UNITED STATES
SECURITIES AND EXCHANGE COMMISSION
Washington, DC 20549
FORM N-CSR
CERTIFIED SHAREHOLDER REPORT OF REGISTERED MANAGEMENT
INVESTMENT COMPANIES
Investment Company Act file number File No. 811-08961
TIAA-CREF LIFE FUNDS
(Exact Name of Registrant as specified in charter)
730 Third Avenue, New York, New York 10017-3206
(Address of Principal Executive Offices) (Zip code)
Terry H. Lin, Esq.
c/o TIAA-CREF
730 Third Avenue
New York, New York 10017-3206
(Name and address of agent for service)
Registrant’s telephone number, including area code: 212-490-9000
Date of fiscal year end: December 31
Date of reporting period: December 31, 2015
Item 1. Reports to Stockholders.
Understanding your TIAA-CREF Life Funds report
This annual report contains information about the eleven TIAA-CREF Life Funds and describes the funds’ results for the twelve months ended December 31, 2015. The report contains three main sections:
| | • | The fund performance section compares each fund’s investment returns with those of its benchmark index. |
| | • | The summary portfolios of investments list the industries and types of securities in which each fund had investments as of December 31, 2015. |
| | • | The financial statements provide detailed information about the operations and financial condition of each fund. |
The views and opinions expressed in this report are through the end of the period, as stated on the cover of this report. They are subject to change at any time based on a variety of factors. As such, they are not guarantees of future performance or investment results and should not be taken as investment advice. The risks of investing in the TIAA-CREF Life Funds vary from fund to fund; to see the risks of investing in an individual fund, please refer to that fund’s latest prospectus.
As always, you should carefully consider the investment objectives, risks, charges and expenses of any fund before investing. For a prospectus that contains this and other important information, please visit our website at tiaa-cref.org, or call 800 223-1200. We urge you to read the prospectus carefully before investing.
2 2015 Annual Report ¡ TIAA-CREF Life Funds
Information on the TIAA-CREF Life Funds
Portfolio holdings
Securities and Exchange Commission (SEC) rules allow investment companies to list the top holdings of each fund in their annual and semiannual reports, instead of providing complete portfolio listings. The TIAA-CREF Life Funds also file complete portfolio listings with the SEC, and they are available to the public.
You can obtain a complete list of the TIAA-CREF Life Funds’ portfolio holdings (Schedules of Investments) as of the most recently completed fiscal quarter in the following ways:
| | • | By visiting our website at tiaa-cref.org; or |
| | • | By calling us at 800 842-2252 to request a copy free of charge. |
You can also obtain a complete list of the TIAA-CREF Life Funds’ portfolio holdings as of the most recently completed fiscal quarter, and for prior quarter-ends, from our SEC Form N-CSR and Form N-Q filings. Form N-CSR filings are as of December 31 or June 30; Form N-Q filings are as of March 31 or September 30. Copies of these forms are available:
| | • | Through the Electronic Data Gathering and Retrieval System (EDGAR) on the SEC’s website at www.sec.gov; or |
| | • | From the SEC’s Office of Investor Education and Advocacy. |
(Call 202 551-8090 for more information.)
Proxy voting
TIAA-CREF Life Funds’ ownership of stock gives it the right to vote on proxy issues of companies in which it invests. A description of our proxy voting policies and procedures can be found on our website at tiaa-cref.org or on the SEC’s website at www.sec.gov. You can also call us at 800 223-1200 to request a free copy. A report of how the funds voted during the most recently completed twelve-month period ended June 30 can be found on our website or on Form N-PX at www.sec.gov.
Contacting TIAA-CREF
There are three easy ways to contact us: by email, using the Contact Us link at the top of our home page; by mail at TIAA-CREF, 730 Third Avenue, New York, NY 10017–3206; or by phone at 800 223-1200.
Fund management
TIAA-CREF Life Funds are managed by the portfolio management teams of Teachers Advisors, Inc. The members of these teams are responsible for the day-to-day investment management of the funds.
TIAA-CREF Life Funds ¡ 2015 Annual Report 3
About the funds’ benchmarks
Equity Indexes
Broad market indexes
The Russell 3000® Index measures the performance of the stocks of the 3,000 largest publicly traded U.S. companies, based on market capitalization. The index measures the performance of about 98% of the total market capitalization of the publicly traded U.S. equity market.
The MSCI EAFE Index measures the performance of the leading stocks in 21 developed market countries outside North America—in Europe, Australasia and the Far East.
Large-cap indexes
The S&P 500® Index is a market-capitalization-weighted index of the stocks of 500 leading companies in leading industries of the U.S. economy.
The Russell 1000® Growth Index is a subset of the Russell 1000 Index, which measures the performance of the stocks of the 1,000 largest companies in the Russell 3000 Index, based on market capitalization. The Russell 1000 Growth Index measures the performance of those stocks of the Russell 1000 Index with higher relative forecasted growth rates and price/book ratios.
The Russell 1000 Value Index is a subset of the Russell 1000 Index, which measures the performance of the stocks of the 1,000 largest companies in the Russell 3000 Index, based on market capitalization. The Russell 1000 Value Index measures the performance of those stocks of the Russell 1000 Index with lower relative forecasted growth rates and price/book ratios.
Small-cap index
The Russell 2000® Index measures the performance of the stocks of the 2,000 smallest companies in the Russell 3000 Index, based on market capitalization.
Specialty equity index
The FTSE NAREIT All Equity REITs Index measures the performance of certain publicly traded real estate investment trusts in the United States that own, manage and lease investment-grade commercial real estate.
4 2015 Annual Report ¡ TIAA-CREF Life Funds
About the funds’ benchmarks
Fixed-income Index
The Barclays U.S. Aggregate Bond Index measures the performance of the domestic investment-grade fixed-rate bond market, including government and corporate securities, agency mortgage pass-through securities, asset-backed securities and commercial mortgage-backed securities.
Composite Index
The Balanced Fund Composite Index is a composite of three unmanaged benchmark indexes, each of which represents one of the three market sectors in which the underlying funds invest: domestic equity (Russell 3000 Index), international equity (MSCI EAFE Index), and fixed income (Barclays U.S. Aggregate Bond Index). The fund’s composite benchmark combines those public indexes in proportions that reflect the fund’s target market sector allocations.
You cannot invest directly in any index. Index returns do not include a deduction for fees or expenses.
Russell 1000, Russell 2000 and Russell 3000 are trademarks and service marks of Russell Investments. TIAA-CREF products are not promoted or sponsored by, or affiliated with, Russell Investments. MSCI makes no express or implied warranties or representations and shall have no liability whatsoever with respect to any MSCI data contained herein. This report is not approved, reviewed or produced by MSCI. S&P 500 is a registered trademark and service mark of the McGraw-Hill Companies, Inc. FTSE is a trademark of London Stock Exchange plc and The Financial Times Limited.
TIAA-CREF Life Funds ¡ 2015 Annual Report 5
Important information about expenses
All shareholders of the TIAA-CREF Life Funds incur ongoing costs, including management fees and other fund expenses.
The TIAA-CREF Life Funds are the underlying investment vehicles for certain variable life insurance and variable annuity contracts issued by TIAA-CREF Life Insurance Company. These contracts have additional administrative expense fees and mortality and expense risk charges. Because of these additional deductions, the costs to investors will be higher than the figures shown in the expense examples. Information about these additional charges can be found in the product prospectuses.
The expense examples that appear on the performance pages are intended to help you understand your ongoing costs only (in U.S. dollars) and do not reflect transactional costs incurred by the fund for buying and selling securities. The examples are designed to help you compare these ongoing costs with the ongoing costs of investing in other mutual funds. Shareholders of the TIAA-CREF Life Funds do not incur a sales charge on purchases, on reinvested dividends or other distributions.
The examples are based on an investment of $1,000 invested at the beginning of the six-month period and held for the entire period (July 1, 2015–December 31, 2015).
Actual expenses
The first line in each table uses the fund’s actual expenses and its actual rate of return. You may use the information in this line, together with the amount you invested, to estimate the expenses that you paid over the six-month period.
Simply divide your account value by $1,000 (for example, an $8,600 account value divided by $1,000 = 8.6), then multiply the result by the number in the first line under the heading “Expenses paid during period” to estimate the expenses you paid during the six-month period. Some funds have a contractual fee reimbursement. Had these not been in effect, fund expenses would have been higher.
Hypothetical example for comparison purposes
The second line shows hypothetical account values and expenses based on the fund’s actual expense ratio for the six-month period and an assumed 5% per year rate of return before expenses. This was not the fund’s actual return.
This hypothetical example cannot be used to estimate the actual expenses you paid for the period but rather allows you to compare the ongoing costs of investing in the fund with that of other funds. To do so, compare this 5% hypothetical example with the 5% hypothetical examples that appear in the shareholder reports of other mutual funds.
6 2015 Annual Report ¡ TIAA-CREF Life Funds
Growth Equity Fund
Performance for the twelve months ended December 31, 2015
The Growth Equity Fund returned 9.67% for the year, compared with the 5.67% return of its benchmark, the Russell 1000® Growth Index.
Following a weak first quarter, gross domestic product (GDP), which measures the value of all goods and services produced in the United States, rose at an annualized rate of 3.9% and 2.0% in the second and third quarters, respectively. Average hourly wages increased, inflation rose slightly and the national unemployment rate dropped to 5.0%. The Federal Reserve raised the federal funds target rate by 0.25%, while central banks overseas eased rates.
Stock prices were volatile, particularly in the third quarter, largely in reaction to slowing growth in China, interest rate uncertainties and plunging oil prices. For the twelve months, the Russell 3000® Index, a broad measure of the U.S. stock market, returned 0.48%. Large-cap stocks topped mid-cap equities, which outperformed small-cap stocks. Growth stocks ended the year up, but their value counterparts ended down. (Returns are based on Russell indexes.)
For the ten years ended December 31, 2015, the Russell 1000 Growth Index produced an average annual gain of 8.53%, beating the 7.35% average return of the Russell 3000 Index over the same period.
Stock choices boost relative performance
Six of the ten industry sectors within the fund’s benchmark generated gains for the twelve months. Consumer discretionary (up 11.6%), information technology (up 9.2%) and health care (up 6.8%) were among the benchmark’s best performing sectors. These three largest sectors comprised nearly two-thirds of the index’s total market capitalization on December 31, 2015. The energy sector had the most significant decline (down 38.2%).
The fund outperformed its benchmark, aided by overweight positions in Amazon.com and Starbucks. Amazon’s stock rose on strong sales growth and the profitability of Amazon Web Services, its fast-growing cloud-computing business. Starbucks benefited from increased customer traffic and revenue and the announcement of a share buyback program.
Slightly offsetting these strong performers were out-of-benchmark holdings in Yahoo! and Valeant Pharmaceuticals, which detracted from relative returns. Naysayers pressured online content provider Yahoo!’s stock. Although Valeant had a solid year financially, the stock suffered when a probe was launched questioning the company’s drug pricing practices.
TIAA-CREF Life Funds ¡ 2015 Annual Report 7
Growth Equity Fund
Performance as of December 31, 2015
| | | | | | | | | | | | | | | | |
| |
| | | | | | Total
return | | | Average annual
total return | |
| | | Inception date | | | 1 year | | | 5 years | | | 10 years | |
| |
| | | | |
Growth Equity Fund | | | 4/3/2000 | | | | 9.67% | | | | 15.26 | % | | | 9.07% | |
|
| |
| | | | |
Russell 1000® Growth Index | | | — | | | | 5.67 | | | | 13.53 | | | | 8.53 | |
|
| |
The returns in this report show past performance, which is no guarantee of future results. Returns and the principal value of your investment will fluctuate. Current performance may be higher or lower than that shown, and you may have a gain or a loss when you redeem your shares. For current performance information, including performance to the most recent month-end, please visit tiaa-cref.org. Performance may reflect waivers or reimbursements of certain expenses. Absent these waivers or reimbursement arrangements, performance may be lower.
Total returns for the shares of the fund do not include the effect of expenses attributable to the variable annuity or variable life insurance product; if they did, returns for the shares of the fund would have been lower.
You cannot invest directly in any index. Index returns do not include a deduction for fees or expenses.
$10,000 over 10 years
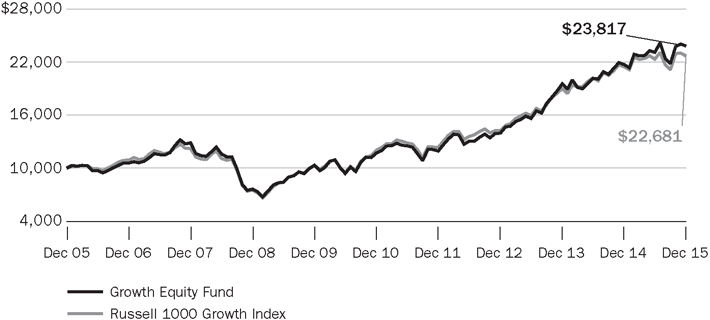
For the purpose of comparison, the graph also shows the change in the value of the fund’s benchmark during the same period.
8 2015 Annual Report ¡ TIAA-CREF Life Funds
Growth Equity Fund
Expense example
Six months ended December 31, 2015
| | | | | | | | | | | | |
| |
Growth Equity Fund | | Beginning account value
(7/1/15) | | | Ending account value
(12/31/15) | | | Expenses paid during period*
(7/1/15–12/31/15) | |
| |
| | | |
Actual return | | | $1,000.00 | | | | $1,031.05 | | | | $2.66 | |
| | | |
5% annual hypothetical return | | | 1,000.00 | | | | 1,022.58 | | | | 2.65 | |
|
| |
| * | “Expenses paid during period” is based on the fund’s actual expense ratio for the most recent fiscal half-year, multiplied by the average account value over the six-month period, multiplied by 184/365. There were 184 days in the six months ended December 31, 2015. The fund’s annualized six-month expense ratio for that period was 0.52%. The expense charges of the fund may at times reflect a reimbursement. Please see the prospectus for an explanation, including the date on which this reimbursement is scheduled to end. Without such reimbursement, the expenses of the fund would be higher and its performance lower. |
For more information about this expense example, please see page 6.
Portfolio composition
| | | | |
| |
Sector | | % of net assets
as of 12/31/2015 | |
| |
| |
Information technology | | | 38.4 | |
| |
Consumer discretionary | | | 23.9 | |
| |
Health care | | | 17.0 | |
| |
Industrials | | | 7.1 | |
| |
Consumer staples | | | 4.4 | |
| |
Financials | | | 4.1 | |
| |
Materials | | | 3.2 | |
| |
Telecommunication services | | | 1.1 | |
| |
Energy | | | 0.7 | |
| |
Short-term investments, other assets & liabilities, net | | | 0.1 | |
|
| |
| |
Total | | | 100.0 | |
Holdings by company size
| | | | |
| |
Market capitalization | | % of equity investments
as of 12/31/2015 | |
| |
| |
More than $50 billion | | | 55.5 | |
| |
More than $15 billion–$50 billion | | | 36.8 | |
| |
More than $2 billion–$15 billion | | | 7.7 | |
|
| |
| |
Total | | | 100.0 | |
TIAA-CREF Life Funds ¡ 2015 Annual Report 9
Growth & Income Fund
Performance for the twelve months ended December 31, 2015
The Growth & Income Fund returned 3.34% for the year, compared with the 1.38% return of its benchmark, the S&P 500® Index.
Following a weak first quarter, gross domestic product (GDP), which measures the value of all goods and services produced in the United States, rose at an annualized rate of 3.9% and 2.0% in the second and third quarters, respectively. Average hourly wages increased, inflation rose slightly and the national unemployment rate dropped to 5.0%. The Federal Reserve raised the federal funds target rate by 0.25%, while central banks overseas eased rates.
Stock prices were volatile, particularly in the third quarter, largely in reaction to slowing growth in China, interest rate uncertainties and plunging oil prices.
For the twelve months, the Russell 3000® Index, a broad measure of the U.S. stock market, returned 0.48%. Large-cap stocks, like those contained in the S&P 500, outperformed mid-cap and small-cap issues.
For the ten years ended December 31, 2015, the S&P 500 Index had an average annual return of 7.31%, a gain nearly matching the 7.35% average annual return of the Russell 3000 Index over the same period.
Large-cap stocks perform well, fund does even better
Five of the ten industry sectors within the benchmark ended the twelve months with gains. Consumer discretionary had a double-digit return. Health care, consumer staples, information technology and telecommunication services had single-digit gains. This group of sectors made up more than half of the benchmark’s total market capitalization on December 31, 2015.
The energy and materials sectors registered the biggest declines due to falling commodity prices.
Many holdings helped the fund outperform its benchmark for the twelve months, especially an overweight position in Netflix and an underweight in energy company Kinder Morgan. Netflix benefited from strong subscriber growth. Lower oil prices hurt Kinder Morgan.
Not all stock choices worked as expected. An overweight position in Anadarko Petroleum and an out-of-benchmark weight in GoPro detracted from relative results. Bad news stalked energy giant Anadarko, including declining revenue and being ordered to pay a fine resulting from the 2010 oil spill in the Gulf of Mexico. GoPro struggled as more competitors entered the action-camera space and results disappointed investors.
10 2015 Annual Report ¡ TIAA-CREF Life Funds
Growth & Income Fund
Performance as of December 31, 2015
| | | | | | | | | | | | | | | | |
| |
| | | | | | Total
return | | | Average annual
total return | |
| | | Inception date | | | 1 year | | | 5 years | | | 10 years | |
| |
| | | | |
Growth & Income Fund | | | 4/3/2000 | | | | 3.34% | | | | 13.08 | % | | | 9.25% | |
|
| |
| | | | |
S&P 500 Index | | | — | | | | 1.38 | | | | 12.57 | | | | 7.31 | |
|
| |
The returns in this report show past performance, which is no guarantee of future results. Returns and the principal value of your investment will fluctuate. Current performance may be higher or lower than that shown, and you may have a gain or a loss when you redeem your shares. For current performance information, including performance to the most recent month-end, please visit tiaa-cref.org. Performance may reflect waivers or reimbursements of certain expenses. Absent these waivers or reimbursement arrangements, performance may be lower.
Total returns for the shares of the fund do not include the effect of expenses attributable to the variable annuity or variable life insurance product; if they did, returns for the shares of the fund would have been lower.
You cannot invest directly in any index. Index returns do not include a deduction for fees or expenses.
$10,000 over 10 years
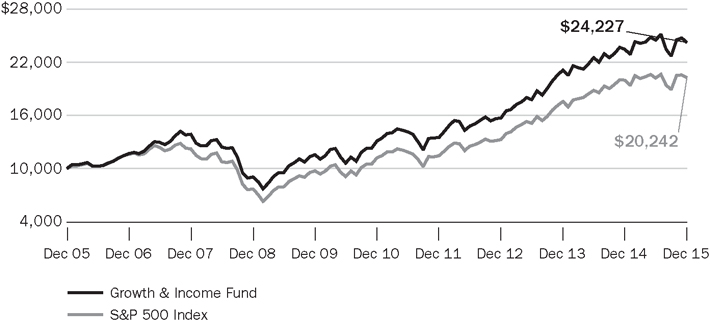
For the purpose of comparison, the graph also shows the change in the value of the fund’s benchmark during the same period.
TIAA-CREF Life Funds ¡ 2015 Annual Report 11
Growth & Income Fund
Expense example
Six months ended December 31, 2015
| | | | | | | | | | | | |
| |
Growth & Income Fund | | Beginning account value
(7/1/15) | | | Ending account value
(12/31/15) | | | Expenses paid during period*
(7/1/15–12/31/15) | |
| |
| | | |
Actual return | | | $1,000.00 | | | | $ 989.10 | | | | $2.61 | |
| | | |
5% annual hypothetical return | | | 1,000.00 | | | | 1,022.58 | | | | 2.65 | |
|
| |
| * | “Expenses paid during period” is based on the fund’s actual expense ratio for the most recent fiscal half-year, multiplied by the average account value over the six-month period, multiplied by 184/365. There were 184 days in the six months ended December 31, 2015. The fund’s annualized six-month expense ratio for that period was 0.52%. The expense charges of the fund may at times reflect a reimbursement. Please see the prospectus for an explanation, including the date on which this reimbursement is scheduled to end. Without such reimbursement, the expenses of the fund would be higher and its performance lower. |
For more information about this expense example, please see page 6.
Portfolio composition
| | | | |
| |
Sector | | % of net assets
as of 12/31/2015 | |
| |
| |
Information technology | | | 24.2 | |
| |
Consumer discretionary | | | 18.5 | |
| |
Health care | | | 15.6 | |
| |
Financials | | | 11.2 | |
| |
Consumer staples | | | 9.6 | |
| |
Industrials | | | 9.5 | |
| |
Energy | | | 4.7 | |
| |
Materials | | | 2.5 | |
| |
Telecommunication services | | | 2.4 | |
| |
Utilities | | | 1.7 | |
| |
Short-term investments, other assets & liabilities, net | | | 0.1 | |
|
| |
| |
Total | | | 100.0 | |
Holdings by company size
| | | | |
| |
Market capitalization | | % of equity investments
as of 12/31/2015 | |
| |
| |
More than $50 billion | | | 55.1 | |
| |
More than $15 billion–$50 billion | | | 22.7 | |
| |
More than $2 billion–$15 billion | | | 20.4 | |
| |
$2 billion or less | | | 1.8 | |
|
| |
| |
Total | | | 100.0 | |
12 2015 Annual Report ¡ TIAA-CREF Life Funds
Large-Cap Value Fund
Performance for the twelve months ended December 31, 2015
The Large-Cap Value Fund returned –5.00% for the year, compared with the –3.83% return of its benchmark, the Russell 1000® Value Index.
The U.S. economy expanded in 2015. Following a weak first quarter, gross domestic product (GDP), which measures the value of all goods and services produced in the United States, rose at an annualized rate of 3.9% and 2.0% in the second and third quarters, respectively. Average hourly wages increased, inflation rose slightly and the national unemployment rate dropped to 5.0%.
Stock prices were volatile, largely in reaction to slowing growth in China, interest rate uncertainties and plunging oil prices. For the twelve months, the Russell 3000® Index, a broad measure of the U.S. stock market, rose 0.48%, marking the seventh straight year of positive performance. Large-cap stocks topped mid-caps, which outperformed small-cap stocks. Growth stocks ended the year up, but their value counterparts declined.
For the ten years ended December 31, 2015, the Russell 1000 Value Index registered an average annual gain of 6.16%, less than the 8.53% average annual return of the Russell 1000 Growth Index over the same period. (Returns by investment style and capitalization size are based on the Russell indexes.)
Stock choices limit returns
All but three of the industry sectors comprising the fund’s benchmark posted losses for the twelve-month period. Energy was the worst performer (down 23.5%). Materials (down 11.5%), consumer discretionary (down 5.9%) and utilities (down 5.4%) also suffered sizable losses. Together, these four sectors made up more than one-quarter of the benchmark’s total market capitalization. The index’s second-largest sector, health care, was the best performer (up 7.8%).
In 2015, the fund trailed its benchmark. An overweight position in SPX detracted most, as a decline in revenue negatively impacted the HVAC solutions company. Next in line were an out-of-benchmark position in Groupon and an overweight in Yahoo! as both suffered losses.
Conversely, an out-of-benchmark position in Kraft Heinz contributed most to relative performance as the completion of its merger boosted net sales. Sizable underweights in energy company Kinder Morgan and technology giant Intel were next in line as both stocks declined.
TIAA-CREF Life Funds ¡ 2015 Annual Report 13
Large-Cap Value Fund
Performance as of December 31, 2015
| | | | | | | | | | | | | | | | |
| |
| | | | | | Total
return | | | Average annual
total return | |
| | | Inception date | | | 1 year | | | 5 years | | | 10 years | |
| |
| | | | |
Large-Cap Value Fund | | | 10/28/2002 | | | | –5.00% | | | | 9.46 | % | | | 5.92% | |
|
| |
| | | | |
Russell 1000® Value Index | | | — | | | | –3.83 | | | | 11.27 | | | | 6.16 | |
|
| |
The returns in this report show past performance, which is no guarantee of future results. Returns and the principal value of your investment will fluctuate. Current performance may be higher or lower than that shown, and you may have a gain or a loss when you redeem your shares. For current performance information, including performance to the most recent month-end, please visit tiaa-cref.org. Performance may reflect waivers or reimbursements of certain expenses. Absent these waivers or reimbursement arrangements, performance may be lower.
Total returns for the shares of the fund do not include the effect of expenses attributable to the variable annuity or variable life insurance product; if they did, returns for the shares of the fund would have been lower.
You cannot invest directly in any index. Index returns do not include a deduction for fees or expenses.
$10,000 over 10 years
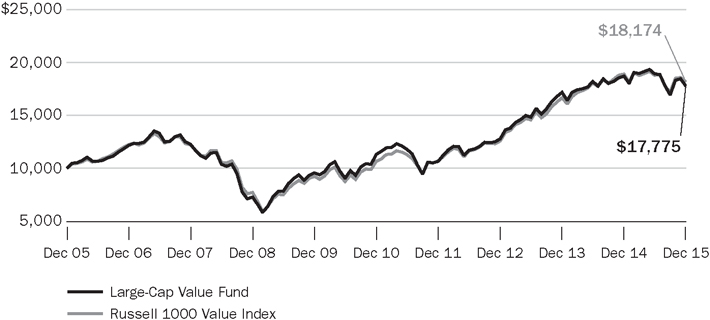
For the purpose of comparison, the graph also shows the change in the value of the fund’s benchmark during the same period.
14 2015 Annual Report ¡ TIAA-CREF Life Funds
Large-Cap Value Fund
Expense example
Six months ended December 31, 2015
| | | | | | | | | | | | |
| |
Large-Cap Value Fund | | Beginning
account value
(7/1/15) | | | Ending
account value
(12/31/15) | | | Expenses paid
during period*
(7/1/15–12/31/15) | |
| |
| | | |
Actual return | | | $1,000.00 | | | | $ 939.55 | | | | $2.54 | |
| | | |
5% annual hypothetical return | | | 1,000.00 | | | | 1,022.58 | | | | 2.65 | |
| |
| * | “Expenses paid during period” is based on the fund’s actual expense ratio for the most recent fiscal half-year, multiplied by the average account value over the six-month period, multiplied by 184/365. There were 184 days in the six months ended December 31, 2015. The fund’s annualized six-month expense ratio for that period was 0.52%. The expense charges of the fund may at times reflect a reimbursement. Please see the prospectus for an explanation, including the date on which this reimbursement is scheduled to end. Without such reimbursement, the expenses of the fund would be higher and its performance lower. |
For more information about this expense example, please see page 6.
Portfolio composition
| | | | |
| |
Sector | | % of net assets
as of 12/31/2015 | |
| |
| |
Financials | | | 27.6 | |
| |
Information technology | | | 13.9 | |
| |
Health care | | | 11.8 | |
| |
Energy | | | 10.8 | |
| |
Consumer discretionary | | | 10.1 | |
| |
Industrials | | | 8.6 | |
| |
Consumer staples | | | 5.6 | |
| |
Materials | | | 4.3 | |
| |
Utilities | | | 3.6 | |
| |
Telecommunication services | | | 2.9 | |
| |
Short-term investments, other assets & liabilities, net | | | 0.8 | |
| |
| |
Total | | | 100.0 | |
Holdings by company size
| | | | |
| |
Market capitalization | | % of equity investments
as of 12/31/2015 | |
| |
| |
More than $50 billion | | | 38.3 | |
| |
More than $15 billion–$50 billion | | | 21.5 | |
| |
More than $2 billion–$15 billion | | | 34.1 | |
| |
$2 billion or less | | | 6.1 | |
| |
| |
Total | | | 100.0 | |
TIAA-CREF Life Funds ¡ 2015 Annual Report 15
Real Estate Securities Fund
Performance for the twelve months ended December 31, 2015
The Real Estate Securities Fund returned 4.37% for the year, compared with the 2.83% return of its benchmark, the FTSE NAREIT All Equity REITs Index.
For the year, the FTSE index topped the 0.48% return of the broad U.S. stock market, as measured by the Russell 3000® Index. The fund’s benchmark also outperformed the 0.55% return of the U.S. investment-grade fixed-rate bond market, as measured by the Barclays U.S. Aggregate Bond Index.
The fund’s benchmark rose in three of the four quarters of 2015. It fell in the second quarter when renewed concerns about rising U.S. interest rates jolted the REIT market, given its sensitivity to bond yields. Yet the benchmark improved during the third and fourth quarters when corporate profits rose, and the Federal Reserve approved a quarter-point hike in its federal funds target rate.
For the ten years ended December 31, 2015, the benchmark generated an average annual return of 7.38%, narrowly surpassing the 7.35% average annual return of the Russell 3000 and outpacing the 4.51% average annual gain of the Barclays index.
All but four of the benchmark’s 14 property sectors and subsectors posted positive returns for the period. The top performers were self-storage (up 40.7%), manufactured homes (up 25.7%), apartments (up 16.5%) and free standing (up 5.9%). Self-storage REITs continued to perform well against a backdrop of strong demand and limited supply. The benchmark’s detractors included lodging (down 24.4%), health care (down 7.3%) and timber (down 7.0%). Lodging fell in part due to competition from room rentals in private residences, fueled by the rising popularity of Airbnb.
Stock choices boost the fund’s relative results
The fund beat its benchmark largely due to favorable stock choices. The biggest contributions to relative performance came from the fund’s overweight position in specialized REITs CubeSmart and Extra Space Storage, both of which posted double-digit gains for the year. An underweight in forest products company Weyerhaeuser also aided relative returns.
These positive contributions were partly offset by a nonbenchmark position in NorthStar Asset Management Group, an overweight in NorthStar Realty Finance and an underweight in wireless provider Crown Castle International.
During the twelve months, the fund also held stocks of several companies that are not REITs but engage in activities related to real estate.
16 2015 Annual Report ¡ TIAA-CREF Life Funds
Real Estate Securities Fund
Performance as of December 31, 2015
| | | | | | | | | | | | | | | | |
| |
| | | |
| | | | | | Total
return | | | Average annual
total return | |
| | | Inception date | | | 1 year | | | 5 years | | | 10 years | |
| |
| | | | |
Real Estate Securities Fund | | | 10/28/2002 | | | | 4.37% | | | | 11.80% | | | | 7.12% | |
| |
| | | | |
FTSE NAREIT All Equity REITs Index | | | — | | | | 2.83 | | | | 11.91 | | | | 7.38 | |
| |
The returns in this report show past performance, which is no guarantee of future results. Returns and the principal value of your investment will fluctuate. Current performance may be higher or lower than that shown, and you may have a gain or a loss when you redeem your shares. For current performance information, including performance to the most recent month-end, please visit tiaa-cref.org. Performance may reflect waivers or reimbursements of certain expenses. Absent these waivers or reimbursement arrangements, performance may be lower.
Total returns for the shares of the fund do not include the effect of expenses attributable to the variable annuity or variable life insurance product; if they did, returns for the shares of the fund would have been lower.
You cannot invest directly in any index. Index returns do not include a deduction for fees or expenses.
$10,000 over 10 years
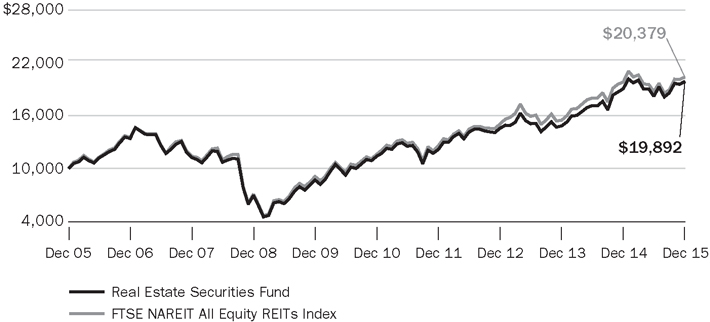
For the purpose of comparison, the graph also shows the change in the value of the fund’s benchmark during the same period.
TIAA-CREF Life Funds ¡ 2015 Annual Report 17
Real Estate Securities Fund
Expense example
Six months ended December 31, 2015
| | | | | | | | | | | | |
| |
Real Estate Securities Fund | | Beginning
account value
(7/1/15) | | | Ending
account value
(12/31/15) | | | Expenses paid
during period*
(7/1/15–12/31/15) | |
| |
| | | |
Actual return | | | $1,000.00 | | | | $1,093.52 | | | | $3.01 | |
| | | |
5% annual hypothetical return | | | 1,000.00 | | | | 1,022.33 | | | | 2.91 | |
| |
| * | “Expenses paid during period” is based on the fund’s actual expense ratio for the most recent fiscal half-year, multiplied by the average account value over the six-month period, multiplied by 184/365. There were 184 days in the six months ended December 31, 2015. The fund’s annualized six-month expense ratio for that period was 0.57%. The expense charges of the fund may at times reflect a reimbursement. Please see the prospectus for an explanation, including the date on which this reimbursement is scheduled to end. Without such reimbursement, the expenses of the fund would be higher and its performance lower. |
For more information about this expense example, please see page 6.
Portfolio composition
| | | | |
| |
Sector | | % of net assets
as of 12/31/2015 | |
| |
| |
Specialized REITs | | | 26.7 | |
| |
Retail REITs | | | 21.3 | |
| |
Residential REITs | | | 20.7 | |
| |
Office REITs | | | 11.0 | |
| |
Industrial REITs | | | 9.6 | |
| |
Diversified REITs | | | 3.2 | |
| |
Real estate services | | | 1.6 | |
| |
Hotels, resorts & cruise lines | | | 0.9 | |
| |
Mortgage REITs | | | 0.8 | |
| |
Real estate operating companies | | | 0.8 | |
| |
Asset management & custody banks | | | 0.8 | |
| |
Diversified capital markets | | | 0.3 | |
| |
Health care facilities | | | 0.3 | |
| |
Short-term investments, other assets & liabilities, net | | | 2.0 | |
| |
| |
Total | | | 100.0 | |
Holdings by company size
| | | | |
| |
Market capitalization | | % of equity investments
as of 12/31/2015 | |
| |
| |
More than $50 billion | | | 9.8 | |
| |
More than $15 billion–$50 billion | | | 47.4 | |
| |
More than $2 billion–$15 billion | | | 35.1 | |
| |
$2 billion or less | | | 7.7 | |
| |
| |
Total | | | 100.0 | |
18 2015 Annual Report ¡ TIAA-CREF Life Funds
Small-Cap Equity Fund
Performance for the twelve months ended December 31, 2015
The Small-Cap Equity Fund returned –0.15% for the year, compared with the –4.41% return of its benchmark, the Russell 2000® Index.
Following a weak first quarter, gross domestic product (GDP), which measures the value of all goods and services produced in the United States, rose at an annualized rate of 3.9% and 2.0% in the second and third quarters, respectively. Average hourly wages increased, inflation rose slightly and the national unemployment rate dropped to 5.0%. The Federal Reserve raised the federal funds target rate by 0.25%, while central banks overseas eased rates.
Stock prices were volatile, particularly in the third quarter, largely in reaction to slowing growth in China, interest rate uncertainties and plunging oil prices. For the twelve months, the Russell 3000® Index, a broad measure of the U.S. stock market, returned 0.48%. Small-cap stocks underperformed mid- and large-cap stocks. Growth stocks ended the year up, but their value counterparts ended down. (Returns are based on Russell indexes.)
For the ten years ended December 31, 2015, the Russell 2000 Index registered an average annual gain of 6.80%, and underperformed the 7.35% average return of the Russell 3000 Index over the same period.
Fund outperforms as small-cap stocks struggle
Eight of the ten industry sectors within the fund’s benchmark recorded negative returns for the twelve months. The only positive sectors were health care (up 8.1%) and information technology (up 3.0%). These two sectors plus financials (down 0.3%) comprised over half of the benchmark’s total market capitalization on December 31, 2015. The energy and materials sectors posted the biggest losses, hurt by falling commodity prices.
The fund outperformed its benchmark, helped by overweight positions in Cambrex and American Woodmark. Drug manufacturer Cambrex benefited by partnering with pharmaceutical firms to help them bring new drugs to market. New residential construction contributed to strong sales for cabinet manufacturer American Woodmark.
Other choices did not work out as expected. The fund did not hold Synageva BioPharma, a developer of drugs to treat rare diseases. Synageva was acquired during the period at a significant premium. An overweight position in LivePerson detracted as the cloud-based customer service specialist announced results that disappointed investors. Finally, the fund had a small exposure to derivative instruments, which detracted from its relative performance.
TIAA-CREF Life Funds ¡ 2015 Annual Report 19
Small-Cap Equity Fund
Performance as of December 31, 2015
| | | | | | | | | | | | | | | | |
| |
| | | |
| | | | | | Total
return | | | Average annual
total return | |
| | | Inception date | | | 1 year | | | 5 years | | | 10 years | |
| |
| | | | |
Small-Cap Equity Fund | | | 10/28/2002 | | | | –0.15% | | | | 10.26% | | | | 7.15% | |
| |
| | | | |
Russell 2000® Index | | | — | | | | –4.41 | | | | 9.19 | | | | 6.80 | |
| |
The returns in this report show past performance, which is no guarantee of future results. Returns and the principal value of your investment will fluctuate. Current performance may be higher or lower than that shown, and you may have a gain or a loss when you redeem your shares. For current performance information, including performance to the most recent month-end, please visit tiaa-cref.org. Performance may reflect waivers or reimbursements of certain expenses. Absent these waivers or reimbursement arrangements, performance may be lower.
Total returns for the shares of the fund do not include the effect of expenses attributable to the variable annuity or variable life insurance product; if they did, returns for the shares of the fund would have been lower.
You cannot invest directly in any index. Index returns do not include a deduction for fees or expenses.
$10,000 over 10 years
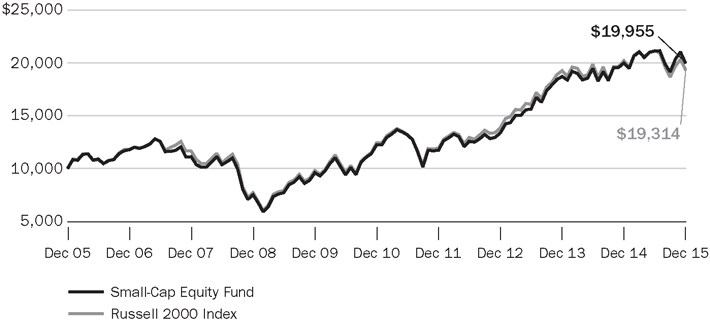
For the purpose of comparison, the graph also shows the change in the value of the fund’s benchmark during the same period.
20 2015 Annual Report ¡ TIAA-CREF Life Funds
Small-Cap Equity Fund
Expense example
Six months ended December 31, 2015
| | | | | | | | | | | | |
| |
Small-Cap Equity Fund | | Beginning
account value
(7/1/15) | | | Ending
account value
(12/31/15) | | | Expenses paid
during period*
(7/1/15–12/31/15) | |
| |
| | | |
Actual return | | | $1,000.00 | | | | $ 945.04 | | | | $2.60 | |
| | | |
5% annual hypothetical return | | | 1,000.00 | | | | 1,022.53 | | | | 2.70 | |
| |
| * | “Expenses paid during period” is based on the fund’s actual expense ratio for the most recent fiscal half-year, multiplied by the average account value over the six-month period, multiplied by 184/365. There were 184 days in the six months ended December 31, 2015. The fund’s annualized six-month expense ratio for that period was 0.53%. The expense charges of the fund may at times reflect a reimbursement. Please see the prospectus for an explanation, including the date on which this reimbursement is scheduled to end. Without such reimbursement, the expenses of the fund would be higher and its performance lower. |
For more information about this expense example, please see page 6.
Portfolio composition
| | | | |
| |
Sector | | % of net assets
as of 12/31/2015 | |
| |
| |
Financials | | | 23.5 | |
| |
Information technology | | | 19.5 | |
| |
Health care | | | 16.8 | |
| |
Industrials | | | 12.5 | |
| |
Consumer discretionary | | | 12.0 | |
| |
Materials | | | 4.7 | |
| |
Consumer staples | | | 3.7 | |
| |
Energy | | | 3.2 | |
| |
Utilities | | | 2.8 | |
| |
Telecommunication services | | | 1.5 | |
| |
Short-term investments, other assets & liabilities, net | | | –0.2 | |
| |
| |
Total | | | 100.0 | |
Holdings by company size
| | | | |
| |
Market capitalization | | % of equity investments
as of 12/31/2015 | |
| |
| |
More than $2 billion–$15 billion | | | 49.1 | |
| |
$2 billion or less | | | 50.9 | |
| |
| |
Total | | | 100.0 | |
TIAA-CREF Life Funds ¡ 2015 Annual Report 21
Social Choice Equity Fund
Performance for the twelve months ended December 31, 2015
The Social Choice Equity Fund returned –2.70% for the year, compared with the 0.48% return of its benchmark, the Russell 3000® Index. The fund screens for investments by using certain environmental, social and governance (ESG) criteria, while the benchmark does not.
Because of its ESG criteria, the fund did not invest in a number of stocks and bonds that were included in the Russell index. Avoiding these companies produced mixed results, but the net effect partly caused the fund to trail its benchmark.
The largest detractors relative to the Russell 3000 Index were the exclusions of stocks Amazon.com, Microsoft, General Electric and Facebook. Shares of Amazon.com rose sharply, driven by the strong earnings growth of its cloud business. The growth of cloud computing also boosted demand for Microsoft shares, which rose significantly.
These negative effects were partly offset by the exclusions of stocks Exxon Mobil, Wal-Mart, Chevron and Micron Technology. Many energy stocks such as Exxon Mobil and Chevron fell as oil prices plunged.
Stock positions hamper fund’s performance
To compensate for the fund’s exclusion of some stocks, its managers use quantitative (mathematical) modeling and other techniques in an attempt to match the overall investment characteristics of the portfolio with those of its benchmark.
The fund also underperformed due in part to stock selections that did not perform as well as anticipated. They included overweight positions in Yahoo!, HP and National Oilwell Varco, respectively. Yahoo! dropped in reaction to concerns about its future earnings potential and uncertainties regarding its turnaround strategy. On November 2, 2015, Hewlett-Packard split into two companies—HP Inc. and Hewlett Packard Enterprise—in an effort to separate the technology business from the personal computer and printer market.
The losses were partly offset by the fund’s successful stock selections, led by overweight positions in shares of Google-parent Alphabet, Starbucks, and property and casualty insurer Chubb Corp, respectively. Alphabet’s and Starbucks’ earnings and revenues exceeded expectations. Shares of Chubb rallied after Switzerland’s ACE Limited agreed to purchase Chubb for $28.3 billion in cash and stock. At period-end, the merger remained subject to obtaining certain regulatory approvals. An overweight position in Aetna also aided relative returns.
22 2015 Annual Report ¡ TIAA-CREF Life Funds
Social Choice Equity Fund
Performance as of December 31, 2015
| | | | | | | | | | | | | | | | |
| |
| | | |
| | | | | | Total
return | | | Average annual
total return | |
| | | Inception date | | | 1 year | | | 5 years | | | 10 years | |
| |
| | | | |
Social Choice Equity Fund | | | 4/3/2000 | | | | –2.70% | | | | 10.54% | | | | 6.84% | |
| |
| | | | |
Russell 3000® Index | | | — | | | | 0.48 | | | | 12.18 | | | | 7.35 | |
| |
The returns in this report show past performance, which is no guarantee of future results. Returns and the principal value of your investment will fluctuate. Current performance may be higher or lower than that shown, and you may have a gain or a loss when you redeem your shares. For current performance information, including performance to the most recent month-end, please visit tiaa-cref.org. Performance may reflect waivers or reimbursements of certain expenses. Absent these waivers or reimbursement arrangements, performance may be lower.
Total returns for the shares of the fund do not include the effect of expenses attributable to the variable annuity or variable life insurance product; if they did, returns for the shares of the fund would have been lower.
You cannot invest directly in any index. Index returns do not include a deduction for fees or expenses.
$10,000 over 10 years
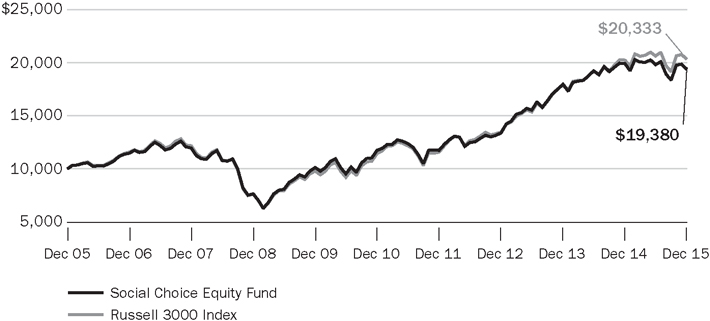
For the purpose of comparison, the graph also shows the change in the value of the fund’s benchmark during the same period.
TIAA-CREF Life Funds ¡ 2015 Annual Report 23
Social Choice Equity Fund
Expense example
Six months ended December 31, 2015
| | | | | | | | | | | | |
| |
Social Choice Equity Fund | | Beginning
account value
(7/1/15) | | | Ending
account value
(12/31/15) | | | Expenses paid
during period*
(7/1/15–12/31/15) | |
| |
| | | |
Actual return | | | $1,000.00 | | | | $ 978.36 | | | | $1.10 | |
| | | |
5% annual hypothetical return | | | 1,000.00 | | | | 1,024.10 | | | | 1.12 | |
| |
| * | “Expenses paid during period” is based on the fund’s actual expense ratio for the most recent fiscal half-year, multiplied by the average account value over the six-month period, multiplied by 184/365. There were 184 days in the six months ended December 31, 2015. The fund’s annualized six-month expense ratio for that period was 0.22%. The expense charges of the fund may at times reflect a reimbursement. Please see the prospectus for an explanation, including the date on which this reimbursement is scheduled to end. Without such reimbursement, the expenses of the fund would be higher and its performance lower. |
For more information about this expense example, please see page 6.
Portfolio composition
| | | | |
| |
Sector | | % of net assets
as of 12/31/2015 | |
| |
| |
Financials | | | 20.8 | |
| |
Information technology | | | 18.3 | |
| |
Health care | | | 14.8 | |
| |
Consumer discretionary | | | 12.6 | |
| |
Industrials | | | 9.7 | |
| |
Consumer staples | | | 7.9 | |
| |
Energy | | | 6.2 | |
| |
Materials | | | 4.0 | |
| |
Utilities | | | 3.2 | |
| |
Telecommunication services | | | 1.9 | |
| |
Short-term investments, other assets & liabilities, net | | | 0.6 | |
| |
| |
Total | | | 100.0 | |
Holdings by company size
| | | | |
| |
Market capitalization | | % of equity investments
as of 12/31/2015 | |
| |
| |
More than $50 billion | | | 40.0 | |
| |
More than $15 billion–$50 billion | | | 39.5 | |
| |
More than $2 billion–$15 billion | | | 17.4 | |
| |
$2 billion or less | | | 3.1 | |
| |
| |
Total | | | 100.0 | |
24 2015 Annual Report ¡ TIAA-CREF Life Funds
Stock Index Fund
Performance for the twelve months ended December 31, 2015
The Stock Index Fund returned 0.43% for the year, compared with the 0.48% return of its benchmark, the Russell 3000® Index.
For the twelve-month period, the fund’s return lagged that of its benchmark index, primarily because of the effect of expenses. The fund’s return includes a deduction for expenses, while the benchmark’s does not. The fund had a risk profile similar to that of its benchmark.
Following a weak first quarter, gross domestic product (GDP), which measures the value of all goods and services produced in the United States, rose at an annualized rate of 3.9% and 2.0% in the second and third quarters, respectively. Average hourly wages increased and national unemployment dropped to 5.0%. The Federal Reserve raised the federal funds target rate by 0.25%, while central banks overseas eased rates.
Stocks were volatile, particularly in the third quarter, in reaction to slowing growth in China, interest rate uncertainties and plunging oil prices. For the twelve months, large-cap stocks topped mid-cap equities, which outperformed small-cap stocks. Growth stocks ended the year up, but their value counterparts ended down. (Returns are based on Russell indexes.)
Five of ten sectors post positive returns
For the period, half of the ten industry sectors in the fund’s benchmark ended in positive territory. The largest sector, information technology, contributed most with a return of 5.4%. Health care (up 7.2%) and consumer discretionary (up 6.0%) also contributed significantly. Together, these sectors constituted nearly half of the benchmark’s total market capitalization. Energy performed worst (down 23.2%), followed by materials (down 10.2%) and utilities (down 5.2%). Lower oil prices particularly hurt energy stocks.
Seven of the ten largest stocks in the index by market capitalization at year-end beat the benchmark, and three finished lower for the period. Among the ten, Amazon.com performed best—more than doubling in price—fueled by strong earnings growth of its cloud business. The growth of cloud computing also boosted Microsoft shares. Exxon Mobil ended down, and Apple ended lower amid weakening demand for smartphones.
TIAA-CREF Life Funds ¡ 2015 Annual Report 25
Stock Index Fund
Performance as of December 31, 2015
| | | | | | | | | | | | | | | | |
| |
| | | |
| | | | | | Total
return | | | Average annual
total return | |
| | | Inception date | | | 1 year | | | 5 years | | | 10 years | |
| |
| | | | |
Stock Index Fund | | | 1/4/1999 | | | | 0.43% | | | | 12.10% | | | | 7.34% | |
| |
| | | | |
Russell 3000® Index | | | — | | | | 0.48 | | | | 12.18 | | | | 7.35 | |
| |
The returns in this report show past performance, which is no guarantee of future results. Returns and the principal value of your investment will fluctuate. Current performance may be higher or lower than that shown, and you may have a gain or a loss when you redeem your shares. For current performance information, including performance to the most recent month-end, please visit tiaa-cref.org. Performance may reflect waivers or reimbursements of certain expenses. Absent these waivers or reimbursement arrangements, performance may be lower.
Total returns for the shares of the fund do not include the effect of expenses attributable to the variable annuity or variable life insurance product; if they did, returns for the shares of the fund would have been lower.
You cannot invest directly in any index. Index returns do not include a deduction for fees or expenses.
$10,000 over 10 years
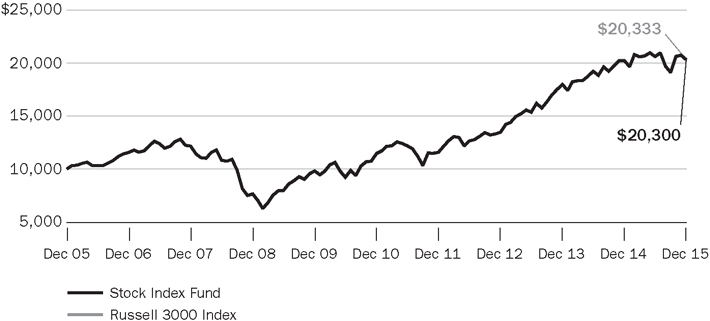
For the purpose of comparison, the graph also shows the change in the value of the fund’s benchmark during the same period.
26 2015 Annual Report ¡ TIAA-CREF Life Funds
Stock Index Fund
Expense example
Six months ended December 31, 2015
| | | | | | | | | | | | |
| |
Stock Index Fund | | Beginning
account value
(7/1/15) | | | Ending
account value
(12/31/15) | | | Expenses paid
during period*
(7/1/15–12/31/15) | |
| |
| | | |
Actual return | | | $1,000.00 | | | | $ 985.23 | | | | $0.45 | |
| | | |
5% annual hypothetical return | | | 1,000.00 | | | | 1,024.75 | | | | 0.46 | |
| |
| * | “Expenses paid during period” is based on the fund’s actual expense ratio for the most recent fiscal half-year, multiplied by the average account value over the six-month period, multiplied by 184/365. There were 184 days in the six months ended December 31, 2015. The fund’s annualized six-month expense ratio for that period was 0.09%. The expense charges of the fund may at times reflect a reimbursement. Please see the prospectus for an explanation, including the date on which this reimbursement is scheduled to end. Without such reimbursement, the expenses of the fund would be higher and its performance lower. |
For more information about this expense example, please see page 6.
Portfolio composition
| | | | |
| |
Sector | | % of net assets
as of 12/31/2015 | |
| |
| |
Information technology | | | 19.7 | |
| |
Financials | | | 18.5 | |
| |
Health care | | | 14.7 | |
| |
Consumer discretionary | | | 13.4 | |
| |
Industrials | | | 10.6 | |
| |
Consumer staples | | | 8.8 | |
| |
Energy | | | 5.9 | |
| |
Materials | | | 3.1 | |
| |
Utilities | | | 3.1 | |
| |
Telecommunication services | | | 2.2 | |
| |
| |
Total | | | 100.0 | |
Holdings by company size
| | | | |
| |
Market capitalization | | % of equity investments
as of 12/31/2015 | |
| |
| |
More than $50 billion | | | 50.1 | |
| |
More than $15 billion–$50 billion | | | 23.2 | |
| |
More than $2 billion–$15 billion | | | 21.8 | |
| |
$2 billion or less | | | 4.9 | |
| |
| |
Total | | | 100.0 | |
TIAA-CREF Life Funds ¡ 2015 Annual Report 27
International Equity Fund
Performance for the twelve months ended December 31, 2015
The International Equity Fund returned –0.98% for the year, compared with the –0.81% return of its benchmark, the MSCI EAFE Index.
Foreign stocks fell in 2015 amid concerns about Greece’s debt problems and slowing growth in China. U.S. dollar strength was also a headwind as the EAFE index, which measures stock performance in 21 developed market nations outside North America, actually advanced 5.33%, in terms of local currency. In comparison, U.S. stocks, as measured by the Russell 3000® Index, rose 0.48%, marking the seventh straight year of positive performance.
Market performance varied significantly across countries. United Kingdom stocks fell in both local and U.S. dollar terms as reduced demand for energy and commodity-related exports hurt the region. U.S. dollar strength was a headwind for index shares in the eurozone, which declined when converted to U.S. dollar returns. Japan achieved nearly double-digit gains in both local and U.S. currency.
Stock choices trim results
In 2015, the fund modestly trailed its benchmark. The largest detractor was an overweight position in Tesco. Ongoing issues related to its expansion initiatives have hurt the supermarket giant. Next in line were losses from overweight positions in global engineering company Weir Group and industrial gas and engineering firm Linde.
Conversely, an overweight position in Adidas contributed most to relative performance. The sportswear company benefited from strong product sales. Sizable overweights in French automaker Renault and entertainment company Sky were next in line as both stocks produced double-digit returns.
The fund’s returns may sometimes diverge from the returns of its benchmark more than would be expected. This divergence may be the result of the fund’s fair value pricing adjustments or of the timing of foreign currency valuations. Many foreign exchanges close for trading before the fund’s net asset value (NAV) is calculated (generally 4 p.m. ET). In the intervening hours, the values of foreign securities can change, and these changes are not reflected immediately in the returns of the fund’s benchmark. These changes are, however, taken into account to value the fund’s portfolio holdings at the time the fund’s NAV is calculated; these are known as fair value pricing adjustments.
28 2015 Annual Report ¡ TIAA-CREF Life Funds
International Equity Fund
Performance as of December 31, 2015
| | | | | | | | | | | | | | | | |
| |
| | | | | | Total
return | | | Average annual
total return | |
| | | Inception date | | | 1 year | | | 5 years | | | 10 years | |
| |
International Equity Fund | | | 4/3/2000 | | | | –0.98% | | | | 2.50 | % | | | 3.29% | |
| |
MSCI EAFE Index | | | — | | | | –0.81 | | | | 3.60 | | | | 3.03 | |
|
| |
The returns in this report show past performance, which is no guarantee of future results. Returns and the principal value of your investment will fluctuate. Current performance may be higher or lower than that shown, and you may have a gain or a loss when you redeem your shares. For current performance information, including performance to the most recent month-end, please visit tiaa-cref.org. Performance may reflect waivers or reimbursements of certain expenses. Absent these waivers or reimbursement arrangements, performance may be lower.
Total returns for the shares of the fund do not include the effect of expenses attributable to the variable annuity or variable life insurance product; if they did, returns for the shares of the fund would have been lower.
You cannot invest directly in any index. Index returns do not include a deduction for fees or expenses.
$10,000 over 10 years
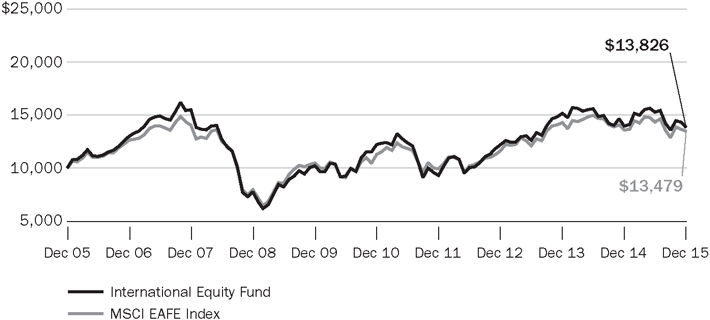
For the purpose of comparison, the graph also shows the change in the value of the fund’s benchmark during the same period.
TIAA-CREF Life Funds ¡ 2015 Annual Report 29
International Equity Fund
Expense example
Six months ended December 31, 2015
| | | | | | | | | | | | |
| |
International Equity Fund | | Beginning
account value
(7/1/15) | | | Ending
account value
(12/31/15) | | | Expenses paid
during period*
(7/1/15–12/31/15) | |
| |
| | | |
Actual return | | $ | 1,000.00 | | | | $ 905.13 | | | | $2.88 | |
| | | |
5% annual hypothetical return | | | 1,000.00 | | | | 1,022.18 | | | | 3.06 | |
| |
| * | “Expenses paid during period” is based on the fund’s actual expense ratio for the most recent fiscal half-year, multiplied by the average account value over the six-month period, multiplied by 184/365. There were 184 days in the six months ended December 31, 2015. The fund’s annualized six-month expense ratio for that period was 0.60%. The expense charges of the fund may at times reflect a reimbursement. Please see the prospectus for an explanation, including the date on which this reimbursement is scheduled to end. Without such reimbursement, the expenses of the fund would be higher and its performance lower. |
For more information about this expense example, please see page 6.
Portfolio composition
| | | | |
| |
Sector | | % of net assets
as of 12/31/2015 | |
| |
| |
Consumer discretionary | | | 40.1 | |
| |
Industrials | | | 15.3 | |
| |
Financials | | | 15.2 | |
| |
Health care | | | 10.3 | |
| |
Consumer staples | | | 9.0 | |
| |
Materials | | | 5.8 | |
| |
Information technology | | | 3.7 | |
| |
Short-term investments,other assets & liabilities, net | | | 0.6 | |
| |
| |
Total | | | 100.0 | |
Holdings by company size
| | | | |
| |
Market capitalization | | % of equity investments as of 12/31/2015 | |
| |
| |
More than $50 billion | | | 4.0 | |
| |
More than $15 billion–$50 billion | | | 60.3 | |
| |
More than $2 billion–$15 billion | | | 33.6 | |
| |
$2 billion or less | | | 2.1 | |
| |
| |
Total | | | 100.0 | |
Holdings by country
| | | | |
| |
| | | % of portfolio investments as of 12/31/2015 | |
| |
| |
France | | | 24.2 | |
| |
Germany | | | 18.6 | |
| |
United Kingdom | | | 17.6 | |
| |
Japan | | | 14.0 | |
| |
India | | | 7.9 | |
| |
Netherlands | | | 5.1 | |
| |
Switzerland | | | 4.8 | |
| |
Sweden | | | 1.9 | |
| |
7 other nations | | | 5.0 | |
| |
Short-term investments | | | 0.9 | |
| |
| |
Total | | | 100.0 | |
30 2015 Annual Report ¡ TIAA-CREF Life Funds
Bond Fund
Performance for the twelve months ended December 31, 2015
The Bond Fund returned 0.57% for the year, compared with the 0.55% return of its benchmark, the Barclays U.S. Aggregate Bond Index.
The U.S. economy expanded in 2015. Following a weak first quarter, gross domestic product (GDP), which measures the value of all goods and services produced in the United States, rose at an annualized rate of 3.9% and 2.0% in the second and third quarters, respectively. Average hourly wages increased, inflation rose slightly and the national unemployment rate dropped to 5.0%.
On December 16, 2015, the Federal Reserve approved a quarter-point hike in its federal funds target rate. The new target went from 0.00%–0.25% to 0.25%–0.50% and marks the first increase since June 29, 2006. The yield on the 10-year U.S. Treasury bond rose from 2.12% on January 2, 2015 to 2.27% on December 31, 2015.
Strong security selection and a significant overweight aid returns
Throughout much of 2015, extreme swings in the financial markets and concerns over the pace of growth overseas kept investors unsettled. Strong investor demand for more stable assets bolstered the performance of U.S. Treasuries and other higher-quality/high-rated sectors. Mortgage-backed securities (MBS), commercial mortgage-backed securities (CMBS) and asset-backed securities (ABS) also benefited from low default rates and relatively attractive returns.
U.S. Treasury securities, the benchmark’s largest sector at more than 36% of total market capitalization, rose nearly 0.9% for the period. MBS, the benchmark’s second-largest weighting at nearly 28%, gained 1.5% for the twelve months. Corporate bonds, which constituted almost 24% of the benchmark’s total capitalization, returned –0.7%.
The fund outperformed its benchmark primarily due to strong security selection and a sizable overweight position in CMBS, which topped CMBS holdings in the benchmark by a wide margin. Select corporate bonds were the next largest contributor helped by beneficial security selection and favorable yield curve positioning as well as higher coupons.
In contrast, the fund was held back partly by spread weakness in high-yield and emerging markets where spreads widened on concerns U.S. rate increases would harm the sector. A small allocation to cash further diminished the fund’s relative performance.
TIAA-CREF Life Funds ¡ 2015 Annual Report 31
Bond Fund
Performance as of December 31, 2015
| | | | | | | | | | | | | | | | |
| |
| | | |
| | | | | | Total
return | | | Average annual
total return | |
| | | Inception date | | | 1 year | | | 5 years | | | 10 years | |
| |
Bond Fund | | | 7/8/2003 | | | | 0.57% | | | | 3.49 | % | | | 4.23% | |
| |
Barclays U.S. Aggregate Bond Index | | | — | | | | 0.55 | | | | 3.25 | | | | 4.51 | |
| |
The returns in this report show past performance, which is no guarantee of future results. Returns and the principal value of your investment will fluctuate. Current performance may be higher or lower than that shown, and you may have a gain or a loss when you redeem your shares. For current performance information, including performance to the most recent month-end, please visit tiaa-cref.org. Performance may reflect waivers or reimbursements of certain expenses. Absent these waivers or reimbursement arrangements, performance may be lower.
Total returns for the shares of the fund do not include the effect of expenses attributable to the variable annuity or variable life insurance product; if they did, returns for the shares of the fund would have been lower.
You cannot invest directly in any index. Index returns do not include a deduction for fees or expenses.
$10,000 over 10 years
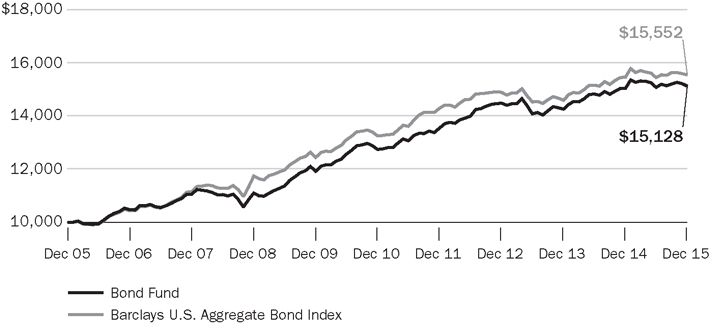
For the purpose of comparison, the graph also shows the change in the value of the fund’s benchmark during the same period.
32 2015 Annual Report ¡ TIAA-CREF Life Funds
Bond Fund
Expense example
Six months ended December 31, 2015
| | | | | | | | | | | | |
| |
Bond Fund | | Beginning
account value
(7/1/15) | | | Ending
account value
(12/31/15) | | | Expenses paid
during period*
(7/1/15–12/31/15) | |
| |
| | | |
Actual return | | | $1,000.00 | | | | $1,002.93 | | | | $1.77 | |
| | | |
5% annual hypothetical return | | | 1,000.00 | | | | 1,023.44 | | | | 1.79 | |
| |
| * | “Expenses paid during period” is based on the fund’s actual expense ratio for the most recent fiscal half-year, multiplied by the average account value over the six-month period, multiplied by 184/365. There were 184 days in the six months ended December 31, 2015. The fund’s annualized six-month expense ratio for that period was 0.35%. The expense charges of the fund may at times reflect a reimbursement. Please see the prospectus for an explanation, including the date on which this reimbursement is scheduled to end. Without such reimbursement, the expenses of the fund would be higher and its performance lower. |
For more information about this expense example, please see page 6.
Portfolio composition
| | | | |
| |
|
% of net assets as of 12/31/2015 | |
| |
| |
Corporate bonds | | | 34.3 | |
| |
Mortgage-backed securities† | | | 19.6 | |
| |
Foreign government & corporate bonds denominated in U.S. dollars | | | 16.9 | |
| |
Commercial mortgage-backed securities | | | 14.5 | |
| |
Asset-backed securities | | | 5.5 | |
| |
U.S. Treasury securities | | | 4.1 | |
| |
Bank loan obligations | | | 1.5 | |
| |
Municipal bonds | | | 0.5 | |
| |
U.S. agency securities | | | 0.3 | |
| |
Short-term investments,other assets & liabilities, net | | | 2.8 | |
| |
| |
Total | | | 100.0 | |
| † | Includes mortgage pass-through securities and collateralized mortgage obligations |
Holdings by maturity
| | | | |
| |
% of fixed-income investments (excluding
short-term investments) as of 12/31/2015 | |
| |
| |
Less than 1 year | | | 6.1 | |
| |
1–3 years | | | 16.2 | |
| |
3–5 years | | | 17.3 | |
| |
5–10 years | | | 48.2 | |
| |
Over 10 years | | | 12.2 | |
| |
| |
Total | | | 100.0 | |
Holdings by credit quality‡
| | | | |
| |
% of fixed-income investments (excluding short-term investments) as of 12/31/2015 | |
| |
| |
Aaa/AAA | | | 26.1 | |
| |
Aa/AA | | | 4.0 | |
| |
A/A | | | 15.7 | |
| |
Baa/BBB | | | 35.1 | |
| |
Ba/BB | | | 5.3 | |
| |
B/B | | | 7.6 | |
| |
Below B/B | | | 3.4 | |
| |
Non-rated | | | 2.8 | |
| |
| |
Total | | | 100.0 | |
| ‡ | Credit quality ratings are based on the Barclays methodology, which uses the median rating of those compiled by the Moody’s, Standard & Poor’s and Fitch ratings agencies. If ratings are available from only two of these agencies, the lower rating is used. When only one rating is available, that one is used. These ratings are subject to change without notice. |
TIAA-CREF Life Funds ¡ 2015 Annual Report 33
Money Market Fund
Performance for the twelve months ended December 31, 2015
The Money Market Fund returned 0.00% for the year, compared with the 0.02% return of the iMoneyNet Money Fund Averages™—All Taxable, a simple average of over 1,000 taxable money market funds. The iMoneyNet average is not an index, and its return reflects the deduction of expenses charged by the funds included in the average.
The Federal Reserve’s target for short-term interest rates went from 0.00%–0.25% to 0.25%–0.50% on December 16, 2015, fulfilling speculation of a rate hike that permeated financial markets for much of 2015. The increase in the federal funds target rate was the first to occur in nine years and represents a process of “rate normalization” by the Fed.
Money Market Fund is restructuring to comply with new SEC regulations
On August 11, 2015, the TIAA-CREF Life Funds board approved a restructuring of the Money Market Fund as a “government” money market instrument. This action was taken to comply with new SEC regulations requiring all money market funds to restructure as retail, institutional or government. As a government fund, the Money Market Fund will invest 99.5% or more of its total assets in cash, U.S. government securities and/or repurchase agreements (“repos”) collateralized fully in cash or U.S. government securities. The restructuring will be effective by October 2016.
Many other U.S. money market funds are also expected to restructure as government funds. As a result, the supply of commercial paper declined in 2015, while the supply of short-term Treasuries increased by year-end. LIBOR yields also rose at the end of 2015, as a result of the Fed rate hike in December. Three-month LIBOR increased from 0.26% in January 2015 to 0.61% by December 31.
In pursuit of additional yield, the fund held longer-dated, floating-rate government agency paper in order to capture slightly higher yields. In 2015, our commercial paper exposure was diversified across industries and issuers, nearly all of which are U.S.-domiciled. The fund had limited exposure in Europe and made select investments in top-tier Pacific Rim banks. As of December 29, 2015, the fund’s weighted average maturity was 44 days, versus 35 days for the average iMoneyNet fund.
34 2015 Annual Report ¡ TIAA-CREF Life Funds
Money Market Fund
Net annualized yield for the 7 days ended December 29, 2015*
| | | | | | | | |
| |
| | |
| | | Current yield | | | Effective yield | |
| |
| | |
Money Market Fund† | | | 0.12 | % | | | 0.12% | |
| |
| | |
iMoneyNet Money Fund Averages—All Taxable‡ | | | 0.06 | | | | 0.06 | |
| |
The current yield more closely reflects current earnings than does the total return.
| * | Typically, iMoneyNet reports its 7-day yields as of Tuesday of each week. |
Performance as of December 31, 2015
| | | | | | | | | | | | | | | | |
| |
| | | |
| | | | | | Total
return | | | Average annual
total return | |
| | | Inception date | | | 1 year | | | 5 years | | | 10 years | |
| |
| | | | |
Money Market Fund† | | | 7/8/2003 | | | | 0.00% | | | | 0.01% | | | | 1.38% | |
| |
| | | | |
iMoneyNet Money Fund Averages—All Taxable‡ | | | — | | | | 0.02 | | | | 0.02 | | | | 1.14 | |
| |
The returns in this report show past performance, which is no guarantee of future results. Returns and the principal value of your investment will fluctuate. Current performance may be higher or lower than that shown, and you may have a gain or a loss when you redeem your shares. For current performance information, including performance to the most recent month-end, please visit tiaa-cref.org. Performance may reflect waivers or reimbursements of certain expenses. Absent these waivers or reimbursement arrangements, performance may be lower.
Total returns for the shares of the fund do not include the effect of expenses attributable to the variable annuity or variable life insurance product; if they did, returns for the shares of the fund would have been lower.
Investments in the TIAA-CREF Life Money Market Fund are neither insured nor guaranteed by the Federal Deposit Insurance Corporation (FDIC) or any other government agency. Although the fund seeks to preserve the value of your investment at $1.00 per share, it is possible to lose money by investing in the fund. For a detailed discussion of risk, please see the prospectus.
| † | Beginning May 29, 2013, part or all of the investment management fees of the TIAA-CREF Life Money Market Fund are being voluntarily waived. Without this waiver, the total returns would have been lower. This voluntary fee waiver may be discontinued at any time without notice. |
| ‡ | The iMoneyNet Money Fund Averages–All Taxable category is a simple average of over 1,000 taxable money market funds. You cannot invest in it directly. |
TIAA-CREF Life Funds ¡ 2015 Annual Report 35
Money Market Fund
Expense example
Six months ended December 31, 2015
| | | | | | | | | | | | |
| |
Money Market Fund | | Beginning
account value
(7/1/15) | | | Ending
account value
(12/31/15) | | | Expenses paid
during period*
(7/1/15–12/31/15) | |
| |
| | | |
Actual return | | | $1,000.00 | | | | $1,000.03 | | | | $0.86 | |
| | | |
5% annual hypothetical return | | | 1,000.00 | | | | 1,024.35 | | | | 0.87 | |
| |
| * | “Expenses paid during period” is based on the fund’s actual expense ratio for the most recent fiscal half-year, multiplied by the average account value over the six-month period, multiplied by 184/365. There were 184 days in the six months ended December 31, 2015. The fund’s annualized six-month expense ratio for that period was 0.17%. The expense charges of the fund reflect a voluntary waiver and may at times reflect a reimbursement. Please see the prospectus for an explanation, including the date on which this reimbursement is scheduled to end. Without such waiver and reimbursement, the expenses of the fund would be higher and its performance lower. |
For more information about this expense example, please see page 6.
Portfolio composition
| | | | |
| |
% of net assets as of 12/31/2015 | |
| |
| |
U.S. government agency securities | | | 38.1 | |
| |
Commercial paper | | | 26.3 | |
| |
U.S. Treasury securities | | | 19.3 | |
| |
Floating-rate securities, government | | | 12.7 | |
| |
Certificates of deposit | | | 3.2 | |
| |
Other assets & liabilities, net | | | 0.4 | |
| |
| |
Total | | | 100.0 | |
36 2015 Annual Report ¡ TIAA-CREF Life Funds
Balanced Fund
Performance for the twelve months ended December 31, 2015
The Balanced Fund returned 1.28% for the year, compared with the 0.64% return of its benchmark, the Balanced Fund Composite Index.
The U.S. economy expanded in 2015. Following a weak first quarter, gross domestic product (GDP), which measures the value of all goods and services produced in the United States, rose at an annualized rate of 3.9% and 2.0% in the second and third quarters, respectively. Average hourly wages increased, inflation rose slightly and the national unemployment rate dropped to 5.0%.
U.S. stocks gained 0.48% in 2015, as measured by the Russell 3000® Index, marking seven straight years of positive performance. Foreign equities fell, in U.S. dollar terms, amid concerns about Greece’s debt problems and slowing growth in China. U.S. dollar strength was also a headwind as the MSCI EAFE Index, which measures stock performance in 21 developed market nations outside North America, actually advanced 5.33%, in terms of local currency.
On December 16, 2015, the Federal Reserve approved a quarter-point hike in its federal funds target rate, which marked the first increase since June 29, 2006. The broad investment-grade fixed-rate bond market, as measured by the Barclays U.S. Aggregate Bond Index, gained 0.55% for the period. The yield on the 10-year U.S. Treasury bond rose from 2.12% on January 2, 2015 to 2.27% on December 31, 2015.
Strong selection in U.S. stock holdings propels the fund past its benchmark
In 2015, the fund’s absolute performance benefited from positive returns from U.S. stocks and bonds held by the underlying funds of the Balanced Fund. The fund’s U.S. stock holdings contributed most to performance.
The fund’s return was double that of its composite benchmark for the year. During that time, most of the underlying funds outperformed the broad market indexes used to calculate the benchmark.
The majority of the fund’s outperformance versus its benchmark was due to the strong performance of its underlying funds, led by the Growth Equity Fund, the Growth & Income Fund and the Small-Cap Equity Fund. The Bond Fund also had a positive impact on relative results.
In contrast, the Large-Cap Value Fund and the International Equity Fund detracted from relative performance.
(Performance for the Balanced Fund’s underlying funds can be found at www.tiaa-cref.org/performance.)
TIAA-CREF Life Funds ¡ 2015 Annual Report 37
Balanced Fund
Performance as of December 31, 2015
| | | | | | | | | | | | |
| |
| | | | | |
| Total
return |
| |
| Average annual
total return |
|
| | | Inception date | | | 1 year | | | since inception | |
| |
| | | |
Balanced Fund | | | 1/31/2014 | | | | 1.28% | | | | 4.39% | |
|
| |
| | | |
Balanced Fund Composite Index* | | | — | | | | 0.64 | | | | 4.70† | |
|
| |
| | | |
Broad market indexes | | | | | | | | | | | | |
Barclays U.S. Aggregate Bond Index | | | — | | | | 0.55 | | | | 2.58† | |
Russell 3000® Index | | | — | | | | 0.48 | | | | 8.44† | |
|
| |
The returns in this report show past performance, which is no guarantee of future results. Returns and the principal value of your investment will fluctuate. Current performance may be higher or lower than that shown, and you may have a gain or a loss when you redeem your shares. For current performance information, including performance to the most recent month-end, please visit tiaa-cref.org. Performance may reflect waivers or reimbursements of certain expenses. Absent these waivers or reimbursement arrangements, performance may be lower.
Total returns for the shares of the fund do not include the effect of expenses attributable to the variable annuity or variable life insurance product; if they did, returns for the shares of the fund would have been lower.
You cannot invest directly in any index. Index returns do not include a deduction for fees or expenses.
| * | On December 31, 2015, the Balanced Fund Composite Index consisted of: 50.0% Barclays U.S. Aggregate Bond Index, 40.0% Russell 3000 Index and 10.0% MSCI EAFE Index. The fund’s benchmark, the components that make up the composite benchmark and the method of calculating the composite benchmark’s performance may vary over time. |
| † | Performance is calculated from the inception date of the fund. |
$10,000 invested at fund’s inception
(Inception: January 31, 2014)
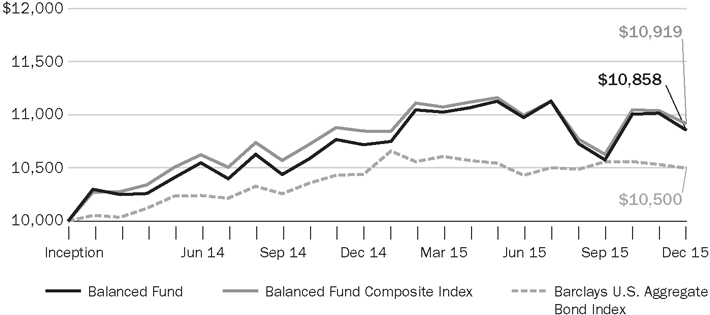
For the purpose of comparison, the graph also shows the change in the value of the fund’s benchmark and of a broad market index during the same period.
38 2015 Annual Report ¡ TIAA-CREF Life Funds
Balanced Fund
Expense example
Period ended December 31, 2015
| | | | | | | | | | | | | | | | |
| |
| | | | |
| Balanced Fund | | Beginning
account
value
(7/1/15) | | | Ending
account
value
(12/31/15) | | | Expenses paid
during period*
(7/1/15-12/31/15) | | | Effective
expenses paid
during period†
(7/1/15-12/31/15) | |
|
| |
| | | | |
Actual return | | | $1,000.00 | | | | $ 989.09 | | | | $0.50 | | | | $2.56 | |
| | | | |
5% annual hypothetical return | | | 1,000.00 | | | | 1,024.70 | | | | 0.51 | | | | 2.60 | |
|
| |
| * | “Expenses paid during period” is based on the fund’s actual expense ratio for the most recent fiscal half-year, multiplied by the average account value over the six-month period, multiplied by 184/365. There were 184 days in the six months ended December 31, 2015. The fund’s annualized six-month expense ratio for that period was 0.10%. The expense charges of the fund reflect a voluntary waiver and may at times reflect a reimbursement. Please see the prospectus for an explanation, including the date on which this reimbursement is scheduled to end. Without such waiver and reimbursement, the expenses of the fund would be higher and its performance lower. |
| † | “Effective expenses paid during period” is based on each fund’s total expense ratio for the most recent fiscal half-year, which includes the fund’s own expense ratio plus its pro rata share of its underlying funds’ expenses (which the fund bears through its investment in the underlying funds). For the six-month period, the total annualized weighted average expense ratio was 0.51%. |
For more information about this expense example, please see page 6.
Asset allocation
| | | | |
| |
| |
| | | % of net assets
as of 12/31/2015 | |
| |
| |
Equity | | | | |
| |
U.S. equity | | | 39.6 | |
| |
International equity | | | 9.9 | |
| |
Fixed income | | | 50.4 | |
| |
Other assets & liabilities, net | | | 0.1 | |
|
| |
| |
Total | | | 100.0 | |
Target allocation
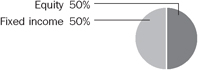
TIAA-CREF Life Funds ¡ 2015 Annual Report 39
| | |
| Summary portfolio of investments | | |
Growth Equity Fund § December 31, 2015
| | | | | | | | | | | | | | | | |
| Shares | | | | | Company | | | | Value | | | % of net assets | |
| | | | | | | | | | | | | | | | |
| | COMMON STOCKS | | | | | | | | |
| | AUTOMOBILES & COMPONENTS | | | | | | | | |
| | 13,055 | | | | | Delphi Automotive plc | | | | $ | 1,119,205 | | | | 1.4 | % |
| | | | | | Other | | | | | 454,819 | | | | 0.5 | |
| | | | | | | | | | | | |
| | | | | | | | | | | 1,574,024 | | | | 1.9 | |
| | | | | | | | | | | | |
| | CAPITAL GOODS | | | | | | | | |
| | 5,163 | | | | | Boeing Co | | | | | 746,518 | | | | 0.9 | |
| | 6,582 | | | | | Northrop Grumman Corp | | | | | 1,242,748 | | | | 1.5 | |
| | 4,243 | | | | | Roper Industries, Inc | | | | | 805,279 | | | | 1.0 | |
| | | | | | Other | | | | | 353,608 | | | | 0.5 | |
| | | | | | | | | | | | |
| | | | | | | | | | | 3,148,153 | | | | 3.9 | |
| | | | | | | | | | | | |
| | COMMERCIAL & PROFESSIONAL SERVICES | | | | | | | | |
| | 26,447 | | | | | Nielsen NV | | | | | 1,232,430 | | | | 1.5 | |
| | 13,160 | | | * | | Verisk Analytics, Inc | | | | | 1,011,741 | | | | 1.2 | |
| | | | | | | | | | | | |
| | | | | | | | | | | 2,244,171 | | | | 2.7 | |
| | | | | | | | | | | | |
| | CONSUMER DURABLES & APPAREL | | | | | | | | |
| | 30,908 | | | | | Nike, Inc (Class B) | | | | | 1,931,750 | | | | 2.4 | |
| | 12,237 | | | | | VF Corp | | | | | 761,754 | | | | 0.9 | |
| | | | | | Other | | | | | 113,146 | | | | 0.1 | |
| | | | | | | | | | | | |
| | | | | | | | | | | 2,806,650 | | | | 3.4 | |
| | | | | | | | | | | | |
| | CONSUMER SERVICES | | | | | | | | |
| | 29,359 | | | * | | Norwegian Cruise Line Holdings Ltd | | | | | 1,720,437 | | | | 2.1 | |
| | 38,047 | | | | | Starbucks Corp | | | | | 2,283,962 | | | | 2.8 | |
| | | | | | Other | | | | | 421,153 | | | | 0.5 | |
| | | | | | | | | | | | |
| | | | | | | | | | | 4,425,552 | | | | 5.4 | |
| | | | | | | | | | | | |
| | DIVERSIFIED FINANCIALS | | | | | | | | |
| | 19,861 | | | | | Charles Schwab Corp | | | | | 654,023 | | | | 0.8 | |
| | 3,355 | | | | | IntercontinentalExchange Group, Inc | | | | | 859,752 | | | | 1.0 | |
| | 24,501 | | | | | Morgan Stanley | | | | | 779,377 | | | | 1.0 | |
| | | | | | Other | | | | | 650,523 | | | | 0.8 | |
| | | | | | | | | | | | |
| | | | | | | | | | | 2,943,675 | | | | 3.6 | |
| | | | | | | | | | | | |
| | ENERGY | | | | | | | | |
| | 6,282 | | | * | | Concho Resources, Inc | | | | | 583,347 | | | | 0.7 | |
| | | | | | | | | | | | |
| | | | | | | | | | | 583,347 | | | | 0.7 | |
| | | | | | | | | | | | |
| | FOOD, BEVERAGE & TOBACCO | | | | | | | | |
| | 8,889 | | | * | | Monster Beverage Corp | | | | | 1,324,105 | | | | 1.6 | |
| | | | | | Other | | | | | 517,746 | | | | 0.7 | |
| | | | | | | | | | | | |
| | | | | | | | | | | 1,841,851 | | | | 2.3 | |
| | | | | | | | | | | | |
| | HEALTH CARE EQUIPMENT & SERVICES | | | | | | | | |
| | 11,772 | | | * | | Cerner Corp | | | | | 708,321 | | | | 0.9 | |
| | 2,120 | | | * | | Intuitive Surgical, Inc | | | | | 1,157,859 | | | | 1.4 | |
| | | | | | | | | | | | |
| | | | | | | | | | | 1,866,180 | | | | 2.3 | |
| | | | | | | | | | | | |
| | | | |
| 40 | | 2015 Annual Report § TIAA-CREF Life Funds | | See notes to financial statements |
| | |
| Summary portfolio of investments | | continued |
Growth Equity Fund § December 31, 2015
| | | | | | | | | | | | | | | | |
| Shares | | | | | Company | | | | Value | | | % of net assets | |
| | | | | | | | | | | | | | | | |
| | HOUSEHOLD & PERSONAL PRODUCTS | | | | | | | | |
| | 19,521 | | | | | Estee Lauder Cos (Class A) | | | | $ | 1,719,019 | | | | 2.1 | % |
| | | | | | | | | | | | |
| | | | | | | | | | | 1,719,019 | | | | 2.1 | |
| | | | | | | | | | | | |
| | MATERIALS | | | | | | | | |
| | 12,805 | | | | | Monsanto Co | | | | | 1,261,548 | | | | 1.5 | |
| | 8,279 | | | | | PPG Industries, Inc | | | | | 818,131 | | | | 1.0 | |
| | 2,146 | | | | | Sherwin-Williams Co | | | | | 557,102 | | | | 0.7 | |
| | | | | | | | | | | | |
| | | | | | | | | | | 2,636,781 | | | | 3.2 | |
| | | | | | | | | | | | |
| | MEDIA | | | | | | | | |
| | 26,133 | | | | | Comcast Corp (Class A) | | | | | 1,474,685 | | | | 1.8 | |
| | 8,921 | | | | | Time Warner, Inc | | | | | 576,921 | | | | 0.7 | |
| | 5,782 | | | | | Walt Disney Co | | | | | 607,573 | | | | 0.8 | |
| | | | | | Other | | | | | 402,160 | | | | 0.5 | |
| | | | | | | | | | | | |
| | | | | | | | | | | 3,061,339 | | | | 3.8 | |
| | | | | | | | | | | | |
| | PHARMACEUTICALS, BIOTECHNOLOGY & LIFE SCIENCES | | | | | | | | |
| | 4,827 | | | * | | Alexion Pharmaceuticals, Inc | | | | | 920,750 | | | | 1.1 | |
| | 5,594 | | | * | | Allergan plc | | | | | 1,748,125 | | | | 2.1 | |
| | 14,744 | | | | | Bristol-Myers Squibb Co | | | | | 1,014,240 | | | | 1.3 | |
| | 19,653 | | | *,p | | Celgene Corp | | | | | 2,353,643 | | | | 2.9 | |
| | 18,380 | | | | | Eli Lilly & Co | | | | | 1,548,699 | | | | 1.9 | |
| | 15,377 | | | | | Gilead Sciences, Inc | | | | | 1,555,999 | | | | 1.9 | |
| | 7,527 | | | | | Thermo Electron Corp | | | | | 1,067,705 | | | | 1.3 | |
| | | | | | Other | | | | | 1,760,306 | | | | 2.2 | |
| | | | | | | | | | | | |
| | | | | | | | | | | 11,969,467 | | | | 14.7 | |
| | | | | | | | | | | | |
| | REAL ESTATE | | | 396,425 | | | | 0.5 | |
| | | | | | | | | | | | |
| | RETAILING | | | | | | | | |
| | 6,852 | | | * | | Amazon.com, Inc | | | | | 4,631,198 | | | | 5.7 | |
| | 4,792 | | | | | Expedia, Inc | | | | | 595,645 | | | | 0.7 | |
| | 14,523 | | | | | Home Depot, Inc | | | | | 1,920,667 | | | | 2.4 | |
| | | | | | Other | | | | | 482,684 | | | | 0.6 | |
| | | | | | | | | | | | |
| | | | | | | | | | | 7,630,194 | | | | 9.4 | |
| | | | | | | | | | | | |
| | SEMICONDUCTORS & SEMICONDUCTOR EQUIPMENT | | | | | | | | |
| | 17,995 | | | | | ARM Holdings plc (ADR) | | | | | 814,094 | | | | 1.0 | |
| | | | | | Other | | | | | 744,554 | | | | 0.9 | |
| | | | | | | | | | | | |
| | | | | | | | | | | 1,558,648 | | | | 1.9 | |
| | | | | | | | | | | | |
| | SOFTWARE & SERVICES | | | | | | | | |
| | 17,652 | | | | | Activision Blizzard, Inc | | | | | 683,309 | | | | 0.8 | |
| | 28,481 | | | * | | Adobe Systems, Inc | | | | | 2,675,505 | | | | 3.3 | |
| | 2,521 | | | * | | Alphabet, Inc (Class A) | | | | | 1,961,363 | | | | 2.4 | |
| | 3,927 | | | * | | Alphabet, Inc (Class C) | | | | | 2,980,122 | | | | 3.7 | |
| | 27,731 | | | * | | Facebook, Inc | | | | | 2,902,326 | | | | 3.6 | |
| | 29,727 | | | | | Intuit, Inc | | | | | 2,868,655 | | | | 3.5 | |
| | 25,330 | | | | | Mastercard, Inc (Class A) | | | | | 2,466,129 | | | | 3.0 | |
| | 31,110 | | | | | Microsoft Corp | | | | | 1,725,983 | | | | 2.1 | |
| | | | | | |
| See notes to financial statements | | TIAA-CREF Life Funds § 2015 Annual Report | | | 41 | |
| | |
| Summary portfolio of investments | | concluded |
Growth Equity Fund § December 31, 2015
| | | | | | | | | | | | | | | | |
| Shares | | | | | Company | | | | Value | | | % of net assets | |
| | | | | | | | | | | | | | | | |
| | SOFTWARE & SERVICES—continued | | | | | | | | |
| | 15,750 | | | * | | Red Hat, Inc | | | | $ | 1,304,257 | | | | 1.6 | % |
| | 22,014 | | | * | | Salesforce.com, Inc | | | | | 1,725,898 | | | | 2.1 | |
| | 25,450 | | | | | Visa, Inc (Class A) | | | | | 1,973,648 | | | | 2.4 | |
| | | | | | Other | | | | | 2,647,413 | | | | 3.3 | |
| | | | | | | | | | | | |
| | | | | | | | | | | 25,914,608 | | | | 31.8 | |
| | | | | | | | | | | | |
| | TECHNOLOGY HARDWARE & EQUIPMENT | | | | | | | | |
| | 25,262 | | | | | Apple, Inc | | | | | 2,659,078 | | | | 3.3 | |
| | 33,850 | | | | | Cisco Systems, Inc | | | | | 919,197 | | | | 1.1 | |
| | | | | | Other | | | | | 269,494 | | | | 0.3 | |
| | | | | | | | | | | | |
| | | | | | | | | | | 3,847,769 | | | | 4.7 | |
| | | | | | | | | | | | |
| | TELECOMMUNICATION SERVICES | | | | | | | | |
| | 16,765 | | | * | | Level 3 Communications, Inc | | | | | 911,345 | | | | 1.1 | |
| | | | | | | | | | | | |
| | | | | | | | | | | 911,345 | | | | 1.1 | |
| | | | | | | | | | | | |
| | TRANSPORTATION | | | 432,690 | | | | 0.5 | |
| | | | | | | | | | | | |
| | | | | | TOTAL COMMON STOCKS | | (Cost $60,018,389) | | | 81,511,888 | | | | 99.9 | |
| | | | | | | | | | | | |
| | | |
| | SHORT-TERM INVESTMENTS | | | | | | | | | | |
| | INVESTMENTS IN REGISTERED INVESTMENT COMPANIES | | | | | | | | | | |
| | 641,218 | | | c | | TIAA-CREF Short Term Lending Portfolio of the State Street Navigator Securities Lending Trust | | | | | 641,218 | | | | 0.8 | |
| | | | | | | | | | | | |
| | | | | | | | | | | 641,218 | | | | 0.8 | |
| | | | | | | | | | | | |
| | | | | | TOTAL SHORT-TERM INVESTMENTS | | (Cost $641,218) | | | 641,218 | | | | 0.8 | |
| | | | | | | | | | | | |
| | | | | |
| | | | | | TOTAL PORTFOLIO | | (Cost $60,659,607) | | | 82,153,106 | | | | 100.7 | |
| | | | | | OTHER ASSETS & LIABILITIES, NET | | | | | (584,233 | ) | | | (0.7 | ) |
| | | | | | | | | | | | |
| | | | | | NET ASSETS | | | | $ | 81,568,873 | | | | 100.0 | % |
| | | | | | | | | | |
Abbreviation(s):
| ADR American | Depositary Receipt |
| c | Investments made with cash collateral received from securities on loan. |
| p | All or a portion of these securities have been segregated by the custodian to cover requirements on open written options contracts. |
At 12/31/15, the aggregate value of securities on loan is $629,295.
“Other” securities represent the aggregate value, by category, of securities that are not among the 50 largest holdings and, in total for any issuer, represent 1% or less of net assets.
For ease of presentation, a number of classification categories have been grouped together in the Summary portfolio of investments. Note that the Fund uses more specific categories in following its investment limitations on investment concentrations.
| | | | |
| 42 | | 2015 Annual Report § TIAA-CREF Life Funds | | See notes to financial statements |
| | |
| Summary portfolio of investments | | |
Growth & Income Fund § December 31, 2015
| | | | | | | | | | | | | | | | |
| Shares | | | | | Company | | | | Value | | | % of net
assets | |
| | | | | | | | | | | | | | | | |
| | COMMON STOCKS | |
| | AUTOMOBILES & COMPONENTS | | | | $ | 1,120,636 | | | | 0.8 | % |
| | | | | | | | | | | | |
| | BANKS | | | | | | | | | | |
| | 111,202 | | | | | Bank of America Corp | | | | | 1,871,529 | | | | 1.4 | |
| | 38,812 | | | | | Citigroup, Inc | | | | | 2,008,521 | | | | 1.5 | |
| | 24,793 | | | | | JPMorgan Chase & Co | | | | | 1,637,082 | | | | 1.3 | |
| | 31,111 | | | | | Wells Fargo & Co | | | | | 1,691,194 | | | | 1.3 | |
| | | | | | | | | | | | �� |
| | | | | | | | | | | 7,208,326 | | | | 5.5 | |
| | | | | | | | | | | | |
| | CAPITAL GOODS | | | | | | | | | | |
| | 88,805 | | | p | | General Electric Co | | | | | 2,766,276 | | | | 2.1 | |
| | 14,665 | | | | | Honeywell International, Inc | | | | | 1,518,854 | | | | 1.2 | |
| | 9,241 | | | | | Illinois Tool Works, Inc | | | | | 856,456 | | | | 0.6 | |
| | 4,425 | | | | | Northrop Grumman Corp | | | | | 835,484 | | | | 0.6 | |
| | 8,076 | | | | | Raytheon Co | | | | | 1,005,704 | | | | 0.8 | |
| | | | | | Other | | | | | 2,820,818 | | | | 2.1 | |
| | | | | | | | | | | | |
| | | | | | | | | | | 9,803,592 | | | | 7.4 | |
| | | | | | | | | | | | |
| | COMMERCIAL & PROFESSIONAL SERVICES | | | | | 687,042 | | | | 0.5 | |
| | | | | | | | | | | | |
| | CONSUMER DURABLES & APPAREL | | | | | | | | | | |
| | 24,376 | | | | | Newell Rubbermaid, Inc | | | | | 1,074,494 | | | | 0.8 | |
| | 16,220 | | | | | Nike, Inc (Class B) | | | | | 1,013,750 | | | | 0.8 | |
| | | | | | Other | | | | | 2,460,204 | | | | 1.8 | |
| | | | | | | | | | | | |
| | | | | | | | | | | 4,548,448 | | | | 3.4 | |
| | | | | | | | | | | | |
| | CONSUMER SERVICES | | | | | | | | | | |
| | 15,471 | | | | | Starbucks Corp | | | | | 928,724 | | | | 0.7 | |
| | | | | | Other | | | | | 3,133,011 | | | | 2.4 | |
| | | | | | | | | | | | |
| | | | | | | | | | | 4,061,735 | | | | 3.1 | |
| | | | | | | | | | | | |
| | DIVERSIFIED FINANCIALS | | | | | | | | | | |
| | 33,008 | | | | | Morgan Stanley | | | | | 1,049,984 | | | | 0.8 | |
| | | | | | Other | | | | | 3,058,069 | | | | 2.3 | |
| | | | | | | | | | | | |
| | | | | | | | | | | 4,108,053 | | | | 3.1 | |
| | | | | | | | | | | | |
| | ENERGY | | | | | | | | | | |
| | 11,371 | | | | | EOG Resources, Inc | | | | | 804,953 | | | | 0.6 | |
| | | | | | Other | | | | | 5,424,822 | | | | 4.1 | |
| | | | | | | | | | | | |
| | | | | | | | | | | 6,229,775 | | | | 4.7 | |
| | | | | | | | | | | | |
| | FOOD & STAPLES RETAILING | | | | | | | | | | |
| | 5,739 | | | | | Costco Wholesale Corp | | | | | 926,848 | | | | 0.7 | |
| | 31,290 | | | | | Kroger Co | | | | | 1,308,861 | | | | 1.0 | |
| | | | | | | | | | | | |
| | | | | | | | | | | 2,235,709 | | | | 1.7 | |
| | | | | | | | | | | | |
| | FOOD, BEVERAGE & TOBACCO | | | | | | | | | | |
| | 44,420 | | | | | Coca-Cola Co | | | | | 1,908,283 | | | | 1.4 | |
| | 25,932 | | | | | Mondelez International, Inc | | | | | 1,162,791 | | | | 0.9 | |
| | 5,503 | | | * | | Monster Beverage Corp | | | | | 819,727 | | | | 0.6 | |
| | 20,986 | | | | | PepsiCo, Inc | | | | | 2,096,921 | | | | 1.6 | |
| | | | | | |
| See notes to financial statements | | TIAA-CREF Life Funds § 2015 Annual Report | | | 43 | |
| | |
| Summary portfolio of investments | | continued |
Growth & Income Fund § December 31, 2015
| | | | | | | | | | | | | | | | |
| Shares | | | | | Company | | | | Value | | | % of net
assets | |
| | | | | | | | | | | | | | | | |
| | FOOD, BEVERAGE & TOBACCO—continued | | | | | | | | | | |
| | 15,020 | | | | | Philip Morris International, Inc | | | | $ | 1,320,408 | | | | 1.0 | % |
| | | | | | Other | | | | | 2,388,626 | | | | 1.8 | |
| | | | | | | | | | | | |
| | | | | | | | | | | 9,696,756 | | | | 7.3 | |
| | | | | | | | | | | | |
| | HEALTH CARE EQUIPMENT & SERVICES | | | | | | | | | | |
| | 11,619 | | | * | | Express Scripts Holding Co | | | | | 1,015,617 | | | | 0.8 | |
| | 16,549 | | | | | Medtronic plc | | | | | 1,272,949 | | | | 0.9 | |
| | | | | | Other | | | | | 3,701,335 | | | | 2.8 | |
| | | | | | | | | | | | |
| | | | | | | | | | | 5,989,901 | | | | 4.5 | |
| | | | | | | | | | | | |
| | HOUSEHOLD & PERSONAL PRODUCTS | | | | | 782,467 | | | | 0.6 | |
| | | | | | | | | | | | |
| | INSURANCE | | | | | | | | | | |
| | 11,227 | | | | | ACE Ltd | | | | | 1,311,875 | | | | 1.0 | |
| | | | | | Other | | | | | 1,251,278 | | | | 0.9 | |
| | | | | | | | | | | | |
| | | | | | | | | | | 2,563,153 | | | | 1.9 | |
| | | | | | | | | | | | |
| | MATERIALS | | | | | | | | | | |
| | 25,947 | | | | | Dow Chemical Co | | | | | 1,335,752 | | | | 1.0 | |
| | 8,072 | | | | | PPG Industries, Inc | | | | | 797,675 | | | | 0.6 | |
| | | | | | Other | | | | | 1,222,107 | | | | 0.9 | |
| | | | | | | | | | | | |
| | | | | | | | | | | 3,355,534 | | | | 2.5 | |
| | | | | | | | | | | | |
| | MEDIA | | | | | | | | | | |
| | 11,996 | | | | | Walt Disney Co | | | | | 1,260,539 | | | | 1.0 | |
| | | | | | Other | | | | | 2,765,877 | | | | 2.1 | |
| | | | | | | | | | | | |
| | | | | | | | | | | 4,026,416 | | | | 3.1 | |
| | | | | | | | | | | | |
| | PHARMACEUTICALS, BIOTECHNOLOGY & LIFE SCIENCES | | | | | | | | | | |
| | 23,178 | | | | | AbbVie, Inc | | | | | 1,373,065 | | | | 1.1 | |
| | 4,328 | | | * | | Allergan plc | | | | | 1,352,500 | | | | 1.0 | |
| | 8,380 | | | | | Amgen, Inc | | | | | 1,360,325 | | | | 1.0 | |
| | 20,381 | | | | | Bristol-Myers Squibb Co | | | | | 1,402,009 | | | | 1.1 | |
| | 10,738 | | | * | | Celgene Corp | | | | | 1,285,983 | | | | 1.0 | |
| | 17,429 | | | | | Eli Lilly & Co | | | | | 1,468,568 | | | | 1.1 | |
| | 71,059 | | | | | Pfizer, Inc | | | | | 2,293,784 | | | | 1.7 | |
| | | | | | Other | | | | | 4,089,636 | | | | 3.1 | |
| | | | | | | | | | | | |
| | | | | | | | | | | 14,625,870 | | | | 11.1 | |
| | | | | | | | | | | | |
| | REAL ESTATE | | | | | 891,254 | | | | 0.7 | |
| | | | | | | | | | | | |
| | RETAILING | | | | | | | | | | |
| | 3,951 | | | * | | Amazon.com, Inc | | | | | 2,670,441 | | | | 2.0 | |
| | 18,931 | | | | | Home Depot, Inc | | | | | 2,503,625 | | | | 1.9 | |
| | 9,029 | | | * | | NetFlix, Inc | | | | | 1,032,737 | | | | 0.8 | |
| | | | | | Other | | | | | 4,513,634 | | | | 3.4 | |
| | | | | | | | | | | | |
| | | | | | | | | | | 10,720,437 | | | | 8.1 | |
| | | | | | | | | | | | |
| | SEMICONDUCTORS & SEMICONDUCTOR EQUIPMENT | | | | | | | | | | |
| | 5,800 | | | | | Avago Technologies Ltd | | | | | 841,870 | | | | 0.7 | |
| | 49,007 | | | | | Intel Corp | | | | | 1,688,291 | | | | 1.3 | |
| | | | | | Other | | | | | 1,760,855 | | | | 1.3 | |
| | | | | | | | | | | | |
| | | | | | | | | | | 4,291,016 | | | | 3.3 | |
| | | | | | | | | | | | |
| | | | |
| 44 | | 2015 Annual Report § TIAA-CREF Life Funds | | See notes to financial statements |
| | |
| Summary portfolio of investments | | continued |
Growth & Income Fund § December 31, 2015
| | | | | | | | | | | | | | | | |
| Shares | | | | | Company | | | | Value | | | % of net
assets | |
| | | | | | | | | | | | | | | | |
| | SOFTWARE & SERVICES | | | | | | | | | | |
| | 5,476 | | | * | | Alphabet, Inc (Class C) | | | | $ | 4,155,627 | | | | 3.1 | % |
| | 23,800 | | | * | | Facebook, Inc | | | | | 2,490,908 | | | | 1.9 | |
| | 65,218 | | | | | Microsoft Corp | | | | | 3,618,295 | | | | 2.7 | |
| | 16,943 | | | * | | Salesforce.com, Inc | | | | | 1,328,331 | | | | 1.0 | |
| | 20,701 | | | | | Visa, Inc (Class A) | | | | | 1,605,363 | | | | 1.2 | |
| | | | | | Other | | | | | 5,236,389 | | | | 4.0 | |
| | | | | | | | | | | | |
| | | | | | | | | | | 18,434,913 | | | | 13.9 | |
| | | | | | | | | | | | |
| | TECHNOLOGY HARDWARE & EQUIPMENT | | | | | | | | | | |
| | 42,619 | | | | | Apple, Inc | | | | | 4,486,076 | | | | 3.4 | |
| | 65,265 | | | | | Cisco Systems, Inc | | | | | 1,772,271 | | | | 1.3 | |
| | | | | | Other | | | | | 3,001,970 | | | | 2.3 | |
| | | | | | | | | | | | |
| | | | | | | | | | | 9,260,317 | | | | 7.0 | |
| | | | | | | | | | | | |
| | TELECOMMUNICATION SERVICES | | | | | | | | | | |
| | 39,312 | | | | | AT&T, Inc | | | | | 1,352,726 | | | | 1.0 | |
| | | | | | Other | | | | | 1,784,472 | | | | 1.4 | |
| | | | | | | | | | | | |
| | | | | | | | | | | 3,137,198 | | | | 2.4 | |
| | | | | | | | | | | | |
| | TRANSPORTATION | | | | | | | | | | |
| | 21,567 | | | | | Delta Air Lines, Inc | | | | | 1,093,231 | | | | 0.8 | |
| | | | | | Other | | | | | 1,030,491 | | | | 0.8 | |
| | | | | | | | | | | | |
| | | | | | | | | | | 2,123,722 | | | | 1.6 | |
| | | | | | | | | | | | |
| | UTILITIES | | | | | | | | | | |
| | 9,910 | | | | | NextEra Energy, Inc | | | | | 1,029,550 | | | | 0.8 | |
| | | | | | Other | | | | | 1,242,258 | | | | 0.9 | |
| | | | | | | | | | | | |
| | | | | | | | | | | 2,271,808 | | | | 1.7 | |
| | | | | | | | | | | | |
| | | | | | TOTAL COMMON STOCKS | | (Cost $105,482,462) | | | 132,174,078 | | | | 99.9 | |
| | | | | | | | | | | | |
| | | |
| | PURCHASED OPTIONS | | | | | | | | | | |
| | CONSUMER DURABLES & APPAREL | | | | | 180 | | | | 0.0 | |
| | | | | | | | | | | | |
| | ENERGY | | | 385 | | | | 0.0 | |
| | | | | | | | | | | | |
| | MEDIA | | | 210 | | | | 0.0 | |
| | | | | | | | | | | | |
| | TECHNOLOGY HARDWARE & EQUIPMENT | | | 90 | | | | 0.0 | |
| | | | | | | | | | | | |
| | | | | | TOTAL PURCHASED OPTIONS | | (Cost $3,387) | | | 865 | | | | 0.0 | |
| | | | | | | | | | | | |
| | | |
| | SHORT-TERM INVESTMENTS | | | | | | | | | | |
| | INVESTMENTS IN REGISTERED INVESTMENT COMPANIES | | | | | | | | | | |
| | 1,194,927 | | | c | | TIAA-CREF Short Term Lending Portfolio of the State Street Navigator Securities Lending Trust | | | | | 1,194,927 | | | | 1.0 | |
| | | | | | | | | | | | |
| | | | | | | | | | | 1,194,927 | | | | 1.0 | |
| | | | | | | | | | | | |
| | | | | | TOTAL SHORT-TERM INVESTMENTS | | (Cost $1,194,927) | | | 1,194,927 | | | | 1.0 | |
| | | | | | | | | | | | |
| | | | | |
| | | | | | TOTAL PORTFOLIO | | (Cost $106,680,776) | | | 133,369,870 | | | | 100.9 | |
| | | | | | OTHER ASSETS & LIABILITIES, NET | | | | | (1,126,184 | ) | | | (0.9 | ) |
| | | | | | | | | | | | |
| | | | | | NET ASSETS | | | | $ | 132,243,686 | | | | 100.0 | % |
| | | | | | | | | | | | |
| | | | | | |
| See notes to financial statements | | TIAA-CREF Life Funds § 2015 Annual Report | | | 45 | |
| | |
| Summary portfolio of investments | | concluded |
Growth & Income Fund § December 31, 2015
| c | Investments made with cash collateral received from securities on loan. |
| p | All or a portion of these securities have been segregated by the custodian to cover requirements on open written options contracts. |
At 12/31/15, the aggregate value of securities on loan is $1,172,315.
At 12/31/15, the aggregate value of securities exempt from registration under Rule 144(A) of the Securities Act of 1933 amounted to $420,831 or 0.3% of net assets. Such securities are deemed liquid and may be resold in transactions exempt from registration to qualified institutional buyers.
“Other” securities represent the aggregate value, by category, of securities that are not among the 50 largest holdings and, in total for any issuer, represent 1% or less of net assets.
For ease of presentation, a number of classification categories have been grouped together in the Summary portfolio of investments. Note that the Fund uses more specific categories in following its investment limitations on investment concentrations.
| | | | |
| 46 | | 2015 Annual Report § TIAA-CREF Life Funds | | See notes to financial statements |
| | |
| Summary portfolio of investments | | |
Large-Cap Value Fund § December 31, 2015
| | | | | | | | | | | | | | | | |
| Shares | | | | | Company | | | | Value | | | % of net
assets | |
| | | | | | | | | | | | | | | | |
| | COMMON STOCKS | |
| | AUTOMOBILES & COMPONENTS | | | | $ | 321,016 | | | | 0.5 | % |
| | | | | | | | | | | | |
| | BANKS | | | | | | | | | | |
| | 110,372 | | | | | Bank of America Corp | | | | | 1,857,561 | | | | 2.9 | |
| | 19,125 | | | | | Citigroup, Inc | | | | | 989,719 | | | | 1.5 | |
| | 16,120 | | | | | JPMorgan Chase & Co | | | | | 1,064,403 | | | | 1.7 | |
| | 31,631 | | | | | Wells Fargo & Co | | | | | 1,719,461 | | | | 2.7 | |
| | | | | | Other | | | | | 1,962,786 | | | | 3.1 | |
| | | | | | | | | | | | |
| | | | | | | | | | | 7,593,930 | | | | 11.9 | |
| | | | | | | | | | | | |
| | CAPITAL GOODS | | | | | | | | | | |
| | 34,962 | | | | | General Electric Co | | | | | 1,089,066 | | | | 1.7 | |
| | 40,352 | | | | | Terex Corp | | | | | 745,705 | | | | 1.1 | |
| | | | | | Other | | | | | 2,425,625 | | | | 3.8 | |
| | | | | | | | | | | | |
| | | | | | | | | | | 4,260,396 | | | | 6.6 | |
| | | | | | | | | | | | |
| | CONSUMER DURABLES & APPAREL | | | | | | | | | | |
| | 12,402 | | | | | Coach, Inc | | | | | 405,917 | | | | 0.6 | |
| | 21,053 | | | | | Mattel, Inc | | | | | 572,010 | | | | 0.9 | |
| | 32,605 | | | | | Pulte Homes, Inc | | | | | 581,021 | | | | 0.9 | |
| | | | | | Other | | | | | 1,039,157 | | | | 1.7 | |
| | | | | | | | | | | | |
| | | | | | | | | | | 2,598,105 | | | | 4.1 | |
| | | | | | | | | | | | |
| | CONSUMER SERVICES | | | | | | | | | | |
| | 13,297 | | | | | ARAMARK Holdings Corp | | | | | 428,828 | | | | 0.7 | |
| | 12,204 | | | | | Restaurant Brands International, Inc | | | | | 455,941 | | | | 0.7 | |
| | | | | | Other | | | | | 1,214,416 | | | | 1.9 | |
| | | | | | | | | | | | |
| | | | | | | | | | | 2,099,185 | | | | 3.3 | |
| | | | | | | | | | | | |
| | DIVERSIFIED FINANCIALS | | | | | | | | | | |
| | 26,409 | | | | | Morgan Stanley | | | | | 840,070 | | | | 1.3 | |
| | 49,810 | | | * | | Synchrony Financial | | | | | 1,514,722 | | | | 2.4 | |
| | | | | | Other | | | | | 1,977,303 | | | | 3.1 | |
| | | | | | | | | | | | |
| | | | | | | | | | | 4,332,095 | | | | 6.8 | |
| | | | | | | | | | | | |
| | ENERGY | | | | | | | | | | |
| | 15,259 | | | | | Apache Corp | | | | | 678,568 | | | | 1.1 | |
| | 10,503 | | | | | Chevron Corp | | | | | 944,850 | | | | 1.5 | |
| | 10,953 | | | | | Exxon Mobil Corp | | | | | 853,786 | | | | 1.3 | |
| | 4,789 | | | | | Pioneer Natural Resources Co | | | | | 600,445 | | | | 1.0 | |
| | 9,496 | | | | | Schlumberger Ltd | | | | | 662,346 | | | | 1.0 | |
| | | | | | Other | | | | | 3,146,615 | | | | 4.9 | |
| | | | | | | | | | | | |
| | | | | | | | | | | 6,886,610 | | | | 10.8 | |
| | | | | | | | | | | | |
| | FOOD & STAPLES RETAILING | | | | | 387,317 | | | | 0.6 | |
| | | | | | | | | | | | |
| | FOOD, BEVERAGE & TOBACCO | | | | | | | | | | |
| | 13,078 | | | | | ConAgra Foods, Inc | | | | | 551,368 | | | | 0.8 | |
| | 15,336 | | | | | Pinnacle Foods, Inc | | | | | 651,167 | | | | 1.0 | |
| | | | | | Other | | | | | 808,591 | | | | 1.3 | |
| | | | | | | | | | | | |
| | | | | | | | | | | 2,011,126 | | | | 3.1 | |
| | | | | | | | | | | | |
| | | | | | |
| See notes to financial statements | | TIAA-CREF Life Funds § 2015 Annual Report | | | 47 | |
| | |
| Summary portfolio of investments | | continued |
Large-Cap Value Fund § December 31, 2015
| | | | | | | | | | | | | | | | |
| Shares | | | | | Company | | | | Value | | | % of net
assets | |
| | | | | | | | | | | | | | | | |
| | HEALTH CARE EQUIPMENT & SERVICES | | | | | | | | | | |
| | 6,489 | | | * | | WellCare Health Plans, Inc | | | | $ | 507,505 | | | | 0.8 | % |
| | | | | | Other | | | | | 1,505,048 | | | | 2.3 | |
| | | | | | | | | | | | |
| | | | | | | | | | | 2,012,553 | | | | 3.1 | |
| | | | | | | | | | | | |
| | HOUSEHOLD & PERSONAL PRODUCTS | | | | | | | | | | |
| | 15,187 | | | | | Procter & Gamble Co | | | | | 1,206,000 | | | | 1.9 | |
| | | | | | | | | | | | |
| | | | | | | | | | | 1,206,000 | | | | 1.9 | |
| | | | | | | | | | | | |
| | INSURANCE | | | | | | | | | | |
| | 4,679 | | | | | ACE Ltd | | | | | 546,741 | | | | 0.9 | |
| | 8,857 | | | | | American International Group, Inc | | | | | 548,868 | | | | 0.9 | |
| | 4,590 | | | * | | Berkshire Hathaway, Inc (Class B) | | | | | 606,064 | | | | 0.9 | |
| | 10,702 | | | | | Hartford Financial Services Group, Inc | | | | | 465,109 | | | | 0.7 | |
| | 10,878 | | | | | Metlife, Inc | | | | | 524,428 | | | | 0.8 | |
| | 10,165 | | | | | Principal Financial Group | | | | | 457,222 | | | | 0.7 | |
| | 12,729 | | | | | XL Capital Ltd | | | | | 498,722 | | | | 0.8 | |
| | | | | | Other | | | | | 1,037,692 | | | | 1.6 | |
| | | | | | | | | | | | |
| | | | | | | | | | | 4,684,846 | | | | 7.3 | |
| | | | | | | | | | | | |
| | MATERIALS | | | | | | | | | | |
| | 62,788 | | | * | | Louisiana-Pacific Corp | | | | | 1,130,812 | | | | 1.8 | |
| | | | | | Other | | | | | 1,614,350 | | | | 2.5 | |
| | | | | | | | | | | | |
| | | | | | | | | | | 2,745,162 | | | | 4.3 | |
| | | | | | | | | | | | |
| | MEDIA | | | | | 461,979 | | | | 0.7 | |
| | | | | | | | | | | | |
| | PHARMACEUTICALS, BIOTECHNOLOGY & LIFE SCIENCES | | | | | | | | | | |
| | 13,280 | | | | | Agilent Technologies, Inc | | | | | 555,237 | | | | 0.9 | |
| | 1,306 | | | * | | Allergan plc | | | | | 408,125 | | | | 0.6 | |
| | 10,153 | | | * | | Endo International plc | | | | | 621,567 | | | | 1.0 | |
| | 8,488 | | | | | Johnson & Johnson | | | | | 871,887 | | | | 1.3 | |
| | 13,012 | | | | | Merck & Co, Inc | | | | | 687,294 | | | | 1.1 | |
| | 50,119 | | | | | Pfizer, Inc | | | | | 1,617,841 | | | | 2.5 | |
| | | | | | Other | | | | | 750,766 | | | | 1.2 | |
| | | | | | | | | | | | |
| | | | | | | | | | | 5,512,717 | | | | 8.6 | |
| | | | | | | | | | | | |
| | REAL ESTATE | | | | | | | | | | |
| | 28,725 | | | | | Starwood Property Trust, Inc | | | | | 590,586 | | | | 0.9 | |
| | | | | | Other | | | | | 536,628 | | | | 0.9 | |
| | | | | | | | | | | | |
| | | | | | | | | | | 1,127,214 | | | | 1.8 | |
| | | | | | | | | | | | |
| | RETAILING | | | | | | | | | | |
| | 69,133 | | | * | | JC Penney Co, Inc | | | | | 460,426 | | | | 0.7 | |
| | | | | | Other | | | | | 529,017 | | | | 0.8 | |
| | | | | | | | | | | | |
| | | | | | | | | | | 989,443 | | | | 1.5 | |
| | | | | | | | | | | | |
| | SEMICONDUCTORS & SEMICONDUCTOR EQUIPMENT | | | | | | | | | | |
| | 42,596 | | | | | Cypress Semiconductor Corp | | | | | 417,867 | | | | 0.6 | |
| | 30,128 | | | | | Intel Corp | | | | | 1,037,909 | | | | 1.6 | |
| | 43,926 | | | * | | ON Semiconductor Corp | | | | | 430,475 | | | | 0.7 | |
| | | | | | Other | | | | | 1,012,749 | | | | 1.6 | |
| | | | | | | | | | | | |
| | | | | | | | | | | 2,899,000 | | | | 4.5 | |
| | | | | | | | | | | | |
| | | | |
| 48 | | 2015 Annual Report § TIAA-CREF Life Funds | | See notes to financial statements |
| | |
| Summary portfolio of investments | | concluded |
Large-Cap Value Fund § December 31, 2015
| | | | | | | | | | | | | | | | |
| Shares | | | | | Company | | | | Value | | | % of net
assets | |
| | | | | | | | | | | | | | | | |
| | SOFTWARE & SERVICES | | | | | | | | | | |
| | 14,262 | | | | | Microsoft Corp | | | | $ | 791,256 | | | | 1.2 | % |
| | 17,725 | | | * | | Yahoo!, Inc | | | | | 589,533 | | | | 0.9 | |
| | | �� | | | Other | | | | | 1,574,825 | | | | 2.5 | |
| | | | | | | | | | | | |
| | | | | | | | | | | 2,955,614 | | | | 4.6 | |
| | | | | | | | | | | | |
| | TECHNOLOGY HARDWARE & EQUIPMENT | | | | | | | | | | |
| | 28,273 | | | | | Cisco Systems, Inc | | | | | 767,753 | | | | 1.2 | |
| | 64,452 | | | | | Nokia Corp | | | | | 452,453 | | | | 0.7 | |
| | | | | | Other | | | | | 1,838,226 | | | | 2.9 | |
| | | | | | | | | | | | |
| | | | | | | | | | | 3,058,432 | | | | 4.8 | |
| | | | | | | | | | | | |
| | TELECOMMUNICATION SERVICES | | | | | | | | | | |
| | 23,843 | | | | | AT&T, Inc | | | | | 820,438 | | | | 1.3 | |
| | 10,622 | | | * | | Level 3 Communications, Inc | | | | | 577,412 | | | | 0.9 | |
| | 18,861 | | | | | Telephone & Data Systems, Inc | | | | | 488,311 | | | | 0.7 | |
| | | | | | | | | | | | |
| | | | | | | | | | | 1,886,161 | | | | 2.9 | |
| | | | | | | | | | | | |
| | TRANSPORTATION | | | | | 1,245,318 | | | | 1.9 | |
| | | | | | | | | | | | |
| | UTILITIES | | | | | | | | | | |
| | 6,910 | | | | | NextEra Energy, Inc | | | | | 717,880 | | | | 1.1 | |
| | | | | | Other | | | | | 1,572,081 | | | | 2.5 | |
| | | | | | | | | | | | |
| | | | | | | | | | | 2,289,961 | | | | 3.6 | |
| | | | | | | | | | | | |
| | | | | | TOTAL COMMON STOCKS | | (Cost $56,509,862) | | | 63,564,180 | | | | 99.2 | |
| | | | | | | | | | | | |
| | SHORT-TERM INVESTMENTS | | | | | | | | | | |
| | INVESTMENTS IN REGISTERED INVESTMENT COMPANIES | | | | | | | | | | |
| | 877,177 | | | c | | TIAA-CREF Short Term Lending Portfolio of the State Street Navigator Securities Lending Trust | | | | | 877,177 | | | | 1.4 | |
| | | | | | | | | | | | |
| | | | | | | | | | | 877,177 | | | | 1.4 | |
| | | | | | | | | | | | |
| | | | | | TOTAL SHORT-TERM INVESTMENTS | | (Cost $877,177) | | | 877,177 | | | | 1.4 | |
| | | | | | | | | | | | |
| | | | | |
| | | | | | TOTAL PORTFOLIO | | (Cost $57,387,039) | | | 64,441,357 | | | | 100.6 | |
| | | | | | OTHER ASSETS & LIABILITIES, NET | | | | | (389,315 | ) | | | (0.6 | ) |
| | | | | | | | | | | | |
| | | | | | NET ASSETS | | | | $ | 64,052,042 | | | | 100.0 | % |
| | | | | | | | | | | | |
| c | Investments made with cash collateral received from securities on loan. |
At 12/31/15, the aggregate value of securities on loan is $843,733.
“Other” securities represent the aggregate value, by category, of securities that are not among the 50 largest holdings and, in total for any issuer, represent 1% or less of net assets.
For ease of presentation, a number of classification categories have been grouped together in the Summary portfolio of investments. Note that the Fund uses more specific categories in following its investment limitations on investment concentrations.
| | | | | | |
| See notes to financial statements | | TIAA-CREF Life Funds § 2015 Annual Report | | | 49 | |
Real Estate Securities Fund § December 31, 2015
| | | | | | | | | | | | | | | | |
| Shares | | | | | Company | | | | Value | | | % of net
assets | |
| | | | | | | | | | | | | | | | |
| | COMMON STOCKS | |
| | ASSET MANAGEMENT & CUSTODY BANKS | |
| | 45,000 | | | | | NorthStar Asset Management Group, Inc | | | | $ | 546,300 | | | | 0.8 | % |
| | | | | | | | | | | | |
| | | | | | | | | | | 546,300 | | | | 0.8 | |
| | | | | | | | | | | | |
| | DIVERSIFIED CAPITAL MARKETS | |
| | 8,000 | | | | | HFF, Inc (Class A) | | | | | 248,560 | | | | 0.3 | |
| | | | | | | | | | | | |
| | | | | | | | | | | 248,560 | | | | 0.3 | |
| | | | | | | | | | | | |
| | DIVERSIFIED REITS | |
| | 135,000 | | | | | Gramercy Property Trust | | | | | 1,042,200 | | | | 1.4 | |
| | 52,000 | | | | | NorthStar Realty Finance Corp | | | | | 885,560 | | | | 1.2 | |
| | 40,000 | | | | | Spirit Realty Capital, Inc | | | | | 400,800 | | | | 0.6 | |
| | | | | | | | | | | | |
| | | | | | | | | | | 2,328,560 | | | | 3.2 | |
| | | | | | | | | | | | |
| | HEALTH CARE FACILITIES | |
| | 10,180 | | | * | | Brookdale Senior Living, Inc | | | | | 187,923 | | | | 0.3 | |
| | | | | | | | | | | | |
| | | | | | | | | | | 187,923 | | | | 0.3 | |
| | | | | | | | | | | | |
| | HOTELS, RESORTS & CRUISE LINES | |
| | 9,000 | | | | | Starwood Hotels & Resorts Worldwide, Inc | | | | | 623,520 | | | | 0.9 | |
| | | | | | | | | | | | |
| | | | | | | | | | | 623,520 | | | | 0.9 | |
| | | | | | | | | | | | |
| | INDUSTRIAL REITS | |
| | 80,000 | | | | | Prologis, Inc | | | | | 3,433,600 | | | | 4.8 | |
| | 145,000 | | | | | Rexford Industrial Realty, Inc | | | | | 2,372,200 | | | | 3.2 | |
| | 55,000 | | | | | Terreno Realty Corp | | | | | 1,244,100 | | | | 1.6 | |
| | | | | | | | | | | | |
| | | | | | | | | | | 7,049,900 | | | | 9.6 | |
| | | | | | | | | | | | |
| | MORTGAGE REITS | |
| | 30,000 | | | | | Starwood Property Trust, Inc | | | | | 616,800 | | | | 0.8 | |
| | | | | | | | | | | | |
| | | | | | | | | | | 616,800 | | | | 0.8 | |
| | | | | | | | | | | | |
| | OFFICE REITS | |
| | 23,000 | | | | | Boston Properties, Inc | | | | | 2,933,420 | | | | 4.0 | |
| | 22,000 | | | | | Kilroy Realty Corp | | | | | 1,392,160 | | | | 1.9 | |
| | 24,000 | | | | | NorthStar Realty Europe Corp | | | | | 283,440 | | | | 0.4 | |
| | 17,000 | | | | | SL Green Realty Corp | | | | | 1,920,660 | | | | 2.6 | |
| | 15,000 | | | | | Vornado Realty Trust | | | | | 1,499,400 | | | | 2.1 | |
| | | | | | | | | | | | |
| | | | | | | | | | | 8,029,080 | | | | 11.0 | |
| | | | | | | | | | | | |
| | REAL ESTATE OPERATING COMPANIES | |
| | 28,000 | | | * | | Forest City Enterprises, Inc (Class A) | | | | | 614,040 | | | | 0.8 | |
| | | | | | | | | | | | |
| | | | | | | | | | | 614,040 | | | | 0.8 | |
| | | | | | | | | | | | |
| | REAL ESTATE SERVICES | |
| | 30,000 | | | | | Kennedy-Wilson Holdings, Inc | | | | | 722,400 | | | | 1.0 | |
| | 15,000 | | | * | | Marcus & Millichap, Inc | | | | | 437,100 | | | | 0.6 | |
| | | | | | | | | | | | |
| | | | | | | | | | | 1,159,500 | | | | 1.6 | |
| | | | | | | | | | | | |
| | RESIDENTIAL REITS | |
| | 30,000 | | | | | Apartment Investment & Management Co (Class A) | | | | | 1,200,900 | | | | 1.6 | |
| | 21,000 | | | | | AvalonBay Communities, Inc | | | | | 3,866,730 | | | | 5.3 | |
| | 24,000 | | | | | Equity Lifestyle Properties, Inc | | | | | 1,600,080 | | | | 2.2 | |
| | | | |
| 50 | | 2015 Annual Report § TIAA-CREF Life Funds | | See notes to financial statements |
| | |
| Portfolio of investments | | concluded |
Real Estate Securities Fund § December 31, 2015
| | | | | | | | | | | | | | | | |
| Shares | | | | | Company | | | | Value | | | % of net
assets | |
| | | | | | | | | | | | | | | | |
| | RESIDENTIAL REITS—continued | |
| | 53,000 | | | | | Equity Residential | | | | $ | 4,324,270 | | | | 5.8 | % |
| | 11,500 | | | | | Essex Property Trust, Inc | | | | | 2,753,215 | | | | 3.8 | |
| | 40,000 | | | | | Monogram Residential Trust, Inc | | | | | 390,400 | | | | 0.5 | |
| | 15,000 | | | | | Sun Communities, Inc | | | | | 1,027,950 | | | | 1.5 | |
| | | | | | | | | | | | |
| | | | | | | | | | | 15,163,545 | | | | 20.7 | |
| | | | | | | | | | | | |
| | RETAIL REITS | |
| | 60,000 | | | | | DDR Corp | | | | | 1,010,400 | | | | 1.4 | |
| | 40,000 | | | | | Equity One, Inc | | | | | 1,086,000 | | | | 1.5 | |
| | 16,000 | | | | | Federal Realty Investment Trust | | | | | 2,337,600 | | | | 3.2 | |
| | 85,000 | | | | | General Growth Properties, Inc | | | | | 2,312,850 | | | | 3.2 | |
| | 30,000 | | | | | Retail Opportunities Investment Corp | | | | | 537,000 | | | | 0.7 | |
| | 36,000 | | | | | Simon Property Group, Inc | | | | | 6,999,840 | | | | 9.5 | |
| | 17,000 | | | | | Taubman Centers, Inc | | | | | 1,304,240 | | | | 1.8 | |
| | | | | | | | | | | | |
| | | | | | | | | | | 15,587,930 | | | | 21.3 | |
| | | | | | | | | | | | |
| | SPECIALIZED REITS | |
| | 28,000 | | | | | American Tower Corp | | | | | 2,714,600 | | | | 3.7 | |
| | 17,000 | | | | | Crown Castle International Corp | | | | | 1,469,650 | | | | 2.0 | |
| | 50,000 | | | | | CubeSmart | | | | | 1,531,000 | | | | 2.1 | |
| | 5,000 | | | | | Equinix, Inc | | | | | 1,512,000 | | | | 2.1 | |
| | 19,000 | | | | | Extra Space Storage, Inc | | | | | 1,675,990 | | | | 2.3 | |
| | 30,000 | | | | | Healthcare Trust of America, Inc | | | | | 809,100 | | | | 1.1 | |
| | 75,000 | | | | | Host Marriott Corp | | | | | 1,150,500 | | | | 1.6 | |
| | 15,000 | | | | | Plum Creek Timber Co, Inc | | | | | 715,800 | | | | 1.0 | |
| | 13,000 | | | | | Public Storage, Inc | | | | | 3,220,100 | | | | 4.4 | |
| | 65,000 | | | | | Sunstone Hotel Investors, Inc | | | | | 811,850 | | | | 1.1 | |
| | 14,000 | | | | | Ventas, Inc | | | | | 790,020 | | | | 1.1 | |
| | 42,000 | | | | | Welltower, Inc | | | | | 2,857,260 | | | | 3.9 | |
| | 12,000 | | | | | Weyerhaeuser Co | | | | | 359,760 | | | | 0.3 | |
| | | | | | | | | | | | |
| | | | | | | | | | | 19,617,630 | | | | 26.7 | |
| | | | | | | | | | | | |
| | | | | | TOTAL COMMON STOCKS | | (Cost $52,230,488) | | | 71,773,288 | | | | 98.0 | |
| | | | | | | | | | | | |
| | | | | |
| | | | | | TOTAL PORTFOLIO | | (Cost $52,230,488) | | | 71,773,288 | | | | 98.0 | |
| | | | | | OTHER ASSETS & LIABILITIES, NET | | | | | 1,449,766 | | | | 2.0 | |
| | | | | | | | | | | | |
| | | | | | NET ASSETS | | | | $ | 73,223,054 | | | | 100.0 | % |
| | | | | | | | | | | | |
Abbreviation(s):
REIT Real Estate Investment Trust
| | | | | | |
| See notes to financial statements | | TIAA-CREF Life Funds § 2015 Annual Report | | | 51 | |
| | |
| Summary portfolio of investments | | |
Small-Cap Equity Fund § December 31, 2015
| | | | | | | | | | | | | | | | |
| Shares | | | | | Company | | | | Value | | | % of net
assets | |
| | | | | | | | | | | | | | | | |
| | COMMON STOCKS | | | | | | | | | | |
| | AUTOMOBILES & COMPONENTS | | | | $ | 631,881 | | | | 1.3 | % |
| | | | | | | | | | | | |
| | BANKS | | | | | | | | | | |
| | 7,115 | | | | | BankUnited | | | | | 256,567 | | | | 0.5 | |
| | 8,172 | | | | | Cathay General Bancorp | | | | | 256,029 | | | | 0.5 | |
| | 21,293 | | | | | Fulton Financial Corp | | | | | 277,022 | | | | 0.5 | |
| | 9,240 | | | | | Great Western Bancorp, Inc | | | | | 268,145 | | | | 0.5 | |
| | 30,424 | | | | | Investors Bancorp, Inc | | | | | 378,475 | | | | 0.8 | |
| | 37,122 | | | * | | MGIC Investment Corp | | | | | 327,787 | | | | 0.7 | |
| | 24,642 | | | | | National Penn Bancshares, Inc | | | | | 303,836 | | | | 0.6 | |
| | 8,679 | | | | | PrivateBancorp, Inc | | | | | 356,013 | | | | 0.7 | |
| | 13,850 | | | | | Provident Financial Services, Inc | | | | | 279,077 | | | | 0.6 | |
| | 18,030 | | | | | Umpqua Holdings Corp | | | | | 286,677 | | | | 0.6 | |
| | 11,150 | | | * | | Western Alliance Bancorp | | | | | 399,839 | | | | 0.8 | |
| | | | | | Other | | | | | 1,772,339 | | | | 3.5 | |
| | | | | | | | | | | | |
| | | | | | | | | | | 5,161,806 | | | | 10.3 | |
| | | | | | | | | | | | |
| | CAPITAL GOODS | | | | | | | | | | |
| | 6,297 | | | | | EMCOR Group, Inc | | | | | 302,508 | | | | 0.6 | |
| | | | | | Other | | | | | 3,348,622 | | | | 6.8 | |
| | | | | | | | | | | | |
| | | | | | | | | | | 3,651,130 | | | | 7.4 | |
| | | | | | | | | | | | |
| | COMMERCIAL & PROFESSIONAL SERVICES | | | | | 1,444,948 | | | | 2.9 | |
| | | | | | | | | | | | |
| | CONSUMER DURABLES & APPAREL | | | | | | | | | | |
| | 18,410 | | | * | | TRI Pointe Homes, Inc | | | | | 233,255 | | | | 0.5 | |
| | | | | | Other | | | | | 1,251,214 | | | | 2.5 | |
| | | | | | | | | | | | |
| | | | | | | | | | | 1,484,469 | | | | 3.0 | |
| | | | | | | | | | | | |
| | CONSUMER SERVICES | | | | | | | | | | |
| | 6,045 | | | * | | Grand Canyon Education, Inc | | | | | 242,525 | | | | 0.5 | |
| | 3,800 | | | | | Jack in the Box, Inc | | | | | 291,498 | | | | 0.6 | |
| | 2,710 | | | l | | Vail Resorts, Inc | | | | | 346,853 | | | | 0.7 | |
| | | | | | Other | | | | | 800,680 | | | | 1.6 | |
| | | | | | | | | | | | |
| | | | | | | | | | | 1,681,556 | | | | 3.4 | |
| | | | | | | | | | | | |
| | DIVERSIFIED FINANCIALS | | | | | 181,945 | | | | 0.4 | |
| | | | | | | | | | | | |
| | ENERGY | | | | | 1,555,440 | | | | 3.2 | |
| | | | | | | | | | | | |
| | FOOD & STAPLES RETAILING | | | | | | | | | | |
| | 2,898 | | | | | Casey’s General Stores, Inc | | | | | 349,064 | | | | 0.7 | |
| | | | | | Other | | | | | 214,248 | | | | 0.4 | |
| | | | | | | | | | | | |
| | | | | | | | | | | 563,312 | | | | 1.1 | |
| | | | | | | | | | | | |
| | FOOD, BEVERAGE & TOBACCO | | | | | | | | | | |
| | 2,074 | | | | | Lancaster Colony Corp | | | | | 239,464 | | | | 0.5 | |
| | | | | | Other | | | | | 778,810 | | | | 1.6 | |
| | | | | | | | | | | | |
| | | | | | | | | | | 1,018,274 | | | | 2.1 | |
| | | | | | | | | | | | |
| | HEALTH CARE EQUIPMENT & SERVICES | | | | | | | | | | |
| | 2,900 | | | * | | Abiomed, Inc | | | | | 261,812 | | | | 0.5 | |
| | 2,660 | | | * | | ICU Medical, Inc | | | | | 299,995 | | | | 0.6 | |
| | | | |
| 52 | | 2015 Annual Report § TIAA-CREF Life Funds | | See notes to financial statements |
| | |
| Summary portfolio of investments | | continued |
Small-Cap Equity Fund § December 31, 2015
| | | | | | | | | | | | | | | | |
| Shares | | | | | Company | | | | Value | | | % of net
assets | |
| | | | | | | | | | | | | | | | |
| | HEALTH CARE EQUIPMENT & SERVICES—continued | | | | | | | | | | |
| | 4,330 | | | * | | NuVasive, Inc | | | | $ | 234,296 | | | | 0.5 | % |
| | 3,649 | | | * | | WellCare Health Plans, Inc | | | | | 285,388 | | | | 0.6 | |
| | | | | | Other | | | | | 2,221,000 | | | | 4.5 | |
| | | | | | | | | | | | |
| | | | | | | | | | | 3,302,491 | | | | 6.7 | |
| | | | | | | | | | | | |
| | HOUSEHOLD & PERSONAL PRODUCTS | | | | | 257,603 | | | | 0.5 | |
| | | | | | | | | | | | |
| | INSURANCE | | | | | | | | | | |
| | 5,363 | | | | | Aspen Insurance Holdings Ltd | | | | | 259,033 | | | | 0.5 | |
| | | | | | Other | | | | | 1,391,444 | | | | 2.8 | |
| | | | | | | | | | | | |
| | | | | | | | | | | 1,650,477 | | | | 3.3 | |
| | | | | | | | | | | | |
| | MATERIALS | | | | | | | | | | |
| | 9,810 | | | * | | Berry Plastics Group, Inc | | | | | 354,926 | | | | 0.7 | |
| | 13,500 | | | * | | Louisiana-Pacific Corp | | | | | 243,135 | | | | 0.5 | |
| | | | | | Other | | | | | 1,698,559 | | | | 3.5 | |
| | | | | | | | | | | | |
| | | | | | | | | | | 2,296,620 | | | | 4.7 | |
| | | | | | | | | | | | |
| | MEDIA | | | | | | | | | | |
| | 10,760 | | | * | | Live Nation, Inc | | | | | 264,373 | | | | 0.5 | |
| | | | | | Other | | | | | 317,262 | | | | 0.7 | |
| | | | | | | | | | | | |
| | | | | | | | | | | 581,635 | | | | 1.2 | |
| | | | | | | | | | | | |
| | PHARMACEUTICALS, BIOTECHNOLOGY & LIFE SCIENCES | | | | | | | | | | |
| | 6,072 | | | * | | Impax Laboratories, Inc | | | | | 259,639 | | | | 0.5 | |
| | 6,014 | | | * | | INC Research Holdings, Inc | | | | | 291,739 | | | | 0.6 | |
| | 3,760 | | | * | | Parexel International Corp | | | | | 256,131 | | | | 0.5 | |
| | | | | | Other | | | | | 4,167,529 | | | | 8.5 | |
| | | | | | | | | | | | |
| | | | | | | | | | | 4,975,038 | | | | 10.1 | |
| | | | | | | | | | | | |
| | REAL ESTATE | | | | | | | | | | |
| | 28,154 | | | | | Cousins Properties, Inc | | | | | 265,492 | | | | 0.5 | |
| | 12,557 | | | | | CubeSmart | | | | | 384,495 | | | | 0.8 | |
| | 9,340 | | | | | DuPont Fabros Technology, Inc | | | | | 296,919 | | | | 0.6 | |
| | 5,890 | | | | | Entertainment Properties Trust | | | | | 344,271 | | | | 0.7 | |
| | 11,500 | | | | | First Industrial Realty Trust, Inc | | | | | 254,495 | | | | 0.5 | |
| | 6,600 | | | | | Highwoods Properties, Inc | | | | | 287,760 | | | | 0.6 | |
| | 3,927 | | | | | Sovran Self Storage, Inc | | | | | 421,406 | | | | 0.9 | |
| | 19,388 | | | | | Sunstone Hotel Investors, Inc | | | | | 242,156 | | | | 0.5 | |
| | | | | | Other | | | | | 2,233,255 | | | | 4.5 | |
| | | | | | | | | | | | |
| | | | | | | | | | | 4,730,249 | | | | 9.6 | |
| | | | | | | | | | | | |
| | RETAILING | | | | | 1,535,509 | | | | 3.1 | |
| | | | | | | | | | | | |
| | SEMICONDUCTORS & SEMICONDUCTOR EQUIPMENT | | | | | 2,041,928 | | | | 4.1 | |
| | | | | | | | | | | | |
| | SOFTWARE & SERVICES | | | | | | | | | | |
| | 3,266 | | | * | | EPAM Systems, Inc | | | | | 256,773 | | | | 0.5 | |
| | 5,800 | | | * | | ExlService Holdings, Inc | | | | | 260,594 | | | | 0.5 | |
| | 5,100 | | | * | | Manhattan Associates, Inc | | | | | 337,467 | | | | 0.7 | |
| | 4,319 | | | | | MAXIMUS, Inc | | | | | 242,944 | | | | 0.5 | |
| | | | | | |
| See notes to financial statements | | TIAA-CREF Life Funds § 2015 Annual Report | | | 53 | |
| | |
| Summary portfolio of investments | | concluded |
Small-Cap Equity Fund § December 31, 2015
| | | | | | | | | | | | | | | | |
| Shares | | | | | Company | | | | Value | | | % of net
assets | |
| | | | | | | | | | | | | | | | |
| | SOFTWARE & SERVICES—continued | | | | | | | | | | |
| | 2,282 | | | * | | Tyler Technologies, Inc | | | | $ | 397,798 | | | | 0.8 | % |
| | | | | | Other | | | | | 3,531,723 | | | | 7.2 | |
| | | | | | | | | | | | |
| | | | | | | | | | | 5,027,299 | | | | 10.2 | |
| | | | | | | | | | | | |
| | TECHNOLOGY HARDWARE & EQUIPMENT | | | | | 2,578,066 | | | | 5.2 | |
| | | | | | | | | | | | |
| | TELECOMMUNICATION SERVICES | | | | | | | | | | |
| | 23,998 | | | * | | 8x8, Inc | | | | | 274,777 | | | | 0.5 | |
| | 13,505 | | | | | Inteliquent, Inc | | | | | 239,984 | | | | 0.5 | |
| | 40,284 | | | * | | Vonage Holdings Corp | | | | | 231,230 | | | | 0.5 | |
| | | | | | | | | | | | |
| | | | | | | | | | | 745,991 | | | | 1.5 | |
| | | | | | | | | | | | |
| | TRANSPORTATION | | | | | 1,054,176 | | | | 2.1 | |
| | | | | | | | | | | | |
| | UTILITIES | | | | | | | | | | |
| | 5,490 | | | | | American States Water Co | | | | | 230,306 | | | | 0.5 | |
| | 8,263 | | | | | Avista Corp | | | | | 292,263 | | | | 0.6 | |
| | 5,754 | | | | | Black Hills Corp | | | | | 267,158 | | | | 0.5 | |
| | 7,600 | | | | | Portland General Electric Co | | | | | 276,412 | | | | 0.6 | |
| | | | | | Other | | | | | 298,236 | | | | 0.6 | |
| | | | | | | | | | | | |
| | | | | | | | | | | 1,364,375 | | | | 2.8 | |
| | | | | | | | | | | | |
| | | | | | TOTAL COMMON STOCKS | | (Cost $45,628,863) | | | 49,516,218 | | | | 100.2 | |
| | | | | | | | | | | | |
| | | |
| | SHORT-TERM INVESTMENTS | | | | | | | | | | |
| | INVESTMENTS IN REGISTERED INVESTMENT COMPANIES | | | | | | | | | | |
| | 1,424,802 | | | c | | TIAA-CREF Short Term Lending Portfolio of the State Street Navigator Securities Lending Trust | | | | | 1,424,802 | | | | 2.9 | |
| | | | | | | | | | | | |
| | | | | | | | | | | 1,424,802 | | | | 2.9 | |
| | | | | | | | | | | | |
| | | | | | TOTAL SHORT-TERM INVESTMENTS | | (Cost $1,424,802) | | | 1,424,802 | | | | 2.9 | |
| | | | | | | | | | | | |
| | | | | |
| | | | | | TOTAL PORTFOLIO | | (Cost $47,053,665) | | | 50,941,020 | | | | 103.1 | |
| | | | | | OTHER ASSETS & LIABILITIES, NET | | | | | (1,538,441 | ) | | | (3.1 | ) |
| | | | | | | | | | | | |
| | | | | | NET ASSETS | | | | $ | 49,402,579 | | | | 100.0 | % |
| | | | | | | | | | | | |
| c | Investments made with cash collateral received from securities on loan. |
| l | All or a portion of these securities have been segregated by the custodian to cover collateral requirements on swaps agreements. |
At 12/31/15, the aggregate value of the securities on loan is $1,367,222.
“Other” securities represent the aggregate value, by category, of securities that are not among the 50 largest holdings and, in total for any issuer, represent 1% or less of net assets.
For ease of presentation, a number of classification categories have been grouped together in the Summary portfolio of investments. Note that the Fund uses more specific categories in following its investment limitations on investment concentrations.
| | | | |
| 54 | | 2015 Annual Report § TIAA-CREF Life Funds | | See notes to financial statements |
| | |
| Summary portfolio of investments | | |
Social Choice Equity Fund § December 31, 2015
| | | | | | | | | | | | | | | | |
| Shares | | | | | Company | | | | Value | | | % of net
assets | |
| | | | | | | | | | | | | | | | |
| | COMMON STOCKS | | | | | | | | |
| | AUTOMOBILES & COMPONENTS | | | | | | | | |
| | 23,923 | | | | | Ford Motor Co | | | | $ | 337,075 | | | | 0.7 | % |
| | | | | | Other | | | | | 510,554 | | | | 1.1 | |
| | | | | | | | | | | | |
| | | | | | | | | | | 847,629 | | | | 1.8 | |
| | | | | | | | | | | | |
| | BANKS | | | | | | | | |
| | 3,541 | | | | | PNC Financial Services Group, Inc | | | | | 337,493 | | | | 0.7 | |
| | 8,861 | | | | | US Bancorp | | | | | 378,099 | | | | 0.8 | |
| | | | | | Other | | | | | 1,147,881 | | | | 2.4 | |
| | | | | | | | | | | | |
| | | | | | | | | | | 1,863,473 | | | | 3.9 | |
| | | | | | | | | | | | |
| | CAPITAL GOODS | | | | | | | | |
| | 2,809 | | | | | 3M Co | | | | | 423,148 | | | | 0.9 | |
| | 3,753 | | | | | Danaher Corp | | | | | 348,579 | | | | 0.7 | |
| | | | | | Other | | | | | 2,159,966 | | | | 4.6 | |
| | | | | | | | | | | | |
| | | | | | | | | | | 2,931,693 | | | | 6.2 | |
| | | | | | | | | | | | |
| | COMMERCIAL & PROFESSIONAL SERVICES | | | | | 330,924 | | | | 0.7 | |
| | | | | | | | | | | | |
| | CONSUMER DURABLES & APPAREL | | | | | | | | |
| | 6,412 | | | | | Nike, Inc (Class B) | | | | | 400,750 | | | | 0.8 | |
| | | | | | Other | | | | | 215,354 | | | | 0.5 | |
| | | | | | | | | | | | |
| | | | | | | | | | | 616,104 | | | | 1.3 | |
| | | | | | | | | | | | |
| | CONSUMER SERVICES | | | | | | | | |
| | 3,990 | | | | | McDonald’s Corp | | | | | 471,378 | | | | 1.0 | |
| | 7,021 | | | | | Starbucks Corp | | | | | 421,471 | | | | 0.9 | |
| | | | | | Other | | | | | 519,342 | | | | 1.1 | |
| | | | | | | | | | | | |
| | | | | | | | | | | 1,412,191 | | | | 3.0 | |
| | | | | | | | | | | | |
| | DIVERSIFIED FINANCIALS | | | | | | | | |
| | 5,030 | | | | | American Express Co | | | | | 349,836 | | | | 0.7 | |
| | 7,990 | | | | | Bank of New York Mellon Corp | | | | | 329,348 | | | | 0.7 | |
| | 936 | | | | | BlackRock, Inc | | | | | 318,727 | | | | 0.7 | |
| | 9,289 | | | | | Charles Schwab Corp | | | | | 305,887 | | | | 0.6 | |
| | | | | | Other | | | | | 1,751,161 | | | | 3.7 | |
| | | | | | | | | | | | |
| | | | | | | | | | | 3,054,959 | | | | 6.4 | |
| | | | | | | | | | | | |
| | ENERGY | | | | | 2,940,280 | | | | 6.2 | |
| | | | | | | | | | | | |
| | FOOD & STAPLES RETAILING | | | | | 569,516 | | | | 1.2 | |
| | | | | | | | | | | | |
| | FOOD, BEVERAGE & TOBACCO | | | | | | | | |
| | 5,148 | | | | | General Mills, Inc | | | | | 296,834 | | | | 0.6 | |
| | 8,638 | | | | | Mondelez International, Inc | | | | | 387,328 | | | | 0.8 | |
| | 5,461 | | | | | PepsiCo, Inc | | | | | 545,663 | | | | 1.2 | |
| | | | | | Other | | | | | 758,943 | | | | 1.6 | |
| | | | | | | | | | | | |
| | | | | | | | | | | 1,988,768 | | | | 4.2 | |
| | | | | | | | | | | | |
| | HEALTH CARE EQUIPMENT & SERVICES | | | | | 1,904,510 | | | | 4.0 | |
| | | | | | | | | | | | |
| | | | | | |
| See notes to financial statements | | TIAA-CREF Life Funds § 2015 Annual Report | | | 55 | |
| | |
| Summary portfolio of investments | | continued |
Social Choice Equity Fund § December 31, 2015
| | | | | | | | | | | | | | | | |
| Shares | | | | | Company | | | | Value | | | % of net
assets | |
| | | | | | | | | | | | | | | | |
| | HOUSEHOLD & PERSONAL PRODUCTS | | | | | | | | |
| | 4,937 | | | | | Colgate-Palmolive Co | | | | $ | 328,903 | | | | 0.7 | % |
| | 8,539 | | | | | Procter & Gamble Co | | | | | 678,082 | | | | 1.4 | |
| | | | | | Other | | | | | 194,222 | | | | 0.4 | |
| | | | | | | | | | | | |
| | | | | | | | | | | 1,201,207 | | | | 2.5 | |
| | | | | | | | | | | | |
| | INSURANCE | | | | | | | | | | | | | | | |
| | 2,611 | | | | | ACE Ltd | | | | | 305,095 | | | | 0.6 | |
| | 5,661 | | | * | | Berkshire Hathaway, Inc (Class B) | | | | | 747,478 | | | | 1.6 | |
| | 2,681 | | | | | Travelers Cos, Inc | | | | | 302,578 | | | | 0.6 | |
| | | | | | Other | | | | | 1,409,448 | | | | 3.0 | |
| | | | | | | | | | | | |
| | | | | | | | | | | 2,764,599 | | | | 5.8 | |
| | | | | | | | | | | | |
| | MATERIALS | | | | | 1,873,962 | | | | 4.0 | |
| | | | | | | | | | | | |
| | MEDIA | | | | | | | | | | | | | | | |
| | 1,849 | | | | | Time Warner Cable, Inc | | | | | 343,156 | | | | 0.7 | |
| | 4,680 | | | | | Time Warner, Inc | | | | | 302,656 | | | | 0.6 | |
| | 5,701 | | | | | Walt Disney Co | | | | | 599,061 | | | | 1.3 | |
| | | | | | Other | | | | | 347,780 | | | | 0.7 | |
| | | | | | | | | | | | |
| | | | | | | | | | | 1,592,653 | | | | 3.3 | |
| | | | | | | | | | | | |
| | PHARMACEUTICALS, BIOTECHNOLOGY & LIFE SCIENCES | | | | | | | | |
| | 3,009 | | | | | Amgen, Inc | | | | | 488,451 | | | | 1.0 | |
| | 1,073 | | | * | | Biogen Idec, Inc | | | | | 328,713 | | | | 0.7 | |
| | 6,848 | | | | | Bristol-Myers Squibb Co | | | | | 471,074 | | | | 1.0 | |
| | 3,318 | | | * | | Celgene Corp | | | | | 397,364 | | | | 0.8 | |
| | 5,337 | | | | | Gilead Sciences, Inc | | | | | 540,051 | | | | 1.1 | |
| | 8,123 | | | | | Johnson & Johnson | | | | | 834,395 | | | | 1.8 | |
| | 10,340 | | | | | Merck & Co, Inc | | | | | 546,159 | | | | 1.2 | |
| | | | | | Other | | | | | 1,514,997 | | | | 3.2 | |
| | | | | | | | | | | | |
| | | | | | | | | | | 5,121,204 | | | | 10.8 | |
| | | | | | | | | | | | |
| | REAL ESTATE | | | | | | | | | | |
| | 3,213 | | | | | American Tower Corp | | | | | 311,501 | | | | 0.6 | |
| | 1,846 | | | | | Simon Property Group, Inc | | | | | 358,936 | | | | 0.8 | |
| | | | | | Other | | | | | 1,514,184 | | | | 3.2 | |
| | | | | | | | | | | | |
| | | | | | | | | | | 2,184,621 | | | | 4.6 | |
| | | | | | | | | | | | |
| | RETAILING | | | | | | | | | | | | | | | |
| | 5,027 | | | | | Lowe’s Companies, Inc | | | | | 382,253 | | | | 0.8 | |
| | | | | | Other | | | | | 1,135,576 | | | | 2.4 | |
| | | | | | | | | | | | |
| | | | | | | | | | | 1,517,829 | | | | 3.2 | |
| | | | | | | | | | | | |
| | SEMICONDUCTORS & SEMICONDUCTOR EQUIPMENT | | | | | | | | |
| | 16,786 | | | | | Intel Corp | | | | | 578,278 | | | | 1.2 | |
| | 6,339 | | | | | Texas Instruments, Inc | | | | | 347,441 | | | | 0.8 | |
| | | | | | Other | | | | | 426,820 | | | | 0.9 | |
| | | | | | | | | | | | |
| | | | | | | | | | | 1,352,539 | | | | 2.9 | |
| | | | | | | | | | | | |
| | SOFTWARE & SERVICES | | | | | | | | |
| | 3,585 | | | | | Accenture plc | | | | | 374,632 | | | | 0.8 | |
| | 3,517 | | | * | | Adobe Systems, Inc | | | | | 330,387 | | | | 0.7 | |
| | | | |
| 56 | | 2015 Annual Report § TIAA-CREF Life Funds | | See notes to financial statements |
| | |
| Summary portfolio of investments | | concluded |
Social Choice Equity Fund § December 31, 2015
| | | | | | | | | | | | | | | | |
| Shares | | | | | Company | | | | Value | | | % of net
assets | |
| | | | | | | | | | | | | | | | |
| | SOFTWARE & SERVICES—continued | | | | | | | | |
| | 793 | | | * | | Alphabet, Inc (Class A) | | | | $ | 616,962 | | | | 1.3 | % |
| | 809 | | | * | | Alphabet, Inc (Class C) | | | | | 613,934 | | | | 1.3 | |
| | 5,105 | | | * | | Cognizant Technology Solutions Corp (Class A) | | | | | 306,402 | | | | 0.6 | |
| | 3,608 | | | | | International Business Machines Corp | | | | | 496,533 | | | | 1.1 | |
| | 4,493 | | | | | Mastercard, Inc (Class A) | | | | | 437,438 | | | | 0.9 | |
| | 12,801 | | | | | Oracle Corp | | | | | 467,621 | | | | 1.0 | |
| | 4,303 | | | * | | Salesforce.com, Inc | | | | | 337,355 | | | | 0.7 | |
| | | | | | Other | | | | | 1,639,634 | | | | 3.5 | |
| | | | | | | | | | | | |
| | | | | | | | | | | 5,620,898 | | | | 11.9 | |
| | | | | | | | | | | | |
| | TECHNOLOGY HARDWARE & EQUIPMENT | | | | | | | | |
| | 19,287 | | | | | Cisco Systems, Inc | | | | | 523,738 | | | | 1.1 | |
| | 12,660 | | | | | EMC Corp | | | | | 325,109 | | | | 0.7 | |
| | 6,952 | | | | | Qualcomm, Inc | | | | | 347,496 | | | | 0.7 | |
| | | | | | Other | | | | | 524,336 | | | | 1.1 | |
| | | | | | | | | | | | |
| | | | | | | | | | | 1,720,679 | | | | 3.6 | |
| | | | | | | | | | | | |
| | TELECOMMUNICATION SERVICES | | | | | | | | |
| | 13,585 | | | | | Verizon Communications, Inc | | | | | 627,899 | | | | 1.3 | |
| | | | | | Other | | | | | 280,687 | | | | 0.6 | |
| | | | | | | | | | | | |
| | | | | | | | | | | 908,586 | | | | 1.9 | |
| | | | | | | | | | | | |
| | TRANSPORTATION | | | | | | | | | | |
| | 3,796 | | | | | United Parcel Service, Inc (Class B) | | | | | 365,289 | | | | 0.8 | |
| | | | | | Other | | | | | 949,410 | | | | 2.0 | |
| | | | | | | | | | | | |
| | | | | | | | | | | 1,314,699 | | | | 2.8 | |
| | | | | | | | | | | | |
| | UTILITIES | | | | | | | | | | | | | | | |
| | 3,165 | | | | | NextEra Energy, Inc | | | | | 328,812 | | | | 0.7 | |
| | | | | | Other | | | | | 1,183,412 | | | | 2.5 | |
| | | | | | | | | | | | |
| | | | | | | | | | | 1,512,224 | | | | 3.2 | |
| | | | | | | | | | | | |
| | | | | | TOTAL COMMON STOCKS | | (Cost $30,856,871) | | | 47,145,747 | | | | 99.4 | |
| | | | | | | | | | | | |
| | | | | |
| | | | | | TOTAL PORTFOLIO | | (Cost $30,856,871) | | | 47,145,747 | | | | 99.4 | |
| | | | | | OTHER ASSETS & LIABILITIES, NET | | | | | 262,200 | | | | 0.6 | |
| | | | | | | | | | | | |
| | | | | | NET ASSETS | | | | $ | 47,407,947 | | | | 100.0 | % |
| | | | | | | | | | | | |
“Other” securities represent the aggregate value, by category, of securities that are not among the 50 largest holdings and, in total for any issuer, represent 1% or less of net assets.
For ease of presentation, a number of classification categories have been grouped together in the Summary portfolio of investments. Note that the Fund uses more specific categories in following its investment limitations on investment concentrations.
| | | | | | |
| See notes to financial statements | | TIAA-CREF Life Funds § 2015 Annual Report | | | 57 | |
| | |
| Summary portfolio of investments | | |
Stock Index Fund § December 31, 2015
| | | | | | | | | | | | | | | | |
| Shares | | | | | Company | | | | Value | | | % of net
assets | |
| | | | | | | | | | | | | | | | |
| | COMMON STOCKS | |
| | AUTOMOBILES & COMPONENTS | | | | $ | 3,769,332 | | | | 1.1 | % |
| | | | | | | | | | | | |
| | BANKS | | | | | | | | | | |
| | 157,210 | | | | | Bank of America Corp | | | | | 2,645,844 | | | | 0.8 | |
| | 45,420 | | | | | Citigroup, Inc | | | | | 2,350,485 | | | | 0.7 | |
| | 55,551 | | | | | JPMorgan Chase & Co | | | | | 3,668,032 | | | | 1.1 | |
| | 69,738 | | | | | Wells Fargo & Co | | | | | 3,790,958 | | | | 1.1 | |
| | | | | | Other | | | | | 8,113,903 | | | | 2.5 | |
| | | | | | | | | | | | |
| | | | | | | | | | | 20,569,222 | | | | 6.2 | |
| | | | | | | | | | | | |
| | CAPITAL GOODS | | | | | | | | | | |
| | 9,497 | | | | | 3M Co | | | | | 1,430,628 | | | | 0.4 | |
| | 10,353 | | | | | Boeing Co | | | | | 1,496,940 | | | | 0.5 | |
| | 140,774 | | | | | General Electric Co | | | | | 4,385,110 | | | | 1.3 | |
| | | | | | Other | | | | | 17,549,700 | | | | 5.3 | |
| | | | | | | | | | | | |
| | | | | | | | | | | 24,862,378 | | | | 7.5 | |
| | | | | | | | | | | | |
| | COMMERCIAL & PROFESSIONAL SERVICES | | | | | 3,577,752 | | | | 1.1 | |
| | | | | | | | | | | | |
| | CONSUMER DURABLES & APPAREL | | | | | 5,452,351 | | | | 1.6 | |
| | | | | | | | | | | | |
| | CONSUMER SERVICES | | | | | | | | | | |
| | 14,350 | | | | | McDonald’s Corp | | | | | 1,695,309 | | | | 0.5 | |
| | 22,464 | | | | | Starbucks Corp | | | | | 1,348,514 | | | | 0.4 | |
| | | | | | Other | | | | | 4,610,283 | | | | 1.4 | |
| | | | | | | | | | | | |
| | | | | | | | | | | 7,654,106 | | | | 2.3 | |
| | | | | | | | | | | | |
| | DIVERSIFIED FINANCIALS | | | | | | | | | | |
| | 12,500 | | | e | | iShares Russell 3000 Index Fund | | | | | 1,503,875 | | | | 0.5 | |
| | | | | | Other | | | | | 11,730,259 | | | | 3.5 | |
| | | | | | | | | | | | |
| | | | | | | | | | | 13,234,134 | | | | 4.0 | |
| | | | | | | | | | | | |
| | ENERGY | | | | | | | | | | |
| | 28,150 | | | | | Chevron Corp | | | | | 2,532,374 | | | | 0.7 | |
| | 62,585 | | | d | | Exxon Mobil Corp | | | | | 4,878,500 | | | | 1.5 | |
| | 19,009 | | | | | Schlumberger Ltd | | | | | 1,325,878 | | | | 0.4 | |
| | | | | | Other | | | | | 10,861,333 | | | | 3.3 | |
| | | | | | | | | | | | |
| | | | | | | | | | | 19,598,085 | | | | 5.9 | |
| | | | | | | | | | | | |
| | FOOD & STAPLES RETAILING | | | | | | | | | | |
| | 16,892 | | | | | CVS Health Corp | | | | | 1,651,531 | | | | 0.5 | |
| | 23,648 | | | | | Wal-Mart Stores, Inc | | | | | 1,449,622 | | | | 0.5 | |
| | | | | | Other | | | | | 3,724,657 | | | | 1.1 | |
| | | | | | | | | | | | |
| | | | | | | | | | | 6,825,810 | | | | 2.1 | |
| | | | | | | | | | | | |
| | FOOD, BEVERAGE & TOBACCO | | | | | | | | | | |
| | 29,377 | | | | | Altria Group, Inc | | | | | 1,710,035 | | | | 0.5 | |
| | 58,699 | | | | | Coca-Cola Co | | | | | 2,521,709 | | | | 0.7 | |
| | 22,096 | | | | | PepsiCo, Inc | | | | | 2,207,832 | | | | 0.7 | |
| | 23,191 | | | | | Philip Morris International, Inc | | | | | 2,038,721 | | | | 0.6 | |
| | | | | | Other | | | | | 7,883,529 | | | | 2.4 | |
| | | | | | | | | | | | |
| | | | | | | | | | | 16,361,826 | | | | 4.9 | |
| | | | | | | | | | | | |
| | | | |
| 58 | | 2015 Annual Report § TIAA-CREF Life Funds | | See notes to financial statements |
| | |
| Summary portfolio of investments | | continued |
Stock Index Fund § December 31, 2015
| | | | | | | | | | | | | | | | |
| Shares | | | | | Company | | | | Value | | | % of net
assets | |
| | | | | | | | | | | | | | | | |
| | HEALTH CARE EQUIPMENT & SERVICES | | | | | | | | | | |
| | 21,334 | | | | | Medtronic plc | | | | $ | 1,641,011 | | | | 0.5 | % |
| | 14,251 | | | | | UnitedHealth Group, Inc | | | | | 1,676,488 | | | | 0.5 | |
| | | | | | Other | | | | | 13,741,212 | | | | 4.1 | |
| | | | | | | | | | | | |
| | | | | | | | | | | 17,058,711 | | | | 5.1 | |
| | | | | | | | | | | | |
| | HOUSEHOLD & PERSONAL PRODUCTS | | | | | | | | | | |
| | 40,611 | | | | | Procter & Gamble Co | | | | | 3,224,920 | | | | 1.0 | |
| | | | | | Other | | | | | 2,667,697 | | | | 0.8 | |
| | | | | | | | | | | | |
| | | | | | | | | | | 5,892,617 | | | | 1.8 | |
| | | | | | | | | | | | |
| | INSURANCE | | | | | | | | | | |
| | 27,840 | | | * | | Berkshire Hathaway, Inc (Class B) | | | | | 3,675,994 | | | | 1.1 | |
| | | | | | Other | | | | | 10,025,916 | | | | 3.0 | |
| | | | | | | | | | | | |
| | | | | | | | | | | 13,701,910 | | | | 4.1 | |
| | | | | | | | | | | | |
| | MATERIALS | | | | | 10,205,834 | | | | 3.1 | |
| | | | | | | | | | | | |
| | MEDIA | | | | | | | | | | |
| | 37,415 | | | | | Comcast Corp (Class A) | | | | | 2,111,328 | | | | 0.6 | |
| | 25,399 | | | | | Walt Disney Co | | | | | 2,668,927 | | | | 0.8 | |
| | | | | | Other | | | | | 5,633,539 | | | | 1.7 | |
| | | | | | | | | | | | |
| | | | | | | | | | | 10,413,794 | | | | 3.1 | |
| | | | | | | | | | | | |
| | PHARMACEUTICALS, BIOTECHNOLOGY & LIFE SCIENCES | | | | | | | | | | |
| | 24,781 | | | | | AbbVie, Inc | | | | | 1,468,026 | | | | 0.4 | |
| | 5,871 | | | * | | Allergan plc | | | | | 1,834,688 | | | | 0.5 | |
| | 11,382 | | | | | Amgen, Inc | | | | | 1,847,640 | | | | 0.6 | |
| | 24,955 | | | | | Bristol-Myers Squibb Co | | | | | 1,716,654 | | | | 0.5 | |
| | 11,874 | | | * | | Celgene Corp | | | | | 1,422,030 | | | | 0.4 | |
| | 22,000 | | | | | Gilead Sciences, Inc | | | | | 2,226,180 | | | | 0.7 | |
| | 41,509 | | | | | Johnson & Johnson | | | | | 4,263,805 | | | | 1.3 | |
| | 42,291 | | | | | Merck & Co, Inc | | | | | 2,233,811 | | | | 0.7 | |
| | 92,175 | | | | | Pfizer, Inc | | | | | 2,975,409 | | | | 0.9 | |
| | | | | | Other | | | | | 11,763,779 | | | | 3.5 | |
| | | | | | | | | | | | |
| | | | | | | | | | | 31,752,022 | | | | 9.5 | |
| | | | | | | | | | | | |
| | REAL ESTATE | | | | | 13,968,979 | | | | 4.2 | |
| | | | | | | | | | | | |
| | RETAILING | | | | | | | | | | |
| | 5,706 | | | * | | Amazon.com, Inc | | | | | 3,856,628 | | | | 1.2 | |
| | 19,445 | | | | | Home Depot, Inc | | | | | 2,571,601 | | | | 0.8 | |
| | | | | | Other | | | | | 10,835,348 | | | | 3.2 | |
| | | | | | | | | | | | |
| | | | | | | | | | | 17,263,577 | | | | 5.2 | |
| | | | | | | | | | | | |
| | SEMICONDUCTORS & SEMICONDUCTOR EQUIPMENT | | | | | | | | | | |
| | 71,016 | | | | | Intel Corp | | | | | 2,446,501 | | | | 0.7 | |
| | | | | | Other | | | | | 5,530,820 | | | | 1.7 | |
| | | | | | | | | | | | |
| | | | | | | | | | | 7,977,321 | | | | 2.4 | |
| | | | | | | | | | | | |
| | SOFTWARE & SERVICES | | | | | | | | | | |
| | 4,315 | | | * | | Alphabet, Inc (Class A) | | | | | 3,357,113 | | | | 1.0 | |
| | 4,403 | | | * | | Alphabet, Inc (Class C) | | | | | 3,341,349 | | | | 1.0 | |
| | 32,393 | | | * | | Facebook, Inc | | | | | 3,390,251 | | | | 1.0 | |
| | 13,594 | | | | | International Business Machines Corp | | | | | 1,870,806 | | | | 0.6 | |
| | | | | | |
| See notes to financial statements | | TIAA-CREF Life Funds § 2015 Annual Report | | | 59 | |
| | |
| Summary portfolio of investments | | concluded |
Stock Index Fund § December 31, 2015
| | | | | | | | | | | | | | | | |
| Shares | | | | | Company | | | | Value | | | % of net
assets | |
| | | | | | | | | | | | | | | | |
| | SOFTWARE & SERVICES—continued | | | | | | | | | | |
| | 14,966 | | | | | Mastercard, Inc (Class A) | | | | $ | 1,457,090 | | | | 0.4 | % |
| | 121,087 | | | | | Microsoft Corp | | | | | 6,717,907 | | | | 2.0 | |
| | 47,432 | | | | | Oracle Corp | | | | | 1,732,691 | | | | 0.5 | |
| | 29,302 | | | | | Visa, Inc (Class A) | | | | | 2,272,370 | | | | 0.7 | |
| | | | | | Other | | | | | 15,517,321 | | | | 4.7 | |
| | | | | | | | | | | | |
| | | | | | | | | | | 39,656,898 | | | | 11.9 | |
| | | | | | | | | | | | |
| | TECHNOLOGY HARDWARE & EQUIPMENT | | | | | | | | | | |
| | 86,295 | | | | | Apple, Inc | | | | | 9,083,412 | | | | 2.8 | |
| | 76,136 | | | | | Cisco Systems, Inc | | | | | 2,067,473 | | | | 0.6 | |
| | | | | | Other | | | | | 7,025,835 | | | | 2.1 | |
| | | | | | | | | | | | |
| | | | | | | | | | | 18,176,720 | | | | 5.5 | |
| | | | | | | | | | | | |
| | TELECOMMUNICATION SERVICES | | | | | | | | | | |
| | 91,008 | | | | | AT&T, Inc | | | | | 3,131,585 | | | | 0.9 | |
| | 61,052 | | | | | Verizon Communications, Inc | | | | | 2,821,823 | | | | 0.9 | |
| | | | | | Other | | | | | 1,253,541 | | | | 0.4 | |
| | | | | | | | | | | | |
| | | | | | | | | | | 7,206,949 | | | | 2.2 | |
| | | | | | | | | | | | |
| | TRANSPORTATION | | | | | 6,916,209 | | | | 2.1 | |
| | | | | | | | | | | | |
| | UTILITIES | | | | | 10,190,391 | | | | 3.1 | |
| | | | | | | | | | | | |
| | | | | | TOTAL COMMON STOCKS | | (Cost $206,406,740) | | | 332,286,928 | | | | 100.0 | |
| | | | | | | | | | | | |
| | | |
| | RIGHTS/WARRANTS | | | | | | | | | | |
| | PHARMACEUTICALS, BIOTECHNOLOGY & LIFE SCIENCES | | | | | 178 | | | | 0.0 | |
| | | | | | | | | | | | |
| | TELECOMMUNICATION SERVICES | | | | | 1,789 | | | | 0.0 | |
| | | | | | | | | | | | |
| | | | | | TOTAL RIGHTS/WARRANTS | | (Cost $1,797) | | | 1,967 | | | | 0.0 | |
| | | | | | | | | | | | |
| | | |
| | SHORT-TERM INVESTMENTS | | | | | | | | | | |
| | INVESTMENTS IN REGISTERED INVESTMENT COMPANIES | | | | | | | | | | |
| | 9,417,992 | | | c | | TIAA-CREF Short Term Lending Portfolio of the State Street Navigator Securities Lending Trust | | | | | 9,417,992 | | | | 2.8 | |
| | | | | | | | | | | | |
| | | | | | | | | | | 9,417,992 | | | | 2.8 | |
| | | | | | | | | | | | |
| | | | | | TOTAL SHORT-TERM INVESTMENTS | | (Cost $9,417,992) | | | 9,417,992 | | | | 2.8 | |
| | | | | | | | | | | | |
| | | | | |
| | | | | | TOTAL PORTFOLIO | | (Cost $215,826,529) | | | 341,706,887 | | | | 102.8 | |
| | | | | | OTHER ASSETS & LIABILITIES, NET | | | | | (9,264,262 | ) | | | (2.8 | ) |
| | | | | | | | | | | | |
| | | | | | NET ASSETS | | | | $ | 332,442,625 | | | | 100.0 | % |
| | | | | | | | | | |
| c | Investments made with cash collateral received from securities on loan. |
| d | All or a portion of these securities have been segregated by the custodian to cover margin or other requirements on open futures transactions. |
| e | All or a portion of these securities are out on loan. The aggregate value of securities on loan is $9,105,861. |
“Other” securities represent the aggregate value, by category, of securities that are not among the 50 largest holdings and, in total for any issuer, represent 1% or less of net assets.
For ease of presentation, a number of classification categories have been grouped together in the Summary portfolio of investments. Note that the Fund uses more specific categories in following its investment limitations on investment concentrations.
| | | | |
| 60 | | 2015 Annual Report § TIAA-CREF Life Funds | | See notes to financial statements |
| | |
| Summary portfolio of investments | | |
International Equity Fund § December 31, 2015
| | | | | | | | | | | | | | | | |
| Shares | | | | | Company | | | | Value | | | % of net
assets | |
| | | | | | | | | | | | | | | | |
| | COMMON STOCKS | |
| | AUSTRALIA | | | | $ | 309,835 | | | | 0.3 | % |
| | | | | | | | | | | | |
| | DENMARK | | | | | | | | | | |
| | 28,593 | | | * | | H Lundbeck AS | | | | | 976,316 | | | | 1.1 | |
| | | | | | Other | | | | | 237,209 | | | | 0.2 | |
| | | | | | | | | | | | |
| | | | | | | | | | | 1,213,525 | | | | 1.3 | |
| | | | | | | | | | | | |
| | FINLAND | | | | | 334,951 | | | | 0.4 | |
| | | | | | | | | | | | |
| | FRANCE | | | | | | | | | | |
| | 119,693 | | | | | Accor S.A. | | | | | 5,183,894 | | | | 5.6 | |
| | 20,435 | | | | | Compagnie de Saint-Gobain | | | | | 885,556 | | | | 1.0 | |
| | 36,405 | | | | | Edenred | | | | | 688,165 | | | | 0.7 | |
| | 44,257 | | | g | | Elior Participations S.C.A | | | | | 927,211 | | | | 1.0 | |
| | 35,054 | | | | | Essilor International S.A. | | | | | 4,368,985 | | | | 4.8 | |
| | 9,233 | | | | | Groupe Danone | | | | | 623,906 | | | | 0.7 | |
| | 43,415 | | | | | Renault S.A. | | | | | 4,345,645 | | | | 4.7 | |
| | 38,025 | | | | | Schneider Electric S.A. | | | | | 2,159,969 | | | | 2.4 | |
| | 35,733 | | | | | Vinci S.A. | | | | | 2,290,297 | | | | 2.5 | |
| | | | | | Other | | | | | 674,915 | | | | 0.7 | |
| | | | | | | | | | | | |
| | | | | | | | | | | 22,148,543 | | | | 24.1 | |
| | | | | | | | | | | | |
| | GERMANY | | | | | | | | | | |
| | 74,189 | | | | | Adidas-Salomon AG. | | | | | 7,200,712 | | | | 7.8 | |
| | 204,237 | | | * | | Commerzbank AG. | | | | | 2,107,435 | | | | 2.3 | |
| | 19,368 | | | | | Deutsche Boerse AG. | | | | | 1,702,469 | | | | 1.9 | |
| | 18,323 | | | | | Henkel KGaA (Preference) | | | | | 2,044,882 | | | | 2.2 | |
| | 15,219 | | | | | Lanxess AG. | | | | | 700,336 | | | | 0.8 | |
| | 23,549 | | | | | Linde AG. | | | | | 3,401,849 | | | | 3.7 | |
| | | | | | | | | | | | |
| | | | | | | | | | | 17,157,683 | | | | 18.7 | |
| | | | | | | | | | | | |
| | HONG KONG | | | | | | | | | | |
| | 276,800 | | | | | Sands China Ltd | | | | | 938,406 | | | | 1.0 | |
| | | | | | | | | | | | |
| | | | | | | | | | | 938,406 | | | | 1.0 | |
| | | | | | | | | | | | |
| | INDIA | | | | | | | | | | |
| | 5,678 | | | | | Eicher Motors Ltd | | | | | 1,441,363 | | | | 1.6 | |
| | 158,064 | | | | | HDFC Bank Ltd | | | | | 2,581,600 | | | | 2.8 | |
| | 140,221 | | | | | IndusInd Bank Ltd | | | | | 2,046,594 | | | | 2.2 | |
| | 15,277 | | | | | Maruti Suzuki India Ltd | | | | | 1,063,909 | | | | 1.2 | |
| | | | | | Other | | | | | 123,233 | | | | 0.1 | |
| | | | | | | | | | | | |
| | | | | | | | | | | 7,256,699 | | | | 7.9 | |
| | | | | | | | | | | | |
| | ITALY | | | | | | | | | | |
| | 58,381 | | | | | Moncler S.p.A | | | | | 812,424 | | | | 0.9 | |
| | | | | | | | | | | | |
| | | | | | | | | | | 812,424 | | | | 0.9 | |
| | | | | | | | | | | | |
| | JAPAN | | | | | | | | | | |
| | 31,800 | | | | | Don Quijote Co Ltd | | | | | 1,116,776 | | | | 1.2 | |
| | 161,000 | | | | | Ishikawajima-Harima Heavy Industries Co Ltd | | | | | 444,440 | | | | 0.5 | |
| | 18,900 | | | | | Murata Manufacturing Co Ltd | | | | | 2,719,354 | | | | 3.0 | |
| | 84,425 | | | | | Olympus Corp | | | | | 3,323,700 | | | | 3.6 | |
| | | | | | |
| See notes to financial statements | | TIAA-CREF Life Funds § 2015 Annual Report | | | 61 | |
| | |
| Summary portfolio of investments | | continued |
International Equity Fund § December 31, 2015
| | | | | | | | | | | | | | | | |
| Shares | | | | | Company | | | | Value | | | % of net
assets | |
| | | | | | | | | | | | | | | | |
| | JAPAN—continued | | | | | | | | | | |
| | 7,592 | | | | | Oriental Land Co Ltd | | | | $ | 459,289 | | | | 0.5 | % |
| | 230,400 | | | *,e | | Pioneer Corp | | | | | 634,271 | | | | 0.7 | |
| | 117,550 | | | | | Sony Corp | | | | | 2,889,001 | | | | 3.2 | |
| | 26,200 | | | e | | Sony Financial Holdings, Inc | | | | | 468,646 | | | | 0.5 | |
| | 12,300 | | | | | Toyota Motor Corp | | | | | 757,421 | | | | 0.8 | |
| | | | | | Other | | | | | 124,608 | | | | 0.1 | |
| | | | | | | | | | | | |
| | | | | | | | | | | 12,937,506 | | | | 14.1 | |
| | | | | | | | | | | | |
| | NETHERLANDS | | | | | | | | | | |
| | 38,936 | | | | | Heineken NV | | | | | 3,318,004 | | | | 3.6 | |
| | 97,495 | | | | | ING Groep NV | | | | | 1,319,111 | | | | 1.5 | |
| | | | | | Other | | | | | 104,576 | | | | 0.1 | |
| | | | | | | | | | | | |
| | | | | | | | | | | 4,741,691 | | | | 5.2 | |
| | | | | | | | | | | | |
| | SWEDEN | | | | | | | | | | |
| | 72,527 | | | | | Electrolux AB (Series B) | | | | | 1,749,888 | | | | 1.9 | |
| | | | | | | | | | | | |
| | | | | | | | | | | 1,749,888 | | | | 1.9 | |
| | | | | | | | | | | | |
| | SWITZERLAND | | | | | | | | | | |
| | 3,167 | | | | | Burckhardt Compression Holding AG. | | | | | 969,653 | | | | 1.0 | |
| | 2,945 | | | | | Geberit AG. | | | | | 997,479 | | | | 1.1 | |
| | 22,640 | | | | | Swatch Group AG. (Registered) | | | | | 1,528,893 | | | | 1.7 | |
| | 3,083 | | | | | Zurich Financial Services AG. | | | | | 792,022 | | | | 0.9 | |
| | | | | | Other | | | | | 131,576 | | | | 0.1 | |
| | | | | | | | | | | | |
| | | | | | | | | | | 4,419,623 | | | | 4.8 | |
| | | | | | | | | | | | |
| | TAIWAN | | | | | | | | | | |
| | 406,927 | | | | | Advanced Semiconductor Engineering, Inc | | | | | 467,445 | | | | 0.5 | |
| | | | | | | | | | | | |
| | | | | | | | | | | 467,445 | | | | 0.5 | |
| | | | | | | | | | | | |
| | UNITED KINGDOM | | | | | | | | | | |
| | 8,484 | | | | | Associated British Foods plc | | | | | 417,473 | | | | 0.5 | |
| | 291,990 | | | | | Barclays plc | | | | | 939,848 | | | | 1.0 | |
| | 63,288 | | | | | Essentra plc | | | | | 771,487 | | | | 0.8 | |
| | 287,842 | | | | | Group 4 Securicor plc | | | | | 956,150 | | | | 1.0 | |
| | 510,259 | | | | | Man Group plc | | | | | 1,312,645 | | | | 1.4 | |
| | 374,083 | | | | | Sky plc | | | | | 6,132,247 | | | | 6.7 | |
| | 786,841 | | | * | | Tesco plc | | | | | 1,728,906 | | | | 1.9 | |
| | 96,553 | | | | | Weir Group plc | | | | | 1,418,247 | | | | 1.5 | |
| | 94,071 | | | | | WPP plc | | | | | 2,163,799 | | | | 2.4 | |
| | | | | | Other | | | | | 412,154 | | | | 0.5 | |
| | | | | | | | | | | | |
| | | | | | | | | | | 16,252,956 | | | | 17.7 | |
| | | | | | | | | | | | |
| | UNITED STATES | | | | | | | | | | |
| | 18,866 | | | * | | Qiagen NV | | | | | 511,347 | | | | 0.6 | |
| | | | | | | | | | | | |
| | | | | | | | | | | 511,347 | | | | 0.6 | |
| | | | | | | | | | | | |
| | | | | | TOTAL COMMON STOCKS | | (Cost $91,662,365) | | | 91,252,522 | | | | 99.4 | |
| | | | | | | | | | | | |
| | | | |
| 62 | | 2015 Annual Report § TIAA-CREF Life Funds | | See notes to financial statements |
| | |
| Summary portfolio of investments | | concluded |
International Equity Fund § December 31, 2015
| | | | | | | | | | | | | | | | |
| Shares | | | | | Company | | | | Value | | | % of net
assets | |
| | | | | | | | | | | | | | | | |
| | SHORT-TERM INVESTMENTS | | | | | | | | | | |
| | INVESTMENTS IN REGISTERED INVESTMENT COMPANIES | | | | | | | | | | |
| | 869,519 | | | c | | TIAA-CREF Short Term Lending Portfolio of the State Street Navigator Securities Lending Trust | | | | $ | 869,519 | | | | 0.9 | % |
| | | | | | | | | | | | |
| | | | | | | | | | | 869,519 | | | | 0.9 | |
| | | | | | | | | | | | |
| | | | | | TOTAL SHORT-TERM INVESTMENTS | | (Cost $869,519) | | | 869,519 | | | | 0.9 | |
| | | | | | | | | | | | |
| | | | | |
| | | | | | TOTAL PORTFOLIO | | (Cost $92,531,884) | | | 92,122,041 | | | | 100.3 | |
| | | | | | OTHER ASSETS & LIABILITIES, NET | | | | | (302,570 | ) | | | (0.3 | ) |
| | | | | | | | | | | | |
| | | | | | NET ASSETS | | | | $ | 91,819,471 | | | | 100.0 | % |
| | | | | | | | | | | | |
| c | Investments made with cash collateral received from securities on loan. |
| e | All or a portion of these securities are out on loan. The aggregate value of securities on loan is $826,060. |
| g | Security is exempt from registration under Rule 144(A) of the Securities Act of 1933. Such securities are deemed liquid and may be resold in transactions exempt from registration to qualified institutional buyers. At 12/31/2015, the aggregate value of these securities, is $927,211 or 1.0% of net assets. |
“Other” securities represent the aggregate value, by category, of securities that are not among the 50 largest holdings and, in total for any issuer, represent 1% or less of net assets.
For ease of presentation, a number of classification categories have been grouped together in the Summary portfolio of investments. Note that the Fund uses more specific categories in following its investment limitations on investment concentrations.
| | | | | | |
| See notes to financial statements | | TIAA-CREF Life Funds § 2015 Annual Report | | | 63 | |
| | |
| Summary of market values by sector | | |
International Equity Fund § December 31, 2015
| | | | | | | | |
| Sector | | Value | | | % of net
assets | |
| CONSUMER DISCRETIONARY | | $ | 36,976,574 | | | | 40.1 | % |
| INDUSTRIALS | | | 13,998,885 | | | | 15.3 | |
| FINANCIALS | | | 13,925,079 | | | | 15.2 | |
| HEALTH CARE | | | 9,417,556 | | | | 10.3 | |
| CONSUMER STAPLES | | | 8,256,404 | | | | 9.0 | |
| MATERIALS | | | 5,299,524 | | | | 5.8 | |
| INFORMATION TECHNOLOGY | | | 3,377,435 | | | | 3.7 | |
| ENERGY | | | 1,065 | | | | 0.0 | |
| SHORT-TERM INVESTMENTS | | | 869,519 | | | | 0.9 | |
| OTHER ASSETS & LIABILITES, NET | | | (302,570 | ) | | | (0.3 | ) |
| | | | |
NET ASSETS | | $ | 91,819,471 | | | | 100.0 | % |
| | | | |
| | | | |
| 64 | | 2015 Annual Report § TIAA-CREF Life Funds | | See notes to financial statements |
| | |
| Summary portfolio of investments | | |
Bond Fund § December 31, 2015
| | | | | | | | | | | | | | | | |
| Principal | | | | | Issuer | | | | Value | | | % of net assets | |
| | | | | | | | | | | | | | | | |
| | BANK LOAN OBLIGATIONS | | | | | | | | |
| | AUTOMOBILES & COMPONENTS | | | | $ | 118,739 | | | | 0.1% | |
| | | | | | | | | | | | |
| | CAPITAL GOODS | | | | | 49,173 | | | | 0.0 | |
| | | | | | | | | | | | |
| | COMMERCIAL & PROFESSIONAL SERVICES | | | | | 194,556 | | | | 0.1 | |
| | | | | | | | | | | | |
| | CONSUMER DURABLES & APPAREL | | | | | 87,341 | | | | 0.0 | |
| | | | | | | | | | | | |
| | CONSUMER SERVICES | | | | | 320,271 | | | | 0.2 | |
| | | | | | | | | | | | |
| | DIVERSIFIED FINANCIALS | | | | | 289,825 | | | | 0.2 | |
| | | | | | | | | | | | |
| | ENERGY | | | | | 61,704 | | | | 0.0 | |
| | | | | | | | | | | | |
| | FOOD, BEVERAGE & TOBACCO | | | | | 42,684 | | | | 0.0 | |
| | | | | | | | | | | | |
| | HEALTH CARE EQUIPMENT & SERVICES | | | | | 172,306 | | | | 0.1 | |
| | | | | | | | | | | | |
| | INSURANCE | | | | | 119,076 | | | | 0.1 | |
| | | | | | | | | | | | |
| | MATERIALS | | | | | 231,550 | | | | 0.1 | |
| | | | | | | | | | | | |
| | MEDIA | | | | | 387,274 | | | | 0.2 | |
| | | | | | | | | | | | |
| | SOFTWARE & SERVICES | | | | | 349,537 | | | | 0.2 | |
| | | | | | | | | | | | |
| | TECHNOLOGY HARDWARE & EQUIPMENT | | | | | 185,214 | | | | 0.2 | |
| | | | | | | | | | | | |
| | | | | | TOTAL BANK LOAN OBLIGATIONS | | (Cost $2,724,491) | | | 2,609,250 | | | | 1.5 | |
| | | | | | | | | | | | |
| | |
| | BONDS | | | | | | | | |
| | CORPORATE BONDS | | | | | | | | |
| | AUTOMOBILES & COMPONENTS | | | | | 598,448 | | | | 0.4 | |
| | | | | | | | | | | | |
| | BANKS | | | | | 12,927,827 | | | | 7.2 | |
| | | | | | | | | | | | |
| | CAPITAL GOODS | | | | | 2,114,819 | | | | 1.2 | |
| | | | | | | | | | | | |
| | COMMERCIAL & PROFESSIONAL SERVICES | | | | | 2,864,635 | | | | 1.6 | |
| | | | | | | | | | | | |
| | CONSUMER DURABLES & APPAREL | | | | | 288,660 | | | | 0.2 | |
| | | | | | | | | | | | |
| | CONSUMER SERVICES | | | | | 473,120 | | | | 0.2 | |
| | | | | | | | | | | | |
| | DIVERSIFIED FINANCIALS | | | | | | | | | | |
| | $ 725,000 | | | | | American Express Credit Corp | | 2.250%, 08/15/19 | | | 725,105 | | | | 0.4 | |
| | 750,000 | | | g,i | | Armor Re Ltd | | 4.243%, 12/15/16 | | | 748,425 | | | | 0.4 | |
| | 750,000 | | | | | Ford Motor Credit Co LLC | | 2.597%, 11/04/19 | | | 736,443 | | | | 0.4 | |
| | 558,000 | | | g | | GE Capital International Funding Co | | 3.373%, 11/15/25 | | | 568,191 | | | | 0.3 | |
| | | | | | Other | | | | | 7,927,285 | | | | 4.5 | |
| | | | | | | | | | | | |
| | | | | | | | | | | 10,705,449 | | | | 6.0 | |
| | | | | | | | | | | | |
| | ENERGY | | | | | 6,254,325 | | | | 3.5 | |
| | | | | | | | | | | | |
| | FOOD & STAPLES RETAILING | | | | | 1,490,812 | | | | 0.8 | |
| | | | | | | | | | | | |
| | FOOD, BEVERAGE & TOBACCO | | | | | 2,590,351 | | | | 1.4 | |
| | | | | | | | | | | | |
| | | | | | |
| See notes to financial statements | | TIAA-CREF Life Funds § 2015 Annual Report | | | 65 | |
| | |
| Summary portfolio of investments | | continued |
Bond Fund § December 31, 2015
| | | | | | | | | | | | | | | | |
| Principal | | | | | Issuer | | | | Value | | | % of net assets | |
| | | | | | | | | | | | | | | | |
| | HEALTH CARE EQUIPMENT & SERVICES | | | | $ | 2,744,621 | | | | 1.5 | % |
| | | | | | | | | | | | |
| | HOUSEHOLD & PERSONAL PRODUCTS | | | | | 200,443 | | | | 0.1 | |
| | | | | | | | | | | | |
| | INSURANCE | | | | | 4,366,785 | | | | 2.4 | |
| | | | | | | | | | | | |
| | MATERIALS | | | | | | | | | | |
| | $ 930,000 | | | g | | Glencore Funding LLC | | 2.125%, 04/16/18 | | | 826,442 | | | | 0.5 | |
| | 598,000 | | | | | International Paper Co | | 4.750%, 02/15/22 | | | 638,841 | | | | 0.3 | |
| | | | | | Other | | | | | 2,832,590 | | | | 1.6 | |
| | | | | | | | | | | | |
| | | | | | | | | | | 4,297,873 | | | | 2.4 | |
| | | | | | | | | | | | |
| | MEDIA | | | 4,847,771 | | | | 2.7 | |
| | | | | | | | | | | | |
| | PHARMACEUTICALS, BIOTECHNOLOGY & LIFE SCIENCES | | | 3,012,745 | | | | 1.7 | |
| | | | | | | | | | | | |
| | REAL ESTATE | | | 3,808,670 | | | | 2.1 | |
| | | | | | | | | | | | |
| | RETAILING | | | | | | | | |
| | 725,000 | | | | | O’Reilly Automotive, Inc | | 3.800%, 09/01/22 | | | 734,220 | | | | 0.4 | |
| | | | | | Other | | | | | 1,864,147 | | | | 1.1 | |
| | | | | | | | | | | | |
| | | | | | | | | | | 2,598,367 | | | | 1.5 | |
| | | | | | | | | | | | |
| | SEMICONDUCTORS & SEMICONDUCTOR EQUIPMENT | | | 258,631 | | | | 0.2 | |
| | | | | | | | | | | | |
| | SOFTWARE & SERVICES | | | | | | | | |
| | 1,170,000 | | | | | Fidelity National Information Services, Inc | | 5.000%, 03/15/22 | | | 1,216,065 | | | | 0.7 | |
| | | | | | Other | | | | | 881,857 | | | | 0.5 | |
| | | | | | | | | | | | |
| | | | | | | | | | | 2,097,922 | | | | 1.2 | |
| | | | | | | | | | | | |
| | TECHNOLOGY HARDWARE & EQUIPMENT | | | 989,891 | | | | 0.6 | |
| | | | | | | | | | | | |
| | TELECOMMUNICATION SERVICES | | | | | | | | |
| | 675,000 | | | | | Verizon Communications, Inc | | 3.450%, 03/15/21 | | | 690,912 | | | | 0.4 | |
| | | | | | Other | | | | | 3,820,902 | | | | 2.1 | |
| | | | | | | | | | | | |
| | | | | | | | | | | 4,511,814 | | | | 2.5 | |
| | | | | | | | | | | | |
| | TRANSPORTATION | | | 3,690,992 | | | | 2.1 | |
| | | | | | | | | | | | |
| | UTILITIES | | | 6,940,968 | | | | 3.8 | |
| | | | | | | | | | | | |
| | | | | | TOTAL CORPORATE BONDS | | (Cost $86,154,773) | | | 84,675,939 | | | | 47.3 | |
| | | | | | | | | | | | |
| | | |
| | GOVERNMENT BONDS | | | | | | | | | | |
| | AGENCY SECURITIES | | | 534,209 | | | | 0.3 | |
| | | | | | | | | | | | |
| | FOREIGN GOVERNMENT BONDS | | | 6,697,100 | | | | 3.7 | |
| | | | | | | | | | | | |
| | MORTGAGE BACKED | | | | | | | | |
| | 3,056,356 | | | h | | Federal Home Loan Mortgage Corp (FHLMC) | | 3.500%, 10/01/45 | | | 3,156,466 | | | | 1.8 | |
| | 1,183,686 | | | | | Federal National Mortgage Association (FNMA) | | 3.000%, 10/01/30 | | | 1,220,320 | | | | 0.7 | |
| | 1,557,913 | | | | | FNMA | | 2.500%, 11/01/30 | | | 1,571,697 | | | | 0.9 | |
| | 892,482 | | | | | FNMA | | 3.000%, 01/01/35 | | | 911,037 | | | | 0.5 | |
| | 1,135,775 | | | | | FNMA | | 5.500%, 07/01/40 | | | 1,279,691 | | | | 0.7 | |
| | 529,171 | | | | | FNMA | | 6.000%, 10/01/40 | | | 598,113 | | | | 0.3 | |
| | | | |
| 66 | | 2015 Annual Report § TIAA-CREF Life Funds | | See notes to financial statements |
| | |
| Summary portfolio of investments | | continued |
Bond Fund § December 31, 2015
| | | | | | | | | | | | | | | | |
| Principal | | | | | Issuer | | | | Value | | | % of net assets | |
| | | | | | | | | | | | | | | | |
| | MORTGAGE BACKED—continued | | | | | | | | |
| | $ 1,555,629 | | | | | FNMA | | 4.500%, 11/01/40 | | $ | 1,683,368 | | | | 0.9 | % |
| | 2,682,719 | | | h | | FNMA | | 3.000%, 02/01/43 | | | 2,687,783 | | | | 1.5 | |
| | 1,445,011 | | | | | FNMA | | 3.000%, 05/01/43 | | | 1,447,403 | | | | 0.8 | |
| | 481,666 | | | | | FNMA | | 4.500%, 10/01/44 | | | 529,928 | | | | 0.3 | |
| | 949,746 | | | | | FNMA | | 4.500%, 11/01/44 | | | 1,044,756 | | | | 0.6 | |
| | 969,542 | | | | | FNMA | | 4.000%, 12/01/44 | | | 1,032,123 | | | | 0.6 | |
| | 954,239 | | | | | FNMA | | 4.000%, 01/01/45 | | | 1,021,608 | | | | 0.6 | |
| | 2,161,019 | | | | | FNMA | | 3.500%, 07/01/45 | | | 2,232,481 | | | | 1.2 | |
| | 3,066,671 | | | h | | FNMA | | 4.000%, 07/01/45 | | | 3,260,479 | | | | 1.8 | |
| | 3,801,686 | | | i | | FNMA | | 0.772%–7.500%, 08/01/21–12/01/45 | | | 3,721,977 | | | | 2.1 | |
| | 810,017 | | | | | Government National Mortgage Association (GNMA) | | 3.000%, 02/20/43 | | | 825,045 | | | | 0.5 | |
| | 498,929 | | | | | GNMA | | 3.500%, 11/20/45 | | | 520,705 | | | | 0.3 | |
| | 1,250,000 | | | | | GNMA | | 3.500%, 12/20/45 | | | 1,304,556 | | | | 0.7 | |
| | 500,000 | | | | | GNMA | | 4.000%, 12/20/45 | | | 531,686 | | | | 0.3 | |
| | 3,244,354 | | | | | GNMA | | 3.000%–6.000%, 07/15/33–11/20/45 | | | 2,794,329 | | | | 1.6 | |
| | | | | | Other | | | | | 1,645,570 | | | | 0.9 | |
| | | | | | | | | | | | |
| | | | | | | | | | | 35,021,121 | | | | 19.6 | |
| | | | | | | | | | | | |
| | MUNICIPAL BONDS | | | | | | | | |
| | 590,000 | | | | | State of Illinois | | 3.860%, 04/01/21 | | | 584,578 | | | | 0.3 | |
| | | | | | Other | | | | | 301,347 | | | | 0.2 | |
| | | | | | | | | | | | |
| | | | | | | | | | | 885,925 | | | | 0.5 | |
| | | | | | | | | | | | |
| | U.S. TREASURY SECURITIES | | | | | | | | |
| | 1,249,000 | | | | | United States Treasury Bond | | 2.875%, 08/15/45 | | | 1,210,701 | | | | 0.7 | |
| | 4,240,000 | | | | | United States Treasury Bond | | 3.000%, 11/15/45 | | | 4,219,275 | | | | 2.4 | |
| | 1,000,000 | | | | | United States Treasury Note | | 1.625%, 11/30/20 | | | 994,333 | | | | 0.5 | |
| | 1,000,000 | | | | | United States Treasury Note | | 2.000%, 11/30/22 | | | 994,542 | | | | 0.5 | |
| | | | | | | | | | | | |
| | | | | | | | | | | 7,418,851 | | | | 4.1 | |
| | | | | | | | | | | | |
| | | | | | TOTAL GOVERNMENT BONDS | | (Cost $51,035,894) | | | 50,557,206 | | | | 28.2 | |
| | | | | | | | | | | | |
| | |
| | STRUCTURED ASSETS | | | | | | | | |
| | ASSET BACKED | | | | | | | | |
| | 1,000,000 | | | g | | Capital Automotive REIT | | 3.660%, 10/15/44 | | | 1,004,829 | | | | 0.6 | |
| | | | | | Series 2014-1A (Class A) | | | | | | | | | | |
| | 1,000,000 | | | g | | Domino’s Pizza Master Issuer LLC | | 3.484%, 10/25/45 | | | 980,000 | | | | 0.5 | |
| | | | | | Series 2015-1A (Class A2I) | | | | | | | | | | |
| | 1,000,000 | | | g | | Domino’s Pizza Master Issuer LLC | | 4.474%, 10/25/45 | | | 986,410 | | | | 0.6 | |
| | | | | | Series 2015-1A (Class A2II) | | | | | | | | | | |
| | 573,627 | | | | | Santander Drive Auto Receivables Trust | | 4.740%, 09/15/17 | | | 578,153 | | | | 0.3 | |
| | | | | | Series 2011-4 (Class D) | | | | | | | | | | |
| | 625,000 | | | | | Santander Drive Auto Receivables Trust | | 1.590%, 10/15/18 | | | 624,735 | | | | 0.3 | |
| | | | | | Series 2014-1 (Class B) | | | | | | | | | | |
| | | | | | Other | | | | | 6,039,502 | | | | 3.4 | |
| | | | | | | | | | | | |
| | | | | | | | | | | 10,213,629 | | | | 5.7 | |
| | | | | | | | | | | | |
| | OTHER MORTGAGE BACKED | | | | | | | | |
| | 2,000,000 | | | i | | Banc of America Commercial Mortgage Trust | | 5.954%, 05/10/45 | | | 2,003,324 | | | | 1.1 | |
| | | | | | Series 2006-2 (Class AJ) | | | | | | | | | | |
| | | | | | |
| See notes to financial statements | | TIAA-CREF Life Funds § 2015 Annual Report | | | 67 | |
| | |
| Summary portfolio of investments | | concluded |
Bond Fund § December 31, 2015
| | | | | | | | | | | | | | | | |
| Principal | | | | | Issuer | | | | Value | | | % of net assets | |
| | | | | | | | | | | | | | | | |
| | OTHER MORTGAGE BACKED—continued | | | | | | | | |
| | $ 1,175,000 | | | i | | Bear Stearns Commercial Mortgage Securities | | 5.920%, 09/11/42 | | $ | 1,240,016 | | | | 0.7 | % |
| | | | | | Series 2007-T28 (Class AJ) | | | | | | | | | | |
| | 1,500,000 | | | i | | COBALT CMBS Commercial Mortgage Trust | | 5.771%, 05/15/46 | | | 1,510,109 | | | | 0.8 | |
| | | | | | Series 2007-C3 (Class AJ) | | | | | | | | | | |
| | 1,190,601 | | | i | | Commercial Mortgage Trust | | 5.867%, 12/10/49 | | | 1,236,749 | | | | 0.7 | |
| | | | | | Series 2007-GG11 (Class AM) | | | | | | | | | | |
| | 1,000,000 | | | i | | LB-UBS Commercial Mortgage Trust | | 6.114%, 07/15/40 | | | 1,044,314 | | | | 0.6 | |
| | | | | | Series 2007-C6 (Class AM) | | | | | | | | | | |
| | 1,200,000 | | | i | | Morgan Stanley Capital I Trust | | 5.389%, 11/12/41 | | | 1,203,958 | | | | 0.7 | |
| | | | | | Series 2006-HQ10 (Class AJ) | | | | | | | | | | |
| | 1,250,000 | | | | | Wachovia Bank Commercial Mortgage Trust | | 5.383%, 12/15/43 | | | 1,291,589 | | | | 0.7 | |
| | | | | | Series 2007-C30 (Class AM) | | | | | | | | | | |
| | 980,000 | | | i | | Wachovia Bank Commercial Mortgage Trust | | 5.818%, 05/15/46 | | | 1,029,192 | | | | 0.6 | |
| | | | | | Series 2007-C34 (Class AM) | | | | | | | | | | |
| | 1,200,000 | | | i | | Wachovia Bank Commercial Mortgage Trust | | 5.947%, 05/15/46 | | | 1,210,131 | | | | 0.7 | |
| | | | | | Series 2007-C34 (Class AJ) | | | | | | | | | | |
| | 2,150,000 | | | i | | Wachovia Bank Commercial Mortgage Trust | | 5.591%, 04/15/47 | | | 2,228,499 | | | | 1.2 | |
| | | | | | Series 2007-C31 (Class AM) | | | | | | | | | | |
| | 1,500,000 | | | g | | Wachovia Bank Commercial Mortgage Trust | | 5.703%, 06/15/49 | | | 1,562,773 | | | | 0.9 | |
| | | | | | Series 2007-C32 (Class AMFX) | | | | | | | | | | |
| | 1,260,000 | | | i | | Wachovia Bank Commercial Mortgage Trust | | 5.750%, 06/15/49 | | | 1,259,533 | | | | 0.7 | |
| | | | | | Series 2007-C32 (Class AJ) | | | | | | | | | | |
| | | | | | Other | | | | | 9,215,520 | | | | 5.1 | |
| | | | | | | | | | | | |
| | | | | | | | | | | 26,035,707 | | | | 14.5 | |
| | | | | | | | | | | | |
| | | | | | TOTAL STRUCTURED ASSETS | | (Cost $36,560,883) | | | 36,249,336 | | | | 20.2 | |
| | | | | | | | | | | | |
| | | | | | TOTAL BONDS | | (Cost $173,751,550) | | | 171,482,481 | | | | 95.7 | |
| | | | | | | | | | | | |
| | | | | |
| Shares | | | | | Company | | | | | | | | |
| | PREFERRED STOCKS | | | | | | | | |
| | BANKS | | | 79,185 | | | | 0.0 | |
| | | | | | | | | | | | |
| | | | | | TOTAL PREFERRED STOCKS | | (Cost $569,550) | | | 79,185 | | | | 0.0 | |
| | | | | | | | | | | | |
| | | | | |
| | | | | | TOTAL PORTFOLIO | | (Cost $177,045,591) | | | 174,170,916 | | | | 97.2 | |
| | | | | | OTHER ASSETS & LIABILITIES, NET | | | | | 4,925,041 | | | | 2.8 | |
| | | | | | | | | | | | |
| | | | | | NET ASSETS | | | | $ | 179,095,957 | | | | 100.0 | % |
| | | | | | | | | | |
Abbreviation(s):
REIT Real Estate Investment Trust
| g | Security is exempt from registration under Rule 144(A) of the Securities Act of 1933. Such securities are deemed liquid and may be resold in transactions exempt from registration to qualified institutional buyers. At 12/31/2015, the aggregate value of these securities, including those in “Other,” was $33,699,649 or 18.8% of net assets. |
| h | All or a portion of these securities were purchased on a delayed delivery basis. |
| i | Floating or variable rate security. Coupon rate reflects the rate at period end. |
“Other” securities represent the aggregate value, by category, of securities that are not among the 50 largest holdings and, in total for any issuer, represent 1% or less of net assets.
For ease of presentation, a number of classification categories have been grouped together in the Summary portfolio of investments. Note that the Fund uses more specific categories in following its investment limitations on investment concentrations.
| | | | |
| 68 | | 2015 Annual Report § TIAA-CREF Life Funds | | See notes to financial statements |
| | |
| Summary portfolio of investments | | |
Money Market Fund § December 31, 2015
| | | | | | | | | | | | | | | | |
| Principal | | | | | Issuer | | | | Value | | | % net
assets | |
| | | | | | | | | | | | | | | | |
| | SHORT-TERM INVESTMENTS | | | | | | | | | | |
| | CERTIFICATE OF DEPOSIT | | | | | | | | | | |
| | $ 500,000 | | | | | Banco Del Estado De Chile | | 0.260%, 01/08/16 | | $ | 500,000 | | | | 0.7 | % |
| | 500,000 | | | | | Banco Del Estado De Chile | | 0.350%, 02/17/16 | | | 500,000 | | | | 0.7 | |
| | 500,000 | | | | | Toronto-Dominion Bank | | 0.300%, 01/04/16 | | | 500,000 | | | | 0.7 | |
| | 500,000 | | | | | Toronto-Dominion Bank | | 0.300%, 02/12/16 | | | 500,000 | | | | 0.7 | |
| | | | | | Other | | | | | 300,000 | | | | 0.4 | |
| | | | | | | | | | | | |
| | | | | | | | | | | 2,300,000 | | | | 3.2 | |
| | | | | | | | | | | | |
| | COMMERCIAL PAPER | | | | | | | | | | |
| | 600,000 | | | y | | Apple, Inc | | 0.150%, 01/11/16 | | | 599,975 | | | | 0.8 | |
| | 900,000 | | | y | | Apple, Inc | | 0.155%–0.390%, 01/04/16–02/22/16 | | | 899,803 | | | | 1.3 | |
| | 530,000 | | | y | | Australia & New Zealand Banking Group Ltd | | 0.550%, 03/24/16 | | | 529,328 | | | | 0.7 | |
| | 1,100,000 | | | y | | Australia & New Zealand Banking Group Ltd | | 0.285%–0.640%, 02/12/16–03/23/16 | | | 1,099,197 | | | | 1.5 | |
| | 1,000,000 | | | y | | Chevron Corp | | 0.205%, 02/03/16 | | | 999,812 | | | | 1.4 | |
| | 985,000 | | | y | | DBS Bank Ltd | | 0.240%–0.540%, 01/19/16–02/11/16 | | | 984,696 | | | | 1.4 | |
| | 1,000,000 | | | | | Korea Development Bank | | 0.260%–0.320%, 01/21/16–02/11/16 | | | 999,746 | | | | 1.4 | |
| | 1,000,000 | | | y | | Microsoft Corp | | 0.185%–0.190%, 01/06/16 | | | 999,974 | | | | 1.4 | |
| | 1,800,000 | | | | | Province of British Columbia Canada | | 0.200%–0.470%, 01/19/16–03/09/16 | | | 1,799,172 | | | | 2.5 | |
| | 755,000 | | | | | Province of Ontario Canada | | 0.460%–0.470%, 02/23/16–02/29/16 | | | 754,442 | | | | 1.1 | |
| | 1,000,000 | | | y | | Province of Quebec Canada | | 0.160%, 01/05/16 | | | 999,982 | | | | 1.4 | |
| | 750,000 | | | y | | PSP Capital, Inc | | 0.260%–0.300%, 02/01/16 | | | 749,815 | | | | 1.1 | |
| | 760,000 | | | y | | Svenska Handelsbanken AB | | 0.380%–0.600%, 02/22/16–03/07/16 | | | 759,439 | | | | 1.1 | |
| | 500,000 | | | y | | Unilever Capital Corp | | 0.170%, 01/11/16 | | | 499,976 | | | | 0.7 | |
| | 1,000,000 | | | y | | Unilever Capital Corp | | 0.170%–0.440%, 01/12/16–02/26/16 | | | 999,632 | | | | 1.4 | |
| | 650,000 | | | y | | United Overseas Bank Ltd | | 0.370%, 02/24/16 | | | 649,639 | | | | 0.9 | |
| | | | | | Other | | | | | 4,437,118 | | | | 6.2 | |
| | | | | | | | | | | | |
| | | | | | | | | | | 18,761,746 | | | | 26.3 | |
| | | | | | | | | | | | |
| | GOVERNMENT AGENCY DEBT | | | | | | | | | | |
| | 800,000 | | | | | Federal Farm Credit Bank (FFCB) | | 0.350%, 3/7/2016 | | | 799,487 | | | | 1.1 | |
| | 500,000 | | | | | Federal Home Loan Bank (FHLB) | | 0.115%,1/7/2016 | | | 499,990 | | | | 0.7 | |
| | 570,000 | | | | | FHLB | | 0.120%–0.150%,1/12/2016 | | | 569,975 | | | | 0.8 | |
| | 1,700,000 | | | | | FHLB | | 0.110%, 1/13/2016 | | | 1,699,938 | | | | 2.4 | |
| | 1,000,000 | | | | | FHLB | | 0.120%–0.210%, 1/15/2016 | | | 999,933 | | | | 1.4 | |
| | 1,320,000 | | | | | FHLB | | 0.135%–0.250%, 1/22/2016 | | | 1,319,822 | | | | 1.9 | |
| | 824,000 | | | | | FHLB | | 0.150%–0.200%, 1/25/2016 | | | 823,903 | | | | 1.2 | |
| | 800,000 | | | | | FHLB | | 0.150%–0.200%, 1/26/2016 | | | 799,903 | | | | 1.1 | |
| | 1,390,000 | | | | | FHLB | | 0.122%–0.220%, 1/27/2016 | | | 1,389,838 | | | | 1.9 | |
| | 900,000 | | | | | FHLB | | 0.140%–0.200%, 1/29/2016 | | | 899,883 | | | | 1.3 | |
| | 1,000,000 | | | | | FHLB | | 0.205%, 2/5/2016 | | | 999,801 | | | | 1.4 | |
| | 910,000 | | | | | FHLB | | 0.295%, 2/16/2016 | | | 909,657 | | | | 1.3 | |
| | 850,000 | | | | | FHLB | | 0.315%, 3/2/2016 | | | 849,546 | | | | 1.2 | |
| | 700,000 | | | | | FHLB | | 0.350%, 3/30/2016 | | | 699,394 | | | | 1.0 | |
| | 557,000 | | | | | FHLB | | 0.620%, 6/8/2016 | | | 555,475 | | | | 0.8 | |
| | 5,017,000 | | | | | FHLB | | 0.125%–0.550%, 01/04/16–04/22/16 | | | 5,014,554 | | | | 7.0 | |
| | 600,000 | | | | | Federal Home Loan Mortgage Corp (FHLMC) | | 0.250%–0.270%, 1/11/2016 | | | 599,957 | | | | 0.8 | |
| | 900,000 | | | | | FHLMC | | 0.200%, 1/13/2016 | | | 899,940 | | | | 1.3 | |
| | | | | | |
| See notes to financial statements | | TIAA-CREF Life Funds § 2015 Annual Report | | | 69 | |
| | |
| Summary portfolio of investments | | continued |
Money Market Fund § December 31, 2015
| | | | | | | | | | | | | | | | |
| Principal | | | | | Issuer | | | | Value | | | % net
assets | |
| | | | | | | | | | | | | | | | |
| | GOVERNMENT AGENCY DEBT—continued | | | | | | | | | | |
| | $1,000,000 | | | | | FHLMC | | 0.140%, 1/25/2016 | | $ | 999,907 | | | | 1.4 | % |
| | 2,575,000 | | | | | FHLMC | | 0.110%–0.440%, 01/20/16–04/08/16 | | | 2,573,996 | | | | 3.6 | |
| | 800,000 | | | | | Federal National Mortgage Association (FNMA) | | 0.200%, 2/8/2016 | | | 799,831 | | | | 1.1 | |
| | 900,000 | | | | | FNMA | | 0.220%–0.420%, 2/10/2016 | | | 899,624 | | | | 1.3 | |
| | 1,528,000 | | | | | FNMA | | 0.150%–0.640%, 01/25/16–06/08/16 | | | 1,526,664 | | | | 2.1 | |
| | | | | | | | | | | | |
| | | | | | | | | | | 27,131,018 | | | | 38.1 | |
| | | | | | | | | | | | |
| | TREASURY DEBT | | | | | | | | | | |
| | 504,000 | | | | | United States Treasury Bill | | 0.050%–0.088%, 01/07/16 | | | 503,995 | | | | 0.7 | |
| | 715,000 | | | | | United States Treasury Bill | | 0.126%–0.149%, 01/14/16 | | | 714,966 | | | | 1.0 | |
| | 600,000 | | | | | United States Treasury Bill | | 0.103%–0.155%, 02/11/16 | | | 599,929 | | | | 0.9 | |
| | 700,000 | | | | | United States Treasury Bill | | 0.060%–0.103%, 02/18/16 | | | 699,934 | | | | 1.0 | |
| | 645,000 | | | | | United States Treasury Bill | | 0.100%–0.251%, 03/24/16 | | | 644,684 | | | | 0.9 | |
| | 715,000 | | | | | United States Treasury Bill | | 0.111%–0.121%, 04/21/16 | | | 714,745 | | | | 1.0 | |
| | 885,000 | | | | | United States Treasury Bill | | 0.158%–0.230%, 04/28/16 | | | 884,430 | | | | 1.2 | |
| | 3,039,000 | | | | | United States Treasury Bill | | 0.071%–0.476%, 01/21/16–06/09/16 | | | 3,037,134 | | | | 4.3 | |
| | 678,000 | | | | | United States Treasury Note | | 0.375%, 01/15/16 | | | 678,062 | | | | 0.9 | |
| | 550,000 | | | | | United States Treasury Note | | 0.250%, 02/29/16 | | | 550,057 | | | | 0.8 | |
| | 800,000 | | | | | United States Treasury Note | | 0.375%, 03/15/16 | | | 800,275 | | | | 1.1 | |
| | 1,028,000 | | | | | United States Treasury Note | | 0.375%, 03/31/16 | | | 1,028,364 | | | | 1.4 | |
| | 910,000 | | | | | United States Treasury Note | | 0.250%, 04/15/16 | | | 910,193 | | | | 1.3 | |
| | 550,000 | | | | | United States Treasury Note | | 0.625%, 07/15/16 | | | 550,940 | | | | 0.8 | |
| | 1,412,000 | | | | | United States Treasury Note | | 0.250%–0.500%, 01/31/16–06/30/16 | | | 1,412,544 | | | | 2.0 | |
| | | | | | | | | | | | |
| | | | | | | | | | | 13,730,252 | | | | 19.3 | |
| | | | | | | | | | | | |
| | VARIABLE RATE SECURITIES | | | | | | | | | | |
| | 500,000 | | | i | | Federal Farm Credit Bank (FFCB) | | 0.398%, 01/24/17 | | | 499,975 | | | | 0.7 | |
| | 500,000 | | | i | | FFCB | | 0.243%, 03/02/17 | | | 500,002 | | | | 0.7 | |
| | 1,000,000 | | | i | | FFCB | | 0.326%, 06/15/17 | | | 999,822 | | | | 1.4 | |
| | 1,800,000 | | | i | | FFCB | | 0.390%–0.500%, 03/29/16–06/27/17 | | | 1,799,017 | | | | 2.6 | |
| | 1,930,000 | | | i | | FHLMC | | 0.322%–0.407%, 01/12/17–04/26/17 | | | 1,929,287 | | | | 2.7 | |
| | 1,000,000 | | | i | | Federal National Mortgage Association (FNMA) | | 0.437%, 01/26/17 | | | 1,000,065 | | | | 1.4 | |
| | 1,000,000 | | | i | | FNMA | | 0.355%–0.422%, 07/20/17–08/16/17 | | | 999,366 | | | | 1.4 | |
| | 500,000 | | | i | | Wells Fargo Bank NA | | 0.540%, 03/10/16 | | | 500,000 | | | | 0.7 | |
| | | | | | Other | | | | | 799,787 | | | | 1.1 | |
| | | | | | | | | | | | |
| | | | | | | | | | | 9,027,321 | | | | 12.7 | |
| | | | | | | | | | | | |
| | | | | | TOTAL SHORT-TERM INVESTMENTS | | (Cost $70,950,337) | | | 70,950,337 | | | | 99.6 | |
| | | | | | | | | | | | |
| | | | | |
| | | | | | TOTAL PORTFOLIO | | (Cost $70,950,337) | | | 70,950,337 | | | | 99.6 | |
| | | | | | OTHER ASSETS & LIABILITIES, NET | | | | | 287,493 | | | | 0.4 | |
| | | | | | | | | | | | |
| | | | | | NET ASSETS | | | | $ | 71,237,830 | | | | 100.0 | % |
| | | | | | | | | | | | |
| | | | |
| 70 | | 2015 Annual Report § TIAA-CREF Life Funds | | See notes to financial statements |
| | |
| Summary portfolio of investments | | concluded |
Money Market Fund § December 31, 2015
| i | Floating or variable rate security. Coupon rate reflects the rate at period end. |
| y | Security exempt from registration under Section 4(2) of the Securities Act of 1933. Such securities are deemed to be liquid and may be sold in transactions exempt from registration only to dealers in that program or other “accredited investors.” At 12/31/2015, the aggregate value of these securities was $13,150,169 or 19.0% of net assets. |
“Other” securities represent the aggregate value, by category, of securities that are not among the 50 largest holdings and, in total for any issuer, represent 1% or less of net assets.
For ease of presentation, a number of classification categories have been grouped together in the Summary portfolio of investments. Note that the Fund uses more specific categories in following its investment limitations on investment concentrations.
| | | | | | |
| See notes to financial statements | | TIAA-CREF Life Funds § 2015 Annual Report | | | 71 | |
Balanced Fund § December 31, 2015
| | | | | | | | | | | | | | | | |
| Shares | | | | | Security | | | | Value | | | % of net
assets | |
| | | | | | | | | | | | | | | | |
| | TIAA-CREF LIFE FUNDS - 99.9% (a) | |
| | FIXED INCOME - 50.4% | | | | | |
| | 872,183 | | | | | TIAA-CREF Life Bond Fund | | | | $ | 21,412,095 | | | | 50.4 | % |
| | | | | | | | | | | | |
| | TOTAL FIXED INCOME | | | | | 21,412,095 | | | | 50.4 | |
| | | | | | | | | | | | |
| | INTERNATIONAL EQUITY - 9.9% | | | | | | | | | | |
| | 237,074 | | | | | TIAA-CREF Life International Equity Fund | | | | | 4,234,141 | | | | 9.9 | |
| | | | | | | | | | | | |
| | TOTAL INTERNATIONAL EQUITY | | | | | 4,234,141 | | | | 9.9 | |
| | | | | | | | | | | | |
| | U.S. EQUITY - 39.6% | | | | | | | | | | |
| | 136,252 | | | | | TIAA-CREF Life Growth Equity Fund | | | | | 3,933,592 | | | | 9.3 | |
| | 118,352 | | | | | TIAA-CREF Life Growth & Income Fund | | | | | 4,223,974 | | | | 9.9 | |
| | 117,687 | | | | | TIAA-CREF Life Large-Cap Value Fund | | | | | 3,671,834 | | | | 8.6 | |
| | 25,555 | | | | | TIAA-CREF Life Real Estate Securities Fund | | | | | 852,526 | | | | 2.0 | |
| | 27,670 | | | | | TIAA-CREF Life Small-Cap Equity Fund | | | | | 841,169 | | | | 2.0 | |
| | 76,200 | | | | | TIAA-CREF Life Stock Index Fund | | | | | 3,379,474 | | | | 7.8 | |
| | | | | | | | | | | | |
| | TOTAL U.S. EQUITY | | | | | 16,902,569 | | | | 39.6 | |
| | | | | | | | | | | | |
| | | | | | TOTAL TIAA-CREF LIFE FUNDS | | (Cost $44,010,205) | | | 42,548,805 | | | | 99.9 | |
| | | | | | | | | | | | |
| | | | | |
| | | | | | TOTAL PORTFOLIO | | (Cost $44,010,205) | | | 42,548,805 | | | | 99.9 | |
| | | | | | OTHER ASSETS AND LIABILITIES, NET | | | | | 36,103 | | | | 0.1 | |
| | | | | | | | | | | | |
| | | | | | NET ASSETS | | | | $ | 42,584,908 | | | | 100.0 | % |
| | | | | | | | | | |
| (a) | The Fund invests its assets in the affiliated TIAA-CREF Life Funds. |
| | | | |
| 72 | | 2015 Annual Report § TIAA-CREF Life Funds | | See notes to financial statements |
[This page intentionally left blank.]
| | | | |
| TIAA-CREF Life Funds § 2015 Annual Report | | | 73 | |
| | |
| Statements of assets and liabilities | | |
TIAA-CREF Life Funds § December 31, 2015
| | | | | | |
| | | Growth
Equity
Fund | | | |
|
| | |
ASSETS | | | | | | |
Portfolio investments, at value*† | | $ | 82,153,106 | | | |
Cash | | | 68,435 | | | |
Receivable from securities transactions | | | 48,193 | | | |
Receivable from Fund shares sold | | | 15,578 | | | |
Dividends and interest receivable | | | 19,068 | | | |
Due from affiliates | | | 314 | | | |
Other | | | 4,670 | | | |
|
Total assets | | | 82,309,364 | | | |
|
| | |
LIABILITIES | | | | | | |
Management fees payable | | | 3,052 | | | |
Due to affiliates | | | 656 | | | |
Payable for collateral for securities loaned | | | 641,218 | | | |
Payable for securities transactions | | | — | | | |
Payable for Fund shares redeemed | | | 63,412 | | | |
Written options^ | | | 15,090 | | | |
Payable for trustee compensation | | | 4,900 | | | |
Accrued expenses and other payables | | | 12,163 | | | |
|
Total liabilities | | | 740,491 | | | |
|
NET ASSETS | | $ | 81,568,873 | | | |
|
| | |
NET ASSETS CONSIST OF: | | | | | | |
Paid-in-capital | | $ | 59,724,108 | | | |
Undistributed net investment income (loss) | | | 16,366 | | | |
Accumulated net realized gain (loss) on total investments | | | 345,174 | | | |
Net unrealized appreciation (depreciation) on total investments | | | 21,483,225 | | | |
|
NET ASSETS | | $ | 81,568,873 | | | |
|
Outstanding shares of beneficial interest,
unlimited shares authorized ($.0001 par value) | | | 2,825,665 | | | |
|
Net asset value per share | | | $28.87 | | | |
|
| | |
* Includes securities loaned of | | $ | 629,295 | | | |
† Portfolio investments, cost | | $ | 60,659,607 | | | |
^ Written options premiums | | $ | 4,816 | | | |
| | | | |
| 74 | | 2015 Annual Report § TIAA-CREF Life Funds | | See notes to financial statements |
| | | | | | | | | | | | | | | | | | | | |
| | | Growth &
Income
Fund | | | Large-Cap
Value
Fund | | | Real Estate
Securities
Fund | | | Small-Cap
Equity
Fund | | | Social Choice
Equity
Fund | |
| |
| | | | | |
| | | | | | | | | | | | | | | | | | | | |
| | $ | 133,369,870 | | | $ | 64,441,357 | | | $ | 71,773,288 | | | $ | 50,941,020 | | | $ | 47,145,747 | |
| | | 295,182 | | | | 778,158 | | | | 1,209,005 | | | | 113,734 | | | | 285,931 | |
| | | 435,275 | | | | 4,686 | | | | — | | | | 4,551,278 | | | | — | |
| | | 17,426 | | | | 30 | | | | 16,643 | | | | 4,973 | | | | 30 | |
| | | 173,959 | | | | 108,030 | | | | 390,827 | | | | 70,477 | | | | 80,817 | |
| | | 504 | | | | 686 | | | | 374 | | | | 449 | | | | 414 | |
| | | 7,716 | | | | 6,299 | | | | 6,929 | | | | 4,767 | | | | 4,534 | |
| |
| | | 134,299,932 | | | | 65,339,246 | | | | 73,397,066 | | | | 55,686,698 | | | | 47,517,473 | |
| |
| | | | | |
| | | | | | | | | | | | | | | | | | | | |
| | | 5,042 | | | | 2,407 | | | | 3,032 | | | | 1,907 | | | | 592 | |
| | | 1,139 | | | | 801 | | | | 715 | | | | 432 | | | | 527 | |
| | | 1,194,927 | | | | 877,177 | | | | — | | | | 1,424,802 | | | | — | |
| | | 583,607 | | | | 4,496 | | | | 68,782 | | | | 4,595,585 | | | | 692 | |
| | | 224,861 | | | | 378,630 | | | | 85,604 | | | | 248,283 | | | | 89,965 | |
| | | 14,262 | | | | — | | | | — | | | | — | | | | — | |
| | | 8,179 | | | | 6,545 | | | | 7,191 | | | | 4,896 | | | | 4,741 | |
| | | 24,229 | | | | 17,148 | | | | 8,688 | | | | 8,214 | | | | 13,009 | |
| |
| | | 2,056,246 | | | | 1,287,204 | | | | 174,012 | | | | 6,284,119 | | | | 109,526 | |
| |
| | $ | 132,243,686 | | | $ | 64,052,042 | | | $ | 73,223,054 | | | $ | 49,402,579 | | | $ | 47,407,947 | |
| |
| | | | | |
| | | | | | | | | | | | | | | | | | | | |
| | $ | 104,201,832 | | | $ | 59,009,193 | | | $ | 51,332,992 | | | $ | 45,690,495 | | | $ | 29,763,519 | |
| | | 20,846 | | | | (52,868 | ) | | | 777,111 | | | | 75,097 | | | | 9,262 | |
| | | 1,330,559 | | | | (1,958,472 | ) | | | 1,570,151 | | | | (250,368 | ) | | | 1,346,290 | |
| | | 26,690,449 | | | | 7,054,189 | | | | 19,542,800 | | | | 3,887,355 | | | | 16,288,876 | |
| |
| | $ | 132,243,686 | | | $ | 64,052,042 | | | $ | 73,223,054 | | | $ | 49,402,579 | | | $ | 47,407,947 | |
| |
| |
|
3,705,237 |
| | | 2,052,671 | | | | 2,195,094 | | | | 1,625,351 | | | | 1,393,458 | |
| |
| | | $35.69 | | | | $31.20 | | | | $33.36 | | | | $30.40 | | | | $34.02 | |
| |
| | | | | |
| | $ | 1,172,315 | | | $ | 843,733 | | | $ | — | | | $ | 1,367,222 | | | $ | — | |
| | $ | 106,680,776 | | | $ | 57,387,039 | | | $ | 52,230,488 | | | $ | 47,053,665 | | | $ | 30,856,871 | |
| | $ | 16,853 | | | $ | — | | | $ | — | | | $ | — | | | $ | — | |
| | | | | | |
| See notes to financial statements | | TIAA-CREF Life Funds § 2015 Annual Report | | | 75 | |
| | |
| Statements of assets and liabilities | | |
TIAA-CREF Life Funds § December 31, 2015
| | | | | | |
| | | Stock Index
Fund | | | |
|
| | |
ASSETS | | | | | | |
Unaffiliated investments, at value*† | | $ | 341,706,887 | | | |
Affiliated investments, at value‡ | | | — | | | |
Cash | | | 201,283 | | | |
Receivable from securities transactions | | | 526 | | | |
Receivable for delayed delivery securities | | | — | | | |
Receivable from Fund shares sold | | | 31,102 | | | |
Dividends and interest receivable | | | 463,022 | | | |
Due from affiliates | | | 551 | | | |
Other | | | 15,211 | | | |
|
Total assets | | | 342,418,582 | | | |
|
| | |
LIABILITIES | | | | | | |
Management fees payable | | | 1,661 | | | |
Due to affiliates | | | 2,765 | | | |
Payable for collateral for securities loaned | | | 9,417,992 | | | |
Payable for securities transactions | | | — | | | |
Payable for delayed delivery securities | | | — | | | |
Payable for Fund shares redeemed | | | 519,113 | | | |
Payable for variation margin on futures contracts | | | 960 | | | |
Payable for trustee compensation | | | 16,223 | | | |
Accrued expenses and other payables | | | 17,243 | | | |
|
Total liabilities | | | 9,975,957 | | | |
|
NET ASSETS | | $ | 332,442,625 | | | |
|
| | |
NET ASSETS CONSIST OF: | | | | | | |
Paid-in-capital | | $ | 213,484,481 | | | |
Undistributed net investment income (loss) | | | 56,694 | | | |
Accumulated net realized gain (loss) on total investments | | | (6,977,538 | ) | | |
Net unrealized appreciation (depreciation) on total investments | | | 125,878,988 | | | |
|
NET ASSETS | | $ | 332,442,625 | | | |
|
Outstanding shares of beneficial interest,
unlimited shares authorized ($.0001 par value) | | | 7,495,597 | | | |
|
Net asset value per share | | | $44.35 | | | |
|
| | |
* Includes securities loaned of | | $ | 9,105,861 | | | |
† Portfolio investments, cost | | $ | 215,826,529 | | | |
‡ Affiliated investments, cost | | $ | – | | | |
| | | | |
| 76 | | 2015 Annual Report § TIAA-CREF Life Funds | | See notes to financial statements |
| | | | | | | | | | | | | | | | |
| | | International
Equity
Fund | | | Bond
Fund | | | Money
Market
Fund | | | Balanced
Fund | |
| |
| | | | |
| | | | | | | | | | | | | | | | |
| | $ | 92,122,041 | | | $ | 174,170,916 | | | $ | 70,950,337 | | | $ | — | |
| | | — | | | | — | | | | — | | | | 42,548,805 | |
| | | 949,169 | | | | 1,767,279 | | | | 2,364 | | | | 6,301 | |
| | | 349,081 | | | | 6,824 | | | | — | | | | 36,500 | |
| | | — | | | | 2,057,589 | | | | — | | | | — | |
| | | 23,705 | | | | 7,069 | | | | 333,670 | | | | — | |
| | | 57,579 | | | | 1,241,038 | | | | 9,627 | | | | — | |
| | | 612 | | | | 901 | | | | 501 | | | | 484 | |
| | | 7,291 | | | | 10,257 | | | | 1,130 | | | | 576 | |
| |
| | | 93,509,478 | | | | 179,261,873 | | | | 71,297,629 | | | | 42,592,666 | |
| |
| | | | |
| | | | | | | | | | | | | | | | |
| | | 3,824 | | | | 4,408 | | | | 592 | | | | 352 | |
| | | 773 | | | | 2,183 | | | | 548 | | | | 189 | |
| | | 869,519 | | | | — | | | | — | | | | — | |
| | | 646,708 | | | | — | | | | — | | | | — | |
| | | — | | | | 24,875 | | | | — | | | | — | |
| | | 138,471 | | | | 95,039 | | | | 41,704 | | | | 1,587 | |
| | | — | | | | — | | | | — | | | | — | |
| | | 7,611 | | | | 12,575 | | | | 1,350 | | | | 673 | |
| | | 23,101 | | | | 26,836 | | | | 15,605 | | | | 4,957 | |
| |
| | | 1,690,007 | | | | 165,916 | | | | 59,799 | | | | 7,758 | |
| |
| | $ | 91,819,471 | | | $ | 179,095,957 | | | $ | 71,237,830 | | | $ | 42,584,908 | |
| |
| | | | |
| | | | | | | | | | | | | | | | |
| | $ | 125,427,293 | | | $ | 182,496,844 | | | $ | 71,238,787 | | | $ | 43,634,537 | |
| | | 1,187,981 | | | | (13,341 | ) | | | (957 | ) | | | 401 | |
| | | (34,381,994 | ) | | | (512,040 | ) | | | — | | | | 411,370 | |
| | | (413,809 | ) | | | (2,875,506 | ) | | | — | | | | (1,461,400 | ) |
| |
| | $ | 91,819,471 | | | $ | 179,095,957 | | | $ | 71,237,830 | | | $ | 42,584,908 | |
| |
| |
|
5,142,202 |
| | | 7,294,286 | | | | 71,235,502 | | | | 4,209,727 | |
| |
| | | $17.86 | | | | $24.55 | | | | $1.00 | | | | $10.12 | |
| |
| | | | |
| | $ | 826,060 | | | $ | — | | | $ | — | | | $ | — | |
| | $ | 92,531,884 | | | $ | 177,045,591 | | | $ | 70,950,337 | | | $ | — | |
| | $ | — | | | $ | — | | | $ | — | | | $ | 44,010,205 | |
| | | | | | |
| See notes to financial statements | | TIAA-CREF Life Funds § 2015 Annual Report | | | 77 | |
TIAA-CREF Life Funds § For the year ended December 31, 2015
| | | | | | |
| | | Growth Equity Fund | | | |
|
| | |
INVESTMENT INCOME | | | | | | |
Dividends* | | $ | 584,010 | | | |
Income from securities lending | | | 5,149 | | | |
Interest | | | 113 | | | |
|
Total income | | | 589,272 | | | |
|
| | |
EXPENSES | | | | | | |
Management fees | | | 349,012 | | | |
Shareholder servicing | | | 3,134 | | | |
Professional fees | | | 37,566 | | | |
Custody and accounting fees | | | 23,409 | | | |
Shareholder reports | | | 14,600 | | | |
Administrative service fees | | | 3,543 | | | |
Trustee fees and expenses | | | 918 | | | |
Other expenses | | | 10,924 | | | |
|
Total expenses | | | 443,106 | | | |
Less: Expenses reimbursed by the investment adviser | | | (39,725 | ) | | |
|
Net expenses | | | 403,381 | | | |
|
| | |
Net investment income (loss) | | | 185,891 | | | |
|
| | |
NET REALIZED AND UNREALIZED GAIN (LOSS) ON TOTAL INVESTMENTS | | | | | | |
Realized gain (loss): | | | | | | |
Portfolio investments† | | | 1,348,880 | | | |
Futures transactions | | | — | | | |
Purchased options | | | — | | | |
Written options | | | 7,157 | | | |
Swap transactions | | | — | | | |
Foreign currency transactions | | | (1,319 | ) | | |
|
Net realized gain (loss) on total investments | | | 1,354,718 | | | |
|
| | |
Change in unrealized appreciation (depreciation) on: | | | | | | |
Portfolio investments | | | 5,317,440 | | | |
Futures transactions | | | — | | | |
Purchased options | | | — | | | |
Written options | | | (10,274 | ) | | |
Translation of assets (other than portfolio investments) and liabilities denominated in foreign currencies | | | 853 | | | |
|
Net change in unrealized appreciation (depreciation) on total investments and from affiliated investments | | | 5,308,019 | | | |
|
Net realized and unrealized gain (loss) on total investments | | | 6,662,737 | | | |
|
Net increase (decrease) in net assets from operations | | $ | 6,848,628 | | | |
|
| | |
* Net of foreign withholding taxes of | | $ | 2,092 | | | |
† Includes net gain (loss) from securities sold to affiliates of | | $ | (8,270 | ) | | |
| | | | |
| 78 | | 2015 Annual Report § TIAA-CREF Life Funds | | See notes to financial statements |
| | | | | | | | | | | | | | | | | | | | |
| | | Growth & Income Fund | | | Large-Cap Value Fund | | | Real Estate Securities Fund | | | Small-Cap Equity Fund | | | Social Choice Equity Fund | |
| |
| | | | | |
| | | | | | | | | | | | | | | | | | | | |
| | $ | 2,264,380 | | | $ | 1,706,359 | | | $ | 2,968,073 | | | $ | 617,372 | | | $ | 1,273,277 | |
| | | 47,738 | | | | 28,290 | | | | — | | | | 13,668 | | | | — | |
| | | 74 | | | | 59 | | | | 191 | | | | 9 | | | | 30 | |
| |
| | | 2,312,192 | | | | 1,734,708 | | | | 2,968,264 | | | | 631,049 | | | | 1,273,307 | |
| |
| | | | | |
| | | | | | | | | | | | | | | | | | | | |
| | | 678,253 | | | | 441,750 | | | | 552,456 | | | | 240,571 | | | | 96,479 | |
| | | 3,685 | | | | 3,144 | | | | 3,150 | | | | 2,606 | | | | 3,526 | |
| | | 38,127 | | | | 37,627 | | | | 39,220 | | | | 35,235 | | | | 31,735 | |
| | | 49,165 | | | | 43,157 | | | | 14,067 | | | | 22,951 | | | | 12,882 | |
| | | 21,789 | | | | 17,740 | | | | 19,810 | | | | 11,782 | | | | 14,180 | |
| | | 7,051 | | | | 4,699 | | | | 5,290 | | | | 2,322 | | | | 2,998 | |
| | | 1,822 | | | | 1,161 | | | | 1,319 | | | | 501 | | | | 797 | |
| | | 33,400 | | | | 18,710 | | | | 13,564 | | | | 13,603 | | | | 17,831 | |
| |
| | | 833,292 | | | | 567,988 | | | | 648,876 | | | | 329,571 | | | | 180,428 | |
| | | (49,251 | ) | | | (57,084 | ) | | | (19,009 | ) | | | (51,619 | ) | | | (38,774 | ) |
| |
| | | 784,041 | | | | 510,904 | | | | 629,867 | | | | 277,952 | | | | 141,654 | |
| |
| | | | | |
| | | 1,528,151 | | | | 1,223,804 | | | | 2,338,397 | | | | 353,097 | | | | 1,131,653 | |
| |
| | | | | |
| | | | | | | | | | | | | | | | | | | | |
| | | | | | | | | | | | | | | | | | | | |
| | | 9,941,861 | | | | 6,759,700 | | | | 9,057,725 | | | | 3,264,472 | | | | 4,560,195 | |
| | | — | | | | — | | | | — | | | | (102,702 | ) | | | — | |
| | | (16,660 | ) | | | — | | | | — | | | | — | | | | — | |
| | | 151,450 | | | | — | | | | — | | | | — | | | | — | |
| | | — | | | | — | | | | — | | | | (6,671 | ) | | | — | |
| | | (2,284 | ) | | | 904 | | | | — | | | | — | | | | — | |
| |
| | | 10,074,367 | | | | 6,760,604 | | | | 9,057,725 | | | | 3,155,099 | | | | 4,560,195 | |
| |
| | | | | |
| | | | | | | | | | | | | | | | | | | | |
| | | (6,574,444 | ) | | | (11,873,402 | ) | | | (9,217,498 | ) | | | (3,541,559 | ) | | | (7,240,787 | ) |
| | | — | | | | — | | | | — | | | | 1,256 | | | | — | |
| | | (2,522 | ) | | | — | | | | — | | | | — | | | | — | |
| | | 1,890 | | | | — | | | | 1,700 | | | | — | | | | — | |
| | | (356 | ) | | | (16 | ) | | | — | | |
|
— |
| | | — | |
| |
| | | (6,575,432 | ) | | | (11,873,418 | ) | | | (9,215,798 | ) | | | (3,540,303 | ) | | | (7,240,787 | ) |
| |
| | | 3,498,935 | | | | (5,112,814 | ) | | | (158,073 | ) | | | (385,204 | ) | | | (2,680,592 | ) |
| |
| | $ | 5,027,086 | | | $ | (3,889,010 | ) | | $ | 2,180,324 | | | $ | (32,107 | ) | | $ | (1,548,939 | ) |
| |
| | | | | |
| | $ | 12,348 | | | $ | 4,801 | | | $ | — | | | $ | 183 | | | $ | 50 | |
| | $ | 358,945 | | | $ | 91,170 | | | $ | 139,307 | | | $ | 34,117 | | | $ | 11,695 | |
| | | | | | |
| See notes to financial statements | | TIAA-CREF Life Funds § 2015 Annual Report | | | 79 | |
TIAA-CREF Life Funds § For the year ended December 31, 2015
| | | | | | |
| | | Stock Index Fund | | | |
|
| | |
INVESTMENT INCOME | | | | | | |
Dividends from unaffiliated investments* | | $ | 6,530,319 | | | |
Dividends from affiliated investments | | | — | | | |
Income from securities lending | | | 140,528 | | | |
Interest | | | 34 | | | |
|
Total income | | | 6,670,881 | | | |
|
| | |
EXPENSES | | | | | | |
Management fees | | | 200,489 | | | |
Shareholder servicing | | | 3,326 | | | |
Professional fees | | | 48,260 | | | |
Custody and accounting fees | | | 34,564 | | | |
Shareholder reports | | | 40,699 | | | |
Administrative service fees | | | 15,447 | | | |
Trustee fees and expenses | | | 3,933 | | | |
Other expenses | | | 18,094 | | | |
|
Total expenses | | | 364,812 | | | |
Less: Expenses reimbursed by the investment adviser | | | (63,683 | ) | | |
|
Net expenses | | | 301,129 | | | |
|
| | |
Net investment income (loss) | | | 6,369,752 | | | |
|
| | |
NET REALIZED AND UNREALIZED GAIN (LOSS) ON TOTAL INVESTMENTS | | | | | | |
Realized gain (loss): | | | | | | |
Portfolio investments: | | | | | | |
Unaffiliated investments | | | 2,996,809 | | | |
Affiliated investments | | | — | | | |
Futures transactions | | | (48,715 | ) | | |
Foreign currency transactions | | | (2 | ) | | |
Realized gain distributions from affiliated investments | | | — | | | |
|
Net realized gain (loss) on total investments | | | 2,948,092 | | | |
|
| | |
Change in unrealized appreciation (depreciation) on: | | | | | | |
Portfolio investments: | | | | | | |
Unaffiliated investments** | | | (7,896,163 | ) | | |
Affiliated investments | | | — | | | |
Futures transactions | | | (9,413 | ) | | |
Unfunded loan commitment | | | — | | | |
Translation of assets (other than portfolio investments) and liabilities denominated in foreign currencies | | | — | | | |
|
Net change in unrealized appreciation (depreciation) on total investments and from affiliated investments | | | (7,905,576 | ) | | |
|
Net realized and unrealized gain (loss) on total investments | | | (4,957,484 | ) | | |
|
Net increase (decrease) in net assets from operations | | $ | 1,412,268 | | | |
|
| | |
* Net of foreign withholding taxes of | | $ | 2,283 | | | |
** Includes net change in unrealized foreign capital gains taxes of | | $ | — | | | |
| | | | |
| 80 | | 2015 Annual Report § TIAA-CREF Life Funds | | See notes to financial statements |
| | | | | | | | | | | | | | | | |
| | | International
Equity Fund | | | Bond Fund | | | Money
Market
Fund | | | Balanced
Fund | |
| |
| | | | |
| | | | | | | | | | | | | | | | |
| | $ | 1,795,886 | | | $ | — | | | $ | — | | | $ | — | |
| | | — | | | | — | | | | — | | | | 1,007,352 | |
| | | 60,512 | | | | — | | | | — | | | | — | |
| | | 167 | | | | 6,906,743 | | | | 108,541 | | | | 11 | |
| |
| | | 1,856,565 | | | | 6,906,743 | | | | 108,541 | | | | 1,007,363 | |
| |
| | | | |
| | | | | | | | | | | | | | | | |
| | | 491,893 | | | | 664,037 | | | | 70,671 | | | | 47,195 | |
| | | 3,139 | | | | 2,931 | | | | 2,049 | | | | 3,424 | |
| | | 45,144 | | | | 52,740 | | | | 30,049 | | | | 24,341 | |
| | | 57,656 | | | | 85,411 | | | | 38,623 | | | | 12,872 | |
| | | 16,443 | | | | 29,626 | | | | 14,036 | | | | 11,228 | |
| | | 4,333 | | | | 10,836 | | | | 3,265 | | | | 1,301 | |
| | | 1,110 | | | | 2,596 | | | | 815 | | | | 417 | |
| | | 32,358 | | | | 10,125 | | | | 5,310 | | | | 6,401 | |
| |
| | | 652,076 | | | | 858,302 | | | | 164,818 | | | | 107,179 | |
| | | (61,249 | ) | | | (82,305 | ) | | | (58,757 | ) | | | (59,796 | ) |
| |
| | | 590,827 | | | | 775,997 | | | | 106,061 | | | | 47,383 | |
| |
| | | | |
| | | 1,265,738 | | | | 6,130,746 | | | | 2,480 | | | | 959,980 | |
| |
| | | | |
| | | | | | | | | | | | | | | | |
| | | | | | | | | | | | | | | | |
| | | | | | | | | | | | | | | | |
| | | (3,130,854 | ) | | | 993,657 | | | | 39 | | | | 458 | |
| | | — | | | | — | | | | — | | | | (425,966 | ) |
| | | — | | | | — | | | | — | | | | — | |
| | | (58,068 | ) | | | (123,015 | ) | | | — | | | | — | |
| | | — | | | | — | | | | — | | | | 1,097,277 | |
| |
| | | (3,188,922 | ) | | | 870,642 | | | | 39 | | | | 671,769 | |
| |
| | | | |
| | | | | | | | | | | | | | | | |
| | | | | | | | | | | | | | | | |
| | | 671,183 | | | | (5,519,728 | ) | | | — | | | | — | |
| | | — | | | | — | | | | — | | | | (1,297,295 | ) |
| | | — | | | | — | | | | — | | | | — | |
| | | — | | | | (450 | ) | | | — | | | | — | |
| | | (1,561 | ) | | | 985 | | | | — | | | | — | |
| |
| | | 669,622 | | | | (5,519,193 | ) | | | — | | | | (1,297,295 | ) |
| |
| | | (2,519,300 | ) | | | (4,648,551 | ) | | | 39 | | | | (625,526 | ) |
| |
| | $ | (1,253,562 | ) | | $ | 1,482,195 | | | $ | 2,519 | | | $ | 334,454 | |
| |
| | | | |
| | $ | 176,328 | | | $ | — | | | $ | — | | | $ | — | |
| | $ | 7,169 | | | $ | — | | | $ | — | | | $ | — | |
| | | | | | |
| See notes to financial statements | | TIAA-CREF Life Funds § 2015 Annual Report | | | 81 | |
| | |
| Statements of changes in net assets | | |
TIAA-CREF Life Funds § For the period or year ended
| | | | | | | | | | |
| | | Growth Equity Fund | | | |
| | | December 31, 2015 | | | December 31, 2014 | | | |
|
OPERATIONS | | | | | | | | | | |
Net investment income (loss) | | $ | 185,891 | | | $ | 222,897 | | | |
Net realized gain (loss) on total investments | | | 1,354,718 | | | | 5,865,458 | | | |
Net change in unrealized appreciation (depreciation) on total investments | | | 5,308,019 | | | | 944,698 | | | |
|
Net increase (decrease) in net assets from operations | | | 6,848,628 | | | | 7,033,053 | | | |
|
| | | |
DISTRIBUTIONS TO SHAREHOLDERS: | | | | | | | | | | |
From net investment income | | | (178,017 | ) | | | (200,087 | ) | | |
From realized gains | | | (1,922,807 | ) | | | (5,437,368 | ) | | |
|
Total distributions | | | (2,100,824 | ) | | | (5,637,455 | ) | | |
|
| | | |
SHAREHOLDER TRANSACTIONS: | | | | | | | | | | |
Subscriptions | | | 17,989,820 | | | | 11,000,241 | | | |
Reinvestments of distributions | | | 2,100,824 | | | | 5,637,455 | | | |
Redemptions | | | (13,761,681 | ) | | | (9,343,682 | ) | | |
|
Net increase (decrease) from shareholder transactions | | | 6,328,963 | | | | 7,294,014 | | | |
|
| | | |
Net increase (decrease) in net assets | | | 11,076,767 | | | | 8,689,612 | | | |
| | | |
NET ASSETS | | | | | | | | | | |
Beginning of period | | | 70,492,106 | | | | 61,802,494 | | | |
|
End of period | | $ | 81,568,873 | | | $ | 70,492,106 | | | |
|
Undistributed net investment income (loss) included in net assets | | $ | 16,366 | | | $ | 19,849 | | | |
|
| | | |
CHANGE IN FUND SHARES: | | | | | | | | | | |
Shares sold | | | 623,414 | | | | 406,384 | | | |
Shares reinvested | | | 74,077 | | | | 206,803 | | | |
Shares redeemed | | | (479,580 | ) | | | (349,109 | ) | | |
|
Net increase (decrease) from shareholder transactions | | | 217,911 | | | | 264,078 | | | |
|
| | | | |
| 82 | | 2015 Annual Report § TIAA-CREF Life Funds | | See notes to financial statements |
| | | | | | | | | | | | | | | | |
| | | Growth & Income Fund | | | Large-Cap Value Fund | |
| | | December 31, 2015 | | | December 31, 2014 | | | December 31, 2015 | | | December 31, 2014 | |
| |
| | | | | | | | | | | | | | | | |
| | $ | 1,528,151 | | | $ | 1,356,660 | | | $ | 1,223,804 | | | $ | 1,875,803 | |
| | | 10,074,367 | | | | 11,045,076 | | | | 6,760,604 | | | | 4,885,189 | |
| | | (6,575,432 | ) | | | 2,411,922 | | | | (11,873,418 | ) | | | 2,627,383 | |
| |
| | | 5,027,086 | | | | 14,813,658 | | | | (3,889,010 | ) | | | 9,388,375 | |
| |
| | | | |
| | | | | | | | | | | | | | | | |
| | | (1,549,452 | ) | | | (1,393,308 | ) | | | (1,386,039 | ) | | | (1,920,379 | ) |
| | | (9,530,445 | ) | | | (11,582,263 | ) | | | (7,259,512 | ) | | | (6,962,082 | ) |
| |
| | | (11,079,897 | ) | | | (12,975,571 | ) | | | (8,645,551 | ) | | | (8,882,461 | ) |
| |
| | | | |
| | | | | | | | | | | | | | | | |
| | | 13,871,816 | | | | 15,887,789 | | | | 7,137,756 | | | | 12,992,437 | |
| | | 9,949,810 | | | | 12,975,571 | | | | 6,791,729 | | | | 8,882,461 | |
| | | (33,398,382 | ) | | | (14,425,379 | ) | | | (49,986,314 | ) | | | (14,606,261 | ) |
| |
| | | (9,576,756 | ) | | | 14,437,981 | | | | (36,056,829 | ) | | | 7,268,637 | |
| |
| | | | |
| | | (15,629,567 | ) | | | 16,276,068 | | | | (48,591,390 | ) | | | 7,774,551 | |
| | | | |
| | | | | | | | | | | | | | | | |
| | | 147,873,253 | | | | 131,597,185 | | | | 112,643,432 | | | | 104,868,881 | |
| |
| | $ | 132,243,686 | | | $ | 147,873,253 | | | $ | 64,052,042 | | | $ | 112,643,432 | |
| |
| |
$ |
20,846 |
| | $ | 25,062 | | | $ | (52,868 | ) | | $ | (20,508 | ) |
| |
| | | | |
| | | | | | | | | | | | | | | | |
| | | 358,145 | | | | 414,657 | | | | 196,342 | | | | 343,938 | |
| | | 283,713 | | | | 343,997 | | | | 222,388 | | | | 240,978 | |
| | | (876,121 | ) | | | (374,167 | ) | | | (1,426,977 | ) | | | (386,431 | ) |
| |
| | | (234,263 | ) | | | 384,487 | | | | (1,008,247 | ) | | | 198,485 | |
| |
| | | | | | |
| See notes to financial statements | | TIAA-CREF Life Funds § 2015 Annual Report | | | 83 | |
| | |
| Statements of changes in net assets | | |
TIAA-CREF Life Funds § For the period or year ended
| | | | | | | | | | |
| | | Real Estate Securities Fund | | | |
| | | December 31, 2015 | | | December 31, 2014 | | | |
|
OPERATIONS | | | | | | | | | | |
Net investment income (loss) | | $ | 2,338,397 | | | $ | 1,971,623 | | | |
Net realized gain (loss) on total investments | | | 9,057,725 | | | | 4,830,657 | | | |
Net change in unrealized appreciation (depreciation) on total investments | | | (9,215,798 | ) | | | 21,149,002 | | | |
|
Net increase (decrease) in net assets from operations | | | 2,180,324 | | | | 27,951,282 | | | |
|
| | | |
DISTRIBUTIONS TO SHAREHOLDERS: | | | | | | | | | | |
From net investment income | | | (1,920,234 | ) | | | (1,916,352 | ) | | |
From realized gains | | | (7,250,046 | ) | | | (1,766,677 | ) | | |
|
Total distributions | | | (9,170,280 | ) | | | (3,683,029 | ) | | |
|
| | | |
SHAREHOLDER TRANSACTIONS: | | | | | | | | | | |
Subscriptions | | | 9,995,182 | | | | 15,313,674 | | | |
Reinvestments of distributions | | | 9,169,509 | | | | 3,683,029 | | | |
Redemptions | | | (67,604,617 | ) | | | (10,814,277 | ) | | |
|
Net increase (decrease) from shareholder transactions | | | (48,439,926 | ) | | | 8,182,426 | | | |
|
| | | |
Net increase (decrease) in net assets | | | (55,429,882 | ) | | | 32,450,679 | | | |
| | | |
NET ASSETS | | | | | | | | | | |
Beginning of period | | | 128,652,936 | | | | 96,202,257 | | | |
|
End of period | | $ | 73,223,054 | | | $ | 128,652,936 | | | |
|
Undistributed net investment income (loss) included in net assets | | $ | 777,111 | | | $ | 358,946 | | | |
|
| | | |
CHANGE IN FUND SHARES: | | | | | | | | | | |
Shares sold | | | 266,581 | | | | 457,838 | | | |
Shares reinvested | | | 280,757 | | | | 100,465 | | | |
Shares redeemed | | | (1,863,553 | ) | | | (323,501 | ) | | |
|
Net increase (decrease) from shareholder transactions | | | (1,316,215 | ) | | | 234,802 | | | |
|
| | | | |
| 84 | | 2015 Annual Report § TIAA-CREF Life Funds | | See notes to financial statements |
| | | | | | | | | | | | | | | | |
| | | Small-Cap Equity Fund | | | Social Choice Equity Fund | |
| | | December 31, 2015 | | | December 31, 2014 | | | December 31, 2015 | | | December 31, 2014 | |
| |
| | | | | | | | | | | | | | | | |
| | $ | 353,097 | | | $ | 378,897 | | | $ | 1,131,653 | | | $ | 1,144,434 | |
| | | 3,155,099 | | | | 5,783,413 | | | | 4,560,195 | | | | 2,054,766 | |
| | | (3,540,303 | ) | | | (2,728,985 | ) | | | (7,240,787 | ) | | | 3,925,842 | |
| |
| | | (32,107 | ) | | | 3,433,325 | | | | (1,548,939 | ) | | | 7,125,042 | |
| |
| | | | |
| | | | | | | | | | | | | | | | |
| | | (316,132 | ) | | | (369,606 | ) | | | (1,192,522 | ) | | | (1,272,574 | ) |
| | | (4,257,977 | ) | | | (6,738,049 | ) | | | (3,272,663 | ) | | | (1,804,914 | ) |
| |
| | | (4,574,109 | ) | | | (7,107,655 | ) | | | (4,465,185 | ) | | | (3,077,488 | ) |
| |
| | | | |
| | | | | | | | | | | | | | | | |
| | | 8,594,667 | | | | 7,459,772 | | | | 2,794,439 | | | | 5,010,304 | |
| | | 4,574,109 | | | | 7,107,655 | | | | 4,458,272 | | | | 3,077,488 | |
| | | (11,894,290 | ) | | | (9,595,425 | ) | | | (25,797,910 | ) | | | (5,099,000 | ) |
| |
| | | 1,274,486 | | | | 4,972,002 | | | | (18,545,199 | ) | | | 2,988,792 | |
| |
| | | | |
| | | (3,331,730 | ) | | | 1,297,672 | | | | (24,559,323 | ) | | | 7,036,346 | |
| | | | |
| | | | | | | | | | | | | | | | |
| | | 52,734,309 | | | | 51,436,637 | | | | 71,967,270 | | | | 64,930,924 | |
| |
| | $ | 49,402,579 | | | $ | 52,734,309 | | | $ | 47,407,947 | | | $ | 71,967,270 | |
| |
| |
$ |
75,097 |
| | $ | 38,132 | | | $ | 9,262 | | | $ | 72,930 | |
| |
| | | | |
| | | | | | | | | | | | | | | | |
| | | 247,043 | | | | 205,283 | | | | 73,813 | | | | 131,771 | |
| | | 152,369 | | | | 213,187 | | | | 133,842 | | | | 79,133 | |
| | | (344,873 | ) | | | (263,823 | ) | | | (675,199 | ) | | | (133,971 | ) |
| |
| | | 54,539 | | | | 154,647 | | | | (467,544 | ) | | | 76,933 | |
| |
| | | | | | |
| See notes to financial statements | | TIAA-CREF Life Funds § 2015 Annual Report | | | 85 | |
| | |
| Statements of changes in net assets | | |
TIAA-CREF Life Funds § For the period or year ended
| | | | | | | | | | |
| | | Stock Index Fund | | | |
| | | December 31, 2015 | | | December 31, 2014 | | | |
|
OPERATIONS | | | | | | | | | | |
Net investment income (loss) | | $ | 6,369,752 | | | $ | 5,621,788 | | | |
Net realized gain (loss) on total investments | | | 2,948,092 | | | | (2,109,409 | ) | | |
Net change in unrealized appreciation (depreciation) on total investments | | | (7,905,576 | ) | | | 32,426,092 | | | |
|
Net increase (decrease) in net assets from operations | | | 1,412,268 | | | | 35,938,471 | | | |
|
| | | |
DISTRIBUTIONS TO SHAREHOLDERS: | | | | | | | | | | |
From net investment income | | | (6,567,752 | ) | | | (5,819,205 | ) | | |
From realized gains | | | (2,591,490 | ) | | | (781,353 | ) | | |
|
Total distributions | | | (9,159,242 | ) | | | (6,600,558 | ) | | |
|
| | | |
SHAREHOLDER TRANSACTIONS: | | | | | | | | | | |
Subscriptions | | | 37,117,802 | | | | 54,752,142 | | | |
Reinvestments of distributions | | | 9,159,242 | | | | 6,600,558 | | | |
Redemptions | | | (34,815,396 | ) | | | (45,079,185 | ) | | |
|
Net increase (decrease) from shareholder transactions | | | 11,461,648 | | | | 16,273,515 | | | |
|
| | | |
Net increase (decrease) in net assets | | | 3,714,674 | | | | 45,611,428 | | | |
| | | |
NET ASSETS | | | | | | | | | | |
Beginning of period | | | 328,727,951 | | | | 283,116,523 | | | |
|
End of period | | $ | 332,442,625 | | | $ | 328,727,951 | | | |
|
Undistributed net investment income (loss) included in net assets | | $ | 56,694 | | | $ | 231,629 | | | |
|
| | | |
CHANGE IN FUND SHARES: | | | | | | | | | | |
Shares sold | | | 807,408 | | | | 1,254,772 | | | |
Shares reinvested | | | 210,460 | | | | 144,844 | | | |
Shares redeemed | | | (757,927 | ) | | | (1,031,928 | ) | | |
|
Net increase (decrease) from shareholder transactions | | | 259,941 | | | | 367,688 | | | |
|
| | | | |
| 86 | | 2015 Annual Report § TIAA-CREF Life Funds | | See notes to financial statements |
| | | | | | | | | | | | | | | | |
| | | International Equity Fund | | | Bond Fund | |
| | | December 31, 2015 | | | December 31, 2014 | | | December 31, 2015 | | | December 31, 2014 | |
| |
| | | | | | | | | | | | | | | | |
| | $ | 1,265,738 | | | $ | 1,416,405 | | | $ | 6,130,746 | | | $ | 4,983,115 | |
| | | (3,188,922 | ) | | | 3,671,464 | | | | 870,642 | | | | 2,322,328 | |
| | | 669,622 | | | | (12,802,952 | ) | | | (5,519,193 | ) | | | 3,574,387 | |
| |
| | | (1,253,562 | ) | | | (7,715,083 | ) | | | 1,482,195 | | | | 10,879,830 | |
| |
| | | | |
| | | | | | | | | | | | | | | | |
| | | (1,300,403 | ) | | | (1,271,623 | ) | | | (6,056,937 | ) | | | (4,939,268 | ) |
| | | — | | | | — | | | | (1,875,364 | ) | | | (1,903,517 | ) |
| |
| | | (1,300,403 | ) | | | (1,271,623 | ) | | | (7,932,301 | ) | | | (6,842,785 | ) |
| |
| | | | |
| | | | | | | | | | | | | | | | |
| | | 16,102,178 | | | | 19,044,794 | | | | 33,411,926 | | | | 40,090,282 | |
| | | 1,300,403 | | | | 1,271,623 | | | | 7,260,264 | | | | 6,842,785 | |
| | | (13,708,884 | ) | | | (18,755,813 | ) | | | (85,949,408 | ) | | | (9,555,431 | ) |
| |
| | | 3,693,697 | | | | 1,560,604 | | | | (45,277,218 | ) | | | 37,377,636 | |
| |
| | | | |
| | | 1,139,732 | | | | (7,426,102 | ) | | | (51,727,324 | ) | | | 41,414,681 | |
| | | | |
| | | | | | | | | | | | | | | | |
| | | 90,679,739 | | | | 98,105,841 | | | | 230,823,281 | | | | 189,408,600 | |
| |
| | $ | 91,819,471 | | | $ | 90,679,739 | | | $ | 179,095,957 | | | $ | 230,823,281 | |
| |
| |
$ |
1,187,981 |
| | $ | 1,280,713 | | | $ | (13,341 | ) | | $ | 35,865 | |
| |
| | | | |
| | | | | | | | | | | | | | | | |
| | | 830,584 | | | | 957,517 | | | | 1,294,749 | | | | 1,553,339 | |
| | | 73,887 | | | | 68,736 | | | | 295,252 | | | | 268,555 | |
| | | (717,099 | ) | | | (939,770 | ) | | | (3,334,823 | ) | | | (371,789 | ) |
| |
| | | 187,372 | | | | 86,483 | | | | (1,744,822 | ) | | | 1,450,105 | |
| |
| | | | | | |
| See notes to financial statements | | TIAA-CREF Life Funds § 2015 Annual Report | | | 87 | |
| | |
| Statements of changes in net assets | | |
TIAA-CREF Life Funds § For the period or year ended
| | | | | | | | | | |
| | | Money Market Fund | | | |
| | | December 31, 2015 | | | December 31, 2014 | | | |
|
OPERATIONS | | | | | | | | | | |
Net investment income (loss) | | $ | 2,480 | | | $ | — | | | |
Net realized gain (loss) on total investments | | | 39 | | | | 134 | | | |
Net change in unrealized appreciation (depreciation) on total investments | | | — | | | | — | | | |
|
Net increase (decrease) in net assets from operations | | | 2,519 | | | | 134 | | | |
|
| | | |
DISTRIBUTIONS TO SHAREHOLDERS: | | | | | | | | | | |
From net investment income | | | (2,480 | ) | | | — | | | |
From realized gains | | | — | | | | — | | | |
|
Total distributions | | | (2,480 | ) | | | — | | | |
|
| | | |
SHAREHOLDER TRANSACTIONS: | | | | | | | | | | |
Subscriptions | | | 100,890,165 | | | | 94,829,356 | | | |
Reinvestments of distributions | | | 2,480 | | | | — | | | |
Redemptions | | | (98,282,482 | ) | | | (99,608,107 | ) | | |
|
Net increase (decrease) from shareholder transactions | | | 2,610,163 | | | | (4,778,751 | ) | | |
|
| | | |
Net increase (decrease) in net assets | | | 2,610,202 | | | | (4,778,617 | ) | | |
| | | |
NET ASSETS | | | | | | | | | | |
Beginning of period | | | 68,627,628 | | | | 73,406,245 | | | |
|
End of period | | $ | 71,237,830 | | | $ | 68,627,628 | | | |
|
Undistributed net investment income (loss) included in net assets | | $ | (957 | ) | | $ | (996 | ) | | |
|
| | | |
CHANGE IN FUND SHARES: | | | | | | | | | | |
Shares sold | | | 100,890,165 | | | | 94,829,356 | | | |
Shares reinvested | | | 2,480 | | | | — | | | |
Shares redeemed | | | (98,282,482 | ) | | | (99,608,107 | ) | | |
|
Net increase (decrease) from shareholder transactions | | | 2,610,163 | | | | (4,778,751 | ) | | |
|
| | |
* For the period January 31, 2014 to December 31, 2014. | | | | | | | |
| | | | |
| 88 | | 2015 Annual Report § TIAA-CREF Life Funds | | See notes to financial statements |
| | | | | | | | |
| | | Balanced Fund | |
| | | December 31, 2015 | | | December 31, 2014* | |
| |
| | | | | | | | |
| | $ | 959,980 | | | $ | 573,504 | |
| | | 671,769 | | | | 961,302 | |
| | | (1,297,295 | ) | | | (164,105 | ) |
| |
| | | 334,454 | | | | 1,370,701 | |
| |
| | |
| | | | | | | | |
| | | (1,200,226 | ) | | | (897,987 | ) |
| | | (649,845 | ) | | | (6,726 | ) |
| |
| | | (1,850,071 | ) | | | (904,713 | ) |
| |
| | |
| | | | | | | | |
| | | 18,837,821 | | | | 36,989,915 | |
| | | 1,849,613 | | | | 904,713 | |
| | | (13,519,173 | ) | | | (1,428,352 | ) |
| |
| | | 7,168,261 | | | | 36,466,276 | |
| |
| | |
| | | 5,652,644 | | | | 36,932,264 | |
| | |
| | | | | | | | |
| | | 36,932,264 | | | | — | |
| |
| | $ | 42,584,908 | | | $ | 36,932,264 | |
| |
| |
$ |
401 |
| | $ | 298 | |
| |
| | |
| | | | | | | | |
| | | 1,763,317 | | | | 3,583,815 | |
| | | 184,224 | | | | 86,492 | |
| | | (1,272,387 | ) | | | (135,735 | ) |
| |
| | | 675,154 | | | | 3,534,572 | |
| |
| | |
| | | | | | | | |
| | | | | | |
| See notes to financial statements | | TIAA-CREF Life Funds § 2015 Annual Report | | | 89 | |
TIAA-CREF Life Funds § For the period or year ended
| | | | | | | | | | | | | | | | | | | | | | | | | | | | | | |
| | | | | | Selected per share data |
| | | | | | | | | Gain (loss) from investment operations | | | Less distributions from | | | |
| | | For the
period
or year
ended | | | Net asset
value,
beginning
of period | | | Net
investment
income
(loss)a | | | Net realized
and unrealized
gain (loss) on total
investments | | | Total
gain (loss) from
investment
operations | | | Net
investment
income | | | Net
realized
gains | | | |
| | | | |
GROWTH EQUITY FUND | | | | | | | | | | | | | | | |
| | | 12/31/15 | | | $ | 27.03 | | | $ | 0.07 | | | $ | 2.52 | | | $ | 2.59 | | | $ | (0.06 | ) | | $ | (0.69 | ) | | |
| | | 12/31/14 | | | | 26.37 | | | | 0.09 | | | | 2.89 | | | | 2.98 | | | | (0.08 | ) | | | (2.24 | ) | | |
| | | 12/31/13 | | | | 18.89 | | | | 0.07 | | | | 7.47 | | | | 7.54 | | | | (0.06 | ) | | | — | | | |
| | | 12/31/12 | | | | 16.26 | | | | 0.12 | | | | 2.64 | | | | 2.76 | | | | (0.13 | ) | | | — | | | |
| | | | 12/31/11 | | | | 16.01 | | | | 0.05 | | | | 0.25 | | | | 0.30 | | | | (0.05 | ) | | | — | | | |
| | | | |
GROWTH & INCOME FUND | | | | | | | | | | | | | | | |
| | | 12/31/15 | | | | 37.54 | | | | 0.39 | | | | 0.81 | | | | 1.20 | | | | (0.43 | ) | | | (2.62 | ) | | |
| | | 12/31/14 | | | | 37.02 | | | | 0.38 | | | | 3.75 | | | | 4.13 | | | | (0.39 | ) | | | (3.22 | ) | | |
| | | 12/31/13 | | | | 30.37 | | | | 0.40 | | | | 9.98 | | | | 10.38 | | | | (0.39 | ) | | | (3.34 | ) | | |
| | | 12/31/12 | | | | 26.54 | | | | 0.42 | | | | 3.94 | | | | 4.36 | | | | (0.53 | ) | | | — | | | |
| | | | 12/31/11 | | | | 26.07 | | | | 0.29 | | | | 0.47 | | | | 0.76 | | | | (0.29 | ) | | | — | | | |
| | | | |
LARGE-CAP VALUE FUND | | | | | | | | | | | | | | | |
| | | 12/31/15 | | | | 36.80 | | | | 0.46 | | | | (2.38 | ) | | | (1.92 | ) | | | (0.59 | ) | | | (3.09 | ) | | |
| | | 12/31/14 | | | | 36.64 | | | | 0.66 | | | | 2.64 | | | | 3.30 | | | | (0.68 | ) | | | (2.46 | ) | | |
| | | 12/31/13 | | | | 29.39 | | | | 0.54 | | | | 9.49 | | | | 10.03 | | | | (0.69 | ) | | | (2.09 | ) | | |
| | | 12/31/12 | | | | 24.92 | | | | 0.55 | | | | 4.47 | | | | 5.02 | | | | (0.55 | ) | | | — | | | |
| | | | 12/31/11 | | | | 26.95 | | | | 0.41 | | | | (2.03 | ) | | | (1.62 | ) | | | (0.41 | ) | | | — | | | |
| | | | |
REAL ESTATE SECURITIES FUND | | | | | | | | | | | | | | | |
| | | 12/31/15 | | | | 36.64 | | | | 0.79 | �� | | | 0.71 | | | | 1.50 | | | | (1.00 | ) | | | (3.78 | ) | | |
| | | 12/31/14 | | | | 29.36 | | | | 0.59 | | | | 7.77 | | | | 8.36 | | | | (0.56 | ) | | | (0.52 | ) | | |
| | | 12/31/13 | | | | 29.35 | | | | 0.53 | | | | 0.02 | | | | 0.55 | | | | (0.54 | ) | | | — | | | |
| | | 12/31/12 | | | | 24.94 | | | | 0.45 | | | | 4.48 | | | | 4.93 | | | | (0.52 | ) | | | — | | | |
| | | | 12/31/11 | | | | 23.67 | | | | 0.38 | | | | 1.20 | | | | 1.58 | | | | (0.31 | ) | | | — | | | |
| | | | |
SMALL-CAP EQUITY FUND | | | | | | | | | | | | | | | |
| | | 12/31/15 | | | | 33.57 | | | | 0.23 | | | | (0.32 | ) | | | (0.09 | ) | | | (0.21 | ) | | | (2.87 | ) | | |
| | | 12/31/14 | | | | 36.32 | | | | 0.27 | | | | 2.18 | | | | 2.45 | | | | (0.27 | ) | | | (4.93 | ) | | |
| | | 12/31/13 | | | | 30.87 | | | | 0.27 | | | | 11.93 | | | | 12.20 | | | | (0.25 | ) | | | (6.50 | ) | | |
| | | 12/31/12 | | | | 27.38 | | | | 0.32 | | | | 3.52 | | | | 3.84 | | | | (0.35 | ) | | | — | | | |
| | | | 12/31/11 | | | | 28.76 | | | | 0.14 | | | | (1.36 | ) | | | (1.22 | ) | | | (0.16 | ) | | | — | | | |
| | | | |
SOCIAL CHOICE EQUITY FUND | | | | | | | | | | | | | | | |
| | | 12/31/15 | | | | 38.67 | | | | 0.68 | | | | (1.80 | ) | | | (1.12 | ) | | | (0.97 | ) | | | (2.56 | ) | | |
| | | 12/31/14 | | | | 36.39 | | | | 0.64 | | | | 3.36 | | | | 4.00 | | | | (0.71 | ) | | | (1.01 | ) | | |
| | | 12/31/13 | | | | 27.53 | | | | 0.55 | | | | 8.84 | | | | 9.39 | | | | (0.53 | ) | | | — | | | |
| | | 12/31/12 | | | | 24.61 | | | | 0.58 | | | | 2.87 | | | | 3.45 | | | | (0.53 | ) | | | — | | | |
| | | | 12/31/11 | | | | 25.07 | | | | 0.43 | | | | (0.45 | ) | | | (0.02 | ) | | | (0.44 | ) | | | — | | | |
| | | | |
| 90 | | 2015 Annual Report § TIAA-CREF Life Funds | | See notes to financial statements |
| | | | | | | | | | | | | | | | | | | | | | | | | | | | | | | | |
| | | | | | Ratios and supplemental data | |
| | | | | | |
| | | | | | | | | | | | | | | Ratios to average net assets | | | | |
| | | Total
dividends
and
distributions | | | Net asset
value,
end of
period | | | Total
return†† | | | Net assets
at end of
period
(in thousands) | | | Gross
expenses | | | Net
expenses | | | Net
investment
income
(loss) | | | Portfolio
turnover
rate | |
| | | | | | | | |
| | | | | | | | | | | | | | | | | | | | | | | | | | | | | | | | |
| | | $(0.75) | | | $ | 28.87 | | | | 9.67 | % | | $ | 81,569 | | | | 0.57 | % | | | 0.52 | % | | | 0.24 | % | | | 78 | % |
| | | (2.32) | | | | 27.03 | | | | 11.25 | | | | 70,492 | | | | 0.59 | | | | 0.52 | | | | 0.35 | | | | 103 | |
| | | (0.06) | | | | 26.37 | | | | 39.94 | | | | 61,802 | | | | 0.66 | | | | 0.52 | | | | 0.29 | | | | 105 | |
| | | (0.13) | | | | 18.89 | | | | 16.99 | | | | 42,710 | | | | 0.74 | | | | 0.52 | | | | 0.69 | | | | 155 | |
| | | | (0.05) | | | | 16.26 | | | | 1.85 | | | | 40,950 | | | | 0.76 | | | | 0.52 | | | | 0.29 | | | | 136 | |
| | | | | | | | |
| | | | | | | | | | | | | | | | | | | | | | | | | | | | | | | | |
| | | (3.05) | | | | 35.69 | | | | 3.34 | | | | 132,244 | | | | 0.55 | | | | 0.52 | | | | 1.01 | | | | 82 | |
| | | (3.61) | | | | 37.54 | | | | 11.09 | | | | 147,873 | | | | 0.56 | | | | 0.52 | | | | 0.98 | | | | 103 | |
| | | (3.73) | | | | 37.02 | | | | 34.38 | | | | 131,597 | | | | 0.61 | | | | 0.52 | | | | 1.15 | | | | 141 | |
| | | (0.53) | | | | 30.37 | | | | 16.43 | | | | 92,409 | | | | 0.69 | | | | 0.52 | | | | 1.41 | | | | 115 | |
| | | | (0.29) | | | | 26.54 | | | | 2.96 | | | | 76,240 | | | | 0.70 | | | | 0.52 | | | | 1.09 | | | | 109 | |
| | | | | | | | |
| | | | | | | | | | | | | | | | | | | | | | | | | | | | | | | | |
| | | (3.68) | | | | 31.20 | | | | (5.00 | ) | | | 64,052 | | | | 0.58 | | | | 0.52 | | | | 1.25 | | | | 61 | |
| | | (3.14) | | | | 36.80 | | | | 8.98 | | | | 112,643 | | | | 0.56 | | | | 0.52 | | | | 1.75 | | | | 60 | |
| | | (2.78) | | | | 36.64 | | | | 34.31 | | | | 104,869 | | | | 0.60 | | | | 0.52 | | | | 1.54 | | | | 58 | |
| | | (0.55) | | | | 29.39 | | | | 20.14 | | | | 71,691 | | | | 0.70 | | | | 0.52 | | | | 1.99 | | | | 77 | |
| | | | (0.41) | | | | 24.92 | | | | (5.95 | ) | | | 60,441 | | | | 0.71 | | | | 0.52 | | | | 1.56 | | | | 80 | |
| | | | | | | | |
| | | | | | | | | | | | | | | | | | | | | | | | | | | | | | | | |
| | | (4.78) | | | | 33.36 | | | | 4.37 | | | | 73,223 | | | | 0.59 | | | | 0.57 | | | | 2.12 | | | | 30 | |
| | | (1.08) | | | | 36.64 | | | | 28.47 | | | | 128,653 | | | | 0.58 | | | | 0.57 | | | | 1.76 | | | | 45 | |
| | | (0.54) | | | | 29.36 | | | | 1.89 | | | | 96,202 | | | | 0.63 | | | | 0.57 | | | | 1.72 | | | | 58 | |
| | | (0.52) | | | | 29.35 | | | | 19.79 | | | | 96,421 | | | | 0.71 | | | | 0.57 | | | | 1.59 | | | | 65 | |
| | | | (0.31) | | | | 24.94 | | | | 6.73 | | | | 79,535 | | | | 0.71 | | | | 0.57 | | | | 1.53 | | | | 58 | |
| | | | | | | | |
| | | | | | | | | | | | | | | | | | | | | | | | | | | | | | | | |
| | | (3.08) | | | | 30.40 | | | | (0.15 | ) | | | 49,403 | | | | 0.63 | | | | 0.53 | | | | 0.68 | | | | 92 | |
| | | (5.20) | | | | 33.57 | | | | 6.85 | | | | 52,734 | | | | 0.64 | | | | 0.54 | | | | 0.73 | | | | 98 | |
| | | (6.75) | | | | 36.32 | | | | 39.87 | | | | 51,437 | | | | 0.73 | | | | 0.55 | | | | 0.72 | | | | 87 | |
| | | (0.35) | | | | 30.87 | | | | 14.02 | | | | 60,081 | | | | 0.75 | | | | 0.55 | | | | 1.08 | | | | 118 | |
| | | | (0.16) | | | | 27.38 | | | | (4.23 | ) | | | 55,391 | | | | 0.76 | | | | 0.55 | | | | 0.48 | | | | 100 | |
| | | | | | | | |
| | | | | | | | | | | | | | | | | | | | | | | | | | | | | | | | |
| | | (3.53) | | | | 34.02 | | | | (2.70 | ) | | | 47,408 | | | | 0.28 | | | | 0.22 | | | | 1.76 | | | | 9 | |
| | | (1.72) | | | | 38.67 | | | | 10.98 | | | | 71,967 | | | | 0.26 | | | | 0.22 | | | | 1.68 | | | | 10 | |
| | | (0.53) | | | | 36.39 | | | | 34.13 | | | | 64,931 | | | | 0.33 | | | | 0.22 | | | | 1.68 | | | | 11 | |
| | | (0.53) | | | | 27.53 | | | | 14.01 | | | | 43,692 | | | | 0.43 | | | | 0.22 | | | | 2.16 | | | | 16 | |
| | | | (0.44) | | | | 24.61 | | | | (0.05 | ) | | | 37,295 | | | | 0.49 | | | | 0.22 | | | | 1.71 | | | | 18 | |
| | | | | | |
| See notes to financial statements | | TIAA-CREF Life Funds § 2015 Annual Report | | | 91 | |
TIAA-CREF Life Funds § For the period or year ended
| | | | | | | | | | | | | | | | | | | | | | | | | | | | | | |
| | | | | | Selected per share data |
| | | | | | | | | Gain (loss) from investment operations | | | Less distributions from | | | |
| | | For the
period
or year
ended | | | Net asset
value,
beginning
of period | | | Net
investment
income
(loss)a | | | Net realized
and unrealized
gain (loss) on total
investments | | | Total
gain (loss) from
investment
operations | | | Net
investment
income | | | Net
realized
gains | | | |
| | | | |
STOCK INDEX FUND | | | | | | | | | | | | | | | |
| | | 12/31/15 | | | $ | 45.43 | | | $ | 0.88 | | | $ | (0.71 | ) | | $ | 0.17 | | | $ | (0.90 | ) | | $ | (0.35 | ) | | |
| | | 12/31/14 | | | | 41.22 | | | | 0.80 | | | | 4.34 | | | | 5.14 | | | | (0.82 | ) | | | (0.11 | ) | | |
| | | 12/31/13 | | | | 31.48 | | | | 0.70 | | | | 9.81 | | | | 10.51 | | | | (0.71 | ) | | | (0.06 | ) | | |
| | | 12/31/12 | | | | 27.81 | | | | 0.68 | | | | 3.87 | | | | 4.55 | | | | (0.68 | ) | | | (0.20 | ) | | |
| | | | 12/31/11 | | | | 28.09 | | | | 0.53 | | | | (0.28 | ) | | | 0.25 | | | | (0.53 | ) | | | — | | | |
| | | | |
INTERNATIONAL EQUITY FUND | | | | | | | | | | | | | | | |
| | | 12/31/15 | | | | 18.30 | | | | 0.25 | | | | (0.43 | ) | | | (0.18 | ) | | | (0.26 | ) | | | — | | | |
| | | 12/31/14 | | | | 20.15 | | | | 0.29 | | | | (1.88 | ) | | | (1.59 | ) | | | (0.26 | ) | | | — | | | |
| | | 12/31/13 | | | | 16.60 | | | | 0.33 | | | | 3.67 | | | | 4.00 | | | | (0.45 | ) | | | — | | | |
| | | 12/31/12 | | | | 12.85 | | | | 0.32 | | | | 3.70 | | | | 4.02 | | | | (0.27 | ) | | | — | | | |
| | | | 12/31/11 | | | | 17.24 | | | | 0.28 | | | | (4.41 | ) | | | (4.13 | ) | | | (0.26 | ) | | | — | | | |
| | | | |
BOND FUND | | | | | | | | | | | | | | | |
| | | 12/31/15 | | | | 25.54 | | | | 0.72 | | | | (0.57 | ) | | | 0.15 | | | | (0.88 | ) | | | (0.26 | ) | | |
| | | 12/31/14 | | | | 24.96 | | | | 0.61 | | | | 0.76 | | | | 1.37 | | | | (0.57 | ) | | | (0.22 | ) | | |
| | | 12/31/13 | | | | 26.15 | | | | 0.64 | | | | (1.04 | ) | | | (0.40 | ) | | | (0.62 | ) | | | (0.17 | ) | | |
| | | 12/31/12 | | | | 25.60 | | | | 0.77 | | | | 1.00 | | | | 1.77 | | | | (0.74 | ) | | | (0.48 | ) | | |
| | | | 12/31/11 | | | | 24.88 | | | | 0.87 | | | | 0.70 | | | | 1.57 | | | | (0.85 | ) | | | — | | | |
| | | | |
MONEY MARKET FUND | | | | | | | | | | | | | | | |
| | | 12/31/15 | | | | 1.00 | | | | 0.00 | d | | | 0.00 | d | | | 0.00 | d | | | (0.00 | )d | | | — | | | |
| | | 12/31/14 | | | | 1.00 | | | | — | | | | 0.00 | d | | | 0.00 | d | | | — | | | | — | | | |
| | | 12/31/13 | | | | 1.00 | | | | 0.00 | d | | | — | | | | 0.00 | d | | | (0.00 | )d | | | — | | | |
| | | 12/31/12 | | | | 1.00 | | | | 0.00 | d | | | 0.00 | d | | | 0.00 | d | | | (0.00 | )d | | | — | | | |
| | | | 12/31/11 | | | | 1.00 | | | | 0.00 | d | | | 0.00 | d | | | 0.00 | d | | | (0.00 | )d | | | — | | | |
| | | | |
BALANCED FUND | | | | | | | | | | | | | | | |
| | | 12/31/15 | | | | 10.45 | | | | 0.22 | | | | (0.09 | ) | | | 0.13 | | | | (0.30 | ) | | | (0.16 | ) | | |
| | | | 12/31/14 | ‡ | | | 10.00 | | | | 0.29 | | | | 0.43 | | | | 0.72 | | | | (0.27 | ) | | | (0.00 | )d | | |
| a | Based on average shares outstanding. |
| b | The percentages shown for this period are not annualized. |
| c | The percentages shown for this period are annualized. |
| d | Amount represents less than $0.01 per share. |
| e | The Fund’s expenses do not include the expenses of the Underlying Funds. |
| ‡ | The Fund commenced operations on January 31, 2014. |
| †† | Total returns for the shares of the Funds do not include the effect of expenses attributable to the variable annuity or variable life insurance product; if they did, returns for the shares of the Funds would have been lower. |
| | | | |
| 92 | | 2015 Annual Report § TIAA-CREF Life Funds | | See notes to financial statements |
| | | | | | | | | | | | | | | | | | | | | | | | | | | | | | | | |
| | | | | | | | | | | Ratios and supplemental data | |
| | | | | | |
| | | | | | | | | | | | | | | Ratios to average net assets | | | | |
| | | Total
dividends
and
distributions | | | Net asset
value,
end of
period | | | Total
return†† | | | Net assets
at end of
period
(in thousands) | | | Gross
expenses | | | Net
expenses | | | Net
investment
income
(loss) | | | Portfolio
turnover
rate | |
| | | | | | | | |
| | | | | | | | | | | | | | | | | | | | | | | | | | | | | | | | |
| | | $(1.25) | | | $ | 44.35 | | | | 0.43 | % | | $ | 332,443 | | | | 0.11 | % | | | 0.09 | % | | | 1.91 | % | | | 7 | % |
| | | (0.93) | | | | 45.43 | | | | 12.46 | | | | 328,728 | | | | 0.12 | | | | 0.09 | | | | 1.86 | | | | 8 | |
| | | (0.77) | | | | 41.22 | | | | 33.43 | | | | 283,117 | | | | 0.16 | | | | 0.09 | | | | 1.90 | | | | 5 | |
| | | (0.88) | | | | 31.48 | | | | 16.35 | | | | 207,090 | | | | 0.25 | | | | 0.09 | | | | 2.22 | | | | 6 | |
| | | | (0.53) | | | | 27.81 | | | | 0.95 | | | | 180,256 | | | | 0.26 | | | | 0.09 | | | | 1.85 | | | | 6 | |
| | | | | | | | |
| | | | | | | | | | | | | | | | | | | | | | | | | | | | | | | | |
| | | (0.26) | | | | 17.86 | | | | (0.98 | ) | | | 91,819 | | | | 0.66 | | | | 0.60 | | | | 1.29 | | | | 77 | |
| | | (0.26) | | | | 18.30 | | | | (7.90 | ) | | | 90,680 | | | | 0.66 | | | | 0.60 | | | | 1.46 | | | | 91 | |
| | | (0.45) | | | | 20.15 | | | | 24.15 | | | | 98,106 | | | | 0.74 | | | | 0.60 | | | | 1.79 | | | | 133 | |
| | | (0.27) | | | | 16.60 | | | | 31.27 | | | | 77,021 | | | | 0.80 | | | | 0.60 | | | | 2.21 | | | | 111 | |
| | | | (0.26) | | | | 12.85 | | | | (23.88 | ) | | | 81,275 | | | | 0.81 | | | | 0.60 | | | | 1.77 | | | | 108 | |
| | | | | | | | |
| | | | | | | | | | | | | | | | | | | | | | | | | | | | | | | | |
| | | (1.14) | | | | 24.55 | | | | 0.57 | | | | 179,096 | | | | 0.39 | | | | 0.35 | | | | 2.77 | | | | 155 | |
| | | (0.79) | | | | 25.54 | | | | 5.47 | | | | 230,823 | | | | 0.39 | | | | 0.35 | | | | 2.38 | | | | 180 | |
| | | (0.79) | | | | 24.96 | | | | (1.54 | ) | | | 189,409 | | | | 0.44 | | | | 0.35 | | | | 2.46 | | | | 133 | |
| | | (1.22) | | | | 26.15 | | | | 6.91 | | | | 184,563 | | | | 0.53 | | | | 0.35 | | | | 2.92 | | | | 174 | |
| | | | (0.85) | | | | 25.60 | | | | 6.31 | | | | 158,136 | | | | 0.53 | | | | 0.35 | | | | 3.41 | | | | 92 | |
| | | | | | | | |
| | | | | | | | | | | | | | | | | | | | | | | | | | | | | | | | |
| | | (0.00)d | | | | 1.00 | | | | 0.00 | | | | 71,238 | | | | 0.23 | | | | 0.15 | | | | 0.00 | | | | — | |
| | | — | | | | 1.00 | | | | 0.00 | | | | 68,628 | | | | 0.23 | | | | 0.11 | | | | 0.00 | | | | — | |
| | | (0.00)d | | | | 1.00 | | | | 0.01 | | | | 73,406 | | | | 0.27 | | | | 0.13 | | | | 0.00 | | | | — | |
| | | (0.00)d | | | | 1.00 | | | | 0.02 | | | | 62,598 | | | | 0.39 | | | | 0.15 | | | | 0.02 | | | | — | |
| | | | (0.00)d | | | | 1.00 | | | | 0.03 | | | | 59,822 | | | | 0.39 | | | | 0.15 | | | | 0.03 | | | | — | |
| | | | | | | | |
| | | | | | | | | | | | | | | | | | | | | | | | | | | | | | | | |
| | | (0.46) | | | | 10.12 | | | | 1.28 | | | | 42,585 | | | | 0.23 | e | | | 0.10 | e | | | 2.03 | | | | 40 | |
| | | | (0.27) | | | | 10.45 | | | | 7.21 | b | | | 36,932 | | | | 0.49 | c e | | | 0.10 | c e | | | 2.99 | c | | | 59 | b |
| | | | | | |
| See notes to financial statements | | TIAA-CREF Life Funds § 2015 Annual Report | | | 93 | |
| | |
| Notes to financial statements | | |
TIAA-CREF Life Funds
Note 1—organization and significant accounting policies
TIAA-CREF Life Funds (the “Trust”) is a Delaware statutory trust that is registered with the Securities and Exchange Commission (“Commission”) under the Investment Company Act of 1940, as amended (“1940 Act”), as an open-end management investment company. The Trust consists of the following funds: Growth Equity Fund, Growth & Income Fund, Large-Cap Value Fund, Real Estate Securities Fund, Small-Cap Equity Fund, Social Choice Equity Fund, Stock Index Fund, International Equity Fund, Bond Fund, Money Market Fund and Balanced Fund (collectively the “Funds” or individually, the “Fund”). The Funds are currently available only through the purchase of variable annuity contracts or variable life insurance policies issued by TIAA-CREF Life Insurance Company (“TIAA-CREF Life”).
The accompanying financial statements were prepared in accordance with accounting principles generally accepted in the United States of America (“U.S. GAAP”), which may require the use of estimates made by management and the evaluation of subsequent events. Actual results may differ from those estimates. The Funds are investment companies and follow the accounting guidance in the Financial Accounting Standards Board (“FASB”) Accounting Standards Codification 946, Financial Services—Investment Companies. The Net Asset Value (“NAV”) for financial reporting purposes may differ from the NAV for processing transactions. The NAV for financial reporting purposes includes security and shareholder transactions through the date of the report. Total return is computed based on the NAV used for processing transactions. The following is a summary of the significant accounting policies consistently followed by the Funds.
Security valuation: For all Funds (other than the Money Market Fund), investments in securities are recorded at their estimated fair value as described in the valuation of investments note to the financial statements. Investments held by the Money Market Fund are recorded at amortized cost, which approximates fair value. The amortized cost of an instrument is determined by valuing it at its original cost and thereafter accreting or amortizing any discount or premium to its face value at a constant rate until maturity.
Investments and investment income: Securities transactions are accounted for as of the trade date for financial reporting purposes. Interest income is recorded as earned and includes accretion of discounts and amortization of premiums using the effective yield method. Dividend income is recorded on the ex-dividend date. Dividends from affiliated investments are recorded as dividend income, while capital gain distributions, including short-term capital gain distributions, are recorded as gain distributions from affiliated investments on the Statements of Operations. Foreign dividend income is recorded on the ex-dividend date or as soon as possible after the Funds determine the existence of a dividend declaration after exercising reasonable due diligence. Realized gains and losses on securities transactions are based upon the specific identification method. Distributions received on securities that represent a return of capital or capital gains are recorded as a reduction of cost of investments and/or as a realized gain. The Funds estimate the components of distributions received that may be considered return of capital distributions or capital gain distributions.
| | |
| 94 | | 2015 Annual Report § TIAA-CREF Life Funds |
Most expenses of the Trust can be directly attributed to a fund. Expenses that cannot be directly attributed are allocated to each fund in the Trust based upon the average net assets of each fund.
Foreign currency transactions and translation: Assets, including investments, and liabilities denominated in foreign currencies are translated into U.S. dollar values each day using exchange rates obtained from an independent third party. Purchases and sales of securities, income, and expenses are translated into U.S. dollars at the prevailing exchange rate on the date of the transaction. The effect of changes in foreign currency exchange rates on realized and unrealized security gains and losses is reflected as a component of security gains and losses.
Distributions to shareholders: Distributions to shareholders, which are determined in accordance with income tax regulations, are recorded on the ex-dividend date.
Income taxes: Each Fund is treated separately for income tax purposes. The Funds intend to continue to qualify as regulated investment companies under Subchapter M of the Internal Revenue Code (“Code”) and will not be subject to income taxes to the extent that they distribute all taxable income each year and comply with various other Code requirements. The Funds file income tax returns in U.S. federal and applicable state and local jurisdictions. A fund’s federal income tax returns are generally subject to examination for a period of three fiscal years after being filed. State and local tax returns may be subject to examination for an additional period of time depending on the jurisdiction. Management has analyzed the Funds’ tax positions taken for all open federal income tax years and has concluded that no provision for federal income tax is required in the Funds’ financial statements.
The timing and character of income and capital gain distributions are determined in accordance with income tax regulations, which may differ from U.S. GAAP. Reclassifications are made to a Fund’s capital accounts for permanent tax differences to reflect income and gains available for distribution (or available capital loss carryforwards) under income tax regulations.
For the year ended December 31, 2015, permanent book and tax differences resulting primarily from differing treatments for foreign currency transactions, dividend reclassifications, investments in partnerships, gains and losses from the sale of stock in passive foreign investment companies, and the reclassification of short-term capital gain distributions received from underlying funds from realized gain (loss) to ordinary income were identified and reclassified among the components of certain Funds’ net assets. Net investment income and net realized gains (losses), as disclosed on the Statements of Operations, and net assets were not affected by these reclassifications.
Foreign taxes: The Funds may be subject to foreign taxes on income, gains on investments or currency repatriation, a portion of which may be recoverable. The Funds will accrue such taxes and recoveries as applicable, based upon the current interpretation of tax rules and regulations that exist in the markets in which the Funds invest.
Trustee compensation: The Funds pay the members of the Board of Trustees (“Board”), all of whom are independent, certain remuneration for their services,
| | | | |
| TIAA-CREF Life Funds § 2015 Annual Report | | | 95 | |
| | |
| Notes to financial statements | | |
plus travel and other expenses. Trustees may elect to participate in a deferred compensation plan and defer all or a portion of their compensation. In addition, trustees participate in a long-term compensation plan. Amounts deferred are retained by the Funds until paid. Amounts payable to the trustees for compensation are included in the accompanying Statements of Assets and Liabilities. Trustees’ fees, including any deferred and long-term compensation incurred, are reflected in the Statements of Operations.
New accounting pronouncement: In May 2015, the FASB issued Accounting Standards Update No. 2015-07 Fair Value Measurement (Topic 820) Disclosures in Certain Entities That Calculate Net Asset Value per Share (the “ASU”). The ASU removes the requirement to categorize within the fair value hierarchy all investments for which the fair value is measured using the net asset value per share practical expedient. The ASU also removes the requirement to make certain disclosures for investments that are eligible to be measured at fair value using the net asset value per share practical expedient. The ASU is effective for public business entities for fiscal years beginning after December 15, 2015, and for interim periods within those fiscal years. The Funds early adopted the ASU for this annual report. The adoption of the ASU did not have a material impact on the Funds’ financial statements and notes disclosures.
New rule issuance: In July 2014, the Commission issued Final Rule Release No. 33-9616, Money Market Fund Reform; Amendments to Form PF, which amends the rules governing money market funds. The final amendments impose different implementation dates for the changes that certain money market funds will need to make. Management is currently evaluating the implication of these amendments and their impact of the Final Rule to the Fund’s financial statements and related disclosures. On August 11, 2015, The Board of Trustees of the TIAA-CREF Life Funds approved a restructuring of the TIAA-CREF Life Money Market Fund as a “Government” money market instrument, in compliance with the new SEC regulations requiring all money market funds to restructure as retail, institutional or government. The restructuring will be effective by October 14, 2016.
Note 2—valuation of investments
Portfolio investments are valued at fair value utilizing various valuation methods approved by the Board. U.S. GAAP establishes a hierarchy that prioritizes market inputs to valuation methods. The three levels of inputs are:
| • | | Level 1—quoted prices in active markets for identical securities |
| • | | Level 2—other significant observable inputs (including quoted prices for similar securities, interest rates, credit spreads, etc.) |
| • | | Level 3—significant unobservable inputs (including the Funds’ own assumptions in determining the fair value of investments) |
The availability of observable inputs can vary from security to security and is affected by a wide variety of factors, including, for example, the type of security, whether the security is new and not yet established in the marketplace, the liquidity of markets, and other characteristics particular to the security. To the extent that valuation is
| | |
| 96 | | 2015 Annual Report § TIAA-CREF Life Funds |
based on models or inputs that are less observable or unobservable in the market, the determination of fair value requires more judgment. Accordingly, the degree of judgment exercised in determining fair value is greatest for instruments categorized in Level 3. The inputs or methodology used for valuing securities are not necessarily an indication of the risk associated with investing in those securities.
Certain portfolio investments that are measured at fair value using the net asset value per share practical expedient are not categorized within the fair value hierarchy. These investments will be disclosed at their fair value to allow reconciliation back to the Statement of Assets and Liabilities. As of December 31, 2015, no investments were valued utilizing the practical expedient.
A description of the valuation techniques applied to the Funds’ major categories of assets and liabilities measured at fair value follows:
Exchange-traded equity securities, common and preferred stock: Equity securities listed or traded on a national market or exchange are valued based on their sale price on such market or exchange at the close of business on the date of valuation, or at the mean of the closing bid and asked prices if no sale is reported. To the extent these securities are actively traded and valuation adjustments are not applied, they are categorized in Level 1 of the fair value hierarchy. Foreign equity securities are valued at the last sale price or official closing price reported on the exchange where traded and converted to U.S. dollars at the prevailing rates of exchange on the date of valuation. For events affecting the value of foreign securities between the time when the exchange on which they are traded closes and the time when the Funds’ net assets are calculated, such securities will be valued at fair value in accordance with procedures adopted by the Board. Foreign securities are generally categorized in Level 2 of the fair value hierarchy.
Debt securities: Debt securities will generally be valued using prices provided by a pricing service that may employ various indications of value including but not limited to broker-dealer quotations. Certain debt securities, other than money market instruments, are valued based on the most recent bid price or the equivalent quoted yield for such securities (or those of comparable maturity, quality and type). Debt securities are generally categorized in Level 2 of the fair value hierarchy; in instances where prices, yields or any other key inputs are unobservable, they are categorized in Level 3 of the hierarchy.
Short-term investments: Prior to January 2, 2015, short-term investments with maturities of 60 days or less were valued at amortized cost. Short-term investments with maturities in excess of 60 days were valued in the same manner as debt securities. Effective January 2, 2015, all short-term investments are valued in the same manner as debt securities. Short-term investments are generally categorized in Level 2 of the fair value hierarchy.
The Money Market Fund: The Money Market Fund’s portfolio securities are valued on an amortized cost basis. Money Market investments are generally categorized in Level 2 of the fair value hierarchy.
Investments in registered investment companies: These investments are valued at their net asset value on the valuation date. These investments are categorized in Level 1 of the fair value hierarchy.
| | | | |
| TIAA-CREF Life Funds § 2015 Annual Report | | | 97 | |
| | |
| Notes to financial statements | | |
Futures contracts: Stock and bond index futures, which are traded on commodity exchanges, are valued at the last sale price as of the close of such commodity exchanges and are categorized in Level 1 of the fair value hierarchy.
Options: Purchased and written options listed or traded on a national market or exchange are valued at the last sale price as of the close of such exchange or at the mean of the closing bid and asked prices if no sale is reported. To the extent these securities are actively traded and valuation adjustments are not applied, they are categorized in Level 1 of the fair value hierarchy.
Total return swap contract: Total return swaps are marked-to-market daily based upon a price supplied by a pricing service. Total return swaps are generally categorized as Level 2 in the fair value hierarchy.
Unfunded loan commitment: Unfunded loan commitments are marked-to-market daily based upon a price supplied by a pricing service. Unfunded loan commitments are generally categorized as Level 2 in the fair value hierarchy.
Any portfolio security for which market quotations are not readily available or for which the above valuation procedures are deemed not to reflect fair value are valued at fair value, as determined in good faith using procedures approved by the Board. To the extent the inputs are observable and timely, the values would be categorized in Level 2 of the fair value hierarchy; otherwise they would be categorized as Level 3.
Transfers between levels are recognized at the end of the reporting period. For the year ended December 31, 2015, there were no material transfers between levels by the Funds.
As of December 31, 2015, 100% of the value of investments in the Real Estate Securities Fund, the Small-Cap Equity Fund, the Social Choice Equity Fund, and the Balanced Fund were valued based on Level 1 inputs.
As of December 31, 2015, 100% of the value of investments in the Money Market Fund was valued based on level 2 inputs.
The following table summarizes the market value of the Funds’ investments as of December 31, 2015, based on the inputs used to value them:
| | | | | | | | | | | | | | | | |
| Fund | | Level 1 | | | Level 2 | | | Level 3 | | | Total | |
| |
Growth Equity | | | | | | | | | | | | | | | | |
Equity investments: | | | | | | | | | | | | | | | | |
Industrials | | $ | 4,592,583 | | | $ | 1,232,430 | | | $ | — | | | $ | 5,825,013 | |
All other equity investments* | | | 75,686,875 | | | | — | | | | — | | | | 75,686,875 | |
Short-term investments | | | 641,218 | | | | — | | | | — | | | | 641,218 | |
Written options** | | | (15,090 | ) | | | — | | | | — | | | | (15,090 | ) |
| |
Total | | $ | 80,905,586 | | | $ | 1,232,430 | | | $ | — | | | $ | 82,138,016 | |
| |
Growth & Income | | | | | | | | | | | | | | | | |
Equity investments: | | | | | | | | | | | | | | | | |
Consumer discretionary | | $ | 23,695,953 | | | $ | 781,718 | | | $ | — | | | $ | 24,477,671 | |
Consumer staples | | | 11,784,078 | | | | 930,854 | | | | — | | | | 12,714,932 | |
Financials | | | 14,294,570 | | | | 476,217 | | | | — | | | | 14,770,787 | |
Health care | | | 18,097,930 | | | | 2,517,842 | | | | — | | | | 20,615,772 | |
Information technology | | | 30,959,656 | | | | 1,026,590 | | | | — | | | | 31,986,246 | |
Materials | | | 2,879,518 | | | | 476,016 | | | | — | | | | 3,355,534 | |
| |
| | |
| 98 | | 2015 Annual Report § TIAA-CREF Life Funds |
| | | | | | | | | | | | | | | | |
| Fund | | Level 1 | | | Level 2 | | | Level 3 | | | Total | |
| |
| |
Growth & Income—continued | | | | | | | | | | | | | |
All other equity investments* | | $ | 24,253,136$ | | | $ | — | | | $ | — | | | $ | 24,253,136 | |
Short-term investments | | | 1,194,927 | | | | — | | | | — | | | | 1,194,927 | |
Purchased options** | | | 865 | | | | — | | | | — | | | | 865 | |
Written options** | | | (14,262 | ) | | | — | | | | — | | | | (14,262 | ) |
| |
Total | | $ | 127,146,371 | | | $ | 6,209,237 | | | $ | — | | | $ | 133,355,608 | |
| |
Large-Cap Value | | | | | | | | | | | | | | | | |
Equity investments: | | | | | | | | | | | | | | | | |
Consumer discretionary | | $ | 5,556,076 | | | $ | 913,652 | | | $ | — | | | $ | 6,469,728 | |
Financials | | | 17,473,533 | | | | 264,552 | | | | — | | | | 17,738,085 | |
Health care | | | 6,862,474 | | | | 662,795 | | | | — | | | | 7,525,269 | |
Industrials | | | 5,505,554 | | | | — | | | | 160 | | | | 5,505,714 | |
Information technology | | | 8,807,579 | | | | 105,468 | | | | — | | | | 8,913,047 | |
Materials | | | 2,662,727 | | | | 82,435 | | | | — | | | | 2,745,162 | |
All other equity investments* | | | 14,667,175 | | | | — | | | | — | | | | 14,667,175 | |
Short-term investments | | | 877,177 | | | | — | | | | — | | | | 877,177 | |
| |
Total | | $ | 62,412,295 | | | $ | 2,028,902 | | | $ | 160 | | | $ | 64,441,357 | |
| |
Stock Index | | | | | | | | | | | | | | | | |
Equity investments: | | | | | | | | | | | | | | | | |
Health care | | $ | 48,810,733 | | | $ | — | | | $ | 178 | | | $ | 48,810,911 | |
Industrials | | | 35,103,533 | | | | 252,805 | | | | — | | | | 35,356,338 | |
Telecommunication services | | | 7,206,949 | | | | — | | | | 1,789 | | | | 7,208,738 | |
All other equity investments* | | | 240,912,908 | | | | — | | | | — | | | | 240,912,908 | |
Short-term investments | | | 9,417,992 | | | | — | | | | — | | | | 9,417,992 | |
Futures** | | | (1,370 | ) | | | — | | | | — | | | | (1,370 | ) |
| |
Total | | $ | 341,450,745 | | | $ | 252,805 | | | $ | 1,967 | | | $ | 341,705,517 | |
| |
International Equity | | | | | | | | | | | | | | | | |
Equity investments: | | | | | | | | | | | | | | | | |
Asia | | $ | — | | | $ | 20,194,205 | | | $ | — | | | $ | 20,194,205 | |
Australasia | | | — | | | | 309,835 | | | | — | | | | 309,835 | |
Europe | | | — | | | | 67,683,908 | | | | — | | | | 67,683,908 | |
All other equity investments* | | | — | | | | 3,064,574 | | | | — | | | | 3,064,574 | |
Short-term investments | | | 869,519 | | | | — | | | | — | | | | 869,519 | |
| |
Total | | $ | 869,519 | | | $ | 91,252,522 | | | $ | — | | | $ | 92,122,041 | |
| |
Bond | | | | | | | | | | | | | | | | |
Bank loan obligations | | $ | — | | | $ | 2,609,250 | | | $ | — | | | $ | 2,609,250 | |
Corporate bonds | | | — | | | | 84,675,939 | | | | — | | | | 84,675,939 | |
Government bonds | | | — | | | | 50,557,206 | | | | — | | | | 50,557,206 | |
Structured assets | | | — | | | | 36,249,336 | | | | — | | | | 36,249,336 | |
Preferred stocks | | | 79,185 | | | | — | | | | — | | | | 79,185 | |
| |
Total | | $ | 79,185 | | | $ | 174,091,731 | | | $ | — | | | $ | 174,170,916 | |
| |
| * | For detailed categories, see the accompanying Summary portfolio of investments. |
| ** | Derivative instruments, excluding purchased options, are not reflected in the Summary portfolio of investments. |
| | | | |
| TIAA-CREF Life Funds § 2015 Annual Report | | | 99 | |
| | |
| Notes to financial statements | | |
Note 3—derivative instruments
As defined by U.S. GAAP, a derivative is a financial instrument whose value is derived from an underlying security price, foreign exchange rate, interest rate, index of prices or rates, or other variables. Derivatives require little or no initial investment and permit or require net settlement. The Funds value derivatives at fair value.
At December 31, 2015, the following Funds have invested in derivative contracts which are reflected in the Statements of Assets and Liabilities as follows:
| | | | | | | | | | | | | | | | | | |
| | | Asset derivatives | | | | | Liabilities derivatives | |
| Derivative contract | | Location | | | Fair value
amount | | | | | Location | | | Fair value amount | |
| |
Growth Equity Fund | | | | | | | | | | | | | | | | | | |
Equity contracts | | | | | | | | | | | | | Written options | | | $ | (15,090 | ) |
| |
Growth & Income Fund | | | | | | | | | | | | | | | | | | |
Equity contracts | | | Portfolio investments | | | $ | 865 | | | | | | | | | | | |
Equity contracts | | | | | | | | | | | | | Written options | | | | (14,262 | ) |
| |
Stock Index Fund | | | | | | | | | | | | | | | | | | |
Equity contracts | | | | | | | | | | | | | Futures | * | | | (1,370 | ) |
| |
| * | The fair value presented includes cumulative gain (loss) on open futures contracts; however, the value reflected in the accompanying Statements of Assets and Liabilities is only the receivable or payable for variation margin on open futures contracts. |
For the year ended December 31, 2015, the effect of derivative contracts on the Funds’ Statements of Operations was as follows:
| | | | | | | | | | | | |
| Derivative contract | | Location | | | Realized gain (loss) | | | Change in unrealized appreciation (depreciation) | |
| |
Growth Equity Fund | | | | | | | | | | | | |
Equity contracts | | | Written options | | | $ | 7,157 | | | $ | (10,274 | ) |
| |
Growth & Income Fund | | | | | | | | | | | | |
Equity contracts | | | Purchased options | | | | (16,660 | ) | | | (2,522 | ) |
Equity contracts | | | Written options | | | | 151,450 | | | | 1,890 | |
| |
Real Estate Securities Fund | | | | | | | | | | | | |
Equity contracts | | | Written options | | | | — | | | | 1,700 | |
| |
Small-Cap Equity Fund | | | | | | | | | | | | |
Equity contracts | | | Futures transactions | | | | (102,702 | ) | | | 1,256 | |
Equity contracts | | | Swaps transactions | | | | (6,671 | ) | | | — | |
| |
Stock Index Fund | | | | | | | | | | | | |
Equity contracts | | | Futures transactions | | | | (48,715 | ) | | | (9,413 | ) |
| |
Futures contracts: The Funds are subject to equity price risk in the normal course of pursuing their investment objectives. The Funds use futures contracts to manage exposure to the equity markets and for cash management purposes to remain highly invested in these markets while minimizing transaction costs. Buying futures contracts tends to increase exposure to the underlying instrument/index, while selling futures contracts tends to decrease exposure to the underlying instrument/index or hedge other
| | |
| 100 | | 2015 Annual Report § TIAA-CREF Life Funds |
investments. Initial margin deposits are made upon entering into a futures contract, and variation margin receipts or payments are settled daily reflecting changes in the value of the futures contracts. Daily changes in the value of such contracts are reflected in net unrealized gains and losses. Gains or losses are realized upon the expiration or closing of the futures contracts or if the counterparties do not perform in accordance with contractual provisions. With futures, there is minimal counterparty credit risk to the Funds since futures are exchange-traded and the exchange’s clearinghouse, as counterparty to all exchange-traded funds, guarantees the futures against default. During the year ended December 31, 2015, the Small-Cap Equity Fund and the Stock Index Fund had exposure to futures contracts, based on underlying notional values, generally between 0% and 3% of net assets.
At December 31, 2015, the Stock Index Fund held the following open futures contracts:
| | | | | | | | | | | | | | | | |
| Futures | | Number of
contracts | | | Settlement
value | | | Expiration date | | | Unrealized
gain (loss) | |
| |
S&P 500 E Mini Index | | | 1 | | | $ | 101,770 | | | | March 2016 | | | $ | (1,370 | ) |
| |
Options: Certain Funds are subject to equity price risk in the normal course of pursuing their investment objectives. The Funds use options contracts for hedging and cash management purposes and to seek to increase total return. Call and put options give the holder the right, in return for a premium paid, to purchase or sell, respectively, a security at a specified exercise price at any time during the period of the option. Purchased options are included in the summary portfolio of investments, and written options are separately reflected as a liability in the Statements of Assets and Liabilities. Premiums on unexercised, expired options are recorded as realized gains or losses; premiums on exercised options are recorded as an adjustment to the proceeds from the sale or cost of the purchase. The difference between the premium and the amount received or paid in a closing transaction is also treated as a realized gain or loss. Risks related to the use of options include possible illiquidity of the options markets, price movements in underlying security values, and losses that may exceed amounts recognized on the Statements of Assets and Liabilities. During the year ended December 31, 2015, the Growth Equity Fund, the Growth & Income Fund and the Real Estate Securities Fund had exposure to options, based on underlying nominal values, generally between 0% and 2% of net assets.
The Growth & Income Fund had purchased options outstanding as of December 31, 2015:
| | | | | | | | |
| | | Number of
contracts | | | Value | |
| |
Growth & Income Fund | | | | | | | | |
Chesapeake Energy Corp, Call, 1/15/16 at $5 | | | 35 | | | $ | 385 | |
Lions Gate Entertainment Corp, Call, 1/15/16 at $34 | | | 6 | | | | 210 | |
Newell Rubbermaid, Inc, Call, 1/15/16 at $47 | | | 6 | | | | 180 | |
QUALCOMM, Inc, Call, 1/8/16 at $54 | | | 9 | | | | 90 | |
| |
Total | | | 56 | | | $ | 865 | |
| |
| | | | |
| TIAA-CREF Life Funds § 2015 Annual Report | | | 101 | |
| | |
| Notes to financial statements | | |
Written options outstanding as of December 31, 2015 were as follows:
| | | | | | | | |
| | | Number of
contracts | | | Value | |
| |
Growth Equity Fund | | | | | | | | |
Chipotle Mexican Grill, Inc, Put, 1/15/16 at $555 | | | 2 | | | $ | (15,090 | ) |
| |
Total | | | 2 | | | $ | (15,090 | ) |
| |
Growth & Income Fund | | | | | | | | |
Acuity Brands, Inc, Call, 1/15/16 at $260 | | | 3 | | | $ | (348 | ) |
AMC Networks, Inc, Put, 1/15/16 at $70 | | | 6 | | | | (300 | ) |
Anadarko Petroleum Corp, Put, 1/15/16 at $49 | | | 14 | | | | (2,870 | ) |
Cavium, Inc, Put, 1/15/16 at $55 | | | 14 | | | | (112 | ) |
Chipotle Mexican Grill, Inc, Put, 1/8/16 at $500 | | | 4 | | | | (8,800 | ) |
Fitbit, Inc, Put, 1/15/16 at $24 | | | 9 | | | | (180 | ) |
Kansas City Southern Industries, Inc, Put, 1/15/16 at $74 | | | 9 | | | | (900 | ) |
Norwegian Cruise Line Holdings Ltd, Put, 1/15/16 at $55 | | | 6 | | | | (300 | ) |
Sonic Corp, Put, 1/15/16 at $25 | | | 12 | | | | (60 | ) |
Ulta Salon Cosmetics & Fragrance, Inc, Put, 1/15/16 at $175 | | | 4 | | | | (212 | ) |
Universal Health Services, Inc, Put, 1/15/16 at $105 | | | 6 | | | | (180 | ) |
| |
Total | | | 87 | | | $ | (14,262 | ) |
| |
Transactions in written options and related premiums received during the year ended December 31, 2015 were as follows:
| | | | | | | | |
| | | Number of
contracts | | | Premiums | |
| |
Growth Equity Fund | | | | | | | | |
Outstanding at beginning of period | | | — | | | $ | — | |
Written | | | 59 | | | | 23,729 | |
Purchased | | | (8 | ) | | | (5,604 | ) |
Exercised | | | (4 | ) | | | (2,462 | ) |
Expired | | | (45 | ) | | | (10,847 | ) |
| |
Outstanding at end of period | | | 2 | | | $ | 4,816 | |
| |
Growth & Income Fund | |
Outstanding at beginning of period | | | 21 | | | $ | 1,737 | |
Written | | | 7,115 | | | | 738,311 | |
Purchased | | | (2,231 | ) | | | (457,618 | ) |
Exercised | | | (766 | ) | | | (26,531 | ) |
Expired | | | (4,052 | ) | | | (239,046 | ) |
| |
Outstanding at end of period | | | 87 | | | $ | 16,853 | |
| |
Real Estate Securities Fund | | | | | | | | |
Outstanding at beginning of period | | | 100 | | | $ | 9,800 | |
Written | | | — | | | | — | |
Purchased | | | — | | | | — | |
Exercised | | | (100 | ) | | | (9,800 | ) |
Expired | | | — | | | | — | |
| |
Outstanding at end of period | | | — | | | $ | — | |
| |
| | |
| 102 | | 2015 Annual Report § TIAA-CREF Life Funds |
Total return swap contracts: Total return swaps are agreements that provide a Fund with a return based on the performance of an underlying asset, in exchange for fee payments to a counterparty based on a specific rate. To the extent the total return of the reference security or index underlying the total return swap exceeds or falls short of the offsetting interest rate obligation, the Fund will receive a payment or make a payment to the counterparty, respectively. Payments received or made at the end of each measurement period are recorded as a realized gain or loss in the Statements of Operations. The swap is valued daily and any change in the value of the swap is reflected separately as a change in unrealized appreciation (depreciation) in the Statements of Operations. The value of the swap contract is reflected in unrealized appreciation (depreciation) on swap agreements in the Statements of Assets and Liabilities. Total return swaps are exposed to the market risk factor of the specific underlying financial instrument or index. Additional risks to the Fund include the possibility that there is no liquid market for these agreements or that the counterparty may default on its obligation to perform. The Fund’s maximum loss from counterparty risk is the fair value of the contract. The Small-Cap Equity Fund is currently invested in a total return swap contract to gain exposure to certain equity markets. During the period ended December 31, 2015, the Small-Cap Equity Fund’s exposure to total return swaps, based on underlying notional amounts, was generally between 0% and 3% of net assets.
At December 31, 2015, the Small-Cap Equity Fund held the following open total return swap contracts:
| | | | | | | | | | | | | | | | | | | | |
| Counterparty | | Notional amount | | | Termination date | | | Fixed
payments
paid by fund per annum | | | Total return received by fund | | | Unrealized appreciation/ depreciation | |
| |
Goldman Sachs | | $ | 1,254,766 | | | | 4/5/2016 | | | | 0.35% | | |
| Difference between
Russell MicroCap
Index less Russell
2000 Index and
Russell 2500 Index |
| | $ | — | |
| |
Note 4—investment adviser and affiliates
Teachers Advisors, Inc. (“Advisors”), a wholly owned subsidiary of Teachers Insurance and Annuity Association of America (“TIAA”) and a registered investment adviser, provides investment advisory services for the Funds pursuant to an Investment Advisory Agreement between Advisors and the Funds. The Funds have also entered into an Administrative Service Agreement with Advisors under which the Funds pay Advisors for its costs in providing certain administrative and compliance services to the Funds.
Teachers Personal Investors Services, Inc. (“TPIS”), which is a wholly owned indirect subsidiary of TIAA, distributes the Funds’ shares. Under the terms of the distribution agreement, TPIS is not compensated. TPIS does not currently enter into agreements, or otherwise pay, other intermediaries to sell shares of the Funds.
| | | | |
| TIAA-CREF Life Funds § 2015 Annual Report | | | 103 | |
| | |
| Notes to financial statements | | |
Beginning May 29, 2013, Advisors began waiving a portion of the investment management fees for the Money Market Fund. This waiver is voluntary in nature and can be discontinued at any time. The amounts waived are disclosed on the Statements of Operations.
As part of the Advisory Agreement, Advisors has agreed to reimburse each Fund if its total expense ratio (excluding interest, taxes, brokerage and other transactional expenses, acquired fund fees and expenses and extraordinary expenses) exceeds certain percentages. As of December 31, 2015, the investment management fees and maximum expense amounts (after waivers and reimbursements) are equal to the following noted annual percentage of average daily net assets:
| | | | | | | | |
| Fund | | Investment management fee | | | Maximum expense amounts* | |
| |
Growth Equity | | | 0.45% | | | | 0.52% | |
Growth & Income | | | 0.45% | | | | 0.52% | |
Large-Cap Value | | | 0.45% | | | | 0.52% | |
Real Estate Securities | | | 0.50% | | | | 0.57% | |
Small-Cap Equity | | | 0.46% | | | | 0.53% | |
Social Choice Equity | | | 0.15% | | | | 0.22% | |
Stock Index | | | 0.06% | | | | 0.09% | |
International Equity | | | 0.50% | | | | 0.60% | |
Bond | | | 0.30% | | | | 0.35% | |
Money Market | | | 0.10% | | | | 0.15% | |
Balanced | | | 0.10% | | | | 0.10% | |
| |
| * | Maximum expense amounts reflect all expenses excluding interest, taxes, brokerage and other transactional expenses, acquired fund fees and expenses and extraordinary expenses. The expense reimbursement arrangements will continue through at least April 30, 2016. The reimbursement arrangements can only be changed with the approval of the Board of Trustees. |
The Funds may purchase or sell investment securities in transactions with affiliated entities under procedures adopted by the Board, pursuant to the 1940 Act. These transactions are effected at market rates without incurring broker commissions. For the year ended December 31, 2015, the Funds engaged in the following security transactions with affiliated entities:
| | | | | | | | | | | | |
| Fund | | Purchases | | | Sales | | | Realized
gain (loss) | |
| |
Growth Equity | | $ | 321,063 | | | $ | 211,635 | | | $ | (8,270 | ) |
Growth & Income | | | 637,246 | | | | 10,212,261 | | | | 358,945 | |
Large-Cap Value | | | 394,132 | | | | 3,007,672 | | | | 91,170 | |
Real Estate Securities | | | — | | | | 672,655 | | | | 139,307 | |
Small-Cap Equity | | | 68,406 | | | | 338,982 | | | | 34,117 | |
Social Choice Equity | | | 141,835 | | | | 96,391 | | | | 11,695 | |
Stock Index | | | 2,044,332 | | | | — | | | | — | |
International Equity | | | 90,797 | | | | — | | | | — | |
Balanced | | | 217,893 | | | | — | | | | — | |
| |
| | |
| 104 | | 2015 Annual Report § TIAA-CREF Life Funds |
Certain registered separate accounts of TIAA-CREF Life, which is a wholly owned subsidiary of TIAA, have various sub-accounts which invest in the Funds.
Additionally, at the commencement of operations of each Fund, TIAA, an affiliate, invested in each Fund. During the period ended December 31, 2015, TIAA received total proceeds of $16,500,000, $37,872,144, $54,959,658, $20,464,003, $52,500,000 and $10,885,256 from redemptions from the Growth & Income Fund, the Large-Cap Value Fund, the Real Estate Securities Fund, the Social Choice Equity Fund, the Bond Fund and the Balanced Fund, respectively.
The following is the percentage of the Funds’ shares owned by affiliates and the Balanced Fund as of December 31, 2015:
| | | | | | | | | | | | | | | | |
| Underlying Fund | | Investments in funds held by TIAA-CREF Life | | | Investments in funds held by TIAA | | | Investments in funds held by Life Balanced Fund | | | Total | |
| |
Growth Equity | | | 95 | % | | | — | % | | | 5 | % | | | 100 | % |
Growth & Income | | | 92 | | | | 5 | | | | 3 | | | | 100 | |
Large-Cap Value | | | 94 | | | | — | | | | 6 | | | | 100 | |
Real Estate Securities | | | 99 | | | | — | | | | 1 | | | | 100 | |
Small-Cap Equity | | | 98 | | | | — | | | | 2 | | | | 100 | |
Social Choice Equity | | | 100 | | | | — | | | | — | | | | 100 | |
Stock Index | | | 99 | | | | — | | | | 1 | | | | 100 | |
International Equity | | | 95 | | | | — | | | | 5 | | | | 100 | |
Bond | | | 80 | | | | 8 | | | | 12 | | | | 100 | |
Money Market | | | 100 | | | | — | | | | — | | | | 100 | |
Balanced | | | 100 | | | | — | | | | — | | | | 100 | |
| |
Investments in other investment companies advised by Advisors are deemed to be affiliated investments. The Balanced Fund invests its assets in shares of the affiliated TIAA-CREF Life Funds. Information regarding transactions with affiliated companies is as follows:
| | | | | | | | | | | | | | | | | | | | | | | | |
| Issue | | Value at
December 31,
2014 | | | Purchases cost | | | Sales proceeds | | | Realized gain (loss) | | | Dividend income | | | Value at December 31, 2015 | |
| |
TIAA-CREF Life Balanced Fund | | | | | | | | | | | | | | | | | | | | | | | | |
| TIAA-CREF Life Growth Equity | | $ | 3,379,374 | | | $ | 2,011,704 | | | $ | 1,777,529 | | | $ | 135,315 | | | $ | 8,510 | | | $ | 3,933,592 | |
| TIAA-CREF Life Growth & Income | | | 3,705,141 | | | | 2,232,644 | | | | 1,548,714 | | | | 254,103 | | | | 46,214 | | | | 4,223,974 | |
| TIAA-CREF Life Large-Cap Value | | | 3,290,586 | | | | 2,437,558 | | | | 1,461,421 | | | | 208,076 | | | | 61,778 | | | | 3,671,834 | |
| TIAA-CREF Life Real Estate Securities | | | 738,902 | | | | 610,199 | | | | 422,506 | | | | 76,352 | | | | 22,628 | | | | 852,526 | |
| TIAA-CREF Life Small Cap Equity | | | 742,402 | | | | 520,501 | | | | 342,591 | | | | 45,190 | | | | 5,355 | | | | 841,169 | |
| TIAA-CREF Life Stock Index | | | 2,962,068 | | | | 1,715,235 | | | | 1,222,957 | | | | 10,118 | | | | 66,470 | | | | 3,379,474 | |
| TIAA-CREF Life International Equity | | | 3,597,330 | | | | 2,570,975 | | | | 1,762,115 | | | | (159,673 | ) | | | 59,691 | | | | 4,234,141 | |
| TIAA-CREF Life Bond | | | 18,481,266 | | | | 12,196,729 | | | | 8,382,715 | | | | 101,830 | | | | 736,706 | | | | 21,412,095 | |
| |
| | $ | 36,897,069 | | | $ | 24,295,545 | | | $ | 16,920,548 | | | $ | 671,311 | | | $ | 1,007,352 | | | $ | 42,548,805 | |
| |
| | | | |
| TIAA-CREF Life Funds § 2015 Annual Report | | | 105 | |
| | |
| Notes to financial statements | | |
Note 5—investments
Securities lending: Certain Funds may lend their securities to qualified institutional borrowers to earn additional income. A Fund receives collateral (in the form of cash, Treasury securities or other collateral permitted by applicable law) against the loaned securities and maintains collateral in an amount not less than 100% of the market value of loaned securities during the period of the loan; any additional collateral required due to changes in security values is delivered to the Fund the next business day. Cash collateral received by the Fund will generally be invested in high-quality short-term instruments or in one or more funds maintained by the securities lending agent (“Agent”) for the purpose of investing cash collateral. The value of the loaned securities and the liability to return the cash collateral received are reflected in the Statements of Assets and Liabilities. As of December 31, 2015, securities lending transactions are for equity securities, and the resulting loans are continuous, can be recalled at any time, and have no set maturity. Securities lending income recognized by the Funds consists of earnings on invested collateral and lending fees, net of any rebates to the borrower and compensation to the Agent. Such income is reflected separately in the Statements of Operations. In lending its securities, a Fund bears the market risk with respect to the investment of collateral and the risk that the Agent may default on its contractual obligations to the Fund. The Agent bears the risk that the borrower may default on its obligation to return the loaned securities as the Agent is contractually obligated to indemnify the Fund if at the time of a default by a borrower some or all of the loan securities have not been returned.
Securities purchased on a when-issued or delayed-delivery basis: The Funds may purchase securities on a when-issued or delayed-delivery basis. Securities purchased or sold on a when-issued or delayed-delivery basis may be settled a month or more after trade date; interest income is not accrued until settlement date. At the time a Fund enters into such transactions, it is required to have segregated assets with a current value at least equal to the amount of its when-issued or delayed-delivery purchase commitments.
Restricted securities: Restricted securities held by the Funds, if any, may not be sold except in exempt transactions or in a public offering registered under the Securities Act of 1933. The risk of investing in such securities is generally greater than the risk of investing in securities that are widely held and publicly traded.
Unfunded loan commitment: The Bond Fund may enter into loan commitments to fund a portion of delayed-draw term loan facility. The Fund is obligated to fund loan commitments at the borrower’s discretion. The Fund reserves against such contingent obligation by segregating short-term securities or cash. At December 31, 2015, the Fund had no unfunded loan commitments. Unfunded loan commitments are marked-to-market daily and any unrealized appreciation (depreciation) is included in other assets on the Statements of Assets and Liabilities. Interest income and the change in unrealized appreciation (depreciation) are included on the Statements of Operations.
| | |
| 106 | | 2015 Annual Report § TIAA-CREF Life Funds |
Net unrealized appreciation (depreciation): At December 31, 2015, net unrealized appreciation (depreciation) based on the aggregate cost of portfolio investments for federal income tax purposes, consisting of gross unrealized appreciation and gross unrealized depreciation, was as follows:
| | | | | | | | | | | | | | | | |
| Fund | | Tax cost | | | Gross
unrealized
appreciation | | | Gross
unrealized
depreciation | | | Net
unrealized
appreciation
(depreciation) | |
| |
Growth Equity | | $ | 60,771,382 | | | $ | 22,050,039 | | | $ | (668,315 | ) | | $ | 21,381,724 | |
Growth & Income | | | 107,661,161 | | | | 28,924,529 | | | | (3,215,820 | ) | | | 25,708,709 | |
Large-Cap Value | | | 59,290,196 | | | | 9,011,740 | | | | (3,860,579 | ) | | | 5,151,161 | |
Real Estate Securities | | | 52,324,603 | | | | 20,720,411 | | | | (1,271,726 | ) | | | 19,448,685 | |
Small-Cap Equity | | | 47,108,831 | | | | 7,028,734 | | | | (3,196,545 | ) | | | 3,832,189 | |
Social Choice Equity | | | 30,925,763 | | | | 17,597,508 | | | | (1,377,524 | ) | | | 16,219,984 | |
Stock Index | | | 222,620,734 | | | | 133,670,253 | | | | (14,584,100 | ) | | | 119,086,153 | |
International Equity | | | 92,818,658 | | | | 8,177,368 | | | | (8,873,985 | ) | | | (696,617 | ) |
Bond | | | 177,105,157 | | | | 1,226,830 | | | | (4,161,071 | ) | | | (2,934,241 | ) |
Balanced | | | 44,309,098 | | | | 149,327 | | | | (1,909,620 | ) | | | (1,760,293 | ) |
| |
Purchases and sales: Purchases and sales of securities (other than short-term instruments) for all of the Funds for the year ended December 31, 2015 were as follows:
| | | | | | | | | | | | | | | | |
| Fund | | Non-U.S.
government
purchases | | | U.S.
government
purchases | | | Non-U.S.
government
sales | | | U.S.
government
sales | |
| |
Growth Equity | | $ | 63,961,698 | | | $ | — | | | $ | 59,203,982 | | | $ | — | |
Growth & Income | | | 122,327,941 | | | | — | | | | 140,675,661 | | | | — | |
Large-Cap Value | | | 58,492,416 | | | | — | | | | 102,085,714 | | | | — | |
Real Estate Securities | | | 32,345,859 | | | | — | | | | 85,068,477 | | | | — | |
Small-Cap Equity | | | 47,459,287 | | | | — | | | | 47,899,025 | | | | — | |
Social Choice Equity | | | 5,842,477 | | | | — | | | | 27,862,161 | | | | — | |
Stock Index | | | 32,668,417 | | | | — | | | | 21,746,562 | | | | — | |
International Equity | | | 77,379,246 | | | | — | | | | 73,954,657 | | | | — | |
Bond | | | 107,143,541 | | | | 222,652,838 | | | | 120,521,782 | | | | 243,529,494 | |
Balanced | | | 26,096,136 | | | | — | | | | 18,721,598 | | | | — | |
| |
| | | | |
| TIAA-CREF Life Funds § 2015 Annual Report | | | 107 | |
| | |
| Notes to financial statements | | |
Note 6—distributions to shareholders and other tax items
The tax character of distributions paid to shareholders during the years ended December 31, 2015 and December 31, 2014 was as follows:
| | | | | | | | | | | | | | | | | | | | | | | | | | |
| | | 2015 | | | | | 2014 | |
| Fund | | Ordinary
income | | | Long-term
capital
gains | | | Total | | | | | Ordinary
income | | | Long-term
capital
gains | | | Total | |
| |
Growth Equity | | $ | 604,803 | | | $ | 1,496,021 | | | $ | 2,100,824 | | | | | $ | 2,076,259 | | | $ | 3,561,196 | | | $ | 5,637,455 | |
Growth & Income | | | 1,499,232 | | | | 9,580,665 | | | | 11,079,897 | | | | | | 4,851,074 | | | | 8,124,497 | | | | 12,975,571 | |
Large-Cap Value | | | 2,900,767 | | | | 5,744,784 | | | | 8,645,551 | | | | | | 4,468,495 | | | | 4,413,966 | | | | 8,882,461 | |
Real Estate Securities | | | 2,094,029 | | | | 7,076,251 | | | | 9,170,280 | | | | | | 1,916,352 | | | | 1,766,677 | | | | 3,683,029 | |
Small-Cap Equity | | | 892,020 | | | | 3,682,089 | | | | 4,574,109 | | | | | | 1,616,315 | | | | 5,491,340 | | | | 7,107,655 | |
Social Choice Equity | | | 1,192,522 | | | | 3,272,663 | | | | 4,465,185 | | | | | | 1,272,574 | | | | 1,804,914 | | | | 3,077,488 | |
Stock Index | | | 7,001,099 | | | | 2,158,143 | | | | 9,159,242 | | | | | | 6,600,558 | | | | — | | | | 6,600,558 | |
International Equity | | | 1,300,403 | | | | — | | | | 1,300,403 | | | | | | 1,271,623 | | | | — | | | | 1,271,623 | |
Bond | | | 7,218,042 | | | | 714,259 | | | | 7,932,301 | | | | | | 5,720,077 | | | | 1,122,708 | | | | 6,842,785 | |
Money Market | | | 2,480 | | | | — | | | | 2,480 | | | | | | — | | | | — | | | | — | |
Balanced Fund | | | 1,200,386 | | | | 649,685 | | | | 1,850,071 | | | | | | 904,713 | | | | — | | | | 904,713 | |
| |
As of December 31, 2015, the components of accumulated earnings on a tax basis were as follows:
| | | | | | | | | | | | | | | | | | | | | | | | |
| Fund | | Undistributed
(overdistributed)
ordinary income | | | Undistributed
long-term
capital gains | | | Unrealized
appreciation
(depreciation) | | | Capital loss
carryover | | | Late-year
loss
deferrals | | | Total | |
| |
Growth Equity | | $ | 21,036 | | | $ | 576,221 | | | $ | 21,371,452 | | | $ | — | | | $ | (119,274 | ) | | $ | 21,849,435 | |
Growth & Income | | | — | | | | 2,505,621 | | | | 25,710,059 | | | | — | | | | (166,110 | ) | | | 28,049,570 | |
Large-Cap Value | | | (46,934 | ) | | | — | | | | 5,151,027 | | | | — | | | | (54,947 | ) | | | 5,049,146 | |
Real Estate Securities | | | 784,036 | | | | 1,759,715 | | | | 19,448,686 | | | | — | | | | (95,447 | ) | | | 21,896,990 | |
Small-Cap Equity | | | 82,237 | | | | — | | | | 3,832,187 | | | | — | | | | (197,575 | ) | | | 3,716,849 | |
Social Choice Equity | | | — | | | | 1,480,525 | | | | 16,219,984 | | | | — | | | | (51,547 | ) | | | 17,648,962 | |
Stock Index | | | — | | | | 120,652 | | | | 119,086,144 | | | | — | | | | (233,442 | ) | | | 118,973,354 | |
International Equity | | | 1,213,048 | | | | — | | | | (700,579 | ) | | | (33,182,585 | ) | | | (930,415 | ) | | | (33,600,531 | ) |
Bond | | | — | | | | 18,933 | | | | (2,935,072 | ) | | | — | | | | (472,774 | ) | | | (3,388,913 | ) |
Money Market | | | — | | | | — | | | | — | | | | — | | | | — | | | | — | |
Balanced | | | 22,810 | | | | 756,526 | | | | (1,760,293 | ) | | | — | | | | (68,096 | ) | | | (1,049,053 | ) |
| |
The difference between book basis and tax basis net investment income, net realized gains and losses, and unrealized appreciation and depreciation is attributable primarily to the tax deferral of losses on wash sales, the tax deferral of straddle losses, the realization, for tax purposes, of unrealized gains on investments in
| | |
| 108 | | 2015 Annual Report § TIAA-CREF Life Funds |
passive foreign investment companies, and the treatment of short-term gain as ordinary income for tax purposes.
At December 31, 2015, the following Fund had capital loss carryovers, which will expire as follows:
| | | | |
| | | International
Equity | |
| |
12/31/16 | | $ | 8,123,581 | |
12/31/17 | | | 22,163,893 | |
No Expiration Date | | | 2,895,111 | |
| |
Total | | $ | 33,182,585 | |
| |
Under the Regulated Investment Company Modernization Act of 2010, the Funds will be permitted to carry forward capital losses incurred in taxable years beginning after December 22, 2010 for an unlimited period. However, any losses incurred during those future years will be required to be utilized prior to the losses incurred in pre-enactment tax years. As a result of this ordering rule, pre-enactment capital loss carryovers may be more likely to expire unused. Additionally, post-enactment capital losses that are carried forward will retain their character as either short-term or long-term capital losses rather than being considered all short-term as under previous law.
Note 7—line of credit
Each of the Funds, except the Money Market Fund, participates in a $1.5 billion unsecured revolving credit facility that can be used for temporary purposes, including, without limitation, the funding of shareholder redemptions. This facility expired June 2015. A new facility was entered into on June 23, 2015 expiring June 21, 2016. Certain affiliated accounts and mutual funds, each of which is managed by Advisors, or an affiliate of Advisors, also participate in this facility. An annual commitment fee for the credit facility is borne by the participating accounts and mutual funds on a pro rata basis. Interest associated with any borrowing under the facility is charged to the borrowing accounts or mutual funds at a specified rate of interest. The Funds are not liable for borrowings under the facility by other affiliated accounts or mutual funds. For the year ended December 31, 2015, there were no borrowings under this credit facility by the Funds.
Note 8—indemnification
In the normal course of business, each Fund enters into contracts that contain a variety of representations and warranties and that provide general indemnities. A Fund’s maximum exposure under these arrangements is unknown, as this would involve future claims against the Fund that have not yet occurred. Also, under the Funds’ organizational documents, the trustees and officers of the Funds are indemnified against certain liabilities that may arise out of their duties to the Funds. However, based on experience, the Funds expect the risk of loss due to these warranties and indemnities to be unlikely.
| | | | |
| TIAA-CREF Life Funds § 2015 Annual Report | | | 109 | |
| | |
Report of independent registered
public accounting firm | | |
To the Board of Trustees and Shareholders of the TIAA-CREF Life Funds:
In our opinion, the accompanying statements of assets and liabilities, including the summary portfolios of investments, and the related statements of operations and of changes in net assets and the financial highlights present fairly, in all material respects, the financial position of the Growth Equity Fund, Growth & Income Fund, Large-Cap Value Fund, Real Estate Securities Fund, Small-Cap Equity Fund, Social Choice Equity Fund, Stock Index Fund, International Equity Fund, Bond Fund, Money Market Fund, and Balanced Fund (constituting the TIAA-CREF Life Funds, hereafter collectively referred to as the “Funds”) at December 31, 2015, the results of each of their operations, the changes in each of their net assets and the financial highlights for each of the periods presented, in conformity with accounting principles generally accepted in the United States of America. These financial statements and financial highlights (hereafter referred to as “financial statements”) are the responsibility of the Funds’ management. Our responsibility is to express an opinion on these financial statements based on our audits. We conducted our audits of these financial statements in accordance with the standards of the Public Company Accounting Oversight Board (United States). Those standards require that we plan and perform the audit to obtain reasonable assurance about whether the financial statements are free of material misstatement. An audit includes examining, on a test basis, evidence supporting the amounts and disclosures in the financial statements, assessing the accounting principles used and significant estimates made by management, and evaluating the overall financial statement presentation. We believe that our audits, which included confirmation of securities at December 31, 2015 by correspondence with the custodian and brokers and confirmation of underlying investee mutual fund shares by correspondence with the transfer agent of the investee mutual funds, provide a reasonable basis for our opinion.
/s/ PricewaterhouseCoopers LLP
PricewaterhouseCoopers LLP
Baltimore, Maryland
February 19, 2016
| | |
| 110 | | 2015 Annual Report § TIAA-CREF Life Funds |
| | |
| Trustees and officers (unaudited) | | |
TIAA-CREF Life Funds § December 31, 2015
Trustees
| | | | | | | | | | |
Name, address and year of birth (“YOB”) | | Position(s)
held with fund | | Term of office
and length of
time served | | Principal occupation(s) during past 5 years | | Number of
portfolios in
fund
complex
overseen by
trustee | | Other directorship(s) held by trustee |
Forrest Berkley c/o Corporate Secretary 730 Third Avenue New York, NY 10017-3206 YOB: 1954 | | Trustee | | Indefinite term. Trustee since 2006. | | Retired Partner (since 2006), Partner (1990–2005) and Head of Global Product Management (2003–2005), GMO (formerly, Grantham, Mayo, Van Otterloo & Co.) (investment management); and member of asset allocation portfolio management team, GMO (2003–2005). | | 85 | | Director, the Maine Coast Heritage Trust; Investment Committee member, Maine Community Foundation and the Elmina B. Sewall Foundation; and Trustee of the Maine Chapter of the Nature Conservancy. |
Nancy A. Eckl c/o Corporate Secretary 730 Third Avenue New York, NY 10017-3206 YOB: 1962 | | Trustee | | Indefinite term. Trustee since 2007. | | Vice President (1990–2006), American Beacon Advisors, Inc., and Vice President of certain funds advised by American Beacon Advisors, Inc. | | 85 | | Independent Director, The Lazard Funds, Inc., Lazard Retirement Series, Inc., Lazard Global Total Return and Income Fund, Inc. and Lazard World Dividend & Income Fund, Inc. |
Michael A. Forrester c/o Corporate Secretary 730 Third Avenue New York, NY 10017-3206 YOB: 1967 | | Trustee | | Indefinite term. Trustee since 2007. | | Chief Executive Officer (since 2014) and Chief Operating Officer (2007–2014), Copper Rock Capital Partners, LLC; Chief Operating Officer, DDJ Capital Management (2003–2006). | | 85 | | Director of Copper Rock Capital Partners, LLC (investment adviser). |
| | | | |
| TIAA-CREF Life Funds § 2015 Annual Report | | | 111 | |
| | |
| Trustees and officers (unaudited) | | continued |
TIAA-CREF Life Funds § December 31, 2015
Trustees—continued
| | | | | | | | | | |
Name, address and year of birth (“YOB”) | | Position(s)
held with fund | | Term of office
and length of
time served | | Principal occupation(s) during past 5 years | | Number of
portfolios in
fund
complex
overseen by
trustee | | Other directorship(s) held by trustee |
Howell E. Jackson c/o Corporate Secretary 730 Third Avenue New York, NY 10017-3206 YOB: 1954 | | Chairman of the Board and Trustee | | Indefinite term. Trustee since 2005; Chairman for term ending December 31, 2018. Chairman since 2013. | | James S. Reid, Jr. Professor of Law (since 2004), Senior Advisor to the President and Provost (2010–2012), Acting Dean (2009), Vice Dean for Budget (2003–2006) and on the faculty (since 1989) of Harvard Law School. | | 85 | | Director, D2D Fund. |
Thomas J. Kenny c/o Corporate Secretary 730 Third Avenue New York, NY 10017-3206 YOB: 1963 | | Trustee | | Indefinite term. Trustee since 2011. | | Partner (2004–2010) and Managing Director (1999–2004), Goldman Sachs Asset Management. | | 85 | | Director, Aflac Insurance. Inc., Sansum Clinic and cielo24; Investment committee member, Cottage Health System; Member, University of California at Santa Barbara Arts and Lectures Advisory Council; Trustee and Chairman, Crane Country Day School. |
| | |
| 112 | | 2015 Annual Report § TIAA-CREF Life Funds |
| | | | | | | | | | |
Bridget A. Macaskill c/o Corporate Secretary 730 Third Avenue New York, NY 10017-3206 YOB: 1948 | | Trustee | | Indefinite term. Trustee since 2003. | | Chief Executive Officer (since 2010), President (since 2009) and Chief Operating Officer (2009–2010), First Eagle Investment Management, LLC; Principal, BAM Consulting LLC (2003–2009); Independent Consultant for Merrill Lynch (2003–2009). | | 85 | | Director, Arnhold and S. Bleichroeder Holdings; First Eagle Investment Management, LLC; Jupiter Fund Management plc; American Legacy Foundation (Investment Committee); University of Edinburgh (Campaign Board); the North Shore Land Alliance, Prep for Prep; and Close Brothers Group plc. |
James M. Poterba c/o Corporate Secretary 730 Third Avenue New York, NY 10017-3206 YOB: 1958 | | Trustee | | Indefinite term. Trustee since 2006. | | President and Chief Executive Officer, National Bureau of Economic Research (“NBER”) (since 2008); Affiliated Faculty Member of the Finance Group at the Alfred P. Sloan School of Management, Massachusetts Institute of Technology (“MIT”) (since 2014); Mitsui Professor of Economics, MIT (since 1996); Head (2006–2008) and Associate Head (1994–2000 and 2001–2006), Economics Department of MIT; and Program Director, NBER (1990–2008). | | 85 | | Director, The Alfred P. Sloan Foundation and National Bureau of Economic Research; Member, Congressional Budget Office Panel of Economic Advisers. |
Maceo K. Sloan c/o Corporate Secretary 730 Third Avenue New York, NY 10017-3206 YOB: 1949 | | Trustee | | Indefinite term. Trustee since 2001. | | Chairman, President and Chief Executive Officer, Sloan Financial Group, Inc. (since 1991); Chairman and Chief Executive Officer (since 1991) and Chief Investment Officer (1991–2013), NCM Capital Management Group, Inc.; Chairman and Chief Executive Officer (since 2003) and Chief Investment Officer (2003–2013), NCM Capital Advisers Inc.; and Chairman, President and Principal Executive Officer, NCM Capital Investment Trust (2007–2012). | | 85 | | Director, SCANA Corporation (energy holding company). |
| | | | |
| TIAA-CREF Life Funds § 2015 Annual Report | | | 113 | |
| | |
| Trustees and officers (unaudited) | | continued |
TIAA-CREF Life Funds § December 31, 2015
Trustees—concluded
| | | | | | | | | | |
Name, address and year of birth (“YOB”) | | Position(s)
held with fund | | Term of office
and length of
time served | | Principal occupation(s) during past 5 years | | Number of
portfolios in
fund
complex
overseen by
trustee | | Other directorship(s) held by trustee |
Laura T. Starks c/o Corporate Secretary 730 Third Avenue New York, NY 10017-3206 YOB: 1950 | | Trustee | | Indefinite term. Trustee since 2006. | | Associate Dean for Research (since 2011), McCombs School of Business, University of Texas at Austin (“McCombs”), and Director, AIM Investment Center at McCombs (since 2000). Charles E. and Sarah M. Seay Regents Chair in Finance (since 2002) and Professor, University of Texas at Austin (since 1987). Chairman, Department of Finance, University of Texas at Austin (2002–2011). | | 85 | | Member of the Board of Governors of the Investment Company Institute, the Governing Council of Independent Directors Council (an association for mutual fund directors); and Investment Advisory Committee, Employees Retirement System of Texas. |
| | |
| 114 | | 2015 Annual Report § TIAA-CREF Life Funds |
Officers
| | | | | | |
Name, address
and year of birth (“YOB”) | | Position(s)
held with
fund | | Term of office
and length of
time served | | Principal occupation(s) during past 5 years |
Richard S. Biegen TIAA-CREF 730 Third Avenue New York, NY 10017-3206 YOB: 1962 | | Chief Compliance Officer | | One-year term. Vice President and Chief Compliance Officer since 2008. | | Managing Director, Senior Compliance officer of Teachers Insurance and Annuity Association of America (“TIAA”). Chief Compliance Officer of the College Retirement Equities Fund (“CREF”), TIAA Separate Account VA-1, TIAA-CREF Funds, and TIAA-CREF Life Funds (collectively, the “TIAA-CREF Fund Complex”). |
Carol W. Deckbar TIAA-CREF 730 Third Avenue New York, NY 10017-3206 YOB: 1962 | | Executive Vice President | | One-year term. Executive Vice President since 2013. | | Executive Vice President of TIAA, President and Chief Executive Officer of TIAA-CREF Asset Management LLC (“TCAM”) and Executive Vice President of the TIAA-CREF Fund Complex. |
Phillip G. Goff TIAA-CREF 730 Third Avenue New York, NY 10017-3206 YOB: 1963 | | Principal Financial Officer, Principal Accounting Officer and Treasurer | | One-year term. Principal Financial Officer, Principal Accounting Officer and Treasurer since 2007. | | Senior Vice President, Corporate Controller of TIAA. Treasurer of CREF; Chief Financial Officer, Principal Accounting Officer and Treasurer of TIAA Separate Account VA-1; Principal Financial Officer, Principal Accounting Officer and Treasurer of the TIAA-CREF Funds and TIAA-CREF Life Funds. |
Stephen Gruppo TIAA-CREF 730 Third Avenue New York, NY 10017-3206 YOB: 1959 | | Executive Vice President | | One-year term. Executive Vice President since 2009. | | Executive Vice President, Chief Risk Officer of TIAA. Executive Vice President of the TIAA-CREF Fund Complex. |
Robert G. Leary TIAA-CREF 730 Third Avenue New York, NY 10017-3206 YOB: 1961 | | President and Principal Executive Officer since 2013 | | One-year term. President and Principal Executive Officer since 2013. | | Executive Vice President, Asset Management Chief Executive Officer of TIAA, Principal Executive Officer and Executive Vice President of CREF and VA-1. Principal Executive Officer and President of TIAA-CREF Funds and TIAA-CREF Life Funds. Prior to joining TIAA, Mr. Leary served as a Representative, Securities Research, Inc., President and Chief Operating Officer, U.S., ING Americas, Chief Executive Officer, ING Insurance US, and Chairman and Chief Executive Officer, ING Investment Management, Americas. |
| | | | |
| TIAA-CREF Life Funds § 2015 Annual Report | | | 115 | |
| | |
| Trustees and officers (unaudited) | | concluded |
TIAA-CREF Life Funds § December 31, 2015
Officers—concluded
| | | | | | |
Name, address
and year of birth (“YOB”) | | Position(s)
held with
fund | | Term of office
and length of
time served | | Principal occupation(s) during past 5 years |
J. Keith Morgan TIAA-CREF 730 Third Ave. New York, NY 10017-3206 YOB: 1951 | | Executive Vice President | | One-year term. Executive Vice President since 2015. | | Executive Vice President and Chief Legal Officer of TIAA and Executive Vice President of the TIAA-CREF Fund Complex. Prior to joining TIAA, Mr. Morgan served Founder and Chief Executive Officer of Morris Lane Capital LLC (consultant), and as Senior Vice President and General Counsel of General Electric Capital Corporation. |
Ronald R. Pressman TIAA-CREF 730 Third Avenue New York, NY 10017-3206 YOB: 1958 | | Executive Vice President | | One-year term. Executive Vice President since 2012. | | Executive Vice President, Institutional Financial Services Chief Executive Officer of TIAA, and Executive Vice President of the TIAA-CREF Fund Complex. Prior to joining TIAA, Mr. Pressman served as President and Chief Executive Officer of General Electric Capital Real Estate. |
Phillip T. Rollock TIAA-CREF 730 Third Avenue New York, NY 10017-3206 YOB: 1962 | | Senior Managing Director and Corporate Secretary | | One-year term. Senior Managing Director since 2013 and Corporate Secretary since 2012. | | Senior Managing Director, Corporate Secretary of TIAA and the TIAA-CREF Fund Complex. |
Otha T. Spriggs, III TIAA-CREF 730 Third Avenue New York, NY 10017-3206 YOB: 1951 | | Executive Vice President | | One-year term. Executive Vice President since 2012. | | Executive Vice President and Chief Human Resources Officer of TIAA and Executive Vice President of the TIAA-CREF Fund Complex. Prior to joining TIAA, Mr. Spriggs served as Senior Vice President of Human Resources, Boston Scientific; President of Integrated People Solutions; Senior Vice President, Human Resources and various human resources leadership roles, CIGNA Corp. |
| | |
| 116 | | 2015 Annual Report § TIAA-CREF Life Funds |
| | | | | | |
Edward D. Van Dolsen TIAA-CREF 730 Third Avenue New York, NY 10017-3206 YOB: 1958 | | Executive Vice President | | One year term. Executive Vice President since 2006. | | Executive Vice President, Individual Financial Services Chief Executive Officer of TIAA, and Executive Vice President of the TIAA-CREF Fund Complex. |
Constance K. Weaver TIAA-CREF 730 Third Avenue New York, NY 10017-3206 YOB: 1952 | | Executive Vice President | | One-year term. Executive Vice President since 2010. | | Executive Vice President, Chief Marketing Officer of TIAA and Executive Vice President of the TIAA-CREF Fund Complex. Prior to joining TIAA, Ms. Weaver served as Senior Vice President, The Hartford Financial Services Group, Inc. |
Please note that the Funds’ Statement of Additional Information (SAI) includes additional information about the Funds’ trustees and is available, without charge, through our website, tiaa-cref.org, or by calling at 800 223-1200.
| | | | |
| TIAA-CREF Life Funds § 2015 Annual Report | | | 117 | |
| | |
| Important tax information (unaudited) | | |
TIAA-CREF Life Funds
For the fiscal year ended December 31, 2015, the TIAA-CREF Life Funds designate the following distribution amounts (or the maximum amount allowable) as being from Section 1250 gains and net long-term capital gains.
| | | | | | | | | | | | |
| Fund | | Section 1250
gains | | | Long-term
capital gains | | | Total | |
| |
Growth Equity | | $ | — | | | $ | 1,496,021 | | | $ | 1,496,021 | |
Growth & Income | | | — | | | | 9,580,665 | | | | 9,580,665 | |
Large-Cap Value | | | — | | | | 5,744,784 | | | | 5,744,784 | |
Real Estate Securities | | | — | | | | 7,076,251 | | | | 7,076,251 | |
Small-Cap Equity | | | 8,904 | | | | 3,673,185 | | | | 3,682,089 | |
Social Choice Equity | | | — | | | | 3,272,663 | | | | 3,272,663 | |
Stock Index | | | — | | | | 2,158,143 | | | | 2,158,143 | |
International Equity | | | — | | | | — | | | | — | |
Bond | | | — | | | | 714,259 | | | | 714,259 | |
Money Market | | | — | | | | — | | | | — | |
Balanced | | | — | | | | 649,685 | | | | 649,685 | |
| |
For the fiscal year ended December 31, 2015, the TIAA-CREF Life Funds designate the following percentages (or maximum amount allowable) of ordinary income dividends paid as qualifying for the corporate dividends received deduction.
| | | | |
| Fund | | Percentage | |
| |
Growth Equity | | | 39.30 | % |
Growth & Income | | | 99.95 | % |
Large-Cap Value | | | 54.40 | % |
Real Estate Securities | | | 4.00 | % |
Small-Cap Equity | | | 47.76 | % |
Social Choice Equity | | | 98.99 | % |
Stock Index | | | 99.27 | % |
International Equity | | | 0.00 | % |
Balanced | | | 16.86 | % |
| |
The TIAA-CREF Life International Equity Fund received income from foreign sources during the year ended December 31, 2015 of $1,251,562 ($0.24339 per share), and paid taxes to foreign countries during the year ended December 31, 2015 of $74,842 ($0.1455 per share).
| | |
| 118 | | 2015 Annual Report § TIAA-CREF Life Funds |
| | |
Additional information about
index providers (unaudited) | | |
Russell Indexes
The Russell 1000® Index, the Russell 2000® Index, the Russell 3000® Index, the Russell 1000 Value Index, and the Russell 1000 Growth Index are trademarks/service marks of the Russell Investment Group. The Russell Investment Group is the owner of the copyrights relating to the Russell indexes and is the source and owner of the data contained or reflected in the performance values relating to the Russell indexes. The funds are not promoted by, nor in any way affiliated with, the Russell Investment Group. The Russell Investment Group is not responsible for and has not reviewed the funds nor any associated literature or publications and the Russell Investment Group makes no representation or warranty, express or implied, as to their accuracy, or completeness.
Russell reserves the right, at any time and without notice, to alter, amend, terminate or in any way change the Russell Indexes. Russell has no obligation to take the needs of any particular fund or its participants or any other product or person into consideration in determining, composing or calculating any of the Russell Indexes.
Russell’s publication of the Russell Indexes in no way suggests or implies an opinion by Russell as to the attractiveness or appropriateness of investment in any or all securities upon which the Russell Indexes are based. RUSSELL MAKES NO REPRESENTATION, WARRANTY OR GUARANTEE AS TO THE ACCURACY, COMPLETENESS, RELIABILITY OR OTHERWISE OF THE RUSSELL INDEXES OR ANY DATA INCLUDED IN THE RUSSELL INDEXES. RUSSELL MAKES NO REPRESENTATION, WARRANTY OR GUARANTEE REGARDING THE USE OR THE RESULTS OF USE OF THE RUSSELL INDEXES OR ANY DATA INCLUDED THEREIN, OR ANY SECURITIES (OR COMBINATION THEREOF) COMPRISING THE RUSSELL INDEXES. RUSSELL MAKES NO OTHER EXPRESS OR IMPLIED WARRANTY, AND EXPRESSLY DISCLAIMS ANY WARRANTY, OF ANY KIND, INCLUDING WITHOUT LIMITATION, ANY WARRANTY OF MERCHANTABILITY OR FITNESS FOR A PARTICULAR PURPOSE WITH RESPECT TO THE RUSSELL INDEX(ES) OR ANY DATA OR ANY SECURITY (OR COMBINATION THEREOF) INCLUDED THEREIN.
Standard & Poor’s Index
The S&P 500® Index is a trademark of The McGraw-Hill Companies, Inc. and has been licensed for use by the fund. The fund is not sponsored, endorsed, sold or promoted by Standard & Poor’s and Standard & Poor’s makes no representation regarding the advisability of investing in the fund.
MSCI Indexes
The funds are not sponsored, endorsed, sold or promoted by MSCI Inc. (“MSCI”), any of its affiliates, any of its information providers or any other third party involved in, or related to, compiling, computing or creating any MSCI index (collectively, the “MSCI Parties”). The MSCI indexes are the exclusive property of MSCI. MSCI and the MSCI index names are service marks of MSCI or its affiliates and have been licensed for use for certain purposes by Teachers Advisors, Inc. None of the MSCI parties makes any representation or warranty, express or implied, to the issuer or owners of these funds or any other person or entity regarding the advisability of investing in funds generally or in these funds particularly or the ability of any MSCI
| | | | |
| TIAA-CREF Life Funds § 2015 Annual Report | | | 119 | |
| | |
Additional information about
index providers (unaudited) | | concluded |
index to track corresponding stock market performance. MSCI or its affiliates are the licensors of certain trademarks, service marks and trade names and of the MSCI indexes which are determined, composed and calculated by MSCI without regard to these funds or the issuer or owners of these funds or any other person or entity. None of the MSCI parties has any obligation to take the needs of the issuer or owners of these funds or any other person or entity into consideration in determining, composing or calculating the MSCI indexes. None of the MSCI parties is responsible for or has participated in the determination of the timing of, prices at, or quantities of these funds to be issued or in the determination or calculation of the equation by or the consideration into which these funds is redeemable. Further, none of the MSCI parties has any obligation or liability to the issuer or owners of these funds or any other person or entity in connection with the administration, marketing or offering of these funds.
ALTHOUGH MSCI SHALL OBTAIN INFORMATION FOR INCLUSION IN OR FOR USE IN THE CALCULATION OF THE MSCI INDEXES FROM SOURCES THAT MSCI CONSIDERS RELIABLE, NONE OF THE MSCI PARTIES WARRANTS OR GUARANTEES THE ORIGINALITY, ACCURACY AND/OR THE COMPLETENESS OF ANY MSCI INDEX OR ANY DATA INCLUDED THEREIN. NONE OF THE MSCI PARTIES MAKES ANY WARRANTY, EXPRESS OR IMPLIED, AS TO RESULTS TO BE OBTAINED BY THE ISSUER OF THESE FUNDS, OWNERS OF THESE FUNDS, OR ANY OTHER PERSON OR ENTITY, FROM THE USE OF ANY MSCI INDEX OR ANY DATA INCLUDED THEREIN. NONE OF THE MSCI PARTIES SHALL HAVE ANY LIABILITY FOR ANY ERRORS, OMISSIONS OR INTERRUPTIONS OF OR IN CONNECTION WITH ANY MSCI INDEX OR ANY DATA INCLUDED THEREIN. FURTHER, NONE OF THE MSCI PARTIES MAKES ANY EXPRESS OR IMPLIED WARRANTIES OF ANY KIND, AND THE MSCI PARTIES HEREBY EXPRESSLY DISCLAIM ALL WARRANTIES OF MERCHANTABILITY AND FITNESS FOR A PARTICULAR PURPOSE, WITH RESPECT TO EACH MSCI INDEX AND ANY DATA INCLUDED THEREIN. WITHOUT LIMITING ANY OF THE FOREGOING, IN NO EVENT SHALL ANY OF THE MSCI PARTIES HAVE ANY LIABILITY FOR ANY DIRECT, INDIRECT, SPECIAL, PUNITIVE, CONSEQUENTIAL OR ANY OTHER DAMAGES (INCLUDING LOST PROFITS) EVEN IF NOTIFIED OF THE POSSIBILITY OF SUCH DAMAGES.
No purchaser, seller or holder of these securities, products or funds, or any other person or entity, should use or refer to any MSCI trade name, trademark or service mark to sponsor, endorse, market or promote these securities without first contacting MSCI to determine whether MSCI’s permission is required. Under no circumstances may any person or entity claim any affiliation with MSCI without the prior written permission of MSCI.
| | |
| 120 | | 2015 Annual Report § TIAA-CREF Life Funds |
How to reach us
TIAA-CREF website
Account performance, personal account information and transactions, product descriptions, and information about investment choices and income options
tiaa-cref.org
24 hours a day, 7 days a week
Automated telephone service
Check account performance and accumulation balances, change allocations, transfer funds and verify credited premiums
800 842-2252
24 hours a day, 7 days a week
National contact center
Retirement saving and planning, income options and payments, beneficiary services and tax reporting
800 842-2252
8 a.m. to 10 p.m. (ET), Monday–Friday
9 a.m. to 6 p.m. (ET), Saturday
Planning and service center
TIAA-CREF mutual funds
800 223-1200
8 a.m. to 10 p.m. (ET), Monday–Friday
Insurance planning center
After-tax annuities and life insurance
For an existing policy or contract
800 223-1200
To apply for a new policy or contract
877 825-0411
8 a.m. to 8 p.m. (ET), Monday–Friday
For the hearing– or speech–impaired
800 842-2755
8 a.m. to 10 p.m. (ET), Monday–Friday
9 a.m. to 6 p.m. (ET), Saturday
TIAA–CREF brokerage services
Self-directed brokerage accounts for investing in stocks, bonds and mutual funds
800 927-3059
8 a.m. to 7 p.m. (ET), Monday–Friday
TIAA–CREF Trust Company, FSB
Asset management, trust administration, estate planning, planned giving and endowment management
888 842-9001
9 a.m. to 6 p.m. (ET), Monday–Friday
Advisor services
888 842-0318
8 a.m. to 7:30 p.m. (ET), Monday–Friday
You should carefully consider the investment objectives, risks, charges and expenses of any fund before investing. For a prospectus that contains this and other important information, please visit tiaa-cref.org, or call 800 223-1200. Please read the prospectus carefully before investing. Investment, insurance and annuity products are not FDIC insured, are not bank guaranteed, are not bank deposits, are not insured by any federal government agency, are not a condition
to any banking service or activity, and may lose value. TIAA-CREF Brokerage Services is a division of TIAA-CREF Individual & Institutional Services, LLC. TIAA-CREF Individual & Institutional Services, LLC, and Teachers Personal Investors Services, Inc., members FINRA, distribute securities products. Insurance and annuity products are issued by TIAA-CREF Life Insurance Company, New York, NY. TIAA-CREF Trust Company, FSB provides trust services.
©2016 Teachers Insurance and Annuity Association of America—College Retirement Equities Fund (TIAA-CREF), 730 Third Avenue, New York, NY 10017-3206.
| | |
 | | 730 Third Avenue New York, NY 10017-3206 |

| | |
 | | Printed on paper containing recycled fiber |
| | |
 | | We’re fond of paper … in its original form. |
| | Switch to eDelivery at |
| | www.tiaa–cref.org/eDelivery |
C28647
A10847 (2/16)
| | |
| | 730 Third Avenue New York, NY 10017-3206 |
C28647
A10847 (2/16)
Item 2. Code of Ethics.
2(a) The Board of Trustees of the TIAA-CREF Life Funds (the “Registrant”) has adopted a code of ethics for senior financial officers, including the Registrant’s principal executive officer, principal financial officer, principal accounting officer, or controller, and persons performing similar functions, in conformity with rules promulgated under the Sarbanes-Oxley Act of 2002.
2(b) No response required.
2(c) During the reporting period, there were no amendments to the code of ethics.
2(d) During the reporting period, there were no implicit or explicit waivers granted by the Registrant from any provision of the code of ethics.
2(e) Not applicable.
2(f) A copy of the current code of ethics is filed as an exhibit to this Form N-CSR.
Item 3. Audit Committee Financial Expert.
3(a)(1) The Registrant’s Board of Trustees has determined that the Registrant has at least one audit committee financial expert serving on its Audit and Compliance Committee.
3(a)(2) Nancy A. Eckl is the Registrant’s audit committee financial expert and is “independent” for purposes of Item 3 of Form N-CSR.
Item 4. Principal Accountant Fees and Services.
PricewaterhouseCoopers LLP (“PwC”) performs independent audits of the Registrant’s financial statements. To maintain auditor independence and avoid the appearance of conflicts of interest, the Registrant, as a policy, does not engage PwC for management advisory or consulting services.
4(a) Audit Fees.
For the fiscal years ended December 31, 2015 and December 31, 2014, PwC’s aggregate fees for the audit of the Registrant’s annual financial statements were $283,900 and $281,500, respectively.
4(b) Audit Related Fees.
For the fiscal years ended December 31, 2015 and December 31, 2014, PwC’s aggregate fees for services related to the performance of the audit of the Registrant’s annual financial statements were $0 and $0, respectively.
For the fiscal years ended December 31, 2015 and December 31, 2014, the Audit-Related Fees billed by PwC to Teachers Advisors, Inc. (“Advisors”) or to any entity controlling, controlled by or under common control with Advisors that provides ongoing services to the Registrant (collectively, “Fund Service Providers”) were $0 and $0, respectively.
4(c) Tax Fees.
For the fiscal years ended December 31, 2015 and December 31, 2014, PwC’s aggregate fees for tax services billed to the Registrant were $151,397 and $132,200, respectively.
For the fiscal years ended December 31, 2015 and December 31, 2014, PwC’s aggregate fees for tax services billed to the Fund Service Providers were $0 and $0, respectively.
4(d) All Other Fees.
For the fiscal years ended December 31, 2015 and December 31, 2014, PwC’s aggregate fees for all other services billed to the Registrant were $5,500 and $3,500, respectively.
For the fiscal years ended December 31, 2015 and December 31, 2014, PwC’s aggregate fees for all other services billed to the Fund Service Providers were $0 and $0, respectively.
4(e)(1) Preapproval Policy.
The Registrant’s audit and compliance committee (“Audit Committee”) has adopted a Preapproval Policy for External Audit Firm Services (the “Policy”). The Policy describes the types of services that may be provided by the independent auditor to the Registrant and certain of its affiliates without impairing the auditor’s independence. Under the Policy, the Audit Committee is required to preapprove all services to be performed by the Registrant’s
independent auditor in order to ensure that such services do not impair the auditor’s independence.
The Policy requires the Audit Committee to: (i) appoint the independent auditor to perform the financial statements audit for the Registrant and certain of its affiliates, including approving the terms of the engagement, and (ii) preapprove the audit, audit-related, tax and other services to be provided by the independent auditor to the Registrant and certain of its affiliates and the fees to be charged for provision of such services from year to year.
4(e)(2) Services provided pursuant to paragraph (c)(7)(i)(C) of Rule 2-01 of Regulation S-X (the “de minimis exception”):
Audit-Related Fees:
There were no amounts that were approved by the Audit Committee pursuant to the de minimis exception for the fiscal years ended December 31, 2015 and December 31, 2014 on behalf of the Registrant.
There were no amounts that were approved by the Audit Committee pursuant to the de minimis exception for the fiscal years ended December 31, 2015 and December 31, 2014 on behalf of the Fund Service Providers that relate directly to the operations and financial reporting of the Registrant.
Tax Fees:
There were no amounts that were approved by the Audit Committee pursuant to the de minimis exception for the fiscal years ended December 31, 2015 and December 31, 2014 on behalf of the Registrant.
There were no amounts that were approved by the Audit Committee pursuant to the de minimis exception for the fiscal years ended December 31, 2015 and December 31, 2014 on behalf of the Fund Service Providers that relate directly to the operations and financial reporting of the Registrant.
All Other Fees:
There were no amounts that were approved by the Audit Committee pursuant to the de minimis exception for the fiscal years ended December 31, 2015 and December 31, 2014 on behalf of the Registrant.
There were no amounts that were approved by the Audit Committee pursuant to the de minimis exception for the fiscal years ended December 31, 2015 and December 31, 2014 on behalf of the Fund Service Providers that relate directly to the operations and financial reporting of the Registrant.
4(f) The percentage of hours expended by PwC’s engagement to audit the Registrant’s financial statements for the most recent fiscal year attributable to work performed by persons other than PwC’s full-time, permanent employees was less than 50%.
4(g) Non-Audit Fees for Related Entities.
For the fiscal years ended December 31, 2015 and December 31, 2014, aggregate non-audit fees billed to the Registrant and to its Fund Service Providers by PwC were $399,000 and $277,000, respectively.
4(h) The Registrant’s Audit Committee has considered whether the non-audit services that were rendered by PwC to the Registrant’s Fund Service Providers that were not pre-approved pursuant to paragraph (c)(7)(ii) of Rule 2-01 of Regulation S-X are compatible with maintaining PwC’s independence.
Item 5. Audited Committee of Listed Registrants.
Not Applicable.
Item 6. Schedule of Investments.
TIAA-CREF LIFE FUNDS - Growth Equity Fund
TIAA-CREF LIFE FUNDS
GROWTH EQUITY FUND
SCHEDULE OF INVESTMENTS
December 31, 2015
| | | | | | | | |
SHARES | | | | COMPANY | | VALUE | |
| | | | | | | | |
COMMON STOCKS - 99.9% | | | | |
| |
AUTOMOBILES & COMPONENTS - 1.9% | | | | |
13,055 | | | | Delphi Automotive plc | | $ | 1,119,205 | |
1,895 | | *,e | | Tesla Motors, Inc | | | 454,819 | |
| | | | | | | | |
| | | | TOTAL AUTOMOBILES & COMPONENTS | | | 1,574,024 | |
| | | | | | | | |
| |
CAPITAL GOODS - 3.9% | | | | |
5,163 | | | | Boeing Co | | | 746,518 | |
2,905 | | * | | Middleby Corp | | | 313,362 | |
6,582 | | | | Northrop Grumman Corp | | | 1,242,748 | |
4,243 | | | | Roper Industries, Inc | | | 805,279 | |
2,366 | | * | | Univar, Inc | | | 40,246 | |
| | | | | | | | |
| | | | TOTAL CAPITAL GOODS | | | 3,148,153 | |
| | | | | | | | |
| |
COMMERCIAL & PROFESSIONAL SERVICES - 2.7% | | | | |
26,447 | | | | Nielsen NV | | | 1,232,430 | |
13,160 | | * | | Verisk Analytics, Inc | | | 1,011,741 | |
| | | | | | | | |
| | | | TOTAL COMMERCIAL & PROFESSIONAL SERVICES | | | 2,244,171 | |
| | | | | | | | |
| |
CONSUMER DURABLES & APPAREL - 3.4% | | | | |
1,201 | | | | Harman International Industries, Inc | | | 113,146 | |
30,908 | | | | Nike, Inc (Class B) | | | 1,931,750 | |
12,237 | | | | VF Corp | | | 761,754 | |
| | | | | | | | |
| | | | TOTAL CONSUMER DURABLES & APPAREL | | | 2,806,650 | |
| | | | | | | | |
| |
CONSUMER SERVICES - 5.4% | | | | |
13,059 | | | | ARAMARK Holdings Corp | | | 421,153 | |
29,359 | | * | | Norwegian Cruise Line Holdings Ltd | | | 1,720,437 | |
38,047 | | | | Starbucks Corp | | | 2,283,962 | |
| | | | | | | | |
| | | | TOTAL CONSUMER SERVICES | | | 4,425,552 | |
| | | | | | | | |
| |
DIVERSIFIED FINANCIALS - 3.6% | | | | |
19,861 | | | | Charles Schwab Corp | | | 654,023 | |
3,355 | | | | IntercontinentalExchange Group, Inc | | | 859,752 | |
4,157 | | | | McGraw-Hill Financial, Inc | | | 409,797 | |
24,501 | | | | Morgan Stanley | | | 779,377 | |
7,916 | | * | | Synchrony Financial | | | 240,726 | |
| | | | | | | | |
| | | | TOTAL DIVERSIFIED FINANCIALS | | | 2,943,675 | |
| | | | | | | | |
| |
ENERGY - 0.7% | | | | |
6,282 | | * | | Concho Resources, Inc | | | 583,347 | |
| | | | | | | | |
| | | | TOTAL ENERGY | | | 583,347 | |
| | | | | | | | |
| |
FOOD, BEVERAGE & TOBACCO - 2.3% | | | | |
2,702 | | | | Molson Coors Brewing Co (Class B) | | | 253,772 | |
8,889 | | * | | Monster Beverage Corp | | | 1,324,105 | |
6,217 | | | | Pinnacle Foods, Inc | | | 263,974 | |
| | | | | | | | |
| | | | TOTAL FOOD, BEVERAGE & TOBACCO | | | 1,841,851 | |
| | | | | | | | |
| |
HEALTH CARE EQUIPMENT & SERVICES - 2.3% | | | | |
11,772 | | * | | Cerner Corp | | | 708,321 | |
2,120 | | * | | Intuitive Surgical, Inc | | | 1,157,859 | |
| | | | | | | | |
| | | | TOTAL HEALTH CARE EQUIPMENT & SERVICES | | | 1,866,180 | |
| | | | | | | | |
1
TIAA-CREF LIFE FUNDS - Growth Equity Fund
| | | | | | | | |
SHARES | | | | COMPANY | | VALUE | |
| | | | | | | | |
HOUSEHOLD & PERSONAL PRODUCTS - 2.1% | | | | |
19,521 | | | | Estee Lauder Cos (Class A) | | $ | 1,719,019 | |
| | | | | | | | |
| | | | TOTAL HOUSEHOLD & PERSONAL PRODUCTS | | | 1,719,019 | |
| | | | | | | | |
| |
MATERIALS - 3.2% | | | | |
12,805 | | | | Monsanto Co | | | 1,261,548 | |
8,279 | | | | PPG Industries, Inc | | | 818,131 | |
2,146 | | | | Sherwin-Williams Co | | | 557,102 | |
| | | | | | | | |
| | | | TOTAL MATERIALS | | | 2,636,781 | |
| | | | | | | | |
| |
MEDIA - 3.8% | | | | |
8,533 | | | | CBS Corp (Class B) | | | 402,160 | |
26,133 | | | | Comcast Corp (Class A) | | | 1,474,685 | |
8,921 | | | | Time Warner, Inc | | | 576,921 | |
5,782 | | | | Walt Disney Co | | | 607,573 | |
| | | | | | | | |
| | | | TOTAL MEDIA | | | 3,061,339 | |
| | | | | | | | |
| |
PHARMACEUTICALS, BIOTECHNOLOGY & LIFE SCIENCES - 14.7% | | | | |
4,827 | | * | | Alexion Pharmaceuticals, Inc | | | 920,750 | |
5,594 | | * | | Allergan plc | | | 1,748,125 | |
1,789 | | * | | Biogen Idec, Inc | | | 548,060 | |
2,251 | | * | | BioMarin Pharmaceutical, Inc | | | 235,814 | |
14,744 | | | | Bristol-Myers Squibb Co | | | 1,014,240 | |
19,653 | | *,p | | Celgene Corp | | | 2,353,643 | |
18,380 | | | | Eli Lilly & Co | | | 1,548,699 | |
15,377 | | | | Gilead Sciences, Inc | | | 1,555,999 | |
2,801 | | * | | Illumina, Inc | | | 537,638 | |
1,430 | | * | | Mallinckrodt plc | | | 106,721 | |
5,059 | | | | Teva Pharmaceutical Industries Ltd (ADR) | | | 332,073 | |
7,527 | | | | Thermo Electron Corp | | | 1,067,705 | |
| | | | | | | | |
| | | | TOTAL PHARMACEUTICALS, BIOTECHNOLOGY & LIFE SCIENCES | | | 11,969,467 | |
| | | | | | | | |
| |
REAL ESTATE - 0.5% | | | | |
11,464 | | * | | CBRE Group, Inc | | | 396,425 | |
| | | | | | | | |
| | | | TOTAL REAL ESTATE | | | 396,425 | |
| | | | | | | | |
| |
RETAILING - 9.4% | | | | |
6,852 | | * | | Amazon.com, Inc | | | 4,631,198 | |
4,792 | | | | Expedia, Inc | | | 595,645 | |
14,523 | | | | Home Depot, Inc | | | 1,920,667 | |
4,220 | | * | | NetFlix, Inc | | | 482,684 | |
| | | | | | | | |
| | | | TOTAL RETAILING | | | 7,630,194 | |
| | | | | | | | |
| |
SEMICONDUCTORS & SEMICONDUCTOR EQUIPMENT - 1.9% | | | | |
17,995 | | | | ARM Holdings plc (ADR) | | | 814,094 | |
5,537 | | * | | NXP Semiconductors NV | | | 466,492 | |
5,920 | | | | Xilinx, Inc | | | 278,062 | |
| | | | | | | | |
| | | | TOTAL SEMICONDUCTORS & SEMICONDUCTOR EQUIPMENT | | | 1,558,648 | |
| | | | | | | | |
| |
SOFTWARE & SERVICES - 31.8% | | | | |
17,652 | | | | Activision Blizzard, Inc | | | 683,309 | |
28,481 | | * | | Adobe Systems, Inc | | | 2,675,505 | |
3,143 | | * | | Akamai Technologies, Inc | | | 165,416 | |
5,472 | | * | | Alibaba Group Holding Ltd (ADR) | | | 444,709 | |
2,521 | | * | | Alphabet, Inc (Class A) | | | 1,961,363 | |
3,927 | | * | | Alphabet, Inc (Class C) | | | 2,980,122 | |
3,968 | | *,e | | Check Point Software Technologies | | | 322,916 | |
14,946 | | * | | eBay, Inc | | | 410,716 | |
27,731 | | * | | Facebook, Inc | | | 2,902,326 | |
29,727 | | | | Intuit, Inc | | | 2,868,655 | |
25,330 | | | | Mastercard, Inc (Class A) | | | 2,466,129 | |
31,110 | | | | Microsoft Corp | | | 1,725,983 | |
2
TIAA-CREF LIFE FUNDS - Growth Equity Fund
| | | | | | | | |
SHARES | | | | COMPANY | | VALUE | |
| | | | | | | | |
3,177 | | * | | Mobileye NV | | $ | 134,324 | |
8,726 | | | | Oracle Corp | | | 318,761 | |
12,067 | | * | | PayPal Holdings, Inc | | | 436,825 | |
15,750 | | * | | Red Hat, Inc | | | 1,304,257 | |
6,774 | | | | Sabre Corp | | | 189,469 | |
22,014 | | * | | Salesforce.com, Inc | | | 1,725,898 | |
2,591 | | * | | ServiceNow, Inc | | | 224,277 | |
25,450 | | | | Visa, Inc (Class A) | | | 1,973,648 | |
| | | | | | | | |
| | | | TOTAL SOFTWARE & SERVICES | | | 25,914,608 | |
| | | | | | | | |
| |
TECHNOLOGY HARDWARE & EQUIPMENT - 4.7% | | | | |
25,262 | | | | Apple, Inc | | | 2,659,078 | |
33,850 | | | | Cisco Systems, Inc | | | 919,197 | |
1,530 | | * | | Palo Alto Networks, Inc | | | 269,494 | |
| | | | | | | | |
| | | | TOTAL TECHNOLOGY HARDWARE & EQUIPMENT | | | 3,847,769 | |
| | | | | | | | |
| |
TELECOMMUNICATION SERVICES - 1.1% | | | | |
16,765 | | * | | Level 3 Communications, Inc | | | 911,345 | |
| | | | | | | | |
| | | | TOTAL TELECOMMUNICATION SERVICES | | | 911,345 | |
| | | | | | | | |
| |
TRANSPORTATION - 0.5% | | | | |
8,536 | | | | Delta Air Lines, Inc | | | 432,690 | |
| | | | | | | | |
| | | | TOTAL TRANSPORTATION | | | 432,690 | |
| | | | | | | | |
| | | | TOTAL COMMON STOCKS
(Cost $60,018,389) | | | 81,511,888 | |
| | | | | | | | |
| |
SHORT-TERM INVESTMENTS - 0.8% | | | | |
| |
INVESTMENTS IN REGISTERED INVESTMENT COMPANIES - 0.8% | | | | |
641,218 | | c | | TIAA-CREF Short Term Lending Portfolio of the State Street Navigator Securities Lending Trust | | | 641,218 | |
| | | | | | | | |
| | | | TOTAL INVESTMENTS IN REGISTERED INVESTMENT COMPANIES | | | 641,218 | |
| | | | | | | | |
| | | | TOTAL SHORT-TERM INVESTMENTS
(Cost $641,218) | | | 641,218 | |
| | | | | | | | |
| | | | TOTAL INVESTMENTS - 100.7%
(Cost $60,659,607) | | | 82,153,106 | |
| | | | OTHER ASSETS & LIABILITIES, NET - (0.7)% | | | (584,233 | ) |
| | | | | | | | |
| | | | NET ASSETS - 100.0% | | $ | 81,568,873 | |
| | | | | | | | |
Abbreviation(s):
| ADR | American Depositary Receipt |
| c | Investments made with cash collateral received from securities on loan. |
| e | All or a portion of these securities are out on loan. The aggregate value of securities on loan is $629,295. |
| p | All or a portion of these securities have been segregated by the custodian to cover margin requirements on open written options contracts. |
3
TIAA-CREF LIFE FUNDS - Growth & Income Fund
TIAA-CREF LIFE FUNDS
GROWTH & INCOME FUND
SCHEDULE OF INVESTMENTS
December 31, 2015
| | | | | | | | |
SHARES | | | | COMPANY | | VALUE | |
| | | | | | | | |
COMMON STOCKS - 99.9% | |
| |
AUTOMOBILES & COMPONENTS - 0.8% | | | | |
7,776 | | | | Delphi Automotive plc | | $ | 666,636 | |
13,349 | | | | General Motors Co | | | 454,000 | |
| | | | | | | | |
| | | | TOTAL AUTOMOBILES & COMPONENTS | | | 1,120,636 | |
| | | | | | | | |
| |
BANKS - 5.5% | | | | |
111,202 | | | | Bank of America Corp | | | 1,871,529 | |
38,812 | | | | Citigroup, Inc | | | 2,008,521 | |
24,793 | | | | JPMorgan Chase & Co | | | 1,637,082 | |
31,111 | | | | Wells Fargo & Co | | | 1,691,194 | |
| | | | | | | | |
| | | | TOTAL BANKS | | | 7,208,326 | |
| | | | | | | | |
| |
CAPITAL GOODS - 7.4% | | | | |
1,492 | | p | | Acuity Brands, Inc | | | 348,830 | |
10,707 | | * | | Caesarstone Sdot-Yam Ltd | | | 464,041 | |
7,381 | | e | | Fastenal Co | | | 301,292 | |
88,805 | | p | | General Electric Co | | | 2,766,276 | |
14,665 | | | | Honeywell International, Inc | | | 1,518,854 | |
9,241 | | | | Illinois Tool Works, Inc | | | 856,456 | |
4,305 | | | | L-3 Communications Holdings, Inc | | | 514,491 | |
4,425 | | | | Northrop Grumman Corp | | | 835,484 | |
8,076 | | | | Raytheon Co | | | 1,005,704 | |
2,509 | | | | Snap-On, Inc | | | 430,118 | |
18,684 | | * | | USG Corp | | | 453,834 | |
3,014 | | * | | WABCO Holdings, Inc | | | 308,212 | |
| | | | | | | | |
| | | | TOTAL CAPITAL GOODS | | | 9,803,592 | |
| | | | | | | | |
| |
COMMERCIAL & PROFESSIONAL SERVICES - 0.5% | | | | |
6,169 | | | | Equifax, Inc | | | 687,042 | |
| | | | | | | | |
| | | | TOTAL COMMERCIAL & PROFESSIONAL SERVICES | | | 687,042 | |
| | | | | | | | |
| |
CONSUMER DURABLES & APPAREL - 3.4% | | | | |
8,181 | | * | | GoPro, Inc | | | 147,340 | |
22,983 | | * | | Kate Spade & Co | | | 408,408 | |
4,388 | | *,e | | Lululemon Athletica, Inc | | | 230,238 | |
21,542 | | | | Mattel, Inc | | | 585,296 | |
2,668 | | * | | Mohawk Industries, Inc | | | 505,293 | |
24,376 | | | | Newell Rubbermaid, Inc | | | 1,074,494 | |
16,220 | | | | Nike, Inc (Class B) | | | 1,013,750 | |
7,741 | | *,g | | Spin Master Corp | | | 122,294 | |
7,411 | | | | VF Corp | | | 461,335 | |
| | | | | | | | |
| | | | TOTAL CONSUMER DURABLES & APPAREL | | | 4,548,448 | |
| | | | | | | | |
| |
CONSUMER SERVICES - 3.1% | | | | |
20,558 | | | | Hilton Worldwide Holdings, Inc | | | 439,941 | |
4,911 | | | | McDonald’s Corp | | | 580,185 | |
21,798 | | * | | MGM Resorts International | | | 495,251 | |
10,986 | | *,p | | Norwegian Cruise Line Holdings Ltd | | | 643,780 | |
12,303 | | | | Restaurant Brands International, Inc | | | 459,640 | |
15,915 | | p | | Sonic Corp | | | 514,214 | |
15,471 | | | | Starbucks Corp | | | 928,724 | |
| | | | | | | | |
| | | | TOTAL CONSUMER SERVICES | | | 4,061,735 | |
| | | | | | | | |
4
TIAA-CREF LIFE FUNDS - Growth & Income Fund
| | | | | | | | |
SHARES | | | | COMPANY | | VALUE | |
| | | | | | | | |
DIVERSIFIED FINANCIALS - 3.1% | | | | |
35,197 | | | | ING Groep NV | | $ | 476,217 | |
2,888 | | | | IntercontinentalExchange Group, Inc | | | 740,079 | |
10,854 | | | | Lazard Ltd (Class A) | | | 488,538 | |
8,451 | | | | Legg Mason, Inc | | | 331,533 | |
5,869 | | | | Moody’s Corp | | | 588,895 | |
33,008 | | | | Morgan Stanley | | | 1,049,984 | |
11,726 | | | | Voya Financial, Inc | | | 432,807 | |
| | | | | | | | |
| | | | TOTAL DIVERSIFIED FINANCIALS | | | 4,108,053 | |
| | | | | | | | |
| |
ENERGY - 4.7% | | | | |
10,483 | | p | | Anadarko Petroleum Corp | | | 509,264 | |
2,849 | | | | Apache Corp | | | 126,695 | |
5,940 | | | | Chevron Corp | | | 534,362 | |
8,181 | | * | | Concho Resources, Inc | | | 759,688 | |
17,533 | | * | | Continental Resources, Inc | | | 402,908 | |
7,511 | | * | | Diamondback Energy, Inc | | | 502,486 | |
7,412 | | | | Energen Corp | | | 303,818 | |
11,371 | | | | EOG Resources, Inc | | | 804,953 | |
8,908 | | | | Occidental Petroleum Corp | | | 602,270 | |
5,375 | | | | Pioneer Natural Resources Co | | | 673,918 | |
10,471 | | e | | Range Resources Corp | | | 257,691 | |
7,202 | | * | | RSP Permian, Inc | | | 175,657 | |
8,259 | | | | Schlumberger Ltd | | | 576,065 | |
| | | | | | | | |
| | | | TOTAL ENERGY | | | 6,229,775 | |
| | | | | | | | |
| |
FOOD & STAPLES RETAILING - 1.7% | | | | |
5,739 | | | | Costco Wholesale Corp | | | 926,848 | |
31,290 | | | | Kroger Co | | | 1,308,861 | |
| | | | | | | | |
| | | | TOTAL FOOD & STAPLES RETAILING | | | 2,235,709 | |
| | | | | | | | |
| |
FOOD, BEVERAGE & TOBACCO - 7.3% | | | | |
50,572 | | | | Britvic plc | | | 541,839 | |
893 | | | | Brown-Forman Corp (Class B) | | | 88,657 | |
44,420 | | | | Coca-Cola Co | | | 1,908,283 | |
7,260 | | | | ConAgra Foods, Inc | | | 306,082 | |
4,553 | | | | Constellation Brands, Inc (Class A) | | | 648,529 | |
2,298 | | | | Diageo plc (ADR) | | | 250,643 | |
2,817 | | | | Molson Coors Brewing Co (Class B) | | | 264,573 | |
25,932 | | | | Mondelez International, Inc | | | 1,162,791 | |
5,503 | | * | | Monster Beverage Corp | | | 819,727 | |
20,986 | | | | PepsiCo, Inc | | | 2,096,921 | |
15,020 | | | | Philip Morris International, Inc | | | 1,320,408 | |
6,790 | | | | Pinnacle Foods, Inc | | | 288,303 | |
| | | | | | | | |
| | | | TOTAL FOOD, BEVERAGE & TOBACCO | | | 9,696,756 | |
| | | | | | | | |
| |
HEALTH CARE EQUIPMENT & SERVICES - 4.5% | | | | |
34,985 | | * | | Boston Scientific Corp | | | 645,123 | |
8,776 | | * | | Edwards Lifesciences Corp | | | 693,128 | |
11,619 | | * | | Express Scripts Holding Co | | | 1,015,617 | |
8,010 | | | | Getinge AB (B Shares) | | | 209,824 | |
13,790 | | * | | Hologic, Inc | | | 533,535 | |
16,549 | | | | Medtronic plc | | | 1,272,949 | |
4,980 | | | | Olympus Corp | | | 196,056 | |
4,947 | | | | STERIS plc | | | 372,707 | |
6,673 | | p | | Universal Health Services, Inc (Class B) | | | 797,357 | |
4,611 | | * | | VCA Antech, Inc | | | 253,605 | |
| | | | | | | | |
| | | | TOTAL HEALTH CARE EQUIPMENT & SERVICES | | | 5,989,901 | |
| | | | | | | | |
| |
HOUSEHOLD & PERSONAL PRODUCTS - 0.6% | | | | |
4,280 | | | | Beiersdorf AG. | | | 389,015 | |
4,468 | | | | Estee Lauder Cos (Class A) | | | 393,452 | |
| | | | | | | | |
| | | | TOTAL HOUSEHOLD & PERSONAL PRODUCTS | | | 782,467 | |
| | | | | | | | |
5
TIAA-CREF LIFE FUNDS - Growth & Income Fund
| | | | | | | | |
SHARES | | | | COMPANY | | VALUE | |
| | | | | | | | |
INSURANCE - 1.9% | | | | |
11,227 | | | | ACE Ltd | | $ | 1,311,875 | |
9,800 | | | | Metlife, Inc | | | 472,458 | |
19,878 | | | | XL Capital Ltd | | | 778,820 | |
| | | | | | | | |
| | | | TOTAL INSURANCE | | | 2,563,153 | |
| | | | | | | | |
| |
MATERIALS - 2.5% | | | | |
7,124 | | | | Akzo Nobel NV | | | 476,016 | |
25,947 | | | | Dow Chemical Co | | | 1,335,752 | |
17,549 | | | | Olin Corp | | | 302,896 | |
8,072 | | | | PPG Industries, Inc | | | 797,675 | |
3,968 | | | | Scotts Miracle-Gro Co (Class A) | | | 255,975 | |
2,378 | | | | Syngenta AG. (ADR) | | | 187,220 | |
| | | | | | | | |
| | | | TOTAL MATERIALS | | | 3,355,534 | |
| | | | | | | | |
| |
MEDIA - 3.1% | | | | |
6,361 | | *,p | | AMC Networks, Inc | | | 475,039 | |
13,452 | | | | Comcast Corp (Class A) | | | 759,096 | |
10,093 | | * | | DreamWorks Animation SKG, Inc (Class A) | | | 260,097 | |
11,949 | | e | | Lions Gate Entertainment Corp | | | 387,028 | |
19,890 | | | | Sky plc | | | 326,052 | |
4,131 | | | | Time Warner, Inc | | | 267,152 | |
7,080 | | | | Viacom, Inc (Class B) | | | 291,413 | |
11,996 | | | | Walt Disney Co | | | 1,260,539 | |
| | | | | | | | |
| | | | TOTAL MEDIA | | | 4,026,416 | |
| | | | | | | | |
| |
PHARMACEUTICALS, BIOTECHNOLOGY & LIFE SCIENCES - 11.1% | | | | |
23,178 | | | | AbbVie, Inc | | | 1,373,065 | |
4,328 | | * | | Allergan plc | | | 1,352,500 | |
8,380 | | | | Amgen, Inc | | | 1,360,325 | |
6,019 | | | | AstraZeneca plc | | | 406,567 | |
4,195 | | * | | BioMarin Pharmaceutical, Inc | | | 439,468 | |
20,381 | | | | Bristol-Myers Squibb Co | | | 1,402,009 | |
10,738 | | * | | Celgene Corp | | | 1,285,983 | |
17,429 | | | | Eli Lilly & Co | | | 1,468,568 | |
17,331 | | * | | H Lundbeck AS | | | 591,772 | |
2,762 | | * | | Illumina, Inc | | | 530,152 | |
7,672 | | | | Ipsen | | | 508,328 | |
3,675 | | * | | Jazz Pharmaceuticals plc | | | 516,558 | |
9,090 | | * | | Mylan NV | | | 491,496 | |
71,059 | | | | Pfizer, Inc | | | 2,293,784 | |
4,602 | | | | Shire Ltd | | | 315,731 | |
3,208 | | | | UCB S.A. | | | 289,564 | |
| | | | | | | | |
| | | | TOTAL PHARMACEUTICALS, BIOTECHNOLOGY & LIFE SCIENCES | | | 14,625,870 | |
| | | | | | | | |
| |
REAL ESTATE - 0.7% | | | | |
10,247 | | | | Brixmor Property Group, Inc | | | 264,578 | |
7,249 | | | | Crown Castle International Corp | | | 626,676 | |
| | | | | | | | |
| | | | TOTAL REAL ESTATE | | | 891,254 | |
| | | | | | | | |
| |
RETAILING - 8.1% | | | | |
3,951 | | * | | Amazon.com, Inc | | | 2,670,441 | |
1,036 | | * | | AutoZone, Inc | | | 768,619 | |
16,983 | | | | Best Buy Co, Inc | | | 517,133 | |
5,503 | | | | Expedia, Inc | | | 684,023 | |
18,931 | | | | Home Depot, Inc | | | 2,503,625 | |
9,704 | | | | Inditex S.A. | | | 333,372 | |
65,692 | | * | | JC Penney Co, Inc | | | 437,509 | |
9,029 | | * | | NetFlix, Inc | | | 1,032,737 | |
2,512 | | * | | O’Reilly Automotive, Inc | | | 636,591 | |
6,143 | | | | Target Corp | | | 446,043 | |
6,042 | | | | Tiffany & Co | | | 460,944 | |
6
TIAA-CREF LIFE FUNDS - Growth & Income Fund
| | | | | | | | |
SHARES | | | | COMPANY | | VALUE | |
| | | | | | | | |
1,240 | | *,p | | Ulta Salon Cosmetics & Fragrance, Inc | | $ | 229,400 | |
| | | | | | | | |
| | | | TOTAL RETAILING | | | 10,720,437 | |
| | | | | | | | |
| |
SEMICONDUCTORS & SEMICONDUCTOR EQUIPMENT - 3.3% | | | | |
4,139 | | *,e | | Ambarella, Inc | | | 230,708 | |
5,800 | | | | Avago Technologies Ltd | | | 841,870 | |
6,162 | | *,p | | Cavium Networks, Inc | | | 404,905 | |
19,789 | | | | Cypress Semiconductor Corp | | | 194,130 | |
49,007 | | | | Intel Corp | | | 1,688,291 | |
9,976 | | | | Nvidia Corp | | | 328,809 | |
7,149 | | * | | NXP Semiconductors NV | | | 602,303 | |
| | | | | | | | |
| | | | TOTAL SEMICONDUCTORS & SEMICONDUCTOR EQUIPMENT | | | 4,291,016 | |
| | | | | | | | |
| |
SOFTWARE & SERVICES - 13.9% | | | | |
5,476 | | * | | Alphabet, Inc (Class C) | | | 4,155,627 | |
4,294 | | * | | CyberArk Software Ltd | | | 193,831 | |
4,273 | | | | Dassault Systemes S.A. | | | 341,544 | |
10,164 | | * | | Electronic Arts, Inc | | | 698,470 | |
23,800 | | * | | Facebook, Inc | | | 2,490,908 | |
5,305 | | * | | Manhattan Associates, Inc | | | 351,032 | |
65,218 | | | | Microsoft Corp | | | 3,618,295 | |
2,319 | | * | | MicroStrategy, Inc (Class A) | | | 415,773 | |
5,685 | | * | | Mobileye NV | | | 240,362 | |
17,007 | | | | Oracle Corp | | | 621,266 | |
3,770 | | * | | Proofpoint, Inc | | | 245,088 | |
16,943 | | * | | Salesforce.com, Inc | | | 1,328,331 | |
22,982 | | | | Symantec Corp | | | 482,622 | |
15,766 | | * | | Take-Two Interactive Software, Inc | | | 549,287 | |
19,740 | | | | Tencent Holdings Ltd | | | 386,509 | |
2,254 | | *,e | | VeriSign, Inc | | | 196,909 | |
20,701 | | | | Visa, Inc (Class A) | | | 1,605,363 | |
65,899 | | *,g | | Worldpay Group plc | | | 298,537 | |
6,469 | | * | | Yahoo!, Inc | | | 215,159 | |
| | | | | | | | |
| | | | TOTAL SOFTWARE & SERVICES | | | 18,434,913 | |
| | | | | | | | |
| |
TECHNOLOGY HARDWARE & EQUIPMENT - 7.0% | | | | |
42,619 | | | | Apple, Inc | | | 4,486,076 | |
19,016 | | * | | Ciena Corp | | | 393,441 | |
65,265 | | | | Cisco Systems, Inc | | | 1,772,271 | |
7,804 | | *,p | | Fitbit, Inc | | | 230,921 | |
18,581 | | * | | Flextronics International Ltd | | | 208,293 | |
21,875 | | | | Juniper Networks, Inc | | | 603,750 | |
54,602 | | | | Nokia Corp | | | 383,306 | |
13,398 | | | | Qualcomm, Inc | | | 669,699 | |
3,837 | | * | | Universal Display Corp | | | 208,886 | |
4,360 | | * | | Zebra Technologies Corp (Class A) | | | 303,674 | |
| | | | | | | | |
| | | | TOTAL TECHNOLOGY HARDWARE & EQUIPMENT | | | 9,260,317 | |
| | | | | | | | |
| |
TELECOMMUNICATION SERVICES - 2.4% | | | | |
39,312 | | | | AT&T, Inc | | | 1,352,726 | |
13,721 | | * | | Level 3 Communications, Inc | | | 745,874 | |
13,034 | | | | Telephone & Data Systems, Inc | | | 337,450 | |
17,923 | | * | | T-Mobile US, Inc | | | 701,148 | |
| | | | | | | | |
| | | | TOTAL TELECOMMUNICATION SERVICES | | | 3,137,198 | |
| | | | | | | | |
| |
TRANSPORTATION - 1.6% | | | | |
21,567 | | | | Delta Air Lines, Inc | | | 1,093,231 | |
6,478 | | p | | Kansas City Southern Industries, Inc | | | 483,712 | |
5,682 | | | | United Parcel Service, Inc (Class B) | | | 546,779 | |
| | | | | | | | |
| | | | TOTAL TRANSPORTATION | | | 2,123,722 | |
| | | | | | | | |
7
TIAA-CREF LIFE FUNDS - Growth & Income Fund
| | | | | | | | |
SHARES | | | | COMPANY | | VALUE | |
| | | | | | | | |
UTILITIES - 1.7% | | | | |
8,263 | | | | American Water Works Co, Inc | | $ | 493,714 | |
9,910 | | | | NextEra Energy, Inc | | | 1,029,550 | |
12,241 | | | | NiSource, Inc | | | 238,822 | |
5,422 | | | | Sempra Energy | | | 509,722 | |
| | | | | | | | |
| | | | TOTAL UTILITIES | | | 2,271,808 | |
| | | | | | | | |
| | | | TOTAL COMMON STOCKS
(Cost $105,482,462) | | | 132,174,078 | |
| | | | | | | | |
|
PURCHASED OPTIONS - 0.0% | |
| |
CONSUMER DURABLES & APPAREL - 0.0% | | | | |
600 | | | | Newell Rubbermaid, Inc | | | 180 | |
| | | | | | | | |
| | | | TOTAL CONSUMER DURABLES & APPAREL | | | 180 | |
| | | | | | | | |
| |
ENERGY - 0.0% | | | | |
3,500 | | | | Chesapeake Energy Corp | | | 385 | |
| | | | | | | | |
| | | | TOTAL ENERGY | | | 385 | |
| | | | | | | | |
| |
MEDIA - 0.0% | | | | |
600 | | | | Lions Gate Entertainment Corp | | | 210 | |
| | | | | | | | |
| | | | TOTAL MEDIA | | | 210 | |
| | | | | | | | |
| |
TECHNOLOGY HARDWARE & EQUIPMENT - 0.0% | | | | |
900 | | | | QUALCOMM, Inc | | | 90 | |
| | | | | | | | |
| | | | TOTAL TECHNOLOGY HARDWARE & EQUIPMENT | | | 90 | |
| | | | | | | | |
| | | | TOTAL PURCHASED OPTIONS
(Cost $3,387) | | | 865 | |
| | | | | | | | |
| |
SHORT-TERM INVESTMENTS - 1.0% | | | | |
| |
INVESTMENTS IN REGISTERED INVESTMENT COMPANIES - 1.0% | | | | |
1,194,927 | | c | | TIAA-CREF Short Term Lending Portfolio of the State Street Navigator Securities Lending Trust | | | 1,194,927 | |
| | | | | | | | |
| | | | TOTAL INVESTMENTS IN REGISTERED INVESTMENT COMPANIES | | | 1,194,927 | |
| | | | | | | | |
| | | | TOTAL SHORT-TERM INVESTMENTS
(Cost $1,194,927) | | | 1,194,927 | |
| | | | | | | | |
| | | | TOTAL INVESTMENTS - 100.9%
(Cost $106,680,776) | | | 133,369,870 | |
| | | | OTHER ASSETS & LIABILITIES, NET - (0.9)% | | | (1,126,184 | ) |
| | | | | | | | |
| | | | NET ASSETS - 100.0% | | $ | 132,243,686 | |
| | | | | | | | |
Abbreviation(s):
| ADR | American Depositary Receipt |
| c | Investments made with cash collateral received from securities on loan. |
| e | All or a portion of these securities are out on loan. The aggregate value of securities on loan is $1,172,315. |
| g | Security is exempt from registration under Rule 144(A) of the Securities Act of 1933. Such securities are deemed liquid and may be resold in transactions exempt from registration to qualified institutional buyers. At 12/31/2015, the aggregate value of these securities amounted to $420,831 or 0.3% of net assets. |
| p | All or a portion of these securities have been segregated by the custodian to cover margin requirements on open written options contracts. |
8
TIAA-CREF LIFE FUNDS - Large-Cap Value Fund
TIAA-CREF LIFE FUNDS
LARGE-CAP VALUE FUND
SCHEDULE OF INVESTMENTS
December 31, 2015
| | | | | | | | |
SHARES | | | | COMPANY | | VALUE | |
| | | | | | | | |
COMMON STOCKS - 99.2% | |
| |
AUTOMOBILES & COMPONENTS - 0.5% | | | | |
4,524 | | * | | American Axle & Manufacturing Holdings, Inc | | $ | 85,685 | |
16,702 | | | | Ford Motor Co | | | 235,331 | |
| | | | | | | | |
| | | | TOTAL AUTOMOBILES & COMPONENTS | | | 321,016 | |
| | | | | | | | |
| |
BANKS - 11.9% | | | | |
110,372 | | | | Bank of America Corp | | | 1,857,561 | |
4,711 | | | | CIT Group, Inc | | | 187,027 | |
19,125 | | | | Citigroup, Inc | | | 989,719 | |
7,907 | | * | | Hilltop Holdings, Inc | | | 151,973 | |
5,167 | | | | Huntington Bancshares, Inc | | | 57,147 | |
15,137 | | | | Investors Bancorp, Inc | | | 188,304 | |
16,120 | | | | JPMorgan Chase & Co | | | 1,064,403 | |
11,863 | | | | New York Community Bancorp, Inc | | | 193,604 | |
36,198 | | | | Regions Financial Corp | | | 347,501 | |
45,084 | | | | Sberbank of Russian Federation (ADR) | | | 264,480 | |
13,787 | | | | TCF Financial Corp | | | 194,672 | |
31,631 | | | | Wells Fargo & Co | | | 1,719,461 | |
13,849 | | | | Zions Bancorporation | | | 378,078 | |
| | | | | | | | |
| | | | TOTAL BANKS | | | 7,593,930 | |
| | | | | | | | |
| |
CAPITAL GOODS - 6.6% | | | | |
4,545 | | * | | AerCap Holdings NV | | | 196,162 | |
1,209 | | | | General Dynamics Corp | | | 166,068 | |
34,962 | | | | General Electric Co | | | 1,089,066 | |
7,985 | | e | | Joy Global, Inc | | | 100,691 | |
3,093 | | | | L-3 Communications Holdings, Inc | | | 369,644 | |
7,495 | | | | Masco Corp | | | 212,109 | |
1,282 | | | | Raytheon Co | | | 159,648 | |
11,011 | | | | SPX Corp | | | 102,733 | |
11,011 | | * | | SPX FLOW, Inc | | | 307,317 | |
40,352 | | | | Terex Corp | | | 745,705 | |
8,440 | | | | Triumph Group, Inc | | | 335,490 | |
3,328 | | | | United Technologies Corp | | | 319,721 | |
3,603 | | * | | Univar, Inc | | | 61,287 | |
3,901 | | * | | USG Corp | | | 94,755 | |
| | | | | | | | |
| | | | TOTAL CAPITAL GOODS | | | 4,260,396 | |
| | | | | | | | |
| |
CONSUMER DURABLES & APPAREL - 4.1% | | | | |
12,402 | | | | Coach, Inc | | | 405,917 | |
2,224 | | * | | Deckers Outdoor Corp | | | 104,973 | |
6,799 | | * | | Jarden Corp | | | 388,359 | |
21,053 | | | | Mattel, Inc | | | 572,010 | |
94,401 | | *,e | | Pioneer Corp | | | 259,878 | |
32,605 | | | | Pulte Homes, Inc | | | 581,021 | |
3,601 | | | | Sony Corp | | | 88,501 | |
8,023 | | | | Sony Corp (ADR) | | | 197,446 | |
| | | | | | | | |
| | | | TOTAL CONSUMER DURABLES & APPAREL | | | 2,598,105 | |
| | | | | | | | |
| |
CONSUMER SERVICES - 3.3% | | | | |
13,297 | | | | ARAMARK Holdings Corp | | | 428,828 | |
3,641 | | | | Carnival Corp | | | 198,362 | |
25,520 | | | | Extended Stay America, Inc | | | 405,768 | |
15,282 | | * | | MGM Resorts International | | | 347,207 | |
12,204 | | | | Restaurant Brands International, Inc | | | 455,941 | |
9
TIAA-CREF LIFE FUNDS - Large-Cap Value Fund
| | | | | | | | |
SHARES | | | | COMPANY | | VALUE | |
| | | | | | | | |
77,600 | | | | Sands China Ltd | | $ | 263,079 | |
| | | | | | | | |
| | | | TOTAL CONSUMER SERVICES | | | 2,099,185 | |
| | | | | | | | |
| |
DIVERSIFIED FINANCIALS - 6.8% | | | | |
2,990 | | | | American Express Co | | | 207,954 | |
4,447 | | | | Bank of New York Mellon Corp | | | 183,305 | |
1,482 | | | | Capital One Financial Corp | | | 106,971 | |
5,839 | | * | | E*TRADE Financial Corp | | | 173,068 | |
1,398 | | | | Goldman Sachs Group, Inc | | | 251,962 | |
20,135 | | | | ING Groep NV (ADR) | | | 271,017 | |
2,557 | | e | | iShares Dow Jones US Real Estate Index Fund | | | 192,056 | |
2,353 | | | | Janus Capital Group, Inc | | | 33,154 | |
4,518 | | | | Legg Mason, Inc | | | 177,241 | |
26,409 | | | | Morgan Stanley | | | 840,070 | |
5,735 | | | | State Street Corp | | | 380,575 | |
49,810 | | * | | Synchrony Financial | | | 1,514,722 | |
| | | | | | | | |
| | | | TOTAL DIVERSIFIED FINANCIALS | | | 4,332,095 | |
| | | | | | | | |
| |
ENERGY - 10.8% | | | | |
3,113 | | | | Anadarko Petroleum Corp | | | 151,230 | |
15,259 | | | | Apache Corp | | | 678,568 | |
4,370 | | | | Baker Hughes, Inc | | | 201,675 | |
10,503 | | | | Chevron Corp | | | 944,850 | |
2,067 | | * | | Concho Resources, Inc | | | 191,942 | |
5,346 | | * | | Diamondback Energy, Inc | | | 357,647 | |
5,301 | | | | EOG Resources, Inc | | | 375,258 | |
10,953 | | | | Exxon Mobil Corp | | | 853,786 | |
5,707 | | | | Kinder Morgan, Inc | | | 85,148 | |
5,235 | | *,e | | Laredo Petroleum Holdings, Inc | | | 41,828 | |
14,884 | | * | | Matador Resources Co | | | 294,257 | |
22,464 | | | | Nabors Industries Ltd | | | 191,169 | |
3,943 | | | | Occidental Petroleum Corp | | | 266,586 | |
7,594 | | * | | Parsley Energy, Inc | | | 140,109 | |
4,789 | | | | Pioneer Natural Resources Co | | | 600,445 | |
15,272 | | * | | RSP Permian, Inc | | | 372,484 | |
9,496 | | | | Schlumberger Ltd | | | 662,346 | |
38,865 | | * | | Weatherford International Ltd | | | 326,077 | |
2,565 | | | | Williams Cos, Inc | | | 65,920 | |
14,858 | | * | | WPX Energy, Inc | | | 85,285 | |
| | | | | | | | |
| | | | TOTAL ENERGY | | | 6,886,610 | |
| | | | | | | | |
| |
FOOD & STAPLES RETAILING - 0.6% | | | | |
1,900 | | | | Walgreens Boots Alliance, Inc | | | 161,794 | |
3,679 | | | | Wal-Mart Stores, Inc | | | 225,523 | |
| | | | | | | | |
| | | | TOTAL FOOD & STAPLES RETAILING | | | 387,317 | |
| | | | | | | | |
| |
FOOD, BEVERAGE & TOBACCO - 3.1% | | | | |
13,078 | | | | ConAgra Foods, Inc | | | 551,368 | |
2,920 | | | | Kraft Heinz Co | | | 212,459 | |
8,308 | | | | Mondelez International, Inc | | | 372,531 | |
15,336 | | | | Pinnacle Foods, Inc | | | 651,167 | |
3,624 | | * | | Post Holdings, Inc | | | 223,601 | |
| | | | | | | | |
| | | | TOTAL FOOD, BEVERAGE & TOBACCO | | | 2,011,126 | |
| | | | | | | | |
| |
HEALTH CARE EQUIPMENT & SERVICES - 3.1% | | | | |
8,086 | | | | Abbott Laboratories | | | 363,142 | |
654 | | | | Anthem, Inc | | | 91,194 | |
1,250 | | | | Baxter International, Inc | | | 47,688 | |
19,653 | | * | | Boston Scientific Corp | | | 362,401 | |
3,516 | | | | Medtronic plc | | | 270,451 | |
6,301 | | | | Olympus Corp | | | 248,062 | |
1,038 | | | | UnitedHealth Group, Inc | | | 122,110 | |
6,489 | | * | | WellCare Health Plans, Inc | | | 507,505 | |
| | | | | | | | |
| | | | TOTAL HEALTH CARE EQUIPMENT & SERVICES | | | 2,012,553 | |
| | | | | | | | |
10
TIAA-CREF LIFE FUNDS - Large-Cap Value Fund
| | | | | | | | |
SHARES | | | | COMPANY | | VALUE | |
| | | | | | | | |
HOUSEHOLD & PERSONAL PRODUCTS - 1.9% | | | | |
15,187 | | | | Procter & Gamble Co | | $ | 1,206,000 | |
| | | | | | | | |
| | | | TOTAL HOUSEHOLD & PERSONAL PRODUCTS | | | 1,206,000 | |
| | | | | | | | |
| |
INSURANCE - 7.3% | | | | |
4,679 | | | | ACE Ltd | | | 546,741 | |
2,034 | | | | Aflac, Inc | | | 121,837 | |
4,148 | | | | Allstate Corp | | | 257,549 | |
8,857 | | | | American International Group, Inc | | | 548,868 | |
4,590 | | * | | Berkshire Hathaway, Inc (Class B) | | | 606,064 | |
10,702 | | | | Hartford Financial Services Group, Inc | | | 465,109 | |
10,878 | | | | Metlife, Inc | | | 524,428 | |
10,165 | | | | Principal Financial Group | | | 457,222 | |
3,002 | | | | Prudential Financial, Inc | | | 244,393 | |
2,494 | | | | Travelers Cos, Inc | | | 281,473 | |
2,419 | | | | W.R. Berkley Corp | | | 132,440 | |
12,729 | | | | XL Capital Ltd | | | 498,722 | |
| | | | | | | | |
| | | | TOTAL INSURANCE | | | 4,684,846 | |
| | | | | | | | |
| |
MATERIALS - 4.3% | | | | |
393 | | e | | Acerinox S.A. | | | 4,008 | |
2,405 | | | | Albemarle Corp | | | 134,704 | |
9,237 | | | | Axiall Corp | | | 142,250 | |
14,249 | | *,e | | Cemex SAB de C.V. (ADR) | | | 79,367 | |
7,901 | | * | | Constellium NV | | | 60,838 | |
4,634 | | | | Dow Chemical Co | | | 238,558 | |
4,601 | | | | Du Pont (E.I.) de Nemours & Co | | | 306,426 | |
7,451 | | | | Freeport-McMoRan Copper & Gold, Inc (Class B) | | | 50,443 | |
62,788 | | * | | Louisiana-Pacific Corp | | | 1,130,812 | |
18,325 | | * | | Multi Packaging Solutions International Ltd | | | 317,939 | |
11,668 | | | | Olin Corp | | | 201,390 | |
938 | | e | | Wacker Chemie AG. | | | 78,427 | |
| | | | | | | | |
| | | | TOTAL MATERIALS | | | 2,745,162 | |
| | | | | | | | |
| |
MEDIA - 0.7% | | | | |
880 | | | | Naspers Ltd (N Shares) | | | 120,282 | |
1,822 | | | | Time Warner, Inc | | | 117,829 | |
3,321 | | | | Tribune Co | | | 112,283 | |
2,711 | | | | Viacom, Inc (Class B) | | | 111,585 | |
| | | | | | | | |
| | | | TOTAL MEDIA | | | 461,979 | |
| | | | | | | | |
| |
PHARMACEUTICALS, BIOTECHNOLOGY & LIFE SCIENCES - 8.6% | | | | |
13,280 | | | | Agilent Technologies, Inc | | | 555,237 | |
1,306 | | * | | Allergan plc | | | 408,125 | |
1,250 | | | | Baxalta, Inc | | | 48,787 | |
10,178 | | * | | Biovitrum AB | | | 161,443 | |
10,153 | | * | | Endo International plc | | | 621,567 | |
7,418 | | * | | H Lundbeck AS | | | 253,290 | |
3,622 | | *,e | | Insys Therapeutics, Inc | | | 103,698 | |
8,488 | | | | Johnson & Johnson | | | 871,887 | |
2,222 | | * | | Mallinckrodt plc | | | 165,828 | |
13,012 | | | | Merck & Co, Inc | | | 687,294 | |
2,243 | | *,e | | Merrimack Pharmaceuticals, Inc | | | 17,720 | |
50,119 | | | | Pfizer, Inc | | | 1,617,841 | |
| | | | | | | | |
| | | | TOTAL PHARMACEUTICALS, BIOTECHNOLOGY & LIFE SCIENCES | | | 5,512,717 | |
| | | | | | | | |
| |
REAL ESTATE - 1.8% | | | | |
2,804 | | | | Brixmor Property Group, Inc | | | 72,399 | |
325 | | * | | Lifestyle Properties Development Ltd | | | 72 | |
4,399 | | | | Post Properties, Inc | | | 260,245 | |
1,848 | | | | Potlatch Corp | | | 55,884 | |
28,725 | | | | Starwood Property Trust, Inc | | | 590,586 | |
543 | | | | Vornado Realty Trust | | | 54,278 | |
11
TIAA-CREF LIFE FUNDS - Large-Cap Value Fund
| | | | | | | | |
SHARES | | | | COMPANY | | VALUE | |
| | | | | | | | |
8,836 | | | | WP GLIMCHER, Inc | | $ | 93,750 | |
| | | | | | | | |
| | | | TOTAL REAL ESTATE | | | 1,127,214 | |
| | | | | | | | |
| |
RETAILING - 1.5% | | | | |
1,710 | | | | Expedia, Inc | | | 212,553 | |
43,828 | | * | | Groupon, Inc | | | 134,552 | |
200,000 | | | | Hengdeli Holdings Ltd | | | 29,105 | |
155,872 | | * | | Intime Retail Group Co Ltd | | | 152,807 | |
69,133 | | * | | JC Penney Co, Inc | | | 460,426 | |
| | | | | | | | |
| | | | TOTAL RETAILING | | | 989,443 | |
| | | | | | | | |
| |
SEMICONDUCTORS & SEMICONDUCTOR EQUIPMENT - 4.5% | | | | |
34,019 | | | | Advanced Semiconductor Engineering, Inc (ADR) | | | 192,888 | |
42,596 | | | | Cypress Semiconductor Corp | | | 417,867 | |
30,128 | | | | Intel Corp | | | 1,037,909 | |
30,464 | | | | Marvell Technology Group Ltd | | | 268,692 | |
7,172 | | * | | Mellanox Technologies Ltd | | | 302,228 | |
43,926 | | * | | ON Semiconductor Corp | | | 430,475 | |
5,300 | | | | Xilinx, Inc | | | 248,941 | |
| | | | | | | | |
| | | | TOTAL SEMICONDUCTORS & SEMICONDUCTOR EQUIPMENT | | | 2,899,000 | |
| | | | | | | | |
| |
SOFTWARE & SERVICES - 4.6% | | | | |
1,640 | | *,e | | Cimpress NV | | | 133,070 | |
2,199 | | * | | Citrix Systems, Inc | | | 166,354 | |
4,858 | | * | | eBay, Inc | | | 133,498 | |
2,691 | | * | | Fortinet, Inc | | | 83,878 | |
4,616 | | | | Mentor Graphics Corp | | | 85,027 | |
14,262 | | | | Microsoft Corp | | | 791,256 | |
1,310 | | * | | MicroStrategy, Inc (Class A) | | | 234,870 | |
7,088 | | | | Oracle Corp | | | 258,925 | |
2,285 | | * | | PTC, Inc | | | 79,130 | |
3,789 | | * | | Rackspace Hosting, Inc | | | 95,937 | |
4,419 | | | | Sabre Corp | | | 123,599 | |
8,597 | | | | Symantec Corp | | | 180,537 | |
17,725 | | * | | Yahoo!, Inc | | | 589,533 | |
| | | | | | | | |
| | | | TOTAL SOFTWARE & SERVICES | | | 2,955,614 | |
| | | | | | | | |
| |
TECHNOLOGY HARDWARE & EQUIPMENT - 4.8% | | | | |
5,389 | | * | | Ciena Corp | | | 111,498 | |
28,273 | | | | Cisco Systems, Inc | | | 767,753 | |
5,129 | | | | Corning, Inc | | | 93,758 | |
3,224 | | | | EMC Corp | | | 82,792 | |
23,850 | | * | | Hewlett Packard Enterprise Co | | | 362,520 | |
3,900 | | | | Hitachi High-Technologies Corp | | | 105,468 | |
15,018 | | | | HP, Inc | | | 177,813 | |
11,553 | | | | Juniper Networks, Inc | | | 318,863 | |
10,184 | | * | | Lumentum Holdings, Inc | | | 224,252 | |
64,452 | | | | Nokia Corp | | | 452,453 | |
2,438 | | | | Qualcomm, Inc | | | 121,864 | |
39,310 | | * | | Viavi Solutions, Inc | | | 239,398 | |
| | | | | | | | |
| | | | TOTAL TECHNOLOGY HARDWARE & EQUIPMENT | | | 3,058,432 | |
| | | | | | | | |
| |
TELECOMMUNICATION SERVICES - 2.9% | | | | |
23,843 | | | | AT&T, Inc | | | 820,438 | |
10,622 | | * | | Level 3 Communications, Inc | | | 577,412 | |
18,861 | | | | Telephone & Data Systems, Inc | | | 488,311 | |
| | | | | | | | |
| | | | TOTAL TELECOMMUNICATION SERVICES | | | 1,886,161 | |
| | | | | | | | |
| |
TRANSPORTATION - 1.9% | | | | |
9,501 | | | | American Airlines Group, Inc | | | 402,367 | |
15,994 | | *,b,m | | AMR Corp (Escrow) | | | 160 | |
973 | | | | FedEx Corp | | | 144,967 | |
12
TIAA-CREF LIFE FUNDS - Large-Cap Value Fund
| | | | | | | | |
SHARES | | | | COMPANY | | VALUE | |
| | | | | | | | |
16,774 | | * | | Hertz Global Holdings, Inc | | $ | 238,694 | |
4,977 | | | | Kansas City Southern Industries, Inc | | | 371,633 | |
1,527 | | * | | United Continental Holdings, Inc | | | 87,497 | |
| | | | | | | | |
| | | | TOTAL TRANSPORTATION | | | 1,245,318 | |
| | | | | | | | |
| | | |
UTILITIES - 3.6% | | | | | | | | |
3,302 | | | | Duke Energy Corp | | | 235,730 | |
2,512 | | | | Edison International | | | 148,735 | |
3,032 | | | | Exelon Corp | | | 84,199 | |
10,323 | | | | FirstEnergy Corp | | | 327,549 | |
6,910 | | | | NextEra Energy, Inc | | | 717,880 | |
10,835 | | | | NRG Energy, Inc | | | 127,528 | |
2,757 | | | | PG&E Corp | | | 146,645 | |
1,358 | | | | Sempra Energy | | | 127,665 | |
5,109 | | | | Westar Energy, Inc | | | 216,673 | |
4,382 | | | | Xcel Energy, Inc | | | 157,357 | |
| | | | | | | | |
| | | | TOTAL UTILITIES | | | 2,289,961 | |
| | | | | | | | |
| | | | TOTAL COMMON STOCKS (Cost $56,509,862) | | | 63,564,180 | |
| | | | | | �� | | |
| |
SHORT-TERM INVESTMENTS - 1.4% | | | | |
| |
INVESTMENTS IN REGISTERED INVESTMENT COMPANIES - 1.4% | | | | |
877,177 | | c | | TIAA-CREF Short Term Lending Portfolio of the State Street Navigator Securities Lending Trust | | | 877,177 | |
| | | | | | | | |
| | | | TOTAL INVESTMENTS IN REGISTERED INVESTMENT COMPANIES | | | 877,177 | |
| | | | | | | | |
| | | | TOTAL SHORT-TERM INVESTMENTS
(Cost $877,177) | | | 877,177 | |
| | | | | | | | |
| | | | TOTAL INVESTMENTS - 100.6%
(Cost $57,387,039) | | | 64,441,357 | |
| | | | OTHER ASSETS & LIABILITIES, NET - (0.6)% | | | (389,315 | ) |
| | | | | | | | |
| | | | NET ASSETS - 100.0% | | $ | 64,052,042 | |
| | | | | | | | |
Abbreviation(s):
| ADR | American Depositary Receipt |
| c | Investments made with cash collateral received from securities on loan. |
| e | All or a portion of these securities are out on loan. The aggregate value of securities on loan is $843,733. |
| m | Indicates a security that has been deemed illiquid. |
13
TIAA-CREF LIFE FUNDS - Real Estate Securities Fund
TIAA-CREF LIFE FUNDS
REAL ESTATE SECURITIES FUND
SCHEDULE OF INVESTMENTS
December 31, 2015
| | | | | | | | |
SHARES | | | | COMPANY | | VALUE | |
| | | | | | | | |
COMMON STOCKS - 98.0% | |
| |
ASSET MANAGEMENT & CUSTODY BANKS - 0.8% | | | | |
45,000 | | | | NorthStar Asset Management Group, Inc | | $ | 546,300 | |
| | | | | | | | |
| | | | TOTAL ASSET MANAGEMENT & CUSTODY BANKS | | | 546,300 | |
| | | | | | | | |
| |
DIVERSIFIED CAPITAL MARKETS - 0.3% | | | | |
8,000 | | | | HFF, Inc (Class A) | | | 248,560 | |
| | | | | | | | |
| | | | TOTAL DIVERSIFIED CAPITAL MARKETS | | | 248,560 | |
| | | | | | | | |
| |
DIVERSIFIED REITS - 3.2% | | | | |
135,000 | | | | Gramercy Property Trust | | | 1,042,200 | |
52,000 | | | | NorthStar Realty Finance Corp | | | 885,560 | |
40,000 | | | | Spirit Realty Capital, Inc | | | 400,800 | |
| | | | | | | | |
| | | | TOTAL DIVERSIFIED REITS | | | 2,328,560 | |
| | | | | | | | |
| |
HEALTH CARE FACILITIES - 0.3% | | | | |
10,180 | | * | | Brookdale Senior Living, Inc | | | 187,923 | |
| | | | | | | | |
| | | | TOTAL HEALTH CARE FACILITIES | | | 187,923 | |
| | | | | | | | |
| |
HOTELS, RESORTS & CRUISE LINES - 0.9% | | | | |
9,000 | | | | Starwood Hotels & Resorts Worldwide, Inc | | | 623,520 | |
| | | | | | | | |
| | | | TOTAL HOTELS, RESORTS & CRUISE LINES | | | 623,520 | |
| | | | | | | | |
| |
INDUSTRIAL REITS - 9.6% | | | | |
80,000 | | | | Prologis, Inc | | | 3,433,600 | |
145,000 | | | | Rexford Industrial Realty, Inc | | | 2,372,200 | |
55,000 | | | | Terreno Realty Corp | | | 1,244,100 | |
| | | | | | | | |
| | | | TOTAL INDUSTRIAL REITS | | | 7,049,900 | |
| | | | | | | | |
| |
MORTGAGE REITS - 0.8% | | | | |
30,000 | | | | Starwood Property Trust, Inc | | | 616,800 | |
| | | | | | | | |
| | | | TOTAL MORTGAGE REITS | | | 616,800 | |
| | | | | | | | |
| |
OFFICE REITS - 11.0% | | | | |
23,000 | | | | Boston Properties, Inc | | | 2,933,420 | |
22,000 | | | | Kilroy Realty Corp | | | 1,392,160 | |
24,000 | | | | NorthStar Realty Europe Corp | | | 283,440 | |
17,000 | | | | SL Green Realty Corp | | | 1,920,660 | |
15,000 | | | | Vornado Realty Trust | | | 1,499,400 | |
| | | | | | | | |
| | | | TOTAL OFFICE REITS | | | 8,029,080 | |
| | | | | | | | |
| |
REAL ESTATE OPERATING COMPANIES - 0.8% | | | | |
28,000 | | * | | Forest City Enterprises, Inc (Class A) | | | 614,040 | |
| | | | | | | | |
| | | | TOTAL REAL ESTATE OPERATING COMPANIES | | | 614,040 | |
| | | | | | | | |
| |
REAL ESTATE SERVICES - 1.6% | | | | |
30,000 | | | | Kennedy-Wilson Holdings, Inc | | | 722,400 | |
15,000 | | * | | Marcus & Millichap, Inc | | | 437,100 | |
| | | | | | | | |
| | | | TOTAL REAL ESTATE SERVICES | | | 1,159,500 | |
| | | | | | | | |
| |
RESIDENTIAL REITS - 20.7% | | | | |
30,000 | | | | Apartment Investment & Management Co (Class A) | | | 1,200,900 | |
21,000 | | | | AvalonBay Communities, Inc | | | 3,866,730 | |
14
TIAA-CREF LIFE FUNDS - Real Estate Securities Fund
| | | | | | | | |
SHARES | | | | COMPANY | | VALUE | |
| | | | | | | | |
24,000 | | | | Equity Lifestyle Properties, Inc | | $ | 1,600,080 | |
53,000 | | | | Equity Residential | | | 4,324,270 | |
11,500 | | | | Essex Property Trust, Inc | | | 2,753,215 | |
40,000 | | | | Monogram Residential Trust, Inc | | | 390,400 | |
15,000 | | | | Sun Communities, Inc | | | 1,027,950 | |
| | | | | | | | |
| | | | TOTAL RESIDENTIAL REITS | | | 15,163,545 | |
| | | | | | | | |
| |
RETAIL REITS - 21.3% | | | | |
60,000 | | | | DDR Corp | | | 1,010,400 | |
40,000 | | | | Equity One, Inc | | | 1,086,000 | |
16,000 | | | | Federal Realty Investment Trust | | | 2,337,600 | |
85,000 | | | | General Growth Properties, Inc | | | 2,312,850 | |
30,000 | | | | Retail Opportunities Investment Corp | | | 537,000 | |
36,000 | | | | Simon Property Group, Inc | | | 6,999,840 | |
17,000 | | | | Taubman Centers, Inc | | | 1,304,240 | |
| | | | | | | | |
| | | | TOTAL RETAIL REITS | | | 15,587,930 | |
| | | | | | | | |
| |
SPECIALIZED REITS - 26.7% | | | | |
28,000 | | | | American Tower Corp | | | 2,714,600 | |
17,000 | | | | Crown Castle International Corp | | | 1,469,650 | |
50,000 | | | | CubeSmart | | | 1,531,000 | |
5,000 | | | | Equinix, Inc | | | 1,512,000 | |
19,000 | | | | Extra Space Storage, Inc | | | 1,675,990 | |
30,000 | | | | Healthcare Trust of America, Inc | | | 809,100 | |
75,000 | | | | Host Marriott Corp | | | 1,150,500 | |
15,000 | | | | Plum Creek Timber Co, Inc | | | 715,800 | |
13,000 | | | | Public Storage, Inc | | | 3,220,100 | |
65,000 | | | | Sunstone Hotel Investors, Inc | | | 811,850 | |
14,000 | | | | Ventas, Inc | | | 790,020 | |
42,000 | | | | Welltower, Inc | | | 2,857,260 | |
12,000 | | | | Weyerhaeuser Co | | | 359,760 | |
| | | | | | | | |
| | | | TOTAL SPECIALIZED REITS | | | 19,617,630 | |
| | | | | | | | |
| | | | TOTAL COMMON STOCKS (Cost $52,230,488) | | | 71,773,288 | |
| | | | | | | | |
| | | | TOTAL INVESTMENTS - 98.0% (Cost $52,230,488) | | | 71,773,288 | |
| | | | OTHER ASSETS & LIABILITIES, NET - 2.0% | | | 1,449,766 | |
| | | | | | | | |
| | | | NET ASSETS - 100.0% | | $ | 73,223,054 | |
| | | | | | | | |
Abbreviation(s):
| REIT | Real Estate Investment Trust |
15
TIAA-CREF LIFE FUNDS - Small-Cap Equity Fund
TIAA-CREF LIFE FUNDS
SMALL-CAP EQUITY FUND
SCHEDULE OF INVESTMENTS
December 31, 2015
| | | | | | | | |
SHARES | | | | COMPANY | | VALUE | |
| | | | | | | | |
COMMON STOCKS - 100.2% | | | | |
| |
AUTOMOBILES & COMPONENTS - 1.3% | | | | |
10,340 | | * | | American Axle & Manufacturing Holdings, Inc | | $ | 195,840 | |
4,809 | | * | | Tenneco, Inc | | | 220,781 | |
1,880 | | * | | Visteon Corp | | | 215,260 | |
| | | | | | | | |
| | | | TOTAL AUTOMOBILES & COMPONENTS | | | 631,881 | |
| | | | | | | | |
| |
BANKS - 10.3% | | | | |
7,115 | | | | BankUnited | | | 256,567 | |
3,260 | | | | Banner Corp | | | 149,504 | |
14,110 | | | | Brookline Bancorp, Inc | | | 162,265 | |
18,231 | | | | Capitol Federal Financial | | | 228,981 | |
8,172 | | | | Cathay General Bancorp | | | 256,029 | |
5,850 | | | | Columbia Banking System, Inc | | | 190,183 | |
11,810 | | | | First Commonwealth Financial Corp | | | 107,117 | |
1,459 | | | | First Midwest Bancorp, Inc | | | 26,889 | |
21,293 | | | | Fulton Financial Corp | | | 277,022 | |
9,240 | | | | Great Western Bancorp, Inc | | | 268,145 | |
9,600 | | * | | Hilltop Holdings, Inc | | | 184,512 | |
30,424 | | | | Investors Bancorp, Inc | | | 378,475 | |
37,122 | | * | | MGIC Investment Corp | | | 327,787 | |
24,642 | | | | National Penn Bancshares, Inc | | | 303,836 | |
8,833 | | | | Oritani Financial Corp | | | 145,745 | |
5,711 | | | | Popular, Inc | | | 161,850 | |
8,679 | | | | PrivateBancorp, Inc | | | 356,013 | |
4,505 | | | | Prosperity Bancshares, Inc | | | 215,609 | |
13,850 | | | | Provident Financial Services, Inc | | | 279,077 | |
12,311 | | | | Sterling Bancorp/DE | | | 199,684 | |
18,030 | | | | Umpqua Holdings Corp | | | 286,677 | |
11,150 | | * | | Western Alliance Bancorp | | | 399,839 | |
| | | | | | | | |
| | | | TOTAL BANKS | | | 5,161,806 | |
| | | | | | | | |
| |
CAPITAL GOODS - 7.4% | | | | |
2,535 | | * | | American Woodmark Corp | | | 202,749 | |
3,900 | | | | Apogee Enterprises, Inc | | | 169,689 | |
4,100 | | | | Barnes Group, Inc | | | 145,099 | |
5,470 | | * | | Beacon Roofing Supply, Inc | | | 225,255 | |
6,189 | | | | Comfort Systems USA, Inc | | | 175,891 | |
3,012 | | | | Cubic Corp | | | 142,317 | |
3,353 | | | | Curtiss-Wright Corp | | | 229,680 | |
2,342 | | * | | DXP Enterprises, Inc | | | 53,398 | |
6,297 | | | | EMCOR Group, Inc | | | 302,508 | |
3,439 | | | | Encore Wire Corp | | | 127,553 | |
2,700 | | | | EnPro Industries, Inc | | | 118,368 | |
798 | | | | HEICO Corp | | | 43,379 | |
1,900 | | | | IDEX Corp | | | 145,559 | |
| | | | | | | | |
5,000 | | | | ITT Corp | | | 181,600 | |
4,487 | | | | John Bean Technologies Corp | | | 223,587 | |
2,774 | | * | | Masonite International Corp | | | 169,852 | |
2,500 | | * | | Moog, Inc (Class A) | | | 151,500 | |
4,900 | | * | | MRC Global, Inc | | | 63,210 | |
5,450 | | | | Mueller Industries, Inc | | | 147,695 | |
1,800 | | | | Orbital ATK, Inc | | | 160,812 | |
1,920 | | * | | Teledyne Technologies, Inc | | | 170,304 | |
2,708 | | | | Tennant Co | | | 152,352 | |
2,176 | | | | Universal Forest Products, Inc | | | 148,773 | |
| | | | | | | | |
| | | | TOTAL CAPITAL GOODS | | | 3,651,130 | |
| | | | | | | | |
16
TIAA-CREF LIFE FUNDS - Small-Cap Equity Fund
| | | | | | | | |
SHARES | | | | COMPANY | | VALUE | |
| | | | | | | | |
COMMERCIAL & PROFESSIONAL SERVICES - 2.9% | | | | |
3,700 | | | | Administaff, Inc | | $ | 178,155 | |
5,900 | | | | Herman Miller, Inc | | | 169,330 | |
3,600 | | | | Kforce, Inc | | | 91,008 | |
6,432 | | | | Korn/Ferry International | | | 213,414 | |
6,611 | | | | Rollins, Inc | | | 171,225 | |
7,100 | | | | Steelcase, Inc (Class A) | | | 105,790 | |
7,858 | | * | | TrueBlue, Inc | | | 202,422 | |
3,536 | | | | Viad Corp | | | 99,821 | |
4,712 | | * | | WageWorks, Inc | | | 213,783 | |
| | | | | | | | |
| | | | TOTAL COMMERCIAL & PROFESSIONAL SERVICES | | | 1,444,948 | |
| | | | | | | | |
| |
CONSUMER DURABLES & APPAREL - 3.0% | | | | |
3,990 | | | | Brunswick Corp | | | 201,535 | |
2,550 | | | | Columbia Sportswear Co | | | 124,338 | |
3,020 | | * | | G-III Apparel Group Ltd | | | 133,665 | |
1,600 | | * | | Helen of Troy Ltd | | | 150,800 | |
5,300 | | * | | Kate Spade & Co | | | 94,181 | |
5,970 | | | | La-Z-Boy, Inc | | | 145,787 | |
6,410 | | * | | Nautilus, Inc | | | 107,175 | |
2,296 | | | | Oxford Industries, Inc | | | 146,531 | |
4,871 | | * | | Steven Madden Ltd | | | 147,202 | |
18,410 | | * | | TRI Pointe Homes, Inc | | | 233,255 | |
| | | | | | | | |
| | | | TOTAL CONSUMER DURABLES & APPAREL | | | 1,484,469 | |
| | | | | | | | |
| |
CONSUMER SERVICES - 3.4% | | | | |
17,017 | | * | | Belmond Ltd. | | | 161,662 | |
7,800 | | | | Bloomin’ Brands, Inc | | | 131,742 | |
2,700 | | * | | Dave & Buster’s Entertainment, Inc | | | 112,698 | |
1,779 | | | | Domino’s Pizza, Inc | | | 197,914 | |
6,045 | | * | | Grand Canyon Education, Inc | | | 242,525 | |
3,800 | | | | Jack in the Box, Inc | | | 291,498 | |
6,573 | | * | | K12, Inc | | | 57,842 | |
10,200 | | * | | La Quinta Holdings, Inc | | | 138,822 | |
2,710 | | l | | Vail Resorts, Inc | | | 346,853 | |
| | | | | | | | |
| | | | TOTAL CONSUMER SERVICES | | | 1,681,556 | |
| | | | | | | | |
| |
DIVERSIFIED FINANCIALS - 0.4% | | | | |
3,365 | | | | Evercore Partners, Inc (Class A) | | | 181,945 | |
| | | | | | | | |
| | | | TOTAL DIVERSIFIED FINANCIALS | | | 181,945 | |
| | | | | | | | |
| |
ENERGY - 3.2% | | | | |
14,574 | | * | | Callon Petroleum Co | | | 121,547 | |
4,100 | | * | | Carrizo Oil & Gas, Inc | | | 121,278 | |
4,027 | | | | Delek US Holdings, Inc | | | 99,064 | |
2,048 | | * | | Exterran Corp | | | 32,871 | |
7,260 | | | | Green Plains Renewable Energy, Inc | | | 166,254 | |
6,708 | | * | | Matrix Service Co | | | 137,782 | |
38,470 | | *,e | | McDermott International, Inc | | | 128,875 | |
2,500 | | * | | PDC Energy, Inc | | | 133,450 | |
10,430 | | | | Questar Market Resources, Inc | | | 139,762 | |
15,475 | | * | | Renewable Energy Group, Inc | | | 143,763 | |
24,813 | | | | Scorpio Tankers, Inc | | | 199,000 | |
3,700 | | | | Western Refining, Inc | | | 131,794 | |
| | | | | | | | |
| | | | TOTAL ENERGY | | | 1,555,440 | |
| | | | | | | | |
| |
FOOD & STAPLES RETAILING - 1.1% | | | | |
2,898 | | | | Casey’s General Stores, Inc | | | 349,064 | |
31,600 | | * | | Supervalu, Inc | | | 214,248 | |
| | | | | | | | |
| | | | TOTAL FOOD & STAPLES RETAILING | | | 563,312 | |
| | | | | | | | |
17
TIAA-CREF LIFE FUNDS - Small-Cap Equity Fund
| | | | | | | | |
SHARES | | | | COMPANY | | VALUE | |
| | | | | | | | |
FOOD, BEVERAGE & TOBACCO - 2.1% | | | | |
15,500 | | * | | Darling International, Inc | | $ | 163,060 | |
11,330 | | | | Dean Foods Co | | | 194,310 | |
2,074 | | | | Lancaster Colony Corp | | | 239,464 | |
3,300 | | * | | Post Holdings, Inc | | | 203,610 | |
9,234 | | e | | Vector Group Ltd | | | 217,830 | |
| | | | | | | | |
| | | | TOTAL FOOD, BEVERAGE & TOBACCO | | | 1,018,274 | |
| | | | | | | | |
| |
HEALTH CARE EQUIPMENT & SERVICES - 6.7% | | | | |
2,900 | | * | | Abiomed, Inc | | | 261,812 | |
2,268 | | * | | Anika Therapeutics, Inc | | | 86,547 | |
6,632 | | * | | Globus Medical, Inc | | | 184,502 | |
6,232 | | * | | HealthStream, Inc | | | 137,104 | |
4,300 | | | | Hill-Rom Holdings, Inc | | | 206,658 | |
2,660 | | * | | ICU Medical, Inc | | | 299,995 | |
2,500 | | * | | Integra LifeSciences Holdings Corp | | | 169,450 | |
7,840 | | | | Kindred Healthcare, Inc | | | 93,374 | |
1,600 | | * | | LifePoint Hospitals, Inc | | | 117,440 | |
5,700 | | * | | Merit Medical Systems, Inc | | | 105,963 | |
3,841 | | * | | Natus Medical, Inc | | | 184,560 | |
4,330 | | * | | NuVasive, Inc | | | 234,296 | |
4,646 | | * | | Omnicell, Inc | | | 144,398 | |
20,322 | | * | | OraSure Technologies, Inc | | | 130,874 | |
5,401 | | * | | PharMerica Corp | | | 189,035 | |
4,973 | | * | | Premier, Inc | | | 175,398 | |
4,700 | | * | | Team Health Holdings, Inc | | | 206,283 | |
2,600 | | * | | Vascular Solutions, Inc | | | 89,414 | |
3,649 | | * | | WellCare Health Plans, Inc | | | 285,388 | |
| | | | | | | | |
| | | | TOTAL HEALTH CARE EQUIPMENT & SERVICES | | | 3,302,491 | |
| | | | | | | | |
| |
HOUSEHOLD & PERSONAL PRODUCTS - 0.5% | | | | |
3,850 | | | | Energizer Holdings, Inc | | | 131,131 | |
990 | | * | | USANA Health Sciences, Inc | | | 126,472 | |
| | | | | | | | |
| | | | TOTAL HOUSEHOLD & PERSONAL PRODUCTS | | | 257,603 | |
| | | | | | | | |
| |
INSURANCE - 3.3% | | | | |
8,826 | | | | American Equity Investment Life Holding Co | | | 212,089 | |
5,363 | | | | Aspen Insurance Holdings Ltd | | | 259,033 | |
816 | | | | Employers Holdings, Inc | | | 22,277 | |
4,304 | | e | | HCI Group, Inc | | | 149,994 | |
11,656 | | | | Old Republic International Corp | | | 217,151 | |
3,700 | | | | Primerica, Inc | | | 174,751 | |
6,120 | | | | Selective Insurance Group, Inc | | | 205,510 | |
9,851 | | * | | Third Point Reinsurance Ltd | | | 132,102 | |
4,400 | | e | | Universal Insurance Holdings, Inc | | | 101,992 | |
3,793 | | | | Validus Holdings Ltd | | | 175,578 | |
| | | | | | | | |
| | | | TOTAL INSURANCE | | | 1,650,477 | |
| | | | | | | | |
| |
MATERIALS - 4.7% | | | | |
4,606 | | | | A. Schulman, Inc | | | 141,128 | |
9,810 | | * | | Berry Plastics Group, Inc | | | 354,926 | |
3,600 | | * | | Boise Cascade Co | | | 91,908 | |
3,600 | | | | Cabot Corp | | | 147,168 | |
7,550 | | * | | Chemtura | | | 205,888 | |
15,681 | | | | Commercial Metals Co | | | 214,673 | |
4,155 | | | | Innospec, Inc | | | 225,658 | |
5,247 | | * | | Kraton Polymers LLC | | | 87,152 | |
13,500 | | * | | Louisiana-Pacific Corp | | | 243,135 | |
4,238 | | | | Minerals Technologies, Inc | | | 194,355 | |
2,700 | | | | Reliance Steel & Aluminum Co | | | 156,357 | |
2,607 | | | | Sensient Technologies Corp | | | 163,772 | |
2,500 | | *,e | | Trinseo S.A. | | | 70,500 | |
| | | | | | | | |
| | | | TOTAL MATERIALS | | | 2,296,620 | |
| | | | | | | | |
18
TIAA-CREF LIFE FUNDS - Small-Cap Equity Fund
| | | | | | | | |
SHARES | | | | COMPANY | | VALUE | |
| | | | | | | | |
MEDIA - 1.2% | | | | |
12,100 | | * | | Gray Television, Inc | | $ | 197,230 | |
10,760 | | * | | Live Nation, Inc | | | 264,373 | |
7,660 | | | | Time, Inc | | | 120,032 | |
| | | | | | | | |
| | | | TOTAL MEDIA | | | 581,635 | |
| | | | | | | | |
| |
PHARMACEUTICALS, BIOTECHNOLOGY & LIFE SCIENCES - 10.1% | | | | |
3,560 | | * | | Acadia Pharmaceuticals, Inc | | | 126,914 | |
2,130 | | * | | Acorda Therapeutics, Inc | | | 91,121 | |
7,766 | | * | | Agenus, Inc | | | 35,258 | |
1,297 | | * | | Alder Biopharmaceuticals, Inc | | | 42,840 | |
2,700 | | * | | AMAG Pharmaceuticals, Inc | | | 81,513 | |
6,100 | | *,e | | Amphastar Pharmaceuticals, Inc | | | 86,803 | |
1,560 | | * | | Anacor Pharmaceuticals, Inc | | | 176,233 | |
17,260 | | *,e | | Array Biopharma, Inc | | | 72,837 | |
1,100 | | * | | Atara Biotherapeutics, Inc | | | 29,051 | |
5,500 | | * | | BioCryst Pharmaceuticals, Inc | | | 56,760 | |
4,193 | | * | | Cambrex Corp | | | 197,448 | |
2,234 | | * | | Cara Therapeutics Inc | | | 37,665 | |
8,168 | | * | | Catalent, Inc | | | 204,445 | |
4,710 | | *,e | | Celldex Therapeutics, Inc | | | 73,853 | |
5,900 | | * | | Cepheid, Inc | | | 215,527 | |
9,411 | | * | | Cytokinetics, Inc | | | 98,439 | |
7,171 | | *,e | | Depomed, Inc | | | 130,010 | |
1,700 | | * | | Dermira, Inc | | | 58,837 | |
5,216 | | * | | FibroGen, Inc | | | 158,932 | |
2,100 | | * | | Five Prime Therapeutics, Inc | | | 87,150 | |
1,760 | | *,e | | Heron Therapeutics, Inc | | | 46,992 | |
2,040 | | *,e | | Immune Design Corp | | | 40,963 | |
6,072 | | * | | Impax Laboratories, Inc | | | 259,639 | |
6,014 | | * | | INC Research Holdings, Inc | | | 291,739 | |
9,460 | | * | | Infinity Pharmaceuticals, Inc | | | 74,261 | |
3,790 | | * | | Insmed, Inc | | | 68,788 | |
400 | | *,e | | Kite Pharma, Inc | | | 24,648 | |
2,810 | | * | | MacroGenics, Inc | | | 87,026 | |
4,409 | | * | | Medicines Co | | | 164,632 | |
6,442 | | *,e | | Merrimack Pharmaceuticals, Inc | | | 50,892 | |
3,526 | | * | | Momenta Pharmaceuticals, Inc | | | 52,326 | |
3,700 | | * | | Neurocrine Biosciences, Inc | | | 209,309 | |
2,100 | | *,e | | NewLink Genetics Corp | | | 76,419 | |
4,500 | | *,e | | Novavax, Inc | | | 37,755 | |
1,900 | | * | | Pacira Pharmaceuticals, Inc | | | 145,901 | |
3,760 | | * | | Parexel International Corp | | | 256,131 | |
2,900 | | | | Phibro Animal Health Corp | | | 87,377 | |
2,820 | | * | | Prestige Brands Holdings, Inc | | | 145,174 | |
1,767 | | * | | Prothena Corp plc | | | 120,350 | |
890 | | *,e | | Puma Biotechnology, Inc | | | 69,776 | |
2,500 | | * | | Retrophin, Inc | | | 48,225 | |
4,175 | | * | | Sagent Pharmaceuticals | | | 66,424 | |
11,720 | | * | | Spectrum Pharmaceuticals, Inc | | | 70,672 | |
4,010 | | * | | Sucampo Pharmaceuticals, Inc (Class A) | | | 69,333 | |
7,777 | | * | | Supernus Pharmaceuticals, Inc | | | 104,523 | |
1,690 | | *,e | | TESARO, Inc | | | 88,421 | |
1,388 | | * | | Ultragenyx Pharmaceutical, Inc | | | 155,706 | |
| | | | | | | | |
| | | | TOTAL PHARMACEUTICALS, BIOTECHNOLOGY & LIFE SCIENCES | | | 4,975,038 | |
| | | | | | | | |
| |
REAL ESTATE - 9.6% | | | | |
3,200 | | | | American Assets Trust,Inc | | | 122,720 | |
3,700 | | | | Coresite Realty | | | 209,864 | |
28,154 | | | | Cousins Properties, Inc | | | 265,492 | |
12,557 | | | | CubeSmart | | | 384,495 | |
21,948 | | | | DiamondRock Hospitality Co | | | 211,798 | |
9,340 | | | | DuPont Fabros Technology, Inc | | | 296,919 | |
2,680 | | | | EastGroup Properties, Inc | | | 149,035 | |
5,890 | | | | Entertainment Properties Trust | | | 344,271 | |
19
TIAA-CREF LIFE FUNDS - Small-Cap Equity Fund
| | | | | | | | |
SHARES | | | | COMPANY | | VALUE | |
| | | | | | | | |
11,500 | | | | First Industrial Realty Trust, Inc | | $ | 254,495 | |
4,293 | | | | Geo Group, Inc | | | 124,111 | |
6,600 | | | | Highwoods Properties, Inc | | | 287,760 | |
8,162 | | | | Kennedy-Wilson Holdings, Inc | | | 196,541 | |
17,306 | | | | Lexington Realty Trust | | | 138,448 | |
14,200 | | | | New Residential Investment Corp | | | 172,672 | |
2,309 | | | | PS Business Parks, Inc | | | 201,876 | |
12,173 | | | | Retail Opportunities Investment Corp | | | 217,897 | |
1,915 | | | | Saul Centers, Inc | | | 98,182 | |
3,927 | | | | Sovran Self Storage, Inc | | | 421,406 | |
14,735 | | | | Summit Hotel Properties, Inc | | | 176,083 | |
19,388 | | | | Sunstone Hotel Investors, Inc | | | 242,156 | |
9,127 | | | | Urban Edge Properties | | | 214,028 | |
| | | | | | | | |
| | | | TOTAL REAL ESTATE | | | 4,730,249 | |
| | | | | | | | |
| |
RETAILING - 3.1% | | | | |
5,300 | | e | | Abercrombie & Fitch Co (Class A) | | | 143,100 | |
11,950 | | e | | American Eagle Outfitters, Inc | | | 185,225 | |
15,000 | | * | | Ascena Retail Group, Inc | | | 147,750 | |
2,300 | | | | Cato Corp (Class A) | | | 84,686 | |
3,700 | | | | CST Brands, Inc | | | 144,818 | |
10,120 | | * | | Express Parent LLC | | | 174,874 | |
5,300 | | | | Finish Line, Inc (Class A) | | | 95,824 | |
2,100 | | | | Group 1 Automotive, Inc | | | 158,970 | |
20,200 | | * | | Office Depot, Inc | | | 113,928 | |
5,200 | | * | | Sally Beauty Holdings, Inc | | | 145,028 | |
6,600 | | * | | Select Comfort Corp | | | 141,306 | |
| | | | | | | | |
| | | | TOTAL RETAILING | | | 1,535,509 | |
| | | | | | | | |
| |
SEMICONDUCTORS & SEMICONDUCTOR EQUIPMENT - 4.1% | | | | |
5,472 | | * | | Advanced Energy Industries, Inc | | | 154,475 | |
2,955 | | * | | Cabot Microelectronics Corp | | | 129,370 | |
810 | | * | | Cavium Networks, Inc | | | 53,225 | |
4,600 | | * | | Cirrus Logic, Inc | | | 135,838 | |
1,600 | | * | | First Solar, Inc | | | 105,584 | |
8,100 | | * | | Inphi Corp | | | 218,862 | |
8,463 | | * | | Integrated Device Technology, Inc | | | 223,000 | |
12,405 | | | | Intersil Corp (Class A) | | | 158,288 | |
885 | | | | MKS Instruments, Inc | | | 31,860 | |
2,936 | | | | Monolithic Power Systems, Inc | | | 187,053 | |
5,459 | | * | | Photronics, Inc | | | 67,964 | |
9,152 | | * | | Rudolph Technologies, Inc | | | 130,141 | |
2,500 | | * | | Silicon Laboratories, Inc | | | 121,350 | |
6,500 | | | | Teradyne, Inc | | | 134,355 | |
6,350 | | | | Tessera Technologies, Inc | | | 190,563 | |
| | | | | | | | |
| | | | TOTAL SEMICONDUCTORS & SEMICONDUCTOR EQUIPMENT | | | 2,041,928 | |
| | | | | | | | |
| |
SOFTWARE & SERVICES - 10.2% | | | | |
5,740 | | * | | Aspen Technology, Inc | | | 216,742 | |
4,900 | | * | | BroadSoft, Inc | | | 173,264 | |
3,266 | | * | | EPAM Systems, Inc | | | 256,773 | |
9,221 | | * | | Everyday Health, Inc | | | 55,510 | |
5,800 | | * | | ExlService Holdings, Inc | | | 260,594 | |
4,140 | | * | | Gigamon, Inc | | | 110,000 | |
2,660 | | * | | Imperva, Inc | | | 168,404 | |
6,207 | | * | | Infoblox, Inc | | | 114,147 | |
10,049 | | * | | Liveperson, Inc | | | 67,831 | |
2,428 | | * | | LogMeIn, Inc | | | 162,919 | |
2,073 | | * | | Luxoft Holding, Inc | | | 159,890 | |
5,100 | | * | | Manhattan Associates, Inc | | | 337,467 | |
4,319 | | | | MAXIMUS, Inc | | | 242,944 | |
4,797 | | * | | NIC, Inc | | | 94,405 | |
10,900 | | * | | Nuance Communications, Inc | | | 216,801 | |
9,301 | | * | | Progress Software Corp | | | 223,224 | |
20
TIAA-CREF LIFE FUNDS - Small-Cap Equity Fund
| | | | | | | | |
SHARES | | | | COMPANY | | VALUE | |
| | | | | | | | |
5,030 | | * | | QLIK Technologies, Inc | | $ | 159,250 | |
5,100 | | * | | RealPage, Inc | | | 114,495 | |
8,100 | | * | | RingCentral, Inc | | | 190,998 | |
11,014 | | * | | Rubicon Project, Inc | | | 181,180 | |
1,865 | | * | | SPS Commerce, Inc | | | 130,942 | |
1,200 | | * | | Stamps.com, Inc | | | 131,532 | |
4,120 | | * | | Synchronoss Technologies, Inc | | | 145,148 | |
15,395 | | * | | TA Indigo Holding Corp | | | 139,633 | |
1,000 | | * | | Tableau Software, Inc | | | 94,220 | |
10,000 | | | | Travelport Worldwide Ltd | | | 129,000 | |
2,282 | | * | | Tyler Technologies, Inc | | | 397,798 | |
6,200 | | * | | VeriFone Systems, Inc | | | 173,724 | |
4,400 | | * | | Verint Systems, Inc | | | 178,464 | |
| | | | | | | | |
| | | | TOTAL SOFTWARE & SERVICES | | | 5,027,299 | |
| | | | | | | | |
| |
TECHNOLOGY HARDWARE & EQUIPMENT - 5.2% | | | | |
5,989 | | * | | Alliance Fiber Optic Products, Inc | | | 90,793 | |
2,230 | | * | | Anixter International, Inc | | | 134,670 | |
2,393 | | * | | Coherent, Inc | | | 155,808 | |
8,471 | | * | | II-VI, Inc | | | 157,222 | |
8,857 | | * | | Immersion Corp | | | 103,273 | |
3,413 | | | | InterDigital, Inc | | | 167,373 | |
9,900 | | * | | InvenSense, Inc | | | 101,277 | |
11,432 | | * | | Ixia | | | 142,100 | |
8,830 | | | | Jabil Circuit, Inc | | | 205,651 | |
4,800 | | * | | NCR Corp | | | 117,408 | |
2,600 | | * | | Netgear, Inc | | | 108,966 | |
6,000 | | * | | Netscout Systems, Inc | | | 184,200 | |
13,000 | | * | | Polycom, Inc | | | 163,670 | |
8,807 | | * | | Sanmina Corp | | | 181,248 | |
2,070 | | * | | Synaptics, Inc | | | 166,304 | |
2,580 | | * | | Tech Data Corp | | | 171,260 | |
13,939 | | * | | TTM Technologies, Inc | | | 90,743 | |
2,500 | | * | | Universal Display Corp | | | 136,100 | |
| | | | | | | | |
| | | | TOTAL TECHNOLOGY HARDWARE & EQUIPMENT | | | 2,578,066 | |
| | | | | | | | |
| |
TELECOMMUNICATION SERVICES - 1.5% | | | | |
23,998 | | * | | 8x8, Inc | | | 274,777 | |
13,505 | | | | Inteliquent, Inc | | | 239,984 | |
40,284 | | * | | Vonage Holdings Corp | | | 231,230 | |
| | | | | | | | |
| | | | TOTAL TELECOMMUNICATION SERVICES | | | 745,991 | |
| | | | | | | | |
| |
TRANSPORTATION - 2.1% | | | | |
16,438 | | * | | Air Transport Services Group, Inc | | | 165,695 | |
5,169 | | * | | Atlas Air Worldwide Holdings, Inc | | | 213,687 | |
3,700 | | * | | Hub Group, Inc (Class A) | | | 121,915 | |
3,646 | | | | Matson, Inc | | | 155,429 | |
10,111 | | | | Skywest, Inc | | | 192,311 | |
8,080 | | * | | UTI Worldwide, Inc | | | 56,802 | |
10,461 | | * | | YRC Worldwide, Inc | | | 148,337 | |
| | | | | | | | |
| | | | TOTAL TRANSPORTATION | | | 1,054,176 | |
| | | | | | | | |
| |
UTILITIES - 2.8% | | | | |
5,490 | | | | American States Water Co | | | 230,306 | |
8,263 | | | | Avista Corp | | | 292,263 | |
5,754 | | | | Black Hills Corp | | | 267,158 | |
7,600 | | | | Portland General Electric Co | | | 276,412 | |
6,810 | | | | South Jersey Industries, Inc | | | 160,171 | |
2,503 | | | | Southwest Gas Corp | | | 138,065 | |
| | | | | | | | |
| | | | TOTAL UTILITIES | | | 1,364,375 | |
| | | | | | | | |
| | | | TOTAL COMMON STOCKS
(Cost $45,628,863) | | | 49,516,218 | |
| | | | | | | | |
21
TIAA-CREF LIFE FUNDS - Small-Cap Equity Fund
| | | | | | | | |
SHARES | | | | COMPANY | | VALUE | |
| | | | | | | | |
SHORT-TERM INVESTMENTS - 2.9% | | | | |
| |
INVESTMENTS IN REGISTERED INVESTMENT COMPANIES - 2.9% | | | | |
1,424,802 | | c | | TIAA-CREF Short Term Lending Portfolio of the State Street Navigator Securities Lending Trust | | $ | 1,424,802 | |
| | | | | | | | |
| | | | TOTAL INVESTMENTS IN REGISTERED INVESTMENT COMPANIES | | | 1,424,802 | |
| | | | | | | | |
| | | | TOTAL SHORT-TERM INVESTMENTS
(Cost $1,424,802) | | | 1,424,802 | |
| | | | | | | | |
| | | | TOTAL INVESTMENTS - 103.1%
(Cost $47,053,665) | | | 50,941,020 | |
| | | | OTHER ASSETS & LIABILITIES, NET - (3.1)% | | | (1,538,441 | ) |
| | | | | | | | |
| | | | NET ASSETS - 100.0% | | $ | 49,402,579 | |
| | | | | | | | |
| c | Investments made with cash collateral received from securities on loan. |
| e | All or a portion of these securities are out on loan. The aggregate value of securities on loan is $1,367,222. |
| l | All or a portion of these securities have been segregated by the custodian to cover collateral requirements on swaps agreements. |
22
TIAA-CREF LIFE FUNDS - Social Choice Equity Fund
TIAA-CREF LIFE FUNDS
SOCIAL CHOICE EQUITY FUND
SCHEDULE OF INVESTMENTS
December 31, 2015
| | | | | | | | |
SHARES | | | | COMPANY | | VALUE | |
| | | | | | | | |
COMMON STOCKS - 99.4% | |
|
AUTOMOBILES & COMPONENTS - 1.8% | |
229 | | | | BorgWarner, Inc | | $ | 9,900 | |
23,923 | | | | Ford Motor Co | | | 337,075 | |
1,838 | | | | Harley-Davidson, Inc | | | 83,427 | |
5,792 | | | | Johnson Controls, Inc | | | 228,726 | |
292 | | * | | Modine Manufacturing Co | | | 2,643 | |
117 | | * | | Tenneco, Inc | | | 5,371 | |
752 | | * | | Tesla Motors, Inc | | | 180,487 | |
| | | | | | | | |
| | | | TOTAL AUTOMOBILES & COMPONENTS | | | 847,629 | |
| | | | | | | | |
|
BANKS - 3.9% | |
470 | | | | Associated Banc-Corp | | | 8,812 | |
196 | | | | Bank of Hawaii Corp | | | 12,328 | |
7,766 | | | | BB&T Corp | | | 293,632 | |
200 | | | | Boston Private Financial Holdings, Inc | | | 2,268 | |
207 | | | | Camden National Corp | | | 9,127 | |
38 | | | | Capitol Federal Financial | | | 477 | |
72 | | | | Centerstate Banks of Florida, Inc | | | 1,127 | |
1,091 | | | | CIT Group, Inc | | | 43,313 | |
1,597 | | | | Comerica, Inc | | | 66,803 | |
22 | | | | Community Bank System, Inc | | | 879 | |
69 | | | | Cullen/Frost Bankers, Inc | | | 4,140 | |
486 | | * | | FCB Financial Holdings, Inc | | | 17,394 | |
290 | | | | Federal Agricultural Mortgage Corp (Class C) | | | 9,155 | |
717 | | | | First Community Bancshares, Inc | | | 13,358 | |
414 | | * | | HomeStreet, Inc | | | 8,988 | |
581 | | * | | HomeTrust Bancshares, Inc | | | 11,765 | |
88 | | | | IBERIABANK Corp | | | 4,846 | |
13,273 | | | | Keycorp | | | 175,071 | |
2,110 | | | | M&T Bank Corp | | | 255,690 | |
528 | | * | | MGIC Investment Corp | | | 4,662 | |
1,477 | | | | New York Community Bancorp, Inc | | | 24,105 | |
333 | | | | OFG Bancorp | | | 2,438 | |
145 | | | | Old National Bancorp | | | 1,966 | |
199 | | | | PacWest Bancorp | | | 8,577 | |
18 | | | | Peoples Bancorp, Inc | | | 339 | |
189 | | | | People’s United Financial, Inc | | | 3,052 | |
176 | | * | | PHH Corp | | | 2,851 | |
3,541 | | | | PNC Financial Services Group, Inc | | | 337,493 | |
1,276 | | | | Popular, Inc | | | 36,162 | |
188 | | | | PrivateBancorp, Inc | | | 7,712 | |
355 | | | | Provident Financial Services, Inc | | | 7,153 | |
3,772 | | | | Radian Group, Inc | | | 50,507 | |
269 | | * | | SVB Financial Group | | | 31,984 | |
31 | | | | TCF Financial Corp | | | 438 | |
50 | | | | UMB Financial Corp | | | 2,327 | |
102 | | | | United Bankshares, Inc | | | 3,773 | |
8,861 | | | | US Bancorp | | | 378,099 | |
157 | | * | | Walker & Dunlop, Inc | | | 4,523 | |
107 | | | | Webster Financial Corp | | | 3,979 | |
49 | | | | Westamerica Bancorporation | | | 2,291 | |
169 | | | | Wilshire Bancorp, Inc | | | 1,952 | |
290 | | | | Zions Bancorporation | | | 7,917 | |
| | | | | | | | |
| | | | TOTAL BANKS | | | 1,863,473 | |
| | | | | | | | |
23
TIAA-CREF LIFE FUNDS - Social Choice Equity Fund
| | | | | | | | |
SHARES | | | | COMPANY | | VALUE | |
| | | | | | | | |
CAPITAL GOODS - 6.2% | | | | |
2,809 | | | | 3M Co | | $ | 423,148 | |
178 | | | | A.O. Smith Corp | | | 13,637 | |
3,470 | | | | Ametek, Inc | | | 185,957 | |
17 | | | | Applied Industrial Technologies, Inc | | | 688 | |
400 | | * | | ArvinMeritor, Inc | | | 3,340 | |
1,187 | | | | Barnes Group, Inc | | | 42,008 | |
200 | | | | Briggs & Stratton Corp | | | 3,460 | |
1,027 | | * | | Builders FirstSource, Inc | | | 11,379 | |
174 | | | | Caterpillar, Inc | | | 11,825 | |
33 | | * | | Chart Industries, Inc | | | 593 | |
81 | | * | | Colfax Corp | | | 1,891 | |
1,613 | | | | Cummins, Inc | | | 141,960 | |
3,753 | | | | Danaher Corp | | | 348,579 | |
2,607 | | | | Deere & Co | | | 198,836 | |
644 | | | | Dover Corp | | | 39,484 | |
2,685 | | | | Eaton Corp | | | 139,727 | |
72 | | | | EnerSys | | | 4,027 | |
139 | | * | | Esterline Technologies Corp | | | 11,259 | |
1,324 | | | | Fastenal Co | | | 54,046 | |
123 | | | | Fluor Corp | | | 5,808 | |
246 | | | | Graco, Inc | | | 17,729 | |
117 | | | | Hexcel Corp | | | 5,435 | |
3,067 | | | | Illinois Tool Works, Inc | | | 284,250 | |
1,107 | | | | Ingersoll-Rand plc | | | 61,206 | |
245 | | | | Lincoln Electric Holdings, Inc | | | 12,713 | |
3,766 | | | | Masco Corp | | | 106,578 | |
232 | | | | Nordson Corp | | | 14,883 | |
1,418 | | | | Owens Corning, Inc | | | 66,689 | |
2,211 | | | | Paccar, Inc | | | 104,801 | |
361 | | | | Parker Hannifin Corp | | | 35,010 | |
959 | | | | Pentair plc | | | 47,499 | |
1,254 | | | | Precision Castparts Corp | | | 290,941 | |
934 | | * | | Quanta Services, Inc | | | 18,913 | |
711 | | | | Rockwell Automation, Inc | | | 72,956 | |
205 | | | | Rockwell Collins, Inc | | | 18,921 | |
340 | | | | Roper Industries, Inc | | | 64,529 | |
55 | | | | TAL International Group, Inc | | | 874 | |
264 | | | | Tennant Co | | | 14,853 | |
143 | | | | Timken Co | | | 4,088 | |
328 | | * | | United Rentals, Inc | | | 23,793 | |
23 | | | | Valmont Industries, Inc | | | 2,438 | |
44 | | | | W.W. Grainger, Inc | | | 8,914 | |
179 | | | | Woodward Governor Co | | | 8,889 | |
86 | | | | Xylem, Inc | | | 3,139 | |
| | | | | | | | |
| | | | TOTAL CAPITAL GOODS | | | 2,931,693 | |
| | | | | | | | |
| |
COMMERCIAL & PROFESSIONAL SERVICES - 0.7% | | | | |
302 | | | | Acacia Research (Acacia Technologies) | | | 1,296 | |
2,963 | | * | | ACCO Brands Corp | | | 21,126 | |
93 | | | | CEB, Inc | | | 5,709 | |
245 | | | | Deluxe Corp | | | 13,362 | |
709 | | | | Dun & Bradstreet Corp | | | 73,686 | |
217 | | | | Equifax, Inc | | | 24,167 | |
366 | | | | Heidrick & Struggles International, Inc | | | 9,963 | |
168 | | | | HNI Corp | | | 6,058 | |
73 | | * | | IHS, Inc (Class A) | | | 8,646 | |
190 | | | | Interface, Inc | | | 3,637 | |
291 | | | | Manpower, Inc | | | 24,528 | |
1,111 | | | | R.R. Donnelley & Sons Co | | | 16,354 | |
1,338 | | | | Robert Half International, Inc | | | 63,073 | |
160 | | * | | RPX Corp | | | 1,760 | |
282 | | | | Tetra Tech, Inc | | | 7,338 | |
941 | | | | Waste Management, Inc | | | 50,221 | |
| | | | | | | | |
| | | | TOTAL COMMERCIAL & PROFESSIONAL SERVICES | | | 330,924 | |
| | | | | | | | |
24
TIAA-CREF LIFE FUNDS - Social Choice Equity Fund
| | | | | | | | |
SHARES | | | | COMPANY | | VALUE | |
| | | | | | | | |
CONSUMER DURABLES & APPAREL - 1.3% | | | | |
200 | | | | Callaway Golf Co | | $ | 1,884 | |
10 | | | | Columbia Sportswear Co | | | 487 | |
14 | | * | | Deckers Outdoor Corp | | | 661 | |
13 | | | | Hasbro, Inc | | | 876 | |
3,914 | | | | Mattel, Inc | | | 106,343 | |
72 | | * | | Meritage Homes Corp | | | 2,447 | |
95 | | * | | Mohawk Industries, Inc | | | 17,992 | |
200 | | | | Movado Group, Inc | | | 5,142 | |
6,412 | | | | Nike, Inc (Class B) | | | 400,750 | |
71 | | * | | Tempur-Pedic International, Inc | | | 5,003 | |
2 | | | | Tupperware Corp | | | 111 | |
506 | | * | | Under Armour, Inc (Class A) | | | 40,789 | |
323 | | | | VF Corp | | | 20,107 | |
92 | | | | Whirlpool Corp | | | 13,512 | |
| | | | | | | | |
| | | | TOTAL CONSUMER DURABLES & APPAREL | | | 616,104 | |
| | | | | | | | |
| |
CONSUMER SERVICES - 3.0% | | | | |
55 | | | | Bob Evans Farms, Inc | | | 2,137 | |
200 | | | | Brinker International, Inc | | | 9,590 | |
754 | | | | Choice Hotels International, Inc | | | 38,009 | |
800 | | | | Darden Restaurants, Inc | | | 50,912 | |
13 | | | | DineEquity, Inc | | | 1,101 | |
128 | | | | Domino’s Pizza, Inc | | | 14,240 | |
60 | | | | Dunkin Brands Group, Inc | | | 2,555 | |
2,846 | | | | Marriott International, Inc (Class A) | | | 190,796 | |
3,990 | | | | McDonald’s Corp | | | 471,378 | |
3,548 | | * | | MGM Resorts International | | | 80,611 | |
111 | | * | | Popeyes Louisiana Kitchen, Inc | | | 6,493 | |
333 | | | | Royal Caribbean Cruises Ltd | | | 33,703 | |
1,081 | | * | | Ruby Tuesday, Inc | | | 5,956 | |
58 | | * | | ServiceMaster Global Holdings, Inc | | | 2,276 | |
177 | | | | Sonic Corp | | | 5,719 | |
7,021 | | | | Starbucks Corp | | | 421,471 | |
1,075 | | | | Starwood Hotels & Resorts Worldwide, Inc | | | 74,476 | |
6 | | | | Vail Resorts, Inc | | | 768 | |
| | | | | | | | |
| | | | TOTAL CONSUMER SERVICES | | | 1,412,191 | |
| | | | | | | | |
| |
DIVERSIFIED FINANCIALS - 6.4% | | | | |
5,030 | | | | American Express Co | | | 349,836 | |
7,990 | | | | Bank of New York Mellon Corp | | | 329,348 | |
936 | | | | BlackRock, Inc | | | 318,727 | |
9,289 | | | | Charles Schwab Corp | | | 305,887 | |
2,462 | | | | CME Group, Inc | | | 223,057 | |
34 | | * | | Credit Acceptance Corp | | | 7,277 | |
4,703 | | | | Discover Financial Services | | | 252,175 | |
49 | | | | Factset Research Systems, Inc | | | 7,966 | |
3,534 | | | | Franklin Resources, Inc | | | 130,122 | |
221 | | * | | Green Dot Corp | | | 3,629 | |
1,022 | | | | IntercontinentalExchange Group, Inc | | | 261,898 | |
3,959 | | | | Invesco Ltd | | | 132,547 | |
466 | | | | Janus Capital Group, Inc | | | 6,566 | |
566 | | | | Legg Mason, Inc | | | 22,204 | |
785 | | | | NASDAQ OMX Group, Inc | | | 45,663 | |
3,726 | | | | Northern Trust Corp | | | 268,607 | |
3,559 | | | | State Street Corp | | | 236,175 | |
2,144 | | | | T Rowe Price Group, Inc | | | 153,275 | |
| | | | | | | | |
| | | | TOTAL DIVERSIFIED FINANCIALS | | | 3,054,959 | |
| | | | | | | | |
| |
ENERGY - 6.2% | | | | |
2,538 | | | | Apache Corp | | | 112,865 | |
49 | | | | Archrock, Inc | | | 368 | |
1,606 | | | | Baker Hughes, Inc | | | 74,117 | |
1,540 | | * | | Callon Petroleum Co | | | 12,844 | |
25
TIAA-CREF LIFE FUNDS - Social Choice Equity Fund
| | | | | | | | |
SHARES | | | | COMPANY | | VALUE | |
| | | | | | | | |
1,455 | | * | | Cameron International Corp | | $ | 91,956 | |
56 | | | | CARBO Ceramics, Inc | | | 963 | |
1,640 | | * | | Cheniere Energy, Inc | | | 61,090 | |
758 | | | | Cimarex Energy Co | | | 67,750 | |
2,376 | | * | | Clean Energy Fuels Corp | | | 8,554 | |
4,546 | | | | Columbia Pipeline Group, Inc | | | 90,920 | |
299 | | * | | Concho Resources, Inc | | | 27,765 | |
1,756 | | | | ConocoPhillips | | | 81,988 | |
2,323 | | * | | Continental Resources, Inc | | | 53,383 | |
3,677 | | | | Devon Energy Corp | | | 117,664 | |
3,732 | | | | EOG Resources, Inc | | | 264,188 | |
729 | | | | EQT Corp | | | 38,003 | |
25 | | * | | FMC Technologies, Inc | | | 725 | |
66 | | * | | Geospace Technologies Corp | | | 929 | |
2,768 | | | | Hess Corp | | | 134,193 | |
3,290 | | | | Kinder Morgan, Inc | | | 49,087 | |
4,618 | | | | Marathon Oil Corp | | | 58,141 | |
3,935 | | | | Marathon Petroleum Corp | | | 203,990 | |
22 | | * | | Matrix Service Co | | | 452 | |
3,753 | | | | National Oilwell Varco, Inc | | | 125,688 | |
347 | | * | | Natural Gas Services Group, Inc | | | 7,738 | |
2,468 | | | | Noble Energy, Inc | | | 81,271 | |
4,039 | | | | Occidental Petroleum Corp | | | 273,077 | |
4 | | | | Oceaneering International, Inc | | | 150 | |
2 | | * | | Oil States International, Inc | | | 54 | |
1,358 | | | | Oneok, Inc | | | 33,488 | |
3 | | * | | PDC Energy, Inc | | | 160 | |
3,548 | | | | Phillips 66 | | | 290,226 | |
1,135 | | | | Pioneer Natural Resources Co | | | 142,306 | |
12 | | | | Range Resources Corp | | | 295 | |
5 | | * | | SEACOR Holdings, Inc | | | 263 | |
588 | | | | SM Energy Co | | | 11,560 | |
398 | | * | | Southwestern Energy Co | | | 2,830 | |
7,118 | | | | Spectra Energy Corp | | | 170,405 | |
893 | | | | Superior Energy Services | | | 12,029 | |
81 | | | | Tesoro Corp | | | 8,535 | |
377 | | * | | Ultra Petroleum Corp | | | 943 | |
133 | | * | | Unit Corp | | | 1,623 | |
854 | | | | Valero Energy Corp | | | 60,386 | |
1,514 | | * | | Weatherford International Ltd | | | 12,702 | |
1,460 | | | | Western Refining, Inc | | | 52,005 | |
103 | | * | | Whiting Petroleum Corp | | | 972 | |
3,877 | | | | Williams Cos, Inc | | | 99,639 | |
| | | | | | | | |
| | | | TOTAL ENERGY | | | 2,940,280 | |
| | | | | | | | |
| |
FOOD & STAPLES RETAILING - 1.2% | | | | |
6,391 | | | | Kroger Co | | | 267,336 | |
128 | | | | Spartan Stores, Inc | | | 2,770 | |
6,073 | | | | Sysco Corp | | | 248,993 | |
1,505 | | | | Whole Foods Market, Inc | | | 50,417 | |
| | | | | | | | |
| | | | TOTAL FOOD & STAPLES RETAILING | | | 569,516 | |
| | | | | | | | |
| |
FOOD, BEVERAGE & TOBACCO - 4.2% | | | | |
286 | | | | Bunge Ltd | | | 19,528 | |
1,966 | | | | Campbell Soup Co | | | 103,313 | |
1,136 | | | | ConAgra Foods, Inc | | | 47,894 | |
151 | | * | | Darling International, Inc | | | 1,589 | |
302 | | | | Dr Pepper Snapple Group, Inc | | | 28,146 | |
127 | | | | Flowers Foods, Inc | | | 2,729 | |
5,148 | | | | General Mills, Inc | | | 296,834 | |
41 | | | | Hormel Foods Corp | | | 3,242 | |
286 | | | | J.M. Smucker Co | | | 35,275 | |
3,675 | | | | Kellogg Co | | | 265,592 | |
400 | | | | Keurig Green Mountain, Inc | | | 35,992 | |
26
TIAA-CREF LIFE FUNDS - Social Choice Equity Fund
| | | | | | | | |
SHARES | | | | COMPANY | | VALUE | |
| | | | | | | | |
2,275 | | | | Kraft Heinz Co | | $ | 165,529 | |
97 | | * | | Landec Corp | | | 1,148 | |
585 | | | | Mead Johnson Nutrition Co | | | 46,186 | |
8,638 | | | | Mondelez International, Inc | | | 387,328 | |
5,461 | | | | PepsiCo, Inc | | | 545,663 | |
88 | | | | Tootsie Roll Industries, Inc | | | 2,780 | |
| | | | | | | | |
| | | | TOTAL FOOD, BEVERAGE & TOBACCO | | | 1,988,768 | |
| | | | | | | | |
| |
HEALTH CARE EQUIPMENT & SERVICES - 4.0% | | | | |
489 | | * | | Acadia Healthcare Co, Inc | | | 30,543 | |
79 | | * | | Align Technology, Inc | | | 5,202 | |
844 | | * | | Amedisys, Inc | | | 33,186 | |
1,455 | | | | AmerisourceBergen Corp | | | 150,898 | |
389 | | * | | AMN Healthcare Services, Inc | | | 12,079 | |
55 | | * | | Amsurg Corp | | | 4,180 | |
1,112 | | | | Anthem, Inc | | | 155,057 | |
142 | | * | | athenahealth, Inc | | | 22,858 | |
702 | | * | | AtriCure, Inc | | | 15,753 | |
1,926 | | | | Becton Dickinson & Co | | | 296,777 | |
386 | | * | | Brookdale Senior Living, Inc | | | 7,126 | |
650 | | * | | Capital Senior Living Corp | | | 13,559 | |
2,071 | | | | Cardinal Health, Inc | | | 184,878 | |
963 | | * | | Centene Corp | | | 63,375 | |
275 | | * | | Cerner Corp | | | 16,547 | |
2,506 | | * | | Cerus Corp | | | 15,838 | |
41 | | | | Chemed Corp | | | 6,142 | |
1,547 | | | | Cigna Corp | | | 226,373 | |
55 | | | | Dentsply International, Inc | | | 3,347 | |
336 | | * | | Edwards Lifesciences Corp | | | 26,537 | |
434 | | * | | ExamWorks Group, Inc | | | 11,544 | |
1,269 | | * | | GenMark Diagnostics, Inc | | | 9,847 | |
85 | | * | | Greatbatch, Inc | | | 4,463 | |
875 | | * | | Healthways, Inc | | | 11,261 | |
147 | | * | | Henry Schein, Inc | | | 23,254 | |
84 | | * | | HMS Holdings Corp | | | 1,037 | |
328 | | * | | Hologic, Inc | | | 12,690 | |
1,038 | | | | Humana, Inc | | | 185,293 | |
609 | | * | | Idexx Laboratories, Inc | | | 44,408 | |
599 | | * | | Inverness Medical Innovations, Inc | | | 23,415 | |
555 | | * | | LDR Holding Corp | | | 13,936 | |
389 | | * | | LHC Group, Inc | | | 17,618 | |
548 | | * | | LifePoint Hospitals, Inc | | | 40,223 | |
534 | | * | | Molina Healthcare, Inc | | | 32,109 | |
60 | | * | | Natus Medical, Inc | | | 2,883 | |
645 | | * | | Omnicell, Inc | | | 20,047 | |
1,080 | | * | | OraSure Technologies, Inc | | | 6,955 | |
61 | | | | Owens & Minor, Inc | | | 2,195 | |
634 | | | | Patterson Cos, Inc | | | 28,663 | |
580 | | * | | PharMerica Corp | | | 20,300 | |
324 | | * | | Premier, Inc | | | 11,428 | |
321 | | * | | Providence Service Corp | | | 15,061 | |
35 | | * | | Sirona Dental Systems, Inc | | | 3,835 | |
388 | | * | | Surgical Care Affiliates, Inc | | | 15,446 | |
111 | | * | | Triple-S Management Corp (Class B) | | | 2,654 | |
1,177 | | | | Universal American Corp | | | 8,239 | |
340 | | | | US Physical Therapy, Inc | | | 18,251 | |
516 | | * | | Vascular Solutions, Inc | | | 17,745 | |
775 | | * | | Vocera Communications, Inc | | | 9,455 | |
| | | | | | | | |
| | | | TOTAL HEALTH CARE EQUIPMENT & SERVICES | | | 1,904,510 | |
| | | | | | | | |
| |
HOUSEHOLD & PERSONAL PRODUCTS - 2.5% | | | | |
5 | | | | Clorox Co | | | 634 | |
4,937 | | | | Colgate-Palmolive Co | | | 328,903 | |
1,031 | | | | Estee Lauder Cos (Class A) | | | 90,790 | |
27
TIAA-CREF LIFE FUNDS - Social Choice Equity Fund
| | | | | | | | |
SHARES | | | | COMPANY | | VALUE | |
| | | | | | | | |
724 | | | | Kimberly-Clark Corp | | $ | 92,165 | |
350 | | * | | Medifast, Inc | | | 10,633 | |
8,539 | | | | Procter & Gamble Co | | | 678,082 | |
| | | | | | | | |
| | | | TOTAL HOUSEHOLD & PERSONAL PRODUCTS | | | 1,201,207 | |
| | | | | | | | |
| |
INSURANCE - 5.8% | | | | |
2,611 | | | | ACE Ltd | | | 305,095 | |
4,542 | | | | Aflac, Inc | | | 272,066 | |
105 | | | | Arthur J. Gallagher & Co | | | 4,299 | |
959 | | | | Aspen Insurance Holdings Ltd | | | 46,320 | |
239 | | | | Axis Capital Holdings Ltd | | | 13,437 | |
5,661 | | * | | Berkshire Hathaway, Inc (Class B) | | | 747,478 | |
2,177 | | | | Chubb Corp | | | 288,757 | |
2,226 | | | | Hartford Financial Services Group, Inc | | | 96,742 | |
1,559 | | | | Marsh & McLennan Cos, Inc | | | 86,446 | |
104 | | | | PartnerRe Ltd | | | 14,533 | |
2,300 | | | | Principal Financial Group | | | 103,454 | |
14 | | | | ProAssurance Corp | | | 679 | |
5,214 | | | | Progressive Corp | | | 165,805 | |
3,619 | | | | Prudential Financial, Inc | | | 294,623 | |
156 | | | | RenaissanceRe Holdings Ltd | | | 17,658 | |
124 | | | | Stewart Information Services Corp | | | 4,629 | |
2,681 | | | | Travelers Cos, Inc | | | 302,578 | |
| | | | | | | | |
| | | | TOTAL INSURANCE | | | 2,764,599 | |
| | | | | | | | |
| |
MATERIALS - 4.0% | | | | |
2,153 | | | | Air Products & Chemicals, Inc | | | 280,127 | |
59 | | | | Albemarle Corp | | | 3,305 | |
47 | | | | Aptargroup, Inc | | | 3,415 | |
1,404 | | | | Avery Dennison Corp | | | 87,975 | |
611 | | | | Ball Corp | | | 44,438 | |
6 | | | | Bemis Co, Inc | | | 268 | |
64 | | | | Carpenter Technology Corp | | | 1,937 | |
456 | | | | Celanese Corp (Series A) | | | 30,702 | |
699 | | * | | Century Aluminum Co | | | 3,090 | |
18 | | * | | Clearwater Paper Corp | | | 820 | |
1,284 | | | | Commercial Metals Co | | | 17,578 | |
110 | | | | Compass Minerals International, Inc | | | 8,280 | |
344 | | | | Eastman Chemical Co | | | 23,223 | |
2,527 | | | | Ecolab, Inc | | | 289,038 | |
265 | | * | | Flotek Industries, Inc | | | 3,032 | |
695 | | | | H.B. Fuller Co | | | 25,347 | |
182 | | | | Innophos Holdings, Inc | | | 5,274 | |
72 | | | | International Flavors & Fragrances, Inc | | | 8,614 | |
1,821 | | | | International Paper Co | | | 68,652 | |
1,436 | | * | | Louisiana-Pacific Corp | | | 25,862 | |
2,755 | | | | LyondellBasell Industries AF S.C.A | | | 239,410 | |
394 | | | | Minerals Technologies, Inc | | | 18,069 | |
946 | | | | Mosaic Co | | | 26,100 | |
4,076 | | | | Nucor Corp | | | 164,263 | |
121 | | | | PolyOne Corp | | | 3,843 | |
2,386 | | | | Praxair, Inc | | | 244,326 | |
102 | | | | Reliance Steel & Aluminum Co | | | 5,907 | |
1,060 | | | | Royal Gold, Inc | | | 38,658 | |
157 | | | | Sealed Air Corp | | | 7,002 | |
209 | | | | Sherwin-Williams Co | | | 54,256 | |
586 | | * | | Stillwater Mining Co | | | 5,022 | |
532 | | | | Valspar Corp | | | 44,129 | |
79 | | | | Wausau Paper Corp | | | 808 | |
1,333 | | | | WestRock Co | | | 60,811 | |
1,008 | | | | Worthington Industries, Inc | | | 30,381 | |
| | | | | | | | |
| | | | TOTAL MATERIALS | | | 1,873,962 | |
| | | | | | | | |
28
TIAA-CREF LIFE FUNDS - Social Choice Equity Fund
| | | | | | | | |
SHARES | | | | COMPANY | | VALUE | |
| | | | | | | | |
MEDIA - 3.3% | | | | |
425 | | * | | Charter Communications, Inc | | $ | 77,818 | |
156 | | | | Cinemark Holdings, Inc | | | 5,215 | |
1,162 | | * | | Clear Channel Outdoor Holdings, Inc (Class A) | | | 6,496 | |
2,735 | | * | | Discovery Communications, Inc (Class A) | | | 72,970 | |
3,954 | | * | | Discovery Communications, Inc (Class C) | | | 99,720 | |
496 | | * | | DreamWorks Animation SKG, Inc (Class A) | | | 12,782 | |
1,519 | | | | Entravision Communications Corp (Class A) | | | 11,711 | |
83 | | | | John Wiley & Sons, Inc (Class A) | | | 3,737 | |
2,180 | | | | New York Times Co (Class A) | | | 29,256 | |
149 | | | | Scripps Networks Interactive (Class A) | | | 8,226 | |
610 | | | | Sinclair Broadcast Group, Inc (Class A) | | | 19,849 | |
1,849 | | | | Time Warner Cable, Inc | | | 343,156 | |
4,680 | | | | Time Warner, Inc | | | 302,656 | |
5,701 | | | | Walt Disney Co | | | 599,061 | |
| | | | | | | | |
| | | | TOTAL MEDIA | | | 1,592,653 | |
| | | | | | | | |
| |
PHARMACEUTICALS, BIOTECHNOLOGY & LIFE SCIENCES - 10.8% | | | | |
430 | | * | | Acadia Pharmaceuticals, Inc | | | 15,330 | |
702 | | * | | Affymetrix, Inc | | | 7,083 | |
3,090 | | | | Agilent Technologies, Inc | | | 129,193 | |
1,581 | | * | | Akorn, Inc | | | 58,987 | |
1,080 | | * | | Alexion Pharmaceuticals, Inc | | | 206,010 | |
3,009 | | | | Amgen, Inc | | | 488,451 | |
521 | | * | | Ariad Pharmaceuticals, Inc | | | 3,256 | |
1,073 | | * | | Biogen Idec, Inc | | | 328,713 | |
729 | | * | | BioMarin Pharmaceutical, Inc | | | 76,370 | |
24 | | | | Bio-Techne Corp | | | 2,160 | |
414 | | * | | Bluebird Bio, Inc | | | 26,587 | |
6,848 | | | | Bristol-Myers Squibb Co | | | 471,074 | |
639 | | * | | Cambrex Corp | | | 30,091 | |
3,318 | | * | | Celgene Corp | | | 397,364 | |
629 | | * | | Cempra, Inc | | | 19,581 | |
555 | | * | | Cepheid, Inc | | | 20,274 | |
1,518 | | * | | Depomed, Inc | | | 27,521 | |
5,337 | | | | Gilead Sciences, Inc | | | 540,051 | |
969 | | * | | Immunomedics, Inc | | | 2,975 | |
414 | | * | | Intra-Cellular Therapies, Inc | | | 22,269 | |
8,123 | | | | Johnson & Johnson | | | 834,395 | |
317 | | * | | Kite Pharma, Inc | | | 19,534 | |
3,159 | | * | | MannKind Corp | | | 4,581 | |
10,340 | | | | Merck & Co, Inc | | | 546,159 | |
23 | | * | | Mettler-Toledo International, Inc | | | 7,800 | |
1,190 | | * | | MiMedx Group, Inc | | | 11,150 | |
1,888 | | * | | Nektar Therapeutics | | | 31,813 | |
2,037 | | * | | Opko Health, Inc | | | 20,472 | |
4,450 | | * | | Orexigen Therapeutics, Inc | | | 7,654 | |
122 | | | | PerkinElmer, Inc | | | 6,536 | |
485 | | * | | Prothena Corp plc | | | 33,033 | |
121 | | * | | Quintiles Transnational Holdings, Inc | | | 8,308 | |
580 | | * | | Relypsa, Inc | | | 16,437 | |
238 | | * | | Repligen Corp | | | 6,733 | |
50 | | * | | Sage Therapeutics, Inc | | | 2,915 | |
1,256 | | * | | Sangamo Biosciences, Inc | | | 11,467 | |
902 | | * | | Sarepta Therapeutics, Inc | | | 34,799 | |
743 | | * | | Sucampo Pharmaceuticals, Inc (Class A) | | | 12,847 | |
138 | | * | | TESARO, Inc | | | 7,220 | |
1,080 | | * | | Tetraphase Pharmaceuticals, Inc | | | 10,832 | |
1,486 | | | | Thermo Electron Corp | | | 210,789 | |
1,340 | | * | | Vertex Pharmaceuticals, Inc | | | 168,612 | |
562 | | * | | Waters Corp | | | 75,634 | |
1,776 | | * | | Xenoport, Inc | | | 9,750 | |
493 | | * | | Zafgen, Inc | | | 3,101 | |
3,032 | | | | Zoetis Inc | | | 145,293 | |
| | | | | | | | |
| | | | TOTAL PHARMACEUTICALS, BIOTECHNOLOGY & LIFE SCIENCES | | | 5,121,204 | |
| | | | | | | | |
29
TIAA-CREF LIFE FUNDS - Social Choice Equity Fund
| | | | | | | | |
SHARES | | | | COMPANY | | VALUE | |
| | | | | | | | |
REAL ESTATE - 4.6% | | | | |
203 | | | | American Campus Communities, Inc | | $ | 8,392 | |
3,213 | | | | American Tower Corp | | | 311,501 | |
11,186 | | | | Annaly Capital Management, Inc | | | 104,925 | |
961 | | | | Boston Properties, Inc | | | 122,566 | |
1,680 | | * | | CBRE Group, Inc | | | 58,094 | |
339 | | | | Coresite Realty | | | 19,228 | |
2,671 | | | | Crown Castle International Corp | | | 230,908 | |
64 | | | | Digital Realty Trust, Inc | | | 4,840 | |
165 | | | | Douglas Emmett, Inc | | | 5,145 | |
1,687 | | | | Duke Realty Corp | | | 35,461 | |
29 | | | | Equity One, Inc | | | 787 | |
1,322 | | | | Equity Residential | | | 107,862 | |
1,212 | | | | First Industrial Realty Trust, Inc | | | 26,821 | |
4,150 | | | | HCP, Inc | | | 158,696 | |
89 | | | | Healthcare Realty Trust, Inc | | | 2,520 | |
5,118 | | | | Host Marriott Corp | | | 78,510 | |
968 | | | | Iron Mountain, Inc | | | 26,146 | |
15 | | | | Jones Lang LaSalle, Inc | | | 2,398 | |
14 | | | | Kilroy Realty Corp | | | 886 | |
325 | | | | Liberty Property Trust | | | 10,091 | |
488 | | | | Macerich Co | | | 39,377 | |
213 | | | | Mid-America Apartment Communities, Inc | | | 19,342 | |
4,055 | | | | Prologis, Inc | | | 174,040 | |
765 | | | | Ryman Hospitality Properties | | | 39,505 | |
1,846 | | | | Simon Property Group, Inc | | | 358,936 | |
860 | | | | Ventas, Inc | | | 48,530 | |
1,079 | | | | Vornado Realty Trust | | | 107,857 | |
17 | | | | Washington REIT | | | 460 | |
1,122 | | | | Welltower, Inc | | | 76,330 | |
149 | | | | Weyerhaeuser Co | | | 4,467 | |
| | | | | | | | |
| | | | TOTAL REAL ESTATE | | | 2,184,621 | |
| | | | | | | | |
| |
RETAILING - 3.2% | | | | |
1,088 | | * | | 1-800-FLOWERS.COM, Inc (Class A) | | | 7,921 | |
77 | | | | Aaron’s, Inc | | | 1,724 | |
1,224 | | | | American Eagle Outfitters, Inc | | | 18,972 | |
318 | | * | | AutoZone, Inc | | | 235,927 | |
1,626 | | * | | Bed Bath & Beyond, Inc | | | 78,455 | |
1,193 | | | | Best Buy Co, Inc | | | 36,327 | |
62 | | * | | Cabela’s, Inc | | | 2,897 | |
852 | | * | | Carmax, Inc | | | 45,982 | |
8 | | | | Chico’s FAS, Inc | | | 85 | |
403 | | * | | FTD Cos, Inc | | | 10,547 | |
6 | | | | GameStop Corp (Class A) | | | 168 | |
4,256 | | | | Gap, Inc | | | 105,123 | |
259 | | | | GNC Holdings, Inc | | | 8,034 | |
270 | | | | HSN, Inc | | | 13,681 | |
1,923 | | | | Kohl’s Corp | | | 91,592 | |
202 | | * | | LKQ Corp | | | 5,985 | |
5,027 | | | | Lowe’s Companies, Inc | | | 382,253 | |
2,212 | | * | | NetFlix, Inc | | | 253,009 | |
701 | | | | Nordstrom, Inc | | | 34,917 | |
1,890 | | * | | Office Depot, Inc | | | 10,660 | |
69 | | | | Outerwall, Inc | | | 2,521 | |
359 | | * | | Overstock.com, Inc | | | 4,409 | |
278 | | | | Pier 1 Imports, Inc | | | 1,415 | |
753 | | | | Ross Stores, Inc | | | 40,519 | |
503 | | * | | Shutterfly, Inc | | | 22,414 | |
5,018 | | | | Staples, Inc | | | 47,520 | |
135 | | | | Tiffany & Co | | | 10,299 | |
205 | | * | | Ulta Salon Cosmetics & Fragrance, Inc | | | 37,925 | |
7 | | | | Williams-Sonoma, Inc | | | 409 | |
66 | | | | Winmark Corp | | | 6,139 | |
| | | | | | | | |
| | | | TOTAL RETAILING | | | 1,517,829 | |
| | | | | | | | |
30
TIAA-CREF LIFE FUNDS - Social Choice Equity Fund
| | | | | | | | |
SHARES | | | | COMPANY | | VALUE | |
| | | | | | | | |
SEMICONDUCTORS & SEMICONDUCTOR EQUIPMENT - 2.9% | | | | |
652 | | * | | Advanced Micro Devices, Inc | | $ | 1,871 | |
9 | | | | Analog Devices, Inc | | | 498 | |
13,348 | | | | Applied Materials, Inc | | | 249,207 | |
125 | | * | | Cirrus Logic, Inc | | | 3,691 | |
16,786 | | | | Intel Corp | | | 578,278 | |
227 | | | | Lam Research Corp | | | 18,028 | |
111 | | | | Microchip Technology, Inc | | | 5,166 | |
5,111 | | * | | ON Semiconductor Corp | | | 50,088 | |
842 | | | | Skyworks Solutions, Inc | | | 64,691 | |
902 | | * | | SunPower Corp | | | 27,069 | |
315 | | | | Teradyne, Inc | | | 6,511 | |
6,339 | | | | Texas Instruments, Inc | | | 347,441 | |
| | | | | | | | |
| | | | TOTAL SEMICONDUCTORS & SEMICONDUCTOR EQUIPMENT | | | 1,352,539 | |
| | | | | | | | |
| |
SOFTWARE & SERVICES - 11.9% | | | | |
3,585 | | | | Accenture plc | | | 374,632 | |
756 | | * | | Actua Corp | | | 8,656 | |
3,517 | | * | | Adobe Systems, Inc | | | 330,387 | |
793 | | * | | Alphabet, Inc (Class A) | | | 616,962 | |
809 | | * | | Alphabet, Inc (Class C) | | | 613,934 | |
1,319 | | * | | Angie’s List, Inc | | | 12,333 | |
1,582 | | * | | Autodesk, Inc | | | 96,391 | |
727 | | | | Automatic Data Processing, Inc | | | 61,591 | |
1,228 | | | | Broadridge Financial Solutions, Inc | | | 65,980 | |
4,000 | | | | CA, Inc | | | 114,240 | |
191 | | * | | Cadence Design Systems, Inc | | | 3,975 | |
31 | | * | | Cimpress NV | | | 2,515 | |
5,105 | | * | | Cognizant Technology Solutions Corp (Class A) | | | 306,402 | |
505 | | * | | comScore, Inc | | | 20,781 | |
155 | | | | Convergys Corp | | | 3,858 | |
532 | | * | | Ellie Mae, Inc | | | 32,042 | |
54 | | | | Fair Isaac Corp | | | 5,086 | |
1,096 | | * | | FireEye, Inc | | | 22,731 | |
3,848 | | * | | Glu Mobile, Inc | | | 9,351 | |
121 | | * | | Infoblox, Inc | | | 2,225 | |
1,513 | | * | | Internap Network Services Corp | | | 9,683 | |
3,608 | | | | International Business Machines Corp | | | 496,533 | |
2,922 | | | | Intuit, Inc | | | 281,973 | |
695 | | | | j2 Global, Inc | | | 57,212 | |
533 | | * | | Liquidity Services, Inc | | | 3,465 | |
262 | | * | | Manhattan Associates, Inc | | | 17,337 | |
587 | | * | | Marketo, Inc | | | 16,853 | |
4,493 | | | | Mastercard, Inc (Class A) | | | 437,438 | |
2,640 | | * | | Monster Worldwide, Inc | | | 15,127 | |
55 | | * | | NetSuite, Inc | | | 4,654 | |
189 | | * | | NeuStar, Inc (Class A) | | | 4,530 | |
12,801 | | | | Oracle Corp | | | 467,621 | |
635 | | * | | Perficient, Inc | | | 10,871 | |
417 | | * | | Qualys, Inc | | | 13,799 | |
4,303 | | * | | Salesforce.com, Inc | | | 337,355 | |
1,102 | | * | | ServiceSource International LLC | | | 5,080 | |
123 | | * | | SolarWinds, Inc | | | 7,245 | |
268 | | * | | Stamps.com, Inc | | | 29,375 | |
7,639 | | | | Symantec Corp | | | 160,419 | |
118 | | * | | Syntel, Inc | | | 5,340 | |
214 | | * | | Teradata Corp | | | 5,654 | |
17 | | * | | Tyler Technologies, Inc | | | 2,963 | |
67 | | * | | Ultimate Software Group, Inc | | | 13,099 | |
150 | | * | | Unisys Corp | | | 1,658 | |
496 | | * | | Vasco Data Security International | | | 8,298 | |
898 | | * | | Website Pros, Inc | | | 17,969 | |
441 | | * | | Workday, Inc | | | 35,139 | |
19,943 | | | | Xerox Corp | | | 211,994 | |
7,160 | | * | | Yahoo!, Inc | | | 238,142 | |
| | | | | | | | |
| | | | TOTAL SOFTWARE & SERVICES | | | 5,620,898 | |
| | | | | | | | |
31
TIAA-CREF LIFE FUNDS - Social Choice Equity Fund
| | | | | | | | |
SHARES | | | | COMPANY | | VALUE | |
| | | | | | | | |
TECHNOLOGY HARDWARE & EQUIPMENT - 3.6% | | | | |
41 | | | | Belden CDT, Inc | | $ | 1,955 | |
147 | | * | | Benchmark Electronics, Inc | | | 3,038 | |
681 | | | | Black Box Corp | | | 6,490 | |
19,287 | | | | Cisco Systems, Inc | | | 523,738 | |
42 | | | | Cognex Corp | | | 1,418 | |
3,180 | | | | Corning, Inc | | | 58,130 | |
800 | | * | | Cray, Inc | | | 25,960 | |
12,660 | | | | EMC Corp | | | 325,109 | |
1,050 | | * | | Finisar Corp | | | 15,267 | |
12,211 | | | | HP, Inc | | | 144,578 | |
550 | | | | Ingram Micro, Inc (Class A) | | | 16,709 | |
169 | | | | InterDigital, Inc | | | 8,288 | |
306 | | * | | IPG Photonics Corp | | | 27,283 | |
14 | | * | | Itron, Inc | | | 506 | |
462 | | | | Jabil Circuit, Inc | | | 10,760 | |
554 | | | | Lexmark International, Inc (Class A) | | | 17,977 | |
1,584 | | | | Motorola, Inc | | | 108,425 | |
60 | | * | | Netgear, Inc | | | 2,515 | |
18 | | | | Plantronics, Inc | | | 854 | |
494 | | * | | QLogic Corp | | | 6,027 | |
6,952 | | | | Qualcomm, Inc | | | 347,496 | |
2,705 | | * | | Quantum Corp | | | 2,516 | |
227 | | * | | RealD, Inc | | | 2,395 | |
676 | | | | SanDisk Corp | | | 51,369 | |
172 | | * | | Super Micro Computer, Inc | | | 4,216 | |
26 | | * | | Tech Data Corp | | | 1,726 | |
184 | | * | | TTM Technologies, Inc | | | 1,198 | |
87 | | * | | Universal Display Corp | | | 4,736 | |
| | | | | | | | |
| | | | TOTAL TECHNOLOGY HARDWARE & EQUIPMENT | | | 1,720,679 | |
| | | | | | | | |
| |
TELECOMMUNICATION SERVICES - 1.9% | | | | |
1,016 | | * | | Boingo Wireless, Inc | | | 6,726 | |
6,724 | | | | CenturyTel, Inc | | | 169,176 | |
1,541 | | * | | Cincinnati Bell, Inc | | | 5,547 | |
194 | | | | IDT Corp (Class B) | | | 2,262 | |
635 | | * | | Level 3 Communications, Inc | | | 34,518 | |
15,330 | | * | | Sprint Corp | | | 55,495 | |
13,585 | | | | Verizon Communications, Inc | | | 627,899 | |
1,213 | | * | | Vonage Holdings Corp | | | 6,963 | |
| | | | | | | | |
| | | | TOTAL TELECOMMUNICATION SERVICES | | | 908,586 | |
| | | | | | | | |
| |
TRANSPORTATION - 2.8% | | | | |
8 | | | | Allegiant Travel Co | | | 1,343 | |
903 | | * | | Avis Budget Group, Inc | | | 32,770 | |
6 | | | | CH Robinson Worldwide, Inc | | | 372 | |
5,301 | | | | CSX Corp | | | 137,561 | |
855 | | | | Delta Air Lines, Inc | | | 43,340 | |
176 | | * | | Echo Global Logistics, Inc | | | 3,589 | |
1,934 | | | | Norfolk Southern Corp | | | 163,597 | |
6 | | | | Ryder System, Inc | | | 341 | |
6,725 | | | | Southwest Airlines Co | | | 289,578 | |
330 | | * | | Spirit Airlines, Inc | | | 13,150 | |
3,373 | | | | Union Pacific Corp | | | 263,769 | |
3,796 | | | | United Parcel Service, Inc (Class B) | | | 365,289 | |
| | | | | | | | |
| | | | TOTAL TRANSPORTATION | | | 1,314,699 | |
| | | | | | | | |
| |
UTILITIES - 3.2% | | | | |
102 | | | | American Water Works Co, Inc | | | 6,095 | |
2,186 | | | | Centerpoint Energy, Inc | | | 40,135 | |
3,513 | | | | Consolidated Edison, Inc | | | 225,781 | |
2,949 | | | | Duke Energy Corp | | | 210,529 | |
2,842 | | | | Eversource Energy | | | 145,141 | |
4 | | | | ITC Holdings Corp | | | 157 | |
32
TIAA-CREF LIFE FUNDS - Social Choice Equity Fund
| | | | | | | | |
SHARES | | | | COMPANY | | VALUE | |
| | | | | | | | |
601 | | | | MGE Energy, Inc | | $ | 27,886 | |
220 | | | | New Jersey Resources Corp | | | 7,251 | |
3,165 | | | | NextEra Energy, Inc | | | 328,812 | |
3,748 | | | | Pepco Holdings, Inc | | | 97,486 | |
1,453 | | | | Piedmont Natural Gas Co, Inc | | | 82,850 | |
3 | | | | Pinnacle West Capital Corp | | | 193 | |
326 | | | | Public Service Enterprise Group, Inc | | | 12,613 | |
2,089 | | | | Sempra Energy | | | 196,387 | |
956 | | | | South Jersey Industries, Inc | | | 22,485 | |
926 | | | | TECO Energy, Inc | | | 24,678 | |
58 | | | | Unitil Corp | | | 2,081 | |
478 | | | | WEC Energy Group, Inc | | | 24,526 | |
280 | | | | WGL Holdings, Inc | | | 17,637 | |
1,100 | | | | Xcel Energy, Inc | | | 39,501 | |
| | | | | | | | |
| | | | TOTAL UTILITIES | | | 1,512,224 | |
| | | | | | | | |
| | | | TOTAL COMMON STOCKS
(Cost $30,856,871) | | | 47,145,747 | |
| | | | | | | | |
| | | | TOTAL INVESTMENTS - 99.4%
(Cost $30,856,871) | | | 47,145,747 | |
| | | | OTHER ASSETS & LIABILITIES, NET - 0.6% | | | 262,200 | |
| | | | | | | | |
| | | | NET ASSETS - 100.0% | | $ | 47,407,947 | |
| | | | | | | | |
Abbreviation(s):
| REIT | Real Estate Investment Trust |
33
TIAA-CREF LIFE FUNDS - Stock Index Fund
TIAA-CREF LIFE FUNDS
STOCK INDEX FUND
SCHEDULE OF INVESTMENTS
December 31, 2015
| | | | | | | | |
SHARES | | | | COMPANY | | VALUE | |
| | | | | | | | |
COMMON STOCKS - 100.0% | | | | |
| |
AUTOMOBILES & COMPONENTS - 1.1% | | | | |
1,481 | | * | | American Axle & Manufacturing Holdings, Inc | | $ | 28,050 | |
3,256 | | | | BorgWarner, Inc | | | 140,757 | |
852 | | | | Cooper Tire & Rubber Co | | | 32,248 | |
195 | | * | | Cooper-Standard Holding, Inc | | | 15,130 | |
2,343 | | | | Dana Holding Corp | | | 32,333 | |
4,198 | | | | Delphi Automotive plc | | | 359,894 | |
572 | | *,e | | Dorman Products, Inc | | | 27,153 | |
349 | | | | Drew Industries, Inc | | | 21,251 | |
425 | | *,e | | Federal Mogul Corp (Class A) | | | 2,911 | |
58,040 | | | | Ford Motor Co | | | 817,784 | |
243 | | * | | Fox Factory Holding Corp | | | 4,017 | |
24,098 | | | | General Motors Co | | | 819,573 | |
4,344 | | | | Gentex Corp | | | 69,547 | |
573 | | * | | Gentherm, Inc | | | 27,160 | |
3,887 | | | | Goodyear Tire & Rubber Co | | | 126,988 | |
2,911 | | | | Harley-Davidson, Inc | | | 132,130 | |
259 | | * | | Horizon Global Corp | | | 2,686 | |
9,822 | | | | Johnson Controls, Inc | | | 387,871 | |
1,159 | | | | Lear Corp | | | 142,360 | |
387 | | | | Metaldyne Performance Group, Inc | | | 7,098 | |
671 | | * | | Modine Manufacturing Co | | | 6,073 | |
364 | | * | | Motorcar Parts of America, Inc | | | 12,307 | |
289 | | | | Standard Motor Products, Inc | | | 10,996 | |
449 | | * | | Stoneridge, Inc | | | 6,645 | |
47 | | | | Strattec Security Corp | | | 2,655 | |
336 | | | | Superior Industries International, Inc | | | 6,189 | |
882 | | * | | Tenneco, Inc | | | 40,493 | |
1,471 | | *,e | | Tesla Motors, Inc | | | 353,055 | |
658 | | | | Thor Industries, Inc | | | 36,947 | |
428 | | | | Tower International, Inc | | | 12,228 | |
652 | | * | | Visteon Corp | | | 74,654 | |
510 | | e | | Winnebago Industries, Inc | | | 10,149 | |
| | | | | | | | |
| | | | TOTAL AUTOMOBILES & COMPONENTS | | | 3,769,332 | |
| | | | | | | | |
| |
BANKS - 6.2% | | | | |
235 | | | | 1st Source Corp | | | 7,254 | |
101 | | e | | Access National Corp | | | 2,066 | |
98 | | | | American National Bankshares, Inc | | | 2,510 | |
459 | | | | Ameris Bancorp | | | 15,601 | |
129 | | e | | Ames National Corp | | | 3,133 | |
430 | | | | Apollo Residential Mortgage | | | 5,139 | |
165 | | | | Arrow Financial Corp | | | 4,483 | |
2,146 | | | | Associated Banc-Corp | | | 40,238 | |
1,306 | | | | Astoria Financial Corp | | | 20,700 | |
110 | | | | Banc of California, Inc | | | 1,608 | |
130 | | | | Bancfirst Corp | | | 7,621 | |
541 | | | | Banco Latinoamericano de Exportaciones S.A. (Class E) | | | 14,028 | |
1,389 | | | | Bancorpsouth, Inc | | | 33,322 | |
838 | | | | Bank Mutual Corp | | | 6,536 | |
157,210 | | | | Bank of America Corp | | | 2,645,844 | |
757 | | | | Bank of Hawaii Corp | | | 47,615 | |
87 | | | | Bank of Marin Bancorp | | | 4,646 | |
1,130 | | | | Bank of the Ozarks, Inc | | | 55,890 | |
300 | | | | BankFinancial Corp | | | 3,789 | |
1,410 | | | | BankUnited | | | 50,845 | |
303 | | | | Banner Corp | | | 13,896 | |
34
TIAA-CREF LIFE FUNDS - Stock Index Fund
| | | | | | | | |
SHARES | | | | COMPANY | | VALUE | |
| | | | | | | | |
89 | | | | Bar Harbor Bankshares | | $ | 3,063 | |
11,666 | | | | BB&T Corp | | | 441,091 | |
982 | | | | BBCN Bancorp, Inc | | | 16,910 | |
90 | | * | | BBX Capital Corp | | | 1,409 | |
194 | | * | | Bear State Financial, Inc | | | 2,101 | |
1,199 | | * | | Beneficial Bancorp, Inc | | | 15,971 | |
428 | | | | Berkshire Hills Bancorp, Inc | | | 12,459 | |
400 | | | | Blue Hills Bancorp, Inc | | | 6,124 | |
359 | | | | BNC Bancorp | | | 9,111 | |
1,028 | | *,e | | BofI Holding, Inc | | | 21,639 | |
603 | | e | | BOK Financial Corp | | | 36,053 | |
1,073 | | | | Boston Private Financial Holdings, Inc | | | 12,168 | |
156 | | | | Bridge Bancorp, Inc | | | 4,747 | |
771 | | | | Brookline Bancorp, Inc | | | 8,867 | |
253 | | | | Bryn Mawr Bank Corp | | | 7,266 | |
124 | | * | | BSB Bancorp, Inc | | | 2,900 | |
89 | | * | | C1 Financial, Inc | | | 2,155 | |
87 | | | | Camden National Corp | | | 3,836 | |
321 | | | | Capital Bank Financial Corp | | | 10,266 | |
156 | | | | Capital City Bank Group, Inc | | | 2,395 | |
2,763 | | | | Capitol Federal Financial | | | 34,703 | |
459 | | | | Cardinal Financial Corp | | | 10,442 | |
333 | | * | | Cascade Bancorp | | | 2,021 | |
1,068 | | | | Cathay General Bancorp | | | 33,460 | |
659 | | | | Centerstate Banks of Florida, Inc | | | 10,313 | |
335 | | | | Central Pacific Financial Corp | | | 7,377 | |
47 | | | | Century Bancorp, Inc | | | 2,043 | |
244 | | | | Charter Financial Corp | | | 3,223 | |
486 | | | | Chemical Financial Corp | | | 16,655 | |
2,656 | | | | CIT Group, Inc | | | 105,443 | |
45,420 | | | | Citigroup, Inc | | | 2,350,485 | |
167 | | | | Citizens & Northern Corp | | | 3,507 | |
4,534 | | | | Citizens Financial Group, Inc | | | 118,745 | |
211 | | | | City Holding Co | | | 9,630 | |
623 | | | | Clifton Bancorp, Inc | | | 8,934 | |
194 | | | | CNB Financial Corp | | | 3,498 | |
534 | | | | CoBiz, Inc | | | 7,166 | |
830 | | | | Columbia Banking System, Inc | | | 26,983 | |
2,657 | | | | Comerica, Inc | | | 111,142 | |
1,528 | | | | Commerce Bancshares, Inc | | | 65,001 | |
628 | | | | Community Bank System, Inc | | | 25,082 | |
222 | | | | Community Trust Bancorp, Inc | | | 7,761 | |
130 | | * | | CommunityOne Bancorp | | | 1,751 | |
422 | | | | ConnectOne Bancorp, Inc | | | 7,887 | |
246 | | * | | CU Bancorp | | | 6,239 | |
907 | | | | Cullen/Frost Bankers, Inc | | | 54,420 | |
384 | | * | | Customers Bancorp, Inc | | | 10,453 | |
1,534 | | | | CVB Financial Corp | | | 25,955 | |
451 | | | | Dime Community Bancshares | | | 7,888 | |
430 | | * | | Eagle Bancorp, Inc | | | 21,702 | |
2,157 | | | | East West Bancorp, Inc | | | 89,645 | |
100 | | | | Enterprise Bancorp, Inc | | | 2,285 | |
265 | | | | Enterprise Financial Services Corp | | | 7,513 | |
767 | | * | | Essent Group Ltd | | | 16,790 | |
1,397 | | | | EverBank Financial Corp | | | 22,324 | |
102 | | * | | Farmers Capital Bank Corp | | | 2,765 | |
407 | | * | | FCB Financial Holdings, Inc | | | 14,567 | |
115 | | | | Federal Agricultural Mortgage Corp (Class C) | | | 3,631 | |
222 | | | | Fidelity Southern Corp | | | 4,953 | |
12,139 | | | | Fifth Third Bancorp | | | 243,994 | |
202 | | | | Financial Institutions, Inc | | | 5,656 | |
264 | | | | First Bancorp (NC) | | | 4,947 | |
1,662 | | * | | First Bancorp (Puerto Rico) | | | 5,402 | |
162 | | | | First Bancorp, Inc | | | 3,316 | |
324 | | | | First Busey Corp | | | 6,684 | |
408 | | | | First Business Financial Services, Inc | | | 10,204 | |
35
TIAA-CREF LIFE FUNDS - Stock Index Fund
| | | | | | | | |
SHARES | | | | COMPANY | | VALUE | |
| | | | | | | | |
154 | | | | First Citizens Bancshares, Inc (Class A) | | $ | 39,758 | |
1,229 | | | | First Commonwealth Financial Corp | | | 11,147 | |
242 | | | | First Community Bancshares, Inc | | | 4,508 | |
240 | | | | First Connecticut Bancorp | | | 4,178 | |
120 | | | | First Defiance Financial Corp | | | 4,534 | |
747 | | | | First Financial Bancorp | | | 13,498 | |
1,215 | | e | | First Financial Bankshares, Inc | | | 36,657 | |
188 | | | | First Financial Corp | | | 6,386 | |
3,378 | | | | First Horizon National Corp | | | 49,049 | |
284 | | | | First Interstate Bancsystem, Inc | | | 8,256 | |
557 | | | | First Merchants Corp | | | 14,159 | |
1,128 | | | | First Midwest Bancorp, Inc | | | 20,789 | |
221 | | * | | First NBC Bank Holding Co | | | 8,263 | |
5,097 | | | | First Niagara Financial Group, Inc | | | 55,302 | |
162 | | | | First of Long Island Corp | | | 4,860 | |
2,140 | | | | First Republic Bank | | | 141,368 | |
2,387 | | | | FirstMerit Corp | | | 44,518 | |
298 | | * | | Flagstar Bancorp, Inc | | | 6,887 | |
358 | | | | Flushing Financial Corp | | | 7,747 | |
2,437 | | | | FNB Corp | | | 32,510 | |
185 | | | | Fox Chase Bancorp, Inc | | | 3,754 | |
76 | | * | | Franklin Financial Network, Inc | | | 2,385 | |
2,541 | | | | Fulton Financial Corp | | | 33,058 | |
177 | | | | German American Bancorp, Inc | | | 5,898 | |
1,082 | | e | | Glacier Bancorp, Inc | | | 28,705 | |
135 | | | | Great Southern Bancorp, Inc | | | 6,110 | |
592 | | | | Great Western Bancorp, Inc | | | 17,180 | |
155 | | * | | Green Bancorp, Inc | | | 1,624 | |
185 | | | | Guaranty Bancorp | | | 3,060 | |
222 | | * | | Hampton Roads Bankshares, Inc | | | 409 | |
1,231 | | | | Hancock Holding Co | | | 30,984 | |
554 | | | | Hanmi Financial Corp | | | 13,141 | |
259 | | | | Heartland Financial USA, Inc | | | 8,122 | |
279 | | | | Heritage Commerce Corp | | | 3,337 | |
434 | | | | Heritage Financial Corp | | | 8,177 | |
260 | | | | Heritage Oaks Bancorp | | | 2,083 | |
1,094 | | * | | Hilltop Holdings, Inc | | | 21,027 | |
817 | | | | Home Bancshares, Inc | | | 33,105 | |
314 | | * | | HomeStreet, Inc | | | 6,817 | |
265 | | * | | HomeTrust Bancshares, Inc | | | 5,366 | |
123 | | | | Horizon Bancorp | | | 3,439 | |
11,643 | | | | Huntington Bancshares, Inc | | | 128,772 | |
620 | | | | IBERIABANK Corp | | | 34,143 | |
119 | | * | | Impac Mortgage Holdings, Inc | | | 2,142 | |
374 | | | | Independent Bank Corp (MA) | | | 17,398 | |
308 | | | | Independent Bank Corp (MI) | | | 4,691 | |
123 | | | | Independent Bank Group, Inc | | | 3,936 | |
774 | | | | International Bancshares Corp | | | 19,892 | |
4,963 | | | | Investors Bancorp, Inc | | | 61,740 | |
55,551 | | | | JPMorgan Chase & Co | | | 3,668,032 | |
1,603 | | | | Kearny Financial Corp | | | 20,310 | |
12,707 | | | | Keycorp | | | 167,605 | |
509 | | | | Lakeland Bancorp, Inc | | | 6,001 | |
350 | | | | Lakeland Financial Corp | | | 16,317 | |
693 | | | | LegacyTexas Financial Group, Inc | | | 17,339 | |
80 | | * | | LendingTree, Inc | | | 7,142 | |
2,446 | | | | M&T Bank Corp | | | 296,406 | |
318 | | | | MainSource Financial Group, Inc | | | 7,276 | |
1,081 | | | | MB Financial, Inc | | | 34,992 | |
226 | | | | Mercantile Bank Corp | | | 5,546 | |
60 | | | | Merchants Bancshares, Inc | | | 1,889 | |
895 | | | | Meridian Bancorp, Inc | | | 12,620 | |
178 | | | | Meta Financial Group, Inc | | | 8,176 | |
4,883 | | * | | MGIC Investment Corp | | | 43,117 | |
113 | | | | MidWestOne Financial Group, Inc | | | 3,436 | |
684 | | | | National Bank Holdings Corp | | | 14,617 | |
36
TIAA-CREF LIFE FUNDS - Stock Index Fund
| | | | | | | | |
SHARES | | | | COMPANY | | VALUE | |
| | | | | | | | |
84 | | e | | National Bankshares, Inc | | $ | 2,985 | |
85 | | *,e | | National Commerce Corp | | | 2,129 | |
2,023 | | | | National Penn Bancshares, Inc | | | 24,944 | |
569 | | *,e | | Nationstar Mortgage Holdings, Inc | | | 7,608 | |
636 | | | | NBT Bancorp, Inc | | | 17,732 | |
6,765 | | | | New York Community Bancorp, Inc | | | 110,405 | |
451 | | | | NewBridge Bancorp | | | 5,493 | |
644 | | * | | NMI Holdings, Inc | | | 4,360 | |
669 | | | | Northfield Bancorp, Inc | | | 10,650 | |
1,818 | | | | Northwest Bancshares, Inc | | | 24,343 | |
180 | | | | OceanFirst Financial Corp | | | 3,605 | |
1,552 | | *,e | | Ocwen Financial Corp | | | 10,817 | |
596 | | e | | OFG Bancorp | | | 4,363 | |
1,471 | | | | Old National Bancorp | | | 19,947 | |
150 | | | | Opus Bank | | | 5,546 | |
670 | | | | Oritani Financial Corp | | | 11,055 | |
241 | | | | Pacific Continental Corp | | | 3,586 | |
300 | | * | | Pacific Premier Bancorp, Inc | | | 6,375 | |
1,661 | | | | PacWest Bancorp | | | 71,589 | |
188 | | | | Park National Corp | | | 17,010 | |
651 | | | | Park Sterling Bank | | | 4,765 | |
225 | | | | Peapack Gladstone Financial Corp | | | 4,640 | |
67 | | e | | Penns Woods Bancorp, Inc | | | 2,845 | |
164 | | | | Pennsylvania Commerce Bancorp, Inc | | | 5,146 | |
165 | | * | | PennyMac Financial Services, Inc | | | 2,534 | |
261 | | | | Peoples Bancorp, Inc | | | 4,917 | |
101 | | | | Peoples Financial Services Corp | | | 3,846 | |
4,665 | | e | | People’s United Financial, Inc | | | 75,340 | |
717 | | * | | PHH Corp | | | 11,615 | |
519 | | | | Pinnacle Financial Partners, Inc | | | 26,656 | |
7,764 | | | | PNC Financial Services Group, Inc | | | 739,987 | |
1,622 | | | | Popular, Inc | | | 45,967 | |
147 | | | | Preferred Bank | | | 4,854 | |
1,130 | | | | PrivateBancorp, Inc | | | 46,353 | |
1,121 | | | | Prosperity Bancshares, Inc | | | 53,651 | |
1,207 | | | | Provident Financial Services, Inc | | | 24,321 | |
170 | | | | QCR Holdings, Inc | | | 4,129 | |
2,750 | | | | Radian Group, Inc | | | 36,823 | |
20,164 | | | | Regions Financial Corp | | | 193,574 | |
583 | | | | Renasant Corp | | | 20,061 | |
120 | | | | Republic Bancorp, Inc (Class A) | | | 3,169 | |
499 | | | | S&T Bancorp, Inc | | | 15,379 | |
330 | | | | Sandy Spring Bancorp, Inc | | | 8,897 | |
332 | | * | | Seacoast Banking Corp of Florida | | | 4,973 | |
319 | | | | ServisFirst Bancshares, Inc | | | 15,162 | |
163 | | | | Sierra Bancorp | | | 2,877 | |
719 | | * | | Signature Bank | | | 110,273 | |
431 | | | | Simmons First National Corp (Class A) | | | 22,136 | |
350 | | | | South State Corp | | | 25,183 | |
362 | | e | | Southside Bancshares, Inc | | | 8,695 | |
265 | | | | Southwest Bancorp, Inc | | | 4,632 | |
397 | | | | State Bank & Trust Co | | | 8,349 | |
1,738 | | | | Sterling Bancorp/DE | | | 28,190 | |
210 | | | | Stock Yards Bancorp, Inc | | | 7,936 | |
134 | | | | Stonegate Bank | | | 4,403 | |
192 | | * | | Stonegate Mortgage Corp | | | 1,046 | |
155 | | | | Suffolk Bancorp | | | 4,394 | |
137 | | * | | Sun Bancorp, Inc | | | 2,828 | |
7,661 | | | | SunTrust Banks, Inc | | | 328,197 | |
747 | | * | | SVB Financial Group | | | 88,818 | |
2,139 | | | | Synovus Financial Corp | | | 69,261 | |
790 | | | | Talmer Bancorp Inc | | | 14,307 | |
2,235 | | | | TCF Financial Corp | | | 31,558 | |
150 | | | | Territorial Bancorp, Inc | | | 4,161 | |
739 | | * | | Texas Capital Bancshares, Inc | | | 36,521 | |
1,038 | | | | TFS Financial Corp | | | 19,546 | |
37
TIAA-CREF LIFE FUNDS - Stock Index Fund
| | | | | | | | |
SHARES | | | | COMPANY | | VALUE | |
| | | | | | | | |
434 | | * | | The Bancorp, Inc | | $ | 2,765 | |
216 | | | | Tompkins Trustco, Inc | | | 12,131 | |
634 | | | | TowneBank | | | 13,232 | |
330 | | | | Trico Bancshares | | | 9,055 | |
296 | | * | | Tristate Capital Holdings, Inc | | | 4,141 | |
207 | | * | | Triumph Bancorp, Inc | | | 3,416 | |
1,974 | | | | Trustco Bank Corp NY | | | 12,120 | |
970 | | | | Trustmark Corp | | | 22,349 | |
569 | | | | UMB Financial Corp | | | 26,487 | |
3,165 | | | | Umpqua Holdings Corp | | | 50,324 | |
621 | | | | Union Bankshares Corp | | | 15,674 | |
1,151 | | e | | United Bankshares, Inc | | | 42,576 | |
765 | | | | United Community Banks, Inc | | | 14,910 | |
680 | | | | United Community Financial Corp | | | 4,012 | |
707 | | | | United Financial Bancorp, Inc (New) | | | 9,106 | |
282 | | | | Univest Corp of Pennsylvania | | | 5,883 | |
25,106 | | | | US Bancorp | | | 1,071,273 | |
3,310 | | | | Valley National Bancorp | | | 32,604 | |
387 | | * | | Walker & Dunlop, Inc | | | 11,149 | |
743 | | *,e | | Walter Investment Management Corp | | | 10,565 | |
1,359 | | | | Washington Federal, Inc | | | 32,385 | |
217 | | | | Washington Trust Bancorp, Inc | | | 8,576 | |
486 | | | | Waterstone Financial, Inc | | | 6,853 | |
1,420 | | | | Webster Financial Corp | | | 52,810 | |
69,738 | | | | Wells Fargo & Co | | | 3,790,958 | |
549 | | | | WesBanco, Inc | | | 16,481 | |
239 | | | | West Bancorporation, Inc | | | 4,720 | |
667 | | e | | Westamerica Bancorporation | | | 31,182 | |
1,222 | | * | | Western Alliance Bancorp | | | 43,821 | |
1,094 | | | | Wilshire Bancorp, Inc | | | 12,636 | |
805 | | | | Wintrust Financial Corp | | | 39,059 | |
360 | | | | WSFS Financial Corp | | | 11,650 | |
362 | | | | Yadkin Financial Corp | | | 9,112 | |
2,937 | | | | Zions Bancorporation | | | 80,180 | |
| | | | | | | | |
| | | | TOTAL BANKS | | | 20,569,222 | |
| | | | | | | | |
| |
CAPITAL GOODS - 7.5% | | | | |
9,497 | | | | 3M Co | | | 1,430,628 | |
1,112 | | | | A.O. Smith Corp | | | 85,190 | |
587 | | | | Aaon, Inc | | | 13,630 | |
511 | | | | AAR Corp | | | 13,434 | |
654 | | * | | Accuride Corp | | | 1,086 | |
865 | | | | Actuant Corp (Class A) | | | 20,725 | |
624 | | | | Acuity Brands, Inc | | | 145,891 | |
487 | | e | | Advanced Drainage Systems, Inc | | | 11,703 | |
2,168 | | * | | Aecom Technology Corp | | | 65,105 | |
522 | | * | | Aegion Corp | | | 10,080 | |
908 | | *,e | | Aerojet Rocketdyne Holdings, Inc | | | 14,219 | |
288 | | * | | Aerovironment, Inc | | | 8,487 | |
1,278 | | | | AGCO Corp | | | 58,008 | |
1,500 | | | | Air Lease Corp | | | 50,220 | |
892 | | | | Aircastle Ltd | | | 18,634 | |
140 | | | | Alamo Group, Inc | | | 7,294 | |
401 | | | | Albany International Corp (Class A) | | | 14,657 | |
1,443 | | | | Allegion plc | | | 95,123 | |
87 | | | | Allied Motion Technologies, Inc | | | 2,278 | |
2,586 | | | | Allison Transmission Holdings, Inc | | | 66,952 | |
326 | | | | Altra Holdings, Inc | | | 8,176 | |
224 | | * | | Ameresco, Inc | | | 1,400 | |
127 | | e | | American Railcar Industries, Inc | | | 5,878 | |
105 | | | | American Science & Engineering, Inc | | | 4,345 | |
184 | | * | | American Woodmark Corp | | | 14,716 | |
3,641 | | | | Ametek, Inc | | | 195,121 | |
418 | | | | Apogee Enterprises, Inc | | | 18,187 | |
783 | | | | Applied Industrial Technologies, Inc | | | 31,704 | |
38
TIAA-CREF LIFE FUNDS - Stock Index Fund
| | | | | | | | |
SHARES | | | | COMPANY | | VALUE | |
| | | | | | | | |
250 | | | | Argan, Inc | | $ | 8,100 | |
566 | | * | | Armstrong World Industries, Inc | | | 25,883 | |
2,308 | | * | | ArvinMeritor, Inc | | | 19,272 | |
261 | | | | Astec Industries, Inc | | | 10,623 | |
301 | | * | | Astronics Corp | | | 12,254 | |
343 | | | | AZZ, Inc | | | 19,060 | |
768 | | * | | Babcock & Wilcox Enterprises, Inc | | | 16,028 | |
880 | | | | Barnes Group, Inc | | | 31,143 | |
1,678 | | | | BE Aerospace, Inc | | | 71,097 | |
752 | | * | | Beacon Roofing Supply, Inc | | | 30,967 | |
739 | | * | | Blount International, Inc | | | 7,250 | |
290 | | *,e | | BMC Stock Holdings, Inc | | | 4,857 | |
10,353 | | | | Boeing Co | | | 1,496,940 | |
600 | | | | Briggs & Stratton Corp | | | 10,380 | |
1,402 | | * | | Builders FirstSource, Inc | | | 15,534 | |
1,845 | | | | BWX Technologies, Inc | | | 58,616 | |
232 | | * | | CAI International, Inc | | | 2,339 | |
1,007 | | | | Carlisle Cos, Inc | | | 89,311 | |
8,962 | | | | Caterpillar, Inc | | | 609,057 | |
435 | | * | | Chart Industries, Inc | | | 7,813 | |
1,410 | | e | | Chicago Bridge & Iron Co NV | | | 54,976 | |
248 | | | | CIRCOR International, Inc | | | 10,453 | |
719 | | | | Clarcor, Inc | | | 35,720 | |
1,585 | | * | | Colfax Corp | | | 37,010 | |
262 | | | | Columbus McKinnon Corp | | | 4,952 | |
536 | | | | Comfort Systems USA, Inc | | | 15,233 | |
414 | | * | | Commercial Vehicle Group, Inc | | | 1,143 | |
965 | | * | | Continental Building Products Inc | | | 16,849 | |
785 | | | | Crane Co | | | 37,554 | |
262 | | | | Cubic Corp | | | 12,379 | |
2,663 | | | | Cummins, Inc | | | 234,371 | |
772 | | | | Curtiss-Wright Corp | | | 52,882 | |
8,976 | | | | Danaher Corp | | | 833,691 | |
5,014 | | e | | Deere & Co | | | 382,418 | |
1,031 | | * | | DigitalGlobe, Inc | | | 16,145 | |
1,968 | | | | Donaldson Co, Inc | | | 56,403 | |
296 | | | | Douglas Dynamics, Inc | | | 6,237 | |
2,309 | | | | Dover Corp | | | 141,565 | |
139 | | * | | Ducommun, Inc | | | 2,255 | |
174 | | * | | DXP Enterprises, Inc | | | 3,967 | |
489 | | * | | Dycom Industries, Inc | | | 34,210 | |
7,012 | | | | Eaton Corp | | | 364,904 | |
900 | | | | EMCOR Group, Inc | | | 43,236 | |
9,988 | | | | Emerson Electric Co | | | 477,726 | |
295 | | | | Encore Wire Corp | | | 10,942 | |
629 | | | | EnerSys | | | 35,180 | |
236 | | | | Engility Holdings, Inc | | | 7,665 | |
558 | | *,e | | Enphase Energy, Inc | | | 1,959 | |
330 | | | | EnPro Industries, Inc | | | 14,467 | |
371 | | | | ESCO Technologies, Inc | | | 13,408 | |
456 | | * | | Esterline Technologies Corp | | | 36,936 | |
4,312 | | e | | Fastenal Co | | | 176,016 | |
743 | | | | Federal Signal Corp | | | 11,777 | |
1,937 | | | | Flowserve Corp | | | 81,509 | |
2,196 | | | | Fluor Corp | | | 103,695 | |
2,295 | | | | Fortune Brands Home & Security, Inc | | | 127,372 | |
640 | | | | Franklin Electric Co, Inc | | | 17,299 | |
165 | | | | Freightcar America, Inc | | | 3,206 | |
432 | | *,e | | FuelCell Energy, Inc | | | 2,143 | |
505 | | * | | Furmanite Corp | | | 3,363 | |
618 | | e | | GATX Corp | | | 26,296 | |
994 | | *,e | | Generac Holdings, Inc | | | 29,591 | |
705 | | | | General Cable Corp | | | 9,468 | |
4,398 | | | | General Dynamics Corp | | | 604,109 | |
140,774 | | | | General Electric Co | | | 4,385,110 | |
472 | | * | | Gibraltar Industries, Inc | | | 12,008 | |
39
TIAA-CREF LIFE FUNDS - Stock Index Fund
| | | | | | | | |
SHARES | | | | COMPANY | | VALUE | |
| | | | | | | | |
278 | | | | Global Brass & Copper Holdings, Inc | | $ | 5,921 | |
253 | | | | Gorman-Rupp Co | | | 6,763 | |
825 | | | | Graco, Inc | | | 59,458 | |
128 | | | | Graham Corp | | | 2,153 | |
695 | | | | Granite Construction, Inc | | | 29,822 | |
890 | | * | | Great Lakes Dredge & Dock Corp | | | 3,524 | |
454 | | e | | Greenbrier Cos, Inc | | | 14,809 | |
686 | | | | Griffon Corp | | | 12,211 | |
450 | | | | H&E Equipment Services, Inc | | | 7,866 | |
1,086 | | | | Harsco Corp | | | 8,558 | |
271 | | *,e | | HC2 Holdings, Inc | | | 1,434 | |
2,395 | | * | | HD Supply Holdings, Inc | | | 71,922 | |
279 | | | | HEICO Corp | | | 15,166 | |
574 | | | | HEICO Corp (Class A) | | | 28,241 | |
1,458 | | | | Hexcel Corp | | | 67,724 | |
856 | | | | Hillenbrand, Inc | | | 25,363 | |
11,704 | | | | Honeywell International, Inc | | | 1,212,183 | |
833 | | | | Hubbell, Inc | | | 84,166 | |
699 | | | | Huntington Ingalls | | | 88,668 | |
78 | | | | Hurco Cos, Inc | | | 2,072 | |
138 | | | | Hyster-Yale Materials Handling, Inc | | | 7,238 | |
1,119 | | | | IDEX Corp | | | 85,727 | |
4,496 | | | | Illinois Tool Works, Inc | | | 416,689 | |
3,974 | | | | Ingersoll-Rand plc | | | 219,722 | |
267 | | | | Insteel Industries, Inc | | | 5,586 | |
1,286 | | | | ITT Corp | | | 46,707 | |
1,819 | | * | | Jacobs Engineering Group, Inc | | | 76,307 | |
607 | | | | John Bean Technologies Corp | | | 30,247 | |
1,398 | | e | | Joy Global, Inc | | | 17,629 | |
148 | | | | Kadant, Inc | | | 6,010 | |
380 | | | | Kaman Corp | | | 15,508 | |
2,113 | | | | KBR, Inc | | | 35,752 | |
1,135 | | | | Kennametal, Inc | | | 21,792 | |
488 | | *,e | | KEYW Holding Corp | | | 2,938 | |
734 | | * | | KLX, Inc | | | 22,600 | |
600 | | *,e | | Kratos Defense & Security Solutions, Inc | | | 2,460 | |
1,264 | | | | L-3 Communications Holdings, Inc | | | 151,061 | |
87 | | * | | Lawson Products, Inc | | | 2,031 | |
151 | | | | LB Foster Co (Class A) | | | 2,063 | |
650 | | | | Lennox International, Inc | | | 81,185 | |
1,089 | | | | Lincoln Electric Holdings, Inc | | | 56,508 | |
169 | | e | | Lindsay Manufacturing Co | | | 12,236 | |
4,063 | | | | Lockheed Martin Corp | | | 882,280 | |
289 | | | | LSI Industries, Inc | | | 3,523 | |
242 | | * | | Lydall, Inc | | | 8,586 | |
1,952 | | e | | Manitowoc Co, Inc | | | 29,963 | |
5,104 | | | | Masco Corp | | | 144,443 | |
513 | | * | | Masonite International Corp | | | 31,411 | |
961 | | * | | Mastec, Inc | | | 16,702 | |
820 | | * | | Middleby Corp | | | 88,453 | |
558 | | *,e | | Milacron Holdings Corp | | | 6,981 | |
168 | | | | Miller Industries, Inc | | | 3,659 | |
555 | | * | | Moog, Inc (Class A) | | | 33,633 | |
1,441 | | * | | MRC Global, Inc | | | 18,589 | |
703 | | | | MSC Industrial Direct Co (Class A) | | | 39,558 | |
803 | | | | Mueller Industries, Inc | | | 21,761 | |
2,137 | | | | Mueller Water Products, Inc (Class A) | | | 18,378 | |
301 | | * | | MYR Group, Inc | | | 6,204 | |
58 | | e | | National Presto Industries, Inc | | | 4,806 | |
755 | | *,e | | Navistar International Corp | | | 6,674 | |
446 | | * | | NCI Building Systems, Inc | | | 5,535 | |
157 | | *,e | | Neff Corp | | | 1,203 | |
600 | | | | NN, Inc | | | 9,564 | |
877 | | | | Nordson Corp | | | 56,260 | |
140 | | * | | Nortek, Inc | | | 6,107 | |
2,725 | | | | Northrop Grumman Corp | | | 514,507 | |
40
TIAA-CREF LIFE FUNDS - Stock Index Fund
| | | | | | | | |
SHARES | | | | COMPANY | | VALUE | |
| | | | | | | | |
128 | | * | | Northwest Pipe Co | | $ | 1,432 | |
1,544 | | *,e | | NOW, Inc | | | 24,426 | |
71 | | * | | NV5 Holdings, Inc | | | 1,561 | |
44 | | | | Omega Flex, Inc | | | 1,452 | |
924 | | | | Orbital ATK, Inc | | | 82,550 | |
434 | | * | | Orion Marine Group, Inc | | | 1,810 | |
1,154 | | e | | Oshkosh Truck Corp | | | 45,052 | |
1,694 | | | | Owens Corning, Inc | | | 79,669 | |
5,239 | | | | Paccar, Inc | | | 248,329 | |
2,087 | | | | Parker Hannifin Corp | | | 202,397 | |
181 | | * | | Patrick Industries, Inc | | | 7,873 | |
2,753 | | | | Pentair plc | | | 136,356 | |
702 | | * | | Perini Corp | | | 11,751 | |
692 | | * | | Pgt, Inc | | | 7,882 | |
2,919 | | *,e | | Plug Power, Inc | | | 6,159 | |
412 | | * | | Ply Gem Holdings, Inc | | | 5,166 | |
125 | | | | Powell Industries, Inc | | | 3,254 | |
69 | | *,e | | Power Solutions International, Inc | | | 1,259 | |
415 | | * | | PowerSecure International, Inc | | | 6,246 | |
2,068 | | | | Precision Castparts Corp | | | 479,797 | |
28 | | | | Preformed Line Products Co | | | 1,179 | |
560 | | | | Primoris Services Corp | | | 12,337 | |
423 | | *,e | | Proto Labs, Inc | | | 26,941 | |
492 | | | | Quanex Building Products Corp | | | 10,258 | |
2,937 | | * | | Quanta Services, Inc | | | 59,474 | |
551 | | | | Raven Industries, Inc | | | 8,596 | |
4,557 | | | | Raytheon Co | | | 567,483 | |
437 | | * | | RBC Bearings, Inc | | | 28,226 | |
757 | | | | Regal-Beloit Corp | | | 44,300 | |
1,689 | | * | | Rexnord Corp | | | 30,605 | |
2,024 | | | | Rockwell Automation, Inc | | | 207,683 | |
1,998 | | | | Rockwell Collins, Inc | | | 184,415 | |
1,494 | | | | Roper Industries, Inc | | | 283,546 | |
626 | | * | | Rush Enterprises, Inc (Class A) | | | 13,703 | |
554 | | | | Simpson Manufacturing Co, Inc | | | 18,919 | |
882 | | | | Snap-On, Inc | | | 151,201 | |
852 | | *,e | | SolarCity Corp | | | 43,469 | |
136 | | * | | Sparton Corp | | | 2,719 | |
2,039 | | * | | Spirit Aerosystems Holdings, Inc (Class A) | | | 102,093 | |
588 | | | | SPX Corp | | | 5,486 | |
588 | | * | | SPX FLOW, Inc | | | 16,411 | |
183 | | | | Standex International Corp | | | 15,216 | |
2,266 | | | | Stanley Works | | | 241,850 | |
279 | | | | Sun Hydraulics Corp | | | 8,853 | |
480 | | | | TAL International Group, Inc | | | 7,632 | |
773 | | *,e | | Taser International, Inc | | | 13,365 | |
508 | | * | | Teledyne Technologies, Inc | | | 45,060 | |
408 | | | | Tennant Co | | | 22,954 | |
1,508 | | | | Terex Corp | | | 27,868 | |
401 | | e | | Textainer Group Holdings Ltd | | | 5,658 | |
4,107 | | | | Textron, Inc | | | 172,535 | |
267 | | * | | The ExOne Company | | | 2,681 | |
460 | | * | | Thermon Group Holdings | | | 7,783 | |
1,085 | | | | Timken Co | | | 31,020 | |
2,693 | | e | | Titan International, Inc | | | 10,610 | |
282 | | *,e | | Titan Machinery, Inc | | | 3,082 | |
912 | | | | Toro Co | | | 66,640 | |
798 | | * | | TransDigm Group, Inc | | | 182,303 | |
467 | | * | | Trex Co, Inc | | | 17,765 | |
649 | | * | | Trimas Corp | | | 12,104 | |
2,205 | | | | Trinity Industries, Inc | | | 52,964 | |
710 | | | | Triumph Group, Inc | | | 28,222 | |
100 | | | | Twin Disc, Inc | | | 1,052 | |
1,518 | | * | | United Rentals, Inc | | | 110,116 | |
13,328 | | | | United Technologies Corp | | | 1,280,421 | |
584 | | * | | Univar, Inc | | | 9,934 | |
41
TIAA-CREF LIFE FUNDS - Stock Index Fund
| | | | | | | | |
SHARES | | | | COMPANY | | VALUE | |
| | | | | | | | |
289 | | | | Universal Forest Products, Inc | | $ | 19,759 | |
1,341 | | * | | USG Corp | | | 32,573 | |
340 | | | | Valmont Industries, Inc | | | 36,047 | |
156 | | * | | Vectrus, Inc | | | 3,259 | |
112 | | * | | Veritiv Corp | | | 4,057 | |
200 | | * | | Vicor Corp | | | 1,824 | |
987 | | e | | W.W. Grainger, Inc | | | 199,956 | |
976 | | * | | Wabash National Corp | | | 11,546 | |
811 | | * | | WABCO Holdings, Inc | | | 82,933 | |
376 | | | | Watsco, Inc | | | 44,041 | |
382 | | | | Watts Water Technologies, Inc (Class A) | | | 18,974 | |
635 | | * | | WESCO International, Inc | | | 27,737 | |
1,471 | | | | Westinghouse Air Brake Technologies Corp | | | 104,618 | |
1,066 | | | | Woodward Governor Co | | | 52,938 | |
147 | | * | | Xerium Technologies, Inc | | | 1,742 | |
2,609 | | | | Xylem, Inc | | | 95,228 | |
| | | | | | | | |
| | | | TOTAL CAPITAL GOODS | | | 24,862,378 | |
| | | | | | | | |
| |
COMMERCIAL & PROFESSIONAL SERVICES - 1.1% | | | | |
807 | | | | ABM Industries, Inc | | | 22,975 | |
731 | | | | Acacia Research (Acacia Technologies) | | | 3,136 | |
1,951 | | * | | ACCO Brands Corp | | | 13,911 | |
287 | | | | Administaff, Inc | | | 13,819 | |
2,463 | | e | | ADT Corp | | | 81,230 | |
661 | | * | | Advisory Board Co | | | 32,792 | |
314 | | | | American Ecology Corp | | | 11,442 | |
601 | | * | | ARC Document Solutions, Inc | | | 2,656 | |
97 | | | | Barrett Business Services, Inc | | | 4,223 | |
688 | | | | Brady Corp (Class A) | | | 15,810 | |
949 | | | | Brink’s Co | | | 27,388 | |
524 | | * | | Casella Waste Systems, Inc (Class A) | | | 3,134 | |
557 | | * | | CBIZ, Inc | | | 5,492 | |
189 | | | | CDI Corp | | | 1,278 | |
480 | | | | CEB, Inc | | | 29,467 | |
282 | | | | Ceco Environmental Corp | | | 2,166 | |
1,331 | | | | Cintas Corp | | | 121,188 | |
842 | | * | | Clean Harbors, Inc | | | 35,069 | |
1,823 | | * | | Copart, Inc | | | 69,292 | |
1,616 | | e | | Covanta Holding Corp | | | 25,032 | |
128 | | * | | CRA International, Inc | | | 2,387 | |
719 | | | | Deluxe Corp | | | 39,214 | |
550 | | | | Dun & Bradstreet Corp | | | 57,162 | |
351 | | | | Ennis, Inc | | | 6,757 | |
1,797 | | | | Equifax, Inc | | | 200,132 | |
528 | | | | Essendant, Inc | | | 17,165 | |
456 | | | | Exponent, Inc | | | 22,777 | |
148 | | * | | Franklin Covey Co | | | 2,478 | |
598 | | * | | FTI Consulting, Inc | | | 20,727 | |
286 | | | | G & K Services, Inc (Class A) | | | 17,989 | |
191 | | * | | GP Strategies Corp | | | 4,796 | |
1,030 | | | | Healthcare Services Group | | | 35,916 | |
200 | | | | Heidrick & Struggles International, Inc | | | 5,444 | |
347 | | * | | Heritage-Crystal Clean, Inc | | | 3,678 | |
842 | | | | Herman Miller, Inc | | | 24,165 | |
315 | | * | | Hill International, Inc | | | 1,222 | |
641 | | | | HNI Corp | | | 23,114 | |
306 | | * | | Huron Consulting Group, Inc | | | 18,176 | |
261 | | * | | ICF International, Inc | | | 9,281 | |
2,113 | | * | | ICO Global Communications Holdings Ltd | | | 1,059 | |
1,005 | | * | | IHS, Inc (Class A) | | | 119,022 | |
491 | | * | | Innerworkings, Inc | | | 3,683 | |
1,218 | | | | Interface, Inc | | | 23,313 | |
2,133 | | | | KAR Auction Services, Inc | | | 78,985 | |
439 | | | | Kelly Services, Inc (Class A) | | | 7,090 | |
366 | | | | Kforce, Inc | | | 9,252 | |
42
TIAA-CREF LIFE FUNDS - Stock Index Fund
| | | | | | | | |
SHARES | | | | COMPANY | | VALUE | |
| | | | | | | | |
460 | | | | Kimball International, Inc (Class B) | | $ | 4,494 | |
669 | | | | Knoll, Inc | | | 12,577 | |
867 | | | | Korn/Ferry International | | | 28,767 | |
1,126 | | | | Manpower, Inc | | | 94,911 | |
550 | | | | Matthews International Corp (Class A) | | | 29,398 | |
379 | | | | McGrath RentCorp | | | 9,547 | |
220 | | * | | Mistras Group, Inc | | | 4,200 | |
656 | | | | Mobile Mini, Inc | | | 20,421 | |
420 | | | | MSA Safety, Inc | | | 18,257 | |
167 | | | | Multi-Color Corp | | | 9,988 | |
700 | | * | | Navigant Consulting, Inc | | | 11,242 | |
5,425 | | | | Nielsen NV | | | 252,805 | |
113 | | * | | NL Industries, Inc | | | 344 | |
725 | | * | | On Assignment, Inc | | | 32,589 | |
2,896 | | | | Pitney Bowes, Inc | | | 59,802 | |
313 | | | | Quad | | | 2,911 | |
3,055 | | | | R.R. Donnelley & Sons Co | | | 44,970 | |
3,678 | | | | Republic Services, Inc | | | 161,795 | |
514 | | | | Resources Connection, Inc | | | 8,399 | |
2,048 | | | | Robert Half International, Inc | | | 96,543 | |
1,379 | | | | Rollins, Inc | | | 35,716 | |
778 | | * | | RPX Corp | | | 8,558 | |
241 | | * | | SP Plus Corp | | | 5,760 | |
1,572 | | | | Steelcase, Inc (Class A) | | | 23,423 | |
1,260 | | * | | Stericycle, Inc | | | 151,956 | |
294 | | * | | Team, Inc | | | 9,396 | |
864 | | | | Tetra Tech, Inc | | | 22,481 | |
1,030 | | | | Towers Watson & Co | | | 132,314 | |
468 | | * | | TransUnion | | | 12,903 | |
235 | | * | | TRC Cos, Inc | | | 2,174 | |
590 | | * | | TriNet Group, Inc | | | 11,417 | |
550 | | * | | TrueBlue, Inc | | | 14,168 | |
6,406 | | | | Tyco International plc | | | 204,287 | |
301 | | | | Unifirst Corp | | | 31,364 | |
2,567 | | * | | Verisk Analytics, Inc | | | 197,351 | |
291 | | | | Viad Corp | | | 8,215 | |
145 | | * | | Volt Information Sciences, Inc | | | 1,180 | |
48 | | | | VSE Corp | | | 2,985 | |
563 | | * | | WageWorks, Inc | | | 25,543 | |
1,932 | | | | Waste Connections, Inc | | | 108,810 | |
6,907 | | | | Waste Management, Inc | | | 368,627 | |
866 | | | | West Corp | | | 18,680 | |
| | | | | | | | |
| | | | TOTAL COMMERCIAL & PROFESSIONAL SERVICES | | | 3,577,752 | |
| | | | | | | | |
| |
CONSUMER DURABLES & APPAREL - 1.6% | | | | |
171 | | e | | Arctic Cat, Inc | | | 2,801 | |
372 | | | | Bassett Furniture Industries, Inc | | | 9,330 | |
565 | | * | | Beazer Homes USA, Inc | | | 6,492 | |
271 | | * | | Black Diamond, Inc | | | 1,198 | |
1,325 | | | | Brunswick Corp | | | 66,926 | |
1,137 | | | | CalAtlantic Group, Inc | | | 43,115 | |
1,140 | | | | Callaway Golf Co | | | 10,739 | |
770 | | | | Carter’s, Inc | | | 68,553 | |
119 | | * | | Cavco Industries, Inc | | | 9,914 | |
221 | | * | | Century Communities, Inc | | | 3,914 | |
244 | | * | | Cherokee, Inc | | | 4,209 | |
4,055 | | | | Coach, Inc | | | 132,720 | |
492 | | | | Columbia Sportswear Co | | | 23,990 | |
1,231 | | * | | CROCS, Inc | | | 12,605 | |
125 | | | | CSS Industries, Inc | | | 3,547 | |
110 | | | | Culp, Inc | | | 2,802 | |
498 | | * | | Deckers Outdoor Corp | | | 23,506 | |
4,717 | | | | DR Horton, Inc | | | 151,085 | |
536 | | e | | Ethan Allen Interiors, Inc | | | 14,911 | |
81 | | | | Flexsteel Industries, Inc | | | 3,579 | |
43
TIAA-CREF LIFE FUNDS - Stock Index Fund
| | | | | | | | |
SHARES | | | | COMPANY | | VALUE | |
| | | | | | | | |
607 | | *,e | | Fossil Group, Inc | | $ | 22,192 | |
1,834 | | e | | Garmin Ltd | | | 68,170 | |
575 | | * | | G-III Apparel Group Ltd | | | 25,449 | |
1,757 | | *,e | | GoPro, Inc | | | 31,644 | |
976 | | * | | Green Brick Partners, Inc | | | 7,027 | |
5,988 | | | | Hanesbrands, Inc | | | 176,227 | |
1,035 | | | | Harman International Industries, Inc | | | 97,507 | |
1,601 | | | | Hasbro, Inc | | | 107,843 | |
411 | | * | | Helen of Troy Ltd | | | 38,737 | |
156 | | | | Hooker Furniture Corp | | | 3,937 | |
2,631 | | *,e | | Hovnanian Enterprises, Inc (Class A) | | | 4,762 | |
753 | | *,e | | Iconix Brand Group, Inc | | | 5,143 | |
287 | | * | | Installed Building Products Inc | | | 7,126 | |
429 | | *,e | | iRobot Corp | | | 15,187 | |
257 | | *,e | | Jakks Pacific, Inc | | | 2,046 | |
3,189 | | * | | Jarden Corp | | | 182,156 | |
70 | | | | Johnson Outdoors, Inc | | | 1,532 | |
1,827 | | * | | Kate Spade & Co | | | 32,466 | |
1,672 | | e | | KB Home | | | 20,616 | |
702 | | | | La-Z-Boy, Inc | | | 17,143 | |
1,983 | | | | Leggett & Platt, Inc | | | 83,326 | |
143 | | | | Lennar Corp (B Shares) | | | 5,746 | |
2,523 | | e | | Lennar Corp (Class A) | | | 123,400 | |
192 | | *,e | | LGI Homes, Inc | | | 4,671 | |
365 | | | | Libbey, Inc | | | 7,782 | |
112 | | | | Lifetime Brands, Inc | | | 1,485 | |
1,680 | | *,e | | Lululemon Athletica, Inc | | | 88,150 | |
385 | | * | | M/I Homes, Inc | | | 8,439 | |
200 | | * | | Malibu Boats Inc | | | 3,274 | |
156 | | | | Marine Products Corp | | | 942 | |
4,985 | | | | Mattel, Inc | | | 135,442 | |
558 | | | | MDC Holdings, Inc | | | 14,246 | |
567 | | * | | Meritage Homes Corp | | | 19,272 | |
2,746 | | * | | Michael Kors Holdings Ltd | | | 110,005 | |
900 | | * | | Mohawk Industries, Inc | | | 170,451 | |
227 | | | | Movado Group, Inc | | | 5,836 | |
66 | | | | Nacco Industries, Inc (Class A) | | | 2,785 | |
727 | | * | | Nautilus, Inc | | | 12,155 | |
112 | | * | | New Home Co Inc | | | 1,452 | |
4,078 | | | | Newell Rubbermaid, Inc | | | 179,758 | |
20,286 | | | | Nike, Inc (Class B) | | | 1,267,875 | |
59 | | * | | NVR, Inc | | | 96,937 | |
292 | | | | Oxford Industries, Inc | | | 18,635 | |
365 | | * | | Performance Sports Group Ltd | | | 3,515 | |
161 | | * | | Perry Ellis International, Inc | | | 2,966 | |
1,294 | | | | Phillips-Van Heusen Corp | | | 95,303 | |
977 | | e | | Polaris Industries, Inc | | | 83,973 | |
626 | | | | Pool Corp | | | 50,568 | |
5,283 | | | | Pulte Homes, Inc | | | 94,143 | |
892 | | | | Ralph Lauren Corp | | | 99,440 | |
539 | | *,e | | Sequential Brands Group, Inc | | | 4,263 | |
1,967 | | * | | Skechers U.S.A., Inc (Class A) | | | 59,423 | |
334 | | * | | Skullcandy, Inc | | | 1,580 | |
1,177 | | * | | Smith & Wesson Holding Corp | | | 25,870 | |
798 | | * | | Steven Madden Ltd | | | 24,116 | |
272 | | e | | Sturm Ruger & Co, Inc | | | 16,214 | |
100 | | | | Superior Uniform Group, Inc | | | 1,698 | |
680 | | * | | Taylor Morrison Home Corp | | | 10,880 | |
899 | | * | | Tempur-Pedic International, Inc | | | 63,344 | |
2,547 | | * | | Toll Brothers, Inc | | | 84,815 | |
567 | | * | | TopBuild Corp | | | 17,447 | |
2,322 | | * | | TRI Pointe Homes, Inc | | | 29,420 | |
1,042 | | * | | Tumi Holdings, Inc | | | 17,328 | |
719 | | e | | Tupperware Corp | | | 40,012 | |
2,662 | | *,e | | Under Armour, Inc (Class A) | | | 214,584 | |
226 | | * | | Unifi, Inc | | | 6,362 | |
44
TIAA-CREF LIFE FUNDS - Stock Index Fund
| | | | | | | | |
SHARES | | | | COMPANY | | VALUE | |
| | | | | | | | |
213 | | * | | Universal Electronics, Inc | | $ | 10,938 | |
246 | | *,e | | Vera Bradley, Inc | | | 3,877 | |
4,970 | | | | VF Corp | | | 309,382 | |
234 | | * | | Vince Holding Corp | | | 1,072 | |
917 | | * | | Vista Outdoor, Inc | | | 40,816 | |
226 | | * | | WCI Communities, Inc | | | 5,035 | |
99 | | | | Weyco Group, Inc | | | 2,649 | |
1,145 | | | | Whirlpool Corp | | | 168,166 | |
428 | | * | | William Lyon Homes, Inc | | | 7,062 | |
1,589 | | | | Wolverine World Wide, Inc | | | 26,552 | |
423 | | * | | Zagg, Inc | | | 4,628 | |
| | | | | | | | |
| | | | TOTAL CONSUMER DURABLES & APPAREL | | | 5,452,351 | |
| | | | | | | | |
| |
CONSUMER SERVICES - 2.3% | | | | |
342 | | *,e | | 2U, Inc | | | 9,569 | |
224 | | * | | American Public Education, Inc | | | 4,169 | |
1,363 | | * | | Apollo Group, Inc (Class A) | | | 10,454 | |
2,776 | | | | ARAMARK Holdings Corp | | | 89,526 | |
193 | | * | | Ascent Media Corp (Series A) | | | 3,227 | |
1,433 | | * | | Belmond Ltd. | | | 13,613 | |
298 | | * | | BJ’s Restaurants, Inc | | | 12,954 | |
1,790 | | | | Bloomin’ Brands, Inc | | | 30,233 | |
331 | | | | Bob Evans Farms, Inc | | | 12,859 | |
120 | | *,e | | Bojangles’, Inc | | | 1,904 | |
1,534 | | * | | Boyd Gaming Corp | | | 30,481 | |
246 | | * | | Bravo Brio Restaurant Group, Inc | | | 2,214 | |
192 | | * | | Bridgepoint Education, Inc | | | 1,461 | |
538 | | * | | Bright Horizons Family Solutions | | | 35,938 | |
928 | | | | Brinker International, Inc | | | 44,498 | |
271 | | * | | Buffalo Wild Wings, Inc | | | 43,265 | |
674 | | *,e | | Caesars Acquisition Co | | | 4,590 | |
785 | | *,e | | Caesars Entertainment Corp | | | 6,194 | |
164 | | | | Capella Education Co | | | 7,580 | |
1,960 | | * | | Career Education Corp | | | 7,115 | |
6,413 | | | | Carnival Corp | | | 349,380 | |
234 | | | | Carriage Services, Inc | | | 5,639 | |
507 | | * | | Carrols Restaurant Group, Inc | | | 5,952 | |
701 | | | | Cheesecake Factory | | | 32,323 | |
1,106 | | *,e | | Chegg, Inc | | | 7,443 | |
476 | | * | | Chipotle Mexican Grill, Inc (Class A) | | | 228,409 | |
591 | | | | Choice Hotels International, Inc | | | 29,792 | |
194 | | | | Churchill Downs, Inc | | | 27,449 | |
215 | | *,e | | Chuy’s Holdings, Inc | | | 6,738 | |
628 | | | | ClubCorp Holdings, Inc | | | 11,474 | |
92 | | | | Collectors Universe | | | 1,426 | |
295 | | e | | Cracker Barrel Old Country Store, Inc | | | 37,415 | |
1,845 | | | | Darden Restaurants, Inc | | | 117,416 | |
327 | | * | | Dave & Buster’s Entertainment, Inc | | | 13,649 | |
331 | | * | | Del Frisco’s Restaurant Group, Inc | | | 5,303 | |
1,168 | | * | | Denny’s Corp | | | 11,481 | |
918 | | e | | DeVry, Inc | | | 23,235 | |
602 | | *,e | | Diamond Resorts International, Inc | | | 15,357 | |
243 | | | | DineEquity, Inc | | | 20,575 | |
794 | | | | Domino’s Pizza, Inc | | | 88,332 | |
1,398 | | | | Dunkin Brands Group, Inc | | | 59,541 | |
196 | | *,e | | El Pollo Loco Holdings, Inc | | | 2,475 | |
807 | | * | | Eldorado Resorts, Inc | | | 8,877 | |
39 | | *,e | | Empire Resorts, Inc | | | 702 | |
868 | | | | Extended Stay America, Inc | | | 13,801 | |
366 | | * | | Fiesta Restaurant Group, Inc | | | 12,298 | |
48 | | | | Graham Holdings Co | | | 23,279 | |
675 | | * | | Grand Canyon Education, Inc | | | 27,081 | |
3,580 | | | | H&R Block, Inc | | | 119,250 | |
163 | | *,e | | Habit Restaurants, Inc | | | 3,759 | |
7,669 | | | | Hilton Worldwide Holdings, Inc | | | 164,117 | |
45
TIAA-CREF LIFE FUNDS - Stock Index Fund
| | | | | | | | |
SHARES | | | | COMPANY | | VALUE | |
| | | | | | | | |
1,975 | | * | | Houghton Mifflin Harcourt Co | | $ | 43,016 | |
490 | | * | | Hyatt Hotels Corp | | | 23,040 | |
1,368 | | e | | International Game Technology plc | | | 22,134 | |
373 | | | | International Speedway Corp (Class A) | | | 12,578 | |
474 | | | | Interval Leisure Group, Inc | | | 7,399 | |
251 | | * | | Intrawest Resorts Holdings Inc | | | 1,963 | |
353 | | * | | Isle of Capri Casinos, Inc | | | 4,917 | |
211 | | * | | J Alexander’s Holdings, Inc | | | 2,304 | |
571 | | | | Jack in the Box, Inc | | | 43,801 | |
192 | | *,e | | Jamba, Inc | | | 2,590 | |
461 | | * | | K12, Inc | | | 4,057 | |
117 | | *,e | | Kona Grill, Inc | | | 1,856 | |
940 | | * | | Krispy Kreme Doughnuts, Inc | | | 14,166 | |
1,351 | | * | | La Quinta Holdings, Inc | | | 18,387 | |
5,466 | | | | Las Vegas Sands Corp | | | 239,629 | |
83 | | e | | Liberty Tax, Inc | | | 1,978 | |
1,352 | | *,e | | LifeLock, Inc | | | 19,401 | |
271 | | | | Marcus Corp | | | 5,141 | |
2,947 | | | | Marriott International, Inc (Class A) | | | 197,567 | |
481 | | | | Marriott Vacations Worldwide Corp | | | 27,393 | |
14,350 | | | | McDonald’s Corp | | | 1,695,309 | |
6,814 | | * | | MGM Resorts International | | | 154,814 | |
139 | | * | | Monarch Casino & Resort, Inc | | | 3,158 | |
706 | | * | | Morgans Hotel Group Co | | | 2,379 | |
279 | | *,e | | Noodles & Co | | | 2,704 | |
2,054 | | * | | Norwegian Cruise Line Holdings Ltd | | | 120,364 | |
414 | | * | | Panera Bread Co (Class A) | | | 80,639 | |
450 | | | | Papa John’s International, Inc | | | 25,142 | |
1,142 | | * | | Penn National Gaming, Inc | | | 18,295 | |
1,029 | | * | | Pinnacle Entertainment, Inc | | | 32,022 | |
556 | | * | | Planet Fitness, Inc | | | 8,690 | |
334 | | * | | Popeyes Louisiana Kitchen, Inc | | | 19,539 | |
320 | | *,e | | Potbelly Corp | | | 3,747 | |
204 | | * | | Red Robin Gourmet Burgers, Inc | | | 12,595 | |
674 | | * | | Regis Corp | | | 9,537 | |
2,602 | | | | Royal Caribbean Cruises Ltd | | | 263,348 | |
779 | | * | | Ruby Tuesday, Inc | | | 4,292 | |
473 | | | | Ruth’s Chris Steak House, Inc | | | 7,530 | |
719 | | *,e | | Scientific Games Corp (Class A) | | | 6,449 | |
956 | | e | | SeaWorld Entertainment, Inc | | | 18,824 | |
2,996 | | | | Service Corp International | | | 77,956 | |
1,478 | | * | | ServiceMaster Global Holdings, Inc | | | 57,997 | |
85 | | *,e | | Shake Shack, Inc | | | 3,366 | |
1,042 | | | | Six Flags Entertainment Corp | | | 57,247 | |
729 | | | | Sonic Corp | | | 23,554 | |
897 | | | | Sotheby’s (Class A) | | | 23,107 | |
164 | | | | Speedway Motorsports, Inc | | | 3,398 | |
22,464 | | | | Starbucks Corp | | | 1,348,514 | |
2,457 | | | | Starwood Hotels & Resorts Worldwide, Inc | | | 170,221 | |
43 | | * | | Steak N Shake Co | | | 14,010 | |
149 | | * | | Strayer Education, Inc | | | 8,958 | |
997 | | | | Texas Roadhouse, Inc (Class A) | | | 35,663 | |
228 | | | | Universal Technical Institute, Inc | | | 1,062 | |
514 | | | | Vail Resorts, Inc | | | 65,787 | |
412 | | *,e | | Weight Watchers International, Inc | | | 9,394 | |
3,688 | | | | Wendy’s | | | 39,720 | |
1,708 | | | | Wyndham Worldwide Corp | | | 124,086 | |
1,204 | | e | | Wynn Resorts Ltd | | | 83,305 | |
6,442 | | | | Yum! Brands, Inc | | | 470,588 | |
274 | | *,e | | Zoe’s Kitchen, Inc | | | 7,667 | |
| | | | | | | | |
| | | | TOTAL CONSUMER SERVICES | | | 7,654,106 | |
| | | | | | | | |
| |
DIVERSIFIED FINANCIALS - 4.0% | | | | |
829 | | * | | Affiliated Managers Group, Inc | | | 132,441 | |
7,403 | | * | | Ally Financial, Inc | | | 137,992 | |
46
TIAA-CREF LIFE FUNDS - Stock Index Fund
| | | | | | | | |
SHARES | | | | COMPANY | | VALUE | |
| | | | | | | | |
12,985 | | | | American Express Co | | $ | 903,107 | |
2,749 | | | | Ameriprise Financial, Inc | | | 292,549 | |
359 | | e | | Arlington Asset Investment Corp (Class A) | | | 4,750 | |
514 | | | | Artisan Partners Asset Management, Inc | | | 18,535 | |
10 | | * | | Ashford, Inc | | | 533 | |
86 | | * | | Associated Capital Group, Inc | | | 2,623 | |
16,853 | | | | Bank of New York Mellon Corp | | | 694,681 | |
2,631 | | | | BGC Partners, Inc (Class A) | | | 25,810 | |
1,893 | | | | BlackRock, Inc | | | 644,604 | |
267 | | | | Calamos Asset Management, Inc (Class A) | | | 2,585 | |
8,240 | | | | Capital One Financial Corp | | | 594,763 | |
400 | | | | Cash America International, Inc | | | 11,980 | |
1,274 | | | | CBOE Holdings, Inc | | | 82,683 | |
17,158 | | | | Charles Schwab Corp | | | 565,013 | |
4,828 | | | | CME Group, Inc | | | 437,417 | |
291 | | | | Cohen & Steers, Inc | | | 8,870 | |
1,548 | | *,e | | Cowen Group, Inc | | | 5,929 | |
151 | | *,e | | Credit Acceptance Corp | | | 32,317 | |
42 | | | | Diamond Hill Investment Group, Inc | | | 7,938 | |
6,681 | | | | Discover Financial Services | | | 358,235 | |
4,248 | | * | | E*TRADE Financial Corp | | | 125,911 | |
1,765 | | | | Eaton Vance Corp | | | 57,239 | |
375 | | *,e | | Encore Capital Group, Inc | | | 10,905 | |
366 | | * | | Enova International, Inc | | | 2,419 | |
499 | | | | Evercore Partners, Inc (Class A) | | | 26,981 | |
690 | | * | | Ezcorp, Inc (Class A) | | | 3,443 | |
623 | | | | Factset Research Systems, Inc | | | 101,281 | |
1,349 | | | | Federated Investors, Inc (Class B) | | | 38,649 | |
99 | | e | | Fifth Street Asset Management, Inc | | | 323 | |
745 | | e | | Financial Engines, Inc | | | 25,084 | |
403 | | * | | First Cash Financial Services, Inc | | | 15,084 | |
1,222 | | * | | FNFV Group | | | 13,723 | |
5,754 | | | | Franklin Resources, Inc | | | 211,862 | |
464 | | | | Gain Capital Holdings, Inc | | | 3,763 | |
86 | | | | GAMCO Investors, Inc (Class A) | | | 2,669 | |
6,468 | | | | Goldman Sachs Group, Inc | | | 1,165,728 | |
662 | | * | | Green Dot Corp | | | 10,870 | |
424 | | | | Greenhill & Co, Inc | | | 12,131 | |
655 | | | | HFF, Inc (Class A) | | | 20,351 | |
824 | | | | Interactive Brokers Group, Inc (Class A) | | | 35,926 | |
1,676 | | | | IntercontinentalExchange Group, Inc | | | 429,492 | |
215 | | * | | INTL FCStone, Inc | | | 7,194 | |
6,484 | | | | Invesco Ltd | | | 217,084 | |
524 | | | | Investment Technology Group, Inc | | | 8,918 | |
12,500 | | e | | iShares Russell 3000 Index Fund | | | 1,503,875 | |
2,141 | | | | Janus Capital Group, Inc | | | 30,167 | |
767 | | * | | KCG Holdings, Inc | | | 9,442 | |
1,533 | | *,e | | Ladenburg Thalmann Financial Services, Inc | | | 4,231 | |
1,815 | | | | Lazard Ltd (Class A) | | | 81,693 | |
1,408 | | | | Legg Mason, Inc | | | 55,236 | |
963 | | *,e | | LendingClub Corp | | | 10,641 | |
5,119 | | | | Leucadia National Corp | | | 89,019 | |
1,173 | | e | | LPL Financial Holdings, Inc | | | 50,028 | |
536 | | | | MarketAxess Holdings, Inc | | | 59,812 | |
102 | | | | Marlin Business Services Corp | | | 1,638 | |
4,114 | | | | McGraw-Hill Financial, Inc | | | 405,558 | |
249 | | | | Moelis & Co | | | 7,266 | |
2,643 | | | | Moody’s Corp | | | 265,199 | |
22,737 | | | | Morgan Stanley | | | 723,264 | |
279 | | | | Morningstar, Inc | | | 22,434 | |
1,620 | | | | MSCI, Inc (Class A) | | | 116,851 | |
1,717 | | | | NASDAQ OMX Group, Inc | | | 99,878 | |
5,649 | | | | Navient Corp | | | 64,681 | |
339 | | | | Nelnet, Inc (Class A) | | | 11,380 | |
341 | | * | | NewStar Financial, Inc | | | 3,062 | |
3,494 | | | | Northern Trust Corp | | | 251,882 | |
47
TIAA-CREF LIFE FUNDS - Stock Index Fund
| | | | | | | | |
SHARES | | | | COMPANY | | VALUE | |
| | | | | | | | |
2,792 | | | | NorthStar Asset Management Group, Inc | | $ | 33,895 | |
349 | | | | OM Asset Management plc | | | 5,350 | |
158 | | *,e | | On Deck Capital, Inc | | | 1,627 | |
740 | | * | | OneMain Holdings, Inc | | | 30,740 | |
147 | | | | Oppenheimer Holdings, Inc | | | 2,555 | |
324 | | * | | Pico Holdings, Inc | | | 3,344 | |
236 | | * | | Piper Jaffray Cos | | | 9,534 | |
754 | | *,e | | PRA Group, Inc | | | 26,156 | |
189 | | | | Pzena Investment Management, Inc (Class A) | | | 1,625 | |
1,837 | | | | Raymond James Financial, Inc | | | 106,491 | |
143 | | * | | Regional Management Corp | | | 2,212 | |
238 | | | | Resource America, Inc (Class A) | | | 1,459 | |
296 | | * | | Safeguard Scientifics, Inc | | | 4,295 | |
1,279 | | * | | Santander Consumer USA Holdings, Inc | | | 20,272 | |
2,006 | | | | SEI Investments Co | | | 105,114 | |
6,344 | | * | | SLM Corp | | | 41,363 | |
6,168 | | | | State Street Corp | | | 409,308 | |
977 | | * | | Stifel Financial Corp | | | 41,386 | |
12,334 | | * | | Synchrony Financial | | | 375,077 | |
3,948 | | | | T Rowe Price Group, Inc | | | 282,243 | |
3,844 | | | | TD Ameritrade Holding Corp | | | 133,425 | |
433 | | | | Tiptree Financial, Inc | | | 2,659 | |
317 | | | | Virtu Financial, Inc | | | 7,177 | |
95 | | | | Virtus Investment Partners, Inc | | | 11,159 | |
3,297 | | | | Voya Financial, Inc | | | 121,692 | |
1,207 | | | | Waddell & Reed Financial, Inc (Class A) | | | 34,593 | |
113 | | | | Westwood Holdings Group, Inc | | | 5,886 | |
1,867 | | | | WisdomTree Investments, Inc | | | 29,275 | |
124 | | *,e | | World Acceptance Corp | | | 4,600 | |
| | | | | | | | |
| | | | TOTAL DIVERSIFIED FINANCIALS | | | 13,234,134 | |
| | | | | | | | |
| |
ENERGY - 5.9% | | | | |
1,395 | | * | | Abraxas Petroleum Corp | | | 1,479 | |
30 | | | | Adams Resources & Energy, Inc | | | 1,152 | |
730 | | | | Alon USA Energy, Inc | | | 10,833 | |
7,567 | | | | Anadarko Petroleum Corp | | | 367,605 | |
1,004 | | *,e | | Antero Resources Corp | | | 21,887 | |
5,651 | | | | Apache Corp | | | 251,300 | |
999 | | | | Archrock, Inc | | | 7,512 | |
242 | | | | Ardmore Shipping Corp | | | 3,078 | |
929 | | e | | Atwood Oceanics, Inc | | | 9,504 | |
6,450 | | | | Baker Hughes, Inc | | | 297,667 | |
1,513 | | *,e | | Basic Energy Services, Inc | | | 4,055 | |
901 | | *,e | | Bill Barrett Corp | | | 3,541 | |
1,097 | | *,e | | Bonanza Creek Energy, Inc | | | 5,781 | |
499 | | | | Bristow Group, Inc | | | 12,924 | |
1,330 | | *,e | | C&J Energy Services Ltd | | | 6,331 | |
6,133 | | | | Cabot Oil & Gas Corp | | | 108,493 | |
5,505 | | | | California Resources Corp | | | 12,827 | |
966 | | * | | Callon Petroleum Co | | | 8,056 | |
2,889 | | * | | Cameron International Corp | | | 182,585 | |
335 | | e | | CARBO Ceramics, Inc | | | 5,762 | |
743 | | * | | Carrizo Oil & Gas, Inc | | | 21,978 | |
3,450 | | * | | Cheniere Energy, Inc | | | 128,513 | |
8,636 | | e | | Chesapeake Energy Corp | | | 38,862 | |
28,150 | | | | Chevron Corp | | | 2,532,374 | |
1,360 | | | | Cimarex Energy Co | | | 121,557 | |
90 | | *,e | | Clayton Williams Energy, Inc | | | 2,661 | |
2,148 | | *,e | | Clean Energy Fuels Corp | | | 7,733 | |
3,851 | | *,e | | Cloud Peak Energy, Inc | | | 8,010 | |
5,265 | | * | | Cobalt International Energy, Inc | | | 28,431 | |
5,929 | | | | Columbia Pipeline Group, Inc | | | 118,580 | |
1,916 | | * | | Concho Resources, Inc | | | 177,920 | |
18,460 | | | | ConocoPhillips | | | 861,897 | |
3,293 | | e | | Consol Energy, Inc | | | 26,015 | |
48
TIAA-CREF LIFE FUNDS - Stock Index Fund
| | | | | | | | |
SHARES | | | | COMPANY | | VALUE | |
| | | | | | | | |
368 | | * | | Contango Oil & Gas Co | | $ | 2,359 | |
1,246 | | * | | Continental Resources, Inc | | | 28,633 | |
212 | | e | | CVR Energy, Inc | | | 8,342 | |
967 | | | | Delek US Holdings, Inc | | | 23,788 | |
7,762 | | e | | Denbury Resources, Inc | | | 15,679 | |
6,036 | | | | Devon Energy Corp | | | 193,152 | |
1,169 | | | | DHT Holdings, Inc | | | 9,457 | |
904 | | e | | Diamond Offshore Drilling, Inc | | | 19,074 | |
1,030 | | * | | Diamondback Energy, Inc | | | 68,907 | |
532 | | * | | Dorian LPG Ltd | | | 6,262 | |
548 | | * | | Dril-Quip, Inc | | | 32,458 | |
713 | | *,e | | Eclipse Resources Corp | | | 1,298 | |
1,167 | | | | Energen Corp | | | 47,835 | |
612 | | * | | Energy Fuels, Inc | | | 1,805 | |
3,370 | | | | Ensco plc | | | 51,864 | |
8,220 | | | | EOG Resources, Inc | | | 581,894 | |
521 | | *,e | | EP Energy Corp | | | 2,282 | |
2,269 | | | | EQT Corp | | | 118,283 | |
272 | | * | | Era Group, Inc | | | 3,033 | |
1,867 | | *,e | | Erin Energy Corp | | | 5,974 | |
468 | | | | Evolution Petroleum Corp | | | 2,251 | |
499 | | * | | Exterran Corp | | | 8,009 | |
62,585 | | d | | Exxon Mobil Corp | | | 4,878,500 | |
1,740 | | *,e | | Fairmount Santrol Holdings, Inc | | | 4,089 | |
3,593 | | * | | FMC Technologies, Inc | | | 104,233 | |
847 | | * | | Forum Energy Technologies, Inc | | | 10,554 | |
467 | | | | Frank’s International NV | | | 7,794 | |
1,979 | | | | Frontline Ltd | | | 5,917 | |
690 | | e | | GasLog Ltd | | | 5,727 | |
1,444 | | *,e | | Gastar Exploration, Inc | | | 1,892 | |
310 | | *,e | | Geospace Technologies Corp | | | 4,362 | |
1,362 | | | | Golar LNG Ltd | | | 21,506 | |
569 | | | | Green Plains Renewable Energy, Inc | | | 13,030 | |
1,627 | | *,e | | Gulfmark Offshore, Inc | | | 7,598 | |
1,710 | | * | | Gulfport Energy Corp | | | 42,015 | |
1,079 | | *,e | | Halcon Resources Corp | | | 1,360 | |
153 | | e | | Hallador Petroleum Co | | | 698 | |
12,756 | | | | Halliburton Co | | | 434,214 | |
1,588 | | * | | Helix Energy Solutions Group, Inc | | | 8,353 | |
1,353 | | e | | Helmerich & Payne, Inc | | | 72,453 | |
3,782 | | | | Hess Corp | | | 183,351 | |
2,837 | | | | HollyFrontier Corp | | | 113,168 | |
615 | | *,e | | Hornbeck Offshore Services, Inc | | | 6,113 | |
1,960 | | *,e | | ION Geophysical Corp | | | 986 | |
13 | | * | | Isramco, Inc | | | 1,161 | |
402 | | *,e | | Jones Energy, Inc (Class A) | | | 1,548 | |
26,562 | | | | Kinder Morgan, Inc | | | 396,305 | |
2,251 | | * | | Kosmos Energy LLC | | | 11,705 | |
2,320 | | *,e | | Laredo Petroleum Holdings, Inc | | | 18,537 | |
10,238 | | | | Marathon Oil Corp | | | 128,896 | |
8,091 | | | | Marathon Petroleum Corp | | | 419,437 | |
1,143 | | * | | Matador Resources Co | | | 22,597 | |
383 | | * | | Matrix Service Co | | | 7,867 | |
4,745 | | *,e | | McDermott International, Inc | | | 15,896 | |
1,191 | | * | | Memorial Resource Development Corp | | | 19,235 | |
2,559 | | | | Murphy Oil Corp | | | 57,450 | |
5,154 | | | | Nabors Industries Ltd | | | 43,861 | |
5,813 | | | | National Oilwell Varco, Inc | | | 194,677 | |
180 | | * | | Natural Gas Services Group, Inc | | | 4,014 | |
764 | | e | | Navios Maritime Acq Corp | | | 2,300 | |
2,360 | | * | | Newfield Exploration Co | | | 76,842 | |
1,448 | | * | | Newpark Resources, Inc | | | 7,645 | |
3,347 | | e | | Noble Corp plc | | | 35,311 | |
6,298 | | | | Noble Energy, Inc | | | 207,393 | |
430 | | e | | Nordic American Offshore Ltd | | | 2,266 | |
1,193 | | e | | Nordic American Tanker Shipping | | | 18,539 | |
49
TIAA-CREF LIFE FUNDS - Stock Index Fund
| | | | | | | | |
SHARES �� | | | | COMPANY | | VALUE | |
| | | | | | | | |
148 | | * | | North Atlantic Drilling Ltd | | $ | 364 | |
911 | | *,e | | Northern Oil And Gas, Inc | | | 3,516 | |
2,205 | | *,e | | Oasis Petroleum, Inc | | | 16,251 | |
11,501 | | | | Occidental Petroleum Corp | | | 777,583 | |
1,421 | | | | Oceaneering International, Inc | | | 53,316 | |
745 | | * | | Oil States International, Inc | | | 20,301 | |
3,004 | | | | Oneok, Inc | | | 74,079 | |
627 | | *,e | | Pacific Ethanol, Inc | | | 2,997 | |
355 | | | | Panhandle Oil and Gas, Inc (Class A) | | | 5,737 | |
234 | | * | | Par Petroleum Corp | | | 5,508 | |
2,470 | | * | | Parker Drilling Co | | | 4,495 | |
1,195 | | * | | Parsley Energy, Inc | | | 22,048 | |
2,118 | | | | Patterson-UTI Energy, Inc | | | 31,939 | |
1,435 | | | | PBF Energy, Inc | | | 52,822 | |
707 | | * | | PDC Energy, Inc | | | 37,740 | |
176 | | * | | PHI, Inc | | | 2,888 | |
8,111 | | | | Phillips 66 | | | 663,480 | |
1,182 | | * | | Pioneer Energy Services Corp | | | 2,565 | |
2,237 | | | | Pioneer Natural Resources Co | | | 280,475 | |
2,504 | | | | Questar Market Resources, Inc | | | 33,554 | |
2,345 | | e | | Range Resources Corp | | | 57,710 | |
641 | | * | | Renewable Energy Group, Inc | | | 5,955 | |
92 | | *,e | | Rex Stores Corp | | | 4,974 | |
1,390 | | * | | Rice Energy, Inc | | | 15,151 | |
159 | | * | | RigNet, Inc | | | 3,290 | |
707 | | * | | Ring Energy, Inc | | | 4,984 | |
1,813 | | | | Rowan Cos plc | | | 30,730 | |
849 | | e | | RPC, Inc | | | 10,146 | |
787 | | * | | RSP Permian, Inc | | | 19,195 | |
847 | | *,e | | Sanchez Energy Corp | | | 3,651 | |
19,009 | | | | Schlumberger Ltd | | | 1,325,878 | |
2,573 | | | | Scorpio Tankers, Inc | | | 20,635 | |
346 | | *,e | | SEACOR Holdings, Inc | | | 18,186 | |
5,991 | | *,e | | Seadrill Ltd | | | 20,309 | |
633 | | | | SemGroup Corp | | | 18,268 | |
859 | | e | | Ship Finance International Ltd | | | 14,234 | |
1,025 | | e | | SM Energy Co | | | 20,152 | |
5,536 | | *,e | | Southwestern Energy Co | | | 39,361 | |
9,730 | | | | Spectra Energy Corp | | | 232,936 | |
864 | | *,e | | Stone Energy Corp | | | 3,707 | |
2,173 | | | | Superior Energy Services | | | 29,270 | |
2,117 | | * | | Synergy Resources Corp | | | 18,037 | |
870 | | | | Targa Resources Investments, Inc | | | 23,542 | |
674 | | e | | Teekay Corp | | | 6,652 | |
1,211 | | | | Teekay Tankers Ltd (Class A) | | | 8,332 | |
465 | | | | Tesco Corp | | | 3,367 | |
1,906 | | | | Tesoro Corp | | | 200,835 | |
1,686 | | * | | Tetra Technologies, Inc | | | 12,679 | |
680 | | e | | Tidewater, Inc | | | 4,733 | |
1,702 | | * | | TransAtlantic Petroleum Ltd | | | 2,366 | |
2,775 | | *,e | | Ultra Petroleum Corp | | | 6,938 | |
1,355 | | * | | Unit Corp | | | 16,531 | |
5,822 | | *,e | | Uranium Energy Corp | | | 6,171 | |
1,014 | | e | | US Silica Holdings Inc | | | 18,992 | |
7,223 | | | | Valero Energy Corp | | | 510,738 | |
923 | | *,e | | W&T Offshore, Inc | | | 2,132 | |
11,035 | | * | | Weatherford International Ltd | | | 92,584 | |
1,189 | | | | Western Refining, Inc | | | 42,352 | |
3,161 | | * | | Whiting Petroleum Corp | | | 29,840 | |
11,280 | | | | Williams Cos, Inc | | | 289,896 | |
1,038 | | | | World Fuel Services Corp | | | 39,921 | |
3,507 | | * | | WPX Energy, Inc | | | 20,130 | |
| | | | | | | | |
| | | | TOTAL ENERGY | | | 19,598,085 | |
| | | | | | | | |
50
TIAA-CREF LIFE FUNDS - Stock Index Fund
| | | | | | | | |
SHARES | | | | COMPANY | | VALUE | |
| | | | | | | | |
FOOD & STAPLES RETAILING - 2.1% | | | | |
418 | | | | Andersons, Inc | | $ | 13,221 | |
618 | | | | Casey’s General Stores, Inc | | | 74,438 | |
300 | | *,e | | Chefs’ Warehouse Holdings, Inc | | | 5,004 | |
6,587 | | | | Costco Wholesale Corp | | | 1,063,801 | |
16,892 | | | | CVS Health Corp | | | 1,651,531 | |
638 | | *,e | | Fresh Market, Inc | | | 14,942 | |
248 | | | | Ingles Markets, Inc (Class A) | | | 10,932 | |
14,535 | | | | Kroger Co | | | 607,999 | |
95 | | * | | Natural Grocers by Vitamin C | | | 1,935 | |
278 | | | | Pricesmart, Inc | | | 23,071 | |
15,693 | | * | | Rite Aid Corp | | | 123,033 | |
389 | | * | | Smart & Final Stores, Inc | | | 7,084 | |
546 | | | | Spartan Stores, Inc | | | 11,816 | |
2,229 | | * | | Sprouts Farmers Market, Inc | | | 59,269 | |
3,759 | | * | | Supervalu, Inc | | | 25,486 | |
8,968 | | | | Sysco Corp | | | 367,688 | |
759 | | * | | United Natural Foods, Inc | | | 29,874 | |
77 | | | | Village Super Market (Class A) | | | 2,029 | |
12,872 | | | | Walgreens Boots Alliance, Inc | | | 1,096,115 | |
23,648 | | | | Wal-Mart Stores, Inc | | | 1,449,622 | |
148 | | | | Weis Markets, Inc | | | 6,556 | |
5,384 | | | | Whole Foods Market, Inc | | | 180,364 | |
| | | | | | | | |
| | | | TOTAL FOOD & STAPLES RETAILING | | | 6,825,810 | |
| | | | | | | | |
| |
FOOD, BEVERAGE & TOBACCO - 4.9% | | | | |
100 | | e | | Alico, Inc | | | 3,869 | |
29,377 | | | | Altria Group, Inc | | | 1,710,035 | |
756 | | *,e | | Amplify Snack Brands, Inc | | | 8,709 | |
9,297 | | | | Archer Daniels Midland Co | | | 341,014 | |
832 | | | | B&G Foods, Inc (Class A) | | | 29,137 | |
567 | | *,e | | Blue Buffalo Pet Products, Inc | | | 10,609 | |
130 | | *,e | | Boston Beer Co, Inc (Class A) | | | 26,248 | |
817 | | * | | Boulder Brands, Inc | | | 8,971 | |
398 | | e | | Brown-Forman Corp | | | 43,824 | |
1,735 | | | | Brown-Forman Corp (Class B) | | | 172,251 | |
2,110 | | | | Bunge Ltd | | | 144,071 | |
271 | | | | Calavo Growers, Inc | | | 13,279 | |
486 | | e | | Cal-Maine Foods, Inc | | | 22,521 | |
2,561 | | | | Campbell Soup Co | | | 134,581 | |
870 | | *,e | | Castle Brands, Inc | | | 1,070 | |
62 | | | | Coca-Cola Bottling Co Consolidated | | | 11,316 | |
58,699 | | | | Coca-Cola Co | | | 2,521,709 | |
3,531 | | | | Coca-Cola Enterprises, Inc | | | 173,867 | |
6,284 | | | | ConAgra Foods, Inc | | | 264,934 | |
2,453 | | | | Constellation Brands, Inc (Class A) | | | 349,405 | |
142 | | * | | Craft Brewers Alliance, Inc | | | 1,189 | |
2,386 | | * | | Darling International, Inc | | | 25,101 | |
1,357 | | | | Dean Foods Co | | | 23,273 | |
382 | | * | | Diamond Foods, Inc | | | 14,726 | |
2,859 | | | | Dr Pepper Snapple Group, Inc | | | 266,459 | |
200 | | * | | Farmer Bros Co | | | 6,454 | |
2,611 | | | | Flowers Foods, Inc | | | 56,110 | |
482 | | | | Fresh Del Monte Produce, Inc | | | 18,740 | |
307 | | *,e | | Freshpet, Inc | | | 2,607 | |
9,023 | | | | General Mills, Inc | | | 520,266 | |
1,478 | | * | | Hain Celestial Group, Inc | | | 59,696 | |
2,251 | | | | Hershey Co | | | 200,947 | |
2,054 | | | | Hormel Foods Corp | | | 162,430 | |
1,024 | | | | Ingredion, Inc | | | 98,140 | |
281 | | *,e | | Inventure Foods, Inc | | | 1,995 | |
209 | | | | J&J Snack Foods Corp | | | 24,384 | |
1,820 | | | | J.M. Smucker Co | | | 224,479 | |
121 | | | | John B. Sanfilippo & Son, Inc | | | 6,538 | |
3,771 | | | | Kellogg Co | | | 272,530 | |
51
TIAA-CREF LIFE FUNDS - Stock Index Fund
| | | | | | | | |
SHARES | | | | COMPANY | | VALUE | |
| | | | | | | | |
1,893 | | | | Keurig Green Mountain, Inc | | $ | 170,332 | |
8,876 | | | | Kraft Heinz Co | | | 645,818 | |
341 | | | | Lancaster Colony Corp | | | 39,372 | |
689 | | | | Lance, Inc | | | 23,633 | |
359 | | * | | Landec Corp | | | 4,247 | |
244 | | * | | Lifeway Foods, Inc | | | 2,708 | |
150 | | e | | Limoneira Co | | | 2,241 | |
1,877 | | | | McCormick & Co, Inc | | | 160,596 | |
3,014 | | | | Mead Johnson Nutrition Co | | | 237,955 | |
162 | | | | Mgp Ingredients, Inc | | | 4,204 | |
2,052 | | | | Molson Coors Brewing Co (Class B) | | | 192,724 | |
24,354 | | | | Mondelez International, Inc | | | 1,092,033 | |
2,267 | | * | | Monster Beverage Corp | | | 337,692 | |
162 | | * | | National Beverage Corp | | | 7,361 | |
311 | | * | | Omega Protein Corp | | | 6,904 | |
22,096 | | | | PepsiCo, Inc | | | 2,207,832 | |
23,191 | | | | Philip Morris International, Inc | | | 2,038,721 | |
922 | | e | | Pilgrim’s Pride Corp | | | 20,367 | |
1,676 | | | | Pinnacle Foods, Inc | | | 71,163 | |
904 | | * | | Post Holdings, Inc | | | 55,777 | |
12,436 | | | | Reynolds American, Inc | | | 573,921 | |
320 | | e | | Sanderson Farms, Inc | | | 24,806 | |
4 | | * | | Seaboard Corp | | | 11,579 | |
134 | | * | | Seneca Foods Corp | | | 3,883 | |
309 | | *,e | | Synutra International, Inc | | | 1,455 | |
349 | | e | | Tootsie Roll Industries, Inc | | | 11,025 | |
616 | | * | | TreeHouse Foods, Inc | | | 48,331 | |
4,298 | | | | Tyson Foods, Inc (Class A) | | | 229,212 | |
446 | | e | | Universal Corp | | | 25,012 | |
1,500 | | e | | Vector Group Ltd | | | 35,385 | |
2,520 | | * | | WhiteWave Foods Co (Class A) | | | 98,053 | |
| | | | | | | | |
| | | | TOTAL FOOD, BEVERAGE & TOBACCO | | | 16,361,826 | |
| | | | | | | | |
| |
HEALTH CARE EQUIPMENT & SERVICES - 5.1% | | | | |
115 | | * | | AAC Holdings, Inc | | | 2,192 | |
317 | | | | Abaxis, Inc | | | 17,651 | |
22,355 | | | | Abbott Laboratories | | | 1,003,963 | |
669 | | * | | Abiomed, Inc | | | 60,397 | |
741 | | * | | Acadia Healthcare Co, Inc | | | 46,283 | |
1,151 | | *,e | | Accuray, Inc | | | 7,769 | |
413 | | | | Aceto Corp | | | 11,143 | |
85 | | * | | Addus HomeCare Corp | | | 1,979 | |
91 | | *,e | | Adeptus Health, Inc | | | 4,961 | |
5,197 | | | | Aetna Inc | | | 561,900 | |
564 | | *,e | | Air Methods Corp | | | 23,648 | |
1,163 | | * | | Align Technology, Inc | | | 76,584 | |
67 | | * | | Alliance HealthCare Services, Inc | | | 615 | |
2,611 | | * | | Allscripts Healthcare Solutions, Inc | | | 40,157 | |
101 | | * | | Almost Family, Inc | | | 3,861 | |
403 | | * | | Amedisys, Inc | | | 15,846 | |
3,086 | | | | AmerisourceBergen Corp | | | 320,049 | |
688 | | * | | AMN Healthcare Services, Inc | | | 21,362 | |
698 | | * | | Amsurg Corp | | | 53,048 | |
177 | | | | Analogic Corp | | | 14,620 | |
364 | | * | | Angiodynamics, Inc | | | 4,419 | |
183 | | * | | Anika Therapeutics, Inc | | | 6,983 | |
2,094 | | *,e | | Antares Pharma, Inc | | | 2,534 | |
3,963 | | | | Anthem, Inc | | | 552,601 | |
581 | | *,e | | athenahealth, Inc | | | 93,524 | |
403 | | * | | AtriCure, Inc | | | 9,043 | |
29 | | | | Atrion Corp | | | 11,055 | |
1,115 | | | | Bard (C.R.), Inc | | | 211,226 | |
8,223 | | | | Baxter International, Inc | | | 313,707 | |
3,137 | | | | Becton Dickinson & Co | | | 483,380 | |
918 | | *,e | | BioScrip, Inc | | | 1,606 | |
52
TIAA-CREF LIFE FUNDS - Stock Index Fund
| | | | | | | | |
SHARES | | | | COMPANY | | VALUE | |
| | | | | | | | |
354 | | * | | BioTelemetry, Inc | | $ | 4,135 | |
20,207 | | * | | Boston Scientific Corp | | | 372,617 | |
2,647 | | * | | Brookdale Senior Living, Inc | | | 48,864 | |
484 | | | | Cantel Medical Corp | | | 30,076 | |
442 | | * | | Capital Senior Living Corp | | | 9,220 | |
4,962 | | | | Cardinal Health, Inc | | | 442,958 | |
459 | | *,e | | Cardiovascular Systems, Inc | | | 6,940 | |
470 | | *,e | | Castlight Health, Inc | | | 2,007 | |
1,865 | | * | | Centene Corp | | | 122,736 | |
4,438 | | * | | Cerner Corp | | | 267,034 | |
1,390 | | *,e | | Cerus Corp | | | 8,785 | |
278 | | e | | Chemed Corp | | | 41,644 | |
3,835 | | | | Cigna Corp | | | 561,176 | |
172 | | * | | Civitas Solutions, Inc | | | 4,952 | |
2,019 | | * | | Community Health Systems, Inc | | | 53,564 | |
168 | | e | | Computer Programs & Systems, Inc | | | 8,358 | |
477 | | *,e | | ConforMIS, Inc | | | 8,247 | |
397 | | | | Conmed Corp | | | 17,488 | |
100 | | * | | Connecture, Inc | | | 361 | |
735 | | | | Cooper Cos, Inc | | | 98,637 | |
312 | | *,e | | Corindus Vascular Robotics, Inc | | | 1,002 | |
180 | | * | | Corvel Corp | | | 7,906 | |
459 | | * | | Cross Country Healthcare, Inc | | | 7,523 | |
377 | | | | CryoLife, Inc | | | 4,064 | |
202 | | * | | Cutera, Inc | | | 2,584 | |
319 | | * | | Cynosure, Inc (Class A) | | | 14,250 | |
2,638 | | * | | DaVita, Inc | | | 183,895 | |
2,083 | | | | Dentsply International, Inc | | | 126,751 | |
1,191 | | * | | DexCom, Inc | | | 97,543 | |
524 | | *,e | | Diplomat Pharmacy, Inc | | | 17,931 | |
3,190 | | * | | Edwards Lifesciences Corp | | | 251,946 | |
960 | | *,e | | Endologix, Inc | | | 9,504 | |
734 | | | | Ensign Group, Inc | | | 16,610 | |
75 | | * | | Entellus Medical, Inc | | | 1,264 | |
2,674 | | * | | Envision Healthcare Holdings, Inc | | | 69,444 | |
131 | | * | | Exactech, Inc | | | 2,378 | |
598 | | * | | ExamWorks Group, Inc | | | 15,907 | |
10,058 | | * | | Express Scripts Holding Co | | | 879,170 | |
635 | | * | | Five Star Quality Care, Inc | | | 2,019 | |
548 | | * | | Genesis Health Care, Inc | | | 1,902 | |
665 | | *,e | | GenMark Diagnostics, Inc | | | 5,160 | |
1,078 | | * | | Globus Medical, Inc | | | 29,990 | |
367 | | * | | Greatbatch, Inc | | | 19,267 | |
745 | | * | | Haemonetics Corp | | | 24,019 | |
725 | | * | | Halyard Health, Inc | | | 24,222 | |
506 | | * | | Hanger Orthopedic Group, Inc | | | 8,324 | |
4,743 | | * | | HCA Holdings, Inc | | | 320,769 | |
1,258 | | * | | Health Net, Inc | | | 86,123 | |
518 | | * | | HealthEquity, Inc | | | 12,986 | |
1,313 | | | | Healthsouth Corp | | | 45,706 | |
367 | | * | | HealthStream, Inc | | | 8,074 | |
402 | | * | | Healthways, Inc | | | 5,174 | |
241 | | *,e | | HeartWare International, Inc | | | 12,146 | |
1,278 | | * | | Henry Schein, Inc | | | 202,167 | |
815 | | | | Hill-Rom Holdings, Inc | | | 39,169 | |
1,267 | | * | | HMS Holdings Corp | | | 15,635 | |
3,770 | | * | | Hologic, Inc | | | 145,861 | |
2,267 | | | | Humana, Inc | | | 404,682 | |
202 | | * | | ICU Medical, Inc | | | 22,782 | |
1,489 | | * | | Idexx Laboratories, Inc | | | 108,578 | |
126 | | * | | Imprivata, Inc | | | 1,424 | |
1,943 | | * | | IMS Health Holdings, Inc | | | 49,488 | |
219 | | * | | Inogen Inc | | | 8,780 | |
277 | | *,e | | Inovalon Holdings, Inc | | | 4,709 | |
877 | | * | | Insulet Corp | | | 33,159 | |
367 | | * | | Integra LifeSciences Holdings Corp | | | 24,875 | |
53
TIAA-CREF LIFE FUNDS - Stock Index Fund
| | | | | | | | |
SHARES | | | | COMPANY | | VALUE | |
| | | | | | | | |
564 | | * | | Intuitive Surgical, Inc | | $ | 308,034 | |
463 | | | | Invacare Corp | | | 8,052 | |
1,225 | | * | | Inverness Medical Innovations, Inc | | | 47,885 | |
376 | | *,e | | InVivo Therapeutics Holdings Corp | | | 2,707 | |
44 | | * | | iRadimed Corp | | | 1,233 | |
199 | | * | | K2M Group Holdings, Inc | | | 3,928 | |
1,162 | | | | Kindred Healthcare, Inc | | | 13,839 | |
1,542 | | * | | Laboratory Corp of America Holdings | | | 190,653 | |
128 | | e | | Landauer, Inc | | | 4,214 | |
309 | | * | | LDR Holding Corp | | | 7,759 | |
185 | | | | LeMaitre Vascular, Inc | | | 3,191 | |
267 | | * | | LHC Group, Inc | | | 12,092 | |
658 | | * | | LifePoint Hospitals, Inc | | | 48,297 | |
652 | | * | | LivaNova plc | | | 38,709 | |
405 | | * | | Magellan Health Services, Inc | | | 24,972 | |
633 | | * | | Masimo Corp | | | 26,276 | |
3,486 | | | | McKesson Corp | | | 687,544 | |
873 | | * | | MedAssets, Inc | | | 27,011 | |
793 | | * | | Medidata Solutions, Inc | | | 39,087 | |
21,334 | | | | Medtronic plc | | | 1,641,011 | |
601 | | | | Meridian Bioscience, Inc | | | 12,333 | |
638 | | * | | Merit Medical Systems, Inc | | | 11,860 | |
610 | | * | | Molina Healthcare, Inc | | | 36,679 | |
138 | | | | National Healthcare Corp | | | 8,515 | |
133 | | | | National Research Corp | | | 2,133 | |
470 | | * | | Natus Medical, Inc | | | 22,583 | |
594 | | * | | Neogen Corp | | | 33,573 | |
368 | | * | | Nevro Corp | | | 24,844 | |
459 | | *,e | | Nobilis Health Corp | | | 1,294 | |
695 | | * | | NuVasive, Inc | | | 37,606 | |
920 | | * | | NxStage Medical, Inc | | | 20,157 | |
517 | | * | | Omnicell, Inc | | | 16,068 | |
749 | | * | | OraSure Technologies, Inc | | | 4,824 | |
267 | | * | | Orthofix International NV | | | 10,469 | |
999 | | | | Owens & Minor, Inc | | | 35,944 | |
286 | | *,e | | Oxford Immunotec Global plc | | | 3,289 | |
1,239 | | | | Patterson Cos, Inc | | | 56,015 | |
1,412 | | * | | Pediatrix Medical Group, Inc | | | 101,184 | |
435 | | * | | PharMerica Corp | | | 15,225 | |
546 | | * | | Premier, Inc | | | 19,257 | |
151 | | * | | Press Ganey Holdings, Inc | | | 4,764 | |
199 | | * | | Providence Service Corp | | | 9,337 | |
724 | | | | Quality Systems, Inc | | | 11,671 | |
2,180 | | | | Quest Diagnostics, Inc | | | 155,085 | |
382 | | * | | Quidel Corp | | | 8,098 | |
415 | | * | | RadNet, Inc | | | 2,565 | |
2,188 | | | | Resmed, Inc | | | 117,474 | |
726 | | *,e | | Rockwell Medical Technologies, Inc | | | 7,434 | |
837 | | * | | RTI Biologics, Inc | | | 3,323 | |
122 | | * | | SeaSpine Holdings Corp | | | 2,096 | |
167 | | *,e | | Second Sight Medical Products, Inc | | | 984 | |
1,504 | | | | Select Medical Holdings Corp | | | 17,913 | |
815 | | * | | Sirona Dental Systems, Inc | | | 89,300 | |
592 | | * | | Spectranetics Corp | | | 8,916 | |
4,154 | | | | St. Jude Medical, Inc | | | 256,593 | |
515 | | * | | Staar Surgical Co | | | 3,677 | |
1,263 | | e | | STERIS plc | | | 95,154 | |
5,044 | | | | Stryker Corp | | | 468,789 | |
351 | | * | | Surgical Care Affiliates, Inc | | | 13,973 | |
332 | | * | | SurModics, Inc | | | 6,730 | |
255 | | * | | Tandem Diabetes Care, Inc | | | 3,012 | |
1,034 | | * | | Team Health Holdings, Inc | | | 45,382 | |
490 | | *,e | | Teladoc, Inc | | | 8,800 | |
664 | | | | Teleflex, Inc | | | 87,283 | |
1,416 | | * | | Tenet Healthcare Corp | | | 42,905 | |
385 | | *,e | | TransEnterix, Inc | | | 955 | |
54
TIAA-CREF LIFE FUNDS - Stock Index Fund
| | | | | | | | |
SHARES | | | | COMPANY | | VALUE | |
| | | | | | | | |
334 | | * | | Triple-S Management Corp (Class B) | | $ | 7,986 | |
239 | | *,e | | Trupanion, Inc | | | 2,333 | |
1,710 | | *,e | | Unilife Corp | | | 847 | |
14,251 | | | | UnitedHealth Group, Inc | | | 1,676,488 | |
720 | | | | Universal American Corp | | | 5,040 | |
1,337 | | | | Universal Health Services, Inc (Class B) | | | 159,758 | |
178 | | | | US Physical Therapy, Inc | | | 9,555 | |
52 | | | | Utah Medical Products, Inc | | | 3,044 | |
1,462 | | * | | Varian Medical Systems, Inc | | | 118,130 | |
249 | | * | | Vascular Solutions, Inc | | | 8,563 | |
1,259 | | * | | VCA Antech, Inc | | | 69,245 | |
1,018 | | *,e | | Veeva Systems, Inc | | | 29,369 | |
202 | | *,e | | Veracyte, Inc | | | 1,454 | |
375 | | * | | Vocera Communications, Inc | | | 4,575 | |
632 | | * | | WellCare Health Plans, Inc | | | 49,429 | |
1,037 | | | | West Pharmaceutical Services, Inc | | | 62,448 | |
1,319 | | * | | Wright Medical Group NV | | | 31,893 | |
438 | | *,e | | Zeltiq Aesthetics, Inc | | | 12,496 | |
2,522 | | | | Zimmer Holdings, Inc | | | 258,732 | |
| | | | | | | | |
| | | | TOTAL HEALTH CARE EQUIPMENT & SERVICES | | | 17,058,711 | |
| | | | | | | | |
| |
HOUSEHOLD & PERSONAL PRODUCTS - 1.8% | | | | |
5,788 | | e | | Avon Products, Inc | | | 23,441 | |
580 | | * | | Central Garden and Pet Co (Class A) | | | 7,888 | |
1,968 | | | | Church & Dwight Co, Inc | | | 167,044 | |
1,957 | | | | Clorox Co | | | 248,206 | |
13,560 | | | | Colgate-Palmolive Co | | | 903,367 | |
1,382 | | e | | Coty, Inc | | | 35,421 | |
894 | | | | Edgewell Personal Care Co | | | 70,063 | |
373 | | *,e | | Elizabeth Arden, Inc | | | 3,693 | |
894 | | | | Energizer Holdings, Inc | | | 30,450 | |
3,114 | | | | Estee Lauder Cos (Class A) | | | 274,219 | |
1,076 | | *,e | | Herbalife Ltd | | | 57,695 | |
1,236 | | * | | HRG Group, Inc | | | 16,760 | |
223 | | | | Inter Parfums, Inc | | | 5,312 | |
5,465 | | | | Kimberly-Clark Corp | | | 695,695 | |
152 | | * | | Medifast, Inc | | | 4,618 | |
111 | | e | | Natural Health Trends Corp | | | 3,722 | |
140 | | | | Nature’s Sunshine Products, Inc | | | 1,417 | |
843 | | e | | Nu Skin Enterprises, Inc (Class A) | | | 31,941 | |
127 | | * | | Nutraceutical International Corp | | | 3,279 | |
63 | | | | Oil-Dri Corp of America | | | 2,320 | |
108 | | | | Orchids Paper Products Co | | | 3,339 | |
40,611 | | | | Procter & Gamble Co | | | 3,224,920 | |
162 | | * | | Revlon, Inc (Class A) | | | 4,510 | |
403 | | | | Spectrum Brands, Inc | | | 41,025 | |
92 | | * | | USANA Health Sciences, Inc | | | 11,753 | |
208 | | | | WD-40 Co | | | 20,519 | |
| | | | | | | | |
| | | | TOTAL HOUSEHOLD & PERSONAL PRODUCTS | | | 5,892,617 | |
| | | | | | | | |
| |
INSURANCE - 4.1% | | | | |
4,868 | | | | ACE Ltd | | | 568,826 | |
6,512 | | | | Aflac, Inc | | | 390,069 | |
250 | | * | | Alleghany Corp | | | 119,483 | |
1,633 | | | | Allied World Assurance Co Holdings Ltd | | | 60,731 | |
5,778 | | | | Allstate Corp | | | 358,756 | |
653 | | * | | AMBAC Financial Group, Inc | | | 9,201 | |
1,193 | | | | American Equity Investment Life Holding Co | | | 28,668 | |
972 | | | | American Financial Group, Inc | | | 70,062 | |
18,512 | | | | American International Group, Inc | | | 1,147,189 | |
105 | | | | American National Insurance Co | | | 10,738 | |
276 | | | | Amerisafe, Inc | | | 14,048 | |
523 | | | | Amtrust Financial Services, Inc | | | 32,206 | |
4,235 | | | | Aon plc | | | 390,509 | |
55
TIAA-CREF LIFE FUNDS - Stock Index Fund
| | | | | | | | |
SHARES | | | | COMPANY | | VALUE | |
| | | | | | | | |
1,888 | | * | | Arch Capital Group Ltd | | $ | 131,688 | |
403 | | | | Argo Group International Holdings Ltd | | | 24,116 | |
2,625 | | | | Arthur J. Gallagher & Co | | | 107,468 | |
878 | | | | Aspen Insurance Holdings Ltd | | | 42,407 | |
961 | | | | Assurant, Inc | | | 77,399 | |
2,304 | | | | Assured Guaranty Ltd | | | 60,895 | |
154 | | * | | Atlas Financial Holdings, Inc | | | 3,065 | |
1,620 | | | | Axis Capital Holdings Ltd | | | 91,076 | |
125 | | | | Baldwin & Lyons, Inc (Class B) | | | 3,004 | |
27,840 | | * | | Berkshire Hathaway, Inc (Class B) | | | 3,675,994 | |
1,663 | | | | Brown & Brown, Inc | | | 53,382 | |
3,454 | | | | Chubb Corp | | | 458,139 | |
2,559 | | | | Cincinnati Financial Corp | | | 151,416 | |
590 | | *,e | | Citizens, Inc (Class A) | | | 4,384 | |
303 | | | | CNA Financial Corp | | | 10,650 | |
2,903 | | | | Conseco, Inc | | | 55,418 | |
375 | | | | Crawford & Co (Class B) | | | 1,991 | |
143 | | | | Donegal Group, Inc (Class A) | | | 2,013 | |
90 | | | | EMC Insurance Group, Inc | | | 2,277 | |
458 | | | | Employers Holdings, Inc | | | 12,503 | |
913 | | | | Endurance Specialty Holdings Ltd | | | 58,423 | |
148 | | * | | Enstar Group Ltd | | | 22,206 | |
435 | | | | Erie Indemnity Co (Class A) | | | 41,603 | |
683 | | | | Everest Re Group Ltd | | | 125,050 | |
130 | | | | FBL Financial Group, Inc (Class A) | | | 8,273 | |
201 | | | | Federated National Holding Co | | | 5,942 | |
1,654 | | | | First American Financial Corp | | | 59,379 | |
4,111 | | | | FNF Group | | | 142,528 | |
7,337 | | * | | Genworth Financial, Inc (Class A) | | | 27,367 | |
420 | | * | | Greenlight Capital Re Ltd (Class A) | | | 7,858 | |
198 | | * | | Hallmark Financial Services | | | 2,315 | |
634 | | | | Hanover Insurance Group, Inc | | | 51,570 | |
6,230 | | | | Hartford Financial Services Group, Inc | | | 270,756 | |
121 | | e | | HCI Group, Inc | | | 4,217 | |
362 | | * | | Heritage Insurance Holdings, Inc | | | 7,899 | |
467 | | | | Horace Mann Educators Corp | | | 15,495 | |
102 | | | | Independence Holding Co | | | 1,413 | |
166 | | | | Infinity Property & Casualty Corp | | | 13,650 | |
162 | | | | James River Group Holdings Ltd | | | 5,433 | |
614 | | | | Kemper Corp | | | 22,872 | |
3,723 | | | | Lincoln National Corp | | | 187,118 | |
4,751 | | | | Loews Corp | | | 182,438 | |
553 | | | | Maiden Holdings Ltd | | | 8,245 | |
207 | | * | | Markel Corp | | | 182,853 | |
8,043 | | | | Marsh & McLennan Cos, Inc | | | 445,984 | |
2,232 | | * | | MBIA, Inc | | | 14,463 | |
494 | | | | Mercury General Corp | | | 23,006 | |
14,080 | | | | Metlife, Inc | | | 678,797 | |
515 | | | | National General Holdings Corp | | | 11,258 | |
95 | | | | National Interstate Corp | | | 2,537 | |
33 | | | | National Western Life Group, Inc | | | 8,314 | |
149 | | * | | Navigators Group, Inc | | | 12,783 | |
3,761 | | | | Old Republic International Corp | | | 70,067 | |
313 | | | | OneBeacon Insurance Group Ltd (Class A) | | | 3,884 | |
741 | | | | PartnerRe Ltd | | | 103,547 | |
736 | | | | Primerica, Inc | | | 34,761 | |
4,415 | | | | Principal Financial Group | | | 198,587 | |
1,060 | | | | ProAssurance Corp | | | 51,442 | |
8,719 | | | | Progressive Corp | | | 277,264 | |
6,749 | | | | Prudential Financial, Inc | | | 549,436 | |
1,054 | | | | Reinsurance Group of America, Inc (Class A) | | | 90,170 | |
770 | | | | RenaissanceRe Holdings Ltd | | | 87,156 | |
768 | | | | RLI Corp | | | 47,424 | |
216 | | | | Safety Insurance Group, Inc | | | 12,178 | |
819 | | | | Selective Insurance Group, Inc | | | 27,502 | |
671 | | | | Stancorp Financial Group, Inc | | | 76,413 | |
56
TIAA-CREF LIFE FUNDS - Stock Index Fund
| | | | | | | | |
SHARES | | | | COMPANY | | VALUE | |
| | | | | | | | |
200 | | | | State Auto Financial Corp | | $ | 4,118 | |
436 | | | | State National Cos, Inc | | | 4,277 | |
329 | | | | Stewart Information Services Corp | | | 12,282 | |
1,331 | | | | Symetra Financial Corp | | | 42,286 | |
1,221 | | * | | Third Point Reinsurance Ltd | | | 16,374 | |
1,815 | | | | Torchmark Corp | | | 103,745 | |
4,757 | | | | Travelers Cos, Inc | | | 536,875 | |
110 | | * | | United America Indemnity Ltd | | | 3,192 | |
234 | | | | United Fire & Casualty Co | | | 8,965 | |
255 | | | | United Insurance Holdings Corp | | | 4,361 | |
456 | | e | | Universal Insurance Holdings, Inc | | | 10,570 | |
3,686 | | | | UnumProvident Corp | | | 122,707 | |
1,218 | | | | Validus Holdings Ltd | | | 56,381 | |
1,346 | | | | W.R. Berkley Corp | | | 73,694 | |
98 | | | | White Mountains Insurance Group Ltd | | | 71,227 | |
4,574 | | | | XL Capital Ltd | | | 179,209 | |
| | | | | | | | |
| | | | TOTAL INSURANCE | | | 13,701,910 | |
| | | | | | | | |
| |
MATERIALS - 3.1% | | | | |
412 | | | | A. Schulman, Inc | | | 12,624 | |
78 | | * | | AEP Industries, Inc | | | 6,018 | |
3,229 | | | | Air Products & Chemicals, Inc | | | 420,125 | |
1,095 | | | | Airgas, Inc | | | 151,460 | |
3,755 | | *,e | | AK Steel Holding Corp | | | 8,411 | |
1,735 | | | | Albemarle Corp | | | 97,177 | |
19,492 | | | | Alcoa, Inc | | | 192,386 | |
1,514 | | e | | Allegheny Technologies, Inc | | | 17,032 | |
429 | | | | American Vanguard Corp | | | 6,010 | |
1,019 | | | | Aptargroup, Inc | | | 74,030 | |
954 | | | | Ashland, Inc | | | 97,976 | |
1,310 | | | | Avery Dennison Corp | | | 82,085 | |
1,447 | | * | | Axalta Coating Systems Ltd | | | 38,563 | |
1,085 | | | | Axiall Corp | | | 16,709 | |
437 | | | | Balchem Corp | | | 26,570 | |
1,984 | | | | Ball Corp | | | 144,296 | |
1,495 | | | | Bemis Co, Inc | | | 66,812 | |
1,716 | | * | | Berry Plastics Group, Inc | | | 62,085 | |
571 | | * | | Boise Cascade Co | | | 14,578 | |
300 | | | | Brush Engineered Materials, Inc | | | 8,400 | |
912 | | | | Cabot Corp | | | 37,283 | |
730 | | | | Calgon Carbon Corp | | | 12,592 | |
723 | | | | Carpenter Technology Corp | | | 21,885 | |
2,335 | | | | Celanese Corp (Series A) | | | 157,216 | |
742 | | *,e | | Century Aluminum Co | | | 3,280 | |
3,559 | | | | CF Industries Holdings, Inc | | | 145,243 | |
90 | | | | Chase Corp | | | 3,666 | |
2,604 | | | | Chemours Co | | | 13,957 | |
1,111 | | * | | Chemtura | | | 30,297 | |
372 | | * | | Clearwater Paper Corp | | | 16,937 | |
5,053 | | *,e | | Cliffs Natural Resources, Inc | | | 7,984 | |
2,109 | | *,e | | Coeur Mining, Inc | | | 5,230 | |
1,538 | | | | Commercial Metals Co | | | 21,055 | |
486 | | | | Compass Minerals International, Inc | | | 36,581 | |
115 | | * | | Core Molding Technologies, Inc | | | 1,475 | |
2,131 | | * | | Crown Holdings, Inc | | | 108,042 | |
156 | | | | Deltic Timber Corp | | | 9,184 | |
915 | | | | Domtar Corp | | | 33,809 | |
16,785 | | | | Dow Chemical Co | | | 864,092 | |
13,478 | | | | Du Pont (E.I.) de Nemours & Co | | | 897,635 | |
723 | | | | Eagle Materials, Inc | | | 43,691 | |
2,137 | | | | Eastman Chemical Co | | | 144,269 | |
3,965 | | | | Ecolab, Inc | | | 453,517 | |
1,059 | | * | | Ferro Corp | | | 11,776 | |
835 | | *,e | | Flotek Industries, Inc | | | 9,552 | |
1,884 | | | | FMC Corp | | | 73,721 | |
57
TIAA-CREF LIFE FUNDS - Stock Index Fund
| | | | | | | | |
SHARES | | | | COMPANY | | VALUE | |
| | | | | | | | |
16,725 | | | | Freeport-McMoRan Copper & Gold, Inc (Class B) | | $ | 113,228 | |
353 | | | | FutureFuel Corp | | | 4,765 | |
553 | | | | Glatfelter | | | 10,197 | |
4,735 | | | | Graphic Packaging Holding Co | | | 60,750 | |
417 | | | | Greif, Inc (Class A) | | | 12,848 | |
728 | | | | H.B. Fuller Co | | | 26,550 | |
142 | | | | Hawkins, Inc | | | 5,079 | |
166 | | | | Haynes International, Inc | | | 6,091 | |
1,060 | | * | | Headwaters, Inc | | | 17,882 | |
7,872 | | | | Hecla Mining Co | | | 14,878 | |
4,078 | | *,e | | Horsehead Holding Corp | | | 8,360 | |
3,515 | | | | Huntsman Corp | | | 39,966 | |
294 | | | | Innophos Holdings, Inc | | | 8,520 | |
351 | | | | Innospec, Inc | | | 19,063 | |
1,215 | | | | International Flavors & Fragrances, Inc | | | 145,363 | |
6,275 | | | | International Paper Co | | | 236,567 | |
748 | | * | | Intrepid Potash, Inc | | | 2,207 | |
245 | | | | Kaiser Aluminum Corp | | | 20,497 | |
1,230 | | | | Kapstone Paper and Packaging Corp | | | 27,786 | |
139 | | | | KMG Chemicals, Inc | | | 3,200 | |
296 | | | | Koppers Holdings, Inc | | | 5,402 | |
448 | | * | | Kraton Polymers LLC | | | 7,441 | |
274 | | e | | Kronos Worldwide, Inc | | | 1,545 | |
2,147 | | * | | Louisiana-Pacific Corp | | | 38,667 | |
1,745 | | *,e | | LSB Industries, Inc | | | 12,651 | |
5,465 | | | | LyondellBasell Industries AF S.C.A | | | 474,908 | |
1,031 | | | | Martin Marietta Materials, Inc | | | 140,814 | |
492 | | | | Minerals Technologies, Inc | | | 22,563 | |
6,575 | | | | Monsanto Co | | | 647,769 | |
5,071 | | | | Mosaic Co | | | 139,909 | |
371 | | | | Myers Industries, Inc | | | 4,942 | |
240 | | | | Neenah Paper, Inc | | | 14,983 | |
129 | | | | NewMarket Corp | | | 49,114 | |
7,804 | | | | Newmont Mining Corp | | | 140,394 | |
4,769 | | | | Nucor Corp | | | 192,191 | |
2,434 | | | | Olin Corp | | | 42,011 | |
170 | | | | Olympic Steel, Inc | | | 1,969 | |
1,204 | | * | | Omnova Solutions, Inc | | | 7,381 | |
2,323 | | * | | Owens-Illinois, Inc | | | 40,467 | |
1,406 | | | | Packaging Corp of America | | | 88,648 | |
1,731 | | * | | Platform Specialty Products Corp | | | 22,209 | |
1,282 | | | | PolyOne Corp | | | 40,716 | |
4,083 | | | | PPG Industries, Inc | | | 403,482 | |
4,318 | | | | Praxair, Inc | | | 442,163 | |
190 | | | | Quaker Chemical Corp | | | 14,679 | |
593 | | | | Rayonier Advanced Materials, Inc | | | 5,805 | |
362 | | * | | Real Industry, Inc | | | 2,907 | |
1,071 | | | | Reliance Steel & Aluminum Co | | | 62,022 | |
3,699 | | * | | Rentech, Inc | | | 13,020 | |
932 | | | | Royal Gold, Inc | | | 33,990 | |
1,857 | | | | RPM International, Inc | | | 81,819 | |
268 | | *,e | | Ryerson Holding Corp | | | 1,252 | |
387 | | | | Schnitzer Steel Industries, Inc (Class A) | | | 5,561 | |
409 | | | | Schweitzer-Mauduit International, Inc | | | 17,174 | |
647 | | | | Scotts Miracle-Gro Co (Class A) | | | 41,738 | |
3,207 | | | | Sealed Air Corp | | | 143,032 | |
570 | | *,e | | Senomyx, Inc | | | 2,149 | |
694 | | | | Sensient Technologies Corp | | | 43,597 | |
1,200 | | | | Sherwin-Williams Co | | | 311,520 | |
587 | | | | Silgan Holdings, Inc | | | 31,534 | |
1,453 | | | | Sonoco Products Co | | | 59,384 | |
1,642 | | e | | Southern Copper Corp (NY) | | | 42,889 | |
3,403 | | | | Steel Dynamics, Inc | | | 60,812 | |
281 | | | | Stepan Co | | | 13,963 | |
1,739 | | * | | Stillwater Mining Co | | | 14,903 | |
374 | | * | | Summit Materials, Inc | | | 7,485 | |
58
TIAA-CREF LIFE FUNDS - Stock Index Fund
| | | | | | | | |
SHARES | | | | COMPANY | | VALUE | |
| | | | | | | | |
936 | | | | SunCoke Energy, Inc | | $ | 3,248 | |
2,292 | | | | Tahoe Resources, Inc | | | 19,872 | |
579 | | | | TimkenSteel Corp | | | 4,852 | |
254 | | * | | Trecora Resources | | | 3,147 | |
333 | | | | Tredegar Corp | | | 4,535 | |
261 | | *,e | | Trinseo S.A. | | | 7,360 | |
929 | | e | | Tronox Ltd | | | 3,632 | |
30 | | | | United States Lime & Minerals, Inc | | | 1,649 | |
2,110 | | e | | United States Steel Corp | | | 16,838 | |
210 | | * | | US Concrete, Inc | | | 11,059 | |
251 | | e | | Valhi, Inc | | | 336 | |
1,192 | | | | Valspar Corp | | | 98,876 | |
2,091 | | | | Vulcan Materials Co | | | 198,582 | |
624 | | | | Wausau Paper Corp | | | 6,384 | |
546 | | | | Westlake Chemical Corp | | | 29,659 | |
3,950 | | | | WestRock Co | | | 180,199 | |
54 | | * | | WHX Corp | | | 1,108 | |
702 | | | | Worthington Industries, Inc | | | 21,158 | |
1,091 | | * | | WR Grace & Co | | | 108,653 | |
| | | | | | | | |
| | | | TOTAL MATERIALS | | | 10,205,834 | |
| | | | | | | | |
| |
MEDIA - 3.1% | | | | |
301 | | | | AMC Entertainment Holdings, Inc | | | 7,224 | |
861 | | * | | AMC Networks, Inc | | | 64,299 | |
48 | | | | Cable One, Inc | | | 20,816 | |
2,916 | | | | Cablevision Systems Corp (Class A) | | | 93,020 | |
409 | | * | | Carmike Cinemas, Inc | | | 9,382 | |
7,434 | | | | CBS Corp (Class B) | | | 350,364 | |
3,129 | | *,e | | Central European Media Enterprises Ltd (Class A) (NASDAQ) | | | 8,417 | |
1,129 | | *,e | | Charter Communications, Inc | | | 206,720 | |
1,900 | | | | Cinemark Holdings, Inc | | | 63,517 | |
566 | | * | | Clear Channel Outdoor Holdings, Inc (Class A) | | | 3,164 | |
37,415 | | | | Comcast Corp (Class A) | | | 2,111,328 | |
465 | | * | | Crown Media Holdings, Inc (Class A) | | | 2,609 | |
18 | | *,e | | Daily Journal Corp | | | 3,636 | |
2,526 | | * | | Discovery Communications, Inc (Class A) | | | 67,394 | |
3,942 | | * | | Discovery Communications, Inc (Class C) | | | 99,417 | |
3,256 | | * | | DISH Network Corp (Class A) | | | 186,178 | |
1,127 | | * | | DreamWorks Animation SKG, Inc (Class A) | | | 29,043 | |
375 | | * | | Entercom Communications Corp (Class A) | | | 4,211 | |
931 | | | | Entravision Communications Corp (Class A) | | | 7,178 | |
852 | | | | EW Scripps Co (Class A) | | | 16,188 | |
1,572 | | | | Gannett Co, Inc | | | 25,608 | |
667 | | *,e | | Global Eagle Entertainment, Inc | | | 6,583 | |
966 | | * | | Gray Television, Inc | | | 15,746 | |
700 | | | | Harte-Hanks, Inc | | | 2,268 | |
133 | | *,e | | Hemisphere Media Group, Inc | | | 1,962 | |
869 | | *,e | | Imax Corp | | | 30,884 | |
6,347 | | | | Interpublic Group of Cos, Inc | | | 147,758 | |
670 | | | | John Wiley & Sons, Inc (Class A) | | | 30,170 | |
220 | | | | Journal Media Group, Inc | | | 2,644 | |
373 | | * | | Liberty Broadband Corp (Class A) | | | 19,265 | |
1,023 | | * | | Liberty Broadband Corp (Class C) | | | 53,053 | |
1,500 | | * | | Liberty Media Corp | | | 58,875 | |
3,121 | | * | | Liberty Media Corp (Class C) | | | 118,848 | |
1,362 | | e | | Lions Gate Entertainment Corp | | | 44,115 | |
2,089 | | * | | Live Nation, Inc | | | 51,327 | |
187 | | * | | Loral Space & Communications, Inc | | | 7,613 | |
298 | | * | | Madison Square Garden Co | | | 48,216 | |
554 | | e | | MDC Partners, Inc | | | 12,033 | |
1,381 | | * | | Media General, Inc | | | 22,303 | |
465 | | | | Meredith Corp | | | 20,111 | |
895 | | * | | MSG Networks, Inc | | | 18,616 | |
760 | | | | National CineMedia, Inc | | | 11,940 | |
651 | | | | New Media Investment Group, Inc | | | 12,668 | |
59
TIAA-CREF LIFE FUNDS - Stock Index Fund
| | | | | | | | |
SHARES | | | | COMPANY | | VALUE | |
| | | | | | | | |
2,509 | | | | New York Times Co (Class A) | | $ | 33,671 | |
5,520 | | | | News Corp | | | 73,747 | |
1,810 | | | | News Corp (Class B) | | | 25,268 | |
512 | | e | | Nexstar Broadcasting Group, Inc (Class A) | | | 30,054 | |
3,641 | | | | Omnicom Group, Inc | | | 275,478 | |
444 | | * | | Reading International, Inc | | | 5,821 | |
1,186 | | e | | Regal Entertainment Group (Class A) | | | 22,380 | |
185 | | * | | Rentrak Corp | | | 8,793 | |
51 | | | | Saga Communications, Inc | | | 1,961 | |
365 | | | | Scholastic Corp | | | 14,074 | |
1,321 | | | | Scripps Networks Interactive (Class A) | | | 72,932 | |
955 | | | | Sinclair Broadcast Group, Inc (Class A) | | | 31,076 | |
35,836 | | *,e | | Sirius XM Holdings, Inc | | | 145,853 | |
300 | | * | | Sizmek, Inc | | | 1,095 | |
1,255 | | * | | Starz-Liberty Capital | | | 42,043 | |
3,468 | | | | TEGNA, Inc | | | 88,503 | |
5,062 | | | | Thomson Corp | | | 191,597 | |
4,233 | | | | Time Warner Cable, Inc | | | 785,602 | |
12,347 | | | | Time Warner, Inc | | | 798,481 | |
1,479 | | | | Time, Inc | | | 23,176 | |
99 | | * | | Townsquare Media, Inc | | | 1,184 | |
1,158 | | | | Tribune Co | | | 39,152 | |
322 | | | | Tribune Publishing Co | | | 2,969 | |
17,875 | | | | Twenty-First Century Fox, Inc | | | 485,485 | |
7,264 | | | | Twenty-First Century Fox, Inc (Class B) | | | 197,799 | |
150 | | | | Viacom, Inc | | | 6,599 | |
5,174 | | | | Viacom, Inc (Class B) | | | 212,962 | |
25,399 | | | | Walt Disney Co | | | 2,668,927 | |
583 | | e | | World Wrestling Entertainment, Inc (Class A) | | | 10,401 | |
| | | | | | | | |
| | | | TOTAL MEDIA | | | 10,413,794 | |
| | | | | | | | |
| |
PHARMACEUTICALS, BIOTECHNOLOGY & LIFE SCIENCES - 9.5% | | | | |
24,781 | | | | AbbVie, Inc | | | 1,468,026 | |
149 | | *,e | | Abeona Therapeutics, Inc | | | 501 | |
1,146 | | * | | Acadia Pharmaceuticals, Inc | | | 40,855 | |
305 | | *,e | | Accelerate Diagnostics, Inc | | | 6,554 | |
314 | | * | | Acceleron Pharma, Inc | | | 15,311 | |
1,630 | | * | | Achillion Pharmaceuticals, Inc | | | 17,588 | |
533 | | *,e | | Acorda Therapeutics, Inc | | | 22,802 | |
143 | | * | | Adamas Pharmaceuticals, Inc | | | 4,050 | |
121 | | *,e | | Aduro Biotech, Inc | | | 3,405 | |
440 | | *,e | | Advaxis, Inc | | | 4,426 | |
373 | | *,e | | Aegerion Pharmaceuticals, Inc | | | 3,767 | |
287 | | *,e | | Aerie Pharmaceuticals, Inc | | | 6,988 | |
214 | | *,e | | Affimed NV | | | 1,524 | |
1,123 | | * | | Affymetrix, Inc | | | 11,331 | |
1,104 | | * | | Agenus, Inc | | | 5,012 | |
150 | | * | | Agile Therapeutics, Inc | | | 1,464 | |
4,923 | | | | Agilent Technologies, Inc | | | 205,831 | |
369 | | *,e | | Agios Pharmaceuticals, Inc | | | 23,955 | |
604 | | *,e | | Aimmune Therapeutics, Inc | | | 11,144 | |
189 | | *,e | | Akebia Therapeutics, Inc | | | 2,442 | |
1,130 | | * | | Akorn, Inc | | | 42,160 | |
359 | | *,e | | Albany Molecular Research, Inc | | | 7,126 | |
299 | | * | | Alder Biopharmaceuticals, Inc | | | 9,876 | |
3,231 | | * | | Alexion Pharmaceuticals, Inc | | | 616,313 | |
352 | | *,e | | Alimera Sciences, Inc | | | 852 | |
2,267 | | * | | Alkermes plc | | | 179,954 | |
5,871 | | * | | Allergan plc | | | 1,834,688 | |
1,068 | | * | | Alnylam Pharmaceuticals, Inc | | | 100,542 | |
533 | | * | | AMAG Pharmaceuticals, Inc | | | 16,091 | |
11,382 | | | | Amgen, Inc | | | 1,847,640 | |
1,917 | | *,e | | Amicus Therapeutics, Inc | | | 18,595 | |
453 | | *,e | | Amphastar Pharmaceuticals, Inc | | | 6,446 | |
588 | | * | | Anacor Pharmaceuticals, Inc | | | 66,426 | |
60
TIAA-CREF LIFE FUNDS - Stock Index Fund
| | | | | | | | |
SHARES | | | | COMPANY | | VALUE | |
| | | | | | | | |
112 | | * | | ANI Pharmaceuticals, Inc | | $ | 5,054 | |
506 | | *,e | | Anthera Pharmaceuticals, Inc | | | 2,348 | |
121 | | * | | Applied Genetic Technologies Corp | | | 2,468 | |
434 | | * | | Aratana Therapeutics, Inc | | | 2,422 | |
181 | | * | | Ardelyx, Inc | | | 3,280 | |
3,482 | | * | | Arena Pharmaceuticals, Inc | | | 6,616 | |
2,403 | | *,e | | Ariad Pharmaceuticals, Inc | | | 15,019 | |
2,149 | | *,e | | Array Biopharma, Inc | | | 9,069 | |
1,229 | | *,e | | Arrowhead Research Corp | | | 7,558 | |
203 | | *,e | | Assembly Biosciences, Inc | | | 1,525 | |
224 | | * | | Atara Biotherapeutics, Inc | | | 5,916 | |
93 | | *,e | | aTyr Pharma, Inc | | | 914 | |
291 | | *,e | | Avalanche Biotechnologies, Inc | | | 2,770 | |
680 | | *,e | | Axovant Sciences Ltd | | | 12,260 | |
8,247 | | | | Baxalta, Inc | | | 321,880 | |
120 | | *,e | | Bellicum Pharmaceuticals, Inc | | | 2,432 | |
1,046 | | * | | BioCryst Pharmaceuticals, Inc | | | 10,795 | |
659 | | *,e | | BioDelivery Sciences International, Inc | | | 3,157 | |
3,338 | | * | | Biogen Idec, Inc | | | 1,022,596 | |
2,367 | | * | | BioMarin Pharmaceutical, Inc | | | 247,967 | |
297 | | * | | Bio-Rad Laboratories, Inc (Class A) | | | 41,182 | |
73 | | * | | Biospecifics Technologies Corp | | | 3,137 | |
590 | | | | Bio-Techne Corp | | | 53,100 | |
734 | | *,e | | BioTime, Inc | | | 3,009 | |
627 | | * | | Bluebird Bio, Inc | | | 40,266 | |
130 | | *,e | | Blueprint Medicines Corp | | | 3,424 | |
24,955 | | | | Bristol-Myers Squibb Co | | | 1,716,654 | |
1,601 | | * | | Bruker BioSciences Corp | | | 38,856 | |
186 | | *,e | | Calithera Biosciences, Inc | | | 1,425 | |
449 | | * | | Cambrex Corp | | | 21,143 | |
240 | | * | | Cara Therapeutics Inc | | | 4,046 | |
187 | | *,e | | Carbylan Therapeutics, Inc | | | 677 | |
1,202 | | * | | Catalent, Inc | | | 30,086 | |
1,105 | | *,e | | Catalyst Pharmaceuticals, Inc | | | 2,707 | |
11,874 | | * | | Celgene Corp | | | 1,422,030 | |
1,468 | | *,e | | Celldex Therapeutics, Inc | | | 23,018 | |
138 | | * | | Cellular Biomedicine Group, Inc | | | 2,966 | |
472 | | *,e | | Cempra, Inc | | | 14,693 | |
1,032 | | * | | Cepheid, Inc | | | 37,699 | |
740 | | * | | Charles River Laboratories International, Inc | | | 59,489 | |
316 | | * | | ChemoCentryx, Inc | | | 2,560 | |
595 | | * | | Chimerix, Inc | | | 5,325 | |
68 | | *,e | | Cidara Therapeutics, Inc | | | 1,167 | |
463 | | *,e | | Clovis Oncology, Inc | | | 16,205 | |
338 | | * | | Coherus Biosciences, Inc | | | 7,760 | |
95 | | * | | Collegium Pharmaceutical, Inc | | | 2,612 | |
219 | | * | | Concert Pharmaceuticals Inc | | | 4,154 | |
898 | | *,e | | Corcept Therapeutics, Inc | | | 4,472 | |
123 | | *,e | | Corium International, Inc | | | 999 | |
431 | | *,e | | CorMedix, Inc | | | 875 | |
2,422 | | * | | CTI BioPharma Corp | | | 2,979 | |
1,644 | | * | | Curis, Inc | | | 4,784 | |
503 | | * | | Cytokinetics, Inc | | | 5,261 | |
748 | | *,e | | CytRx Corp | | | 1,982 | |
867 | | *,e | | Depomed, Inc | | | 15,719 | |
185 | | * | | Dermira, Inc | | | 6,403 | |
226 | | * | | Dicerna Pharmaceuticals Inc | | | 2,683 | |
1,634 | | *,e | | Durect Corp | | | 3,611 | |
2,090 | | * | | Dyax Corp | | | 78,626 | |
691 | | * | | Dynavax Technologies Corp | | | 16,695 | |
122 | | *,e | | Eagle Pharmaceuticals, Inc | | | 10,818 | |
14,649 | | | | Eli Lilly & Co | | | 1,234,325 | |
433 | | * | | Emergent Biosolutions, Inc | | | 17,324 | |
232 | | *,e | | Enanta Pharmaceuticals, Inc | | | 7,661 | |
3,357 | | * | | Endo International plc | | | 205,516 | |
543 | | *,e | | Endocyte, Inc | | | 2,177 | |
61
TIAA-CREF LIFE FUNDS - Stock Index Fund
| | | | | | | | |
SHARES | | | | COMPANY | | VALUE | |
| | | | | | | | |
424 | | *,e | | Epizyme, Inc | | $ | 6,792 | |
183 | | *,e | | Esperion Thereapeutics, Inc | | | 4,074 | |
1,326 | | *,e | | Exact Sciences Corp | | | 12,239 | |
3,210 | | *,e | | Exelixis, Inc | | | 18,104 | |
352 | | * | | Fibrocell Science, Inc | | | 1,602 | |
691 | | * | | FibroGen, Inc | | | 21,055 | |
307 | | * | | Five Prime Therapeutics, Inc | | | 12,741 | |
86 | | *,e | | Flex Pharma, Inc | | | 1,071 | |
200 | | *,e | | Flexion Therapeutics Inc | | | 3,854 | |
419 | | * | | Fluidigm Corp | | | 4,529 | |
320 | | *,e | | Foamix Pharmaceuticals Ltd | | | 2,595 | |
173 | | * | | Foundation Medicine, Inc | | | 3,643 | |
2,273 | | *,e | | Galena Biopharma, Inc | | | 3,341 | |
255 | | *,e | | Genocea Biosciences Inc | | | 1,344 | |
270 | | * | | Genomic Health, Inc | | | 9,504 | |
2,277 | | *,e | | Geron Corp | | | 11,021 | |
22,000 | | | | Gilead Sciences, Inc | | | 2,226,180 | |
1,523 | | * | | Halozyme Therapeutics, Inc | | | 26,394 | |
512 | | * | | Harvard Bioscience, Inc | | | 1,777 | |
591 | | *,e | | Heron Therapeutics, Inc | | | 15,780 | |
80 | | * | | Heska Corp | | | 3,094 | |
1,665 | | *,e | | Idera Pharmaceuticals, Inc | | | 5,145 | |
268 | | *,e | | Ignyta, Inc | | | 3,591 | |
2,170 | | * | | Illumina, Inc | | | 416,521 | |
247 | | *,e | | Immune Design Corp | | | 4,960 | |
1,233 | | * | | Immunogen, Inc | | | 16,732 | |
1,305 | | *,e | | Immunomedics, Inc | | | 4,006 | |
1,034 | | * | | Impax Laboratories, Inc | | | 44,214 | |
255 | | * | | INC Research Holdings, Inc | | | 12,370 | |
2,315 | | * | | Incyte Corp | | | 251,062 | |
696 | | * | | Infinity Pharmaceuticals, Inc | | | 5,464 | |
1,045 | | *,e | | Inovio Pharmaceuticals, Inc | | | 7,022 | |
884 | | * | | Insmed, Inc | | | 16,045 | |
340 | | *,e | | Insys Therapeutics, Inc | | | 9,734 | |
229 | | *,e | | Intercept Pharmaceuticals, Inc | | | 34,201 | |
199 | | * | | Intersect ENT, Inc | | | 4,478 | |
487 | | * | | Intra-Cellular Therapies, Inc | | | 26,196 | |
667 | | *,e | | Intrexon Corp | | | 20,110 | |
110 | | *,e | | Invitae Corp | | | 903 | |
1,742 | | *,e | | Ionis Pharmaceuticals, Inc | | | 107,882 | |
1,820 | | * | | Ironwood Pharmaceuticals, Inc | | | 21,094 | |
943 | | * | | Jazz Pharmaceuticals plc | | | 132,548 | |
41,509 | | | | Johnson & Johnson | | | 4,263,805 | |
188 | | *,e | | Juno Therapeutics, Inc | | | 8,266 | |
1,014 | | *,e | | Karyopharm Therapeutics, Inc | | | 13,436 | |
3,453 | | *,e | | Keryx Biopharmaceuticals, Inc | | | 17,438 | |
416 | | *,e | | Kite Pharma, Inc | | | 25,634 | |
166 | | *,e | | La Jolla Pharmaceutical Co | | | 4,482 | |
380 | | *,e | | Lannett Co, Inc | | | 15,246 | |
585 | | *,e | | Lexicon Pharmaceuticals, Inc | | | 7,786 | |
257 | | *,e | | Ligand Pharmaceuticals, Inc (Class B) | | | 27,864 | |
664 | | *,e | | Lion Biotechnologies, Inc | | | 5,126 | |
120 | | *,e | | Loxo Oncology, Inc | | | 3,414 | |
588 | | * | | Luminex Corp | | | 12,577 | |
401 | | * | | MacroGenics, Inc | | | 12,419 | |
1,774 | | * | | Mallinckrodt plc | | | 132,394 | |
3,540 | | *,e | | MannKind Corp | | | 5,133 | |
222 | | * | | Medgenics, Inc | | | 1,336 | |
952 | | * | | Medicines Co | | | 35,548 | |
2,485 | | * | | Medivation, Inc | | | 120,125 | |
42,291 | | | | Merck & Co, Inc | | | 2,233,811 | |
1,570 | | *,e | | Merrimack Pharmaceuticals, Inc | | | 12,403 | |
441 | | * | | Mettler-Toledo International, Inc | | | 149,556 | |
1,555 | | *,e | | MiMedx Group, Inc | | | 14,570 | |
140 | | *,e | | Mirati Therapeutics, Inc | | | 4,424 | |
872 | | * | | Momenta Pharmaceuticals, Inc | | | 12,940 | |
62
TIAA-CREF LIFE FUNDS - Stock Index Fund
| | | | | | | | |
SHARES | | | | COMPANY | | VALUE | |
| | | | | | | | |
6,345 | | * | | Mylan NV | | $ | 343,074 | |
1,155 | | * | | Myriad Genetics, Inc | | | 49,850 | |
188 | | *,e | | NanoString Technologies, Inc | | | 2,765 | |
2,022 | | *,e | | Navidea Biopharmceuticals, Inc | | | 2,689 | |
1,889 | | * | | Nektar Therapeutics | | | 31,830 | |
749 | | * | | NeoGenomics, Inc | | | 5,895 | |
1,232 | | * | | Neurocrine Biosciences, Inc | | | 69,694 | |
298 | | *,e | | NewLink Genetics Corp | | | 10,844 | |
660 | | *,e | | Northwest Biotherapeutics, Inc | | | 2,112 | |
3,846 | | *,e | | Novavax, Inc | | | 32,268 | |
506 | | * | | Ocata Therapeutics, Inc | | | 4,261 | |
185 | | *,e | | Ocular Therapeutix, Inc | | | 1,733 | |
548 | | *,e | | Omeros Corp | | | 8,620 | |
240 | | *,e | | OncoMed Pharmaceuticals, Inc | | | 5,410 | |
1,471 | | * | | Oncothyreon, Inc | | | 3,266 | |
339 | | * | | Ophthotech Corp | | | 26,622 | |
4,500 | | *,e | | Opko Health, Inc | | | 45,225 | |
1,769 | | *,e | | Orexigen Therapeutics, Inc | | | 3,043 | |
4,084 | | *,e | | Organovo Holdings, Inc | | | 10,169 | |
254 | | e | | Osiris Therapeutics, Inc | | | 2,637 | |
219 | | * | | Otonomy, Inc | | | 6,077 | |
356 | | *,e | | OvaScience, Inc | | | 3,478 | |
772 | | *,e | | Pacific Biosciences of California, Inc | | | 10,136 | |
522 | | * | | Pacira Pharmaceuticals, Inc | | | 40,084 | |
180 | | * | | Paratek Pharmaceuticals, Inc | | | 3,415 | |
876 | | * | | Parexel International Corp | | | 59,673 | |
2,346 | | e | | PDL BioPharma, Inc | | | 8,305 | |
2,703 | | *,e | | Peregrine Pharmaceuticals, Inc | | | 3,163 | |
1,628 | | | | PerkinElmer, Inc | | | 87,212 | |
708 | | * | | Pernix Therapeutics Holdings, Inc | | | 2,089 | |
2,202 | | | | Perrigo Co plc | | | 318,629 | |
236 | | * | | Pfenex, Inc | | | 2,922 | |
92,175 | | | | Pfizer, Inc | | | 2,975,409 | |
251 | | | | Phibro Animal Health Corp | | | 7,563 | |
677 | | * | | Portola Pharmaceuticals, Inc | | | 34,832 | |
423 | | *,e | | Pozen, Inc | | | 2,889 | |
287 | | *,e | | PRA Health Sciences, Inc | | | 12,992 | |
795 | | * | | Prestige Brands Holdings, Inc | | | 40,927 | |
933 | | *,e | | Progenics Pharmaceuticals, Inc | | | 5,719 | |
105 | | *,e | | Proteon Therapeutics, Inc | | | 1,629 | |
455 | | * | | Prothena Corp plc | | | 30,990 | |
488 | | * | | PTC Therapeutics, Inc | | | 15,811 | |
358 | | *,e | | Puma Biotechnology, Inc | | | 28,067 | |
3,176 | | * | | Qiagen NV (NASDAQ) | | | 87,816 | |
1,245 | | * | | Quintiles Transnational Holdings, Inc | | | 85,482 | |
542 | | * | | Radius Health, Inc | | | 33,355 | |
1,157 | | * | | Raptor Pharmaceutical Corp | | | 6,016 | |
1,175 | | * | | Regeneron Pharmaceuticals, Inc | | | 637,872 | |
412 | | *,e | | Regulus Therapeutics, Inc | | | 3,593 | |
468 | | *,e | | Relypsa, Inc | | | 13,263 | |
475 | | * | | Repligen Corp | | | 13,438 | |
500 | | * | | Retrophin, Inc | | | 9,645 | |
228 | | *,e | | Revance Therapeutics, Inc | | | 7,788 | |
1,285 | | * | | Rigel Pharmaceuticals, Inc | | | 3,894 | |
200 | | * | | Sage Therapeutics, Inc | | | 11,660 | |
340 | | * | | Sagent Pharmaceuticals | | | 5,409 | |
987 | | * | | Sangamo Biosciences, Inc | | | 9,011 | |
810 | | *,e | | Sarepta Therapeutics, Inc | | | 31,250 | |
716 | | * | | Sciclone Pharmaceuticals, Inc | | | 6,587 | |
1,592 | | * | | Seattle Genetics, Inc | | | 71,449 | |
1,561 | | *,e | | Sequenom, Inc | | | 2,560 | |
325 | | *,e | | Seres Therapeutics, Inc | | | 11,404 | |
405 | | *,e | | Sorrento Therapeutics, Inc | | | 3,528 | |
129 | | * | | Spark Therapeutics, Inc | | | 5,845 | |
972 | | *,e | | Spectrum Pharmaceuticals, Inc | | | 5,861 | |
213 | | * | | Stemline Therapeutics, Inc | | | 1,344 | |
63
TIAA-CREF LIFE FUNDS - Stock Index Fund
| | | | | | | | |
SHARES | | | | COMPANY | | VALUE | |
| | | | | | | | |
357 | | * | | Sucampo Pharmaceuticals, Inc (Class A) | | $ | 6,173 | |
486 | | * | | Supernus Pharmaceuticals, Inc | | | 6,532 | |
1,430 | | *,e | | Synergy Pharmaceuticals, Inc | | | 8,108 | |
130 | | *,e | | T2 Biosystems, Inc | | | 1,422 | |
903 | | *,e | | Teligent, Inc | | | 8,037 | |
334 | | *,e | | TESARO, Inc | | | 17,475 | |
502 | | *,e | | Tetraphase Pharmaceuticals, Inc | | | 5,035 | |
516 | | *,e | | TG Therapeutics, Inc | | | 6,156 | |
1,825 | | * | | TherapeuticsMD, Inc | | | 18,925 | |
367 | | *,e | | Theravance Biopharma, Inc | | | 6,015 | |
1,228 | | *,e | | Theravance, Inc | | | 12,943 | |
5,973 | | | | Thermo Electron Corp | | | 847,270 | |
949 | | * | | Threshold Pharmaceuticals, Inc | | | 455 | |
146 | | *,e | | Tokai Pharmaceuticals, Inc | | | 1,273 | |
355 | | * | | Trevena, Inc | | | 3,728 | |
349 | | *,e | | Trovagene, Inc | | | 1,885 | |
563 | | * | | Ultragenyx Pharmaceutical, Inc | | | 63,157 | |
689 | | * | | United Therapeutics Corp | | | 107,904 | |
604 | | *,e | | Vanda Pharmaceuticals, Inc | | | 5,623 | |
708 | | * | | Verastem, Inc | | | 1,317 | |
322 | | *,e | | Versartis, Inc | | | 3,990 | |
3,659 | | * | | Vertex Pharmaceuticals, Inc | | | 460,412 | |
185 | | *,e | | Vitae Pharmaceuticals, Inc | | | 3,349 | |
321 | | * | | Vital Therapies, Inc | | | 3,698 | |
1,259 | | *,e | | Vivus, Inc | | | 1,284 | |
1,161 | | * | | vTv Therapeutics, Inc | | | 7,906 | |
390 | | * | | VWR Corp | | | 11,041 | |
1,253 | | * | | Waters Corp | | | 168,629 | |
51 | | *,e | | XBiotech, Inc | | | 554 | |
407 | | * | | Xencor Inc | | | 5,950 | |
827 | | * | | Xenoport, Inc | | | 4,540 | |
240 | | * | | Zafgen, Inc | | | 1,510 | |
1,695 | | *,e | | ZIOPHARM Oncology, Inc | | | 14,085 | |
7,357 | | | | Zoetis Inc | | | 352,547 | |
287 | | * | | Zogenix, Inc | | | 4,230 | |
| | | | | | | | |
| | | | TOTAL PHARMACEUTICALS, BIOTECHNOLOGY & LIFE SCIENCES | | | 31,752,022 | |
| | | | | | | | |
REAL ESTATE - 4.2% | | | | |
1,053 | | | | Acadia Realty Trust | | | 34,907 | |
587 | | | | AG Mortgage Investment Trust | | | 7,537 | |
248 | | | | Agree Realty Corp | | | 8,430 | |
934 | | | | Alexander & Baldwin, Inc | | | 32,980 | |
55 | | | | Alexander’s, Inc | | | 21,126 | |
1,036 | | | | Alexandria Real Estate Equities, Inc | | | 93,613 | |
354 | | * | | Altisource Asset Management Corp | | | 6,075 | |
196 | | * | | Altisource Portfolio Solutions S.A. | | | 5,451 | |
766 | | | | Altisource Residential Corp | | | 9,506 | |
684 | | | | American Assets Trust,Inc | | | 26,231 | |
1,619 | | | | American Campus Communities, Inc | | | 66,929 | |
5,242 | | | | American Capital Agency Corp | | | 90,896 | |
1,068 | | | | American Capital Mortgage, Inc | | | 14,909 | |
2,594 | | | | American Homes 4 Rent | | | 43,216 | |
432 | | | | American Residential Properties, Inc | | | 8,165 | |
6,291 | | | | American Tower Corp | | | 609,912 | |
14,133 | | | | Annaly Capital Management, Inc | | | 132,568 | |
1,539 | | | | Anworth Mortgage Asset Corp | | | 6,695 | |
2,250 | | | | Apartment Investment & Management Co (Class A) | | | 90,067 | |
836 | | | | Apollo Commercial Real Estate Finance, Inc | | | 14,404 | |
2,676 | | | | Apple Hospitality REIT, Inc | | | 53,440 | |
100 | | | | Ares Commercial Real Estate Corp | | | 1,144 | |
357 | | | | Armada Hoffler Properties, Inc | | | 3,741 | |
612 | | | | ARMOUR Residential REIT, Inc | | | 13,317 | |
403 | | | | Ashford Hospitality Prime, Inc | | | 5,843 | |
1,205 | | | | Ashford Hospitality Trust, Inc | | | 7,604 | |
179 | | * | | AV Homes, Inc | | | 2,293 | |
1,997 | | | | AvalonBay Communities, Inc | | | 367,708 | |
64
TIAA-CREF LIFE FUNDS - Stock Index Fund
| | | | | | | | |
SHARES | | | | COMPANY | | VALUE | |
| | | | | | | | |
2,924 | | | | BioMed Realty Trust, Inc | | $ | 69,270 | |
262 | | | | Bluerock Residential Growth REIT, Inc | | | 3,105 | |
2,281 | | | | Boston Properties, Inc | | | 290,919 | |
2,577 | | | | Brandywine Realty Trust | | | 35,202 | |
2,486 | | | | Brixmor Property Group, Inc | | | 64,189 | |
1,276 | | | | Camden Property Trust | | | 97,946 | |
868 | | | | Campus Crest Communities, Inc | | | 5,902 | |
1,382 | | | | Capstead Mortgage Corp | | | 12,079 | |
1,216 | | | | Care Capital Properties, Inc | | | 37,173 | |
460 | | | | CareTrust REIT, Inc | | | 5,037 | |
568 | | | | CatchMark Timber Trust Inc | | | 6,424 | |
2,404 | | | | CBL & Associates Properties, Inc | | | 29,737 | |
4,118 | | * | | CBRE Group, Inc | | | 142,400 | |
1,224 | | | | Cedar Shopping Centers, Inc | | | 8,666 | |
640 | | | | Chatham Lodging Trust | | | 13,107 | |
862 | | | | Chesapeake Lodging Trust | | | 21,688 | |
3,282 | | | | Chimera Investment Corp | | | 44,766 | |
1,604 | | | | Colony Financial, Inc | | | 31,246 | |
534 | | * | | Colony Starwood Homes | | | 12,090 | |
1,793 | | | | Columbia Property Trust, Inc | | | 42,100 | |
1,690 | | | | Communications Sales & Leasing, Inc | | | 31,586 | |
74 | | | | Consolidated-Tomoka Land Co | | | 3,901 | |
347 | | | | Coresite Realty | | | 19,682 | |
1,358 | | | | Corporate Office Properties Trust | | | 29,645 | |
1,921 | | | | Corrections Corp of America | | | 50,887 | |
3,372 | | | | Cousins Properties, Inc | | | 31,798 | |
5,009 | | | | Crown Castle International Corp | | | 433,028 | |
2,390 | | | | CubeSmart | | | 73,182 | |
1,011 | | | | CyrusOne, Inc | | | 37,862 | |
2,918 | | | | CYS Investments, Inc | | | 20,805 | |
1,403 | | | | DCT Industrial Trust, Inc | | | 52,430 | |
4,364 | | | | DDR Corp | | | 73,490 | |
2,875 | | | | DiamondRock Hospitality Co | | | 27,744 | |
2,032 | | | | Digital Realty Trust, Inc | | | 153,660 | |
2,099 | | | | Douglas Emmett, Inc | | | 65,447 | |
4,964 | | | | Duke Realty Corp | | | 104,343 | |
1,063 | | | | DuPont Fabros Technology, Inc | | | 33,793 | |
776 | | | | Dynex Capital, Inc | | | 4,928 | |
570 | | | | EastGroup Properties, Inc | | | 31,698 | |
693 | | | | Education Realty Trust, Inc | | | 26,251 | |
1,593 | | | | Empire State Realty Trust, Inc | | | 28,786 | |
888 | | | | Entertainment Properties Trust | | | 51,904 | |
917 | | | | Equinix, Inc | | | 277,301 | |
1,973 | | * | | Equity Commonwealth | | | 54,711 | |
1,359 | | | | Equity Lifestyle Properties, Inc | | | 90,605 | |
1,054 | | | | Equity One, Inc | | | 28,616 | |
5,344 | | | | Equity Residential | | | 436,017 | |
981 | | | | Essex Property Trust, Inc | | | 234,861 | |
1,859 | | | | Extra Space Storage, Inc | | | 163,982 | |
1,053 | | | | Federal Realty Investment Trust | | | 153,843 | |
2,066 | | | | FelCor Lodging Trust, Inc | | | 15,082 | |
1,594 | | | | First Industrial Realty Trust, Inc | | | 35,275 | |
788 | | | | First Potomac Realty Trust | | | 8,983 | |
3,147 | | * | | Forest City Enterprises, Inc (Class A) | | | 69,014 | |
498 | | *,e | | Forestar Real Estate Group, Inc | | | 5,448 | |
615 | | * | | Four Corners Property Trust, Inc | | | 14,858 | |
1,291 | | | | Franklin Street Properties Corp | | | 13,362 | |
102 | | * | | FRP Holdings, Inc | | | 3,462 | |
1,247 | | | | Gaming and Leisure Properties, Inc | | | 34,667 | |
8,516 | | | | General Growth Properties, Inc | | | 231,720 | |
1,075 | | | | Geo Group, Inc | | | 31,078 | |
343 | | | | Getty Realty Corp | | | 5,882 | |
475 | | | | Gladstone Commercial Corp | | | 6,930 | |
1,014 | | | | Government Properties Income Trust | | | 16,092 | |
6,023 | | | | Gramercy Property Trust | | | 46,498 | |
73 | | | | Great Ajax Corp | | | 885 | |
65
TIAA-CREF LIFE FUNDS - Stock Index Fund
| | | | | | | | |
SHARES | | | | COMPANY | | VALUE | |
| | | | | | | | |
430 | | | | Hannon Armstrong Sustainable Infrastructure Capital, Inc | | $ | 8,136 | |
1,505 | | | | Hatteras Financial Corp | | | 19,791 | |
6,920 | | | | HCP, Inc | | | 264,621 | |
1,448 | | | | Healthcare Realty Trust, Inc | | | 41,007 | |
1,941 | | | | Healthcare Trust of America, Inc | | | 52,349 | |
712 | | | | Hersha Hospitality Trust | | | 15,493 | |
1,490 | | | | Highwoods Properties, Inc | | | 64,964 | |
2,156 | | | | Hospitality Properties Trust | | | 56,379 | |
10,898 | | | | Host Marriott Corp | | | 167,175 | |
581 | | * | | Howard Hughes Corp | | | 65,746 | |
1,069 | | | | Hudson Pacific Properties | | | 30,082 | |
463 | | | | Independence Realty Trust, Inc | | | 3,477 | |
1,253 | | | | Inland Real Estate Corp | | | 13,307 | |
1,774 | | | | Invesco Mortgage Capital, Inc | | | 21,980 | |
1,762 | | | | Investors Real Estate Trust | | | 12,246 | |
3,030 | | | | Iron Mountain, Inc | | | 81,840 | |
1,225 | | * | | iStar Financial, Inc | | | 14,369 | |
698 | | | | Jones Lang LaSalle, Inc | | | 111,582 | |
1,291 | | | | Kennedy-Wilson Holdings, Inc | | | 31,087 | |
1,268 | | | | Kilroy Realty Corp | | | 80,239 | |
6,160 | | | | Kimco Realty Corp | | | 162,994 | |
1,204 | | | | Kite Realty Group Trust | | | 31,220 | |
569 | | | | Ladder Capital Corp | | | 7,067 | |
1,168 | | | | Lamar Advertising Co | | | 70,057 | |
1,627 | | | | LaSalle Hotel Properties | | | 40,935 | |
2,959 | | | | Lexington Realty Trust | | | 23,672 | |
2,147 | | | | Liberty Property Trust | | | 66,664 | |
719 | | | | LTC Properties, Inc | | | 31,018 | |
2,277 | | | | Macerich Co | | | 183,731 | |
1,487 | | | | Mack-Cali Realty Corp | | | 34,721 | |
194 | | * | | Marcus & Millichap, Inc | | | 5,653 | |
3,787 | | | | Medical Properties Trust, Inc | | | 43,588 | |
5,647 | | | | MFA Mortgage Investments, Inc | | | 37,270 | |
1,085 | | | | Mid-America Apartment Communities, Inc | | | 98,529 | |
851 | | | | Monmouth Real Estate Investment Corp (Class A) | | | 8,901 | |
2,397 | | | | Monogram Residential Trust, Inc | | | 23,395 | |
577 | | | | National Health Investors, Inc | | | 35,122 | |
2,136 | | | | National Retail Properties, Inc | | | 85,547 | |
569 | | | | National Storage Affiliates Trust | | | 9,747 | |
4,200 | | | | New Residential Investment Corp | | | 51,072 | |
959 | | | | New Senior Investment Group, Inc | | | 9,456 | |
1,563 | | | | New York Mortgage Trust, Inc | | | 8,331 | |
2,421 | | | | New York REIT, Inc | | | 27,841 | |
280 | | | | NexPoint Residential Trust, Inc | | | 3,665 | |
892 | | | | NorthStar Realty Europe Corp | | | 10,535 | |
2,676 | | | | NorthStar Realty Finance Corp | | | 45,572 | |
2,628 | | | | Omega Healthcare Investors, Inc | | | 91,927 | |
251 | | | | One Liberty Properties, Inc | | | 5,386 | |
262 | | | | Orchid Island Capital, Inc | | | 2,602 | |
1,976 | | | | Outfront Media, Inc | | | 43,136 | |
3,025 | | | | Paramount Group, Inc | | | 54,752 | |
1,208 | | | | Parkway Properties, Inc | | | 18,881 | |
1,026 | | | | Pebblebrook Hotel Trust | | | 28,749 | |
999 | | | | Pennsylvania REIT | | | 21,848 | |
1,079 | | | | Pennymac Mortgage Investment Trust | | | 16,466 | |
1,008 | | | | Physicians Realty Trust | | | 16,995 | |
2,219 | | | | Piedmont Office Realty Trust, Inc | | | 41,895 | |
2,713 | | | | Plum Creek Timber Co, Inc | | | 129,464 | |
905 | | | | Post Properties, Inc | | | 53,540 | |
659 | | | | Potlatch Corp | | | 19,928 | |
331 | | | | Preferred Apartment Communities, Inc | | | 4,329 | |
7,711 | | | | Prologis, Inc | | | 330,956 | |
373 | | | | PS Business Parks, Inc | | | 32,611 | |
2,194 | | | | Public Storage, Inc | | | 543,454 | |
552 | | | | QTS Realty Trust, Inc | | | 24,901 | |
1,095 | | | | RAIT Investment Trust | | | 2,956 | |
66
TIAA-CREF LIFE FUNDS - Stock Index Fund
| | | | | | | | |
SHARES | | | | COMPANY | | VALUE | |
| | | | | | | | |
1,144 | | | | Ramco-Gershenson Properties | | $ | 19,002 | |
1,826 | | | | Rayonier, Inc | | | 40,537 | |
170 | | | | Re/Max Holdings, Inc | | | 6,341 | |
2,169 | | * | | Realogy Holdings Corp | | | 79,537 | |
3,706 | | | | Realty Income Corp | | | 191,341 | |
1,217 | | | | Redwood Trust, Inc | | | 16,064 | |
1,534 | | | | Regency Centers Corp | | | 104,496 | |
422 | | | | Resource Capital Corp | | | 5,385 | |
1,382 | | | | Retail Opportunities Investment Corp | | | 24,738 | |
4,003 | | | | Retail Properties of America, Inc | | | 59,124 | |
791 | | | | Rexford Industrial Realty, Inc | | | 12,941 | |
1,906 | | | | RLJ Lodging Trust | | | 41,227 | |
99 | | * | | RMR Group, Inc | | | 1,427 | |
518 | | | | Rouse Properties, Inc | | | 7,542 | |
623 | | | | Ryman Hospitality Properties | | | 32,172 | |
929 | | | | Sabra Healthcare REIT, Inc | | | 18,794 | |
133 | | | | Saul Centers, Inc | | | 6,819 | |
894 | | | | Select Income REIT | | | 17,719 | |
3,548 | | | | Senior Housing Properties Trust | | | 52,652 | |
516 | | | | Silver Bay Realty Trust Corp | | | 8,081 | |
4,667 | | | | Simon Property Group, Inc | | | 907,451 | |
1,433 | | | | SL Green Realty Corp | | | 161,900 | |
592 | | | | Sovran Self Storage, Inc | | | 63,528 | |
6,338 | | | | Spirit Realty Capital, Inc | | | 63,507 | |
1,100 | | *,e | | St. Joe Co | | | 20,361 | |
933 | | | | STAG Industrial, Inc | | | 17,214 | |
3,418 | | | | Starwood Property Trust, Inc | | | 70,274 | |
661 | | | | STORE Capital Corp | | | 15,335 | |
1,404 | | | | Summit Hotel Properties, Inc | | | 16,778 | |
688 | | | | Sun Communities, Inc | | | 47,149 | |
2,998 | | | | Sunstone Hotel Investors, Inc | | | 37,445 | |
1,512 | | | | Tanger Factory Outlet Centers, Inc | | | 49,442 | |
971 | | | | Taubman Centers, Inc | | | 74,495 | |
200 | | * | | Tejon Ranch Co | | | 3,830 | |
620 | | | | Terreno Realty Corp | | | 14,024 | |
5,406 | | | | Two Harbors Investment Corp | | | 43,789 | |
3,723 | | | | UDR, Inc | | | 139,873 | |
258 | | | | UMH Properties, Inc | | | 2,611 | |
438 | | | | United Development Funding IV | | | 4,818 | |
302 | | | | Universal Health Realty Income Trust | | | 15,103 | |
1,349 | | | | Urban Edge Properties | | | 31,634 | |
405 | | | | Urstadt Biddle Properties, Inc (Class A) | | | 7,792 | |
4,866 | | | | Ventas, Inc | | | 274,588 | |
13,489 | | | | VEREIT, Inc | | | 106,833 | |
2,773 | | | | Vornado Realty Trust | | | 277,189 | |
1,428 | | | | Washington REIT | | | 38,642 | |
1,782 | | | | Weingarten Realty Investors | | | 61,622 | |
5,159 | | | | Welltower, Inc | | | 350,967 | |
614 | | | | Western Asset Mortgage Capital Corp | | | 6,275 | |
7,632 | | | | Weyerhaeuser Co | | | 228,807 | |
550 | | | | Whitestone REIT | | | 6,605 | |
1,613 | | | | WP Carey, Inc | | | 95,167 | |
2,677 | | | | WP GLIMCHER, Inc | | | 28,403 | |
1,622 | | | | Xenia Hotels & Resorts, Inc | | | 24,865 | |
| | | | | | | | |
| | | | TOTAL REAL ESTATE | | | 13,968,979 | |
| | | | | | | | |
RETAILING - 5.2% | | | | |
426 | | * | | 1-800-FLOWERS.COM, Inc (Class A) | | | 3,101 | |
930 | | | | Aaron’s, Inc | | | 20,823 | |
976 | | e | | Abercrombie & Fitch Co (Class A) | | | 26,352 | |
1,110 | | | | Advance Auto Parts, Inc | | | 167,066 | |
5,706 | | * | | Amazon.com, Inc | | | 3,856,628 | |
2,903 | | e | | American Eagle Outfitters, Inc | | | 44,996 | |
122 | | * | | America’s Car-Mart, Inc | | | 3,256 | |
411 | | * | | Asbury Automotive Group, Inc | | | 27,718 | |
2,570 | | * | | Ascena Retail Group, Inc | | | 25,314 | |
67
TIAA-CREF LIFE FUNDS - Stock Index Fund
| | | | | | | | |
SHARES | | | | COMPANY | | VALUE | |
| | | | | | | | |
1,043 | | * | | Autonation, Inc | | $ | 62,225 | |
464 | | * | | AutoZone, Inc | | | 344,246 | |
464 | | * | | Barnes & Noble Education, Inc | | | 4,617 | |
735 | | | | Barnes & Noble, Inc | | | 6,402 | |
2,521 | | * | | Bed Bath & Beyond, Inc | | | 121,638 | |
4,629 | | | | Best Buy Co, Inc | | | 140,953 | |
334 | | | | Big 5 Sporting Goods Corp | | | 3,337 | |
777 | | | | Big Lots, Inc | | | 29,946 | |
158 | | * | | Blue Nile, Inc | | | 5,867 | |
176 | | * | | Boot Barn Holdings, Inc | | | 2,163 | |
378 | | e | | Buckle, Inc | | | 11,635 | |
165 | | * | | Build-A-Bear Workshop, Inc | | | 2,020 | |
1,272 | | * | | Burlington Stores, Inc | | | 54,569 | |
729 | | *,e | | Cabela’s, Inc | | | 34,066 | |
657 | | | | Caleres, Inc | | | 17,621 | |
3,169 | | * | | Carmax, Inc | | | 171,031 | |
368 | | | | Cato Corp (Class A) | | | 13,550 | |
2,056 | | | | Chico’s FAS, Inc | | | 21,938 | |
297 | | | | Children’s Place Retail Stores, Inc | | | 16,394 | |
243 | | | | Citi Trends, Inc | | | 5,164 | |
424 | | *,e | | Conn’s, Inc | | | 9,951 | |
231 | | *,e | | Container Store Group, Inc | | | 1,894 | |
340 | | | | Core-Mark Holding Co, Inc | | | 27,860 | |
1,158 | | | | CST Brands, Inc | | | 45,324 | |
514 | | * | | Destination XL Group, Inc | | | 2,837 | |
1,324 | | | | Dick’s Sporting Goods, Inc | | | 46,803 | |
344 | | e | | Dillard’s, Inc (Class A) | | | 22,604 | |
4,607 | | | | Dollar General Corp | | | 331,105 | |
3,433 | | * | | Dollar Tree, Inc | | | 265,096 | |
1,144 | | e | | DSW, Inc (Class A) | | | 27,296 | |
284 | | * | | Etsy, Inc | | | 2,346 | |
512 | | * | | EVINE Live, Inc | | | 911 | |
1,740 | | | | Expedia, Inc | | | 216,282 | |
1,489 | | * | | Express Parent LLC | | | 25,730 | |
183 | | * | | Fenix Parts, Inc | | | 1,243 | |
647 | | | | Finish Line, Inc (Class A) | | | 11,698 | |
780 | | * | | Five Below, Inc | | | 25,038 | |
2,014 | | | | Foot Locker, Inc | | | 131,091 | |
753 | | * | | Francesca’s Holdings Corp | | | 13,110 | |
543 | | | | Fred’s, Inc (Class A) | | | 8,889 | |
254 | | * | | FTD Cos, Inc | | | 6,647 | |
1,566 | | e | | GameStop Corp (Class A) | | | 43,911 | |
3,431 | | e | | Gap, Inc | | | 84,746 | |
343 | | * | | Genesco, Inc | | | 19,493 | |
2,270 | | | | Genuine Parts Co | | | 194,970 | |
1,267 | | | | GNC Holdings, Inc | | | 39,302 | |
376 | | | | Group 1 Automotive, Inc | | | 28,463 | |
7,150 | | * | | Groupon, Inc | | | 21,951 | |
822 | | e | | Guess?, Inc | | | 15,519 | |
270 | | | | Haverty Furniture Cos, Inc | | | 5,789 | |
444 | | *,e | | Hibbett Sports, Inc | | | 13,427 | |
19,445 | | | | Home Depot, Inc | | | 2,571,601 | |
475 | | | | HSN, Inc | | | 24,068 | |
4,378 | | *,e | | JC Penney Co, Inc | | | 29,157 | |
247 | | | | Kirkland’s, Inc | | | 3,582 | |
3,068 | | | | Kohl’s Corp | | | 146,129 | |
3,696 | | | | L Brands, Inc | | | 354,151 | |
221 | | *,e | | Lands’ End, Inc | | | 5,180 | |
7,225 | | * | | Liberty Interactive Corp | | | 197,387 | |
1,061 | | * | | Liberty TripAdvisor Holdings, Inc | | | 32,191 | |
2,046 | | * | | Liberty Ventures | | | 92,295 | |
344 | | | | Lithia Motors, Inc (Class A) | | | 36,694 | |
4,504 | | * | | LKQ Corp | | | 133,454 | |
14,249 | | | | Lowe’s Companies, Inc | | | 1,083,494 | |
368 | | *,e | | Lumber Liquidators, Inc | | | 6,388 | |
4,717 | | | | Macy’s, Inc | | | 165,001 | |
68
TIAA-CREF LIFE FUNDS - Stock Index Fund
| | | | | | | | |
SHARES | | | | COMPANY | | VALUE | |
| | | | | | | | |
333 | | * | | MarineMax, Inc | | $ | 6,134 | |
324 | | *,e | | Mattress Firm Holding Corp | | | 14,460 | |
1,157 | | | | Men’s Wearhouse, Inc | | | 16,985 | |
907 | | * | | Michaels Cos, Inc | | | 20,054 | |
459 | | | | Monro Muffler, Inc | | | 30,395 | |
703 | | * | | Murphy USA, Inc | | | 42,700 | |
6,385 | | * | | NetFlix, Inc | | | 730,316 | |
2,054 | | e | | Nordstrom, Inc | | | 102,310 | |
414 | | | | Nutri/System, Inc | | | 8,959 | |
7,892 | | * | | Office Depot, Inc | | | 44,511 | |
1,521 | | * | | O’Reilly Automotive, Inc | | | 385,452 | |
275 | | e | | Outerwall, Inc | | | 10,049 | |
176 | | * | | Overstock.com, Inc | | | 2,161 | |
363 | | * | | Party City Holdco, Inc | | | 4,686 | |
613 | | | | Penske Auto Group, Inc | | | 25,954 | |
774 | | * | | PEP Boys - Manny Moe & Jack | | | 14,249 | |
278 | | e | | PetMed Express, Inc | | | 4,765 | |
1,303 | | e | | Pier 1 Imports, Inc | | | 6,632 | |
776 | | * | | Priceline.com, Inc | | | 989,361 | |
765 | | | | Rent-A-Center, Inc | | | 11,452 | |
484 | | *,e | | Restoration Hardware Holdings, Inc | | | 38,454 | |
6,110 | | | | Ross Stores, Inc | | | 328,779 | |
2,313 | | * | | Sally Beauty Holdings, Inc | | | 64,510 | |
188 | | *,e | | Sears Holdings Corp | | | 3,865 | |
757 | | * | | Select Comfort Corp | | | 16,207 | |
203 | | | | Shoe Carnival, Inc | | | 4,710 | |
541 | | * | | Shutterfly, Inc | | | 24,107 | |
1,203 | | | | Signet Jewelers Ltd | | | 148,799 | |
661 | | | | Sonic Automotive, Inc (Class A) | | | 15,044 | |
720 | | *,e | | Sportsman’s Warehouse Holdings, Inc | | | 9,288 | |
411 | | e | | Stage Stores, Inc | | | 3,744 | |
10,025 | | | | Staples, Inc | | | 94,937 | |
372 | | | | Stein Mart, Inc | | | 2,504 | |
151 | | * | | Systemax, Inc | | | 1,299 | |
9,601 | | | | Target Corp | | | 697,129 | |
1,658 | | | | Tiffany & Co | | | 126,489 | |
1,018 | | *,e | | Tile Shop Holdings, Inc | | | 16,695 | |
174 | | * | | Tilly’s, Inc | | | 1,154 | |
10,137 | | | | TJX Companies, Inc | | | 718,815 | |
2,070 | | | | Tractor Supply Co | | | 176,985 | |
1,722 | | * | | TripAdvisor, Inc | | | 146,801 | |
632 | | * | | Tuesday Morning Corp | | | 4,108 | |
981 | | * | | Ulta Salon Cosmetics & Fragrance, Inc | | | 181,485 | |
1,403 | | * | | Urban Outfitters, Inc | | | 31,918 | |
432 | | * | | Vitamin Shoppe, Inc | | | 14,126 | |
286 | | * | | VOXX International Corp (Class A) | | | 1,504 | |
286 | | * | | Wayfair, Inc | | | 13,619 | |
258 | | * | | West Marine, Inc | | | 2,190 | |
1,340 | | | | Williams-Sonoma, Inc | | | 78,269 | |
32 | | | | Winmark Corp | | | 2,976 | |
314 | | * | | Zumiez, Inc | | | 4,748 | |
| | | | | | | | |
| | | | TOTAL RETAILING | | | 17,263,577 | |
| | | | | | | | |
| |
SEMICONDUCTORS & SEMICONDUCTOR EQUIPMENT - 2.4% | | | | |
667 | | * | | Advanced Energy Industries, Inc | | | 18,829 | |
9,659 | | *,e | | Advanced Micro Devices, Inc | | | 27,721 | |
302 | | * | | Alpha & Omega Semiconductor Ltd | | | 2,775 | |
521 | | *,e | | Ambarella, Inc | | | 29,041 | |
1,424 | | * | | Amkor Technology, Inc | | | 8,658 | |
4,721 | | | | Analog Devices, Inc | | | 261,166 | |
17,204 | | | | Applied Materials, Inc | | | 321,199 | |
1,648 | | * | | Applied Micro Circuits Corp | | | 10,498 | |
5,910 | | | | Atmel Corp | | | 50,885 | |
3,820 | | | | Avago Technologies Ltd | | | 554,473 | |
2,300 | | * | | Axcelis Technologies, Inc | | | 5,957 | |
69
TIAA-CREF LIFE FUNDS - Stock Index Fund
| | | | | | | | |
SHARES | | | | COMPANY | | VALUE | |
| | | | | | | | |
8,259 | | | | Broadcom Corp (Class A) | | $ | 477,535 | |
977 | | | | Brooks Automation, Inc | | | 10,434 | |
353 | | * | | Cabot Microelectronics Corp | | | 15,454 | |
171 | | * | | Cascade Microtech, Inc | | | 2,779 | |
794 | | * | | Cavium Networks, Inc | | | 52,174 | |
293 | | * | | Ceva, Inc | | | 6,844 | |
1,200 | | * | | Cirrus Logic, Inc | | | 35,436 | |
379 | | | | Cohu, Inc | | | 4,575 | |
1,573 | | *,e | | Cree, Inc | | | 41,952 | |
4,786 | | | | Cypress Semiconductor Corp | | | 46,951 | |
534 | | * | | Diodes, Inc | | | 12,271 | |
289 | | * | | DSP Group, Inc | | | 2,728 | |
2,008 | | * | | Entegris, Inc | | | 26,646 | |
520 | | * | | Exar Corp | | | 3,188 | |
1,676 | | * | | Fairchild Semiconductor International, Inc | | | 34,710 | |
1,092 | | * | | First Solar, Inc | | | 72,061 | |
821 | | * | | Formfactor, Inc | | | 7,389 | |
592 | | * | | Inphi Corp | | | 15,996 | |
2,132 | | * | | Integrated Device Technology, Inc | | | 56,178 | |
71,016 | | | | Intel Corp | | | 2,446,501 | |
1,885 | | | | Intersil Corp (Class A) | | | 24,053 | |
353 | | | | IXYS Corp | | | 4,458 | |
2,443 | | | | Kla-Tencor Corp | | | 169,422 | |
800 | | * | | Kopin Corp | | | 2,176 | |
2,387 | | | | Lam Research Corp | | | 189,576 | |
1,579 | | * | | Lattice Semiconductor Corp | | | 10,216 | |
3,670 | | | | Linear Technology Corp | | | 155,865 | |
336 | | *,e | | MA-COM Technology Solutions | | | 13,739 | |
6,507 | | | | Marvell Technology Group Ltd | | | 57,392 | |
1,057 | | * | | Mattson Technology, Inc | | | 3,731 | |
4,270 | | | | Maxim Integrated Products, Inc | | | 162,260 | |
962 | | * | | MaxLinear, Inc | | | 14,170 | |
3,195 | | | | Microchip Technology, Inc | | | 148,695 | |
16,114 | | * | | Micron Technology, Inc | | | 228,174 | |
1,371 | | * | | Microsemi Corp | | | 44,681 | |
698 | | | | MKS Instruments, Inc | | | 25,128 | |
598 | | | | Monolithic Power Systems, Inc | | | 38,099 | |
321 | | * | | Nanometrics, Inc | | | 4,860 | |
414 | | * | | NeoPhotonics Corp Ltd | | | 4,496 | |
68 | | | | NVE Corp | | | 3,820 | |
8,083 | | | | Nvidia Corp | | | 266,416 | |
840 | | * | | Omnivision Technologies, Inc | | | 24,377 | |
6,173 | | * | | ON Semiconductor Corp | | | 60,495 | |
409 | | * | | PDF Solutions, Inc | | | 4,434 | |
970 | | * | | Photronics, Inc | | | 12,077 | |
2,499 | | * | | PMC - Sierra, Inc | | | 29,038 | |
425 | | | | Power Integrations, Inc | | | 20,668 | |
2,240 | | * | | Qorvo, Inc | | | 114,016 | |
1,707 | | * | | Rambus, Inc | | | 19,784 | |
456 | | * | | Rudolph Technologies, Inc | | | 6,484 | |
936 | | * | | Semtech Corp | | | 17,709 | |
497 | | * | | Sigma Designs, Inc | | | 3,141 | |
618 | | * | | Silicon Laboratories, Inc | | | 29,998 | |
2,818 | | | | Skyworks Solutions, Inc | | | 216,507 | |
750 | | *,e | | SunPower Corp | | | 22,508 | |
3,319 | | | | Teradyne, Inc | | | 68,604 | |
1,035 | | | | Tessera Technologies, Inc | | | 31,060 | |
15,593 | | | | Texas Instruments, Inc | | | 854,652 | |
395 | | * | | Ultra Clean Holdings | | | 2,022 | |
367 | | * | | Ultratech, Inc | | | 7,274 | |
512 | | * | | Veeco Instruments, Inc | | | 10,527 | |
584 | | * | | Xcerra Corp | | | 3,533 | |
3,917 | | | | Xilinx, Inc | | | 183,982 | |
| | | | | | | | |
| | | | TOTAL SEMICONDUCTORS & SEMICONDUCTOR EQUIPMENT | | | 7,977,321 | |
| | | | | | | | |
70
TIAA-CREF LIFE FUNDS - Stock Index Fund
| | | | | | | | |
SHARES | | | | COMPANY | | VALUE | |
| | | | | | | | |
SOFTWARE & SERVICES - 11.9% | | | | |
482 | | * | | A10 Networks, Inc | | $ | 3,162 | |
9,405 | | | | Accenture plc | | | 982,823 | |
1,674 | | * | | ACI Worldwide, Inc | | | 35,824 | |
7,672 | | | | Activision Blizzard, Inc | | | 296,983 | |
552 | | * | | Actua Corp | | | 6,320 | |
1,122 | | * | | Acxiom Corp | | | 23,472 | |
7,535 | | * | | Adobe Systems, Inc | | | 707,838 | |
2,675 | | * | | Akamai Technologies, Inc | | | 140,785 | |
923 | | * | | Alliance Data Systems Corp | | | 255,274 | |
4,315 | | * | | Alphabet, Inc (Class A) | | | 3,357,113 | |
4,403 | | * | | Alphabet, Inc (Class C) | | | 3,341,349 | |
120 | | *,e | | Amber Road, Inc | | | 611 | |
2,313 | | | | Amdocs Ltd | | | 126,220 | |
370 | | | | American Software, Inc (Class A) | | | 3,767 | |
555 | | * | | Angie’s List, Inc | | | 5,189 | |
1,417 | | * | | Ansys, Inc | | | 131,073 | |
1,235 | | * | | Aspen Technology, Inc | | | 46,634 | |
3,467 | | * | | Autodesk, Inc | | | 211,244 | |
7,020 | | | | Automatic Data Processing, Inc | | | 594,734 | |
591 | | * | | AVG Technologies NV | | | 11,850 | |
899 | | * | | Bankrate, Inc | | | 11,957 | |
106 | | * | | Barracuda Networks, Inc | | | 1,980 | |
857 | | * | | Bazaarvoice, Inc | | | 3,754 | |
111 | | *,e | | Benefitfocus, Inc | | | 4,039 | |
303 | | *,e | | Black Knight Financial Services, Inc | | | 10,017 | |
735 | | | | Blackbaud, Inc | | | 48,407 | |
780 | | * | | Blackhawk Network Holdings, Inc | | | 34,484 | |
583 | | * | | Blucora, Inc | | | 5,713 | |
1,464 | | | | Booz Allen Hamilton Holding Co | | | 45,164 | |
528 | | * | | Bottomline Technologies, Inc | | | 15,697 | |
193 | | *,e | | Box, Inc | | | 2,694 | |
460 | | * | | Brightcove, Inc | | | 2,852 | |
1,849 | | | | Broadridge Financial Solutions, Inc | | | 99,347 | |
423 | | * | | BroadSoft, Inc | | | 14,957 | |
4,657 | | | | CA, Inc | | | 133,004 | |
350 | | * | | CACI International, Inc (Class A) | | | 32,473 | |
4,290 | | * | | Cadence Design Systems, Inc | | | 89,275 | |
790 | | * | | Callidus Software, Inc | | | 14,670 | |
238 | | * | | Carbonite, Inc | | | 2,332 | |
644 | | * | | Cardtronics, Inc | | | 21,671 | |
271 | | * | | Care.com, Inc | | | 1,940 | |
155 | | | | Cass Information Systems, Inc | | | 7,976 | |
2,503 | | | | CDK Global, Inc | | | 118,817 | |
278 | | * | | ChannelAdvisor Corp | | | 3,850 | |
1,042 | | * | | Ciber, Inc | | | 3,657 | |
503 | | *,e | | Cimpress NV | | | 40,813 | |
2,467 | | * | | Citrix Systems, Inc | | | 186,629 | |
9,085 | | * | | Cognizant Technology Solutions Corp (Class A) | | | 545,282 | |
633 | | * | | Commvault Systems, Inc | | | 24,909 | |
2,093 | | | | Computer Sciences Corp | | | 68,399 | |
492 | | * | | comScore, Inc | | | 20,246 | |
465 | | * | | Constant Contact, Inc | | | 13,597 | |
1,361 | | | | Convergys Corp | | | 33,875 | |
779 | | * | | Cornerstone OnDemand, Inc | | | 26,899 | |
481 | | * | | CoStar Group, Inc | | | 99,418 | |
485 | | | | CSG Systems International, Inc | | | 17,450 | |
2,093 | | * | | CSRA, Inc | | | 62,790 | |
342 | | * | | Cvent, Inc | | | 11,939 | |
185 | | * | | Datalink Corp | | | 1,258 | |
479 | | *,e | | Demandware, Inc | | | 25,852 | |
606 | | * | | DHI Group, Inc | | | 5,557 | |
110 | | *,e | | Digimarc Corp | | | 4,016 | |
730 | | *,e | | Digital Turbine, Inc | | | 971 | |
529 | | | | DST Systems, Inc | | | 60,338 | |
1,405 | | | | EarthLink Holdings Corp | | | 10,439 | |
71
TIAA-CREF LIFE FUNDS - Stock Index Fund
| | | | | | | | |
SHARES | | | | COMPANY | | VALUE | |
| | | | | | | | |
18,131 | | * | | eBay, Inc | | $ | 498,240 | |
405 | | e | | Ebix, Inc | | | 13,280 | |
4,777 | | * | | Electronic Arts, Inc | | | 328,275 | |
423 | | *,e | | Ellie Mae, Inc | | | 25,477 | |
845 | | *,e | | Endurance International Group Holdings, Inc | | | 9,236 | |
382 | | * | | EnerNOC, Inc | | | 1,471 | |
556 | | * | | Envestnet, Inc | | | 16,597 | |
705 | | * | | EPAM Systems, Inc | | | 55,427 | |
472 | | | | EPIQ Systems, Inc | | | 6,169 | |
747 | | * | | Euronet Worldwide, Inc | | | 54,105 | |
928 | | * | | Everi Holdings, Inc | | | 4,074 | |
941 | | | | EVERTEC, Inc | | | 15,752 | |
101 | | * | | Everyday Health, Inc | | | 608 | |
484 | | * | | ExlService Holdings, Inc | | | 21,746 | |
32,393 | | * | | Facebook, Inc | | | 3,390,251 | |
458 | | | | Fair Isaac Corp | | | 43,134 | |
4,210 | | | | Fidelity National Information Services, Inc | | | 255,126 | |
1,984 | | * | | FireEye, Inc | | | 41,148 | |
1,462 | | * | | First American Corp | | | 49,503 | |
2,758 | | * | | First Data Corp | | | 44,183 | |
3,612 | | * | | Fiserv, Inc | | | 330,354 | |
351 | | *,e | | Five9, Inc | | | 3,054 | |
1,384 | | * | | FleetCor Technologies, Inc | | | 197,815 | |
552 | | * | | FleetMatics Group plc | | | 28,036 | |
178 | | | | Forrester Research, Inc | | | 5,069 | |
2,056 | | * | | Fortinet, Inc | | | 64,086 | |
1,313 | | * | | Gartner, Inc | | | 119,089 | |
2,284 | | * | | Genpact Ltd | | | 57,054 | |
435 | | * | | Gigamon, Inc | | | 11,558 | |
2,062 | | | | Global Payments, Inc | | | 133,020 | |
220 | | *,e | | Globant S.A. | | | 8,252 | |
1,739 | | *,e | | Glu Mobile, Inc | | | 4,226 | |
341 | | *,e | | GoDaddy, Inc | | | 10,932 | |
805 | | *,e | | Gogo, Inc | | | 14,329 | |
1,083 | | *,e | | GrubHub, Inc | | | 26,209 | |
354 | | * | | GTT Communications, Inc | | | 6,039 | |
239 | | *,e | | Guidance Software, Inc | | | 1,439 | |
1,007 | | * | | Guidewire Software, Inc | | | 60,581 | |
476 | | | | Hackett Group, Inc | | | 7,649 | |
526 | | | | Heartland Payment Systems, Inc | | | 49,875 | |
109 | | *,e | | Hortonworks, Inc | | | 2,387 | |
268 | | * | | HubSpot, Inc | | | 15,091 | |
1,192 | | | | IAC/InterActiveCorp | | | 71,580 | |
395 | | * | | Imperva, Inc | | | 25,007 | |
889 | | * | | Infoblox, Inc | | | 16,349 | |
225 | | * | | Interactive Intelligence, Inc | | | 7,070 | |
729 | | * | | Internap Network Services Corp | | | 4,666 | |
13,594 | | | | International Business Machines Corp | | | 1,870,806 | |
4,142 | | | | Intuit, Inc | | | 399,703 | |
745 | | | | j2 Global, Inc | | | 61,328 | |
1,354 | | | | Jack Henry & Associates, Inc | | | 105,693 | |
661 | | * | | Jive Software, Inc | | | 2,697 | |
1,321 | | | | King Digital Entertainment plc | | | 23,620 | |
376 | | * | | Knot, Inc | | | 6,039 | |
958 | | | | Leidos Holdings, Inc | | | 53,897 | |
884 | | * | | Limelight Networks, Inc | | | 1,291 | |
1,657 | | * | | LinkedIn Corp | | | 372,958 | |
915 | | * | | Lionbridge Technologies | | | 4,493 | |
325 | | * | | Liquidity Services, Inc | | | 2,113 | |
827 | | * | | Liveperson, Inc | | | 5,582 | |
352 | | * | | LogMeIn, Inc | | | 23,619 | |
261 | | * | | Luxoft Holding, Inc | | | 20,131 | |
1,063 | | * | | Manhattan Associates, Inc | | | 70,339 | |
349 | | | | Mantech International Corp (Class A) | | | 10,554 | |
441 | | | | Marchex, Inc (Class B) | | | 1,716 | |
353 | | * | | Marin Software, Inc | | | 1,264 | |
72
TIAA-CREF LIFE FUNDS - Stock Index Fund
| | | | | | | | |
SHARES | | | | COMPANY | | VALUE | |
| | | | | | | | |
500 | | * | | Marketo, Inc | | $ | 14,355 | |
14,966 | | | | Mastercard, Inc (Class A) | | | 1,457,090 | |
946 | | | | MAXIMUS, Inc | | | 53,213 | |
1,645 | | | | Mentor Graphics Corp | | | 30,301 | |
121,087 | | | | Microsoft Corp | | | 6,717,907 | |
133 | | * | | MicroStrategy, Inc (Class A) | | | 23,846 | |
553 | | *,e | | MINDBODY, Inc | | | 8,367 | |
577 | | *,e | | MobileIron, Inc | | | 2,083 | |
259 | | * | | Model N, Inc | | | 2,890 | |
529 | | *,e | | ModusLink Global Solutions, Inc | | | 1,312 | |
445 | | * | | MoneyGram International, Inc | | | 2,790 | |
572 | | | | Monotype Imaging Holdings, Inc | | | 13,522 | |
1,321 | | * | | Monster Worldwide, Inc | | | 7,569 | |
605 | | *,e | | NetSuite, Inc | | | 51,195 | |
808 | | *,e | | NeuStar, Inc (Class A) | | | 19,368 | |
81 | | * | | New Relic, Inc | | | 2,951 | |
949 | | * | | NIC, Inc | | | 18,676 | |
3,638 | | * | | Nuance Communications, Inc | | | 72,360 | |
385 | | *,e | | OPOWER, Inc | | | 4,066 | |
47,432 | | | | Oracle Corp | | | 1,732,691 | |
3,044 | | * | | Pandora Media, Inc | | | 40,820 | |
128 | | *,e | | Park City Group, Inc | | | 1,525 | |
4,926 | | | | Paychex, Inc | | | 260,536 | |
454 | | * | | Paycom Software, Inc | | | 17,084 | |
218 | | * | | Paylocity Holding Corp | | | 8,840 | |
18,249 | | * | | PayPal Holdings, Inc | | | 660,614 | |
508 | | | | Pegasystems, Inc | | | 13,970 | |
509 | | * | | Perficient, Inc | | | 8,714 | |
1,174 | | * | | Progress Software Corp | | | 28,176 | |
567 | | * | | Proofpoint, Inc | | | 36,861 | |
336 | | * | | PROS Holdings, Inc | | | 7,741 | |
1,652 | | * | | PTC, Inc | | | 57,209 | |
279 | | * | | Q2 Holdings, Inc | | | 7,357 | |
43 | | | | QAD, Inc (Class A) | | | 882 | |
1,405 | | * | | QLIK Technologies, Inc | | | 44,482 | |
354 | | * | | Qualys, Inc | | | 11,714 | |
335 | | * | | QuinStreet, Inc | | | 1,437 | |
888 | | *,e | | Quotient Technology, Inc | | | 6,056 | |
1,775 | | * | | Rackspace Hosting, Inc | | | 44,943 | |
299 | | * | | RealNetworks, Inc | | | 1,271 | |
755 | | * | | RealPage, Inc | | | 16,950 | |
2,756 | | * | | Red Hat, Inc | | | 228,224 | |
111 | | | | Reis, Inc | | | 2,634 | |
560 | | * | | RetailMeNot, Inc | | | 5,555 | |
774 | | * | | RingCentral, Inc | | | 18,251 | |
392 | | * | | Rocket Fuel, Inc | | | 1,368 | |
1,271 | | * | | Rovi Corp | | | 21,175 | |
364 | | * | | Rubicon Project, Inc | | | 5,988 | |
1,637 | | | | Sabre Corp | | | 45,787 | |
9,848 | | * | | Salesforce.com, Inc | | | 772,083 | |
329 | | | | Sapiens International Corp NV | | | 3,356 | |
661 | | | | Science Applications International Corp | | | 30,261 | |
368 | | * | | Sciquest, Inc | | | 4,773 | |
488 | | * | | Seachange International, Inc | | | 3,289 | |
2,338 | | * | | ServiceNow, Inc | | | 202,377 | |
819 | | * | | ServiceSource International LLC | | | 3,776 | |
346 | | *,e | | Shutterstock, Inc | | | 11,190 | |
710 | | * | | Silver Spring Networks, Inc | | | 10,231 | |
958 | | * | | SolarWinds, Inc | | | 56,426 | |
962 | | | | Solera Holdings, Inc | | | 52,746 | |
1,801 | | * | | Splunk, Inc | | | 105,917 | |
235 | | * | | SPS Commerce, Inc | | | 16,499 | |
1,196 | | | | SS&C Technologies Holdings, Inc | | | 81,651 | |
205 | | * | | Stamps.com, Inc | | | 22,470 | |
566 | | * | | Sykes Enterprises, Inc | | | 17,421 | |
10,236 | | | | Symantec Corp | | | 214,956 | |
73
TIAA-CREF LIFE FUNDS - Stock Index Fund
| | | | | | | | |
SHARES | | | | COMPANY | | VALUE | |
| | | | | | | | |
664 | | * | | Synchronoss Technologies, Inc | | $ | 23,393 | |
2,495 | | * | | Synopsys, Inc | | | 113,797 | |
547 | | * | | Syntel, Inc | | | 24,752 | |
527 | | * | | TA Indigo Holding Corp | | | 4,780 | |
710 | | * | | Tableau Software, Inc | | | 66,896 | |
1,302 | | * | | Take-Two Interactive Software, Inc | | | 45,362 | |
519 | | * | | Tangoe, Inc | | | 4,354 | |
222 | | * | | TechTarget, Inc | | | 1,783 | |
646 | | * | | TeleCommunication Systems, Inc (Class A) | | | 3,211 | |
397 | | * | | TeleNav, Inc | | | 2,259 | |
235 | | | | TeleTech Holdings, Inc | | | 6,559 | |
2,241 | | * | | Teradata Corp | | | 59,207 | |
280 | | *,e | | Textura Corp | | | 6,042 | |
1,541 | | * | | TiVo, Inc | | | 13,299 | |
2,490 | | | | Total System Services, Inc | | | 124,002 | |
1,535 | | | | Travelport Worldwide Ltd | | | 19,802 | |
86 | | * | | Travelzoo, Inc | | | 720 | |
708 | | *,e | | TrueCar, Inc | | | 6,754 | |
210 | | *,e | | TubeMogul, Inc | | | 2,856 | |
8,709 | | * | | Twitter, Inc | | | 201,526 | |
485 | | * | | Tyler Technologies, Inc | | | 84,545 | |
411 | | * | | Ultimate Software Group, Inc | | | 80,355 | |
686 | | * | | Unisys Corp | | | 7,580 | |
2,060 | | * | | Vantiv, Inc | | | 97,685 | |
124 | | *,e | | Varonis Systems, Inc | | | 2,331 | |
418 | | *,e | | Vasco Data Security International | | | 6,993 | |
1,621 | | * | | VeriFone Systems, Inc | | | 45,420 | |
1,046 | | * | | Verint Systems, Inc | | | 42,426 | |
1,618 | | *,e | | VeriSign, Inc | | | 141,348 | |
631 | | *,e | | VirnetX Holding Corp | | | 1,622 | |
427 | | * | | Virtusa Corp | | | 17,652 | |
29,302 | | | | Visa, Inc (Class A) | | | 2,272,370 | |
1,284 | | *,e | | VMware, Inc (Class A) | | | 72,636 | |
510 | | *,e | | WebMD Health Corp (Class A) | | | 24,633 | |
695 | | * | | Website Pros, Inc | | | 13,907 | |
7,917 | | | | Western Union Co | | | 141,793 | |
555 | | * | | WEX, Inc | | | 49,062 | |
260 | | * | | Wix.com Ltd | | | 5,915 | |
1,645 | | * | | Workday, Inc | | | 131,074 | |
97 | | *,e | | Workiva, Inc | | | 1,704 | |
15,308 | | | | Xerox Corp | | | 162,724 | |
320 | | * | | Xura, Inc | | | 7,866 | |
14,016 | | * | | Yahoo!, Inc | | | 466,172 | |
936 | | * | | Yelp, Inc | | | 26,957 | |
775 | | * | | Zendesk, Inc | | | 20,491 | |
668 | | *,e | | Zillow Group, Inc | | | 17,395 | |
1,336 | | *,e | | Zillow Group, Inc (Class C) | | | 31,369 | |
743 | | * | | Zix Corp | | | 3,774 | |
10,999 | | * | | Zynga, Inc | | | 29,477 | |
| | | | | | | | |
| | | | TOTAL SOFTWARE & SERVICES | | | 39,656,898 | |
| | | | | | | | |
| |
TECHNOLOGY HARDWARE & EQUIPMENT - 5.5% | | | | |
1,599 | | *,e | | 3D Systems Corp | | | 13,895 | |
806 | | | | Adtran, Inc | | | 13,879 | |
317 | | *,e | | Aerohive Networks, Inc | | | 1,620 | |
400 | | * | | Agilysys, Inc | | | 3,996 | |
211 | | * | | Alliance Fiber Optic Products, Inc | | | 3,199 | |
4,622 | | | | Amphenol Corp (Class A) | | | 241,407 | |
412 | | * | | Anixter International, Inc | | | 24,881 | |
86,295 | | | | Apple, Inc | | | 9,083,412 | |
411 | | * | | Applied Optoelectronics, Inc | | | 7,053 | |
485 | | *,e | | Arista Networks, Inc | | | 37,752 | |
2,728 | | * | | ARRIS Group, Inc | | | 83,395 | |
1,379 | | * | | Arrow Electronics, Inc | | | 74,714 | |
470 | | * | | Avid Technology, Inc | | | 3,426 | |
74
TIAA-CREF LIFE FUNDS - Stock Index Fund
| | | | | | | | |
SHARES | | | | COMPANY | | VALUE | |
| | | | | | | | |
2,131 | | | | Avnet, Inc | | $ | 91,292 | |
655 | | | | AVX Corp | | | 7,952 | |
194 | | | | Badger Meter, Inc | | | 11,366 | |
144 | | | | Bel Fuse, Inc (Class B) | | | 2,490 | |
612 | | | | Belden CDT, Inc | | | 29,180 | |
750 | | * | | Benchmark Electronics, Inc | | | 15,502 | |
226 | | | | Black Box Corp | | | 2,154 | |
6,014 | | | | Brocade Communications Systems, Inc | | | 55,208 | |
528 | | * | | CalAmp Corp | | | 10,523 | |
643 | | * | | Calix Networks, Inc | | | 5,060 | |
1,918 | | | | CDW Corp | | | 80,633 | |
606 | | | | Checkpoint Systems, Inc | | | 3,800 | |
1,778 | | * | | Ciena Corp | | | 36,787 | |
76,136 | | | | Cisco Systems, Inc | | | 2,067,473 | |
153 | | *,e | | Clearfield, Inc | | | 2,052 | |
1,253 | | | | Cognex Corp | | | 42,314 | |
334 | | * | | Coherent, Inc | | | 21,747 | |
1,530 | | * | | CommScope Holding Co, Inc | | | 39,612 | |
234 | | | | Comtech Telecommunications Corp | | | 4,701 | |
305 | | *,e | | Control4 Corp | | | 2,217 | |
17,647 | | | | Corning, Inc | | | 322,587 | |
788 | | * | | Cray, Inc | | | 25,571 | |
485 | | | | CTS Corp | | | 8,555 | |
548 | | | | Daktronics, Inc | | | 4,779 | |
936 | | | | Diebold, Inc | | | 28,164 | |
400 | | * | | Digi International, Inc | | | 4,552 | |
716 | | | | Dolby Laboratories, Inc (Class A) | | | 24,093 | |
255 | | * | | DTS, Inc | | | 5,758 | |
250 | | *,e | | Eastman Kodak Co | | | 3,135 | |
637 | | * | | EchoStar Corp (Class A) | | | 24,913 | |
248 | | | | Electro Rent Corp | | | 2,282 | |
630 | | * | | Electronics for Imaging, Inc | | | 29,446 | |
29,176 | | | | EMC Corp | | | 749,240 | |
381 | | * | | EMCORE Corp | | | 2,336 | |
80 | | * | | ePlus, Inc | | | 7,461 | |
1,428 | | * | | Extreme Networks, Inc | | | 5,826 | |
1,071 | | * | | F5 Networks, Inc | | | 103,844 | |
508 | | * | | Fabrinet | | | 12,101 | |
215 | | * | | FARO Technologies, Inc | | | 6,347 | |
597 | | | | FEI Co | | | 47,635 | |
1,797 | | * | | Finisar Corp | | | 26,128 | |
617 | | *,e | | Fitbit, Inc | | | 18,257 | |
2,138 | | | | Flir Systems, Inc | | | 60,014 | |
497 | | * | | GSI Group, Inc | | | 6,769 | |
1,256 | | * | | Harmonic, Inc | | | 5,112 | |
1,906 | | | | Harris Corp | | | 165,631 | |
26,957 | | * | | Hewlett Packard Enterprise Co | | | 409,746 | |
26,957 | | | | HP, Inc | | | 319,171 | |
747 | | * | | II-VI, Inc | | | 13,864 | |
163 | | *,e | | Imation Corp | | | 223 | |
400 | | * | | Immersion Corp | | | 4,664 | |
1,872 | | * | | Infinera Corp | | | 33,921 | |
2,335 | | | | Ingram Micro, Inc (Class A) | | | 70,937 | |
620 | | * | | Insight Enterprises, Inc | | | 15,574 | |
520 | | | | InterDigital, Inc | | | 25,501 | |
1,144 | | * | | InvenSense, Inc | | | 11,703 | |
497 | | *,e | | IPG Photonics Corp | | | 44,313 | |
653 | | * | | Itron, Inc | | | 23,626 | |
867 | | * | | Ixia | | | 10,777 | |
2,873 | | | | Jabil Circuit, Inc | | | 66,912 | |
5,981 | | | | Juniper Networks, Inc | | | 165,076 | |
2,590 | | * | | Keysight Technologies, Inc | | | 73,375 | |
411 | | * | | Kimball Electronics, Inc | | | 4,517 | |
1,229 | | *,e | | Knowles Corp | | | 16,383 | |
172 | | * | | KVH Industries, Inc | | | 1,620 | |
75
TIAA-CREF LIFE FUNDS - Stock Index Fund
| | | | | | | | |
SHARES | | | | COMPANY | | VALUE | |
| | | | | | | | |
882 | | | | Lexmark International, Inc (Class A) | | $ | 28,621 | |
323 | | | | Littelfuse, Inc | | | 34,564 | |
610 | | * | | Lumentum Holdings, Inc | | | 13,432 | |
497 | | * | | Mercury Computer Systems, Inc | | | 9,125 | |
41 | | | | Mesa Laboratories, Inc | | | 4,079 | |
657 | | | | Methode Electronics, Inc | | | 20,912 | |
2,599 | | | | Motorola, Inc | | | 177,902 | |
221 | | | | MTS Systems Corp | | | 14,014 | |
160 | | * | | Multi-Fineline Electronix, Inc | | | 3,309 | |
1,621 | | | | National Instruments Corp | | | 46,506 | |
2,665 | | * | | NCR Corp | | | 65,186 | |
4,729 | | | | NetApp, Inc | | | 125,460 | |
454 | | * | | Netgear, Inc | | | 19,027 | |
1,579 | | * | | Netscout Systems, Inc | | | 48,475 | |
535 | | * | | Newport Corp | | | 8,490 | |
727 | | *,e | | Nimble Storage, Inc | | | 6,688 | |
576 | | *,e | | Novatel Wireless, Inc | | | 962 | |
2,855 | | *,e | | Oclaro, Inc | | | 9,935 | |
283 | | * | | OSI Systems, Inc | | | 25,091 | |
1,101 | | * | | Palo Alto Networks, Inc | | | 193,930 | |
291 | | | | Park Electrochemical Corp | | | 4,382 | |
196 | | * | | PC Connection, Inc | | | 4,437 | |
554 | | | | Plantronics, Inc | | | 26,271 | |
511 | | * | | Plexus Corp | | | 17,844 | |
1,944 | | * | | Polycom, Inc | | | 24,475 | |
1,170 | | * | | QLogic Corp | | | 14,274 | |
22,562 | | | | Qualcomm, Inc | | | 1,127,762 | |
4,721 | | * | | Quantum Corp | | | 4,391 | |
485 | | * | | RealD, Inc | | | 5,117 | |
383 | | * | | Rofin-Sinar Technologies, Inc | | | 10,257 | |
267 | | * | | Rogers Corp | | | 13,769 | |
1,077 | | * | | Ruckus Wireless, Inc | | | 11,535 | |
3,134 | | | | SanDisk Corp | | | 238,153 | |
1,189 | | * | | Sanmina Corp | | | 24,470 | |
410 | | * | | Scansource, Inc | | | 13,210 | |
839 | | * | | ShoreTel, Inc | | | 7,425 | |
435 | | * | | Silicon Graphics International Corp | | | 2,566 | |
704 | | * | | Sonus Networks, Inc | | | 5,020 | |
703 | | *,e | | Stratasys Ltd | | | 16,506 | |
463 | | * | | Super Micro Computer, Inc | | | 11,348 | |
636 | | * | | Synaptics, Inc | | | 51,096 | |
483 | | | | SYNNEX Corp | | | 43,436 | |
512 | | * | | Tech Data Corp | | | 33,987 | |
3,730 | | * | | Trimble Navigation Ltd | | | 80,008 | |
846 | | * | | TTM Technologies, Inc | | | 5,507 | |
443 | | *,e | | Ubiquiti Networks, Inc | | | 14,039 | |
579 | | * | | Universal Display Corp | | | 31,521 | |
617 | | *,e | | Viasat, Inc | | | 37,643 | |
3,054 | | * | | Viavi Solutions, Inc | | | 18,599 | |
1,934 | | *,e | | Violin Memory, Inc | | | 1,741 | |
1,815 | | | | Vishay Intertechnology, Inc | | | 21,871 | |
161 | | * | | Vishay Precision Group, Inc | | | 1,823 | |
3,473 | | | | Western Digital Corp | | | 208,554 | |
730 | | * | | Zebra Technologies Corp (Class A) | | | 50,844 | |
| | | | | | | | |
| | | | TOTAL TECHNOLOGY HARDWARE & EQUIPMENT | | | 18,176,720 | |
| | | | | | | | |
| |
TELECOMMUNICATION SERVICES - 2.2% | | | | |
1,188 | | * | | 8x8, Inc | | | 13,603 | |
91,008 | | | | AT&T, Inc | | | 3,131,585 | |
220 | | | | Atlantic Tele-Network, Inc | | | 17,211 | |
201 | | * | | Boingo Wireless, Inc | | | 1,331 | |
8,542 | | | | CenturyTel, Inc | | | 214,917 | |
3,005 | | * | | Cincinnati Bell, Inc | | | 10,818 | |
675 | | | | Cogent Communications Group, Inc | | | 23,416 | |
76
TIAA-CREF LIFE FUNDS - Stock Index Fund
| | | | | | | | |
SHARES | | | | COMPANY | | VALUE | |
| | | | | | | | |
945 | | | | Consolidated Communications Holdings, Inc | | $ | 19,798 | |
533 | | *,e | | Fairpoint Communications, Inc | | | 8,565 | |
19,858 | | e | | Frontier Communications Corp | | | 92,737 | |
464 | | * | | General Communication, Inc (Class A) | | | 9,178 | |
6,783 | | *,e | | Globalstar, Inc | | | 9,767 | |
126 | | * | | Hawaiian Telcom Holdco, Inc | | | 3,132 | |
238 | | | | IDT Corp (Class B) | | | 2,775 | |
814 | | *,e | | inContact, Inc | | | 7,766 | |
391 | | | | Inteliquent, Inc | | | 6,948 | |
367 | | *,e | | Intelsat S.A. | | | 1,527 | |
1,082 | | *,e | | Iridium Communications, Inc | | | 9,100 | |
4,242 | | * | | Level 3 Communications, Inc | | | 230,595 | |
323 | | | | Lumos Networks Corp | | | 3,618 | |
181 | | * | | NTELOS Holdings Corp | | | 1,654 | |
877 | | * | | Orbcomm, Inc | | | 6,349 | |
184 | | * | | pdvWireless, Inc | | | 5,060 | |
1,900 | | * | | SBA Communications Corp (Class A) | | | 199,633 | |
364 | | | | Shenandoah Telecom Co | | | 15,670 | |
309 | | | | Spok Holdings, Inc | | | 5,661 | |
10,684 | | *,e | | Sprint Corp | | | 38,676 | |
349 | | *,e | | Straight Path Communications, Inc | | | 5,982 | |
1,431 | | | | Telephone & Data Systems, Inc | | | 37,049 | |
4,226 | | * | | T-Mobile US, Inc | | | 165,321 | |
200 | | * | | US Cellular Corp | | | 8,162 | |
61,052 | | | | Verizon Communications, Inc | | | 2,821,823 | |
2,337 | | * | | Vonage Holdings Corp | | | 13,414 | |
1,408 | | e | | Windstream Holdings, Inc | | | 9,067 | |
2,070 | | * | | Zayo Group Holdings, Inc | | | 55,041 | |
| | | | | | | | |
| | | | TOTAL TELECOMMUNICATION SERVICES | | | 7,206,949 | |
| | | | | | | | |
| |
TRANSPORTATION - 2.1% | | | | |
776 | | * | | Air Transport Services Group, Inc | | | 7,822 | |
1,979 | | | | Alaska Air Group, Inc | | | 159,329 | |
198 | | | | Allegiant Travel Co | | | 33,230 | |
105 | | | | Amerco, Inc | | | 40,897 | |
9,459 | | | | American Airlines Group, Inc | | | 400,589 | |
378 | | | | Arkansas Best Corp | | | 8,085 | |
363 | | * | | Atlas Air Worldwide Holdings, Inc | | | 15,006 | |
1,524 | | * | | Avis Budget Group, Inc | | | 55,306 | |
390 | | | | Celadon Group, Inc | | | 3,857 | |
2,210 | | | | CH Robinson Worldwide, Inc | | | 137,064 | |
473 | | e | | Copa Holdings S.A. (Class A) | | | 22,827 | |
169 | | * | | Covenant Transportation Group, Inc | | | 3,192 | |
14,818 | | | | CSX Corp | | | 384,527 | |
12,267 | | | | Delta Air Lines, Inc | | | 621,814 | |
342 | | * | | Eagle Bulk Shipping, Inc | | | 1,204 | |
427 | | * | | Echo Global Logistics, Inc | | | 8,707 | |
2,935 | | | | Expeditors International of Washington, Inc | | | 132,369 | |
4,211 | | | | FedEx Corp | | | 627,397 | |
419 | | | | Forward Air Corp | | | 18,021 | |
756 | | * | | Genesee & Wyoming, Inc (Class A) | | | 40,590 | |
985 | | * | | Hawaiian Holdings, Inc | | | 34,800 | |
1,088 | | e | | Heartland Express, Inc | | | 18,518 | |
6,017 | | * | | Hertz Global Holdings, Inc | | | 85,622 | |
500 | | * | | Hub Group, Inc (Class A) | | | 16,475 | |
1,324 | | | | J.B. Hunt Transport Services, Inc | | | 97,129 | |
4,853 | | * | | JetBlue Airways Corp | | | 109,920 | |
1,673 | | | | Kansas City Southern Industries, Inc | | | 124,923 | |
791 | | * | | Kirby Corp | | | 41,622 | |
937 | | | | Knight Transportation, Inc | | | 22,704 | |
644 | | | | Landstar System, Inc | | | 37,771 | |
1,005 | | | | Macquarie Infrastructure Co LLC | | | 72,963 | |
319 | | | | Marten Transport Ltd | | | 5,646 | |
698 | | | | Matson, Inc | | | 29,756 | |
77
TIAA-CREF LIFE FUNDS - Stock Index Fund
| | | | | | | | |
SHARES | | | | COMPANY | | VALUE | |
| | | | | | | | |
1,614 | | e | | Navios Maritime Holdings, Inc | | $ | 2,824 | |
4,511 | | | | Norfolk Southern Corp | | | 381,585 | |
1,017 | | * | | Old Dominion Freight Line | | | 60,074 | |
118 | | | | Park-Ohio Holdings Corp | | | 4,340 | |
958 | | * | | Radiant Logistics, Inc | | | 3,286 | |
2,215 | | * | | Republic Airways Holdings, Inc | | | 8,705 | |
411 | | * | | Roadrunner Transportation Services Holdings, Inc | | | 3,876 | |
808 | | | | Ryder System, Inc | | | 45,919 | |
1,151 | | | | Safe Bulkers, Inc | | | 932 | |
358 | | * | | Saia, Inc | | | 7,966 | |
428 | | * | | Scorpio Bulkers, Inc | | | 4,237 | |
1,232 | | | | Skywest, Inc | | | 23,433 | |
9,914 | | | | Southwest Airlines Co | | | 426,897 | |
1,197 | | * | | Spirit Airlines, Inc | | | 47,700 | |
1,289 | | *,e | | Swift Transportation Co, Inc | | | 17,814 | |
13,109 | | | | Union Pacific Corp | | | 1,025,124 | |
5,628 | | * | | United Continental Holdings, Inc | | | 322,484 | |
10,513 | | | | United Parcel Service, Inc (Class B) | | | 1,011,666 | |
122 | | | | Universal Truckload Services, Inc | | | 1,713 | |
139 | | * | | USA Truck, Inc | | | 2,426 | |
1,203 | | * | | UTI Worldwide, Inc | | | 8,457 | |
407 | | *,e | | Virgin America, Inc | | | 14,656 | |
975 | | | | Werner Enterprises, Inc | | | 22,805 | |
849 | | * | | Wesco Aircraft Holdings, Inc | | | 10,163 | |
1,103 | | *,e | | XPO Logistics, Inc | | | 30,057 | |
521 | | * | | YRC Worldwide, Inc | | | 7,388 | |
| | | | | | | | |
| | | | TOTAL TRANSPORTATION | | | 6,916,209 | |
| | | | | | | | |
| |
UTILITIES - 3.1% | | | | |
710 | | e | | Abengoa Yield plc | | | 13,696 | |
9,820 | | | | AES Corp | | | 93,977 | |
1,862 | | | | AGL Resources, Inc | | | 118,814 | |
719 | | | | Allete, Inc | | | 36,547 | |
1,783 | | | | Alliant Energy Corp | | | 111,348 | |
3,624 | | | | Ameren Corp | | | 156,666 | |
7,209 | | | | American Electric Power Co, Inc | | | 420,068 | |
543 | | | | American States Water Co | | | 22,779 | |
2,749 | | | | American Water Works Co, Inc | | | 164,253 | |
2,635 | | | | Aqua America, Inc | | | 78,523 | |
111 | | | | Artesian Resources Corp | | | 3,075 | |
1,866 | | e | | Atlantic Power Corp | | | 3,676 | |
1,558 | | | | Atmos Energy Corp | | | 98,216 | |
895 | | * | | Avangrid, Inc | | | 34,368 | |
912 | | | | Avista Corp | | | 32,257 | |
656 | | | | Black Hills Corp | | | 30,458 | |
641 | | | | California Water Service Group | | | 14,916 | |
5,965 | | * | | Calpine Corp | | | 86,314 | |
5,931 | | | | Centerpoint Energy, Inc | | | 108,893 | |
207 | | | | Chesapeake Utilities Corp | | | 11,747 | |
937 | | | | Cleco Corp | | | 48,921 | |
4,058 | | | | CMS Energy Corp | | | 146,413 | |
146 | | | | Connecticut Water Service, Inc | | | 5,549 | |
4,484 | | | | Consolidated Edison, Inc | | | 288,187 | |
213 | | | | Consolidated Water Co, Inc | | | 2,607 | |
8,956 | | | | Dominion Resources, Inc | | | 605,784 | |
2,680 | | | | DTE Energy Co | | | 214,909 | |
10,397 | | | | Duke Energy Corp | | | 742,242 | |
1,845 | | * | | Dynegy, Inc | | | 24,723 | |
4,790 | | | | Edison International | | | 283,616 | |
600 | | | | El Paso Electric Co | | | 23,100 | |
864 | | | | Empire District Electric Co | | | 24,252 | |
2,652 | | | | Entergy Corp | | | 181,291 | |
4,674 | | | | Eversource Energy | | | 238,701 | |
13,720 | | | | Exelon Corp | | | 381,004 | |
78
TIAA-CREF LIFE FUNDS - Stock Index Fund
| | | | | | | | |
SHARES | | | | COMPANY | | VALUE | |
| | | | | | | | |
856 | | | | Ferroglobe plc | | $ | 9,202 | |
6,317 | | | | FirstEnergy Corp | | | 200,438 | |
182 | | e | | Genie Energy Ltd | | | 2,029 | |
2,223 | | | | Great Plains Energy, Inc | | | 60,710 | |
1,618 | | | | Hawaiian Electric Industries, Inc | | | 46,841 | |
750 | | | | Idacorp, Inc | | | 51,000 | |
2,504 | | | | ITC Holdings Corp | | | 98,282 | |
609 | | | | Laclede Group, Inc | | | 36,181 | |
2,800 | | | | MDU Resources Group, Inc | | | 51,296 | |
501 | | | | MGE Energy, Inc | | | 23,246 | |
214 | | | | Middlesex Water Co | | | 5,680 | |
1,140 | | e | | National Fuel Gas Co | | | 48,735 | |
1,226 | | | | New Jersey Resources Corp | | | 40,409 | |
6,685 | | | | NextEra Energy, Inc | | | 694,505 | |
4,919 | | | | NiSource, Inc | | | 95,970 | |
392 | | | | Northwest Natural Gas Co | | | 19,839 | |
823 | | | | NorthWestern Corp | | | 44,648 | |
4,874 | | | | NRG Energy, Inc | | | 57,367 | |
495 | | | | NRG Yield, Inc (Class A) | | | 6,885 | |
1,714 | | e | | NRG Yield, Inc (Class C) | | | 25,299 | |
2,807 | | | | OGE Energy Corp | | | 73,796 | |
863 | | | | ONE Gas, Inc | | | 43,297 | |
539 | | e | | Ormat Technologies, Inc | | | 19,657 | |
489 | | | | Otter Tail Corp | | | 13,022 | |
860 | | e | | Pattern Energy Group, Inc | | | 17,983 | |
3,891 | | | | Pepco Holdings, Inc | | | 101,205 | |
7,190 | | | | PG&E Corp | | | 382,436 | |
1,150 | | | | Piedmont Natural Gas Co, Inc | | | 65,573 | |
1,829 | | | | Pinnacle West Capital Corp | | | 117,934 | |
1,143 | | | | PNM Resources, Inc | | | 34,942 | |
1,365 | | | | Portland General Electric Co | | | 49,645 | |
9,862 | | | | PPL Corp | | | 336,590 | |
7,611 | | | | Public Service Enterprise Group, Inc | | | 294,470 | |
3,138 | | | | Questar Corp | | | 61,128 | |
2,185 | | | | SCANA Corp | | | 132,171 | |
3,699 | | | | Sempra Energy | | | 347,743 | |
210 | | | | SJW Corp | | | 6,226 | |
884 | | | | South Jersey Industries, Inc | | | 20,792 | |
13,713 | | | | Southern Co | | | 641,631 | |
672 | | | | Southwest Gas Corp | | | 37,068 | |
449 | | e | | Spark Energy, Inc | | | 9,303 | |
1,205 | | * | | Talen Energy Corp | | | 7,507 | |
3,378 | | | | TECO Energy, Inc | | | 90,024 | |
1,167 | | | | TerraForm Global, Inc | | | 6,524 | |
1,783 | | e | | TerraForm Power, Inc | | | 22,430 | |
2,418 | | | | UGI Corp | | | 81,632 | |
205 | | | | Unitil Corp | | | 7,355 | |
1,188 | | | | Vectren Corp | | | 50,395 | |
298 | | *,e | | Vivint Solar, Inc | | | 2,849 | |
4,635 | | | | WEC Energy Group, Inc | | | 237,822 | |
2,093 | | | | Westar Energy, Inc | | | 88,764 | |
691 | | | | WGL Holdings, Inc | | | 43,526 | |
7,517 | | | | Xcel Energy, Inc | | | 269,935 | |
183 | | | | York Water Co | | | 4,564 | |
| | | | | | | | |
| | | | TOTAL UTILITIES | | | 10,190,391 | |
| | | | | | | | |
| | | | TOTAL COMMON STOCKS
(Cost $206,406,740) | | | 332,286,928 | |
| | | | | | | | |
| |
RIGHTS / WARRANTS - 0.0% | | | | |
| |
ENERGY - 0.0% | | | | |
303 | | e,m | | Magnum Hunter Resources Corp | | | 0 | |
| | | | | | | | |
| | | | TOTAL ENERGY | | | 0 | |
| | | | | | | | |
79
TIAA-CREF LIFE FUNDS - Stock Index Fund
| | | | | | | | |
SHARES | | | | COMPANY | | VALUE | |
| | | | | | | | |
PHARMACEUTICALS, BIOTECHNOLOGY & LIFE SCIENCES - 0.0% | | | | |
118 | | m | | Forest Laboratories, Inc CVR | | $ | 113 | |
104 | | m | | Furiex Pharmaceuticals, Inc | | | 0 | |
499 | | m | | Trius Therapeutics, Inc | | | 65 | |
| | | | | | | | |
| | | | TOTAL PHARMACEUTICALS, BIOTECHNOLOGY & LIFE SCIENCES | | | 178 | |
| | | | | | | | |
| |
SOFTWARE & SERVICES - 0.0% | | | | |
299 | | m | | Gerber Scientific, Inc | | | 0 | |
| | | | | | | | |
| | | | TOTAL SOFTWARE & SERVICES | | | 0 | |
| | | | | | | | |
| |
TELECOMMUNICATION SERVICES - 0.0% | | | | |
710 | | m | | Leap Wireless International, Inc | | | 1,789 | |
| | | | | | | | |
| | | | TOTAL TELECOMMUNICATION SERVICES | | | 1,789 | |
| | | | | | | | |
| | | | TOTAL RIGHTS / WARRANTS
(Cost $1,797) | | | 1,967 | |
| | | | | | | | |
| |
SHORT-TERM INVESTMENTS - 2.8% | | | | |
| |
INVESTMENTS IN REGISTERED INVESTMENT COMPANIES - 2.8% | | | | |
9,417,992 | | c | | TIAA-CREF Short Term Lending Portfolio of the State Street Navigator Securities Lending Trust | | | 9,417,992 | |
| | | | | | | | |
| | | | TOTAL INVESTMENTS IN REGISTERED INVESTMENT COMPANIES | | | 9,417,992 | |
| | | | | | | | |
| | | | TOTAL SHORT-TERM INVESTMENTS
(Cost $9,417,992) | | | 9,417,992 | |
| | | | | | | | |
| | | | TOTAL INVESTMENTS - 102.8%
(Cost $215,826,529) | | | 341,706,887 | |
| | | | OTHER ASSETS & LIABILITIES, NET - (2.8)% | | | (9,264,262 | ) |
| | | | | | | | |
| | | | NET ASSETS - 100.0% | | $ | 332,442,625 | |
| | | | | | | | |
Abbreviation(s):
| REIT | Real Estate Investment Trust |
| c | Investments made with cash collateral received from securities on loan. |
| d | All or a portion of these securities have been segregated by the custodian to cover margin or other requirements on open futures transactions. |
| e | All or a portion of these securities are out on loan. The aggregate value of securities on loan is $9,105,861. |
| m | Indicates a security that has been deemed illiquid. |
80
TIAA-CREF LIFE FUNDS - International Equity Fund
TIAA-CREF LIFE FUNDS
INTERNATIONAL EQUITY FUND
SCHEDULE OF INVESTMENTS
December 31, 2015
| | | | | | | | |
SHARES | | | | COMPANY | | VALUE | |
| | | | | | | | |
COMMON STOCKS - 99.4% | | | | |
| |
AUSTRALIA - 0.3% | | | | |
24,075 | | | | BHP Billiton Ltd | | $ | 309,835 | |
| | | | | | | | |
| | | | TOTAL AUSTRALIA | | | 309,835 | |
| | | | | | | | |
| |
DENMARK - 1.3% | | | | |
28,593 | | * | | H Lundbeck AS | | | 976,316 | |
4,097 | | | | Novo Nordisk AS | | | 237,209 | |
| | | | | | | | |
| | | | TOTAL DENMARK | | | 1,213,525 | |
| | | | | | | | |
| |
FINLAND - 0.4% | | | | |
13,533 | | e | | Konecranes Oyj | | | 334,951 | |
| | | | | | | | |
| | | | TOTAL FINLAND | | | 334,951 | |
| | | | | | | | |
| |
FRANCE - 24.1% | | | | |
119,693 | | | | Accor S.A. | | | 5,183,894 | |
3,170 | | | | Aeroports de Paris | | | 368,888 | |
5,409 | | | | BNP Paribas | | | 306,027 | |
20,435 | | | | Compagnie de Saint-Gobain | | | 885,556 | |
36,405 | | | | Edenred | | | 688,165 | |
44,257 | | g | | Elior Participations S.C.A | | | 927,211 | |
35,054 | | | | Essilor International S.A. | | | 4,368,985 | |
9,233 | | | | Groupe Danone | | | 623,906 | |
43,415 | | | | Renault S.A. | | | 4,345,645 | |
38,025 | | | | Schneider Electric S.A. | | | 2,159,969 | |
35,733 | | | | Vinci S.A. | | | 2,290,297 | |
| | | | | | | | |
| | | | TOTAL FRANCE | | | 22,148,543 | |
| | | | | | | | |
| |
GERMANY - 18.7% | | | | |
74,189 | | | | Adidas-Salomon AG. | | | 7,200,712 | |
204,237 | | * | | Commerzbank AG. | | | 2,107,435 | |
19,368 | | | | Deutsche Boerse AG. | | | 1,702,469 | |
18,323 | | | | Henkel KGaA (Preference) | | | 2,044,882 | |
15,219 | | | | Lanxess AG. | | | 700,336 | |
23,549 | | | | Linde AG. | | | 3,401,849 | |
| | | | | | | | |
| | | | TOTAL GERMANY | | | 17,157,683 | |
| | | | | | | | |
| |
HONG KONG - 1.0% | | | | |
276,800 | | | | Sands China Ltd | | | 938,406 | |
| | | | | | | | |
| | | | TOTAL HONG KONG | | | 938,406 | |
| | | | | | | | |
| |
INDIA - 7.9% | | | | |
5,678 | | | | Eicher Motors Ltd | | | 1,441,363 | |
8,180 | | | | Emami Ltd | | | 123,233 | |
158,064 | | | | HDFC Bank Ltd | | | 2,581,600 | |
140,221 | | | | IndusInd Bank Ltd | | | 2,046,594 | |
15,277 | | | | Maruti Suzuki India Ltd | | | 1,063,909 | |
| | | | | | | | |
| | | | TOTAL INDIA | | | 7,256,699 | |
| | | | | | | | |
| |
ITALY - 0.9% | | | | |
58,381 | | | | Moncler S.p.A | | | 812,424 | |
| | | | | | | | |
| | | | TOTAL ITALY | | | 812,424 | |
| | | | | | | | |
81
TIAA-CREF LIFE FUNDS - International Equity Fund
| | | | | | | | |
SHARES | | | | COMPANY | | VALUE | |
| | | | | | | | |
JAPAN - 14.1% | | | | |
1,600 | | | | Daikin Industries Ltd | | $ | 116,515 | |
31,800 | | | | Don Quijote Co Ltd | | | 1,116,776 | |
161,000 | | | | Ishikawajima-Harima Heavy Industries Co Ltd | | | 444,440 | |
18,900 | | | | Murata Manufacturing Co Ltd | | | 2,719,354 | |
1,453 | | | | Nomura Holdings, Inc | | | 8,093 | |
84,425 | | | | Olympus Corp | | | 3,323,700 | |
7,592 | | | | Oriental Land Co Ltd | | | 459,289 | |
230,400 | | *,e | | Pioneer Corp | | | 634,271 | |
117,550 | | | | Sony Corp | | | 2,889,001 | |
26,200 | | e | | Sony Financial Holdings, Inc | | | 468,646 | |
12,300 | | | | Toyota Motor Corp | | | 757,421 | |
| | | | | | | | |
| | | | TOTAL JAPAN | | | 12,937,506 | |
| | | | | | | | |
| |
NETHERLANDS - 5.2% | | | | |
1,165 | | | | ASML Holding NV | | | 103,512 | |
38,936 | | | | Heineken NV | | | 3,318,004 | |
97,495 | | | | ING Groep NV | | | 1,319,111 | |
47 | | | | Royal Dutch Shell plc (A Shares) | | | 1,064 | |
| | | | | | | | |
| | | | TOTAL NETHERLANDS | | | 4,741,691 | |
| | | | | | | | |
| |
SWEDEN - 1.9% | | | | |
72,527 | | | | Electrolux AB (Series B) | | | 1,749,888 | |
| | | | | | | | |
| | | | TOTAL SWEDEN | | | 1,749,888 | |
| | | | | | | | |
| |
SWITZERLAND - 4.8% | | | | |
3,167 | | | | Burckhardt Compression Holding AG. | | | 969,653 | |
2,945 | | | | Geberit AG. | | | 997,479 | |
17 | | | | Givaudan S.A. | | | 30,854 | |
22,640 | | | | Swatch Group AG. (Registered) | | | 1,528,893 | |
5,192 | | | | UBS AG. | | | 100,722 | |
3,083 | | | | Zurich Financial Services AG. | | | 792,022 | |
| | | | | | | | |
| | | | TOTAL SWITZERLAND | | | 4,419,623 | |
| | | | | | | | |
| |
TAIWAN - 0.5% | | | | |
406,927 | | | | Advanced Semiconductor Engineering, Inc | | | 467,445 | |
| | | | | | | | |
| | | | TOTAL TAIWAN | | | 467,445 | |
| | | | | | | | |
| |
UNITED KINGDOM - 17.7% | | | | |
5,716 | | | | ARM Holdings plc | | | 87,124 | |
8,484 | | | | Associated British Foods plc | | | 417,473 | |
291,990 | | | | Barclays plc | | | 939,848 | |
63,288 | | | | Essentra plc | | | 771,487 | |
287,842 | | | | Group 4 Securicor plc | | | 956,150 | |
52,776 | | | | Henderson Group plc | | | 239,868 | |
510,259 | | | | Man Group plc | | | 1,312,645 | |
2,925 | | | | Rio Tinto plc | | | 85,162 | |
374,083 | | | | Sky plc | | | 6,132,247 | |
786,841 | | * | | Tesco plc | | | 1,728,906 | |
96,553 | | | | Weir Group plc | | | 1,418,247 | |
94,071 | | | | WPP plc | | | 2,163,799 | |
| | | | | | | | |
| | | | TOTAL UNITED KINGDOM | | | 16,252,956 | |
| | | | | | | | |
| |
UNITED STATES - 0.6% | | | | |
18,866 | | * | | Qiagen NV | | | 511,347 | |
| | | | | | | | |
| | | | TOTAL UNITED STATES | | | 511,347 | |
| | | | | | | | |
| | | | TOTAL COMMON STOCKS
(Cost $91,662,365) | | | 91,252,522 | |
| | | | | | | | |
82
TIAA-CREF LIFE FUNDS - International Equity Fund
| | | | | | | | |
SHARES | | | | COMPANY | | VALUE | |
| | | | | | | | |
SHORT-TERM INVESTMENTS - 0.9% | | | | |
| |
INVESTMENTS IN REGISTERED INVESTMENT COMPANIES - 0.9% | | | | |
869,519 | | c | | TIAA-CREF Short Term Lending Portfolio of the State Street Navigator Securities Lending Trust | | $ | 869,519 | |
| | | | | | | | |
| | | | TOTAL INVESTMENTS IN REGISTERED INVESTMENT COMPANIES | | | 869,519 | |
| | | | | | | | |
| | | | TOTAL SHORT-TERM INVESTMENTS
(Cost $869,519) | | | 869,519 | |
| | | | | | | | |
| | | | TOTAL INVESTMENTS - 100.3%
(Cost $92,531,884) | | | 92,122,041 | |
| | | | OTHER ASSETS & LIABILITIES, NET - (0.3)% | | | (302,570 | ) |
| | | | | | | | |
| | | | NET ASSETS - 100.0% | | $ | 91,819,471 | |
| | | | | | | | |
| c | Investments made with cash collateral received from securities on loan. |
| e | All or a portion of these securities are out on loan. The aggregate value of securities on loan is $826,060. |
| g | Security is exempt from registration under Rule 144(A) of the Securities Act of 1933. Such securities are deemed liquid and may be resold in transactions exempt from registration to qualified institutional buyers. At 12/31/15, the aggregate value of these securities was $927,211 or 1.0% of net assets. |
83
TIAA-CREF LIFE FUNDS - International Equity Fund
TIAA-CREF LIFE FUNDS
INTERNATIONAL EQUITY FUND
SUMMARY OF MARKET VALUES BY SECTOR
December 31, 2015
| | | | | | | | |
SECTOR | | VALUE | | | % OF
NET
ASSETS | |
CONSUMER DISCRETIONARY | | $ | 36,976,574 | | | | 40.1 | % |
INDUSTRIALS | | | 13,998,885 | | | | 15.3 | |
FINANCIALS | | | 13,925,079 | | | | 15.2 | |
HEALTH CARE | | | 9,417,556 | | | | 10.3 | |
CONSUMER STAPLES | | | 8,256,404 | | | | 9.0 | |
MATERIALS | | | 5,299,524 | | | | 5.8 | |
INFORMATION TECHNOLOGY | | | 3,377,435 | | | | 3.7 | |
ENERGY | | | 1,065 | | | | 0.0 | |
SHORT-TERM INVESTMENTS | | | 869,519 | | | | 0.9 | |
OTHER ASSETS & LIABILITES, NET | | | (302,570 | ) | | | (0.3 | ) |
| | | | | | | | |
NET ASSETS | | $ | 91,819,471 | | | | 100.0 | % |
| | | | | | | | |
84
TIAA-CREF LIFE FUNDS - Bond Fund
TIAA-CREF LIFE FUNDS
BOND FUND
SCHEDULE OF INVESTMENTS
December 31, 2015
| | | | | | | | | | | | | | | | |
PRINCIPAL | | | | ISSUER | | RATE | | | MATURITY
DATE | | | VALUE | |
| | | | | | | | | | | | | | |
BANK LOAN OBLIGATIONS - 1.5% | | | | | | | | | |
| | | |
AUTOMOBILES & COMPONENTS - 0.1% | | | | | | | | | | | | |
$ 49,500 | | i | | Dealer Tire LLC | | | 5.500 | % | | | 12/22/21 | | | $ | 49,438 | |
74,063 | | i | | Gates Global LLC | | | 4.250 | | | | 07/05/21 | | | | 69,301 | |
| | | | | | | | | | | | | | | | |
| | | | TOTAL AUTOMOBILES & COMPONENTS | | | | 118,739 | |
| | | | | | | | | | | | | | | | |
| | | |
CAPITAL GOODS - 0.0% | | | | | | | | | | | | |
24,938 | | i | | CHI Overhead Doors, Inc | | | 4.750 | | | | 07/31/22 | | | | 24,423 | |
25,000 | | i | | Plaze, Inc | | | 5.250 | | | | 07/31/22 | | | | 24,750 | |
| | | | | | | | | | | | | | | | |
| | | | TOTAL CAPITAL GOODS | | | | 49,173 | |
| | | | | | | | | | | | | | | | |
| | | |
COMMERCIAL & PROFESSIONAL SERVICES - 0.1% | | | | | | | | | | | | |
110,984 | | i | | AECOM Technology Corp | | | 3.750 | | | | 10/15/21 | | | | 110,776 | |
59,400 | | i | | Creative Artists Agency LLC | | | 5.500 | | | | 12/17/21 | | | | 59,103 | |
25,000 | | h,i | | Staples, Inc | | | 3.500 | | | | 04/24/21 | | | | 24,677 | |
| | | | | | | | | | | | | | | | |
| | | | TOTAL COMMERCIAL & PROFESSIONAL SERVICES | | | | 194,556 | |
| | | | | | | | | | | | | | | | |
| | | |
CONSUMER DURABLES & APPAREL - 0.0% | | | | | | | | | | | | |
91,576 | | i | | Otter Products LLC | | | 5.750 | | | | 06/03/20 | | | | 87,341 | |
| | | | | | | | | | | | | | | | |
| | | | TOTAL CONSUMER DURABLES & APPAREL | | | | 87,341 | |
| | | | | | | | | | | | | | | | |
| | | |
CONSUMER SERVICES - 0.2% | | | | | | | | | | | | |
100,000 | | i | | Jackson Hewitt Tax Service, Inc | | | 8.000 | | | | 06/25/21 | | | | 95,625 | |
99,750 | | i | | Knowledge Universe Education LLC | | | 6.000 | | | | 08/13/22 | | | | 97,256 | |
132,906 | | i | | Spin Holdco, Inc | | | 4.250 | | | | 11/14/19 | | | | 127,390 | |
| | | | | | | | | | | | | | | | |
| | | | TOTAL CONSUMER SERVICES | | | | 320,271 | |
| | | | | | | | | | | | | | | | |
| | | |
DIVERSIFIED FINANCIALS - 0.2% | | | | | | | | | | | | |
199,500 | | | | DTZ US Borrower LLC | | | 4.250 | | | | 11/04/21 | | | | 194,325 | |
98,496 | | i | | TransUnion LLC | | | 3.500 | | | | 04/09/21 | | | | 95,500 | |
| | | | | | | | | | | | | | | | |
| | | | TOTAL DIVERSIFIED FINANCIALS | | | | 289,825 | |
| | | | | | | | | | | | | | | | |
| | | |
ENERGY - 0.0% | | | | | | | | | | | | |
2,950 | | i | | Granite Acquisition, Inc | | | 5.000 | | | | 12/19/21 | | | | 2,626 | |
66,379 | | i | | Granite Acquisition, Inc | | | 5.000 | | | | 12/19/21 | | | | 59,078 | |
| | | | | | | | | | | | | | | | |
| | | | TOTAL ENERGY | | | | 61,704 | |
| | | | | | | | | | | | | | | | |
| | | |
FOOD, BEVERAGE & TOBACCO - 0.0% | | | | | | | | | | | | |
29,925 | | i | | Hostess Brands LLC | | | 4.500 | | | | 08/03/22 | | | | 29,738 | |
12,981 | | i | | Post Holdings, Inc | | | 3.750 | | | | 06/02/21 | | | | 12,946 | |
| | | | | | | | | | | | | | | | |
| | | | TOTAL FOOD, BEVERAGE & TOBACCO | | | | 42,684 | |
| | | | | | | | | | | | | | | | |
| | | |
HEALTH CARE EQUIPMENT & SERVICES - 0.1% | | | | | | | | | | | | |
98,685 | | i | | DaVita HealthCare Partners, Inc | | | 3.500 | | | | 06/24/21 | | | | 98,150 | |
75,000 | | i | | Greatbatch Ltd | | | 5.250 | | | | 10/14/22 | | | | 74,156 | |
| | | | | | | | | | | | | | | | |
| | | | TOTAL HEALTH CARE EQUIPMENT & SERVICES | | | | 172,306 | |
| | | | | | | | | | | | | | | | |
| | | |
INSURANCE - 0.1% | | | | | | | | | | | | |
124,524 | | i | | Acrisure LLC | | | 6.500 | | | | 05/19/22 | | | | 119,076 | |
| | | | | | | | | | | | | | | | |
| | | | TOTAL INSURANCE | | | | 119,076 | |
| | | | | | | | | | | | | | | | |
85
TIAA-CREF LIFE FUNDS - Bond Fund
| | | | | | | | | | | | | | | | |
PRINCIPAL | | | | ISSUER | | RATE | | | MATURITY
DATE | | | VALUE | |
| | | | | | | | | | | | | | |
MATERIALS - 0.1% | | | | | | | | | | | | |
$ 69,300 | | i | | Eco Services Operations LLC | | | 4.750 | % | | | 12/04/21 | | | $ | 68,152 | |
137,037 | | i | | Signode Industrial Group US, Inc | | | 3.750 | | | | 05/01/21 | | | | 131,898 | |
40,000 | | i | | Solenis International LP | | | 7.750 | | | | 07/31/22 | | | | 31,500 | |
| | | | | | | | | | | | | | | | |
| | | | TOTAL MATERIALS | | | | 231,550 | |
| | | | | | | | | | | | | | | | |
| | | |
MEDIA - 0.2% | | | | | | | | | | | | |
99,750 | | i | | CDS US Intermediate Holdings, Inc | | | 5.000 | | | | 07/08/22 | | | | 93,848 | |
124,233 | | i | | CSC Holdings LLC | | | 2.924 | | | | 04/17/20 | | | | 123,690 | |
75,000 | | i | | Neptune Finco Corp | | | 5.000 | | | | 10/09/22 | | | | 74,789 | |
97,203 | | i | | Univision Communications, Inc | | | 4.000 | | | | 03/01/20 | | | | 94,947 | |
| | | | | | | | | | | | | | | | |
| | | | TOTAL MEDIA | | | | 387,274 | |
| | | | | | | | | | | | | | | | |
| | | |
SOFTWARE & SERVICES - 0.2% | | | | | | | | | | | | |
155,000 | | i | | Evergreen Skills Lux S.a.r.l. | | | 9.250 | | | | 04/28/22 | | | | 100,362 | |
69,121 | | i | | IMS Health, Inc | | | 3.500 | | | | 03/17/21 | | | | 67,393 | |
48,694 | | i | | Mitchell International, Inc | | | 4.500 | | | | 10/13/20 | | | | 45,967 | |
41,739 | | i | | P2 Lower Acquisition LLC | | | 5.500 | | | | 10/22/20 | | | | 41,217 | |
74,249 | | i | | ProQuest LLC | | | 5.750 | | | | 10/24/21 | | | | 72,671 | |
2,838 | | i | | SS&C Technologies Holdings Europe SARL | | | 4.018 | | | | 07/08/22 | | | | 2,813 | |
19,283 | | i | | SS&C Technologies Holdings, Inc | | | 4.007 | | | | 07/08/22 | | | | 19,114 | |
| | | | | | | | | | | | | | | | |
| | | | TOTAL SOFTWARE & SERVICES | | | | 349,537 | |
| | | | | | | | | | | | | | | | |
| | | |
TECHNOLOGY HARDWARE & EQUIPMENT - 0.2% | | | | | | | | | | | | |
99,750 | | i | | CommScope, Inc | | | 3.827 | | | | 12/29/22 | | | | 98,940 | |
69,128 | | i | | Sensata Technologies BV | | | 3.000 | | | | 10/14/21 | | | | 67,774 | |
18,500 | | i | | Zebra Technologies Corp | | | 4.750 | | | | 10/27/21 | | | | 18,500 | |
| | | | | | | | | | | | | | | | |
| | | | TOTAL TECHNOLOGY HARDWARE & EQUIPMENT | | | | 185,214 | |
| | | | | | | | | | | | | | | | |
| | | | TOTAL BANK LOAN OBLIGATIONS
(Cost $2,724,491) | | | | | | | | | | | 2,609,250 | |
| | | | | | | | | | | | | | | | |
| | | |
BONDS - 95.7% | | | | | | | | | | | | |
| | | |
CORPORATE BONDS - 47.3% | | | | | | | | | | | | |
| | | |
AUTOMOBILES & COMPONENTS - 0.4% | | | | | | | | | | | | |
125,000 | | | | Delphi Automotive plc | | | 3.150 | | | | 11/19/20 | | | | 124,852 | |
75,000 | | g | | Gates Global LLC | | | 6.000 | | | | 07/15/22 | | | | 54,000 | |
175,000 | | | | Magna International, Inc | | | 3.625 | | | | 06/15/24 | | | | 171,114 | |
100,000 | | | | Magna International, Inc | | | 4.150 | | | | 10/01/25 | | | | 101,857 | |
150,000 | | g | | ZF North America Capital, Inc | | | 4.500 | | | | 04/29/22 | | | | 146,625 | |
| | | | | | | | | | | | | | | | |
| | | | TOTAL AUTOMOBILES & COMPONENTS | | | | 598,448 | |
| | | | | | | | | | | | | | | | |
| | | |
BANKS - 7.2% | | | | | | | | | | | | |
200,000 | | g | | Banco Nacional de Comercio Exterior SNC | | | 4.375 | | | | 10/14/25 | | | | 197,500 | |
200,000 | | | | Bank of America Corp | | | 5.300 | | | | 03/15/17 | | | | 208,052 | |
350,000 | | | | Bank of America Corp | | | 2.625 | | | | 10/19/20 | | | | 345,751 | |
500,000 | | | | Bank of America Corp | | | 4.000 | | | | 01/22/25 | | | | 489,868 | |
275,000 | | | | Bank of America Corp | | | 3.950 | | | | 04/21/25 | | | | 267,811 | |
200,000 | | | | Bank of America Corp | | | 3.875 | | | | 08/01/25 | | | | 203,045 | |
50,000 | | | | Bank of America Corp | | | 4.750 | | | | 04/21/45 | | | | 48,057 | |
150,000 | | g | | Bank of Tokyo-Mitsubishi UFJ Ltd | | | 2.350 | | | | 02/23/17 | | | | 151,052 | |
225,000 | | g | | Bank of Tokyo-Mitsubishi UFJ Ltd | | | 2.350 | | | | 09/08/19 | | | | 223,914 | |
150,000 | | g | | Bank of Tokyo-Mitsubishi UFJ Ltd | | | 3.250 | | | | 09/08/24 | | | | 147,860 | |
200,000 | | | | Barclays plc | | | 2.750 | | | | 11/08/19 | | | | 199,269 | |
325,000 | | | | Barclays plc | | | 3.650 | | | | 03/16/25 | | | | 312,333 | |
250,000 | | | | Branch Banking & Trust Co | | | 2.300 | | | | 10/15/18 | | | | 252,528 | |
60,000 | | | | Capital One Bank USA NA | | | 3.375 | | | | 02/15/23 | | | | 58,742 | |
100,000 | | | | Citigroup, Inc | | | 2.550 | | | | 04/08/19 | | | | 100,652 | |
325,000 | | | | Citigroup, Inc | | | 4.400 | | | | 06/10/25 | | | | 328,406 | |
425,000 | | | | Citigroup, Inc | | | 4.450 | | | | 09/29/27 | | | | 422,470 | |
100,000 | | | | Cooperatieve Centrale Raiffeisen-Boerenleenbank BA | | | 3.950 | | | | 11/09/22 | | | | 101,232 | |
125,000 | | | | Cooperatieve Centrale Raiffeisen-Boerenleenbank BA | | | 4.625 | | | | 12/01/23 | | | | 130,344 | |
100,000 | | g | | Credit Agricole S.A. | | | 2.500 | | | | 04/15/19 | | | | 100,529 | |
75,000 | | g | | Credit Agricole S.A. | | | 2.750 | | | | 06/10/20 | | | | 75,402 | |
225,000 | | | | Discover Bank | | | 3.100 | | | | 06/04/20 | | | | 225,616 | |
200,000 | | | | Fifth Third Bancorp | | | 2.375 | | | | 04/25/19 | | | | 200,682 | |
86
TIAA-CREF LIFE FUNDS - Bond Fund
| | | | | | | | | | | | | | | | |
PRINCIPAL | | | | ISSUER | | RATE | | | MATURITY
DATE | | | VALUE | |
| | | | | | | | | | | | | | |
$ 200,000 | | g | | HSBC Bank plc | | | 1.500 | % | | | 05/15/18 | | | $ | 197,815 | |
150,000 | | g | | HSBC Bank plc | | | 4.125 | | | | 08/12/20 | | | | 159,798 | |
150,000 | | | | HSBC USA, Inc | | | 2.375 | | | | 11/13/19 | | | | 149,421 | |
200,000 | | | | HSBC USA, Inc | | | 2.350 | | | | 03/05/20 | | | | 197,733 | |
200,000 | | g | | Industrial & Commercial Bank of China Ltd | | | 4.875 | | | | 09/21/25 | | | | 202,308 | |
375,000 | | | | JPMorgan Chase & Co | | | 2.750 | | | | 06/23/20 | | | | 376,748 | |
500,000 | | | | JPMorgan Chase & Co | | | 3.875 | | | | 02/01/24 | | | | 514,285 | |
325,000 | | | | JPMorgan Chase & Co | | | 3.900 | | | | 07/15/25 | | | | 334,710 | |
100,000 | | i | | JPMorgan Chase & Co | | | 5.150 | | | | 12/30/49 | | | | 94,500 | |
80,000 | | | | KeyBank NA | | | 2.500 | | | | 12/15/19 | | | | 80,141 | |
275,000 | | | | KeyBank NA | | | 2.250 | | | | 03/16/20 | | | | 271,986 | |
350,000 | | | | KeyBank NA | | | 3.300 | | | | 06/01/25 | | | | 346,173 | |
100,000 | | g | | Macquarie Bank Ltd | | | 2.600 | | | | 06/24/19 | | | | 99,908 | |
225,000 | | | | Manufacturers & Traders Trust Co | | | 2.100 | | | | 02/06/20 | | | | 221,020 | |
175,000 | | | | PNC Bank NA | | | 2.200 | | | | 01/28/19 | | | | 175,595 | |
225,000 | | | | PNC Bank NA | | | 2.250 | | | | 07/02/19 | | | | 226,067 | |
350,000 | | | | PNC Bank NA | | | 2.600 | | | | 07/21/20 | | | | 350,002 | |
150,000 | | | | PNC Bank NA | | | 2.700 | | | | 11/01/22 | | | | 145,897 | |
140,000 | | g,i | | Rabobank Nederland NV | | | 11.000 | | | | 12/30/49 | | | | 172,830 | |
500,000 | | | | Royal Bank of Canada | | | 1.200 | | | | 09/19/17 | | | | 497,665 | |
175,000 | | | | Royal Bank of Canada | | | 2.200 | | | | 07/27/18 | | | | 176,446 | |
300,000 | | g | | Skandinaviska Enskilda Banken AB | | | 2.625 | | | | 11/17/20 | | | | 299,052 | |
250,000 | | g | | Societe Generale S.A. | | | 4.750 | | | | 11/24/25 | | | | 241,965 | |
250,000 | | g | | Societe Generale S.A. | | | 5.625 | | | | 11/24/45 | | | | 239,339 | |
75,000 | | | | Sumitomo Mitsui Banking Corp | | | 2.500 | | | | 07/19/18 | | | | 75,990 | |
150,000 | | | | Sumitomo Mitsui Banking Corp | | | 2.450 | | | | 01/16/20 | | | | 149,181 | |
250,000 | | | | Sumitomo Mitsui Banking Corp | | | 3.650 | | | | 07/23/25 | | | | 252,587 | |
100,000 | | | | SunTrust Banks, Inc | | | 2.750 | | | | 05/01/23 | | | | 95,670 | |
250,000 | | | | Toronto-Dominion Bank | | | 2.500 | | | | 12/14/20 | | | | 249,888 | |
200,000 | | g | | Turkiye Garanti Bankasi AS. | | | 4.750 | | | | 10/17/19 | | | | 198,660 | |
150,000 | | | | Union Bank NA | | | 2.125 | | | | 06/16/17 | | | | 150,939 | |
125,000 | | | | UnionBanCal Corp | | | 3.500 | | | | 06/18/22 | | | | 126,811 | |
370,000 | | | | US Bank NA | | | 2.800 | | | | 01/27/25 | | | | 360,271 | |
200,000 | | | | Westpac Banking Corp | | | 2.250 | | | | 01/17/19 | | | | 200,536 | |
325,000 | | | | Westpac Banking Corp | | | 2.600 | | | | 11/23/20 | | | | 324,875 | |
200,000 | | g | | Zenith Bank plc | | | 6.250 | | | | 04/22/19 | | | | 179,900 | |
| | | | | | | | | | | | | | | | |
| | | | TOTAL BANKS | | | | 12,927,827 | |
| | | | | | | | | | | | | | | | |
| | | |
CAPITAL GOODS - 1.2% | | | | | | | | | | | | |
125,000 | | | | Caterpillar Financial Services Corp | | | 3.250 | | | | 12/01/24 | | | | 124,028 | |
150,000 | | g | | CRH America, Inc | | | 3.875 | | | | 05/18/25 | | | | 149,050 | |
100,000 | | | | Eaton Corp | | | 4.000 | | | | 11/02/32 | | | | 95,284 | |
60,000 | | | | Embraer Netherlands Finance BV | | | 5.050 | | | | 06/15/25 | | | | 54,600 | |
125,000 | | | | Ingersoll-Rand Luxembourg Finance S.A. | | | 3.550 | | | | 11/01/24 | | | | 122,385 | |
175,000 | | | | John Deere Capital Corp | | | 3.400 | | | | 09/11/25 | | | | 177,501 | |
175,000 | | | | Lockheed Martin Corp | | | 2.500 | | | | 11/23/20 | | | | 174,384 | |
100,000 | | | | Lockheed Martin Corp | | | 3.550 | | | | 01/15/26 | | | | 100,514 | |
125,000 | | | | Rockwell Automation, Inc | | | 2.050 | | | | 03/01/20 | | | | 123,944 | |
115,000 | | | | Rockwell Automation, Inc | | | 2.875 | | | | 03/01/25 | | | | 112,164 | |
100,000 | | g | | Schaeffler Finance BV | | | 4.750 | | | | 05/15/21 | | | | 100,500 | |
100,000 | | g | | Stena AB | | | 7.000 | | | | 02/01/24 | | | | 85,000 | |
100,000 | | | | Textron, Inc | | | 3.875 | | | | 03/01/25 | | | | 98,127 | |
425,000 | | | | Timken Co | | | 3.875 | | | | 09/01/24 | | | | 401,293 | |
200,000 | | g | | TSMC Global Ltd | | | 1.625 | | | | 04/03/18 | | | | 196,045 | |
| | | | | | | | | | | | | | | | |
| | | | TOTAL CAPITAL GOODS | | | | 2,114,819 | |
| | | | | | | | | | | | | | | | |
| | | |
COMMERCIAL & PROFESSIONAL SERVICES - 1.6% | | | | | | | | | | | | |
500,000 | | | | 21st Century Fox America, Inc | | | 3.000 | | | | 09/15/22 | | | | 492,747 | |
50,000 | | | | 21st Century Fox America, Inc | | | 6.900 | | | | 08/15/39 | | | | 59,115 | |
100,000 | | | | ADT Corp | | | 6.250 | | | | 10/15/21 | | | | 104,455 | |
25,000 | | | | AECOM | | | 5.750 | | | | 10/15/22 | | | | 25,750 | |
50,000 | | | | AECOM | | | 5.875 | | | | 10/15/24 | | | | 51,000 | |
250,000 | | | | Air Lease Corp | | | 3.875 | | | | 04/01/21 | | | | 251,250 | |
250,000 | | g | | Daimler Finance North America LLC | | | 3.300 | | | | 05/19/25 | | | | 242,432 | |
87
TIAA-CREF LIFE FUNDS - Bond Fund
| | | | | | | | | | | | | | | | |
PRINCIPAL | | | | ISSUER | | RATE | | | MATURITY
DATE | | | VALUE | |
| | | | | | | | | | | | | | |
$ 150,000 | | | | Fluor Corp | | | 3.500 | % | | | 12/15/24 | | | $ | 149,889 | |
75,000 | | | | Republic Services, Inc | | | 3.800 | | | | 05/15/18 | | | | 77,697 | |
250,000 | | | | Republic Services, Inc | | | 3.550 | | | | 06/01/22 | | | | 255,446 | |
150,000 | | | | Republic Services, Inc | | | 3.200 | | | | 03/15/25 | | | | 144,419 | |
75,000 | | | | United Rentals North America, Inc | | | 5.500 | | | | 07/15/25 | | | | 72,750 | |
250,000 | | | | Visa, Inc | | | 2.200 | | | | 12/14/20 | | | | 249,810 | |
175,000 | | | | Visa, Inc | | | 3.150 | | | | 12/14/25 | | | | 175,370 | |
250,000 | | | | Waste Management, Inc | | | 2.600 | | | | 09/01/16 | | | | 251,723 | |
100,000 | | | | Waste Management, Inc | | | 2.900 | | | | 09/15/22 | | | | 98,187 | |
50,000 | | | | Waste Management, Inc | | | 3.900 | | | | 03/01/35 | | | | 46,750 | |
50,000 | | | | Waste Management, Inc | | | 4.100 | | | | 03/01/45 | | | | 46,470 | |
75,000 | | g | | XPO Logistics, Inc | | | 6.500 | | | | 06/15/22 | | | | 69,375 | |
| | | | | | | | | | | | | | | | |
| | | | TOTAL COMMERCIAL & PROFESSIONAL SERVICES | | | | 2,864,635 | |
| | | | | | | | | | | | | | | | |
| | | |
CONSUMER DURABLES & APPAREL - 0.2% | | | | | | | | | | | | |
100,000 | | | | Newell Rubbermaid, Inc | | | 3.900 | | | | 11/01/25 | | | | 90,270 | |
100,000 | | | | PVH Corp | | | 4.500 | | | | 12/15/22 | | | | 97,750 | |
100,000 | | | | Whirlpool Corp | | | 3.700 | | | | 03/01/23 | | | | 100,640 | |
| | | | | | | | | | | | | | | | |
| | | | TOTAL CONSUMER DURABLES & APPAREL | | | | 288,660 | |
| | | | | | | | | | | | | | | | |
| | | |
CONSUMER SERVICES - 0.2% | | | | | | | | | | | | |
200,000 | | g | | 1011778 BC / New Red Fin | | | 6.000 | | | | 04/01/22 | | | | 206,000 | |
150,000 | | g | | SABMiller Holdings, Inc | | | 3.750 | | | | 01/15/22 | | | | 154,282 | |
43,000 | | g | | Six Flags Entertainment Corp | | | 5.250 | | | | 01/15/21 | | | | 43,538 | |
70,000 | | | | Speedway Motorsports, Inc | | | 5.125 | | | | 02/01/23 | | | | 69,300 | |
| | | | | | | | | | | | | | | | |
| | | | TOTAL CONSUMER SERVICES | | | | 473,120 | |
| | | | | | | | | | | | | | | | |
| | | |
DIVERSIFIED FINANCIALS - 6.0% | | | | | | | | | | | | |
40,000 | | | | Abbey National Treasury Services plc | | | 4.000 | | | | 04/27/16 | | | | 40,368 | |
125,000 | | | | American Express Centurion Bank | | | 6.000 | | | | 09/13/17 | | | | 133,903 | |
725,000 | | | | American Express Credit Corp | | | 2.250 | | | | 08/15/19 | | | | 725,105 | |
750,000 | | g,i | | Armor Re Ltd | | | 4.243 | | | | 12/15/16 | | | | 748,425 | |
50,000 | | | | Bank of New York Mellon Corp | | | 5.450 | | | | 05/15/19 | | | | 55,193 | |
225,000 | | g | | Bayer US Finance LLC | | | 2.375 | | | | 10/08/19 | | | | 225,201 | |
200,000 | | g | | Bayer US Finance LLC | | | 3.375 | | | | 10/08/24 | | | | 201,503 | |
200,000 | | g | | BBVA Bancomer S.A. | | | 6.750 | | | | 09/30/22 | | | | 220,000 | |
200,000 | | g | | Comcel Trust | | | 6.875 | | | | 02/06/24 | | | | 154,000 | |
125,000 | | | | Credit Suisse | | | 2.300 | | | | 05/28/19 | | | | 125,143 | |
125,000 | | | | Credit Suisse | | | 3.000 | | | | 10/29/21 | | | | 124,568 | |
150,000 | | g | | Credit Suisse Group Funding Guernsey Ltd | | | 3.750 | | | | 03/26/25 | | | | 144,915 | |
250,000 | | g | | Credit Suisse Group Funding Guernsey Ltd | | | 4.875 | | | | 05/15/45 | | | | 246,529 | |
65,000 | | | | Ford Motor Credit Co LLC | | | 4.250 | | | | 02/03/17 | | | | 66,413 | |
250,000 | | | | Ford Motor Credit Co LLC | | | 3.000 | | | | 06/12/17 | | | | 252,441 | |
35,000 | | | | Ford Motor Credit Co LLC | | | 6.625 | | | | 08/15/17 | | | | 37,305 | |
750,000 | | | | Ford Motor Credit Co LLC | | | 2.597 | | | | 11/04/19 | | | | 736,443 | |
275,000 | | | | Ford Motor Credit Co LLC | | | 3.157 | | | | 08/04/20 | | | | 274,172 | |
325,000 | | | | Ford Motor Credit Co LLC | | | 3.200 | | | | 01/15/21 | | | | 322,826 | |
275,000 | | | | Ford Motor Credit Co LLC | | | 4.134 | | | | 08/04/25 | | | | 274,164 | |
400,000 | | g | | GE Capital International Funding Co | | | 2.342 | | | | 11/15/20 | | | | 397,069 | |
558,000 | | g | | GE Capital International Funding Co | | | 3.373 | | | | 11/15/25 | | | | 568,191 | |
215,000 | | | | General Electric Capital Corp | | | 3.100 | | | | 01/09/23 | | | | 218,227 | |
160,000 | | | | General Motors Financial Co, Inc | | | 3.500 | | | | 07/10/19 | | | | 160,567 | |
100,000 | | | | General Motors Financial Co, Inc | | | 3.200 | | | | 07/13/20 | | | | 98,460 | |
40,000 | | | | General Motors Financial Co, Inc | | | 4.375 | | | | 09/25/21 | | | | 40,582 | |
200,000 | | | | Goldman Sachs Group, Inc | | | 2.750 | | | | 09/15/20 | | | | 199,912 | |
200,000 | | | | Goldman Sachs Group, Inc | | | 3.625 | | | | 01/22/23 | | | | 202,347 | |
300,000 | | | | Goldman Sachs Group, Inc | | | 3.500 | | | | 01/23/25 | | | | 295,073 | |
125,000 | | | | Goldman Sachs Group, Inc | | | 4.800 | | | | 07/08/44 | | | | 124,162 | |
100,000 | | | | Goldman Sachs Group, Inc | | | 4.750 | | | | 10/21/45 | | | | 99,312 | |
100,000 | | | | Icahn Enterprises LP | | | 4.875 | | | | 03/15/19 | | | | 99,100 | |
130,000 | | | | International Lease Finance Corp | | | 5.750 | | | | 05/15/16 | | | | 131,788 | |
100,000 | | | | International Lease Finance Corp | | | 3.875 | | | | 04/15/18 | | | | 100,750 | |
100,000 | | | | International Lease Finance Corp | | | 5.875 | | | | 08/15/22 | | | | 106,500 | |
88
TIAA-CREF LIFE FUNDS - Bond Fund
| | | | | | | | | | | | | | | | |
PRINCIPAL | | | | ISSUER | | RATE | | | MATURITY
DATE | | | VALUE | |
| | | | | | | | | | | | | | |
$ 100,000 | | | | Legg Mason, Inc | | | 2.700 | % | | | 07/15/19 | | | $ | 99,756 | |
100,000 | | | | Legg Mason, Inc | | | 3.950 | | | | 07/15/24 | | | | 98,415 | |
325,000 | | | | Morgan Stanley | | | 1.875 | | | | 01/05/18 | | | | 324,673 | |
225,000 | | | | Morgan Stanley | | | 2.650 | | | | 01/27/20 | | | | 224,467 | |
450,000 | | | | Morgan Stanley | | | 2.800 | | | | 06/16/20 | | | | 451,603 | |
150,000 | | | | Morgan Stanley | | | 4.000 | | | | 07/23/25 | | | | 154,595 | |
200,000 | | | | Morgan Stanley | | | 3.950 | | | | 04/23/27 | | | | 194,199 | |
250,000 | | | | Morgan Stanley | | | 6.375 | | | | 07/24/42 | | | | 308,923 | |
200,000 | | g | | Nacional Financiera SNC | | | 3.375 | | | | 11/05/20 | | | | 198,075 | |
50,000 | | | | National Rural Utilities Cooperative Finance Corp | | | 10.375 | | | | 11/01/18 | | | | 61,007 | |
100,000 | | g | | SUAM Finance BV | | | 4.875 | | | | 04/17/24 | | | | 101,500 | |
150,000 | | g | | UBS Group Funding Jersey Ltd | | | 2.950 | | | | 09/24/20 | | | | 148,616 | |
100,000 | | | | Unilever Capital Corp | | | 3.100 | | | | 07/30/25 | | | | 101,414 | |
150,000 | | | | Wells Fargo & Co | | | 2.550 | | | | 12/07/20 | | | | 149,248 | |
150,000 | | | | Wells Fargo & Co | | | 3.900 | | | | 05/01/45 | | | | 138,301 | |
| | | | | | | | | | | | | | | | |
| | | | TOTAL DIVERSIFIED FINANCIALS | | | | 10,705,449 | |
| | | | | | | | | | | | | | | | |
| | | |
ENERGY - 3.5% | | | | | | | | | | | | |
50,000 | | | | Anadarko Petroleum Corp | | | 5.950 | | | | 09/15/16 | | | | 51,379 | |
30,000 | | | | Anadarko Petroleum Corp | | | 6.950 | | | | 06/15/19 | | | | 32,772 | |
50,000 | | | | Apache Corp | | | 4.750 | | | | 04/15/43 | | | | 42,954 | |
25,000 | | | | Apache Corp | | | 4.250 | | | | 01/15/44 | | | | 20,008 | |
255,000 | | | | Ashland, Inc | | | 3.875 | | | | 04/15/18 | | | | 260,100 | |
250,000 | | | | BP Capital Markets plc | | | 1.375 | | | | 05/10/18 | | | | 246,433 | |
300,000 | | | | BP Capital Markets plc | | | 2.315 | | | | 02/13/20 | | | | 295,692 | |
12,000 | | | | California Resources Corp | | | 5.000 | | | | 01/15/20 | | | | 4,275 | |
30,000 | | g | | California Resources Corp | | | 8.000 | | | | 12/15/22 | | | | 15,787 | |
165,000 | | | | Calumet Specialty Products Partners LP | | | 6.500 | | | | 04/15/21 | | | | 143,550 | |
325,000 | | | | Chevron Corp | | | 2.419 | | | | 11/17/20 | | | | 323,384 | |
192,000 | | | | Cimarex Energy Co | | | 4.375 | | | | 06/01/24 | | | | 170,404 | |
150,000 | | | | Concho Resources, Inc | | | 5.500 | | | | 04/01/23 | | | | 138,750 | |
50,000 | | | | Continental Resources, Inc | | | 5.000 | | | | 09/15/22 | | | | 36,875 | |
200,000 | | | | Ecopetrol S.A. | | | 5.375 | | | | 06/26/26 | | | | 170,500 | |
25,000 | | | | Enbridge Energy Partners LP | | | 5.200 | | | | 03/15/20 | | | | 25,330 | |
100,000 | | | | Enbridge Energy Partners LP | | | 4.375 | | | | 10/15/20 | | | | 97,590 | |
150,000 | | | | Enbridge Energy Partners LP | | | 5.875 | | | | 10/15/25 | | | | 144,582 | |
75,000 | | | | EnCana Corp | | | 6.500 | | | | 02/01/38 | | | | 59,954 | |
200,000 | | | | Enterprise Products Operating LLC | | | 3.750 | | | | 02/15/25 | | | | 183,044 | |
250,000 | | | | Enterprise Products Operating LLC | | | 5.100 | | | | 02/15/45 | | | | 209,250 | |
25,000 | | | | EP Energy LLC | | | 6.375 | | | | 06/15/23 | | | | 12,500 | |
75,000 | | | | Exterran Partners LP | | | 6.000 | | | | 10/01/22 | | | | 61,125 | |
100,000 | | | | Husky Energy, Inc | | | 3.950 | | | | 04/15/22 | | | | 92,709 | |
250,000 | | g | | Indo Energy Finance II BV | | | 6.375 | | | | 01/24/23 | | | | 102,812 | |
50,000 | | | | Marathon Petroleum Corp | | | 3.500 | | | | 03/01/16 | | | | 50,141 | |
100,000 | | | | Noble Energy, Inc | | | 5.625 | | | | 05/01/21 | | | | 97,819 | |
175,000 | | | | Noble Energy, Inc | | | 5.875 | | | | 06/01/22 | | | | 166,477 | |
25,000 | | | | Noble Energy, Inc | | | 5.250 | | | | 11/15/43 | | | | 20,177 | |
100,000 | | | | Noble Holding International Ltd | | | 4.000 | | | | 03/16/18 | | | | 90,563 | |
75,000 | | | | Noble Holding International Ltd | | | 3.950 | | | | 03/15/22 | | | | 49,606 | |
200,000 | | | | ONE Gas, Inc | | | 2.070 | | | | 02/01/19 | | | | 198,901 | |
100,000 | | | | ONE Gas, Inc | | | 3.610 | | | | 02/01/24 | | | | 101,827 | |
100,000 | | i | | Petrobras Global Finance BV | | | 1.990 | | | | 05/20/16 | | | | 97,500 | |
100,000 | | i | | Petrobras Global Finance BV | | | 2.461 | | | | 01/15/19 | | | | 76,000 | |
50,000 | | | | Petrobras Global Finance BV | | | 3.000 | | | | 01/15/19 | | | | 38,000 | |
125,000 | | | | Petrobras Global Finance BV | | | 4.875 | | | | 03/17/20 | | | | 93,750 | |
50,000 | | | | Petrobras International Finance Co | | | 3.500 | | | | 02/06/17 | | | | 46,750 | |
20,000 | | | | Petroleos Mexicanos | | | 8.000 | | | | 05/03/19 | | | | 22,017 | |
100,000 | | g | | Petroleos Mexicanos | | | 3.500 | | | | 07/23/20 | | | | 94,650 | |
150,000 | | | | Petroleos Mexicanos | | | 3.500 | | | | 01/30/23 | | | | 130,875 | |
80,000 | | g | | Petroleos Mexicanos | | | 4.250 | | | | 01/15/25 | | | | 70,000 | |
40,000 | | | | Petroleos Mexicanos | | | 5.500 | | | | 06/27/44 | | | | 30,094 | |
162,500 | | g | | Petroleum Co of Trinidad & Tobago Ltd | | | 6.000 | | | | 05/08/22 | | | | 150,312 | |
45,000 | | | | Pioneer Natural Resources Co | | | 7.500 | | | | 01/15/20 | | | | 47,803 | |
150,000 | | | | Pioneer Natural Resources Co | | | 3.450 | | | | 01/15/21 | | | | 138,560 | |
89
TIAA-CREF LIFE FUNDS - Bond Fund
| | | | | | | | | | | | | | | | |
PRINCIPAL | | | | ISSUER | | RATE | | | MATURITY
DATE | | | VALUE | |
| | | | | | | | | | | | | | |
$ 125,000 | | | | Pioneer Natural Resources Co | | | 4.450 | % | | | 01/15/26 | | | $ | 112,578 | |
293,000 | | | | Plains All American Pipeline LP | | | 3.600 | | | | 11/01/24 | | | | 235,181 | |
45,000 | | | | Precision Drilling Corp | | | 6.500 | | | | 12/15/21 | | | | 34,650 | |
32,000 | | | | Questar Market Resources, Inc | | | 6.875 | | | | 03/01/21 | | | | 26,240 | |
17,000 | | | | Regency Energy Partners LP | | | 5.875 | | | | 03/01/22 | | | | 16,025 | |
250,000 | | g | | Reliance Industries Ltd | | | 4.125 | | | | 01/28/25 | | | | 244,796 | |
75,000 | | | | Shell International Finance BV | | | 2.375 | | | | 08/21/22 | | | | 71,852 | |
125,000 | | | | Southwestern Energy Co | | | 4.050 | | | | 01/23/20 | | | | 90,625 | |
100,000 | | | | Statoil ASA | | | 1.200 | | | | 01/17/18 | | | | 99,029 | |
200,000 | | | | Statoil ASA | | | 2.450 | | | | 01/17/23 | | | | 189,669 | |
125,000 | | | | Statoil ASA | | | 4.250 | | | | 11/23/41 | | | | 117,827 | |
50,000 | | | | Talisman Energy, Inc | | | 3.750 | | | | 02/01/21 | | | | 45,355 | |
50,000 | | g | | Targa Resources Partners LP | | | 5.000 | | | | 01/15/18 | | | | 46,250 | |
100,000 | | | | TransCanada PipeLines Ltd | | | 5.850 | | | | 03/15/36 | | | | 102,838 | |
55,000 | | g | | Ultra Petroleum Corp | | | 6.125 | | | | 10/01/24 | | | | 12,512 | |
50,000 | | | | Vale Overseas Ltd | | | 4.375 | | | | 01/11/22 | | | | 37,841 | |
25,000 | | | | Vale Overseas Ltd | | | 6.875 | | | | 11/21/36 | | | | 17,476 | |
| | | | | | | | | | | | | | | | |
| | | | TOTAL ENERGY | | | | 6,254,325 | |
| | | | | | | | | | | | | | | | |
| | | |
FOOD & STAPLES RETAILING - 0.8% | | | | | | | | | | | | |
400,000 | | | | CVS Health Corp | | | 2.800 | | | | 07/20/20 | | | | 401,964 | |
100,000 | | | | CVS Health Corp | | | 3.375 | | | | 08/12/24 | | | | 99,014 | |
375,000 | | | | CVS Health Corp | | | 3.875 | | | | 07/20/25 | | | | 382,780 | |
140,000 | | | | Ingles Markets, Inc | | | 5.750 | | | | 06/15/23 | | | | 139,650 | |
225,000 | | | | Walgreens Boots Alliance, Inc | | | 2.700 | | | | 11/18/19 | | | | 224,672 | |
250,000 | | | | Walgreens Boots Alliance, Inc | | | 3.800 | | | | 11/18/24 | | | | 242,732 | |
| | | | | | | | | | | | | | | | |
| | | | TOTAL FOOD & STAPLES RETAILING | | | | 1,490,812 | |
| | | | | | | | | | | | | | | | |
| | | |
FOOD, BEVERAGE & TOBACCO - 1.4% | | | | | | | | | | | | |
75,000 | | | | ConAgra Foods, Inc | | | 3.200 | | | | 01/25/23 | | | | 72,158 | |
100,000 | | | | Constellation Brands, Inc | | | 3.875 | | | | 11/15/19 | | | | 102,750 | |
200,000 | | g | | Corp Lindley S.A. | | | 4.625 | | | | 04/12/23 | | | | 197,000 | |
150,000 | | | | Diageo Capital plc | | | 2.625 | | | | 04/29/23 | | | | 145,018 | |
200,000 | | g | | Embotelladora Andina S.A. | | | 5.000 | | | | 10/01/23 | | | | 206,092 | |
150,000 | | | | Fomento Economico Mexicano SAB de C.V. | | | 2.875 | | | | 05/10/23 | | | | 140,032 | |
100,000 | | | | General Mills, Inc | | | 2.200 | | | | 10/21/19 | | | | 100,031 | |
100,000 | | | | Mead Johnson Nutrition Co | | | 3.000 | | | | 11/15/20 | | | | 100,015 | |
100,000 | | | | Mondelez International, Inc | | | 4.125 | | | | 02/09/16 | | | | 100,258 | |
300,000 | | | | Mondelez International, Inc | | | 4.000 | | | | 02/01/24 | | | | 309,448 | |
5,000 | | | | PepsiCo, Inc | | | 7.900 | | | | 11/01/18 | | | | 5,859 | |
275,000 | | | | PepsiCo, Inc | | | 2.750 | | | | 04/30/25 | | | | 266,933 | |
265,000 | | | | PepsiCo, Inc | | | 4.450 | | | | 04/14/46 | | | | 273,537 | |
32,000 | | g | | Pernod-Ricard S.A. | | | 5.750 | | | | 04/07/21 | | | | 35,331 | |
175,000 | | g | | Pernod-Ricard S.A. | | | 4.250 | | | | 07/15/22 | | | | 179,763 | |
175,000 | | | | Philip Morris International, Inc | | | 3.375 | | | | 08/11/25 | | | | 177,122 | |
75,000 | | | | Tyson Foods, Inc | | | 3.950 | | | | 08/15/24 | | | | 77,010 | |
100,000 | | | | Tyson Foods, Inc | | | 4.875 | | | | 08/15/34 | | | | 101,994 | |
| | | | | | | | | | | | | | | | |
| | | | TOTAL FOOD, BEVERAGE & TOBACCO | | | | 2,590,351 | |
| | | | | | | | | | | | | | | | |
| | | |
HEALTH CARE EQUIPMENT & SERVICES - 1.5% | | | | | | | | | | | | |
50,000 | | | | Becton Dickinson & Co | | | 1.750 | | | | 11/08/16 | | | | 50,254 | |
100,000 | | | | Becton Dickinson & Co | | | 3.734 | | | | 12/15/24 | | | | 100,918 | |
125,000 | | | | Becton Dickinson & Co | | | 4.685 | | | | 12/15/44 | | | | 126,106 | |
100,000 | | | | CHS/Community Health Systems | | | 6.875 | | | | 02/01/22 | | | | 94,875 | |
100,000 | | | | Covidien International Finance S.A. | | | 3.200 | | | | 06/15/22 | | | | 100,251 | |
100,000 | | | | Express Scripts Holding Co | | | 3.900 | | | | 02/15/22 | | | | 102,760 | |
130,000 | | g | | Fresenius Medical Care Capital Trust | | | 5.750 | | | | 02/15/21 | | | | 139,100 | |
40,000 | | | | HCA, Inc | | | 6.500 | | | | 02/15/20 | | | | 43,580 | |
150,000 | | | | HCA, Inc | | | 5.875 | | | | 03/15/22 | | | | 158,250 | |
125,000 | | | | Keysight Technologies, Inc | | | 4.550 | | | | 10/30/24 | | | | 120,179 | |
100,000 | | | | Laboratory Corp of America Holdings | | | 2.625 | | | | 02/01/20 | | | | 98,766 | |
100,000 | | | | Laboratory Corp of America Holdings | | | 3.600 | | | | 02/01/25 | | | | 96,502 | |
200,000 | | | | Medtronic, Inc | | | 3.500 | | | | 03/15/25 | | | | 202,368 | |
90
TIAA-CREF LIFE FUNDS - Bond Fund
| | | | | | | | | | | | | | | | |
PRINCIPAL | | | | ISSUER | | RATE | | | MATURITY
DATE | | | VALUE | |
| | | | | | | | | | | | | | |
$ 200,000 | | | | Medtronic, Inc | | | 4.625 | % | | | 03/15/45 | | | $ | 206,205 | |
200,000 | | | | Quest Diagnostics, Inc | | | 3.500 | | | | 03/30/25 | | | | 193,241 | |
75,000 | | | | Thermo Fisher Scientific, Inc | | | 2.250 | | | | 08/15/16 | | | | 75,412 | |
100,000 | | | | Thermo Fisher Scientific, Inc | | | 2.400 | | | | 02/01/19 | | | | 99,983 | |
100,000 | | | | Thermo Fisher Scientific, Inc | | | 3.300 | | | | 02/15/22 | | | | 99,812 | |
125,000 | | | | Thermo Fisher Scientific, Inc | | | 3.150 | | | | 01/15/23 | | | | 121,742 | |
250,000 | | | | Zimmer Holdings, Inc | | | 2.700 | | | | 04/01/20 | | | | 246,948 | |
275,000 | | | | Zimmer Holdings, Inc | | | 3.550 | | | | 04/01/25 | | | | 267,369 | |
| | | | | | | | | | | | | | | | |
| | | | TOTAL HEALTH CARE EQUIPMENT & SERVICES | | | | 2,744,621 | |
| | | | | | | | | | | | | | | | |
| | | |
HOUSEHOLD & PERSONAL PRODUCTS - 0.1% | | | | | | | | | | | | |
200,000 | | | | Colgate-Palmolive Co | | | 4.000 | | | | 08/15/45 | | | | 200,443 | |
| | | | | | | | | | | | | | | | |
| | | | TOTAL HOUSEHOLD & PERSONAL PRODUCTS | | | | 200,443 | |
| | | | | | | | | | | | | | | | |
| | | |
INSURANCE - 2.4% | | | | | | | | | | | | |
125,000 | | | | Aetna, Inc | | | 1.500 | | | | 11/15/17 | | | | 124,526 | |
100,000 | | | | Allstate Corp | | | 3.150 | | | | 06/15/23 | | | | 99,980 | |
100,000 | | | | Allstate Corp | | | 4.500 | | | | 06/15/43 | | | | 101,596 | |
200,000 | | | | American International Group, Inc | | | 2.300 | | | | 07/16/19 | | | | 198,328 | |
200,000 | | | | Children’s Hospital Medic | | | 4.268 | | | | 05/15/44 | | | | 195,612 | |
100,000 | | | | Chubb Corp | | | 6.000 | | | | 05/11/37 | | | | 122,593 | |
20,000 | | | | Cigna Corp | | | 5.125 | | | | 06/15/20 | | | | 21,832 | |
100,000 | | | | Cigna Corp | | | 4.500 | | | | 03/15/21 | | | | 106,148 | |
125,000 | | | | Cigna Corp | | | 3.250 | | | | 04/15/25 | | | | 122,761 | |
100,000 | | g | | Five Corners Funding Trust | | | 4.419 | | | | 11/15/23 | | | | 104,410 | |
25,000 | | | | Lincoln National Corp | | | 7.000 | | | | 06/15/40 | | | | 31,356 | |
350,000 | | g,i | | Merna Reinsurance IV Ltd | | | 2.663 | | | | 04/08/16 | | | | 349,895 | |
300,000 | | | | MetLife, Inc | | | 4.368 | | | | 09/15/23 | | | | 322,209 | |
225,000 | | | | MetLife, Inc | | | 3.000 | | | | 03/01/25 | | | | 216,375 | |
150,000 | | i | | MetLife, Inc | | | 5.250 | | | | 12/30/49 | | | | 152,625 | |
100,000 | | | | Principal Financial Group, Inc | | | 1.850 | | | | 11/15/17 | | | | 100,081 | |
150,000 | | | | Progressive Corp | | | 3.750 | | | | 08/23/21 | | | | 158,608 | |
175,000 | | | | Prudential Financial, Inc | | | 5.400 | | | | 06/13/35 | | | | 190,382 | |
100,000 | | | | Prudential Financial, Inc | | | 5.100 | | | | 08/15/43 | | | | 104,185 | |
325,000 | | i | | Prudential Financial, Inc | | | 5.375 | | | | 05/15/45 | | | | 324,594 | |
100,000 | | g | | Prudential Funding LLC | | | 6.750 | | | | 09/15/23 | | | | 118,036 | |
100,000 | | g | | Swiss Re Treasury US Corp | | | 2.875 | | | | 12/06/22 | | | | 96,635 | |
125,000 | | g | | Swiss Re Treasury US Corp | | | 4.250 | | | | 12/06/42 | | | | 117,970 | |
25,000 | | | | Travelers Cos, Inc | | | 5.800 | | | | 05/15/18 | | | | 27,305 | |
150,000 | | | | UnitedHealth Group, Inc | | | 3.750 | | | | 07/15/25 | | | | 154,773 | |
275,000 | | | | UnitedHealth Group, Inc | | | 4.750 | | | | 07/15/45 | | | | 289,387 | |
250,000 | | | | WellPoint, Inc | | | 3.125 | | | | 05/15/22 | | | | 245,462 | |
150,000 | | | | WellPoint, Inc | | | 4.625 | | | | 05/15/42 | | | | 141,643 | |
25,000 | | | | WR Berkley Corp | | | 5.375 | | | | 09/15/20 | | | | 27,478 | |
| | | | | | | | | | | | | | | | |
| | | | TOTAL INSURANCE | | | | 4,366,785 | |
| | | | | | | | | | | | | | | | |
| | | |
MATERIALS - 2.4% | | | | | | | | | | | | |
35,000 | | | | Air Products & Chemicals, Inc | | | 4.375 | | | | 08/21/19 | | | | 37,397 | |
52,000 | | | | Barrick Gold Corp | | | 4.100 | | | | 05/01/23 | | | | 44,612 | |
25,000 | | g | | Berry Plastics Corp | | | 6.000 | | | | 10/15/22 | | | | 25,437 | |
50,000 | | g | | Blue Cube Spinco, Inc | | | 9.750 | | | | 10/15/23 | | | | 53,937 | |
50,000 | | g | | Blue Cube Spinco, Inc | | | 10.000 | | | | 10/15/25 | | | | 55,000 | |
200,000 | | | | Celulosa Arauco y Constitucion S.A. | | | 4.500 | | | | 08/01/24 | | | | 198,073 | |
100,000 | | | | Corning, Inc | | | 1.450 | | | | 11/15/17 | | | | 99,143 | |
200,000 | | g | | Corp Nacional del Cobre de Chile-CODELCO | | | 4.500 | | | | 09/16/25 | | | | 188,335 | |
105,000 | | | | Crown Americas LLC | | | 4.500 | | | | 01/15/23 | | | | 102,637 | |
100,000 | | | | Eastman Chemical Co | | | 3.800 | | | | 03/15/25 | | | | 96,902 | |
75,000 | | | | Fibria Overseas Finance Ltd | | | 5.250 | | | | 05/12/24 | | | | 71,250 | |
200,000 | | g | | Georgia-Pacific LLC | | | 2.539 | | | | 11/15/19 | | | | 198,916 | |
930,000 | | g | | Glencore Funding LLC | | | 2.125 | | | | 04/16/18 | | | | 826,442 | |
125,000 | | g | | Glencore Funding LLC | | | 4.625 | | | | 04/29/24 | | | | 90,525 | |
150,000 | | g | | Glencore Funding LLC | | | 4.000 | | | | 04/16/25 | | | | 104,250 | |
50,000 | | | | Hexion US Finance Corp | | | 8.875 | | | | 02/01/18 | | | | 35,250 | |
91
TIAA-CREF LIFE FUNDS - Bond Fund
| | | | | | | | | | | | | | | | |
PRINCIPAL | | | | ISSUER | | RATE | | | MATURITY
DATE | | | VALUE | |
| | | | | | | | | | | | | | |
$ 50,000 | | | | Hexion US Finance Corp | | | 6.625 | % | | | 04/15/20 | | | $ | 39,125 | |
598,000 | | | | International Paper Co | | | 4.750 | | | | 02/15/22 | | | | 638,841 | |
200,000 | | g | | Klabin Finance S.A. | | | 5.250 | | | | 07/16/24 | | | | 178,000 | |
150,000 | | | | LyondellBasell Industries NV | | | 4.625 | | | | 02/26/55 | | | | 121,643 | |
125,000 | | | | Nucor Corp | | | 4.000 | | | | 08/01/23 | | | | 121,243 | |
200,000 | | g | | OCP S.A. | | | 4.500 | | | | 10/22/25 | | | | 186,026 | |
80,000 | | g | | Owens-Brockway Glass Container, Inc | | | 5.875 | | | | 08/15/23 | | | | 81,200 | |
150,000 | | | | Packaging Corp of America | | | 3.650 | | | | 09/15/24 | | | | 145,844 | |
85,000 | | | | Rio Tinto Finance USA plc | | | 2.250 | | | | 12/14/18 | | | | 82,882 | |
70,000 | | g | | Sealed Air Corp | | | 5.250 | | | | 04/01/23 | | | | 71,400 | |
25,000 | | | | Steel Dynamics, Inc | | | 5.125 | | | | 10/01/21 | | | | 23,125 | |
100,000 | | | | Teck Resources Ltd | | | 2.500 | | | | 02/01/18 | | | | 76,000 | |
100,000 | | | | Teck Resources Ltd | | | 3.750 | | | | 02/01/23 | | | | 46,250 | |
225,000 | | g | | Union Andina de Cementos SAA | | | 5.875 | | | | 10/30/21 | | | | 217,125 | |
45,000 | | g | | Univar, Inc | | | 6.750 | | | | 07/15/23 | | | | 41,063 | |
| | | | | | | | | | | | | | | | |
| | | | TOTAL MATERIALS | | | | 4,297,873 | |
| | | | | | | | | | | | | | | | |
| | | |
MEDIA - 2.7% | | | | | | | | | | | | |
100,000 | | | | AMC Entertainment, Inc | | | 5.875 | | | | 02/15/22 | | | | 101,500 | |
150,000 | | | | CBS Corp | | | 2.300 | | | | 08/15/19 | | | | 148,347 | |
125,000 | | | | CBS Corp | | | 4.000 | | | | 01/15/26 | | | | 121,962 | |
50,000 | | | | CBS Corp | | | 4.600 | | | | 01/15/45 | | | | 42,898 | |
250,000 | | g | | CCO Safari II LLC | | | 3.579 | | | | 07/23/20 | | | | 248,568 | |
325,000 | | g | | CCO Safari II LLC | | | 4.908 | | | | 07/23/25 | | | | 324,681 | |
100,000 | | | | Cinemark USA, Inc | | | 4.875 | | | | 06/01/23 | | | | 97,500 | |
475,000 | | | | Comcast Corp | | | 4.250 | | | | 01/15/33 | | | | 466,735 | |
150,000 | | | | Comcast Corp | | | 4.600 | | | | 08/15/45 | | | | 151,864 | |
175,000 | | | | DIRECTV Holdings LLC | | | 4.450 | | | | 04/01/24 | | | | 179,756 | |
15,000 | | g | | Gannett Co, Inc | | | 4.875 | | | | 09/15/21 | | | | 15,038 | |
80,000 | | g | | Gannett Co, Inc | | | 5.500 | | | | 09/15/24 | | | | 80,000 | |
200,000 | | | | Grupo Televisa SAB | | | 4.625 | | | | 01/30/26 | | | | 197,610 | |
200,000 | | | | Grupo Televisa SAB | | | 5.000 | | | | 05/13/45 | | | | 171,835 | |
100,000 | | | | Lamar Media Corp | | | 5.875 | | | | 02/01/22 | | | | 105,000 | |
100,000 | | g | | NBC Universal Enterprise, Inc | | | 1.662 | | | | 04/15/18 | | | | 100,024 | |
125,000 | | g | | NBC Universal Enterprise, Inc | | | 1.974 | | | | 04/15/19 | | | | 124,942 | |
50,000 | | g | | Nielsen Finance LLC | | | 5.000 | | | | 04/15/22 | | | | 49,375 | |
120,000 | | g | | Numericable Group S.A. | | | 6.000 | | | | 05/15/22 | | | | 116,400 | |
200,000 | | | | Outfront Media Capital LLC | | | 5.250 | | | | 02/15/22 | | | | 204,500 | |
200,000 | | | | Scripps Networks Interactive, Inc | | | 2.800 | | | | 06/15/20 | | | | 195,118 | |
175,000 | | g | | Sky plc | | | 2.625 | | | | 09/16/19 | | | | 174,257 | |
200,000 | | | | Time Warner Cable, Inc | | | 4.000 | | | | 09/01/21 | | | | 201,942 | |
75,000 | | | | Time Warner Cable, Inc | | | 5.875 | | | | 11/15/40 | | | | 71,060 | |
450,000 | | | | Time Warner, Inc | | | 2.100 | | | | 06/01/19 | | | | 447,591 | |
50,000 | | | | Time Warner, Inc | | | 6.500 | | | | 11/15/36 | | | | 56,608 | |
150,000 | | | | Time Warner, Inc | | | 4.650 | | | | 06/01/44 | | | | 137,586 | |
104,000 | | g | | Time, Inc | | | 5.750 | | | | 04/15/22 | | | | 95,160 | |
200,000 | | g | | Univision Communications, Inc | | | 5.125 | | | | 05/15/23 | | | | 192,500 | |
115,000 | | | | Viacom, Inc | | | 2.500 | | | | 12/15/16 | | | | 115,241 | |
125,000 | | | | Viacom, Inc | | | 5.850 | | | | 09/01/43 | | | | 112,173 | |
| | | | | | | | | | | | | | | | |
| | | | TOTAL MEDIA | | | | 4,847,771 | |
| | | | | | | | | | | | | | | | |
| | | |
PHARMACEUTICALS, BIOTECHNOLOGY & LIFE SCIENCES - 1.7% | | | | | | | | | | | | |
425,000 | | | | AbbVie, Inc | | | 2.500 | | | | 05/14/20 | | | | 420,798 | |
175,000 | | | | Actavis Funding SCS | | | 3.000 | | | | 03/12/20 | | | | 174,861 | |
150,000 | | | | Actavis Funding SCS | | | 3.800 | | | | 03/15/25 | | | | 149,248 | |
150,000 | | | | Amgen, Inc | | | 4.400 | | | | 05/01/45 | | | | 138,879 | |
150,000 | | | | Biogen, Inc | | | 2.900 | | | | 09/15/20 | | | | 149,671 | |
175,000 | | | | Celgene Corp | | | 2.875 | | | | 08/15/20 | | | | 173,749 | |
250,000 | | | | Celgene Corp | | | 3.875 | | | | 08/15/25 | | | | 249,206 | |
125,000 | | | | Gilead Sciences, Inc | | | 3.500 | | | | 02/01/25 | | | | 126,054 | |
250,000 | | | | Gilead Sciences, Inc | | | 3.650 | | | | 03/01/26 | | | | 252,222 | |
100,000 | | g | | Mylan NV | | | 3.750 | | | | 12/15/20 | | | | 100,108 | |
75,000 | | | | Mylan, Inc | | | 2.550 | | | | 03/28/19 | | | | 74,020 | |
375,000 | | | | Novartis Capital Corp | | | 3.000 | | | | 11/20/25 | | | | 369,673 | |
92
TIAA-CREF LIFE FUNDS - Bond Fund
| | | | | | | | | | | | | | | | |
PRINCIPAL | | | | ISSUER | | RATE | | | MATURITY
DATE | | | VALUE | |
| | | | | | | | | | | | | | |
$ 250,000 | | | | Novartis Capital Corp | | | 4.000 | % | | | 11/20/45 | | | $ | 244,635 | |
100,000 | | | | Perrigo Co plc | | | 4.000 | | | | 11/15/23 | | | | 97,849 | |
100,000 | | | | Perrigo Finance plc | | | 4.900 | | | | 12/15/44 | | | | 90,245 | |
100,000 | | | | Zoetis, Inc | | | 3.450 | | | | 11/13/20 | | | | 100,120 | |
100,000 | | | | Zoetis, Inc | | | 4.500 | | | | 11/13/25 | | | | 101,407 | |
| | | | | | | | | | | | | | | | |
| | | | TOTAL PHARMACEUTICALS, BIOTECHNOLOGY & LIFE SCIENCES | | | | 3,012,745 | |
| | | | | | | | | | | | | | | | |
| | | |
REAL ESTATE - 2.1% | | | | | | | | | | | | |
150,000 | | | | Brandywine Operating Partnership LP | | | 4.100 | | | | 10/01/24 | | | | 145,038 | |
100,000 | | | | Brixmor Operating Partnership LP | | | 3.875 | | | | 08/15/22 | | | | 99,552 | |
200,000 | | | | Brixmor Operating Partnership LP | | | 3.850 | | | | 02/01/25 | | | | 194,472 | |
35,000 | | | | Camden Property Trust | | | 4.625 | | | | 06/15/21 | | | | 37,273 | |
100,000 | | | | Camden Property Trust | | | 2.950 | | | | 12/15/22 | | | | 95,979 | |
100,000 | | | | DCT Industrial Operating Partnership LP | | | 4.500 | | | | 10/15/23 | | | | 100,072 | |
100,000 | | | | DDR Corp | | | 3.625 | | | | 02/01/25 | | | | 94,413 | |
75,000 | | | | DDR Corp | | | 4.250 | | | | 02/01/26 | | | | 73,167 | |
100,000 | | | | Developers Diversified Realty Corp | | | 4.750 | | | | 04/15/18 | | | | 104,623 | |
40,000 | | | | Developers Diversified Realty Corp | | | 7.875 | | | | 09/01/20 | | | | 47,872 | |
100,000 | | | | Equinix, Inc | | | 4.875 | | | | 04/01/20 | | | | 103,950 | |
100,000 | | | | Equity One, Inc | | | 3.750 | | | | 11/15/22 | | | | 96,571 | |
75,000 | | | | Essex Portfolio LP | | | 3.375 | | | | 01/15/23 | | | | 73,588 | |
25,000 | | | | Healthcare Realty Trust, Inc | | | 5.750 | | | | 01/15/21 | | | | 27,579 | |
100,000 | | | | Healthcare Realty Trust, Inc | | | 3.750 | | | | 04/15/23 | | | | 97,884 | |
175,000 | | | | Healthcare Realty Trust, Inc | | | 3.875 | | | | 05/01/25 | | | | 169,411 | |
100,000 | | | | Healthcare Trust of America Holdings LP | | | 3.700 | | | | 04/15/23 | | | | 96,977 | |
100,000 | | | | Host Hotels & Resorts LP | | | 4.500 | | | | 02/01/26 | | | | 98,728 | |
225,000 | | | | Kilroy Realty LP | | | 3.800 | | | | 01/15/23 | | | | 223,038 | |
100,000 | | | | Kilroy Realty LP | | | 4.375 | | | | 10/01/25 | | | | 101,304 | |
100,000 | | | | Kimco Realty Corp | | | 3.400 | | | | 11/01/22 | | | | 99,115 | |
100,000 | | | | Mid-America Apartments LP | | | 4.300 | | | | 10/15/23 | | | | 102,525 | |
125,000 | | | | Mid-America Apartments LP | | | 3.750 | | | | 06/15/24 | | | | 122,503 | |
50,000 | | | | National Retail Properties, Inc | | | 3.800 | | | | 10/15/22 | | | | 50,167 | |
100,000 | | | | National Retail Properties, Inc | | | 3.300 | | | | 04/15/23 | | | | 96,278 | |
100,000 | | | | National Retail Properties, Inc | | | 4.000 | | | | 11/15/25 | | | | 98,251 | |
150,000 | | | | Regency Centers LP | | | 3.900 | | | | 11/01/25 | | | | 149,706 | |
40,000 | | | | Simon Property Group LP | | | 10.350 | | | | 04/01/19 | | | | 49,087 | |
200,000 | | g | | Trust F | | | 5.250 | | | | 01/30/26 | | | | 194,500 | |
100,000 | | | | Ventas Realty LP | | | 4.125 | | | | 01/15/26 | | | | 99,682 | |
50,000 | | | | Weingarten Realty Investors | | | 3.375 | | | | 10/15/22 | | | | 48,799 | |
100,000 | | | | Weingarten Realty Investors | | | 3.500 | | | | 04/15/23 | | | | 97,227 | |
100,000 | | | | Weingarten Realty Investors | | | 4.450 | | | | 01/15/24 | | | | 102,533 | |
100,000 | | | | Weingarten Realty Investors | | | 3.850 | | | | 06/01/25 | | | | 97,062 | |
325,000 | | | | Welltower, Inc | | | 4.000 | | | | 06/01/25 | | | | 319,744 | |
| | | | | | | | | | | | | | | | |
| | | | TOTAL REAL ESTATE | | | | 3,808,670 | |
| | | | | | | | | | | | | | | | |
| | | |
RETAILING - 1.5% | | | | | | | | | | | | |
100,000 | | g | | Argos Merger Sub, Inc | | | 7.125 | | | | 03/15/23 | | | | 99,150 | |
25,000 | | g | | Asbury Automotive Group, Inc | | | 6.000 | | | | 12/15/24 | | | | 25,812 | |
100,000 | | | | AutoNation, Inc | | | 3.350 | | | | 01/15/21 | | | | 99,652 | |
300,000 | | | | AutoZone, Inc | | | 2.500 | | | | 04/15/21 | | | | 292,838 | |
100,000 | | | | AutoZone, Inc | | | 3.250 | | | | 04/15/25 | | | | 96,769 | |
15,000 | | g | | Family Tree Escrow LLC | | | 5.750 | | | | 03/01/23 | | | | 15,638 | |
150,000 | | | | Home Depot, Inc | | | 3.350 | | | | 09/15/25 | | | | 153,371 | |
75,000 | | g | | L Brands, Inc | | | 6.875 | | | | 11/01/35 | | | | 77,063 | |
132,000 | | | | Limited Brands, Inc | | | 6.625 | | | | 04/01/21 | | | | 146,190 | |
250,000 | | | | Macy’s Retail Holdings, Inc | | | 3.450 | | | | 01/15/21 | | | | 248,655 | |
70,000 | | | | Men’s Wearhouse, Inc | | | 7.000 | | | | 07/01/22 | | | | 49,700 | |
35,000 | | | | O’Reilly Automotive, Inc | | | 4.625 | | | | 09/15/21 | | | | 37,305 | |
725,000 | | | | O’Reilly Automotive, Inc | | | 3.800 | | | | 09/01/22 | | | | 734,220 | |
100,000 | | | | QVC, Inc | | | 5.125 | | | | 07/02/22 | | | | 99,688 | |
125,000 | | g | | Rolls-Royce plc | | | 2.375 | | | | 10/14/20 | | | | 122,222 | |
100,000 | | g | | Rolls-Royce plc | | | 3.625 | | | | 10/14/25 | | | | 97,994 | |
100,000 | | | | Sally Holdings LLC | | | 5.750 | | | | 06/01/22 | | | | 103,500 | |
93
TIAA-CREF LIFE FUNDS - Bond Fund
| | | | | | | | | | | | | | | | |
PRINCIPAL | | | | ISSUER | | RATE | | | MATURITY
DATE | | | VALUE | |
| | | | | | | | | | | | | | |
$ 100,000 | | | | Tiffany & Co | | | 3.800 | % | | | 10/01/24 | | | $ | 98,600 | |
| | | | | | | | | | | | | | | | |
| | | | TOTAL RETAILING | | | | 2,598,367 | |
| | | | | | | | | | | | | | | | |
| | | |
SEMICONDUCTORS & SEMICONDUCTOR EQUIPMENT - 0.2% | | | | | | | | | | | | |
250,000 | | | | Intel Corp | | | 3.700 | | | | 07/29/25 | | | | 258,631 | |
| | | | | | | | | | | | | | | | |
| | | | TOTAL SEMICONDUCTORS & SEMICONDUCTOR EQUIPMENT | | | | 258,631 | |
| | | | | | | | | | | | | | | | |
| | | |
SOFTWARE & SERVICES - 1.2% | | | | | | | | | | | | |
200,000 | | | | Baidu, Inc | | | 3.000 | | | | 06/30/20 | | | | 197,783 | |
1,170,000 | | | | Fidelity National Information Services, Inc | | | 5.000 | | | | 03/15/22 | | | | 1,216,065 | |
100,000 | | | | NCR Corp | | | 5.875 | | | | 12/15/21 | | | | 98,500 | |
50,000 | | g | | Open Text Corp | | | 5.625 | | | | 01/15/23 | | | | 49,500 | |
375,000 | | | | Oracle Corp | | | 2.500 | | | | 05/15/22 | | | | 368,295 | |
150,000 | | | | Oracle Corp | | | 4.125 | | | | 05/15/45 | | | | 141,967 | |
25,000 | | g | | SS&C Technologies Holdings, Inc | | | 5.875 | | | | 07/15/23 | | | | 25,812 | |
| | | | | | | | | | | | | | | | |
| | | | TOTAL SOFTWARE & SERVICES | | | | 2,097,922 | |
| | | | | | | | | | | | | | | | |
| | | |
TECHNOLOGY HARDWARE & EQUIPMENT - 0.6% | | | | | | | | | | | | |
200,000 | | | | Amphenol Corp | | | 3.125 | | | | 09/15/21 | | | | 197,856 | |
100,000 | | | | CC Holdings GS V LLC | | | 2.381 | | | | 12/15/17 | | | | 100,108 | |
75,000 | | g | | CommScope, Inc | | | 5.000 | | | | 06/15/21 | | | | 71,906 | |
75,000 | | g | | CommScope, Inc | | | 5.500 | | | | 06/15/24 | | | | 71,250 | |
17,000 | | | | Hewlett-Packard Co | | | 3.750 | | | | 12/01/20 | | | | 16,872 | |
65,000 | | g | | International Game Technology | | | 5.625 | | | | 02/15/20 | | | | 64,025 | |
150,000 | | g | | NXP BV | | | 3.750 | | | | 06/01/18 | | | | 150,750 | |
50,000 | | g | | Seagate HDD Cayman | | | 4.875 | | | | 06/01/27 | | | | 38,391 | |
100,000 | | | | Tyco Electronics Group S.A. | | | 2.375 | | | | 12/17/18 | | | | 99,875 | |
150,000 | | | | Tyco Electronics Group S.A. | | | 3.500 | | | | 02/03/22 | | | | 152,733 | |
25,000 | | | | Zebra Technologies Corp | | | 7.250 | | | | 10/15/22 | | | | 26,125 | |
| | | | | | | | | | | | | | | | |
| | | | TOTAL TECHNOLOGY HARDWARE & EQUIPMENT | | | | 989,891 | |
| | | | | | | | | | | | | | | | |
| | | |
TELECOMMUNICATION SERVICES - 2.5% | | | | | | | | | | | | |
200,000 | | | | Alibaba Group Holding Ltd | | | 2.500 | | | | 11/28/19 | | | | 195,392 | |
50,000 | | | | American Tower Corp | | | 3.500 | | | | 01/31/23 | | | | 48,903 | |
125,000 | | | | AT&T, Inc | | | 1.400 | | | | 12/01/17 | | | | 124,428 | |
225,000 | | | | AT&T, Inc | | | 2.450 | | | | 06/30/20 | | | | 221,671 | |
150,000 | | | | AT&T, Inc | | | 2.625 | | | | 12/01/22 | | | | 142,302 | |
275,000 | | | | AT&T, Inc | | | 3.400 | | | | 05/15/25 | | | | 264,334 | |
300,000 | | | | AT&T, Inc | | | 4.500 | | | | 05/15/35 | | | | 277,487 | |
100,000 | | | | AT&T, Inc | | | 4.750 | | | | 05/15/46 | | | | 91,543 | |
200,000 | | g | | Bharti Airtel International Netherlands BV | | | 5.350 | | | | 05/20/24 | | | | 209,955 | |
100,000 | | | | Deutsche Telekom International Finance BV | | | 8.750 | | | | 06/15/30 | | | | 138,727 | |
75,000 | | g | | Deutsche Telekom International Finance BV | | | 4.875 | | | | 03/06/42 | | | | 76,377 | |
125,000 | | | | Intelsat Jackson Holdings S.A. | | | 5.500 | | | | 08/01/23 | | | | 98,125 | |
50,000 | | | | Orange S.A. | | | 5.500 | | | | 02/06/44 | | | | 53,009 | |
100,000 | | g | | SES | | | 3.600 | | | | 04/04/23 | | | | 97,412 | |
150,000 | | | | Telefonica Emisiones SAU | | | 3.992 | | | | 02/16/16 | | | | 150,413 | |
200,000 | | | | Telefonica Emisiones SAU | | | 4.570 | | | | 04/27/23 | | | | 209,808 | |
100,000 | | | | T-Mobile USA, Inc | | | 6.731 | | | | 04/28/22 | | | | 104,250 | |
50,000 | | | | T-Mobile USA, Inc | | | 6.375 | | | | 03/01/25 | | | | 50,500 | |
675,000 | | | | Verizon Communications, Inc | | | 3.450 | | | | 03/15/21 | | | | 690,912 | |
400,000 | | | | Verizon Communications, Inc | | | 4.150 | | | | 03/15/24 | | | | 411,320 | |
425,000 | | | | Verizon Communications, Inc | | | 4.400 | | | | 11/01/34 | | | | 392,118 | |
433,000 | | | | Verizon Communications, Inc | | | 4.272 | | | | 01/15/36 | | | | 390,828 | |
100,000 | | | | Windstream Corp | | | 6.375 | | | | 08/01/23 | | | | 72,000 | |
| | | | | | | | | | | | | | | | |
| | | | TOTAL TELECOMMUNICATION SERVICES | | | | 4,511,814 | |
| | | | | | | | | | | | | | | | |
| | | |
TRANSPORTATION - 2.1% | | | | | | | | | | | | |
200,000 | | g | | Adani Ports & Special Economic Zone Ltd | | | 3.500 | | | | 07/29/20 | | | | 197,125 | |
275,000 | | g | | AP Moeller-Maersk A.S. | | | 2.550 | | | | 09/22/19 | | | | 272,246 | |
250,000 | | g | | AP Moeller-Maersk A.S. | | | 3.750 | | | | 09/22/24 | | | | 242,675 | |
94
TIAA-CREF LIFE FUNDS - Bond Fund
| | | | | | | | | | | | | | | | |
PRINCIPAL | | | | ISSUER | | RATE | | | MATURITY
DATE | | | VALUE | |
| | | | | | | | | | | | | | |
$ 165,000 | | g | | Asciano Finance Ltd | | | 5.000 | % | | | 04/07/18 | | | $ | 169,899 | |
100,000 | | g | | Bombardier, Inc | | | 5.500 | | | | 09/15/18 | | | | 91,760 | |
225,000 | | | | Canadian Pacific Railway Co | | | 2.900 | | | | 02/01/25 | | | | 211,811 | |
100,000 | | | | Canadian Pacific Railway Co | | | 4.800 | | | | 08/01/45 | | | | 97,256 | |
100,000 | | g | | ERAC USA Finance LLC | | | 3.300 | | | | 10/15/22 | | | | 98,438 | |
100,000 | | g | | ERAC USA Finance LLC | | | 5.625 | | | | 03/15/42 | | | | 107,334 | |
125,000 | | | | FedEx Corp | | | 3.200 | | | | 02/01/25 | | | | 121,680 | |
100,000 | | | | FedEx Corp | | | 4.100 | | | | 02/01/45 | | | | 89,050 | |
221,000 | | | | GATX Corp | | | 1.250 | | | | 03/04/17 | | | | 218,793 | |
200,000 | | | | GATX Corp | | | 2.500 | | | | 07/30/19 | | | | 196,855 | |
125,000 | | | | GATX Corp | | | 3.250 | | | | 03/30/25 | | | | 115,577 | |
200,000 | | | | GATX Corp | | | 5.200 | | | | 03/15/44 | | | | 190,889 | |
150,000 | | | | GATX Corp | | | 4.500 | | | | 03/30/45 | | | | 128,006 | |
400,000 | | g | | Kansas City Southern | | | 2.350 | | | | 05/15/20 | | | | 386,327 | |
175,000 | | g | | Kansas City Southern | | | 4.950 | | | | 08/15/45 | | | | 171,244 | |
250,000 | | | | Norfolk Southern Corp | | | 4.450 | | | | 06/15/45 | | | | 235,405 | |
100,000 | | | | Southwest Airlines Co | | | 2.750 | | | | 11/06/19 | | | | 100,817 | |
250,000 | | g | | TTX Co | | | 3.600 | | | | 01/15/25 | | | | 247,805 | |
| | | | | | | | | | | | | | | | |
| | | | TOTAL TRANSPORTATION | | | | 3,690,992 | |
| | | | | | | | | | | | | | | | |
| | | |
UTILITIES - 3.8% | | | | | | | | | | | | |
25,000 | | i | | AES Corp | | | 3.414 | | | | 06/01/19 | | | | 22,937 | |
100,000 | | | | AES Corp | | | 7.375 | | | | 07/01/21 | | | | 102,000 | |
100,000 | | | | AES Corp | | | 4.875 | | | | 05/15/23 | | | | 87,500 | |
200,000 | | | | AGL Capital Corp | | | 3.875 | | | | 11/15/25 | | | | 201,275 | |
100,000 | | | | Alabama Power Co | | | 3.550 | | | | 12/01/23 | | | | 102,928 | |
100,000 | | | | Alabama Power Co | | | 4.150 | | | | 08/15/44 | | | | 95,035 | |
130,000 | | | | AmeriGas Partners LP | | | 6.250 | | | | 08/20/19 | | | | 124,800 | |
75,000 | | | | Atmos Energy Corp | | | 8.500 | | | | 03/15/19 | | | | 87,923 | |
200,000 | | | | Atmos Energy Corp | | | 4.125 | | | | 10/15/44 | | | | 191,514 | |
100,000 | | | | Berkshire Hathaway Energy Co | | | 3.500 | | | | 02/01/25 | | | | 99,173 | |
200,000 | | | | Black Hills Corp | | | 4.250 | | | | 11/30/23 | | | | 204,322 | |
200,000 | | | | Carolina Power & Light Co | | | 5.300 | | | | 01/15/19 | | | | 219,730 | |
100,000 | | | | CMS Energy Corp | | | 3.600 | | | | 11/15/25 | | | | 99,439 | |
25,000 | | | | Connecticut Light & Power Co | | | 5.500 | | | | 02/01/19 | | | | 27,459 | |
150,000 | | | | Consolidated Edison Co of New York, Inc | | | 4.500 | | | | 12/01/45 | | | | 151,837 | |
125,000 | | | | Dominion Gas Holdings LLC | | | 4.600 | | | | 12/15/44 | | | | 116,276 | |
15,000 | | | | Duke Energy Carolinas LLC | | | 4.300 | | | | 06/15/20 | | | | 16,237 | |
150,000 | | g,i | | Electricite de France | | | 5.625 | | | | 12/30/49 | | | | 142,650 | |
300,000 | | g | | Electricite de France S.A. | | | 2.350 | | | | 10/13/20 | | | | 295,390 | |
300,000 | | g | | Electricite de France S.A. | | | 3.625 | | | | 10/13/25 | | | | 293,426 | |
200,000 | | g | | Empresa Electrica Angamos S.A. | | | 4.875 | | | | 05/25/29 | | | | 178,415 | |
200,000 | | g | | Exelon Corp | | | 3.950 | | | | 06/15/25 | | | | 199,850 | |
150,000 | | g | | Exelon Corp | | | 5.100 | | | | 06/15/45 | | | | 149,657 | |
50,000 | | | | Ferrellgas Partners LP | | | 6.750 | | | | 01/15/22 | | | | 42,125 | |
150,000 | | g | | FirstEnergy Transmission LLC | | | 4.350 | | | | 01/15/25 | | | | 152,133 | |
50,000 | | | | Indiana Michigan Power Co | | | 7.000 | | | | 03/15/19 | | | | 56,676 | |
25,000 | | | | Integrys Energy Group, Inc | | | 4.170 | | | | 11/01/20 | | | | 26,417 | |
100,000 | | | | LG&E and KU Energy LLC | | | 3.750 | | | | 11/15/20 | | | | 103,296 | |
250,000 | | g | | Molex Electronic Technologies LLC | | | 2.878 | | | | 04/15/20 | | | | 243,585 | |
200,000 | | g | | Molex Electronic Technologies LLC | | | 3.900 | | | | 04/15/25 | | | | 187,251 | |
80,000 | | | | MPLX LP | | | 4.000 | | | | 02/15/25 | | | | 67,265 | |
50,000 | | | | NiSource Finance Corp | | | 4.800 | | | | 02/15/44 | | | | 50,783 | |
100,000 | | | | Northeast Utilities | | | 1.450 | | | | 05/01/18 | | | | 98,375 | |
100,000 | | | | NRG Energy, Inc | | | 6.250 | | | | 05/01/24 | | | | 84,020 | |
200,000 | | | | NTPC Ltd | | | 5.625 | | | | 07/14/21 | | | | 216,943 | |
125,000 | | | | Oncor Electric Delivery Co LLC | | | 2.150 | | | | 06/01/19 | | | | 123,002 | |
100,000 | | | | Oncor Electric Delivery Co LLC | | | 3.750 | | | | 04/01/45 | | | | 83,113 | |
125,000 | | | | Pacific Gas & Electric Co | | | 4.250 | | | | 03/15/46 | | | | 121,020 | |
200,000 | | g | | Perusahaan Gas Negara Persero Tbk PT | | | 5.125 | | | | 05/16/24 | | | | 191,299 | |
300,000 | | | | PPL Capital Funding, Inc | | | 4.200 | | | | 06/15/22 | | | | 312,324 | |
250,000 | | | | PPL Electric Utilities Corp | | | 3.000 | | | | 09/15/21 | | | | 253,939 | |
50,000 | | | | Progress Energy, Inc | | | 7.050 | | | | 03/15/19 | | | | 56,732 | |
80,000 | | | | Public Service Co of Colorado | | | 4.750 | | | | 08/15/41 | | | | 86,132 | |
95
TIAA-CREF LIFE FUNDS - Bond Fund
| | | | | | | | | | | | | | | | |
PRINCIPAL | | | | ISSUER | | RATE | | | MATURITY
DATE | | | VALUE | |
| | | | | | | | | | | | | | |
$ 100,000 | | | | Public Service Co of Oklahoma | | | 5.150 | % | | | 12/01/19 | | | $ | 109,366 | |
125,000 | | | | Sempra Energy | | | 2.875 | | | | 10/01/22 | | | | 121,010 | |
150,000 | | | | Southern Power Co | | | 4.150 | | | | 12/01/25 | | | | 149,821 | |
200,000 | | g | | SP PowerAssets Ltd | | | 3.250 | | | | 11/24/25 | | | | 202,102 | |
150,000 | | | | Spectra Energy Partners LP | | | 4.500 | | | | 03/15/45 | | | | 115,241 | |
100,000 | | g | | Transurban Finance Co Pty Ltd | | | 4.125 | | | | 02/02/26 | | | | 98,379 | |
55,000 | | | | Virginia Electric and Power Co | | | 2.950 | | | | 01/15/22 | | | | 55,353 | |
100,000 | | | | WEC Energy Group, Inc | | | 3.550 | | | | 06/15/25 | | | | 100,579 | |
75,000 | | | | Williams Partners LP | | | 3.600 | | | | 03/15/22 | | | | 59,013 | |
100,000 | | | | Williams Partners LP | | | 4.500 | | | | 11/15/23 | | | | 80,998 | |
75,000 | | | | Williams Partners LP | | | 4.900 | | | | 01/15/45 | | | | 47,741 | |
35,000 | | | | Xcel Energy, Inc | | | 4.800 | | | | 09/15/41 | | | | 35,162 | |
| | | | | | | | | | | | | | | | |
| | | | TOTAL UTILITIES | | | | 6,940,968 | |
| | | | | | | | | | | | | | | | |
| | | | TOTAL CORPORATE BONDS
(Cost $86,154,773) | | | | | | | | | | | 84,675,939 | |
| | | | | | | | | | | | | | | | |
| | | |
GOVERNMENT BONDS - 28.2% | | | | | | | | | | | | |
| | | |
AGENCY SECURITIES - 0.3% | | | | | | | | | | | | |
400,000 | | | | Private Export Funding Corp (PEFCO) | | | 2.250 | | | | 03/15/20 | | | | 403,007 | |
125,000 | | | | Totem Ocean Trailer Express, Inc | | | 4.514 | | | | 12/18/19 | | | | 131,202 | |
| | | | | | | | | | | | | | | | |
| | | | TOTAL AGENCY SECURITIES | | | | 534,209 | |
| | | | | | | | | | | | | | | | |
| | | |
FOREIGN GOVERNMENT BONDS - 3.7% | | | | | | | | | | | | |
200,000 | | g | | Banque Centrale de Tunisie S.A. | | | 5.750 | | | | 01/30/25 | | | | 173,094 | |
BRL 350,000 | | | | Brazil Notas do Tesouro Nacional Serie F | | | 10.000 | | | | 01/01/21 | | | | 70,422 | |
$ 100,000 | | | | Brazilian Government International Bond | | | 2.625 | | | | 01/05/23 | | | | 76,000 | |
25,000 | | | | Brazilian Government International Bond | | | 7.125 | | | | 01/20/37 | | | | 21,563 | |
150,000 | | g | | Caisse d’Amortissement de la Dette Sociale | | | 1.875 | | | | 07/28/20 | | | | 148,813 | |
250,000 | | | | Canada Government International Bond | | | 0.875 | | | | 02/14/17 | | | | 249,813 | |
200,000 | | | | Colombia Government International Bond | | | 2.625 | | | | 03/15/23 | | | | 175,700 | |
200,000 | | g | | Costa Rica Government International Bond | | | 7.158 | | | | 03/12/45 | | | | 167,500 | |
200,000 | | g | | Croatia Government International Bond | | | 6.375 | | | | 03/24/21 | | | | 212,400 | |
DOP 4,500,000 | | g | | Dominican Republic International Bond | | | 10.000 | | | | 01/05/17 | | | | 98,981 | |
$ 200,000 | | g | | Ecuador Government International Bond | | | 10.500 | | | | 03/24/20 | | | | 161,000 | |
200,000 | | g | | Egypt Government International Bond | | | 5.875 | | | | 06/11/25 | | | | 173,340 | |
100,000 | | | | European Investment Bank | | | 4.875 | | | | 02/15/36 | | | | 124,356 | |
200,000 | | | | Export-Import Bank of Korea | | | 1.750 | | | | 02/27/18 | | | | 198,004 | |
175,000 | | | | Federative Republic of Brazil | | | 6.000 | | | | 01/17/17 | | | | 179,813 | |
200,000 | | g | | Gabonese Republic | | | 6.950 | | | | 06/16/25 | | | | 159,040 | |
200,000 | | g | | Guatemala Government Bond | | | 4.875 | | | | 02/13/28 | | | | 191,500 | |
100,000 | | | | Hungary Government International Bond | | | 5.750 | | | | 11/22/23 | | | | 111,890 | |
200,000 | | g | | Indonesia Government International Bond | | | 5.950 | | | | 01/08/46 | | | | 196,915 | |
200,000 | | | | Israel Government International Bond | | | 4.500 | | | | 01/30/43 | | | | 200,500 | |
35,000 | | | | Italy Government International Bond | | | 6.875 | | | | 09/27/23 | | | | 43,005 | |
200,000 | | g | | Kazakhstan Government International Bond | | | 5.125 | | | | 07/21/25 | | | | 197,104 | |
200,000 | | g,i | | Kommunalbanken AS. | | | 0.550 | | | | 02/20/18 | | | | 199,648 | |
250,000 | | g | | Korea Housing Finance Corp | | | 1.625 | | | | 09/15/18 | | | | 246,188 | |
100,000 | | | | Mexico Government International Bond | | | 4.000 | | | | 10/02/23 | | | | 101,300 | |
200,000 | | g | | Namibia International Bonds | | | 5.250 | | | | 10/29/25 | | | | 186,000 | |
200,000 | | g | | Pakistan Government International Bond | | | 8.250 | | | | 09/30/25 | | | | 203,232 | |
200,000 | | | | Panama Government International Bond | | | 3.750 | | | | 03/16/25 | | | | 196,000 | |
275,000 | | | | Peruvian Government International Bond | | | 4.125 | | | | 08/25/27 | | | | 269,500 | |
200,000 | | | | Philippine Government International Bond | | | 4.200 | | | | 01/21/24 | | | | 216,637 | |
175,000 | | | | Poland Government International Bond | | | 4.000 | | | | 01/22/24 | | | | 184,100 | |
200,000 | | g | | Republic of Angola | | | 9.500 | | | | 11/12/25 | | | | 186,000 | |
200,000 | | g | | Russian Foreign Bond - Eurobond | | | 5.625 | | | | 04/04/42 | | | | 189,200 | |
ZAR 2,952,000 | | | | South Africa Government Bond | | | 8.250 | | | | 09/15/17 | | | | 190,268 | |
$ 200,000 | | | | South Africa Government International Bond | | | 5.375 | | | | 07/24/44 | | | | 180,000 | |
200,000 | | g | | Sri Lanka Government International Bond | | | 6.850 | | | | 11/03/25 | | | | 188,395 | |
100,000 | | | | Turkey Government International Bond | | | 5.625 | | | | 03/30/21 | | | | 105,740 | |
200,000 | | | | Turkey Government International Bond | | | 3.250 | | | | 03/23/23 | | | | 183,211 | |
125,000 | | | | Uruguay Government International Bond | | | 4.375 | | | | 10/27/27 | | | | 122,813 | |
96
TIAA-CREF LIFE FUNDS - Bond Fund
| | | | | | | | | | | | | | | | |
PRINCIPAL | | | | ISSUER | | RATE | | | MATURITY
DATE | | | VALUE | |
| | | | | | | | | | | | | | |
$ 70,000 | | | | Uruguay Government International Bond | | | 5.100 | % | | | 06/18/50 | | | $ | 60,375 | |
200,000 | | g | | Zambia Government International Bond | | | 8.970 | | | | 07/30/27 | | | | 157,740 | |
| | | | | | | | | | | | | | | | |
| | | | TOTAL FOREIGN GOVERNMENT BONDS | | | | 6,697,100 | |
| | | | | | | | | | | | | | | | |
MORTGAGE BACKED - 19.6% | | | | | | | | | | | | |
341,907 | | i | | Federal Home Loan Mortgage Corp (FHLMC) | | | 0.681 | | | | 10/15/42 | | | | 343,214 | |
3,056,356 | | h | | FHLMC | | | 3.500 | | | | 10/01/45 | | | | 3,156,466 | |
1,633 | | | | Federal Home Loan Mortgage Corp Gold (FGLMC) | | | 6.000 | | | | 03/01/33 | | | | 1,833 | |
84,809 | | | | FGLMC | | | 5.000 | | | | 11/01/33 | | | | 94,424 | |
136,250 | | | | FGLMC | | | 6.000 | | | | 11/01/33 | | | | 155,712 | |
21,506 | | | | FGLMC | | | 5.000 | | | | 05/01/34 | | | | 23,701 | |
15,186 | | | | FGLMC | | | 6.000 | | | | 09/01/34 | | | | 17,354 | |
14,759 | | | | FGLMC | | | 6.000 | | | | 04/01/35 | | | | 16,582 | |
5,323 | | | | FGLMC | | | 5.000 | | | | 02/01/36 | | | | 5,844 | |
216 | | | | FGLMC | | | 6.500 | | | | 05/01/36 | | | | 246 | |
41,223 | | | | FGLMC | | | 6.000 | | | | 08/01/37 | | | | 46,499 | |
12,675 | | | | FGLMC | | | 6.500 | | | | 09/01/37 | | | | 14,434 | |
10,052 | | | | FGLMC | | | 6.500 | | | | 11/01/37 | | | | 11,937 | |
32,583 | | | | FGLMC | | | 5.000 | | | | 04/01/38 | | | | 36,048 | |
6,234 | | | | FGLMC | | | 6.500 | | | | 05/01/38 | | | | 7,099 | |
5,689 | | | | FGLMC | | | 5.500 | | | | 01/01/39 | | | | 6,287 | |
26,220 | | | | FGLMC | | | 5.000 | | | | 07/01/39 | | | | 28,681 | |
45,582 | | | | FGLMC | | | 5.000 | | | | 01/01/40 | | | | 50,050 | |
261,157 | | | | FGLMC | | | 4.000 | | | | 08/01/44 | | | | 278,691 | |
490,592 | | | | FGLMC | | | 3.500 | | | | 04/01/45 | | | | 506,934 | |
85,241 | | | | Federal National Mortgage Association (FNMA) | | | 6.000 | | | | 08/01/21 | | | | 92,358 | |
2,311 | | | | FNMA | | | 5.500 | | | | 09/01/24 | | | | 2,573 | |
178,069 | | | | FNMA | | | 3.500 | | | | 01/01/26 | | | | 187,314 | |
1,183,686 | | | | FNMA | | | 3.000 | | | | 10/01/30 | | | | 1,220,320 | |
1,557,913 | | | | FNMA | | | 2.500 | | | | 11/01/30 | | | | 1,571,697 | |
356,421 | | | | FNMA | | | 3.500 | | | | 06/01/32 | | | | 373,161 | |
14,520 | | | | FNMA | | | 6.500 | | | | 07/01/32 | | | | 16,747 | |
355,396 | | | | FNMA | | | 5.500 | | | | 03/01/34 | | | | 400,053 | |
892,482 | | | | FNMA | | | 3.000 | | | | 01/01/35 | | | | 911,037 | |
25,960 | | | | FNMA | | | 6.500 | | | | 02/01/35 | | | | 29,667 | |
303,991 | | | | FNMA | | | 5.000 | | | | 05/01/35 | | | | 335,512 | |
7,884 | | | | FNMA | | | 7.500 | | | | 07/01/35 | | | | 7,960 | |
6,472 | | | | FNMA | | | 6.500 | | | | 09/01/36 | | | | 7,397 | |
19,979 | | | | FNMA | | | 7.000 | | | | 02/01/37 | | | | 23,105 | |
27,671 | | | | FNMA | | | 7.000 | | | | 04/01/37 | | | | 32,703 | |
4,027 | | | | FNMA | | | 6.500 | | | | 08/01/37 | | | | 4,602 | |
5,055 | | | | FNMA | | | 7.000 | | | | 11/01/37 | | | | 5,934 | |
1,165 | | | | FNMA | | | 6.500 | | | | 02/01/38 | | | | 1,331 | |
3,532 | | | | FNMA | | | 6.500 | | | | 03/01/38 | | | | 4,037 | |
93,235 | | | | FNMA | | | 6.500 | | | | 07/01/39 | | | | 106,549 | |
277,016 | | | | FNMA | | | 4.500 | | | | 09/01/39 | | | | 304,612 | |
238,195 | | | | FNMA | | | 4.500 | | | | 10/01/39 | | | | 261,930 | |
108,845 | | | | FNMA | | | 5.000 | | | | 03/01/40 | | | | 121,876 | |
1,135,775 | | | | FNMA | | | 5.500 | | | | 07/01/40 | | | | 1,279,691 | |
529,171 | | | | FNMA | | | 6.000 | | | | 10/01/40 | | | | 598,113 | |
1,555,629 | | | | FNMA | | | 4.500 | | | | 11/01/40 | | | | 1,683,368 | |
190,990 | | | | FNMA | | | 5.000 | | | | 02/01/41 | | | | 215,382 | |
194,517 | | | | FNMA | | | 5.000 | | | | 07/01/41 | | | | 215,485 | |
208,631 | | i | | FNMA | | | 0.922 | | | | 08/25/42 | | | | 210,109 | |
193,061 | | i | | FNMA | | | 0.822 | | | | 11/25/42 | | | | 192,431 | |
423,709 | | | | FNMA | | | 3.500 | | | | 11/25/42 | | | | 82,217 | |
2,682,719 | | h | | FNMA | | | 3.000 | | | | 02/01/43 | | | | 2,687,783 | |
126,637 | | i | | FNMA | | | 0.772 | | | | 03/25/43 | | | | 126,542 | |
1,445,011 | | | | FNMA | | | 3.000 | | | | 05/01/43 | | | | 1,447,403 | |
481,666 | | | | FNMA | | | 4.500 | | | | 10/01/44 | | | | 529,928 | |
949,746 | | | | FNMA | | | 4.500 | | | | 11/01/44 | | | | 1,044,756 | |
969,542 | | | | FNMA | | | 4.000 | | | | 12/01/44 | | | | 1,032,123 | |
954,239 | | | | FNMA | | | 4.000 | | | | 01/01/45 | | | | 1,021,608 | |
2,161,019 | | | | FNMA | | | 3.500 | | | | 07/01/45 | | | | 2,232,481 | |
97
TIAA-CREF LIFE FUNDS - Bond Fund
| | | | | | | | | | | | | | | | |
PRINCIPAL | | | | ISSUER | | RATE | | | MATURITY
DATE | | | VALUE | |
| | | | | | | | | | | | | | |
$ 3,066,671 | | h | | FNMA | | | 4.000 | % | | | 07/01/45 | | | $ | 3,260,479 | |
349,157 | | | | FNMA | | | 3.500 | | | | 12/01/45 | | | | 360,390 | |
8,617 | | | | Government National Mortgage Association (GNMA) | | | 5.500 | | | | 07/15/33 | | | | 9,798 | |
70,957 | | | | GNMA | | | 5.500 | | | | 07/20/33 | | | | 79,234 | |
7,914 | | | | GNMA | | | 5.000 | | | | 03/15/34 | | | | 8,676 | |
100,344 | | | | GNMA | | | 5.000 | | | | 06/15/34 | | | | 111,188 | |
48,434 | | | | GNMA | | | 5.500 | | | | 02/15/37 | | | | 54,358 | |
11,160 | | | | GNMA | | | 5.000 | | | | 04/15/38 | | | | 12,342 | |
26,296 | | | | GNMA | | | 5.500 | | | | 05/15/38 | | | | 29,266 | |
5,332 | | | | GNMA | | | 6.000 | | | | 08/15/38 | | | | 6,035 | |
6,322 | | | | GNMA | | | 6.000 | | | | 08/20/38 | | | | 7,073 | |
145,987 | | | | GNMA | | | 5.500 | | | | 07/15/39 | | | | 162,414 | |
16,506 | | | | GNMA | | | 5.000 | | | | 07/20/39 | | | | 18,235 | |
45,967 | | | | GNMA | | | 4.500 | | | | 04/15/40 | | | | 49,658 | |
740,907 | | | | GNMA | | | 3.500 | | | | 10/20/42 | | | | 147,370 | |
810,017 | | | | GNMA | | | 3.000 | | | | 02/20/43 | | | | 825,045 | |
362,195 | | | | GNMA | | | 3.500 | | | | 09/20/44 | | | | 379,746 | |
493,767 | | | | GNMA | | | 3.500 | | | | 02/15/45 | | | | 516,524 | |
228,603 | | | | GNMA | | | 4.000 | | | | 04/15/45 | | | | 243,305 | |
235,421 | | | | GNMA | | | 4.000 | | | | 04/15/45 | | | | 250,199 | |
190,729 | | | | GNMA | | | 4.000 | | | | 05/15/45 | | | | 202,746 | |
498,897 | | | | GNMA | | | 3.000 | | | | 11/20/45 | | | | 506,162 | |
498,929 | | | | GNMA | | | 3.500 | | | | 11/20/45 | | | | 520,705 | |
1,250,000 | | | | GNMA | | | 3.500 | | | | 12/20/45 | | | | 1,304,556 | |
500,000 | | | | GNMA | | | 4.000 | | | | 12/20/45 | | | | 531,686 | |
| | | | | | | | | | | | | | | | |
| | | | TOTAL MORTGAGE BACKED | | | | 35,021,121 | |
| | | | | | | | | | | | | | | | |
| | | |
MUNICIPAL BONDS - 0.5% | | | | | | | | | | | | |
100,000 | | | | State of California | | | 5.950 | | | | 04/01/16 | | | | 101,335 | |
590,000 | | | | State of Illinois | | | 3.860 | | | | 04/01/21 | | | | 584,578 | |
200,000 | | | | University of Massachusetts Building Authority | | | 0.770 | | | | 11/01/16 | | | | 200,012 | |
| | | | | | | | | | | | | | | | |
| | | | TOTAL MUNICIPAL BONDS | | | | 885,925 | |
| | | | | | | | | | | | | | | | |
| | | |
U.S. TREASURY SECURITIES - 4.1% | | | | | | | | | | | | |
1,249,000 | | | | United States Treasury Bond | | | 2.875 | | | | 08/15/45 | | | | 1,210,701 | |
4,240,000 | | | | United States Treasury Bond | | | 3.000 | | | | 11/15/45 | | | | 4,219,275 | |
1,000,000 | | | | United States Treasury Note | | | 1.625 | | | | 11/30/20 | | | | 994,333 | |
1,000,000 | | | | United States Treasury Note | | | 2.000 | | | | 11/30/22 | | | | 994,542 | |
| | | | | | | | | | | | | | | | |
| | | | TOTAL U.S. TREASURY SECURITIES | | | | 7,418,851 | |
| | | | | | | | | | | | | | | | |
| | | | TOTAL GOVERNMENT BONDS
(Cost $51,035,894) | | | | | | | | | | | 50,557,206 | |
| | | | | | | | | | | | | | | | |
| | | |
STRUCTURED ASSETS - 20.2% | | | | | | | | | | | | |
| | | |
ASSET BACKED - 5.7% | | | | | | | | | | | | |
183,446 | | i | | ACE Securities Corp Home Equity Loan Trust | | | 1.157 | | | | 08/25/35 | | | | 181,059 | |
| | | | Series - 2005 HE5 (Class M2) | | | | | | | | | | | | |
403,041 | | | | AmeriCredit Automobile Receivables Trust | | | 2.420 | | | | 05/08/18 | | | | 404,344 | |
| | | | Series - 2012 3 (Class C) | | | | | | | | | | | | |
300,000 | | | | AmeriCredit Automobile Receivables Trust | | | 1.270 | | | | 07/08/19 | | | | 298,952 | |
| | | | Series - 2014 4 (Class A3) | | | | | | | | | | | | |
200,000 | | | | AmeriCredit Automobile Receivables Trust | | | 3.340 | | | | 08/08/21 | | | | 197,925 | |
| | | | Series - 2015 3 (Class D) | | | | | | | | | | | | |
74,756 | | i | | Asset Backed Securities Corp Home Equity Loan Trust | | | 0.635 | | | | 07/25/35 | | | | 74,500 | |
| | | | Series - 2005 HE7 (Class M2) | | | | | | | | | | | | |
100,000 | | g | | Avis Budget Rental Car Funding AESOP LLC | | | 5.110 | | | | 03/20/17 | | | | 100,334 | |
| | | | Series - 2010 5A (Class B) | | | | | | | | | | | | |
200,000 | | g | | Avis Budget Rental Car Funding AESOP LLC | | | 4.740 | | | | 11/20/17 | | | | 202,577 | |
| | | | Series - 2011 3A (Class B) | | | | | | | | | | | | |
200,000 | | g | | Avis Budget Rental Car Funding AESOP LLC | | | 2.802 | | | | 05/20/18 | | | | 202,291 | |
| | | | Series - 2012 2A (Class A) | | | | | | | | | | | | |
200,000 | | g | | Avis Budget Rental Car Funding AESOP LLC | | | 3.040 | | | | 03/20/19 | | | | 199,006 | |
| | | | Series - 2012 3A (Class B) | | | | | | | | | | | | |
98
TIAA-CREF LIFE FUNDS - Bond Fund
| | | | | | | | | | | | | | | | |
PRINCIPAL | | | | ISSUER | | RATE | | | MATURITY
DATE | | | VALUE | |
| | | | | | | | | | | | | | |
$ 503 | | i | | Bear Stearns Asset Backed Securities Trust | | | 1.162 | % | | | 11/25/39 | | | $ | 502 | |
| | | | Series - 2005 SD3 (Class 2A1) | | | | | | | | | | | | |
13,694 | | | | Capital Auto Receivables Asset Trust | | | 0.790 | | | | 06/20/17 | | | | 13,690 | |
| | | | Series - 2013 1 (Class A3) | | | | | | | | | | | | |
189,723 | | g | | Capital Automotive REIT | | | 4.700 | | | | 07/15/42 | | | | 194,284 | |
| | | | Series - 2012 1A (Class A) | | | | | | | | | | | | |
1,000,000 | | g | | Capital Automotive REIT | | | 3.660 | | | | 10/15/44 | | | | 1,004,829 | |
| | | | Series - 2014 1A (Class A) | | | | | | | | | | | | |
258,615 | | g,i | | CBRE Realty Finance CDO | | | 0.623 | | | | 04/07/52 | | | | 99,567 | |
| | | | Series - 2007 1A (Class A2) | | | | | | | | | | | | |
149,197 | | i,m | | CCR, Inc | | | 0.738 | | | | 07/10/17 | | | | 147,605 | |
| | | | Series - 2010 CX (Class C) | | | | | | | | | | | | |
45,785 | | | | Centex Home Equity | | | 5.540 | | | | 01/25/32 | | | | 45,687 | |
| | | | Series - 2002 A (Class AF6) | | | | | | | | | | | | |
496,250 | | g | | DB Master Finance LLC | | | 3.262 | | | | 02/20/45 | | | | 491,036 | |
| | | | Series - 2015 1A (Class A2I) | | | | | | | | | | | | |
175,000 | | g,i | | DB/UBS Mortgage Trust | | | 5.663 | | | | 11/10/46 | | | | 192,586 | |
| | | | Series - 2011 LC1A (Class C) | | | | | | | | | | | | |
1,000,000 | | g | | Domino’s Pizza Master Issuer LLC | | | 3.484 | | | | 10/25/45 | | | | 980,000 | |
| | | | Series - 2015 1A (Class A2I) | | | | | | | | | | | | |
1,000,000 | | g | | Domino’s Pizza Master Issuer LLC | | | 4.474 | | | | 10/25/45 | | | | 986,410 | |
| | | | Series - 2015 1A (Class A2II) | | | | | | | | | | | | |
200,000 | | | | Ford Credit Auto Owner Trust | | | 2.930 | | | | 10/15/18 | | | | 201,579 | |
| | | | Series - 2012 B (Class D) | | | | | | | | | | | | |
200,000 | | | | Ford Credit Auto Owner Trust | | | 2.430 | | | | 01/15/19 | | | | 201,055 | |
| | | | Series - 2012 C (Class D) | | | | | | | | | | | | |
260,000 | | | | Ford Credit Auto Owner Trust | | | 1.860 | | | | 08/15/19 | | | | 260,283 | |
| | | | Series - 2013 A (Class D) | | | | | | | | | | | | |
66,667 | | g | | Hertz Vehicle Financing LLC | | | 3.740 | | | | 02/25/17 | | | | 66,875 | |
| | | | Series - 2010 1A (Class A2) | | | | | | | | | | | | |
132,933 | | i | | Lehman XS Trust | | | 6.500 | | | | 06/25/46 | | | | 101,039 | |
| | | | Series - 2006 13 (Class 2A1) | | | | | | | | | | | | |
129,145 | | g | | Orange Lake Timeshare Trust | | | 3.030 | | | | 07/09/29 | | | | 127,865 | |
| | | | Series - 2014 AA (Class B) | | | | | | | | | | | | |
1,694 | | i | | Residential Asset Securities Corp | | | 1.067 | | | | 04/25/35 | | | | 1,695 | |
| | | | Series - 2005 KS3 (Class M3) | | | | | | | | | | | | |
100,000 | | i | | Residential Funding Mortgage Securities II, Inc | | | 6.060 | | | | 02/25/36 | | | | 104,019 | |
| | | | Series - 2006 HI1 (Class M2) | | | | | | | | | | | | |
573,627 | | | | Santander Drive Auto Receivables Trust | | | 4.740 | | | | 09/15/17 | | | | 578,153 | |
| | | | Series - 2011 4 (Class D) | | | | | | | | | | | | |
250,000 | | | | Santander Drive Auto Receivables Trust | | | 3.870 | | | | 02/15/18 | | | | 252,708 | |
| | | | Series - 2012 2 (Class D) | | | | | | | | | | | | |
625,000 | | | | Santander Drive Auto Receivables Trust | | | 1.590 | | | | 10/15/18 | | | | 624,735 | |
| | | | Series - 2014 1 (Class B) | | | | | | | | | | | | |
21,901 | | i | | Securitized Asset Backed Receivables LLC | | | 0.722 | | | | 10/25/35 | | | | 21,771 | |
| | | | Series - 2006 OP1 (Class A2C) | | | | | | | | | | | | |
32,193 | | g | | Sierra Receivables Funding Co LLC | | | 3.350 | | | | 04/20/26 | | | | 32,217 | |
| | | | Series - 2011 1A (Class A) | | | | | | | | | | | | |
39,263 | | g | | Sierra Receivables Funding Co LLC | | | 4.250 | | | | 05/20/28 | | | | 39,483 | |
| | | | Series - 2011 2A (Class B) | | | | | | | | | | | | |
34,264 | | g | | Sierra Receivables Funding Co LLC | | | 3.420 | | | | 03/20/29 | | | | 34,516 | |
| | | | Series - 2012 2A (Class B) | | | | | | | | | | | | |
57,887 | | g | | Sierra Receivables Funding Co LLC | | | 1.590 | | | | 11/20/29 | | | | 56,924 | |
| | | | Series - 2013 1A (Class A) | | | | | | | | | | | | |
92,619 | | g | | Sierra Receivables Funding Co LLC | | | 2.390 | | | | 11/20/29 | | | | 91,803 | |
| | | | Series - 2013 1A (Class B) | | | | | | | | | | | | |
400,000 | | g | | SLM Student Loan Trust | | | 3.830 | | | | 01/17/45 | | | | 412,396 | |
| | | | Series - 2012 A (Class A2) | | | | | | | | | | | | |
192,264 | | g | | SolarCity LMC | | | 4.020 | | | | 07/20/44 | | | | 182,728 | |
| | | | Series - 2014 2 (Class A) | | | | | | | | | | | | |
7,320 | | i | | Soundview Home Equity Loan Trust | | | 0.722 | | | | 11/25/35 | | | | 7,311 | |
| | | | Series - 2005 OPT3 (Class A4) | | | | | | | | | | | | |
449,145 | | g | | SpringCastle America Funding LLC | | | 2.700 | | | | 05/25/23 | | | | 448,136 | |
| | | | Series - 2014 AA (Class A) | | | | | | | | | | | | |
99
TIAA-CREF LIFE FUNDS - Bond Fund
| | | | | | | | | | | | | | | | |
PRINCIPAL | | | | ISSUER | | RATE | | | MATURITY
DATE | | | VALUE | |
| | | | | | | | | | | | | | |
$ 56,989 | | g,i | | Structured Asset Securities Corp Mortgage Loan Trust | | | 0.642 | % | | | 10/25/36 | | | $ | 56,564 | |
| | | | Series - 2006 GEL4 (Class A2) | | | | | | | | | | | | |
200,000 | | g,i | | Vitality Re IV Ltd | | | 2.913 | | | | 01/09/17 | | | | 201,080 | |
| | | | Series - 2013 IV B (Class ) | | | | | | | | | | | | |
24,362 | | g | | Volvo Financial Equipment LLC | | | 0.740 | | | | 03/15/17 | | | | 24,350 | |
| | | | Series - 2013 1A (Class A3) | | | | | | | | | | | | |
64,273 | | g,m | | Wachovia Amortization Controlled Heloc NIM | | | 5.683 | | | | 08/12/47 | | | | 65,398 | |
| | | | Series - 2006 N1 (Class N1) | | | | | | | | | | | | |
1,764 | | i | | Wells Fargo Home Equity Trust | | | 0.562 | | | | 07/25/36 | | | | 1,762 | |
| | | | Series - 2006 2 (Class A3) | | | | | | | | | | | | |
| | | | | | | | | | | | | | | | |
| | | | TOTAL ASSET BACKED | | | | 10,213,629 | |
| | | | | | | | | | | | | | | | |
| | | |
OTHER MORTGAGE BACKED - 14.5% | | | | | | | | | | | | |
2,000,000 | | i | | Banc of America Commercial Mortgage Trust | | | 5.954 | | | | 05/10/45 | | | | 2,003,324 | |
| | | | Series - 2006 2 (Class AJ) | | | | | | | | | | | | |
200,000 | | | | Banc of America Commercial Mortgage Trust | | | 5.480 | | | | 10/10/45 | | | | 196,191 | |
| | | | Series - 2006 6 (Class B) | | | | | | | | | | | | |
200,000 | | g | | Banc of America Commercial Mortgage Trust | | | 5.416 | | | | 01/15/49 | | | | 204,629 | |
| | | | Series - 2007 1 (Class AM) | | | | | | | | | | | | |
235,000 | | i | | Banc of America Commercial Mortgage Trust | | | 5.482 | | | | 01/15/49 | | | | 240,634 | |
| | | | Series - 2007 1 (Class AMFX) | | | | | | | | | | | | |
500,000 | | g,i | | Banc of America Commercial Mortgage Trust | | | 5.821 | | | | 02/10/51 | | | | 455,395 | |
| | | | Series - 2007 4 (Class E) | | | | | | | | | | | | |
1,175,000 | | i | | Bear Stearns Commercial Mortgage Securities | | | 5.920 | | | | 09/11/42 | | | | 1,240,016 | |
| | | | Series - 2007 T28 (Class AJ) | | | | | | | | | | | | |
189,948 | | i | | CHL Mortgage Pass-Through Trust | | | 2.671 | | | | 02/20/35 | | | | 189,029 | |
| | | | Series - 2004 HYB9 (Class 1A1) | | | | | | | | | | | | |
245,616 | | i | | Citigroup Commercial Mortgage Trust | | | 5.713 | | | | 12/10/49 | | | | 248,220 | |
| | | | Series - 2007 C6 (Class ASB) | | | | | | | | | | | | |
471,141 | | g,i | | Citigroup Mortgage Loan Trust | | | 0.401 | | | | 05/25/37 | | | | 450,450 | |
| | | | Series - 2015 8 (Class 1A1) | | | | | | | | | | | | |
1,500,000 | | i | | COBALT CMBS Commercial Mortgage Trust | | | 5.771 | | | | 05/15/46 | | | | 1,510,109 | |
| | | | Series - 2007 C3 (Class AJ) | | | | | | | | | | | | |
41,618 | | i | | Commercial Mortgage Trust | | | 5.238 | | | | 04/10/37 | | | | 41,582 | |
| | | | Series - 2005 GG5 (Class AJ) | | | | | | | | | | | | |
1,190,601 | | i | | Commercial Mortgage Trust | | | 5.867 | | | | 12/10/49 | | | | 1,236,749 | |
| | | | Series - 2007 GG11 (Class AM) | | | | | | | | | | | | |
9,945 | | | | Countrywide Alternative Loan Trust | | | 5.500 | | | | 08/25/16 | | | | 10,012 | |
| | | | Series - 2004 30CB (Class 1A15) | | | | | | | | | | | | |
200,000 | | i | | Credit Suisse Commercial Mortgage Trust | | | 5.903 | | | | 09/15/39 | | | | 201,703 | |
| | | | Series - 2007 C4 (Class A1AJ) | | | | | | | | | | | | |
75,000 | | g | | Credit Suisse Commercial Mortgage Trust | | | 5.383 | | | | 02/15/40 | | | | 76,349 | |
| | | | Series - 2009 RR1 (Class A3C) | | | | | | | | | | | | |
500,000 | | i | | Credit Suisse Commercial Mortgage Trust | | | 5.625 | | | | 01/15/49 | | | | 483,966 | |
| | | | Series - 2007 C2 (Class AJ) | | | | | | | | | | | | |
4,947 | | | | Credit Suisse First Boston Mortgage Securities Corp | | | 4.771 | | | | 07/15/37 | | | | 4,944 | |
| | | | Series - 2005 C3 (Class AJ) | | | | | | | | | | | | |
9,549 | | i | | Credit Suisse First Boston Mortgage Securities Corp | | | 5.100 | | | | 08/15/38 | | | | 9,544 | |
| | | | Series - 2005 C5 (Class C) | | | | | | | | | | | | |
200,000 | | i | | GS Mortgage Securities Trust | | | 5.553 | | | | 04/10/38 | | | | 200,146 | |
| | | | Series - 2006 GG6 (Class B) | | | | | | | | | | | | |
48,529 | | i | | Harborview Mortgage Loan Trust | | | 0.622 | | | | 07/19/47 | | | | 39,548 | |
| | | | Series - 2007 4 (Class 2A1) | | | | | | | | | | | | |
370,000 | | i | | JP Morgan Chase Commercial Mortgage Securities Trust | | | 4.911 | | | | 07/15/42 | | | | 369,972 | |
| | | | Series - 2005 LDP2 (Class C) | | | | | | | | | | | | |
364,000 | | g,i | | JP Morgan Chase Commercial Mortgage Securities Trust | | | 5.544 | | | | 02/15/46 | | | | 386,197 | |
| | | | Series - 2011 C3 (Class D) | | | | | | | | | | | | |
100,000 | | g,i | | JP Morgan Chase Commercial Mortgage Securities Trust | | | 5.277 | | | | 07/15/46 | | | | 105,615 | |
| | | | Series - 2011 C4 (Class C) | | | | | | | | | | | | |
330,000 | | i | | JP Morgan Chase Commercial Mortgage Securities Trust | | | 6.192 | | | | 02/15/51 | | | | 347,214 | |
| | | | Series - 2007 LD12 (Class AM) | | | | | | | | | | | | |
200,000 | | i | | LB-UBS Commercial Mortgage Trust | | | 6.049 | | | | 06/15/38 | | | | 203,099 | |
| | | | Series - 2006 C4 (Class B) | | | | | | | | | | | | |
100
TIAA-CREF LIFE FUNDS - Bond Fund
| | | | | | | | | | | | | | | | |
PRINCIPAL | | | | ISSUER | | RATE | | | MATURITY
DATE | | | VALUE | |
| | | | | | | | | | | | | | |
$ 400,000 | | i | | LB-UBS Commercial Mortgage Trust | | | 5.533 | % | | | 02/15/40 | | | $ | 400,611 | |
| | | | Series - 2007 C1 (Class C) | | | | | | | | | | | | |
250,000 | | i | | LB-UBS Commercial Mortgage Trust | | | 5.563 | | | | 02/15/40 | | | | 244,835 | |
| | | | Series - 2007 C1 (Class D) | | | | | | | | | | | | |
1,000,000 | | i | | LB-UBS Commercial Mortgage Trust | | | 6.114 | | | | 07/15/40 | | | | 1,044,314 | |
| | | | Series - 2007 C6 (Class AM) | | | | | | | | | | | | |
453,655 | | g,i | | LVII Resecuritization Trust | | | 3.033 | | | | 07/31/47 | | | | 453,655 | |
| | | | Series - 2015 A (Class A) | | | | | | | | | | | | |
170,000 | | i | | Merrill Lynch Mortgage Trust | | | 6.267 | | | | 02/12/51 | | | | 180,332 | |
| | | | Series - 0 C1 (Class AJA) | | | | | | | | | | | | |
300,000 | | i | | ML-CFC Commercial Mortgage Trust | | | 5.526 | | | | 03/12/51 | | | | 306,315 | |
| | | | Series - 2007 6 (Class AM) | | | | | | | | | | | | |
90,000 | | g,i | | Morgan Stanley Capital I Trust | | | 5.847 | | | | 08/12/41 | | | | 91,267 | |
| | | | Series - 2006 T23 (Class B) | | | | | | | | | | | | |
1,200,000 | | i | | Morgan Stanley Capital I Trust | | | 5.389 | | | | 11/12/41 | | | | 1,203,958 | |
| | | | Series - 2006 HQ10 (Class AJ) | | | | | | | | | | | | |
256,765 | | i | | Morgan Stanley Capital I Trust | | | 5.378 | | | | 01/14/42 | | | | 255,988 | |
| | | | Series - 2005 HQ5 (Class E) | | | | | | | | | | | | |
55,000 | | i | | Morgan Stanley Capital I Trust | | | 5.832 | | | | 07/12/44 | | | | 55,472 | |
| | | | Series - 2006 HQ9 (Class B) | | | | | | | | | | | | |
100,000 | | i | | Morgan Stanley Capital I Trust | | | 5.842 | | | | 07/12/44 | | | | 99,565 | |
| | | | Series - 2006 HQ9 (Class C) | | | | | | | | | | | | |
22,000 | | g,i | | Morgan Stanley Capital I Trust | | | 5.438 | | | | 09/15/47 | | | | 23,135 | |
| | | | Series - 2011 C1 (Class D) | | | | | | | | | | | | |
400,000 | | i | | Morgan Stanley Capital I Trust | | | 5.907 | | | | 06/11/49 | | | | 398,382 | |
| | | | Series - 2007 IQ15 (Class AJ) | | | | | | | | | | | | |
231 | | | | Residential Accredit Loans, Inc | | | 4.350 | | | | 03/25/34 | | | | 230 | |
| | | | Series - 2004 QS4 (Class A1) | | | | | | | | | | | | |
250,000 | | i | | Structured Agency Credit Risk Debt Note (STACR) | | | 2.622 | | | | 09/25/24 | | | | 247,332 | |
| | | | Series - 2014 HQ2 (Class M2) | | | | | | | | | | | | |
124,038 | | i | | Structured Agency Credit Risk Debt Note (STACR) | | | 1.672 | | | | 01/25/25 | | | | 124,141 | |
| | | | Series - 2015 DN1 (Class M1) | | | | | | | | | | | | |
250,000 | | i | | Structured Agency Credit Risk Debt Note (STACR) | | | 2.622 | | | | 03/25/25 | | | | 249,279 | |
| | | | Series - 2015 HQ1 (Class M2) | | | | | | | | | | | | |
250,000 | | i | | Structured Agency Credit Risk Debt Note (STACR) | | | 4.222 | | | | 03/25/25 | | | | 241,011 | |
| | | | Series - 2015 HQ1 (Class M3) | | | | | | | | | | | | |
239,140 | | i | | Structured Agency Credit Risk Debt Note (STACR) | | | 1.522 | | | | 05/25/25 | | | | 238,749 | |
| | | | Series - 2015 HQ2 (Class M1) | | | | | | | | | | | | |
275,000 | | i | | Structured Agency Credit Risk Debt Note (STACR) | | | 2.372 | | | | 05/25/25 | | | | 268,517 | |
| | | | Series - 2015 HQ2 (Class M2) | | | | | | | | | | | | |
200,000 | | g,i | | Wachovia Bank Commercial Mortgage Trust | | | 0.551 | | | | 12/15/43 | | | | 191,496 | |
| | | | Series - 2007 C30 (Class AMFL) | | | | | | | | | | | | |
1,250,000 | | | | Wachovia Bank Commercial Mortgage Trust | | | 5.383 | | | | 12/15/43 | | | | 1,291,589 | |
| | | | Series - 2007 C30 (Class AM) | | | | | | | | | | | | |
200,000 | | i | | Wachovia Bank Commercial Mortgage Trust | | | 5.625 | | | | 01/15/45 | | | | 199,590 | |
| | | | Series - 2006 C23 (Class F) | | | | | | | | | | | | |
980,000 | | i | | Wachovia Bank Commercial Mortgage Trust | | | 5.818 | | | | 05/15/46 | | | | 1,029,192 | |
| | | | Series - 2007 C34 (Class AM) | | | | | | | | | | | | |
1,200,000 | | i | | Wachovia Bank Commercial Mortgage Trust | | | 5.947 | | | | 05/15/46 | | | | 1,210,131 | |
| | | | Series - 2007 C34 (Class AJ) | | | | | | | | | | | | |
2,150,000 | | i | | Wachovia Bank Commercial Mortgage Trust | | | 5.591 | | | | 04/15/47 | | | | 2,228,499 | |
| | | | Series - 2007 C31 (Class AM) | | | | | | | | | | | | |
200,000 | | i | | Wachovia Bank Commercial Mortgage Trust | | | 5.680 | | | | 04/15/47 | | | | 193,985 | |
| | | | Series - 2007 C31 (Class C) | | | | | | | | | | | | |
1,500,000 | | g | | Wachovia Bank Commercial Mortgage Trust | | | 5.703 | | | | 06/15/49 | | | | 1,562,773 | |
| | | | Series - 2007 C32 (Class AMFX) | | | | | | | | | | | | |
1,260,000 | | i | | Wachovia Bank Commercial Mortgage Trust | | | 5.750 | | | | 06/15/49 | | | | 1,259,533 | |
| | | | Series - 2007 C32 (Class AJ) | | | | | | | | | | | | |
70,000 | | i | | Wachovia Bank Commercial Mortgage Trust | | | 5.953 | | | | 02/15/51 | | | | 73,528 | |
| | | | Series - 2007 C33 (Class AM) | | | | | | | | | | | | |
83,468 | | i | | WaMu Mortgage Pass-Through Certificates | | | 0.772 | | | | 12/25/45 | | | | 72,252 | |
| | | | Series - 2005 AR19 (Class A1B3) | | | | | | | | | | | | |
50,000 | | g,i | | Wells Fargo Mortgage Backed Securities Trust | | | 5.276 | | | | 11/15/43 | | | | 53,833 | |
| | | | Series - 2010 C1 (Class B) | | | | | | | | | | | | |
101
TIAA-CREF LIFE FUNDS - Bond Fund
| | | | | | | | | | | | | | | | |
PRINCIPAL | | | | ISSUER | | RATE | | | MATURITY
DATE | | | VALUE | |
| | | | | | | | | | | | | | |
$ 88,042 | | | | WF-RBS Commercial Mortgage Trust | | | 0.735 | % | | | 03/15/48 | | | $ | 87,581 | |
| | | | Series - 2013 C12 (Class A1) | | | | | | | | | | | | |
| | | | | | | | | | | | | | | | |
| | | | TOTAL OTHER MORTGAGE BACKED | | | | 26,035,707 | |
| | | | | | | | | | | | | | | | |
| | | | TOTAL STRUCTURED ASSETS
(Cost $36,560,883) | | | | | | | | | | | 36,249,336 | |
| | | | | | | | | | | | | | | | |
| | | | TOTAL BONDS
(Cost $173,751,550) | | | | | | | | | | | 171,482,481 | |
| | | | | | | | | | | | | | | | |
| | | | | |
SHARES | | | | COMPANY | | | | | | | | | |
| | | |
PREFERRED STOCKS - 0.0% | | | | | | | | | | | | |
| | | |
BANKS - 0.0% | | | | | | | | | | | | |
5,517 | | * | | Federal Home Loan Mortgage Corp | | | 8.375 | | | | 12/30/49 | | | | 18,758 | |
17,265 | | * | | Federal National Mortgage Association | | | 8.250 | | | | 12/30/49 | | | | 60,427 | |
| | | | | | | | | | | | | | | | |
| | | | TOTAL BANKS | | | | | | | | | | | 79,185 | |
| | | | | | | | | | | | | | | | |
| | | | TOTAL PREFERRED STOCKS
(Cost $569,550) | | | | | | | | | | | 79,185 | |
| | | | | | | | | | | | | | | | |
| | | | TOTAL INVESTMENTS - 97.2%
(Cost $177,045,591) | | | | | | | | | | | 174,170,916 | |
| | | | OTHER ASSETS & LIABILITIES, NET - 2.8% | | | | | | | | | | | 4,925,041 | |
| | | | | | | | | | | | | | | | |
| | | | NET ASSETS - 100.0% | | | | | | | | | | $ | 179,095,957 | |
| | | | | | | | | | | | | | | | |
Abbreviation(s):
| CDO | Collateralized Debt Obligation |
| REIT | Real Estate Investment Trust |
| g | Security is exempt from registration under Rule 144(A) of the Securities Act of 1933. Such securities are deemed liquid and may be resold in transactions exempt from registration to qualified institutional buyers. At 12/31/2015, the aggregate value of these securities was $33,699,649 or 18.8% of net assets. |
| h | These securities were purchased on a delayed delivery basis. |
| i | Floating or variable rate security. Coupon reflects the rate at period end. |
| m | Indicates a security that has been deemed illiquid. |
102
TIAA-CREF LIFE FUNDS - Money Market Fund
TIAA-CREF LIFE FUNDS
MONEY MARKET FUND
SCHEDULE OF INVESTMENTS
December 31, 2015
| | | | | | | | | | | | | | | | |
PRINCIPAL | | | | ISSUER | | RATE | | | MATURITY
DATE | | | VALUE | |
| | | | | | | | | | | | | | |
SHORT-TERM INVESTMENTS - 99.6% | | | | | | | | | |
| | | |
CERTIFICATE OF DEPOSIT - 3.2% | | | | | | | | | | | | |
$ 500,000 | | | | Banco Del Estado De Chile | | | 0.260 | % | | | 01/08/16 | | | $ | 500,000 | |
500,000 | | | | Banco Del Estado De Chile | | | 0.350 | | | | 02/17/16 | | | | 500,000 | |
300,000 | | | | Banco Del Estado De Chile | | | 0.530 | | | | 03/11/16 | | | | 300,000 | |
500,000 | | | | Toronto-Dominion Bank | | | 0.300 | | | | 01/04/16 | | | | 500,000 | |
500,000 | | | | Toronto-Dominion Bank | | | 0.300 | | | | 02/12/16 | | | | 500,000 | |
| | | | | | | | | | | | | | | | |
| | | | TOTAL CERTIFICATE OF DEPOSIT | | | | | | | | | | | 2,300,000 | |
| | | | | | | | | | | | | | | | |
| | | |
COMMERCIAL PAPER - 26.3% | | | | | | | | | | | | |
300,000 | | y | | Apple, Inc | | | 0.170 | | | | 01/04/16 | | | | 299,996 | |
600,000 | | y | | Apple, Inc | | | 0.150 | | | | 01/11/16 | | | | 599,975 | |
300,000 | | y | | Apple, Inc | | | 0.155 | | | | 01/19/16 | | | | 299,976 | |
300,000 | | y | | Apple, Inc | | | 0.390 | | | | 02/22/16 | | | | 299,831 | |
500,000 | | y | | Australia & New Zealand Banking Group Ltd | | | 0.285 | | | | 02/12/16 | | | | 499,834 | |
250,000 | | y | | Australia & New Zealand Banking Group Ltd | | | 0.290 | | | | 03/04/16 | | | | 249,873 | |
350,000 | | | | Australia & New Zealand Banking Group Ltd | | | 0.640 | | | | 03/23/16 | | | | 349,490 | |
530,000 | | y | | Australia & New Zealand Banking Group Ltd | | | 0.550 | | | | 03/24/16 | | | | 529,328 | |
1,000,000 | | y | | Chevron Corp | | | 0.205 | | | | 02/03/16 | | | | 999,812 | |
300,000 | | y | | DBS Bank Ltd | | | 0.240 | | | | 01/19/16 | | | | 299,964 | |
385,000 | | y | | DBS Bank Ltd | | | 0.290 | | | | 01/28/16 | | | | 384,916 | |
300,000 | | y | | DBS Bank Ltd | | | 0.540 | | | | 02/11/16 | | | | 299,816 | |
164,000 | | | | JPMorgan Chase Bank NA | | | 0.300 | | | | 01/04/16 | | | | 163,996 | |
185,000 | | | | JPMorgan Chase Bank NA | | | 0.520 | | | | 02/25/16 | | | | 184,853 | |
500,000 | | | | Korea Development Bank | | | 0.260 | | | | 01/21/16 | | | | 499,928 | |
500,000 | | | | Korea Development Bank | | | 0.320 | | | | 02/11/16 | | | | 499,818 | |
1,000,000 | | y | | Microsoft Corp | | | 0.185 - 0.190 | | | | 01/06/16 | | | | 999,974 | |
500,000 | | y | | Microsoft Corp | | | 0.170 | | | | 01/20/16 | | | | 499,955 | |
310,000 | | y | | National Australia Bank Ltd | | | 0.235 | | | | 01/21/16 | | | | 309,959 | |
355,000 | | y | | National Australia Bank Ltd | | | 0.400 | | | | 03/01/16 | | | | 354,763 | |
400,000 | | y | | Nestle Capital Corp | | | 0.335 | | | | 01/19/16 | | | | 399,933 | |
400,000 | | y | | Procter & Gamble Co | | | 0.330 | | | | 02/18/16 | | | | 399,824 | |
500,000 | | | | Province of British Columbia Canada | | | 0.200 | | | | 01/19/16 | | | | 499,950 | |
500,000 | | | | Province of British Columbia Canada | | | 0.320 | | | | 02/12/16 | | | | 499,813 | |
500,000 | | | | Province of British Columbia Canada | | | 0.390 | | | | 03/01/16 | | | | 499,675 | |
300,000 | | | | Province of British Columbia Canada | | | 0.470 | | | | 03/09/16 | | | | 299,734 | |
1,000,000 | | y | | Province of Quebec Canada | | | 0.160 | | | | 01/05/16 | | | | 999,982 | |
300,000 | | y | | Province of Quebec Canada | | | 0.430 | | | | 02/22/16 | | | | 299,814 | |
255,000 | | | | Province of Ontario Canada | | | 0.460 | | | | 02/23/16 | | | | 254,827 | |
500,000 | | | | Province of Ontario Canada | | | 0.470 | | | | 02/29/16 | | | | 499,615 | |
750,000 | | y | | PSP Capital, Inc | | | 0.260 - 0.300 | | | | 02/01/16 | | | | 749,815 | |
500,000 | | y | | Svenska Handelsbanken AB | | | 0.380 | | | | 02/22/16 | | | | 499,725 | |
260,000 | | y | | Svenska Handelsbanken AB | | | 0.600 | | | | 03/07/16 | | | | 259,714 | |
500,000 | | | | Toyota Motor Credit Corp | | | 0.240 | | | | 01/26/16 | | | | 499,917 | |
500,000 | | y | | Unilever Capital Corp | | | 0.170 | | | | 01/11/16 | | | | 499,976 | |
500,000 | | y | | Unilever Capital Corp | | | 0.170 | | | | 01/12/16 | | | | 499,974 | |
500,000 | | y | | Unilever Capital Corp | | | 0.440 | | | | 02/26/16 | | | | 499,658 | |
250,000 | | y | | United Overseas Bank Ltd | | | 0.210 | | | | 01/06/16 | | | | 249,993 | |
650,000 | | y | | United Overseas Bank Ltd | | | 0.370 | | | | 02/24/16 | | | | 649,639 | |
500,000 | | | | Washington Gas Light Co | | | 0.400 | | | | 01/08/16 | | | | 499,961 | |
325,000 | | y | | Westpac Banking Corp | | | 0.200 | | | | 01/04/16 | | | | 324,995 | |
250,000 | | y | | Westpac Banking Corp | | | 0.790 | | | | 06/03/16 | | | | 249,155 | |
| | | | | | | | | | | | | | | | |
| | | | TOTAL COMMERCIAL PAPER | | | | | | | | | | | 18,761,746 | |
| | | | | | | | | | | | | | | | |
| | | |
GOVERNMENT AGENCY DEBT - 38.1% | | | | | | | | | | | | |
800,000 | | | | Federal Farm Credit Bank (FFCB) | | | 0.350 | | | | 03/07/16 | | | | 799,487 | |
100,000 | | | | Federal Home Loan Bank (FHLB) | | | 0.280 | | | | 01/04/16 | | | | 99,998 | |
103
TIAA-CREF LIFE FUNDS - Money Market Fund
| | | | | | | | | | | | | | | | |
PRINCIPAL | | | | ISSUER | | RATE | | | MATURITY
DATE | | | VALUE | |
| | | | | | | | | | | | | | |
$ 300,000 | | | | FHLB | | | 0.185 | % | | | 01/05/16 | | | $ | 299,994 | |
105,000 | | | | FHLB | | | 0.125 | | | | 01/06/16 | | | | 104,998 | |
500,000 | | | | FHLB | | | 0.115 | | | | 01/07/16 | | | | 499,990 | |
140,000 | | | | FHLB | | | 0.140 | | | | 01/08/16 | | | | 139,996 | |
570,000 | | | | FHLB | | | 0.120 - 0.150 | | | | 01/12/16 | | | | 569,975 | |
1,700,000 | | | | FHLB | | | 0.110 | | | | 01/13/16 | | | | 1,699,938 | |
432,000 | | | | FHLB | | | 0.160 | | | | 01/14/16 | | | | 431,975 | |
1,000,000 | | | | FHLB | | | 0.120 - 0.210 | | | | 01/15/16 | | | | 999,933 | |
500,000 | | | | FHLB | | | 0.155 | | | | 01/20/16 | | | | 499,959 | |
1,320,000 | | | | FHLB | | | 0.135 - 0.250 | | | | 01/22/16 | | | | 1,319,822 | |
824,000 | | | | FHLB | | | 0.150 - 0.200 | | | | 01/25/16 | | | | 823,903 | |
800,000 | | | | FHLB | | | 0.150 - 0.200 | | | | 01/26/16 | | | | 799,903 | |
1,390,000 | | | | FHLB | | | 0.122 - 0.220 | | | | 01/27/16 | | | | 1,389,838 | |
900,000 | | | | FHLB | | | 0.140 - 0.200 | | | | 01/29/16 | | | | 899,883 | |
400,000 | | | | FHLB | | | 0.200 | | | | 02/02/16 | | | | 399,929 | |
500,000 | | | | FHLB | | | 0.230 | | | | 02/03/16 | | | | 499,895 | |
1,000,000 | | | | FHLB | | | 0.205 | | | | 02/05/16 | | | | 999,801 | |
300,000 | | | | FHLB | | | 0.225 | | | | 02/09/16 | | | | 299,927 | |
910,000 | | | | FHLB | | | 0.295 | | | | 02/16/16 | | | | 909,657 | |
100,000 | | | | FHLB | | | 0.470 | | | | 02/19/16 | | | | 99,936 | |
350,000 | | | | FHLB | | | 0.350 | | | | 02/24/16 | | | | 349,816 | |
325,000 | | | | FHLB | | | 0.280 | | | | 02/26/16 | | | | 324,858 | |
850,000 | | | | FHLB | | | 0.315 | | | | 03/02/16 | | | | 849,546 | |
365,000 | | | | FHLB | | | 0.470 | | | | 03/09/16 | | | | 364,676 | |
400,000 | | | | FHLB | | | 0.420 | | | | 03/16/16 | | | | 399,650 | |
700,000 | | | | FHLB | | | 0.350 | | | | 03/30/16 | | | | 699,394 | |
300,000 | | | | FHLB | | | 0.410 | | | | 04/18/16 | | | | 299,631 | |
400,000 | | | | FHLB | | | 0.550 | | | | 04/22/16 | | | | 399,316 | |
557,000 | | | | FHLB | | | 0.620 | | | | 06/08/16 | | | | 555,475 | |
600,000 | | | | Federal Home Loan Mortgage Corp (FHLMC) | | | 0.250 - 0.270 | | | | 01/11/16 | | | | 599,957 | |
900,000 | | | | FHLMC | | | 0.200 | | | | 01/13/16 | | | | 899,940 | |
500,000 | | | | FHLMC | | | 0.170 | | | | 01/20/16 | | | | 499,955 | |
300,000 | | | | FHLMC | | | 0.300 | | | | 01/21/16 | | | | 299,950 | |
100,000 | | | | FHLMC | | | 0.380 | | | | 01/22/16 | | | | 99,978 | |
1,000,000 | | | | FHLMC | | | 0.140 | | | | 01/25/16 | | | | 999,907 | |
400,000 | | | | FHLMC | | | 0.110 | | | | 01/27/16 | | | | 399,968 | |
500,000 | | | | FHLMC | | | 0.210 | | | | 02/04/16 | | | | 499,901 | |
500,000 | | | | FHLMC | | | 0.410 | | | | 03/16/16 | | | | 499,573 | |
275,000 | | | | FHLMC | | | 0.440 | | | | 04/08/16 | | | | 274,671 | |
500,000 | | | | Federal National Mortgage Association (FNMA) | | | 0.182 | | | | 01/25/16 | | | | 499,939 | |
128,000 | | | | FNMA | | | 0.150 | | | | 01/26/16 | | | | 127,987 | |
800,000 | | | | FNMA | | | 0.200 | | | | 02/08/16 | | | | 799,831 | |
900,000 | | | | FNMA | | | 0.220 - 0.420 | | | | 02/10/16 | | | | 899,624 | |
200,000 | | | | FNMA | | | 0.190 | | | | 02/17/16 | | | | 199,950 | |
400,000 | | | | FNMA | | | 0.360 | | | | 04/01/16 | | | | 399,636 | |
300,000 | | | | FNMA | | | 0.640 | | | | 06/08/16 | | | | 299,152 | |
| | | | | | | | | | | | | | | | |
| | | | TOTAL GOVERNMENT AGENCY DEBT | | | | | | | | | | | 27,131,018 | |
| | | | | | | | | | | | | | | | |
| | | |
TREASURY DEBT - 19.3% | | | | | | | | | | | | |
504,000 | | | | United States Treasury Bill | | | 0.050 - 0.088 | | | | 01/07/16 | | | | 503,995 | |
715,000 | | | | United States Treasury Bill | | | 0.126 - 0.149 | | | | 01/14/16 | | | | 714,966 | |
395,000 | | | | United States Treasury Bill | | | 0.071 | | | | 01/21/16 | | | | 394,984 | |
200,000 | | | | United States Treasury Bill | | | 0.135 | | | | 01/28/16 | | | | 199,980 | |
423,000 | | | | United States Treasury Bill | | | 0.112 - 0.217 | | | | 02/04/16 | | | | 422,926 | |
600,000 | | | | United States Treasury Bill | | | 0.085 - 0.155 | | | | 02/11/16 | | | | 599,929 | |
700,000 | | | | United States Treasury Bill | | | 0.032 - 0.103 | | | | 02/18/16 | | | | 699,934 | |
300,000 | | | | United States Treasury Bill | | | 0.215 | | | | 02/25/16 | | | | 299,901 | |
316,000 | | | | United States Treasury Bill | | | 0.200 - 0.235 | | | | 03/03/16 | | | | 315,883 | |
300,000 | | | | United States Treasury Bill | | | 0.257 | | | | 03/10/16 | | | | 299,853 | |
200,000 | | | | United States Treasury Bill | | | 0.147 | | | | 03/17/16 | | | | 199,938 | |
645,000 | | | | United States Treasury Bill | | | 0.100 - 0.251 | | | | 03/24/16 | | | | 644,684 | |
145,000 | | | | United States Treasury Bill | | | 0.061 - 0.073 | | | | 04/07/16 | | | | 144,974 | |
715,000 | | | | United States Treasury Bill | | | 0.111 - 0.121 | | | | 04/21/16 | | | | 714,745 | |
885,000 | | | | United States Treasury Bill | | | 0.158 - 0.230 | | | | 04/28/16 | | | | 884,430 | |
104
TIAA-CREF LIFE FUNDS - Money Market Fund
| | | | | | | | | | | | | | | | |
PRINCIPAL | | | | ISSUER | | RATE | | | MATURITY
DATE | | | VALUE | |
| | | | | | | | | | | | | | |
$ 75,000 | | | | United States Treasury Bill | | | 0.323 | % | | | 05/05/16 | | | $ | 74,916 | |
340,000 | | | | United States Treasury Bill | | | 0.450 | | | | 05/19/16 | | | | 339,409 | |
50,000 | | | | United States Treasury Bill | | | 0.387 | | | | 05/26/16 | | | | 49,922 | |
105,000 | | | | United States Treasury Bill | | | 0.476 | | | | 06/02/16 | | | | 104,788 | |
190,000 | | | | United States Treasury Bill | | | 0.402 - 0.404 | | | | 06/09/16 | | | | 189,660 | |
678,000 | | | | United States Treasury Note | | | 0.375 | | | | 01/15/16 | | | | 678,062 | |
300,000 | | | | United States Treasury Note | | | 0.375 | | | | 01/31/16 | | | | 300,041 | |
412,000 | | | | United States Treasury Note | | | 0.375 | | | | 02/15/16 | | | | 412,093 | |
550,000 | | | | United States Treasury Note | | | 0.250 | | | | 02/29/16 | | | | 550,057 | |
800,000 | | | | United States Treasury Note | | | 0.375 | | | | 03/15/16 | | | | 800,275 | |
1,028,000 | | | | United States Treasury Note | | | 0.375 | | | | 03/31/16 | | | | 1,028,364 | |
910,000 | | | | United States Treasury Note | | | 0.250 | | | | 04/15/16 | | | | 910,193 | |
100,000 | | | | United States Treasury Note | | | 0.250 | | | | 05/15/16 | | | | 100,014 | |
400,000 | | | | United States Treasury Note | | | 0.375 | | | | 05/31/16 | | | | 400,143 | |
200,000 | | | | United States Treasury Note | | | 0.500 | | | | 06/30/16 | | | | 200,253 | |
550,000 | | | | United States Treasury Note | | | 0.625 | | | | 07/15/16 | | | | 550,940 | |
| | | | | | | | | | | | | | | | |
| | | | TOTAL TREASURY DEBT | | | | | | | | | | | 13,730,252 | |
| | | | | | | | | | | | | | | | |
| | | |
VARIABLE RATE SECURITIES - 12.7% | | | | | | | | | | | | |
500,000 | | i | | Federal Farm Credit Bank (FFCB) | | | 0.390 | | | | 03/29/16 | | | | 499,951 | |
500,000 | | i | | FFCB | | | 0.480 | | | | 12/30/16 | | | | 499,622 | |
500,000 | | i | | FFCB | | | 0.398 | | | | 01/24/17 | | | | 499,975 | |
500,000 | | i | | FFCB | | | 0.243 | | | | 03/02/17 | | | | 500,002 | |
500,000 | | i | | FFCB | | | 0.500 | | | | 03/09/17 | | | | 499,760 | |
1,000,000 | | i | | FFCB | | | 0.326 | | | | 06/15/17 | | | | 999,822 | |
300,000 | | i | | FFCB | | | 0.480 | | | | 06/27/17 | | | | 299,684 | |
500,000 | | i | | Federal Home Loan Bank (FHLB) | | | 0.229 | | | | 02/17/17 | | | | 499,787 | |
500,000 | | i | | Federal Home Loan Mortgage Corp (FHLMC) | | | 0.322 | | | | 01/12/17 | | | | 499,975 | |
500,000 | | i | | FHLMC | | | 0.322 | | | | 01/13/17 | | | | 499,948 | |
430,000 | | i | | FHLMC | | | 0.407 | | | | 04/20/17 | | | | 429,746 | |
500,000 | | i | | FHLMC | | | 0.328 | | | | 04/26/17 | | | | 499,618 | |
1,000,000 | | i | | Federal National Mortgage Association (FNMA) | | | 0.437 | | | | 01/26/17 | | | | 1,000,065 | |
500,000 | | i | | FNMA | | | 0.422 | | | | 07/20/17 | | | | 499,448 | |
500,000 | | i | | FNMA | | | 0.355 | | | | 08/16/17 | | | | 499,918 | |
500,000 | | i | | Wells Fargo Bank NA | | | 0.540 | | | | 03/10/16 | | | | 500,000 | |
300,000 | | i | | Wells Fargo Bank NA | | | 0.570 | | | | 04/11/16 | | | | 300,000 | |
| | | | | | | | | | | | | | | | |
| | | | TOTAL VARIABLE RATE SECURITIES | | | | | | | | | | | 9,027,321 | |
| | | | | | | | | | | | | | | | |
| | | | TOTAL SHORT-TERM INVESTMENTS
(Cost $70,950,337) | | | | | | | | | | | 70,950,337 | |
| | | | | | | | | | | | | | | | |
| | | | TOTAL PORTFOLIO - 99.6%
(Cost $70,950,337) | | | | | | | | | | | 70,950,337 | |
| | | | OTHER ASSETS & LIABILITIES, NET - 0.4% | | | | | | | | | | | 287,493 | |
| | | | | | | | | | | | | | | | |
| | | | NET ASSETS - 100.0% | | | | | | | | | | $ | 71,237,830 | |
| | | | | | | | | | | | | | | | |
| i | Floating or variable rate security. Coupon reflects the rate at period end. |
| y | Security exempt from registration under Section 4(2) of the Securities Act of 1933. Such securities are deemed to be liquid and may be sold in transactions exempt from registration only to dealers in that program or other “accredited investors.” At 12/31/2015, the aggregate value of these securities was $13,150,169 or 19.0% of net assets. |
105
TIAA-CREF LIFE FUNDS - Balanced Fund
TIAA-CREF LIFE FUNDS
BALANCED FUND
SCHEDULE OF INVESTMENTS
December 31, 2015
| | | | | | |
SHARES | | SECURITY | | VALUE | |
| | | | | | |
|
TIAA-CREF LIFE FUNDS - 99.9%(a) | |
|
FIXED INCOME - 50.4% | |
872,183 | | TIAA-CREF Life Bond Fund | | $ | 21,412,095 | |
| | | | | | |
| | TOTAL FIXED INCOME | | | 21,412,095 | |
| | | | | | |
|
INTERNATIONAL EQUITY - 9.9% | |
237,074 | | TIAA-CREF Life International Equity Fund | | | 4,234,141 | |
| | | | | | |
| | TOTAL INTERNATIONAL EQUITY | | | 4,234,141 | |
| | | | | | |
|
U.S. EQUITY - 39.6% | |
136,252 | | TIAA-CREF Life Growth Equity Fund | | | 3,933,592 | |
118,352 | | TIAA-CREF Life Growth & Income Fund | | | 4,223,974 | |
117,687 | | TIAA-CREF Life Large-Cap Value Fund | | | 3,671,834 | |
25,555 | | TIAA-CREF Life Real Estate Securities Fund | | | 852,526 | |
27,670 | | TIAA-CREF Life Small-Cap Equity Fund | | | 841,169 | |
76,200 | | TIAA-CREF Life Stock Index Fund | | | 3,379,474 | |
| | | | | | |
| | TOTAL U.S. EQUITY | | | 16,902,569 | |
| | | | | | |
| | TOTAL TIAA-CREF LIFE FUNDS (Cost $44,010,205) | | | 42,548,805 | |
| | | | | | |
| | TOTAL INVESTMENTS - 99.9% (Cost $44,010,205) | | | 42,548,805 | |
| | OTHER ASSETS & LIABILITIES, NET - 0.1% | | | 36,103 | |
| | | | | | |
| | NET ASSETS - 100.0% | | $ | 42,584,908 | |
| | | | | | |
| (a) | The Fund invests its assets in the affiliated TIAA-CREF Life Funds. |
106
Report of Independent Registered Public Accounting Firm
To the Board of Trustees and Shareholders of the TIAA-CREF Life Funds:
In our opinion, the accompanying statements of assets and liabilities, including the summary portfolios of investments, and the related statements of operations and of changes in net assets and the financial highlights (included in Item 1 of this Form N-CSR) and the schedules of investments (included in Item 6 of this Form N-CSR) present fairly, in all material respects, the financial position of the Growth Equity Fund, Growth & Income Fund, Large-Cap Value Fund, Real Estate Securities Fund, Small-Cap Equity Fund, Social Choice Equity Fund, Stock Index Fund, International Equity Fund, Bond Fund, Money Market Fund, and Balanced Fund (constituting the TIAA-CREF Life Funds, hereafter collectively referred to as the “Funds”) at December 31, 2015, the results of each of their operations, the changes in each of their net assets and the financial highlights for each of the periods presented, in conformity with accounting principles generally accepted in the United States of America. These financial statements, financial highlights, and schedules of investments (hereafter collectively referred to as “financial statements”) are the responsibility of the Funds’ management. Our responsibility is to express an opinion on these financial statements based on our audits. We conducted our audits of these financial statements in accordance with the standards of the Public Company Accounting Oversight Board (United States). Those standards require that we plan and perform the audit to obtain reasonable assurance about whether the financial statements are free of material misstatement. An audit includes examining, on a test basis, evidence supporting the amounts and disclosures in the financial statements, assessing the accounting principles used and significant estimates made by management, and evaluating the overall financial statement presentation. We believe that our audits, which included confirmation of securities at December 31, 2015 by correspondence with the custodian and brokers and confirmation of underlying investee mutual fund shares by correspondence with the transfer agent of the investee mutual funds, provide a reasonable basis for our opinion.
/s/ PricewaterhouseCoopers LLP
Baltimore, Maryland
February 19, 2016
107
Item 7. Disclosure of Proxy Voting Policies and Procedures for Closed-End Management
Investment Companies.
Not Applicable.
Item 8. Portfolio Managers of Closed-End Management Investment Companies.
Not Applicable.
Item 9. Purchases of Equity Securities by Closed-End Management Investment Company and Affiliated Purchasers.
Not Applicable.
Item 10. Submission of Matters to a Vote of Security Holders.
There were no material changes to the procedures by which shareholders may recommend nominees to the Registrant’s Board of Trustees.
Item 11. Controls and Procedures.
(a) An evaluation was performed within 90 days of the filing date of the report under the supervision of the Registrant’s management, including the principal executive officer and principal financial officer, of the effectiveness of the design and operation of the Registrant’s disclosure controls and procedures. Based on that evaluation, the Registrant’s management, including the principal executive officer and principal financial officer, concluded that the Registrant’s disclosure controls and procedures were effective for this annual reporting period.
(b) There were no changes in the Registrant’s internal control over financial reporting that occurred during the Registrant’s annual period covered by this report that materially affected, or are reasonably likely to materially affect, the Registrant’s internal control over financial reporting.
Item 12. Exhibits.
12(a)(1) Copy of current Code of Ethics
12(a)(2)(i) Section 302 certification of the principal executive officer
12(a)(2)(ii) Section 302 certification of the principal financial officer
12(b) Section 906 certification of principal executive officer and principal financial officer
SIGNATURES
Pursuant to the requirements of the Securities Exchange Act of 1934 and the Investment Company Act of 1940, the Registrant has duly caused this report to be signed on its behalf by the undersigned, thereunto duly authorized.
| | | | | | |
| | | | TIAA-CREF LIFE FUNDS |
| | | |
| Dated: February 19, 2016 | | | | By: | | /s/ Robert G. Leary |
| | | | | | Robert G. Leary |
| | | | | | Principal Executive Officer and President |
Pursuant to the requirements of the Securities Exchange Act of 1934 and the Investment Company Act of 1940, this report has been signed below by the following persons on behalf of the Registrant and in the capacities and on the dates indicated.
| | | | | | |
| Dated: February 19, 2016 | | | | By: | | /s/ Robert G. Leary |
| | | | | | Robert G. Leary |
| | | | | | Principal Executive Officer and President |
| | | | | | (principal executive officer) |
| | | | | | |
| Dated: February 19, 2016 | | | | By: | | /s/ Phillip G. Goff |
| | | | | | Phillip G. Goff |
| | | | | | Principal Financial Officer, Principal Accounting |
| | | | | | Officer and Treasurer (principal financial officer) |
EXHIBIT INDEX
Item 12. Exhibits.
12(a)(1) Copy of current SOX code of ethics for Senior Financial Officers
12(a)(2)(i) Section 302 certification of the principal executive officer
12(a)(2)(ii) Section 302 certification of the principal financial officer
12(b) Section 906 certification of principal executive officer and principal financial officer