UNITED STATES
SECURITIES AND EXCHANGE COMMISSION
Washington, DC 20549
FORMN-CSR
CERTIFIED SHAREHOLDER REPORT OF REGISTERED MANAGEMENT
INVESTMENT COMPANIES
Investment Company Act file number File No. 811-08961
TIAA-CREF LIFE FUNDS
(Exact Name of Registrant as specified in charter)
730 Third Avenue, New York, New York 10017-3206
(Address of Principal Executive Offices) (Zip code)
John M. McCann, Esq.
TIAA-CREF Life Funds
8500 Andrew Carnegie Blvd.
Charlotte, North Carolina 28262-8500
(Name and address of agent for service)
Registrant’s telephone number, including area code:704-595-1000
Date of fiscal year end:December 31
Date of reporting period:December 31, 2018
Item 1. Reports to Stockholders.
| | | | | | |
Fund name | | Ticker | | | | |
| | | |
Growth Equity Fund | | TLGQX | | | | |
| | | |
Growth & Income Fund | | TLGWX | | | | |
| | | |
Large-Cap Value Fund | | TLLVX | | | | |
| | | |
Real Estate Securities Fund | | TLRSX | | | | |
| | | |
Small-Cap Equity Fund | | TLEQX | | | | |
| | | |
Social Choice Equity Fund | | TLCHX | | | | |
| | | |
Stock Index Fund | | TLSTX | | | | |
| | | |
International Equity Fund | | TLINX | | | | |
| | | |
Bond Fund | | TLBDX | | | | |
| | | |
Money Market Fund | | TLMXX | | | | |
| | | |
Balanced Fund | | TLBAX | | | | |
Contents
Proposals for action at the 2019 shareholder meeting
We anticipate that the next meeting of shareholders of the TIAA-CREF Life Funds will be held in July 2019; however, the exact date, time and location of such meeting have yet to be determined. Proposals submitted by or on behalf of shareholders pursuant to Rule14a-8 under the Securities Exchange Act of 1934 for inclusion in the proxy materials for the 2019 shareholder meeting
must be received by the TIAA-CREF Life Funds’ Corporate Secretary no earlier than January 2, 2019, and no later than March 15, 2019. The submission of a proposal does not assure its inclusion in TIAA-CREF Life Funds’ proxy statement or presentation at the meeting. Unless TIAA-CREF Life Funds is notified by April 24, 2019, of other matters that may be properly brought before the 2019 shareholders’ meeting by or on behalf of shareholders, the persons named in the proxy will have the discretion to vote on those matters as they see fit.
Understanding this report
This annual report contains information about the TIAA-CREF Life Funds and describes their results for the twelve months ended December 31, 2018. The report contains four main sections:
• A market review from Brad Finkle, President of TIAA-CREF Funds, TIAA-CREF Life Funds and TIAA Investments.
• The fund performance section compares each fund’s investment returns with those of its benchmark index.
• The summary portfolios of investments list the industries and types of securities in which each fund had investments as of December 31, 2018.
• The financial statements provide detailed information about the operations and financial condition of each fund.
The views and opinions expressed in this report are through the end of the period, as stated on the cover of this report. They are subject to change at any time based on a variety of factors. As such, they are not guarantees of future performance or investment results and should not be taken as investment advice. To see the risks of investing in any fund, please read the latest prospectus.
The TIAA-CREF Life Funds serve as underlying investment vehicles for certain variable annuity and variable life insurance separate accounts. The returns of the funds shown in this review do not reflect the administrative expense and the mortality and expense risk charges of these separate accounts. Because of these additional deductions, the returns contractholders of these separate accounts will experience are lower, for the same periods, than the figures shown here. For more information on the performance of your variable annuity and variable life insurance separate accounts, please visit TIAA.org.
As always, you should carefully consider the investment objectives, risks, charges and expenses of any fund before investing. For a prospectus that contains this and other important information, please visit our website at TIAA.org, or call800-223-1200. We urge you to read the prospectus carefully before investing.
TIAA-CREF Life Funds ◾ 2018 Annual Report 3
Market review
Global equity markets became more volatile in 2018, serving as a reminder to investors that downturns can and do occur. After nearly a decade-long stretch of strong performance, the sharp decline near the year’s end caught some investors off guard. Nevertheless, the U.S. economy remained strong with moderate inflation. The U.S. unemployment rate fell to its lowest level in nearly 50 years, and wage growth continued. In response to the economy’s strength, the Federal Reserve increased the federal funds target rate four times to 2.25%–2.50%. Overseas, growth in Europe slowed, while returns in emerging markets were hurt by rising interest rates and a stronger U.S. dollar. In the fixed-income markets, U.S. Treasury yields increased, which dampened returns as bond prices move in the opposite direction of yields.
• Returns for the eight TIAA-CREF Life Funds that invest primarily in equities ranged from –23.6% for the International Equity Fund to –0.2% for the Growth Equity Fund.
• The Bond Fund returned –0.8%, and the Balanced Fund posted a return of –5.5%.
• Most TIAA-CREF Life Funds trailed their respective benchmarks for the period.
Performance review of the TIAA-CREF Life Funds
In 2018, the TIAA-CREF Life Funds posted losses—with the exception of the Money Market Fund, which gained 1.7%—as rising U.S. interest rates and global trade tensions weighed on investors.
Among equity funds, the Growth Equity Fund had the best absolute return at –0.2% and outpaced its benchmark, the Russell 1000® Growth Index. The Growth & Income Fund returned –7.3% and trailed its benchmark, the S&P 500® Index.
TheLarge-Cap Value Fund returned –14.1%, underperforming the result of its benchmark, the Russell 1000 Value Index. TheSmall-Cap Equity Fund recorded a return of –12.1% and also trailed its benchmark, the Russell 2000® Index.
The Social Choice Equity Fund, which does not invest in certain stocks because of its environmental, social and governance criteria, returned –5.6%, while the Stock Index Fund returned –5.3%. Both funds modestly fell short of their mutual benchmark, the Russell 3000® Index.
The Real Estate Securities Fund returned –4.2%, slightly behind its benchmark, the FTSE Nareit All Equity REITs Index.
With respect to foreign developed markets, the International Equity Fund posted a return of –23.6% in U.S.-dollar terms, underperforming its benchmark, the MSCI EAFE Index. The strong U.S. dollar was generally a headwind to the performance of international stocks.
Within the fixed-income category, the Bond Fund returned –0.8% and trailed its benchmark, the Bloomberg Barclays U.S. Aggregate Bond Index.
The Balanced Fund, which invests in stock and bond funds, returned –5.5% and trailed its composite benchmark due to relative weakness in most of its underlying funds.
4 2018 Annual Report ∎ TIAA-CREF Life Funds
| | |
For full details on all TIAA-CREF Life Funds, please see the commentaries starting on page 10. Global equity markets posted losses The broad U.S. stock market, as measured by the Russell 3000 Index, returned –5.2% for the twelve months. Concerns about rising interest rates, trade tensions with China and a decelerating global economy weighed on markets in the latter months of the period. Foreign equities, as represented in U.S.-dollar terms by the MSCI EAFE Index, declined more sharply, posting a return of –13.8%. U.S. investment-grade fixed-rate bonds, as measured by the Bloomberg Barclays U.S. Aggregate Bond Index, were essentially flat for the year, reflecting the impact of four interest-rate increases by the Federal Reserve. Yields on U.S. Treasury securities were also affected by the Fed’s actions, rising during the period, with greater increases occurring among shorter-term bonds. | |  Brad Finkle |
Maintain perspective during periods of increased volatility
Periodic corrections are a normal part of investing in the stock market and have occurred frequently throughout the course of history. Perhaps the most important thing to remember during periods of volatility is to avoid overreacting. We believe that investment decisions should be based on a current assessment of long-term goals and personal risk tolerance, rather than emotions. Attempts to time stock market declines and rallies are rarely successful. We believe that investors who can ride out the market’s inevitable ups and downs have a greater chance of achieving more consistent investment results over the long term. The market’s strong start in 2019 illustrates this point.
As always, we recommend that you consult your financial advisor or call a TIAA financial consultant with any questions about your investments. To learn more, visit us at TIAA.org or call800-842-2252. We would be happy to assist you.

Brad Finkle
President
TIAA-CREF Funds, TIAA-CREF Life Funds and TIAA Investments
TIAA-CREF Life Funds ◾ 2018 Annual Report 5
Information for investors
Portfolio holdings
Securities and Exchange Commission (SEC) rules allow investment companies to list the top holdings of each fund in their annual and semiannual reports, instead of providing complete portfolio listings. The TIAA-CREF Life Funds also file complete portfolio listings with the SEC, and they are available to the public.
You can obtain a complete list of the TIAA-CREF Life Funds’ holdings (Schedules of Investments) as of the most recently completed fiscal quarter in the following ways:
• By visiting our website at TIAA.org; or
• By calling us at800-842-2252 to request a copy, which will be provided free of charge.
You can also obtain a complete list of the TIAA-CREF Life Funds’ portfolio holdings as of the most recently completed fiscal quarter, and for prior quarter-ends, from our SEC FormN-CSR and FormN-Q filings. FormN-CSR filings are as of December 31 or June 30;Form N-Q filings are as of March 31 or September 30. Copies of these forms are available:
• Through the Electronic Data Gathering and Retrieval System (EDGAR) on the SEC’s website at sec.gov; or
• From the SEC’s Office of Investor Education and Advocacy. Call202-551-8090 for more information.
Proxy voting
TIAA-CREF Life Funds’ ownership of stock gives it the right to vote on proxy issues of companies in which it invests. A description of our proxy voting policies and procedures can be found on our website at TIAA.org or on the SEC’s website at sec.gov. You can also call us at800-223-1200 to request a free copy. A report of how the funds voted during the most recently completed twelve-month period ended June 30 can be found on our website or on FormN-PX at sec.gov.
Contacting TIAA
There are three easy ways to contact us: by email, using the Contact Us link at the top of our home page; by mail at TIAA, 730 Third Avenue, New York, NY 10017-3206; or by phone at800-223-1200.
Fund management
The TIAA-CREF Life Funds are managed by the portfolio management teams of Teachers Advisors, LLC. The members of these teams are responsible for theday-to-day investment management of the funds.
6 2018 Annual Report ∎ TIAA-CREF Life Funds
About the funds’ benchmarks
Equity Indexes
Broad market indexes
TheRussell 3000® Index measures the performance of the stocks of the 3,000 largest publicly traded U.S. companies, based on market capitalization. The index measures the performance of about 98% of the total market capitalization of the publicly traded U.S. equity market.
TheMSCI EAFE Index measures the performance of the leading stocks in 21 developed-markets countries outside North America—in Europe, Australasia and the Far East.
Large-cap indexes
TheS&P 500® Index is a market-capitalization-weighted index of the stocks of 500 leading companies in leading industries of the U.S. economy.
TheRussell 1000® Growth Index is a subset of the Russell 1000 Index, which measures the performance of the stocks of the 1,000 largest companies in the Russell 3000 Index, based on market capitalization. The Russell 1000 Growth Index measures the performance of those stocks of the Russell 1000 Index with higher relative forecasted growth rates and price/book ratios.
TheRussell 1000 Value Index is a subset of the Russell 1000 Index, which measures the performance of the stocks of the 1,000 largest companies in the Russell 3000 Index, based on market capitalization. The Russell 1000 Value Index measures the performance of those stocks of the Russell 1000 Index with lower relative forecasted growth rates and price/book ratios.
Small-cap index
TheRussell 2000® Index measures the performance of the stocks of the 2,000 smallest companies in the Russell 3000 Index, based on market capitalization.
Specialty equity index
TheFTSE Nareit All Equity REITs Index measures the performance of certain publicly traded real estate investment trusts in the United States that own, manage and lease investment-grade commercial real estate.
TIAA-CREF Life Funds ◾ 2018 Annual Report 7
About the funds’ benchmarks
Fixed-income Index
TheBloomberg Barclays U.S. Aggregate Bond Index measures the performance of the domestic investment-grade fixed-rate bond market, including government and corporate securities, agency mortgage pass-through securities, asset-backed securities and commercial mortgage-backed securities.
Multi-asset Class Indexes
Composite index
TheBalanced Fund Composite Index is a composite of three unmanaged benchmark indexes, each of which represents one of the three market sectors in which the underlying funds invest: domestic equity (Russell 3000 Index), international equity (MSCI EAFE Index), and fixed income (Bloomberg Barclays U.S. Aggregate Bond Index). The Fund’s composite benchmark combines those public indexes in proportions that reflect the Fund’s target market sector allocations.
Broad market index
TheMorningstar Moderately Conservative Target Risk Index has a 40% global equity market exposure based on an asset allocation methodology from Ibbotson Associates, a Morningstar company. The returns of the Morningstar Moderately Conservative Target Risk Index reflect a multi-asset class exposure and similar risk profile as the Balanced Fund.
You cannot invest directly in any index. Index returns do not include a deduction for fees or expenses. For additional details about the benchmark indexes, please read the funds’ latest prospectus.
Russell 1000, Russell 2000 and Russell 3000 are trademarks and service marks of Frank Russell Company. TIAA products are not promoted or sponsored by, or affiliated with, Frank Russell Company. MSCI makes no express or implied warranties or representations and shall have no liability whatsoever with respect to any MSCI data contained herein. This report is not approved, reviewed or produced by MSCI. S&P 500 is a registered trademark and service mark of Standard & Poor’s Financial Services, LLC, a division of S&P Global.
FTSE International Limited (“FTSE”) © FTSE 2019. FTSE® is a trademark of the London Stock Exchange Group companies and is used by FTSE International Limited under license. Nareit® is a trademark of the National Association of Real Estate Investment Trusts (“Nareit”). All intellectual property rights in the Index vest in FTSE and Nareit. Neither FTSE nor its licensors accept any liability for any errors or omissions in the FTSE indices and/or FTSE ratings or underlying data. No further distribution of FTSE Data is permitted without FTSE’s express written consent.
8 2018 Annual Report ∎ TIAA-CREF Life Funds
Important information about expenses
All shareholders of the TIAA-CREF Life Funds incur ongoing costs, including management fees and other fund expenses.
The TIAA-CREF Life Funds are the underlying investment vehicles for certain variable life insurance and variable annuity contracts issued by TIAA-CREF Life Insurance Company.These contracts have additional administrative expense fees and mortality and expense risk charges. Because of these additional deductions, the costs to investors will be higher than the figures shown in the expense examples. Information about these additional charges can be found in the product prospectuses.
The expense examples that appear in this report are intended to help you understand your ongoing costs only (in U.S. dollars) and do not reflect transactional costs. The examples are designed to help you compare these ongoing costs with the ongoing costs of investing in other mutual funds. Shareholders of the TIAA-CREF Life Funds do not incur a sales charge on purchases, on reinvested dividends or other distributions.
The examples are based on an investment of $1,000 invested at the beginning of thesix-month period and held for the entire period (July 1, 2018–December 31, 2018).
Actual expenses
The first line in each table uses the Fund’s actual expenses and its actual rate of return. You may use the information in this line, together with the amount you invested, to estimate the expenses that you paid over thesix-month period.
Simply divide your account value by $1,000 (for example, an $8,600 account value divided by $1,000 = 8.6), then multiply the result by the number in the first line under the heading “Expenses paid during period” to estimate the expenses you paid during thesix-month period. Some funds have a contractual fee reimbursement. Had these not been in effect, fund expenses would have been higher.
Hypothetical example for comparison purposes
The second line in each table shows hypothetical account values and expenses based on the Fund’s actual expense ratio for thesix-month period and an assumed5%-per-year rate of return before expenses. This was not the Fund’s actual return.
This hypothetical example cannot be used to estimate the actual expenses you paid for the period, but rather allows you to compare the ongoing costs of investing in the Fund with that of other funds. To do so, compare this 5% hypothetical example with the 5% hypothetical examples that appear in the shareholder reports of other mutual funds.
TIAA-CREF Life Funds ◾ 2018 Annual Report 9
Growth Equity Fund
Performance for the twelve months ended December 31, 2018
The Growth Equity Fund returned –0.21% for the year, compared with the –1.51% return of its benchmark, the Russell 1000® Growth Index.
The U.S. economy grew at a solid pace in 2018, while inflation remained moderate. The unemployment rate fell to 3.7%—its lowest level in nearly 50 years—before ending the period at 3.9% on December 31, 2018. Wage growth increased and consumer confidence was strong. The Federal Reserve responded to the growing economy by raising the federal funds target rate four times during the period, increasing the key short-term interest-rate measure to 2.25%–2.50%. Oil prices declined for the year, falling sharply over the final three months of the period. Concerns over rising interest rates, trade tensions with China and a decelerating global economy weighed on markets in the latter months of the period.
The broad U.S. stock market, as measured by the Russell 3000® Index, declined 5.24% for the twelve-month period as performance was negative across investment styles and capitalization sizes. Growth stocks performed better than value shares, andlarge-cap stocks surpassedmid- andsmall-cap equities. (Returns by investment style and capitalization size are based on the Russell indexes.)
For the ten years ended December 31, 2018, the Russell 1000 Growth Index recorded an annual average return of 15.29%, versus the 11.18% average annual return of the Russell 1000 Value Index.
Fund surpassed its benchmark
Seven of the eleven industry sectors in the Russell 1000 Growth Index posted losses for the year. Energy (down 29.9%) was the worst-performing sector, reflecting the decline in oil prices. Next came materials (down 14.6%), communication services (down 11.1%) and industrials (down 10.1%), the latter detracting most from the benchmark’s return. Together, these four sectors represented more thanone-quarter of the benchmark’s total market capitalization on December 31, 2018. The sectors with positive performance were utilities (up 9.2%)—the benchmark’s smallest sector—consumer discretionary (up 5.2%), information technology (up 4.5%) and health care (up 4.1%).
The Fund outperformed its benchmark mostly due to favorable security selection. The largest contributor to relative performance was an overweight position in salesforce.com, a developer of customer relationship management software that posted strong revenue growth. Overweight investments in two other software companies, Adobe and Intuit, followed by an overweight position in surgical robotics manufacturer Intuitive Surgical, also benefited the Fund’s relative performance.
These positive effects were partly offset by overweight positions in semiconductor maker Broadcom and Starbucks—both of which performed poorly—followed by anout-of-benchmark position in Chinese Internet provider Tencent Holdings. A small exposure to derivatives instruments also hurt the Fund’s relative performance.
10 2018 Annual Report ∎ TIAA-CREF Life Funds
Growth Equity Fund
| | | | | | | | | | | | | | | | | | | | | | |
Performance as of December 31, 2018 | | | | | | | | | | | | | | | | | | | | | | |
| | | | | Total
return | | | | | Average annual
total return | | | | | Annual operating
expenses* |
| | | Inception
date | | 1 year | | | | | 5 years | | | 10 years | | | | | gross | | net |
Growth Equity Fund | | 4/3/00 | | | -0.21 | % | | | | | 10.16 | % | | | 15.31 | % | | | | 0.59% | | 0.52% |
| | | | | | | | |
Russell 1000® Growth Index | | – | | | -1.51 | | | | | | 10.40 | | | | 15.29 | | | | | – | | – |
The returns in this report show past performance, which is no guarantee of future results. Returns and the principal value of your investment will fluctuate. Current performance may be higher or lower than that shown, and you may have a gain or a loss when you redeem your shares. For current performance information, including performance to the most recentmonth-end, please visit TIAA.org. Performance may reflect waivers or reimbursements of certain expenses. Absent these waivers or reimbursement arrangements, performance would have been lower.
Total returns for the shares of the Fund do not include the effect of expenses attributable to the variable annuity or variable life insurance product; if they did, returns for the shares of the Fund would have been lower.
You cannot invest directly in any index. Index returns do not include a deduction for fees or expenses.
| * | The gross and net annual operating expenses are taken from the Fund’s prospectus. The net annual operating expenses may at times reflect a contractual reimbursement of various expenses. The expense reimbursement will continue through at least April 30, 2019, unless changed with the approval of the Board of Trustees. Without these reimbursements, expenses would be higher and returns lower. |
$10,000 over 10 years
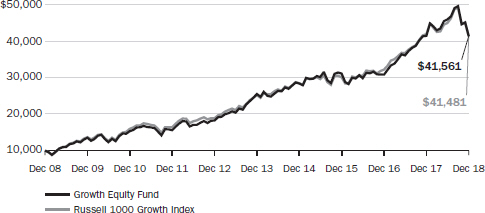
For the purpose of comparison, the graph also shows the change in the value of the Fund’s benchmark during the same period.
TIAA-CREF Life Funds ◾ 2018 Annual Report 11
Growth Equity Fund
Expense example
Six months ended December 31, 2018
| | | | | | |
Growth Equity Fund | | Beginning
account value
(7/1/18) | | Ending
account value
(12/31/18) | | Expenses paid
during period*
(7/1/18–12/31/18) |
| | | |
Actual return | | $1,000.00 | | $ 900.23 | | $2.49 |
| | | |
5% annual hypothetical return | | 1,000.00 | | 1,022.58 | | 2.65 |
| * | “Expenses paid during period” is based on the Fund’s actual expense ratio for the most recent fiscal half-year, multiplied by the average account value over thesix-month period, multiplied by 184/365. There were 184 days in the six months ended December 31, 2018. The Fund’s annualizedsix-month expense ratio for that period was 0.52%. The expense charges of the Fund may reflect a waiver and/or reimbursement. Please see the prospectus for an explanation, including the date on which this reimbursement is scheduled to end. Without such waiver and reimbursement, the expenses of the Fund would be higher and its performance lower. |
For more information about this expense example, please see page 9.
Fund profile
| | |
| | | as of 12/31/2018 |
Net assets | | $98.22 million |
| |
Portfolio turnover rate | | 90% |
| |
Number of holdings | | 81 |
| |
Weighted median market capitalization | | $100.91 billion |
| |
Price/earnings ratio (weighted12-month trailing average)* | | 31.88 |
| * | Price/earnings ratio is the price of a stock divided by its earnings per share for the past twelve-month period. |
Holdings by company size
| | | | |
Market capitalization | | % of equity investments
as of 12/31/2018 | |
More than $50 billion | | | 68.9 | |
| |
More than $15 billion–$50 billion | | | 22.7 | |
| |
More than $2 billion–$15 billion | | | 8.4 | |
Total | | | 100.0 | |
Portfolio composition
| | | | |
Sector | | % of net assets
as of 12/31/2018 | |
Information technology | | | 36.2 | |
| |
Communication services | | | 16.3 | |
| |
Consumer discretionary | | | 15.5 | |
| |
Health care | | | 14.4 | |
| |
Industrials | | | 7.7 | |
| |
Consumer staples | | | 3.8 | |
| |
Materials | | | 3.0 | |
| |
Financials | | | 1.6 | |
| |
Energy | | | 0.2 | |
| |
Short-term investments, other assets & liabilities, net | | | 1.3 | |
Total | | | 100.0 | |
12 2018 Annual Report ∎ TIAA-CREF Life Funds
Growth & Income Fund
Performance for the twelve months ended December 31, 2018
The Growth & Income Fund returned –7.25% for the year, compared with the –4.38% return of its benchmark, the S&P 500® Index.
The U.S. economy grew at a solid pace in 2018, while inflation remained moderate. The unemployment rate fell to 3.7%—its lowest level in nearly 50 years—before ending the period at 3.9% on December 31, 2018. Wage growth increased and consumer confidence was strong. The Federal Reserve responded to the growing economy by raising the federal funds target rate four times during the period, increasing the key short-term interest-rate measure to 2.25%–2.50%. Oil prices declined for the year, falling sharply over the final three months of the period. Concerns over rising interest rates, trade tensions with China and a decelerating global economy weighed on markets in the latter months of the period.
The S&P 500 Index, a market capitalization-weighted index of the stocks of 500 leading companies in leading industries of the U.S. economy, held up better than the Russell 3000® Index, which declined 5.24%. The broad Russell 3000 Index includesmid- andsmall-cap equities, which trailed large-caps for the year.
For the ten years ended December 31, 2018, the S&P 500 Index had an average annual return of 13.12%, versus the 13.18% average annual gain of the Russell 3000 Index.
Fund trailed its benchmark
Eight of the eleven industry sectors in the S&P 500 Index posted losses for the year. Information technology, the benchmark’s largest sector, declined marginally, as technology stocks tumbled late in the period. Energy (down 18.1%), materials (down 15.8%), industrials (down 13.3%) and financials (down 13.0%) were the worst performers. Together, these five sectors represented more thanone-half of the benchmark’s total market capitalization on December 31, 2018. Health care (up 6.8%), utilities (up 4.1%) and consumer discretionary (up 2.4%) were the best performers.
The main detractors from the Fund’s relative performance were anout-of-benchmark investment in ASOS, an overweight position in Conagra Brands and anout-of-benchmark holding in Parsley Energy. Online fashion retailer ASOS was affected by a weak pricing environment during the holiday season. Increased competition affected Conagra Brand’s food business. Slumping oil prices pressured U.S. shale producer Parsley Energy. A small exposure to derivatives instruments also hurt the Fund’s relative performance.
Conversely, the Fund’s largest contributors wereout-of-benchmark investments in World Wrestling Entertainment (WWE) and IAC/InterActiveCorp (IAC) and an overweight position in Boston Scientific. WWE’s stock soared amid two major television deals. Media and Internet company IAC reported strong revenue growth. Medical device maker Boston Scientific’s stock climbed on takeover rumors.
TIAA-CREF Life Funds ◾ 2018 Annual Report 13
Growth & Income Fund
| | | | | | | | | | | | | | | | | | | | | | |
Performance as of December 31, 2018 | | | | | | | | | | | | | | | | | | | | | | |
| | | | | Total
return | | | | | Average annual
total return | | | | | Annual operating
expenses* |
| | | Inception
date | | 1 year | | | | | 5 years | | | 10 years | | | | | gross | | net |
Growth & Income Fund | | 4/3/00 | | | -7.25 | % | | | | | 7.46 | % | | | 12.83 | % | | | | 0.58% | | 0.52% |
| | | | | | | | |
S&P 500® Index | | – | | | -4.38 | | | | | | 8.49 | | | | 13.12 | | | | | – | | – |
The returns in this report show past performance, which is no guarantee of future results. Returns and the principal value of your investment will fluctuate. Current performance may be higher or lower than that shown, and you may have a gain or a loss when you redeem your shares. For current performance information, including performance to the most recentmonth-end, please visit TIAA.org. Performance may reflect waivers or reimbursements of certain expenses. Absent these waivers or reimbursement arrangements, performance would have been lower.
Total returns for the shares of the Fund do not include the effect of expenses attributable to the variable annuity or variable life insurance product; if they did, returns for the shares of the Fund would have been lower.
You cannot invest directly in any index. Index returns do not include a deduction for fees or expenses.
| * | The gross and net annual operating expenses are taken from the Fund’s prospectus. The net annual operating expenses may at times reflect a contractual reimbursement of various expenses. The expense reimbursement will continue through at least April 30, 2019, unless changed with the approval of the Board of Trustees. Without these reimbursements, expenses would be higher and returns lower. |
$10,000 over 10 years
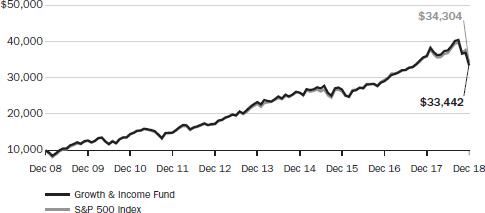
For the purpose of comparison, the graph also shows the change in the value of the Fund’s benchmark during the same period.
14 2018 Annual Report ∎ TIAA-CREF Life Funds
Growth & Income Fund
Expense example
Six months ended December 31, 2018
| | | | | | |
Growth & Income Fund | | Beginning
account value
(7/1/18) | | Ending
account value
(12/31/18) | | Expenses paid
during period*
(7/1/18–12/31/18) |
| | | |
Actual return | | $1,000.00 | | $ 889.87 | | $2.48 |
| | | |
5% annual hypothetical return | | 1,000.00 | | 1,022.58 | | 2.65 |
| * | “Expenses paid during period” is based on the Fund’s actual expense ratio for the most recent fiscal half-year, multiplied by the average account value over thesix-month period, multiplied by 184/365. There were 184 days in the six months ended December 31, 2018. The Fund’s annualizedsix-month expense ratio for that period was 0.52%. The expense charges of the Fund may reflect a waiver and/or reimbursement. Please see the prospectus for an explanation, including the date on which this reimbursement is scheduled to end. Without such waiver and reimbursement, the expenses of the Fund would be higher and its performance lower. |
For more information about this expense example, please see page 9.
Fund profile
| | |
| | | as of 12/31/2018 |
Net assets | | $129.67 million |
| |
Portfolio turnover rate | | 61% |
| |
Number of holdings | | 176 |
| |
Weighted median market capitalization | | $80.90 billion |
| |
Price/earnings ratio (weighted12-month trailing average)* | | 25.28 |
| * | Price/earnings ratio is the price of a stock divided by its earnings per share for the past twelve-month period. |
Holdings by company size
| | | | |
Market capitalization | | % of equity investments
as of 12/31/2018 | |
More than $50 billion | | | 60.4 | |
More than $15 billion–$50 billion | | | 20.3 | |
More than $2 billion–$15 billion | | | 18.8 | |
$2 billion or less | | | 0.5 | |
Total | | | 100.0 | |
Portfolio composition
| | | | |
Sector | | % of net assets
as of 12/31/2018 | |
Information technology | | | 20.4 | |
Health care | | | 18.0 | |
Financials | | | 11.2 | |
Communication services | | | 10.6 | |
Industrials | | | 9.0 | |
Consumer discretionary | | | 8.8 | |
Consumer staples | | | 8.5 | |
Energy | | | 5.5 | |
Materials | | | 4.3 | |
Utilities | | | 2.1 | |
Real estate | | | 0.8 | |
Short-term investments, other assets & liabilities, net | | | 0.8 | |
Total | | | 100.0 | |
TIAA-CREF Life Funds ◾ 2018 Annual Report 15
Large-Cap Value Fund
Performance for the twelve months ended December 31, 2018
TheLarge-Cap Value Fund returned –14.13% for the year, compared with the –8.27% return of its benchmark, the Russell 1000® Value Index.
The U.S. economy grew at a solid pace in 2018, while inflation remained moderate. The unemployment rate fell to 3.7%—its lowest level in nearly 50 years—before ending the period at 3.9% on December 31, 2018. Wage growth increased and consumer confidence was strong. The Federal Reserve responded to the growing economy by raising the federal funds target rate four times during the period, increasing the key short-term interest-rate measure to 2.25%–2.50%. Oil prices declined for the year, falling sharply over the final three months of the period. Concerns over rising interest rates, trade tensions with China and a decelerating global economy weighed on markets in the latter months of the period.
The broad U.S. stock market, as measured by the Russell 3000® Index, declined 5.24% for the twelve-month period as performance was negative across investment styles and capitalization sizes. Growth stocks performed better than value shares, andlarge-cap stocks surpassedmid- andsmall-cap equities. (Returns by investment style and capitalization size are based on the Russell indexes.)
For the ten years ended December 31, 2018, the Russell 1000 Value Index recorded an average annual gain of 11.18%, versus the 15.29% average annual return of the Russell 1000 Growth Index.
Fund trailed its benchmark
Eight of the eleven industry sectors in the Russell 1000 Value Index posted losses for the year. The worst-performing sectors were industrials (down 18.9%), energy (down 17.4%) and materials (down 17.2%). Financials (down 13.9%)—the benchmark’s largest sector—detracted most from the index’s return amid concerns that rising short-term interest rates would reduce banks’ profits. Together, these four sectors represented close toone-half of the benchmark’s total market capitalization on December 31, 2018. The sectors with positive performance were health care (up 7.8%), utilities (up 4.6%) and communication services (up 0.3%).
The Fund lagged its benchmark, mainly because of stock choices that did not perform as anticipated. The biggest detractor was an overweight position in Kraft Heinz, which faced higher ingredient and shipping costs. Anout-of-benchmark investment in aircraft manufacturer Bombardier, followed by overweight holdings in energy companies Weatherford International and Concho Resources, which were hurt by falling oil prices, were the next-biggest detractors.
These negative effects were partly offset by several favorable stock selections, led by a nonbenchmark holding in semiconductor maker Advanced Micro Devices.Out-of-index positions in Pandora Media and Molina Healthcare were the next-largest contributors to relative results.
16 2018 Annual Report ∎ TIAA-CREF Life Funds
Large-Cap Value Fund
| | | | | | | | | | | | | | | | | | | | | | |
Performance as of December 31, 2018 | | | | | | | | | | | | | | | | | | | | | | |
| | | | | Total
return | | | | | Average annual
total return | | | | | Annual operating
expenses* |
| | | Inception
date | | 1 year | | | | | 5 years | | | 10 years | | | | | gross | | net |
Large-Cap Value Fund | | 10/28/02 | | | -14.13 | % | | | | | 3.47 | % | | | 10.85 | % | | | | 0.63% | | 0.52% |
| | | | | | | | |
Russell 1000® Value Index | | – | | | -8.27 | | | | | | 5.95 | | | | 11.18 | | | | | – | | – |
The returns in this report show past performance, which is no guarantee of future results. Returns and the principal value of your investment will fluctuate. Current performance may be higher or lower than that shown, and you may have a gain or a loss when you redeem your shares. For current performance information, including performance to the most recentmonth-end, please visit TIAA.org. Performance may reflect waivers or reimbursements of certain expenses. Absent these waivers or reimbursement arrangements, performance would have been lower.
Total returns for the shares of the Fund do not include the effect of expenses attributable to the variable annuity or variable life insurance product; if they did, returns for the shares of the Fund would have been lower.
You cannot invest directly in any index. Index returns do not include a deduction for fees or expenses.
| * | The gross and net annual operating expenses are taken from the Fund’s prospectus. The net annual operating expenses may at times reflect a contractual reimbursement of various expenses. The expense reimbursement will continue through at least April 30, 2019, unless changed with the approval of the Board of Trustees. Without these reimbursements, expenses would be higher and returns lower. |
$10,000 over 10 years
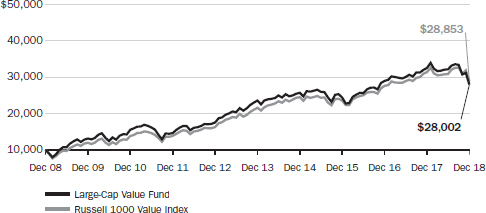
For the purpose of comparison, the graph also shows the change in the value of the Fund’s benchmark during the same period.
TIAA-CREF Life Funds ◾ 2018 Annual Report 17
Large-Cap Value Fund
Expense example
Six months ended December 31, 2018
| | | | | | |
Large-Cap Value Fund | | Beginning
account value
(7/1/18) | | Ending
account value
(12/31/18) | | Expenses paid
during period*
(7/1/18–12/31/18) |
| | | |
Actual return | | $1,000.00 | | $ 869.20 | | $2.45 |
| | | |
5% annual hypothetical return | | 1,000.00 | | 1,022.58 | | 2.65 |
| * | “Expenses paid during period” is based on the Fund’s actual expense ratio for the most recent fiscal half-year, multiplied by the average account value over thesix-month period, multiplied by 184/365. There were 184 days in the six months ended December 31, 2018. The Fund’s annualizedsix-month expense ratio for that period was 0.52%. The expense charges of the Fund may reflect a waiver and/or reimbursement. Please see the prospectus for an explanation, including the date on which this reimbursement is scheduled to end. Without such waiver and reimbursement, the expenses of the Fund would be higher and its performance lower. |
For more information about this expense example, please see page 9.
Fund profile
| | |
| | | as of 12/31/2018 |
Net assets | | $62.96 million |
Portfolio turnover rate | | 107% |
Number of holdings | | 81 |
Weighted median market capitalization | | $124.47 billion |
Price/earnings ratio (weighted12-month trailing average)* | | 17.23 |
| * | Price/earnings ratio is the price of a stock divided by its earnings per share for the past twelve-month period. |
Holdings by company size
| | | | |
Market capitalization | | % of equity investments as of 12/31/2018 | |
More than $50 billion | | | 70.6 | |
More than $15 billion–$50 billion | | | 22.2 | |
More than $2 billion–$15 billion | | | 7.2 | |
Total | | | 100.0 | |
Portfolio composition
| | | | |
Sector | | % of net assets
as of 12/31/2018 | |
Financials | | | 24.8 | |
Health care | | | 19.6 | |
Information technology | | | 12.1 | |
Energy | | | 10.4 | |
Industrials | | | 10.4 | |
Communication services | | | 5.9 | |
Consumer staples | | | 5.4 | |
Utilities | | | 4.5 | |
Materials | | | 4.4 | |
Consumer discretionary | | | 2.0 | |
Short-term investments, other assets & liabilities, net | | | 0.5 | |
Total | | | 100.0 | |
18 2018 Annual Report ∎ TIAA-CREF Life Funds
Real Estate Securities Fund
Performance for the twelve months ended December 31, 2018
The Real Estate Securities Fund returned –4.23% for the year, compared with the –4.04% return of its benchmark, the FTSE Nareit All Equity REITs Index.
For the year, the FTSE index surpassed the –5.24% return of the broad U.S. stock market, as measured by the Russell 3000® Index. However, the Fund’s benchmark trailed the 0.01% return of the domestic investment-grade fixed-rate bond market, as measured by the Bloomberg Barclays U.S. Aggregate Bond Index.
REITs (real estate investment trusts), as measured by the FTSE Nareit All Equity REITs Index, declined for the twelve months amid rising U.S. interest rates. The U.S. economy grew at a solid pace in 2018, while inflation remained moderate. The unemployment rate fell to 3.7%—its lowest level in nearly 50 years—before ending the period at 3.9% on December 31, 2018. Wage growth increased and consumer confidence was strong. The Federal Reserve responded to the growing economy by raising the federal funds target rate four times during the period, increasing the key short-term interest-rate measure to 2.25%–2.50%. Despite the strong U.S. economic performance, concerns over rising interest rates, trade tensions with China and a decelerating global economy weighed on markets in the latter months of the period.
For the ten years ended December 31, 2018, the Fund’s benchmark generated an average annual return of 12.53%, modestly underperforming the 13.18% average annual gain of the Russell 3000 Index but outpacing the 3.48% average annual return of the Bloomberg Barclays U.S. Aggregate Bond Index.
Fund trailed its benchmark
Among the benchmark’s 16 property sectors and subsectors, most declined for the year. The benchmark’s worst performers included timber (down 32.0%), shopping centers (down 14.5%) and office REITs (down 14.5%). The top performers were free standing retail (up 14.3%), manufactured homes (up 11.4%) and health care (up 7.6%).
In 2018, the Fund trailed its benchmark, primarily due to investment decisions that did not perform as anticipated. An overweight position in QTS Realty Trust, a provider of data center solutions, detracted most from the Fund’s relative performance, followed by an underweight position in telecommunication services company American Tower. The Fund was also hurt by not owning specialized REIT Omega Healthcare Investors.
These negative effects were partly offset by overweight positions in Sun Communities and Equity LifeStyle Properties, both of which are residential REITs. An underweight investment in poorly performing real estate investment manager Colony Capital also benefited the Fund’s relative performance.
TIAA-CREF Life Funds ◾ 2018 Annual Report 19
Real Estate Securities Fund
| | | | | | | | | | | | | | | | | | | | | | |
Performance as of December 31, 2018 | | | | | | | | | | | | | | | | | | | | | | |
| | | | | Total
return | | | | | Average annual
total return | | | | | Annual operating
expenses* |
| | | Inception
date | | 1 year | | | | | 5 years | | | 10 years | | | | | gross | | net |
Real Estate Securities Fund | | 10/28/02 | | | -4.23 | % | | | | | 8.44 | % | | | 12.35 | % | | | | 0.66% | | 0.57% |
| | | | | | | | |
FTSE Nareit All Equity REITs Index | | – | | | -4.04 | | | | | | 8.32 | | | | 12.53 | | | | | – | | – |
The returns in this report show past performance, which is no guarantee of future results. Returns and the principal value of your investment will fluctuate. Current performance may be higher or lower than that shown, and you may have a gain or a loss when you redeem your shares. For current performance information, including performance to the most recentmonth-end, please visit TIAA.org. Performance may reflect waivers or reimbursements of certain expenses. Absent these waivers or reimbursement arrangements, performance would have been lower.
Total returns for the shares of the Fund do not include the effect of expenses attributable to the variable annuity or variable life insurance product; if they did, returns for the shares of the Fund would have been lower.
You cannot invest directly in any index. Index returns do not include a deduction for fees or expenses.
| * | The gross and net annual operating expenses are taken from the Fund’s prospectus. The net annual operating expenses may at times reflect a contractual reimbursement of various expenses. The expense reimbursement will continue through at least April 30, 2019, unless changed with the approval of the Board of Trustees. Without these reimbursements, expenses would be higher and returns lower. |
$10,000 over 10 years
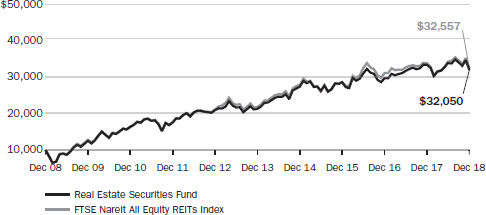
For the purpose of comparison, the graph also shows the change in the value of the Fund’s benchmark during the same period.
20 2018 Annual Report ∎ TIAA-CREF Life Funds
Real Estate Securities Fund
Expense example
Six months ended December 31, 2018
| | | | | | |
Real Estate Securities Fund | | Beginning
account value
(7/1/18) | | Ending
account value
(12/31/18) | | Expenses paid
during period*
(7/1/18–12/31/18) |
| | | |
Actual return | | $1,000.00 | | $ 943.15 | | $2.79 |
| | | |
5% annual hypothetical return | | 1,000.00 | | 1,022.33 | | 2.91 |
| * | “Expenses paid during period” is based on the Fund’s actual expense ratio for the most recent fiscal half-year, multiplied by the average account value over thesix-month period, multiplied by 184/365. There were 184 days in the six months ended December 31, 2018. The Fund’s annualizedsix-month expense ratio for that period was 0.57%. The expense charges of the Fund may reflect a waiver and/or reimbursement. Please see the prospectus for an explanation, including the date on which this reimbursement is scheduled to end. Without such waiver and reimbursement, the expenses of the Fund would be higher and its performance lower. |
For more information about this expense example, please see page 9.
Fund profile
| | |
| | |
| | | as of 12/31/2018 |
| |
Net assets | | $67.14 million |
| |
Portfolio turnover rate | | 34% |
| |
Number of holdings | | 53 |
| |
Weighted median market capitalization | | $16.20 billion |
| |
Price/earnings ratio (weighted12-month trailing average)* | | 38.43 |
| * | Price/earnings ratio is the price of a stock divided by its earnings per share for the past twelve-month period. |
Holdings by company size
| | | | |
| | |
Market capitalization | | % of equity investments
as of 12/31/2018 | |
| |
More than $50 billion | | | 12.8 | |
| |
More than $15 billion–$50 billion | | | 37.7 | |
| |
More than $2 billion–$15 billion | | | 44.1 | |
| |
$2 billion or less | | | 5.4 | |
| |
Total | | | 100.0 | |
Portfolio composition
| | | | |
| | |
Sector | | % of net assets as of 12/31/2018 | |
| |
Specialized REITs | | | 26.5 | |
| |
Residential REITs | | | 20.4 | |
| |
Retail REITs | | | 14.9 | |
| |
Office REITs | | | 11.6 | |
| |
Industrial REITs | | | 10.4 | |
| |
Health care REITs | | | 7.0 | |
| |
Hotel & resort REITs | | | 3.6 | |
| |
Mortgage REITs | | | 1.3 | |
| |
Homebuilding | | | 0.8 | |
| |
Data processing & outsourced services | | | 0.7 | |
| |
Casinos & gaming | | | 0.7 | |
| |
IT consulting & other services | | | 0.4 | |
| |
Real estate operating companies | | | 0.3 | |
| |
Diversified REITs | | | 0.2 | |
| |
Short-term investments, other assets & liabilities, net | | | 1.2 | |
| |
Total | | | 100.0 | |
TIAA-CREF Life Funds ◾ 2018 Annual Report 21
Small-Cap Equity Fund
Performance for the twelve months ended December 31, 2018
TheSmall-Cap Equity Fund returned –12.05% for the year, compared with the –11.01% return of its benchmark, the Russell 2000® Index.
The U.S. economy grew at a solid pace in 2018, while inflation remained moderate. The unemployment rate fell to 3.7%—its lowest level in nearly 50 years—before ending the period at 3.9% on December 31, 2018. Wage growth increased and consumer confidence was strong. The Federal Reserve responded to the growing economy by raising the federal funds target rate four times during the period, increasing the key short-term interest-rate measure to 2.25%–2.50%. Oil prices declined for the year, falling sharply over the final three months of the period. Concerns over rising interest rates, trade tensions with China and a decelerating global economy weighed on markets in the latter months of the period.
The broad U.S. stock market, as measured by the Russell 3000® Index, declined 5.24% for the twelve-month period as performance was negative across investment styles and capitalization sizes. Growth stocks performed better than value shares, andlarge-cap stocks surpassedmid- andsmall-cap equities. (Returns by investment style and capitalization size are based on the Russell indexes.)
For the ten years ended December 31, 2018, the Russell 2000 Index generated an average annual gain of 11.97%, versus the 13.18% average annual return of the Russell 3000 Index.
Fund trailed its benchmark
Ten of the eleven industry sectors in the Russell 2000 Index posted losses for the year. Energy (down 39.3%) was the worst-performing sector. Next came materials (down 25.5%) and industrials (down 17.4%), the latter detracting most from the benchmark’s return. Financials (down 10.8%)—the index’s largest sector—fared better but was still weak. Together, these four sectors represented more thantwo-fifths of the benchmark’s total market capitalization on December 31, 2018. Utilities (up 2.8%) was the only sector to advance.
The Fund underperformed its benchmark, mainly due to stock choices that did not perform as anticipated. Chief among these was an overweight position in Patrick Industries, a supplier of products used to build recreational vehicles (RVs) that was hurt by a softer outlook for the RV industry. The next-largest detractors were overweight holdings in industrial company GMS and chemical producer Koppers.
Other stock selections were advantageous. The top contributor was an overweight investment in business services provider Insperity, which benefited from strong client retention rates. Overweight positions in technology firm Electro Scientific Industries and marketing company USANA Health Sciences were the next-largest contributors.
22 2018 Annual Report ∎ TIAA-CREF Life Funds
Small-Cap Equity Fund
| | | | | | | | | | | | | | | | | | | | | | |
Performance as of December 31, 2018 | | | | | | | | | | | | | | | | | | | | | | |
| | | | | Total
return | | | | | Average annual
total return | | | | | Annual operating expenses* |
| | | Inception
date | | 1 year | | | | | 5 years | | | 10 years | | | | | gross | | net |
Small-Cap Equity Fund | | 10/28/02 | | | -12.05 | % | | | | | 5.26 | % | | | 12.39 | % | | | | 0.71% | | 0.53% |
| | | | | | | | |
Russell 2000® Index | | – | | | -11.01 | | | | | | 4.41 | | | | 11.97 | | | | | – | | – |
The returns in this report show past performance, which is no guarantee of future results. Returns and the principal value of your investment will fluctuate. Current performance may be higher or lower than that shown, and you may have a gain or a loss when you redeem your shares. For current performance information, including performance to the most recentmonth-end, please visit TIAA.org. Performance may reflect waivers or reimbursements of certain expenses. Absent these waivers or reimbursement arrangements, performance would have been lower.
Total returns for the shares of the Fund do not include the effect of expenses attributable to the variable annuity or variable life insurance product; if they did, returns for the shares of the Fund would have been lower.
You cannot invest directly in any index. Index returns do not include a deduction for fees or expenses.
| * | The gross and net annual operating expenses are taken from the Fund’s prospectus. The net annual operating expenses may at times reflect a contractual reimbursement of various expenses. The expense reimbursement will continue through at least April 30, 2019, unless changed with the approval of the Board of Trustees. Without these reimbursements, expenses would be higher and returns lower. |
$10,000 over 10 years
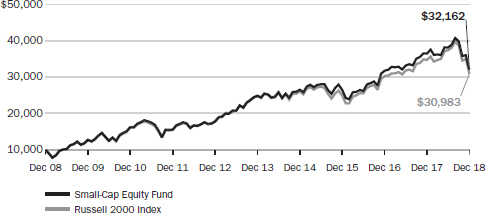
For the purpose of comparison, the graph also shows the change in the value of the Fund’s benchmark during the same period.
TIAA-CREF Life Funds ◾ 2018 Annual Report 23
Small-Cap Equity Fund
Expense example
Six months ended December 31, 2018
| | | | | | |
Small-Cap Equity Fund | | Beginning
account value
(7/1/18) | | Ending
account value
(12/31/18) | | Expenses paid
during period*
(7/1/18–12/31/18) |
| | | |
Actual return | | $1,000.00 | | $ 841.22 | | $2.46 |
| | | |
5% annual hypothetical return | | 1,000.00 | | 1,022.53 | | 2.70 |
| * | “Expenses paid during period” is based on the Fund’s actual expense ratio for the most recent fiscal half-year, multiplied by the average account value over thesix-month period, multiplied by 184/365. There were 184 days in the six months ended December 31, 2018. The Fund’s annualizedsix-month expense ratio for that period was 0.53%. The expense charges of the Fund may reflect a waiver and/or reimbursement. Please see the prospectus for an explanation, including the date on which this reimbursement is scheduled to end. Without such waiver and reimbursement, the expenses of the Fund would be higher and its performance lower. |
For more information about this expense example, please see page 9.
Fund profile
| | |
| | |
| | | as of 12/31/2018 |
| |
Net assets | | $46.42 million |
| |
Portfolio turnover rate | | 86% |
| |
Number of holdings | | 310 |
| |
Weighted median market capitalization | | $2.14 billion |
| |
Price/earnings ratio (weighted12-month trailing average)* | | 24.83 |
| * | Price/earnings ratio is the price of a stock divided by its earnings per share for the past twelve-month period. |
Holdings by company size
| | | | |
| | |
Market capitalization | | % of equity investments
as of 12/31/2018 | |
| |
More than $15 billion–$50 billion | | | 1.4 | |
| |
More than $2 billion–$15 billion | | | 53.6 | |
| |
$2 billion or less | | | 45.0 | |
| |
Total | | | 100.0 | |
Portfolio composition
| | | | |
| | |
| Sector | | % of net assets
as of 12/31/2018 | |
| |
Financials | | | 18.2 | |
| |
Industrials | | | 15.5 | |
| |
Information technology | | | 15.4 | |
| |
Health care | | | 15.2 | |
| |
Consumer discretionary | | | 11.3 | |
| |
Real estate | | | 7.9 | |
| |
Energy | | | 4.4 | |
| |
Utilities | | | 4.1 | |
| |
Materials | | | 3.5 | |
| |
Consumer staples | | | 2.2 | |
| |
Communication services | | | 1.9 | |
| |
Short-term investments, other assets & liabilities, net | | | 0.4 | |
| |
Total | | | 100.0 | |
24 2018 Annual Report ∎ TIAA-CREF Life Funds
Social Choice Equity Fund
Performance for the twelve months ended December 31, 2018
The Social Choice Equity Fund returned –5.55% for the year, compared with the –5.24% return of its benchmark, the Russell 3000® Index. The Fund utilizes environmental, social and governance (ESG) criteria, while the benchmark does not.
Because of its ESG criteria, the Fund did not invest in a number of stocks that were included in the Russell 3000 Index. Avoiding these companies produced mixed results, but the net effect was that the Fund underperformed its benchmark.
Notable detractors among stocks the Fund excluded were Amazon.com, Pfizer and Visa. Amazon reported record profits in 2018, helped by itse-commerce and cloud computing businesses. Pfizer’s stock soared in the second half of the year, benefiting from strong drug sales. Visa’s stock gained due in part to increased electronic transactions as more companies conduct business online.
By contrast, avoiding Facebook, General Electric (GE) and Philip Morris International helped the Fund’s relative performance. In addition to slowing revenue growth, Facebook was plagued by privacy concerns affecting many Silicon Valley companies. GE’s stock plummeted in 2018 as the company faced mounting losses and struggled to turn around its business. Philip Morris International declined due to the company’s transition away from selling cigarettes, as well as from slower sales of a new heated tobacco product in Japan.
Fund trailed its benchmark
To compensate for the Fund’s exclusion of some stocks within the Russell 3000 Index, the Fund’s managers use quantitative (mathematical) modeling and other techniques in an attempt to match the overall investment characteristics of the portfolio with those of its index and to manage risk.
Among stocks the Fund held, three detractors stood out—underweight positions in Apple and Johnson & Johnson and an overweight position in Schlumberger. Apple was the first publicly traded U.S. firm to reach $1 trillion in market value in 2018, but its stock declined late in the year due in part to disappointing sales of its new iPhone X. Johnson & Johnson struggled with changing consumer tastes and lawsuits over its baby powder. Oilfield services company Schlumberger posted slightly better profits in its most recent report, but warned of slowing hydraulic fracturing activity, transportation bottlenecks and declining oil prices.
On the positive side, overweight positions in Netflix, Eli Lilly and salesforce.com contributed to the Fund’s relative performance. Netflix benefited from impressive subscriber growth and the popularity of its original content. Pharmaceutical giant Eli Lilly’s stock soared on expectations for robust sales of newer drugs. Finally, salesforce.com, a developer of customer relationship management software, posted strong revenue growth.
TIAA-CREF Life Funds ◾ 2018 Annual Report 25
Social Choice Equity Fund
| | | | | | | | | | | | | | | | | | | | | | |
Performance as of December 31, 2018 | | | | | | | | | | | | | | | | | | | | | | |
| | | | | Total
return | | | | | Average annual
total return | | | | | Annual operating
expenses* |
| | | Inception
date | | 1 year | | | | | 5 years | | | 10 years | | | | | gross | | net |
Social Choice Equity Fund | | 4/3/00 | | | -5.55 | % | | | | | 6.94 | % | | | 12.63 | % | | | | 0.33% | | 0.22% |
| | | | | | | | |
Russell 3000® Index | | – | | | -5.24 | | | | | | 7.91 | | | | 13.18 | | | | | – | | – |
The returns in this report show past performance, which is no guarantee of future results. Returns and the principal value of your investment will fluctuate. Current performance may be higher or lower than that shown, and you may have a gain or a loss when you redeem your shares. For current performance information, including performance to the most recentmonth-end, please visit TIAA.org. Performance may reflect waivers or reimbursements of certain expenses. Absent these waivers or reimbursement arrangements, performance would have been lower.
Total returns for the shares of the Fund do not include the effect of expenses attributable to the variable annuity or variable life insurance product; if they did, returns for the shares of the Fund would have been lower.
You cannot invest directly in any index. Index returns do not include a deduction for fees or expenses.
| * | The gross and net annual operating expenses are taken from the Fund’s prospectus. The net annual operating expenses may at times reflect a contractual reimbursement of various expenses. The expense reimbursement will continue through at least April 30, 2019, unless changed with the approval of the Board of Trustees. Without these reimbursements, expenses would be higher and returns lower. |
$10,000 over 10 years
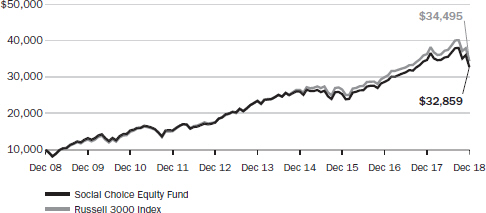
For the purpose of comparison, the graph also shows the change in the value of the Fund’s benchmark during the same period.
26 2018 Annual Report ∎ TIAA-CREF Life Funds
Social Choice Equity Fund
Expense example
Six months ended December 31, 2018
| | | | | | |
Social Choice Equity Fund | | Beginning
account value
(7/1/18) | | Ending
account value
(12/31/18) | | Expenses paid
during period*
(7/1/18–12/31/18) |
| | | |
Actual return | | $1,000.00 | | $ 921.10 | | $1.07 |
| | | |
5% annual hypothetical return | | 1,000.00 | | 1,024.10 | | 1.12 |
| * | “Expenses paid during period” is based on the Fund’s actual expense ratio for the most recent fiscal half-year, multiplied by the average account value over thesix-month period, multiplied by 184/365. There were 184 days in the six months ended December 31, 2018. The Fund’s annualizedsix-month expense ratio for that period was 0.22%. The expense charges of the Fund may reflect a waiver and/or reimbursement. Please see the prospectus for an explanation, including the date on which this reimbursement is scheduled to end. Without such waiver and reimbursement, the expenses of the Fund would be higher and its performance lower. |
For more information about this expense example, please see page 9.
Fund profile
| | |
| | |
| | | as of 12/31/2018 |
| |
Net assets | | $55.84 million |
| |
Portfolio turnover rate | | 38% |
| |
Number of holdings | | 581 |
| |
Weighted median market capitalization | | $47.50 billion |
| |
Price/earnings ratio (weighted12-month trailing average)* | | 20.97 |
| * | Price/earnings ratio is the price of a stock divided by its earnings per share for the past twelve-month period. |
Holdings by company size
| | | | |
| | |
Market capitalization | | % of equity investments
as of 12/31/2018 | |
| |
More than $50 billion | | | 48.8 | |
| |
More than $15 billion–$50 billion | | | 32.8 | |
| |
More than $2 billion–$15 billion | | | 15.4 | |
| |
$2 billion or less | | | 3.0 | |
| |
Total | | | 100.0 | |
Portfolio composition
| | | | |
| | |
Sector | | % of net assets as of 12/31/2018 | |
| |
Information technology | | | 20.8 | |
| |
Health care | | | 15.4 | |
| |
Financials | | | 14.8 | |
| |
Industrials | | | 9.8 | |
| |
Consumer discretionary | | | 9.4 | |
| |
Communication services | | | 6.5 | |
| |
Consumer staples | | | 6.5 | |
| |
Energy | | | 4.7 | |
| |
Utilities | | | 3.7 | |
| |
Real estate | | | 3.7 | |
| |
Materials | | | 3.1 | |
| |
Short-term investments, other assets & liabilities, net | | | 1.6 | |
| |
Total | | | 100.0 | |
TIAA-CREF Life Funds ◾ 2018 Annual Report 27
Stock Index Fund
Performance for the twelve months ended December 31, 2018
The Stock Index Fund returned –5.28% for the year, compared with the –5.24% return of its benchmark, the Russell 3000® Index.
For the twelve-month period, the Fund’s return underperformed that of its benchmark index due to the effect of expenses. The Fund’s return includes a deduction for expenses, while the benchmark’s does not. The Fund had a risk profile similar to that of its benchmark.
The U.S. economy grew at a solid pace in 2018, while inflation remained moderate. The unemployment rate fell to 3.7%—its lowest level in nearly 50 years—before ending the period at 3.9% on December 31, 2018. Wage growth increased and consumer confidence was strong. The Federal Reserve responded to the growing economy by raising the federal funds target rate four times during the period, increasing the key short-term interest-rate measure to 2.25%–2.50%. Oil prices declined for the year, falling sharply over the final three months of the period. Concerns over rising interest rates, trade tensions with China and a decelerating global economy weighed on markets in the latter months of the period.
The performance of the broad U.S. stock market, as measured by the Russell 3000 Index, was negative across investment styles and capitalization sizes. Growth stocks performed better than value shares, andlarge-cap stocks surpassedmid- andsmall-cap equities. (Returns by investment style and capitalization size are based on the Russell indexes.)
Financials and industrials led the benchmark’s decline
Eight of the eleven industry sectors in the Russell 3000 Index posted losses for the year. The worst-performing sectors were energy (down 19.8%), materials (down 17.4%) and industrials (down 14.0%). Financials (down 12.7%)—the benchmark’s second-largest sector—detracted most from the index’s return amid concerns that rising short-term interest rates would reduce banks’ profits. Together, these four sectors represented more thanone-third of the benchmark’s total market capitalization on December 31, 2018. The sectors with positive performance were health care (up 5.2%), utilities (up 4.5%) and information technology (up 3.1%), which was the index’s largest sector.
For the twelve-month period, four of the benchmark’s five largest stocks outperformed the benchmark’s overall return. Amazon.com performed best with strong double-digit gains, followed by Microsoft. Berkshire Hathaway posted a single-digit rise. Johnson & Johnson declined amid uncertainty about drug prices but outpaced the benchmark’s return. Apple slightly underperformed the index as concerns about U.S.-Chinese trade issues and slowing global growth weighed on the stock.
28 2018 Annual Report ∎ TIAA-CREF Life Funds
Stock Index Fund
| | | | | | | | | | | | | | | | | | | | | | |
Performance as of December 31, 2018 | | | | | | | | | | | | | | | | | | | | | | |
| | | | | Total
return | | | | | Average annual
total return | | | | | Annual operating
expenses* |
| | | Inception
date | | 1 year | | | | | 5 years | | | 10 years | | | | | gross | | net |
Stock Index Fund | | 1/4/99 | | | -5.28 | % | | | | | 7.85 | % | | | 13.11 | % | | | | 0.12% | | 0.09% |
| | | | | | | | |
Russell 3000® Index | | – | | | -5.24 | | | | | | 7.91 | | | | 13.18 | | | | | – | | – |
The returns in this report show past performance, which is no guarantee of future results. Returns and the principal value of your investment will fluctuate. Current performance may be higher or lower than that shown, and you may have a gain or a loss when you redeem your shares. For current performance information, including performance to the most recentmonth-end, please visit TIAA.org. Performance may reflect waivers or reimbursements of certain expenses. Absent these waivers or reimbursement arrangements, performance would have been lower.
Total returns for the shares of the Fund do not include the effect of expenses attributable to the variable annuity or variable life insurance product; if they did, returns for the shares of the Fund would have been lower.
You cannot invest directly in any index. Index returns do not include a deduction for fees or expenses.
| * | The gross and net annual operating expenses are taken from the Fund’s prospectus. The net annual operating expenses may at times reflect a contractual reimbursement of various expenses. The expense reimbursement will continue through at least April 30, 2019, unless changed with the approval of the Board of Trustees. Without these reimbursements, expenses would be higher and returns lower. |
$10,000 over 10 years
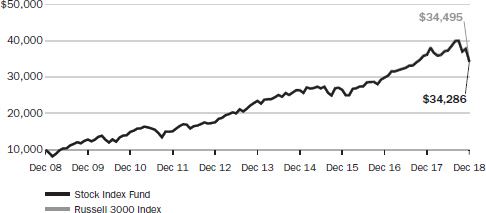
For the purpose of comparison, the graph also shows the change in the value of the Fund’s benchmark during the same period.
TIAA-CREF Life Funds ◾ 2018 Annual Report 29
Stock Index Fund
Expense example
Six months ended December 31, 2018
| | | | | | | | | | | | |
Stock Index Fund | | Beginning
account value
(7/1/18) | | | Ending
account value
(12/31/18) | | | Expenses paid
during period*
(7/1/18-12/31/18) | |
Actual return | | | $1,000.00 | | | | $ 918.17 | | | | $0.44 | |
5% annual hypothetical return | | | 1,000.00 | | | | 1,024.75 | | | | 0.46 | |
| * | “Expenses paid during period” is based on the Fund’s actual expense ratio for the most recent fiscal half-year, multiplied by the average account value over thesix-month period, multiplied by 184/365. There were 184 days in the six months ended December 31, 2018. The Fund’s annualizedsix-month expense ratio for that period was 0.09%. The expense charges of the Fund may reflect a waiver and/or reimbursement. Please see the prospectus for an explanation, including the date on which this reimbursement is scheduled to end. Without such waiver and reimbursement, the expenses of the Fund would be higher and its performance lower. |
For more information about this expense example, please see page 9.
Fund profile
| | | | |
| | | as of 12/31/2018 | |
Net assets | | | $429.53 million | |
| |
Portfolio turnover rate | | | 4% | |
| |
Number of holdings | | | 2,933 | |
| |
Weighted median market capitalization | | | $67.26 billion | |
| |
Price/earnings ratio (weighted12-month trailing average)* | | | 20.05 | |
| * | Price/earnings ratio is the price of a stock divided by its earnings per share for the past twelve-month period. |
Holdings by company size
| | | | |
Market capitalization | | % of equity investments
as of 12/31/2018 | |
| |
More than $50 billion | | | 54.4 | |
| |
More than $15 billion–$50 billion | | | 22.6 | |
| |
More than $2 billion–$15 billion | | | 19.0 | |
| |
$2 billion or less | | | 4.0 | |
Total | | | 100.0 | |
Portfolio composition
| | | | |
Sector | | % of net assets
as of 12/31/2018 | |
| |
Information technology | | | 19.6 | |
| |
Health care | | | 14.7 | |
| |
Financials | | | 13.6 | |
| |
Consumer discretionary | | | 10.1 | |
| |
Industrials | | | 9.7 | |
| |
Communication services | | | 8.9 | |
| |
Consumer staples | | | 6.5 | |
| |
Energy | | | 4.9 | |
| |
Real estate | | | 3.8 | |
| |
Utilities | | | 3.2 | |
| |
Materials | | | 3.0 | |
| |
Short-term investments, other assets & liabilities, net | | | 2.0 | |
Total | | | 100.0 | |
30 2018 Annual Report ∎ TIAA-CREF Life Funds
International Equity Fund
Performance for the twelve months ended December 31, 2018
The International Equity Fund returned –23.58% for the year, compared with the –13.79% return of its benchmark, the MSCI EAFE Index.
During the twelve-month period, declines in foreign equities exceeded those of U.S. equities amid slowing economic growth in many parts of the world and rising global trade tensions. Stock prices fell in both developed- and emerging-markets countries. GDP in the19-nation euro area grew at its slowest pace in four years during the third quarter of 2018, with notable contractions in the economies of Germany and Italy. China’s economic growth slowed to 6.5% in the third quarter—its worst year-over-year performance since 2009—while Japan struggled with natural disasters and declining exports. The U.S. Federal Reserve raised the federal funds target rate four times during the period, increasing the key short-term interest-rate measure to 2.25%–2.50%. In September, the European Central Bank indicated it would leave benchmark interest rates at their low levels until at least the summer of 2019. The Bank of England raised its benchmark interest rate to 0.75% in August; toward the end of the year, however, the bank noted that uncertainty over the United Kingdom’s plan to exit the European Union was evident in financial markets.
All of the country components within the MSCI EAFE Index, which includes 21 developed nations outside North America, declined in U.S.-dollar terms. The strong U.S. dollar was a headwind to performance.
Fund trailed its benchmark
In 2018, the Fund trailed its benchmark, primarily due to investment decisions that did not perform as anticipated. The largest detractors were overweight positions in Swiss banking giant Credit Suisse, Italian bank UniCredit and German chemical producer LANXESS.
On the positive side, the Fund’s biggest contributors were overweight positions in German industrial gases producer Linde, Japanese consumer electronics giant Sony and French luxury goods company Kering.
The Fund’s returns may sometimes diverge from the returns of its benchmark more than would be expected. This divergence may be the result of the Fund’s fair value pricing adjustments or of the timing of foreign currency valuations. Many foreign exchanges close for trading before the Fund’s net asset value (NAV) is calculated (see the Fund’s current prospectus for more details on NAV calculations). In the intervening hours, the values of foreign securities can change, and these changes are not reflected immediately in the returns of the Fund’s benchmark. These changes are, however, taken into account to value the Fund’s portfolio holdings at the time the Fund’s NAV is calculated; these are known as fair value pricing adjustments.
TIAA-CREF Life Funds ◾ 2018 Annual Report 31
International Equity Fund
| | | | | | | | | | | | | | | | | | | | | | |
Performance as of December 31, 2018 | | | | | | | | | | | | | | | | | | | | | | |
| | | | | Total
return | | | | | Average annual
total return | | | | | Annual operating
expenses* |
| | | Inception
date | | 1 year | | | | | 5 years | | | 10 years | | | | | gross | | net |
International Equity Fund | | 4/3/00 | | | -23.58 | % | | | | | -1.30 | % | | | 6.24 | % | | | | 0.70% | | 0.60% |
| | | | | | | | |
MSCI EAFE Index | | – | | | -13.79 | | | | | | 0.53 | | | | 6.32 | | | | | – | | – |
The returns in this report show past performance, which is no guarantee of future results. Returns and the principal value of your investment will fluctuate. Current performance may be higher or lower than that shown, and you may have a gain or a loss when you redeem your shares. For current performance information, including performance to the most recentmonth-end, please visit TIAA.org. Performance may reflect waivers or reimbursements of certain expenses. Absent these waivers or reimbursement arrangements, performance would have been lower.
Total returns for the shares of the Fund do not include the effect of expenses attributable to the variable annuity or variable life insurance product; if they did, returns for the shares of the Fund would have been lower.
You cannot invest directly in any index. Index returns do not include a deduction for fees or expenses.
| * | The gross and net annual operating expenses are taken from the Fund’s prospectus. The net annual operating expenses may at times reflect a contractual reimbursement of various expenses. The expense reimbursement will continue through at least April 30, 2019, unless changed with the approval of the Board of Trustees. Without these reimbursements, expenses would be higher and returns lower. |
$10,000 over 10 years
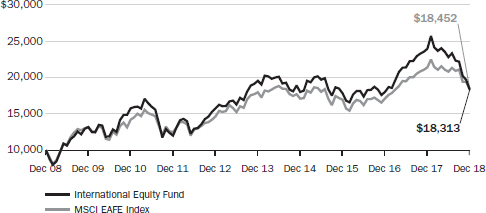
For the purpose of comparison, the graph also shows the change in the value of the Fund’s benchmark during the same period.
32 2018 Annual Report ∎ TIAA-CREF Life Funds
International Equity Fund
Expense example
Six months ended December 31, 2018
| | | | | | |
International Equity Fund | | Beginning
account value
(7/1/18) | | Ending
account value
(12/31/18) | | Expenses paid
during period*
(7/1/18–12/31/18) |
| | | |
Actual return | | $1,000.00 | | $ 802.86 | | $2.73 |
| | | |
5% annual hypothetical return | | 1,000.00 | | 1,022.18 | | 3.06 |
| * | “Expenses paid during period” is based on the Fund’s actual expense ratio for the most recent fiscal half-year, multiplied by the average account value over thesix-month period, multiplied by 184/365. There were 184 days in the six months ended December 31, 2018. The Fund’s annualizedsix-month expense ratio for that period was 0.60%. The expense charges of the Fund may reflect a waiver and/or reimbursement. Please see the prospectus for an explanation, including the date on which this reimbursement is scheduled to end. Without such waiver and reimbursement, the expenses of the Fund would be higher and its performance lower. |
For more information about this expense example, please see page 9.
Fund profile
| | |
| | |
| | | as of 12/31/2018 |
| |
Net assets | | $86.05 million |
| |
Portfolio turnover rate | | 67% |
| |
Number of holdings | | 63 |
| |
Weighted median market capitalization | | $27.94 billion |
| |
Price/earnings ratio (weighted12-month trailing average)* | | 11.58 |
| * | Price/earnings ratio is the price of a stock divided by its earnings per share for the past twelve-month period. |
Holdings by country
| | | | |
| | |
| | | % of portfolio investments
as of 12/31/2018 | |
| |
United Kingdom | | | 20.6 | |
| |
Japan | | | 19.9 | |
| |
France | | | 18.6 | |
| |
Germany | | | 10.8 | |
| |
Italy | | | 7.9 | |
| |
Switzerland | | | 5.5 | |
| |
Sweden | | | 3.2 | |
| |
Spain | | | 1.1 | |
| |
7 other nations | | | 4.6 | |
| |
Short-term investments | | | 7.8 | |
| |
Total | | | 100.0 | |
Portfolio composition
| | | | |
| | |
Sector | | % of net assets
as of 12/31/2018 | |
| |
Consumer discretionary | | | 26.7 | |
| |
Industrials | | | 19.5 | |
| |
Financials | | | 14.8 | |
| |
Materials | | | 9.6 | |
| |
Consumer staples | | | 9.3 | |
| |
Health care | | | 6.0 | |
| |
Information technology | | | 4.3 | |
| |
Communication services | | | 3.1 | |
| |
Energy | | | 1.2 | |
| |
Real estate | | | 0.7 | |
| |
Short-term investments, other assets & liabilities, net | | | 4.8 | |
| |
Total | | | 100.0 | |
Holdings by company size
| | | | |
| | |
Market capitalization | | % of equity investments
as of 12/31/2018 | |
| |
More than $50 billion | | | 27.7 | |
| |
More than $15 billion–$50 billion | | | 42.1 | |
| |
More than $2 billion–$15 billion | | | 30.0 | |
| |
$2 billion or less | | | 0.2 | |
| |
Total | | | 100.0 | |
TIAA-CREF Life Funds ◾ 2018 Annual Report 33
Bond Fund
Performance for the twelve months ended December 31, 2018
The Bond Fund returned –0.79% for the year, compared with the 0.01% return of its benchmark, the Bloomberg Barclays U.S. Aggregate Bond Index.
During the twelve-month period, the U.S. economy continued to grow at a solid pace. The unemployment rate fell to 3.7%, its lowest level in nearly 50 years, before ending the period at 3.9% on December 31, 2018. Wages grew at the fastest rate in nearly a decade, and, in October, consumer confidence reached its highest level since 2000 before declining in November. Annual core inflation, which includes all items except food and energy, was moderate at 2.2% in December. The price of oil declined for the year, falling sharply over the final three months of the period, while the U.S. dollar strengthened.
The Federal Reserve raised the federal funds target rate four times during the period, increasing the key short-term interest-rate measure to 2.25%–2.50%. Fed policymakers were criticized for rate increases amid declining stock markets and evidence of a slowing global economy late in the year. Chairman Jerome Powell said the Fed would be “patient” with monetary policy in 2019. Yields on U.S. Treasury securities of all maturities rose during the period, but the increases were greatest among shorter-term investments. In August, the Bank of England raised its benchmark rate to 0.75%, while in September, the European Central Bank indicated it would leave benchmark interest rates unchanged until at least the summer of 2019.
Fund trailed its benchmark
For the twelve-month period, the Fund’s benchmark returns were driven primarily by mortgaged-backed securities, which gained 1.0% and accounted for 27.7% of the index’s total market capitalization atperiod-end. U.S. Treasuries, the largest index sector with a weighting of 37.6%, and asset-backed securities (ABS), one of the smallest sectors at 0.5%, rose 0.9% and 1.8%, respectively. By contrast, corporate bonds, which represented 25.2% of the index, declined 2.5%, while the smallest sector in the benchmark, municipal bonds, fell 1.6%.
The Fund underperformed its benchmark during the period, with overweight positions in corporate bonds and government credit securities detracting most from relative performance. Security selection in U.S. Treasuries also detracted. In general, the Fund was held back by its yield curve positioning across the portfolio as well as by a modest position in cash. A small exposure to derivatives instruments also hurt the Fund’s relative performance.
These negative effects were tempered by holdings in commercial mortgage-backed securities and ABS, which contributed to the Fund’s relative performance.
34 2018 Annual Report ∎ TIAA-CREF Life Funds
Bond Fund
| | | | | | | | | | | | | | | | | | | | | | |
Performance as of December 31, 2018 | | | | | | | | | | | | | | | | | | | | | | |
| | | | | Total
return | | | | | Average annual
total return | | | | | Annual operating
expenses* |
| | | Inception
date | | 1 year | | | | | 5 years | | | 10 years | | | | | gross | | net |
Bond Fund | | 7/8/03 | | | -0.79 | % | | | | | 2.78 | % | | | 3.95 | % | | | | 0.36% | | 0.35% |
| | | | | | | | |
Bloomberg Barclays U.S. Aggregate Bond Index | | – | | | 0.01 | | | | | | 2.52 | | | | 3.48 | | | | | – | | – |
The returns in this report show past performance, which is no guarantee of future results. Returns and the principal value of your investment will fluctuate. Current performance may be higher or lower than that shown, and you may have a gain or a loss when you redeem your shares. For current performance information, including performance to the most recentmonth-end, please visit TIAA.org. Performance may reflect waivers or reimbursements of certain expenses. Absent these waivers or reimbursement arrangements, performance would have been lower.
Total returns for the shares of the Fund do not include the effect of expenses attributable to the variable annuity or variable life insurance product; if they did, returns for the shares of the Fund would have been lower.
You cannot invest directly in any index. Index returns do not include a deduction for fees or expenses.
| * | The gross and net annual operating expenses are taken from the Fund’s prospectus. The net annual operating expenses may at times reflect a contractual reimbursement of various expenses. The expense reimbursement will continue through at least April 30, 2019, unless changed with the approval of the Board of Trustees. Without these reimbursements, expenses would be higher and returns lower. |
$10,000 over 10 years
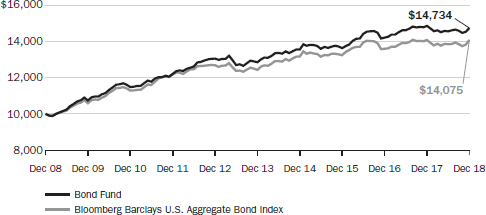
For the purpose of comparison, the graph also shows the change in the value of the Fund’s benchmark during the same period.
TIAA-CREF Life Funds ◾ 2018 Annual Report 35
Bond Fund
Expense example
Six months ended December 31, 2018
| | | | | | |
Bond Fund | | Beginning
account value
(7/1/18) | | Ending
account value
(12/31/18) | | Expenses paid
during period*
(7/1/18–12/31/18) |
| | | |
Actual return | | $1,000.00 | | $ 1,012.75 | | $1.78 |
| | | |
5% annual hypothetical return | | 1,000.00 | | 1,023.44 | | 1.79 |
| * | “Expenses paid during period” is based on the Fund’s actual expense ratio for the most recent fiscal half-year, multiplied by the average account value over thesix-month period, multiplied by 184/365. There were 184 days in the six months ended December 31, 2018. The Fund’s annualizedsix-month expense ratio for that period was 0.35%. The expense charges of the Fund may reflect a waiver and/or reimbursement. Please see the prospectus for an explanation, including the date on which this reimbursement is scheduled to end. Without such waiver and reimbursement, the expenses of the Fund would be higher and its performance lower. |
For more information about this expense example, please see page 9.
Fund profile
| | |
| | |
| | | as of 12/31/2018 |
| |
Net assets | | $189.28 million |
| |
Portfolio turnover rate | | 147% |
| |
Portfolio turnover rate, excluding mortgage dollar roll transactions | | 139% |
| |
Number of issues | | 810 |
| |
Option-adjusted duration* | | 5.90 years |
| |
Average maturity† | | 8.31 years |
| * | Option-adjusted duration estimates how much the value of a bond portfolio would be affected by a change in prevailing interest rates, taking into account the options embedded in individual securities. The longer a portfolio’s duration, the more sensitive it is to changes in interest rates. |
| † | Average maturity is a simple average of the maturities of all the bonds in a fund’s portfolio. The maturity of a bond is the amount of time until the bond’s principal becomes due or payable. |
Portfolio composition
| | | | |
| | |
Sector | | % of net assets
as of 12/31/2018 | |
| |
Corporate bonds | | | 28.5 | |
| |
Mortgage-backed securities | | | 20.5 | |
| |
Foreign government & corporate bonds denominated in U.S. dollars | | | 13.7 | |
| |
U.S. Treasury securities | | | 13.0 | |
| |
Asset-backed securities | | | 9.2 | |
| |
Commercial mortgage-backed securities | | | 8.1 | |
| |
Bank loan obligations | | | 1.5 | |
| |
Municipal bonds | | | 1.5 | |
| |
U.S. agency securities | | | 0.2 | |
| |
Preferred stock | | | 0.1 | |
| |
Short-term investments, other assets & liabilities, net | | | 3.7 | |
| |
Total | | | 100.0 | |
36 2018 Annual Report ∎ TIAA-CREF Life Funds
Bond Fund
Holdings by maturity
| | | | |
| | |
| | | % of fixed-income investments
(excluding short-term investments)
as of 12/31/2018 | |
| |
Less than 1 year | | | 3.7 | |
| |
1–3 years | | | 13.6 | |
| |
3–5 years | | | 17.2 | |
| |
5–10 years | | | 50.5 | |
| |
Over 10 years | | | 15.0 | |
| |
Total | | | 100.0 | |
Holdings by credit quality
| | |
| | |
| | | % of fixed-income investments
(excluding short-term investments)
as of 12/31/2018 |
| |
U.S. Treasury & U.S. agency securities* | | 30.5 |
| |
Aaa/AAA | | 13.6 |
| |
Aa/AA | | 6.5 |
| |
A/A | | 14.1 |
| |
Baa/BBB | | 28.1 |
| |
Ba/BB | | 2.6 |
| |
B/B | | 2.9 |
| |
Below B/B | | 0.4 |
| |
Non-rated | | 1.3 |
| |
Total | | 100.0 |
| * | These securities are guaranteed by the full faith and credit of the U.S. government. |
Credit quality ratings are based on the Bloomberg Barclays methodology, which uses the median rating of those compiled by the Moody’s, Standard & Poor’s and Fitch ratings agencies. If ratings are available from only two of these agencies, the lower rating is used. When only one rating is available, that one is used. These ratings are subject to change without notice.
TIAA-CREF Life Funds ◾ 2018 Annual Report 37
Money Market Fund
Performance for the twelve months ended December 31, 2018
The Money Market Fund returned 1.71% for the year, compared with the 1.42% return of the iMoneyNet Money Fund Averages™—All Government, a simple average of over 500 money market funds that invest in short-term U.S. government securities. The iMoneyNet average is not an index, and its return reflects the deduction of expenses charged by the funds included in the average.
During the twelve-month period, the U.S. economy continued to grow at a solid pace. Unemployment fell to 3.7%, its lowest rate in nearly 50 years, before ending the period at 3.9%. Wage growth increased and consumer confidence was strong. Annual core inflation, which includes all items except food and energy, was moderate at 2.2% in December. The Federal Reserve raised the federal funds target rate four times during the period, increasing the key short-term interest-rate measure to 2.25%–2.50%. Chairman Jerome Powell indicated that the Fed would be “patient” with monetary policy in 2019. Yields on U.S. Treasury securities of all maturities rose during the period, but the increases were greatest among shorter-term investments (bond yields move in the opposite direction of prices).
Money market funds benefited from a high issuance of short-term Treasury Bills late in the period, which lowered prices and increased yields, as well as from the introduction of a newtwo-month maturity Treasury Bill, which provided investors with increased supply and greater flexibility of maturities.
As a result of the Fed’s actions and signals, yields on LIBOR—a key interest-rate benchmark for money market funds—continued to rise. For the twelve-month period,one-month LIBOR yields rose from 1.56% on January 2, 2018, to 2.50% on December 31, 2018. Over the same period, three-month LIBOR rose from 1.70% to 2.81%;six-month LIBOR rose from 1.84% to 2.88%; and twelve-month LIBOR rose from 2.11% to 3.01%. (LIBOR is an indication of the interest rates that banks expect to pay to other banks for loans on the London market and is the most widely used benchmark for short-term rates.)
Fund outperformed the iMoneyNet average
In this environment of rising interest rates, the return of the Money Market Fund increased, outpacing that of the iMoneyNet government fund average for the twelve-month period. In pursuit of additional yield, the Fund increased its exposure to longer-dated floating-rate government agency securities, which benefited performance as short-term rates increased. As of December 25, 2018, the Fund’s weighted average maturity (WAM) was 44 days, versus 32 days for the iMoneyNet government fund average, and this longer WAM also benefited the Fund’s relative performance. (iMoneyNet releases their data on a weekly basis, and December 25, 2018, was the last date of release for the month.)
38 2018 Annual Report ∎ TIAA-CREF Life Funds
Money Market Fund
Net annualized yield for the 7 days ended December 25, 2018§
| | | | | | | | |
| | | |
| | | Current yield | | | Effective yield | |
| | |
Money Market Fund | | | 2.19 | % | | | 2.21 | % |
iMoneyNet Money Fund Averages—All Government‡ | | | 1.91 | | | | 1.93 | |
The current yield more closely reflects current earnings than does the total return.
§ Typically, iMoneyNet reports its7-day yields as of Tuesday of each week.
| | | | | | | | | | | | | | | | | | | | | | |
Performance as of December 31, 2018 | | | | | | | | | | | | | | | | | | | | | | |
| | | | | Total
return | | | | | Average annual
total return | | | | | Annual operating
expenses* |
| | | Inception
date | | 1 year | | | | | 5 years | | | 10 years | | | | | gross | | net |
Money Market Fund | | 7/8/03 | | | 1.71 | % | | | | | 0.55 | % | | | 0.35 | % | | | | 0.26% | | 0.15% |
| | | | | | | | |
iMoneyNet Money Fund Averages–All Government‡ | | – | | | 1.42 | | | | | | 0.40 | | | | 0.21 | | | | | – | | – |
The returns in this report show past performance, which is no guarantee of future results. Returns and the principal value of your investment will fluctuate. Current performance may be higher or lower than that shown, and you may have a gain or a loss when you redeem your shares. For current performance information, including performance to the most recentmonth-end, please visit TIAA.org. Performance may reflect waivers or reimbursements of certain expenses. Absent these waivers or reimbursement arrangements, the7-day current and effective annualized yields and total returns would have been lower.
Total returns for the shares of the Fund do not include the effect of expenses attributable to the variable annuity or variable life insurance product; if they did, returns for the shares of the Fund would have been lower.
You could lose money by investing in this Fund. Although the Fund seeks to preserve the value of your investment at $1.00 per share, it cannot guarantee it will do so. An investment in the Fund is not insured or guaranteed by the Federal Deposit Insurance Corporation (FDIC) or any other government agency. The Fund’s sponsor has no legal obligation to provide support to the Fund, and you should not expect that the sponsor will provide financial support to the Fund at any time. For a detailed discussion of risk, please see the prospectus. The current yield more closely reflects current earnings than does total return.
| ‡ | The iMoneyNet Money Fund Averages–All Government is a simple average of over 500 money market funds that invest in U.S. Treasuries, U.S. agencies, repurchase agreements and government-backed floating rate notes. You cannot invest in it directly. |
| * | The gross and net annual operating expenses are taken from the Fund’s prospectus. The net annual operating expenses may at times reflect a contractual reimbursement of various expenses. The expense reimbursement will continue through at least April 30, 2019, unless changed with the approval of the Board of Trustees. Without these reimbursements, expenses would be higher and returns lower. |
TIAA-CREF Life Funds ◾ 2018 Annual Report 39
Money Market Fund
Expense example
Six months ended December 31, 2018
| | | | | | |
Money Market Fund | | Beginning
account value
(7/1/18) | | Ending
account value
(12/31/18) | | Expenses paid
during period*
(7/1/18–12/31/18) |
| | | |
Actual return | | $1,000.00 | | $ 1,009.93 | | $0.76 |
| | | |
5% annual hypothetical return | | 1,000.00 | | 1,024.45 | | 0.77 |
| * | “Expenses paid during period” is based on the Fund’s actual expense ratio for the most recent fiscal half-year, multiplied by the average account value over thesix-month period, multiplied by 184/365. There were 184 days in the six months ended December 31, 2018. The Fund’s annualizedsix-month expense ratio for that period was 0.15%. The expense charges of the Fund may reflect a waiver and/or reimbursement. Please see the prospectus for an explanation, including the date on which this reimbursement is scheduled to end. Without such waiver and reimbursement, the expenses of the Fund would be higher and its performance lower. |
For more information about this expense example, please see page 9.
Fund profile
| | | | |
| | |
| | | as of 12/31/2018 | |
| |
Net assets | | $ | 104.67 million | |
| |
Number of issues | | | 154 | |
Portfolio composition
| | | | |
| | |
Sector | | % of net assets
as of 12/31/2018 | |
| |
U.S. government agency securities | | | 60.7 | |
| |
U.S. Treasury securities | | | 23.8 | |
| |
Floating-rate securities, government | | | 16.9 | |
| |
Other assets & liabilities, net | | | –1.4 | |
| |
Total | | | 100.0 | |
40 2018 Annual Report ∎ TIAA-CREF Life Funds
Balanced Fund
Performance for the twelve months ended December 31, 2018
The Balanced Fund returned –5.47% for the year, compared with the –3.25% return of its benchmark, the Balanced Fund Composite Index, which is a weighted average of the Russell 3000® Index, the MSCI EAFE Index and the Bloomberg Barclays U.S. Aggregate Bond Index.
The U.S. economy grew at a solid pace in 2018, while inflation remained moderate. The unemployment rate fell to 3.7%—its lowest level in nearly 50 years—before ending the period at 3.9% on December 31, 2018. Wage growth increased and consumer confidence was strong. The Federal Reserve responded to the growing economy by raising the federal funds target rate four times during the period, increasing the key short-term interest-rate measure to 2.25%–2.50%. Oil prices declined for the year, falling sharply over the final three months of the period. Concerns over rising interest rates, trade tensions with China and a decelerating global economy weighed on markets in the latter months of the period.
U.S. stocks, as measured by the Russell 3000 Index, declined 5.24% for the twelve-month period as performance was negative across investment styles and capitalization sizes. Growth stocks performed better than value shares, andlarge-cap stocks surpassedmid- andsmall-cap equities. (Returns by investment style and capitalization size are based on the Russell indexes.) The MSCI EAFE Index, which measures the performance of stocks in 21 developed-markets countries outside North America, returned –13.79% in U.S. dollars.
The broad investment-grade fixed-rate bond market, as measured by the Bloomberg Barclays U.S. Aggregate Bond Index, advanced 0.01%. Most index components delivered positive performance, with notable gains from the asset-backed securities, mortgage-backed securities and Treasury sectors. However, the corporate and municipal bond sectors declined. The yield on the10-Year U.S. Treasury Bond—a key long-term interest-rate benchmark—rose from 2.46% on January 2, 2018, to 2.69% on December 31, 2018 (bond yields move in the opposite direction of prices).
Fund trailed its benchmark, hampered by declines in equity and bond funds
In 2018, the Fund’s absolute performance was hurt by the negative returns of stocks and bonds held by the underlying funds of the Balanced Fund. The International Equity Fund posted the sharpest decline.
The Fund underperformed its composite benchmark for the year, hurt by the relative weakness of most of its underlying funds. The International Equity Fund was the largest detractor, followed by theLarge-Cap Value Fund, the Bond Fund and the Growth & Income Fund.
Conversely, the Growth Equity Fund contributed to the Fund’s performance relative to its composite benchmark.
TIAA-CREF Life Funds ◾ 2018 Annual Report 41
Balanced Fund
Performance as of December 31, 2018
| | | | | | | | | | | | | | | | |
| | | | | Total
return | | | Average annual
total return | | Annual operating
expenses*† | |
| | | Inception
date | | 1 year | | | since inception | | gross | | | net | |
Balanced Fund | | 1/31/14 | | | -5.47% | | | 4.47% | | | 0.64% | | | | 0.51% | |
Balanced Fund Composite Index‡ | | – | | | -3.25 | | | 4.92§ | | | – | | | | – | |
Broad market indexes# | | | | | | | | | | | | | | | | |
Morningstar Moderately Conservative Target Risk Index | | – | | | -2.87 | | | 3.64§ | | | – | | | | – | |
Bloomberg Barclays U.S. Aggregate Bond Index | | – | | | 0.01 | | | 2.26§ | | | – | | | | – | |
Russell 3000® Index | | – | | | -5.24 | | | 8.76§ | | | – | | | | – | |
The returns in this report show past performance, which is no guarantee of future results. Returns and the principal value of your investment will fluctuate. Current performance may be higher or lower than that shown, and you may have a gain or a loss when you redeem your shares. For current performance information, including performance to the most recentmonth-end, please visit TIAA.org. Performance may reflect waivers or reimbursements of certain expenses. Absent these waivers or reimbursement arrangements, performance would have been lower.
Total returns for the shares of the Fund do not include the effect of expenses attributable to the variable annuity or variable life insurance product; if they did, returns for the shares of the Fund would have been lower.
You cannot invest directly in any index. Index returns do not include a deduction for fees or expenses.
| * | The gross and net annual operating expenses are taken from the Fund’s prospectus. The net annual operating expenses may at times reflect a contractual reimbursement of various expenses. The expense reimbursement will continue through at least April 30, 2019, unless changed with the approval of the Board of Trustees. Without these reimbursements, expenses would be higher and returns lower. |
| † | The gross and net annual operating expenses include acquired fund fees and expenses, which are the Fund’s proportionate amount of the expenses of any investment companies or pools in which it invests. These expenses are not paid directly by Fund shareholders. Instead, shareholders bear these expenses indirectly because they reduce Fund performance. |
| ‡ | As of the close of business on December 31, 2018, the Balanced Fund Composite Index consisted of: 50.0% Bloomberg Barclays U.S. Aggregate Bond Index; 40.0% Russell 3000 Index; and 10.0% MSCI EAFE Index. The Fund’s benchmark, the components that make up the composite benchmark and the method of calculating the composite benchmark’s performance may vary over time. |
| § | Performance is calculated from the inception date of the Fund. |
| # | On May 1, 2018, the Fund’s broad market index comparisons were changed from the Bloomberg Barclays U.S. Aggregate Bond Index and the Russell 3000 Index to the Morningstar Moderately Conservative Target Risk Index (40% global equity market exposure). For additional information, please read the Fund’s current prospectus. |
42 2018 Annual Report ∎ TIAA-CREF Life Funds
Balanced Fund
$10,000 invested at Fund’s inception
(Inception: January 31, 2014)
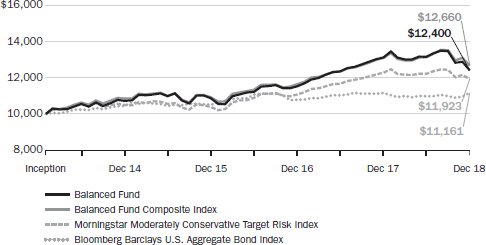
For the purpose of comparison, the graph also shows the change in the values of the Fund’s composite benchmark and broad market indexes during the same period.
Expense example
Six months ended December 31, 2018
| | | | | | | | | | | | |
| | | | | |
Balanced Fund | | Beginning
account
value
(7/1/18) | | | Ending
account
value
(12/31/18) | | | Expenses paid
during period*
(7/1/18–12/31/18) | | Effective
expenses paid
during period†
(7/1/18–12/31/18) |
| | | | |
Actual return | | $ | 1,000.00 | | | $ | 942.91 | | | $0.49 | | $2.50 |
| | | | |
5% annual hypothetical return | | | 1,000.00 | | | | 1,024.70 | | | 0.51 | | 2.60 |
| * | “Expenses paid during period” is based on the Fund’s actual expense ratio for the most recent fiscal half-year, multiplied by the average account value over thesix-month period, multiplied by 184/365. There were 184 days in the six months ended December 31, 2018. The Fund’s annualizedsix-month expense ratio for that period was 0.10%. The expense charges of the Fund may reflect a waiver and/or reimbursement. Please see the prospectus for an explanation, including the date on which this reimbursement is scheduled to end. Without such waiver and reimbursement, the expenses of the Fund would be higher and its performance lower. |
| † | “Effective expenses paid during period” is based on the Fund’s total expense ratio for the most recent fiscal half-year, which includes the Fund’s own expense ratio plus its pro rata share of its underlying funds’ expenses (which the Fund bears through its investment in the underlying funds). For thesix-month period, the total annualized weighted average expense ratio was 0.51%. |
For more information about this expense example, please see page 9.
TIAA-CREF Life Funds ◾ 2018 Annual Report 43
Balanced Fund
Fund profile
| | |
| | |
| | | as of 12/31/2018 |
| |
Net assets | | $56.52 million |
Asset allocation
| | | | |
| | |
| | | % of net assets
as of 12/31/2018 | |
| |
Equity | | | | |
| |
U.S. equity | | | 39.33 | |
| |
International equity | | | 9.91 | |
| |
Fixed income | | | 50.65 | |
| |
Other assets & liabilities, net | | | 0.11 | |
| |
Total | | | 100.0 | |
Target allocation
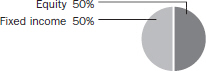
44 2018 Annual Report ∎ TIAA-CREF Life Funds
| | |
| Summary portfolio of investments | | |
Growth Equity Fund § December 31, 2018
| | | | | | | | | | | | | | | | |
| Shares | | | | | Company | | | | Value | | | % of net
assets | |
| | | | | | | | | | | | | | | | |
| | COMMON STOCKS | | | | | | | | | | |
| | AUTOMOBILES & COMPONENTS | | | | $ | 352,102 | | | | 0.3 | % |
| | | | | | | | | | | | |
| | CAPITAL GOODS | | | | | | | | | | |
| | 10,419 | | | | | Airbus SE | | | | | 993,345 | | | | 1.0 | |
| | 4,012 | | | | | Boeing Co | | | | | 1,293,870 | | | | 1.3 | |
| | 4,817 | | | | | Northrop Grumman Corp | | | | | 1,179,683 | | | | 1.2 | |
| | 3,107 | | | | | W.W. Grainger, Inc | | | | | 877,293 | | | | 0.9 | |
| | | | | | Other | | | | | 1,778,285 | | | | 1.8 | |
| | | | | | | | | | | | |
| | | | | | | | | | | 6,122,476 | | | | 6.2 | |
| | | | | | | | | | | | |
| | COMMERCIAL & PROFESSIONAL SERVICES | | | | | 1,219,435 | | | | 1.2 | |
| | | | | | | | | | | | |
| | CONSUMER DURABLES & APPAREL | | | | | | | | | | |
| | 19,703 | | | | | Nike, Inc (Class B) | | | | | 1,460,780 | | | | 1.5 | |
| | 26,600 | | | | | Tapestry, Inc | | | | | 897,750 | | | | 0.9 | |
| | | | | | | | | | | | |
| | | | | | | | | | | 2,358,530 | | | | 2.4 | |
| | | | | | | | | | | | |
| | CONSUMER SERVICES | | | | | | | | | | |
| | 9,683 | | | | | Marriott International, Inc (Class A) | | | | | 1,051,186 | | | | 1.1 | |
| | | | | | Other | | | | | 415,382 | | | | 0.4 | |
| | | | | | | | | | | | |
| | | | | | | | | | | 1,466,568 | | | | 1.5 | |
| | | | | | | | | | | | |
| | DIVERSIFIED FINANCIALS | | | | | | | | | | |
| | 20,171 | | | | | IntercontinentalExchange Group, Inc | | | | | 1,519,481 | | | | 1.6 | |
| | | | | | | | | | | | |
| | | | | | | | | | | 1,519,481 | | | | 1.6 | |
| | | | | | | | | | | | |
| | ENERGY | | | | | 147,991 | | | | 0.2 | |
| | | | | | | | | | | | |
| | FOOD & STAPLES RETAILING | | | | | | | | | | |
| | 13,762 | | | | | Walmart, Inc | | | | | 1,281,930 | | | | 1.3 | |
| | | | | | | | | | | | |
| | | | | | | | | | | 1,281,930 | | | | 1.3 | |
| | | | | | | | | | | | |
| | FOOD, BEVERAGE & TOBACCO | | | | | | | | | | |
| | 6,429 | | | | | Constellation Brands, Inc (Class A) | | | | | 1,033,912 | | | | 1.0 | |
| | | | | | Other | | | | | 368,461 | | | | 0.4 | |
| | | | | | | | | | | | |
| | | | | | | | | | | 1,402,373 | | | | 1.4 | |
| | | | | | | | | | | | |
| | HEALTH CARE EQUIPMENT & SERVICES | | | | | | | | | | |
| | 14,273 | | | | | Abbott Laboratories | | | | | 1,032,366 | | | | 1.0 | |
| | 7,413 | | | * | | Edwards Lifesciences Corp | | | | | 1,135,449 | | | | 1.2 | |
| | 4,049 | | | * | | Intuitive Surgical, Inc | | | | | 1,939,147 | | | | 2.0 | |
| | 5,740 | | | | | Stryker Corp | | | | | 899,745 | | | | 0.9 | |
| | | | | | Other | | | | | 476,103 | | | | 0.5 | |
| | | | | | | | | | | | |
| | | | | | | | | | | 5,482,810 | | | | 5.6 | |
| | | | | | | | | | | | |
| | HOUSEHOLD & PERSONAL PRODUCTS | | | | | | | | | | |
| | 11,857 | | | | | Procter & Gamble Co | | | | | 1,089,895 | | | | 1.1 | |
| | | | | | | | | | | | |
| | | | | | | | | | | 1,089,895 | | | | 1.1 | |
| | | | | | | | | | | | |
| | | | | | |
| See notes to financial statements | | TIAA-CREF Life Funds § 2018 Annual Report | | | 45 | |
| | |
| Summary portfolio of investments | | continued |
Growth Equity Fund § December 31, 2018
| | | | | | | | | | | | | | | | |
| Shares | | | | | Company | | | | Value | | | % of net
assets | |
| | | | | | | | | | | | | | | | |
| | MATERIALS | | | | | | | | | | |
| | 9,843 | | | | | Linde plc | | | | $ | 1,535,902 | | | | 1.6 | % |
| | 3,526 | | | | | Sherwin-Williams Co | | | | | 1,387,340 | | | | 1.4 | |
| | | | | | | | | | | | |
| | | | | | | | | | | 2,923,242 | | | | 3.0 | |
| | | | | | | | | | | | |
| | MEDIA & ENTERTAINMENT | | | | | | | | | | |
| | 20,874 | | | | | Activision Blizzard, Inc | | | | | 972,102 | | | | 1.0 | |
| | 3,201 | | | * | | Alphabet, Inc (Class A) | | | | | 3,344,917 | | | | 3.4 | |
| | 3,558 | | | * | | Alphabet, Inc (Class C) | | | | | 3,684,700 | | | | 3.8 | |
| | 24,514 | | | * | | Facebook, Inc | | | | | 3,213,540 | | | | 3.3 | |
| | 6,160 | | | * | | IAC/InterActiveCorp | | | | | 1,127,527 | | | | 1.1 | |
| | 3,761 | | | * | | NetFlix, Inc | | | | | 1,006,669 | | | | 1.0 | |
| | 9,614 | | | | | Walt Disney Co | | | | | 1,054,175 | | | | 1.1 | |
| | | | | | Other | | | | | 555,832 | | | | 0.6 | |
| | | | | | | | | | | | |
| | | | | | | | | | | 14,959,462 | | | | 15.3 | |
| | | | | | | | | | | | |
| | PHARMACEUTICALS, BIOTECHNOLOGY & LIFE SCIENCES | | | | | | | | | | |
| | 9,583 | | | | | Eli Lilly & Co | | | | | 1,108,945 | | | | 1.1 | |
| | 21,573 | | | | | Gilead Sciences, Inc | | | | | 1,349,391 | | | | 1.4 | |
| | 3,513 | | | * | | Illumina, Inc | | | | | 1,053,654 | | | | 1.1 | |
| | 9,244 | | | | | Johnson & Johnson | | | | | 1,192,938 | | | | 1.2 | |
| | 3,352 | | | | | Lonza Group AG. | | | | | 871,368 | | | | 0.9 | |
| | 15,485 | | | | | Schering-Plough Corp | | | | | 1,183,209 | | | | 1.2 | |
| | | | | | Other | | | | | 1,891,664 | | | | 1.9 | |
| | | | | | | | | | | | |
| | | | | | | | | | | 8,651,169 | | | | 8.8 | |
| | | | | | | | | | | | |
| | RETAILING | | | | | |
| | 3,255 | | | * | | Amazon.com, Inc | | | | | 4,888,912 | | | | 5.0 | |
| | 13,969 | | | | | Expedia, Inc | | | | | 1,573,608 | | | | 1.6 | |
| | 10,573 | | | | | Home Depot, Inc | | | | | 1,816,653 | | | | 1.8 | |
| | | | | | Other | | | | | 2,804,569 | | | | 2.9 | |
| | | | | | | | | | | | |
| | | | | | | | | | | 11,083,742 | | | | 11.3 | |
| | | | | | | | | | | | |
| | SEMICONDUCTORS & SEMICONDUCTOR EQUIPMENT | | | | | |
| | 8,208 | | | | | NVIDIA Corp | | | | | 1,095,768 | | | | 1.1 | |
| | 12,252 | | | | | Xilinx, Inc | | | | | 1,043,503 | | | | 1.1 | |
| | | | | | Other | | | | | 487,835 | | | | 0.4 | |
| | | | | | | | | | | | |
| | | | | | | | | | | 2,627,106 | | | | 2.6 | |
| | | | | | | | | | | | |
| | SOFTWARE & SERVICES | | | | | |
| | 11,307 | | | * | | Adobe, Inc | | | | | 2,558,096 | | | | 2.6 | |
| | 18,019 | | | * | | Akamai Technologies, Inc | | | | | 1,100,600 | | | | 1.1 | |
| | 16,106 | | | | | Automatic Data Processing, Inc | | | | | 2,111,819 | | | | 2.1 | |
| | 13,436 | | | | | Intuit, Inc | | | | | 2,644,877 | | | | 2.7 | |
| | 17,738 | | | | | MasterCard, Inc (Class A) | | | | | 3,346,274 | | | | 3.4 | |
| | 61,861 | | | | | Microsoft Corp | | | | | 6,283,222 | | | | 6.4 | |
| | 25,318 | | | * | | PayPal Holdings, Inc | | | | | 2,128,991 | | | | 2.2 | |
| | 21,893 | | | * | | salesforce.com, Inc | | | | | 2,998,684 | | | | 3.1 | |
| | 6,223 | | | * | | ServiceNow, Inc | | | | | 1,108,005 | | | | 1.1 | |
| | | | |
| 46 | | 2018 Annual Report § TIAA-CREF Life Funds | | See notes to financial statements |
| | |
| Summary portfolio of investments | | continued |
Growth Equity Fund § December 31, 2018
| | | | | | | | | | | | | | | | |
| Shares | | | | | Company | | | | Value | | | % of net
assets | |
| | | | | | | | | | | | | | | | |
| | SOFTWARE & SERVICES—continued | | | | | | | | | | |
| | 18,362 | | | | | Visa, Inc (Class A) | | | | $ | 2,422,682 | | | | 2.5 | % |
| | | | | | Other | | | | | 784,184 | | | | 0.8 | |
| | | | | | | | | | | | |
| | | | | | | | | | | 27,487,434 | | | | 28.0 | |
| | | | | | | | | | | | |
| | TECHNOLOGY HARDWARE & EQUIPMENT | | | | | |
| | 11,595 | | | n | | Apple, Inc | | | | | 1,828,995 | | | | 1.8 | |
| | 36,111 | | | | | Cisco Systems, Inc | | | | | 1,564,690 | | | | 1.6 | |
| | 8,406 | | | | | Motorola, Inc | | | | | 967,026 | | | | 1.0 | |
| | | | | | Other | | | | | 1,178,030 | | | | 1.2 | |
| | | | | | | | | | | | |
| | | | | | | | | | | 5,538,741 | | | | 5.6 | |
| | | | | | | | | | | | |
| | TELECOMMUNICATION SERVICES | | | | | |
| | 15,500 | | | | | Softbank Corp | | | | | 1,015,237 | | | | 1.0 | |
| | | | | | | | | | | | |
| | | | | | | | | | | 1,015,237 | | | | 1.0 | |
| | | | | | | | | | | | |
| | TRANSPORTATION | | | | | 247,642 | | | | 0.3 | |
| | | | | | | | | | | | |
| | | | | | TOTAL COMMON STOCKS | | (Cost $70,795,657) | | | 96,977,366 | | | | 98.7 | |
| | | | | | | | | | | | |
| | | | | |
| Principal | | | | | Issuer | | | | | | | | |
| | | | | | | | | | | | | | |
| | SHORT-TERM INVESTMENTS | | | | | | | | |
| | GOVERNMENT AGENCY DEBT | | | | | | | | | | |
| | $1,160,000 | | | | | Federal Home Loan Bank (FHLB) 2.150%, 01/02/19 | | | | | 1,160,000 | | | | 1.2 | |
| | | | | | | | | | | | |
| | | | | | | | | | | 1,160,000 | | | | 1.2 | |
| | | | | | | | | | | | |
| | | | | | TOTAL SHORT-TERM INVESTMENTS | | (Cost $1,159,931) | | | 1,160,000 | | | | 1.2 | |
| | | | | | | | | | | | |
| | | | | |
| | | | | | TOTAL PORTFOLIO | | (Cost $71,955,588) | | | 98,137,366 | | | | 99.9 | |
| | | | | | OTHER ASSETS & LIABILITIES, NET | | | | | 78,931 | | | | 0.1 | |
| | | | | | | | | | | | |
| | | | | | NET ASSETS | | | | $ | 98,216,297 | | | | 100.0 | % |
| | | | | | | | | | |
| n | | All or a portion of these securities have been segregated by the custodian to cover requirements on open written options contracts. |
“Other” securities represent the aggregate value, by category, of securities that are not among the 50 largest holdings and, in total for any issuer, represent 1% or less of net assets.
For ease of presentation, a number of classification categories have been grouped together in the Summary portfolio of investments. Note that the Fund uses more specific categories in following its investment limitations on investment concentrations.
| | | | | | |
| See notes to financial statements | | TIAA-CREF Life Funds § 2018 Annual Report | | | 47 | |
| | |
| Summary portfolio of investments | | concluded |
Growth Equity Fund § December 31, 2018
Written options outstanding as of December 31, 2018 were as follows (See Note 3):
| | | | | | | | | | | | | | | | | | | | |
| Description/underlying investment | | Number of
contracts | | | Notional
amount | | | Exercise
price | | | Expiration
date | | | Value | |
| |
GrubHub, Inc, Put | | | 2 | | | $ | (996 | ) | | $ | 65.00 | | | | 03/15/19 | | | $ | (730 | ) |
GrubHub, Inc, Put | | | 3 | | | | (2,079 | ) | | | 70.00 | | | | 03/15/19 | | | | (1,740 | ) |
| |
Total | | | 5 | | | $ | (3,075 | ) | | | | | | | | | | $ | (2,470 | ) |
|
| |
| | | | |
| 48 | | 2018 Annual Report § TIAA-CREF Life Funds | | See notes to financial statements |
| | |
| Summary portfolio of investments | | |
Growth & Income Fund § December 31, 2018
| | | | | | | | | | | | | | | | |
| Shares | | | | | Company | | | | Value | | | % of net
assets | |
| | | | | | | | | | | | | | | | |
| | COMMON STOCKS | | | | | | | | | | |
| | AUTOMOBILES & COMPONENTS | | | | $ | 369,789 | | | | 0.3 | % |
| | | | | | | | | | | | |
| | BANKS | | | | | | | | | | |
| | 71,707 | | | | | Bank of America Corp | | | | | 1,766,861 | | | | 1.4 | |
| | 27,754 | | | | | JPMorgan Chase & Co | | | | | 2,709,345 | | | | 2.1 | |
| | | | | | Other | | | | | 2,412,069 | | | | 1.8 | |
| | | | | | | | | | | | |
| | | | | | | | | | | 6,888,275 | | | | 5.3 | |
| | | | | | | | | | | | |
| | CAPITAL GOODS | | | | | |
| | 2,827 | | | n | | Boeing Co | | | | | 911,708 | | | | 0.7 | |
| | 6,378 | | | | | Deere & Co | | | | | 951,406 | | | | 0.7 | |
| | 11,621 | | | n | | Honeywell International, Inc | | | | | 1,535,367 | | | | 1.2 | |
| | | | | | Other | | | | | 5,040,060 | | | | 3.9 | |
| | | | | | | | | | | | |
| | | | | | | | | | | 8,438,541 | | | | 6.5 | |
| | | | | | | | | | | | |
| | COMMERCIAL & PROFESSIONAL SERVICES | | | | | |
| | 12,296 | | | | | Waste Management, Inc | | | | | 1,094,221 | | | | 0.9 | |
| | | | | | Other | | | | | 537,240 | | | | 0.4 | |
| | | | | | | | | | | | |
| | | | | | | | | | | 1,631,461 | | | | 1.3 | |
| | | | | | | | | | | | |
| | CONSUMER DURABLES & APPAREL | | | | | 3,213,009 | | | | 2.5 | |
| | | | | | | | | | | | |
| | CONSUMER SERVICES | | | | | 429,787 | | | | 0.3 | |
| | | | | | | | | | | | |
| | DIVERSIFIED FINANCIALS | | | | | |
| | 7,215 | | | | | CME Group, Inc | | | | | 1,357,286 | | | | 1.1 | |
| | 22,140 | | | | | Morgan Stanley | | | | | 877,851 | | | | 0.7 | |
| | | | | | Other | | | | | 1,067,605 | | | | 0.8 | |
| | | | | | | | | | | | |
| | | | | | | | | | | 3,302,742 | | | | 2.6 | |
| | | | | | | | | | | | |
| | ENERGY | | | | | |
| | 20,506 | | | | | Chevron Corp | | | | | 2,230,847 | | | | 1.7 | |
| | 10,256 | | | | | EOG Resources, Inc | | | | | 894,426 | | | | 0.7 | |
| | | | | | Other | | | | | 4,019,295 | | | | 3.1 | |
| | | | | | | | | | | | |
| | | | | | | | | | | 7,144,568 | | | | 5.5 | |
| | | | | | | | | | | | |
| | FOOD & STAPLES RETAILING | | | | | |
| | 4,454 | | | n | | Costco Wholesale Corp | | | | | 907,324 | | | | 0.7 | |
| | | | | | Other | | | | | 773,238 | | | | 0.6 | |
| | | | | | | | | | | | |
| | | | | | | | | | | 1,680,562 | | | | 1.3 | |
| | | | | | | | | | | | |
| | FOOD, BEVERAGE & TOBACCO | | | | | |
| | 31,904 | | | | | Coca-Cola Co | | | | | 1,510,654 | | | | 1.2 | |
| | 23,639 | | | | | Mondelez International, Inc | | | | | 946,269 | | | | 0.7 | |
| | | | | | Other | | | | | 4,515,223 | | | | 3.5 | |
| | | | | | | | | | | | |
| | | | | | | | | | | 6,972,146 | | | | 5.4 | |
| | | | | | | | | | | | |
| | HEALTH CARE EQUIPMENT & SERVICES | | | | | |
| | 24,039 | | | | | Abbott Laboratories | | | | | 1,738,741 | | | | 1.3 | |
| | 3,963 | | | n | | Anthem, Inc | | | | | 1,040,803 | | | | 0.8 | |
| | | | | | |
| See notes to financial statements | | TIAA-CREF Life Funds § 2018 Annual Report | | | 49 | |
| | |
| Summary portfolio of investments | | continued |
Growth & Income Fund § December 31, 2018
| | | | | | | | | | | | | | | | |
| Shares | | | | | Company | | | | Value | | | % of net
assets | |
| | | | | | | | | | | | | | | | |
| | HEALTH CARE EQUIPMENT & SERVICES—continued | | | | | | | | | | |
| | 33,567 | | | * | | Boston Scientific Corp | | | | $ | 1,186,258 | | | | 0.9 | % |
| | 3,086 | | | | | Humana, Inc | | | | | 884,077 | | | | 0.7 | |
| | 1,923 | | | * | | Intuitive Surgical, Inc | | | | | 920,963 | | | | 0.7 | |
| | 12,593 | | | | | Medtronic plc | | | | | 1,145,459 | | | | 0.9 | |
| | 7,079 | | | n | | Stryker Corp | | | | | 1,109,633 | | | | 0.9 | |
| | | | | | Other | | | | | 4,584,253 | | | | 3.5 | |
| | | | | | | | | | | | |
| | | | | | | | | | | 12,610,187 | | | | 9.7 | |
| | | | | | | | | | | | |
| | HOUSEHOLD & PERSONAL PRODUCTS | | | | | |
| | 18,858 | | | | | Procter & Gamble Co | | | | | 1,733,427 | | | | 1.3 | |
| | | | | | Other | | | | | 590,524 | | | | 0.5 | |
| | | | | | | | | | | | |
| | | | | | | | | | | 2,323,951 | | | | 1.8 | |
| | | | | | | | | | | | |
| | INSURANCE | | | | | |
| | 5,709 | | | * | | Berkshire Hathaway, Inc (Class B) | | | | | 1,165,664 | | | | 0.9 | |
| | 9,877 | | | | | Chubb Ltd | | | | | 1,275,911 | | | | 1.0 | |
| | | | | | Other | | | | | 1,897,723 | | | | 1.4 | |
| | | | | | | | | | | | |
| | | | | | | | | | | 4,339,298 | | | | 3.3 | |
| | | | | | | | | | | | |
| | MATERIALS | | | | | |
| | 26,902 | | | | | DowDuPont, Inc | | | | | 1,438,719 | | | | 1.1 | |
| | 9,105 | | | n | | Linde plc | | | | | 1,420,744 | | | | 1.1 | |
| | | | | | Other | | | | | 2,708,805 | | | | 2.1 | |
| | | | | | | | | | | | |
| | | | | | | | | | | 5,568,268 | | | | 4.3 | |
| | | | | | | | | | | | |
| | MEDIA & ENTERTAINMENT | | | | | |
| | 3,771 | | | * | | Alphabet, Inc (Class C) | | | | | 3,905,285 | | | | 3.0 | |
| | 32,472 | | | | | Comcast Corp (Class A) | | | | | 1,105,672 | | | | 0.9 | |
| | 12,701 | | | *,n | | Facebook, Inc | | | | | 1,664,974 | | | | 1.3 | |
| | 4,459 | | | * | | NetFlix, Inc | | | | | 1,193,496 | | | | 0.9 | |
| | 15,692 | | | | | Walt Disney Co | | | | | 1,720,628 | | | | 1.3 | |
| | | | | | Other | | | | | 2,725,004 | | | | 2.1 | |
| | | | | | | | | | | | |
| | | | | | | | | | | 12,315,059 | | | | 9.5 | |
| | | | | | | | | | | | |
| | PHARMACEUTICALS, BIOTECHNOLOGY & LIFE SCIENCES | | | | | |
| | 14,497 | | | | | AbbVie, Inc | | | | | 1,336,479 | | | | 1.0 | |
| | 9,139 | | | | | Eli Lilly & Co | | | | | 1,057,565 | | | | 0.8 | |
| | 32,596 | | | | | Pfizer, Inc | | | | | 1,422,815 | | | | 1.1 | |
| | 22,973 | | | | | Schering-Plough Corp | | | | | 1,755,367 | | | | 1.4 | |
| | | | | | Other | | | | | 5,132,691 | | | | 4.0 | |
| | | | | | | | | | | | |
| | | | | | | | | | | 10,704,917 | | | | 8.3 | |
| | | | | | | | | | | | |
| | REAL ESTATE | | | | | 1,028,481 | | | | 0.8 | |
| | | | | | | | | | | | |
| | RETAILING | | | | | |
| | 2,379 | | | * | | Amazon.com, Inc | | | | | 3,573,187 | | | | 2.7 | |
| | 10,308 | | | | | Home Depot, Inc | | | | | 1,771,120 | | | | 1.4 | |
| | | | | | Other | | | | | 2,067,646 | | | | 1.6 | |
| | | | | | | | | | | | |
| | | | | | | | | | | 7,411,953 | | | | 5.7 | |
| | | | | | | | | | | | |
| | | | |
| 50 | | 2018 Annual Report § TIAA-CREF Life Funds | | See notes to financial statements |
| | |
| Summary portfolio of investments | | continued |
Growth & Income Fund § December 31, 2018
| | | | | | | | | | | | | | | | |
| Shares | | | | | Company | | | | Value | | | % of net
assets | |
| | | | | | | | | | | | | | | | |
| | SEMICONDUCTORS & SEMICONDUCTOR EQUIPMENT | | | | | |
| | 21,547 | | | | | Intel Corp | | | | $ | 1,011,201 | | | | 0.8 | % |
| | 7,229 | | | n | | NVIDIA Corp | | | | | 965,071 | | | | 0.7 | |
| | | | | | Other | | | | | 3,380,490 | | | | 2.6 | |
| | | | | | | | | | | | |
| | | | | | | | | | | 5,356,762 | | | | 4.1 | |
| | | | | | | | | | | | |
| | SOFTWARE & SERVICES | | | | | |
| | 3,965 | | | * | | Adobe, Inc | | | | | 897,042 | | | | 0.7 | |
| | 10,163 | | | | | MasterCard, Inc (Class A) | | | | | 1,917,250 | | | | 1.5 | |
| | 51,404 | | | | | Microsoft Corp | | | | | 5,221,104 | | | | 4.0 | |
| | 11,702 | | | * | | PayPal Holdings, Inc | | | | | 984,021 | | | | 0.8 | |
| | 8,648 | | | *,n | | salesforce.com, Inc | | | | | 1,184,517 | | | | 0.9 | |
| | | | | | Other | | | | | 2,493,555 | | | | 1.9 | |
| | | | | | | | | | | | |
| | | | | | | | | | | 12,697,489 | | | | 9.8 | |
| | | | | | | | | | | | |
| | TECHNOLOGY HARDWARE & EQUIPMENT | | | | | |
| | 25,666 | | | n | | Apple, Inc | | | | | 4,048,555 | | | | 3.1 | |
| | 49,191 | | | | | Cisco Systems, Inc | | | | | 2,131,446 | | | | 1.7 | |
| | | | | | Other | | | | | 2,249,712 | | | | 1.7 | |
| | | | | | | | | | | | |
| | | | | | | | | | | 8,429,713 | | | | 6.5 | |
| | | | | | | | | | | | |
| | TELECOMMUNICATION SERVICES | | | | | |
| | 25,511 | | | | | Verizon Communications, Inc | | | | | 1,434,228 | | | | 1.1 | |
| | | | | | | | | | | | |
| | | | | | | | | | | 1,434,228 | | | | 1.1 | |
| | | | | | | | | | | | |
| | TRANSPORTATION | | | | | |
| | 14,819 | | | | | CSX Corp | | | | | 920,705 | | | | 0.7 | |
| | | | | | Other | | | | | 717,909 | | | | 0.5 | |
| | | | | | | | | | | | |
| | | | | | | | | | | 1,638,614 | | | | 1.2 | |
| | | | | | | | | | | | |
| | UTILITIES | | | | | |
| | 5,374 | | | | | NextEra Energy, Inc | | | | | 934,109 | | | | 0.7 | |
| | | | | | Other | | | | | 1,843,292 | | | | 1.4 | |
| | | | | | | | | | | | |
| | | | | | | | | | | 2,777,401 | | | | 2.1 | |
| | | | | | | | | | | | |
| | | | | | TOTAL COMMON STOCKS | | (Cost $99,922,668) | | | 128,707,201 | | | | 99.2 | |
| | | | | | | | | | | | |
| | | |
| | PURCHASED OPTIONS | | | | | | | | | | |
| | CAPITAL GOODS | | | | | 8 | | | | 0.0 | |
| | | | | | | | | | | | |
| | PHARMACEUTICALS, BIOTECHNOLOGY & LIFE SCIENCES | | | | | 7 | | | | 0.0 | |
| | | | | | | | | | | | |
| | | | | | TOTAL PURCHASED OPTIONS | | (Cost $1,844) | | | 15 | | | | 0.0 | |
| | | | | | | | | | | | |
| | | | | |
| Principal | | | | | Issuer | | | | | | | | |
| | |
| | SHORT-TERM INVESTMENTS | | | | | | | | |
| | GOVERNMENT AGENCY DEBT | | | | | | | | |
| | $1,460,000 | | | | | Federal Home Loan Bank (FHLB) 2.150%, 01/02/19 | | | | | 1,460,000 | | | | 1.1 | |
| | | | | | | | | | | | |
| | | | | | | | | | | 1,460,000 | | | | 1.1 | |
| | | | | | | | | | | | |
| | | | | | |
| See notes to financial statements | | TIAA-CREF Life Funds § 2018 Annual Report | | | 51 | |
| | |
| Summary portfolio of investments | | continued |
Growth & Income Fund § December 31, 2018
| | | | | | | | | | | | | | | | |
| Shares | | | | | Company | | | | Value | | | % of net
assets | |
| | | | | | | | | | | | | | | | |
| | INVESTMENTS IN REGISTERED INVESTMENT COMPANIES | | | | | | | | |
| | 1,180,169 | | | c | | State Street Navigator Securities Lending Government Money
Market Portfolio | | $ | 1,180,169 | | | | 0.9 | % |
| | | | | | | | | | | | |
| | | | | | | | | | | 1,180,169 | | | | 0.9 | |
| | | | | | | | | | | | |
| | | | | | TOTAL SHORT-TERM INVESTMENTS | | (Cost $2,640,082) | | | 2,640,169 | | | | 2.0 | |
| | | | | | | | | | | | |
| | | | | |
| | | | | | TOTAL PORTFOLIO | | (Cost $102,564,594) | | | 131,347,385 | | | | 101.2 | |
| | | | | | OTHER ASSETS & LIABILITIES, NET | | | | | (1,679,042 | ) | | | (1.2 | ) |
| | | | | | | | | | | | |
| | | | | | NET ASSETS | | | | $ | 129,668,343 | | | | 100.0 | % |
| | | | | | | | | | |
| c | | Investments made with cash collateral received from securities on loan. |
| n | | All or a portion of these securities have been segregated by the custodian to cover requirements on open written options contracts. |
“Other” securities represent the aggregate value, by category, of securities that are not among the 50 largest holdings and, in total for any issuer, represent 1% or less of net assets.
At 12/31/18, the aggregate value of securities on loan is $1,154,511.
At 12/31/18, the aggregate value of securities exempt from registration under Rule 144(A) of the securities Act of 1933 amounted to $339,076 or 0.3% of net assets. Such securities are deemed liquid and may be resold in transactions exempt from registration to qualified institutional buyers.
For ease of presentation, a number of classification categories have been grouped together in the Summary portfolio of investments. Note that the Fund uses more specific categories in following its investment limitations on investment concentrations.
Purchased options outstanding as of December 31, 2018 were as follows (See Note 3):
| | | | | | | | | | | | | | | | | | | | |
| Description/underlying investment | | Number of
contracts | | | Notional
amount | | | Exercise
price | | | Expiration
date | | | Value | |
| |
CVS Health Corp, Call | | | 7 | | | $ | 1,204 | | | $ | 80.00 | | | | 01/18/19 | | | $ | 7 | |
General Electric Co, Call | | | 8 | | | | 640 | | | | 15.00 | | | | 01/18/19 | | | | 8 | |
| |
Total | | | 15 | | | $ | 1,844 | | | | | | | | | | | $ | 15 | |
|
| |
Written options outstanding as of December 31, 2018 were as follows (See Note 3):
| | | | | | | | | | | | | | | | | | | | |
| Description/underlying investment | | Number of
contracts | | | Notional
amount | | | Exercise
price | | | Expiration
date | | | Value | |
| |
Activision Blizzard, Inc, Put | | | 13 | | | $ | (7,221 | ) | | $ | 50.00 | | | | 05/17/19 | | | $ | (9,100 | ) |
Alibaba Group Holding Ltd, Put | | | 5 | | | | (6,687 | ) | | | 140.00 | | | | 04/18/19 | | | | (6,325 | ) |
Anthem, Inc, Call | | | 3 | | | | (1,089 | ) | | | 310.00 | | | | 01/18/19 | | | | (60 | ) |
Anthem, Inc, Put | | | 3 | | | | (2,654 | ) | | | 250.00 | | | | 03/15/19 | | | | (2,288 | ) |
Anthem, Inc, Put | | | 3 | | | | (6,416 | ) | | | 260.00 | | | | 06/21/19 | | | | (4,875 | ) |
Apple, Inc, Put | | | 5 | | | | (3,250 | ) | | | 195.00 | | | | 02/15/19 | | | | (18,975 | ) |
Apple, Inc, Put | | | 5 | | | | (2,615 | ) | | | 205.00 | | | | 02/15/19 | | | | (23,875 | ) |
Apple, Inc, Put | | | 5 | | | | (6,852 | ) | | | 175.00 | | | | 04/18/19 | | | | (11,030 | ) |
| |
| | | | |
| 52 | | 2018 Annual Report § TIAA-CREF Life Funds | | See notes to financial statements |
| | |
| Summary portfolio of investments | | continued |
Growth & Income Fund § December 31, 2018
| | | | | | | | | | | | | | | | | | | | |
| Description/underlying investment | | Number of
contracts | | | Notional
amount | | | Exercise
price | | | Expiration
date | | | Value | |
| |
Applied Materials, Inc, Put | | | 13 | | | $ | (2,392 | ) | | $ | 32.00 | | | | 04/18/19 | | | $ | (3,640 | ) |
Arista Networks, Inc, Put | | | 3 | | | | (3,369 | ) | | | 200.00 | | | | 03/15/19 | | | | (3,999 | ) |
Boeing Co, Put | | | 2 | | | | (5,639 | ) | | | 320.00 | | | | 05/17/19 | | | | (5,140 | ) |
Broadcom Ltd, Call | | | 5 | | | | (2,290 | ) | | | 270.00 | | | | 01/18/19 | | | | (1,275 | ) |
Broadridge Financial Solutions, Inc, Put | | | 8 | | | | (1,565 | ) | | | 85.00 | | | | 03/15/19 | | | | (1,520 | ) |
Celgene Corp, Put | | | 11 | | | | (7,425 | ) | | | 70.00 | | | | 04/18/19 | | | | (10,065 | ) |
Celgene Corp, Put | | | 4 | | | | (3,992 | ) | | | 75.00 | | | | 04/18/19 | | | | (5,080 | ) |
Celgene Corp, Put | | | 2 | | | | (2,694 | ) | | | 80.00 | | | | 04/18/19 | | | | (3,398 | ) |
Chipotle Mexican Grill, Inc, Put | | | 2 | | | | (4,916 | ) | | | 405.00 | | | | 03/15/19 | | | | (3,890 | ) |
Chipotle Mexican Grill, Inc, Put | | | 1 | | | | (3,588 | ) | | | 420.00 | | | | 06/21/19 | | | | (3,745 | ) |
Clovis Oncology, Inc, Put | | | 2 | | | | (1,316 | ) | | | 20.00 | | | | 04/18/19 | | | | (1,090 | ) |
Coherent, Inc, Put | | | 4 | | | | (6,112 | ) | | | 145.00 | | | | 02/15/19 | | | | (16,320 | ) |
ConAgra Brands, Inc, Put | | | 12 | | | | (867 | ) | | | 27.00 | | | | 03/15/19 | | | | (7,080 | ) |
ConAgra Brands, Inc, Put | | | 12 | | | | (3,036 | ) | | | 31.00 | | | | 06/21/19 | | | | (11,940 | ) |
Constellation Brands, Inc, Put | | | 4 | | | | (1,075 | ) | | | 160.00 | | | | 01/18/19 | | | | (2,304 | ) |
Constellation Brands, Inc, Put | | | 2 | | | | (1,276 | ) | | | 175.00 | | | | 04/18/19 | | | | (3,844 | ) |
Costco Wholesale Corp, Put | | | 3 | | | | (3,272 | ) | | | 210.00 | | | | 02/15/19 | | | | (3,270 | ) |
Cree, Inc, Call | | | 13 | | | | (1,743 | ) | | | 47.00 | | | | 01/18/19 | | | | (429 | ) |
Cree, Inc, Put | | | 13 | | | | (1,614 | ) | | | 39.00 | | | | 01/18/19 | | | | (572 | ) |
CVS Health Corp, Call | | | 7 | | | | (420 | ) | | | 85.00 | | | | 01/18/19 | | | | (7 | ) |
CVS Health Corp, Put | | | 11 | | | | (1,452 | ) | | | 70.00 | | | | 01/18/19 | | | | (5,621 | ) |
DISH Network Corp, Put | | | 14 | | | | (8,512 | ) | | | 35.00 | | | | 03/15/19 | | | | (14,000 | ) |
DXC Technology Co, Put | | | 5 | | | | (1,889 | ) | | | 50.00 | | | | 03/15/19 | | | | (1,425 | ) |
DXC Technology Co, Put | | | 3 | | | | (474 | ) | | | 55.00 | | | | 03/15/19 | | | | (1,380 | ) |
DXC Technology Co, Put | | | 2 | | | | (456 | ) | | | 57.50 | | | | 03/15/19 | | | | (1,250 | ) |
Exact Sciences Corp, Call | | | 18 | | | | (3,689 | ) | | | 80.00 | | | | 01/18/19 | | | | (360 | ) |
Facebook, Inc, Call | | | 2 | | | | (132 | ) | | | 165.00 | | | | 01/18/19 | | | | (6 | ) |
Facebook, Inc, Put | | | 2 | | | | (136 | ) | | | 125.00 | | | | 01/18/19 | | | | (532 | ) |
Facebook, Inc, Put | | | 2 | | | | (3,132 | ) | | | 135.00 | | | | 06/21/19 | | | | (2,980 | ) |
FedEx Corp, Call | | | 4 | | | | (994 | ) | | | 162.50 | | | | 01/18/19 | | | | (1,560 | ) |
FedEx Corp, Call | | | 4 | | | | (260 | ) | | | 180.00 | | | | 01/18/19 | | | | (96 | ) |
FedEx Corp, Put | | | 4 | | | | (788 | ) | | | 144.00 | | | | 01/25/19 | | | | (448 | ) |
FedEx Corp, Put | | | 4 | | | | (4,004 | ) | | | 200.00 | | | | 04/18/19 | | | | (16,020 | ) |
First Data Corp, Put | | | 18 | | | | (2,125 | ) | | | 17.00 | | | | 04/18/19 | | | | (3,150 | ) |
General Electric Co, Call | | | 17 | | | | (289 | ) | | | 18.00 | | | | 01/18/19 | | | | (17 | ) |
General Electric Co, Put | | | 17 | | | | (1,581 | ) | | | 7.00 | | | | 03/15/19 | | | | (986 | ) |
General Electric Co, Put | | | 17 | | | | (2,465 | ) | | | 8.00 | | | | 06/21/19 | | | | (2,295 | ) |
Hain Celestial Group, Inc, Put | | | 24 | | | | (13,152 | ) | | | 23.00 | | | | 01/17/20 | | | | (18,480 | ) |
HCA Healthcare, Inc, Put | | | 5 | | | | (445 | ) | | | 105.00 | | | | 01/18/19 | | | | (150 | ) |
IAC/InterActiveCorp, Call | | | 5 | | | | (3,608 | ) | | | 240.00 | | | | 01/18/19 | | | | (110 | ) |
IAC/InterActiveCorp, Put | | | 8 | | | | (4,584 | ) | | | 165.00 | | | | 01/18/19 | | | | (1,520 | ) |
IAC/InterActiveCorp, Put | | | 5 | | | | (11,815 | ) | | | 185.00 | | | | 07/19/19 | | | | (10,775 | ) |
Incyte Corp, Put | | | 3 | | | | (1,196 | ) | | | 52.50 | | | | 06/21/19 | | | | (893 | ) |
Ingredion, Inc, Put | | | 3 | | | | (1,194 | ) | | | 90.00 | | | | 04/18/19 | | | | (1,485 | ) |
International Business Machines Corp, Put | | | 7 | | | | (8,592 | ) | | | 120.00 | | | | 01/17/20 | | | | (11,935 | ) |
Jazz Pharmaceuticals plc, Put | | | 3 | | | | (2,131 | ) | | | 140.00 | | | | 03/15/19 | | | | (5,745 | ) |
Knight-Swift Transportation Holdings, Inc, Put | | | 20 | | | | (900 | ) | | | 25.00 | | | | 02/15/19 | | | | (4,020 | ) |
| |
| | | | | | |
| See notes to financial statements | | TIAA-CREF Life Funds § 2018 Annual Report | | | 53 | |
| | |
| Summary portfolio of investments | | concluded |
Growth & Income Fund § December 31, 2018
| | | | | | | | | | | | | | | | | | | | |
| Description/underlying investment | | Number of
contracts | | | Notional
amount | | | Exercise
price | | | Expiration
date | | | Value | |
| |
Knight-Swift Transportation Holdings, Inc, Put | | | 20 | | | $ | (3,766 | ) | | $ | 25.00 | | | | 05/17/19 | | | $ | (5,950 | ) |
Linde plc, Put | | | 3 | | | | (3,341 | ) | | | 140.00 | | | | 01/18/19 | | | | (177 | ) |
Mellanox Technologies Ltd, Put | | | 12 | | | | (1,186 | ) | | | 70.00 | | | | 01/18/19 | | | | (240 | ) |
Microchip Technology, Inc, Put | | | 10 | | | | (6,082 | ) | | | 65.00 | | | | 04/18/19 | | | | (3,000 | ) |
Micron Technology, Inc, Put | | | 13 | | | | (8,956 | ) | | | 40.00 | | | | 04/18/19 | | | | (11,830 | ) |
Monolithic Power Systems, Inc, Put | | | 5 | | | | (899 | ) | | | 100.00 | | | | 01/18/19 | | | | (287 | ) |
Nektar Therapeutics, Put | | | 8 | | | | (6,104 | ) | | | 41.00 | | | | 05/17/19 | | | | (8,920 | ) |
Neurocrine Biosciences, Inc, Put | | | 10 | | | | (1,080 | ) | | | 55.00 | | | | 01/18/19 | | | | (400 | ) |
Northrop Grumman Corp, Put | | | 1 | | | | (3,630 | ) | | | 290.00 | | | | 05/17/19 | | | | (4,860 | ) |
Northrop Grumman Corp, Put | | | 2 | | | | (7,872 | ) | | | 295.00 | | | | 05/17/19 | | | | (10,620 | ) |
Nutanix, Inc, Put | | | 4 | | | | (552 | ) | | | 30.00 | | | | 01/18/19 | | | | (40 | ) |
NVIDIA Corp, Put | | | 5 | | | | (545 | ) | | | 100.00 | | | | 01/18/19 | | | | (165 | ) |
Parker-Hannifin Corp, Put | | | 4 | | | | (3,352 | ) | | | 150.00 | | | | 02/15/19 | | | | (3,480 | ) |
PNC Financial Services Group, Inc, Call | | | 7 | | | | (1,393 | ) | | | 135.00 | | | | 02/15/19 | | | | (259 | ) |
PNC Financial Services Group, Inc, Call | | | 7 | | | | (2,653 | ) | | | 140.00 | | | | 02/15/19 | | | | (91 | ) |
PNC Financial Services Group, Inc, Put | | | 7 | | | | (2,716 | ) | | | 120.00 | | | | 02/15/19 | | | | (5,285 | ) |
PNC Financial Services Group, Inc, Put | | | 7 | | | | (2,541 | ) | | | 110.00 | | | | 05/17/19 | | | | (4,200 | ) |
PVH Corp, Put | | | 5 | | | | (2,310 | ) | | | 105.00 | | | | 03/15/19 | | | | (7,050 | ) |
PVH Corp, Put | | | 5 | | | | (2,875 | ) | | | 90.00 | | | | 03/15/19 | | | | (2,650 | ) |
PVH Corp, Put | | | 5 | | | | (4,690 | ) | | | 100.00 | | | | 06/21/19 | | | | (6,700 | ) |
QUALCOMM, Inc, Put | | | 8 | | | | (5,344 | ) | | | 60.00 | | | | 06/21/19 | | | | (5,344 | ) |
Red Hat, Inc, Put | | | 7 | | | | (2,436 | ) | | | 110.00 | | | | 01/18/19 | | | | (63 | ) |
Red Hat, Inc, Put | | | 4 | | | | (2,191 | ) | | | 115.00 | | | | 01/18/19 | | | | (12 | ) |
Rockwell Automation, Inc, Put | | | 2 | | | | (1,276 | ) | | | 145.00 | | | | 04/18/19 | | | | (1,540 | ) |
Roku, Inc, Put | | | 10 | | | | (3,180 | ) | | | 30.00 | | | | 02/15/19 | | | | (2,940 | ) |
salesforce.com, Inc, Call | | | 5 | | | | (550 | ) | | | 160.00 | | | | 01/18/19 | | | | (65 | ) |
salesforce.com, Inc, Put | | | 5 | | | | (2,210 | ) | | | 128.00 | | | | 01/25/19 | | | | (1,455 | ) |
salesforce.com, Inc, Put | | | 5 | | | | (2,055 | ) | | | 120.00 | | | | 02/15/19 | | | | (1,220 | ) |
Stryker Corp, Put | | | 5 | | | | (1,040 | ) | | | 145.00 | | | | 01/18/19 | | | | (490 | ) |
Take-Two Interactive Software, Inc, Put | | | 7 | | | | (2,134 | ) | | | 70.00 | | | | 01/18/19 | | | | (70 | ) |
Tiffany & Co, Put | | | 10 | | | | (9,680 | ) | | | 95.00 | | | | 05/17/19 | | | | (16,940 | ) |
Tiffany & Co, Put | | | 10 | | | | (23,280 | ) | | | 105.00 | | | | 01/17/20 | | | | (27,940 | ) |
Tiffany & Co, Put | | | 10 | | | | (27,030 | ) | | | 110.00 | | | | 01/17/20 | | | | (31,700 | ) |
Ulta Beauty, Inc, Call | | | 2 | | | | (307 | ) | | | 290.00 | | | | 01/18/19 | | | | (40 | ) |
United Parcel Service, Inc, Put | | | 7 | | | | (2,613 | ) | | | 95.00 | | | | 04/18/19 | | | | (4,060 | ) |
Universal Health Services, Inc, Call | | | 5 | | | | (715 | ) | | | 145.00 | | | | 01/18/19 | | | | (65 | ) |
WABCO Holdings, Inc, Call | | | 7 | | | | (1,966 | ) | | | 125.00 | | | | 01/18/19 | | | | (105 | ) |
WABCO Holdings, Inc, Put | | | 7 | | | | (946 | ) | | | 110.00 | | | | 01/18/19 | | | | (3,045 | ) |
WABCO Holdings, Inc, Put | | | 7 | | | | (1,526 | ) | | | 105.00 | | | | 03/15/19 | | | | (3,325 | ) |
WellCare Health Plans, Inc, Call | | | 3 | | | | (3,793 | ) | | | 350.00 | | | | 03/15/19 | | | | (247 | ) |
WellCare Health Plans, Inc, Put | | | 3 | | | | (2,424 | ) | | | 270.00 | | | | 03/15/19 | | | | (11,385 | ) |
WellCare Health Plans, Inc, Put | | | 3 | | | | (2,811 | ) | | | 290.00 | | | | 03/15/19 | | | | (16,605 | ) |
| |
Total | | | 664 | | | $ | (341,430 | ) | | | | | | | | | | $ | (477,235 | ) |
|
| |
| | | | |
| 54 | | 2018 Annual Report § TIAA-CREF Life Funds | | See notes to financial statements |
| | |
| Summary portfolio of investments | | |
Large-Cap Value Fund § December 31, 2018
| | | | | | | | | | | | | | | | |
| Shares | | | | | Company | | | | Value | | | % of net
assets | |
| | | | | | | | | | | | | | | | |
| | COMMON STOCKS | | | | | | | | | | |
| | BANKS | | | | | | | | | | |
| | 90,540 | | | | | Bank of America Corp | | | | $ | 2,230,906 | | | | 3.5 | % |
| | 34,663 | | | | | Citigroup, Inc | | | | | 1,804,556 | | | | 2.8 | |
| | 30,144 | | | | | JPMorgan Chase & Co | | | | | 2,942,657 | | | | 4.7 | |
| | 5,822 | | | | | PNC Financial Services Group, Inc | | | | | 680,650 | | | | 1.1 | |
| | 28,423 | | | | | Wells Fargo & Co | | | | | 1,309,732 | | | | 2.1 | |
| | | | | | Other | | | | | 740,503 | | | | 1.1 | |
| | | | | | | | | | | | |
| | | | | | | | | | | 9,709,004 | | | | 15.3 | |
| | | | | | | | | | | | |
| | CAPITAL GOODS | | | | | |
| | 5,555 | | | | | Deere & Co | | | | | 828,639 | | | | 1.3 | |
| | 7,487 | | | | | Honeywell International, Inc | | | | | 989,183 | | | | 1.6 | |
| | 8,961 | | | | | Ingersoll-Rand plc | | | | | 817,512 | | | | 1.3 | |
| | 18,301 | | | | | Masco Corp | | | | | 535,121 | | | | 0.8 | |
| | 5,202 | | | | | Stanley Works | | | | | 622,888 | | | | 1.0 | |
| | | | | | Other | | | | | 1,556,288 | | | | 2.5 | |
| | | | | | | | | | | | |
| | | | | | | | | | | 5,349,631 | | | | 8.5 | |
| | | | | | | | | | | | |
| | CONSUMER DURABLES & APPAREL | | | | | |
| | 230 | | | * | | NVR, Inc | | | | | 560,508 | | | | 0.9 | |
| | | | | | | | | | | | |
| | | | | | | | | | | 560,508 | | | | 0.9 | |
| | | | | | | | | | | | |
| | DIVERSIFIED FINANCIALS | | | | | |
| | 12,755 | | | | | Bank of New York Mellon Corp | | | | | 600,378 | | | | 1.0 | |
| | 4,722 | | | | | Goldman Sachs Group, Inc | | | | | 788,810 | | | | 1.2 | |
| | | | | | Other | | | | | 436,089 | | | | 0.6 | |
| | | | | | | | | | | | |
| | | | | | | | | | | 1,825,277 | | | | 2.8 | |
| | | | | | | | | | | | |
| | ENERGY | | | | | |
| | 16,740 | | | | | Chevron Corp | | | | | 1,821,145 | | | | 2.9 | |
| | 9,012 | | | * | | Concho Resources, Inc | | | | | 926,343 | | | | 1.5 | |
| | 6,654 | | | | | Diamondback Energy, Inc | | | | | 616,826 | | | | 1.0 | |
| | 15,174 | | | | | EOG Resources, Inc | | | | | 1,323,324 | | | | 2.1 | |
| | 10,261 | | | | | Exxon Mobil Corp | | | | | 699,698 | | | | 1.1 | |
| | | | | | Other | | | | | 1,136,959 | | | | 1.8 | |
| | | | | | | | | | | | |
| | | | | | | | | | | 6,524,295 | | | | 10.4 | |
| | | | | | | | | | | | |
| | FOOD & STAPLES RETAILING | | | | | 459,882 | | | | 0.7 | |
| | | | | | | | | | | | |
| | FOOD, BEVERAGE & TOBACCO | | | | | |
| | 15,251 | | | | | Mondelez International, Inc | | | | | 610,497 | | | | 1.0 | |
| | 11,785 | | | | | Philip Morris International, Inc | | | | | 786,767 | | | | 1.3 | |
| | | | | | | | | | | | |
| | | | | | | | | | | 1,397,264 | | | | 2.3 | |
| | | | | | | | | | | | |
| | HEALTH CARE EQUIPMENT & SERVICES | | | | | |
| | 12,894 | | | | | Abbott Laboratories | | | | | 932,623 | | | | 1.5 | |
| | 4,984 | | | | | Anthem, Inc | | | | | 1,308,948 | | | | 2.1 | |
| | 5,120 | | | | | Cigna Corp | | | | | 972,390 | | | | 1.5 | |
| | 11,974 | | | | | CVS Health Corp | | | | | 784,537 | | | | 1.3 | |
| | | | | | |
| See notes to financial statements | | TIAA-CREF Life Funds § 2018 Annual Report | | | 55 | |
| | |
| Summary portfolio of investments | | continued |
Large-Cap Value Fund § December 31, 2018
| | | | | | | | | | | | | | | | |
| Shares | | | | | Company | | | | Value | | | % of net
assets | |
| | | | | | | | | | | | | | | | |
| | HEALTH CARE EQUIPMENT & SERVICES—continued | | | | | | | | |
| | 7,081 | | | | | Medtronic plc | | | | $ | 644,088 | | | | 1.0 | % |
| | 3,529 | | | | | UnitedHealth Group, Inc | | | | | 879,144 | | | | 1.4 | |
| | 6,100 | | | | | Zimmer Biomet Holdings, Inc | | | | | 632,692 | | | | 1.0 | |
| | | | | | Other | | | | | 379,448 | | | | 0.6 | |
| | | | | | | | | | | | |
| | | | | | | | | | | 6,533,870 | | | | 10.4 | |
| | | | | | | | | | | | |
| | HOUSEHOLD & PERSONAL PRODUCTS | | | | | |
| | 16,638 | | | | | Procter & Gamble Co | | | | | 1,529,365 | | | | 2.4 | |
| | | | | | | | | | | | |
| | | | | | | | | | | 1,529,365 | | | | 2.4 | |
| | | | | | | | | | | | |
| | INSURANCE | | | | | |
| | 19,411 | | | | | American International Group, Inc | | | | | 764,987 | | | | 1.2 | |
| | 6,248 | | | * | | Berkshire Hathaway, Inc (Class B) | | | | | 1,275,717 | | | | 2.0 | |
| | 7,257 | | | | | Chubb Ltd | | | | | 937,459 | | | | 1.5 | |
| | | | | | Other | | | | | 1,237,667 | | | | 2.0 | |
| | | | | | | | | | | | |
| | | | | | | | | | | 4,215,830 | | | | 6.7 | |
| | | | | | | | | | | | |
| | MATERIALS | | | | | |
| | 13,865 | | | | | Ball Corp | | | | | 637,513 | | | | 1.0 | |
| | 12,755 | | | * | | Crown Holdings, Inc | | | | | 530,225 | | | | 0.8 | |
| | 22,877 | | | | | DowDuPont, Inc | | | | | 1,223,462 | | | | 2.0 | |
| | | | | | Other | | | | | 390,621 | | | | 0.6 | |
| | | | | | | | | | | | |
| | | | | | | | | | | 2,781,821 | | | | 4.4 | |
| | | | | | | | | | | | |
| | MEDIA & ENTERTAINMENT | | | | | |
| | 47,142 | | | | | Comcast Corp (Class A) | | | | | 1,605,185 | | | | 2.5 | |
| | | | | | Other | | | | | 159,212 | | | | 0.3 | |
| | | | | | | | | | | | |
| | | | | | | | | | | 1,764,397 | | | | 2.8 | |
| | | | | | | | | | | | |
| | PHARMACEUTICALS, BIOTECHNOLOGY & LIFE SCIENCES | | | | | |
| | 15,658 | | | | | Johnson & Johnson | | | | | 2,020,665 | | | | 3.2 | |
| | 38,129 | | | | | Pfizer, Inc | | | | | 1,664,331 | | | | 2.7 | |
| | 18,297 | | | | | Schering-Plough Corp | | | | | 1,398,074 | | | | 2.2 | |
| | | | | | Other | | | | | 700,096 | | | | 1.1 | |
| | | | | | | | | | | | |
| | | | | | | | | | | 5,783,166 | | | | 9.2 | |
| | | | | | | | | | | | |
| | RETAILING | | | | | |
| | 4,054 | | | | | Home Depot, Inc | | | | | 696,558 | | | | 1.1 | |
| | | | | | | | | | | | |
| | | | | | | | | | | 696,558 | | | | 1.1 | |
| | | | | | | | | | | | |
| | SEMICONDUCTORS & SEMICONDUCTOR EQUIPMENT | | | | | |
| | 2,195 | | | | | Broadcom, Inc | | | | | 558,144 | | | | 0.9 | |
| | 22,184 | | | | | Intel Corp | | | | | 1,041,095 | | | | 1.7 | |
| | | | | | Other | | | | | 468,661 | | | | 0.7 | |
| | | | | | | | | | | | |
| | | | | | | | | | | 2,067,900 | | | | 3.3 | |
| | | | | | | | | | | | |
| | SOFTWARE & SERVICES | | | | | |
| | 4,297 | | | | | Accenture plc | | | | | 605,920 | | | | 1.0 | |
| | 11,507 | | | | | Microsoft Corp | | | | | 1,168,766 | | | | 1.9 | |
| | | | |
| 56 | | 2018 Annual Report § TIAA-CREF Life Funds | | See notes to financial statements |
| | |
| Summary portfolio of investments | | concluded |
Large-Cap Value Fund § December 31, 2018
| | | | | | | | | | | | | | | | |
| Shares | | | | | Company | | | | Value | | | % of net
assets | |
| | | | | | | | | | | | | | | | |
| | SOFTWARE & SERVICES—continued | | | | | | | | |
| | 16,740 | | | | | Oracle Corp | | | | $ | 755,811 | | | | 1.2 | % |
| | | | | | Other | | | | | 516,015 | | | | 0.8 | |
| | | | | | | | | | | | |
| | | | | | | | | | | 3,046,512 | | | | 4.9 | |
| | | | | | | | | | | | |
| | TECHNOLOGY HARDWARE & EQUIPMENT | | | | | |
| | 42,565 | | | | | Cisco Systems, Inc | | | | | 1,844,341 | | | | 2.9 | |
| | 8,319 | | | | | TE Connectivity Ltd | | | | | 629,166 | | | | 1.0 | |
| | | | | | | | | | | | |
| | | | | | | | | | | 2,473,507 | | | | 3.9 | |
| | | | | | | | | | | | |
| | TELECOMMUNICATION SERVICES | | | | | |
| | 25,650 | | | | | Verizon Communications, Inc | | | | | 1,442,043 | | | | 2.3 | |
| | | | | | Other | | | | | 474,848 | | | | 0.8 | |
| | | | | | | | | | | | |
| | | | | | | | | | | 1,916,891 | | | | 3.1 | |
| | | | | | | | | | | | |
| | TRANSPORTATION | | | | | |
| | 5,961 | | | | | Union Pacific Corp | | | | | 823,989 | | | | 1.3 | |
| | | | | | Other | | | | | 345,292 | | | | 0.6 | |
| | | | | | | | | | | | |
| | | | | | | | | | | 1,169,281 | | | | 1.9 | |
| | | | | | | | | | | | |
| | UTILITIES | | | | | |
| | 16,740 | | | | | FirstEnergy Corp | | | | | 628,587 | | | | 1.0 | |
| | 4,579 | | | | | NextEra Energy, Inc | | | | | 795,922 | | | | 1.3 | |
| | | | | | Other | | | | | 1,394,233 | | | | 2.2 | |
| | | | | | | | | | | | |
| | | | | | | | | | | 2,818,742 | | | | 4.5 | |
| | | | | | | | | | | | |
| | | | | | TOTAL COMMON STOCKS | | (Cost $61,299,800) | | | 62,623,701 | | | | 99.5 | |
| | | | | | | | | | | | |
| | | | | |
| Principal | | | | | Issuer | | | | | | | | |
| | |
| | SHORT-TERM INVESTMENTS | | | | | | | | |
| | GOVERNMENT AGENCY DEBT | | | 130,000 | | | | 0.2 | |
| | | | | | | | | | | | |
| | | | | | TOTAL SHORT-TERM INVESTMENTS | | (Cost $129,992) | | | 130,000 | | | | 0.2 | |
| | | | | | | | | | | | |
| | | | | |
| | | | | | TOTAL PORTFOLIO | | (Cost $61,429,792) | | | 62,753,701 | | | | 99.7 | |
| | | | | | OTHER ASSETS & LIABILITIES, NET | | | | | 202,392 | | | | 0.3 | |
| | | | | | | | | | | | |
| | | | | | NET ASSETS | | | | $ | 62,956,093 | | | | 100.0 | % |
| | | | | | | | | | |
“Other” securities represent the aggregate value, by category, of securities that are not among the 50 largest holdings and, in total for any issuer, represent 1% or less of net assets.
For ease of presentation, a number of classification categories have been grouped together in the Summary portfolio of investments. Note that the Fund uses more specific categories in following its investment limitations on investment concentrations.
| | | | | | |
| See notes to financial statements | | TIAA-CREF Life Funds § 2018 Annual Report | | | 57 | |
| | |
| Summary portfolio of investments | | |
Real Estate Securities Fund § December 31, 2018
| | | | | | | | | | | | | | | | |
| Shares | | | | | Company | | | | Value | | | % of net
assets | |
| | | | | | | | | | | | | | | | |
| | COMMON STOCKS | | | | | | | | | | |
| | CASINOS & GAMING | | | | | | | | | | |
| | 24,000 | | | * | | Penn National Gaming, Inc | | | | $ | 451,920 | | | | 0.7 | % |
| | | | | | | | | | | | |
| | | | | | | | | | | 451,920 | | | | 0.7 | |
| | | | | | | | | | | | |
| | DATA PROCESSING & OUTSOURCED SERVICES | | | | | | | | | | |
| | 20,000 | | | * | | GDS Holdings Ltd (ADR) | | | | | 461,800 | | | | 0.7 | |
| | | | | | | | | | | | |
| | | | | | | | | | | 461,800 | | | | 0.7 | |
| | | | | | | | | | | | |
| | DIVERSIFIED REITS | | | | | 163,800 | | | | 0.2 | |
| | | | | | | | | | | | |
| | HEALTH CARE REITS | | | | | | | | | | |
| | 50,000 | | | | | HCP, Inc | | | | | 1,396,500 | | | | 2.1 | |
| | 20,000 | | | | | Healthcare Trust of America, Inc | | | | | 506,200 | | | | 0.8 | |
| | 20,000 | | | | | Ventas, Inc | | | | | 1,171,800 | | | | 1.7 | |
| | 23,000 | | | | | Welltower, Inc | | | | | 1,596,430 | | | | 2.4 | |
| | | | | | | | | | | | |
| | | | | | | | | | | 4,670,930 | | | | 7.0 | |
| | | | | | | | | | | | |
| | HOMEBUILDING | | | | | | | | | | |
| | 50,000 | | | * | | TRI Pointe Homes, Inc | | | | | 546,500 | | | | 0.8 | |
| | | | | | | | | | | | |
| | | | | | | | | | | 546,500 | | | | 0.8 | |
| | | | | | | | | | | | |
| | HOTEL & RESORT REITS | | | | | | | | | | |
| | 70,000 | | | | | Host Marriott Corp | | | | | 1,166,900 | | | | 1.7 | |
| | 14,000 | | | | | Pebblebrook Hotel Trust | | | | | 396,340 | | | | 0.6 | |
| | 67,000 | | | | | Sunstone Hotel Investors, Inc | | | | | 871,670 | | | | 1.3 | |
| | | | | | | | | | | | |
| | | | | | | | | | | 2,434,910 | | | | 3.6 | |
| | | | | | | | | | | | |
| | INDUSTRIAL REITS | | | | | | | | | | |
| | 6,000 | | | | | EastGroup Properties, Inc | | | | | 550,380 | | | | 0.8 | |
| | 55,000 | | | | | Prologis, Inc | | | | | 3,229,600 | | | | 4.8 | |
| | 80,000 | | | | | Rexford Industrial Realty, Inc | | | | | 2,357,600 | | | | 3.5 | |
| | 23,000 | | | | | Terreno Realty Corp | | | | | 808,910 | | | | 1.3 | |
| | | | | | | | | | | | |
| | | | | | | | | | | 6,946,490 | | | | 10.4 | |
| | | | | | | | | | | | |
| | IT CONSULTING & OTHER SERVICES | | | | | | | | | | |
| | 5,399 | | | * | | InterXion Holding NV | | | | | 292,410 | | | | 0.4 | |
| | | | | | | | | | | | |
| | | | | | | | | | | 292,410 | | | | 0.4 | |
| | | | | | | | | | | | |
| | MORTGAGE REITS | | | | | | | | | | |
| | 45,000 | | | | | Starwood Property Trust, Inc | | | | | 886,950 | | | | 1.3 | |
| | | | | | | | | | | | |
| | | | | | | | | | | 886,950 | | | | 1.3 | |
| | | | | | | | | | | | |
| | OFFICE REITS | | | | | | | | | | |
| | 16,000 | | | | | Alexandria Real Estate Equities, Inc | | | | | 1,843,840 | | | | 2.8 | |
| | 24,500 | | | | | Boston Properties, Inc | | | | | 2,757,475 | | | | 4.1 | |
| | 28,000 | | | | | Hudson Pacific Properties | | | | | 813,680 | | | | 1.2 | |
| | 25,500 | | | | | JBG SMITH Properties | | | | | 887,655 | | | | 1.3 | |
| | 16,500 | | | | | Kilroy Realty Corp | | | | | 1,037,520 | | | | 1.5 | |
| | 5,500 | | | | | SL Green Realty Corp | | | | | 434,940 | | | | 0.7 | |
| | | | | | | | | | | | |
| | | | | | | | | | | 7,775,110 | | | | 11.6 | |
| | | | | | | | | | | | |
| | | | |
| 58 | | 2018 Annual Report § TIAA-CREF Life Funds | | See notes to financial statements |
| | |
| Summary portfolio of investments | | continued |
Real Estate Securities Fund § December 31, 2018
| | | | | | | | | | | | | | | | |
| Shares | | | | | Company | | | | Value | | | % of net
assets | |
| | | | | | | | | | | | | | | | |
| | REAL ESTATE OPERATING COMPANIES | | | | $ | 207,600 | | | | 0.3 | % |
| | | | | | | | | | | | |
| | RESIDENTIAL REITS | | | | | | | | | | |
| | 70,000 | | | | | American Homes 4 Rent | | | | | 1,389,500 | | | | 2.1 | |
| | 16,000 | | | | | AvalonBay Communities, Inc | | | | | 2,784,800 | | | | 4.2 | |
| | 14,000 | | | | | Camden Property Trust | | | | | 1,232,700 | | | | 1.8 | |
| | 21,000 | | | | | Equity Lifestyle Properties, Inc | | | | | 2,039,730 | | | | 3.0 | |
| | 14,000 | | | | | Equity Residential | | | | | 924,140 | | | | 1.4 | |
| | 9,000 | | | | | Essex Property Trust, Inc | | | | | 2,206,890 | | | | 3.3 | |
| | 38,000 | | | | | Invitation Homes, Inc | | | | | 763,040 | | | | 1.1 | |
| | 23,000 | | | | | Sun Communities, Inc | | | | | 2,339,330 | | | | 3.5 | |
| | | | | | | | | | | | |
| | | | | | | | | | | 13,680,130 | | | | 20.4 | |
| | | | | | | | | | | | |
| | RETAIL REITS | | | | | | | | | | |
| | 12,000 | | | | | Agree Realty Corp | | | | | 709,440 | | | | 1.0 | |
| | 12,500 | | | | | Federal Realty Investment Trust | | | | | 1,475,500 | | | | 2.2 | |
| | 7,000 | | | | | Realty Income Corp | | | | | 441,280 | | | | 0.7 | |
| | 31,000 | | | | | Regency Centers Corp | | | | | 1,819,080 | | | | 2.7 | |
| | 20,000 | | | | | Retail Opportunities Investment Corp | | | | | 317,600 | | | | 0.5 | |
| | 30,000 | | | | | Simon Property Group, Inc | | | | | 5,039,700 | | | | 7.5 | |
| | | | | | Other | | | | | 181,960 | | | | 0.3 | |
| | | | | | | | | | | | |
| | | | | | | | | | | 9,984,560 | | | | 14.9 | |
| | | | | | | | | | | | |
| | SPECIALIZED REITS | | | | | | | | | | |
| | 22,000 | | | | | American Tower Corp | | | | | 3,480,180 | | | | 5.2 | |
| | 25,500 | | | | | Crown Castle International Corp | | | | | 2,770,065 | | | | 4.1 | |
| | 16,000 | | | | | CyrusOne, Inc | | | | | 846,080 | | | | 1.2 | |
| | 12,000 | | | | | Digital Realty Trust, Inc | | | | | 1,278,600 | | | | 1.9 | |
| | 6,300 | | | | | Equinix, Inc | | | | | 2,221,128 | | | | 3.3 | |
| | 12,500 | | | | | Extra Space Storage, Inc | | | | | 1,131,000 | | | | 1.7 | |
| | 25,000 | | | | | Four Corners Property Trust, Inc | | | | | 655,000 | | | | 1.0 | |
| | 15,000 | | | | | Gaming and Leisure Properties, Inc | | | | | 484,650 | | | | 0.7 | |
| | 19,483 | | | | | National Storage Affiliates Trust | | | | | 515,520 | | | | 0.8 | |
| | 6,000 | | | | | Public Storage, Inc | | | | | 1,214,460 | | | | 1.8 | |
| | 23,000 | | | | | QTS Realty Trust, Inc | | | | | 852,150 | | | | 1.3 | |
| | 7,500 | | | * | | SBA Communications Corp | | | | | 1,214,175 | | | | 1.8 | |
| | 55,000 | | | | | Weyerhaeuser Co | | | | | 1,202,300 | | | | 1.7 | |
| | | | | | | | | | | | |
| | | | | | | | | | | 17,865,308 | | | | 26.5 | |
| | | | | | | | | | | | |
| | | | | | TOTAL COMMON STOCKS | | (Cost $52,584,075) | | | 66,368,418 | | | | 98.8 | |
| | | | | | | | | | | | |
| | | | | | |
| See notes to financial statements | | TIAA-CREF Life Funds § 2018 Annual Report | | | 59 | |
| | |
| Summary portfolio of investments | | concluded |
Real Estate Securities Fund § December 31, 2018
| | | | | | | | | | | | | | | | |
| Principal | | | | | Issuer | | | | Value | | | % of net
assets | |
| | | | | | | | | | | | | | | | |
| | SHORT-TERM INVESTMENTS | | | | | | | | | | |
| | GOVERNMENT AGENCY DEBT | | | | | | | | |
| | $510,000 | | | | | Federal Home Loan Bank (FHLB)
2.150%, 01/02/19 | | | | $ | 510,000 | | | | 0.8 | % |
| | | | | | | | | | | | |
| | | | | | | | | | | 510,000 | | | | 0.8 | |
| | | | | | | | | | | | |
| | | | | | TOTAL SHORT-TERM INVESTMENTS | | (Cost $509,969) | | | 510,000 | | | | 0.8 | |
| | | | | | | | | | | | |
| | | | | |
| | | | | | TOTAL PORTFOLIO | | (Cost $53,094,044) | | | 66,878,418 | | | | 99.6 | |
| | | | | | OTHER ASSETS & LIABILITIES, NET | | | | | 263,845 | | | | 0.4 | |
| | | | | | | | | | | | |
| | | | | | NET ASSETS | | | | $ | 67,142,263 | | | | 100.0 | % |
| | | | | | | | | | | | |
Abbreviation(s):
| ADR | | American Depositary Receipt |
| REIT | | Real Estate Investment Trust |
“Other” securities represent the aggregate value, by category, of securities that are not among the 50 largest holdings and, in total for any issuer, represent 1% or less of net assets.
For ease of presentation, a number of classification categories have been grouped together in the Summary portfolio of investments. Note that the Fund uses more specific categories in following its investment limitations on investment concentrations.
| | | | |
| 60 | | 2018 Annual Report § TIAA-CREF Life Funds | | See notes to financial statements |
| | |
| Summary portfolio of investments | | |
Small-Cap Equity Fund § December 31, 2018
| | | | | | | | | | | | | | | | |
| Shares | | | | | Company | | | | Value | | | % of net
assets | |
| | | | | | | | | | | | | | | | |
| | COMMON STOCKS | | | | | | | | | | |
| | AUTOMOBILES & COMPONENTS | | | | $ | 165,623 | | | | 0.4 | % |
| | | | | | | | | | | | |
| | BANKS | | | | | | | | | | |
| | 8,390 | | | | | Cathay General Bancorp | | | | | 281,316 | | | | 0.6 | |
| | 8,610 | | | * | | Essent Group Ltd | | | | | 294,290 | | | | 0.6 | |
| | 8,320 | | | | | Hancock Holding Co | | | | | 288,288 | | | | 0.6 | |
| | 4,460 | | | | | IBERIABANK Corp | | | | | 286,689 | | | | 0.6 | |
| | 25,380 | | | * | | MGIC Investment Corp | | | | | 265,475 | | | | 0.6 | |
| | 12,277 | | | | | United Community Banks, Inc | | | | | 263,464 | | | | 0.6 | |
| | 6,100 | | | | | Walker & Dunlop, Inc | | | | | 263,825 | | | | 0.6 | |
| | | | | | Other | | | | | 3,209,883 | | | | 6.9 | |
| | | | | | | | | | | | |
| | | | | | | | | | | 5,153,230 | | | | 11.1 | |
| | | | | | | | | | | | |
| | CAPITAL GOODS | | | | | |
| | 7,479 | | | | | Comfort Systems USA, Inc | | | | | 326,683 | | | | 0.7 | |
| | 6,197 | | | | | EMCOR Group, Inc | | | | | 369,899 | | | | 0.8 | |
| | 6,560 | | | * | | Generac Holdings, Inc | | | | | 326,032 | | | | 0.7 | |
| | 7,270 | | | | | Hillenbrand, Inc | | | | | 275,751 | | | | 0.6 | |
| | 5,140 | | | * | | Trex Co, Inc | | | | | 305,110 | | | | 0.7 | |
| | | | | | Other | | | | | 3,037,799 | | | | 6.5 | |
| | | | | | | | | | | | |
| | | | | | | | | | | 4,641,274 | | | | 10.0 | |
| | | | | | | | | | | | |
| | COMMERCIAL & PROFESSIONAL SERVICES | | | | | |
| | 5,629 | | | | | Exponent, Inc | | | | | 285,447 | | | | 0.6 | |
| | 4,240 | | | | | Insperity, Inc | | | | | 395,846 | | | | 0.9 | |
| | 5,408 | | | | | Viad Corp | | | | | 270,887 | | | | 0.6 | |
| | | | | | Other | | | | | 659,303 | | | | 1.4 | |
| | | | | | | | | | | | |
| | | | | | | | | | | 1,611,483 | | | | 3.5 | |
| | | | | | | | | | | | |
| | CONSUMER DURABLES & APPAREL | | | | | |
| | 2,340 | | | * | | Deckers Outdoor Corp | | | | | 299,403 | | | | 0.6 | |
| | 2,000 | | | * | | Helen of Troy Ltd | | | | | 262,360 | | | | 0.6 | |
| | | | | | Other | | | | | 1,066,066 | | | | 2.3 | |
| | | | | | | | | | | | |
| | | | | | | | | | | 1,627,829 | | | | 3.5 | |
| | | | | | | | | | | | |
| | CONSUMER SERVICES | | | | | |
| | 2,500 | | | * | | Bright Horizons Family Solutions | | | | | 278,625 | | | | 0.6 | |
| | 5,260 | | | | | Texas Roadhouse, Inc (Class A) | | | | | 314,022 | | | | 0.7 | |
| | | | | | Other | | | | | 1,064,054 | | | | 2.3 | |
| | | | | | | | | | | | |
| | | | | | | | | | | 1,656,701 | | | | 3.6 | |
| | | | | | | | | | | | |
| | DIVERSIFIED FINANCIALS | | | | | |
| | 3,850 | | | * | | Green Dot Corp | | | | | 306,152 | | | | 0.7 | |
| | 4,900 | | | | | iShares Russell 2000 Index Fund | | | | | 656,110 | | | | 1.4 | |
| | | | | | Other | | | | | 1,441,752 | | | | 3.1 | |
| | | | | | | | | | | | |
| | | | | | | | | | | 2,404,014 | | | | 5.2 | |
| | | | | | | | | | | | |
| | | | | | |
| See notes to financial statements | | TIAA-CREF Life Funds § 2018 Annual Report | | | 61 | |
| | |
| Summary portfolio of investments | | continued |
Small-Cap Equity Fund § December 31, 2018
| | | | | | | | | | | | | | | | |
| Shares | | | | | Company | | | | Value | | | % of net
assets | |
| | | | | | | | | | | | | | | | |
| | ENERGY | | | | $ | 2,039,910 | | | | 4.4 | % |
| | | | | | | | | | | | |
| | FOOD, BEVERAGE & TOBACCO | | | | | |
| | 1,990 | | | | | Lancaster Colony Corp | | | | | 351,951 | | | | 0.8 | |
| | | | | | Other | | | | | 92,936 | | | | 0.2 | |
| | | | | | | | | | | | |
| | | | | | | | | | | 444,887 | | | | 1.0 | |
| | | | | | | | | | | | |
| | HEALTH CARE EQUIPMENT & SERVICES | | | | | |
| | 3,690 | | | | | Hill-Rom Holdings, Inc | | | | | 326,749 | | | | 0.7 | |
| | 10,860 | | | * | | HMS Holdings Corp | | | | | 305,492 | | | | 0.7 | |
| | 4,400 | | | * | | Integer Holding Corp | | | | | 335,544 | | | | 0.7 | |
| | 2,520 | | | * | | Masimo Corp | | | | | 270,572 | | | | 0.6 | |
| | | | | | Other | | | | | 1,579,350 | | | | 3.4 | |
| | | | | | | | | | | | |
| | | | | | | | | | | 2,817,707 | | | | 6.1 | |
| | | | | | | | | | | | |
| | HOUSEHOLD & PERSONAL PRODUCTS | | | | | |
| | 2,670 | | | * | | USANA Health Sciences, Inc | | | | | 314,339 | | | | 0.7 | |
| | | | | | Other | | | | | 266,928 | | | | 0.5 | |
| | | | | | | | | | | | |
| | | | | | | | | | | 581,267 | | | | 1.2 | |
| | | | | | | | | | | | |
| | INSURANCE | | | | | 864,180 | | | | 1.9 | |
| | | | | | | | | | | | |
| | MATERIALS | | | | | |
| | 3,710 | | | * | | Ingevity Corp | | | | | 310,490 | | | | 0.6 | |
| | | | | | Other | | | | | 1,333,645 | | | | 2.9 | |
| | | | | | | | | | | | |
| | | | | | | | | | | 1,644,135 | | | | 3.5 | |
| | | | | | | | | | | | |
| | MEDIA & ENTERTAINMENT | | | | | |
| | 950 | | | * | | Madison Square Garden Co | | | | | 254,315 | | | | 0.5 | |
| | | | | | Other | | | | | 375,761 | | | | 0.8 | |
| | | | | | | | | | | | |
| | | | | | | | | | | 630,076 | | | | 1.3 | |
| | | | | | | | | | | | |
| | PHARMACEUTICALS, BIOTECHNOLOGY & LIFE SCIENCES | | | | | |
| | 13,640 | | | * | | Horizon Pharma plc | | | | | 266,526 | | | | 0.5 | |
| | | | | | Other | | | | | 3,983,353 | | | | 8.6 | |
| | | | | | | | | | | | |
| | | | | | | | | | | 4,249,879 | | | | 9.1 | |
| | | | | | | | | | | | |
| | REAL ESTATE | | | | | |
| | 33,150 | | | | | Cousins Properties, Inc | | | | | 261,885 | | | | 0.6 | |
| | 3,560 | | | | | EastGroup Properties, Inc | | | | | 326,559 | | | | 0.7 | |
| | 13,580 | | | | | Geo Group, Inc | | | | | 267,526 | | | | 0.6 | |
| | 2,519 | | | | | PS Business Parks, Inc | | | | | 329,989 | | | | 0.7 | |
| | 3,670 | | | | | Ryman Hospitality Properties | | | | | 244,752 | | | | 0.5 | |
| | | | | | Other | | | | | 2,222,429 | | | | 4.8 | |
| | | | | | | | | | | | |
| | | | | | | | | | | 3,653,140 | | | | 7.9 | |
| | | | | | | | | | | | |
| | RETAILING | | | | | |
| | 3,660 | | | * | | Five Below, Inc | | | | | 374,491 | | | | 0.8 | |
| | | | | | Other | | | | | 1,406,332 | | | | 3.0 | |
| | | | | | | | | | | | |
| | | | | | | | | | | 1,780,823 | | | | 3.8 | |
| | | | | | | | | | | | |
| | | | |
| 62 | | 2018 Annual Report § TIAA-CREF Life Funds | | See notes to financial statements |
| | |
| Summary portfolio of investments | | continued |
Small-Cap Equity Fund § December 31, 2018
| | | | | | | | | | | | | | | | |
| Shares | | | | | Company | | | | Value | | | % of net
assets | |
| | | | | | | | | | | | | | | | |
| | SEMICONDUCTORS & SEMICONDUCTOR EQUIPMENT | | | | | | | | |
| | 2,595 | | | | | Cabot Microelectronics Corp | | | | $ | 247,433 | | | | 0.5 | % |
| | 5,910 | | | * | | Semtech Corp | | | | | 271,092 | | | | 0.6 | |
| | | | | | Other | | | | | 683,110 | | | | 1.5 | |
| | | | | | | | | | | | |
| | | | | | | | | | | 1,201,635 | | | | 2.6 | |
| | | | | | | | | | | | |
| | SOFTWARE & SERVICES | | | | | | | | |
| | 9,821 | | | | | EVERTEC, Inc | | | | | 281,863 | | | | 0.6 | |
| | 6,310 | | | * | | Five9, Inc | | | | | 275,873 | | | | 0.6 | |
| | 4,245 | | | * | | Paylocity Holding Corp | | | | | 255,591 | | | | 0.6 | |
| | 2,560 | | | * | | Trade Desk, Inc | | | | | 297,114 | | | | 0.6 | |
| | 6,790 | | | * | | Verint Systems, Inc | | | | | 287,285 | | | | 0.6 | |
| | | | | | Other | | | | | 2,153,792 | | | | 4.6 | |
| | | | | | | | | | | | |
| | | | | | | | | | | 3,551,518 | | | | 7.6 | |
| | | | | | | | | | | | |
| | TECHNOLOGY HARDWARE & EQUIPMENT | | | | | | | | |
| | 3,410 | | | | | SYNNEX Corp | | | | | 275,665 | | | | 0.6 | |
| | | | | | Other | | | | | 2,116,447 | | | | 4.6 | |
| | | | | | | | | | | | |
| | | | | | | | | | | 2,392,112 | | | | 5.2 | |
| | | | | | | | | | | | |
| | TELECOMMUNICATION SERVICES | | | | | | | | |
| | 31,112 | | | * | | Vonage Holdings Corp | | | | | 271,608 | | | | 0.6 | |
| | | | | | | | | | | | |
| | | | | | | | | | | 271,608 | | | | 0.6 | |
| | | | | | | | | | | | |
| | TRANSPORTATION | | | 957,571 | | | | 2.0 | |
| | | | | | | | | | | | |
| | UTILITIES | | | | | | | | |
| | 7,570 | | | | | New Jersey Resources Corp | | | | | 345,722 | | | | 0.7 | |
| | 4,837 | | | | | NorthWestern Corp | | | | | 287,511 | | | | 0.6 | |
| | 8,300 | | | | | Portland General Electric Co | | | | | 380,555 | | | | 0.8 | |
| | 4,043 | | | | | Southwest Gas Corp | | | | | 309,290 | | | | 0.7 | |
| | | | | | Other | | | | | 585,245 | | | | 1.3 | |
| | | | | | | | | | | | |
| | | | | | | | | | | 1,908,323 | | | | 4.1 | |
| | | | | | | | | | | | |
| | | | | | TOTAL COMMON STOCKS | | (Cost $48,748,848) | | | 46,248,925 | | | | 99.6 | |
| | | | | | | | | | | | |
| | | | | |
| Principal | | | | | Issuer | | | | | | | | |
| | |
| | SHORT-TERM INVESTMENTS | | | | | | | | |
| | GOVERNMENT AGENCY DEBT | | | | | 160,000 | | | | 0.3 | |
| | | | | | | | | | | | |
| | | | | |
| Shares | | | | | Company | | | | | | | | |
| | INVESTMENTS IN REGISTERED INVESTMENT COMPANIES | | | | | | | | | | |
| | 303,146 | | | c | | State Street Navigator Securities Lending Government Money Market Portfolio | | | 303,146 | | | | 0.7 | |
| | | | | | | | | | | | |
| | | | | | | | | | | 303,146 | | | | 0.7 | |
| | | | | | | | | | | | |
| | | | | | TOTAL SHORT-TERM INVESTMENTS | | (Cost $463,136) | | | 463,146 | | | | 1.0 | |
| | | | | | | | | | | | |
| | | | | |
| | | | | | TOTAL PORTFOLIO | | (Cost $49,211,984) | | | 46,712,071 | | | | 100.6 | |
| | | | | | OTHER ASSETS & LIABILITIES, NET | | | | | (287,317 | ) | | | (0.6 | ) |
| | | | | | | | | | | | |
| | | | | | NET ASSETS | | | | $ | 46,424,754 | | | | 100.0 | % |
| | | | | | | | | | |
| | | | | | |
| See notes to financial statements | | TIAA-CREF Life Funds § 2018 Annual Report | | | 63 | |
| | |
| Summary portfolio of investments | | concluded |
Small-Cap Equity Fund § December 31, 2018
| c | | Investments made with cash collateral received from securities on loan. |
“Other” securities represent the aggregate value, by category, of securities that are not among the 50 largest holdings and, in total for any issuer, represent 1% or less of net assets.
At 12/31/18, the aggregate value of securities on loan is $303,730.
For ease of presentation, a number of classification categories have been grouped together in the Summary portfolio of investments. Note that the Fund uses more specific categories in following its investment limitations on investment concentrations.
| | | | |
| 64 | | 2018 Annual Report § TIAA-CREF Life Funds | | See notes to financial statements |
| | |
| Summary portfolio of investments | | |
Social Choice Equity Fund § December 31, 2018
| | | | | | | | | | | | | | | | |
| Shares | | | | | Company | | | | Value | | | % of net
assets | |
| | | | | | | | | | | | | | | | |
| | COMMON STOCKS | | | | | | | | | | |
| | AUTOMOBILES & COMPONENTS | | | | $ | 319,911 | | | | 0.5 | % |
| | | | | | | | | | | | |
| | BANKS | | | | | |
| | 30,027 | | | | | Bank of America Corp | | | | | 739,865 | | | | 1.3 | |
| | 2,981 | | | | | PNC Financial Services Group, Inc | | | | | 348,509 | | | | 0.6 | |
| | | | | | Other | | | | | 1,556,357 | | | | 2.8 | |
| | | | | | | | | | | | |
| | | | | | | | | | | 2,644,731 | | | | 4.7 | |
| | | | | | | | | | | | |
| | CAPITAL GOODS | | | | | |
| | 2,599 | | | | | 3M Co | | | | | 495,214 | | | | 0.9 | |
| | 2,847 | | | | | Caterpillar, Inc | | | | | 361,768 | | | | 0.6 | |
| | 2,558 | | | | | Illinois Tool Works, Inc | | | | | 324,073 | | | | 0.6 | |
| | | | | | Other | | | | | 2,181,254 | | | | 3.9 | |
| | | | | | | | | | | | |
| | | | | | | | | | | 3,362,309 | | | | 6.0 | |
| | | | | | | | | | | | |
| | COMMERCIAL & PROFESSIONAL SERVICES | | | | | 644,100 | | | | 1.2 | |
| | | | | | | | | | | | |
| | CONSUMER DURABLES & APPAREL | | | | | |
| | 6,390 | | | | | Nike, Inc (Class B) | | | | | 473,755 | | | | 0.8 | |
| | | | | | Other | | | | | 312,537 | | | | 0.6 | |
| | | | | | | | | | | | |
| | | | | | | | | | | 786,292 | | | | 1.4 | |
| | | | | | | | | | | | |
| | CONSUMER SERVICES | | | | | |
| | 7,017 | | | | | Starbucks Corp | | | | | 451,895 | | | | 0.8 | |
| | | | | | Other | | | | | 822,986 | | | | 1.5 | |
| | | | | | | | | | | | |
| | | | | | | | | | | 1,274,881 | | | | 2.3 | |
| | | | | | | | | | | | |
| | DIVERSIFIED FINANCIALS | | | | | |
| | 4,130 | | | | | American Express Co | | | | | 393,672 | | | | 0.7 | |
| | 2,131 | | | | | CME Group, Inc | | | | | 400,884 | | | | 0.7 | |
| | 1,934 | | | | | S&P Global, Inc | | | | | 328,664 | | | | 0.6 | |
| | | | | | Other | | | | | 2,391,642 | | | | 4.3 | |
| | | | | | | | | | | | |
| | | | | | | | | | | 3,514,862 | | | | 6.3 | |
| | | | | | | | | | | | |
| | ENERGY | | | | | |
| | 6,779 | | | | | ConocoPhillips | | | | | 422,670 | | | | 0.7 | |
| | | | | | Other | | | | | 2,221,684 | | | | 4.0 | |
| | | | | | | | | | | | |
| | | | | | | | | | | 2,644,354 | | | | 4.7 | |
| | | | | | | | | | | | |
| | FOOD & STAPLES RETAILING | | | | | 307,556 | | | | 0.6 | |
| | | | | | | | | | | | |
| | FOOD, BEVERAGE & TOBACCO | | | | | |
| | 13,819 | | | | | Coca-Cola Co | | | | | 654,330 | | | | 1.2 | |
| | 9,639 | | | | | Mondelez International, Inc | | | | | 385,849 | | | | 0.7 | |
| | 5,470 | | | | | PepsiCo, Inc | | | | | 604,325 | | | | 1.1 | |
| | | | | | Other | | | | | 422,803 | | | | 0.7 | |
| | | | | | | | | | | | |
| | | | | | | | | | | 2,067,307 | | | | 3.7 | |
| | | | | | | | | | | | |
| | | | | | |
| See notes to financial statements | | TIAA-CREF Life Funds § 2018 Annual Report | | | 65 | |
| | |
| Summary portfolio of investments | | continued |
Social Choice Equity Fund § December 31, 2018
| | | | | | | | | | | | | | | | |
| Shares | | | | | Company | | | | Value | | | % of net
assets | |
| | | | | | | | | | | | | | | | |
| | HEALTH CARE EQUIPMENT & SERVICES | | | | | |
| | 1,764 | | | | | Becton Dickinson & Co | | | | $ | 397,464 | | | | 0.7 | % |
| | 2,971 | | | | | UnitedHealth Group, Inc | | | | | 740,136 | | | | 1.3 | |
| | | | | | Other | | | | | 2,652,053 | | | | 4.8 | |
| | | | | | | | | | | | |
| | | | | | | | | | | 3,789,653 | | | | 6.8 | |
| | | | | | | | | | | | |
| | HOUSEHOLD & PERSONAL PRODUCTS | | | | | |
| | 8,393 | | | | | Procter & Gamble Co | | | | | 771,484 | | | | 1.4 | |
| | | | | | Other | | | | | 479,434 | | | | 0.8 | |
| | | | | | | | | | | | |
| | | | | | | | | | | 1,250,918 | | | | 2.2 | |
| | | | | | | | | | | | |
| | INSURANCE | | | | | |
| | 3,084 | | | | | Chubb Ltd | | | | | 398,391 | | | | 0.7 | |
| | | | | | Other | | | | | 1,725,845 | | | | 3.1 | |
| | | | | | | | | | | | |
| | | | | | | | | | | 2,124,236 | | | | 3.8 | |
| | | | | | | | | | | | |
| | MATERIALS | | | | | |
| | 2,326 | | | | | Ecolab, Inc | | | | | 342,736 | | | | 0.6 | |
| | 2,246 | | | | | Linde plc | | | | | 350,466 | | | | 0.7 | |
| | | | | | Other | | | | | 1,013,652 | | | | 1.8 | |
| | | | | | | | | | | | |
| | | | | | | | | | | 1,706,854 | | | | 3.1 | |
| | | | | | | | | | | | |
| | MEDIA & ENTERTAINMENT | | | | | |
| | 634 | | | * | | Alphabet, Inc (Class A) | | | | | 662,505 | | | | 1.2 | |
| | 661 | | | * | | Alphabet, Inc (Class C) | | | | | 684,538 | | | | 1.2 | |
| | 1,879 | | | * | | NetFlix, Inc | | | | | 502,933 | | | | 0.9 | |
| | | | | | Other | | | | | 874,821 | | | | 1.6 | |
| | | | | | | | | | | | |
| | | | | | | | | | | 2,724,797 | | | | 4.9 | |
| | | | | | | | | | | | |
| | PHARMACEUTICALS, BIOTECHNOLOGY & LIFE SCIENCES | | | | | |
| | 4,427 | | | | | AbbVie, Inc | | | | | 408,125 | | | | 0.7 | |
| | 2,834 | | | | | Amgen, Inc | | | | | 551,695 | | | | 1.0 | |
| | 7,021 | | | | | Bristol-Myers Squibb Co | | | | | 364,951 | | | | 0.7 | |
| | 4,451 | | | | | Eli Lilly & Co | | | | | 515,070 | | | | 0.9 | |
| | 9,373 | | | | | Schering-Plough Corp | | | | | 716,191 | | | | 1.3 | |
| | 3,978 | | | | | Zoetis, Inc | | | | | 340,278 | | | | 0.6 | |
| | | | | | Other | | | | | 1,897,870 | | | | 3.4 | |
| | | | | | | | | | | | |
| | | | | | | | | | | 4,794,180 | | | | 8.6 | |
| | | | | | | | | | | | |
| | REAL ESTATE | | | | | |
| | 2,700 | | | | | American Tower Corp | | | | | 427,113 | | | | 0.7 | |
| | | | | | Other | | | | | 1,612,161 | | | | 3.0 | |
| | | | | | | | | | | | |
| | | | | | | | | | | 2,039,274 | | | | 3.7 | |
| | | | | | | | | | | | |
| | RETAILING | | | | | |
| | 248 | | | * | | Booking Holdings, Inc | | | | | 427,160 | | | | 0.8 | |
| | 3,937 | | | | | Home Depot, Inc | | | | | 676,455 | | | | 1.2 | |
| | 4,400 | | | | | Lowe’s Companies, Inc | | | | | 406,384 | | | | 0.7 | |
| | | | | | Other | | | | | 1,380,125 | | | | 2.5 | |
| | | | | | | | | | | | |
| | | | | | | | | | | 2,890,124 | | | | 5.2 | |
| | | | | | | | | | | | |
| | | | |
| 66 | | 2018 Annual Report § TIAA-CREF Life Funds | | See notes to financial statements |
| | |
| Summary portfolio of investments | | continued |
Social Choice Equity Fund § December 31, 2018
| | | | | | | | | | | | | | | | |
| Shares | | | | | Company | | | | Value | | | % of net
assets | |
| | | | | | | | | | | | | | | | |
| | SEMICONDUCTORS & SEMICONDUCTOR EQUIPMENT | | | | | |
| | 14,248 | | | | | Intel Corp | | | | $ | 668,659 | | | | 1.2 | % |
| | 4,677 | | | | | Texas Instruments, Inc | | | | | 441,976 | | | | 0.8 | |
| | | | | | Other | | | | | 594,899 | | | | 1.0 | |
| | | | | | | | | | | | |
| | | | | | | | | | | 1,705,534 | | | | 3.0 | |
| | | | | | | | | | | | |
| | SOFTWARE & SERVICES | | | | | |
| | 3,178 | | | | | Accenture plc | | | | | 448,130 | | | | 0.8 | |
| | 1,435 | | | * | | Adobe, Inc | | | | | 324,654 | | | | 0.6 | |
| | 4,249 | | | | | International Business Machines Corp | | | | | 482,984 | | | | 0.9 | |
| | 1,855 | | | | | Intuit, Inc | | | | | 365,157 | | | | 0.7 | |
| | 18,808 | | | d | | Microsoft Corp | | | | | 1,910,329 | | | | 3.4 | |
| | 11,697 | | | | | Oracle Corp | | | | | 528,119 | | | | 0.9 | |
| | 3,560 | | | * | | salesforce.com, Inc | | | | | 487,613 | | | | 0.9 | |
| | | | | | Other | | | | | 1,746,797 | | | | 3.1 | |
| | | | | | | | | | | | |
| | | | | | | | | | | 6,293,783 | | | | 11.3 | |
| | | | | | | | | | | | |
| | TECHNOLOGY HARDWARE & EQUIPMENT | | | | | |
| | 11,196 | | | | | Apple, Inc | | | | | 1,766,057 | | | | 3.2 | |
| | 16,094 | | | | | Cisco Systems, Inc | | | | | 697,353 | | | | 1.2 | |
| | | | | | Other | | | | | 1,174,946 | | | | 2.1 | |
| | | | | | | | | | | | |
| | | | | | | | | | | 3,638,356 | | | | 6.5 | |
| | | | | | | | | | | | |
| | TELECOMMUNICATION SERVICES | | | | | |
| | 7,996 | | | | | Verizon Communications, Inc | | | | | 449,535 | | | | 0.8 | |
| | | | | | Other | | | | | 479,785 | | | | 0.8 | |
| | | | | | | | | | | | |
| | | | | | | | | | | 929,320 | | | | 1.6 | |
| | | | | | | | | | | | |
| | TRANSPORTATION | | | | | |
| | 3,074 | | | | | Union Pacific Corp | | | | | 424,919 | | | | 0.7 | |
| | 3,789 | | | | | United Parcel Service, Inc (Class B) | | | | | 369,541 | | | | 0.7 | |
| | | | | | Other | | | | | 651,986 | | | | 1.2 | |
| | | | | | | | | | | | |
| | | | | | | | | | | 1,446,446 | | | | 2.6 | |
| | | | | | | | | | | | |
| | UTILITIES | | | | | |
| | 4,969 | | | | | Dominion Resources, Inc | | | | | 355,085 | | | | 0.6 | |
| | | | | | Other | | | | | 1,715,782 | | | | 3.1 | |
| | | | | | | | | | | | |
| | | | | | | | | | | 2,070,867 | | | | 3.7 | |
| | | | | | | | | | | | |
| | | | | | TOTAL COMMON STOCKS | | (Cost $42,107,992) | | | 54,970,645 | | | | 98.4 | |
| | | | | | | | | | | | |
| | | | | |
| Principal | | | | | Issuer | | | | | | | | |
| |
| | SHORT-TERM INVESTMENTS | | | | | |
| | GOVERNMENT AGENCY DEBT | | | | | | | | | | |
| | $860,000 | | | | | Federal Home Loan Bank (FHLB)
2.150%, 01/02/19 | | | | | 860,000 | | | | 1.5 | |
| | | | | | | | | | | | |
| | | | | | | | | | | 860,000 | | | | 1.5 | |
| | | | | | | | | | | | |
| | | | | | |
| See notes to financial statements | | TIAA-CREF Life Funds § 2018 Annual Report | | | 67 | |
| | |
| Summary portfolio of investments | | concluded |
Social Choice Equity Fund § December 31, 2018
| | | | | | | | | | | | | | | | |
| Shares | | | | | Company | | | | Value | | | % of net
assets | |
| | | | | | | | | | | | | | | | |
| | INVESTMENTS IN REGISTERED INVESTMENT COMPANIES | |
| | 325,548 | | | c | | State Street Navigator Securities Lending Government Money Market Portfolio | | $ | 325,548 | | | | 0.6 | % |
| | | | | | | | | | | | |
| | | | | | | | | | | 325,548 | | | | 0.6 | |
| | | | | | | | | | | | |
| | | | | | TOTAL SHORT-TERM INVESTMENTS | | (Cost $1,185,496) | | | 1,185,548 | | | | 2.1 | |
| | | | | | | | | | | | �� |
| | | | | |
| | | | | | TOTAL PORTFOLIO | | (Cost $43,293,488) | | | 56,156,193 | | | | 100.5 | |
| | | | | | OTHER ASSETS & LIABILITIES, NET | | | | | (315,383 | ) | | | (0.5 | ) |
| | | | | | | | | | | | |
| | | | | | NET ASSETS | | | | $ | 55,840,810 | | | | 100.0 | % |
| | | | | | | | | | |
| c | | Investments made with cash collateral received from securities on loan. |
| d | | All or a portion of these securities have been segregated to cover margin requirements on open futures contract. |
“Other” securities represent the aggregate value, by category, of securities that are not among the 50 largest holdings and, in total for any issuer, represent 1% or less of net assets.
At 12/31/18, the aggregate value of securities on loan is $313,300.
For ease of presentation, a number of classification categories have been grouped together in the Summary portfolio of investments. Note that the Fund uses more specific categories in following its investment limitations on investment concentrations.
Futures contracts outstanding as of December 31, 2018 were as follows (See Note 3):
| | | | | | | | | | | | | | | | | | |
| Description | | Number of
long (short) contracts | | | Expiration date | | Notional
amount | | | Value | | | Unrealized appreciation (depreciation) | |
| |
S&P 500 E Mini Index | | | 7 | | | 03/15/19 | | $ | 901,973 | | | $ | 876,820 | | | $ | (25,153 | ) |
| |
| | | | |
| 68 | | 2018 Annual Report § TIAA-CREF Life Funds | | See notes to financial statements |
| | |
| Summary portfolio of investments | | |
Stock Index Fund § December 31, 2018
| | | | | | | | | | | | | | | | |
| Shares | | | | | Company | | | | Value | | | % of net
assets | |
| | | | | | | | | | | | | | | | |
| | COMMON STOCKS | | | | | | | | | | |
| | AUTOMOBILES & COMPONENTS | | | | $ | 3,188,516 | | | | 0.7 | % |
| | | | | | | | | | | | |
| | BANKS | | | | | |
| | 153,546 | | | | | Bank of America Corp | | | | | 3,783,373 | | | | 0.9 | |
| | 41,008 | | | | | Citigroup, Inc | | | | | 2,134,877 | | | | 0.5 | |
| | 55,545 | | | | | JPMorgan Chase & Co | | | | | 5,422,303 | | | | 1.2 | |
| | 71,217 | | | | | Wells Fargo & Co | | | | | 3,281,679 | | | | 0.8 | |
| | | | | | Other | | | | | 10,721,817 | | | | 2.5 | |
| | | | | | | | | | | | |
| | | | | | | | | | | 25,344,049 | | | | 5.9 | |
| | | | | | | | | | | | |
| | CAPITAL GOODS | | | | | |
| | 9,463 | | | | | 3M Co | | | | | 1,803,080 | | | | 0.4 | |
| | 9,035 | | | | | Boeing Co | | | | | 2,913,788 | | | | 0.7 | |
| | | | | | Other | | | | | 24,185,585 | | | | 5.6 | |
| | | | | | | | | | | | |
| | | | | | | | | | | 28,902,453 | | | | 6.7 | |
| | | | | | | | | | | | |
| | COMMERCIAL & PROFESSIONAL SERVICES | | | | | 4,375,431 | | | | 1.0 | |
| | | | | | | | | | | | |
| | CONSUMER DURABLES & APPAREL | | | | | 5,430,992 | | | | 1.3 | |
| | | | | | | | | | | | |
| | CONSUMER SERVICES | | | | | |
| | 12,960 | | | | | McDonald’s Corp | | | | | 2,301,307 | | | | 0.6 | |
| | | | | | Other | | | | | 7,416,132 | | | | 1.7 | |
| | | | | | | | | | | | |
| | | | | | | | | | | 9,717,439 | | | | 2.3 | |
| | | | | | | | | | | | |
| | DIVERSIFIED FINANCIALS | | | | | 15,265,846 | | | | 3.6 | |
| | | | | | | | | | | | |
| | ENERGY | | | | | |
| | 31,784 | | | | | Chevron Corp | | | | | 3,457,781 | | | | 0.8 | |
| | 71,109 | | | d | | Exxon Mobil Corp | | | | | 4,848,923 | | | | 1.2 | |
| | | | | | Other | | | | | 12,573,486 | | | | 2.9 | |
| | | | | | | | | | | | |
| | | | | | | | | | | 20,880,190 | | | | 4.9 | |
| | | | | | | | | | | | |
| | FOOD & STAPLES RETAILING | | | | | |
| | 23,797 | | | | | Walmart, Inc | | | | | 2,216,691 | | | | 0.5 | |
| | | | | | Other | | | | | 3,664,407 | | | | 0.9 | |
| | | | | | | | | | | | |
| | | | | | | | | | | 5,881,098 | | | | 1.4 | |
| | | | | | | | | | | | |
| | FOOD, BEVERAGE & TOBACCO | | | | | |
| | 63,934 | | | | | Coca-Cola Co | | | | | 3,027,275 | | | | 0.7 | |
| | 23,654 | | | | | PepsiCo, Inc | | | | | 2,613,294 | | | | 0.6 | |
| | 25,921 | | | | | Philip Morris International, Inc | | | | | 1,730,486 | | | | 0.4 | |
| | | | | | Other | | | | | 7,790,594 | | | | 1.8 | |
| | | | | | | | | | | | |
| | | | | | | | | | | 15,161,649 | | | | 3.5 | |
| | | | | | | | | | | | |
| | HEALTH CARE EQUIPMENT & SERVICES | | | | | |
| | 28,549 | | | | | Abbott Laboratories | | | | | 2,064,949 | | | | 0.5 | |
| | 22,579 | | | | | Medtronic plc | | | | | 2,053,786 | | | | 0.5 | |
| | 15,967 | | | | | UnitedHealth Group, Inc | | | | | 3,977,699 | | | | 0.9 | |
| | | | | | Other | | | | | 19,125,183 | | | | 4.4 | |
| | | | | | | | | | | | |
| | | | | | | | | | | 27,221,617 | | | | 6.3 | |
| | | | | | | | | | | | |
| | | | | | |
| See notes to financial statements | | TIAA-CREF Life Funds § 2018 Annual Report | | | 69 | |
| | |
| Summary portfolio of investments | | continued |
Stock Index Fund § December 31, 2018
| | | | | | | | | | | | | | | | |
| Shares | | | | | Company | | | | Value | | | % of net
assets | |
| | | | | | | | | | | | | | | | |
| | HOUSEHOLD & PERSONAL PRODUCTS | | | | | |
| | 41,591 | | | | | Procter & Gamble Co | | | | $ | 3,823,045 | | | | 0.9 | % |
| | | | | | Other | | | | | 3,035,243 | | | | 0.7 | |
| | | | | | | | | | | | |
| | | | | | | | | | | 6,858,288 | | | | 1.6 | |
| | | | | | | | | | | | |
| | INSURANCE | | | | | |
| | 32,516 | | | * | | Berkshire Hathaway, Inc (Class B) | | | | | 6,639,117 | | | | 1.5 | |
| | | | | | Other | | | | | 11,180,005 | | | | 2.6 | |
| | | | | | | | | | | | |
| | | | | | | | | | | 17,819,122 | | | | 4.1 | |
| | | | | | | | | | | | |
| | MATERIALS | | | | | |
| | 38,729 | | | | | DowDuPont, Inc | | | | | 2,071,227 | | | | 0.5 | |
| | | | | | Other | | | | | 10,669,788 | | | | 2.5 | |
| | | | | | | | | | | | |
| | | | | | | | | | | 12,741,015 | | | | 3.0 | |
| | | | | | | | | | | | |
| | MEDIA & ENTERTAINMENT | | | | | |
| | 5,014 | | | * | | Alphabet, Inc (Class A) | | | | | 5,239,429 | | | | 1.2 | |
| | 5,111 | | | * | | Alphabet, Inc (Class C) | | | | | 5,293,003 | | | | 1.2 | |
| | 76,199 | | | | | Comcast Corp (Class A) | | | | | 2,594,576 | | | | 0.6 | |
| | 39,914 | | | * | | Facebook, Inc | | | | | 5,232,326 | | | | 1.2 | |
| | 6,945 | | | * | | NetFlix, Inc | | | | | 1,858,899 | | | | 0.4 | |
| | 24,874 | | | | | Walt Disney Co | | | | | 2,727,434 | | | | 0.7 | |
| | | | | | Other | | | | | 7,102,128 | | | | 1.7 | |
| | | | | | | | | | | | |
| | | | | | | | | | | 30,047,795 | | | | 7.0 | |
| | | | | | | | | | | | |
| | PHARMACEUTICALS, BIOTECHNOLOGY & LIFE SCIENCES | | | | | |
| | 25,274 | | | | | AbbVie, Inc | | | | | 2,330,010 | | | | 0.5 | |
| | 10,791 | | | | | Amgen, Inc | | | | | 2,100,684 | | | | 0.5 | |
| | 15,881 | | | | | Eli Lilly & Co | | | | | 1,837,749 | | | | 0.4 | |
| | 45,062 | | | | | Johnson & Johnson | | | | | 5,815,251 | | | | 1.4 | |
| | 97,377 | | | | | Pfizer, Inc | | | | | 4,250,506 | | | | 1.0 | |
| | 43,683 | | | | | Schering-Plough Corp | | | | | 3,337,818 | | | | 0.8 | |
| | | | | | Other | | | | | 16,380,604 | | | | 3.8 | |
| | | | | | | | | | | | |
| | | | | | | | | | | 36,052,622 | | | | 8.4 | |
| | | | | | | | | | | | |
| | REAL ESTATE | | | | | 16,444,784 | | | | 3.8 | |
| | | | | | | | | | | | |
| | RETAILING | | | | | |
| | 6,824 | | | * | | Amazon.com, Inc | | | | | 10,249,443 | | | | 2.4 | |
| | 19,244 | | | | | Home Depot, Inc | | | | | 3,306,504 | | | | 0.8 | |
| | | | | | Other | | | | | 11,444,021 | | | | 2.6 | |
| | | | | | | | | | | | |
| | | | | | | | | | | 24,999,968 | | | | 5.8 | |
| | | | | | | | | | | | |
| | SEMICONDUCTORS & SEMICONDUCTOR EQUIPMENT | | | | | |
| | 6,912 | | | | | Broadcom, Inc | | | | | 1,757,583 | | | | 0.4 | |
| | 77,009 | | | | | Intel Corp | | | | | 3,614,032 | | | | 0.8 | |
| | | | | | Other | | | | | 9,777,924 | | | | 2.3 | |
| | | | | | | | | | | | |
| | | | | | | | | | | 15,149,539 | | | | 3.5 | |
| | | | | | | | | | | | |
| | | | |
| 70 | | 2018 Annual Report § TIAA-CREF Life Funds | | See notes to financial statements |
| | |
| Summary portfolio of investments | | continued |
Stock Index Fund § December 31, 2018
| | | | | | | | | | | | | | | | |
| Shares | | | | | Company | | | | Value | | | % of net
assets | |
| | | | | | | | | | | | | | | | |
| | SOFTWARE & SERVICES | | | | | |
| | 8,198 | | | * | | Adobe, Inc | | | | $ | 1,854,716 | | | | 0.4 | % |
| | 15,344 | | | | | International Business Machines Corp | | | | | 1,744,152 | | | | 0.4 | |
| | 15,329 | | | | | MasterCard, Inc (Class A) | | | | | 2,891,816 | | | | 0.7 | |
| | 127,214 | | | | | Microsoft Corp | | | | | 12,921,126 | | | | 3.0 | |
| | 42,755 | | | | | Oracle Corp | | | | | 1,930,388 | | | | 0.5 | |
| | 19,811 | | | * | | PayPal Holdings, Inc | | | | | 1,665,907 | | | | 0.4 | |
| | 12,068 | | | * | | salesforce.com, Inc | | | | | 1,652,954 | | | | 0.4 | |
| | 29,564 | | | | | Visa, Inc (Class A) | | | | | 3,900,674 | | | | 0.9 | |
| | | | | | Other | | | | | 17,633,385 | | | | 4.1 | |
| | | | | | | | | | | | |
| | | | | | | | | | | 46,195,118 | | | | 10.8 | |
| | | | | | | | | | | | |
| | TECHNOLOGY HARDWARE & EQUIPMENT | | | | | |
| | 79,717 | | | | | Apple, Inc | | | | | 12,574,560 | | | | 2.9 | |
| | 76,114 | | | | | Cisco Systems, Inc | | | | | 3,298,020 | | | | 0.8 | |
| | | | | | Other | | | | | 6,425,111 | | | | 1.6 | |
| | | | | | | | | | | | |
| | | | | | | | | | | 22,297,691 | | | | 5.3 | |
| | | | | | | | | | | | |
| | TELECOMMUNICATION SERVICES | | | | | |
| | 121,390 | | | | | AT&T, Inc | | | | | 3,464,471 | | | | 0.8 | |
| | 69,435 | | | | | Verizon Communications, Inc | | | | | 3,903,636 | | | | 0.9 | |
| | | | | | Other | | | | | 996,960 | | | | 0.2 | |
| | | | | | | | | | | | |
| | | | | | | | | | | 8,365,067 | | | | 1.9 | |
| | | | | | | | | | | | |
| | TRANSPORTATION | | | | | |
| | 12,291 | | | | | Union Pacific Corp | | | | | 1,698,985 | | | | 0.4 | |
| | | | | | Other | | | | | 6,851,057 | | | | 1.6 | |
| | | | | | | | | | | | |
| | | | | | | | | | | 8,550,042 | | | | 2.0 | |
| | | | | | | | | | | | |
| | UTILITIES | | | | | 13,934,158 | | | | 3.2 | |
| | | | | | | | | | | | |
| | | | | | TOTAL COMMON STOCKS | | (Cost $229,306,999) | | | 420,824,489 | | | | 98.0 | |
| | | | | | | | | | | | |
| |
| | RIGHTS / WARRANTS | | | | | |
| | PHARMACEUTICALS, BIOTECHNOLOGY & LIFE SCIENCES | | | | | 121 | | | | 0.0 | |
| | | | | | | | | | | | |
| | | | | | TOTAL RIGHTS / WARRANTS | | (Cost $9) | | | 121 | | | | 0.0 | |
| | | | | | | | | | | | |
| | | | | |
| Principal | | | | | Issuer | | | | | | | | |
| |
| | SHORT-TERM INVESTMENTS | | | | | |
| | GOVERNMENT AGENCY DEBT | | | | | | | | | | |
| | $8,320,000 | | | | | Federal Home Loan Bank (FHLB) 2.150%, 01/02/19 | | | | | 8,320,000 | | | | 1.9 | |
| | | | | | | | | | | | |
| | | | | | | | | | | 8,320,000 | | | | 1.9 | |
| | | | | | | | | | | | |
| | | | | | |
| See notes to financial statements | | TIAA-CREF Life Funds § 2018 Annual Report | | | 71 | |
| | |
| Summary portfolio of investments | | concluded |
Stock Index Fund § December 31, 2018
| | | | | | | | | | | | | | | | |
| Shares | | | | | Company | | | | Value | | | % of net
assets | |
| | | | | | | | | | | | | | | | |
| | INVESTMENTS IN REGISTERED INVESTMENT COMPANIES | |
| | 2,374,724 | | | c | | State Street Navigator Securities Lending Government Money Market Portfolio | | $ | 2,374,724 | | | | 0.6 | % |
| | | | | | | | | | | | |
| | | | | | | | | | | 2,374,724 | | | | 0.6 | |
| | | | | | | | | | | | |
| | | | | | TOTAL SHORT-TERM INVESTMENTS | | (Cost $10,694,227) | | | 10,694,724 | | | | 2.5 | |
| | | | | | | | | | | | |
| | | | | |
| | | | | | TOTAL PORTFOLIO | | (Cost $240,001,235) | | | 431,519,334 | | | | 100.5 | |
| | | | | | OTHER ASSETS & LIABILITIES, NET | | | | | (1,991,990 | ) | | | (0.5 | ) |
| | | | | | | | | | | | |
| | | | | | NET ASSETS | | | | $ | 429,527,344 | | | | 100.0 | % |
| | | | | | | | | | |
| c | | Investments made with cash collateral received from securities on loan. |
| d | | All or a portion of these securities have been segregated to cover margin requirements on open futures contract. |
“Other” securities represent the aggregate value, by category, of securities that are not among the 50 largest holdings and, in total for any issuer, represent 1% or less of net assets.
At 12/31/18, the aggregate value of securities on loan is $2,286,558.
For ease of presentation, a number of classification categories have been grouped together in the Summary portfolio of investments. Note that the Fund uses more specific categories in following its investment limitations on investment concentrations.
Futures contracts outstanding as of December 31, 2018 were as follows (See Note 3):
| | | | | | | | | | | | | | | | | | |
| Description | | Number of
long (short)
contracts | | | Expiration
date | | Notional
amount | | | Value | | | Unrealized
appreciation
(depreciation) | |
| |
S&P 500 E Mini Index | | | 65 | | | 03/15/19 | | $ | 8,409,011 | | | $ | 8,141,900 | | | $ | (267,111 | ) |
| |
| | | | |
| 72 | | 2018 Annual Report § TIAA-CREF Life Funds | | See notes to financial statements |
| | |
| Summary portfolio of investments | | |
International Equity Fund § December 31, 2018
| | | | | | | | | | | | | | | | |
| Shares | | | | | Company | | | | Value | | | % of net
assets | |
| | | | | | | | | | | | | | | | |
| | | | | | | | | | | | | | | | |
| | COMMON STOCKS | | | | | | | | | | |
| | AUSTRIA | | | | | | | | | | |
| | 26,042 | | | | | Wienerberger AG. | | | | $ | 537,420 | | | | 0.6 | % |
| | | | | | | | | | | | |
| | | | | | | | | | | 537,420 | | | | 0.6 | |
| | | | | | | | | | | | |
| | DENMARK | | | | | | | | | | |
| | 3,567 | | | | | Rockwool International AS (B Shares) | | | | | 932,783 | | | | 1.1 | |
| | | | | | | | | | | | |
| | | | | | | | | | | 932,783 | | | | 1.1 | |
| | | | | | | | | | | | |
| | FRANCE | | | | | | | | | | |
| | 75,481 | | | | | Accor S.A. | | | | | 3,209,783 | | | | 3.7 | |
| | 46,795 | | | g | | ALD S.A. | | | | | 557,254 | | | | 0.7 | |
| | 115,574 | | | | | Credit Agricole S.A. | | | | | 1,243,856 | | | | 1.4 | |
| | 5,658 | | | | | Essilor International S.A. | | | | | 717,196 | | | | 0.8 | |
| | 1,459 | | | | | Kering | | | | | 683,495 | | | | 0.8 | |
| | 13,343 | | | | | Nexity | | | | | 602,422 | | | | 0.7 | |
| | 31,254 | | | | | Sanofi-Aventis | | | | | 2,711,279 | | | | 3.2 | |
| | 56,924 | | | | | Schneider Electric S.A. | | | | | 3,861,224 | | | | 4.5 | |
| | 33,477 | | | | | Vinci S.A. | | | | | 2,752,879 | | | | 3.2 | |
| | | | | | Other | | | | | 165,605 | | | | 0.2 | |
| | | | | | | | | | | | |
| | | | | | | | | | | 16,504,993 | | | | 19.2 | |
| | | | | | | | | | | | |
| | GERMANY | | | | | | | | | | |
| | 8,191 | | | | | BASF SE | | | | | 570,532 | | | | 0.7 | |
| | 21,186 | | | | | Bayerische Motoren Werke AG. | | | | | 1,718,293 | | | | 2.0 | |
| | 5,394 | | | | | Continental AG. | | | | | 751,038 | | | | 0.9 | |
| | 58,100 | | | | | Daimler AG. (Registered) | | | | | 3,062,735 | | | | 3.5 | |
| | 31,551 | | | | | Lanxess AG. | | | | | 1,450,602 | | | | 1.7 | |
| | 7,906 | | | | | Porsche AG. | | | | | 464,970 | | | | 0.5 | |
| | 106,877 | | | | | TUI AG. (DI) | | | | | 1,536,114 | | | | 1.8 | |
| | | | | | | | | | | | |
| | | | | | | | | | | 9,554,284 | | | | 11.1 | |
| | | | | | | | | | | | |
| | HONG KONG | | | | | 361,516 | | | | 0.4 | |
| | | | | | | | | | | | |
| | INDIA | | | | | 857,921 | | | | 1.0 | |
| | | | | | | | | | | | |
| | ITALY | | | | | | | | | | |
| | 165,882 | | | | | Davide Campari-Milano S.p.A | | | | | 1,404,754 | | | | 1.6 | |
| | 125,870 | | | | | Mediobanca S.p.A. | | | | | 1,065,041 | | | | 1.3 | |
| | 26,588 | | | | | Moncler S.p.A | | | | | 884,786 | | | | 1.0 | |
| | 190,759 | | | | | Prada S.p.A | | | | | 629,424 | | | | 0.7 | |
| | 267,198 | | | | | UniCredit S.p.A. | | | | | 3,026,524 | | | | 3.5 | |
| | | | | | | | | | | | |
| | | | | | | | | | | 7,010,529 | | | | 8.1 | |
| | | | | | | | | | | | |
| | JAPAN | | | | | | | | | | |
| | 51,151 | | | | | Hitachi Ltd | | | | | 1,356,025 | | | | 1.6 | |
| | 47,086 | | | | | Ishikawajima-Harima Heavy Industries Co Ltd | | | | | 1,296,825 | | | | 1.5 | |
| | 205,209 | | | | | JX Holdings, Inc | | | | | 1,065,758 | | | | 1.2 | |
| | 59,930 | | | | | Komatsu Ltd | | | | | 1,287,892 | | | | 1.5 | |
| | 18,011 | | | | | Konami Corp | | | | | 791,438 | | | | 0.9 | |
| | | | | | |
| See notes to financial statements | | TIAA-CREF Life Funds § 2018 Annual Report | | | 73 | |
| | |
| Summary portfolio of investments | | continued |
International Equity Fund § December 31, 2018
| | | | | | | | | | | | | | | | |
| Shares | | | | | Company | | | | Value | | | % of net
assets | |
| | | | | | | | | | | | | | | | |
| | JAPAN—continued | | | | | | | | |
| | 13,600 | | | | | Murata Manufacturing Co Ltd | | | | $ | 1,832,596 | | | | 2.1 | % |
| | 7,020 | | | | | Nintendo Co Ltd | | | | | 1,864,084 | | | | 2.2 | |
| | 66,850 | | | | | Sony Corp | | | | | 3,222,813 | | | | 3.8 | |
| | 56,384 | | | e | | Takeda Pharmaceutical Co Ltd | | | | | 1,911,106 | | | | 2.2 | |
| | 52,302 | | | | | Toyota Motor Corp | | | | | 3,027,583 | | | | 3.5 | |
| | | | | | | | | | | | |
| | | | | | | | | | | 17,656,120 | | | | 20.5 | |
| | | | | | | | | | | | |
| | KOREA, REPUBLIC OF | | | | | | | | | | |
| | 2,314 | | | | | Samsung SDI Co Ltd | | | | | 454,835 | | | | 0.5 | |
| | | | | | | | | | | | |
| | | | | | | | | | | 454,835 | | | | 0.5 | |
| | | | | | | | | | | | |
| | NETHERLANDS | | | | | 90,220 | | | | 0.1 | |
| | | | | | | | | | | | |
| | NORWAY | | | | | | | | | | |
| | 23,246 | | | | | Yara International ASA | | | | | 896,118 | | | | 1.0 | |
| | | | | | | | | | | | |
| | | | | | | | | | | 896,118 | | | | 1.0 | |
| | | | | | | | | | | | |
| | SPAIN | | | | | | | | | | |
| | 77,238 | | | *,e | | Siemens Gamesa Renewable Energy | | | | | 940,406 | | | | 1.1 | |
| | | | | | | | | | | | |
| | | | | | | | | | | 940,406 | | | | 1.1 | |
| | | | | | | | | | | | |
| | | | | | | | | | | | | | | | |
| | SWEDEN | | | | | | | | |
| | 103,293 | | | | | Electrolux AB (Series B) | | | | | 2,177,285 | | | | 2.6 | |
| | 49,611 | | | | | Hennes & Mauritz AB (B Shares) | | | | | 705,522 | | | | 0.8 | |
| | | | | | | | | | | | |
| | | | | | | | | | | 2,882,807 | | | | 3.4 | |
| | | | | | | | | | | | |
| | SWITZERLAND | | | | | | | | |
| | 270,031 | | | | | Credit Suisse Group | | | | | 2,951,895 | | | | 3.4 | |
| | 11,611 | | | | | Nestle S.A. | | | | | 942,381 | | | | 1.1 | |
| | 4,862 | | | | | Vifor Pharma AG. | | | | | 529,060 | | | | 0.6 | |
| | | | | | Other | | | | | 460,460 | | | | 0.6 | |
| | | | | | | | | | | | |
| | | | | | | | | | | 4,883,796 | | | | 5.7 | |
| | | | | | | | | | | | |
| | UNITED KINGDOM | | | | | | | | |
| | 102,788 | | | | | BAE Systems plc | | | | | 601,192 | | | | 0.7 | |
| | 137,066 | | | | | CNH Industrial NV | | | | | 1,238,430 | | | | 1.4 | |
| | 29,583 | | | | | Linde plc | | | | | 4,696,112 | | | | 5.5 | |
| | 5,114,133 | | | | | Lloyds TSB Group plc | | | | | 3,371,133 | | | | 3.9 | |
| | 33,845 | | | | | Reckitt Benckiser Group plc | | | | | 2,591,725 | | | | 3.0 | |
| | 1,258,984 | | | | | Tesco plc | | | | | 3,053,238 | | | | 3.6 | |
| | 163,977 | | | | | Travis Perkins plc | | | | | 2,235,527 | | | | 2.6 | |
| | | | | | Other | | | | | 590,912 | | | | 0.7 | |
| | | | | | | | | | | | |
| | | | | | | | | | | 18,378,269 | | | | 21.4 | |
| | | | | | | | | | | | |
| | | | | | TOTAL COMMON STOCKS | | (Cost $98,659,789) | | | 81,942,017 | | | | 95.2 | |
| | | | | | | | | | | | |
| | | | |
| 74 | | 2018 Annual Report § TIAA-CREF Life Funds | | See notes to financial statements |
| | |
| Summary portfolio of investments | | concluded |
International Equity Fund § December 31, 2018
| | | | | | | | | | | | | | | | |
| Principal | | | | | Issuer | | | | Value | | | % of net
assets | |
| | SHORT-TERM INVESTMENTS | | | | | | | | | | |
| | GOVERNMENT AGENCY DEBT | | | | | | | | |
| | $4,670,000 | | | | | Federal Home Loan Bank (FHLB)
2.150%, 01/02/19 | | | | $ | 4,670,000 | | | | 5.5 | % |
| | | | | | | | | | | | |
| | | | | | | | | | | 4,670,000 | | | | 5.5 | |
| | | | | | | | | | | | |
| | | | | |
| Shares | | | | | Company | | | | | | | | |
| | INVESTMENTS IN REGISTERED INVESTMENT COMPANIES | | | | | | | | |
| | 2,244,124 | | | c | | State Street Navigator Securities Lending Government Money Market Portfolio | | | 2,244,124 | | | | 2.6 | |
| | | | | | | | | | | | |
| | | | | | | | | | | 2,244,124 | | | | 2.6 | |
| | | | | | | | | | | | |
| | | TOTAL SHORT-TERM INVESTMENTS | | (Cost $6,913,845) | | | 6,914,124 | | | | 8.1 | |
| | | | | | | | | | | | |
| | | | | |
| | | | | | TOTAL PORTFOLIO | | (Cost $105,573,634) | | | 88,856,141 | | | | 103.3 | |
| | | | | | OTHER ASSETS & LIABILITIES, NET | | | | | (2,805,264 | ) | | | (3.3 | ) |
| | | | | | | | | | | | |
| | | | | | NET ASSETS | | | | $ | 86,050,877 | | | | 100.0 | % |
| | | | | | | | | | | | |
| c | | Investments made with cash collateral received from securities on loan. |
| e | | All or a portion of these securities are out on loan. The aggregate value of securities on loan is $2,151,129. |
| g | | Security is exempt from registration under Rule 144(A) of the Securities Act of 1933. Such securities are deemed liquid and may be resold in transactions exempt from registration to qualified institutional buyers. At 12/31/18, the aggregate value of these securities, including those in “Other,” was $647,474 or 0.8% of net assets. |
“Other” securities represent the aggregate value, by category, of securities that are not among the 50 largest holdings and, in total for any issuer, represent 1% or less of net assets.
For ease of presentation, a number of classification categories have been grouped together in the Summary portfolio of investments. Note that the Fund uses more specific categories in following its investment limitations on investment concentrations.
| | | | | | |
| See notes to financial statements | | TIAA-CREF Life Funds § 2018 Annual Report | | | 75 | |
| | |
| Summary of market values by sector | | |
International Equity Fund § December 31, 2018
| | | | | | | | |
| Sector | | Value | | | % of net
assets | |
| CONSUMER DISCRETIONARY | | $ | 22,957,842 | | | | 26.7 | % |
| INDUSTRIALS | | | 16,807,195 | | | | 19.5 | |
| FINANCIALS | | | 12,711,081 | | | | 14.8 | |
| MATERIALS | | | 8,264,979 | | | | 9.6 | |
| CONSUMER STAPLES | | | 7,992,098 | | | | 9.3 | |
| HEALTH CARE | | | 5,151,445 | | | | 6.0 | |
| INFORMATION TECHNOLOGY | | | 3,733,676 | | | | 4.3 | |
| COMMUNICATION SERVICES | | | 2,655,521 | | | | 3.1 | |
| ENERGY | | | 1,065,758 | | | | 1.2 | |
| REAL ESTATE | | | 602,422 | | | | 0.7 | |
| SHORT-TERM INVESTMENTS | | | 6,914,124 | | | | 8.1 | |
| OTHER ASSETS & LIABILITIES, NET | | | (2,805,264 | ) | | | (3.3 | ) |
| | | | |
| NET ASSETS | | $ | 86,050,877 | | | | 100.0 | % |
| | | | |
| | | | |
| 76 | | 2018 Annual Report § TIAA-CREF Life Funds | | See notes to financial statements |
| | |
| Summary portfolio of investments | | |
Bond Fund § December 31, 2018
| | | | | | | | | | | | | | | | |
| Principal | | | | | Issuer | | | | Value | | | % of net
assets | |
| | | | | | | | | | | | | | | | |
| | BANK LOAN OBLIGATIONS | | | | | | | | |
| | COMMERCIAL & PROFESSIONAL SERVICES | | | | $ | 164,949 | | | | 0.1 | % |
| | | | | | | | | | | | |
| | CONSUMER DURABLES & APPAREL | | | | | 94,848 | | | | 0.0 | |
| | | | | | | | | | | | |
| | CONSUMER SERVICES | | | | | 256,950 | | | | 0.2 | |
| | | | | | | | | | | | |
| | ENERGY | | | | | 14,663 | | | | 0.0 | |
| | | | | | | | | | | | |
| | FOOD, BEVERAGE & TOBACCO | | | | | 27,793 | | | | 0.0 | |
| | | | | | | | | | | | |
| | HEALTH CARE EQUIPMENT & SERVICES | | | | | 362,921 | | | | 0.2 | |
| | | | | | | | | | | | |
| | INSURANCE | | | | | 93,779 | | | | 0.0 | |
| | | | | | | | | | | | |
| | MATERIALS | | | | | 214,048 | | | | 0.2 | |
| | | | | | | | | | | | |
| | MEDIA & ENTERTAINMENT | | | | | 282,165 | | | | 0.2 | |
| | | | | | | | | | | | |
| | PHARMACEUTICALS, BIOTECHNOLOGY & LIFE SCIENCES | | | | | 92,893 | | | | 0.0 | |
| | | | | | | | | | | | |
| | REAL ESTATE | | | | | 190,552 | | | | 0.0 | |
| | | | | | | | | | | | |
| | SOFTWARE & SERVICES | | | | | 572,725 | | | | 0.3 | |
| | | | | | | | | | | | |
| | TECHNOLOGY HARDWARE & EQUIPMENT | | | | | 255,188 | | | | 0.1 | |
| | | | | | | | | | | | |
| | TELECOMMUNICATION SERVICES | | | | | 95,463 | | | | 0.1 | |
| | | | | | | | | | | | |
| | TRANSPORTATION | | | | | 187,605 | | | | 0.1 | |
| | | | | | | | | | | | |
| | | | | | TOTAL BANK LOAN OBLIGATIONS | | (Cost $3,036,740) | | | 2,906,542 | | | | 1.5 | |
| | | | | | | | | | | | |
| | | |
| | BONDS | | | | | | | | | | |
| | | |
| | CORPORATE BONDS | | | | | | | | | | |
| | AUTOMOBILES & COMPONENTS | | | | | 874,322 | | | | 0.5 | |
| | | | | | | | | | | | |
| | BANKS | | | | | |
| | $ 750,000 | | | | | Citigroup, Inc | | 3.200%, 10/21/26 | | | 692,625 | | | | 0.4 | |
| | | | | | Other | | | | | 11,237,244 | | | | 5.9 | |
| | | | | | | | | | | | |
| | | | | | | | | | | 11,929,869 | | | | 6.3 | |
| | | | | | | | | | | | |
| | CAPITAL GOODS | | | | | 1,794,726 | | | | 0.9 | |
| | | | | | | | | | | | |
| | COMMERCIAL & PROFESSIONAL SERVICES | | | | | 1,061,272 | | | | 0.5 | |
| | | | | | | | | | | | |
| | CONSUMER DURABLES & APPAREL | | | | | 171,114 | | | | 0.1 | |
| | | | | | | | | | | | |
| | CONSUMER SERVICES | | | | | 853,042 | | | | 0.4 | |
| | | | | | | | | | | | |
| | DIVERSIFIED FINANCIALS | | | | | |
| | 1,125,000 | | | | | Wells Fargo & Co | | 2.625%, 07/22/22 | | | 1,084,739 | | | | 0.6 | |
| | | | | | Other | | | | | 5,337,496 | | | | 2.8 | |
| | | | | | | | | | | | |
| | | | | | | | | | | 6,422,235 | | | | 3.4 | |
| | | | | | | | | | | | |
| | ENERGY | | | | | 7,767,754 | | | | 4.1 | |
| | | | | | | | | | | | |
| | FOOD & STAPLES RETAILING | | | | | 2,394,735 | | | | 1.3 | |
| | | | | | | | | | | | |
| | | | | | |
| See notes to financial statements | | TIAA-CREF Life Funds § 2018 Annual Report | | | 77 | |
| | |
| Summary portfolio of investments | | continued |
Bond Fund § December 31, 2018
| | | | | | | | | | | | | | | | |
| Principal | | | | | Issuer | | | | Value | | | % of net
assets | |
| | | | | | | | | | | | | | | | |
| | FOOD, BEVERAGE & TOBACCO | | | | $ | 2,278,769 | | | | 1.2 | % |
| | | | | | | | | | | | |
| | HEALTH CARE EQUIPMENT & SERVICES | | | | | 1,127,306 | | | | 0.6 | |
| | | | | | | | | | | | |
| | INSURANCE | | | | | 3,046,299 | | | | 1.7 | |
| | | | | | | | | | | | |
| | MATERIALS | | | | | 2,240,123 | | | | 1.1 | |
| | | | | | | | | | | | |
| | MEDIA & ENTERTAINMENT | | | | | 3,936,248 | | | | 2.0 | |
| | | | | | | | | | | | |
| | PHARMACEUTICALS, BIOTECHNOLOGY & LIFE SCIENCES | | | | | 3,278,253 | | | | 1.8 | |
| | | | | | | | | | | | |
| | REAL ESTATE | | | 4,220,868 | | | | 2.3 | |
| | | | | | | | | | | | |
| | RETAILING | | | 1,626,815 | | | | 0.9 | |
| | | | | | | | | | | | |
| | SEMICONDUCTORS & SEMICONDUCTOR EQUIPMENT | | | 502,976 | | | | 0.3 | |
| | | | | | | | | | | | |
| | SOFTWARE & SERVICES | | | 1,924,324 | | | | 1.0 | |
| | | | | | | | | | | | |
| | TECHNOLOGY HARDWARE & EQUIPMENT | | | 2,312,453 | | | | 1.2 | |
| | | | | | | | | | | | |
| | TELECOMMUNICATION SERVICES | | | | | |
| | $ 683,000 | | | | | Verizon Communications, Inc | | 4.329%, 09/21/28 | | | 686,230 | | | | 0.4 | |
| | | | | | Other | | | | | 2,463,711 | | | | 1.2 | |
| | | | | | | | | | | | |
| | | | | | | | | | | 3,149,941 | | | | 1.6 | |
| | | | | | | | | | | | |
| | TRANSPORTATION | | | 2,120,392 | | | | 1.1 | |
| | | | | | | | | | | | |
| | UTILITIES | | | 6,677,801 | | | | 3.5 | |
| | | | | | | | | | | | |
| | | | | | TOTAL CORPORATE BONDS | | (Cost $74,181,105) | | | 71,711,637 | | | | 37.8 | |
| | | | | | | | | | | | |
| | | |
| | GOVERNMENT BONDS | | | | | | | | | | |
| | AGENCY SECURITIES | | | 398,017 | | | | 0.2 | |
| | | | | | | | | | | | |
| | FOREIGN GOVERNMENT BONDS | | | | | |
| | 1,000,000 | | | | | KFW | | 2.750%, 10/01/20 | | | 1,001,985 | | | | 0.5 | |
| | | | | | Other | | | | | 4,983,364 | | | | 2.7 | |
| | | | | | | | | | | | |
| | | | | | | | | | | 5,985,349 | | | | 3.2 | |
| | | | | | | | | | | | |
| | MORTGAGE BACKED | | | | | |
| | 1,261,934 | | | | | Federal Home Loan Mortgage Corp Gold (FGLMC) | | 3.500%, 10/01/45 | | | 1,267,715 | | | | 0.7 | |
| | 1,325,158 | | | | | FGLMC | | 3.000%, 01/01/47 | | | 1,292,244 | | | | 0.7 | |
| | 1,496,209 | | | | | FGLMC | | 3.000%, 02/01/47 | | | 1,459,622 | | | | 0.8 | |
| | 748,466 | | | | | FGLMC | | 3.500%, 03/01/48 | | | 750,738 | | | | 0.4 | |
| | 2,492,748 | | | | | FGLMC | | 3.500%–5.000%, 06/01/36–08/01/48 | | | 2,550,616 | | | | 1.3 | |
| | 800,457 | | | | | Federal National Mortgage Association (FNMA) | | 3.500%, 07/01/32 | | | 810,768 | | | | 0.4 | |
| | 679,254 | | | | | FNMA | | 4.500%, 11/01/44 | | | 710,287 | | | | 0.4 | |
| | 1,439,970 | | | | | FNMA | | 3.000%, 12/25/45 | | | 1,427,482 | | | | 0.7 | |
| | 783,533 | | | | | FNMA | | 3.500%, 01/01/46 | | | 786,957 | | | | 0.4 | |
| | 885,650 | | | | | FNMA | | 3.500%, 12/01/46 | | | 887,812 | | | | 0.5 | |
| | 828,191 | | | | | FNMA | | 3.500%, 01/01/47 | | | 829,064 | | | | 0.4 | |
| | 1,089,366 | | | | | FNMA | | 3.000%, 02/25/48 | | | 1,078,715 | | | | 0.6 | |
| | 988,122 | | | | | FNMA | | 4.500%, 03/01/48 | | | 1,035,598 | | | | 0.5 | |
| | | | |
| 78 | | 2018 Annual Report § TIAA-CREF Life Funds | | See notes to financial statements |
| | |
| Summary portfolio of investments | | continued |
Bond Fund § December 31, 2018
| | | | | | | | | | | | | | | | |
| Principal | | | | | Issuer | | | | Value | | | % of net
assets | |
| | | | | | | | | | | | | | | | |
| | MORTGAGE BACKED—continued | | | | | |
| | $ 3,351,163 | | | | | FNMA | | 4.000%, 04/01/48 | | $ | 3,429,488 | | | | 1.8 | % |
| | 676,360 | | | h | | FNMA | | 4.000%, 06/01/48 | | | 689,832 | | | | 0.4 | |
| | 5,349,674 | | | | | FNMA | | 3.000%–7.500%, 08/01/21–12/01/48 | | | 5,517,784 | | | | 2.9 | |
| | 907,220 | | | | | Government National Mortgage Association (GNMA) | | 3.000%, 12/20/47 | | | 892,855 | | | | 0.5 | |
| | 1,238,141 | | | | | GNMA | | 3.500%, 12/20/47 | | | 1,247,163 | | | | 0.7 | |
| | 848,482 | | | | | GNMA | | 3.000%, 01/20/48 | | | 835,047 | | | | 0.4 | |
| | 1,445,872 | | | | | GNMA | | 3.500%, 01/20/48 | | | 1,456,407 | | | | 0.8 | |
| | 675,000 | | | | | GNMA | | 4.000%, 12/20/48 | | | 688,631 | | | | 0.4 | |
| | | | | | Other | | | | | 1,172,854 | | | | 0.6 | |
| | | | | | | | | | | | |
| | | | | | | | | | | 30,817,679 | | | | 16.3 | |
| | | | | | | | | | | | |
| | MUNICIPAL BONDS | | | | | |
| | 1,750,000 | | | | | State of Illinois | | 5.100%, 06/01/33 | | | 1,668,503 | | | | 0.9 | |
| | 1,000,000 | | | | | State of Texas | | 3.295%, 10/01/25 | | | 1,013,080 | | | | 0.5 | |
| | | | | | Other | | | | | 98,618 | | | | 0.1 | |
| | | | | | | | | | | | |
| | | | | | | | | | | 2,780,201 | | | | 1.5 | |
| | | | | | | | | | | | |
| | U.S. TREASURY SECURITIES | | | | | |
| | 1,000,000 | | | | | United States Treasury Bond | | 3.125%, 11/15/41 | | | 1,025,592 | | | | 0.5 | |
| | 2,935,700 | | | | | United States Treasury Bond | | 3.000%, 11/15/45 | | | 2,934,923 | | | | 1.5 | |
| | 1,865,000 | | | | | United States Treasury Bond | | 2.875%, 11/15/46 | | | 1,816,621 | | | | 1.0 | |
| | 765,000 | | | | | United States Treasury Bond | | 3.000%, 05/15/47 | | | 763,065 | | | | 0.4 | |
| | 2,060,000 | | | | | United States Treasury Bond | | 3.125%, 05/15/48 | | | 2,102,727 | | | | 1.1 | |
| | 1,610,000 | | | | | United States Treasury Bond | | 3.000%, 08/15/48 | | | 1,605,160 | | | | 0.8 | |
| | 900,000 | | | | | United States Treasury Note | | 1.125%, 01/31/19 | | | 899,139 | | | | 0.5 | |
| | 1,000,000 | | | | | United States Treasury Note | | 2.750%, 11/30/20 | | | 1,004,343 | | | | 0.5 | |
| | 2,590,000 | | | | | United States Treasury Note | | 2.625%, 12/15/21 | | | 2,601,512 | | | | 1.4 | |
| | 1,780,000 | | | | | United States Treasury Note | | 2.875%, 09/30/23 | | | 1,808,857 | | | | 1.1 | |
| | 4,430,000 | | | | | United States Treasury Note | | 3.125%, 11/15/28 | | | 4,598,139 | | | | 2.4 | |
| | 2,698,000 | | | | | United States Treasury Note | | 1.125%–2.875%, 02/28/19–10/31/24 | | | 2,658,667 | | | | 1.4 | |
| | | | | | Other | | | | | 692,899 | | | | 0.4 | |
| | | | | | | | | | | | |
| | | | | | | | | | | 24,511,644 | | | | 13.0 | |
| | | | | | | | | | | | |
| | | | | | TOTAL GOVERNMENT BONDS | | (Cost $65,113,773) | | | 64,492,890 | | | | 34.2 | |
| | | | | | | | | | | | |
| | | |
| | STRUCTURED ASSETS | | | | | | | | | | |
| | ASSET BACKED | | | | | | | | | | |
| | 850,000 | | | g,i | | BlueMountain CLO Ltd | | | | | | | | | | |
| | | | | | Series2018-3A (Class B), LIBOR 3 M + 1.770% | | 4.206%, 10/25/30 | | | 832,946 | | | | 0.4 | |
| | 1,000,000 | | | g | | Capital Automotive REIT | | | | | | | | | | |
| | | | | | Series2014-1A (Class A) | | 3.660%, 10/15/44 | | | 996,635 | | | | 0.5 | |
| | 750,000 | | | g,i | | Madison Park Funding Ltd | | | | | | | | | | |
| | | | | | Series2018-29A (Class B), LIBOR 3 M + 1.750% | | 1.000%, 10/18/30 | | | 733,876 | | | | 0.4 | |
| | 713,545 | | | g | | MVW Owner Trust | | | | | | | | | | |
| | | | | | Series2017-1A (Class A) | | 2.420%, 12/20/34 | | | 699,213 | | | | 0.4 | |
| | 800,000 | | | | | Verizon Owner Trust | | | | | | | | | | |
| | | | | | Series2018-A (Class A1A) | | 3.230%, 04/20/23 | | | 804,823 | | | | 0.4 | |
| | | | | | Other | | | | | 15,509,604 | | | | 8.2 | |
| | | | | | | | | | | | |
| | | | | | | | | | | 19,577,097 | | | | 10.3 | |
| | | | | | | | | | | | |
| | | | | | |
| See notes to financial statements | | TIAA-CREF Life Funds § 2018 Annual Report | | | 79 | |
| | |
| Summary portfolio of investments | | continued |
Bond Fund § December 31, 2018
| | | | | | | | | | | | | | | | |
| Principal | | | | | Issuer | | | | Value | | | % of net
assets | |
| | | | | | | | | | | | | | | | |
| | OTHER MORTGAGE BACKED | | | | | | | | |
| | $ 941,816 | | | g,i | | Agate Bay Mortgage Trust | | | | | | | | | | |
| | | | | | Series2015-6 (Class A9) | | 3.500%, 09/25/45 | | $ | 915,089 | | | | 0.5 | % |
| | 1,000,000 | | | | | Citigroup Commercial Mortgage Trust | | | | | | | | | | |
| | | | | | Series 2016-GC37 (Class A4) | | 3.314%, 04/10/49 | | | 987,308 | | | | 0.5 | |
| | 750,000 | | | | | COMM Mortgage Trust | | | | | | | | | | |
| | | | | | Series2012-CR4 (Class A3) | | 2.853%, 10/15/45 | | | 736,720 | | | | 0.4 | |
| | 2,840,000 | | | g,i | | COMM Mortgage Trust | | 3.603%–4.456%, 07/15/47–08/10/48 | | | 2,857,804 | | | | 1.5 | |
| | 2,265,015 | | | g,i | | Connecticut Avenue Securities, LIBOR 1 M + 0.600%–LIBOR 1 M + 3.000% | | 3.106%–5.506%, 05/25/24–04/25/31 | | | 2,279,905 | | | | 1.2 | |
| | 1,300,000 | | | g,i | | DBUBS Mortgage Trust | | | | | | | | | | |
| | | | | | Series 2011-LC2A (Class D) | | 5.534%, 07/10/44 | | | 1,337,341 | | | | 0.7 | |
| | 1,000,000 | | | i | | GS Mortgage Securities Corp II | | | | | | | | | | |
| | | | | | Series2018-GS9 (Class A4) | | 3.992%, 03/10/51 | | | 1,019,416 | | | | 0.5 | |
| | 680,000 | | | | | JPMBB Commercial Mortgage Securities Trust | | | | | | | | | | |
| | | | | | Series2014-C21 (Class A5) | | 3.775%, 08/15/47 | | | 690,570 | | | | 0.4 | |
| | 917,619 | | | i | | Structured Agency Credit Risk Debt Note (STACR) | | | | | | | | | | |
| | | | | | Series 2017-DNA3 (Class M1), LIBOR 1 M + 0.750% | | 3.256%, 03/25/30 | | | 914,830 | | | | 0.5 | |
| | 645,000 | | | i | | WFRBS Commercial Mortgage Trust | | | | | | | | | | |
| | | | | | Series2013-C18 (Class AS) | | 4.387%, 12/15/46 | | | 669,666 | | | | 0.4 | |
| | | | | | Other | | | | | 10,995,455 | | | | 5.8 | |
| | | | | | | | | | | | |
| | | | | | | | | | | 23,404,104 | | | | 12.4 | |
| | | | | | | | | | | | |
| | | | | | TOTAL STRUCTURED ASSETS | | (Cost $43,253,587) | | | 42,981,201 | | | | 22.7 | |
| | | | | | | | | | | | |
| | | | | | TOTAL BONDS | | (Cost $182,548,465) | | | 179,185,728 | | | | 94.7 | |
| | | | | | | | | | | | |
| | | | | |
| Shares | | | | | Company | | | | | | | | |
| | | |
| | PREFERRED STOCKS | | | | | | | | | | |
| | BANKS | | | 158,610 | | | | 0.1 | |
| | | | | | | | | | | | |
| | | | | | TOTAL PREFERRED STOCKS | | (Cost $569,550) | | | 158,610 | | | | 0.1 | |
| | | | | | | | | | | | |
| | | | | |
| Principal | | | | | Issuer | | | | | | | | |
| | | |
| | SHORT-TERM INVESTMENTS | | | | | | | | | | |
| | GOVERNMENT AGENCY DEBT | | | | | | | | | | |
| | $5,980,000 | | | | | Federal Home Loan Bank (FHLB) | | 2.150%, 01/02/19 | | | 5,980,000 | | | | 3.1 | |
| | | | | | | | | | | | |
| | | | | | | | | | | 5,980,000 | | | | 3.1 | |
| | | | | | | | | | | | |
| | | | | | TOTAL SHORT-TERM INVESTMENTS | | (Cost $5,979,643) | | | 5,980,000 | | | | 3.1 | |
| | | | | | | | | | | | |
| | | | | |
| | | | | | TOTAL PORTFOLIO | | (Cost $192,134,398) | | | 188,230,880 | | | | 99.4 | |
| | | | | | OTHER ASSETS & LIABILITIES, NET | | | | | 1,054,004 | | | | 0.6 | |
| | | | | | | | | | | | |
| | | | | | NET ASSETS | | | | $ | 189,284,884 | | | | 100.0 | % |
| | | | | | | | | | | | |
| | | | |
| 80 | | 2018 Annual Report § TIAA-CREF Life Funds | | See notes to financial statements |
| | |
| Summary portfolio of investments | | concluded |
Bond Fund § December 31, 2018
Abbreviation(s):
| LIBOR | | London Interbank Offered Rate |
| REIT | | Real Estate Investment Trust |
| g | | Security is exempt from registration under Rule 144(A) of the Securities Act of 1933. Such securities are deemed liquid and may be resold in transactions exempt from registration to qualified institutional buyers. At 12/31/18, the aggregate value of these securities, including those in “Other,” was $35,179,665 or 18.6% of net assets. |
| h | | All or a portion of these securities were purchased on a delayed delivery basis. |
| i | | Floating or variable rate security includes the reference rate and spread, unless the variable rate is based on the underlying asset of the security. Coupon rate reflects the rate at period end. |
“Other” securities represent the aggregate value, by category, of securities that are not among the 50 largest holdings and, in total for any issuer, represent 1% or less of net assets.
For ease of presentation, a number of classification categories have been grouped together in the Summary portfolio of investments. Note that the Fund uses more specific categories in following its investment limitations on investment concentrations.
| | | | | | |
| See notes to financial statements | | TIAA-CREF Life Funds § 2018 Annual Report | | | 81 | |
| | |
| Summary portfolio of investments | | |
Money Market Fund § December 31, 2018
| | | | | | | | | | | | | | | | |
| Principal | | | | | Issuer | | | | Value | | | % net
assets | |
| | | | | | | | | | | | | | | | |
| | SHORT-TERM INVESTMENTS | |
| | GOVERNMENT AGENCY DEBT | |
| | $ 910,000 | | | | | Federal Agricultural Mortgage Corp (FAMC) | | 0.010%, 01/02/19 | | $ | 909,945 | | | | 0.9 | % |
| | 1,705,000 | | | | | FAMC | | 0.010%, 01/04/19–02/11/19 | | | 1,702,498 | | | | 1.6 | |
| | 1,000,000 | | | | | Federal Farm Credit Bank (FFCB) | | 0.010%, 01/29/19 | | | 998,242 | | | | 1.0 | |
| | 1,000,000 | | | | | FFCB | | 0.010%, 02/05/19 | | | 997,735 | | | | 1.0 | |
| | 1,000,000 | | | | | FFCB | | 0.010%, 02/19/19 | | | 996,869 | | | | 1.0 | |
| | 1,200,000 | | | | | FFCB | | 0.010%, 05/23/19 | | | 1,188,324 | | | | 1.1 | |
| | 7,925,000 | | | | | FFCB | | 0.010%, 01/02/19–05/20/19 | | | 7,883,358 | | | | 7.5 | |
| | 1,250,000 | | | | | Federal Home Loan Bank (FHLB) | | 0.010%, 01/28/19 | | | 1,247,854 | | | | 1.2 | |
| | 1,500,000 | | | | | FHLB | | 0.010%, 01/30/19 | | | 1,497,219 | | | | 1.4 | |
| | 800,000 | | | | | FHLB | | 0.010%, 01/31/19 | | �� | 798,443 | | | | 0.8 | |
| | 865,000 | | | | | FHLB | | 0.010%, 02/01/19 | | | 863,246 | | | | 0.8 | |
| | 2,460,000 | | | | | FHLB | | 0.010%, 02/11/19 | | | 2,453,354 | | | | 2.3 | |
| | 1,700,000 | | | | | FHLB | | 0.010%, 02/12/19 | | | 1,695,325 | | | | 1.6 | |
| | 1,525,000 | | | | | FHLB | | 0.010%, 02/20/19 | | | 1,520,131 | | | | 1.5 | |
| | 1,070,000 | | | | | FHLB | | 0.010%, 02/22/19 | | | 1,066,306 | | | | 1.0 | |
| | 980,000 | | | | | FHLB | | 0.010%, 02/25/19 | | | 976,399 | | | | 0.9 | |
| | 1,125,000 | | | | | FHLB | | 0.010%, 03/13/19 | | | 1,119,631 | | | | 1.1 | |
| | 1,500,000 | | | | | FHLB | | 0.010%, 03/26/19 | | | 1,491,495 | | | | 1.4 | |
| | 1,151,000 | | | | | FHLB | | 0.010%, 04/10/19 | | | 1,143,372 | | | | 1.1 | |
| | 9,797,000 | | | | | FHLB | | 0.010%, 01/02/19–04/02/19 | | | 9,763,378 | | | | 9.3 | |
| | 1,155,000 | | | | | Federal Home Loan Mortgage Corp (FHLMC) | | 0.010%, 01/04/19 | | | 1,154,791 | | | | 1.1 | |
| | 1,000,000 | | | | | FHLMC | | 0.010%, 01/07/19 | | | 999,638 | | | | 1.0 | |
| | 1,500,000 | | | | | FHLMC | | 0.010%, 01/08/19 | | | 1,499,367 | | | | 1.4 | |
| | 1,105,000 | | | | | FHLMC | | 0.010%, 01/09/19 | | | 1,104,462 | | | | 1.1 | |
| | 1,000,000 | | | | | FHLMC | | 0.010%, 01/18/19 | | | 998,914 | | | | 1.0 | |
| | 1,049,000 | | | | | FHLMC | | 0.010%, 01/23/19 | | | 1,047,561 | | | | 1.0 | |
| | 1,000,000 | | | | | FHLMC | | 0.010%, 02/13/19 | | | 997,193 | | | | 1.0 | |
| | 1,210,000 | | | | | FHLMC | | 0.010%, 02/25/19 | | | 1,205,665 | | | | 1.2 | |
| | 1,085,000 | | | | | FHLMC | | 0.010%, 02/26/19 | | | 1,081,037 | | | | 1.0 | |
| | 1,480,000 | | | | | FHLMC | | 0.010%, 03/26/19 | | | 1,471,746 | | | | 1.4 | |
| | 2,218,000 | | | | | FHLMC | | 0.010%, 01/22/19–04/17/19 | | | 2,209,085 | | | | 2.1 | |
| | 965,000 | | | | | Federal National Mortgage Association (FNMA) | | 0.010%, 01/11/19 | | | 964,405 | | | | 0.9 | |
| | 985,000 | | | | | FNMA | | 0.010%, 01/14/19 | | | 984,198 | | | | 0.9 | |
| | 1,205,000 | | | | | FNMA | | 0.010%, 01/22/19 | | | 1,203,432 | | | | 1.1 | |
| | 1,000,000 | | | | | FNMA | | 0.010%, 02/07/19 | | | 997,657 | | | | 1.0 | |
| | 1,000,000 | | | | | FNMA | | 0.010%, 03/06/19 | | | 995,764 | | | | 0.9 | |
| | 4,325,000 | | | | | FNMA | | 0.010%, 01/04/19–03/20/19 | | | 4,310,510 | | | | 4.1 | |
| | | | | | | | | | | | |
| | | | | | | | | | | 63,538,549 | | | | 60.7 | |
| | | | | | | | | | | | |
| | TREASURY DEBT | | | | | | | | |
| | 2,228,000 | | | | | United States Treasury Bill | | 0.010%, 01/03/19 | | | 2,227,731 | | | | 2.1 | |
| | 1,000,000 | | | | | United States Treasury Bill | | 0.010%, 01/08/19 | | | 999,541 | | | | 1.0 | |
| | 1,483,000 | | | | | United States Treasury Bill | | 0.010%, 01/10/19 | | | 1,482,201 | | | | 1.4 | |
| | 1,500,000 | | | | | United States Treasury Bill | | 0.010%, 01/17/19 | | | 1,498,532 | | | | 1.4 | |
| | 1,490,000 | | | | | United States Treasury Bill | | 0.010%, 01/24/19 | | | 1,487,896 | | | | 1.4 | |
| | 1,120,000 | | | | | United States Treasury Bill | | 0.010%, 01/31/19 | | | 1,117,800 | | | | 1.1 | |
| | 1,000,000 | | | | | United States Treasury Bill | | 0.010%, 02/05/19 | | | 997,732 | | | | 1.0 | |
| | 2,000,000 | | | | | United States Treasury Bill | | 0.010%, 02/12/19 | | | 1,994,512 | | | | 1.9 | |
| | 1,500,000 | | | | | United States Treasury Bill | | 0.010%, 02/14/19 | | | 1,495,855 | | | | 1.4 | |
| | | | |
| 82 | | 2018 Annual Report § TIAA-CREF Life Funds | | See notes to financial statements |
| | |
| Summary portfolio of investments | | concluded |
Money Market Fund § December 31, 2018
| | | | | | | | | | | | | | | | |
| Principal | | | | | Issuer | | | | Value | | | % net
assets | |
| | | | | | | | | | | | | | | | |
| | TREASURY DEBT—continued | | | | | |
| | $ 1,485,000 | | | | | United States Treasury Bill | | 0.010%, 02/21/19 | | $ | 1,480,153 | | | | 1.4 | % |
| | 1,000,000 | | | | | United States Treasury Bill | | 0.010%, 02/28/19 | | | 996,259 | | | | 1.0 | |
| | 870,000 | | | | | United States Treasury Bill | | 0.010%, 03/07/19 | | | 866,341 | | | | 0.8 | |
| | 1,025,000 | | | | | United States Treasury Bill | | 0.010%, 03/14/19 | | | 1,020,164 | | | | 1.0 | |
| | 1,095,000 | | | | | United States Treasury Bill | | 0.010%, 04/04/19 | | | 1,088,306 | | | | 1.0 | |
| | 1,180,000 | | | | | United States Treasury Bill | | 0.010%, 04/18/19 | | | 1,171,554 | | | | 1.1 | |
| | 1,745,000 | | | | | United States Treasury Bill | | 0.010%, 02/07/19–04/11/19 | | | 1,736,305 | | | | 1.7 | |
| | 1,320,000 | | | | | United States Treasury Note | | 1.125%, 01/15/19 | | | 1,319,443 | | | | 1.2 | |
| | 1,900,000 | | | | | United States Treasury Note | | 0.750%–1.500%, 01/31/19–03/15/19 | | | 1,896,745 | | | | 1.9 | |
| | | | | | | | | | | | |
| | | | | | | | | | | 24,877,070 | | | | 23.8 | |
| | | | | | | | | | | | |
| | VARIABLE RATE SECURITIES | | | | | |
| | 3,300,000 | | | i | | Federal Agricultural Mortgage Corp (FAMC), LIBOR 1 M – 0.105%–LIBOR 3 M – 0.200% | | 2.244%–2.567%, 02/04/19–02/26/20 | | | 3,300,000 | | | | 3.1 | |
| | 1,000,000 | | | i | | Federal Farm Credit Bank (FFCB), FRED – 2.960% | | 2.540%, 07/09/20 | | | 999,887 | | | | 0.9 | |
| | 7,050,000 | | | i | | FFCB, LIBOR 1 M – 0.125%–FRED – 2.870% | | 2.258%–2.630%, 01/14/19–08/17/20 | | | 7,049,381 | | | | 6.7 | |
| | 1,000,000 | | | i | | Federal Home Loan Bank (FHLB) | | 2.500%, 05/15/19 | | | 1,000,000 | | | | 1.0 | |
| | 2,400,000 | | | i | | FHLB, LIBOR 3 M – 0.200%–SOFR + 0.060% | | 2.245%–2.520%, 01/18/19–09/10/19 | | | 2,400,006 | | | | 2.3 | |
| | 1,980,000 | | | i | | Federal Home Loan Mortgage Corp (FHLMC), LIBOR 3 M – 0.165%–SOFR + 0.030% | | 2.243%–2.490%, 05/08/19–08/08/19 | | | 1,980,069 | | | | 1.9 | |
| | | | | | Other | | | | | 1,000,052 | | | | 1.0 | |
| | | | | | | | | | | | |
| | | | | | | | | | | 17,729,395 | | | | 16.9 | |
| | | | | | | | | | | | |
| | | | | | TOTAL SHORT-TERM INVESTMENTS | | (Cost $106,145,014) | | | 106,145,014 | | | | 101.4 | |
| | | | | | | | | | | | |
| | | | | |
| | | | | | TOTAL PORTFOLIO | | (Cost $106,145,014) | | | 106,145,014 | | | | 101.4 | |
| | | | | | OTHER ASSETS & LIABILITIES, NET | | | | | (1,475,226 | ) | | | (1.4 | ) |
| | | | | | | | | | | | |
| | | | | | NET ASSETS | | | | $ | 104,669,788 | | | | 100.0 | % |
| | | | | | | | | | | | |
Abbreviation(s):
| FRED | | Federal Bank Prime Loan Rate |
| LIBOR | | London Interbank Offered Rate |
| SOFR | | Secure Overnight Financing Rate |
| i | | Floating or variable rate security includes the reference rate and spread, unless the variable rate is based on the underlying asset of the security. Coupon rate reflects the rate at period end. |
“Other” securities represent the aggregate value, by category, of securities that are not among the 50 largest holdings and, in total for any issuer, represent 1% or less of net assets.
For ease of presentation, a number of classification categories have been grouped together in the Summary portfolio of investments. Note that the Fund uses more specific categories in following its investment limitations on investment concentrations.
| | | | | | |
| See notes to financial statements | | TIAA-CREF Life Funds § 2018 Annual Report | | | 83 | |
Balanced Fund § December 31, 2018
| | | | | | | | | | | | | | | | |
| Shares | | | | | Security | | | | Value | | | % of net
assets | |
| | | | | | | | | | | | | | | | |
| | TIAA-CREF LIFE FUNDS—99.9%(a) | | | | | | | | | | |
| | FIXED INCOME—50.7% | | | | | | | | | | |
| | 2,874,005 | | | | | TIAA-CREF Life Bond Fund | | | | | $28,625,094 | | | | 50.7 | % |
| | | | | | | | | | | | |
| | TOTAL FIXED INCOME | | | | | 28,625,094 | | | | 50.7 | |
| | | | | | | | | | | | |
| | INTERNATIONAL EQUITY—9.9% | | | | | | | | | | |
| | 792,577 | | | | | TIAA-CREF Life International Equity Fund | | | | | 5,603,517 | | | | 9.9 | |
| | | | | | | | | | | | |
| | TOTAL INTERNATIONAL EQUITY | | | | | 5,603,517 | | | | 9.9 | |
| | | | | | | | | | | | |
| | U.S. EQUITY—39.3% | | | | | | | | | | |
| | 359,805 | | | | | TIAA-CREF Life Growth Equity Fund | | | | | 4,940,128 | | | | 8.7 | |
| | 357,778 | | | | | TIAA-CREF Life Growth & Income Fund | | | | | 5,559,876 | | | | 9.8 | |
| | 408,243 | | | | | TIAA-CREF LifeLarge-Cap Value Fund | | | | | 5,062,214 | | | | 9.0 | |
| | 89,581 | | | | | TIAA-CREF Life Real Estate Securities Fund | | | | | 1,102,748 | | | | 1.9 | |
| | 89,347 | | | | | TIAA-CREF LifeSmall-Cap Equity Fund | | | | | 1,108,791 | | | | 2.0 | |
| | 202,990 | | | | | TIAA-CREF Life Stock Index Fund | | | | | 4,453,590 | | | | 7.9 | |
| | | | | | | | | | | | |
| | TOTAL U.S. EQUITY | | | | | 22,227,347 | | | | 39.3 | |
| | | | | | | | | | | | |
| | | | | | TOTAL TIAA-CREF LIFE FUNDS | | (Cost $55,664,846) | | | 56,455,958 | | | | 99.9 | |
| | | | | | | | | | | | |
| | | | | |
| | | | | | TOTAL PORTFOLIO | | (Cost $55,664,846) | | | 56,455,958 | | | | 99.9 | |
| | | | | | OTHER ASSETS AND LIABILITIES, NET | | | | | 60,340 | | | | 0.1 | |
| | | | | | | | | | | | |
| | | | | | NET ASSETS | | | | $ | 56,516,298 | | | | 100.0 | % |
| | | | | | | | | | | | |
| (a) | | The Fund invests its assets in the affiliated TIAA-CREF Life Funds. |
| | | | |
| 84 | | 2018 Annual Report § TIAA-CREF Life Funds | | See notes to financial statements |
[This page intentionally left blank.]
| | | | |
| TIAA-CREF Life Funds § 2018 Annual Report | | | 85 | |
| | |
| Statements of assets and liabilities | | |
TIAA-CREF Life Funds § December 31, 2018
| | | | | | | | |
| | | Growth
Equity
Fund | | | | |
| |
| | |
ASSETS | | | | | | | | |
Portfolio investments, at value*† | | $ | 98,137,366 | | | | | |
Cash | | | 7,183 | | | | | |
Receivable from securities transactions | | | 494,003 | | | | | |
Receivable for delayed delivery securities | | | 469,716 | | | | | |
Receivable from Fund shares sold | | | 268,323 | | | | | |
Dividends and interest receivable | | | 56,264 | | | | | |
Due from affiliates | | | 790 | | | | | |
Other | | | 8,579 | | | | | |
| |
Total assets | | | 99,442,224 | | | | | |
| |
| | |
LIABILITIES | | | | | | | | |
Management fees payable | | | 5,983 | | | | | |
Due to affiliates | | | 136 | | | | | |
Payable for collateral for securities loaned | | | — | | | | | |
Payable for securities transactions | | | 1,056,035 | | | | | |
Payable for Fund shares redeemed | | | 141,050 | | | | | |
Payable for variation margin on futures contracts | | | — | | | | | |
Written optionsà | | | 2,470 | | | | | |
Payable for trustee compensation | | | 7,012 | | | | | |
Accrued expenses and other payables | | | 13,241 | | | | | |
| |
Total liabilities | | | 1,225,927 | | | | | |
| |
NET ASSETS | | $ | 98,216,297 | | | | | |
|
| |
| | |
NET ASSETS CONSIST OF: | | | | | | | | |
Paid-in-capital | | $ | 63,082,471 | | | | | |
Total distributable earnings (loss) | | | 35,133,826 | | | | | |
| |
NET ASSETS | | $ | 98,216,297 | | | | | |
|
| |
Outstanding shares of beneficial interest,
unlimited shares authorized ($.0001 par value) | | | 7,152,102 | | | | | |
| |
Net asset value per share | | $ | 13.73 | | | | | |
|
| |
| | |
* Includes securities loaned of | | $ | — | | | | | |
† Portfolio investments, cost | | $ | 71,955,588 | | | | | |
à Written options premiums | | $ | 3,075 | | | | | |
| | | | |
| 86 | | 2018 Annual Report § TIAA-CREF Life Funds | | See notes to financial statements |
| | | | | | | | | | | | | | | | | | | | |
| | | Growth &
Income
Fund | | | Large-Cap
Value
Fund | | | Real Estate
Securities
Fund | | | Small-Cap
Equity
Fund | | | Social Choice
Equity
Fund | |
| |
| | | | | |
| | | | | | | | | | | | | | | | | | | | |
| | $ | 131,347,385 | | | $ | 62,753,701 | | | $ | 66,878,418 | | | $ | 46,712,071 | | | $ | 56,156,193 | |
| | | 33,943 | | | | 9,587 | | | | 7,989 | | | | 2,172 | | | | 39,237 | |
| | | 234,752 | | | | — | | | | — | | | | 44,867 | | | | 16,318 | |
| | | — | | | | — | | | | — | | | | — | | | | — | |
| | | 284,111 | | | | 225,953 | | | | 63,614 | | | | 66,847 | | | | 5,741 | |
| | | 126,510 | | | | 78,079 | | | | 349,722 | | | | 43,222 | | | | 67,545 | |
| | | 1,068 | | | | 1,229 | | | | 863 | | | | 1,178 | | | | 871 | |
| | | 13,455 | | | | 9,408 | | | | 10,093 | | | | 6,215 | | | | 6,018 | |
| |
| | | 132,041,224 | | | | 63,077,957 | | | | 67,310,699 | | | | 46,876,572 | | | | 56,291,923 | |
| |
| | | | | |
| | | | | | | | | | | | | | | | | | | | |
| | | 7,908 | | | | 3,834 | | | | 4,575 | | | | 2,888 | | | | 1,137 | |
| | | 115 | | | | 123 | | | | 114 | | | | 129 | | | | 129 | |
| | | 1,180,169 | | | | — | | | | — | | | | 303,146 | | | | 325,548 | |
| | | 338,282 | | | | — | | | | 29,000 | | | | 66,952 | | | | — | |
| | | 337,196 | | | | 95,800 | | | | 115,458 | | | | 61,011 | | | | 80,593 | |
| | | — | | | | — | | | | — | | | | — | | | | 25,138 | |
| | | 477,235 | | | | — | | | | — | | | | — | | | | — | |
| | | 11,270 | | | | 8,309 | | | | 9,011 | | | | 6,274 | | | | 6,064 | |
| | | 20,706 | | | | 13,798 | | | | 10,278 | | | | 11,418 | | | | 12,504 | |
| |
| | | 2,372,881 | | | | 121,864 | | | | 168,436 | | | | 451,818 | | | | 451,113 | |
| |
| | $ | 129,668,343 | | | $ | 62,956,093 | | | $ | 67,142,263 | | | $ | 46,424,754 | | | $ | 55,840,810 | |
|
| |
| | | | | |
| | | | | | | | | | | | | | | | | | | | |
| | $ | 91,144,213 | | | $ | 58,183,133 | | | $ | 50,538,819 | | | $ | 41,721,760 | | | $ | 33,284,897 | |
| | | 38,524,130 | | | | 4,772,960 | | | | 16,603,444 | | | | 4,702,994 | | | | 22,555,913 | |
| |
| | $ | 129,668,343 | | | $ | 62,956,093 | | | $ | 67,142,263 | | | $ | 46,424,754 | | | $ | 55,840,810 | |
|
| |
| |
|
8,343,297 |
| | | 5,077,106 | | | | 5,454,355 | | | | 3,741,268 | | | | 3,728,627 | |
| |
| | $ | 15.54 | | | $ | 12.40 | | | $ | 12.31 | | | $ | 12.41 | | | $ | 14.98 | |
|
| |
| | | | | |
| | $ | 1,154,511 | | | $ | — | | | $ | — | | | $ | 303,730 | | | $ | 313,300 | |
| | $ | 102,564,594 | | | $ | 61,429,792 | | | $ | 53,094,044 | | | $ | 49,211,984 | | | $ | 43,293,488 | |
| | $ | 341,430 | | | $ | — | | | $ | — | | | $ | — | | | $ | — | |
| | | | | | |
| See notes to financial statements | | TIAA-CREF Life Funds § 2018 Annual Report | | | 87 | |
| | |
| Statements of assets and liabilities | | |
TIAA-CREF Life Funds § December 31, 2018
| | | | | | | | |
| | | Stock
Index
Fund | | | | |
| |
| | |
ASSETS | | | | | | | | |
Portfolio investments, at value *† | | $ | 431,519,334 | | | | | |
Affiliated investments, at value‡ | | | — | | | | | |
Cash# | | | 617,153 | | | | | |
Receivable from securities transactions | | | 12,978 | | | | | |
Receivable for delayed delivery securities | | | — | | | | | |
Receivable from Fund shares sold | | | 316,956 | | | | | |
Dividends and interest receivable | | | 532,512 | | | | | |
Due from affiliates | | | 1,024 | | | | | |
Other | | | 24,874 | | | | | |
| |
Total assets | | | 433,024,831 | | | | | |
| |
| | |
LIABILITIES | | | | | | | | |
Management fees payable | | | 3,497 | | | | | |
Due to affiliates | | | 64 | | | | | |
Payable for collateral for securities loaned | | | 2,374,724 | | | | | |
Payable for securities transactions | | | 12,545 | | | | | |
Payable for delayed delivery securities | | | — | | | | | |
Payable for Fund shares redeemed | | | 784,162 | | | | | |
Income distribution payable | | | — | | | | | |
Payable for variation margin on futures contracts | | | 266,973 | | | | | |
Payable for trustee compensation | | | 25,188 | | | | | |
Accrued expenses and other payables | | | 30,334 | | | | | |
| |
Total liabilities | | | 3,497,487 | | | | | |
| |
NET ASSETS | | $ | 429,527,344 | | | | | |
|
| |
| | |
NET ASSETS CONSIST OF: | | | | | | | | |
Paid-in-capital | | $ | 235,035,386 | | | | | |
Total distributable earnings (loss) | | | 194,491,958 | | | | | |
| |
NET ASSETS | | $ | 429,527,344 | | | | | |
|
| |
Outstanding shares of beneficial interest,
unlimited shares authorized ($.0001 par value) | | | 19,576,296 | | | | | |
| |
Net asset value per share | | $ | 21.94 | | | | | |
|
| |
| | |
* Includes securities loaned of | | $ | 2,286,558 | | | | | |
# Includes cash collateral for mortgage dollar rolls | | $ | — | | | | | |
† Portfolio investments, cost | | $ | 240,001,235 | | | | | |
‡ Affiliated investments, cost | | $ | — | | | | | |
| | | | |
| 88 | | 2018 Annual Report § TIAA-CREF Life Funds | | See notes to financial statements |
| | | | | | | | | | | | | | | | |
| | | International
Equity
Fund | | | Bond
Fund | | | Money
Market
Fund | | | Balanced
Fund | |
| |
| | | | |
| | | | | | | | | | | | | | | | |
| | $ | 88,856,141 | | | $ | 188,230,880 | | | $ | 106,145,014 | | | $ | — | |
| | | — | | | | — | | | | — | | | | 56,455,958 | |
| | | 9,573 | | | | 977,707 | | | | 11,585 | | | | 28,830 | |
| | | 700,316 | | | | 163,118 | | | | — | | | | 1,130,914 | |
| | | — | | | | 294,236 | | | | — | | | | — | |
| | | 98,455 | | | | 48,085 | | | | 20,300 | | | | 14,098 | |
| | | 143,249 | | | | 1,154,437 | | | | 62,225 | | | | — | |
| | | 1,604 | | | | 1,080 | | | | 1,122 | | | | 933 | |
| | | 12,053 | | | | 15,111 | | | | 1,130 | | | | 1,782 | |
| |
| | | 89,821,391 | | | | 190,884,654 | | | | 106,241,376 | | | | 57,632,515 | |
| |
| | | | |
| | | | | | | | | | | | | | | | |
| | | 5,855 | | | | 7,811 | | | | 1,429 | | | | 769 | |
| | | 134 | | | | 109 | | | | 107 | | | | 1,989 | |
| | | 2,244,124 | | | | — | | | | — | | | | — | |
| | | 1,352,385 | | | | — | | | | — | | | | 1,102,914 | |
| | | — | | | | 405,321 | | | | — | | | | — | |
| | | 132,413 | | | | 1,134,048 | | | | 1,549,571 | | | | 936 | |
| | | — | | | | — | | | | 65 | | | | — | |
| | | — | | | | — | | | | — | | | | — | |
| | | 10,040 | | | | 16,966 | | | | 1,120 | | | | 1,761 | |
| | | 25,563 | | | | 35,515 | | | | 19,296 | | | | 7,848 | |
| |
| | | 3,770,514 | | | | 1,599,770 | | | | 1,571,588 | | | | 1,116,217 | |
| |
| | $ | 86,050,877 | | | $ | 189,284,884 | | | $ | 104,669,788 | | | $ | 56,516,298 | |
|
| |
| | | | |
| | | | | | | | | | | | | | | | |
| | $ | 96,875,252 | | | $ | 189,809,437 | | | $ | 104,670,673 | | | $ | 53,837,754 | |
| | | (10,824,375 | ) | | | (524,553 | ) | | | (885 | ) | | | 2,678,544 | |
| |
| | $ | 86,050,877 | | | $ | 189,284,884 | | | $ | 104,669,788 | | | $ | 56,516,298 | |
|
| |
| |
|
12,174,522 |
| | | 19,005,132 | | | | 104,668,319 | | | | 5,166,248 | |
| |
| | $ | 7.07 | | | $ | 9.96 | | | $ | 1.00 | | | $ | 10.94 | |
|
| |
| | | | |
| | $ | 2,151,129 | | | $ | — | | | $ | — | | | $ | — | |
| | $ | — | | | $ | 960,000 | | | $ | — | | | $ | — | |
| | $ | 105,573,634 | | | $ | 192,134,398 | | | $ | 106,145,014 | | | $ | — | |
| | $ | — | | | $ | — | | | $ | — | | | $ | 55,664,846 | |
| | | | | | |
| See notes to financial statements | | TIAA-CREF Life Funds § 2018 Annual Report | | | 89 | |
TIAA-CREF Life Funds § For the year ended December 31, 2018
| | | | | | | | |
| | | Growth
Equity
Fund | | | | |
| |
| | |
INVESTMENT INCOME | | | | | | | | |
Dividends* | | $ | 998,929 | | | | | |
Interest | | | 23,692 | | | | | |
Payment from affiliate | | | 6,662 | | | | | |
Income from securities lending | | | 6,073 | | | | | |
| |
Total income | | | 1,035,356 | | | | | |
| |
| | |
EXPENSES | | | | | | | | |
Management fees | | | 488,235 | | | | | |
Shareholder servicing | | | 3,116 | | | | | |
Professional fees | | | 35,847 | | | | | |
Custody and accounting fees | | | 29,094 | | | | | |
Administrative service fees | | | 24,978 | | | | | |
Shareholder reports | | | 18,508 | | | | | |
Trustee fees and expenses | | | 2,285 | | | | | |
Other expenses | | | 10,171 | | | | | |
| |
Total expenses | | | 612,234 | | | | | |
Less: Expenses reimbursed by the investment adviser | | | (47,292 | ) | | | | |
| |
Net expenses | | | 564,942 | | | | | |
| |
| | |
Net investment income (loss) | | | 470,414 | | | | | |
| |
| | |
NET REALIZED AND UNREALIZED GAIN (LOSS) ON TOTAL INVESTMENTS | | | | | | | | |
Realized gain (loss): | | | | | | | | |
Portfolio investments‡ | | | 9,015,353 | | | | | |
Futures contracts | | | — | | | | | |
Purchased options | | | (148,664 | ) | | | | |
Swap contracts | | | — | | | | | |
Written options | | | (204,610 | ) | | | | |
Foreign currency transactions | | | (2,719 | ) | | | | |
| |
Net realized gain (loss) on total investments | | | 8,659,360 | | | | | |
| |
| | |
Change in unrealized appreciation (depreciation) on: | | | | | | | | |
Portfolio investments | | | (9,390,675 | ) | | | | |
Futures contracts | | | — | | | | | |
Purchased options | | | 131,044 | | | | | |
Written options | | | (20,049 | ) | | | | |
Translation of assets (other than portfolio investments) and
liabilities denominated in foreign currencies | | | 286 | | | | | |
| |
Net change in unrealized appreciation (depreciation) on total investments and from affiliated investments | | | (9,279,394 | ) | | | | |
| |
Net realized and unrealized gain (loss) on total investments | | | (620,034 | ) | | | | |
| |
Net increase (decrease) in net assets from operations | | $ | (149,620 | ) | | | | |
|
| |
| | |
* Net of foreign withholding taxes of | | $ | 19,530 | | | | | |
‡ Includes net reazlied gain (loss) from securities sold to affiliates of | | $ | 52,328 | | | | | |
| | | | |
| 90 | | 2018 Annual Report § TIAA-CREF Life Funds | | See notes to financial statements |
| | | | | | | | | | | | | | | | | | | | |
| | | Growth &
Income
Fund
| | | Large-Cap
Value
Fund | | | Real Estate
Securities
Fund | | | Small-Cap
Equity
Fund | | | Social Choice
Equity
Fund | |
| |
| | | | | |
| | | | | | | | | | | | | | | | | | | | |
| | $ | 2,269,228 | | | $ | 1,604,004 | | | $ | 2,023,776 | | | $ | 590,441 | | | $ | 1,148,973 | |
| | | 15,271 | | | | 9,365 | | | | 17,796 | | | | 2,525 | | | | 7,675 | |
| | | 9,369 | | | | 4,803 | | | | 4,746 | | | | — | | | | — | |
| | | 8,742 | | | | 4,885 | | | | — | | | | 5,607 | | | | 8,814 | |
| |
| | | 2,302,610 | | | | 1,623,057 | | | | 2,046,318 | | | | 598,573 | | | | 1,165,462 | |
| |
| | | | | |
| | | | | | | | | | | | | | | | | | | | |
| | | 666,962 | | | | 332,879 | | | | 357,764 | | | | 260,878 | | | | 91,890 | |
| | | 3,500 | | | | 3,129 | | | | 3,151 | | | | 2,570 | | | | 3,491 | |
| | | 37,062 | | | | 35,590 | | | | 36,576 | | | | 32,912 | | | | 28,968 | |
| | | 51,099 | | | | 37,703 | | | | 14,239 | | | | 27,647 | | | | 14,691 | |
| | | 25,576 | | | | 24,397 | | | | 24,298 | | | | 24,157 | | | | 24,228 | |
| | | 23,746 | | | | 14,773 | | | | 14,097 | | | | 13,271 | | | | 12,419 | |
| | | 3,104 | | | | 1,554 | | | | 1,490 | | | | 1,205 | | | | 1,278 | |
| | | 23,612 | | | | 12,538 | | | | 11,433 | | | | 13,711 | | | | 16,480 | |
| |
| | | 834,661 | | | | 462,563 | | | | 463,048 | | | | 376,351 | | | | 193,445 | |
| | | (63,697 | ) | | | (77,225 | ) | | | (54,971 | ) | | | (75,152 | ) | | | (58,413 | ) |
| |
| | | 770,964 | | | | 385,338 | | | | 408,077 | | | | 301,199 | | | | 135,032 | |
| |
| | | | | |
| | | 1,531,646 | | | | 1,237,719 | | | | 1,638,241 | | | | 297,374 | | | | 1,030,430 | |
| |
| | | | | |
| | | | | | | | | | | | | | | | | | | | |
| | | | | | | | | | | | | | | | | | | | |
| | | 9,036,587 | | | | 3,550,184 | | | | 969,822 | | | | 6,999,728 | | | | 8,765,580 | |
| | | — | | | | — | | | | — | | | | 17,790 | | | | (30,920 | ) |
| | | (745 | ) | | | — | | | | — | | | | — | | | | — | |
| | | — | | | | — | | | | — | | | | (10,434 | ) | | | — | |
| | | (112,036 | ) | | | — | | | | — | | | | — | | | | — | |
| | | 550 | | | | (52 | ) | | | — | | | | — | | | | — | |
| |
| | | 8,924,356 | | | | 3,550,132 | | | | 969,822 | | | | 7,007,084 | | | | 8,734,660 | |
| |
| | | | | |
| | | | | | | | | | | | | | | | | | | | |
| | | (20,084,848 | ) | | | (15,122,646 | ) | | | (5,738,238 | ) | | | (13,591,862 | ) | | | (12,900,337 | ) |
| | | — | | | | — | | | | — | | | | (7,578 | ) | | | (29,457 | ) |
| | | 4,577 | | | | — | | | | — | | | | — | | | | — | |
| | | (159,414 | ) | | | — | | | | — | | | | — | | | | — | |
| |
|
307 |
| | | (94 | ) | | | — | | | | — | | | | — | |
| |
| | | (20,239,378 | ) | | | (15,122,740 | ) | | | (5,738,238 | ) | | | (13,599,440 | ) | | | (12,929,794 | ) |
| |
| | | (11,315,022 | ) | | | (11,572,608 | ) | | | (4,768,416 | ) | | | (6,592,356 | ) | | | (4,195,134 | ) |
| |
| | $ | (9,783,376 | ) | | $ | (10,334,889 | ) | | $ | (3,130,175 | ) | | $ | (6,294,982 | ) | | $ | (3,164,704 | ) |
|
| |
| | | | | |
| | $ | 17,166 | | | $ | 8,828 | | | $ | — | | | $ | 238 | | | $ | 27 | |
| | $ | 29,302 | | | $ | 73,660 | | | $ | 18,191 | | | $ | 179,428 | | | $ | 10,921 | |
| | | | | | |
| See notes to financial statements | | TIAA-CREF Life Funds § 2018 Annual Report | | | 91 | |
TIAA-CREF Life Funds § For the year ended December 31, 2018
| | | | | | | | |
| | | Stock
Index
Fund | | | | |
| |
| | |
INVESTMENT INCOME | | | | | | | | |
Dividends: | | | | | | | | |
Unaffiliated investments* | | $ | 9,035,465 | | | | | |
Affiliated investments | | | — | | | | | |
Interest | | | 81,490 | | | | | |
Payment from affiliate | | | — | | | | | |
Income from securities lending | | | 83,985 | | | | | |
| |
Total income | | | 9,200,940 | | | | | |
| |
| | |
EXPENSES | | | | | | | | |
Management fees | | | 278,175 | | | | | |
Shareholder servicing | | | 3,175 | | | | | |
Professional fees | | | 50,130 | | | | | |
Custody and accounting fees | | | 27,107 | | | | | |
Administrative service fees | | | 30,469 | | | | | |
Shareholder reports | | | 57,660 | | | | | |
Trustee fees and expenses | | | 9,648 | | | | | |
Other expenses | | | 19,416 | | | | | |
| |
Total expenses | | | 475,780 | | | | | |
Less: Expenses reimbursed by the investment adviser | | | (58,439 | ) | | | | |
| |
Net expenses | | | 417,341 | | | | | |
| |
| | |
Net investment income (loss) | | | 8,783,599 | | | | | |
| |
| | |
NET REALIZED AND UNREALIZED GAIN (LOSS) ON TOTAL INVESTMENTS | | | | | | | | |
Realized gain (loss): | | | | | | | | |
Portfolio investments | | | | | | | | |
Unaffiliated investments‡ | | | 4,736,213 | | | | | |
Affiliated investments | | | — | | | | | |
Futures contracts | | | (292,556 | ) | | | | |
Swap contracts | | | — | | | | | |
Foreign currency transactions | | | (4 | ) | | | | |
Realized Gain distributions from affiliated investments | | | — | | | | | |
| |
Net realized gain (loss) on total investments | | | 4,443,653 | | | | | |
| |
| | |
Change in unrealized appreciation (depreciation) on: | | | | | | | | |
Portfolio investments | | | | | | | | |
Unaffiliated investments | | | (36,981,031 | ) | | | | |
Affiliated investments | | | — | | | | | |
Futures contracts | | | (310,350 | ) | | | | |
Translation of assets (other than portfolio investments) and
liabilities denominated in foreign currencies | | | — | | | | | |
Unfunded loan commitment | | | — | | | | | |
| |
Net change in unrealized appreciation (depreciation) on total investments and from affiliated investments | | | (37,291,381 | ) | | | | |
| |
Net realized and unrealized gain (loss) on total investments | | | (32,847,728 | ) | | | | |
| |
Net increase (decrease) in net assets from operations | | $ | (24,064,129 | ) | | | | |
|
| |
| | |
* Net of foreign withholding taxes of | | $ | 839 | | | | | |
‡ Includes net reazlied gain (loss) from securities sold to affiliates of | | $ | 16,562 | | | | | |
| | | | |
| 92 | | 2018 Annual Report § TIAA-CREF Life Funds | | See notes to financial statements |
| | | | | | | | | | | | | | | | |
| | | International
Equity
Fund | | | Bond
Fund | | | Money
Market
Fund | | | Balanced
Fund | |
| |
| | | | |
| | | | | | | | | | | | | | | | |
| | | | | | | | | | | | | | | | |
| | $ | 2,695,856 | | | $ | — | | | $ | — | | | $ | — | |
| | | — | | | | — | | | | — | | | | 1,132,611 | |
| | | 21,262 | | | | 6,504,093 | | | | 1,642,233 | | | | 1,044 | |
| | | 8,923 | | | | — | | | | — | | | | — | |
| | | 27,555 | | | | — | | | | — | | | | — | |
| |
| | | 2,753,596 | | | | 6,504,093 | | | | 1,642,233 | | | | 1,133,655 | |
| |
| | | | |
| | | | | | | | | | | | | | | | |
| | | 537,809 | | | | 580,767 | | | | 87,441 | | | | 60,598 | |
| | | 3,175 | | | | 3,031 | | | | 2,143 | | | | 2,893 | |
| | | 44,228 | | | | 53,736 | | | | 30,184 | | | | 22,768 | |
| | | 61,293 | | | | 21,686 | | | | 40,634 | | | | 11,677 | |
| | | 25,017 | | | | 26,192 | | | | 24,496 | | | | 9,842 | |
| | | 21,164 | | | | 29,806 | | | | 16,859 | | | | 12,154 | |
| | | 2,303 | | | | 4,017 | | | | 1,758 | | | | 669 | |
| | | 64,319 | | | | 15,871 | | | | 8,092 | | | | 7,099 | |
| |
| | | 759,308 | | | | 735,106 | | | | 211,607 | | | | 127,700 | |
| | | (113,399 | ) | | | (54,209 | ) | | | (79,157 | ) | | | (66,667 | ) |
| |
| | | 645,909 | | | | 680,897 | | | | 132,450 | | | | 61,033 | |
| |
| | | | |
| | | 2,107,687 | | | | 5,823,196 | | | | 1,509,783 | | | | 1,072,622 | |
| |
| | | | |
| | | | | | | | | | | | | | | | |
| | | | | | | | | | | | | | | | |
| | | | | | | | | | | | | | | | |
| | | 3,919,459 | | | | (2,218,759 | ) | | | (50 | ) | | | — | |
| | | — | | | | — | | | | — | | | | 266,221 | |
| | | — | | | | — | | | | — | | | | — | |
| | | — | | | | (59,052 | ) | | | — | | | | — | |
| | | (79,694 | ) | | | (20,561 | ) | | | — | | | | — | |
| | | — | | | | — | | | | — | | | | 1,294,330 | |
| |
| | | 3,839,765 | | | | (2,298,372 | ) | | | (50 | ) | | | 1,560,551 | |
| |
| | | | |
| | | | | | | | | | | | | | | | |
| | | | | | | | | | | | | | | | |
| | | (32,407,571 | ) | | | (5,147,218 | ) | | | — | | | | — | |
| | | | | | | | | | | | | | | (5,901,397 | ) |
| | | — | | | | — | | | | — | | | | — | |
| | | (4,997 | ) | |
|
33 |
| | | — | | | | — | |
| | | — | | | | (152 | ) | | | — | | | | — | |
| |
| | | (32,412,568 | ) | | | (5,147,337 | ) | | | — | | | | (5,901,397 | ) |
| |
| | | (28,572,803 | ) | | | (7,445,709 | ) | | | (50 | ) | | | (4,340,846 | ) |
| |
| | $ | (26,465,116 | ) | | $ | (1,622,513 | ) | | $ | 1,509,733 | | | $ | (3,268,224 | ) |
|
| |
| | | | |
| | $ | 331,209 | | | $ | 2,079 | | | $ | — | | | $ | — | |
| | $ | (5,968 | ) | | $ | — | | | $ | — | | | $ | — | |
| | | | | | |
| See notes to financial statements | | TIAA-CREF Life Funds § 2018 Annual Report | | | 93 | |
| | |
| Statements of changes in net assets | | |
TIAA-CREF Life Funds § For the year ended
| | | | | | | | | | | | |
| | | Growth Equity Fund | | | | |
| | | December 31, 2018 | | | December 31, 2017*,a | | | | |
| |
| | | |
OPERATIONS | | | | | | | | | | | | |
Net investment income (loss) | | $ | 470,414 | | | $ | 379,609 | | | | | |
Net realized gain (loss) on total investments | | | 8,659,360 | | | | 7,246,349 | | | | | |
Net change in unrealized appreciation (depreciation) on total investments | | | (9,279,394 | ) | | | 17,848,658 | | | | | |
| |
Net increase (decrease) in net assets from operations | | | (149,620 | ) | | | 25,474,616 | | | | | |
| |
| | | |
DISTRIBUTIONS TO SHAREHOLDERSb,c | | | (7,162,495 | ) | | | (1,338,467 | ) | | | | |
| |
Total distributions | | | (7,162,495 | ) | | | (1,338,467 | ) | | | | |
| |
| | | |
SHAREHOLDER TRANSACTIONS | | | | | | | | | | | | |
Subscriptions | | | 23,046,935 | | | | 13,788,648 | | | | | |
Reinvestments of distributions | | | 7,162,495 | | | | 1,338,467 | | | | | |
Redemptions | | | (21,781,434 | ) | | | (16,908,757 | ) | | | | |
| |
Net increase (decrease) from shareholder transactions | | | 8,427,996 | | | | (1,781,642 | ) | | | | |
| |
| | | |
Net increase (decrease) in net assets | | | 1,115,881 | | | | 22,354,507 | | | | | |
| | | |
NET ASSETS | | | | | | | | | | | | |
Beginning of period | | | 97,100,416 | | | | 74,745,909 | | | | | |
| |
End of period | | $ | 98,216,297 | | | $ | 97,100,416 | | | | | |
|
| |
| | | |
CHANGE IN FUND SHARES | | | | | | | | | | | | |
Shares sold | | | 1,469,843 | | | | 564,988 | | | | | |
Shares reinvested | | | 441,040 | | | | 4,106,138 | | | | | |
Shares redeemed | | | (1,388,831 | ) | | | (746,802 | ) | | | | |
| |
Net increase (decrease) from shareholder transactions | | | 522,052 | | | | 3,924,324 | | | | | |
|
| |
| | | | |
| 94 | | 2018 Annual Report § TIAA-CREF Life Funds | | See notes to financial statements |
| | | | | | | | | | | | | | | | | | | | |
| | | Growth & Income Fund | | | | | | Large-Cap Value Fund | |
| | | December 31, 2018 | | | December 31, 2017*,a | | | | | | December 31, 2018 | | | December 31, 2017*,a | |
| |
| | | | | |
| | | | | | | | | | | | | | | | | | | | |
| | $ | 1,531,646 | | | $ | 1,364,505 | | | | | | | $ | 1,237,719 | | | $ | 1,042,715 | |
| | | 8,924,356 | | | | 9,473,437 | | | | | | | | 3,550,132 | | | | 5,981,163 | |
| | | (20,239,378 | ) | | | 18,429,310 | | | | | | | | (15,122,740 | ) | | | 1,757,572 | |
| |
| | | (9,783,376 | ) | | | 29,267,252 | | | | | | | | (10,334,889 | ) | | | 8,781,450 | |
| |
| | | | | |
| | | (10,596,948 | ) | | | (928,401 | ) | | | | | | | (6,487,384 | ) | | | (302,191 | ) |
| |
| | | (10,596,948 | ) | | | (928,401 | ) | | | | | | | (6,487,384 | ) | | | (302,191 | ) |
| |
| | | | | |
| | | | | | | | | | | | | | | | | | | | |
| | | 15,924,379 | | | | 7,511,932 | | | | | | | | 8,390,235 | | | | 4,431,140 | |
| | | 10,596,104 | | | | 928,331 | | | | | | | | 6,486,526 | | | | 302,153 | |
| | | (22,278,093 | ) | | | (18,248,994 | ) | | | | | | | (11,568,496 | ) | | | (11,422,287 | ) |
| |
| | | 4,242,390 | | | | (9,808,731 | ) | | | | | | | 3,308,265 | | | | (6,688,994 | ) |
| |
| | | | | |
| | | (16,137,934 | ) | | | 18,530,120 | | | | | | | | (13,514,008 | ) | | | 1,790,265 | |
| | | | | |
| | | | | | | | | | | | | | | | | | | | |
| | | 145,806,277 | | | | 127,276,157 | | | | | | | | 76,470,101 | | | | 74,679,836 | |
| |
| | $ | 129,668,343 | | | $ | 145,806,277 | | | | | | | $ | 62,956,093 | | | $ | 76,470,101 | |
|
| |
| | | | | |
| | | | | | | | | | | | | | | | | | | | |
| | | 873,246 | | | | 240,240 | | | | | | | | 557,798 | | | | 147,183 | |
| | | 564,824 | | | | 4,968,313 | | | | | | | | 428,720 | | | | 2,996,387 | |
| | | (1,214,044 | ) | | | (578,655 | ) | | | | | | | (766,117 | ) | | | (409,234 | ) |
| |
| | | 224,026 | | | | 4,629,898 | | | | | | | | 220,401 | | | | 2,734,336 | |
|
| |
| | | | | | |
| See notes to financial statements | | TIAA-CREF Life Funds § 2018 Annual Report | | | 95 | |
| | |
| Statements of changes in net assets | | |
TIAA-CREF Life Funds § For the year ended
| | | | | | | | | | | | |
| | | Real Estate Securities Fund | | | | |
| | | December 31, 2018 | | | December 31, 2017*,a | | | | |
| |
| | | |
OPERATIONS | | | | | | | | | | | | |
Net investment income (loss) | | $ | 1,638,241 | | | $ | 1,398,888 | | | | | |
Net realized gain (loss) on total investments | | | 969,822 | | | | 3,244,851 | | | | | |
Net change in unrealized appreciation (depreciation) on total investments | | | (5,738,238 | ) | | | 4,071,112 | | | | | |
| |
Net increase (decrease) in net assets from operations | | | (3,130,175 | ) | | | 8,714,851 | | | | | |
| |
| | | |
DISTRIBUTIONS TO SHAREHOLDERSb,c | | | (3,982,177 | ) | | | (1,962,261 | ) | | | | |
| |
Total distributions | | | (3,982,177 | ) | | | (1,962,261 | ) | | | | |
| |
| | | |
SHAREHOLDER TRANSACTIONS | | | | | | | | | | | | |
Subscriptions | | | 5,109,851 | | | | 5,606,864 | | | | | |
Reinvestments of distributions | | | 3,981,876 | | | | 1,962,120 | | | | | |
Redemptions | | | (11,980,966 | ) | | | (10,568,490 | ) | | | | |
| |
Net increase (decrease) from shareholder transactions | | | (2,889,239 | ) | | | (2,999,506 | ) | | | | |
| |
| | | |
Net increase (decrease) in net assets | | | (10,001,591 | ) | | | 3,753,084 | | | | | |
| | | |
NET ASSETS | | | | | | | | | | | | |
Beginning of period | | | 77,143,854 | | | | 73,390,770 | | | | | |
| |
End of period | | $ | 67,142,263 | | | $ | 77,143,854 | | | | | |
|
| |
| | | |
CHANGE IN FUND SHARES | | | | | | | | | | | | |
Shares sold | | | 388,522 | | | | 210,802 | | | | | |
Shares reinvested | | | 300,519 | | | | 3,509,672 | | | | | |
Shares redeemed | | | (913,624 | ) | | | (405,755 | ) | | | | |
| |
Net increase (decrease) from shareholder transactions | | | (224,583 | ) | | | 3,314,719 | | | | | |
|
| |
| | | | |
| 96 | | 2018 Annual Report § TIAA-CREF Life Funds | | See notes to financial statements |
| | | | | | | | | | | | | | | | | | | | |
| | | Small-Cap Equity Fund | | | | | | Social Choice Equity Fund | |
| | | December 31, 2018 | | | December 31, 2017*,a | | | | | | December 31, 2018 | | | December 31, 2017*,a | |
| |
| | | | | |
| | | | | | | | | | | | | | | | | | | | |
| | $ | 297,374 | | | $ | 378,520 | | | | | | | $ | 1,030,430 | | | $ | 990,558 | |
| | | 7,007,084 | | | | 6,193,058 | | | | | | | | 8,734,660 | | | | 2,933,124 | |
| | | | | |
| | | (13,599,440 | ) | | | 1,176,205 | | | | | | | | (12,929,794 | ) | | | 6,914,501 | |
| |
| | | (6,294,982 | ) | | | 7,747,783 | | | | | | | | (3,164,704 | ) | | | 10,838,183 | |
| |
| | | | | |
| | | (6,414,744 | ) | | | (1,162,850 | ) | | | | | | | (3,944,778 | ) | | | (215,557 | ) |
| |
| | | (6,414,744 | ) | | | (1,162,850 | ) | | | | | | | (3,944,778 | ) | | | (215,557 | ) |
| |
| | | | | |
| | | | | | | | | | | | | | | | | | | | |
| | | 4,408,393 | | | | 5,699,514 | | | | | | | | 4,449,391 | | | | 3,585,942 | |
| | | 6,414,744 | | | | 1,162,850 | | | | | | | | 3,944,061 | | | | 215,519 | |
| | | (10,277,253 | ) | | | (9,230,658 | ) | | | | | | | (6,827,742 | ) | | | (5,634,488 | ) |
| |
| | | 545,884 | | | | (2,368,294 | ) | | | | | | | 1,565,710 | | | | (1,833,027 | ) |
| |
| | | | | |
| | | (12,163,842 | ) | | | 4,216,639 | | | | | | | | (5,543,772 | ) | | | 8,789,599 | |
| | | | | |
| | | | | | | | | | | | | | | | | | | | |
| | | 58,588,596 | | | | 54,371,957 | | | | | | | | 61,384,582 | | | | 52,594,983 | |
| |
| | $ | 46,424,754 | | | $ | 58,588,596 | | | | | | | $ | 55,840,810 | | | $ | 61,384,582 | |
|
| |
| | | | | |
| | | | | | | | | | | | | | | | | | | | |
| | | 278,556 | | | | 193,772 | | | | | | | | 268,338 | | | | 107,123 | |
| | | 413,854 | | | | 2,277,887 | | | | | | | | 225,246 | | | | 2,204,925 | |
| | | (657,798 | ) | | | (312,476 | ) | | | | | | | (396,474 | ) | | | (180,705 | ) |
| |
| | | 34,612 | | | | 2,159,183 | | | | | | | | 97,110 | | | | 2,131,343 | |
|
| |
| | | | | | |
| See notes to financial statements | | TIAA-CREF Life Funds § 2018 Annual Report | | | 97 | |
| | |
| Statements of changes in net assets | | |
TIAA-CREF Life Funds § For the year ended
| | | | | | | | | | | | |
| | | Stock Index Fund | | | | |
| | | December 31, 2018 | | | December 31, 2017*,a | | | | |
| |
| | | |
OPERATIONS | | | | | | | | | | | | |
Net investment income (loss) | | $ | 8,783,599 | | | $ | 7,611,528 | | | | | |
Net realized gain (loss) on total investments | | | 4,443,653 | | | | 3,252,175 | | | | | |
Net change in unrealized appreciation (depreciation) on total investments | | | (37,291,381 | ) | | | 66,493,460 | | | | | |
| |
Net increase (decrease) in net assets from operations | | | (24,064,129 | ) | | | 77,357,163 | | | | | |
| |
| | | |
DISTRIBUTIONS TO SHAREHOLDERSb,c | | | (10,867,391 | ) | | | (421,541 | ) | | | | |
| |
Total distributions | | | (10,867,391 | ) | | | (421,541 | ) | | | | |
| |
| | | |
SHAREHOLDER TRANSACTIONS | | | | | | | | | | | | |
Subscriptions | | | 56,711,264 | | | | 54,522,509 | | | | | |
Reinvestments of distributions | | | 10,867,391 | | | | 421,541 | | | | | |
Redemptions | | | (48,549,782 | ) | | | (51,236,444 | ) | | | | |
| |
Net increase (decrease) from shareholder transactions | | | 19,028,873 | | | | 3,707,606 | | | | | |
| |
| | | |
Net increase (decrease) in net assets | | | (15,902,647 | ) | | | 80,643,228 | | | | | |
| | | |
NET ASSETS | | | | | | | | | | | | |
Beginning of period | | | 445,429,991 | | | | 364,786,763 | | | | | |
| |
End of period | | $ | 429,527,344 | | | $ | 445,429,991 | | | | | |
|
| |
| | | |
CHANGE IN FUND SHARES | | | | | | | | | | | | |
Shares sold | | | 2,335,728 | | | | 1,224,657 | | | | | |
Shares reinvested | | | 422,362 | | | | 11,277,806 | | | | | |
Shares redeemed | | | (1,990,827 | ) | | | (1,142,941 | ) | | | | |
| |
Net increase (decrease) from shareholder transactions | | | 767,263 | | | | 11,359,522 | | | | | |
|
| |
| | | | |
| 98 | | 2018 Annual Report § TIAA-CREF Life Funds | | See notes to financial statements |
| | | | | | | | | | | | | | | | | | | | |
| | | International Equity Fund | | | | | | Bond Fund | |
| | | December 31, 2018 | | | December 31, 2017*,a | | | | | | December 31, 2018 | | | December 31, 2017*,a | |
| |
| | | | | |
| | | | | | | | | | | | | | | | | | | | |
| | $ | 2,107,687 | | | $ | 1,288,941 | | | | | | | $ | 5,823,196 | | | $ | 5,064,068 | |
| | | 3,839,765 | | | | 14,087,540 | | | | | | | | (2,298,372 | ) | | | 649,151 | |
| | | | | |
| | | (32,412,568 | ) | | | 13,552,587 | | | | | | | | (5,147,337 | ) | | | 2,544,411 | |
| |
| | | (26,465,116 | ) | | | 28,929,068 | | | | | | | | (1,622,513 | ) | | | 8,257,630 | |
| |
| | | | | |
| | | (1,123,383 | ) | | | (1,210,511 | ) | | | | | | | (5,057,919 | ) | | | (37,244 | ) |
| |
| | | (1,123,383 | ) | | | (1,210,511 | ) | | | | | | | (5,057,919 | ) | | | (37,244 | ) |
| |
| | | | | |
| | | | | | | | | | | | | | | | | | | | |
| | | 12,689,868 | | | | 11,688,260 | | | | | | | | 20,767,398 | | | | 24,890,008 | |
| | | 1,123,383 | | | | 1,210,511 | | | | | | | | 5,057,753 | | | | 37,244 | |
| | | (15,579,604 | ) | | | (13,949,175 | ) | | | | | | | (29,828,381 | ) | | | (11,022,815 | ) |
| |
| | | (1,766,353 | ) | | | (1,050,404 | ) | | | | | | | (4,003,230 | ) | | | 13,904,437 | |
| |
| | | | | |
| | | (29,354,852 | ) | | | 26,668,153 | | | | | | | | (10,683,662 | ) | | | 22,124,823 | |
| | | | | |
| | | | | | | | | | | | | | | | | | | | |
| | | 115,405,729 | | | | 88,737,576 | | | | | | | | 199,968,546 | | | | 177,843,723 | |
| |
| | $ | 86,050,877 | | | $ | 115,405,729 | | | | | | | $ | 189,284,884 | | | $ | 199,968,546 | |
|
| |
| | | | | |
| | | | | | | | | | | | | | | | | | | | |
| | | 1,451,600 | | | | 673,883 | | | | | | | | 2,066,035 | | | | 1,403,977 | |
| | | 127,368 | | | | 7,540,417 | | | | | | | | 513,999 | | | | 11,346,816 | |
| | | (1,746,386 | ) | | | (866,413 | ) | | | | | | | (2,974,914 | ) | | | (563,454 | ) |
| |
| | | (167,418 | ) | | | 7,347,887 | | | | | | | | (394,880 | ) | | | 12,187,339 | |
|
| |
| | | | | | |
| See notes to financial statements | | TIAA-CREF Life Funds § 2018 Annual Report | | | 99 | |
| | |
| Statements of changes in net assets | | |
TIAA-CREF Life Funds § For the year ended
| | | | | | | | | | | | |
| | | Money Market Fund | | | | |
| | | December 31, 2018 | | | December 31, 2017a | | | | |
| |
| | | |
OPERATIONS | | | | | | | | | | | | |
Net investment income (loss) | | $ | 1,509,783 | | | $ | 583,742 | | | | | |
Net realized gain (loss) on total investments | | | (50 | ) | | | (77 | ) | | | | |
Net change in unrealized appreciation (depreciation) on total investments | | | — | | | | — | | | | | |
| |
Net increase (decrease) in net assets from operations | | | 1,509,733 | | | | 583,665 | | | | | |
| |
| | | |
DISTRIBUTIONS TO SHAREHOLDERSb,c | | | (1,510,779 | ) | | | (583,742 | ) | | | | |
| |
Total distributions | | | (1,510,779 | ) | | | (583,742 | ) | | | | |
| |
| | | |
SHAREHOLDER TRANSACTIONS | | | | | | | | | | | | |
Subscriptions | | | 153,340,638 | | | | 83,760,116 | | | | | |
Reinvestments of distributions | | | 1,510,714 | | | | 583,742 | | | | | |
Redemptions | | | (132,591,226 | ) | | | (80,192,281 | ) | | | | |
| |
Net increase (decrease) from shareholder transactions | | | 22,260,126 | | | | 4,151,577 | | | | | |
| |
| | | |
Net increase (decrease) in net assets | | | 22,259,080 | | | | 4,151,500 | | | | | |
| | | |
NET ASSETS | | | | | | | | | | | | |
Beginning of period | | | 82,410,708 | | | | 78,259,208 | | | | | |
| |
End of period | | $ | 104,669,788 | | | $ | 82,410,708 | | | | | |
|
| |
| | | |
CHANGE IN FUND SHARES | | | | | | | | | | | | |
Shares sold | | | 153,340,638 | | | | 83,760,116 | | | | | |
Shares reinvested | | | 1,510,714 | | | | 583,742 | | | | | |
Shares redeemed | | | (132,591,226 | ) | | | (80,192,281 | ) | | | | |
| |
Net increase (decrease) from shareholder transactions | | | 22,260,126 | | | | 4,151,577 | | | | | |
|
| |
| * | As described in Note 9, the share data was adjusted for the5-for-2 stock split that occurred on October 25, 2017. |
| a | Prior period amounts have been conformed to current year presentation. See notes to financial statements, Note 1—organization and significant accounting policies for further details. |
| b | The composition and per share amounts of the Funds’ distributions are presented in the Financial highlights. The distribution information for the Funds as of its most recent tax year end is presented within the notes to the financial statements, Note 6—distributions to shareholders and other tax items. |
| c | For the fiscal year ended December 31, 2017, the distributions to shareholders were characterized as “From net investment income” and “From realized gains.” See notes to financial statements, Note 1—organization and significant accounting policies for further details. |
| | | | |
| 100 | | 2018 Annual Report § TIAA-CREF Life Funds | | See notes to financial statements |
| | | | | | | | |
| | | Balanced Fund | |
| | | December 31, 2018 | | | December 31, 2017a | |
| |
| | |
| | | | | | | | |
| | $ | 1,072,622 | | | $ | 13,607 | |
| | | 1,560,551 | | | | 196,799 | |
| | |
| | | (5,901,397 | ) | | | 6,822,312 | |
| |
| | | (3,268,224 | ) | | | 7,032,718 | |
| |
| | |
| | | (308,311 | ) | | | (564,726 | ) |
| |
| | | (308,311 | ) | | | (564,726 | ) |
| |
| | |
| | | | | | | | |
| | | 5,005,948 | | | | 7,075,201 | |
| | | 308,252 | | | | 564,614 | |
| | | (4,564,169 | ) | | | (4,721,985 | ) |
| |
| | | 750,031 | | | | 2,917,830 | |
| |
| | |
| | | (2,826,504 | ) | | | 9,385,822 | |
| | |
| | | | | | | | |
| | | 59,342,802 | | | | 49,956,980 | |
| |
| | $ | 56,516,298 | | | $ | 59,342,802 | |
|
| |
| | |
| | | | | | | | |
| | | 429,326 | | | | 645,111 | |
| | | 25,904 | | | | 50,143 | |
| | | (389,454 | ) | | | (434,816 | ) |
| |
| | | 65,776 | | | | 260,438 | |
|
| |
| | | | | | |
| See notes to financial statements | | TIAA-CREF Life Funds § 2018 Annual Report | | | 101 | |
TIAA-CREF Life Funds
| | | | | | | | | | | | | | | | | | | | | | | | | | | | | | | | | | | | |
| | | | | | Selected per share data | |
| | | | | | | | | Gain (loss) from investment operations | | | | | | | | | | | | | |
| | | | | | | | | | | | | | | | | | Less distributions from | | | | | | | |
| | | | | | | | | |
| | | For the period or year ended | | | Net asset value,
beginning
of period | | | Net
investment
income
(loss)a | | | Net realized
and unrealized
gain (loss) on total
investments | | | Total gain (loss) from
investment
operations | | | Net
investment income | | | Net realized gains | | | Total
dividends and
distributions | | | | |
| | | | |
GROWTH EQUITY FUND | | | | | | | | | | | | | | | | | |
| | | 12/31/18 | | | $ | 14.65 | | | $ | 0.07 | | | $ | 0.07 | | | $ | 0.14 | | | $ | (0.06 | ) | | $ | (1.00 | ) | | $ | (1.06 | ) | | | | |
| | | 12/31/17 | * | | | 11.05 | | | | 0.06 | | | | 3.74 | | | | 3.80 | | | | — | | | | (0.20 | ) | | | (0.20 | ) | | | | |
| | | 12/31/16 | * | | | 11.55 | | | | 0.06 | | | | (0.17 | ) | | | (0.11 | ) | | | (0.06 | ) | | | (0.33 | ) | | | (0.39 | ) | | | | |
| | | 12/31/15 | * | | | 10.81 | | | | 0.03 | | | | 1.01 | | | | 1.04 | | | | (0.02 | ) | | | (0.28 | ) | | | (0.30 | ) | | | | |
| | | | 12/31/14 | * | | | 10.55 | | | | 0.04 | | | | 1.15 | | | | 1.19 | | | | (0.03 | ) | | | (0.90 | ) | | | (0.93 | ) | | | | |
| | | | |
GROWTH & INCOME FUND | | | | | | | | | | | | | | | | | |
| | | 12/31/18 | | | | 17.96 | | | | 0.19 | | | | (1.26 | ) | | | (1.07 | ) | | | (0.17 | ) | | | (1.18 | ) | | | (1.35 | ) | | | | |
| | | 12/31/17 | * | | | 14.59 | | | | 0.16 | | | | 3.32 | | | | 3.48 | | | | — | | | | (0.11 | ) | | | (0.11 | ) | | | | |
| | | 12/31/16 | * | | | 14.28 | | | | 0.18 | | | | 1.05 | | | | 1.23 | | | | (0.20 | ) | | | (0.72 | ) | | | (0.92 | ) | | | | |
| | | 12/31/15 | * | | | 15.02 | | | | 0.16 | | | | 0.32 | | | | 0.48 | | | | (0.17 | ) | | | (1.05 | ) | | | (1.22 | ) | | | | |
| | | | 12/31/14 | * | | | 14.81 | | | | 0.15 | | | | 1.50 | | | | 1.65 | | | | (0.16 | ) | | | (1.28 | ) | | | (1.44 | ) | | | | |
| | | | |
LARGE-CAP VALUE FUND | | | | | | | | | | | | | | | | | |
| | | 12/31/18 | | | | 15.75 | | | | 0.25 | | | | (2.23 | ) | | | (1.98 | ) | | | (0.22 | ) | | | (1.15 | ) | | | (1.37 | ) | | | | |
| | | 12/31/17 | * | | | 14.08 | | | | 0.21 | | | | 1.52 | | | | 1.73 | | | | — | | | | (0.06 | ) | | | (0.06 | ) | | | | |
| | | 12/31/16 | * | | | 12.48 | | | | 0.24 | | | | 2.11 | | | | 2.35 | | | | (0.24 | ) | | | (0.51 | ) | | | (0.75 | ) | | | | |
| | | 12/31/15 | * | | | 14.72 | | | | 0.18 | | | | (0.95 | ) | | | (0.77 | ) | | | (0.24 | ) | | | (1.23 | ) | | | (1.47 | ) | | | | |
| | | | 12/31/14 | * | | | 14.66 | | | | 0.26 | | | | 1.06 | | | | 1.32 | | | | (0.27 | ) | | | (0.99 | ) | | | (1.26 | ) | | | | |
| | | | |
REAL ESTATE SECURITIES FUND | | | | | | | | | | | | | | | | | |
| | | 12/31/18 | | | | 13.58 | | | | 0.30 | | | | (0.82 | ) | | | (0.52 | ) | | | (0.27 | ) | | | (0.48 | ) | | | (0.75 | ) | | | | |
| | | 12/31/17 | * | | | 12.42 | | | | 0.24 | | | | 1.27 | | | | 1.51 | | | | — | | | | (0.35 | ) | | | (0.35 | ) | | | | |
| | | 12/31/16 | * | | | 13.34 | | | | 0.23 | | | | 0.29 | | | | 0.52 | | | | (0.38 | ) | | | (1.06 | ) | | | (1.44 | ) | | | | |
| | | 12/31/15 | * | | | 14.66 | | | | 0.32 | | | | 0.27 | | | | 0.59 | | | | (0.40 | ) | | | (1.51 | ) | | | (1.91 | ) | | | | |
| | | | 12/31/14 | * | | | 11.74 | | | | 0.24 | | | | 3.11 | | | | 3.35 | | | | (0.22 | ) | | | (0.21 | ) | | | (0.43 | ) | | | | |
| | | | |
SMALL-CAP EQUITY FUND | | | | | | | | | | | | | | | | | |
| | | 12/31/18 | | | | 15.81 | | | | 0.08 | | | | (1.61 | ) | | | (1.53 | ) | | | (0.10 | ) | | | (1.77 | ) | | | (1.87 | ) | | | | |
| | | 12/31/17 | * | | | 14.06 | | | | 0.10 | | | | 1.97 | | | | 2.07 | | | | — | | | | (0.32 | ) | | | (0.32 | ) | | | | |
| | | 12/31/16 | * | | | 12.16 | | | | 0.10 | | | | 2.32 | | | | 2.42 | | | | (0.12 | ) | | | (0.40 | ) | | | (0.52 | ) | | | | |
| | | 12/31/15 | * | | | 13.43 | | | | 0.09 | | | | (0.13 | ) | | | (0.04 | ) | | | (0.08 | ) | | | (1.15 | ) | | | (1.23 | ) | | | | |
| | | | 12/31/14 | * | | | 14.53 | | | | 0.11 | | | | 0.87 | | | | 0.98 | | | | (0.11 | ) | | | (1.97 | ) | | | (2.08 | ) | | | | |
| | | | |
| 102 | | 2018 Annual Report § TIAA-CREF Life Funds | | See notes to financial statements |
| | | | | | | | | | | | | | | | | | | | | | | | | | | | | | | | | | | | |
| | | | | | | | | Ratios and supplemental data | |
| | | | | | | | | | | | | | | Ratios to average net assets | | | | |
| | | | | | | | | | | | | | | | | | | |
| | | | | | | | | |
| | | Net asset
value,
end of
period | | | Total
return†† | | | Total return
excluding
payment
from
affiliatesu | | | Net assets
at end of
period
(in thousands) | | | Gross expenses | | | Net expenses | | | Net investment
income (loss) | | | Net investment income (loss) excluding payment from affiliatesu | | | Portfolio turnover rate | |
| | | | | | | | | |
| | | | | | | | | | | | | | | | | | | | | | | | | | | | | | | | | | | | |
| | $ | 13.73 | | | | (0.21 | )% | | | (0.22 | )% | | $ | 98,216 | | | | 0.56 | % | | | 0.52 | % | | | 0.43 | % | | | 0.43 | % | | | 90 | % |
| | | 14.65 | | | | 34.54 | | | | 34.53 | | | | 97,100 | | | | 0.59 | | | | 0.52 | | | | 0.43 | | | | 0.43 | | | | 81 | |
| | | 11.05 | | | | (0.96 | ) | | | (0.99 | ) | | | 74,746 | | | | 0.60 | | | | 0.52 | | | | 0.55 | | | | 0.51 | | | | 106 | |
| | | 11.55 | | | | 9.67 | | | | 9.67 | | | | 81,569 | | | | 0.57 | | | | 0.52 | | | | 0.24 | | | | 0.24 | | | | 78 | |
| | | | 10.81 | | | | 11.25 | | | | 11.25 | | | | 70,492 | | | | 0.59 | | | | 0.52 | | | | 0.35 | | | | 0.35 | | | | 103 | |
| | | | | | | | | |
| | | | | | | | | | | | | | | | | | | | | | | | | | | | | | | | | | | | |
| | | 15.54 | | | | (7.25 | ) | | | (7.26 | ) | | | 129,668 | | | | 0.56 | | | | 0.52 | | | | 1.03 | | | | 1.03 | | | | 61 | |
| | | 17.96 | | | | 23.91 | | | | 23.91 | | | | 145,806 | | | | 0.58 | | | | 0.52 | | | | 1.00 | | | | 1.00 | | | | 70 | |
| | | 14.59 | | | | 8.60 | | | | 8.53 | | | | 127,276 | | | | 0.58 | | | | 0.52 | | | | 1.28 | | | | 1.22 | | | | 88 | |
| | | 14.28 | | | | 3.34 | | | | 3.34 | | | | 132,244 | | | | 0.55 | | | | 0.52 | | | | 1.01 | | | | 1.01 | | | | 82 | |
| | | | 15.02 | | | | 11.09 | | | | 11.09 | | | | 147,873 | | | | 0.56 | | | | 0.52 | | | | 0.98 | | | | 0.98 | | | | 103 | |
| | | | | | | | | |
| | | | | | | | | | | | | | | | | | | | | | | | | | | | | | | | | | | | |
| | | 12.40 | | | | (14.13 | ) | | | (14.14 | ) | | | 62,956 | | | | 0.63 | | | | 0.52 | | | | 1.67 | | | | 1.67 | | | | 107 | |
| | | 15.75 | | | | 12.34 | | | | 12.34 | | | | 76,470 | | | | 0.63 | | | | 0.53 | | | | 1.39 | | | | 1.39 | | | | 55 | |
| | | 14.08 | | | | 18.74 | | | | 18.58 | | | | 74,680 | | | | 0.64 | | | | 0.52 | | | | 1.86 | | | | 1.70 | | | | 68 | |
| | | 12.48 | | | | (5.00 | ) | | | (5.00 | ) | | | 64,052 | | | | 0.58 | | | | 0.52 | | | | 1.25 | | | | 1.25 | | | | 61 | |
| | | | 14.72 | | | | 8.98 | | | | 8.98 | | | | 112,643 | | | | 0.56 | | | | 0.52 | | | | 1.75 | | | | 1.75 | | | | 60 | |
| | | | | | | | | |
| | | | | | | | | | | | | | | | | | | | | | | | | | | | | | | | | | | | |
| | | 12.31 | | | | (4.23 | ) | | | (4.24 | ) | | | 67,142 | | | | 0.65 | | | | 0.57 | | | | 2.29 | | | | 2.28 | | | | 34 | |
| | | 13.58 | | | | 12.32 | | | | 12.32 | | | | 77,144 | | | | 0.66 | | | | 0.58 | | | | 1.86 | | | | 1.86 | | | | 35 | |
| | | 12.42 | | | | 3.96 | | | | 3.85 | | | | 73,391 | | | | 0.65 | | | | 0.57 | | | | 1.71 | | | | 1.60 | | | | 59 | |
| | | 13.34 | | | | 4.37 | | | | 4.37 | | | | 73,223 | | | | 0.59 | | | | 0.57 | | | | 2.12 | | | | 2.12 | | | | 30 | |
| | | | 14.66 | | | | 28.47 | | | | 28.47 | | | | 128,653 | | | | 0.58 | | | | 0.57 | | | | 1.76 | | | | 1.76 | | | | 45 | |
| | | | | | | | | |
| | | | | | | | | | | | | | | | | | | | | | | | | | | | | | | | | | | | |
| | | 12.41 | | | | (12.05 | ) | | | (12.05 | ) | | | 46,425 | | | | 0.66 | | | | 0.53 | | | | 0.52 | | | | 0.52 | | | | 86 | |
| | | 15.81 | | | | 14.90 | | | | 14.90 | | | | 58,589 | | | | 0.71 | | | | 0.53 | | | | 0.68 | | | | 0.68 | | | | 77 | |
| | | 14.06 | | | | 19.87 | | | | 19.87 | | | | 54,372 | | | | 0.71 | | | | 0.53 | | | | 0.84 | | | | 0.84 | | | | 91 | |
| | | 12.16 | | | | (0.15 | ) | | | (0.15 | ) | | | 49,403 | | | | 0.63 | | | | 0.53 | | | | 0.68 | | | | 0.68 | | | | 92 | |
| | | | 13.43 | | | | 6.85 | | | | 6.85 | | | | 52,734 | | | | 0.64 | | | | 0.54 | | | | 0.73 | | | | 0.73 | | | | 98 | |
| | | | | | |
| See notes to financial statements | | TIAA-CREF Life Funds § 2018 Annual Report | | | 103 | |
TIAA-CREF Life Funds
| | | | | | | | | | | | | | | | | | | | | | | | | | | | | | | | | | | | |
| | | | | | Selected per share data | |
| | | | | | | | | Gain (loss) from investment operations | | | | | | | | | | | | | |
| | | | | | | | | | | | | | | | | | Less distributions from | | | | | | | |
| | | | | | | | | |
| | | For the period or year ended | | | Net asset value, beginning of period | | | Net investment income (loss)a | | | Net realized and unrealized gain (loss) on total investments | | | Total gain (loss) from investment operations | | | Net investment income | | | Net realized gains | | | Total dividends and distributions | | | | |
| | | | | |
SOCIAL CHOICE EQUITY FUND | | | | | | | | | | | | | | | | | | | | | |
| | | 12/31/18 | | | $ | 16.90 | | | $ | 0.29 | | | $ | (1.06 | ) | | $ | (0.77 | ) | | $ | (0.29 | ) | | $ | (0.86 | ) | | $ | (1.15 | ) | | | | |
| | | 12/31/17 | * | | | 14.02 | | | | 0.27 | | | | 2.66 | | | | 2.93 | | | | (0.00 | )d | | | (0.05 | ) | | | (0.05 | ) | | | | |
| | | 12/31/16 | * | | | 13.61 | | | | 0.34 | | | | 1.48 | | | | 1.82 | | | | (0.34 | ) | | | (1.07 | ) | | | (1.41 | ) | | | | |
| | | 12/31/15 | * | | | 15.47 | | | | 0.27 | | | | (0.72 | ) | | | (0.45 | ) | | | (0.39 | ) | | | (1.02 | ) | | | (1.41 | ) | | | | |
| | | | 12/31/14 | * | | | 14.56 | | | | 0.26 | | | | 1.34 | | | | 1.60 | | | | (0.28 | ) | | | (0.41 | ) | | | (0.69 | ) | | | | |
| | | | | |
STOCK INDEX FUND | | | | | | | | | | | | | | | | | | | | | |
| | | 12/31/18 | | | | 23.68 | | | | 0.46 | | | | (1.62 | ) | | | (1.16 | ) | | | (0.40 | ) | | | (0.18 | ) | | | (0.58 | ) | | | | |
| | | 12/31/17 | * | | | 19.59 | | | | 0.40 | | | | 3.71 | | | | 4.11 | | | | — | | | | (0.02 | ) | | | (0.02 | ) | | | | |
| | | 12/31/16 | * | | | 17.74 | | | | 0.40 | | | | 1.86 | | | | 2.26 | | | | (0.41 | ) | | | (0.00 | ) | | | (0.41 | ) | | | | |
| | | 12/31/15 | * | | | 18.17 | | | | 0.35 | | | | (0.28 | ) | | | 0.07 | | | | (0.36 | ) | | | (0.14 | ) | | | (0.50 | ) | | | | |
| | | | 12/31/14 | * | | | 16.49 | | | | 0.32 | | | | 1.73 | | | | 2.05 | | | | (0.33 | ) | | | (0.04 | ) | | | (0.37 | ) | | | | |
| | | | | |
INTERNATIONAL EQUITY FUND | | | | | | | | | | | | | | | | | | | | | |
| | | 12/31/18 | | | | 9.35 | | | | 0.17 | | | | (2.36 | ) | | | (2.19 | ) | | | (0.09 | ) | | | — | | | | (0.09 | ) | | | | |
| | | 12/31/17 | * | | | 7.11 | | | | 0.10 | | | | 2.24 | | | | 2.34 | | | | (0.10 | ) | | | — | | | | (0.10 | ) | | | | |
| | | 12/31/16 | * | | | 7.14 | | | | 0.11 | | | | (0.03 | ) | | | 0.08 | | | | (0.11 | ) | | | — | | | | (0.11 | ) | | | | |
| | | 12/31/15 | * | | | 7.32 | | | | 0.10 | | | | (0.18 | ) | | | (0.08 | ) | | | (0.10 | ) | | | — | | | | (0.10 | ) | | | | |
| | | | 12/31/14 | * | | | 8.06 | | | | 0.12 | | | | (0.76 | ) | | | (0.64 | ) | | | (0.10 | ) | | | — | | | | (0.10 | ) | | | | |
| | | | | |
BOND FUND | | | | | | | | | | | | | | | | | | | | | |
| | | 12/31/18 | | | | 10.31 | | | | 0.30 | | | | (0.38 | ) | | | (0.08 | ) | | | (0.27 | ) | | | — | | | | (0.27 | ) | | | | |
| | | 12/31/17 | * | | | 9.86 | | | | 0.27 | | | | 0.18 | | | | 0.45 | | | | (0.00 | )d | | | — | | | | (0.00 | )d | | | | |
| | | 12/31/16 | * | | | 9.82 | | | | 0.28 | | | | 0.13 | | | | 0.41 | | | | (0.29 | ) | | | (0.08 | ) | | | (0.37 | ) | | | | |
| | | 12/31/15 | * | | | 10.22 | | | | 0.29 | | | | (0.23 | ) | | | 0.06 | | | | (0.35 | ) | | | (0.11 | ) | | | (0.46 | ) | | | | |
| | | | 12/31/14 | * | | | 9.98 | | | | 0.24 | | | | 0.31 | | | | 0.55 | | | | (0.23 | ) | | | (0.08 | ) | | | (0.31 | ) | | | | |
| | | | | |
MONEY MARKET FUND | | | | | | | | | | | | | | | | | | | | | |
| | | 12/31/18 | | | | 1.00 | | | | 0.02 | | | | — | | | | 0.02 | | | | (0.02 | ) | | | — | | | | (0.02 | ) | | | | |
| | | 12/31/17 | | | | 1.00 | | | | 0.01 | | | | — | | | | 0.01 | | | | (0.01 | ) | | | — | | | | (0.01 | ) | | | | |
| | | 12/31/16 | | | | 1.00 | | | | 0.00 | d | | | 0.00 | d | | | 0.00 | d | | | (0.00 | )d | | | — | | | | (0.00 | )d | | | | |
| | | 12/31/15 | | | | 1.00 | | | | 0.00 | d | | | 0.00 | d | | | 0.00 | d | | | (0.00 | )d | | | — | | | | (0.00 | )d | | | | |
| | | | 12/31/14 | | | | 1.00 | | | | — | | | | 0.00 | d | | | 0.00 | d | | | — | | | | — | | | | — | | | | | |
| | | | |
| 104 | | 2018 Annual Report § TIAA-CREF Life Funds | | See notes to financial statements |
| | | | | | | | | | | | | | | | | | | | | | | | | | | | | | | | | | | | | | | | | | |
| | | | | | | | | Ratios and supplemental data | | | | |
| | | | | | | | | | | | | | | | Ratios to average net assets | | | | | | | |
| | | | | | | | | | | | | | | | | | | | | | | | | | | | | | | | |
| | | | | | | | | | |
| | | | Net asset value, end of period | | | Total return†† | | | Total return
excluding
payment
from
affiliatesu | | | Net assets at end of period (in thousands) | | | Gross expenses | | | Net expenses | | | Net investment income (loss) | | | Net investment income (loss) excluding payment from affiliatesu | | | Portfolio
turnover
rate | | | Portfolio
turnover
rate
excluding
mortgage
dollar
rolls | |
| | | | | | | | | | |
| | | | | | | | | | | | | | | | | | | | | | | | | | | | | | | | | | | | | | | | | | |
| | | | | $14.98 | | | | (5.55 | )% | | | (5.55 | )% | | $ | 55,841 | | | | 0.32 | % | | | 0.22 | % | | | 1.68 | % | | | 1.68 | % | | | 38 | % | | | 38 | % |
| | | | | 16.90 | | | | 20.96 | | | | 20.96 | | | | 61,385 | | | | 0.33 | | | | 0.22 | | | | 1.75 | | | | 1.75 | | | | 13 | | | | 13 | |
| | | | | 14.02 | | | | 13.35 | | | | 13.35 | | | | 52,595 | | | | 0.36 | | | | 0.22 | | | | 2.44 | | | | 2.44 | | | | 21 | | | | 21 | |
| | | | | 13.61 | | | | (2.70 | ) | | | (2.70 | ) | | | 47,408 | | | | 0.28 | | | | 0.22 | | | | 1.76 | | | | 1.76 | | | | 9 | | | | 9 | |
| | | | | | 15.47 | | | | 10.98 | | | | 10.98 | | | | 71,967 | | | | 0.26 | | | | 0.22 | | | | 1.68 | | | | 1.68 | | | | 10 | | | | 10 | |
| | | | | | | | | | |
| | | | | | | | | | | | | | | | | | | | | | | | | | | | | | | | | | | | | | | | | | |
| | | | | 21.94 | | | | (5.28 | ) | | | (5.28 | ) | | | 429,527 | | | | 0.10 | | | | 0.09 | | | | 1.89 | | | | 1.89 | | | | 4 | | | | 4 | |
| | | | | 23.68 | | | | 21.01 | | | | 21.01 | | | | 445,430 | | | | 0.12 | | | | 0.09 | | | | 1.88 | | | | 1.88 | | | | 7 | | | | 7 | |
| | | | | 19.59 | | | | 12.71 | | | | 12.71 | | | | 364,787 | | | | 0.12 | | | | 0.09 | | | | 2.19 | | | | 2.19 | | | | 12 | | | | 12 | |
| | | | | 17.74 | | | | 0.43 | | | | 0.43 | | | | 332,443 | | | | 0.11 | | | | 0.09 | | | | 1.91 | | | | 1.91 | | | | 7 | | | | 7 | |
| | | | | | 18.17 | | | | 12.46 | | | | 12.46 | | | | 328,728 | | | | 0.12 | | | | 0.09 | | | | 1.86 | | | | 1.86 | | | | 8 | | | | 8 | |
| | | | | | | | | | |
| | | | | | | | | | | | | | | | | | | | | | | | | | | | | | | | | | | | | | | | | | |
| | | | | 7.07 | | | | (23.58 | ) | | | (23.59 | ) | | | 86,051 | | | | 0.71 | | | | 0.60 | | | | 1.96 | | | | 1.95 | | | | 67 | | | | 67 | |
| | | | | 9.35 | | | | 32.98 | | | | 32.97 | | | | 115,406 | | | | 0.70 | | | | 0.60 | | | | 1.24 | | | | 1.24 | | | | 119 | | | | 119 | |
| | | | | 7.11 | | | | 1.06 | | | | 0.96 | | | | 88,738 | | | | 0.69 | | | | 0.60 | | | | 1.57 | | | | 1.47 | | | | 94 | | | | 94 | |
| | | | | 7.14 | | | | (0.98 | ) | | | (0.98 | ) | | | 91,819 | | | | 0.66 | | | | 0.60 | | | | 1.29 | | | | 1.29 | | | | 77 | | | | 77 | |
| | | | | | 7.32 | | | | (7.90 | ) | | | (7.90 | ) | | | 90,680 | | | | 0.66 | | | | 0.60 | | | | 1.46 | | | | 1.46 | | | | 91 | | | | 91 | |
| | | | | | | | | | |
| | | | | | | | | | | | | | | | | | | | | | | | | | | | | | | | | | | | | | | | | | |
| | | | | 9.96 | | | | (0.79 | ) | | | (0.79 | ) | | | 189,285 | | | | 0.38 | | | | 0.35 | | | | 3.01 | | | | 3.01 | | | | 147 | | | | 139 | |
| | | | | 10.31 | | | | 4.54 | | | | 4.54 | | | | 199,969 | | | | 0.36 | | | | 0.35 | | | | 2.69 | | | | 2.69 | | | | 147 | | | | 114 | |
| | | | | 9.86 | | | | 4.23 | | | | 4.23 | | | | 177,844 | | | | 0.42 | | | | 0.35 | | | | 2.80 | | | | 2.80 | | | | 217 | | | | 143 | |
| | | | | 9.82 | | | | 0.57 | | | | 0.57 | | | | 179,096 | | | | 0.39 | | | | 0.35 | | | | 2.77 | | | | 2.77 | | | | 155 | | | | 155 | |
| | | | | | 10.22 | | | | 5.47 | | | | 5.47 | | | | 230,823 | | | | 0.39 | | | | 0.35 | | | | 2.38 | | | | 2.38 | | | | 180 | | | | 180 | |
| | | | | | | | | | |
| | | | | | | | | | | | | | | | | | | | | | | | | | | | | | | | | | | | | | | | | | |
| | | | | 1.00 | | | | 1.71 | | | | 1.71 | | | | 104,670 | | | | 0.24 | | | | 0.15 | | | | 1.73 | | | | 1.73 | | | | — | | | | — | |
| | | | | 1.00 | | | | 0.74 | | | | 0.74 | | | | 82,411 | | | | 0.26 | | | | 0.15 | | | | 0.75 | | | | 0.75 | | | | — | | | | — | |
| | | | | 1.00 | | | | 0.28 | | | | 0.28 | | | | 78,259 | | | | 0.26 | | | | 0.15 | | | | 0.28 | | | | 0.28 | | | | — | | | | — | |
| | | | | 1.00 | | | | 0.00 | | | | 0.00 | | | | 71,238 | | | | 0.23 | | | | 0.15 | | | | 0.00 | | | | 0.00 | | | | — | | | | — | |
| | | | | | 1.00 | | | �� | 0.00 | | | | 0.00 | | | | 68,628 | | | | 0.23 | | | | 0.11 | | | | 0.00 | | | | 0.00 | | | | — | | | | — | |
| | | | | | |
| See notes to financial statements | | TIAA-CREF Life Funds § 2018 Annual Report | | | 105 | |
TIAA-CREF Life Funds
| | | | | | | | | | | | | | | | | | | | | | | | | | | | | | | | | | | | |
| | | | | | Selected per share data | |
| | | | | | | | | Gain (loss) from investment operations | | | | | | | | | | | | | |
| | | | | | | | | | | | | | | | | | Less distributions from | | | | |
| | | | | | | | | |
| | | For the
period or
year ended | | | Net asset
value,
beginning
of period | | | Net
investment
income
(loss)a | | | Net realized
and unrealized
gain (loss) on total
investments | | | Total
gain (loss) from
investment
operations | | | Net
investment
income | | | Net
realized
gains | | | Total
dividends
and
distributions | | | | |
| | | | |
BALANCED FUND | | | | | | | | | | | | | | | | | |
| | | 12/31/18 | | | $ | 11.63 | | | $ | 0.21 | | | $ | (0.84 | ) | | $ | (0.63 | ) | | $ | (0.00 | )d | | $ | (0.06 | ) | | $ | (0.06 | ) | | | | |
| | | 12/31/17 | | | | 10.32 | | | | 0.00 | | | | 1.42 | | | | 1.42 | | | | — | | | | (0.11 | ) | | | (0.11 | ) | | | | |
| | | 12/31/16 | | | | 10.12 | | | | 0.23 | | | | 0.39 | | | | 0.62 | | | | (0.25 | ) | | | (0.17 | ) | | | (0.42 | ) | | | | |
| | | 12/31/15 | | | | 10.45 | | | | 0.22 | | | | (0.09 | ) | | | 0.13 | | | | (0.30 | ) | | | (0.16 | ) | | | (0.46 | ) | | | | |
| | | | 12/31/14 | † | | | 10.00 | | | | 0.29 | | | | 0.43 | | | | 0.72 | | | | (0.27 | ) | | | (0.00 | )d | | | (0.27 | ) | | | | |
| * | | This per share data has been retroactively adjusted for5-for-2 stock split that occurred on October 25, 2017. |
| † | | The Fund commenced operations on January 31, 2014. |
| †† | | Total returns for the shares of the Funds do not include the effect of expenses attributable to the variable annuity or variable life insurance product; if they did, returns for the shares of the Funds would have been lower. |
| a | | Based on average shares outstanding. |
| b | | The percentages shown for this period are not annualized. |
| c | | The percentages shown for this period are annualized. |
| d | | Amount represents less than $0.01 per share. |
| e | | The Fund’s expenses do not include the expenses of the Underlying Funds. |
| u | | Income reflects voluntary compensation from Advisors in amounts that approximate a portion of the cost of research services obtained from broker-dealers and research providers if Advisors had purchased the research services directly. The total return and net investment income ratio displayed excludes this item. |
| | | | |
| 106 | | 2018 Annual Report § TIAA-CREF Life Funds | | See notes to financial statements |
| | | | | | | | | | | | | | | | | | | | | | | | | | | | |
| | | | | | Ratios and supplemental data | |
| | | | | | | | | | | | Ratios to average net assets | | | | |
| | | | | | | | | | | | | | | | | | | | | | |
| | | | | | | |
| | | Net asset
value,
end of
period | | | Total
return†† | | | Net assets
at end of
period
(in thousands) | | | Gross
expenses | | | Net
expenses | | | Net
investment
income
(loss) | | | Portfolio
turnover
rate | |
| | | | | | | |
| | | | | | | | | | | | | | | | | | | | | | | | | | | | |
| | $ | 10.94 | | | | (5.47 | )% | | $ | 56,516 | | | | 0.21 | %e | | | 0.10 | %e | | | 1.77 | % | | | 17 | % |
| | | 11.63 | | | | 13.82 | | | | 59,343 | | | | 0.23 | e | | | 0.10 | e | | | 0.02 | | | | 14 | |
| | | 10.32 | | | | 6.14 | | | | 49,957 | | | | 0.24 | e | | | 0.10 | e | | | 2.20 | | | | 17 | |
| | | 10.12 | | | | 1.28 | | | | 42,585 | | | | 0.23 | e | | | 0.10 | e | | | 2.03 | | | | 40 | |
| | | | 10.45 | | | | 7.21 | b | | | 36,932 | | | | 0.49 | ce | | | 0.10 | ce | | | 2.99 | c | | | 59 | b |
| | | | | | | |
| See notes to financial statements | | TIAA-CREF Life Funds § 2018 Annual Report | | | 107 | |
| | |
| Notes to financial statements | | |
TIAA-CREF Life Funds
Note 1—organization and significant accounting policies
TIAA-CREF Life Funds (the “Trust”) is a Delaware statutory trust that is registered with the U.S. Securities and Exchange Commission (“Commission”) under the Investment Company Act of 1940, as amended (“1940 Act”), as anopen-end management investment company. The Trust consists of the following funds: Growth Equity Fund, Growth & Income Fund,Large-Cap Value Fund, Real Estate Securities Fund,Small-Cap Equity Fund, Social Choice Equity Fund, Stock Index Fund, International Equity Fund, Bond Fund, Money Market Fund and Balanced Fund (collectively the “Funds” or individually, the “Fund”). The Funds are currently available only through the purchase of variable annuity contracts or variable life insurance policies issued by TIAA-CREF Life Insurance Company (“TIAA-CREF Life”).
The accompanying financial statements were prepared in accordance with accounting principles generally accepted in the United States of America (“U.S. GAAP”), which may require the use of estimates made by management and the evaluation of subsequent events. Actual results may differ from those estimates. The Funds are investment companies and follow the accounting guidance in the Financial Accounting Standards Board (“FASB”) Accounting Standards Codification 946,Financial Services—Investment Companies. The Net Asset Value (“NAV”) for financial reporting purposes may differ from the NAV for processing transactions. The NAV for financial reporting purposes includes security and shareholder transactions through the date of the report. Total return is computed based on the NAV used for processing transactions. The following is a summary of the significant accounting policies consistently followed by the Funds.
Security valuation: For all Funds (other than the Money Market Fund), investments in securities are recorded at their estimated fair value as described in the valuation of investments note to the financial statements. Investments held by the Money Market Fund are recorded at amortized cost, which approximates fair value. The amortized cost of an instrument is determined by valuing it at its original cost and thereafter accreting or amortizing any discount or premium to its face value at a constant rate until maturity.
Investments and investment income: Securities transactions are accounted for as of the trade date for financial reporting purposes. Interest income is recorded as earned and includes accretion of discounts and amortization of premiums using the effective yield method. Dividend income is recorded on theex-dividend date. Dividends from affiliated investments are recorded as dividend income, while capital gain distributions, including short-term capital gain distributions, are recorded as gain distributions from affiliated investments on the Statements of Operations. Foreign dividend income is recorded on theex-dividend date or as soon as possible after the Funds determine the existence of a dividend declaration after exercising reasonable due diligence. Realized gains and losses on securities transactions are based upon the specific identification method. Distributions received on securities that represent a return of capital or capital gains are recorded as a reduction of cost
| | |
| 108 | | 2018 Annual Report § TIAA-CREF Life Funds |
of investments and/or as a realized gain. The Funds estimate the components of distributions received that may be considered return of capital distributions or capital gain distributions.
Most expenses of the Trust can be directly attributed to a fund. Expenses that cannot be directly attributed are allocated to each fund in the Trust based upon the average net assets of each fund.
Foreign currency transactions and translation: Assets, including investments, and liabilities denominated in foreign currencies are translated into U.S. dollar values each day using exchange rates obtained from an independent third party. Purchases and sales of securities, income, and expenses are translated into U.S. dollars at the prevailing exchange rate on the date of the transaction. The effect of changes in foreign currency exchange rates on realized and unrealized security gains and losses is reflected as a component of security gains and losses.
Distributions to shareholders: Distributions to shareholders, which are determined in accordance with income tax regulations, are recorded on theex-dividend date.
Income taxes: Each Fund is treated separately for income tax purposes. The Funds intend to continue to qualify as regulated investment companies under Subchapter M of the Internal Revenue Code (“Code”) and will not be subject to income taxes to the extent that they distribute all taxable income each year and comply with various other Code requirements. The Funds file income tax returns in U.S. federal and applicable state and local jurisdictions. A fund’s federal income tax returns are generally subject to examination for a period of three fiscal years after being filed. State and local tax returns may be subject to examination for an additional period of time depending on the jurisdiction. Management has analyzed the Funds’ tax positions taken for all open federal income tax years and has concluded that no provision for federal income tax is required in the Funds’ financial statements.
The timing and character of income and capital gain distributions are determined in accordance with income tax regulations, which may differ from U.S. GAAP. Reclassifications are made to a Fund’s capital accounts for permanent tax differences to reflect income and gains available for distribution (or available capital loss carryforwards) under income tax regulations.
For the year ended December 31, 2018, permanent book and tax differences resulting primarily from fund distribution reclasses were identified and reclassified among the components of the Funds’ net assets. Net investment income and net realized gains (losses), as disclosed on the Statements of operations, and net assets were not affected by these reclassifications.
Foreign taxes: The Funds may be subject to foreign taxes on income, gains on investments or currency repatriation, a portion of which may be recoverable.
| | | | |
| TIAA-CREF Life Funds § 2018 Annual Report | | | 109 | |
| | |
| Notes to financial statements | | |
The Funds will accrue such taxes and recoveries as applicable, based upon the current interpretation of tax rules and regulations that exist in the markets in which the Funds invest.
Trustee compensation: The Funds��pay the members of the Board of Trustees (“Board”), all of whom are independent, certain remuneration for their services, plus travel and other expenses. Trustees may elect to participate in a deferred compensation plan and defer all or a portion of their compensation. In addition, trustees participate in a long-term compensation plan. Amounts deferred are retained by the Funds until paid. Amounts payable to the trustees for compensation are included separately in the accompanying Statements of Assets and Liabilities. Trustees’ fees, including any deferred and long-term compensation incurred, are reflected in the Statements of Operations.
New accounting pronouncement: In August 2018, FASB issued ASU2018-13,Fair Value Measurement: Disclosure Framework—Changes to the Disclosure Requirements for Fair Value Measurements. ASU2018-13 removes or modifies certain disclosures required for fair value measurements. This guidance is effective for fiscal years beginning after December 15, 2019. Management has early implemented this accounting pronouncement for this annual report. This implementation did not have a material impact on the Funds’ financial statements and various filings. Refer to Note 2 for further details.
New rule issuances: In October 2016, the Commission issued Final Rule ReleaseNo. 33-10231,Investment Company Reporting Modernization. This final rule modernizes Investment Company reporting by requiring the filing of new FormsN-CEN andN-PORT, and amends RegulationS-X disclosures related to derivatives and other disclosures in the financial statements and various filings. The requirements of this final rule in relation to FormN-CEN must be complied with by June 1, 2018. In December 2017, the Commission issued Temporary Final Rule ReleaseNo. 33-10442, which delayed the filing requirements related toForm N-PORT from June 1, 2018 to April 2019, but still requires the Funds to maintain the data that would have been filed onForm N-PORT during the deferral period.Form N-CEN and the data requirements ofForm N-PORT were implemented on June 1, 2018 and did not have an impact on net assets or results of operations.
In October 2016, the Commission issued Final Rule ReleaseNo. 33-10233, Investment Company Liquidity Risk Management Programs. This final rule requires Funds to establish a liquidity risk management program and enhances disclosures regarding funds’ liquidity. The requirements of this final rule, in relation to the establishment of the liquidity risk management program and the 15% illiquid investment limit, were implemented by the December 1, 2018 compliance date. This portion of the implementation did not have a material impact on the Funds’ financial statements and various filings. In February 2018, the Commission issued Release No.IC-33142, which delayed certain compliance requirements related to liquidity classification, highly liquid investment minimums, and board approval of the
| | |
| 110 | | 2018 Annual Report § TIAA-CREF Life Funds |
liquidity risk management programs from December 1, 2018 to June 1, 2019. Management is currently assessing the impact of these provisions on the Funds’ financial statements and various filings.
In August 2018, the Commission issued Final Rule ReleaseNo. 33-10532,Disclosure Update and Simplification. This final rule amends certain disclosure requirements that have become redundant or outdated in light of other Commission disclosure requirements, U.S. GAAP or changes in the information environment. This rule eliminates the requirements for funds to present the components of distributable earnings on the balance sheet and parenthetically on the statement of changes in net assets. This final rule is effective November 5, 2018. Management has implemented the above changes for the current reporting period. In addition, certain amounts within each Fund’s Statement of changes in net assets for the prior fiscal period have been modified to conform to the current year’s presentation of distributable earnings. This change did not impact the total amount of distributable earnings from the prior period.
The Funds’ distributions from the prior fiscal period were paid from net investment
income and realized gains as indicated in the following table:
| | | | | | | | | | | | | | | | | | | | | | | | |
| | | Growth
Equity Fund | | | Growth &
Income
Fund | | | Large-Cap
Value Fund | | | Real Estate
Securities
Fund | | | Small-Cap
Equity Fund | | | Social
Choice
Equity Fund | |
| |
DISTRIBUTIONS TO SHAREHOLDERS | | | | | | | | | |
From net investment income: | | $ | — | | | $ | — | | | $ | — | | | $ | — | | | $ | — | | | $ | (6,835 | ) |
From realized gains: | | | (1,338,467 | ) | | | (928,401 | ) | | | (302,191 | ) | | | (1,962,261 | ) | | | (1,162,850 | ) | | | (208,722 | ) |
| |
Total distributions | | $ | (1,338,467 | ) | | $ | (928,401 | ) | | $ | (302,191 | ) | | $ | (1,962,261 | ) | | $ | (1,162,850 | ) | | $ | (215,557 | ) |
| |
| | | | | | |
| | | | | | Stock Index
Fund | | | International
Equity Fund | | | Bond Fund | | | Money
Market Fund | | | Balanced
Fund | |
| |
DISTRIBUTIONS TO SHAREHOLDERS | | | | | |
From net investment income: | | | | | | $ | — | | | $ | (1,210,511 | ) | | $ | (37,244 | ) | | $ | (583,742 | ) | | $ | — | |
From realized gains: | | | | | | | (421,541 | ) | | | — | | | | — | | | | — | | | | (564,726 | ) |
| |
Total distributions | | | | | | $ | (421,541 | ) | | $ | (1,210,511 | ) | | $ | (37,244 | ) | | $ | (583,742 | ) | | $ | (564,726 | ) |
| |
For the prior fiscal period, the following Undistributed net investment income (loss) included in net assets were disclosed:
| | | | | | | | | | | | | | | | | | | | | | | | |
| | | Growth
Equity
Fund | | | Growth &
Income
Fund | | | Large-Cap
Value Fund | | | Real Estate
Securities
Fund | | | Small-Cap
Equity Fund | | | Social
Choice
Equity Fund | |
| |
Undistributed net investment income (loss) included in net assets | | $ | 370,527 | | | $ | 1,361,567 | | | $ | 1,105,432 | | | $ | 1,705,604 | | | $ | 416,605 | | | $ | 1,057,523 | |
| |
| | | | |
| TIAA-CREF Life Funds § 2018 Annual Report | | | 111 | |
| | |
| Notes to financial statements | | |
| | | | | | | | | | | | | | | | | | | | | | | | |
| | | | | | Stock Index
Fund | | | International
Equity Fund | | | Bond Fund | | | Money
Market Fund | | | Balanced
Fund | |
| |
Undistributed net investment income (loss) included in net assets | | | | | | $ | 7,897,532 | | | $ | 1,113,585 | | | $ | 5,041,317 | | | $ | (693 | ) | | $ | 12,727 | |
| |
Note 2—valuation of investments
Portfolio investments are valued at fair value utilizing various valuation methods approved by the Board. U.S. GAAP establishes a hierarchy that prioritizes market inputs to valuation methods. The three levels of inputs are:
| • | | Level 1 – quoted prices in active markets for identical securities |
| • | | Level 2 – other significant observable inputs (including quoted prices for similar securities, interest rates, credit spreads, etc.) |
| • | | Level 3 – significant unobservable inputs (including the Funds’ own assumptions in determining the fair value of investments) |
The availability of observable inputs can vary from security to security and is affected by a wide variety of factors, including, for example, the type of security, whether the security is new and not yet established in the marketplace, the liquidity of markets, and other characteristics particular to the security. To the extent that valuation is based on models or inputs that are less observable or unobservable in the market, the determination of fair value requires more judgment. Accordingly, the degree of judgment exercised in determining fair value is greatest for instruments categorized as Level 3. The inputs or methodology used for valuing securities are not necessarily an indication of the risk associated with investing in those securities.
A description of the valuation techniques applied to the Funds’ major categories of assets and liabilities measured at fair value follows:
Exchange-traded equity securities, common and preferred stock: Equity securities listed or traded on a national market or exchange are valued based on their sale price at the official close of business of such market or exchange on the valuation date, or if there is no official close of business, the latest sale price, or at the mean of the latest available bid and asked prices if no sale is reported. To the extent these securities are actively traded and valuation adjustments are not applied, they are categorized in Level 1 of the fair value hierarchy. Foreign equity securities are valued at the last sale price or official closing price reported on the exchange where traded and converted to U.S. dollars at the prevailing rates of exchange on the date of valuation. For events affecting the value of foreign securities between the time when the exchange on which they are traded closes and the time when the Funds’ net assets are calculated, such securities will be valued at fair value in accordance with procedures adopted by the Board. Foreign securities are generally categorized as Level 2 of the fair value hierarchy.
| | |
| 112 | | 2018 Annual Report § TIAA-CREF Life Funds |
Debt securities: Debt securities will generally be valued using prices provided by a pricing service that may employ various indications of value including but not limited to broker-dealer quotations. Certain debt securities, other than money market instruments, are valued based on the most recent bid price or the equivalent quoted yield for such securities (or those of comparable maturity, quality and type). Debt securities are generally categorized as Level 2 of the fair value hierarchy; in instances where prices, yields or any other key inputs are unobservable, they are categorized as Level 3 of the hierarchy.
The Money Market Fund: The Money Market Fund’s portfolio securities are valued on an amortized cost basis. Money Market investments are generally categorized as Level 2 of the fair value hierarchy.
Investments in registered investment companies: These investments are valued at their NAV on the valuation date. These investments are categorized as Level 1 of the fair value hierarchy.
Futures contracts: Stock and bond index futures contracts, which are traded on commodity exchanges, are valued at the last sale price as of the close of such commodity exchanges and are categorized as Level 1 of the fair value hierarchy.
Options: Purchased and written options traded over the counter and listed on a national market or exchange are valued at the last sale price as of the close of such exchange or at the mean of the closing bid and asked prices if no sale is reported. To the extent these securities are actively traded and valuation adjustments are not applied, they are categorized as Level 1 of the fair value hierarchy.
Total return swap contracts: Total return swap contracts aremarked-to-market daily based upon a price supplied by a pricing service. Total return swaps are generally categorized as Level 2 in the fair value hierarchy.
Credit default swap contracts: Credit default swap contracts aremarked-to-market daily based upon a price supplied by a pricing service. Credit default swaps are generally categorized as Level 2 in the fair value hierarchy.
Any portfolio security for which market quotations are not readily available or for which the above valuation procedures are deemed not to reflect fair value are valued at fair value, as determined in good faith using procedures approved by the Board. To the extent the inputs are observable and timely, the values would be categorized as Level 2 of the fair value hierarchy; otherwise they would be categorized as Level 3.
As of December 31, 2018, 100% of the value of investments in the Balanced Fund was valued based on Level 1 inputs, while 100% of the value of investments in the Money Market Fund was valued based on Level 2 inputs.
| | | | |
| TIAA-CREF Life Funds § 2018 Annual Report | | | 113 | |
| | |
| Notes to financial statements | | |
The following table summarizes the market value of the Funds’ investments as of December 31, 2018, based on the inputs used to value them:
| | | | | | | | | | | | | | | | |
| Fund | | Level 1 | | | Level 2 | | | Level 3 | | | Total | |
| |
Growth Equity | |
Equity investments: | | | | | | | | | | | | | | | | |
Consumer discretionary | | $ | 14,561,988 | | | $ | 698,954 | | | $ | — | | | $ | 15,260,942 | |
Communication services | | | 14,959,462 | | | | 1,015,237 | | | | — | | | | 15,974,699 | |
Health care | | | 13,262,611 | | | | 871,368 | | | | — | | | | 14,133,979 | |
Industrials | | | 6,596,208 | | | | 993,345 | | | | — | | | | 7,589,553 | |
All other equity investments* | | | 44,018,193 | | | | — | | | | — | | | | 44,018,193 | |
Short-term investments | | | — | | | | 1,160,000 | | | | — | | | | 1,160,000 | |
Written options** | | | (2,470 | ) | | | — | | | | — | | | | (2,470 | ) |
| |
Total | | $ | 93,395,992 | | | $ | 4,738,904 | | | $ | — | | | $ | 98,134,896 | |
| |
Growth & Income | |
Equity investments: | | | | | | | | | | | | | | | | |
Consumer discretionary | | $ | 10,634,221 | | | $ | 790,317 | | | $ | — | | | $ | 11,424,538 | |
Communication services | | | 13,446,466 | | | | 302,821 | | | | — | | | | 13,749,287 | |
Consumer staples | | | 10,441,693 | | | | 534,966 | | | | — | | | | 10,976,659 | |
Health care | | | 21,819,400 | | | | 1,495,704 | | | | — | | | | 23,315,104 | |
Industrials | | | 11,335,197 | | | | 373,419 | | | | — | | | | 11,708,616 | |
Information technology | | | 26,110,520 | | | | 373,444 | | | | — | | | | 26,483,964 | |
Materials | | | 5,303,033 | | | | 265,235 | | | | — | | | | 5,568,268 | |
All other equity investments* | | | 25,480,765 | | | | — | | | | — | | | | 25,480,765 | |
Purchased options | | | 15 | | | | — | | | | — | | | | 15 | |
Short-term investments | | | 1,180,169 | | | | 1,460,000 | | | | — | | | | 2,640,169 | |
Written options** | | | (477,235 | ) | | | — | | | | — | | | | (477,235 | ) |
| |
Total | | $ | 125,274,244 | | | $ | 5,595,906 | | | $ | — | | | $ | 130,870,150 | |
| |
Large-Cap Value | |
Equity investments: | | | | | | | | | | | | | | | | |
Industrials | | $ | 6,518,752 | | | $ | — | | | $ | 160 | | | $ | 6,518,912 | |
All other equity investments* | | | 56,104,789 | | | | — | | | | — | | | | 56,104,789 | |
Short-term investments | | | — | | | | 130,000 | | | | — | | | | 130,000 | |
| |
Total | | $ | 62,623,541 | | | $ | 130,000 | | | $ | 160 | | | $ | 62,753,701 | |
| |
Real Estate Securities | |
Equity investments* | | $ | 66,368,418 | | | $ | — | | | $ | — | | | $ | 66,368,418 | |
Short-term investments | | | — | | | | 510,000 | | | | — | | | | 510,000 | |
| |
Total | | $ | 66,368,418 | | | $ | 510,000 | | | $ | — | | | $ | 66,878,418 | |
| |
Small-Cap Equity | |
Equity investments* | | $ | 46,248,925 | | | $ | — | | | $ | — | | | $ | 46,248,925 | |
Short-term investments | | | 303,146 | | | | 160,000 | | | | — | | | | 463,146 | |
| |
Total | | $ | 46,552,071 | | | $ | 160,000 | | | $ | — | | | $ | 46,712,071 | |
| |
| | |
| 114 | | 2018 Annual Report § TIAA-CREF Life Funds |
| | | | | | | | | | | | | | | | |
| Fund | | Level 1 | | | Level 2 | | | Level 3 | | | Total | |
| |
Social Choice Equity | | | | | | | | | | | | | | | | |
Equity investments* | | $ | 54,970,645 | | | $ | — | | | $ | — | | | $ | 54,970,645 | |
Short-term investments | | | 325,548 | | | | 860,000 | | | | — | | | | 1,185,548 | |
Futures contracts** | | | (25,153 | ) | | | — | | | | — | | | | (25,153 | ) |
| |
Total | | $ | 55,271,040 | | | $ | 860,000 | | | $ | — | | | $ | 56,131,040 | |
| |
Stock Index | | | | | | | | | | | | | | | | |
Equity investments: | | | | | | | | | | | | | | | | |
Financials | | $ | 58,428,892 | | | $ | 125 | | | $ | — | | | $ | 58,429,017 | |
Health care | | | 63,274,153 | | | | 95 | | | | 112 | | | | 63,274,360 | |
Materials | | | 12,740,155 | | | | 860 | | | | — | | | | 12,741,015 | |
All other equity investments* | | | 286,380,218 | | | | — | | | | — | | | | 286,380,218 | |
Short-term investments | | | 2,374,724 | | | | 8,320,000 | | | | — | | | | 10,694,724 | |
Futures contracts** | | | (267,111 | ) | | | — | | | | — | | | | (267,111 | ) |
| |
Total | | $ | 422,931,031 | | | $ | 8,321,080 | | | $ | 112 | | | $ | 431,252,223 | |
| |
International Equity | | | | | | | | | | | | | | | | |
Equity investments: | | | | | | | | | | | | | | | | |
Asia | | $ | — | | | $ | 17,656,120 | | | $ | — | | | $ | 17,656,120 | |
Europe | | | — | | | | 61,983,985 | | | | — | | | | 61,983,985 | |
All other equity investments* | | | 131,516 | | | | 2,170,396 | | | | — | | | | 2,301,912 | |
Short-term investments | | | 2,244,124 | | | | 4,670,000 | | | | — | | | | 6,914,124 | |
| |
Total | | $ | 2,375,640 | | | $ | 86,480,501 | | | $ | — | | | $ | 88,856,141 | |
| |
Bond | | | | | | | | | | | | | | | | |
Bank loan obligations | | $ | — | | | $ | 2,906,542 | | | $ | — | | | $ | 2,906,542 | |
Corporate bonds | | | — | | | | 71,645,822 | | | | 65,815 | | | | 71,711,637 | |
Government bonds | | | — | | | | 64,492,890 | | | | — | | | | 64,492,890 | |
Structured assets | | | — | | | | 42,979,197 | | | | 2,004 | | | | 42,981,201 | |
Preferred stocks | | | 158,610 | | | | — | | | | — | | | | 158,610 | |
Short-term investments | | | — | | | | 5,980,000 | | | | — | | | | 5,980,000 | |
| |
Total | | $ | 158,610 | | | $ | 188,004,451 | | | $ | 67,819 | | | $ | 188,230,880 | |
| |
| * | | For detailed categories, see the accompanying Summary portfolio of investments. |
| ** | | Derivative instruments, excluding purchased options, are not reflected in the market value of portfolio investments. |
Note 3—derivative instruments
As defined by U.S. GAAP, a derivative is a financial instrument whose value is derived from an underlying security price, foreign exchange rate, interest rate, index of prices or rates, or other variables. Derivatives require little or no initial investment and permit or require net settlement. The Funds value derivatives at fair value.
| | | | |
| TIAA-CREF Life Funds § 2018 Annual Report | | | 115 | |
| | |
| Notes to financial statements | | |
At December 31, 2018, the following Funds have invested in derivative contracts which are reflected in the Statements of Assets and Liabilities as follows:
| | | | | | | | | | | | | | | | | | | | |
| | | Assets derivatives | | | | | | Liabilities derivatives | |
| Derivative contract | | Location | | | Fair value
amount | | | | | | Location | | | Fair value
amount | |
| |
Growth Equity Fund | | | | | | | | | | | | | | | | | | | | |
Equity contracts | | | | | | | | | | | | | | | Written options | | | $ | (2,470 | ) |
| |
Growth & Income Fund | | | | | | | | | | | | | | | | | | | | |
Equity contracts | | | Portfolio investments | | | $ | 15 | | | | | | | | Written options | | | | (477,235 | ) |
| |
Social Choice Equity Fund | | | | | | | | | | | | | | | | | | | | |
Equity contracts | | | Futures contracts | * | | | (25,153 | ) | | | | | | | | | | | | |
| |
Stock Index Fund | | | | | | | | | | | | | | | | | | | | |
Equity contracts | | | Futures contracts | * | | | (267,111 | ) | | | | | | | | | | | | |
| |
| * | | The fair value presented includes cumulative gain (loss) on open futures contracts; however, the value reflected in the accompanying Statements of Assets and Liabilities is only the receivable or payable for variation margin on open futures contracts. |
For the year ended December 31, 2018, the effect of derivative contracts on the Funds’ Statements of Operations was as follows:
| | | | | | | | | | | | |
| Derivative contract | | Location | | | Realized
gain (loss) | | | Change in
unrealized appreciation
(depreciation) | |
| |
Growth Equity Fund | | | | | | | | | | | | |
Equity contracts | | | Purchased options | | | $ | (148,664 | ) | | $ | 131,044 | |
Equity contracts | | | Written options | | | | (204,610 | ) | | | (20,049 | ) |
| |
Growth & Income Fund | | | | | | | | | | | | |
Equity contracts | | | Purchased options | | | | (745 | ) | | | 4,577 | |
Equity contracts | | | Written options | | | | (112,036 | ) | | | (159,414 | ) |
| |
Small-Cap Equity Fund | | | | | | | | | | | | |
Equity contracts | | | Futures contracts | | | | 17,790 | | | | (7,578 | ) |
Equity contracts | | | Swap contracts | | | | (10,434 | ) | | | — | |
| |
Social Choice Equity Fund | | | | | | | | | |
Equity contracts | | | Futures contracts | | | | (30,920 | ) | | | (29,457 | ) |
| |
Stock Index Fund | | | | | | | | | | | | |
Equity contracts | | | Futures contracts | | | | (292,556 | ) | | | (310,350 | ) |
| |
Bond Fund | | | | | | | | | | | | |
Credit contracts | | | Swap contracts | | | | (59,052 | ) | | | — | |
| |
| | |
| 116 | | 2018 Annual Report § TIAA-CREF Life Funds |
Futures contracts: Certain Funds are subject to equity price risk in the normal course of pursuing their investment objectives. The Funds use futures contracts to manage exposure to the equity markets and for cash management purposes to remain highly invested in these markets while minimizing transaction costs. Buying futures contracts tends to increase exposure to the underlying instrument/index, while selling futures contracts tends to decrease exposure to the underlying instrument/index or hedge other investments. Initial margin deposits are made upon entering into a futures contract, and variation margin receipts or payments are settled daily reflecting changes in the value of the futures contracts. Daily changes in the value of such contracts are reflected in net unrealized gains and losses. Gains or losses are realized upon the expiration or closing of the futures contracts or if the counterparties do not perform in accordance with contractual provisions. With futures contracts, there is minimal counterparty credit risk to the Funds since futures contracts are exchange-traded and the exchange’s clearinghouse, as counterparty to all exchange-traded funds, guarantees the futures contracts against default. During the year ended December 31, 2018, the Small-Cap Equity Fund, the Social Choice Equity Fund and the Stock Index Fund had exposure to futures contracts, based on underlying notional values, generally between 0% and 2% of net assets. The futures contracts outstanding as of December 31, 2018 are disclosed in the summary portfolio of investments and the full Schedules of Investments.
Options: Certain Funds are subject to equity price risk in the normal course of pursuing their investment objectives. Options can be settled either directly with the counterparty (over the counter) or through a central clearing house (exchange traded). To manage the risk, the Funds may invest in both equity and index options. The Funds use options contracts for hedging and cash management purposes and to seek to increase total return. Call and put equity options give the holder the right, in return for a premium paid, to purchase or sell, respectively, a security at a specified exercise price at any time during the period of the option. Index options are written or purchased options in which the underlying investment is a specified index. The exercise of an index option will not result in the physical delivery of the underlier, but a cash transfer of the difference between the settlement price of the underlier and the strike price of the option. Purchased options are included in the summary portfolio of investments, and written options are separately reflected as a liability in the Statements of Assets and Liabilities. Premiums on unexercised, expired options are recorded as realized gains or losses; premiums on exercised options are recorded as an adjustment to the proceeds from the sale or cost of the purchase. The difference between the premium and the amount received or paid in a closing transaction is also treated as a realized gain or loss. Risks may arise upon entering into over the counter options from the potential of default by counterparty. Also, risks related to the use of options include possible illiquidity of the options markets, price movements in underlying security values, and losses that may exceed amounts recognized on the Statements of Assets and Liabilities. During the year ended December 31, 2018, the Growth Equity Fund and the Growth & Income Fund had exposure to options, based on underlying notional values,
| | | | |
| TIAA-CREF Life Funds § 2018 Annual Report | | | 117 | |
| | |
| Notes to financial statements | | |
generally between 0% and 7% of net assets. The purchased and written options outstanding as of December 31, 2018 are disclosed in the summary portfolio of investments and the full Schedules of Investments.
Total return swap contracts:Total return swaps are agreements that provide a Fund with a return based on the performance of an underlying asset, in exchange for fee payments to a counterparty based on a specific rate. To the extent the total return of the reference security or index underlying the total return swap exceeds or falls short of the offsetting interest rate obligation, the Fund will receive a payment or make a payment to the counterparty, respectively. Payments received or made at the end of each measurement period are recorded as a realized gain or loss in the Statements of Operations. The swap is valued daily and any change in the value of the swap is reflected separately as a change in unrealized appreciation (depreciation) in the Statements of Operations. The value of the swap contract is reflected in unrealized appreciation (depreciation) on swap agreements in the Statements of Assets and Liabilities. Total return swaps are exposed to the market risk factor of the specific underlying financial instrument or index. Additional risks to the Fund include the possibility that there is no liquid market for these agreements or that the counterparty may default on its obligation to perform. The Fund’s maximum loss from counterparty risk is the fair value of the contract. Certain Funds may invest in total return swaps to gain or hedge exposure to the underlying reference assets. During the year ended December 31, 2018, theSmall-Cap Equity Fund had exposure to total return swaps, based on underlying notional amounts, generally between 0% and 1% of net assets. There are no total return swap contracts outstanding as of December 31, 2018.
Credit default swap contracts:Certain Funds are subject to credit risk in the normal course of pursuing their investment objectives. Credit default swaps can be settled either directly with the counterparty (bilateral) or through a central clearinghouse (centrally cleared). A credit default swap is a contract between a buyer and a seller of protection against predefined credit events for the reference entity. As a seller in a credit default swap contract, the Funds are required to pay an agreed upon amount to the counterparty with the occurrence of a specified credit event, such as certain bankruptcies related to an underlying credit instrument, index, or issuer which would likely result in a loss to the Funds. The agreed upon amount approximates the notional value of the swap and is estimated to be the maximum potential future payment that the Funds could be required to make under the contract. In return, the Funds receive from the counterparty a periodic stream of payments over the term of the contract provided that no credit event has occurred. If no credit event occurs, the Funds keep the stream of payments with no payment obligations. When the Funds sell a credit default swap contract it will cover its commitment. This may be achieved by, among other methods, maintaining cash or liquid assets in a segregated account equal to the aggregate notional value of the reference entities for all outstanding credit default swap contracts sold by the Funds.
| | |
| 118 | | 2018 Annual Report § TIAA-CREF Life Funds |
Certain Funds may also buy credit default swap contracts, in which case the Funds function as the counterparty referenced above. This involves the risk that the contract may expire worthless. Bilateral swaps involve counterparty risk that the seller may fail to satisfy its payment obligations to the Funds with the occurrence of a credit event. Centrally cleared swaps have minimal counterparty credit risk to the Funds as they are entered into with a central clearinghouse which guarantees the swap against default.
The value of a bilateral swap included in net assets is the unrealized gain or loss of the contract plus or minus any unamortized premiums paid or received, respectively. Appreciated swaps and premiums paid are reflected as assets, while depreciated swaps and premiums received are reflected as liabilities on the Statements of Assets and Liabilities. For centrally cleared swaps, initial margin deposits are made, and variation margin payments are made or received reflecting daily changes in the value of the swap contract. The daily fluctuation in fair value is accounted for as a variation margin receivable or payable on the Statements of Assets and Liabilities.
Under the terms of the credit default swap contracts, the Funds receive or make quarterly payments based on a payment rate on a fixed notional amount. These payments are recorded as a realized gain or loss in the Statements of Operations. Payments received or made as a result of a credit event or termination of the contract are recognized as realized gains or losses. Daily changes in the value of such contracts are reflected in net unrealized gains and losses.
The Funds (other than the Money Market Fund) invest in credit default swaps to hedge or manage the risks associated with assets held in the Funds and/or to facilitate the implementation of portfolio strategies to seek to increase the total return. During the year ended December 31, 2018, the Bond Fund had exposure to credit default swap contracts, based on underlying notional values, generally between 0% and 1% of net assets. There are no credit default swap contracts outstanding as of December 31, 2018.
Note 4—investment adviser and affiliates
Teachers Advisors, LLC (“Advisors”), a wholly owned subsidiary of Teachers Insurance and Annuity Association of America (“TIAA”) and a registered investment adviser, provides investment advisory services for the Funds pursuant to an Investment Advisory Agreement between Advisors and the Funds. The Funds have also entered into an Administrative Service Agreement with Advisors under which the Funds pay Advisors for its costs in providing certain administrative and compliance services to the Funds.
Teachers Personal Investors Services, Inc. (“TPIS”), which is a wholly owned indirect subsidiary of TIAA, distributes the Funds’ shares. Under the terms of the distribution agreement, TPIS is not compensated. TPIS does not currently enter into agreements, or otherwise pay, other intermediaries to sell shares of the Funds.
| | | | |
| TIAA-CREF Life Funds § 2018 Annual Report | | | 119 | |
| | |
| Notes to financial statements | | |
As part of the Advisory Agreement, Advisors has agreed to reimburse each Fund if its total expense ratio (excluding interest, taxes, brokerage and other transactional expenses, Acquired fund fees and expenses and extraordinary expenses) exceeds certain percentages. As of December 31, 2018, the investment management fees and maximum expense amounts (after waivers and reimbursements) are equal to the following noted annual percentage of average daily net assets:
| | | | | | | | |
| Fund | | Investment management fee | | | Maximum expense amounts* | |
| |
Growth Equity | | | 0.45% | | | | 0.52% | |
Growth & Income | | | 0.45% | | | | 0.52% | |
Large-Cap Value | | | 0.45% | | | | 0.52% | |
Real Estate Securities | | | 0.50% | | | | 0.57% | |
Small-Cap Equity | | | 0.46% | | | | 0.53% | |
Social Choice Equity | | | 0.15% | | | | 0.22% | |
Stock Index | | | 0.06% | | | | 0.09% | |
International Equity | | | 0.50% | | | | 0.60% | |
Bond | | | 0.30% | | | | 0.35% | |
Money Market | | | 0.10% | | | | 0.15% | |
Balanced | | | 0.10% | | | | 0.10% | |
| |
| * | | Maximum expense amounts reflect all expenses excluding interest, taxes, brokerage and other transactional expenses, acquired fund fees and expenses and extraordinary expenses. The expense reimbursement arrangements will continue through at least April 30, 2019. The reimbursement arrangements can only be changed with the approval of the Board of Trustees. |
Income, reflected in Payment from affiliate on the Statement of Operations, reflects voluntary compensation from Advisors in amounts that approximate a portion of the cost of research services obtained from broker-dealers and research providers if Advisors had purchased the research services directly.
The Funds may purchase or sell investment securities in transactions with affiliated entities under procedures adopted by the Board, pursuant to the 1940 Act. These transactions are effected at market rates without incurring broker commissions. For the year ended December 31, 2018, the Funds engaged in the following security transactions with affiliated entities:
| | | | | | | | | | | | |
| Fund | | Purchases | | | Sales | | | Realized
gain (loss) | |
| |
Growth Equity | | $ | 438,501 | | | $ | 508,916 | | | $ | 52,328 | |
Growth & Income | | | 207,276 | | | | 466,839 | | | | 29,302 | |
Large-Cap Value | | | 1,023,114 | | | | 3,125,776 | | | | 73,660 | |
Real Estate Securities | | | 83,950 | | | | 193,654 | | | | 18,191 | |
Small-Cap Equity | | | 43,966 | | | | 589,914 | | | | 179,428 | |
Social Choice Equity | | | 440,805 | | | | 89,780 | | | | 10,921 | |
Stock Index | | | 121,939 | | | | 41,836 | | | | 16,562 | |
International Equity | | | 87,101 | | | | 88,014 | | | | (5,968 | ) |
| |
| | |
| 120 | | 2018 Annual Report § TIAA-CREF Life Funds |
Certain registered separate accounts of TIAA-CREF Life, which is a wholly owned subsidiary of TIAA, have varioussub-accounts which invest in the Funds.
Additionally, at the commencement of operations of each Fund, TIAA, an affiliate, invested in each Fund. During the year ended December 31, 2018, there were no redemptions.
The following is the percentage of the Funds’ shares owned by affiliates and the Balanced Fund as of December 31, 2018:
| | | | | | | | | | | | |
| Underlying Fund | | Investments in
funds held by
TIAA-CREF Life | | | Investments
in funds held by
Life Balanced | | | Total | |
| |
Growth Equity | | | 95 | % | | | 5 | % | | | 100 | % |
Growth & Income | | | 96 | | | | 4 | | | | 100 | |
Large-Cap Value | | | 92 | | | | 8 | | | | 100 | |
Real Estate Securities | | | 98 | | | | 2 | | | | 100 | |
Small-Cap Equity | | | 98 | | | | 2 | | | | 100 | |
Social Choice Equity | | | 100 | | | | — | | | | 100 | |
Stock Index | | | 99 | | | | 1 | | | | 100 | |
International Equity | | | 93 | | | | 7 | | | | 100 | |
Bond | | | 85 | | | | 15 | | | | 100 | |
Money Market | | | 100 | | | | — | | | | 100 | |
Balanced | | | 100 | | | | — | | | | 100 | |
| |
Investments in other investment companies advised by Advisors are deemed to be affiliated investments. The Balanced Fund invests its assets in shares of the affiliated TIAA-CREF Life Funds. Information regarding transactions with affiliated companies is as follows (dollar amounts are in thousands):
| | | | | | | | | | | | | | | | | | | | | | | | | | | | |
| Issue | | Value at
12/31/17 | | | Purchase
cost | | | Sales
proceeds | | | Realized
gain
(loss) | | | Change in
unrealized
appreciation
(depreciation) | | | Dividend
income | | | Value at
12/31/18 | |
| |
TIAA-CREF Life Balanced Fund | |
| TIAA-CREF Life Funds: | | | | | | | | | | | | | |
Growth Equity | | $ | 5,379 | | | $ | 1,208 | | | $ | 1,400 | | | $ | 543 | | | $ | (465 | ) | | $ | 18 | | | $ | 4,940 | |
Growth & Income | | | 5,936 | | | | 1,407 | | | | 996 | | | | 455 | | | | (874 | ) | | | 53 | | | | 5,560 | |
Large-Cap Value | | | 5,300 | | | | 1,744 | | | | 747 | | | | 414 | | | | (1,250 | ) | | | 76 | | | | 5,062 | |
Real Estate Securities | | | 1,193 | | | | 493 | | | | 481 | | | | 41 | | | | (100 | ) | | | 24 | | | | 1,103 | |
Small Cap Equity | | | 1,183 | | | | 391 | | | | 197 | | | | 138 | | | | (281 | ) | | | 7 | | | | 1,109 | |
Stock Index | | | 4,736 | | | | 804 | | | | 773 | | | | 105 | | | | (385 | ) | | | 76 | | | | 4,453 | |
International Equity | | | 5,947 | | | | 1,950 | | | | 673 | | | | 50 | | | | (1,670 | ) | | | 67 | | | | 5,604 | |
Bond | | | 29,621 | | | | 5,136 | | | | 5,070 | | | | (186 | ) | | | (876 | ) | | | 813 | | | | 28,625 | |
| |
| | $ | 59,295 | | | $ | 13,133 | | | $ | 10,337 | | | $ | 1,560 | | | $ | (5,901 | ) | | $ | 1,134 | | | $ | 56,456 | |
| |
| | | | |
| TIAA-CREF Life Funds § 2018 Annual Report | | | 121 | |
| | |
| Notes to financial statements | | |
Note 5—investments
Securities lending: Certain Funds may lend their securities to qualified institutional borrowers to earn additional income. A Fund receives collateral (in the form of cash, Treasury securities or other collateral permitted by applicable law) against the loaned securities and maintains collateral in an amount not less than 100% of the market value of loaned securities during the period of the loan; any additional collateral required due to changes in security values is delivered to the Fund the next business day. Cash collateral received by the Fund will generally be invested in high-quality short-term instruments or in one or more funds maintained by the securities lending agent (“Agent”) for the purpose of investing cash collateral. The value of the loaned securities and the liability to return the cash collateral received are reflected in the Statements of Assets and Liabilities. As of December 31, 2018, securities lending transactions are for equity securities, and the resulting loans are continuous, can be recalled at any time, and have no set maturity. Securities lending income recognized by the Funds consists of earnings on invested collateral and lending fees, net of any rebates to the borrower and compensation to the Agent. Such income is reflected separately in the Statements of Operations. In lending its securities, a Fund bears the market risk with respect to the investment of collateral and the risk that the Agent may default on its contractual obligations to the Fund. The Agent bears the risk that the borrower may default on its obligation to return the loaned securities as the Agent is contractually obligated to indemnify the Fund if at the time of a default by a borrower some or all of the loan securities have not been returned.
Securities purchased on a when-issued or delayed-delivery basis: The Funds may purchase securities on a when-issued or delayed-delivery basis. Securities purchased or sold on a when-issued or delayed-delivery basis may be settled a month or more after trade date; interest income is not accrued until settlement date. At the time a Fund enters into such transactions, it is required to have segregated assets with a current value at least equal to the amount of its when-issued or delayed-delivery purchase commitments. Amounts receivable and/or payable for these transactions are reflected separately in the Statements of Assets and Liabilities.
Mortgage dollar roll transactions: Some of the Funds may enter into mortgage dollar rolls in which a Fund sells mortgage securities for delivery in the current month, realizing a gain (loss), and simultaneously contracts to repurchase similar securities on a specified future date. During the roll period, a Fund forgoes principal and interest paid on the securities. The Fund is compensated by the interest earned on the cash proceeds of the initial sale and by the lower repurchase price at the future date. The difference between the sales proceeds and the lower repurchase price is recorded as a realized gain. The Fund maintains a segregated account, the dollar value of which is at least equal to its obligations with respect to dollar rolls.
Restricted securities: Restricted securities held by the Funds, if any, may not be sold except in exempt transactions or in a public offering registered under the Securities Act of 1933. The risk of investing in such securities is generally greater than the risk of investing in securities that are widely held and publicly traded.
| | |
| 122 | | 2018 Annual Report § TIAA-CREF Life Funds |
Unfunded loan commitment: The Funds may enter into loan commitments to fund a portion of a delayed-draw term loan facility. The Funds are obligated to fund loan commitments at the borrower’s discretion. The Funds reserve against such contingent obligation by segregating short-term securities or cash. At December 31, 2018, there were no outstanding unfunded loan commitments. Unfunded loan commitments are marked-to-market daily and any unrealized appreciation (depreciation) is included as an asset (liability) on the Statements of Assets and Liabilities. Interest income and the change in unrealized appreciation (depreciation) are included on the Statements of Operations.
Net unrealized appreciation (depreciation): At December 31, 2018, net unrealized appreciation (depreciation) based on the aggregate cost of all investments for federal income tax purposes, consisting of gross unrealized appreciation and gross unrealized depreciation, was as follows:
| | | | | | | | | | | | | | | | |
| Fund | | Tax cost | | | Gross
unrealized
appreciation | | | Gross
unrealized
(depreciation) | | | Net unrealized
appreciation
(depreciation) | |
| |
Growth Equity | | $ | 72,846,613 | | | $ | 28,599,702 | | | $ | (3,311,419 | ) | | $ | 25,288,283 | |
Growth & Income | | | 102,791,212 | | | | 33,585,994 | | | | (5,507,056 | ) | | | 28,078,938 | |
Large-Cap Value | | | 62,482,815 | | | | 3,869,409 | | | | (3,598,523 | ) | | | 270,886 | |
Real Estate Securities | | | 53,214,026 | | | | 15,153,915 | | | | (1,489,523 | ) | | | 13,664,392 | |
Small-Cap Equity | | | 49,458,231 | | | | 4,618,750 | | | | (7,364,910 | ) | | | (2,746,160 | ) |
Social Choice Equity | | | 43,329,857 | | | | 16,490,368 | | | | (3,689,185 | ) | | | 12,801,183 | |
Stock Index | | | 249,512,377 | | | | 198,714,945 | | | | (16,975,099 | ) | | | 181,739,846 | |
International Equity | | | 106,224,471 | | | | 1,658,364 | | | | (19,026,694 | ) | | | (17,368,330 | ) |
Bond | | | 192,229,709 | | | | 692,937 | | | | (4,691,766 | ) | | | (3,998,829 | ) |
Balanced | | | 56,533,547 | | | | 1,358,559 | | | | (1,436,148 | ) | | | (77,589 | ) |
For purposes of this disclosure, tax cost generally includes the cost of portfolio investments as well as up-front fees or premiums exchanged on derivatives and any amounts unrealized for income statement reporting but realized in income and/or capital gains for tax reporting.
Purchases and sales: Purchases and sales of securities (other than short-term instruments) for all of the Funds for the year ended December 31, 2018 were as follows:
| | | | | | | | | | | | | | | | |
| Fund | | Non-U.S.
government
purchases | | | U.S.
government
purchases | | | Non-U.S.
government
sales | | | U.S.
government
sales | |
| |
Growth Equity | | $ | 98,477,276 | | | $ | — | | | $ | 96,148,321 | | | $ | — | |
Growth & Income | | | 90,138,631 | | | | — | | | | 95,668,791 | | | | — | |
Large-Cap Value | | | 78,605,243 | | | | — | | | | 81,198,321 | | | | — | |
Real Estate Securities | | | 23,836,269 | | | | — | | | | 27,961,860 | | | | — | |
Small-Cap Equity | | | 48,121,442 | | | | — | | | | 53,223,978 | | | | — | |
Social Choice Equity | | | 22,998,001 | | | | — | | | | 24,828,118 | | | | — | |
Stock Index | | | 32,995,456 | | | | — | | | | 19,052,636 | | | | — | |
International Equity | | | 70,572,062 | | | | — | | | | 74,497,768 | | | | — | |
Bond | | | 77,990,118 | | | | 201,503,489 | | | | 61,733,972 | | | | 212,885,473 | |
Balanced | | | 13,133,681 | | | | — | | | | 10,337,276 | | | | — | |
| |
| | | | |
| TIAA-CREF Life Funds § 2018 Annual Report | | | 123 | |
| | |
| Notes to financial statements | | |
Note 6—distributions to shareholders and other tax items
The tax character of distributions paid to shareholders during the years ended December 31, 2018 and December 31, 2017 was as follows:
| | | | | | | | | | | | | | | | | | | | | | | | | | | | |
| | | 2018 | | | | | | 2017 | |
| Fund | | Ordinary
income | | | Long-term
capital gains | | | Total | | | | | | Ordinary
income* | | | Long-term
capital gains | | | Total | |
| |
Growth Equity | | $ | 1,931,191 | | | $ | 5,231,304 | | | $ | 7,162,495 | | | | | | | $ | — | | | $ | 1,338,467 | | | $ | 1,338,467 | |
Growth & Income | | | 2,948,877 | | | | 7,648,071 | | | | 10,596,948 | | | | | | | | — | | | | 928,401 | | | | 928,401 | |
Large-Cap Value | | | 2,392,998 | | | | 4,094,386 | | | | 6,487,384 | | | | | | | | — | | | | 302,191 | | | | 302,191 | |
Real Estate Securities | | | 1,420,413 | | | | 2,561,764 | | | | 3,982,177 | | | | | | | | — | | | | 1,962,261 | | | | 1,962,261 | |
Small-Cap Equity | | | 2,135,741 | | | | 4,279,003 | | | | 6,414,744 | | | | | | | | — | | | | 1,162,850 | | | | 1,162,850 | |
Social Choice Equity | | | 1,341,082 | | | | 2,603,696 | | | | 3,944,778 | | | | | | | | 6,835 | | | | 208,722 | | | | 215,557 | |
Stock Index | | | 8,238,101 | | | | 2,629,290 | | | | 10,867,391 | | | | | | | | — | | | | 421,541 | | | | 421,541 | |
International Equity | | | 1,123,383 | | | | — | | | | 1,123,383 | | | | | | | | 1,210,511 | | | | — | | | | 1,210,511 | |
Bond | | | 5,057,919 | | | | — | | | | 5,057,919 | | | | | | | | 37,244 | | | | — | | | | 37,244 | |
Money Market | | | 1,510,779 | | | | — | | | | 1,510,779 | | | | | | | | 583,742 | | | | — | | | | 583,742 | |
Balanced Fund | | | 111,207 | | | | 197,104 | | | | 308,311 | | | | | | | | — | | | | 564,726 | | | | 564,726 | |
| |
| * | | Starting in 2017, the funds changed the timing of annual distributions from December to September. In September 2017, the Funds distributed any undistributed ordinary income and undistributed net capital gains, if any, as of the prior fiscal year end. |
As of December 31, 2018, the components of accumulated earnings on a tax basis were as follows:
| | | | | | | | | | | | | | | | | | | | |
| Fund | | Undistributed
ordinary income | | | Undistributed
long-term
capital gains | | | Unrealized
appreciation
(depreciation) | | | Capital loss
carryover | | | Total | |
| |
Growth Equity | | $ | 468,024 | | | $ | 9,384,150 | | | $ | 25,288,579 | | | $ | — | | | $ | 35,140,753 | |
Growth & Income | | | 1,492,431 | | | | 8,964,055 | | | | 28,078,801 | | | | | | | | 38,535,287 | |
Large-Cap Value | | | 1,161,960 | | | | 3,326,472 | | | | 270,884 | | | | — | | | | 4,759,316 | |
Real Estate Securities | | | 1,889,034 | | | | 1,058,963 | | | | 13,664,394 | | | | — | | | | 16,612,391 | |
Small-Cap Equity | | | 2,158,059 | | | | 5,297,315 | | | | (2,746,167 | ) | | | — | | | | 4,709,207 | |
Social Choice Equity | | | 1,191,188 | | | | 8,569,562 | | | | 12,801,180 | | | | — | | | | 22,561,930 | |
Stock Index | | | 8,916,645 | | | | 3,860,355 | | | | 181,739,832 | | | | — | | | | 194,516,832 | |
International Equity | | | 2,028,124 | | | | 4,529,229 | | | | (17,371,814 | ) | | | — | | | | (10,814,461 | ) |
Bond | | | 5,808,841 | | | | — | | | | (3,998,978 | ) | | | (2,317,588 | ) | | | (507,725 | ) |
Balanced | | | 1,455,274 | | | | 1,302,641 | | | | (77,588 | ) | | | — | | | | 2,680,327 | |
| |
The difference between book basis and tax basis net investment income, net realized gains and losses, and unrealized appreciation and depreciation is attributable primarily to the tax deferral of losses on wash sales, tax deferral of straddle losses, the realization, for tax purposes, of unrealized gains on investments in passive foreign investment companies, and the treatment of short-term gain as ordinary income for tax purposes.
| | |
| 124 | | 2018 Annual Report § TIAA-CREF Life Funds |
At December 31, 2018, the following Funds had capital loss carryovers, which will expire as follows:
| | | | | | | | | | | | |
| | | Short-term | | | Long-term | | | Total | |
| |
Bond Fund | | $ | 1,528,262 | | | $ | 789,326 | | | $ | 2,317,588 | |
Money Market | | | 127 | | | | — | | | | 127 | |
| |
Note 7—inter-fund lending program
Pursuant to an exemptive order issued by the Commission, the Funds may participate in an inter-fund lending program. This program allows the Funds to lend cash to and/or borrow cash from certain other affiliated Funds for temporary purposes, (e.g., to satisfy redemption requests or to cover unanticipated cash shortfalls). The program is subject to a number of conditions, including the requirement that no Fund may borrow or lend money under the program unless it receives a more favorable interest rate than is available from a bank or other financial institution for a comparable transaction. In addition, a Fund may participate in the program only if its participation is consistent with the Fund’s investment policies and limitations and authorized by its portfolio manager(s). During the year ended December 31, 2018, there were no inter-fund borrowing or lending transactions.
Note 8—line of credit
Each of the Funds, except the Money Market Fund, participates in a $1.25 billion unsecured revolving credit facility that can be used for temporary purposes, including, without limitation, the funding of shareholder redemptions. The current facility was entered into on June 19, 2018 expiring on June 18, 2019, replacing the previous $1.5 billion facility, which expired June 2018. Certain affiliated accounts and mutual funds, each of which is managed by Advisors, or an affiliate of Advisors, also participate in this facility. An annual commitment fee for the credit facility is borne by the participating accounts and mutual funds on a pro rata basis. Interest associated with any borrowing under the facility is charged to the borrowing accounts or mutual funds at a specified rate of interest. The Funds are not liable for borrowings under the facility by other affiliated accounts or mutual funds. For the year ended December 31, 2018, there were no borrowings under this credit facility by the Funds.
| | | | |
| TIAA-CREF Life Funds § 2018 Annual Report | | | 125 | |
| | |
| Notes to financial statements | | concluded |
Note 9—share split
Effective October 25, 2017, the Growth Equity Fund, Growth & Income Fund, International Equity Fund,Large-Cap Value Fund, Real Estate Securities Fund,Small-Cap Equity Fund, Social Choice Equity Fund, Stock Index Fund, and the Bond Fund underwent a5-for-2 share split. The effect of the share split transaction was to multiply the number of outstanding shares of the Funds by the split factor, with a corresponding decrease in the net asset value per share. These transactions did not change the net assets of the Funds or the value of a shareholder’s investment. The historical share transactions presented in the Statements of Changes in Net Assets and per share data presented in the Financial Highlights have been adjusted retroactively to give effect to the share splits.
Note 10—indemnification
In the normal course of business, each Fund enters into contracts that contain a variety of representations and warranties and that provide general indemnities. A Fund’s maximum exposure under these arrangements is unknown, as this would involve future claims against the Fund that have not yet occurred. Also, under the Funds’ organizational documents, the trustees and officers of the Funds are indemnified against certain liabilities that may arise out of their duties to the Funds. However, based on experience, the Funds expect the risk of loss due to these warranties and indemnities to be unlikely.
Note 11—legal proceedings
The Social Choice Equity Fund was named as defendant and a putative member of the proposed defendant class of shareholders, or could be added as a defendant, in pending litigation by the Bankruptcy Litigation Trustee for the Tribune Company (Tribune) and certain creditors of Tribune, as a result of its ownership of shares of Tribune in 2007 when Tribune effected a leveraged buyout transaction (LBO) and was converted to a privately held company. The plaintiffs in that litigation seek to recover payments of the proceeds of the LBO. The litigation is now part of a multi-district litigation proceeding in the Southern District of New York and the Second Court of Appeals. The Fund’s exposure related to this matter is estimated to be 0.20% of net assets as of December 31, 2018.
| | |
| 126 | | 2018 Annual Report § TIAA-CREF Life Funds |
| | |
Report of independent registered
public accounting firm | | |
To the Board of Trustees of TIAA-CREF Life Funds and Shareholders of Growth Equity Fund, Growth & Income Fund, Large-Cap Value Fund, Real Estate Securities Fund, Small-Cap Equity Fund, Social Choice Equity Fund, Stock Index Fund, International Equity Fund, Bond Fund, Money Market Fund and Balanced Fund
Opinions on the Financial Statements
We have audited the accompanying statements of assets and liabilities, including the summary portfolios of investments, of Growth Equity Fund, Growth & Income Fund, Large-Cap Value Fund, Real Estate Securities Fund, Small-Cap Equity Fund, Social Choice Equity Fund, Stock Index Fund, International Equity Fund, Bond Fund, Money Market Fund and portfolio of investments, of Balanced Fund, (constituting TIAA-CREF Life Funds, hereafter collectively referred to as the “Funds”) as of December 31, 2018, the related statements of operations for the year ended December 31, 2018, the statements of changes in net assets for each of the two years in the period ended December 31, 2018, including the related notes, and the financial highlights for each of the periods indicated therein (collectively referred to as the “financial statements”). In our opinion, the financial statements present fairly, in all material respects, the financial position of each of the Funds as of December 31, 2018, the results of each of their operations for the year then ended, the changes in each of their net assets for each of the two years in the period ended December 31, 2018 and each of the financial highlights for each of the periods indicated therein in conformity with accounting principles generally accepted in the United States of America.
Basis for Opinions
These financial statements are the responsibility of the Funds’ management. Our responsibility is to express an opinion on the Funds’ financial statements based on our audits. We are a public accounting firm registered with the Public Company Accounting Oversight Board (United States) (“PCAOB”) and are required to be independent with respect to the Funds in accordance with the U.S. federal securities laws and the applicable rules and regulations of the Securities and Exchange Commission and the PCAOB.
We conducted our audits of these financial statements in accordance with the standards of the PCAOB. Those standards require that we plan and perform the audit to obtain reasonable assurance about whether the financial statements are free of material misstatement, whether due to error or fraud.
Our audits included performing procedures to assess the risks of material misstatement of the financial statements, whether due to error or fraud, and performing procedures that respond to those risks. Such procedures included examining, on a test basis, evidence regarding the amounts and disclosures in the financial statements. Our audits also included evaluating the accounting principles used and significant estimates made by management, as well as evaluating the
| | | | |
| TIAA-CREF Life Funds § 2018 Annual Report | | | 127 | |
| | |
Report of independent registered
public accounting firm | | concluded |
overall presentation of the financial statements. Our procedures included confirmation of securities owned as of December 31, 2018 by correspondence with the custodian, transfer agent and brokers; when replies were not received from brokers, we performed other auditing procedures. We believe that our audits provide a reasonable basis for our opinions.

PricewaterhouseCoopers LLP
Baltimore, Maryland
February 20, 2019
We have served as the auditor of one or more investment companies in TIAA-CREF Funds’ investment company group since 2005.
| | |
| 128 | | 2018 Annual Report § TIAA-CREF Life Funds |
| | |
| Important tax information(unaudited) | | |
TIAA-CREF Life Funds
For the fiscal year ended December 31, 2018, the TIAA-CREF Life Funds designate the following distribution amounts (or the maximum amount allowable) as being from Section 1250 gains and net long-term capital gains.
| | | | | | | | | | | | |
| Fund | | Section 1250
gains | | | Long-term
capital gains | | | Total | |
| |
Growth Equity | | $ | — | | | $ | 5,231,304 | | | $ | 5,231,304 | |
Growth & Income | | | — | | | | 7,648,071 | | | | 7,648,071 | |
Large-Cap Value | | | 251 | | | | 4,094,135 | | | | 4,094,386 | |
Real Estate Securities | | | — | | | | 2,561,764 | | | | 2,561,764 | |
Small-Cap Equity | | | 9,280 | | | | 4,269,723 | | | | 4,279,003 | |
Social Choice Equity | | | 3,489 | | | | 2,600,207 | | | | 2,603,696 | |
Stock Index | | | 25,065 | | | | 2,604,225 | | | | 2,629,290 | |
International Equity | | | — | | | | — | | | | — | |
Bond | | | — | | | | — | | | | — | |
Money Market | | | — | | | | — | | | | — | |
Balanced | | | — | | | | 197,104 | | | | 197,104 | |
| |
For the fiscal year ended December 31, 2018, the TIAA-CREF Life Funds designate the following percentages (or maximum amount allowable) of ordinary income dividends paid as qualifying for the corporate dividends received deduction.
| | | | |
| Fund | | Percentage | |
| |
Growth Equity | | | 37.47 | % |
Growth & Income | | | 60.78 | |
Large-Cap Value | | | 52.26 | |
Real Estate Securities | | | 1.48 | |
Small-Cap Equity | | | 21.36 | |
Social Choice Equity | | | 76.00 | |
Stock Index | | | 81.80 | |
International Equity | | | 0.00 | |
Balanced | | | 0.01 | |
| |
The TIAA-CREF Life International Equity Fund received income from foreign sources during the year ended December 31, 2018 of $2,534,805 ($0.20821 per share), and paid taxes to foreign countries during the year ended December 31, 2018 of $270,608 ($0.02223 per share).
| | | | |
| TIAA-CREF Life Funds § 2018 Annual Report | | | 129 | |
| | |
| Trustees and officers(unaudited) | | |
TIAA-CREF Life Funds § December 31, 2018
Trustees
| | | | | | | | | | |
Name, address and year of birth (“YOB”) | | Position(s) held with fund | | Term of office and length of time served | | Principal occupation(s) during past 5 years | | Number of
portfolios in
fund
complex
overseen by
trustee | | Other directorship(s) held by trustee |
Forrest Berkley c/o Corporate Secretary 730 Third Avenue New York, NY 10017-3206 YOB: 1954 | | Trustee | | Indefinite term. Trustee since 2006. | | Retired Partner (since 2006), Partner (1990–2005) and Head of Global Product Management (2003–2005), GMO (formerly, Grantham, Mayo, Van Otterloo & Co.) (investment management); and member of asset allocation portfolio management team, GMO (2003–2005). | | 89 | | Investment Committee member, Maine Community Foundation and the Elmina B. Sewall Foundation. |
Janice C. Eberly c/o Corporate Secretary 730 Third Avenue New York, NY 10017-3206 YOB: 1962 | | Trustee | | Indefinite term. Trustee since 2018. | | James R. and Helen D. Russell Professor of Finance at the Kellogg School of Management at Northwestern University (2002–2011 and since 2013) and Chair of the Finance Department (2005–2007). Assistant Secretary for Economic Policy, United States Department of the Treasury (2011 to 2013). | | 89 | | Member of the Board of the Office of Finance, Federal Home Loan Banks. |
Nancy A. Eckl c/o Corporate Secretary 730 Third Avenue New York, NY 10017-3206 YOB: 1962 | | Trustee | | Indefinite term. Trustee since 2007. | | Vice President (1990–2006), American Beacon Advisors, Inc., and Vice President of certain funds advised by American Beacon Advisors, Inc. | | 89 | | Independent Director, The Lazard Funds, Inc., Lazard Retirement Series, Inc., Lazard Global Total Return and Income Fund, Inc. and Lazard World Dividend & Income Fund, Inc. |
| | |
| 130 | | 2018 Annual Report § TIAA-CREF Life Funds |
| | | | | | | | | | |
Michael A. Forrester c/o Corporate Secretary 730 Third Avenue New York, NY 10017-3206 YOB: 1967 | | Trustee | | Indefinite term. Trustee since 2007. | | Chief Executive Officer (since 2014) and Chief Operating Officer (2007–2014), Copper Rock Capital Partners, LLC; Chief Operating Officer, DDJ Capital Management (2003–2006). | | 89 | | Director of Copper Rock Capital Partners, LLC (investment adviser). |
Howell E. Jackson c/o Corporate Secretary 730 Third Avenue New York, NY 10017-3206 YOB: 1954 | | Trustee | | Indefinite term. Trustee since 2005. | | James S. Reid, Jr. Professor of Law (since 2004), Senior Advisor to the President and Provost (2010–2012), Acting Dean (2009), Vice Dean for Budget (2003–2006) and on the faculty (since 1989) of Harvard Law School. | | 89 | | Director, Commonwealth. |
Thomas J. Kenny c/o Corporate Secretary 730 Third Avenue New York, NY 10017-3206 YOB: 1963 | | Chairman of the Board and Trustee | | Indefinite term. Trustee since 2011; Chairman for term ending July 1, 2021. Chairman since 2017. | | Advisory Director (2010–2011), Partner (2004–2010), Managing Director (1999–2004),Co-Head of Global Cash and Fixed Income Portfolio Management Team (2002–2010), Goldman Sachs Asset Management. | | 89 | | Director and Finance and Investment Committee Chair, Aflac Incorporated; Director and Investment Committee member, Sansum Clinic; Director, ParentSquare; Investment Committee member, Cottage Health System; Member, University of California at Santa Barbara Arts and Lectures Advisory Council. |
James M. Poterba c/o Corporate Secretary 730 Third Avenue New York, NY 10017-3206 YOB: 1958 | | Trustee | | Indefinite term. Trustee since 2006. | | President and Chief Executive Officer, National Bureau of Economic Research (“NBER”) (since 2008); Affiliated Faculty Member of the Finance Group at the Alfred P. Sloan School of Management, Massachusetts Institute of Technology (“MIT”) (since 2014); Mitsui Professor of Economics, MIT (since 1996); Head (2006–2008) and Associate Head (1994–2000 and 2001–2006), Economics Department of MIT; and Program Director, NBER (1990–2008). | | 89 | | Director, The Alfred P. Sloan Foundation and National Bureau of Economic Research; Member, Congressional Budget Office Panel of Economic Advisers. |
| | | | |
| TIAA-CREF Life Funds § 2018 Annual Report | | | 131 | |
| | |
| Trustees and officers(unaudited) | | continued |
TIAA-CREF Life Funds § December 31, 2018
Trustees—concluded
| | | | | | | | | | |
Name, address and year of birth (“YOB”) | | Position(s) held with fund | | Term of office and length of time served | | Principal occupation(s) during past 5 years | | Number of
portfolios in
fund
complex
overseen by
trustee | | Other directorship(s) held by trustee |
Maceo K. Sloan c/o Corporate Secretary 730 Third Avenue New York, NY 10017-3206 YOB: 1949 | | Trustee | | Indefinite term. Trustee since 2001. | | Chairman, President and Chief Executive Officer, Sloan Financial Group, Inc. (1991–2018); Chairman and Chief Executive Officer (1991–2016) and Chief Investment Officer (1991–2013) and Chief Compliance Officer (2015–2016), NCM Capital Management Group, Inc.; Chairman and Chief Executive Officer (2003–2016) and Chief Investment Officer (2003–2013) and Chief Compliance Officer (2015–2016), NCM Capital Advisers Inc.; and Chairman, President and Principal Executive Officer, NCM Capital Investment Trust (2007–2012). | | 89 | | N/A |
Laura T. Starks c/o Corporate Secretary 730 Third Avenue New York, NY 10017-3206 YOB: 1950 | | Trustee | | Indefinite term. Trustee since 2006. | | Charles E. and Sarah M. Seay Regents Chair in Finance (since 2002),Co-Executive Director of the Social Innovation Initiative (since 2015), Director of the AIM Investment Center (2000–2016), Associate Dean for Research (2011–2016), Chairman, Department of Finance, (2002–2011), and Professor, McCombs School of Business, University of Texas at Austin (since 1987). | | 89 | | Member of the Board of Governors of the Investment Company Institute, the Governing Council of Independent Directors Council (an association for mutual fund directors); and Investment Advisory Committee, Employees Retirement System of Texas. |
| | |
| 132 | | 2018 Annual Report § TIAA-CREF Life Funds |
Officers
| | | | | | |
Name, address and year of birth (“YOB”) | | Position(s) held with fund | | Term of office and length of time served | | Principal occupation(s) during past 5 years |
Vijay Advani TIAA 730 Third Avenue New York, NY 10017-3206 YOB: 1960 | | Executive Vice President | | One-year term. Executive Vice President since 2018. | | Chief Executive Officer, Nuveen. Executive Vice President of the College Retirement Equities Fund (“CREF”), TIAA Separate AccountVA-1, TIAA-CREF Funds and TIAA-CREF Life Funds (collectively, the “TIAA-CREF Fund Complex”). Prior to joining Nuveen, Mr. Advani served asCo-President of Franklin Resources, Inc.-Franklin Templeton Investments. |
Mona Bhalla TIAA 730 Third Avenue New York, NY 10017-3206 YOB: 1969 | | Senior Managing Director and Corporate Secretary | | One-year term. Senior Managing Director and Corporate Secretary since 2017. | | Senior Managing Director and Corporate Secretary of Teachers Insurance and Annuity Association of America (“TIAA”) and the TIAA-CREF Fund Complex. Prior to joining TIAA, Ms. Bhalla served as Senior Vice President, Counsel and Corporate Secretary, Head of Corporate, Securities and M&A Group of AllianceBernstein L.P. |
Richard S. Biegen TIAA 730 Third Avenue New York, NY 10017-3206 YOB: 1962 | | Chief Compliance Officer | | One-year term. Chief Compliance Officer since 2008. | | Senior Managing Director, TIAA. Chief Compliance Officer of the TIAA-CREF Fund Complex. |
Bradley Finkle TIAA 730 Third Avenue New York, NY 10017-3206 YOB: 1973 | | Principal Executive Officer and President | | One-year term. Principal Executive Officer and President since 2017. | | Chief Operating Officer, Nuveen. Principal Executive Officer and President of theTIAA-CREF Funds andTIAA-CREF Life Funds. Formerly, Senior Managing Director,Co-Head Nuveen Equities & Fixed Income and President of TIAA Investments. |
Jose Minaya TIAA 730 Third Avenue New York, NY 10017-3206 YOB: 1971 | | Executive Vice President | | One-year term. Executive Vice President since 2018. | | Executive Vice President, Chief Investment Officer and President, Nuveen Global Investments. Executive Vice President of the TIAA-CREF Fund Complex. Formerly, Senior Managing Director, President, Global Investments, TIAA. |
| | | | |
| TIAA-CREF Life Funds § 2018 Annual Report | | | 133 | |
| | |
| Trustees and officers(unaudited) | | concluded |
TIAA-CREF Life Funds § December 31, 2018
Officers—concluded
| | | | | | |
Name, address and year of birth (“YOB”) | | Position(s) held with fund | | Term of office and length of time served | | Principal occupation(s) during past 5 years |
Phillip T. Rollock TIAA 730 Third Ave. New York, NY 10017-3206 YOB: 1962 | | Executive Vice President and Chief Legal Officer | | One-year term. Executive Vice President and Chief Legal Officer since 2018. | | Executive Vice President and Chief Legal Officer of TIAA and the TIAA-CREF Fund Complex. Formerly, Senior Managing Director, Deputy Chief Legal Officer and Corporate Secretary of TIAA. |
Christopher A. Van Buren TIAA 730 Third Avenue New York, NY 10017-3206 YOB: 1962 | | Executive Vice President | | One-year term. Executive Vice President since 2018. | | Executive Vice President, Chief Risk Officer of TIAA, and Executive Vice President of the TIAA-CREF Fund Complex. Prior to joining TIAA, Mr. Van Buren served as Managing Director, Group Risk Control of UBS. |
E. Scott Wickerham TIAA 730 Third Avenue New York, NY 10017-3206 YOB: 1973 | | Principal Financial Officer, Principal Accounting Officer and Treasurer | | One-year Principal Financial Officer, Principal Accounting Officer and Treasurer since 2017. | | Managing Director, Head, TC Fund Administration, Nuveen. Principal Financial Officer, Principal Accounting Officer and Treasurer of the TIAA-CREF Funds, TIAA-CREF Life Funds and TIAA Separate AccountVA-1; and Treasurer of CREF. |
Sean N. Woodroffe TIAA 730 Third Avenue New York, NY 10017-3206 YOB: 1963 | | Executive Vice President | | One-year term. Executive Vice President since 2018. | | Senior Executive Vice President, Chief Human Resources Officer of TIAA, and Executive Vice President of theTIAA-CREF Fund Complex. Prior to joining TIAA, Mr. Woodroffe served as Chief People Officer at National Life Group. |
Please note that the Funds’ Statement of Additional Information (SAI) includes additional information about the Funds’ trustees and is available, without charge, through our website, TIAA.org, or by calling 800 223-1200.
| | |
| 134 | | 2018 Annual Report § TIAA-CREF Life Funds |
| | |
Additional information about
index providers(unaudited) | | |
Russell indexes
Source: London Stock Exchange Group plc and its group undertakings (collectively, the “LSE Group”). © LSE Group 2019. FTSE Russell is a trading name of certain of the LSE Group companies. “FTSE®,” “Russell®” and “FTSE Russell®” are trademarks of the relevant LSE Group companies and are used by any other LSE Group company under license. All rights in the FTSE Russell indexes or data vest in the relevant LSE Group company which owns the index or the data. Neither LSE Group nor its licensors accept any liability for any errors or omissions in the indexes or data and no party may rely on any indexes or data contained in this communication. No further distribution of data from the LSE Group is permitted without the relevant LSE Group company’s express written consent. The LSE Group does not promote, sponsor or endorse the content of this communication.
Bloomberg Barclays indexes
Source: Bloomberg Index Services Limited. BLOOMBERG® is a trademark and service mark of Bloomberg Finance L.P. and its affiliates (collectively “Bloomberg”). BARCLAYS® is a trademark and service mark of Barclays Bank Plc (collectively with its affiliates, “Barclays”), used under license. Bloomberg or Bloomberg’s licensors, including Barclays, own all proprietary rights in the Bloomberg Barclays Indices. Neither Bloomberg nor Barclays approves or endorses this material, or guarantees the accuracy or completeness of any information herein, or makes any warranty, express or implied, as to the results to be obtained therefrom and, to the maximum extent allowed by law, neither shall have any liability or responsibility for injury or damages arising in connection therewith.
FTSE index
Source: FTSE International Limited (“FTSE”) © FTSE 2019. “FTSE®” is a trade mark of the London Stock Exchange Group companies and is used by FTSE International Limited under license. “Nareit®” is a trade mark of the National Association of Real Estate Investment Trusts (“Nareit”). All intellectual property rights in the Index vest in FTSE and Nareit. Neither FTSE nor its licensors accept any liability for any errors or omissions in the FTSE indices and/or FTSE ratings or underlying data. No further distribution of FTSE Data is permitted without FTSE’s express written consent.
Standard & Poor’s index
TheS&P 500® Index is a product of S&P Dow Jones Indices LLC, a division of S&P Global, or its affiliates (“SPDJI”), and has been licensed for use by the Growth & Income Fund. Standard & Poor’s® and S&P® are registered trademarks of Standard & Poor’s Financial Services LLC, a division of S&P Global (“S&P”); Dow Jones® is a registered trademark of Dow Jones Trademark Holdings LLC (“Dow Jones”). It is not possible to invest directly in an index. The Fund is not sponsored, endorsed, sold or promoted by SPDJI, Dow Jones, S&P, any of their respective affiliates (collectively,
| | | | |
| TIAA-CREF Life Funds § 2018 Annual Report | | | 135 | |
| | |
Additional information about
index providers(unaudited) | | |
“S&P Dow Jones Indices”). S&P Dow Jones Indices does not make any representation or warranty, express or implied, to the owners of the Fund or any member of the public regarding the advisability of investing in securities generally or in the Fund particularly or the ability of the S&P 500 Index to track general market performance. Past performance of an index is not an indication or guarantee of future results. S&P Dow Jones Indices’ only relationship to the Fund with respect to the S&P 500 Index is the licensing of the Index and certain trademarks, service marks and/or trade names of S&P Dow Jones Indices and/or its licensors. The S&P 500 Index is determined, composed and calculated by S&P Dow Jones Indices without regard to the Fund. S&P Dow Jones Indices has no obligation to take the needs of the Fund or the owners of the Fund into consideration in determining, composing or calculating the S&P 500 Index. S&P Dow Jones Indices is not responsible for and has not participated in the determination of the prices, and amount of the Fund or the timing of the issuance or sale of Fund shares or in the determination or calculation of the equation by which Fund shares are to be converted into cash, surrendered or redeemed, as the case may be. S&P Dow Jones Indices has no obligation or liability in connection with the administration, marketing or trading of the Fund. There is no assurance that investment products based on the S&P 500 Index will accurately track index performance or provide positive investment returns. S&P Dow Jones Indices LLC is not an investment or tax advisor. A tax advisor should be consulted to evaluate the impact of any tax-exempt securities on portfolios and the tax consequences of making any particular investment decision. Inclusion of a security within an index is not a recommendation by S&P Dow Jones Indices to buy, sell, or hold such security, nor is it considered to be investment advice.
S&P DOW JONES INDICES DOES NOT GUARANTEE THE ADEQUACY, ACCURACY, TIMELINESS AND/OR THE COMPLETENESS OF THE S&P 500 INDEX OR ANY DATA RELATED THERETO OR ANY COMMUNICATION, INCLUDING BUT NOT LIMITED TO, ORAL OR WRITTEN COMMUNICATION (INCLUDING ELECTRONIC COMMUNICATIONS) WITH RESPECT THERETO. S&P DOW JONES INDICES SHALL NOT BE SUBJECT TO ANY DAMAGES OR LIABILITY FOR ANY ERRORS, OMISSIONS, OR DELAYS THEREIN. S&P DOW JONES INDICES MAKES NO EXPRESS OR IMPLIED WARRANTIES, AND EXPRESSLY DISCLAIMS ALL WARRANTIES, OF MERCHANTABILITY OR FITNESS FOR A PARTICULAR PURPOSE OR USE OR AS TO RESULTS TO BE OBTAINED BY THE FUND, OWNERS OF THE FUND, OR ANY OTHER PERSON OR ENTITY FROM THE USE OF THE S&P 500 INDEX OR WITH RESPECT TO ANY DATA RELATED THERETO. WITHOUT LIMITING ANY OF THE FOREGOING, IN NO EVENT WHATSOEVER SHALL S&P DOW JONES INDICES BE LIABLE FOR ANY INDIRECT, SPECIAL, INCIDENTAL, PUNITIVE, OR CONSEQUENTIAL DAMAGES INCLUDING BUT NOT LIMITED TO, LOSS OF PROFITS, TRADING LOSSES, LOST TIME OR GOODWILL, EVEN IF THEY HAVE BEEN ADVISED OF THE POSSIBILITY OF SUCH DAMAGES, WHETHER IN CONTRACT, TORT, STRICT LIABILITY, OR OTHERWISE. THERE ARE NO THIRD PARTY BENEFICIARIES OF ANY AGREEMENTS OR ARRANGEMENTS BETWEEN S&P DOW JONES INDICES AND THE FUND, OTHER THAN THE LICENSORS OF S&P DOW JONES INDICES.
MSCI indexes
Source: MSCI. The MSCI information may only be used for your internal use, may not be reproduced or redisseminated in any form and may not be used as a basis
| | |
| 136 | | 2018 Annual Report § TIAA-CREF Life Funds |
for or a component of any financial instruments or products or indices. None of the MSCI information is intended to constitute investment advice or a recommendation to make (or refrain from making) any kind of investment decision and may not be relied on as such. Historical data and analysis should not be taken as an indication or guarantee of any future performance analysis, forecast or prediction. The MSCI information is provided on an “as is” basis and the user of this information assumes the entire risk of any use made of this information. MSCI, each of its affiliates and each other person involved in or related to compiling, computing or creating any MSCI information (collectively, the “MSCI Parties”) expressly disclaims all warranties (including, without limitation, any warranties of originality, accuracy, completeness, timeliness, non-infringement, merchantability and fitness for a particular purpose) with respect to this information. Without limiting any of the foregoing, in no event shall any MSCI Party have any liability for any direct, indirect, special, incidental, punitive, consequential (including, without limitation, lost profits) or any other damages. (www.msci.com)
Morningstar indexes
©2019 Morningstar. All Rights Reserved. The information contained herein: (1) is proprietary to Morningstar and/or its content providers; (2) may not be copied or distributed; and (3) is not warranted to be accurate, complete or timely. Neither Morningstar nor its content providers are responsible for any damages or losses arising from any use of this information.
| | | | |
| TIAA-CREF Life Funds § 2018 Annual Report | | | 137 | |
[This page intentionally left blank.]
How to reach us
TIAA website
Account performance, personal account information and transactions, product descriptions, and information about investment choices and income options
TIAA.org
Automated telephone service
Check account performance and accumulation balances, change allocations, transfer funds and verify credited premiums
800-842-2252
24 hours a day, 7 days a week
National contact center
Retirement saving and planning, income options and payments, beneficiary services and tax reporting
800-842-2252
8 a.m. to 10 p.m. (ET), Monday–Friday
9 a.m. to 6 p.m. (ET), Saturday
Insurance planning center
After-tax annuities and life insurance
For an existing policy or contract
800-223-1200
To apply for a new policy or contract
877-825-0411
8 a.m. to 8 p.m. (ET), Monday–Friday
For the hearing- or speech-impaired
800-842-2755
8 a.m. to 10 p.m. (ET), Monday–Friday
9 a.m. to 6 p.m. (ET), Saturday
You should carefully consider the investment objectives, risks, charges and expenses of any fund before investing. For a prospectus that contains this and other important information, please visit TIAA.org, or call800-223-1200. Please read the prospectus carefully before investing. Investment, insurance and annuity products are not Federal Deposit Insurance Corporation (FDIC) insured, are not bank guaranteed, are not bank deposits, are not insured by any federal government agency, are not a condition to any banking service or activity, and may lose value. Nuveen, a subsidiary of TIAA, provides investment advice and portfolio management services through a dozen affiliated registered investment advisers. Teachers Personal Investors Services, Inc., Nuveen Securities, LLC, and TIAA-CREF Individual & Institutional Services, LLC, members FINRA and SIPC, distribute securities products. Insurance and annuity products are issued by TIAA-CREF Life Insurance Company, New York, NY.
This material is not intended to be a recommendation or investment advice, does not constitute a solicitation to buy or sell securities, and is not provided in a fiduciary capacity. The information provided does not take into account the specific objectives or circumstances of any particular investor or suggest any specific course of action. Investment decisions should be made based on an investor’s objectives and circumstances and in consultation with his or her advisors.
©2019 Teachers Insurance and Annuity Association of America—College Retirement Equities Fund, 730 Third Avenue, New York, NY 10017-3206
TIAA
730 Third Avenue
New York, NY 10017-3206

| | |

| | Printed on paper containing recycled fiber |
| | |

| | We’re fond of paper…in its original form. Switch to eDelivery at TIAA.org/eDelivery |
TIAA
730 Third Avenue
New York, NY 10017-3206
Item 2. Code of Ethics.
2(a) The Board of Trustees of the TIAA-CREF Life Funds (the “Registrant”) has adopted a code of ethics for senior financial officers, including the Registrant’s principal executive officer, principal financial officer, principal accounting officer, or controller, and persons performing similar functions, in conformity with rules promulgated under the Sarbanes-Oxley Act of 2002.
2(b) No response required.
2(c) During the reporting period, there were no amendments to the code of ethics.
2(d) During the reporting period, there were no implicit or explicit waivers granted by the Registrant from any provision of the code of ethics.
2(e) Not applicable.
2(f) A copy of the current code of ethics is filed as an exhibit to this FormN-CSR.
Item 3. Audit Committee Financial Expert.
3(a)(1) The Registrant’s Board of Trustees has determined that the Registrant has at least one audit committee financial expert serving on its Audit and Compliance Committee.
3(a)(2) Maceo K. Sloan is the Registrant’s audit committee financial expert and is “independent” for purposes of Item 3 of FormN-CSR.
Item 4. Principal Accountant Fees and Services.
PricewaterhouseCoopers LLP (“PwC”) performs independent audits of the Registrant’s financial statements. To maintain auditor independence and avoid the appearance of conflicts of interest, the Registrant, as a policy, does not engage PwC for management advisory or consulting services.
4(a)Audit Fees.
For the fiscal years ended December 31, 2018 and December 31, 2017, PwC’s aggregate fees for the audit of the Registrant’s annual financial statements were $306,020 and $305,060, respectively.
The aggregate fees for all other services billed by PwC for the fiscal year ended December 31, 2017 do not align with the figures reported in the FormN-CSR dated December 31, 2017 and filed with the Securities and Exchange Commission on February 28, 2018 (SEC FileNo. 811-08961) because the fees disclosed in this FormN-CSR reflect fees updated after the date of that FormN-CSR for the relevant period.
4(b)Audit Related Fees.
For the fiscal years ended December 31, 2018 and December 31, 2017, PwC’s aggregate fees for services related to the performance of the audit of the Registrant’s annual financial statements were $0 and $0, respectively.
For the fiscal years ended December 31, 2018 and December 31, 2017, the Audit-Related Fees billed by PwC to Teachers Advisors, LLC (“Advisors”) or to any entity controlling, controlled by or under common control with Advisors that provides ongoing services to the Registrant (collectively, “Fund Service Providers”) were $0 and $0, respectively.
4(c)Tax Fees.
For the fiscal years ended December 31, 2018 and December 31, 2017, PwC’s aggregate fees for tax services billed to the Registrant were $82,995 and $80,960, respectively.
For the fiscal years ended December 31, 2018 and December 31, 2017, PwC’s aggregate fees for tax services billed to the Fund Service Providers were $0 and $0, respectively.
4(d)All Other Fees.
For the fiscal years ended December 31, 2018 and December 31, 2017, PwC’s aggregate fees for all other services billed to the Registrant were $5,015 and $5,000, respectively.
For the fiscal years ended December 31, 2018 and December 31, 2017, PwC’s aggregate fees for all other services billed to the Fund Service Providers were $0 and $0, respectively.
4(e)(1)Preapproval Policy.
The Registrant’s audit and compliance committee (“Audit Committee”) has adopted a Preapproval Policy for External Audit Firm Services (the “Policy”). The Policy describes the types of services that may be provided by the independent auditor to the Registrant and certain of its affiliates without impairing the auditor’s independence. Under the Policy, the Audit Committee is required to preapprove all services to be performed by the Registrant’s independent auditor in order to ensure that such services do not impair the auditor’s independence.
The Policy requires the Audit Committee to: (i) appoint the independent auditor to perform the financial statements audit for the Registrant and certain of its affiliates, including approving the terms of the engagement, and (ii) preapprove the audit, audit-related, tax and other services to be provided by the independent auditor to the Registrant and certain of its affiliates and the fees to be charged for provision of such services from year to year.
4(e)(2)Services provided pursuant to paragraph (c)(7)(i)(C) of Rule2-01 of RegulationS-X (the “de minimis exception”):
Audit-Related Fees:
There were no amounts that were approved by the Audit Committee pursuant to the de minimis exception for the fiscal years ended December 31, 2018 and December 31, 2017 on behalf of the Registrant.
There were no amounts that were approved by the Audit Committee pursuant to the de minimis exception for the fiscal years ended December 31, 2018 and December 31, 2017 on behalf of the Fund Service Providers that relate directly to the operations and financial reporting of the Registrant.
Tax Fees:
There were no amounts that were approved by the Audit Committee pursuant to the de minimis exception for the fiscal years ended December 31, 2018 and December 31, 2017 on behalf of the Registrant.
There were no amounts that were approved by the Audit Committee pursuant to the de minimis exception for the fiscal years ended December 31, 2018 and December 31, 2017 on behalf of the Fund Service Providers that relate directly to the operations and financial reporting of the Registrant.
All Other Fees:
There were no amounts that were approved by the Audit Committee pursuant to the de minimis exception for the fiscal years ended December 31, 2018 and December 31, 2017 on behalf of the Registrant.
There were no amounts that were approved by the Audit Committee pursuant to the de minimis exception for the fiscal years ended December 31, 2018 and December 31, 2017 on behalf of the Fund Service Providers that relate directly to the operations and financial reporting of the Registrant.
4(f) The percentage of hours expended by PwC’s engagement to audit the Registrant’s financial statements for the most recent fiscal year attributable to work performed by persons other than PwC’s full-time, permanent employees was less than 50%.
4(g)Non-Audit Fees for Related Entities.
For the fiscal years ended December 31, 2018 and December 31, 2017, aggregatenon-audit fees billed to the Registrant and to its Fund Service Providers by PwC were $229,000 and $208,315, respectively.
4(h) The Registrant’s Audit Committee has considered whether thenon-audit services that were rendered by PwC to the Registrant’s Fund Service Providers that were notpre-approved pursuant to paragraph (c)(7)(ii) of Rule2-01 of RegulationS-X are compatible with maintaining PwC’s independence.
Item 5. Audited Committee of Listed Registrants.
Not Applicable.
Item 6. Schedule of Investments.
TIAA-CREF LIFE FUNDS -Growth Equity Fund
TIAA-CREF LIFE FUNDS
GROWTH EQUITY FUND
SCHEDULE OF INVESTMENTS
December 31, 2018
| | | | | | | | |
SHARES | | | | COMPANY | | VALUE | |
| | | | | | | | |
COMMON STOCKS - 98.7% | | | | |
| |
AUTOMOBILES & COMPONENTS - 0.3% | | | | |
| 1,058 | | * | | Tesla, Inc | | $ | 352,102 | |
| | | | | | | | |
| | | | TOTAL AUTOMOBILES & COMPONENTS | | | 352,102 | |
| | | | | | | | |
| |
CAPITAL GOODS - 6.2% | | | | |
| 10,419 | | | | Airbus SE | | | 993,345 | |
| 4,012 | | | | Boeing Co | | | 1,293,870 | |
| 3,826 | | * | | Middleby Corp | | | 393,045 | |
| 4,817 | | | | Northrop Grumman Corp | | | 1,179,683 | |
| 5,010 | | | | Parker-Hannifin Corp | | | 747,191 | |
| 2,394 | | | | Roper Industries, Inc | | | 638,049 | |
| 3,107 | | | | W.W. Grainger, Inc | | | 877,293 | |
| | | | | | | | |
| | | | TOTAL CAPITAL GOODS | | | 6,122,476 | |
| | | | | | | | |
| |
COMMERCIAL & PROFESSIONAL SERVICES - 1.2% | | | | |
| 890 | | * | | CoStar Group, Inc | | | 300,233 | |
| 10,187 | | * | | IHS Markit Ltd | | | 488,670 | |
| 18,454 | | | | Nielsen NV | | | 430,532 | |
| | | | | | | | |
| | | | TOTAL COMMERCIAL & PROFESSIONAL SERVICES | | | 1,219,435 | |
| | | | | | | | |
| |
CONSUMER DURABLES & APPAREL - 2.4% | | | | |
| 19,703 | | | | Nike, Inc (Class B) | | | 1,460,780 | |
| 26,600 | | | | Tapestry, Inc | | | 897,750 | |
| | | | | | | | |
| | | | TOTAL CONSUMER DURABLES & APPAREL | | | 2,358,530 | |
| | | | | | | | |
| |
CONSUMER SERVICES - 1.5% | | | | |
| 962 | | * | | Chipotle Mexican Grill, Inc (Class A) | | | 415,382 | |
| 9,683 | | | | Marriott International, Inc (Class A) | | | 1,051,186 | |
| | | | | | | | |
| | | | TOTAL CONSUMER SERVICES | | | 1,466,568 | |
| | | | | | | | |
| |
DIVERSIFIED FINANCIALS - 1.6% | | | | |
| 20,171 | | | | IntercontinentalExchange Group, Inc | | | 1,519,481 | |
| | | | | | | | |
| | | | TOTAL DIVERSIFIED FINANCIALS | | | 1,519,481 | |
| | | | | | | | |
| |
ENERGY - 0.2% | | | | |
| 9,261 | | * | | Parsley Energy, Inc | | | 147,991 | |
| | | | | | | | |
| | | | TOTAL ENERGY | | | 147,991 | |
| | | | | | | | |
| |
FOOD & STAPLES RETAILING - 1.3% | | | | |
| 13,762 | | | | Walmart, Inc | | | 1,281,930 | |
| | | | | | | | |
| | | | TOTAL FOOD & STAPLES RETAILING | | | 1,281,930 | |
| | | | | | | | |
| |
FOOD, BEVERAGE & TOBACCO - 1.4% | | | | |
| 6,429 | | | | Constellation Brands, Inc (Class A) | | | 1,033,912 | |
| 7,486 | | * | | Monster Beverage Corp | | | 368,461 | |
| | | | | | | | |
| | | | TOTAL FOOD, BEVERAGE & TOBACCO | | | 1,402,373 | |
| | | | | | | | |
| |
HEALTH CARE EQUIPMENT & SERVICES - 5.6% | | | | |
| 14,273 | | | | Abbott Laboratories | | | 1,032,366 | |
| 9,079 | | * | | Cerner Corp | | | 476,103 | |
1
TIAA-CREF LIFE FUNDS -Growth Equity Fund
| | | | | | | | |
SHARES | | | | COMPANY | | VALUE | |
| | | | | | | | |
| 7,413 | | * | | Edwards Lifesciences Corp | | $ | 1,135,449 | |
| 4,049 | | * | | Intuitive Surgical, Inc | | | 1,939,147 | |
| 5,740 | | | | Stryker Corp | | | 899,745 | |
| | | | | | | | |
| | | | TOTAL HEALTH CARE EQUIPMENT & SERVICES | | | 5,482,810 | |
| | | | | | | | |
| |
HOUSEHOLD & PERSONAL PRODUCTS - 1.1% | | | | |
| 11,857 | | | | Procter & Gamble Co | | | 1,089,895 | |
| | | | | | | | |
| | | | TOTAL HOUSEHOLD & PERSONAL PRODUCTS | | | 1,089,895 | |
| | | | | | | | |
| |
MATERIALS - 3.0% | | | | |
| 9,843 | | | | Linde plc | | | 1,535,902 | |
| 3,526 | | | | Sherwin-Williams Co | | | 1,387,340 | |
| | | | | | | | |
| | | | TOTAL MATERIALS | | | 2,923,242 | |
| | | | | | | | |
| |
MEDIA & ENTERTAINMENT - 15.3% | | | | |
| 20,874 | | | | Activision Blizzard, Inc | | | 972,102 | |
| 3,201 | | * | | Alphabet, Inc (Class A) | | | 3,344,917 | |
| 3,558 | | * | | Alphabet, Inc (Class C) | | | 3,684,700 | |
| 24,514 | | * | | Facebook, Inc | | | 3,213,540 | |
| 6,160 | | * | | IAC/InterActiveCorp | | | 1,127,527 | |
| 3,761 | | * | | NetFlix, Inc | | | 1,006,669 | |
| 19,340 | | * | | Twitter, Inc | | | 555,832 | |
| 9,614 | | | | Walt Disney Co | | | 1,054,175 | |
| | | | | | | | |
| | | | TOTAL MEDIA & ENTERTAINMENT | | | 14,959,462 | |
| | | | | | | | |
| |
PHARMACEUTICALS, BIOTECHNOLOGY & LIFE SCIENCES - 8.8% | | | | |
| 3,374 | | * | | BioMarin Pharmaceutical, Inc | | | 287,296 | |
| 9,583 | | | | Eli Lilly & Co | | | 1,108,945 | |
| 21,573 | | | | Gilead Sciences, Inc | | | 1,349,391 | |
| 3,513 | | * | | Illumina, Inc | | | 1,053,654 | |
| 6,028 | | * | | Jazz Pharmaceuticals plc | | | 747,231 | |
| 9,244 | | | | Johnson & Johnson | | | 1,192,938 | |
| 3,352 | | | | Lonza Group AG. | | | 871,368 | |
| 817 | | * | | Sarepta Therapeutics, Inc | | | 89,159 | |
| 15,485 | | | | Schering-Plough Corp | | | 1,183,209 | |
| 8,978 | | | | Zoetis, Inc | | | 767,978 | |
| | | | | | | | |
| | | | TOTAL PHARMACEUTICALS, BIOTECHNOLOGY & LIFE SCIENCES | | | 8,651,169 | |
| | | | | | | | |
| |
RETAILING - 11.3% | | | | |
| 2,643 | | * | | Alibaba Group Holding Ltd (ADR) | | | 362,276 | |
| 3,255 | | * | | Amazon.com, Inc | | | 4,888,912 | |
| 5,265 | | * | | eBay, Inc | | | 147,789 | |
| 13,969 | | | | Expedia, Inc | | | 1,573,608 | |
| 1,960 | | *,n | | GrubHub, Inc | | | 150,548 | |
| 10,573 | | | | Home Depot, Inc | | | 1,816,653 | |
| 1,492 | | | | Kering | | | 698,954 | |
| 11,267 | | | | Kohl’s Corp | | | 747,453 | |
| 2,849 | | * | | Ulta Beauty, Inc | | | 697,549 | |
| | | | | | | | |
| | | | TOTAL RETAILING | | | 11,083,742 | |
| | | | | | | | |
| |
SEMICONDUCTORS & SEMICONDUCTOR EQUIPMENT - 2.6% | | | | |
| 19,679 | | * | | Advanced Micro Devices, Inc | | | 363,274 | |
| 2,912 | | * | | Cree, Inc | | | 124,561 | |
| 8,208 | | | | NVIDIA Corp | | | 1,095,768 | |
| 12,252 | | | | Xilinx, Inc | | | 1,043,503 | |
| | | | | | | | |
| | | | TOTAL SEMICONDUCTORS & SEMICONDUCTOR EQUIPMENT | | | 2,627,106 | |
| | | | | | | | |
| |
SOFTWARE & SERVICES - 28.0% | | | | |
| 11,307 | | * | | Adobe, Inc | | | 2,558,096 | |
| 18,019 | | * | | Akamai Technologies, Inc | | | 1,100,600 | |
2
TIAA-CREF LIFE FUNDS -Growth Equity Fund
| | | | | | | | | | | | | | | | |
SHARES | | | | COMPANY | | | | | | | | VALUE | |
| | | | | | | | | | | | | | |
| 16,106 | | | | Automatic Data Processing, Inc | | | | | | | | | | $ | 2,111,819 | |
| 3,155 | | * | | Gartner, Inc | | | | | | | | | | | 403,335 | |
| 5,803 | | * | | GoDaddy, Inc | | | | | | | | | | | 380,793 | |
| 13,436 | | | | Intuit, Inc | | | | | | | | | | | 2,644,877 | |
| 17,738 | | | | MasterCard, Inc (Class A) | | | | | | | | | | | 3,346,274 | |
| 61,861 | | | | Microsoft Corp | | | | | | | | | | | 6,283,222 | |
| 25,318 | | * | | PayPal Holdings, Inc | | | | | | | | | | | 2,128,991 | |
| 21,893 | | * | | salesforce.com, Inc | | | | | | | | | | | 2,998,684 | |
| 6,223 | | * | | ServiceNow, Inc | | | | | | | | | | | 1,108,005 | |
| 6 | | | | TiVo Corp | | | | | | | | | | | 56 | |
| 18,362 | | | | Visa, Inc (Class A) | | | | | | | | | | | 2,422,682 | |
| | | | | | | | | | | | | | | | |
| | | | TOTAL SOFTWARE & SERVICES | | | | | | | | | | | 27,487,434 | |
| | | | | | | | | | | | | | | | |
| | | |
TECHNOLOGY HARDWARE & EQUIPMENT - 5.6% | | | | | | | | | | | | |
| 11,595 | | n | | Apple, Inc | | | | | | | | | | | 1,828,995 | |
| 3,204 | | * | | Arista Networks, Inc | | | | | | | | | | | 675,083 | |
| 36,111 | | | | Cisco Systems, Inc | | | | | | | | | | | 1,564,690 | |
| 8,406 | | | | Motorola, Inc | | | | | | | | | | | 967,026 | |
| 86,417 | | | | Nokia Corp | | | | | | | | | | | 502,947 | |
| | | | | | | | | | | | | | | | |
| | | | TOTAL TECHNOLOGY HARDWARE & EQUIPMENT | | | | | | | | | | | 5,538,741 | |
| | | | | | | | | | | | | | | | |
| | | |
TELECOMMUNICATION SERVICES - 1.0% | | | | | | | | | | | | |
| 15,500 | | | | Softbank Corp | | | | | | | | | | | 1,015,237 | |
| | | | | | | | | | | | | | | | |
| | | | TOTAL TELECOMMUNICATION SERVICES | | | | | | | | | | | 1,015,237 | |
| | | | | | | | | | | | | | | | |
| | | |
TRANSPORTATION - 0.3% | | | | | | | | | | | | |
| 1,535 | | | | FedEx Corp | | | | | | | | | | | 247,642 | |
| | | | | | | | | | | | | | | | |
| | | | TOTAL TRANSPORTATION | | | | | | | | | | | 247,642 | |
| | | | | | | | | | | | | | | | |
| | | | TOTAL COMMON STOCKS | | | | | | | | | | | 96,977,366 | |
| | | | | | | | | | | | | | | | |
| | | | (Cost $70,795,657) | | | | | | | | | | | | |
| | | | | | | | | | | | | | | | |
PRINCIPAL | | | | ISSUER | | RATE | | | MATURITY
DATE | | | | |
| | | | | | | | | | | | | | |
SHORT-TERM INVESTMENTS - 1.2% | |
| | | |
GOVERNMENT AGENCY DEBT - 1.2% | | | | | | | | | | | | |
| $ 1,160,000 | | | | Federal Home Loan Bank (FHLB) | | | 2.150 | % | | | 01/02/19 | | | | 1,160,000 | |
| | | | | | | | | | | | | | | | |
| | | | TOTAL GOVERNMENT AGENCY DEBT | | | | | | | | | | | 1,160,000 | |
| | | | | | | | | | | | | | | | |
| | | | TOTAL SHORT-TERM INVESTMENTS | | | | | | | | | | | 1,160,000 | |
| | | | | | | | | | | | | | | | |
| | | | (Cost $1,159,931) | | | | | | | | | | | | |
| | | | TOTAL INVESTMENTS - 99.9% | | | | | | | | | | | 98,137,366 | |
| | | | (Cost $71,955,588) | | | | | | | | | | | | |
| | | | OTHER ASSETS & LIABILITIES, NET - 0.1% | | | | | | | | | | | 78,931 | |
| | | | | | | | | | | | | | | | |
| | | | NET ASSETS - 100.0% | | | | | | | | | | $ | 98,216,297 | |
| | | | | | | | | | | | | | | | |
Abbreviation(s):
| ADR | American Depositary Receipt |
| n | All or a portion of these securities have been segregated by the custodian to cover requirements on open written options contracts. |
Written options outstanding as of December 31, 2018 were as follows (See Note 3):
| | | | | | | | | | | | | | | | | | | | |
| Description/underlying investment | | Number of
contracts | | | Notional
amount | | | Exercise
price | | | Expiration
date | | | Value | |
GrubHub, Inc, Put | | | 2 | | | $ | (996 | ) | | $ | 65.00 | | | | 03/15/19 | | | $ | (730 | ) |
GrubHub, Inc, Put | | | 3 | | | | (2,079 | ) | | | 70.00 | | | | 03/15/19 | | | | (1,740 | ) |
Total | | | 5 | | | $ | (3,075 | ) | | | | | | | | | | $ | (2,470 | ) |
| | |
3
TIAA-CREF LIFE FUNDS-Growth & Income Fund
TIAA-CREF LIFE FUNDS
GROWTH & INCOME FUND
SCHEDULE OF INVESTMENTS
December 31, 2018
| | | | | | | | |
SHARES | | | | COMPANY | | VALUE | |
| | | | | | | |
COMMON STOCKS - 99.2% | | | | |
| |
AUTOMOBILES & COMPONENTS - 0.3% | | | | |
| 6,006 | | | | Delphi Automotive plc | | $ | 369,789 | |
| | | | | | | | |
| | | | TOTAL AUTOMOBILES & COMPONENTS | | | 369,789 | |
| | | | | | | | |
| |
BANKS - 5.3% | | | | |
| 71,707 | | | | Bank of America Corp | | | 1,766,861 | |
| 19,733 | | | | Citizens Financial Group, Inc | | | 586,662 | |
| 27,754 | | | | JPMorgan Chase & Co | | | 2,709,345 | |
| 2,918 | | | | M&T Bank Corp | | | 417,653 | |
| 6,446 | | n | | PNC Financial Services Group, Inc | | | 753,602 | |
| 14,196 | | | | Wells Fargo & Co | | | 654,152 | |
| | | | | | | | |
| | | | TOTAL BANKS | | | 6,888,275 | |
| | | | | | | | |
| |
CAPITAL GOODS - 6.5% | | | | |
| 2,827 | | n | | Boeing Co | | | 911,708 | |
| 6,378 | | | | Deere & Co | | | 951,406 | |
| 7,547 | | | | Dover Corp | | | 535,460 | |
| 5,212 | | | | Fortive Corp | | | 352,644 | |
| 24,814 | | n | | General Electric Co | | | 187,842 | |
| 4,800 | | | | Harris Corp | | | 646,320 | |
| 11,621 | | n | | Honeywell International, Inc | | | 1,535,367 | |
| 7,148 | | | | Ingersoll-Rand plc | | | 652,112 | |
| 14,927 | | | | ITT, Inc | | | 720,526 | |
| 2,705 | | | | L3 Technologies, Inc | | | 469,750 | |
| 9,013 | | | | Masco Corp | | | 263,540 | |
| 2,224 | | n | | Northrop Grumman Corp | | | 544,658 | |
| 3,346 | | | | Siemens AG. | | | 373,419 | |
| 2,737 | | *,n | | WABCO Holdings, Inc | | | 293,789 | |
| | | | | | | | |
| | | | TOTAL CAPITAL GOODS | | | 8,438,541 | |
| | | | | | | | |
| |
COMMERCIAL & PROFESSIONAL SERVICES - 1.3% | | | | |
| 4,927 | | * | | Verisk Analytics, Inc | | | 537,240 | |
| 12,296 | | | | Waste Management, Inc | | | 1,094,221 | |
| | | | | | | | |
| | | | TOTAL COMMERCIAL & PROFESSIONAL SERVICES | | | 1,631,461 | |
| | | | | | | | |
| |
CONSUMER DURABLES & APPAREL - 2.5% | | | | |
| 2,502 | | * | | Deckers Outdoor Corp | | | 320,131 | |
| 4,222 | | * | | Lululemon Athletica, Inc | | | 513,437 | |
| 25,179 | | *,e | | Mattel, Inc | | | 251,538 | |
| 5,704 | | n | | PVH Corp | | | 530,187 | |
| 9,360 | | | | Sony Corp | | | 451,242 | |
| 12,058 | | *,e,g | | Spin Master Corp | | | 339,076 | |
| 15,863 | | | | Tapestry, Inc | | | 535,376 | |
| 8,530 | | | | Wolverine World Wide, Inc | | | 272,022 | |
| | | | | | | | |
| | | | TOTAL CONSUMER DURABLES & APPAREL | | | 3,213,009 | |
| | | | | | | | |
| |
CONSUMER SERVICES - 0.3% | | | | |
| 4,395 | | | | Royal Caribbean Cruises Ltd | | | 429,787 | |
| | | | | | | | |
| | | | TOTAL CONSUMER SERVICES | | | 429,787 | |
| | | | | | | | |
| |
DIVERSIFIED FINANCIALS - 2.6% | | | | |
| 14,587 | | | | Blackstone Group LP | | | 434,838 | |
| 7,215 | | | | CME Group, Inc | | | 1,357,286 | |
4
TIAA-CREF LIFE FUNDS-Growth & Income Fund
| | | | | | | | |
SHARES | | | | COMPANY | | VALUE | |
| | | | | | | |
| 22,140 | | | | Morgan Stanley | | $ | 877,851 | |
| 15,764 | | | | Voya Financial, Inc | | | 632,767 | |
| | | | | | | | |
| | | | TOTAL DIVERSIFIED FINANCIALS | | | 3,302,742 | |
| | | | | | | | |
| |
ENERGY - 5.5% | | | | |
| 5,491 | | * | | Apergy Corp | | | 148,696 | |
| 24,670 | | | | Cabot Oil & Gas Corp | | | 551,374 | |
| 20,506 | | | | Chevron Corp | | | 2,230,847 | |
| 8,363 | | * | | Concho Resources, Inc | | | 859,633 | |
| 9,949 | | * | | Continental Resources, Inc | | | 399,850 | |
| 9,843 | | | | Delek US Holdings, Inc | | | 319,996 | |
| 4,318 | | | | Diamondback Energy, Inc | | | 400,279 | |
| 10,256 | | | | EOG Resources, Inc | | | 894,426 | |
| 9,173 | | | | Oneok, Inc | | | 494,883 | |
| 28,325 | | * | | Parsley Energy, Inc | | | 452,634 | |
| 34,533 | | * | | WPX Energy, Inc | | | 391,950 | |
| | | | | | | | |
| | | | TOTAL ENERGY | | | 7,144,568 | |
| | | | | | | | |
| |
FOOD & STAPLES RETAILING - 1.3% | | | | |
| 4,454 | | n | | Costco Wholesale Corp | | | 907,324 | |
| 8,301 | | | | Walmart, Inc | | | 773,238 | |
| | | | | | | | |
| | | | TOTAL FOOD & STAPLES RETAILING | | | 1,680,562 | |
| | | | | | | | |
| |
FOOD, BEVERAGE & TOBACCO - 5.4% | | | | |
| 31,904 | | | | Coca-Cola Co | | | 1,510,654 | |
| 11,173 | | | | Coca-Cola European Partners plc (Class A) | | | 512,282 | |
| 25,901 | | n | | ConAgra Brands, Inc | | | 553,245 | |
| 4,500 | | n | | Constellation Brands, Inc (Class A) | | | 723,690 | |
| 3,565 | | | | Danone | | | 251,271 | |
| 7,939 | | | | Diageo plc | | | 283,695 | |
| 3,944 | | | | Hershey Co | | | 422,718 | |
| 8,418 | | | | Kraft Heinz Co | | | 362,311 | |
| 23,639 | | | | Mondelez International, Inc | | | 946,269 | |
| 12,867 | | * | | Monster Beverage Corp | | | 633,314 | |
| 6,994 | | | | PepsiCo, Inc | | | 772,697 | |
| | | | | | | | |
| | | | TOTAL FOOD, BEVERAGE & TOBACCO | | | 6,972,146 | |
| | | | | | | | |
| |
HEALTH CARE EQUIPMENT & SERVICES - 9.7% | | | | |
| 24,039 | | | | Abbott Laboratories | | | 1,738,741 | |
| 3,963 | | n | | Anthem, Inc | | | 1,040,803 | |
| 33,567 | | * | | Boston Scientific Corp | | | 1,186,258 | |
| 4,653 | | * | | Edwards Lifesciences Corp | | | 712,700 | |
| 1,630 | | *,e | | Guardant Health, Inc | | | 61,272 | |
| 2,523 | | | | HCA Holdings, Inc | | | 313,987 | |
| 7,098 | | * | | Hologic, Inc | | | 291,728 | |
| 3,086 | | | | Humana, Inc | | | 884,077 | |
| 2,586 | | * | | IDEXX Laboratories, Inc | | | 481,048 | |
| 3,605 | | * | | Insulet Corp | | | 285,948 | |
| 1,923 | | * | | Intuitive Surgical, Inc | | | 920,963 | |
| 1,944 | | * | | iRhythm Technologies, Inc | | | 135,069 | |
| 12,593 | | | | Medtronic plc | | | 1,145,459 | |
| 2,428 | | | | STERIS Plc | | | 259,432 | |
| 7,079 | | n | | Stryker Corp | | | 1,109,633 | |
| 3,582 | | n | | Universal Health Services, Inc (Class B) | | | 417,518 | |
| 2,476 | | *,n | | WellCare Health Plans, Inc | | | 584,559 | |
| 12,809 | | * | | Wright Medical Group NV | | | 348,661 | |
| 6,675 | | | | Zimmer Biomet Holdings, Inc | | | 692,331 | |
| | | | | | | | |
| | | | TOTAL HEALTH CARE EQUIPMENT & SERVICES | | | 12,610,187 | |
| | | | | | | | |
| |
HOUSEHOLD & PERSONAL PRODUCTS - 1.8% | | | | |
| 4,539 | | | | Estee Lauder Cos (Class A) | | | 590,524 | |
| 18,858 | | | | Procter & Gamble Co | | | 1,733,427 | |
| | | | | | | | |
| | | | TOTAL HOUSEHOLD & PERSONAL PRODUCTS | | | 2,323,951 | |
| | | | | | | | |
5
TIAA-CREF LIFE FUNDS-Growth & Income Fund
| | | | | | | | |
SHARES | | | | COMPANY | | VALUE | |
| | | | | | | |
INSURANCE - 3.3% | | | | |
| 17,799 | | * | | Athene Holding Ltd | | $ | 708,934 | |
| 5,709 | | * | | Berkshire Hathaway, Inc (Class B) | | | 1,165,664 | |
| 9,877 | | | | Chubb Ltd | | | 1,275,911 | |
| 17,784 | | | | Hartford Financial Services Group, Inc | | | 790,499 | |
| 4,884 | | | | Prudential Financial, Inc | | | 398,290 | |
| | | | | | | | |
| | | | TOTAL INSURANCE | | | 4,339,298 | |
| | | | | | | | |
| |
MATERIALS - 4.3% | | | | |
| 12,381 | | * | | Allegheny Technologies, Inc | | | 269,534 | |
| 2,988 | | | | Christian Hansen Holding | | | 265,235 | |
| 26,902 | | | | DowDuPont, Inc | | | 1,438,719 | |
| 2,958 | | | | Ecolab, Inc | | | 435,861 | |
| 9,529 | | | | FMC Corp | | | 704,765 | |
| 9,105 | | n | | Linde plc | | | 1,420,744 | |
| 19,454 | | * | | Livent Corp | | | 268,465 | |
| 9,113 | | | | Newmont Mining Corp | | | 315,766 | |
| 9,557 | | | | Nutrien Ltd | | | 449,179 | |
| | | | | | | | |
| | | | TOTAL MATERIALS | | | 5,568,268 | |
| | | | | | | | |
| |
MEDIA & ENTERTAINMENT - 9.5% | | | | |
| 3,771 | | * | | Alphabet, Inc (Class C) | | | 3,905,285 | |
| 32,472 | | | | Comcast Corp (Class A) | | | 1,105,672 | |
| 12,701 | | *,n | | Facebook, Inc | | | 1,664,974 | |
| 3,180 | | *,n | | IAC/InterActiveCorp | | | 582,067 | |
| 4,459 | | * | | NetFlix, Inc | | | 1,193,496 | |
| 6,514 | | *,n | | Take-Two Interactive Software, Inc | | | 670,551 | |
| 10,010 | | * | | Twitter, Inc | | | 287,688 | |
| 12,849 | | | | Viacom, Inc (Class B) | | | 330,219 | |
| 12,494 | | | | Vivendi Universal S.A. | | | 302,821 | |
| 15,692 | | | | Walt Disney Co | | | 1,720,628 | |
| 7,383 | | | | World Wrestling Entertainment, Inc (Class A) | | | 551,658 | |
| | | | | | | | |
| | | | TOTAL MEDIA & ENTERTAINMENT | | | 12,315,059 | |
| | | | | | | | |
| |
PHARMACEUTICALS, BIOTECHNOLOGY & LIFE SCIENCES - 8.3% | | | | |
| 14,497 | | | | AbbVie, Inc | | | 1,336,479 | |
| 5,794 | | *,e | | Allogene Therapeutics, Inc | | | 156,032 | |
| 11,995 | | | | AstraZeneca plc (ADR) | | | 455,570 | |
| 4,025 | | * | | Biohaven Pharmaceutical Holding Co Ltd | | | 148,845 | |
| 4,580 | | * | | BioMarin Pharmaceutical, Inc | | | 389,987 | |
| 3,156 | | * | | Bluebird Bio, Inc | | | 313,075 | |
| 8,407 | | | | Bristol-Myers Squibb Co | | | 436,996 | |
| 6,431 | | | | Daiichi Sankyo Co Ltd | | | 205,700 | |
| 9,139 | | | | Eli Lilly & Co | | | 1,057,565 | |
| 3,555 | | *,n | | Exact Sciences Corp | | | 224,321 | |
| 1,138 | | * | | GW Pharmaceuticals plc (ADR) | | | 110,830 | |
| 2,921 | | *,n | | Jazz Pharmaceuticals plc | | | 362,087 | |
| 1,686 | | | | Lonza Group AG. | | | 438,284 | |
| 3,800 | | *,n | | Nektar Therapeutics | | | 124,906 | |
| 3,715 | | *,n | | Neurocrine Biosciences, Inc | | | 265,288 | |
| 32,596 | | | | Pfizer, Inc | | | 1,422,815 | |
| 1,365 | | * | | Sage Therapeutics, Inc | | | 130,753 | |
| 6,834 | | | | Sanofi-Aventis | | | 592,848 | |
| 22,973 | | | | Schering-Plough Corp | | | 1,755,367 | |
| 33,612 | | * | | Teva Pharmaceutical Industries Ltd (ADR) | | | 518,297 | |
| 2,379 | | | | Vifor Pharma AG. | | | 258,872 | |
| | | | | | | | |
| | | | TOTAL PHARMACEUTICALS, BIOTECHNOLOGY & LIFE SCIENCES | | | 10,704,917 | |
| | | | | | | | |
| |
REAL ESTATE - 0.8% | | | | |
| 5,201 | | | | American Tower Corp | | | 822,746 | |
| 11,354 | | | | Outfront Media, Inc | | | 205,735 | |
| | | | | | | | |
| | | | TOTAL REAL ESTATE | | | 1,028,481 | |
| | | | | | | | |
6
TIAA-CREF LIFE FUNDS-Growth & Income Fund
| | | | | | | | |
SHARES | | | | COMPANY | | VALUE | |
| | | | | | | |
RETAILING - 5.7% | | | | |
| 2,379 | | * | | Amazon.com, Inc | | $ | 3,573,187 | |
| 5,983 | | | | Best Buy Co, Inc | | | 316,860 | |
| 19,510 | | * | | BJ’s Wholesale Club Holdings, Inc | | | 432,341 | |
| 10,308 | | | | Home Depot, Inc | | | 1,771,120 | |
| 4,991 | | | | Kohl’s Corp | | | 331,103 | |
| 6,820 | | n | | Tiffany & Co | | | 549,078 | |
| 1,790 | | *,n | | Ulta Beauty, Inc | | | 438,264 | |
| | | | | | | | |
| | | | TOTAL RETAILING | | | 7,411,953 | |
| | | | | | | | |
| |
SEMICONDUCTORS & SEMICONDUCTOR EQUIPMENT - 4.1% | | | | |
| 25,355 | | * | | Advanced Micro Devices, Inc | | | 468,053 | |
| 1,320 | | n | | Broadcom, Inc | | | 335,650 | |
| 5,943 | | *,n | | Cree, Inc | | | 254,212 | |
| 21,547 | | | | Intel Corp | | | 1,011,201 | |
| 34,326 | | | | Marvell Technology Group Ltd | | | 555,738 | |
| 4,951 | | n | | Monolithic Power Systems, Inc | | | 575,554 | |
| 7,229 | | n | | NVIDIA Corp | | | 965,071 | |
| 14,287 | | n | | QUALCOMM, Inc | | | 813,073 | |
| 4,042 | | e | | Universal Display Corp | | | 378,210 | |
| | | | | | | | |
| | | | TOTAL SEMICONDUCTORS & SEMICONDUCTOR EQUIPMENT | | | 5,356,762 | |
| | | | | | | | |
| |
SOFTWARE & SERVICES - 9.8% | | | | |
| 3,965 | | * | | Adobe, Inc | | | 897,042 | |
| 3,144 | | | | Dassault Systemes S.A. | | | 373,444 | |
| 21,275 | | *,n | | First Data Corp | | | 359,760 | |
| 10,163 | | | | MasterCard, Inc (Class A) | | | 1,917,250 | |
| 51,404 | | | | Microsoft Corp | | | 5,221,104 | |
| 11,702 | | * | | PayPal Holdings, Inc | | | 984,021 | |
| 8,648 | | *,n | | salesforce.com, Inc | | | 1,184,517 | |
| 2,798 | | * | | ServiceNow, Inc | | | 498,184 | |
| 12,767 | | * | | Teradata Corp | | | 489,742 | |
| 2,165 | | | | VMware, Inc (Class A) | | | 296,886 | |
| 12,128 | | * | | Zscaler, Inc | | | 475,539 | |
| | | | | | | | |
| | | | TOTAL SOFTWARE & SERVICES | | | 12,697,489 | |
| | | | | | | | |
| |
TECHNOLOGY HARDWARE & EQUIPMENT - 6.5% | | | | |
| 25,666 | | n | | Apple, Inc | | | 4,048,555 | |
| 49,191 | | | | Cisco Systems, Inc | | | 2,131,446 | |
| 9,008 | | | | Cognex Corp | | | 348,339 | |
| 14,347 | | | | Corning, Inc | | | 433,423 | |
| 6,695 | | | | Motorola, Inc | | | 770,193 | |
| 60,877 | | | | Nokia Corp | | | 354,304 | |
| 21,359 | | * | | Pure Storage, Inc | | | 343,453 | |
| | | | | | | | |
| | | | TOTAL TECHNOLOGY HARDWARE & EQUIPMENT | | | 8,429,713 | |
| | | | | | | | |
| |
TELECOMMUNICATION SERVICES - 1.1% | | | | |
| 25,511 | | | | Verizon Communications, Inc | | | 1,434,228 | |
| | | | | | | | |
| | | | TOTAL TELECOMMUNICATION SERVICES | | | 1,434,228 | |
| | | | | | | | |
| |
TRANSPORTATION - 1.2% | | | | |
| 14,819 | | | | CSX Corp | | | 920,705 | |
| 1,579 | | n | | FedEx Corp | | | 254,740 | |
| 18,475 | | n | | Knight-Swift Transportation Holdings, Inc | | | 463,169 | |
| | | | | | | | |
| | | | TOTAL TRANSPORTATION | | | 1,638,614 | |
| | | | | | | | |
| |
UTILITIES - 2.1% | | | | |
| 5,935 | | | | Alliant Energy Corp | | | 250,754 | |
| 5,337 | | | | Ameren Corp | | | 348,132 | |
| 9,870 | | | | Evergy, Inc | | | 560,320 | |
7
TIAA-CREF LIFE FUNDS-Growth & Income Fund
| | | | | | | | | | | | | | | | |
SHARES | | | | COMPANY | | | | | | | | VALUE | |
| | | | | | | | | | | | | |
| 18,218 | | | | FirstEnergy Corp | | | | | | | | | | $ | 684,086 | |
| 5,374 | | | | NextEra Energy, Inc | | | | | | | | | | | 934,109 | |
| | | | | | | | | | | | | | | | |
| | | | TOTAL UTILITIES | | | | | | | | | | | 2,777,401 | |
| | | | | | | | | | | | | | | | |
| | | | TOTAL COMMON STOCKS | | | | | | | | | | | 128,707,201 | |
| | | | | | | | | | | | | | | | |
| | | | (Cost $99,922,668) | | | | | | | | | | | | |
PURCHASED OPTIONS - 0.0% | | | | | | | | | | | | |
| | | |
CAPITAL GOODS - 0.0% | | | | | | | | | | | | |
| 800 | | | | General Electric Co | | | | | | | | | | | 8 | |
| | | | | | | | | |
| | | | TOTAL CAPITAL GOODS | | | | 8 | |
| | | | | | | | | |
| | | |
PHARMACEUTICALS, BIOTECHNOLOGY & LIFE SCIENCES - 0.0% | | | | | | | | | | | | |
| 700 | | | | CVS Health Corp | | | | | | | | | | | 7 | |
| | | | | | | | | | | | | | | | |
| | | | TOTAL PHARMACEUTICALS, BIOTECHNOLOGY & LIFE SCIENCES | | | | 7 | |
| | | | | | | | | |
| | | | TOTAL PURCHASED OPTIONS | | | | 15 | |
| | | | | | | | | |
| | | | (Cost $1,844) | | | | | | | | | | | | |
| | | | | | | | | | | | | | | | |
PRINCIPAL | | ISSUER | | RATE | | | MATURITY
DATE | | | | |
| | | | | | | | | | | | | | |
SHORT-TERM INVESTMENTS - 2.0% | | | | | |
| |
GOVERNMENT AGENCY DEBT - 1.1% | | | | | |
| $ 1,460,000 | | | | Federal Home Loan Bank (FHLB) | | | 2.150 | % | | | 01/02/19 | | | | 1,460,000 | |
| | | | | | | | | | | | | | | | |
| | | | TOTAL GOVERNMENT AGENCY DEBT | | | | 1,460,000 | |
| | | | | | | | | |
| | | | | | | | | | | | | | | | |
SHARES | | | | COMPANY | | | | | | | | | |
| | | | | | | | | | | | | | |
INVESTMENTS IN REGISTERED INVESTMENT COMPANIES - 0.9% | | | | | |
| 1,180,169 | | c | | State Street Navigator Securities Lending Government Money Market Portfolio | | | | | | | | | | | 1,180,169 | |
| | | | | | | | | | | | | | | | |
| | | | TOTAL INVESTMENTS IN REGISTERED INVESTMENT COMPANIES | | | | 1,180,169 | |
| | | | | | | | | |
| | | | TOTAL SHORT-TERM INVESTMENTS | | | | | | | | | | | 2,640,169 | |
| | | | | | | | | | | | | | | | |
| | | | (Cost $2,640,082) | | | | | | | | | | | | |
| | | | TOTAL INVESTMENTS - 101.2% | | | | 131,347,385 | |
| | | | (Cost $102,564,594) | | | | | | | | | | | | |
| | | | OTHER ASSETS & LIABILITIES, NET - (1.2)% | | | | (1,679,042 | ) |
| | | | | | | | | |
| | | | NET ASSETS - 100.0% | | | | | | | | | | $ | 129,668,343 | |
| | | | | | | | | | | | | | | | |
Abbreviation(s):
| ADR | American Depositary Receipt |
| c | Investments made with cash collateral received from securities on loan. |
| e | All or a portion of these securities are out on loan. The aggregate value of securities on loan is $1,154,511. |
| g | Security is exempt from registration under Rule 144(A) of the Securities Act of 1933. Such securities are deemed liquid and may be resold in transactions exempt from registration to qualified institutional buyers. At 12/31/18, the aggregate value of these securities was $339,076 or 0.3% of net assets. |
| n | All or a portion of these securities have been segregated by the custodian to cover requirements on open written options contracts. |
Purchased options outstanding as of December 31, 2018 were as follows (See Note 3):
| | | | | | | | | | | | | | | | | | | | |
| Description/underlying investment | | Number of
contracts | | | Notional
amount | | | Exercise
price | | | Expiration
date | | | Value | |
CVS Health Corp, Call | | | 7 | | | $ | 1,204 | | | $ | 80.00 | | | | 01/18/19 | | | $ | 7 | |
General Electric Co, Call | | | 8 | | | | 640 | | | | 15.00 | | | | 01/18/19 | | | | 8 | |
Total | | | 15 | | | $ | 1,844 | | | | | | | | | | | $ | 15 | |
| | | | | | | | | | | | | | | | | | | | | |
8
TIAA-CREF LIFE FUNDS-Growth & Income Fund
Written options outstanding as of December 31, 2018 were as follows (See Note 3):
| | | | | | | | | | | | | | | | | | | | |
| Description/underlying investment | | Number of
contracts | | | Notional
amount | | | Exercise
price | | | Expiration
date | | | Value | |
Activision Blizzard, Inc, Put | | | 13 | | | $ | (7,221 | ) | | $ | 50.00 | | | | 05/17/19 | | | $ | (9,100 | ) |
Alibaba Group Holding Ltd, Put | | | 5 | | | | (6,687 | ) | | | 140.00 | | | | 04/18/19 | | | | (6,325 | ) |
Anthem, Inc, Call | | | 3 | | | | (1,089 | ) | | | 310.00 | | | | 01/18/19 | | | | (60 | ) |
Anthem, Inc, Put | | | 3 | | | | (2,654 | ) | | | 250.00 | | | | 03/15/19 | | | | (2,288 | ) |
Anthem, Inc, Put | | | 3 | | | | (6,416 | ) | | | 260.00 | | | | 06/21/19 | | | | (4,875 | ) |
Apple, Inc, Put | | | 5 | | | | (3,250 | ) | | | 195.00 | | | | 02/15/19 | | | | (18,975 | ) |
Apple, Inc, Put | | | 5 | | | | (2,615 | ) | | | 205.00 | | | | 02/15/19 | | | | (23,875 | ) |
Apple, Inc, Put | | | 5 | | | | (6,852 | ) | | | 175.00 | | | | 04/18/19 | | | | (11,030 | ) |
Applied Materials, Inc, Put | | | 13 | | | | (2,392 | ) | | | 32.00 | | | | 04/18/19 | | | | (3,640 | ) |
Arista Networks, Inc, Put | | | 3 | | | | (3,369 | ) | | | 200.00 | | | | 03/15/19 | | | | (3,999 | ) |
Boeing Co, Put | | | 2 | | | | (5,639 | ) | | | 320.00 | | | | 05/17/19 | | | | (5,140 | ) |
Broadcom Ltd, Call | | | 5 | | | | (2,290 | ) | | | 270.00 | | | | 01/18/19 | | | | (1,275 | ) |
Broadridge Financial Solutions, Inc, Put | | | 8 | | | | (1,565 | ) | | | 85.00 | | | | 03/15/19 | | | | (1,520 | ) |
Celgene Corp, Put | | | 11 | | | | (7,425 | ) | | | 70.00 | | | | 04/18/19 | | | | (10,065 | ) |
Celgene Corp, Put | | | 4 | | | | (3,992 | ) | | | 75.00 | | | | 04/18/19 | | | | (5,080 | ) |
Celgene Corp, Put | | | 2 | | | | (2,694 | ) | | | 80.00 | | | | 04/18/19 | | | | (3,398 | ) |
Chipotle Mexican Grill, Inc, Put | | | 2 | | | | (4,916 | ) | | | 405.00 | | | | 03/15/19 | | | | (3,890 | ) |
Chipotle Mexican Grill, Inc, Put | | | 1 | | | | (3,588 | ) | | | 420.00 | | | | 06/21/19 | | | | (3,745 | ) |
Clovis Oncology, Inc, Put | | | 2 | | | | (1,316 | ) | | | 20.00 | | | | 04/18/19 | | | | (1,090 | ) |
Coherent, Inc, Put | | | 4 | | | | (6,112 | ) | | | 145.00 | | | | 02/15/19 | | | | (16,320 | ) |
ConAgra Brands, Inc, Put | | | 12 | | | | (867 | ) | | | 27.00 | | | | 03/15/19 | | | | (7,080 | ) |
ConAgra Brands, Inc, Put | | | 12 | | | | (3,036 | ) | | | 31.00 | | | | 06/21/19 | | | | (11,940 | ) |
Constellation Brands, Inc, Put | | | 4 | | | | (1,075 | ) | | | 160.00 | | | | 01/18/19 | | | | (2,304 | ) |
Constellation Brands, Inc, Put | | | 2 | | | | (1,276 | ) | | | 175.00 | | | | 04/18/19 | | | | (3,844 | ) |
Costco Wholesale Corp, Put | | | 3 | | | | (3,272 | ) | | | 210.00 | | | | 02/15/19 | | | | (3,270 | ) |
Cree, Inc, Call | | | 13 | | | | (1,743 | ) | | | 47.00 | | | | 01/18/19 | | | | (429 | ) |
Cree, Inc, Put | | | 13 | | | | (1,614 | ) | | | 39.00 | | | | 01/18/19 | | | | (572 | ) |
CVS Health Corp, Call | | | 7 | | | | (420 | ) | | | 85.00 | | | | 01/18/19 | | | | (7 | ) |
CVS Health Corp, Put | | | 11 | | | | (1,452 | ) | | | 70.00 | | | | 01/18/19 | | | | (5,621 | ) |
DISH Network Corp, Put | | | 14 | | | | (8,512 | ) | | | 35.00 | | | | 03/15/19 | | | | (14,000 | ) |
DXC Technology Co, Put | | | 5 | | | | (1,889 | ) | | | 50.00 | | | | 03/15/19 | | | | (1,425 | ) |
DXC Technology Co, Put | | | 3 | | | | (474 | ) | | | 55.00 | | | | 03/15/19 | | | | (1,380 | ) |
DXC Technology Co, Put | | | 2 | | | | (456 | ) | | | 57.50 | | | | 03/15/19 | | | | (1,250 | ) |
Exact Sciences Corp, Call | | | 18 | | | | (3,689 | ) | | | 80.00 | | | | 01/18/19 | | | | (360 | ) |
Facebook, Inc, Call | | | 2 | | | | (132 | ) | | | 165.00 | | | | 01/18/19 | | | | (6 | ) |
Facebook, Inc, Put | | | 2 | | | | (136 | ) | | | 125.00 | | | | 01/18/19 | | | | (532 | ) |
Facebook, Inc, Put | | | 2 | | | | (3,132 | ) | | | 135.00 | | | | 06/21/19 | | | | (2,980 | ) |
FedEx Corp, Call | | | 4 | | | | (994 | ) | | | 162.50 | | | | 01/18/19 | | | | (1,560 | ) |
FedEx Corp, Call | | | 4 | | | | (260 | ) | | | 180.00 | | | | 01/18/19 | | | | (96 | ) |
FedEx Corp, Put | | | 4 | | | | (788 | ) | | | 144.00 | | | | 01/25/19 | | | | (448 | ) |
FedEx Corp, Put | | | 4 | | | | (4,004 | ) | | | 200.00 | | | | 04/18/19 | | | | (16,020 | ) |
First Data Corp, Put | | | 18 | | | | (2,125 | ) | | | 17.00 | | | | 04/18/19 | | | | (3,150 | ) |
General Electric Co, Call | | | 17 | | | | (289 | ) | | | 18.00 | | | | 01/18/19 | | | | (17 | ) |
General Electric Co, Put | | | 17 | | | | (1,581 | ) | | | 7.00 | | | | 03/15/19 | | | | (986 | ) |
General Electric Co, Put | | | 17 | | | | (2,465 | ) | | | 8.00 | | | | 06/21/19 | | | | (2,295 | ) |
Hain Celestial Group, Inc, Put | | | 24 | | | | (13,152 | ) | | | 23.00 | | | | 01/17/20 | | | | (18,480 | ) |
HCA Healthcare, Inc, Put | | | 5 | | | | (445 | ) | | | 105.00 | | | | 01/18/19 | | | | (150 | ) |
IAC/InterActiveCorp, Call | | | 5 | | | | (3,608 | ) | | | 240.00 | | | | 01/18/19 | | | | (110 | ) |
IAC/InterActiveCorp, Put | | | 8 | | | | (4,584 | ) | | | 165.00 | | | | 01/18/19 | | | | (1,520 | ) |
IAC/InterActiveCorp, Put | | | 5 | | | | (11,815 | ) | | | 185.00 | | | | 07/19/19 | | | | (10,775 | ) |
Incyte Corp, Put | | | 3 | | | | (1,196 | ) | | | 52.50 | | | | 06/21/19 | | | | (893 | ) |
Ingredion, Inc, Put | | | 3 | | | | (1,194 | ) | | | 90.00 | | | | 04/18/19 | | | | (1,485 | ) |
International Business Machines Corp, Put | | | 7 | | | | (8,592 | ) | | | 120.00 | | | | 01/17/20 | | | | (11,935 | ) |
Jazz Pharmaceuticals plc, Put | | | 3 | | | | (2,131 | ) | | | 140.00 | | | | 03/15/19 | | | | (5,745 | ) |
Knight-Swift Transportation Holdings, Inc, Put | | | 20 | | | | (900 | ) | | | 25.00 | | | | 02/15/19 | | | | (4,020 | ) |
Knight-Swift Transportation Holdings, Inc, Put | | | 20 | | | | (3,766 | ) | | | 25.00 | | | | 05/17/19 | | | | (5,950 | ) |
Linde plc, Put | | | 3 | | | | (3,341 | ) | | | 140.00 | | | | 01/18/19 | | | | (177 | ) |
Mellanox Technologies Ltd, Put | | | 12 | | | | (1,186 | ) | | | 70.00 | | | | 01/18/19 | | | | (240 | ) |
Microchip Technology, Inc, Put | | | 10 | | | | (6,082 | ) | | | 65.00 | | | | 04/18/19 | | | | (3,000 | ) |
Micron Technology, Inc, Put | | | 13 | | | | (8,956 | ) | | | 40.00 | | | | 04/18/19 | | | | (11,830 | ) |
Monolithic Power Systems, Inc, Put | | | 5 | | | | (899 | ) | | | 100.00 | | | | 01/18/19 | | | | (287 | ) |
Nektar Therapeutics, Put | | | 8 | | | | (6,104 | ) | | | 41.00 | | | | 05/17/19 | | | | (8,920 | ) |
Neurocrine Biosciences, Inc, Put | | | 10 | | | | (1,080 | ) | | | 55.00 | | | | 01/18/19 | | | | (400 | ) |
9
TIAA-CREF LIFE FUNDS-Growth & Income Fund
| | | | | | | | | | | | | | | | | | | | |
| Description/underlying investment | | Number of
contracts | | | Notional
amount | | | Exercise
price | | | Expiration
date | | | Value | |
Northrop Grumman Corp, Put | | | 1 | | | $ | (3,630 | ) | | $ | 290.00 | | | | 05/17/19 | | | $ | (4,860 | ) |
Northrop Grumman Corp, Put | | | 2 | | | | (7,872 | ) | | | 295.00 | | | | 05/17/19 | | | | (10,620 | ) |
Nutanix, Inc, Put | | | 4 | | | | (552 | ) | | | 30.00 | | | | 01/18/19 | | | | (40 | ) |
NVIDIA Corp, Put | | | 5 | | | | (545 | ) | | | 100.00 | | | | 01/18/19 | | | | (165 | ) |
Parker-Hannifin Corp, Put | | | 4 | | | | (3,352 | ) | | | 150.00 | | | | 02/15/19 | | | | (3,480 | ) |
PNC Financial Services Group, Inc, Call | | | 7 | | | | (1,393 | ) | | | 135.00 | | | | 02/15/19 | | | | (259 | ) |
PNC Financial Services Group, Inc, Call | | | 7 | | | | (2,653 | ) | | | 140.00 | | | | 02/15/19 | | | | (91 | ) |
PNC Financial Services Group, Inc, Put | | | 7 | | | | (2,716 | ) | | | 120.00 | | | | 02/15/19 | | | | (5,285 | ) |
PNC Financial Services Group, Inc, Put | | | 7 | | | | (2,541 | ) | | | 110.00 | | | | 05/17/19 | | | | (4,200 | ) |
PVH Corp, Put | | | 5 | | | | (2,310 | ) | | | 105.00 | | | | 03/15/19 | | | | (7,050 | ) |
PVH Corp, Put | | | 5 | | | | (2,875 | ) | | | 90.00 | | | | 03/15/19 | | | | (2,650 | ) |
PVH Corp, Put | | | 5 | | | | (4,690 | ) | | | 100.00 | | | | 06/21/19 | | | | (6,700 | ) |
QUALCOMM, Inc, Put | | | 8 | | | | (5,344 | ) | | | 60.00 | | | | 06/21/19 | | | | (5,344 | ) |
Red Hat, Inc, Put | | | 7 | | | | (2,436 | ) | | | 110.00 | | | | 01/18/19 | | | | (63 | ) |
Red Hat, Inc, Put | | | 4 | | | | (2,191 | ) | | | 115.00 | | | | 01/18/19 | | | | (12 | ) |
Rockwell Automation, Inc, Put | | | 2 | | | | (1,276 | ) | | | 145.00 | | | | 04/18/19 | | | | (1,540 | ) |
Roku, Inc, Put | | | 10 | | | | (3,180 | ) | | | 30.00 | | | | 02/15/19 | | | | (2,940 | ) |
salesforce.com, Inc, Call | | | 5 | | | | (550 | ) | | | 160.00 | | | | 01/18/19 | | | | (65 | ) |
salesforce.com, Inc, Put | | | 5 | | | | (2,210 | ) | | | 128.00 | | | | 01/25/19 | | | | (1,455 | ) |
salesforce.com, Inc, Put | | | 5 | | | | (2,055 | ) | | | 120.00 | | | | 02/15/19 | | | | (1,220 | ) |
Stryker Corp, Put | | | 5 | | | | (1,040 | ) | | | 145.00 | | | | 01/18/19 | | | | (490 | ) |
Take-Two Interactive Software, Inc, Put | | | 7 | | | | (2,134 | ) | | | 70.00 | | | | 01/18/19 | | | | (70 | ) |
Tiffany & Co, Put | | | 10 | | | | (9,680 | ) | | | 95.00 | | | | 05/17/19 | | | | (16,940 | ) |
Tiffany & Co, Put | | | 10 | | | | (23,280 | ) | | | 105.00 | | | | 01/17/20 | | | | (27,940 | ) |
Tiffany & Co, Put | | | 10 | | | | (27,030 | ) | | | 110.00 | | | | 01/17/20 | | | | (31,700 | ) |
Ulta Beauty, Inc, Call | | | 2 | | | | (307 | ) | | | 290.00 | | | | 01/18/19 | | | | (40 | ) |
United Parcel Service, Inc, Put | | | 7 | | | | (2,613 | ) | | | 95.00 | | | | 04/18/19 | | | | (4,060 | ) |
Universal Health Services, Inc, Call | | | 5 | | | | (715 | ) | | | 145.00 | | | | 01/18/19 | | | | (65 | ) |
WABCO Holdings, Inc, Call | | | 7 | | | | (1,966 | ) | | | 125.00 | | | | 01/18/19 | | | | (105 | ) |
WABCO Holdings, Inc, Put | | | 7 | | | | (946 | ) | | | 110.00 | | | | 01/18/19 | | | | (3,045 | ) |
WABCO Holdings, Inc, Put | | | 7 | | | | (1,526 | ) | | | 105.00 | | | | 03/15/19 | | | | (3,325 | ) |
WellCare Health Plans, Inc, Call | | | 3 | | | | (3,793 | ) | | | 350.00 | | | | 03/15/19 | | | | (247 | ) |
WellCare Health Plans, Inc, Put | | | 3 | | | | (2,424 | ) | | | 270.00 | | | | 03/15/19 | | | | (11,385 | ) |
WellCare Health Plans, Inc, Put | | | 3 | | | | (2,811 | ) | | | 290.00 | | | | 03/15/19 | | | | (16,605 | ) |
Total | | | 664 | | | $ | (341,430 | ) | | | | | | | | | | $ | (477,235 | ) |
| | | | | | | | | | | | | | | | | | | | | |
10
TIAA-CREF LIFE FUNDS -Large-Cap Value Fund
TIAA-CREF LIFE FUNDS
LARGE-CAP VALUE FUND
SCHEDULE OF INVESTMENTS
December 31, 2018
| | | | | | | | |
SHARES | | | | COMPANY | | VALUE | |
| | | | | | | |
COMMON STOCKS - 99.5% | | | | |
| | | |
BANKS - 15.3% | | | | | | | | |
| 90,540 | | | | Bank of America Corp | | $ | 2,230,906 | |
| 34,663 | | | | Citigroup, Inc | | | 1,804,556 | |
| 6,669 | | | | Comerica, Inc | | | 458,093 | |
| 30,144 | | | | JPMorgan Chase & Co | | | 2,942,657 | |
| 5,822 | | | | PNC Financial Services Group, Inc | | | 680,650 | |
| 28,423 | | | | Wells Fargo & Co | | | 1,309,732 | |
| 6,932 | | | | Zions Bancorporation | | | 282,410 | |
| | | | | | | | |
| | | | TOTAL BANKS | | | 9,709,004 | |
| | | | | | | | |
|
CAPITAL GOODS - 8.5% | |
| 5,171 | | | | Allegion plc | | | 412,180 | |
| 5,555 | | | | Deere & Co | | | 828,639 | |
| 6,093 | | | | Dover Corp | | | 432,298 | |
| 24,957 | | | | General Electric Co | | | 188,925 | |
| 7,487 | | | | Honeywell International, Inc | | | 989,183 | |
| 8,961 | | | | Ingersoll-Rand plc | | | 817,512 | |
| 18,301 | | | | Masco Corp | | | 535,121 | |
| 3,506 | | | | Parker-Hannifin Corp | | | 522,885 | |
| 5,202 | | | | Stanley Works | | | 622,888 | |
| | | | | | | | |
| | | | TOTAL CAPITAL GOODS | | | 5,349,631 | |
| | | | | | | | |
|
CONSUMER DURABLES & APPAREL - 0.9% | |
| 230 | | * | | NVR, Inc | | | 560,508 | |
| | | | | | | | |
| | | | TOTAL CONSUMER DURABLES & APPAREL | | | 560,508 | |
| | | | | | | | |
|
DIVERSIFIED FINANCIALS - 2.8% | |
| 4,575 | | | | American Express Co | | | 436,089 | |
| 12,755 | | | | Bank of New York Mellon Corp | | | 600,378 | |
| 4,722 | | | | Goldman Sachs Group, Inc | | | 788,810 | |
| | | | | | | | |
| | | | TOTAL DIVERSIFIED FINANCIALS | | | 1,825,277 | |
| | | | | | | | |
|
ENERGY - 10.4% | |
| 6,400 | | * | | Apergy Corp | | | 173,312 | |
| 16,740 | | | | Chevron Corp | | | 1,821,145 | |
| 9,012 | | * | | Concho Resources, Inc | | | 926,343 | |
| 6,654 | | | | Diamondback Energy, Inc | | | 616,826 | |
| 15,174 | | | | EOG Resources, Inc | | | 1,323,324 | |
| 10,261 | | | | Exxon Mobil Corp | | | 699,698 | |
| 5,822 | | | | National Oilwell Varco, Inc | | | 149,626 | |
| 7,763 | | | | Occidental Petroleum Corp | | | 476,493 | |
| 9,355 | | | | Schlumberger Ltd | | | 337,528 | |
| | | | | | | | |
| | | | TOTAL ENERGY | | | 6,524,295 | |
| | | | | | | | |
FOOD & STAPLES RETAILING - 0.7% | | | | |
| 4,937 | | | | Walmart, Inc | | | 459,882 | |
| | | | | | | | |
| | | | TOTAL FOOD & STAPLES RETAILING | | | 459,882 | |
| | | | | | | | |
| |
FOOD, BEVERAGE & TOBACCO - 2.3% | | | | |
| 15,251 | | | | Mondelez International, Inc | | | 610,497 | |
| 11,785 | | | | Philip Morris International, Inc | | | 786,767 | |
| | | | | | | | |
| | | | TOTAL FOOD, BEVERAGE & TOBACCO | | | 1,397,264 | |
| | | | | | | | |
11
TIAA-CREF LIFE FUNDS -Large-Cap Value Fund
| | | | | | | | |
SHARES | | | | COMPANY | | VALUE | |
| | | | | | | |
HEALTH CARE EQUIPMENT & SERVICES - 10.4% | | | | |
| 12,894 | | | | Abbott Laboratories | | $ | 932,623 | |
| 4,984 | | | | Anthem, Inc | | | 1,308,948 | |
| 5,120 | | | | Cigna Corp | | | 972,390 | |
| 11,974 | | | | CVS Health Corp | | | 784,537 | |
| 3,049 | | | | HCA Holdings, Inc | | | 379,448 | |
| 7,081 | | | | Medtronic plc | | | 644,088 | |
| 3,529 | | | | UnitedHealth Group, Inc | | | 879,144 | |
| 6,100 | | | | Zimmer Biomet Holdings, Inc | | | 632,692 | |
| | | | | | | | |
| | | | TOTAL HEALTH CARE EQUIPMENT & SERVICES | | | 6,533,870 | |
| | | | | | | | |
| |
HOUSEHOLD & PERSONAL PRODUCTS - 2.4% | | | | |
| 16,638 | | | | Procter & Gamble Co | | | 1,529,365 | |
| | | | | | | | |
| | | | TOTAL HOUSEHOLD & PERSONAL PRODUCTS | | | 1,529,365 | |
| | | | | | | | |
| |
INSURANCE - 6.7% | | | | |
| 19,411 | | | | American International Group, Inc | | | 764,987 | |
| 6,248 | | * | | Berkshire Hathaway, Inc (Class B) | | | 1,275,717 | |
| 7,257 | | | | Chubb Ltd | | | 937,459 | |
| 8,837 | | | | Lincoln National Corp | | | 453,426 | |
| 4,862 | | | | Marsh & McLennan Cos, Inc | | | 387,745 | |
| 4,862 | | | | Prudential Financial, Inc | | | 396,496 | |
| | | | | | | | |
| | | | TOTAL INSURANCE | | | 4,215,830 | |
| | | | | | | | |
| |
MATERIALS - 4.4% | | | | |
| 13,865 | | | | Ball Corp | | | 637,513 | |
| 12,755 | | * | | Crown Holdings, Inc | | | 530,225 | |
| 22,877 | | | | DowDuPont, Inc | | | 1,223,462 | |
| 3,821 | | | | PPG Industries, Inc | | | 390,621 | |
| | | | | | | | |
| | | | TOTAL MATERIALS | | | 2,781,821 | |
| | | | | | | | |
| |
MEDIA & ENTERTAINMENT - 2.8% | | | | |
| 47,142 | | | | Comcast Corp (Class A) | | | 1,605,185 | |
| 1,452 | | | | Walt Disney Co | | | 159,212 | |
| | | | | | | | |
| | | | TOTAL MEDIA & ENTERTAINMENT | | | 1,764,397 | |
| | | | | | | | |
| |
PHARMACEUTICALS, BIOTECHNOLOGY & LIFE SCIENCES - 9.2% | | | | |
| 1,089 | | | | Allergan plc | | | 145,556 | |
| 2,090 | | | | Amgen, Inc | | | 406,860 | |
| 2,361 | | | | Gilead Sciences, Inc | | | 147,680 | |
| 15,658 | | | | Johnson & Johnson | | | 2,020,665 | |
| 38,129 | | | | Pfizer, Inc | | | 1,664,331 | |
| 18,297 | | | | Schering-Plough Corp | | | 1,398,074 | |
| | | | | | | | |
| | | | TOTAL PHARMACEUTICALS, BIOTECHNOLOGY & LIFE SCIENCES | | | 5,783,166 | |
| | | | | | | | |
RETAILING - 1.1% | | | | |
| 4,054 | | | | Home Depot, Inc | | | 696,558 | |
| | | | | | | | |
| | | | TOTAL RETAILING | | | 696,558 | |
| | | | | | | | |
| |
SEMICONDUCTORS & SEMICONDUCTOR EQUIPMENT - 3.3% | | | | |
| 6,248 | | | | Applied Materials, Inc | | | 204,560 | |
| 2,195 | | | | Broadcom, Inc | | | 558,144 | |
| 22,184 | | | | Intel Corp | | | 1,041,095 | |
| 3,604 | | | | NXP Semiconductors NV | | | 264,101 | |
| | | | | | | | |
| | | | TOTAL SEMICONDUCTORS & SEMICONDUCTOR EQUIPMENT | | | 2,067,900 | |
| | | | | | | | |
| |
SOFTWARE & SERVICES - 4.9% | | | | |
| 4,297 | | | | Accenture plc | | | 605,920 | |
| 9,705 | | | | DXC Technology Co | | | 516,015 | |
12
TIAA-CREF LIFE FUNDS -Large-Cap Value Fund
| | | | | | | | | | | | | | | | |
SHARES | | | | COMPANY | | | | | | | | VALUE | |
| | | | | | | | | | | | | |
| 11,507 | | | | Microsoft Corp | | | | | | | | | | $ | 1,168,766 | |
| 16,740 | | | | Oracle Corp | | | | | | | | | | | 755,811 | |
| | | | | | | | | | | | | | | | |
| | | | TOTAL SOFTWARE & SERVICES | | | | | | | | | | | 3,046,512 | |
| | | | | | | | | | | | | | | | |
| | | |
TECHNOLOGY HARDWARE & EQUIPMENT - 3.9% | | | | | | | | | | | | |
| 42,565 | | | | Cisco Systems, Inc | | | | | | | | | | | 1,844,341 | |
| 8,319 | | | | TE Connectivity Ltd | | | | | | | | | | | 629,166 | |
| | | | | | | | | | | | | | | | |
| | | | TOTAL TECHNOLOGY HARDWARE & EQUIPMENT | | | | | | | | | | | 2,473,507 | |
| | | | | | | | | | | | | | | | |
| | | |
TELECOMMUNICATION SERVICES - 3.1% | | | | | | | | | | | | |
| 16,638 | | | | AT&T, Inc | | | | | | | | | | | 474,848 | |
| 25,650 | | | | Verizon Communications, Inc | | | | | | | | | | | 1,442,043 | |
| | | | | | | | | | | | | | | | |
| | | | TOTAL TELECOMMUNICATION SERVICES | | | | | | | | | | | 1,916,891 | |
| | | | | | | | | | | | | | | | |
| | | |
TRANSPORTATION - 1.9% | | | | | | | | | | | | |
| 15,994 | | *,†,b | | AMR Corporation (Escrow) | | | | | | | | | | | 160 | |
| 5,555 | | | | CSX Corp | | | | | | | | | | | 345,132 | |
| 5,961 | | | | Union Pacific Corp | | | | | | | | | | | 823,989 | |
| | | | | | | | | | | | | | | | |
| | | | TOTAL TRANSPORTATION | | | | | | | | | | | 1,169,281 | |
| | | | | | | | | | | | | | | | |
| | | |
UTILITIES - 4.5% | | | | | | | | | | | | |
| 6,932 | | | | American Electric Power Co, Inc | | | | | | | | | | | 518,098 | |
| 5,810 | | | | Entergy Corp | | | | | | | | | | | 500,067 | |
| 16,740 | | | | FirstEnergy Corp | | | | | | | | | | | 628,587 | |
| 4,579 | | | | NextEra Energy, Inc | | | | | | | | | | | 795,922 | |
| 3,476 | | | | Sempra Energy | | | | | | | | | | | 376,068 | |
| | | | | | | | | | | | | | | | |
| | | | TOTAL UTILITIES | | | | | | | | | | | 2,818,742 | |
| | | | | | | | | | | | | | | | |
| | | | TOTAL COMMON STOCKS | | | | | | | | | | | 62,623,701 | |
| | | | | | | | | | | | | | | | |
| | | | (Cost $61,299,800) | | | | | | | | | | | | |
PRINCIPAL | | | | ISSUER | | RATE | | | MATURITY
DATE | | | | |
| | | | | | | | | | | | | | |
SHORT-TERM INVESTMENTS - 0.2% | | | | | | | | | | | | |
| | | |
GOVERNMENT AGENCY DEBT - 0.2% | | | | | | | | | | | | |
| $ 130,000 | | | | Federal Home Loan Bank (FHLB) | | | 2.150 | % | | | 01/02/19 | | | | 130,000 | |
| | | | | | | | | | | | | | | | |
| | | | TOTAL GOVERNMENT AGENCY DEBT | | | | | | | | | | | 130,000 | |
| | | | | | | | | | | | | | | | |
| | | | TOTAL SHORT-TERM INVESTMENTS
| | | | | | | | 130,000 | |
| | | | | | | | | | | | | | | | |
| | | | (Cost $129,992) | | | | | | | | | |
| | | | TOTAL INVESTMENTS - 99.7% | | | | | | | | 62,753,701 | |
| | | | (Cost $61,429,792) | | | | | | | | | |
| | | | OTHER ASSETS & LIABILITIES, NET - 0.3% | | | | | | | | 202,392 | |
| | | | | | | | | | | | | | | | |
| | | | NET ASSETS - 100.0% | | | | | | | $ | 62,956,093 | |
| | | | | | | | | | | | | | | | |
| † | Security is categorized as Level 3 in the fair value hierarchy. |
13
TIAA-CREF LIFE FUNDS-Real Estate Securities Fund
TIAA-CREF LIFE FUNDS
REAL ESTATE SECURITIES FUND
SCHEDULE OF INVESTMENTS
December 31, 2018
| | | | | | | | |
SHARES | | | | COMPANY | | VALUE | |
| | | | | | | | |
COMMON STOCKS - 98.8% | | | | |
| |
CASINOS & GAMING - 0.7% | | | | |
| 24,000 | | * | | Penn National Gaming, Inc | | $ | 451,920 | |
| | | | | | | | |
| | | | TOTAL CASINOS & GAMING | | | 451,920 | |
| | | | | | | | |
| |
DATA PROCESSING & OUTSOURCED SERVICES - 0.7% | | | | |
| 20,000 | | * | | GDS Holdings Ltd (ADR) | | | 461,800 | |
| | | | | | | | |
| | | | TOTAL DATA PROCESSING & OUTSOURCED SERVICES | | | 461,800 | |
| | | | | | | | |
| |
DIVERSIFIED REITS - 0.2% | | | | |
| 35,000 | | | | Colony Capital, Inc | | | 163,800 | |
| | | | | | | | |
| | | | TOTAL DIVERSIFIED REITS | | | 163,800 | |
| | | | | | | | |
| |
HEALTH CARE REITS - 7.0% | | | | |
| 50,000 | | | | HCP, Inc | | | 1,396,500 | |
| 20,000 | | | | Healthcare Trust of America, Inc | | | 506,200 | |
| 20,000 | | | | Ventas, Inc | | | 1,171,800 | |
| 23,000 | | | | Welltower, Inc | | | 1,596,430 | |
| | | | | | | | |
| | | | TOTAL HEALTH CARE REITS | | | 4,670,930 | |
| | | | | | | | |
| |
HOMEBUILDING - 0.8% | | | | |
| 50,000 | | * | | TRI Pointe Homes, Inc | | | 546,500 | |
| | | | | | | | |
| | | | TOTAL HOMEBUILDING | | | 546,500 | |
| | | | | | | | |
| |
HOTEL & RESORT REITS - 3.6% | | | | |
| 70,000 | | | | Host Marriott Corp | | | 1,166,900 | |
| 14,000 | | | | Pebblebrook Hotel Trust | | | 396,340 | |
| 67,000 | | | | Sunstone Hotel Investors, Inc | | | 871,670 | |
| | | | | | | | |
| | | | TOTAL HOTEL & RESORT REITS | | | 2,434,910 | |
| | | | | | | | |
| |
INDUSTRIAL REITS - 10.4% | | | | |
| 6,000 | | | | EastGroup Properties, Inc | | | 550,380 | |
| 55,000 | | | | Prologis, Inc | | | 3,229,600 | |
| 80,000 | | | | Rexford Industrial Realty, Inc | | | 2,357,600 | |
| 23,000 | | | | Terreno Realty Corp | | | 808,910 | |
| | | | | | | | |
| | | | TOTAL INDUSTRIAL REITS | | | 6,946,490 | |
| | | | | | | | |
| |
IT CONSULTING & OTHER SERVICES - 0.4% | | | | |
| 5,399 | | * | | InterXion Holding NV | | | 292,410 | |
| | | | | | | | |
| | | | TOTAL IT CONSULTING & OTHER SERVICES | | | 292,410 | |
| | | | | | | | |
| |
MORTGAGE REITS - 1.3% | | | | |
| 45,000 | | | | Starwood Property Trust, Inc | | | 886,950 | |
| | | | | | | | |
| | | | TOTAL MORTGAGE REITS | | | 886,950 | |
| | | | | | | | |
| |
OFFICE REITS - 11.6% | | | | |
| 16,000 | | | | Alexandria Real Estate Equities, Inc | | | 1,843,840 | |
| 24,500 | | | | Boston Properties, Inc | | | 2,757,475 | |
| 28,000 | | | | Hudson Pacific Properties | | | 813,680 | |
| 25,500 | | | | JBG SMITH Properties | | | 887,655 | |
| 16,500 | | | | Kilroy Realty Corp | | | 1,037,520 | |
| 5,500 | | | | SL Green Realty Corp | | | 434,940 | |
| | | | | | | | |
| | | | TOTAL OFFICE REITS | | | 7,775,110 | |
| | | | | | | | |
14
TIAA-CREF LIFE FUNDS-Real Estate Securities Fund
| | | | | | | | | | | | | | | | |
SHARES | | | | COMPANY | | | | | | | | VALUE | |
| | | | | | | | | | | | | | |
REAL ESTATE OPERATING COMPANIES - 0.3% | |
| 15,000 | | | | Essential Properties Realty Trust, Inc | | | | | | | | | | $ | 207,600 | |
| | | | | | | | | | | | | | | | |
| | | | TOTAL REAL ESTATE OPERATING COMPANIES | | | | | | | | | | | 207,600 | |
| | | | | | | | | | | | | | | | |
|
RESIDENTIAL REITS - 20.4% | |
| 70,000 | | | | American Homes 4 Rent | | | | | | | | | | | 1,389,500 | |
| 16,000 | | | | AvalonBay Communities, Inc | | | | | | | | | | | 2,784,800 | |
| 14,000 | | | | Camden Property Trust | | | | | | | | | | | 1,232,700 | |
| 21,000 | | | | Equity Lifestyle Properties, Inc | | | | | | | | | | | 2,039,730 | |
| 14,000 | | | | Equity Residential | | | | | | | | | | | 924,140 | |
| 9,000 | | | | Essex Property Trust, Inc | | | | | | | | | | | 2,206,890 | |
| 38,000 | | | | Invitation Homes, Inc | | | | | | | | | | | 763,040 | |
| 23,000 | | | | Sun Communities, Inc | | | | | | | | | | | 2,339,330 | |
| | | | | | | | | | | | | | | | |
| | | | TOTAL RESIDENTIAL REITS | | | | | | | | | | | 13,680,130 | |
| | | | | | | | | | | | | | | | |
|
RETAIL REITS - 14.9% | |
| 12,000 | | | | Agree Realty Corp | | | | | | | | | | | 709,440 | |
| 12,500 | | | | Federal Realty Investment Trust | | | | | | | | | | | 1,475,500 | |
| 7,000 | | | | Realty Income Corp | | | | | | | | | | | 441,280 | |
| 31,000 | | | | Regency Centers Corp | | | | | | | | | | | 1,819,080 | |
| 20,000 | | | | Retail Opportunities Investment Corp | | | | | | | | | | | 317,600 | |
| 30,000 | | | | Simon Property Group, Inc | | | | | | | | | | | 5,039,700 | |
| 4,000 | | | | Taubman Centers, Inc | | | | | | | | | | | 181,960 | |
| | | | | | | | | | | | | | | | |
| | | | TOTAL RETAIL REITS | | | | | | | | | | | 9,984,560 | |
| | | | | | | | | | | | | | | | |
|
SPECIALIZED REITS - 26.5% | |
| 22,000 | | | | American Tower Corp | | | | | | | | | | | 3,480,180 | |
| 25,500 | | | | Crown Castle International Corp | | | | | | | | | | | 2,770,065 | |
| 16,000 | | | | CyrusOne, Inc | | | | | | | | | | | 846,080 | |
| 12,000 | | | | Digital Realty Trust, Inc | | | | | | | | | | | 1,278,600 | |
| 6,300 | | | | Equinix, Inc | | | | | | | | | | | 2,221,128 | |
| 12,500 | | | | Extra Space Storage, Inc | | | | | | | | | | | 1,131,000 | |
| 25,000 | | | | Four Corners Property Trust, Inc | | | | | | | | | | | 655,000 | |
| 15,000 | | | | Gaming and Leisure Properties, Inc | | | | | | | | | | | 484,650 | |
| 19,483 | | | | National Storage Affiliates Trust | | | | | | | | | | | 515,520 | |
| 6,000 | | | | Public Storage, Inc | | | | | | | | | | | 1,214,460 | |
| 23,000 | | | | QTS Realty Trust, Inc | | | | | | | | | | | 852,150 | |
| 7,500 | | * | | SBA Communications Corp | | | | | | | | | | | 1,214,175 | |
| 55,000 | | | | Weyerhaeuser Co | | | | | | | | | | | 1,202,300 | |
| | | | TOTAL SPECIALIZED REITS | | | | | | | | | | | 17,865,308 | |
| | | | | | | | | | | | | | | | |
| | | | TOTAL COMMON STOCKS | | | | | | | | | | | 66,368,418 | |
| | | | | | | | | | | | | | | | |
| | | | (Cost $52,584,075) | | | | | | | | | | | | |
| | | | | | | | | | | | | | | | |
PRINCIPAL | | | | ISSUER | | RATE | | | MATURITY
DATE | | | | |
| | | | | | | | | | | | | | |
SHORT-TERM INVESTMENTS - 0.8% | | | | | | | | | | | | |
| | | |
GOVERNMENT AGENCY DEBT - 0.8% | | | | | | | | | | | | |
| $ 510,000 | | | | Federal Home Loan Bank (FHLB) | | | 2.150 | % | | | 01/02/19 | | | | 510,000 | |
| | | | | | | | | | | | | | | | |
| | | | TOTAL GOVERNMENT AGENCY DEBT | | | | | | | | | | | 510,000 | |
| | | | | | | | | | | | | | | | |
| | | | TOTAL SHORT-TERM INVESTMENTS | | | | | | | | | | | 510,000 | |
| | | | | | | | | | | | | | | | |
| | | | (Cost $509,969) | | | | | | | | | | | | |
| | | | TOTAL INVESTMENTS - 99.6% | | | | | | | | | | | 66,878,418 | |
| | | | (Cost $53,094,044) | | | | | | | | | | | | |
| | | | OTHER ASSETS & LIABILITIES, NET - 0.4% | | | | | | | | | | | 263,845 | |
| | | | | | | | | | | | | | | | |
| | | | NET ASSETS - 100.0% | | | | | | | | | | $ | 67,142,263 | |
| | | | | | | | | | | | | | | | |
Abbreviation(s):
| ADR | American Depositary Receipt |
| REIT | Real Estate Investment Trust |
15
TIAA-CREF LIFE FUNDS -Small-Cap Equity Fund
TIAA-CREF LIFE FUNDS
SMALL-CAP EQUITY FUND
SCHEDULE OF INVESTMENTS
December 31, 2018
| | | | | | | | |
SHARES | | | | COMPANY | | VALUE | |
| | | | | | | | |
COMMON STOCKS - 99.6% | | | | |
| |
AUTOMOBILES & COMPONENTS - 0.4% | | | | |
| 6,719 | | * | | Stoneridge, Inc | | $ | 165,623 | |
| | | | | | | | |
| | | | TOTAL AUTOMOBILES & COMPONENTS | | | 165,623 | |
| | | | | | | | |
| |
BANKS - 11.1% | | | | |
| 6,800 | | | | Bank of NT Butterfield & Son Ltd | | | 213,180 | |
| 9,844 | | | | Cadence BanCorp | | | 165,182 | |
| 8,390 | | | | Cathay General Bancorp | | | 281,316 | |
| 5,450 | | * | | Customers Bancorp, Inc | | | 99,190 | |
| 3,980 | | * | | Eagle Bancorp, Inc | | | 193,866 | |
| 8,610 | | * | | Essent Group Ltd | | | 294,290 | |
| 4,610 | | * | | FCB Financial Holdings, Inc | | | 154,804 | |
| 2,140 | | | | Federal Agricultural Mortgage Corp (Class C) | | | 129,341 | |
| 28,030 | | | | First Bancorp (Puerto Rico) | | | 241,058 | |
| 11,030 | | | | First Commonwealth Financial Corp | | | 133,242 | |
| 5,040 | | | | First Merchants Corp | | | 172,721 | |
| 6,749 | | * | | Flagstar Bancorp, Inc | | | 178,174 | |
| 13,320 | | | | Fulton Financial Corp | | | 206,194 | |
| 8,320 | | | | Hancock Holding Co | | | 288,288 | |
| 4,460 | | | | IBERIABANK Corp | | | 286,689 | |
| 4,180 | | | | LegacyTexas Financial Group, Inc | | | 134,136 | |
| 25,380 | | * | | MGIC Investment Corp | | | 265,475 | |
| 5,200 | | * | | NMI Holdings, Inc | | | 92,820 | |
| 11,850 | | | | OFG Bancorp | | | 195,051 | |
| 12,210 | | | | Radian Group, Inc | | | 199,756 | |
| 5,000 | | | | Simmons First National Corp (Class A) | | | 120,650 | |
| 10,780 | | | | Sterling Bancorp/DE | | | 177,978 | |
| 12,277 | | | | United Community Banks, Inc | | | 263,464 | |
| 6,100 | | | | Walker & Dunlop, Inc | | | 263,825 | |
| 6,810 | | | | Washington Federal, Inc | | | 181,895 | |
| 3,100 | | | | WesBanco, Inc | | | 113,739 | |
| 2,820 | | | | WSFS Financial Corp | | | 106,906 | |
| | | | | | | | |
| | | | TOTAL BANKS | | | 5,153,230 | |
| | | | | | | | |
| |
CAPITAL GOODS - 10.0% | | | | |
| 5,275 | | * | | Aerojet Rocketdyne Holdings, Inc | | | 185,838 | |
| 4,520 | | | | Applied Industrial Technologies, Inc | | | 243,809 | |
| 10,598 | | * | | Atkore International Group, Inc | | | 210,264 | |
| 6,209 | | * | | BMC Stock Holdings, Inc | | | 96,115 | |
| 7,479 | | | | Comfort Systems USA, Inc | | | 326,683 | |
| 6,270 | | * | | Continental Building Products Inc | | | 159,571 | |
| 2,940 | | | | Crane Co | | | 212,209 | |
| 2,080 | | | | Curtiss-Wright Corp | | | 212,410 | |
| 6,197 | | | | EMCOR Group, Inc | | | 369,899 | |
| 6,560 | | * | | Generac Holdings, Inc | | | 326,032 | |
| 8,482 | | * | | GMS, Inc | | | 126,043 | |
| 8,160 | | * | | Harsco Corp | | | 162,058 | |
| 7,270 | | | | Hillenbrand, Inc | | | 275,751 | |
| 2,450 | | | | ITT, Inc | | | 118,261 | |
| 1,970 | | | | Kadant, Inc | | | 160,476 | |
| 1,000 | | * | | Mastec, Inc | | | 40,560 | |
| 11,631 | | * | | Meritor, Inc | | | 196,680 | |
| 3,080 | | | | Moog, Inc (Class A) | | | 238,638 | |
| 5,432 | | * | | Patrick Industries, Inc | | | 160,842 | |
| 7,070 | | * | | Rexnord Corp | | | 162,257 | |
| 980 | | * | | Teledyne Technologies, Inc | | | 202,929 | |
16
TIAA-CREF LIFE FUNDS -Small-Cap Equity Fund
| | | | | | | | |
SHARES | | | | COMPANY | | VALUE | |
| | | | | | | | |
| 5,140 | | * | | Trex Co, Inc | | $ | 305,110 | |
| 8,390 | | * | | Univar, Inc | | | 148,839 | |
| | | | | | | | |
| | | | TOTAL CAPITAL GOODS | | | 4,641,274 | |
| | | | | | | | |
| |
COMMERCIAL & PROFESSIONAL SERVICES - 3.5% | | | | |
| 3,320 | | | | Brink’s Co | | | 214,638 | |
| 5,629 | | | | Exponent, Inc | | | 285,447 | |
| 1,300 | | | | ICF International, Inc | | | 84,214 | |
| 4,240 | | | | Insperity, Inc | | | 395,846 | |
| 1,700 | | | | MSA Safety, Inc | | | 160,259 | |
| 253 | | * | | On Assignment, Inc | | | 13,788 | |
| 3,730 | | * | | TriNet Group, Inc | | | 156,474 | |
| 5,408 | | | | Viad Corp | | | 270,887 | |
| 1,102 | | * | | WageWorks, Inc | | | 29,930 | |
| | | | | | | | |
| | | | TOTAL COMMERCIAL & PROFESSIONAL SERVICES | | | 1,611,483 | |
| | | | | | | | |
| |
CONSUMER DURABLES & APPAREL - 3.5% | | | | |
| 10,400 | | | | Callaway Golf Co | | | 159,120 | |
| 980 | | * | | Cavco Industries, Inc | | | 127,772 | |
| 2,340 | | * | | Deckers Outdoor Corp | | | 299,403 | |
| 4,510 | | * | | G-III Apparel Group Ltd | | | 125,784 | |
| 2,000 | | * | | Helen of Troy Ltd | | | 262,360 | |
| 9,180 | | | | KB Home | | | 175,338 | |
| 1,970 | | * | | Malibu Boats Inc | | | 68,556 | |
| 5,780 | | * | | Roku, Inc | | | 177,099 | |
| 7,680 | | | | Steven Madden Ltd | | | 232,397 | |
| | | | | | | | |
| | | | TOTAL CONSUMER DURABLES & APPAREL | | | 1,627,829 | |
| | | | | | | | |
| |
CONSUMER SERVICES - 3.6% | | | | |
| 3,010 | | | | BJ’s Restaurants, Inc | | | 152,216 | |
| 2,500 | | * | | Bright Horizons Family Solutions | | | 278,625 | |
| 3,300 | | | | Dave & Buster’s Entertainment, Inc | | | 147,048 | |
| 2,510 | | | | Jack in the Box, Inc | | | 194,851 | |
| 1,490 | | * | | Planet Fitness, Inc | | | 79,894 | |
| 300 | | | | Red Rock Resorts, Inc | | | 6,093 | |
| 4,010 | | * | | Sotheby’s (Class A) | | | 159,357 | |
| 1,900 | | | | Strategic Education Inc | | | 215,498 | |
| 5,260 | | | | Texas Roadhouse, Inc (Class A) | | | 314,022 | |
| 2,830 | | * | | Weight Watchers International, Inc | | | 109,097 | |
| | | | | | | | |
| | | | TOTAL CONSUMER SERVICES | | | 1,656,701 | |
| | | | | | | | |
DIVERSIFIED FINANCIALS - 5.2% | | | | |
| 7,497 | | | | Artisan Partners Asset Management, Inc | | | 165,759 | |
| 13,280 | | | | BGC Partners, Inc (Class A) | | | 68,657 | |
| 3,235 | | | | Evercore Partners, Inc (Class A) | | | 231,497 | |
| 11,880 | | * | | FGL Holdings | | | 79,121 | |
| 3,850 | | * | | Green Dot Corp | | | 306,152 | |
| 4,440 | | | | Houlihan Lokey, Inc | | | 163,392 | |
| 2,400 | | | | iSharesMicro-Cap ETF | | | 197,880 | |
| 4,900 | | | | iShares Russell 2000 Index Fund | | | 656,110 | |
| 10,210 | | | | OM Asset Management plc | | | 109,043 | |
| 22,682 | | * | | SLM Corp | | | 188,487 | |
| 5,744 | | | | Stifel Financial Corp | | | 237,916 | |
| | | | | | | | |
| | | | TOTAL DIVERSIFIED FINANCIALS | | | 2,404,014 | |
| | | | | | | | |
| |
ENERGY - 4.4% | | | | |
| 2,530 | | | | Arch Coal, Inc | | | 209,965 | |
| 7,540 | | * | | C&J Energy Services, Inc | | | 101,790 | |
| 3,803 | | * | | Cactus, Inc | | | 104,240 | |
| 3,340 | | | | CVR Energy, Inc | | | 115,163 | |
| 5,657 | | | | Delek US Holdings, Inc | | | 183,909 | |
| 4,919 | | * | | Exterran Corp | | | 87,066 | |
| 9,970 | | | | Green Plains Renewable Energy, Inc | | | 130,707 | |
17
TIAA-CREF LIFE FUNDS -Small-Cap Equity Fund
| | | | | | | | |
SHARES | | | | COMPANY | | VALUE | |
| | | | | | | | |
| 15,930 | | * | | Keane Group, Inc | | $ | 130,307 | |
| 3,130 | | * | | KLX Energy Services Holdings, Inc | | | 73,399 | |
| 4,080 | | | | Mammoth Energy Services, Inc | | | 73,358 | |
| 3,200 | | * | | Nine Energy Service, Inc | | | 72,128 | |
| 19,050 | | * | | Oasis Petroleum, Inc | | | 105,347 | |
| 8,510 | | * | | Par Pacific Holdings, Inc | | | 120,672 | |
| 4,570 | | | | Peabody Energy Corp | | | 139,294 | |
| 11,570 | | * | | ProPetro Holding Corp | | | 142,542 | |
| 2,780 | | *,e | | Renewable Energy Group, Inc | | | 71,446 | |
| 9,174 | | * | | SandRidge Energy, Inc | | | 69,814 | |
| 5,080 | | | | World Fuel Services Corp | | | 108,763 | |
| | | | | | | | |
| | | | TOTAL ENERGY | | | 2,039,910 | |
| | | | | | | | |
| |
FOOD, BEVERAGE & TOBACCO - 1.0% | | | | |
| 200 | | * | | Boston Beer Co, Inc (Class A) | | | 48,168 | |
| 11,750 | | | | Dean Foods Co | | | 44,768 | |
| 1,990 | | | | Lancaster Colony Corp | | | 351,951 | |
| | | | | | | | |
| | | | TOTAL FOOD, BEVERAGE & TOBACCO | | | 444,887 | |
| | | | | | | | |
| |
HEALTH CARE EQUIPMENT & SERVICES - 6.1% | | | | |
| 2,250 | | * | | Allscripts Healthcare Solutions, Inc | | | 21,690 | |
| 3,900 | | * | | Cardiovascular Systems, Inc | | | 111,111 | |
| 2,750 | | | | Conmed Corp | | | 176,550 | |
| 4,700 | | * | | Globus Medical, Inc | | | 203,416 | |
| 3,690 | | | | Hill-Rom Holdings, Inc | | | 326,749 | |
| 10,860 | | * | | HMS Holdings Corp | | | 305,492 | |
| 170 | | * | | Inogen Inc | | | 21,109 | |
| 4,400 | | * | | Integer Holding Corp | | | 335,544 | |
| 11,180 | | * | | Lantheus Holdings, Inc | | | 174,967 | |
| 644 | | * | | LHC Group, Inc | | | 60,459 | |
| 1,500 | | * | | LivaNova plc | | | 137,205 | |
| 2,510 | | * | | Magellan Health Services, Inc | | | 142,794 | |
| 2,520 | | * | | Masimo Corp | | | 270,572 | |
| 1,000 | | * | | NuVasive, Inc | | | 49,560 | |
| 11,944 | | * | | OraSure Technologies, Inc | | | 139,506 | |
| 4,490 | | * | | Orthofix International NV | | | 235,680 | |
| 3,300 | | * | | Staar Surgical Co | | | 105,303 | |
| | | | | | | | |
| | | | TOTAL HEALTH CARE EQUIPMENT & SERVICES | | | 2,817,707 | |
| | | | | | | | |
| |
HOUSEHOLD & PERSONAL PRODUCTS - 1.2% | | | | |
| 1,100 | | | | Medifast, Inc | | | 137,522 | |
| 2,110 | | | | Nu Skin Enterprises, Inc (Class A) | | | 129,406 | |
| 2,670 | | * | | USANA Health Sciences, Inc | | | 314,339 | |
| | | | | | | | |
| | | | TOTAL HOUSEHOLD & PERSONAL PRODUCTS | | | 581,267 | |
| | | | | | | | |
| |
INSURANCE - 1.9% | | | | |
| 6,306 | | | | American Equity Investment Life Holding Co | | | 176,190 | |
| 2,600 | | | | Amerisafe, Inc | | | 147,394 | |
| 4,510 | | | | Axis Capital Holdings Ltd | | | 232,896 | |
| 3,300 | | | | Employers Holdings, Inc | | | 138,501 | |
| 4,462 | | | | Universal Insurance Holdings, Inc | | | 169,199 | |
| | | | | | | | |
| | | | TOTAL INSURANCE | | | 864,180 | |
| | | | | | | | |
| |
MATERIALS - 3.5% | | | | |
| 5,770 | | | | Boise Cascade Co | | | 137,615 | |
| 10,700 | | * | | Ferroglobe plc | | | 0 | |
| 3,710 | | * | | Ingevity Corp | | | 310,490 | |
| 1,937 | | * | | Koppers Holdings, Inc | | | 33,006 | |
| 2,850 | | | | Materion Corp | | | 128,222 | |
| 1,900 | | | | Reliance Steel & Aluminum Co | | | 135,223 | |
| 9,379 | | | | Schnitzer Steel Industries, Inc (Class A) | | | 202,117 | |
| 2,260 | | | | Stepan Co | | | 167,240 | |
| 4,900 | | * | | SunCoke Energy, Inc | | | 41,895 | |
18
TIAA-CREF LIFE FUNDS -Small-Cap Equity Fund
| | | | | | | | |
SHARES | | | | COMPANY | | VALUE | |
| | | | | | | | |
| 3,100 | | | | Trinseo S.A. | | $ | 141,918 | |
| 3,000 | | | | Tronox Ltd | | | 23,340 | |
| 2,350 | | * | | US Concrete, Inc | | | 82,908 | |
| 4,920 | | * | | Verso Corp | | | 110,208 | |
| 3,730 | | | | Worthington Industries, Inc | | | 129,953 | |
| | | | | | | | |
| | | | TOTAL MATERIALS | | | 1,644,135 | |
| | | | | | | | |
| |
MEDIA & ENTERTAINMENT - 1.3% | | | | |
| 460 | | * | | Cargurus, Inc | | | 15,516 | |
| 7,910 | | * | | Imax Corp | | | 148,787 | |
| 950 | | * | | Madison Square Garden Co | | | 254,315 | |
| 2,830 | | | | World Wrestling Entertainment, Inc (Class A) | | | 211,458 | |
| | | | | | | | |
| | | | TOTAL MEDIA & ENTERTAINMENT | | | 630,076 | |
| | | | | | �� | | |
| |
PHARMACEUTICALS, BIOTECHNOLOGY & LIFE SCIENCES - 9.1% | | | | |
| 24,407 | | * | | Achillion Pharmaceuticals, Inc | | | 38,807 | |
| 1,000 | | * | | Acorda Therapeutics, Inc | | | 15,580 | |
| 1,600 | | * | | Akorn, Inc | | | 5,424 | |
| 4,500 | | * | | AMAG Pharmaceuticals, Inc | | | 68,355 | |
| 5,200 | | * | | Amicus Therapeutics, Inc | | | 49,816 | |
| 1,250 | | * | | Amneal Pharmaceuticals, Inc | | | 16,912 | |
| 7,760 | | * | | Amphastar Pharmaceuticals, Inc | | | 154,424 | |
| 5,450 | | * | | Ardelyx, Inc | | | 9,755 | |
| 3,813 | | * | | Arena Pharmaceuticals, Inc | | | 148,516 | |
| 8,332 | | * | | Array Biopharma, Inc | | | 118,731 | |
| 1,100 | | * | | Assembly Biosciences, Inc | | | 24,882 | |
| 1,590 | | * | | Blueprint Medicines Corp | | | 85,717 | |
| 4,490 | | * | | Calithera Biosciences, Inc | | | 18,005 | |
| 5,460 | | * | | CareDx, Inc | | | 137,264 | |
| 5,039 | | * | | Concert Pharmaceuticals Inc | | | 63,239 | |
| 1,500 | | *,e | | Corcept Therapeutics, Inc | | | 20,040 | |
| 1,670 | | * | | CytomX Therapeutics, Inc | | | 25,217 | |
| 2,720 | | * | | Editas Medicine, Inc | | | 61,880 | |
| 1,100 | | * | | Enanta Pharmaceuticals, Inc | | | 77,913 | |
| 10,040 | | * | | Endo International plc | | | 73,292 | |
| 1,846 | | * | | FibroGen, Inc | | | 85,433 | |
| 4,570 | | * | | Five Prime Therapeutics, Inc | | | 42,501 | |
| 2,300 | | * | | Genomic Health, Inc | | | 148,143 | |
| 3,430 | | * | | Global Blood Therapeutics, Inc | | | 140,802 | |
| 6,460 | | * | | Halozyme Therapeutics, Inc | | | 94,510 | |
| 1,600 | | * | | Heron Therapeutics, Inc | | | 41,504 | |
| 13,640 | | * | | Horizon Pharma plc | | | 266,526 | |
| 16,060 | | * | | Immunogen, Inc | | | 77,088 | |
| 1,790 | | * | | Insmed, Inc | | | 23,485 | |
| 4,544 | | * | | Intersect ENT, Inc | | | 128,050 | |
| 10,940 | | * | | Invitae Corp | | | 120,996 | |
| 6,600 | | * | | Iovance Biotherapeutics, Inc | | | 58,410 | |
| 3,600 | | * | | Karyopharm Therapeutics, Inc | | | 33,732 | |
| 3,300 | | | | Luminex Corp | | | 76,263 | |
| 1,800 | | * | | Medicines Co | | | 34,452 | |
| 3,310 | | * | | Medpace Holdings, Inc | | | 175,198 | |
| 1,770 | | * | | Momenta Pharmaceuticals, Inc | | | 19,541 | |
| 1,300 | | * | | MyoKardia, Inc | | | 63,518 | |
| 4,900 | | * | | Natera, Inc | | | 68,404 | |
| 4,800 | | * | | NeoGenomics, Inc | | | 60,528 | |
| 4,640 | | | | Phibro Animal Health Corp | | | 149,222 | |
| 1,700 | | *,e | | Portola Pharmaceuticals, Inc | | | 33,184 | |
| 3,090 | | * | | PTC Therapeutics, Inc | | | 106,049 | |
| 2,300 | | * | | Puma Biotechnology, Inc | | | 46,805 | |
| 6,200 | | * | | Radius Health, Inc | | | 102,238 | |
| 2,700 | | * | | REGENXBIO, Inc | | | 113,265 | |
| 4,490 | | * | | Retrophin, Inc | | | 101,609 | |
| 2,210 | | * | | Sangamo Biosciences, Inc | | | 25,371 | |
| 5,050 | | * | | Spectrum Pharmaceuticals, Inc | | | 44,188 | |
19
TIAA-CREF LIFE FUNDS -Small-Cap Equity Fund
| | | | | | | | |
SHARES | | | | COMPANY | | VALUE | |
| | | | | | | | |
| 4,594 | | * | | Syneos Health, Inc | | $ | 180,774 | |
| 1,098 | | * | | Ultragenyx Pharmaceutical, Inc | | | 47,741 | |
| 8,090 | | * | | Vanda Pharmaceuticals, Inc | | | 211,392 | |
| 6,620 | | * | | Vericel Corp | | | 115,188 | |
| | | | | | | | |
| | | | TOTAL PHARMACEUTICALS, BIOTECHNOLOGY & LIFE SCIENCES | | | 4,249,879 | |
| | | | | | | | |
| |
REAL ESTATE - 7.9% | | | | |
| 5,470 | | | | American Assets Trust, Inc | | | 219,730 | |
| 4,800 | | | | Americold Realty Trust | | | 122,592 | |
| 11,740 | | | | CareTrust REIT, Inc | | | 216,720 | |
| 4,620 | | | | Chatham Lodging Trust | | | 81,682 | |
| 33,150 | | | | Cousins Properties, Inc | | | 261,885 | |
| 14,750 | | | | DiamondRock Hospitality Co | | | 133,930 | |
| 3,560 | | | | EastGroup Properties, Inc | | | 326,559 | |
| 7,760 | | | | First Industrial Realty Trust, Inc | | | 223,954 | |
| 13,580 | | | | Geo Group, Inc | | | 267,526 | |
| 1,500 | | | | Innovative Industrial Properties, Inc | | | 68,085 | |
| 8,210 | | | | Monmouth Real Estate Investment Corp (Class A) | | | 101,804 | |
| 7,280 | | | | National Storage Affiliates Trust | | | 192,629 | |
| 6,160 | | | | Newmark Group, Inc | | | 49,403 | |
| 7,150 | | | | Pebblebrook Hotel Trust | | | 202,417 | |
| 6,766 | | | | Potlatch Corp | | | 214,076 | |
| 9,790 | | | | Preferred Apartment Communities, Inc | | | 137,647 | |
| 2,519 | | | | PS Business Parks, Inc | | | 329,989 | |
| 3,670 | | | | Ryman Hospitality Properties | | | 244,752 | |
| 2,195 | | | | Saul Centers, Inc | | | 103,648 | |
| 8,960 | | | | Xenia Hotels & Resorts, Inc | | | 154,112 | |
| | | | | | | | |
| | | | TOTAL REAL ESTATE | | | 3,653,140 | |
| | | | | | | | |
| |
RETAILING - 3.8% | | | | |
| 390 | | | | Aaron’s, Inc | | | 16,399 | |
| 5,690 | | | | Abercrombie & Fitch Co (Class A) | | | 114,085 | |
| 1,900 | | | | American Eagle Outfitters, Inc | | | 36,727 | |
| 5,214 | | * | | At Home Group, Inc | | | 97,293 | |
| 7,170 | | * | | BJ’s Wholesale Club Holdings, Inc | | | 158,887 | |
| 6,120 | | * | | Boot Barn Holdings, Inc | | | 104,224 | |
| 5,200 | | | | Caleres, Inc | | | 144,716 | |
| 720 | | | | Children’s Place Retail Stores, Inc | | | 64,865 | |
| 2,590 | | * | | Etsy, Inc | | | 123,206 | |
| 3,660 | | * | | Five Below, Inc | | | 374,491 | |
| 10,100 | | * | | Groupon, Inc | | | 32,320 | |
| 1,800 | | | | Lithia Motors, Inc (Class A) | | | 137,394 | |
| 6,080 | | *,e | | Lumber Liquidators, Inc | | | 57,882 | |
| 800 | | * | | Ollie’s Bargain Outlet Holdings, Inc | | | 53,208 | |
| 300 | | * | | RH | | | 35,946 | |
| 800 | | * | | Stamps.com, Inc | | | 124,512 | |
| 5,460 | | * | | Zumiez, Inc | | | 104,668 | |
| | | | | | | | |
| | | | TOTAL RETAILING | | | 1,780,823 | |
| | | | | | | | |
| |
SEMICONDUCTORS & SEMICONDUCTOR EQUIPMENT - 2.6% | | | | |
| 2,595 | | | | Cabot Microelectronics Corp | | | 247,433 | |
| 1,860 | | * | | Ceva, Inc | | | 41,087 | |
| 3,020 | | | | Cohu, Inc | | | 48,531 | |
| 3,660 | | * | | Diodes, Inc | | | 118,071 | |
| 1,230 | | | | Entegris, Inc | | | 34,311 | |
| 14,830 | | * | | Lattice Semiconductor Corp | | | 102,624 | |
| 14,210 | | * | | Rambus, Inc | | | 108,991 | |
| 5,910 | | * | | Semtech Corp | | | 271,092 | |
| 2,912 | | * | | Silicon Laboratories, Inc | | | 229,495 | |
| | | | | | | | |
| | | | TOTAL SEMICONDUCTORS & SEMICONDUCTOR EQUIPMENT | | | 1,201,635 | |
| | | | | | | | |
| |
SOFTWARE & SERVICES - 7.6% | | | | |
| 1,800 | | * | | Appfolio, Inc | | | 106,596 | |
20
TIAA-CREF LIFE FUNDS -Small-Cap Equity Fund
| | | | | | | | | | | | | | | | |
SHARES | | | | COMPANY | | | | | | | | VALUE | |
| | | | | | | | | | | | | | |
| 1,380 | | * | | CACI International, Inc (Class A) | | | | | | | | | | $ | 198,761 | |
| 14,630 | | * | | Cloudera, Inc | | | | | | | | | | | 161,808 | |
| 900 | | * | | Cornerstone OnDemand, Inc | | | | | | | | | | | 45,387 | |
| 700 | | * | | Coupa Software, Inc | | | | | | | | | | | 44,002 | |
| 3,500 | | *,e | | Domo, Inc | | | | | | | | | | | 68,705 | |
| 9,821 | | | | EVERTEC, Inc | | | | | | | | | | | 281,863 | |
| 6,310 | | * | | Five9, Inc | | | | | | | | | | | 275,873 | |
| 1,790 | | * | | HubSpot, Inc | | | | | | | | | | | 225,057 | |
| 700 | | * | | Imperva, Inc | | | | | | | | | | | 38,983 | |
| 3,410 | | | | Mantech International Corp (Class A) | | | | | | | | | | | 178,326 | |
| 2,140 | | * | | New Relic, Inc | | | | | | | | | | | 173,276 | |
| 4,245 | | * | | Paylocity Holding Corp | | | | | | | | | | | 255,591 | |
| 1,800 | | * | | Proofpoint, Inc | | | | | | | | | | | 150,858 | |
| 380 | | * | | Qualys, Inc | | | | | | | | | | | 28,401 | |
| 2,000 | | * | | SendGrid, Inc | | | | | | | | | | | 86,340 | |
| 2,120 | | * | | SPS Commerce, Inc | | | | | | | | | | | 174,646 | |
| 3,950 | | * | | Tenable Holdings, Inc | | | | | | | | | | | 87,650 | |
| 6,900 | | | | TiVo Corp | | | | | | | | | | | 64,929 | |
| 2,560 | | * | | Trade Desk, Inc | | | | | | | | | | | 297,114 | |
| 800 | | * | | Varonis Systems, Inc | | | | | | | | | | | 42,320 | |
| 6,790 | | * | | Verint Systems, Inc | | | | | | | | | | | 287,285 | |
| 3,690 | | * | | Virtusa Corp | | | | | | | | | | | 157,157 | |
| 3,360 | | * | | Workiva, Inc | | | | | | | | | | | 120,590 | |
| | | | | | | | | | | | | | | | |
| | | | TOTAL SOFTWARE & SERVICES | | | | | | | | | | | 3,551,518 | |
| | | | | | | | | | | | | | | | |
| | |
TECHNOLOGY HARDWARE & EQUIPMENT - 5.2% | | | | | | | | | |
| 3,600 | | *,e | | Applied Optoelectronics, Inc | | | | | | | | | | | 55,548 | |
| 3,186 | | | | AVX Corp | | | | | | | | | | | 48,586 | |
| 6,999 | | * | | Ciena Corp | | | | | | | | | | | 237,336 | |
| 6,680 | | * | | Control4 Corp | | | | | | | | | | | 117,568 | |
| 710 | | * | | Electro Scientific Industries, Inc | | | | | | | | | | | 21,272 | |
| 25,080 | | * | | Extreme Networks, Inc | | | | | | | | | | | 152,988 | |
| 4,860 | | * | | II-VI, Inc | | | | | | | | | | | 157,756 | |
| 4,780 | | * | | Insight Enterprises, Inc | | | | | | | | | | | 194,785 | |
| 8,860 | | | | Kemet Corp | | | | | | | | | | | 155,404 | |
| 3,190 | | * | | OSI Systems, Inc | | | | | | | | | | | 233,827 | |
| 7,100 | | * | | Sanmina Corp | | | | | | | | | | | 170,826 | |
| 3,410 | | | | SYNNEX Corp | | | | | | | | | | | 275,665 | |
| 850 | | * | | Tech Data Corp | | | | | | | | | | | 69,538 | |
| 5,420 | | * | | TTM Technologies, Inc | | | | | | | | | | | 52,737 | |
| 22,670 | | * | | Viavi Solutions, Inc | | | | | | | | | | | 227,834 | |
| 12,240 | | | | Vishay Intertechnology, Inc | | | | | | | | | | | 220,442 | |
| | | | | | | | | | | | | | | | |
| | | | TOTAL TECHNOLOGY HARDWARE & EQUIPMENT | | | | | | | | | | | 2,392,112 | |
| | | | | | | | | | | | | | | | |
| | |
TELECOMMUNICATION SERVICES - 0.6% | | | | | | | | | |
| 31,112 | | * | | Vonage Holdings Corp | | | | | | | | | | | 271,608 | |
| | | | | | | | | | | | | | | | |
| | | | TOTAL TELECOMMUNICATION SERVICES | | | | | | | | | | | 271,608 | |
| | | | | | | | | | | | | | | | |
| | |
TRANSPORTATION - 2.0% | | | | | | | | | |
| 4,370 | | * | | Air Transport Services Group, Inc | | | | | | | | | | | 99,680 | |
| 2,510 | | | | Arkansas Best Corp | | | | | | | | | | | 85,993 | |
| 9,850 | | * | | Echo Global Logistics, Inc | | | | | | | | | | | 200,250 | |
| 3,790 | | * | | Hub Group, Inc (Class A) | | | | | | | | | | | 140,495 | |
| 4,627 | | | | Skywest, Inc | | | | | | | | | | | 205,763 | |
| 7,630 | | | | Werner Enterprises, Inc | | | | | | | | | | | 225,390 | |
| | | | | | | | | | | | | | | | |
| | | | TOTAL TRANSPORTATION | | | | 957,571 | |
| | | | | | | | | |
| | | |
UTILITIES - 4.1% | | | | | | | | | | | | |
| 8,977 | | | | Clearway Energy, Inc (Class A) | | | | | | | | | | | 151,891 | |
| 7,570 | | | | New Jersey Resources Corp | | | | | | | | | | | 345,722 | |
| 4,837 | | | | NorthWestern Corp | | | | | | | | | | | 287,511 | |
| 4,020 | | | | Otter Tail Corp | | | | | | | | | | | 199,553 | |
| 1,580 | | | | Pattern Energy Group, Inc | | | | | | | | | | | 29,419 | |
21
TIAA-CREF LIFE FUNDS -Small-Cap Equity Fund
| | | | | | | | | | | | | | | | |
SHARES | | | | COMPANY | | | | | | | | VALUE | |
| | | | | | | | | | | | | | |
| 4,974 | | | | PNM Resources, Inc | | | | | | | | | | $ | 204,382 | |
| 8,300 | | | | Portland General Electric Co | | | | | | | | | | | 380,555 | |
| 4,043 | | | | Southwest Gas Corp | | | | | | | | | | | 309,290 | |
| | | | | | | | | | | | | | | | |
| | | | TOTAL UTILITIES | | | | 1,908,323 | |
| | | | | | | | | |
| | | | TOTAL COMMON STOCKS | | | | 46,248,925 | |
| | | | | | | | | |
| | | | (Cost $48,748,848) | | | | | | | | | | | | |
| | | | | | | | | | | | | | | | |
PRINCIPAL | | ISSUER | | RATE | | | MATURITY
DATE | | | | |
| | | | | | | | | | | | | | |
SHORT-TERM INVESTMENTS - 1.0% | | | | | |
| |
GOVERNMENT AGENCY DEBT - 0.3% | | | | | |
| $ 160,000 | | | | Federal Home Loan Bank (FHLB) | | | 2.150 | % | | | 01/02/19 | | | | 160,000 | |
| | | | | | | | | | | | | | | | |
| | | | TOTAL GOVERNMENT AGENCY DEBT | | | | 160,000 | |
| | | | | | | | | |
| | | | | | | | | | | | | | | | |
| | | | | | | | | | | | | | |
SHARES | | | | COMPANY | | | | | | | | | |
| | | | | | | | | | | | | | |
INVESTMENTS IN REGISTERED INVESTMENT COMPANIES - 0.7% | | | | | |
| 303,146 | | c | | State Street Navigator Securities Lending Government Money Market Portfolio | | | | | | | | | | | 303,146 | |
| | | | | | | | | | | | | | | | |
| | | | TOTAL INVESTMENTS IN REGISTERED INVESTMENT COMPANIES | | | | 303,146 | |
| | | | | | | | | |
| | | | TOTAL SHORT-TERM INVESTMENTS | | | | | | | | | | | 463,146 | |
| | | | | | | | | | | | | | | | |
| | | | (Cost $463,136) | | | | | | | | | | | | |
| | | | TOTAL INVESTMENTS - 100.6%
(Cost $49,211,984) | | | | 46,712,071 | |
| | | | OTHER ASSETS & LIABILITIES, NET - (0.6)% | | | | (287,317 | ) |
| | | | | | | | | |
| | | | NET ASSETS - 100.0% | | | | | | | | | | $ | 46,424,754 | |
| | | | | | | | | | | | | | | | |
Abbreviation(s):
| REIT | Real Estate Investment Trust |
| c | Investments made with cash collateral received from securities on loan. |
| e | All or a portion of these securities are out on loan. The aggregate value of securities on loan is $303,730. |
22
TIAA-CREF LIFE FUNDS -Social Choice Equity Fund
TIAA-CREF LIFE FUNDS
SOCIAL CHOICE EQUITY FUND
SCHEDULE OF INVESTMENTS
December 31, 2018
| | | | | | | | |
SHARES | | | | COMPANY | | VALUE | |
| | | | | | | | |
COMMON STOCKS - 98.4% | | | | |
| |
AUTOMOBILES & COMPONENTS - 0.5% | | | | |
| 114 | | | | BorgWarner, Inc | | $ | 3,960 | |
| 862 | | | | Delphi Automotive plc | | | 53,073 | |
| 1,191 | | | | Harley-Davidson, Inc | | | 40,637 | |
| 292 | | * | | Modine Manufacturing Co | | | 3,157 | |
| 28 | | | | Tenneco, Inc | | | 767 | |
| 656 | | * | | Tesla, Inc | | | 218,317 | |
| | | | | | | | |
| | | | TOTAL AUTOMOBILES & COMPONENTS | | | 319,911 | |
| | | | | | | | |
| |
BANKS - 4.7% | | | | |
| 312 | | | | Ameris Bancorp | | | 9,881 | |
| 885 | | | | Associated Banc-Corp | | | 17,514 | |
| 30,027 | | | | Bank of America Corp | | | 739,865 | |
| 131 | | | | Bank OZK | | | 2,991 | |
| 5,872 | | | | BB&T Corp | | | 254,375 | |
| 7,007 | | | | Citizens Financial Group, Inc | | | 208,318 | |
| 1,993 | | | | Comerica, Inc | | | 136,899 | |
| 134 | | | | Commerce Bancshares, Inc | | | 7,554 | |
| 69 | | | | Cullen/Frost Bankers, Inc | | | 6,068 | |
| 590 | | * | | Customers Bancorp, Inc | | | 10,738 | |
| 246 | | | | Federal Agricultural Mortgage Corp (Class C) | | | 14,868 | |
| 3,032 | | | | Fifth Third Bancorp | | | 71,343 | |
| 425 | | | | First Republic Bank | | | 36,933 | |
| 244 | | | | Heritage Financial Corp | | | 7,252 | |
| 577 | | * | | HomeStreet, Inc | | | 12,250 | |
| 251 | | | | HomeTrust Bancshares, Inc | | | 6,571 | |
| 11,595 | | | | Keycorp | | | 171,374 | |
| 329 | | | | Live Oak Bancshares, Inc | | | 4,872 | |
| 1,570 | | | | M&T Bank Corp | | | 224,714 | |
| 528 | | * | | MGIC Investment Corp | | | 5,523 | |
| 314 | | * | | NMI Holdings, Inc | | | 5,605 | |
| 479 | | | | Northfield Bancorp, Inc | | | 6,490 | |
| 1,023 | | | | OFG Bancorp | | | 16,839 | |
| 145 | | | | Old National Bancorp | | | 2,233 | |
| 417 | | | | Opus Bank | | | 8,169 | |
| 199 | | | | PacWest Bancorp | | | 6,623 | |
| 189 | | | | People’s United Financial, Inc | | | 2,727 | |
| 498 | | | | Pinnacle Financial Partners, Inc | | | 22,958 | |
| 2,981 | | | | PNC Financial Services Group, Inc | | | 348,509 | |
| 476 | | | | Popular, Inc | | | 22,477 | |
| 10,924 | | | | Regions Financial Corp | | | 146,163 | |
| 130 | | | | Stock Yards Bancorp, Inc | | | 4,264 | |
| 297 | | * | | SVB Financial Group | | | 56,406 | |
| 567 | | * | | The Bancorp, Inc | | | 4,513 | |
| 538 | | * | | Tristate Capital Holdings, Inc | | | 10,469 | |
| 50 | | | | UMB Financial Corp | | | 3,049 | |
| 102 | | | | United Bankshares, Inc | | | 3,173 | |
| 107 | | | | Webster Financial Corp | | | 5,274 | |
| 49 | | | | Westamerica Bancorporation | | | 2,728 | |
| 110 | | * | | Western Alliance Bancorp | | | 4,344 | |
| 290 | | | | Zions Bancorporation | | | 11,815 | |
| | | | | | | | |
| | | | TOTAL BANKS | | | 2,644,731 | |
| | | | | | | | |
| |
CAPITAL GOODS - 6.0% | | | | |
| 2,599 | | | | 3M Co | | | 495,214 | |
| 200 | | | | Air Lease Corp | | | 6,042 | |
| 155 | | | | Argan, Inc | | | 5,865 | |
23
TIAA-CREF LIFE FUNDS -Social Choice Equity Fund
| | | | | | | | |
SHARES | | | | COMPANY | | VALUE | |
| | | | | | | | |
| 151 | | * | | Astronics Corp | | $ | 4,598 | |
| 519 | | * | | Axon Enterprise, Inc | | | 22,706 | |
| 999 | | | | Barnes Group, Inc | | | 53,566 | |
| 77 | | | | Briggs & Stratton Corp | | | 1,007 | |
| 716 | | * | | Builders FirstSource, Inc | | | 7,812 | |
| 2,847 | | | | Caterpillar, Inc | | | 361,768 | |
| 601 | | | | Cummins, Inc | | | 80,318 | |
| 138 | | | | Curtiss-Wright Corp | | | 14,093 | |
| 1,749 | | | | Deere & Co | | | 260,898 | |
| 2,481 | | | | Eaton Corp | | | 170,345 | |
| 799 | | * | | Esterline Technologies Corp | | | 97,039 | |
| 1,141 | | | | Fastenal Co | | | 59,663 | |
| 674 | | | | Fortive Corp | | | 45,603 | |
| 492 | | | | Graco, Inc | | | 20,590 | |
| 407 | | * | | Herc Holdings, Inc | | | 10,578 | |
| 372 | | | | Hexcel Corp | | | 21,330 | |
| 2,558 | | | | Illinois Tool Works, Inc | | | 324,073 | |
| 1,052 | | | | Ingersoll-Rand plc | | | 95,974 | |
| 4,137 | | | | Johnson Controls International plc | | | 122,662 | |
| 254 | | * | | KEYW Holding Corp, The | | | 1,699 | |
| 844 | | | | L3 Technologies, Inc | | | 146,569 | |
| 2,644 | | | | Masco Corp | | | 77,311 | |
| 181 | | * | | Mercury Systems, Inc | | | 8,559 | |
| 44 | | * | | Meritor, Inc | | | 744 | |
| 1,438 | | | | PACCAR, Inc | | | 82,167 | |
| 600 | | | | Parker-Hannifin Corp | | | 89,484 | |
| 1,590 | | *,e | | Plug Power, Inc | | | 1,972 | |
| 1,029 | | * | | Quanta Services, Inc | | | 30,973 | |
| 538 | | | | Rockwell Automation, Inc | | | 80,958 | |
| 549 | | | | Roper Industries, Inc | | | 146,319 | |
| 339 | | * | | Sensata Technologies Holding plc | | | 15,201 | |
| 85 | | | | Snap-On, Inc | | | 12,350 | |
| 1,173 | | | | Spirit Aerosystems Holdings, Inc (Class A) | | | 84,562 | |
| 79 | | | | Stanley Works | | | 9,459 | |
| 717 | | * | | Teledyne Technologies, Inc | | | 148,469 | |
| 233 | | * | | Titan Machinery, Inc | | | 3,064 | |
| 298 | | * | | United Rentals, Inc | | | 30,554 | |
| 141 | | * | | Veritiv Corp | | | 3,521 | |
| 194 | | | | W.W. Grainger, Inc | | | 54,778 | |
| 913 | | * | | Wesco Aircraft Holdings, Inc | | | 7,213 | |
| 212 | | | | Woodward Governor Co | | | 15,749 | |
| 433 | | | | Xylem, Inc | | | 28,890 | |
| | | | | | | | |
| | | | TOTAL CAPITAL GOODS | | | 3,362,309 | |
| | | | | | | | |
| |
COMMERCIAL & PROFESSIONAL SERVICES - 1.2% | | | | |
| 590 | | | | ACCO Brands Corp | | | 4,000 | |
| 122 | | * | | Cimpress NV | | | 12,617 | |
| 4,161 | | * | | Copart, Inc | | | 198,813 | |
| 20 | | | | Deluxe Corp | | | 769 | |
| 236 | | | | Exponent, Inc | | | 11,968 | |
| 112 | | | | Heidrick & Struggles International, Inc | | | 3,493 | |
| 274 | | * | | Huron Consulting Group, Inc | | | 14,059 | |
| 4,051 | | * | | IHS Markit Ltd | | | 194,326 | |
| 148 | | | | Insperity, Inc | | | 13,817 | |
| 220 | | | | Manpower, Inc | | | 14,256 | |
| 1,064 | | | | Robert Half International, Inc | | | 60,861 | |
| 93 | | | | RR Donnelley & Sons Co | | | 368 | |
| 730 | | *,e | | Team, Inc | | | 10,695 | |
| 1,832 | | | | TransUnion | | | 104,058 | |
| | | | | | | | |
| | | | TOTAL COMMERCIAL & PROFESSIONAL SERVICES | | | 644,100 | |
| | | | | | | | |
| |
CONSUMER DURABLES & APPAREL - 1.4% | | | | |
| 200 | | | | Callaway Golf Co | | | 3,060 | |
| 354 | | * | | Century Communities, Inc | | | 6,110 | |
24
TIAA-CREF LIFE FUNDS -Social Choice Equity Fund
| | | | | | | | |
SHARES | | | | COMPANY | | VALUE | |
| | | | | | | | |
| 10 | | | | Columbia Sportswear Co | | $ | 841 | |
| 14 | | * | | Deckers Outdoor Corp | | | 1,791 | |
| 886 | | * | | Fossil Group, Inc | | | 13,937 | |
| 306 | | * | | Green Brick Partners, Inc | | | 2,215 | |
| 616 | | | | Hanesbrands, Inc | | | 7,718 | |
| 13 | | | | Hasbro, Inc | | | 1,056 | |
| 200 | | *,e | | iRobot Corp | | | 16,748 | |
| 399 | | | | Lennar Corp (Class A) | | | 15,621 | |
| 69 | | *,e | | LGI Homes, Inc | | | 3,120 | |
| 169 | | * | | Lululemon Athletica, Inc | | | 20,552 | |
| 931 | | * | | Mattel, Inc | | | 9,301 | |
| 72 | | * | | Meritage Homes Corp | | | 2,644 | |
| 255 | | * | | Mohawk Industries, Inc | | | 29,825 | |
| 200 | | | | Movado Group, Inc | | | 6,324 | |
| 2,264 | | | | Newell Rubbermaid, Inc | | | 42,088 | |
| 6,390 | | | | Nike, Inc (Class B) | | | 473,755 | |
| 2 | | | | Tupperware Corp | | | 63 | |
| 841 | | * | | Under Armour, Inc | | | 13,599 | |
| 1,121 | | * | | Under Armour, Inc (Class A) | | | 19,808 | |
| 1,190 | | | | VF Corp | | | 84,895 | |
| 105 | | | | Whirlpool Corp | | | 11,221 | |
| | | | | | | | |
| | | | TOTAL CONSUMER DURABLES & APPAREL | | | 786,292 | |
| | | | | | | | |
| |
CONSUMER SERVICES - 2.3% | | | | |
| 506 | | | | ARAMARK Holdings Corp | | | 14,659 | |
| 356 | | | | Carriage Services, Inc | | | 5,518 | |
| 78 | | * | | Chipotle Mexican Grill, Inc (Class A) | | | 33,680 | |
| 424 | | | | Choice Hotels International, Inc | | | 30,350 | |
| 659 | | | | Darden Restaurants, Inc | | | 65,808 | |
| 13 | | | | DineEquity, Inc | | | 875 | |
| 175 | | * | | El Pollo Loco Holdings, Inc | | | 2,655 | |
| 282 | | * | | frontdoor, Inc | | | 7,504 | |
| 2,182 | | | | Hilton Worldwide Holdings, Inc | | | 156,667 | |
| 535 | | * | | Houghton Mifflin Harcourt Co | | | 4,740 | |
| 2,806 | | | | Marriott International, Inc (Class A) | | | 304,619 | |
| 907 | | * | | Norwegian Cruise Line Holdings Ltd | | | 38,448 | |
| 1,008 | | | | Royal Caribbean Cruises Ltd | | | 98,572 | |
| 304 | | | | Service Corp International | | | 12,239 | |
| 564 | | * | | ServiceMaster Global Holdings, Inc | | | 20,721 | |
| 7,017 | | | | Starbucks Corp | | | 451,895 | |
| 123 | | | | Vail Resorts, Inc | | | 25,931 | |
| | | | | | | | |
| | | | TOTAL CONSUMER SERVICES | | | 1,274,881 | |
| | | | | | | | |
| |
DIVERSIFIED FINANCIALS - 6.3% | | | | |
| 879 | | | | Ally Financial, Inc | | | 19,918 | |
| 4,130 | | | | American Express Co | | | 393,672 | |
| 541 | | | | Ameriprise Financial, Inc | | | 56,464 | |
| 6,213 | | | | Bank of New York Mellon Corp | | | 292,446 | |
| 792 | | | | BlackRock, Inc | | | 311,113 | |
| 3,090 | | | | Capital One Financial Corp | | | 233,573 | |
| 6,934 | | | | Charles Schwab Corp | | | 287,969 | |
| 2,131 | | | | CME Group, Inc | | | 400,884 | |
| 3,243 | | | | Discover Financial Services | | | 191,272 | |
| 78 | | | | Factset Research Systems, Inc | | | 15,610 | |
| 1,515 | | | | Franklin Resources, Inc | | | 44,935 | |
| 221 | | * | | Green Dot Corp | | | 17,574 | |
| 2,613 | | | | Invesco Ltd | | | 43,742 | |
| 566 | | | | Legg Mason, Inc | | | 14,439 | |
| 604 | | | | Moody’s Corp | | | 84,584 | |
| 7,701 | | | | Morgan Stanley | | | 305,345 | |
| 2,135 | | | | Northern Trust Corp | | | 178,465 | |
| 1,162 | | * | | On Deck Capital, Inc | | | 6,856 | |
| 1,934 | | | | S&P Global, Inc | | | 328,664 | |
| 2,223 | | | | State Street Corp | | | 140,204 | |
25
TIAA-CREF LIFE FUNDS -Social Choice Equity Fund
| | | | | | | | |
SHARES | | | | COMPANY | | VALUE | |
| | | | | | | | |
| 885 | | | | T Rowe Price Group, Inc | | $ | 81,703 | |
| 1,229 | | | | TD Ameritrade Holding Corp | | | 60,172 | |
| 131 | | | | Voya Financial, Inc | | | 5,258 | |
| | | | | | | | |
| | | | TOTAL DIVERSIFIED FINANCIALS | | | 3,514,862 | |
| | | | | | | | |
| |
ENERGY - 4.7% | | | | |
| 2,382 | | * | | Antero Resources Corp | | | 22,367 | |
| 1,431 | | | | Apache Corp | | | 37,564 | |
| 49 | | | | Archrock, Inc | | | 367 | |
| 2,780 | | | | Baker Hughes a GE Co | | | 59,770 | |
| 388 | | * | | Bonanza Creek Energy, Inc | | | 8,020 | |
| 1,014 | | * | | California Resources Corp | | | 17,279 | |
| 1,609 | | * | | Cheniere Energy, Inc | | | 95,237 | |
| 255 | | | | Cimarex Energy Co | | | 15,721 | |
| 6,779 | | | | ConocoPhillips | | | 422,670 | |
| 441 | | *,e | | Covia Holdings Corp | | | 1,508 | |
| 170 | | | | Delek US Holdings, Inc | | | 5,527 | |
| 10,026 | | * | | Denbury Resources, Inc | | | 17,144 | |
| 2,704 | | | | Devon Energy Corp | | | 60,948 | |
| 950 | | | | EQT Corp | | | 17,945 | |
| 374 | | * | | Exterran Corp | | | 6,620 | |
| 777 | | * | | Forum Energy Technologies, Inc | | | 3,209 | |
| 484 | | | | Green Plains Renewable Energy, Inc | | | 6,345 | |
| 1,309 | | * | | Helix Energy Solutions Group, Inc | | | 7,082 | |
| 1,422 | | | | Hess Corp | | | 57,591 | |
| 20,579 | | | | Kinder Morgan, Inc | | | 316,505 | |
| 4,723 | | | | Marathon Oil Corp | | | 67,728 | |
| 22 | | * | | Matrix Service Co | | | 395 | |
| 1,290 | | * | | McDermott International, Inc | | | 8,437 | |
| 3,642 | | | | National Oilwell Varco, Inc | | | 93,599 | |
| 204 | | * | | Natural Gas Services Group, Inc | | | 3,354 | |
| 555 | | * | | Newpark Resources, Inc | | | 3,813 | |
| 2,029 | | | | Noble Energy, Inc | | | 38,064 | |
| 1,018 | | * | | Oasis Petroleum, Inc | | | 5,630 | |
| 5,256 | | | | Occidental Petroleum Corp | | | 322,613 | |
| 4 | | * | | Oceaneering International, Inc | | | 48 | |
| 2 | | * | | Oil States International, Inc | | | 29 | |
| 2,755 | | | | Oneok, Inc | | | 148,632 | |
| 172 | | | | PBF Energy, Inc | | | 5,619 | |
| 866 | | | | Pioneer Natural Resources Co | | | 113,896 | |
| 679 | | * | | Renewable Energy Group, Inc | | | 17,450 | |
| 8,128 | | | | Schlumberger Ltd | | | 293,258 | |
| 16 | | | | SM Energy Co | | | 248 | |
| 2,403 | | * | | Southwestern Energy Co | | | 8,194 | |
| 2,933 | | * | | Superior Energy Services | | | 9,826 | |
| 1,777 | | * | | Tetra Technologies, Inc | | | 2,985 | |
| 243 | | *,e | | Tidewater, Inc | | | 4,649 | |
| 987 | | * | | Unit Corp | | | 14,094 | |
| 259 | | e | | US Silica Holdings Inc | | | 2,637 | |
| 3,452 | | | | Valero Energy Corp | | | 258,796 | |
| 1,480 | | | | Williams Cos, Inc | | | 32,634 | |
| 388 | | | | World Fuel Services Corp | | | 8,307 | |
| | | | | | | | |
| | | | TOTAL ENERGY | | | 2,644,354 | |
| | | | | | | | |
| |
FOOD & STAPLES RETAILING - 0.6% | | | | |
| 626 | | | | Casey’s General Stores, Inc | | | 80,216 | |
| 467 | | * | | Chefs’ Warehouse Holdings, Inc | | | 14,935 | |
| 142 | | | | Pricesmart, Inc | | | 8,392 | |
| 358 | | | | Spartan Stores, Inc | | | 6,150 | |
| 2,120 | | * | | Sprouts Farmers Market, Inc | | | 49,841 | |
| 954 | | * | | United Natural Foods, Inc | | | 10,103 | |
| 4,359 | | * | | US Foods Holding Corp | | | 137,919 | |
| | | | | | | | |
| | | | TOTAL FOOD & STAPLES RETAILING | | | 307,556 | |
| | | | | | | | |
26
TIAA-CREF LIFE FUNDS -Social Choice Equity Fund
| | | | | | | | |
SHARES | | | | COMPANY | | VALUE | |
| | | | | | | | |
FOOD, BEVERAGE & TOBACCO - 3.7% | | | | |
| 430 | | | | Bunge Ltd | | $ | 22,979 | |
| 1,318 | | | | Campbell Soup Co | | | 43,481 | |
| 13,819 | | | | Coca-Cola Co | | | 654,330 | |
| 3,975 | | | | General Mills, Inc | | | 154,787 | |
| 1,482 | | | | Hormel Foods Corp | | | 63,252 | |
| 2,128 | | | | Kellogg Co | | | 121,317 | |
| 122 | | | | McCormick & Co, Inc | | | 16,987 | |
| 9,639 | | | | Mondelez International, Inc | | | 385,849 | |
| 5,470 | | | | PepsiCo, Inc | | | 604,325 | |
| | | | | | | | |
| | | | TOTAL FOOD, BEVERAGE & TOBACCO | | | 2,067,307 | |
| | | | | | | | |
| |
HEALTH CARE EQUIPMENT & SERVICES - 6.8% | | | | |
| 323 | | * | | Abiomed, Inc | | | 104,988 | |
| 390 | | * | | Acadia Healthcare Co, Inc | | | 10,027 | |
| 611 | | * | | Accuray, Inc | | | 2,084 | |
| 741 | | * | | Align Technology, Inc | | | 155,188 | |
| 358 | | * | | Amedisys, Inc | | | 41,925 | |
| 389 | | * | | AMN Healthcare Services, Inc | | | 22,041 | |
| 863 | | * | | Angiodynamics, Inc | | | 17,372 | |
| 551 | | * | | athenahealth, Inc | | | 72,693 | |
| 633 | | * | | AtriCure, Inc | | | 19,370 | |
| 1,764 | | | | Becton Dickinson & Co | | | 397,464 | |
| 61 | | * | | BioTelemetry, Inc | | | 3,643 | |
| 386 | | * | | Brookdale Senior Living, Inc | | | 2,586 | |
| 650 | | * | | Capital Senior Living Corp | | | 4,420 | |
| 2,583 | | | | Cardinal Health, Inc | | | 115,202 | |
| 1,907 | | * | | Centene Corp | | | 219,877 | |
| 1,952 | | * | | Cerner Corp | | | 102,363 | |
| 1,662 | | * | | Cerus Corp | | | 8,426 | |
| 16 | | | | Cigna Corp | | | 3,039 | |
| 327 | | * | | Civitas Solutions, Inc | | | 5,726 | |
| 270 | | | | Computer Programs & Systems, Inc | | | 6,777 | |
| 193 | | | | Cooper Cos, Inc | | | 49,118 | |
| 2,896 | | | | CVS Health Corp | | | 189,746 | |
| 791 | | | | Dentsply Sirona, Inc | | | 29,433 | |
| 1,347 | | * | | Edwards Lifesciences Corp | | | 206,320 | |
| 1,269 | | * | | GenMark Diagnostics, Inc | | | 6,167 | |
| 178 | | * | | Glaukos Corp | | | 9,998 | |
| 31 | | * | | Haemonetics Corp | | | 3,102 | |
| 1,941 | | | | HCA Holdings, Inc | | | 241,557 | |
| 294 | | * | | Henry Schein, Inc | | | 23,085 | |
| 84 | | * | | HMS Holdings Corp | | | 2,363 | |
| 1,250 | | * | | Hologic, Inc | | | 51,375 | |
| 1,125 | | | | Humana, Inc | | | 322,290 | |
| 601 | | * | | IDEXX Laboratories, Inc | | | 111,798 | |
| 257 | | * | | Integer Holding Corp | | | 19,599 | |
| 661 | | * | | Laboratory Corp of America Holdings | | | 83,524 | |
| 166 | | | | LeMaitre Vascular, Inc | | | 3,924 | |
| 362 | | * | | LHC Group, Inc | | | 33,985 | |
| 85 | | * | | LivaNova plc | | | 7,775 | |
| 162 | | * | | Magellan Health Services, Inc | | | 9,216 | |
| 59 | | * | | Medidata Solutions, Inc | | | 3,978 | |
| 356 | | * | | Merit Medical Systems, Inc | | | 19,868 | |
| 645 | | * | | Omnicell, Inc | | | 39,500 | |
| 1,080 | | * | | OraSure Technologies, Inc | | | 12,614 | |
| 61 | | | | Owens & Minor, Inc | | | 386 | |
| 324 | | * | | Premier, Inc | | | 12,101 | |
| 290 | | * | | Providence Service Corp | | | 17,406 | |
| 269 | | | | Quest Diagnostics, Inc | | | 22,400 | |
| 545 | | | | Resmed, Inc | | | 62,059 | |
| 126 | | * | | Staar Surgical Co | | | 4,021 | |
| 391 | | *,e | | Surgery Partners, Inc | | | 3,828 | |
| 330 | | * | | Tactile Systems Technology, Inc | | | 15,031 | |
27
TIAA-CREF LIFE FUNDS -Social Choice Equity Fund
| | | | | | | | |
SHARES | | | | COMPANY | | VALUE | |
| | | | | | | | |
| 728 | | * | | Teladoc, Inc | | $ | 36,087 | |
| 515 | | * | | Tivity Health, Inc | | | 12,777 | |
| 571 | | * | | Triple-S Management Corp (Class B) | | | 9,930 | |
| 2,971 | | | | UnitedHealth Group, Inc | | | 740,136 | |
| 179 | | | | US Physical Therapy, Inc | | | 18,321 | |
| 158 | | * | | Varian Medical Systems, Inc | | | 17,903 | |
| 552 | | * | | Vocera Communications, Inc | | | 21,721 | |
| | | | | | | | |
| | | | TOTAL HEALTH CARE EQUIPMENT & SERVICES | | | 3,789,653 | |
| | | | | | | | |
| |
HOUSEHOLD & PERSONAL PRODUCTS - 2.2% | | | | |
| 5 | | | | Clorox Co | | | 771 | |
| 4,305 | | | | Colgate-Palmolive Co | | | 256,234 | |
| 953 | | | | Estee Lauder Cos (Class A) | | | 123,985 | |
| 864 | | | | Kimberly-Clark Corp | | | 98,444 | |
| 8,393 | | | | Procter & Gamble Co | | | 771,484 | |
| | | | | | | | |
| | | | TOTAL HOUSEHOLD & PERSONAL PRODUCTS | | | 1,250,918 | |
| | | | | | | | |
| |
INSURANCE - 3.8% | | | | |
| 965 | | | | Allstate Corp | | | 79,738 | |
| 7,504 | | | | American International Group, Inc | | | 295,733 | |
| 497 | | | | Aspen Insurance Holdings Ltd | | | 20,869 | |
| 3,084 | | | | Chubb Ltd | | | 398,391 | |
| 2,720 | | | | Loews Corp | | | 123,814 | |
| 3,846 | | | | Marsh & McLennan Cos, Inc | | | 306,719 | |
| 1,069 | | | | Principal Financial Group | | | 47,218 | |
| 5,139 | | | | Progressive Corp | | | 310,036 | |
| 3,377 | | | | Prudential Financial, Inc | | | 275,394 | |
| 2,224 | | | | Travelers Cos, Inc | | | 266,324 | |
| | | | | | | | |
| | | | TOTAL INSURANCE | | | 2,124,236 | |
| | | | | | | | |
| |
MATERIALS - 3.1% | | | | |
| 1,619 | | | | Air Products & Chemicals, Inc | | | 259,121 | |
| 47 | | | | Aptargroup, Inc | | | 4,421 | |
| 1,098 | | | | Ball Corp | | | 50,486 | |
| 6 | | | | Bemis Co, Inc | | | 275 | |
| 432 | | | | Celanese Corp (Series A) | | | 38,867 | |
| 483 | | * | | Century Aluminum Co | | | 3,531 | |
| 295 | | * | | Clearwater Paper Corp | | | 7,189 | |
| 749 | | | | Commercial Metals Co | | | 11,999 | |
| 2,326 | | | | Ecolab, Inc | | | 342,736 | |
| 288 | | | | H.B. Fuller Co | | | 12,289 | |
| 72 | | | | International Flavors & Fragrances, Inc | | | 9,667 | |
| 1,738 | | | | International Paper Co | | | 70,146 | |
| 2,246 | | | | Linde plc | | | 350,466 | |
| 678 | | | | Louisiana-Pacific Corp | | | 15,065 | |
| 20 | | | | Martin Marietta Materials, Inc | | | 3,437 | |
| 281 | | | | Minerals Technologies, Inc | | | 14,427 | |
| 1,894 | | | | Mosaic Co | | | 55,324 | |
| 2,234 | | | | Newmont Mining Corp | | | 77,408 | |
| 3,363 | | | | Nucor Corp | | | 174,237 | |
| 58 | | | | Reliance Steel & Aluminum Co | | | 4,128 | |
| 942 | | | | Royal Gold, Inc | | | 80,682 | |
| 157 | | | | Sealed Air Corp | | | 5,470 | |
| 392 | | * | | Summit Materials, Inc | | | 4,861 | |
| 107 | | | | Trinseo S.A. | | | 4,898 | |
| 195 | | * | | US Concrete, Inc | | | 6,880 | |
| 452 | | | | Vulcan Materials Co | | | 44,658 | |
| 1,435 | | | | WestRock Co | | | 54,186 | |
| | | | | | | | |
| | | | TOTAL MATERIALS | | | 1,706,854 | |
| | | | | | | | |
| |
MEDIA & ENTERTAINMENT - 4.9% | | | | |
| 634 | | * | | Alphabet, Inc (Class A) | | | 662,505 | |
| 661 | | * | | Alphabet, Inc (Class C) | | | 684,538 | |
28
TIAA-CREF LIFE FUNDS -Social Choice Equity Fund
| | | | | | | | |
SHARES | | | | COMPANY | | VALUE | |
| | | | | | | | |
| 156 | | | | Cinemark Holdings, Inc | | $ | 5,585 | |
| 1,162 | | | | Clear Channel Outdoor Holdings, Inc (Class A) | | | 6,031 | |
| 2,993 | | * | | Discovery, Inc (Class A) | | | 74,047 | |
| 3,550 | | * | | Discovery, Inc (Class C) | | | 81,934 | |
| 1,519 | | | | Entravision Communications Corp (Class A) | | | 4,420 | |
| 1,552 | | * | | Gray Television, Inc | | | 22,876 | |
| 398 | | | | Interpublic Group of Cos, Inc | | | 8,211 | |
| 83 | | | | John Wiley & Sons, Inc (Class A) | | | 3,899 | |
| 2,043 | | * | | Liberty Broadband Corp (Class C) | | | 147,157 | |
| 675 | | * | | Live Nation, Inc | | | 33,244 | |
| 1,879 | | * | | NetFlix, Inc | | | 502,933 | |
| 1,293 | | | | New York Times Co (Class A) | | | 28,821 | |
| 1,742 | | | | Omnicom Group, Inc | | | 127,584 | |
| 2,998 | | * | | Pandora Media, Inc | | | 24,254 | |
| 610 | | | | Sinclair Broadcast Group, Inc (Class A) | | | 16,067 | |
| 33,102 | | e | | Sirius XM Holdings, Inc | | | 189,012 | |
| 106 | | | | Tribune Co | | | 4,810 | |
| 1,239 | | * | | TripAdvisor, Inc | | | 66,832 | |
| 402 | | | | World Wrestling Entertainment, Inc (Class A) | | | 30,037 | |
| | | | | | | | |
| | | | TOTAL MEDIA & ENTERTAINMENT | | | 2,724,797 | |
| | | | | | | | |
| |
PHARMACEUTICALS, BIOTECHNOLOGY & LIFE SCIENCES - 8.6% | | | | |
| 4,427 | | | | AbbVie, Inc | | | 408,125 | |
| 907 | | * | | Acadia Pharmaceuticals, Inc | | | 14,666 | |
| 157 | | * | | Acceleron Pharma, Inc | | | 6,837 | |
| 120 | | * | | Acorda Therapeutics, Inc | | | 1,870 | |
| 2,616 | | | | Agilent Technologies, Inc | | | 176,475 | |
| 244 | | * | | Agios Pharmaceuticals, Inc | | | 11,251 | |
| 1,264 | | * | | Akorn, Inc | | | 4,285 | |
| 2,834 | | | | Amgen, Inc | | | 551,695 | |
| 744 | | * | | Bellicum Pharmaceuticals, Inc | | | 2,173 | |
| 1,565 | | * | | BioCryst Pharmaceuticals, Inc | | | 12,630 | |
| 934 | | * | | Biogen Idec, Inc | | | 281,059 | |
| 773 | | * | | BioMarin Pharmaceutical, Inc | | | 65,821 | |
| 156 | | * | | Bluebird Bio, Inc | | | 15,475 | |
| 7,021 | | | | Bristol-Myers Squibb Co | | | 364,951 | |
| 3,262 | | * | | Celgene Corp | | | 209,062 | |
| 729 | | * | | Coherus Biosciences, Inc | | | 6,598 | |
| 225 | | * | | Collegium Pharmaceutical, Inc | | | 3,863 | |
| 4,451 | | | | Eli Lilly & Co | | | 515,070 | |
| 70 | | *,e | | Esperion Thereapeutics, Inc | | | 3,220 | |
| 492 | | * | | FibroGen, Inc | | | 22,770 | |
| 4,732 | | | | Gilead Sciences, Inc | | | 295,987 | |
| 186 | | * | | Halozyme Therapeutics, Inc | | | 2,721 | |
| 682 | | * | | Illumina, Inc | | | 204,552 | |
| 343 | | * | | Inovio Pharmaceuticals, Inc | | | 1,372 | |
| 335 | | * | | Intersect ENT, Inc | | | 9,440 | |
| 116 | | * | | Intra-Cellular Therapies, Inc | | | 1,321 | |
| 715 | | * | | Iovance Biotherapeutics, Inc | | | 6,328 | |
| 947 | | * | | IQVIA Holdings, Inc | | | 110,013 | |
| 80 | | * | | Mettler-Toledo International, Inc | | | 45,246 | |
| 789 | | * | | Nektar Therapeutics | | | 25,934 | |
| 1,079 | | * | | Opko Health, Inc | | | 3,248 | |
| 1,704 | | * | | Progenics Pharmaceuticals, Inc | | | 7,157 | |
| 281 | | * | | Prothena Corp plc | | | 2,894 | |
| 89 | | * | | Sage Therapeutics, Inc | | | 8,525 | |
| 656 | | * | | Sangamo Biosciences, Inc | | | 7,531 | |
| 278 | | * | | Sarepta Therapeutics, Inc | | | 30,338 | |
| 9,373 | | | | Schering-Plough Corp | | | 716,191 | |
| 69 | | * | | Spark Therapeutics, Inc | | | 2,701 | |
| 204 | | *,e | | TESARO, Inc | | | 15,147 | |
| 527 | | *,e | | Theravance Biopharma, Inc | | | 13,486 | |
| 327 | | * | | Ultragenyx Pharmaceutical, Inc | | | 14,218 | |
| 1,209 | | * | | Vertex Pharmaceuticals, Inc | | | 200,343 | |
29
TIAA-CREF LIFE FUNDS -Social Choice Equity Fund
| | | | | | | | |
SHARES | | | | COMPANY | | VALUE | |
| | | | | | | | |
| 272 | | * | | Waters Corp | | $ | 51,313 | |
| 3,978 | | | | Zoetis, Inc | | | 340,278 | |
| | | | | | | | |
| | | | TOTAL PHARMACEUTICALS, BIOTECHNOLOGY & LIFE SCIENCES | | | 4,794,180 | |
| | | | | | | | |
| |
REAL ESTATE - 3.7% | | | | |
| 203 | | *,e | | Altisource Portfolio Solutions S.A. | | | 4,565 | |
| 455 | | | | American Campus Communities, Inc | | | 18,832 | |
| 2,700 | | | | American Tower Corp | | | 427,113 | |
| 1,054 | | | | Boston Properties, Inc | | | 118,628 | |
| 511 | | | | CatchMark Timber Trust Inc | | | 3,628 | |
| 1,526 | | * | | CBRE Group, Inc | | | 61,101 | |
| 339 | | | | Coresite Realty | | | 29,571 | |
| 78 | | | | Digital Realty Trust, Inc | | | 8,311 | |
| 165 | | | | Douglas Emmett, Inc | | | 5,631 | |
| 1,428 | | | | Duke Realty Corp | | | 36,985 | |
| 581 | | | | Easterly Government Properties, Inc | | | 9,110 | |
| 603 | | | | Equinix, Inc | | | 212,594 | |
| 997 | | | | First Industrial Realty Trust, Inc | | | 28,773 | |
| 3,362 | | | | HCP, Inc | | | 93,901 | |
| 2,800 | | | | Host Marriott Corp | | | 46,676 | |
| 504 | | * | | Howard Hughes Corp | | | 49,200 | |
| 1,339 | | | | Iron Mountain, Inc | | | 43,397 | |
| 903 | | | | iStar Financial, Inc | | | 8,280 | |
| 32 | | | | Jones Lang LaSalle, Inc | | | 4,051 | |
| 14 | | | | Kilroy Realty Corp | | | 880 | |
| 325 | | | | Liberty Property Trust | | | 13,611 | |
| 642 | | | | NorthStar Realty Europe Corp | | | 9,335 | |
| 5,300 | | | | Prologis, Inc | | | 311,216 | |
| 296 | | | | QTS Realty Trust, Inc | | | 10,967 | |
| 129 | | | | Realogy Holdings Corp | | | 1,894 | |
| 110 | | | | RMR Group, Inc | | | 5,839 | |
| 786 | | * | | SBA Communications Corp | | | 127,246 | |
| 91 | | | | Senior Housing Properties Trust | | | 1,067 | |
| 760 | | | | Tier REIT, Inc | | | 15,679 | |
| 924 | | | | UDR, Inc | | | 36,609 | |
| 17 | | | | Washington REIT | | | 391 | |
| 3,419 | | | | Welltower, Inc | | | 237,313 | |
| 2,602 | | | | Weyerhaeuser Co | | | 56,880 | |
| | | | | | | | |
| | | | TOTAL REAL ESTATE | | | 2,039,274 | |
| | | | | | | | |
| |
RETAILING - 5.2% | | | | |
| 77 | | | | Aaron’s, Inc | | | 3,238 | |
| 366 | | | | Advance Auto Parts, Inc | | | 57,630 | |
| 1,012 | | | | Best Buy Co, Inc | | | 53,596 | |
| 248 | | * | | Booking Holdings, Inc | | | 427,160 | |
| 785 | | * | | CarMax, Inc | | | 49,243 | |
| 1,291 | | * | | Etsy, Inc | | | 61,413 | |
| 2,323 | | | | Expedia, Inc | | | 261,686 | |
| 44 | | * | | Five Below, Inc | | | 4,502 | |
| 1,834 | | | | Gap, Inc | | | 47,244 | |
| 202 | | * | | Genesco, Inc | | | 8,949 | |
| 259 | | *,e | | GNC Holdings, Inc | | | 614 | |
| 9,910 | | * | | Groupon, Inc | | | 31,712 | |
| 345 | | * | | Hibbett Sports, Inc | | | 4,933 | |
| 3,937 | | | | Home Depot, Inc | | | 676,455 | |
| 1,655 | | | | Kohl’s Corp | | | 109,793 | |
| 91 | | *,e | | Lands’ End, Inc | | | 1,293 | |
| 1,082 | | * | | LKQ Corp | | | 25,676 | |
| 4,400 | | | | Lowe’s Companies, Inc | | | 406,384 | |
| 535 | | | | Nordstrom, Inc | | | 24,936 | |
| 1,231 | | | | Nutri/System, Inc | | | 54,016 | |
| 125 | | | | Office Depot, Inc | | | 322 | |
| 1,613 | | * | | Quotient Technology, Inc | | | 17,227 | |
| 390 | | * | | Rent-A-Center, Inc | | | 6,314 | |
30
TIAA-CREF LIFE FUNDS -Social Choice Equity Fund
| | | | | | | | |
SHARES | | | | COMPANY | | VALUE | |
| | | | | | | | |
| 2,468 | | | | Ross Stores, Inc | | $ | 205,338 | |
| 149 | | | | Shoe Carnival, Inc | | | 4,993 | |
| 1,193 | | * | | Shutterfly, Inc | | | 48,030 | |
| 1,153 | | | | Target Corp | | | 76,202 | |
| 194 | | | | Tiffany & Co | | | 15,619 | |
| 1,800 | | | | TJX Companies, Inc | | | 80,532 | |
| 202 | | | | Tractor Supply Co | | | 16,855 | |
| 316 | | * | | Ulta Beauty, Inc | | | 77,369 | |
| 435 | | e | | Williams-Sonoma, Inc | | | 21,946 | |
| 56 | | | | Winmark Corp | | | 8,904 | |
| | | | | | | | |
| | | | TOTAL RETAILING | | | 2,890,124 | |
| | | | | | | | |
| |
SEMICONDUCTORS & SEMICONDUCTOR EQUIPMENT - 3.0% | | | | |
| 5,713 | | | | Applied Materials, Inc | | | 187,044 | |
| 149 | | * | | Cirrus Logic, Inc | | | 4,944 | |
| 207 | | * | | First Solar, Inc | | | 8,788 | |
| 243 | | * | | Integrated Device Technology, Inc | | | 11,768 | |
| 14,248 | | | | Intel Corp | | | 668,659 | |
| 804 | | | | Lam Research Corp | | | 109,481 | |
| 2,044 | | | | NVIDIA Corp | | | 272,874 | |
| 4,677 | | | | Texas Instruments, Inc | | | 441,976 | |
| | | | | | | | |
| | | | TOTAL SEMICONDUCTORS & SEMICONDUCTOR EQUIPMENT | | | 1,705,534 | |
| | | | | | | | |
| |
SOFTWARE & SERVICES - 11.3% | | | | |
| 3,178 | | | | Accenture plc | | | 448,130 | |
| 1,435 | | * | | Adobe, Inc | | | 324,654 | |
| 1,686 | | * | | Autodesk, Inc | | | 216,837 | |
| 634 | | * | | Benefitfocus, Inc | | | 28,987 | |
| 4,365 | | * | | Black Knight, Inc | | | 196,687 | |
| 366 | | | | Blackbaud, Inc | | | 23,021 | |
| 3,936 | | | | Booz Allen Hamilton Holding Co | | | 177,396 | |
| 1,656 | | * | | Cadence Design Systems, Inc | | | 72,003 | |
| 4,496 | | * | | Conduent, Inc | | | 47,793 | |
| 790 | | | | CSG Systems International, Inc | | | 25,098 | |
| 397 | | *,e | | Ellie Mae, Inc | | | 24,944 | |
| 695 | | * | | ExlService Holdings, Inc | | | 36,571 | |
| 54 | | * | | Fair Isaac Corp | | | 10,098 | |
| 4,249 | | | | International Business Machines Corp | | | 482,984 | |
| 1,855 | | | | Intuit, Inc | | | 365,157 | |
| 2,985 | | * | | Limelight Networks, Inc | | | 6,985 | |
| 986 | | | | LogMeIn, Inc | | | 80,428 | |
| 18,808 | | d | | Microsoft Corp | | | 1,910,329 | |
| 860 | | * | | MINDBODY, Inc | | | 31,304 | |
| 953 | | * | | New Relic, Inc | | | 77,164 | |
| 885 | | * | | Nutanix, Inc | | | 36,807 | |
| 496 | | * | | OneSpan, Inc | | | 6,423 | |
| 11,697 | | | | Oracle Corp | | | 528,119 | |
| 231 | | * | | Paycom Software, Inc | | | 28,286 | |
| 55 | | * | | Paylocity Holding Corp | | | 3,312 | |
| 194 | | * | | Perficient, Inc | | | 4,318 | |
| 417 | | * | | Qualys, Inc | | | 31,167 | |
| 733 | | * | | Rapid7, Inc | | | 22,840 | |
| 1,109 | | * | | RingCentral, Inc | | | 91,426 | |
| 3,560 | | * | | salesforce.com, Inc | | | 487,613 | |
| 727 | | | | Science Applications International Corp | | | 46,310 | |
| 659 | | * | | SPS Commerce, Inc | | | 54,288 | |
| 977 | | * | | Sykes Enterprises, Inc | | | 24,161 | |
| 356 | | * | | Tableau Software, Inc | | | 42,720 | |
| 2,401 | | * | | Teradata Corp | | | 92,102 | |
| 663 | | | | TiVo Corp | | | 6,239 | |
| 2,655 | | | | Travelport Worldwide Ltd | | | 41,471 | |
| 130 | | | | TTEC Holdings, Inc | | | 3,714 | |
| 771 | | * | | Twilio, Inc | | | 68,850 | |
| 166 | | * | | Ultimate Software Group, Inc | | | 40,648 | |
31
TIAA-CREF LIFE FUNDS -Social Choice Equity Fund
| | | | | | | | | | | | | | | | |
SHARES | | | | COMPANY | | | | | | | | VALUE | |
| | | | | | | | | | | | | | |
| 533 | | * | | Virtusa Corp | | | | | | | | | | $ | 22,701 | |
| 406 | | * | | Zendesk, Inc | | | | | | | | | | | 23,698 | |
| | | | | | | | | | | | | | | | |
| | | | TOTAL SOFTWARE & SERVICES | | | | | | | | | | | 6,293,783 | |
| | | | | | | | | | | | | | | | |
| | | |
TECHNOLOGY HARDWARE & EQUIPMENT - 6.5% | | | | | | | | | | | | |
| 130 | | * | | Anixter International, Inc | | | | | | | | | | | 7,060 | |
| 11,196 | | | | Apple, Inc | | | | | | | | | | | 1,766,057 | |
| 41 | | | | Belden CDT, Inc | | | | | | | | | | | 1,713 | |
| 1,563 | | | | Benchmark Electronics, Inc | | | | | | | | | | | 33,104 | |
| 16,094 | | | | Cisco Systems, Inc | | | | | | | | | | | 697,353 | |
| 27 | | * | | Coherent, Inc | | | | | | | | | | | 2,854 | |
| 622 | | * | | Cray, Inc | | | | | | | | | | | 13,429 | |
| 413 | | | | CTS Corp | | | | | | | | | | | 10,693 | |
| 483 | | | | Daktronics, Inc | | | | | | | | | | | 3,574 | |
| 1,665 | | | | Dolby Laboratories, Inc (Class A) | | | | | | | | | | | 102,964 | |
| 841 | | * | | Fabrinet | | | | | | | | | | | 43,152 | |
| 257 | | * | | FARO Technologies, Inc | | | | | | | | | | | 10,444 | |
| 709 | | * | | Finisar Corp | | | | | | | | | | | 15,314 | |
| 13,019 | | | | Hewlett Packard Enterprise Co | | | | | | | | | | | 171,981 | |
| 14,545 | | | | HP, Inc | | | | | | | | | | | 297,591 | |
| 117 | | * | | Insight Enterprises, Inc | | | | | | | | | | | 4,768 | |
| 43 | | | | InterDigital, Inc | | | | | | | | | | | 2,856 | |
| 440 | | * | | Itron, Inc | | | | | | | | | | | 20,808 | |
| 1,058 | | | | Kemet Corp | | | | | | | | | | | 18,557 | |
| 78 | | * | | Keysight Technologies, Inc | | | | | | | | | | | 4,842 | |
| 532 | | * | | Kimball Electronics, Inc | | | | | | | | | | | 8,241 | |
| 286 | | | | Littelfuse, Inc | | | | | | | | | | | 49,043 | |
| 77 | | * | | Lumentum Holdings, Inc | | | | | | | | | | | 3,235 | |
| 892 | | | | Motorola, Inc | | | | | | | | | | | 102,616 | |
| 1,811 | | | | National Instruments Corp | | | | | | | | | | | 82,183 | |
| 233 | | * | | Novanta, Inc | | | | | | | | | | | 14,679 | |
| 18 | | | | Plantronics, Inc | | | | | | | | | | | 596 | |
| 282 | | * | | Plexus Corp | | | | | | | | | | | 14,405 | |
| 228 | | * | | Rogers Corp | | | | | | | | | | | 22,586 | |
| 160 | | | | SYNNEX Corp | | | | | | | | | | | 12,934 | |
| 773 | | * | | Tech Data Corp | | | | | | | | | | | 63,239 | |
| 1,213 | | * | | TTM Technologies, Inc | | | | | | | | | | | 11,802 | |
| 1,315 | | | | Vishay Intertechnology, Inc | | | | | | | | | | | 23,683 | |
| | | | | | | | | | | | | | | | |
| | | | TOTAL TECHNOLOGY HARDWARE & EQUIPMENT | | | | | | | | | | | 3,638,356 | |
| | | | | | | | | | | | | | | | |
| | | |
TELECOMMUNICATION SERVICES - 1.6% | | | | | | | | | | | | |
| 263 | | * | | Boingo Wireless, Inc | | | | | | | | | | | 5,410 | |
| 9,634 | | | | CenturyLink, Inc | | | | | | | | | | | 145,955 | |
| 782 | | * | | Cincinnati Bell, Inc | | | | | | | | | | | 6,084 | |
| 275 | | | | Cogent Communications Group, Inc | | | | | | | | | | | 12,433 | |
| 1,171 | | | | Consolidated Communications Holdings, Inc | | | | | | | | | | | 11,570 | |
| 2,436 | | * | | Iridium Communications, Inc | | | | | | | | | | | 44,944 | |
| 1,351 | | * | | Orbcomm, Inc | | | | | | | | | | | 11,159 | |
| 21,764 | | * | | Sprint Corp | | | | | | | | | | | 126,667 | |
| 7,996 | | | | Verizon Communications, Inc | | | | | | | | | | | 449,535 | |
| 4,855 | | * | | Vonage Holdings Corp | | | | | | | | | | | 42,384 | |
| 3,204 | | * | | Zayo Group Holdings, Inc | | | | | | | | | | | 73,179 | |
| | | | | | | | | | | | | | | | |
| | | | TOTAL TELECOMMUNICATION SERVICES | | | | | | | | | | | 929,320 | |
| | | | | | | | | | | | | | | | |
| | | |
TRANSPORTATION - 2.6% | | | | | | | | | | | | |
| 6 | | | | CH Robinson Worldwide, Inc | | | | | | | | | | | 505 | |
| 3,327 | | | | CSX Corp | | | | | | | | | | | 206,706 | |
| 2,878 | | | | Delta Air Lines, Inc | | | | | | | | | | | 143,612 | |
| 299 | | * | | Hertz Global Holdings, Inc | | | | | | | | | | | 4,081 | |
| 1,005 | | | | Norfolk Southern Corp | | | | | | | | | | | 150,288 | |
| 6 | | | | Ryder System, Inc | | | | | | | | | | | 289 | |
| 3,152 | | | | Southwest Airlines Co | | | | | | | | | | | 146,505 | |
32
TIAA-CREF LIFE FUNDS -Social Choice Equity Fund
| | | | | | | | | | | | | | | | |
SHARES | | | | COMPANY | | | | | | | | VALUE | |
| | | | | | | | | | | | | | |
| 3,074 | | | | Union Pacific Corp | | | | | | | | | | $ | 424,919 | |
| 3,789 | | | | United Parcel Service, Inc (Class B) | | | | | | | | | | | 369,541 | |
| | | | | | | | | | | | | | | | |
| | | | TOTAL TRANSPORTATION | | | | 1,446,446 | |
| | | | | | | | | | | | | | | | |
UTILITIES - 3.7% | | | | | | | | | | | | |
| 3,952 | | | | American Electric Power Co, Inc | | | | | | | | | | | 295,372 | |
| 140 | | | | American Water Works Co, Inc | | | | | | | | | | | 12,708 | |
| 19 | | | | Avista Corp | | | | | | | | | | | 807 | |
| 3,041 | | | | Consolidated Edison, Inc | | | | | | | | | | | 232,515 | |
| 4,969 | | | | Dominion Resources, Inc | | | | | | | | | | | 355,085 | |
| 1,306 | | | | Edison International | | | | | | | | | | | 74,142 | |
| 2,470 | | | | Eversource Energy | | | | | | | | | | | 160,649 | |
| 3 | | | | Pinnacle West Capital Corp | | | | | | | | | | | 255 | |
| 2,215 | | | | Public Service Enterprise Group, Inc | | | | | | | | | | | 115,291 | |
| 1,863 | | | | Sempra Energy | | | | | | | | | | | 201,558 | |
| 579 | | | | South Jersey Industries, Inc | | | | | | | | | | | 16,096 | |
| 7,180 | | | | Southern Co | | | | | | | | | | | 315,346 | |
| 1,977 | | | | WEC Energy Group, Inc | | | | | | | | | | | 136,927 | |
| 3,128 | | | | Xcel Energy, Inc | | | | | | | | | | | 154,116 | |
| | | | | | | | | | | | | | | | |
| | | | TOTAL UTILITIES | | | | 2,070,867 | |
| | | | | | | | | | | | | | | | |
| | | | TOTAL COMMON STOCKS | | | | | | | | | | | 54,970,645 | |
| | | | | | | | | | | | | | | | |
| | | | (Cost $42,107,992) | | | | | | | | | | | | |
| | | | | | | | | | | | | | | | |
PRINCIPAL | | | | ISSUER | | RATE | | | MATURITY
DATE | | | | |
| | | | | | | | | | | | | | |
SHORT-TERM INVESTMENTS - 2.1% | |
| | | |
GOVERNMENT AGENCY DEBT - 1.5% | | | | | | | | | | | | |
| $ 860,000 | | | | Federal Home Loan Bank (FHLB) | | | 2.150 | % | | | 01/02/19 | | | | 860,000 | |
| | | | | | | | | | | | | | | | |
| | | | TOTAL GOVERNMENT AGENCY DEBT | | | | 860,000 | |
| | | | | | | | | | | | | | | | |
| | | | | | | | | | | | | | | | |
SHARES | | | | COMPANY | | | | | | | | | |
| | | | | | | | | | | | | | |
INVESTMENTS IN REGISTERED INVESTMENT COMPANIES - 0.6% | | | | | | | | | | | | |
| 325,548 | | c | | State Street Navigator Securities Lending Government Money Market Portfolio | | | | | | | | | | | 325,548 | |
| | | | | | | | | | | | | | | | |
| | | | TOTAL INVESTMENTS IN REGISTERED INVESTMENT COMPANIES | | | | | | | | | | | 325,548 | |
| | | | | | | | | | | | | | | | |
| | | | TOTAL SHORT-TERM INVESTMENTS | | | | | | | | | | | 1,185,548 | |
| | | | | | | | | | | | | | | | |
| | | | (Cost $1,185,496) | | | | | | | | | | | | |
| | | | TOTAL INVESTMENTS - 100.5%
(Cost $43,293,488) | | | | | | | | | | | 56,156,193 | |
| | | | OTHER ASSETS & LIABILITIES, NET - (0.5)% | | | | | | | | | | | (315,383 | ) |
| | | | | | | | | | | | | | | | |
| | | | NET ASSETS - 100.0% | | | | | | | | | | $ | 55,840,810 | |
| | | | | | | | | | | | | | | | |
Abbreviation(s):
| REIT | Real Estate Investment Trust |
| c | Investments made with cash collateral received from securities on loan. |
| d | All or a portion of these securities have been segregated to cover margin requirements on open futures contracts. |
| e | All or a portion of these securities are out on loan. The aggregate value of securities on loan is $313,300. |
Futures contracts outstanding as of December 31, 2018 were as follows (See Note 3):
| | | | | | | | | | | | | | | | | | |
| Description | | Number of
long (short)
contracts | | | Expiration date | | Notional
amount | | | Value | | | Unrealized
appreciation
(depreciation) | |
S&P 500 E Mini Index | | | 7 | | | 03/15/19 | | $ | 901,973 | | | $ | 876,820 | | | $ | (25,153 | ) |
33
TIAA-CREF LIFE FUNDS -Stock Index Fund
TIAA-CREF LIFE FUNDS
STOCK INDEX FUND
SCHEDULE OF INVESTMENTS
December 31, 2018
| | | | | | | | |
SHARES | | | | COMPANY | | VALUE | |
| | | | | | | |
COMMON STOCKS - 98.0% | | | | |
| |
AUTOMOBILES & COMPONENTS - 0.7% | | | | |
| 1,634 | | | | Adient plc | | $ | 24,608 | |
| 1,752 | | * | | American Axle & Manufacturing Holdings, Inc | | | 19,447 | |
| 3,646 | | | | BorgWarner, Inc | | | 126,662 | |
| 828 | | | | Cooper Tire & Rubber Co | | | 26,769 | |
| 274 | | * | | Cooper-Standard Holding, Inc | | | 17,021 | |
| 2,264 | | | | Dana Holding Corp | | | 30,858 | |
| 4,457 | | | | Delphi Automotive plc | | | 274,418 | |
| 407 | | * | | Dorman Products, Inc | | | 36,638 | |
| 64,435 | | | | Ford Motor Co | | | 492,928 | |
| 545 | | * | | Fox Factory Holding Corp | | | 32,084 | |
| 1,229 | | *,e | | Garrett Motion, Inc | | | 15,166 | |
| 21,821 | | | | General Motors Co | | | 729,912 | |
| 4,430 | | | | Gentex Corp | | | 89,530 | |
| 573 | | * | | Gentherm, Inc | | | 22,909 | |
| 3,947 | | | | Goodyear Tire & Rubber Co | | | 80,558 | |
| 2,737 | | | | Harley-Davidson, Inc | | | 93,386 | |
| 377 | | | | LCI Industries, Inc | | | 25,184 | |
| 1,077 | | | | Lear Corp | | | 132,320 | |
| 772 | | * | | Modine Manufacturing Co | | | 8,345 | |
| 292 | | * | | Motorcar Parts of America, Inc | | | 4,859 | |
| 209 | | * | | Shiloh Industries, Inc | | | 1,219 | |
| 514 | | | | Spartan Motors, Inc | | | 3,716 | |
| 330 | | | | Standard Motor Products, Inc | | | 15,982 | |
| 449 | | * | | Stoneridge, Inc | | | 11,068 | |
| 383 | | | | Superior Industries International, Inc | | | 1,842 | |
| 995 | | | | Tenneco, Inc | | | 27,253 | |
| 2,256 | | * | | Tesla, Inc | | | 750,797 | |
| 841 | | | | Thor Industries, Inc | | | 43,732 | |
| 321 | | | | Tower International, Inc | | | 7,640 | |
| 496 | | * | | Visteon Corp | | | 29,899 | |
| 486 | | | | Winnebago Industries, Inc | | | 11,766 | |
| | | | | | | | |
| | | | TOTAL AUTOMOBILES & COMPONENTS | | | 3,188,516 | |
| | | | | | | | |
| |
BANKS - 5.9% | | | | |
| 184 | | | | 1st Constitution Bancorp | | | 3,667 | |
| 254 | | | | 1st Source Corp | | | 10,246 | |
| 233 | | | | Access National Corp | | | 4,970 | |
| 95 | | | | ACNB Corp | | | 3,729 | |
| 166 | | * | | Allegiance Bancshares, Inc | | | 5,373 | |
| 197 | | | | Amalgamated Bank | | | 3,841 | |
| 127 | | | | American National Bankshares, Inc | | | 3,722 | |
| 563 | | | | Ameris Bancorp | | | 17,830 | |
| 129 | | | | Ames National Corp | | | 3,279 | |
| 179 | | | | Arrow Financial Corp | | | 5,732 | |
| 2,719 | | | | Associated Banc-Corp | | | 53,809 | |
| 318 | | * | | Atlantic Capital Bancshares, Inc | | | 5,206 | |
| 945 | | * | | Axos Financial, Inc | | | 23,795 | |
| 697 | | | | Banc of California, Inc | | | 9,277 | |
| 260 | | | | Bancfirst Corp | | | 12,974 | |
| 1,326 | | | | BancorpSouth Bank | | | 34,662 | |
| 153,546 | | | | Bank of America Corp | | | 3,783,373 | |
| 254 | | | | Bank of Commerce Holdings | | | 2,784 | |
| 677 | | | | Bank of Hawaii Corp | | | 45,576 | |
| 174 | | | | Bank of Marin Bancorp | | | 7,176 | |
| 838 | | | | Bank of NT Butterfield & Son Ltd | | | 26,271 | |
| 130 | | | | Bank of Princeton | | | 3,627 | |
34
TIAA-CREF LIFE FUNDS -Stock Index Fund
| | | | | | | | |
SHARES | | | | COMPANY | | VALUE | |
| | | | | | | |
| 2,233 | | | | Bank OZK | | $ | 50,979 | |
| 238 | | | | BankFinancial Corp | | | 3,558 | |
| 1,888 | | | | BankUnited | | | 56,527 | |
| 81 | | | | Bankwell Financial Group, Inc | | | 2,326 | |
| 511 | | | | Banner Corp | | | 27,328 | |
| 219 | | | | Bar Harbor Bankshares | | | 4,912 | |
| 163 | | * | | Baycom Corp | | | 3,764 | |
| 13,027 | | | | BB&T Corp | | | 564,330 | |
| 152 | | | | BCB Bancorp, Inc | | | 1,591 | |
| 1,199 | | | | Beneficial Bancorp, Inc | | | 17,134 | |
| 557 | | | | Berkshire Hills Bancorp, Inc | | | 15,022 | |
| 400 | | | | Blue Hills Bancorp, Inc | | | 8,536 | |
| 520 | | | | BOK Financial Corp | | | 38,132 | |
| 1,073 | | | | Boston Private Financial Holdings, Inc | | | 11,342 | |
| 287 | | | | Bridge Bancorp, Inc | | | 7,316 | |
| 385 | | * | | Bridgewater Bancshares, Inc | | | 4,062 | |
| 1,046 | | | | Brookline Bancorp, Inc | | | 14,456 | |
| 253 | | | | Bryn Mawr Bank Corp | | | 8,703 | |
| 124 | | * | | BSB Bancorp, Inc | | | 3,479 | |
| 147 | | | | Business First Bancshares, Inc | | | 3,562 | |
| 120 | | * | | Byline Bancorp, Inc | | | 1,999 | |
| 283 | | | | C&F Financial Corp | | | 15,058 | |
| 694 | | | | Cadence BanCorp | | | 11,645 | |
| 59 | | | | Cambridge Bancorp | | | 4,912 | |
| 238 | | | | Camden National Corp | | | 8,561 | |
| 156 | | | | Capital City Bank Group, Inc | | | 3,621 | |
| 2,332 | | | | Capitol Federal Financial | | | 29,780 | |
| 128 | | | | Capstar Financial Holdings, Inc | | | 1,885 | |
| 222 | | | | Carolina Financial Corp | | | 6,569 | |
| 1,496 | | | | Cathay General Bancorp | | | 50,161 | |
| 287 | | | | CBTX, Inc | | | 8,438 | |
| 1,466 | | | | Centerstate Banks of Florida, Inc | | | 30,845 | |
| 470 | | | | Central Pacific Financial Corp | | | 11,444 | |
| 161 | | | | Central Valley Community Bancorp | | | 3,038 | |
| 47 | | | | Century Bancorp, Inc | | | 3,183 | |
| 1,211 | | | | Chemical Financial Corp | | | 44,335 | |
| 46 | | | | Chemung Financial Corp | | | 1,900 | |
| 2,128 | | | | CIT Group, Inc | | | 81,439 | |
| 41,008 | | | | Citigroup, Inc | | | 2,134,877 | |
| 167 | | | | Citizens & Northern Corp | | | 4,414 | |
| 7,995 | | | | Citizens Financial Group, Inc | | | 237,691 | |
| 236 | | | | City Holding Co | | | 15,951 | |
| 157 | | | | Civista Bancshares, Inc | | | 2,735 | |
| 226 | | | | CNB Financial Corp | | | 5,187 | |
| 133 | | | | Codorus Valley Bancorp, Inc | | | 2,826 | |
| 1,129 | | | | Columbia Banking System, Inc | | | 40,971 | |
| 735 | | * | | Columbia Financial, Inc | | | 11,238 | |
| 2,897 | | | | Comerica, Inc | | | 198,995 | |
| 1,675 | | | | Commerce Bancshares, Inc | | | 94,420 | |
| 102 | | | | Commerce Union Bancshares, Inc | | | 2,350 | |
| 763 | | | | Community Bank System, Inc | | | 44,483 | |
| 338 | | * | | Community Bankers Trust Corp | | | 2,440 | |
| 61 | | | | Community Financial Corp | | | 1,784 | |
| 238 | | | | Community Trust Bancorp, Inc | | | 9,427 | |
| 422 | | | | ConnectOne Bancorp, Inc | | | 7,794 | |
| 77 | | | | County Bancorp, Inc | | | 1,337 | |
| 938 | | | | Cullen/Frost Bankers, Inc | | | 82,488 | |
| 438 | | * | | Customers Bancorp, Inc | | | 7,972 | |
| 1,534 | | | | CVB Financial Corp | | | 31,033 | |
| 500 | | | | Dime Community Bancshares | | | 8,490 | |
| 638 | | * | | Eagle Bancorp, Inc | | | 31,077 | |
| 2,453 | | | | East West Bancorp, Inc | | | 106,779 | |
| 100 | | * | | Entegra Financial Corp | | | 2,075 | |
| 147 | | | | Enterprise Bancorp, Inc | | | 4,728 | |
| 347 | | | | Enterprise Financial Services Corp | | | 13,058 | |
35
TIAA-CREF LIFE FUNDS -Stock Index Fund
| | | | | | | | |
SHARES | | | | COMPANY | | VALUE | |
| | | | | | | |
| 161 | | * | | Equity Bancshares, Inc | | $ | 5,675 | |
| 578 | | * | | Esquire Financial Holdings, Inc | | | 12,543 | |
| 127 | | | | ESSA Bancorp, Inc | | | 1,982 | |
| 1,561 | | * | | Essent Group Ltd | | | 53,355 | |
| 384 | | | | Evans Bancorp, Inc | | | 12,484 | |
| 144 | | | | Farmers & Merchants Bancorp, Inc | | | 5,543 | |
| 378 | | | | Farmers National Banc Corp | | | 4,816 | |
| 362 | | | | FB Financial Corp | | | 12,677 | |
| 661 | | * | | FCB Financial Holdings, Inc | | | 22,196 | |
| 139 | | | | Federal Agricultural Mortgage Corp (Class C) | | | 8,401 | |
| 44 | | e | | Fidelity D&D Bancorp, Inc | | | 2,824 | |
| 321 | | | | Fidelity Southern Corp | | | 8,352 | |
| 11,286 | | | | Fifth Third Bancorp | | | 265,560 | |
| 202 | | | | Financial Institutions, Inc | | | 5,191 | |
| 440 | | | | First Bancorp (NC) | | | 14,370 | |
| 3,399 | | | | First Bancorp (Puerto Rico) | | | 29,231 | |
| 162 | | | | First Bancorp, Inc | | | 4,261 | |
| 130 | | | | First Bancshares, Inc | | | 3,933 | |
| 354 | | | | First Bank | | | 4,290 | |
| 586 | | | | First Busey Corp | | | 14,380 | |
| 266 | | | | First Business Financial Services, Inc | | | 5,190 | |
| 117 | | | | First Choice Bancorp | | | 2,644 | |
| 136 | | | | First Citizens Bancshares, Inc (Class A) | | | 51,279 | |
| 1,371 | | | | First Commonwealth Financial Corp | | | 16,562 | |
| 242 | | | | First Community Bancshares, Inc | | | 7,618 | |
| 593 | | | | First Community Corp | | | 11,522 | |
| 312 | | | | First Defiance Financial Corp | | | 7,647 | |
| 1,384 | | | | First Financial Bancorp | | | 32,828 | |
| 987 | | | | First Financial Bankshares, Inc | | | 56,940 | |
| 188 | | | | First Financial Corp | | | 7,548 | |
| 130 | | | | First Financial Northwest, Inc | | | 2,011 | |
| 445 | | * | | First Foundation, Inc | | | 5,723 | |
| 64 | | e | | First Guaranty Bancshares, Inc | | | 1,485 | |
| 1,717 | | | | First Hawaiian, Inc | | | 38,650 | |
| 5,859 | | | | First Horizon National Corp | | | 77,104 | |
| 85 | | | | First Internet Bancorp | | | 1,737 | |
| 744 | | | | First Interstate Bancsystem, Inc | | | 27,201 | |
| 960 | | | | First Merchants Corp | | | 32,899 | |
| 93 | | | | FirstMid-Illinois Bancshares, Inc | | | 2,969 | |
| 1,595 | | | | First Midwest Bancorp, Inc | | | 31,597 | |
| 158 | | | | First Northwest Bancorp | | | 2,343 | |
| 321 | | | | First of Long Island Corp | | | 6,404 | |
| 2,649 | | | | First Republic Bank | | | 230,198 | |
| 610 | | * | | Flagstar Bancorp, Inc | | | 16,104 | |
| 358 | | | | Flushing Financial Corp | | | 7,708 | |
| 5,725 | | | | FNB Corp | | | 56,334 | |
| 206 | | * | | Franklin Financial Network, Inc | | | 5,432 | |
| 247 | | | | FS Bancorp, Inc | | | 10,591 | |
| 2,673 | | | | Fulton Financial Corp | | | 41,378 | |
| 325 | | | | German American Bancorp, Inc | | | 9,025 | |
| 1,494 | | | | Glacier Bancorp, Inc | | | 59,192 | |
| 161 | | | | Great Southern Bancorp, Inc | | | 7,411 | |
| 849 | | | | Great Western Bancorp, Inc | | | 26,531 | |
| 335 | | | | Green Bancorp, Inc | | | 5,742 | |
| 45 | | | | Greene County Bancorp, Inc | | | 1,400 | |
| 365 | | | | Guaranty Bancorp | | | 7,574 | |
| 26 | | | | Guaranty Bancshares, Inc | | | 775 | |
| 1,541 | | | | Hancock Holding Co | | | 53,396 | |
| 484 | | | | Hanmi Financial Corp | | | 9,535 | |
| 200 | | * | | HarborOne Bancorp, Inc | | | 3,178 | |
| 429 | | | | Heartland Financial USA, Inc | | | 18,855 | |
| 553 | | | | Heritage Commerce Corp | | | 6,271 | |
| 460 | | | | Heritage Financial Corp | | | 13,671 | |
| 1,168 | | | | Hilltop Holdings, Inc | | | 20,825 | |
| 22 | | | | Hingham Institution for Savings | | | 4,350 | |
36
TIAA-CREF LIFE FUNDS -Stock Index Fund
| | | | | | | | |
SHARES | | | | COMPANY �� | | VALUE | |
| | | | | | | |
| 89 | | | | Home Bancorp, Inc | | $ | 3,151 | |
| 2,960 | | | | Home Bancshares, Inc | | | 48,366 | |
| 314 | | * | | HomeStreet, Inc | | | 6,666 | |
| 265 | | | | HomeTrust Bancshares, Inc | | | 6,938 | |
| 1,956 | | | | Hope Bancorp, Inc | | | 23,198 | |
| 501 | | | | Horizon Bancorp | | | 7,906 | |
| 129 | | * | | Howard Bancorp, Inc | | | 1,845 | |
| 18,430 | | | | Huntington Bancshares, Inc | | | 219,686 | |
| 909 | | | | IBERIABANK Corp | | | 58,431 | |
| 171 | | *,e | | Impac Mortgage Holdings, Inc | | | 646 | |
| 399 | | | | Independent Bank Corp (MA) | | | 28,054 | |
| 308 | | | | Independent Bank Corp (MI) | | | 6,474 | |
| 324 | | | | Independent Bank Group, Inc | | | 14,829 | |
| 843 | | | | International Bancshares Corp | | | 28,999 | |
| 120 | | | | Investar Holding Corp | | | 2,976 | |
| 4,402 | | | | Investors Bancorp, Inc | | | 45,781 | |
| 55,545 | | | | JPMorgan Chase & Co | | | 5,422,303 | |
| 2,079 | | | | Kearny Financial Corp | | | 26,653 | |
| 17,530 | | | | Keycorp | | | 259,093 | |
| 584 | | | | Lakeland Bancorp, Inc | | | 8,649 | |
| 525 | | | | Lakeland Financial Corp | | | 21,084 | |
| 141 | | | | LCNB Corp | | | 2,136 | |
| 693 | | | | LegacyTexas Financial Group, Inc | | | 22,238 | |
| 125 | | *,e | | LendingTree, Inc | | | 27,446 | |
| 85 | | | | Level One Bancorp, Inc | | | 1,907 | |
| 310 | | | | Live Oak Bancshares, Inc | | | 4,591 | |
| 341 | | | | Luther Burbank Corp | | | 3,076 | |
| 2,442 | | | | M&T Bank Corp | | | 349,523 | |
| 400 | | | | Macatawa Bank Corp | | | 3,848 | |
| 101 | | * | | Malvern Bancorp, Inc | | | 1,993 | |
| 1,317 | | | | MB Financial, Inc | | | 52,193 | |
| 283 | | | | MBT Financial Corp | | | 2,632 | |
| 226 | | | | Mercantile Bank Corp | | | 6,387 | |
| 155 | | | | Merchants Bancorp | | | 3,094 | |
| 856 | | | | Meridian Bancorp, Inc | | | 12,258 | |
| 369 | | | | Meta Financial Group, Inc | | | 7,155 | |
| 101 | | * | | Metropolitan Bank Holding Corp | | | 3,116 | |
| 7,025 | | * | | MGIC Investment Corp | | | 73,482 | |
| 324 | | | | Middlefield Banc Corp | | | 13,747 | |
| 324 | | | | Midland States Bancorp, Inc | | | 7,238 | |
| 1,202 | | | | Midsouth Bancorp, Inc | | | 12,741 | |
| 169 | | | | MidWestOne Financial Group, Inc | | | 4,196 | |
| 799 | | * | | Mr Cooper Group, Inc | | | 9,324 | |
| 101 | | | | MutualFirst Financial, Inc | | | 2,684 | |
| 142 | | | | MVB Financial Corp | | | 2,562 | |
| 535 | | | | National Bank Holdings Corp | | | 16,515 | |
| 109 | | | | National Bankshares, Inc | | | 3,971 | |
| 164 | | * | | National Commerce Corp | | | 5,904 | |
| 669 | | | | NBT Bancorp, Inc | | | 23,141 | |
| 8,219 | | | | New York Community Bancorp, Inc | | | 77,341 | |
| 140 | | * | | Nicolet Bankshares, Inc | | | 6,832 | |
| 1,790 | | * | | NMI Holdings, Inc | | | 31,952 | |
| 115 | | | | Northeast Bancorp | | | 1,924 | |
| 643 | | | | Northfield Bancorp, Inc | | | 8,713 | |
| 104 | | | | Northrim BanCorp, Inc | | | 3,418 | |
| 1,478 | | | | Northwest Bancshares, Inc | | | 25,037 | |
| 64 | | | | Norwood Financial Corp | | | 2,112 | |
| 115 | | | | Oak Valley Bancorp | | | 2,105 | |
| 714 | | | | OceanFirst Financial Corp | | | 16,072 | |
| 596 | | | | OFG Bancorp | | | 9,810 | |
| 68 | | e | | Ohio Valley Banc Corp | �� | | 2,407 | |
| 134 | | | | Old Line Bancshares, Inc | | | 3,527 | |
| 2,084 | | | | Old National Bancorp | | | 32,094 | |
| 432 | | | | Old Second Bancorp, Inc | | | 5,616 | |
| 319 | | | | Opus Bank | | | 6,249 | |
37
TIAA-CREF LIFE FUNDS -Stock Index Fund
| | | | | | | | |
SHARES | | | | COMPANY | | VALUE | |
| | | | | | | |
| 249 | | | | Origin Bancorp, Inc | | $ | 8,486 | |
| 610 | | | | Oritani Financial Corp | | | 8,998 | |
| 111 | | | | Orrstown Financial Services, Inc | | | 2,021 | |
| 226 | | | | Pacific City Financial Corp | | | 3,537 | |
| 241 | | * | | Pacific Mercantile Bancorp | | | 1,723 | |
| 609 | | * | | Pacific Premier Bancorp, Inc | | | 15,542 | |
| 2,138 | | | | PacWest Bancorp | | | 71,153 | |
| 205 | | | | Park National Corp | | | 17,415 | |
| 649 | | | | Parke Bancorp, Inc | | | 12,146 | |
| 290 | | | | PCSB Financial Corp | | | 5,672 | |
| 259 | | * | | PDL Community Bancorp | | | 3,300 | |
| 259 | | | | Peapack Gladstone Financial Corp | | | 6,522 | |
| 67 | | | | Penns Woods Bancorp, Inc | | | 2,696 | |
| 165 | | | | PennyMac Financial Services, Inc | | | 3,508 | |
| 70 | | | | Peoples Bancorp of North Carolina, Inc | | | 1,712 | |
| 261 | | | | Peoples Bancorp, Inc | | | 7,856 | |
| 101 | | | | Peoples Financial Services Corp | | | 4,450 | |
| 6,718 | | | | People’s United Financial, Inc | | | 96,941 | |
| 194 | | | | People’s Utah Bancorp | | | 5,849 | |
| 1,330 | | | | Pinnacle Financial Partners, Inc | | | 61,313 | |
| 7,782 | | | | PNC Financial Services Group, Inc | | | 909,794 | |
| 1,826 | | | | Popular, Inc | | | 86,224 | |
| 188 | | | | Preferred Bank | | | 8,150 | |
| 175 | | | | Premier Financial Bancorp, Inc | | | 2,609 | |
| 1,035 | | | | Prosperity Bancshares, Inc | | | 64,481 | |
| 68 | | * | | Provident Bancorp, Inc | | | 1,474 | |
| 964 | | | | Provident Financial Services, Inc | | | 23,261 | |
| 132 | | | | Prudential Bancorp, Inc | | | 2,323 | |
| 190 | | | | QCR Holdings, Inc | | | 6,097 | |
| 4,289 | | | | Radian Group, Inc | | | 70,168 | |
| 104 | | | | RBB Bancorp | | | 1,827 | |
| 18,527 | | | | Regions Financial Corp | | | 247,891 | |
| 670 | | | | Renasant Corp | | | 20,221 | |
| 146 | | | | Republic Bancorp, Inc (Class A) | | | 5,653 | |
| 750 | | * | | Republic First Bancorp, Inc | | | 4,478 | |
| 2,003 | | | | Riverview Bancorp, Inc | | | 14,582 | |
| 540 | | | | S&T Bancorp, Inc | | | 20,434 | |
| 495 | | | | Sandy Spring Bancorp, Inc | | | 15,513 | |
| 151 | | | | SB One Bancorp | | | 3,086 | |
| 617 | | * | | Seacoast Banking Corp of Florida | | | 16,054 | |
| 290 | | * | | Select Bancorp, Inc | | | 3,590 | |
| 726 | | | | ServisFirst Bancshares, Inc | | | 23,138 | |
| 185 | | | | Shore Bancshares, Inc | | | 2,690 | |
| 177 | | | | SI Financial Group, Inc | | | 2,253 | |
| 192 | | | | Sierra Bancorp | | | 4,614 | |
| 867 | | | | Signature Bank | | | 89,136 | |
| 1,396 | | | | Simmons First National Corp (Class A) | | | 33,685 | |
| 116 | | * | | SmartFinancial, Inc | | | 2,119 | |
| 670 | | | | South State Corp | | | 40,167 | |
| 101 | | * | | Southern First Bancshares, Inc | | | 3,239 | |
| 86 | | | | Southern Missouri Bancorp, Inc | | | 2,915 | |
| 169 | | | | Southern National Bancorp of Virginia, Inc | | | 2,234 | |
| 432 | | | | Southside Bancshares, Inc | | | 13,716 | |
| 154 | | *,e | | Spirit of Texas Bancshares, Inc | | | 3,508 | |
| 584 | | | | State Bank & Trust Co | | | 12,609 | |
| 259 | | | | Sterling Bancorp, Inc | | | 1,800 | |
| 3,716 | | | | Sterling Bancorp/DE | | | 61,351 | |
| 339 | | | | Stock Yards Bancorp, Inc | | | 11,119 | |
| 164 | | | | Summit Financial Group, Inc | | | 3,167 | |
| 7,880 | | | | SunTrust Banks, Inc | | | 397,467 | |
| 881 | | * | | SVB Financial Group | | | 167,320 | |
| 1,928 | | | | Synovus Financial Corp | | | 61,677 | |
| 2,589 | | | | TCF Financial Corp | | | 50,460 | |
| 150 | | | | Territorial Bancorp, Inc | | | 3,897 | |
| 932 | | * | | Texas Capital Bancshares, Inc | | | 47,616 | |
38
TIAA-CREF LIFE FUNDS -Stock Index Fund
| | | | | | | | |
SHARES | | | | COMPANY | | VALUE | |
| | | | | | | |
| 1,347 | | | | TFS Financial Corp | | $ | 21,727 | |
| 714 | | * | | The Bancorp, Inc | | | 5,683 | |
| 100 | | | | Timberland Bancorp, Inc | | | 2,230 | |
| 229 | | | | Tompkins Trustco, Inc | | | 17,177 | |
| 996 | | | | TowneBank | | | 23,854 | |
| 404 | | | | Trico Bancshares | | | 13,651 | |
| 343 | | * | | Tristate Capital Holdings, Inc | | | 6,675 | |
| 599 | | * | | Triumph Bancorp, Inc | | | 17,790 | |
| 1,387 | | | | Trustco Bank Corp NY | | | 9,515 | |
| 1,035 | | | | Trustmark Corp | | | 29,425 | |
| 685 | | | | UMB Financial Corp | | | 41,764 | |
| 3,528 | | | | Umpqua Holdings Corp | | | 56,095 | |
| 1,105 | | | | Union Bankshares Corp | | | 31,194 | |
| 60 | | | | Union Bankshares, Inc | | | 2,865 | |
| 1,552 | | | | United Bankshares, Inc | | | 48,283 | |
| 1,078 | | | | United Community Banks, Inc | | | 23,134 | |
| 740 | | | | United Community Financial Corp | | | 6,549 | |
| 770 | | | | United Financial Bancorp, Inc (New) | | | 11,319 | |
| 113 | | | | United Security Bancshares | | | 1,083 | |
| 119 | | | | Unity Bancorp, Inc | | | 2,470 | |
| 364 | | | | Univest Corp of Pennsylvania | | | 7,851 | |
| 25,723 | | | | US Bancorp | | | 1,175,541 | |
| 6,127 | | | | Valley National Bancorp | | | 54,408 | |
| 226 | | * | | Veritex Holdings, Inc | | | 4,832 | |
| 681 | | | | Walker & Dunlop, Inc | | | 29,453 | |
| 1,396 | | | | Washington Federal, Inc | | | 37,287 | |
| 232 | | | | Washington Trust Bancorp, Inc | | | 11,027 | |
| 384 | | | | Waterstone Financial, Inc | | | 6,436 | |
| 1,651 | | | | Webster Financial Corp | | | 81,378 | |
| 71,217 | | | | Wells Fargo & Co | | | 3,281,679 | |
| 770 | | | | WesBanco, Inc | | | 28,251 | |
| 239 | | | | West Bancorporation, Inc | | | 4,563 | |
| 399 | | | | Westamerica Bancorporation | | | 22,216 | |
| 1,643 | | * | | Western Alliance Bancorp | | | 64,882 | |
| 413 | | | | Western New England Bancorp, Inc | | | 4,147 | |
| 886 | | | | Wintrust Financial Corp | | | 58,910 | |
| 466 | | | | WSFS Financial Corp | | | 17,666 | |
| 3,277 | | | | Zions Bancorporation | | | 133,505 | |
| | | | | | | | |
| | | | TOTAL BANKS | | | 25,344,049 | |
| | | | | | | | |
| |
CAPITAL GOODS - 6.7% | | | | |
| 9,463 | | | | 3M Co | | | 1,803,080 | |
| 2,472 | | | | A.O. Smith Corp | | | 105,554 | |
| 644 | | | | Aaon, Inc | | | 22,579 | |
| 511 | | | | AAR Corp | | | 19,081 | |
| 917 | | | | Actuant Corp (Class A) | | | 19,248 | |
| 685 | | | | Acuity Brands, Inc | | | 78,741 | |
| 1,072 | | | | Advanced Drainage Systems, Inc | | | 25,996 | |
| 2,781 | | * | | Aecom Technology Corp | | | 73,697 | |
| 522 | | * | | Aegion Corp | | | 8,519 | |
| 1,069 | | * | | Aerojet Rocketdyne Holdings, Inc | | | 37,661 | |
| 318 | | * | | Aerovironment, Inc | | | 21,608 | |
| 1,041 | | | | AGCO Corp | | | 57,952 | |
| 1,858 | | | | Air Lease Corp | | | 56,130 | |
| 726 | | | | Aircastle Ltd | | | 12,516 | |
| 148 | | | | Alamo Group, Inc | | | 11,443 | |
| 445 | | | | Albany International Corp (Class A) | | | 27,781 | |
| 1,625 | | | | Allegion plc | | | 129,529 | |
| 91 | | | | Allied Motion Technologies, Inc | | | 4,067 | |
| 2,013 | | | | Allison Transmission Holdings, Inc | | | 88,391 | |
| 990 | | | | Altra Holdings, Inc | | | 24,899 | |
| 317 | | * | | Ameresco, Inc | | | 4,470 | |
| 254 | | * | | American Woodmark Corp | | | 14,143 | |
| 3,763 | | | | Ametek, Inc | | | 254,755 | |
| 438 | | | | Apogee Enterprises, Inc | | | 13,074 | |
39
TIAA-CREF LIFE FUNDS -Stock Index Fund
| | | | | | | | |
SHARES | | | | COMPANY | | VALUE | |
| | | | | | | |
| 567 | | | | Applied Industrial Technologies, Inc | | $ | 30,584 | |
| 7,689 | | | | Arconic, Inc | | | 129,637 | |
| 909 | | * | | Arcosa, Inc | | | 25,170 | |
| 244 | | | | Argan, Inc | | | 9,233 | |
| 367 | | * | | Armstrong Flooring, Inc | | | 4,345 | |
| 902 | | | | Armstrong World Industries, Inc | | | 52,505 | |
| 334 | | | | Astec Industries, Inc | | | 10,083 | |
| 340 | | * | | Astronics Corp | | | 10,353 | |
| 491 | | * | | Atkore International Group, Inc | | | 9,741 | |
| 1,023 | | * | | Axon Enterprise, Inc | | | 44,756 | |
| 406 | | | | AZZ, Inc | | | 16,386 | |
| 782 | | | | Barnes Group, Inc | | | 41,931 | |
| 1,120 | | * | | Beacon Roofing Supply, Inc | | | 35,526 | |
| 87 | | * | | Blue Bird Corp | | | 1,583 | |
| 144 | | *,e | | BlueLinx Holdings, Inc | | | 3,558 | |
| 941 | | * | | BMC Stock Holdings, Inc | | | 14,567 | |
| 9,035 | | | | Boeing Co | | | 2,913,788 | |
| 656 | | | | Briggs & Stratton Corp | | | 8,581 | |
| 2,096 | | * | | Builders FirstSource, Inc | | | 22,867 | |
| 1,582 | | | | BWX Technologies, Inc | | | 60,480 | |
| 351 | | e | | CaesarstoneSdot-Yam Ltd | | | 4,767 | |
| 250 | | * | | CAI International, Inc | | | 5,808 | |
| 986 | | | | Carlisle Cos, Inc | | | 99,113 | |
| 9,661 | | | | Caterpillar, Inc | | | 1,227,623 | |
| 467 | | * | | Chart Industries, Inc | | | 30,369 | |
| 259 | | * | | CIRCOR International, Inc | | | 5,517 | |
| 1,386 | | * | | Colfax Corp | | | 28,967 | |
| 262 | | | | Columbus McKinnon Corp | | | 7,897 | |
| 575 | | | | Comfort Systems USA, Inc | | | 25,116 | |
| 388 | | * | | Commercial Vehicle Group, Inc | | | 2,212 | |
| 601 | | * | | Continental Building Products Inc | | | 15,295 | |
| 901 | | | | Crane Co | | | 65,034 | |
| 225 | | * | | CSW Industrials, Inc | | | 10,879 | |
| 360 | | | | Cubic Corp | | | 19,346 | |
| 2,527 | | | | Cummins, Inc | | | 337,708 | |
| 801 | | | | Curtiss-Wright Corp | | | 81,798 | |
| 5,372 | | | | Deere & Co | | | 801,341 | |
| 199 | | | | DMC Global, Inc | | | 6,989 | |
| 2,203 | | | | Donaldson Co, Inc | | | 95,588 | |
| 347 | | | | Douglas Dynamics, Inc | | | 12,454 | |
| 2,490 | | | | Dover Corp | | | 176,666 | |
| 160 | | * | | Ducommun, Inc | | | 5,811 | |
| 240 | | * | | DXP Enterprises, Inc | | | 6,682 | |
| 486 | | * | | Dycom Industries, Inc | | | 26,263 | |
| 80 | | | | Eastern Co | | | 1,934 | |
| 7,303 | | | | Eaton Corp | | | 501,424 | |
| 916 | | | | EMCOR Group, Inc | | | 54,676 | |
| 10,459 | | | | Emerson Electric Co | | | 624,925 | |
| 318 | | | | Encore Wire Corp | | | 15,957 | |
| 281 | | *,e | | Energous Corp | | | 1,627 | |
| 568 | | *,e | | Energy Recovery, Inc | | | 3,823 | |
| 681 | | | | EnerSys | | | 52,852 | |
| 274 | | * | | Engility Holdings, Inc | | | 7,798 | |
| 1,395 | | *,e | | Enphase Energy, Inc | | | 6,598 | |
| 330 | | | | EnPro Industries, Inc | | | 19,833 | |
| 398 | | | | ESCO Technologies, Inc | | | 26,248 | |
| 525 | | * | | Esterline Technologies Corp | | | 63,761 | |
| 56 | | e | | EVI Industries, Inc | | | 1,868 | |
| 1,196 | | * | | Evoqua Water Technologies Corp | | | 11,482 | |
| 4,827 | | | | Fastenal Co | | | 252,404 | |
| 819 | | | | Federal Signal Corp | | | 16,298 | |
| 2,325 | | | | Flowserve Corp | | | 88,397 | |
| 2,196 | | | | Fluor Corp | | | 70,711 | |
| 5,063 | | | | Fortive Corp | | | 342,563 | |
| 2,359 | | | | Fortune Brands Home & Security, Inc | | | 89,618 | |
40
TIAA-CREF LIFE FUNDS -Stock Index Fund
| | | | | | | | |
SHARES | | | | COMPANY | | VALUE | |
| | | | | | | |
| 199 | | * | | Foundation Building Materials, Inc | | $ | 1,654 | |
| 719 | | | | Franklin Electric Co, Inc | | | 30,831 | |
| 165 | | * | | Freightcar America, Inc | | | 1,104 | |
| 10,949 | | *,e | | FuelCell Energy, Inc | | | 6,027 | |
| 2,242 | | * | | Gardner Denver Holdings, Inc | | | 45,849 | |
| 730 | | * | | Gates Industrial Corp plc | | | 9,665 | |
| 608 | | | | GATX Corp | | | 43,053 | |
| 103 | | * | | Gencor Industries, Inc | | | 1,130 | |
| 981 | | * | | Generac Holdings, Inc | | | 48,756 | |
| 4,342 | | | | General Dynamics Corp | | | 682,606 | |
| 143,646 | | | | General Electric Co | | | 1,087,400 | |
| 230 | | * | | General Finance Corp | | | 2,325 | |
| 567 | | * | | Gibraltar Industries, Inc | | | 20,180 | |
| 336 | | | | Global Brass & Copper Holdings, Inc | | | 8,450 | |
| 370 | | * | | GMS, Inc | | | 5,498 | |
| 271 | | | | Gorman-Rupp Co | | | 8,783 | |
| 2,760 | | | | Graco, Inc | | | 115,506 | |
| 1,413 | | | | GrafTech International Ltd | | | 16,165 | |
| 128 | | | | Graham Corp | | | 2,924 | |
| 696 | | | | Granite Construction, Inc | | | 28,035 | |
| 890 | | * | | Great Lakes Dredge & Dock Corp | | | 5,892 | |
| 720 | | | | Greenbrier Cos, Inc | | | 28,469 | |
| 448 | | | | Griffon Corp | | | 4,682 | |
| 627 | | | | H&E Equipment Services, Inc | | | 12,803 | |
| 1,922 | | | | Harris Corp | | | 258,797 | |
| 1,393 | | * | | Harsco Corp | | | 27,665 | |
| 632 | | *,e | | HC2 Holdings, Inc | | | 1,669 | |
| 3,063 | | * | | HD Supply Holdings, Inc | | | 114,924 | |
| 760 | | | | HEICO Corp | | | 58,885 | |
| 1,362 | | | | HEICO Corp (Class A) | | | 85,806 | |
| 380 | | * | | Herc Holdings, Inc | | | 9,876 | |
| 1,413 | | | | Hexcel Corp | | | 81,021 | |
| 981 | | | | Hillenbrand, Inc | | | 37,209 | |
| 12,463 | | | | Honeywell International, Inc | | | 1,646,612 | |
| 857 | | | | Hubbell, Inc | | | 85,134 | |
| 710 | | | | Huntington Ingalls | | | 135,120 | |
| 96 | | | | Hurco Cos, Inc | | | 3,427 | |
| 158 | | | | Hyster-Yale Materials Handling, Inc | | | 9,790 | |
| 1,286 | | | | IDEX Corp | | | 162,370 | |
| 137 | | * | | IES Holdings, Inc | | | 2,130 | |
| 5,580 | | | | Illinois Tool Works, Inc | | | 706,930 | |
| 1,588 | | * | | Infrastructure and Energy Alternatives, Inc | | | 13,006 | |
| 4,114 | | | | Ingersoll-Rand plc | | | 375,320 | |
| 289 | | | | Insteel Industries, Inc | | | 7,017 | |
| 1,338 | | | | ITT, Inc | | | 64,585 | |
| 2,070 | | | | Jacobs Engineering Group, Inc | | | 121,012 | |
| 1,178 | | * | | JELD-WEN Holding, Inc | | | 16,739 | |
| 486 | | | | John Bean Technologies Corp | | | 34,900 | |
| 15,059 | | | | Johnson Controls International plc | | | 446,499 | |
| 166 | | | | Kadant, Inc | | | 13,522 | |
| 415 | | | | Kaman Corp | | | 23,277 | |
| 2,207 | | | | KBR, Inc | | | 33,502 | |
| 1,244 | | | | Kennametal, Inc | | | 41,400 | |
| 770 | | * | | KEYW Holding Corp, The | | | 5,151 | |
| 2,104 | | * | | Kratos Defense & Security Solutions, Inc | | | 29,645 | |
| 1,320 | | | | L3 Technologies, Inc | | | 229,231 | |
| 87 | | * | | Lawson Products, Inc | | | 2,749 | |
| 122 | | * | | LB Foster Co (Class A) | | | 1,940 | |
| 606 | | | | Lennox International, Inc | | | 132,629 | |
| 1,115 | | | | Lincoln Electric Holdings, Inc | | | 87,918 | |
| 165 | | | | Lindsay Corp | | | 15,881 | |
| 4,145 | | | | Lockheed Martin Corp | | | 1,085,327 | |
| 258 | | * | | Lydall, Inc | | | 5,240 | |
| 1,227 | | * | | Manitex International, Inc | | | 6,969 | |
| 539 | | * | | Manitowoc Co, Inc | | | 7,961 | |
| 4,995 | | | | Masco Corp | | | 146,054 | |
41
TIAA-CREF LIFE FUNDS -Stock Index Fund
| | | | | | | | |
SHARES | | | | COMPANY | | VALUE | |
| | | | | | | |
| 503 | | * | | Masonite International Corp | | $ | 22,550 | |
| 1,083 | | * | | Mastec, Inc | | | 43,926 | |
| 906 | | | | Maxar Technologies Ltd | | | 10,836 | |
| 726 | | * | | Mercury Systems, Inc | | | 34,333 | |
| 1,303 | | * | | Meritor, Inc | | | 22,034 | |
| 1,001 | | * | | Middleby Corp | | | 102,833 | |
| 1,406 | | * | | Milacron Holdings Corp | | | 16,717 | |
| 168 | | | | Miller Industries, Inc | | | 4,536 | |
| 491 | | | | Moog, Inc (Class A) | | | 38,043 | |
| 1,441 | | * | | MRC Global, Inc | | | 17,623 | |
| 688 | | | | MSC Industrial Direct Co (Class A) | | | 52,921 | |
| 883 | | | | Mueller Industries, Inc | | | 20,627 | |
| 2,381 | | | | Mueller Water Products, Inc (Class A) | | | 21,667 | |
| 301 | | * | | MYR Group, Inc | | | 8,479 | |
| 76 | | e | | National Presto Industries, Inc | | | 8,886 | |
| 783 | | * | | Navistar International Corp | | | 20,319 | |
| 628 | | * | | NCI Building Systems, Inc | | | 4,553 | |
| 345 | | *,e | | Nexeo Solutions, Inc | | | 2,964 | |
| 442 | | | | NN, Inc | | | 2,966 | |
| 957 | | | | Nordson Corp | | | 114,218 | |
| 2,664 | | | | Northrop Grumman Corp | | | 652,414 | |
| 149 | | * | | Northwest Pipe Co | | | 3,470 | |
| 1,637 | | * | | NOW, Inc | | | 19,055 | |
| 123 | | * | | NV5 Holdings, Inc | | | 7,448 | |
| 2,708 | | | | nVent Electric plc | | | 60,822 | |
| 44 | | | | Omega Flex, Inc | | | 2,379 | |
| 454 | | * | | Orion Marine Group, Inc | | | 1,948 | |
| 1,266 | | | | Oshkosh Truck Corp | | | 77,618 | |
| 1,733 | | | | Owens Corning, Inc | | | 76,217 | |
| 5,726 | | | | PACCAR, Inc | | | 327,184 | |
| 2,205 | | | | Parker-Hannifin Corp | | | 328,854 | |
| 381 | | * | | Patrick Industries, Inc | | | 11,281 | |
| 2,708 | | | | Pentair plc | | | 102,308 | |
| 763 | | * | | PGT, Inc | | | 12,094 | |
| 3,537 | | *,e | | Plug Power, Inc | | | 4,386 | |
| 125 | | | | Powell Industries, Inc | | | 3,126 | |
| 51 | | | | Preformed Line Products Co | | | 2,767 | |
| 613 | | | | Primoris Services Corp | | | 11,727 | |
| 418 | | * | | Proto Labs, Inc | | | 47,146 | |
| 492 | | | | Quanex Building Products Corp | | | 6,686 | |
| 2,753 | | * | | Quanta Services, Inc | | | 82,865 | |
| 551 | | | | Raven Industries, Inc | | | 19,941 | |
| 4,703 | | | | Raytheon Co | | | 721,205 | |
| 360 | | * | | RBC Bearings, Inc | | | 47,196 | |
| 687 | | | | Regal-Beloit Corp | | | 48,124 | |
| 2,049 | | * | | Resideo Technologies, Inc | | | 42,107 | |
| 562 | | e | | REV Group, Inc | | | 4,221 | |
| 1,622 | | * | | Rexnord Corp | | | 37,225 | |
| 2,075 | | | | Rockwell Automation, Inc | | | 312,246 | |
| 1,714 | | | | Roper Industries, Inc | | | 456,815 | |
| 96 | | | | Rush Enterprises, Inc | | | 3,418 | |
| 461 | | | | Rush Enterprises, Inc (Class A) | | | 15,895 | |
| 2,806 | | * | | Sensata Technologies Holding plc | | | 125,821 | |
| 720 | | | | Simpson Manufacturing Co, Inc | | | 38,974 | |
| 641 | | * | | SiteOne Landscape Supply, Inc | | | 35,428 | |
| 924 | | | | Snap-On, Inc | | | 134,248 | |
| 136 | | * | | Sparton Corp | | | 2,474 | |
| 1,891 | | | | Spirit Aerosystems Holdings, Inc (Class A) | | | 136,322 | |
| 647 | | * | | SPX Corp | | | 18,122 | |
| 646 | | * | | SPX FLOW, Inc | | | 19,651 | |
| 195 | | | | Standex International Corp | | | 13,100 | |
| 2,569 | | | | Stanley Works | | | 307,612 | |
| 394 | | * | | Sterling Construction Co, Inc | | | 4,291 | |
| 365 | | | | Sun Hydraulics Corp | | | 12,114 | |
| 2,418 | | * | | Sunrun, Inc | | | 26,332 | |
42
TIAA-CREF LIFE FUNDS -Stock Index Fund
| | | | | | | | |
SHARES | | | | COMPANY | | VALUE | |
| | | | | | | |
| 582 | | * | | Teledyne Technologies, Inc | | $ | 120,515 | |
| 268 | | | | Tennant Co | | | 13,965 | |
| 1,185 | | | | Terex Corp | | | 32,670 | |
| 427 | | * | | Textainer Group Holdings Ltd | | | 4,253 | |
| 4,224 | | | | Textron, Inc | | | 194,262 | |
| 509 | | * | | Thermon Group Holdings | | | 10,323 | |
| 1,085 | | | | Timken Co | | | 40,492 | |
| 784 | | | | Titan International, Inc | | | 3,653 | |
| 282 | | * | | Titan Machinery, Inc | | | 3,708 | |
| 1,747 | | | | Toro Co | | | 97,622 | |
| 160 | | * | | TPI Composites, Inc | | | 3,933 | |
| 813 | | * | | TransDigm Group, Inc | | | 276,469 | |
| 902 | | * | | Trex Co, Inc | | | 53,543 | |
| 716 | | * | | Trimas Corp | | | 19,540 | |
| 2,728 | | | | Trinity Industries, Inc | | | 56,170 | |
| 1,184 | | | | Triton International Ltd | | | 36,787 | |
| 753 | | | | Triumph Group, Inc | | | 8,660 | |
| 585 | | * | | Tutor Perini Corp | | | 9,342 | |
| 142 | | * | | Twin Disc, Inc | | | 2,095 | |
| 1,363 | | * | | United Rentals, Inc | | | 139,748 | |
| 13,504 | | | | United Technologies Corp | | | 1,437,906 | |
| 2,029 | | * | | Univar, Inc | | | 35,994 | |
| 873 | | | | Universal Forest Products, Inc | | | 22,663 | |
| 1,341 | | | | USG Corp | | | 57,207 | |
| 345 | | | | Valmont Industries, Inc | | | 38,278 | |
| 156 | | * | | Vectrus, Inc | | | 3,366 | |
| 155 | | * | | Veritiv Corp | | | 3,870 | |
| 253 | | * | | Vicor Corp | | | 9,561 | |
| 557 | | *,e | | Vivint Solar, Inc | | | 2,122 | |
| 744 | | | | W.W. Grainger, Inc | | | 210,076 | |
| 918 | | | | Wabash National Corp | | | 12,007 | |
| 980 | | * | | WABCO Holdings, Inc | | | 105,193 | |
| 1,411 | | e | | Wabtec Corp | | | 99,123 | |
| 549 | | | | Watsco, Inc | | | 76,388 | |
| 434 | | | | Watts Water Technologies, Inc (Class A) | | | 28,006 | |
| 2,009 | | * | | Welbilt, Inc | | | 22,320 | |
| 849 | | * | | Wesco Aircraft Holdings, Inc | | | 6,707 | |
| 755 | | * | | WESCO International, Inc | | | 36,240 | |
| 71 | | * | | Willis Lease Finance Corp | | | 2,457 | |
| 524 | | * | | Willscot Corp | | | 4,936 | |
| 826 | | | | Woodward Governor Co | | | 61,364 | |
| 2,937 | | | | Xylem, Inc | | | 195,957 | |
| | | | | | | | |
| | | | TOTAL CAPITAL GOODS | | | 28,902,453 | |
| | | | | | | | |
| |
COMMERCIAL & PROFESSIONAL SERVICES - 1.0% | | | | |
| 868 | | | | ABM Industries, Inc | | | 27,871 | |
| 731 | | * | | Acacia Research (Acacia Technologies) | | | 2,178 | |
| 1,696 | | | | ACCO Brands Corp | | | 11,499 | |
| 1,679 | | e | | ADT, Inc | | | 10,091 | |
| 1,128 | | * | | Advanced Disposal Services, Inc | | | 27,004 | |
| 110 | | | | Barrett Business Services, Inc | | | 6,297 | |
| 109 | | | | BG Staffing, Inc | | | 2,251 | |
| 723 | | | | Brady Corp (Class A) | | | 31,422 | |
| 329 | | * | | BrightView Holdings, Inc | | | 3,359 | |
| 805 | | | | Brink’s Co | | | 52,043 | |
| 599 | | * | | Casella Waste Systems, Inc (Class A) | | | 17,066 | |
| 778 | | * | | CBIZ, Inc | | | 15,327 | |
| 433 | | * | | Ceco Environmental Corp | | | 2,923 | |
| 390 | | * | | Cimpress NV | | | 40,334 | |
| 1,516 | | | | Cintas Corp | | | 254,673 | |
| 819 | | * | | Clean Harbors, Inc | | | 40,418 | |
| 3,383 | | * | | Copart, Inc | | | 161,640 | |
| 577 | | * | | CoStar Group, Inc | | | 194,645 | |
| 1,794 | | | | Covanta Holding Corp | | | 24,075 | |
| 128 | | | | CRA International, Inc | | | 5,446 | |
43
TIAA-CREF LIFE FUNDS -Stock Index Fund
| | | | | | | | |
SHARES | | | | COMPANY | | VALUE | |
| | | | | | | |
| 754 | | | | Deluxe Corp | | $ | 28,984 | |
| 698 | | | | Dun & Bradstreet Corp | | | 99,633 | |
| 394 | | | | Ennis, Inc | | | 7,585 | |
| 1,954 | | | | Equifax, Inc | | | 181,976 | |
| 556 | | | | Essendant, Inc | | | 6,994 | |
| 804 | | | | Exponent, Inc | | | 40,771 | |
| 178 | | | | Forrester Research, Inc | | | 7,957 | |
| 148 | | * | | Franklin Covey Co | | | 3,305 | |
| 640 | | * | | FTI Consulting, Inc | | | 42,650 | |
| 191 | | * | | GP Strategies Corp | | | 2,409 | |
| 1,153 | | | | Healthcare Services Group | | | 46,328 | |
| 286 | | | | Heidrick & Struggles International, Inc | | | 8,920 | |
| 247 | | * | | Heritage-Crystal Clean, Inc | | | 5,683 | |
| 928 | | | | Herman Miller, Inc | | | 28,072 | |
| 682 | | | | HNI Corp | | | 24,163 | |
| 334 | | * | | Huron Consulting Group, Inc | | | 17,138 | |
| 282 | | | | ICF International, Inc | | | 18,268 | |
| 6,456 | | * | | IHS Markit Ltd | | | 309,694 | |
| 708 | | * | | Innerworkings, Inc | | | 2,648 | |
| 568 | | | | Insperity, Inc | | | 53,028 | |
| 961 | | | | Interface, Inc | | | 13,694 | |
| 2,145 | | | | KAR Auction Services, Inc | | | 102,359 | |
| 481 | | | | Kelly Services, Inc (Class A) | | | 9,851 | |
| 366 | | | | Kforce, Inc | | | 11,317 | |
| 577 | | | | Kimball International, Inc (Class B) | | | 8,188 | |
| 752 | | | | Knoll, Inc | | | 12,393 | |
| 1,048 | | | | Korn/Ferry International | | | 41,438 | |
| 518 | | | | LSC Communications, Inc | | | 3,626 | |
| 1,129 | | | | Manpower, Inc | | | 73,159 | |
| 491 | | | | Matthews International Corp (Class A) | | | 19,944 | |
| 379 | | | | McGrath RentCorp | | | 19,511 | |
| 259 | | * | | Mistras Group, Inc | | | 3,724 | |
| 682 | | | | Mobile Mini, Inc | | | 21,654 | |
| 518 | | | | MSA Safety, Inc | | | 48,832 | |
| 210 | | | | Multi-Color Corp | | | 7,369 | |
| 729 | | | | Navigant Consulting, Inc | | | 17,532 | |
| 6,023 | | | | Nielsen NV | | | 140,517 | |
| 160 | | * | | NL Industries, Inc | | | 562 | |
| 781 | | * | | On Assignment, Inc | | | 42,564 | |
| 2,896 | | | | Pitney Bowes, Inc | | | 17,115 | |
| 482 | | | | Quad Graphics, Inc | | | 5,938 | |
| 3,657 | | | | Republic Services, Inc | | | 263,633 | |
| 514 | | | | Resources Connection, Inc | | | 7,299 | |
| 1,949 | | | | Robert Half International, Inc | | | 111,483 | |
| 2,670 | | | | Rollins, Inc | | | 96,387 | |
| 1,220 | | | | RR Donnelley & Sons Co | | | 4,831 | |
| 269 | | * | | SP Plus Corp | | | 7,946 | |
| 1,350 | | | | Steelcase, Inc (Class A) | | | 20,021 | |
| 1,291 | | * | | Stericycle, Inc | | | 47,367 | |
| 187 | | | | Systemax, Inc | | | 4,467 | |
| 449 | | *,e | | Team, Inc | | | 6,578 | |
| 864 | | | | Tetra Tech, Inc | | | 44,729 | |
| 3,120 | | | | TransUnion | | | 177,216 | |
| 932 | | * | | TriNet Group, Inc | | | 39,097 | |
| 645 | | * | | TrueBlue, Inc | | | 14,351 | |
| 237 | | | | Unifirst Corp | | | 33,908 | |
| 211 | | *,e | | Upwork, Inc | | | 3,821 | |
| 338 | | | | US Ecology, Inc | | | 21,287 | |
| 2,712 | | * | | Verisk Analytics, Inc | | | 295,716 | |
| 318 | | | | Viad Corp | | | 15,929 | |
| 134 | | | | VSE Corp | | | 4,008 | |
| 580 | | * | | WageWorks, Inc | | | 15,753 | |
| 7,276 | | | | Waste Management, Inc | | | 647,491 | |
| 116 | | * | | Willdan Group, Inc | | | 4,058 | |
| | | | | | | | |
| | | | TOTAL COMMERCIAL & PROFESSIONAL SERVICES | | | 4,375,431 | |
| | | | | | | | |
44
TIAA-CREF LIFE FUNDS -Stock Index Fund
| | | | | | | | |
SHARES | | | | COMPANY | | VALUE | |
| | | | | | | |
CONSUMER DURABLES & APPAREL - 1.3% | | | | |
| 936 | | | | Acushnet Holdings Corp | | $ | 19,722 | |
| 840 | | * | | American Outdoor Brands Corp | | | 10,802 | |
| 194 | | | | Bassett Furniture Industries, Inc | | | 3,888 | |
| 565 | | * | | Beazer Homes USA, Inc | | | 5,356 | |
| 1,393 | | | | Brunswick Corp | | | 64,705 | |
| 1,433 | | | | Callaway Golf Co | | | 21,925 | |
| 750 | | | | Carter’s, Inc | | | 61,215 | |
| 132 | | * | | Cavco Industries, Inc | | | 17,210 | |
| 772 | | * | | Century Communities, Inc | | | 13,325 | |
| 307 | | | | Clarus Corp | | | 3,107 | |
| 454 | | | | Columbia Sportswear Co | | | 38,177 | |
| 1,159 | | * | | CROCS, Inc | | | 30,111 | |
| 167 | | | | Culp, Inc | | | 3,156 | |
| 498 | | * | | Deckers Outdoor Corp | | | 63,719 | |
| 5,415 | | | | DR Horton, Inc | | | 187,684 | |
| 167 | | | | Escalade, Inc | | | 1,912 | |
| 327 | | | | Ethan Allen Interiors, Inc | | | 5,752 | |
| 122 | | | | Flexsteel Industries, Inc | | | 2,694 | |
| 730 | | * | | Fossil Group, Inc | | | 11,483 | |
| 1,889 | | | | Garmin Ltd | | | 119,611 | |
| 682 | | * | | G-III Apparel Group Ltd | | | 19,021 | |
| 1,762 | | *,e | | GoPro, Inc | | | 7,471 | |
| 578 | | * | | Green Brick Partners, Inc | | | 4,185 | |
| 132 | | | | Hamilton Beach Brands Holding Co | | | 3,097 | |
| 5,680 | | | | Hanesbrands, Inc | | | 71,170 | |
| 1,873 | | | | Hasbro, Inc | | | 152,181 | |
| 411 | | * | | Helen of Troy Ltd | | | 53,915 | |
| 173 | | | | Hooker Furniture Corp | | | 4,557 | |
| 2,504 | | * | | Hovnanian Enterprises, Inc (Class A) | | | 1,712 | |
| 379 | | * | | Installed Building Products Inc | | | 12,769 | |
| 443 | | *,e | | iRobot Corp | | | 37,097 | |
| 75 | | | | Johnson Outdoors, Inc | | | 4,405 | |
| 1,294 | | | | KB Home | | | 24,715 | |
| 696 | | | | La-Z-Boy, Inc | | | 19,286 | |
| 2,061 | | | | Leggett & Platt, Inc | | | 73,866 | |
| 224 | | | | Lennar Corp (B Shares) | | | 7,018 | |
| 4,512 | | | | Lennar Corp (Class A) | | | 176,645 | |
| 562 | | *,e | | LGI Homes, Inc | | | 25,414 | |
| 163 | | | | Lifetime Brands, Inc | | | 1,635 | |
| 95 | | * | | Lovesac Co | | | 2,179 | |
| 1,585 | | * | | Lululemon Athletica, Inc | | | 192,752 | |
| 385 | | * | | M/I Homes, Inc | | | 8,093 | |
| 287 | | * | | Malibu Boats Inc | | | 9,988 | |
| 156 | | | | Marine Products Corp | | | 2,638 | |
| 295 | | * | | MasterCraft Boat Holdings, Inc | | | 5,516 | |
| 6,326 | | *,e | | Mattel, Inc | | | 63,197 | |
| 932 | | | | MDC Holdings, Inc | | | 26,199 | |
| 602 | | * | | Meritage Homes Corp | | | 22,105 | |
| 2,340 | | * | | Michael Kors Holdings Ltd | | | 88,733 | |
| 998 | | * | | Mohawk Industries, Inc | | | 116,726 | |
| 227 | | | | Movado Group, Inc | | | 7,178 | |
| 66 | | | | Nacco Industries, Inc (Class A) | | | 2,237 | |
| 545 | | * | | Nautilus, Inc | | | 5,941 | |
| 389 | | * | | New Home Co Inc | | | 2,034 | |
| 7,369 | | | | Newell Rubbermaid, Inc | | | 136,990 | |
| 20,924 | | | | Nike, Inc (Class B) | | | 1,551,305 | |
| 52 | | * | | NVR, Inc | | | 126,723 | |
| 276 | | | | Oxford Industries, Inc | | | 19,607 | |
| 973 | | | | Polaris Industries, Inc | | | 74,610 | |
| 4,225 | | | | Pulte Homes, Inc | | | 109,808 | |
| 1,215 | | | | PVH Corp | | | 112,934 | |
| 885 | | | | Ralph Lauren Corp | | | 91,562 | |
| 508 | | | | Rocky Brands, Inc | | | 13,208 | |
45
TIAA-CREF LIFE FUNDS -Stock Index Fund
| | | | | | | | |
+SHARES | | | | COMPANY | | VALUE | |
| | | | | | | |
| 694 | | * | | Roku, Inc | | $ | 21,264 | |
| 2,609 | | * | | Skechers U.S.A., Inc (Class A) | | | 59,720 | |
| 734 | | | | Skyline Corp | | | 10,782 | |
| 235 | | * | | Sonos, Inc | | | 2,308 | |
| 1,383 | | | | Steven Madden Ltd | | | 41,850 | |
| 272 | | | | Sturm Ruger & Co, Inc | | | 14,476 | |
| 133 | | | | Superior Uniform Group, Inc | | | 2,347 | |
| 4,883 | | | | Tapestry, Inc | | | 164,801 | |
| 2,087 | | * | | Taylor Morrison Home Corp | | | 33,183 | |
| 725 | | * | | Tempur Sealy International, Inc | | | 30,015 | |
| 2,373 | | | | Toll Brothers, Inc | | | 78,143 | |
| 563 | | * | | TopBuild Corp | | | 25,335 | |
| 2,459 | | * | | TRI Pointe Homes, Inc | | | 26,877 | |
| 917 | | | | Tupperware Corp | | | 28,950 | |
| 707 | | *,e | | Turtle Beach Corp | | | 10,089 | |
| 3,626 | | * | | Under Armour, Inc | | | 58,632 | |
| 2,878 | | * | | Under Armour, Inc (Class A) | | | 50,854 | |
| 226 | | * | | Unifi, Inc | | | 5,162 | |
| 217 | | * | | Universal Electronics, Inc | | | 5,486 | |
| 320 | | * | | Vera Bradley, Inc | | | 2,742 | |
| 5,296 | | | | VF Corp | | | 377,817 | |
| 896 | | * | | Vista Outdoor, Inc | | | 10,170 | |
| 2,014 | | *,e | | Vuzix Corp | | | 9,687 | |
| 1,133 | | | | Whirlpool Corp | | | 121,084 | |
| 576 | | * | | William Lyon Homes, Inc | | | 6,157 | |
| 1,465 | | | | Wolverine World Wide, Inc | | | 46,719 | |
| 285 | | *,e | | YETI Holdings, Inc | | | 4,229 | |
| 423 | | * | | Zagg, Inc | | | 4,137 | |
| | | | | | | | |
| | | | TOTAL CONSUMER DURABLES & APPAREL | | | 5,430,992 | |
| | | | | | | | |
| |
CONSUMER SERVICES - 2.3% | | | | |
| 965 | | * | | Adtalem Global Education, Inc | | | 45,664 | |
| 239 | | * | | American Public Education, Inc | | | 6,802 | |
| 4,005 | | | | ARAMARK Holdings Corp | | | 116,025 | |
| 1,019 | | | | BBX Capital Corp | | | 5,839 | |
| 1,433 | | * | | Belmond Ltd. | | | 35,868 | |
| 1 | | * | | Biglari Holdings, Inc (A Shares) | | | 588 | |
| 17 | | * | | Biglari Holdings, Inc (B Shares) | | | 1,931 | |
| 356 | | | | BJ’s Restaurants, Inc | | | 18,003 | |
| 1,539 | | | | Bloomin’ Brands, Inc | | | 27,533 | |
| 141 | | e | | Bluegreen Vacations Corp | | | 1,823 | |
| 268 | | * | | Bojangles’, Inc | | | 4,309 | |
| 1,270 | | | | Boyd Gaming Corp | | | 26,391 | |
| 949 | | * | | Bright Horizons Family Solutions | | | 105,766 | |
| 763 | | e | | Brinker International, Inc | | | 33,557 | |
| 9,591 | | *,e | | Caesars Entertainment Corp | | | 65,123 | |
| 1,137 | | * | | Career Education Corp | | | 12,984 | |
| 6,849 | | | | Carnival Corp | | | 337,656 | |
| 234 | | | | Carriage Services, Inc | | | 3,627 | |
| 507 | | * | | Carrols Restaurant Group, Inc | | | 4,989 | |
| 348 | | * | | Century Casinos, Inc | | | 2,572 | |
| 702 | | e | | Cheesecake Factory | | | 30,544 | |
| 1,956 | | * | | Chegg, Inc | | | 55,589 | |
| 396 | | * | | Chipotle Mexican Grill, Inc (Class A) | | | 170,989 | |
| 695 | | | | Choice Hotels International, Inc | | | 49,748 | |
| 210 | | | | Churchill Downs, Inc | | | 51,227 | |
| 247 | | * | | Chuy’s Holdings, Inc | | | 4,382 | |
| 294 | | e | | Cracker Barrel Old Country Store, Inc | | | 46,999 | |
| 2,146 | | | | Darden Restaurants, Inc | | | 214,300 | |
| 657 | | | | Dave & Buster’s Entertainment, Inc | | | 29,276 | |
| 331 | | * | | Del Frisco’s Restaurant Group, Inc | | | 2,367 | |
| 519 | | * | | Del Taco Restaurants, Inc | | | 5,185 | |
| 1,168 | | * | | Denny’s Corp | | | 18,933 | |
| 266 | | | | DineEquity, Inc | | | 17,912 | |
| 687 | | | | Domino’s Pizza, Inc | | | 170,369 | |
46
TIAA-CREF LIFE FUNDS -Stock Index Fund
| | | | | | | | |
SHARES | | | | COMPANY | | VALUE | |
| | | | | | | |
| 948 | | * | | Drive Shack, Inc | | $ | 3,716 | |
| 1,432 | | | | Dunkin Brands Group, Inc | | | 91,820 | |
| 302 | | * | | El Pollo Loco Holdings, Inc | | | 4,581 | |
| 1,053 | | * | | Eldorado Resorts, Inc | | | 38,129 | |
| 38 | | * | | Empire Resorts, Inc | | | 385 | |
| 3,065 | | | | Extended Stay America, Inc | | | 47,507 | |
| 402 | | * | | Fiesta Restaurant Group, Inc | | | 6,235 | |
| 1,177 | | * | | frontdoor, Inc | | | 31,320 | |
| 149 | | * | | Golden Entertainment, Inc | | | 2,387 | |
| 73 | | | | Graham Holdings Co | | | 46,762 | |
| 783 | | * | | Grand Canyon Education, Inc | | | 75,278 | |
| 3,944 | | | | H&R Block, Inc | | | 100,059 | |
| 326 | | * | | Habit Restaurants, Inc | | | 3,423 | |
| 1,521 | | * | | Hilton Grand Vacations, Inc | | | 40,139 | |
| 4,675 | | | | Hilton Worldwide Holdings, Inc | | | 335,665 | |
| 1,746 | | * | | Houghton Mifflin Harcourt Co | | | 15,470 | |
| 738 | | | | Hyatt Hotels Corp | | | 49,889 | |
| 1,684 | | | | International Game Technology plc | | | 24,637 | |
| 389 | | | | International Speedway Corp (Class A) | | | 17,062 | |
| 211 | | * | | J Alexander’s Holdings, Inc | | | 1,736 | |
| 490 | | | | Jack in the Box, Inc | | | 38,039 | |
| 521 | | * | | K12, Inc | | | 12,916 | |
| 5,824 | | | | Las Vegas Sands Corp | | | 303,139 | |
| 1,806 | | * | | Laureate Education, Inc | | | 27,523 | |
| 322 | | * | | Lindblad Expeditions Holdings, Inc | | | 4,334 | |
| 4,783 | | | | Marriott International, Inc (Class A) | | | 519,242 | |
| 615 | | | | Marriott Vacations Worldwide Corp | | | 43,364 | |
| 12,960 | | | | McDonald’s Corp | | | 2,301,307 | |
| 8,887 | | | | MGM Resorts International | | | 215,599 | |
| 173 | | * | | Monarch Casino & Resort, Inc | | | 6,598 | |
| 49 | | | | Nathan’s Famous, Inc | | | 3,256 | |
| 279 | | * | | Noodles & Co | | | 1,950 | |
| 3,341 | | * | | Norwegian Cruise Line Holdings Ltd | | | 141,625 | |
| 422 | | e | | Papa John’s International, Inc | | | 16,800 | |
| 1,670 | | * | | Penn National Gaming, Inc | | | 31,446 | |
| 1,549 | | * | | Planet Fitness, Inc | | | 83,057 | |
| 148 | | * | | PlayAGS, Inc | | | 3,404 | |
| 320 | | * | | Potbelly Corp | | | 2,576 | |
| 142 | | | | RCI Hospitality Holdings, Inc | | | 3,171 | |
| 238 | | * | | Red Lion Hotels Corp | | | 1,952 | |
| 204 | | * | | Red Robin Gourmet Burgers, Inc | | | 5,451 | |
| 1,049 | | | | Red Rock Resorts, Inc | | | 21,305 | |
| 607 | | * | | Regis Corp | | | 10,289 | |
| 2,772 | | | | Royal Caribbean Cruises Ltd | | | 271,074 | |
| 473 | | | | Ruth’s Chris Steak House, Inc | | | 10,751 | |
| 843 | | * | | Scientific Games Corp (Class A) | | | 15,073 | |
| 1,062 | | * | | SeaWorld Entertainment, Inc | | | 23,460 | |
| 2,922 | | | | Service Corp International | | | 117,640 | |
| 2,355 | | * | | ServiceMaster Global Holdings, Inc | | | 86,523 | |
| 337 | | * | | Shake Shack, Inc | | | 15,307 | |
| 1,116 | | | | Six Flags Entertainment Corp | | | 62,083 | |
| 602 | | * | | Sotheby’s (Class A) | | | 23,923 | |
| 164 | | | | Speedway Motorsports, Inc | | | 2,668 | |
| 20,269 | | | | Starbucks Corp | | | 1,305,324 | |
| 322 | | | | Strategic Education Inc | | | 36,521 | |
| 1,016 | | | | Texas Roadhouse, Inc (Class A) | | | 60,655 | |
| 645 | | | | Vail Resorts, Inc | | | 135,979 | |
| 619 | | * | | Weight Watchers International, Inc | | | 23,862 | |
| 2,954 | | | | Wendy’s | | | 46,112 | |
| 454 | | | | Wingstop, Inc | | | 29,142 | |
| 1,610 | | | | Wyndham Hotels & Resorts, Inc | | | 73,046 | |
| 1,610 | | | | Wyndham Worldwide Corp | | | 57,702 | |
| 1,664 | | | | Wynn Resorts Ltd | | | 164,586 | |
47
TIAA-CREF LIFE FUNDS -Stock Index Fund
| | | | | | | | |
SHARES | | | | COMPANY | | VALUE | |
| | | | | | | |
| 6,317 | | | | Yum China Holdings, Inc | | $ | 211,809 | |
| 5,274 | | | | Yum! Brands, Inc | | | 484,786 | |
| | | | | | | | |
| | | | TOTAL CONSUMER SERVICES | | | 9,717,439 | |
| | | | | | | | |
| |
DIVERSIFIED FINANCIALS - 3.6% | | | | |
| 887 | | | | Affiliated Managers Group, Inc | | | 86,429 | |
| 430 | | | | AG Mortgage Investment Trust | | | 6,850 | |
| 8,612 | | | | AGNC Investment Corp | | | 151,054 | |
| 7,199 | | | | Ally Financial, Inc | | | 163,129 | |
| 11,841 | | | | American Express Co | | | 1,128,684 | |
| 2,386 | | | | Ameriprise Financial, Inc | | | 249,027 | |
| 21,264 | | | | Annaly Capital Management, Inc | | | 208,812 | |
| 1,539 | | | | Anworth Mortgage Asset Corp | | | 6,218 | |
| 2,164 | | | | Apollo Commercial Real Estate Finance, Inc | | | 36,052 | |
| 756 | | | | Arbor Realty Trust, Inc | | | 7,613 | |
| 406 | | | | Ares Commercial Real Estate Corp | | | 5,294 | |
| 359 | | e | | Arlington Asset Investment Corp (Class A) | | | 2,599 | |
| 566 | | | | ARMOUR Residential REIT, Inc | | | 11,603 | |
| 693 | | | | Artisan Partners Asset Management, Inc | | | 15,322 | |
| 14 | | * | | Ashford, Inc | | | 727 | |
| 86 | | | | Associated Capital Group, Inc | | | 3,030 | |
| 3,469 | | | | AXA Equitable Holdings, Inc | | | 57,689 | |
| 212 | | | | B. Riley Financial, Inc | | | 3,010 | |
| 461 | | | | Banco Latinoamericano de Exportaciones S.A. (Class E) | | | 7,975 | |
| 15,503 | | | | Bank of New York Mellon Corp | | | 729,726 | |
| 4,169 | | | | BGC Partners, Inc (Class A) | | | 21,554 | |
| 2,058 | | | | BlackRock, Inc | | | 808,424 | |
| 2,008 | | | | Blackstone Mortgage Trust, Inc | | | 63,975 | |
| 637 | | * | | Blucora, Inc | | | 16,970 | |
| 1,084 | | * | | Cannae Holdings, Inc | | | 18,558 | |
| 7,981 | | | | Capital One Financial Corp | | | 603,284 | |
| 1,473 | | | | Capstead Mortgage Corp | | | 9,825 | |
| 1,847 | | | | CBOE Holdings, Inc | | | 180,692 | |
| 20,047 | | | | Charles Schwab Corp | | | 832,552 | |
| 189 | | | | Cherry Hill Mortgage Investment Corp | | | 3,315 | |
| 3,165 | | | | Chimera Investment Corp | | | 56,400 | |
| 5,897 | | | | CME Group, Inc | | | 1,109,344 | |
| 321 | | | | Cohen & Steers, Inc | | | 11,017 | |
| 1,289 | | | | Colony Credit Real Estate, Inc | | | 20,353 | |
| 387 | | * | | Cowen Group, Inc | | | 5,163 | |
| 208 | | * | | Credit Acceptance Corp | | | 79,406 | |
| 153 | | * | | Curo Group Holdings Corp | | | 1,452 | |
| 49 | | | | Diamond Hill Investment Group, Inc | | | 7,323 | |
| 5,700 | | | | Discover Financial Services | | | 336,186 | |
| 397 | | * | | Donnelley Financial Solutions, Inc | | | 5,570 | |
| 776 | | | | Dynex Capital, Inc | | | 4,439 | |
| 4,309 | | | | E*TRADE Financial Corp | | | 189,079 | |
| 2,009 | | | | Eaton Vance Corp | | | 70,677 | |
| 241 | | * | | Elevate Credit, Inc | | | 1,080 | |
| 375 | | *,e | | Encore Capital Group, Inc | | | 8,812 | |
| 522 | | * | | Enova International, Inc | | | 10,158 | |
| 638 | | | | Evercore Partners, Inc (Class A) | | | 45,655 | |
| 422 | | | | Exantas Capital Corp | | | 4,228 | |
| 796 | | * | | Ezcorp, Inc (Class A) | | | 6,153 | |
| 613 | | | | Factset Research Systems, Inc | | | 122,680 | |
| 1,485 | | | | Federated Investors, Inc (Class B) | | | 39,427 | |
| 2,135 | | * | | FGL Holdings | | | 14,219 | |
| 737 | | | | FirstCash, Inc | | | 53,322 | |
| 330 | | * | | Focus Financial Partners, Inc | | | 8,689 | |
| 5,414 | | | | Franklin Resources, Inc | | | 160,579 | |
| 546 | | e | | Gain Capital Holdings, Inc | | | 3,363 | |
| 93 | | | | GAMCO Investors, Inc (Class A) | | | 1,571 | |
| 5,902 | | | | Goldman Sachs Group, Inc | | | 985,929 | |
| 662 | | | | Granite Point Mortgage Trust, Inc | | | 11,936 | |
| 251 | | | | Great Ajax Corp | | | 3,025 | |
48
TIAA-CREF LIFE FUNDS -Stock Index Fund
| | | | | | | | |
SHARES | | | | COMPANY | | VALUE | |
| | | | | | | |
| 713 | | * | | Green Dot Corp | | $ | 56,698 | |
| 424 | | | | Greenhill & Co, Inc | | | 10,346 | |
| 218 | | | | Hamilton Lane, Inc | | | 8,066 | |
| 630 | | | | Houlihan Lokey, Inc | | | 23,184 | |
| 1,126 | | | | Interactive Brokers Group, Inc (Class A) | | | 61,536 | |
| 9,543 | | | | IntercontinentalExchange Group, Inc | | | 718,874 | |
| 241 | | * | | INTL FCStone, Inc | | | 8,816 | |
| 6,556 | | | | Invesco Ltd | | | 109,747 | |
| 1,752 | | | | Invesco Mortgage Capital, Inc | | | 25,369 | |
| 524 | | | | Investment Technology Group, Inc | | | 15,846 | |
| 5,119 | | | | Jefferies Financial Group, Inc | | | 88,866 | |
| 168 | | | | KKR Real Estate Finance Trust, Inc | | | 3,217 | |
| 1,088 | | | | Ladder Capital Corp | | | 16,831 | |
| 1,533 | | | | Ladenburg Thalmann Financial Services, Inc | | | 3,572 | |
| 1,898 | | | | Lazard Ltd (Class A) | | | 70,055 | |
| 1,355 | | | | Legg Mason, Inc | | | 34,566 | |
| 5,056 | | * | | LendingClub Corp | | | 13,297 | |
| 1,384 | | | | LPL Financial Holdings, Inc | | | 84,535 | |
| 642 | | | | MarketAxess Holdings, Inc | | | 135,661 | |
| 144 | | | | Marlin Business Services Corp | | | 3,216 | |
| 7,296 | | | | MFA Mortgage Investments, Inc | | | 48,737 | |
| 609 | | | | Moelis & Co | | | 20,937 | |
| 2,814 | | | | Moody’s Corp | | | 394,073 | |
| 20,648 | | | | Morgan Stanley | | | 818,693 | |
| 298 | | | | Morningstar, Inc | | | 32,732 | |
| 1,489 | | | | MSCI, Inc (Class A) | | | 219,523 | |
| 1,986 | | | | NASDAQ OMX Group, Inc | | | 161,998 | |
| 4,428 | | | | Navient Corp | | | 39,011 | |
| 312 | | | | Nelnet, Inc (Class A) | | | 16,330 | |
| 6,508 | | | | New Residential Investment Corp | | | 92,479 | |
| 1,709 | | | | New York Mortgage Trust, Inc | | | 10,066 | |
| 483 | | * | | NewStar Financial, Inc | | | 125 | |
| 3,525 | | | | Northern Trust Corp | | | 294,655 | |
| 866 | | | | OM Asset Management plc | | | 9,249 | |
| 750 | | * | | On Deck Capital, Inc | | | 4,425 | |
| 1,264 | | * | | OneMain Holdings, Inc | | | 30,703 | |
| 147 | | | | Oppenheimer Holdings, Inc | | | 3,756 | |
| 511 | | | | Orchid Island Capital, Inc | | | 3,265 | |
| 1,030 | | | | PennyMac Mortgage Investment Trust | | | 19,179 | |
| 324 | | * | | Pico Holdings, Inc | | | 2,961 | |
| 229 | | | | Piper Jaffray Cos | | | 15,077 | |
| 271 | | | | PJT Partners, Inc | | | 10,504 | |
| 719 | | * | | PRA Group, Inc | | | 17,522 | |
| 257 | | | | Pzena Investment Management, Inc (Class A) | | | 2,223 | |
| 2,252 | | | | Raymond James Financial, Inc | | | 167,571 | |
| 259 | | | | Ready Capital Corp | | | 3,582 | |
| 1,174 | | | | Redwood Trust, Inc | | | 17,692 | |
| 143 | | * | | Regional Management Corp | | | 3,439 | |
| 4,197 | | | | S&P Global, Inc | | | 713,238 | |
| 296 | | * | | Safeguard Scientifics, Inc | | | 2,552 | |
| 1,924 | | | | Santander Consumer USA Holdings, Inc | | | 33,843 | |
| 2,255 | | | | SEI Investments Co | | | 104,181 | |
| 111 | | | | Silvercrest Asset Management Group, Inc | | | 1,469 | |
| 6,760 | | * | | SLM Corp | | | 56,176 | |
| 6,185 | | | | State Street Corp | | | 390,088 | |
| 1,033 | | | | Stifel Financial Corp | | | 42,787 | |
| 12,328 | | | | Synchrony Financial | | | 289,215 | |
| 4,025 | | | | T Rowe Price Group, Inc | | | 371,588 | |
| 4,866 | | | | TD Ameritrade Holding Corp | | | 238,239 | |
| 181 | | | | TPG RE Finance Trust, Inc | | | 3,309 | |
| 4,626 | | | | Two Harbors Investment Corp | | | 59,398 | |
| 618 | | | | Virtu Financial, Inc | | | 15,920 | |
| 103 | | | | Virtus Investment Partners, Inc | | | 8,181 | |
| 2,789 | | | | Voya Financial, Inc | | | 111,950 | |
| 1,255 | | e | | Waddell & Reed Financial, Inc (Class A) | | | 22,690 | |
49
TIAA-CREF LIFE FUNDS -Stock Index Fund
| | | | | | | | |
SHARES | | | | COMPANY | | VALUE | |
| | | | | | | |
| 614 | | | | Western Asset Mortgage Capital Corp | | $ | 5,121 | |
| 125 | | | | Westwood Holdings Group, Inc | | | 4,250 | |
| 1,867 | | | | WisdomTree Investments, Inc | | | 12,416 | |
| 90 | | * | | World Acceptance Corp | | | 9,203 | |
| | | | | | | | |
| | | | TOTAL DIVERSIFIED FINANCIALS | | | 15,265,846 | |
| | | | | | | | |
| |
ENERGY - 4.9% | | | | |
| 2,365 | | * | | Abraxas Petroleum Corp | | | 2,578 | |
| 376 | | | | Adams Resources & Energy, Inc | | | 14,555 | |
| 1,516 | | *,e | | Alta Mesa Resources, Inc | | | 1,516 | |
| 8,402 | | | | Anadarko Petroleum Corp | | | 368,344 | |
| 4,322 | | * | | Antero Resources Corp | | | 40,584 | |
| 6,181 | | | | Apache Corp | | | 162,251 | |
| 1,245 | | * | | Apergy Corp | | | 33,715 | |
| 6,598 | | *,e | | Approach Resources, Inc | | | 5,753 | |
| 338 | | | | Arch Coal, Inc | | | 28,051 | |
| 2,039 | | | | Archrock, Inc | | | 15,272 | |
| 454 | | * | | Ardmore Shipping Corp | | | 2,120 | |
| 8,504 | | | | Baker Hughes a GE Co | | | 182,836 | |
| 2,537 | | * | | Basic Energy Services, Inc | | | 9,742 | |
| 196 | | | | Berry Petroleum Co LLC | | | 1,715 | |
| 314 | | * | | Bonanza Creek Energy, Inc | | | 6,490 | |
| 645 | | *,e | | Bristow Group, Inc | | | 1,567 | |
| 1,022 | | * | | C&J Energy Services, Inc | | | 13,797 | |
| 7,299 | | | | Cabot Oil & Gas Corp | | | 163,133 | |
| 845 | | * | | Cactus, Inc | | | 23,161 | |
| 747 | | * | | California Resources Corp | | | 12,729 | |
| 4,694 | | * | | Callon Petroleum Co | | | 30,464 | |
| 3,409 | | *,e | | CARBO Ceramics, Inc | | | 11,863 | |
| 1,289 | | * | | Carrizo Oil & Gas, Inc | | | 14,553 | |
| 2,955 | | * | | Centennial Resource Development, Inc | | | 32,564 | |
| 3,812 | | * | | Cheniere Energy, Inc | | | 225,632 | |
| 14,182 | | *,e | | Chesapeake Energy Corp | | | 29,782 | |
| 31,784 | | | | Chevron Corp | | | 3,457,781 | |
| 1,627 | | | | Cimarex Energy Co | | | 100,305 | |
| 1,943 | | * | | Clean Energy Fuels Corp | | | 3,342 | |
| 3,564 | | * | | CNX Resources Corp | | | 40,701 | |
| 3,247 | | * | | Concho Resources, Inc | | | 333,759 | |
| 19,492 | | | | ConocoPhillips | | | 1,215,326 | |
| 445 | | * | | CONSOL Energy, Inc | | | 14,111 | |
| 1,365 | | * | | Continental Resources, Inc | | | 54,859 | |
| 485 | | * | | Covia Holdings Corp | | | 1,659 | |
| 236 | | | | CVR Energy, Inc | | | 8,137 | |
| 1,875 | | * | | Dawson Geophysical Co | | | 6,337 | |
| 1,312 | | | | Delek US Holdings, Inc | | | 42,653 | |
| 9,900 | | * | | Denbury Resources, Inc | | | 16,929 | |
| 8,453 | | | | Devon Energy Corp | | | 190,531 | |
| 1,283 | | | | DHT Holdings, Inc | | | 5,029 | |
| 994 | | *,e | | Diamond Offshore Drilling, Inc | | | 9,383 | |
| 2,568 | | | | Diamondback Energy, Inc | | | 238,054 | |
| 424 | | * | | Dorian LPG Ltd | | | 2,472 | |
| 582 | | * | | Dril-Quip, Inc | | | 17,477 | |
| 153 | | * | | Earthstone Energy, Inc | | | 692 | |
| 10,091 | | *,e | | Eclipse Resources Corp | | | 10,596 | |
| 1,385 | | *,e | | Energy Fuels, Inc | | | 3,947 | |
| 9,505 | | | | EOG Resources, Inc | | | 828,931 | |
| 871 | | *,e | | EP Energy Corp | | | 610 | |
| 4,284 | | | | EQT Corp | | | 80,925 | |
| 3,427 | | * | | Equitrans Midstream Corp | | | 68,609 | |
| 272 | | * | | Era Group, Inc | | | 2,377 | |
| 468 | | | | Evolution Petroleum Corp | | | 3,192 | |
| 499 | | * | | Exterran Corp | | | 8,832 | |
| 1,888 | | * | | Extraction Oil & Gas, Inc | | | 8,100 | |
| 71,109 | | d | | Exxon Mobil Corp | | | 4,848,923 | |
| 1,061 | | * | | Forum Energy Technologies, Inc | | | 4,382 | |
50
TIAA-CREF LIFE FUNDS -Stock Index Fund
| | | | | | | | |
SHARES | | | | COMPANY | | VALUE | |
| | | | | | | |
| 790 | | * | | Frank’s International NV | | $ | 4,124 | |
| 1,164 | | *,e | | Frontline Ltd | | | 6,437 | |
| 348 | | * | | FTS International, Inc | | | 2,474 | |
| 635 | | | | GasLog Ltd | | | 10,452 | |
| 1,502 | | | | Golar LNG Ltd | | | 32,684 | |
| 1,162 | | * | | Goodrich Petroleum Corp | | | 15,687 | |
| 569 | | | | Green Plains Renewable Energy, Inc | | | 7,460 | |
| 2,531 | | * | | Gulfport Energy Corp | | | 16,578 | |
| 2,401 | | *,e | | Halcon Resources Corp | | | 4,082 | |
| 223 | | | | Hallador Energy Co | | | 1,131 | |
| 14,405 | | | | Halliburton Co | | | 382,885 | |
| 2,257 | | * | | Helix Energy Solutions Group, Inc | | | 12,210 | |
| 1,788 | | | | Helmerich & Payne, Inc | | | 85,717 | |
| 4,433 | | | | Hess Corp | | | 179,536 | |
| 1,515 | | * | | HighPoint Resources Corp | | | 3,772 | |
| 2,656 | | | | HollyFrontier Corp | | | 135,775 | |
| 4,277 | | * | | Independence Contract Drilling, Inc | | | 13,344 | |
| 461 | | * | | International Seaways, Inc | | | 7,763 | |
| 171 | | * | | ION Geophysical Corp | | | 886 | |
| 13 | | * | | Isramco, Inc | | | 1,540 | |
| 1,246 | | *,e | | Jagged Peak Energy, Inc | | | 11,364 | |
| 488 | | * | | Keane Group, Inc | | | 3,992 | |
| 154 | | * | | Key Energy Services, Inc | | | 319 | |
| 31,528 | | | | Kinder Morgan, Inc | | | 484,901 | |
| 312 | | * | | KLX Energy Services Holdings, Inc | | | 7,316 | |
| 4,331 | | * | | Kosmos Energy Ltd | | | 17,627 | |
| 2,550 | | * | | Laredo Petroleum Holdings, Inc | | | 9,231 | |
| 1,013 | | e | | Liberty Oilfield Services, Inc | | | 13,118 | |
| 792 | | *,e | | Lilis Energy, Inc | | | 1,085 | |
| 67 | | | | Mammoth Energy Services, Inc | | | 1,205 | |
| 13,766 | | | | Marathon Oil Corp | | | 197,404 | |
| 11,216 | | | | Marathon Petroleum Corp | | | 661,856 | |
| 1,401 | | * | | Matador Resources Co | | | 21,758 | |
| 383 | | * | | Matrix Service Co | | | 6,871 | |
| 3,470 | | * | | McDermott International, Inc | | | 22,694 | |
| 178 | | * | | Midstates Petroleum Co, Inc | | | 1,337 | |
| 2,551 | | | | Murphy Oil Corp | | | 59,668 | |
| 4,845 | | | | Nabors Industries Ltd | | | 9,690 | |
| 6,228 | | | | National Oilwell Varco, Inc | | | 160,060 | |
| 180 | | * | | Natural Gas Services Group, Inc | | | 2,959 | |
| 164 | | *,e | | NCS Multistage Holdings, Inc | | | 835 | |
| 3,111 | | * | | Newfield Exploration Co | | | 45,607 | |
| 1,448 | | * | | Newpark Resources, Inc | | | 9,948 | |
| 132 | | * | | Nine Energy Service, Inc | | | 2,975 | |
| 4,315 | | * | | Noble Corp plc | | | 11,305 | |
| 7,761 | | | | Noble Energy, Inc | | | 145,596 | |
| 5,765 | | e | | Nordic American Tanker Shipping | | | 11,530 | |
| 6,914 | | * | | Northern Oil And Gas, Inc | | | 15,626 | |
| 4,419 | | * | | Oasis Petroleum, Inc | | | 24,437 | |
| 12,781 | | | | Occidental Petroleum Corp | | | 784,498 | |
| 1,532 | | * | | Oceaneering International, Inc | | | 18,537 | |
| 784 | | * | | Oil States International, Inc | | | 11,196 | |
| 6,836 | | | | Oneok, Inc | | | 368,802 | |
| 546 | | * | | Overseas Shipholding Group, Inc | | | 906 | |
| 355 | | | | Panhandle Oil and Gas, Inc (Class A) | | | 5,502 | |
| 482 | | * | | Par Pacific Holdings, Inc | | | 6,835 | |
| 4,180 | | * | | Parsley Energy, Inc | | | 66,796 | |
| 3,250 | | | | Patterson-UTI Energy, Inc | | | 33,637 | |
| 2,058 | | | | PBF Energy, Inc | | | 67,235 | |
| 1,032 | | * | | PDC Energy, Inc | | | 30,712 | |
| 1,293 | | | | Peabody Energy Corp | | | 39,411 | |
| 217 | | * | | Penn Virginia Corp | | | 11,731 | |
| 176 | | *,e | | PHI, Inc | | | 326 | |
| 6,850 | | | | Phillips 66 | | | 590,127 | |
| 1,332 | | * | | Pioneer Energy Services Corp | | | 1,638 | |
51
TIAA-CREF LIFE FUNDS -Stock Index Fund
| | | | | | | | |
SHARES | | | | COMPANY | | VALUE | |
| | | | | | | |
| 2,833 | | | | Pioneer Natural Resources Co | | $ | 372,596 | |
| 3,185 | | * | | Profire Energy, Inc | | | 4,618 | |
| 1,178 | | * | | ProPetro Holding Corp | | | 14,513 | |
| 3,764 | | * | | Questar Market Resources, Inc | | | 21,191 | |
| 3,580 | | | | Range Resources Corp | | | 34,261 | |
| 641 | | *,e | | Renewable Energy Group, Inc | | | 16,474 | |
| 335 | | *,e | | Resolute Energy Corp | | | 9,708 | |
| 92 | | * | | Rex American Resources Corp | | | 6,266 | |
| 195 | | * | | RigNet, Inc | | | 2,465 | |
| 994 | | * | | Ring Energy, Inc | | | 5,050 | |
| 3,664 | | *,e | | Rosehill Resources, Inc | | | 8,171 | |
| 1,813 | | *,e | | Rowan Cos plc | | | 15,211 | |
| 901 | | e | | RPC, Inc | | | 8,893 | |
| 537 | | * | | SandRidge Energy, Inc | | | 4,087 | |
| 23,153 | | | | Schlumberger Ltd | | | 835,360 | |
| 4,774 | | | | Scorpio Tankers, Inc | | | 8,402 | |
| 308 | | * | | SEACOR Holdings, Inc | | | 11,396 | |
| 303 | | * | | SEACOR Marine Holdings, Inc | | | 3,563 | |
| 988 | | * | | Select Energy Services, Inc | | | 6,244 | |
| 1,275 | | | | SemGroup Corp | | | 17,570 | |
| 946 | | | | Ship Finance International Ltd | | | 9,961 | |
| 148 | | * | | SilverBow Resources, Inc | | | 3,499 | |
| 1,739 | | | | SM Energy Co | | | 26,920 | |
| 338 | | *,e | | Smart Sand, Inc | | | 750 | |
| 148 | | e | | Solaris Oilfield Infrastructure, Inc | | | 1,789 | |
| 10,291 | | * | | Southwestern Energy Co | | | 35,092 | |
| 4,016 | | * | | SRC Energy, Inc | | | 18,875 | |
| 2,325 | | * | | Superior Energy Services | | | 7,789 | |
| 300 | | * | | Talos Energy, Inc | | | 4,896 | |
| 3,692 | | | | Targa Resources Investments, Inc | | | 132,986 | |
| 818 | | e | | Teekay Corp | | | 2,732 | |
| 1,777 | | | | Teekay Tankers Ltd (Class A) | | | 1,649 | |
| 2,673 | | *,e | | Tellurian, Inc | | | 18,577 | |
| 1,816 | | * | | Tetra Technologies, Inc | | | 3,051 | |
| 384 | | * | | Tidewater, Inc | | | 7,346 | |
| 9,049 | | * | | Transocean Ltd (NYSE) | | | 62,800 | |
| 799 | | * | | Unit Corp | | | 11,410 | |
| 2,051 | | *,e | | Uranium Energy Corp | | | 2,564 | |
| 1,275 | | e | | US Silica Holdings Inc | | | 12,980 | |
| 7,208 | | | | Valero Energy Corp | | | 540,384 | |
| 1,529 | | * | | W&T Offshore, Inc | | | 6,299 | |
| 1,434 | | * | | Whiting Petroleum Corp | | | 32,537 | |
| 481 | | * | | WildHorse Resource Development Corp | | | 6,787 | |
| 19,927 | | | | Williams Cos, Inc | | | 439,390 | |
| 1,068 | | | | World Fuel Services Corp | | | 22,866 | |
| 6,188 | | * | | WPX Energy, Inc | | | 70,234 | |
| 3,641 | | e | | Zion Oil & Gas, Inc | | | 1,520 | |
| | | | | | | | |
| | | | TOTAL ENERGY | | | 20,880,190 | |
| | | | | | | | |
| |
FOOD & STAPLES RETAILING - 1.4% | | | | |
| 418 | | | | Andersons, Inc | | | 12,494 | |
| 618 | | | | Casey’s General Stores, Inc | | | 79,191 | |
| 300 | | * | | Chefs’ Warehouse Holdings, Inc | | | 9,594 | |
| 7,271 | | | | Costco Wholesale Corp | | | 1,481,175 | |
| 213 | | | | Ingles Markets, Inc (Class A) | | | 5,798 | |
| 13,061 | | | | Kroger Co | | | 359,177 | |
| 1,271 | | * | | Natural Grocers by Vitamin C | | | 19,484 | |
| 1,464 | | * | | Performance Food Group Co | | | 47,243 | |
| 385 | | | | Pricesmart, Inc | | | 22,753 | |
| 17,265 | | *,e | | Rite Aid Corp | | | 12,229 | |
| 389 | | * | | Smart & Final Stores, Inc | | | 1,844 | |
| 584 | | | | Spartan Stores, Inc | | | 10,033 | |
| 2,100 | | * | | Sprouts Farmers Market, Inc | | | 49,371 | |
| 7,942 | | | | Sysco Corp | | | 497,646 | |
52
TIAA-CREF LIFE FUNDS -Stock Index Fund
| | | | | | | | |
SHARES | | | | COMPANY | | VALUE | |
| | | | | | | |
| 784 | | * | | United Natural Foods, Inc | | $ | 8,303 | |
| 3,445 | | * | | US Foods Holding Corp | | | 109,000 | |
| 127 | | | | Village Super Market (Class A) | | | 3,396 | |
| 13,590 | | | | Walgreens Boots Alliance, Inc | | | 928,605 | |
| 23,797 | | | | Walmart, Inc | | | 2,216,691 | |
| 148 | | | | Weis Markets, Inc | | | 7,071 | |
| | | | | | | | |
| | | | TOTAL FOOD & STAPLES RETAILING | | | 5,881,098 | |
| | | | | | | | |
| |
FOOD, BEVERAGE & TOBACCO - 3.5% | | | | |
| 1,894 | | *,e | | 22nd Century Group, Inc | | | 4,716 | |
| 99 | | | | Alico, Inc | | | 2,921 | |
| 31,572 | | | | Altria Group, Inc | | | 1,559,341 | |
| 9,390 | | | | Archer Daniels Midland Co | | | 384,708 | |
| 995 | | e | | B&G Foods, Inc (Class A) | | | 28,765 | |
| 137 | | * | | Boston Beer Co, Inc (Class A) | | | 32,995 | |
| 846 | | | | Brown-Forman Corp | | | 40,117 | |
| 4,827 | | | | Brown-Forman Corp (Class B) | | | 229,669 | |
| 2,300 | | | | Bunge Ltd | | | 122,912 | |
| 247 | | | | Calavo Growers, Inc | | | 18,021 | |
| 486 | | | | Cal-Maine Foods, Inc | | | 20,558 | |
| 2,801 | | | | Campbell Soup Co | | | 92,405 | |
| 1,334 | | *,e | | Castle Brands, Inc | | | 1,135 | |
| 72 | | | | Coca-Cola Bottling Co Consolidated | | | 12,771 | |
| 63,934 | | | | Coca-Cola Co | | | 3,027,275 | |
| 7,694 | | | | ConAgra Brands, Inc | | | 164,344 | |
| 2,625 | | | | Constellation Brands, Inc (Class A) | | | 422,153 | |
| 190 | | * | | Craft Brewers Alliance, Inc | | | 2,719 | |
| 2,547 | | * | | Darling International, Inc | | | 49,004 | |
| 1,357 | | | | Dean Foods Co | | | 5,170 | |
| 200 | | * | | Farmer Bros Co | | | 4,666 | |
| 3,010 | | | | Flowers Foods, Inc | | | 55,595 | |
| 499 | | | | Fresh Del Monte Produce, Inc | | | 14,107 | |
| 388 | | * | | Freshpet, Inc | | | 12,478 | |
| 9,541 | | | | General Mills, Inc | | | 371,527 | |
| 1,593 | | * | | Hain Celestial Group, Inc | | | 25,265 | |
| 2,341 | | | | Hershey Co | | | 250,908 | |
| 4,615 | | | | Hormel Foods Corp | | | 196,968 | |
| 1,568 | | * | | Hostess Brands, Inc | | | 17,154 | |
| 1,227 | | | | Ingredion, Inc | | | 112,148 | |
| 277 | | | | J&J Snack Foods Corp | | | 40,051 | |
| 1,901 | | | | J.M. Smucker Co | | | 177,725 | |
| 131 | | | | John B. Sanfilippo & Son, Inc | | | 7,291 | |
| 4,200 | | | | Kellogg Co | | | 239,442 | |
| 2,925 | | | | Keurig Dr Pepper, Inc | | | 74,997 | |
| 9,865 | | | | Kraft Heinz Co | | | 424,590 | |
| 2,490 | | | | Lamb Weston Holdings, Inc | | | 183,164 | |
| 364 | | | | Lancaster Colony Corp | | | 64,377 | |
| 422 | | * | | Landec Corp | | | 4,997 | |
| 187 | | | | Limoneira Co | | | 3,656 | |
| 2,055 | | | | McCormick & Co, Inc | | | 286,138 | |
| 203 | | e | | MGP Ingredients, Inc | | | 11,581 | |
| 3,002 | | | | Molson Coors Brewing Co (Class B) | | | 168,592 | |
| 24,187 | | | | Mondelez International, Inc | | | 968,206 | |
| 6,733 | | * | | Monster Beverage Corp | | | 331,398 | |
| 183 | | * | | National Beverage Corp | | | 13,134 | |
| 23,654 | | | | PepsiCo, Inc | | | 2,613,294 | |
| 25,921 | | | | Philip Morris International, Inc | | | 1,730,486 | |
| 908 | | * | | Pilgrim’s Pride Corp | | | 14,083 | |
| 1,066 | | * | | Post Holdings, Inc | | | 95,013 | |
| 404 | | * | | Primo Water Corp | | | 5,660 | |
| 317 | | | | Sanderson Farms, Inc | | | 31,475 | |
| 4 | | | | Seaboard Corp | | | 14,152 | |
| 134 | | * | | Seneca Foods Corp | | | 3,781 | |
| 937 | | * | | Simply Good Foods Co | | | 17,709 | |
| 379 | | e | | Tootsie Roll Industries, Inc | | | 12,659 | |
53
TIAA-CREF LIFE FUNDS -Stock Index Fund
| | | | | | | | |
SHARES | | | | COMPANY | | VALUE | |
| | | | | | | |
| 864 | | * | | TreeHouse Foods, Inc | | $ | 43,813 | |
| 78 | | | | Turning Point Brands, Inc | | | 2,123 | |
| 4,897 | | | | Tyson Foods, Inc (Class A) | | | 261,500 | |
| 340 | | | | Universal Corp | | | 18,411 | |
| 1,607 | | | | Vector Group Ltd | | | 15,636 | |
| | | | | | | | |
| | | | TOTAL FOOD, BEVERAGE & TOBACCO | | | 15,161,649 | |
| | | | | | | | |
| |
HEALTH CARE EQUIPMENT & SERVICES - 6.3% | | | | |
| 28,549 | | | | Abbott Laboratories | | | 2,064,949 | |
| 690 | | * | | Abiomed, Inc | | | 224,278 | |
| 1,387 | | * | | Acadia Healthcare Co, Inc | | | 35,660 | |
| 1,245 | | * | | Accuray, Inc | | | 4,245 | |
| 119 | | * | | Addus HomeCare Corp | | | 8,078 | |
| 1,305 | | * | | Align Technology, Inc | | | 273,306 | |
| 2,817 | | * | | Allscripts Healthcare Solutions, Inc | | | 27,156 | |
| 460 | | * | | Amedisys, Inc | | | 53,871 | |
| 137 | | * | | American Renal Associates Holdings, Inc | | | 1,578 | |
| 2,579 | | | | AmerisourceBergen Corp | | | 191,878 | |
| 725 | | * | | AMN Healthcare Services, Inc | | | 41,078 | |
| 563 | | * | | Angiodynamics, Inc | | | 11,333 | |
| 216 | | * | | Anika Therapeutics, Inc | | | 7,260 | |
| 2,249 | | * | | Antares Pharma, Inc | | | 6,117 | |
| 4,337 | | | | Anthem, Inc | | | 1,139,026 | |
| 398 | | *,e | | Apollo Medical Holdings, Inc | | | 7,900 | |
| 712 | | * | | athenahealth, Inc | | | 93,934 | |
| 480 | | * | | AtriCure, Inc | | | 14,688 | |
| 27 | | | | Atrion Corp | | | 20,009 | |
| 725 | | * | | Avanos Medical, Inc | | | 32,473 | |
| 560 | | * | | AxoGen, Inc | | | 11,441 | |
| 8,418 | | | | Baxter International, Inc | | | 554,073 | |
| 4,418 | | | | Becton Dickinson & Co | | | 995,464 | |
| 1,877 | | * | | BioScrip, Inc | | | 6,701 | |
| 430 | | * | | BioTelemetry, Inc | | | 25,680 | |
| 22,844 | | * | | Boston Scientific Corp | | | 807,307 | |
| 2,873 | | * | | Brookdale Senior Living, Inc | | | 19,249 | |
| 590 | | | | Cantel Medical Corp | | | 43,925 | |
| 442 | | * | | Capital Senior Living Corp | | | 3,006 | |
| 5,081 | | | | Cardinal Health, Inc | | | 226,613 | |
| 501 | | * | | Cardiovascular Systems, Inc | | | 14,273 | |
| 977 | | * | | Castlight Health, Inc | | | 2,120 | |
| 3,398 | | * | | Centene Corp | | | 391,789 | |
| 5,354 | | * | | Cerner Corp | | | 280,764 | |
| 1,570 | | * | | Cerus Corp | | | 7,960 | |
| 245 | | | | Chemed Corp | | | 69,404 | |
| 6,238 | | | | Cigna Corp | | | 1,184,652 | |
| 240 | | * | | Civitas Solutions, Inc | | | 4,202 | |
| 168 | | | | Computer Programs & Systems, Inc | | | 4,217 | |
| 422 | | | | Conmed Corp | | | 27,092 | |
| 818 | | | | Cooper Cos, Inc | | | 208,181 | |
| 163 | | * | | Corvel Corp | | | 10,060 | |
| 544 | | * | | Cross Country Healthcare, Inc | | | 3,987 | |
| 480 | | * | | CryoLife, Inc | | | 13,622 | |
| 407 | | * | | CryoPort, Inc | | | 4,489 | |
| 202 | | * | | Cutera, Inc | | | 3,438 | |
| 21,335 | | | | CVS Health Corp | | | 1,397,869 | |
| 466 | | *,e | | CytoSorbents Corp | | | 3,765 | |
| 10,325 | | | | Danaher Corp | | | 1,064,714 | |
| 2,220 | | * | | DaVita, Inc | | | 114,241 | |
| 3,684 | | | | Dentsply Sirona, Inc | | | 137,082 | |
| 1,428 | | * | | DexCom, Inc | | | 171,074 | |
| 1,292 | | * | | Diplomat Pharmacy, Inc | | | 17,390 | |
| 3,469 | | * | | Edwards Lifesciences Corp | | | 531,347 | |
| 1,608 | | | | Encompass Health Corp | | | 99,214 | |
| 737 | | | | Ensign Group, Inc | | | 28,588 | |
54
TIAA-CREF LIFE FUNDS -Stock Index Fund
| | | | | | | | |
SHARES | | | | COMPANY | | VALUE | |
| | | | | | | |
| 1,209 | | * | | Evolent Health, Inc | | $ | 24,120 | |
| 97 | | * | | FONAR Corp | | | 1,963 | |
| 995 | | * | | Genesis Health Care, Inc | | | 1,174 | |
| 665 | | * | | GenMark Diagnostics, Inc | | | 3,232 | |
| 803 | | * | | Glaukos Corp | | | 45,104 | |
| 1,094 | | * | | Globus Medical, Inc | | | 47,348 | |
| 245 | | * | | Guardant Health, Inc | | | 9,210 | |
| 886 | | * | | Haemonetics Corp | | | 88,644 | |
| 4,612 | | | | HCA Holdings, Inc | | | 573,963 | |
| 867 | | * | | HealthEquity, Inc | | | 51,717 | |
| 399 | | | | HealthStream, Inc | | | 9,636 | |
| 300 | | *,e | | Helius Medical Technologies, Inc | | | 2,748 | |
| 2,474 | | * | | Henry Schein, Inc | | | 194,258 | |
| 99 | | * | | Heska Corp | | | 8,524 | |
| 1,196 | | | | Hill-Rom Holdings, Inc | | | 105,906 | |
| 1,310 | | * | | HMS Holdings Corp | | | 36,850 | |
| 4,675 | | * | | Hologic, Inc | | | 192,142 | |
| 2,289 | | | | Humana, Inc | | | 655,753 | |
| 233 | | * | | ICU Medical, Inc | | | 53,504 | |
| 1,446 | | * | | IDEXX Laboratories, Inc | | | 268,985 | |
| 263 | | * | | Inogen Inc | | | 32,657 | |
| 978 | | *,e | | Inovalon Holdings, Inc | | | 13,868 | |
| 127 | | * | | Inspire Medical Systems, Inc | | | 5,366 | |
| 908 | | * | | Insulet Corp | | | 72,023 | |
| 472 | | * | | Integer Holding Corp | | | 35,995 | |
| 1,162 | | * | | Integra LifeSciences Holdings Corp | | | 52,406 | |
| 100 | | * | | IntriCon Corp | | | 2,638 | |
| 1,852 | | * | | Intuitive Surgical, Inc | | | 886,960 | |
| 463 | | | | Invacare Corp | | | 1,991 | |
| 383 | | * | | iRhythm Technologies, Inc | | | 26,611 | |
| 1,743 | | * | | Laboratory Corp of America Holdings | | | 220,245 | |
| 465 | | * | | Lantheus Holdings, Inc | | | 7,277 | |
| 236 | | | | LeMaitre Vascular, Inc | | | 5,579 | |
| 490 | | * | | LHC Group, Inc | | | 46,001 | |
| 755 | | * | | LivaNova plc | | | 69,060 | |
| 426 | | * | | Magellan Health Services, Inc | | | 24,235 | |
| 849 | | * | | Masimo Corp | | | 91,157 | |
| 3,381 | | | | McKesson Corp | | | 373,499 | |
| 1,067 | | * | | Medidata Solutions, Inc | | | 71,937 | |
| 1,425 | | * | | MEDNAX, Inc | | | 47,025 | |
| 22,579 | | | | Medtronic plc | | | 2,053,786 | |
| 646 | | | | Meridian Bioscience, Inc | | | 11,215 | |
| 985 | | * | | Merit Medical Systems, Inc | | | 54,973 | |
| 992 | | * | | Molina Healthcare, Inc | | | 115,290 | |
| 274 | | *,e | | NantHealth, Inc | | | 149 | |
| 173 | | | | National Healthcare Corp | | | 13,572 | |
| 208 | | | | National Research Corp | | | 7,933 | |
| 500 | | * | | Natus Medical, Inc | | | 17,015 | |
| 780 | | * | | Neogen Corp | | | 44,460 | |
| 100 | | * | | Neuronetics, Inc | | | 1,935 | |
| 613 | | * | | Nevro Corp | | | 23,840 | |
| 818 | | * | | NextGen Healthcare, Inc | | | 12,393 | |
| 1,159 | | * | | Novocure Ltd | | | 38,803 | |
| 791 | | * | | NuVasive, Inc | | | 39,202 | |
| 229 | | * | | Nuvectra Corp | | | 3,742 | |
| 1,011 | | * | | NxStage Medical, Inc | | | 28,935 | |
| 575 | | * | | Omnicell, Inc | | | 35,213 | |
| 873 | | * | | OraSure Technologies, Inc | | | 10,197 | |
| 267 | | * | | Orthofix International NV | | | 14,015 | |
| 112 | | * | | OrthoPediatrics Corp | | | 3,907 | |
| 942 | | | | Owens & Minor, Inc | | | 5,963 | |
| 346 | | * | | Oxford Immunotec Global plc | | | 4,422 | |
| 1,530 | | | | Patterson Cos, Inc | | | 30,080 | |
| 496 | | * | | Penumbra, Inc | | | 60,611 | |
55
TIAA-CREF LIFE FUNDS -Stock Index Fund
| | | | | | | | |
SHARES | | | | COMPANY | | VALUE | |
| | | | | | | |
| 113 | | *,e | | PetIQ, Inc | | $ | 2,652 | |
| 1,204 | | * | | Premier, Inc | | | 44,969 | |
| 199 | | * | | Providence Service Corp | | | 11,944 | |
| 1,223 | | e | | Pulse Biosciences, Inc | | | 14,016 | |
| 2,225 | | | | Quest Diagnostics, Inc | | | 185,276 | |
| 528 | | * | | Quidel Corp | | | 25,777 | |
| 2,913 | | * | | Quorum Health Corp | | | 8,419 | |
| 1,555 | | * | | R1 RCM, Inc | | | 12,362 | |
| 576 | | * | | RadNet, Inc | | | 5,858 | |
| 2,353 | | | | Resmed, Inc | | | 267,936 | |
| 726 | | *,e | | Rockwell Medical, Inc | | | 1,641 | |
| 837 | | * | | RTI Biologics, Inc | | | 3,097 | |
| 250 | | * | | SeaSpine Holdings Corp | | | 4,560 | |
| 1,678 | | * | | Select Medical Holdings Corp | | | 25,757 | |
| 1,097 | | *,e | | Senseonics Holdings, Inc | | | 2,841 | |
| 141 | | * | | SI-BONE, Inc | | | 2,945 | |
| 220 | | * | | Sientra, Inc | | | 2,796 | |
| 166 | | | | Simulations Plus, Inc | | | 3,303 | |
| 646 | | * | | Staar Surgical Co | | | 20,614 | |
| 1,419 | | | | STERIS Plc | | | 151,620 | |
| 5,698 | | | | Stryker Corp | | | 893,161 | |
| 328 | | * | | Surgery Partners, Inc | | | 3,211 | |
| 300 | | * | | SurModics, Inc | | | 14,178 | |
| 280 | | * | | Tabula Rasa HealthCare, Inc | | | 17,853 | |
| 280 | | * | | Tactile Systems Technology, Inc | | | 12,754 | |
| 1,107 | | * | | Tandem Diabetes Care, Inc | | | 42,033 | |
| 1,001 | | * | | Teladoc, Inc | | | 49,620 | |
| 786 | | | | Teleflex, Inc | | | 203,165 | |
| 1,657 | | * | | Tenet Healthcare Corp | | | 28,401 | |
| 569 | | * | | Tivity Health, Inc | | | 14,117 | |
| 2,530 | | *,e | | TransEnterix, Inc | | | 5,718 | |
| 360 | | * | | Triple-S Management Corp (Class B) | | | 6,260 | |
| 15,967 | | | | UnitedHealth Group, Inc | | | 3,977,699 | |
| 1,403 | | | | Universal Health Services, Inc (Class B) | | | 163,534 | |
| 187 | | | | US Physical Therapy, Inc | | | 19,139 | |
| 49 | | | | Utah Medical Products, Inc | | | 4,071 | |
| 587 | | * | | Varex Imaging Corp | | | 13,900 | |
| 1,596 | | * | | Varian Medical Systems, Inc | | | 180,843 | |
| 2,071 | | * | | Veeva Systems, Inc | | | 184,982 | |
| 427 | | *,e | | ViewRay, Inc | | | 2,592 | |
| 433 | | * | | Vocera Communications, Inc | | | 17,039 | |
| 820 | | * | | WellCare Health Plans, Inc | | | 193,594 | |
| 1,214 | | | | West Pharmaceutical Services, Inc | | | 119,008 | |
| 2,118 | | * | | Wright Medical Group NV | | | 57,652 | |
| 3,451 | | | | Zimmer Biomet Holdings, Inc | | | 357,938 | |
| | | | | | | | |
| | | | TOTAL HEALTH CARE EQUIPMENT & SERVICES | | | 27,221,617 | |
| | | | | | | | |
| |
HOUSEHOLD & PERSONAL PRODUCTS - 1.6% | | | | |
| 160 | | * | | Central Garden & Pet Co | | | 5,512 | |
| 580 | | * | | Central Garden and Pet Co (Class A) | | | 18,125 | |
| 4,108 | | | | Church & Dwight Co, Inc | | | 270,142 | |
| 2,093 | | | | Clorox Co | | | 322,615 | |
| 14,201 | | | | Colgate-Palmolive Co | | | 845,244 | |
| 7,842 | | | | Coty, Inc | | | 51,444 | |
| 893 | | * | | Edgewell Personal Care Co | | | 33,354 | |
| 326 | | *,e | | elf Beauty, Inc | | | 2,823 | |
| 957 | | | | Energizer Holdings, Inc | | | 43,209 | |
| 3,645 | | | | Estee Lauder Cos (Class A) | | | 474,214 | |
| 1,873 | | * | | Herbalife Ltd | | | 110,413 | |
| 253 | | | | Inter Parfums, Inc | | | 16,589 | |
| 5,805 | | | | Kimberly-Clark Corp | | | 661,422 | |
| 160 | | | | Medifast, Inc | | | 20,003 | |
| 111 | | e | | Natural Health Trends Corp | | | 2,052 | |
| 140 | | * | | Nature’s Sunshine Products, Inc | | | 1,141 | |
56
TIAA-CREF LIFE FUNDS -Stock Index Fund
| | | | | | | | |
SHARES | | | | COMPANY | | VALUE | |
| | | | | | | |
| 992 | | | | Nu Skin Enterprises, Inc (Class A) | | $ | 60,839 | |
| 80 | | | | Oil-Dri Corp of America | | | 2,120 | |
| 41,591 | | | | Procter & Gamble Co | | | 3,823,045 | |
| 185 | | * | | Revlon, Inc (Class A) | | | 4,660 | |
| 680 | | | | Spectrum Brands Holdings, Inc | | | 28,730 | |
| 180 | | * | | USANA Health Sciences, Inc | | | 21,191 | |
| 215 | | | | WD-40 Co | | | 39,401 | |
| | | | | | | | |
| | | | TOTAL HOUSEHOLD & PERSONAL PRODUCTS | | | 6,858,288 | |
| | | | | | | | |
| |
INSURANCE - 4.1% | | | | |
| 12,815 | | | | Aflac, Inc | | | 583,851 | |
| 232 | | | | Alleghany Corp | | | 144,610 | |
| 5,748 | | | | Allstate Corp | | | 474,957 | |
| 699 | | * | | AMBAC Financial Group, Inc | | | 12,051 | |
| 1,557 | | | | American Equity Investment Life Holding Co | | | 43,503 | |
| 1,241 | | | | American Financial Group, Inc | | | 112,348 | |
| 14,902 | | | | American International Group, Inc | | | 587,288 | |
| 114 | | | | American National Insurance Co | | | 14,505 | |
| 299 | | | | Amerisafe, Inc | | | 16,950 | |
| 4,084 | | | | Aon plc | | | 593,650 | |
| 6,531 | | * | | Arch Capital Group Ltd | | | 174,508 | |
| 509 | | | | Argo Group International Holdings Ltd | | | 34,230 | |
| 3,090 | | | | Arthur J. Gallagher & Co | | | 227,733 | |
| 930 | | | | Aspen Insurance Holdings Ltd | | | 39,051 | |
| 856 | | | | Assurant, Inc | | | 76,561 | |
| 1,876 | | | | Assured Guaranty Ltd | | | 71,813 | |
| 2,832 | | * | | Athene Holding Ltd | | | 112,799 | |
| 1,308 | | | | Axis Capital Holdings Ltd | | | 67,545 | |
| 32,516 | | * | | Berkshire Hathaway, Inc (Class B) | | | 6,639,117 | |
| 1,957 | | * | | Brighthouse Financial, Inc | | | 59,649 | |
| 3,924 | | | | Brown & Brown, Inc | | | 108,145 | |
| 7,737 | | | | Chubb Ltd | | | 999,466 | |
| 2,548 | | | | Cincinnati Financial Corp | | | 197,266 | |
| 712 | | *,e | | Citizens, Inc (Class A) | | | 5,354 | |
| 426 | | | | CNA Financial Corp | | | 18,808 | |
| 2,753 | | | | Conseco, Inc | | | 40,965 | |
| 300 | | | | Crawford & Co (Class B) | | | 2,700 | |
| 143 | | | | Donegal Group, Inc (Class A) | | | 1,951 | |
| 264 | | * | | eHealth, Inc | | | 10,143 | |
| 124 | | | | EMC Insurance Group, Inc | | | 3,949 | |
| 488 | | | | Employers Holdings, Inc | | | 20,481 | |
| 247 | | * | | Enstar Group Ltd | | | 41,390 | |
| 490 | | | | Erie Indemnity Co (Class A) | | | 65,322 | |
| 706 | | | | Everest Re Group Ltd | | | 153,739 | |
| 150 | | | | FBL Financial Group, Inc (Class A) | | | 9,848 | |
| 201 | | | | FedNat Holding Co | | | 4,004 | |
| 1,977 | | | | First American Financial Corp | | | 88,253 | |
| 4,270 | | | | FNF Group | | | 134,249 | |
| 7,696 | | * | | Genworth Financial, Inc (Class A) | | | 35,863 | |
| 104 | | | | Global Indemnity Ltd | | | 3,768 | |
| 161 | | *,e | | Goosehead Insurance, Inc | | | 4,233 | |
| 463 | | * | | Greenlight Capital Re Ltd (Class A) | | | 3,991 | |
| 198 | | * | | Hallmark Financial Services | | | 2,117 | |
| 664 | | | | Hanover Insurance Group, Inc | | | 77,535 | |
| 5,901 | | | | Hartford Financial Services Group, Inc | | | 262,299 | |
| 121 | | | | HCI Group, Inc | | | 6,148 | |
| 161 | | *,e | | Health Insurance Innovations, Inc | | | 4,304 | |
| 362 | | e | | Heritage Insurance Holdings, Inc | | | 5,329 | |
| 637 | | | | Horace Mann Educators Corp | | | 23,856 | |
| 90 | | | | Independence Holding Co | | | 3,168 | |
| 23 | | | | Investors Title Co | | | 4,064 | |
| 648 | | | | James River Group Holdings Ltd | | | 23,678 | |
| 818 | | | | Kemper Corp | | | 54,299 | |
| 123 | | | | Kingstone Cos, Inc | | | 2,176 | |
57
TIAA-CREF LIFE FUNDS -Stock Index Fund
| | | | | | | | |
SHARES | | | | COMPANY | | VALUE | |
| | | | | | | |
| 497 | | | | Kinsale Capital Group, Inc | | $ | 27,613 | |
| 3,740 | | | | Lincoln National Corp | | | 191,899 | |
| 4,769 | | | | Loews Corp | | | 217,085 | |
| 910 | | | | Maiden Holdings Ltd | | | 1,501 | |
| 224 | | * | | Markel Corp | | | 232,523 | |
| 8,427 | | | | Marsh & McLennan Cos, Inc | | | 672,053 | |
| 2,003 | | * | | MBIA, Inc | | | 17,867 | |
| 429 | | | | Mercury General Corp | | | 22,184 | |
| 14,071 | | | | Metlife, Inc | | | 577,755 | |
| 742 | | | | National General Holdings Corp | | | 17,964 | |
| 35 | | | | National Western Life Group, Inc | | | 10,525 | |
| 532 | | | | Navigators Group, Inc | | | 36,969 | |
| 158 | | * | | NI Holdings, Inc | | | 2,485 | |
| 4,481 | | | | Old Republic International Corp | | | 92,174 | |
| 727 | | | | Primerica, Inc | | | 71,035 | |
| 4,749 | | | | Principal Financial Group | | | 209,763 | |
| 820 | | | | ProAssurance Corp | | | 33,259 | |
| 9,763 | | | | Progressive Corp | | | 589,002 | |
| 144 | | | | Protective Insurance Corp | | | 2,398 | |
| 7,015 | | | | Prudential Financial, Inc | | | 572,073 | |
| 1,056 | | | | Reinsurance Group of America, Inc (Class A) | | | 148,083 | |
| 697 | | | | RenaissanceRe Holdings Ltd | | | 93,189 | |
| 600 | | | | RLI Corp | | | 41,394 | |
| 227 | | | | Safety Insurance Group, Inc | | | 18,571 | |
| 874 | | | | Selective Insurance Group, Inc | | | 53,262 | |
| 243 | | | | State Auto Financial Corp | | | 8,272 | |
| 351 | | | | Stewart Information Services Corp | | | 14,531 | |
| 1,153 | | * | | Third Point Reinsurance Ltd | | | 11,115 | |
| 433 | | | | Tiptree Financial, Inc | | | 2,420 | |
| 1,809 | | | | Torchmark Corp | | | 134,825 | |
| 4,467 | | | | Travelers Cos, Inc | | | 534,923 | |
| 342 | | *,e | | Trupanion, Inc | | | 8,707 | |
| 338 | | | | United Fire & Casualty Co | | | 18,742 | |
| 255 | | | | United Insurance Holdings Corp | | | 4,238 | |
| 503 | | | | Universal Insurance Holdings, Inc | | | 19,074 | |
| 3,600 | | | | UnumProvident Corp | | | 105,768 | |
| 1,489 | | | | W.R. Berkley Corp | | | 110,052 | |
| 56 | | | | White Mountains Insurance Group Ltd | | | 48,031 | |
| 2,214 | | | | Willis Towers Watson plc | | | 336,218 | |
| | | | | | | | |
| | | | TOTAL INSURANCE | | | 17,819,122 | |
| | | | | | | | |
| |
MATERIALS - 3.0% | | | | |
| 450 | | * | | A Schulman, Inc | | | 860 | |
| 324 | | e | | Advanced Emissions Solutions, Inc | | | 3,418 | |
| 461 | | * | | AdvanSix, Inc | | | 11,221 | |
| 332 | | *,e | | AgroFresh Solutions, Inc | | | 1,258 | |
| 3,683 | | | | Air Products & Chemicals, Inc | | | 589,464 | |
| 6,324 | | *,e | | AK Steel Holding Corp | | | 14,229 | |
| 1,889 | | | | Albemarle Corp | | | 145,585 | |
| 3,306 | | * | | Alcoa Corp | | | 87,874 | |
| 2,222 | | * | | Allegheny Technologies, Inc | | | 48,373 | |
| 429 | | | | American Vanguard Corp | | | 6,517 | |
| 2,424 | | *,e | | Amyris, Inc | | | 8,096 | |
| 1,121 | | | | Aptargroup, Inc | | | 105,452 | |
| 271 | | | | Ardagh Group S.A. | | | 3,003 | |
| 943 | | | | Ashland Global Holdings, Inc | | | 66,915 | |
| 1,514 | | | | Avery Dennison Corp | | | 136,003 | |
| 3,458 | | * | | Axalta Coating Systems Ltd | | | 80,986 | |
| 485 | | | | Balchem Corp | | | 38,000 | |
| 5,623 | | | | Ball Corp | | | 258,546 | |
| 1,456 | | | | Bemis Co, Inc | | | 66,830 | |
| 2,289 | | * | | Berry Plastics Group, Inc | | | 108,796 | |
| 597 | | | | Boise Cascade Co | | | 14,238 | |
| 953 | | | | Cabot Corp | | | 40,922 | |
58
TIAA-CREF LIFE FUNDS -Stock Index Fund
| | | | | | | | |
SHARES | | | | COMPANY | | VALUE | |
| | | | | | | |
| 723 | | | | Carpenter Technology Corp | | $ | 25,746 | |
| 2,318 | | | | Celanese Corp (Series A) | | | 208,550 | |
| 831 | | * | | Century Aluminum Co | | | 6,075 | |
| 3,995 | | | | CF Industries Holdings, Inc | | | 173,822 | |
| 111 | | | | Chase Corp | | | 11,106 | |
| 2,911 | | | | Chemours Co | | | 82,148 | |
| 261 | | * | | Clearwater Paper Corp | | | 6,361 | |
| 4,904 | | * | | Cleveland-Cliffs, Inc | | | 37,712 | |
| 2,861 | | * | | Coeur Mining, Inc | | | 12,789 | |
| 1,801 | | | | Commercial Metals Co | | | 28,852 | |
| 532 | | | | Compass Minerals International, Inc | | | 22,179 | |
| 2,049 | | * | | Crown Holdings, Inc | | | 85,177 | |
| 976 | | | | Domtar Corp | | | 34,287 | |
| 38,729 | | | | DowDuPont, Inc | | | 2,071,227 | |
| 735 | | | | Eagle Materials, Inc | | | 44,857 | |
| 2,397 | | | | Eastman Chemical Co | | | 175,245 | |
| 4,238 | | | | Ecolab, Inc | | | 624,469 | |
| 1,255 | | * | | Ferro Corp | | | 19,678 | |
| 1,000 | | * | | Ferroglobe plc | | | 0 | |
| 835 | | *,e | | Flotek Industries, Inc | | | 910 | |
| 2,292 | | | | FMC Corp | | | 169,516 | |
| 325 | | *,e | | Forterra, Inc | | | 1,222 | |
| 24,379 | | | | Freeport-McMoRan Copper & Gold, Inc (Class B) | | | 251,348 | |
| 400 | | | | FutureFuel Corp | | | 6,344 | |
| 1,119 | | * | | GCP Applied Technologies, Inc | | | 27,471 | |
| 816 | | | | Gold Resource Corp | | | 3,264 | |
| 4,828 | | | | Graphic Packaging Holding Co | | | 51,370 | |
| 87 | | | | Greif, Inc | | | 3,863 | |
| 395 | | | | Greif, Inc (Class A) | | | 14,658 | |
| 784 | | | | H.B. Fuller Co | | | 33,453 | |
| 142 | | | | Hawkins, Inc | | | 5,815 | |
| 193 | | | | Haynes International, Inc | | | 5,095 | |
| 7,106 | | | | Hecla Mining Co | | | 16,770 | |
| 3,508 | | | | Huntsman Corp | | | 67,669 | |
| 658 | | * | | Ingevity Corp | | | 55,068 | |
| 294 | | | | Innophos Holdings, Inc | | | 7,212 | |
| 373 | | | | Innospec, Inc | | | 23,037 | |
| 1,651 | | | | International Flavors & Fragrances, Inc | | | 221,680 | |
| 7,009 | | | | International Paper Co | | | 282,883 | |
| 1,493 | | * | | Intrepid Potash, Inc | | | 3,882 | |
| 261 | | | | Kaiser Aluminum Corp | | | 23,305 | |
| 315 | | * | | Koppers Holdings, Inc | | | 5,368 | |
| 468 | | * | | Kraton Polymers LLC | | | 10,221 | |
| 357 | | | | Kronos Worldwide, Inc | | | 4,113 | |
| 9,251 | | | | Linde plc | | | 1,443,526 | |
| 389 | | * | | Livent Corp | | | 5,368 | |
| 2,555 | | | | Louisiana-Pacific Corp | | | 56,772 | |
| 406 | | * | | LSB Industries, Inc | | | 2,241 | |
| 5,309 | | | | LyondellBasell Industries AF S.C.A | | | 441,496 | |
| 8,475 | | * | | Marrone Bio Innovations, Inc | | | 12,458 | |
| 1,050 | | | | Martin Marietta Materials, Inc | | | 180,464 | |
| 300 | | | | Materion Corp | | | 13,497 | |
| 741 | | | | Minerals Technologies, Inc | | | 38,043 | |
| 5,897 | | | | Mosaic Co | | | 172,251 | |
| 371 | | | | Myers Industries, Inc | | | 5,606 | |
| 257 | | | | Neenah Paper, Inc | | | 15,142 | |
| 116 | | | | NewMarket Corp | | | 47,802 | |
| 8,626 | | | | Newmont Mining Corp | | | 298,891 | |
| 5,183 | | | | Nucor Corp | | | 268,531 | |
| 3,054 | | | | Olin Corp | | | 61,416 | |
| 163 | | | | Olympic Steel, Inc | | | 2,326 | |
| 694 | | * | | Omnova Solutions, Inc | | | 5,087 | |
| 2,868 | | * | | Owens-Illinois, Inc | | | 49,444 | |
| 1,586 | | | | Packaging Corp of America | | | 132,368 | |
| 658 | | | | PH Glatfelter Co | | | 6,422 | |
59
TIAA-CREF LIFE FUNDS -Stock Index Fund
| | | | | | | | |
SHARES | | | | COMPANY | | VALUE | |
| | | | | | | |
| 3,394 | | * | | Platform Specialty Products Corp | | $ | 35,060 | |
| 1,269 | | | | PolyOne Corp | | | 36,293 | |
| 4,076 | | | | PPG Industries, Inc | | | 416,689 | |
| 462 | | * | | PQ Group Holdings, Inc | | | 6,842 | |
| 201 | | | | Quaker Chemical Corp | | | 35,720 | |
| 1,995 | | *,e | | Ramaco Resources, Inc | | | 9,875 | |
| 877 | | | | Rayonier Advanced Materials, Inc | | | 9,340 | |
| 1,105 | | | | Reliance Steel & Aluminum Co | | | 78,643 | |
| 1,100 | | | | Royal Gold, Inc | | | 94,215 | |
| 2,208 | | | | RPM International, Inc | | | 129,786 | |
| 272 | | * | | Ryerson Holding Corp | | | 1,724 | |
| 421 | | | | Schnitzer Steel Industries, Inc (Class A) | | | 9,073 | |
| 438 | | | | Schweitzer-Mauduit International, Inc | | | 10,972 | |
| 716 | | | | ScottsMiracle-Gro Co (Class A) | | | 44,005 | |
| 2,697 | | | | Sealed Air Corp | | | 93,963 | |
| 694 | | | | Sensient Technologies Corp | | | 38,760 | |
| 1,384 | | | | Sherwin-Williams Co | | | 544,549 | |
| 1,161 | | | | Silgan Holdings, Inc | | | 27,423 | |
| 1,720 | | | | Sonoco Products Co | | | 91,384 | |
| 1,302 | | | | Southern Copper Corp (NY) | | | 40,063 | |
| 3,643 | | | | Steel Dynamics, Inc | | | 109,436 | |
| 302 | | | | Stepan Co | | | 22,348 | |
| 1,996 | | * | | Summit Materials, Inc | | | 24,750 | |
| 1,010 | | * | | SunCoke Energy, Inc | | | 8,636 | |
| 146 | | | | Synalloy Corp | | | 2,422 | |
| 4,844 | | * | | Tahoe Resources, Inc | | | 17,681 | |
| 717 | | * | | TimkenSteel Corp | | | 6,267 | |
| 322 | | * | | Trecora Resources | | | 2,512 | |
| 394 | | | | Tredegar Corp | | | 6,249 | |
| 733 | | | | Trinseo S.A. | | | 33,557 | |
| 1,458 | | | | Tronox Ltd | | | 11,343 | |
| 97 | | * | | UFP Technologies, Inc | | | 2,914 | |
| 30 | | | | United States Lime & Minerals, Inc | | | 2,130 | |
| 3,129 | | | | United States Steel Corp | | | 57,073 | |
| 144 | | * | | Universal Stainless & Alloy | | | 2,334 | |
| 238 | | * | | US Concrete, Inc | | | 8,397 | |
| 592 | | | | Valhi, Inc | | | 1,143 | |
| 3,141 | | | | Valvoline, Inc | | | 60,778 | |
| 1,196 | | * | | Verso Corp | | | 26,790 | |
| 2,165 | | | | Vulcan Materials Co | | | 213,902 | |
| 610 | | | | Warrior Met Coal, Inc | | | 14,707 | |
| 559 | | | | Westlake Chemical Corp | | | 36,989 | |
| 4,211 | | | | WestRock Co | | | 159,007 | |
| 702 | | | | Worthington Industries, Inc | | | 24,458 | |
| 1,067 | | | | WR Grace and Co | | | 69,259 | |
| | | | | | | | |
| | | | TOTAL MATERIALS | | | 12,741,015 | |
| | | | | | | | |
| |
MEDIA & ENTERTAINMENT - 7.0% | | | | |
| 12,670 | | | | Activision Blizzard, Inc | | | 590,042 | |
| 5,014 | | * | | Alphabet, Inc (Class A) | | | 5,239,429 | |
| 5,111 | | * | | Alphabet, Inc (Class C) | | | 5,293,003 | |
| 855 | | | | AMC Entertainment Holdings, Inc | | | 10,499 | |
| 741 | | * | | AMC Networks, Inc | | | 40,666 | |
| 76 | | | | Beasley Broadcasting Group, Inc | | | 285 | |
| 698 | | * | | Boston Omaha Corp | | | 16,333 | |
| 72 | | | | Cable One, Inc | | | 59,047 | |
| 253 | | * | | Care.com, Inc | | | 4,885 | |
| 788 | | * | | Cargurus, Inc | | | 26,579 | |
| 1,131 | | * | | Cars.com, Inc | | | 24,316 | |
| 5,577 | | | | CBS Corp (Class B) | | | 243,826 | |
| 1,847 | | * | | Central European Media Enterprises Ltd (Class A) (NASDAQ) | | | 5,135 | |
| 2,917 | | * | | Charter Communications, Inc | | | 831,257 | |
| 1,638 | | | | Cinemark Holdings, Inc | | | 58,640 | |
| 566 | | | | Clear Channel Outdoor Holdings, Inc (Class A) | | | 2,938 | |
60
TIAA-CREF LIFE FUNDS -Stock Index Fund
| | | | | | | | |
SHARES | | | | COMPANY | | VALUE | |
| | | | | | | |
| 76,199 | | | | Comcast Corp (Class A) | | $ | 2,594,576 | |
| 17 | | *,e | | Daily Journal Corp | | | 3,978 | |
| 2,851 | | * | | Discovery, Inc (Class A) | | | 70,534 | |
| 6,054 | | * | | Discovery, Inc (Class C) | | | 139,726 | |
| 3,453 | | * | | DISH Network Corp (Class A) | | | 86,221 | |
| 5,069 | | * | | Electronic Arts, Inc | | | 399,995 | |
| 235 | | | | Emerald Expositions Events, Inc | | | 2,900 | |
| 2,009 | | | | Entercom Communications Corp (Class A) | | | 11,471 | |
| 1,005 | | | | Entravision Communications Corp (Class A) | | | 2,925 | |
| 454 | | *,e | | Eros International plc | | | 3,764 | |
| 916 | | | | EW Scripps Co (Class A) | | | 14,409 | |
| 39,914 | | * | | Facebook, Inc | | | 5,232,326 | |
| 218 | | * | | Fluent, Inc | | | 785 | |
| 1,767 | | | | Gannett Co, Inc | | | 15,073 | |
| 1,557 | | * | | GCI Liberty, Inc | | | 64,086 | |
| 1,606 | | * | | Glu Mobile, Inc | | | 12,960 | |
| 1,876 | | * | | Gray Television, Inc | | | 27,652 | |
| 248 | | * | | Hemisphere Media Group, Inc | | | 3,011 | |
| 1,205 | | * | | IAC/InterActiveCorp | | | 220,563 | |
| 902 | | * | | Imax Corp | | | 16,967 | |
| 6,297 | | | | Interpublic Group of Cos, Inc | | | 129,907 | |
| 693 | | | | John Wiley & Sons, Inc (Class A) | | | 32,550 | |
| 170 | | * | | Liberty Braves Group (Class A) | | | 4,240 | |
| 525 | | * | | Liberty Braves Group (Class C) | | | 13,067 | |
| 392 | | * | | Liberty Broadband Corp (Class A) | | | 28,150 | |
| 1,723 | | * | | Liberty Broadband Corp (Class C) | | | 124,108 | |
| 1,811 | | * | | Liberty Latin America Ltd | | | 26,386 | |
| 681 | | * | | Liberty Latin America Ltd (Class A) | | | 9,861 | |
| 398 | | * | | Liberty Media Group (Class A) | | | 11,829 | |
| 3,180 | | * | | Liberty Media Group (Class C) | | | 97,626 | |
| 1,395 | | * | | Liberty SiriusXM Group (Class A) | | | 51,336 | |
| 2,800 | | * | | Liberty SiriusXM Group (Class C) | | | 103,544 | |
| 1,108 | | * | | Liberty TripAdvisor Holdings, Inc | | | 17,606 | |
| 786 | | e | | Lions Gate Entertainment Corp (Class A) | | | 12,655 | |
| 1,548 | | e | | Lions Gate Entertainment Corp (Class B) | | | 23,034 | |
| 2,254 | | * | | Live Nation, Inc | | | 111,009 | |
| 439 | | *,e | | LiveXLive Media, Inc | | | 2,173 | |
| 200 | | * | | Loral Space & Communications, Inc | | | 7,450 | |
| 306 | | * | | Madison Square Garden Co | | | 81,916 | |
| 294 | | | | Marcus Corp | | | 11,613 | |
| 831 | | e | | Match Group, Inc | | | 35,542 | |
| 884 | | * | | MDC Partners, Inc | | | 2,307 | |
| 1,034 | | * | | Meet Group, Inc | | | 4,787 | |
| 597 | | e | | Meredith Corp | | | 31,008 | |
| 934 | | * | | MSG Networks, Inc | | | 22,005 | |
| 970 | | | | National CineMedia, Inc | | | 6,286 | |
| 6,945 | | * | | NetFlix, Inc | | | 1,858,899 | |
| 804 | | | | New Media Investment Group, Inc | | | 9,302 | |
| 2,452 | | | | New York Times Co (Class A) | | | 54,655 | |
| 6,379 | | | | News Corp (Class A) | | | 72,402 | |
| 1,884 | | | | News Corp (Class B) | | | 21,760 | |
| 706 | | | | Nexstar Broadcasting Group, Inc (Class A) | | | 55,520 | |
| 3,754 | | | | Omnicom Group, Inc | | | 274,943 | |
| 5,413 | | * | | Pandora Media, Inc | | | 43,791 | |
| 583 | | * | | QuinStreet, Inc | | | 9,462 | |
| 444 | | * | | Reading International, Inc | | | 6,456 | |
| 279 | | * | | Rosetta Stone, Inc | | | 4,576 | |
| 51 | | | | Saga Communications, Inc | | | 1,695 | |
| 438 | | | | Scholastic Corp | | | 17,634 | |
| 1,071 | | | | Sinclair Broadcast Group, Inc (Class A) | | | 28,210 | |
| 21,148 | | e | | Sirius XM Holdings, Inc | | | 120,755 | |
| 1,927 | | * | | Take-Two Interactive Software, Inc | | | 198,365 | |
| 317 | | * | | TechTarget, Inc | | | 3,871 | |
| 3,394 | | | | TEGNA, Inc | | | 36,893 | |
61
TIAA-CREF LIFE FUNDS -Stock Index Fund
| | | | | | | | |
SHARES | | | | COMPANY | | VALUE | |
| | | | | | | |
| 1,489 | | | | Tribune Co | | $ | 67,571 | |
| 414 | | * | | Tribune Publishing Co | | | 4,695 | |
| 1,758 | | * | | TripAdvisor, Inc | | | 94,827 | |
| 963 | | * | | TrueCar, Inc | | | 8,725 | |
| 17,394 | | | | Twenty-First Century Fox, Inc | | | 836,999 | |
| 8,179 | | | | Twenty-First Century Fox, Inc (Class B) | | | 390,793 | |
| 11,820 | | * | | Twitter, Inc | | | 339,707 | |
| 150 | | | | Viacom, Inc | | | 4,171 | |
| 5,848 | | | | Viacom, Inc (Class B) | | | 150,294 | |
| 24,874 | | | | Walt Disney Co | | | 2,727,434 | |
| 341 | | * | | WideOpenWest, Inc | | | 2,431 | |
| 695 | | | | World Wrestling Entertainment, Inc (Class A) | | | 51,930 | |
| 1,209 | | * | | Yelp, Inc | | | 42,303 | |
| 820 | | * | | Zillow Group, Inc | | | 25,773 | |
| 1,956 | | *,e | | Zillow Group, Inc (Class C) | | | 61,770 | |
| 11,803 | | * | | Zynga, Inc | | | 46,386 | |
| | | | | | | | |
| | | | TOTAL MEDIA & ENTERTAINMENT | | | 30,047,795 | |
| | | | | | | | |
| |
PHARMACEUTICALS, BIOTECHNOLOGY & LIFE SCIENCES - 8.4% | | | | |
| 25,274 | | | | AbbVie, Inc | | | 2,330,010 | |
| 404 | | *,e | | Abeona Therapeutics, Inc | | | 2,885 | |
| 1,514 | | * | | Acadia Pharmaceuticals, Inc | | | 24,481 | |
| 406 | | *,e | | Accelerate Diagnostics, Inc | | | 4,669 | |
| 492 | | * | | Acceleron Pharma, Inc | | | 21,427 | |
| 8,051 | | *,e | | Achaogen, Inc | | | 9,903 | |
| 1,810 | | * | | Achillion Pharmaceuticals, Inc | | | 2,878 | |
| 319 | | * | | Aclaris Therapeutics, Inc | | | 2,357 | |
| 662 | | * | | Acorda Therapeutics, Inc | | | 10,314 | |
| 265 | | * | | Adamas Pharmaceuticals, Inc | | | 2,263 | |
| 6,048 | | * | | Aduro Biotech, Inc | | | 15,967 | |
| 883 | | * | | Adverum Biotechnologies, Inc | | | 2,781 | |
| 1,425 | | * | | Aeglea BioTherapeutics, Inc | | | 10,673 | |
| 702 | | * | | Aerie Pharmaceuticals, Inc | | | 25,342 | |
| 1,104 | | *,e | | Agenus, Inc | | | 2,628 | |
| 120 | | *,e | | AgeX Therapeutics, Inc | | | 359 | |
| 5,456 | | | | Agilent Technologies, Inc | | | 368,062 | |
| 823 | | * | | Agios Pharmaceuticals, Inc | | | 37,949 | |
| 554 | | * | | Aimmune Therapeutics, Inc | | | 13,252 | |
| 239 | | *,e | | Akcea Therapeutics, Inc | | | 7,203 | |
| 1,079 | | * | | Akebia Therapeutics, Inc | | | 5,967 | |
| 1,391 | | * | | Akorn, Inc | | | 4,715 | |
| 147 | | * | | Albireo Pharma, Inc | | | 3,606 | |
| 965 | | * | | Alder Biopharmaceuticals, Inc | | | 9,891 | |
| 355 | | * | | Aldeyra Therapeutics, Inc | | | 2,946 | |
| 3,495 | | * | | Alexion Pharmaceuticals, Inc | | | 340,273 | |
| 2,380 | | * | | Alkermes plc | | | 70,234 | |
| 140 | | *,e | | Allakos, Inc | | | 7,318 | |
| 5,650 | | | | Allergan plc | | | 755,179 | |
| 356 | | * | | Allogene Therapeutics, Inc | | | 9,587 | |
| 1,548 | | * | | Alnylam Pharmaceuticals, Inc | | | 112,865 | |
| 533 | | * | | AMAG Pharmaceuticals, Inc | | | 8,096 | |
| 10,791 | | | | Amgen, Inc | | | 2,100,684 | |
| 2,936 | | * | | Amicus Therapeutics, Inc | | | 28,127 | |
| 2,013 | | * | | Amneal Pharmaceuticals, Inc | | | 27,236 | |
| 552 | | * | | Amphastar Pharmaceuticals, Inc | | | 10,985 | |
| 6,494 | | *,e | | Ampio Pharmaceuticals, Inc | | | 2,564 | |
| 305 | | * | | AnaptysBio, Inc | | | 19,456 | |
| 121 | | * | | ANI Pharmaceuticals, Inc | | | 5,447 | |
| 582 | | * | | Apellis Pharmaceuticals, Inc | | | 7,677 | |
| 211 | | * | | Aptinyx, Inc | | | 3,490 | |
| 626 | | * | | Aratana Therapeutics, Inc | | | 3,837 | |
| 574 | | * | | Arbutus Biopharma Corp | | | 2,198 | |
| 524 | | * | | Arcus Biosciences, Inc | | | 5,643 | |
| 650 | | * | | Ardelyx, Inc | | | 1,164 | |
62
TIAA-CREF LIFE FUNDS -Stock Index Fund
| | | | | | | | |
SHARES | | | | COMPANY | | VALUE | |
| | | | | | | |
| 884 | | * | | Arena Pharmaceuticals, Inc | | $ | 34,432 | |
| 1,405 | | * | | Arqule, Inc | | | 3,892 | |
| 3,325 | | * | | Array Biopharma, Inc | | | 47,381 | |
| 1,400 | | *,e | | Arrowhead Research Corp | | | 17,388 | |
| 4,491 | | * | | Arsanis, Inc | | | 10,419 | |
| 216 | | * | | Assembly Biosciences, Inc | | | 4,886 | |
| 928 | | * | | Assertio Therapeutics, Inc. | | | 3,350 | |
| 719 | | * | | Atara Biotherapeutics, Inc | | | 24,978 | |
| 673 | | *,e | | Athenex, Inc | | | 8,540 | |
| 1,583 | | *,e | | Athersys, Inc | | | 2,280 | |
| 516 | | * | | Audentes Therapeutics, Inc | | | 11,001 | |
| 1,650 | | *,e | | AVEO Pharmaceuticals, Inc | | | 2,640 | |
| 813 | | * | | Avid Bioservices, Inc | | | 3,333 | |
| 105 | | * | | Avrobio, Inc | | | 1,748 | |
| 419 | | * | | Bellicum Pharmaceuticals, Inc | | | 1,223 | |
| 1,257 | | * | | BioCryst Pharmaceuticals, Inc | | | 10,144 | |
| 3,356 | | * | | Biogen Idec, Inc | | | 1,009,888 | |
| 451 | | * | | Biohaven Pharmaceutical Holding Co Ltd | | | 16,678 | |
| 2,842 | | * | | BioMarin Pharmaceutical, Inc | | | 241,996 | |
| 379 | | * | | Bio-Rad Laboratories, Inc (Class A) | | | 88,011 | |
| 89 | | * | | Biospecifics Technologies Corp | | | 5,393 | |
| 578 | | | | Bio-Techne Corp | | | 83,648 | |
| 1,211 | | *,e | | BioTime, Inc | | | 1,106 | |
| 829 | | * | | Bluebird Bio, Inc | | | 82,237 | |
| 676 | | * | | Blueprint Medicines Corp | | | 36,443 | |
| 27,282 | | | | Bristol-Myers Squibb Co | | | 1,418,118 | |
| 1,641 | | | | Bruker BioSciences Corp | | | 48,853 | |
| 470 | | * | | Calithera Biosciences, Inc | | | 1,885 | |
| 127 | | * | | Calyxt, Inc | | | 1,316 | |
| 504 | | * | | Cambrex Corp | | | 19,031 | |
| 425 | | *,e | | Cara Therapeutics Inc | | | 5,525 | |
| 519 | | * | | CareDx, Inc | | | 13,048 | |
| 807 | | * | | CASI Pharmaceuticals, Inc | | | 3,244 | |
| 2,296 | | * | | Catalent, Inc | | | 71,589 | |
| 1,294 | | * | | Catalyst Biosciences, Inc | | | 10,210 | |
| 1,095 | | * | | Catalyst Pharmaceuticals, Inc | | | 2,102 | |
| 102 | | * | | Celcuity, Inc | | | 2,447 | |
| 11,767 | | * | | Celgene Corp | | | 754,147 | |
| 776 | | *,e | | Cellular Biomedicine Group, Inc | | | 13,704 | |
| 728 | | * | | Charles River Laboratories International, Inc | | | 82,395 | |
| 402 | | * | | ChemoCentryx, Inc | | | 4,386 | |
| 913 | | * | | Chimerix, Inc | | | 2,346 | |
| 3,917 | | *,e | | ChromaDex Corp | | | 13,435 | |
| 8,957 | | *,e | | Clearside Biomedical, Inc | | | 9,584 | |
| 747 | | *,e | | Clovis Oncology, Inc | | | 13,416 | |
| 646 | | * | | Codexis, Inc | | | 10,788 | |
| 359 | | *,e | | Cohbar, Inc | | | 1,116 | |
| 601 | | * | | Coherus Biosciences, Inc | | | 5,439 | |
| 351 | | *,e | | Collegium Pharmaceutical, Inc | | | 6,027 | |
| 271 | | * | | Concert Pharmaceuticals Inc | | | 3,401 | |
| 708 | | *,e | | Corbus Pharmaceuticals Holdings, Inc | | | 4,135 | |
| 1,401 | | *,e | | Corcept Therapeutics, Inc | | | 18,717 | |
| 478 | | *,e | | Corium International, Inc | | | 86 | |
| 145 | | * | | Corvus Pharmaceuticals, Inc | | | 532 | |
| 107 | | *,e | | Crinetics Pharmaceuticals, Inc | | | 3,209 | |
| 828 | | *,e | | CTI BioPharma Corp | | | 607 | |
| 288 | | *,e | | Cue Biopharma, Inc | | | 1,354 | |
| 949 | | * | | Cymabay Therapeutics, Inc | | | 7,469 | |
| 639 | | * | | Cytokinetics, Inc | | | 4,038 | |
| 459 | | * | | CytomX Therapeutics, Inc | | | 6,931 | |
| 127 | | * | | Deciphera Pharmaceuticals, Inc | | | 2,666 | |
| 957 | | *,e | | Denali Therapeutics, Inc | | | 19,772 | |
| 587 | | * | | Dermira, Inc | | | 4,221 | |
| 716 | | * | | Dicerna Pharmaceuticals Inc | | | 7,654 | |
| 520 | | *,e | | Dova Pharmaceuticals, Inc | | | 3,942 | |
63
TIAA-CREF LIFE FUNDS -Stock Index Fund
| | | | | | | | |
SHARES | | | | COMPANY | | VALUE | |
| | | | | | | |
| 2,721 | | * | | Durect Corp | | $ | 1,315 | |
| 1,036 | | * | | Dynavax Technologies Corp | | | 9,479 | |
| 122 | | * | | Eagle Pharmaceuticals, Inc | | | 4,915 | |
| 736 | | * | | Editas Medicine, Inc | | | 16,744 | |
| 1,214 | | * | | Elanco Animal Health, Inc | | | 38,277 | |
| 15,881 | | | | Eli Lilly & Co | | | 1,837,749 | |
| 348 | | * | | Eloxx Pharmaceuticals, Inc | | | 4,179 | |
| 709 | | * | | Emergent Biosolutions, Inc | | | 42,030 | |
| 232 | | * | | Enanta Pharmaceuticals, Inc | | | 16,433 | |
| 3,476 | | * | | Endo International plc | | | 25,375 | |
| 623 | | * | | Enzo Biochem, Inc | | | 1,732 | |
| 620 | | * | | Epizyme, Inc | | | 3,819 | |
| 623 | | *,e | | Esperion Thereapeutics, Inc | | | 28,658 | |
| 231 | | *,e | | Evelo Biosciences, Inc | | | 3,005 | |
| 159 | | * | | Evolus, Inc | | | 1,892 | |
| 2,103 | | * | | Exact Sciences Corp | | | 132,699 | |
| 5,221 | | * | | Exelixis, Inc | | | 102,697 | |
| 835 | | * | | Fate Therapeutics, Inc | | | 10,713 | |
| 1,429 | | * | | Fennec Pharmaceuticals, Inc | | | 9,117 | |
| 1,241 | | * | | FibroGen, Inc | | | 57,433 | |
| 428 | | * | | Five Prime Therapeutics, Inc | | | 3,980 | |
| 438 | | *,e | | Flexion Therapeutics Inc | | | 4,958 | |
| 515 | | * | | Fluidigm Corp | | | 4,439 | |
| 137 | | * | | Forty Seven, Inc | | | 2,154 | |
| 336 | | * | | G1 Therapeutics, Inc | | | 6,434 | |
| 303 | | * | | Genomic Health, Inc | | | 19,516 | |
| 2,277 | | *,e | | Geron Corp | | | 2,277 | |
| 21,571 | | | | Gilead Sciences, Inc | | | 1,349,266 | |
| 805 | | * | | Global Blood Therapeutics, Inc | | | 33,045 | |
| 541 | | * | | GlycoMimetics Inc | | | 5,123 | |
| 2,005 | | * | | Halozyme Therapeutics, Inc | | | 29,333 | |
| 2,728 | | * | | Harvard Bioscience, Inc | | | 8,675 | |
| 1,027 | | * | | Heron Therapeutics, Inc | | | 26,640 | |
| 188 | | *,e | | Homology Medicines, Inc | | | 4,204 | |
| 2,514 | | * | | Horizon Pharma plc | | | 49,124 | |
| 343 | | * | | Idera Pharmaceuticals, Inc | | | 950 | |
| 2,433 | | * | | Illumina, Inc | | | 729,730 | |
| 629 | | * | | Immune Design Corp | | | 818 | |
| 2,066 | | * | | Immunogen, Inc | | | 9,917 | |
| 2,121 | | *,e | | Immunomedics, Inc | | | 30,267 | |
| 2,861 | | * | | Incyte Corp | | | 181,931 | |
| 718 | | *,e | | Innovate Biopharmaceuticals, Inc | | | 1,659 | |
| 1,186 | | * | | Innoviva, Inc | | | 20,696 | |
| 1,045 | | * | | Inovio Pharmaceuticals, Inc | | | 4,180 | |
| 1,335 | | * | | Insmed, Inc | | | 17,515 | |
| 340 | | *,e | | Insys Therapeutics, Inc | | | 1,190 | |
| 536 | | * | | Intellia Therapeutics, Inc | | | 7,316 | |
| 353 | | * | | Intercept Pharmaceuticals, Inc | | | 35,579 | |
| 388 | | * | | Intersect ENT, Inc | | | 10,934 | |
| 527 | | * | | Intra-Cellular Therapies, Inc | | | 6,003 | |
| 861 | | *,e | | Intrexon Corp | | | 5,631 | |
| 1,569 | | * | | Invitae Corp | | | 17,353 | |
| 2,281 | | * | | Ionis Pharmaceuticals, Inc | | | 123,311 | |
| 1,361 | | * | | Iovance Biotherapeutics, Inc | | | 12,045 | |
| 2,693 | | * | | IQVIA Holdings, Inc | | | 312,846 | |
| 2,083 | | * | | Ironwood Pharmaceuticals, Inc | | | 21,580 | |
| 941 | | * | | Jazz Pharmaceuticals plc | | | 116,646 | |
| 45,062 | | | | Johnson & Johnson | | | 5,815,251 | |
| 3,171 | | * | | Jounce Therapeutics, Inc | | | 10,686 | |
| 1,126 | | *,e | | Kadmon Holdings, Inc | | | 2,342 | |
| 127 | | * | | Kala Pharmaceuticals, Inc | | | 621 | |
| 499 | | * | | Karyopharm Therapeutics, Inc | | | 4,676 | |
| 337 | | * | | Kindred Biosciences Inc | | | 3,690 | |
| 99 | | * | | Kiniksa Pharmaceuticals Ltd | | | 2,781 | |
| 217 | | * | | Kura Oncology, Inc | | | 3,047 | |
64
TIAA-CREF LIFE FUNDS -Stock Index Fund
| | | | | | | | |
SHARES | | | | COMPANY | | VALUE | |
| | | | | | | |
| 268 | | *,e | | La Jolla Pharmaceutical Co | | $ | 2,527 | |
| 429 | | *,e | | Lannett Co, Inc | | | 2,128 | |
| 657 | | *,e | | Lexicon Pharmaceuticals, Inc | | | 4,362 | |
| 305 | | * | | Ligand Pharmaceuticals, Inc (Class B) | | | 41,389 | |
| 429 | | * | | Loxo Oncology, Inc | | | 60,090 | |
| 628 | | | | Luminex Corp | | | 14,513 | |
| 515 | | * | | MacroGenics, Inc | | | 6,541 | |
| 93 | | *,e | | Madrigal Pharmaceuticals, Inc | | | 10,483 | |
| 1,553 | | * | | Mallinckrodt plc | | | 24,537 | |
| 2,279 | | *,e | | MannKind Corp | | | 2,416 | |
| 592 | | *,e | | Marinus Pharmaceuticals, Inc | | | 1,699 | |
| 1,076 | | * | | Medicines Co | | | 20,595 | |
| 458 | | *,e | | MediciNova, Inc | | | 3,742 | |
| 358 | | * | | Medpace Holdings, Inc | | | 18,949 | |
| 128 | | * | | Melinta Therapeutics, Inc | | | 101 | |
| 98 | | * | | Menlo Therapeutics, Inc | | | 404 | |
| 2,722 | | *,e | | Mersana Therapeutics, Inc | | | 11,106 | |
| 396 | | * | | Mettler-Toledo International, Inc | | | 223,970 | |
| 553 | | * | | Minerva Neurosciences, Inc | | | 3,727 | |
| 216 | | *,e | | Miragen Therapeutics, Inc | | | 654 | |
| 291 | | * | | Mirati Therapeutics, Inc | | | 12,344 | |
| 1,150 | | * | | Momenta Pharmaceuticals, Inc | | | 12,696 | |
| 8,764 | | * | | Mylan NV | | �� | 240,134 | |
| 491 | | * | | MyoKardia, Inc | | | 23,990 | |
| 1,032 | | * | | Myriad Genetics, Inc | | | 30,000 | |
| 276 | | * | | NanoString Technologies, Inc | | | 4,093 | |
| 484 | | *,e | | NantKwest, Inc | | | 561 | |
| 482 | | * | | Natera, Inc | | | 6,729 | |
| 2,571 | | * | | Nektar Therapeutics | | | 84,509 | |
| 820 | | * | | NeoGenomics, Inc | | | 10,340 | |
| 297 | | *,e | | Neos Therapeutics, Inc | | | 490 | |
| 1,442 | | * | | Neurocrine Biosciences, Inc | | | 102,973 | |
| 298 | | * | | NewLink Genetics Corp | | | 453 | |
| 4,132 | | *,e | | Novavax, Inc | | | 7,603 | |
| 416 | | *,e | | Nymox Pharmaceutical Corp | | | 545 | |
| 362 | | * | | Ocular Therapeutix, Inc | | | 1,441 | |
| 107 | | *,e | | Odonate Therapeutics, Inc | | | 1,507 | |
| 652 | | *,e | | Omeros Corp | | | 7,263 | |
| 5,196 | | * | | Opko Health, Inc | | | 15,640 | |
| 258 | | *,e | | Optinose, Inc | | | 1,600 | |
| 1,615 | | *,e | | Organovo Holdings, Inc | | | 1,546 | |
| 1,907 | | * | | Ovid therapeutics, Inc | | | 4,615 | |
| 3,121 | | * | | Pacific Biosciences of California, Inc | | | 23,095 | |
| 609 | | * | | Pacira Pharmaceuticals, Inc | | | 26,199 | |
| 14,286 | | * | | Palatin Technologies, Inc | | | 10,120 | |
| 374 | | *,e | | Paratek Pharmaceuticals, Inc | | | 1,919 | |
| 2,346 | | * | | PDL BioPharma, Inc | | | 6,803 | |
| 1,920 | | | | PerkinElmer, Inc | | | 150,816 | |
| 2,143 | | | | Perrigo Co plc | | | 83,041 | |
| 2,778 | | * | | Pfenex, Inc | | | 8,862 | |
| 97,377 | | | | Pfizer, Inc | | | 4,250,506 | |
| 293 | | | | Phibro Animal Health Corp | | | 9,423 | |
| 529 | | * | | Pieris Pharmaceuticals, Inc | | | 1,407 | |
| 140 | | *,e | | PolarityTE, Inc | | | 1,889 | |
| 1,084 | | *,e | | Portola Pharmaceuticals, Inc | | | 21,160 | |
| 926 | | * | | PRA Health Sciences, Inc | | | 85,155 | |
| 817 | | * | | Prestige Brands Holdings, Inc | | | 25,229 | |
| 95 | | * | | Principia Biopharma, Inc | | | 2,602 | |
| 1,110 | | * | | Progenics Pharmaceuticals, Inc | | | 4,662 | |
| 5,051 | | *,e | | Proteostasis Therapeutics, Inc | | | 16,365 | |
| 594 | | * | | Prothena Corp plc | | | 6,118 | |
| 729 | | * | | PTC Therapeutics, Inc | | | 25,019 | |
| 453 | | * | | Puma Biotechnology, Inc | | | 9,219 | |
| 3,585 | | * | | QIAGEN NV | | | 123,503 | |
| 141 | | * | | Quanterix Corp | | | 2,582 | |
65
TIAA-CREF LIFE FUNDS -Stock Index Fund
| | | | | | | | |
SHARES | | | | COMPANY | | VALUE | |
| | | | | | | |
| 177 | | * | | Ra Pharmaceuticals, Inc | | $ | 3,221 | |
| 582 | | * | | Radius Health, Inc | | | 9,597 | |
| 350 | | * | | Reata Pharmaceuticals, Inc | | | 19,635 | |
| 183 | | * | | Recro Pharma, Inc | | | 1,299 | |
| 1,327 | | * | | Regeneron Pharmaceuticals, Inc | | | 495,635 | |
| 641 | | * | | REGENXBIO, Inc | | | 26,890 | |
| 526 | | * | | Repligen Corp | | | 27,741 | |
| 594 | | * | | Retrophin, Inc | | | 13,442 | |
| 352 | | * | | Revance Therapeutics, Inc | | | 7,086 | |
| 147 | | * | | Rhythm Pharmaceuticals, Inc | | | 3,951 | |
| 1,863 | | * | | Rigel Pharmaceuticals, Inc | | | 4,285 | |
| 337 | | *,e | | Rocket Pharmaceuticals, Inc | | | 4,994 | |
| 186 | | *,e | | Rubius Therapeutics, Inc | | | 2,991 | |
| 721 | | * | | Sage Therapeutics, Inc | | | 69,065 | |
| 1,935 | | * | | Sangamo Biosciences, Inc | | | 22,214 | |
| 1,127 | | * | | Sarepta Therapeutics, Inc | | | 122,990 | |
| 404 | | * | | Savara, Inc | | | 3,058 | |
| 43,683 | | | | Schering-Plough Corp | | | 3,337,818 | |
| 104 | | * | | Scholar Rock Holding Corp | | | 2,389 | |
| 1,816 | | * | | Seattle Genetics, Inc | | | 102,895 | |
| 190 | | *,e | | Selecta Biosciences, Inc | | | 505 | |
| 309 | | * | | Seres Therapeutics, Inc | | | 1,397 | |
| 243 | | * | | Sienna Biopharmaceuticals, Inc | | | 564 | |
| 842 | | *,e | | SIGA Technologies, Inc | | | 6,652 | |
| 146 | | *,e | | Solid Biosciences, Inc | | | 3,913 | |
| 5,304 | | *,e | | Sorrento Therapeutics, Inc | | | 12,730 | |
| 483 | | * | | Spark Therapeutics, Inc | | | 18,905 | |
| 1,594 | | * | | Spectrum Pharmaceuticals, Inc | | | 13,948 | |
| 232 | | * | | Spring Bank Pharmaceuticals, Inc | | | 2,410 | |
| 334 | | * | | Stemline Therapeutics, Inc | | | 3,173 | |
| 725 | | * | | Supernus Pharmaceuticals, Inc | | | 24,085 | |
| 152 | | * | | Syndax Pharmaceuticals, Inc | | | 676 | |
| 1,109 | | * | | Syneos Health, Inc | | | 43,639 | |
| 1,588 | | * | | Synlogic, Inc | | | 11,132 | |
| 204 | | * | | Syros Pharmaceuticals, Inc | | | 1,136 | |
| 416 | | *,e | | T2 Biosystems, Inc | | | 1,252 | |
| 648 | | *,e | | Teligent, Inc | | | 888 | |
| 887 | | *,e | | TESARO, Inc | | | 65,860 | |
| 573 | | * | | Tetraphase Pharmaceuticals, Inc | | | 647 | |
| 748 | | *,e | | TG Therapeutics, Inc | | | 3,067 | |
| 2,459 | | *,e | | TherapeuticsMD, Inc | | | 9,369 | |
| 661 | | *,e | | Theravance Biopharma, Inc | | | 16,915 | |
| 6,681 | | | | Thermo Fisher Scientific, Inc | | | 1,495,141 | |
| 133 | | * | | Tocagen, Inc | | | 1,092 | |
| 204 | | * | | Tricida, Inc | | | 4,810 | |
| 4,055 | | *,e | | Tyme Technologies, Inc | | | 14,963 | |
| 757 | | * | | Ultragenyx Pharmaceutical, Inc | | | 32,914 | |
| 696 | | * | | United Therapeutics Corp | | | 75,794 | |
| 415 | | *,e | | UNITY Biotechnology, Inc | | | 6,748 | |
| 677 | | * | | Vanda Pharmaceuticals, Inc | | | 17,690 | |
| 353 | | * | | Veracyte, Inc | | | 4,441 | |
| 850 | | *,e | | Verastem, Inc | | | 2,856 | |
| 597 | | * | | Vericel Corp | | | 10,388 | |
| 4,234 | | * | | Vertex Pharmaceuticals, Inc | | | 701,616 | |
| 1,907 | | *,e | | Viking Therapeutics, Inc | | | 14,589 | |
| 282 | | * | | Voyager Therapeutics, Inc | | | 2,651 | |
| 1,265 | | * | | Waters Corp | | | 238,642 | |
| 504 | | *,e | | WaVe Life Sciences Pte Ltd | | | 21,188 | |
| 743 | | * | | Xencor Inc | | | 26,867 | |
| 117 | | * | | Y-mAbs Therapeutics, Inc | | | 2,380 | |
| 1,723 | | * | | Zafgen, Inc | | | 8,529 | |
| 2,318 | | *,e | | ZIOPHARM Oncology, Inc | | | 4,335 | |
| 8,045 | | | | Zoetis, Inc | | | 688,169 | |
| 629 | | * | | Zogenix, Inc | | | 22,933 | |
| | | | | | | | |
| | | | TOTAL PHARMACEUTICALS, BIOTECHNOLOGY & LIFE SCIENCES | | | 36,052,622 | |
| | | | | | | | |
66
TIAA-CREF LIFE FUNDS -Stock Index Fund
| | | | | | | | |
SHARES | | | | COMPANY | | VALUE | |
| | | | | | | |
REAL ESTATE - 3.8% | | | | |
| 1,300 | | | | Acadia Realty Trust | | $ | 30,888 | |
| 632 | | | | Agree Realty Corp | | | 37,364 | |
| 1,021 | | | | Alexander & Baldwin, Inc | | | 18,766 | |
| 57 | | | | Alexander’s, Inc | | | 17,370 | |
| 1,739 | | | | Alexandria Real Estate Equities, Inc | | | 200,402 | |
| 196 | | *,e | | Altisource Portfolio Solutions S.A. | | | 4,408 | |
| 714 | | | | American Assets Trust, Inc | | | 28,681 | |
| 2,413 | | | | American Campus Communities, Inc | | | 99,874 | |
| 4,773 | | | | American Homes 4 Rent | | | 94,744 | |
| 7,305 | | | | American Tower Corp | | | 1,155,578 | |
| 1,336 | | | | Americold Realty Trust | | | 34,121 | |
| 2,440 | | | | Apartment Investment & Management Co (Class A) | | | 107,067 | |
| 4,063 | | | | Apple Hospitality REIT, Inc | | | 57,938 | |
| 694 | | | | Armada Hoffler Properties, Inc | | | 9,758 | |
| 1,645 | | | | Ashford Hospitality Trust, Inc | | | 6,580 | |
| 2,244 | | | | AvalonBay Communities, Inc | | | 390,568 | |
| 364 | | | | Bluerock Residential Growth REIT, Inc | | | 3,283 | |
| 2,579 | | | | Boston Properties, Inc | | | 290,266 | |
| 403 | | | | BraeMar Hotels & Resorts, Inc | | | 3,599 | |
| 2,649 | | | | Brandywine Realty Trust | | | 34,093 | |
| 4,778 | | | | Brixmor Property Group, Inc | | | 70,189 | |
| 2,570 | | | | Brookfield Property REIT, Inc | | | 41,377 | |
| 1,146 | | | | Brt Realty Trust | | | 13,110 | |
| 1,459 | | | | Camden Property Trust | | | 128,465 | |
| 1,679 | | | | CareTrust REIT, Inc | | | 30,994 | |
| 568 | | | | CatchMark Timber Trust Inc | | | 4,033 | |
| 2,955 | | | | CBL & Associates Properties, Inc | | | 5,674 | |
| 5,436 | | * | | CBRE Group, Inc | | | 217,657 | |
| 5,095 | | | | Cedar Realty Trust, Inc | | | 15,998 | |
| 572 | | | | Chatham Lodging Trust | | | 10,113 | |
| 909 | | | | Chesapeake Lodging Trust | | | 22,134 | |
| 471 | | | | City Office REIT, Inc | | | 4,828 | |
| 248 | | | | Clipper Realty, Inc | | | 3,241 | |
| 8,422 | | | | Colony Capital, Inc | | | 39,415 | |
| 1,903 | | | | Columbia Property Trust, Inc | | | 36,823 | |
| 199 | | | | Community Healthcare Trust, Inc | | | 5,737 | |
| 74 | | | | Consolidated-Tomoka Land Co | | | 3,885 | |
| 2,491 | | | | CoreCivic, Inc | | | 44,415 | |
| 185 | | | | CorEnergy Infrastructure Trust, Inc | | | 6,120 | |
| 675 | | | | CorePoint Lodging, Inc | | | 8,269 | |
| 582 | | | | Coresite Realty | | | 50,768 | |
| 1,557 | | | | Corporate Office Properties Trust | | | 32,744 | |
| 6,513 | | | | Cousins Properties, Inc | | | 51,453 | |
| 6,908 | | | | Crown Castle International Corp | | | 750,416 | |
| 3,228 | | | | CubeSmart | | | 92,611 | |
| 812 | | * | | Cushman & Wakefield plc | | | 11,750 | |
| 1,577 | | | | CyrusOne, Inc | | | 83,392 | |
| 3,453 | | | | DiamondRock Hospitality Co | | | 31,353 | |
| 3,311 | | | | Digital Realty Trust, Inc | | | 352,787 | |
| 2,632 | | | | Douglas Emmett, Inc | | | 89,830 | |
| 5,730 | | | | Duke Realty Corp | | | 148,407 | |
| 587 | | | | Easterly Government Properties, Inc | | | 9,204 | |
| 673 | | | | EastGroup Properties, Inc | | | 61,734 | |
| 2,070 | | | | Empire State Realty Trust, Inc | | | 29,456 | |
| 1,161 | | | | Entertainment Properties Trust | | | 74,339 | |
| 1,307 | | | | Equinix, Inc | | | 460,796 | |
| 2,199 | | | | Equity Commonwealth | | | 65,992 | |
| 1,525 | | | | Equity Lifestyle Properties, Inc | | | 148,123 | |
| 5,944 | | | | Equity Residential | | | 392,363 | |
| 621 | | | | Essential Properties Realty Trust, Inc | | | 8,595 | |
| 1,056 | | | | Essex Property Trust, Inc | | | 258,942 | |
| 2,082 | | | | Extra Space Storage, Inc | | | 188,379 | |
| 482 | | | | Farmland Partners, Inc | | | 2,188 | |
67
TIAA-CREF LIFE FUNDS -Stock Index Fund
| | | | | | | | |
SHARES | | | | COMPANY | | VALUE | |
| | | | | | | |
| 1,232 | | | | Federal Realty Investment Trust | | $ | 145,425 | |
| 2,259 | | | | First Industrial Realty Trust, Inc | | | 65,195 | |
| 240 | | * | | Forestar Group, Inc | | | 3,324 | |
| 1,235 | | | | Four Corners Property Trust, Inc | | | 32,357 | |
| 1,621 | | | | Franklin Street Properties Corp | | | 10,099 | |
| 2,400 | | | | Front Yard Residential Corp | | | 20,952 | |
| 102 | | * | | FRP Holdings, Inc | | | 4,693 | |
| 3,570 | | | | Gaming and Leisure Properties, Inc | | | 115,347 | |
| 2,553 | | | | Geo Group, Inc | | | 50,294 | |
| 763 | | | | Getty Realty Corp | | | 22,440 | |
| 475 | | | | Gladstone Commercial Corp | | | 8,512 | |
| 1,177 | | | | Gladstone Land Corp | | | 13,512 | |
| 1,861 | | | | Global Medical REIT, Inc | | | 16,544 | |
| 1,848 | | | | Global Net Lease, Inc | | | 32,562 | |
| 1,628 | | * | | Government Properties Income Trust | | | 11,184 | |
| 775 | | | | Hannon Armstrong Sustainable Infrastructure Capital, Inc | | | 14,764 | |
| 7,353 | | | | HCP, Inc | | | 205,369 | |
| 1,899 | | | | Healthcare Realty Trust, Inc | | | 54,008 | |
| 3,069 | | | | Healthcare Trust of America, Inc | | | 77,676 | |
| 697 | | | | Hersha Hospitality Trust | | | 12,225 | |
| 647 | | | | HFF, Inc (Class A) | | | 21,455 | |
| 1,796 | | | | Highwoods Properties, Inc | | | 69,487 | |
| 2,629 | | | | Hospitality Properties Trust | | | 62,781 | |
| 12,207 | | | | Host Marriott Corp | | | 203,491 | |
| 692 | | * | | Howard Hughes Corp | | | 67,553 | |
| 2,438 | | | | Hudson Pacific Properties | | | 70,848 | |
| 1,062 | | | | Independence Realty Trust, Inc | | | 9,749 | |
| 1,016 | | | | Industrial Logistics Properties Trust | | | 19,980 | |
| 107 | | | | Innovative Industrial Properties, Inc | | | 4,857 | |
| 192 | | | | Investors Real Estate Trust | | | 9,441 | |
| 4,609 | | | | Invitation Homes, Inc | | | 92,549 | |
| 4,508 | | | | Iron Mountain, Inc | | | 146,104 | |
| 1,070 | | | | iStar Financial, Inc | | | 9,812 | |
| 1,626 | | | | JBG SMITH Properties | | | 56,601 | |
| 145 | | | | Jernigan Capital, Inc | | | 2,874 | |
| 748 | | | | Jones Lang LaSalle, Inc | | | 94,697 | |
| 2,137 | | | | Kennedy-Wilson Holdings, Inc | | | 38,829 | |
| 1,527 | | | | Kilroy Realty Corp | | | 96,018 | |
| 6,452 | | | | Kimco Realty Corp | | | 94,522 | |
| 1,264 | | | | Kite Realty Group Trust | | | 17,810 | |
| 1,299 | | | | Lamar Advertising Co | | | 89,865 | |
| 3,541 | | | | Lexington Realty Trust | | | 29,072 | |
| 2,305 | | | | Liberty Property Trust | | | 96,533 | |
| 858 | | | | Life Storage, Inc | | | 79,785 | |
| 917 | | | | LTC Properties, Inc | | | 38,221 | |
| 2,145 | | | | Macerich Co | | | 92,836 | |
| 1,437 | | | | Mack-Cali Realty Corp | | | 28,151 | |
| 406 | | * | | Marcus & Millichap, Inc | | | 13,938 | |
| 169 | | * | | Maui Land & Pineapple Co, Inc | | | 1,677 | |
| 453 | | | | MedEquities Realty Trust, Inc | | | 3,099 | |
| 6,177 | | | | Medical Properties Trust, Inc | | | 99,326 | |
| 1,844 | | | | Mid-America Apartment Communities, Inc | | | 176,471 | |
| 2,033 | | | | Monmouth Real Estate Investment Corp (Class A) | | | 25,209 | |
| 700 | | | | National Health Investors, Inc | | | 52,878 | |
| 2,488 | | | | National Retail Properties, Inc | | | 120,693 | |
| 958 | | | | National Storage Affiliates Trust | | | 25,349 | |
| 1,266 | | | | New Senior Investment Group, Inc | | | 5,216 | |
| 2,344 | | | | Newmark Group, Inc | | | 18,799 | |
| 280 | | | | NexPoint Residential Trust, Inc | | | 9,814 | |
| 892 | | | | NorthStar Realty Europe Corp | | | 12,970 | |
| 3,138 | | | | Omega Healthcare Investors, Inc | | | 110,301 | |
| 251 | | | | One Liberty Properties, Inc | | | 6,079 | |
| 2,153 | | | | Outfront Media, Inc | | | 39,012 | |
| 3,099 | | | | Paramount Group, Inc | | | 38,923 | |
| 3,211 | | | | Park Hotels & Resorts, Inc | | | 83,422 | |
68
TIAA-CREF LIFE FUNDS -Stock Index Fund
| | | | | | | | |
SHARES | | | | COMPANY | | VALUE | |
| | | | | | | |
| 2,135 | | | | Pebblebrook Hotel Trust | | $ | 60,442 | |
| 1,134 | | | | Pennsylvania REIT | | | 6,736 | |
| 2,932 | | | | Physicians Realty Trust | | | 47,000 | |
| 2,219 | | | | Piedmont Office Realty Trust, Inc | | | 37,812 | |
| 1,007 | | | | Potlatch Corp | | | 31,862 | |
| 1,193 | | | | Preferred Apartment Communities, Inc | | | 16,774 | |
| 10,470 | | | | Prologis, Inc | | | 614,798 | |
| 358 | | | | PS Business Parks, Inc | | | 46,898 | |
| 2,506 | | | | Public Storage, Inc | | | 507,239 | |
| 754 | | | | QTS Realty Trust, Inc | | | 27,936 | |
| 2,010 | | | | Rayonier, Inc | | | 55,657 | |
| 349 | | | | Re/Max Holdings, Inc | | | 10,732 | |
| 2,208 | | | | Realogy Holdings Corp | | | 32,413 | |
| 4,790 | | | | Realty Income Corp | | | 301,962 | |
| 1,597 | | *,e | | Redfin Corp | | | 22,997 | |
| 2,549 | | | | Regency Centers Corp | | | 149,575 | |
| 1,675 | | | | Retail Opportunities Investment Corp | | | 26,599 | |
| 3,851 | | | | Retail Properties of America, Inc | | | 41,783 | |
| 258 | | * | | Retail Value, Inc | | | 6,602 | |
| 1,780 | | | | Rexford Industrial Realty, Inc | | | 52,457 | |
| 2,670 | | | | RLJ Lodging Trust | | | 43,788 | |
| 148 | | | | RMR Group, Inc | | | 7,856 | |
| 1,201 | | | | RPT Realty | | | 14,352 | |
| 778 | | | | Ryman Hospitality Properties | | | 51,885 | |
| 2,917 | | | | Sabra Healthcare REIT, Inc | | | 48,072 | |
| 172 | | | | Safety Income and Growth, Inc | | | 3,235 | |
| 445 | | | | Saul Centers, Inc | | | 21,013 | |
| 1,945 | | * | | SBA Communications Corp | | | 314,876 | |
| 1,303 | | | | Select Income REIT | | | 9,590 | |
| 3,633 | | | | Senior Housing Properties Trust | | | 42,579 | |
| 458 | | | | Seritage Growth Properties | | | 14,807 | |
| 5,135 | | | | Simon Property Group, Inc | | | 862,629 | |
| 2,580 | | | | SITE Centers Corp | | | 28,561 | |
| 1,436 | | | | SL Green Realty Corp | | | 113,559 | |
| 758 | | | | Spirit MTA REIT | | | 5,405 | |
| 1,516 | | | | Spirit Realty Capital, Inc | | | 53,439 | |
| 831 | | * | | St. Joe Co | | | 10,944 | |
| 1,899 | | | | STAG Industrial, Inc | | | 47,247 | |
| 4,344 | | | | Starwood Property Trust, Inc | | | 85,620 | |
| 3,219 | | | | STORE Capital Corp | | | 91,130 | |
| 93 | | * | | Stratus Properties, Inc | | | 2,230 | |
| 2,137 | | | | Summit Hotel Properties, Inc | | | 20,793 | |
| 1,360 | | | | Sun Communities, Inc | | | 138,326 | |
| 3,681 | | | | Sunstone Hotel Investors, Inc | | | 47,890 | |
| 1,459 | | | | Tanger Factory Outlet Centers, Inc | | | 29,501 | |
| 931 | | | | Taubman Centers, Inc | | | 42,351 | |
| 268 | | * | | Tejon Ranch Co | | | 4,443 | |
| 1,034 | | | | Terreno Realty Corp | | | 36,366 | |
| 721 | | | | Tier REIT, Inc | | | 14,874 | |
| 30 | | * | | Transcontinental Realty Investors, Inc | | | 850 | |
| 568 | | * | | Trinity Place Holdings, Inc | | | 2,465 | |
| 4,118 | | | | UDR, Inc | | | 163,155 | |
| 435 | | | | UMH Properties, Inc | | | 5,150 | |
| 3,290 | | | | Uniti Group, Inc | | | 51,225 | |
| 198 | | | | Universal Health Realty Income Trust | | | 12,151 | |
| 1,716 | | | | Urban Edge Properties | | | 28,520 | |
| 465 | | | | Urstadt Biddle Properties, Inc (Class A) | | | 8,937 | |
| 5,691 | | | | Ventas, Inc | | | 333,436 | |
| 15,295 | | | | VEREIT, Inc | | | 109,359 | |
| 6,596 | | | | VICI Properties, Inc | | | 123,873 | |
| 2,759 | | | | Vornado Realty Trust | | | 171,141 | |
| 3,960 | | | | Washington Prime Group, Inc | | | 19,246 | |
| 1,207 | | | | Washington REIT | | | 27,761 | |
| 1,872 | | | | Weingarten Realty Investors | | | 46,444 | |
| 5,986 | | | | Welltower, Inc | | | 415,488 | |
69
TIAA-CREF LIFE FUNDS -Stock Index Fund
| | | | | | | | |
SHARES | | | | COMPANY | | VALUE | |
| | | | | | | |
| 12,491 | | | | Weyerhaeuser Co | | $ | 273,053 | |
| 550 | | | | Whitestone REIT | | | 6,743 | |
| 2,666 | | | | WP Carey, Inc | | | 174,196 | |
| 1,682 | | | | Xenia Hotels & Resorts, Inc | | | 28,930 | |
| | | | | | | | |
| | | | TOTAL REAL ESTATE | | | 16,444,784 | |
| | | | | | | | |
| |
RETAILING - 5.8% | | | | |
| 426 | | * | | 1-800-FLOWERS.COM, Inc (Class A) | | | 5,210 | |
| 1,334 | | | | Aaron’s, Inc | | | 56,095 | |
| 1,074 | | | | Abercrombie & Fitch Co (Class A) | | | 21,534 | |
| 1,214 | | | | Advance Auto Parts, Inc | | | 191,156 | |
| 6,824 | | * | | Amazon.com, Inc | | | 10,249,443 | |
| 2,547 | | | | American Eagle Outfitters, Inc | | | 49,234 | |
| 122 | | * | | America’sCar-Mart, Inc | | | 8,839 | |
| 305 | | * | | Asbury Automotive Group, Inc | | | 20,331 | |
| 7,209 | | * | | Ascena Retail Group, Inc | | | 18,095 | |
| 908 | | * | | At Home Group, Inc | | | 16,943 | |
| 1,001 | | * | | Autonation, Inc | | | 35,736 | |
| 437 | | * | | AutoZone, Inc | | | 366,355 | |
| 603 | | * | | Barnes & Noble Education, Inc | | | 2,418 | |
| 965 | | | | Barnes & Noble, Inc | | | 6,842 | |
| 2,179 | | | | Bed Bath & Beyond, Inc | | | 24,666 | |
| 3,937 | | | | Best Buy Co, Inc | | | 208,504 | |
| 334 | | e | | Big 5 Sporting Goods Corp | | | 865 | |
| 744 | | | | Big Lots, Inc | | | 21,517 | |
| 1,288 | | * | | BJ’s Wholesale Club Holdings, Inc | | | 28,542 | |
| 791 | | * | | Booking Holdings, Inc | | | 1,362,434 | |
| 865 | | * | | Boot Barn Holdings, Inc | | | 14,731 | |
| 526 | | e | | Buckle, Inc | | | 10,173 | |
| 1,083 | | * | | Burlington Stores, Inc | | | 176,172 | |
| 639 | | | | Caleres, Inc | | | 17,783 | |
| 440 | | e | | Camping World Holdings, Inc | | | 5,047 | |
| 2,903 | | * | | CarMax, Inc | | | 182,105 | |
| 748 | | *,e | | Carvana Co | | | 24,467 | |
| 368 | | | | Cato Corp (Class A) | | | 5,251 | |
| 2,056 | | | | Chico’s FAS, Inc | | | 11,555 | |
| 288 | | | | Children’s Place Retail Stores, Inc | | | 25,946 | |
| 243 | | | | Citi Trends, Inc | | | 4,955 | |
| 291 | | * | | Conn’s, Inc | | | 5,488 | |
| 231 | | * | | Container Store Group, Inc | | | 1,102 | |
| 775 | | | | Core-Mark Holding Co, Inc | | | 18,019 | |
| 1,351 | | | | Dick’s Sporting Goods, Inc | | | 42,151 | |
| 236 | | e | | Dillard’s, Inc (Class A) | | | 14,233 | |
| 4,462 | | | | Dollar General Corp | | | 482,253 | |
| 3,955 | | * | | Dollar Tree, Inc | | | 357,216 | |
| 1,032 | | | | DSW, Inc (Class A) | | | 25,490 | |
| 144 | | *,e | | Duluth Holdings, Inc | | | 3,633 | |
| 15,702 | | * | | eBay, Inc | | | 440,755 | |
| 2,169 | | * | | Etsy, Inc | | | 103,179 | |
| 2,079 | | | | Expedia, Inc | | | 234,199 | |
| 1,208 | | * | | Express Parent LLC | | | 6,173 | |
| 969 | | * | | Five Below, Inc | | | 99,148 | |
| 1,023 | | * | | Floor & Decor Holdings, Inc | | | 26,496 | |
| 1,924 | | | | Foot Locker, Inc | | | 102,357 | |
| 185 | | * | | Funko, Inc | | | 2,433 | |
| 142 | | *,e | | Gaia, Inc | | | 1,471 | |
| 1,573 | | e | | GameStop Corp (Class A) | | | 19,851 | |
| 3,661 | | | | Gap, Inc | | | 94,307 | |
| 313 | | * | | Genesco, Inc | | | 13,866 | |
| 2,404 | | | | Genuine Parts Co | | | 230,832 | |
| 1,054 | | *,e | | GNC Holdings, Inc | | | 2,498 | |
| 324 | | | | Group 1 Automotive, Inc | | | 17,081 | |
| 7,081 | | * | | Groupon, Inc | | | 22,659 | |
| 1,482 | | * | | GrubHub, Inc | | | 113,832 | |
70
TIAA-CREF LIFE FUNDS -Stock Index Fund
| | | | | | | | |
SHARES | | | | COMPANY | | VALUE | |
| | | | | | | |
| 904 | | | | Guess?, Inc | | $ | 18,776 | |
| 286 | | | | Haverty Furniture Cos, Inc | | | 5,371 | |
| 323 | | * | | Hibbett Sports, Inc | | | 4,619 | |
| 19,244 | | | | Home Depot, Inc | | | 3,306,504 | |
| 619 | | * | | Hudson Ltd | | | 10,616 | |
| 1,819 | | * | | J. Jill, Inc | | | 9,695 | |
| 6,812 | | *,e | | JC Penney Co, Inc | | | 7,084 | |
| 247 | | * | | Kirkland’s, Inc | | | 2,354 | |
| 2,690 | | | | Kohl’s Corp | | | 178,455 | |
| 3,738 | | | | L Brands, Inc | | | 95,954 | |
| 221 | | * | | Lands’ End, Inc | | | 3,140 | |
| 198 | | * | | Leaf Group Ltd | | | 1,356 | |
| 837 | | * | | Liberty Expedia Holdings, Inc | | | 32,735 | |
| 325 | | * | | Liquidity Services, Inc | | | 2,005 | |
| 367 | | | | Lithia Motors, Inc (Class A) | | | 28,013 | |
| 5,184 | | * | | LKQ Corp | | | 123,016 | |
| 13,593 | | | | Lowe’s Companies, Inc | | | 1,255,450 | |
| 442 | | *,e | | Lumber Liquidators, Inc | | | 4,208 | |
| 4,990 | | | | Macy’s, Inc | | | 148,602 | |
| 389 | | * | | MarineMax, Inc | | | 7,123 | |
| 1,815 | | * | | Michaels Cos, Inc | | | 24,575 | |
| 452 | | | | Monro Muffler, Inc | | | 31,075 | |
| 539 | | * | | Murphy USA, Inc | | | 41,309 | |
| 956 | | * | | National Vision Holdings, Inc | | | 26,931 | |
| 1,826 | | | | Nordstrom, Inc | | | 85,110 | |
| 463 | | | | Nutri/System, Inc | | | 20,316 | |
| 7,986 | | | | Office Depot, Inc | | | 20,604 | |
| 750 | | * | | Ollie’s Bargain Outlet Holdings, Inc | | | 49,883 | |
| 1,309 | | * | | O’Reilly Automotive, Inc | | | 450,728 | |
| 263 | | *,e | | Overstock.com, Inc | | | 3,572 | |
| 419 | | * | | Party City Holdco, Inc | | | 4,182 | |
| 554 | | | | Penske Auto Group, Inc | | | 22,337 | |
| 306 | | e | | PetMed Express, Inc | | | 7,118 | |
| 716 | | | | Pool Corp | | | 106,433 | |
| 1,155 | | * | | Quotient Technology, Inc | | | 12,335 | |
| 7,241 | | * | | Qurate Retail Group, Inc QVC Group | | | 141,344 | |
| 699 | | * | | Rent-A-Center, Inc | | | 11,317 | |
| 337 | | * | | RH | | | 40,379 | |
| 6,053 | | | | Ross Stores, Inc | | | 503,610 | |
| 2,965 | | * | | RTW RetailWinds, Inc | | | 8,391 | |
| 2,233 | | * | | Sally Beauty Holdings, Inc | | | 38,073 | |
| 203 | | | | Shoe Carnival, Inc | | | 6,803 | |
| 526 | | * | | Shutterfly, Inc | | | 21,177 | |
| 309 | | | | Shutterstock, Inc | | | 11,127 | |
| 961 | | | | Signet Jewelers Ltd | | | 30,531 | |
| 660 | | * | | Sleep Number Corp | | | 20,942 | |
| 455 | | | | Sonic Automotive, Inc (Class A) | | | 6,261 | |
| 571 | | * | | Sportsman’s Warehouse Holdings, Inc | | | 2,501 | |
| 279 | | * | | Stamps.com, Inc | | | 43,424 | |
| 856 | | | | Tailored Brands, Inc | | | 11,676 | |
| 8,934 | | | | Target Corp | | | 590,448 | |
| 2,104 | | | | Tiffany & Co | | | 169,393 | |
| 528 | | | | Tile Shop Holdings, Inc | | | 2,893 | |
| 297 | | | | Tilly’s, Inc | | | 3,225 | |
| 20,819 | | | | TJX Companies, Inc | | | 931,442 | |
| 1,996 | | | | Tractor Supply Co | | | 166,546 | |
| 929 | | * | | Ulta Beauty, Inc | | | 227,456 | |
| 1,237 | | * | | Urban Outfitters, Inc | | | 41,068 | |
| 908 | | * | | Wayfair, Inc | | | 81,793 | |
| 99 | | | | Weyco Group, Inc | | | 2,888 | |
| 1,350 | | | | Williams-Sonoma, Inc | | | 68,108 | |
| 37 | | | | Winmark Corp | | | 5,883 | |
| 314 | | * | | Zumiez, Inc | | | 6,019 | |
| | | | | | | | |
| | | | TOTAL RETAILING | | | 24,999,968 | |
| | | | | | | | |
71
TIAA-CREF LIFE FUNDS -Stock Index Fund
| | | | | | | | |
SHARES | | | | COMPANY | | VALUE | |
| | | | | | | |
SEMICONDUCTORS & SEMICONDUCTOR EQUIPMENT - 3.5% | | | | |
| 728 | | * | | Acacia Communications, Inc | | $ | 27,664 | |
| 617 | | * | | Advanced Energy Industries, Inc | | | 26,488 | |
| 15,372 | | * | | Advanced Micro Devices, Inc | | | 283,767 | |
| 302 | | * | | Alpha & Omega Semiconductor Ltd | | | 3,077 | |
| 507 | | *,e | | Ambarella, Inc | | | 17,735 | |
| 1,455 | | * | | Amkor Technology, Inc | | | 9,545 | |
| 6,222 | | | | Analog Devices, Inc | | | 534,034 | |
| 16,617 | | | | Applied Materials, Inc | | | 544,041 | |
| 341 | | * | | Aquantia Corp | | | 2,991 | |
| 510 | | * | | Axcelis Technologies, Inc | | | 9,078 | |
| 582 | | * | | AXT, Inc | | | 2,532 | |
| 6,912 | | | | Broadcom, Inc | | | 1,757,583 | |
| 1,076 | | | | Brooks Automation, Inc | | | 28,170 | |
| 469 | | | | Cabot Microelectronics Corp | | | 44,719 | |
| 333 | | * | | Ceva, Inc | | | 7,356 | |
| 1,003 | | * | | Cirrus Logic, Inc | | | 33,279 | |
| 598 | | | | Cohu, Inc | | | 9,610 | |
| 1,538 | | * | | Cree, Inc | | | 65,788 | |
| 5,761 | | | | Cypress Semiconductor Corp | | | 73,280 | |
| 584 | | * | | Diodes, Inc | | | 18,840 | |
| 2,131 | | | | Entegris, Inc | | | 59,444 | |
| 1,340 | | * | | First Solar, Inc | | | 56,890 | |
| 1,075 | | * | | Formfactor, Inc | | | 15,147 | |
| 434 | | *,e | | Ichor Holdings Ltd | | | 7,074 | |
| 285 | | * | | Impinj, Inc | | | 4,147 | |
| 657 | | *,e | | Inphi Corp | | | 21,122 | |
| 2,526 | | * | | Integrated Device Technology, Inc | | | 122,334 | |
| 77,009 | | | | Intel Corp | | | 3,614,032 | |
| 2,671 | | | | Kla-Tencor Corp | | | 239,028 | |
| 981 | | * | | Kopin Corp | | | 980 | |
| 2,721 | | | | Lam Research Corp | | | 370,519 | |
| 1,895 | | * | | Lattice Semiconductor Corp | | | 13,113 | |
| 627 | | * | | MA-COM Technology Solutions | | | 9,098 | |
| 9,503 | | | | Marvell Technology Group Ltd | | | 153,854 | |
| 4,597 | | | | Maxim Integrated Products, Inc | | | 233,757 | |
| 927 | | * | | MaxLinear, Inc | | | 16,315 | |
| 3,871 | | | | Microchip Technology, Inc | | | 278,402 | |
| 19,418 | | * | | Micron Technology, Inc | | | 616,133 | |
| 1,013 | | | | MKS Instruments, Inc | | | 65,450 | |
| 730 | | | | Monolithic Power Systems, Inc | | | 84,862 | |
| 364 | | * | | Nanometrics, Inc | | | 9,948 | |
| 478 | | *,e | | NeoPhotonics Corp Ltd | | | 3,097 | |
| 77 | | | | NVE Corp | | | 6,741 | |
| 9,697 | | | | NVIDIA Corp | | | 1,294,549 | |
| 5,663 | | | | NXP Semiconductors NV | | | 414,985 | |
| 7,472 | | * | | ON Semiconductor Corp | | | 123,363 | |
| 409 | | * | | PDF Solutions, Inc | | | 3,448 | |
| 1,020 | | * | | Photronics, Inc | | | 9,874 | |
| 446 | | | | Power Integrations, Inc | | | 27,197 | |
| 2,063 | | * | | Qorvo, Inc | | | 125,286 | |
| 20,344 | | | | QUALCOMM, Inc | | | 1,157,777 | |
| 1,707 | | * | | Rambus, Inc | | | 13,093 | |
| 488 | | * | | Rudolph Technologies, Inc | | | 9,989 | |
| 1,008 | | * | | Semtech Corp | | | 46,237 | |
| 654 | | * | | Silicon Laboratories, Inc | | | 51,542 | |
| 2,993 | | | | Skyworks Solutions, Inc | | | 200,591 | |
| 170 | | *,e | | SMART Global Holdings, Inc | | | 5,049 | |
| 886 | | *,e | | SunPower Corp | | | 4,403 | |
| 3,141 | | | | Teradyne, Inc | | | 98,565 | |
| 16,319 | | | | Texas Instruments, Inc | | | 1,542,145 | |
| 789 | | * | | Ultra Clean Holdings | | | 6,683 | |
| 833 | | e | | Universal Display Corp | | | 77,944 | |
| 729 | | * | | Veeco Instruments, Inc | | | 5,402 | |
72
TIAA-CREF LIFE FUNDS -Stock Index Fund
| | | | | | | | |
SHARES | | | | COMPANY | | VALUE | |
| | | | | | | |
| 1,813 | | | | Versum Materials, Inc | | $ | 50,256 | |
| 4,300 | | | | Xilinx, Inc | | | 366,231 | |
| 754 | | | | Xperi Corp | | | 13,866 | |
| | | | | | | | |
| | | | TOTAL SEMICONDUCTORS & SEMICONDUCTOR EQUIPMENT | | | 15,149,539 | |
| | | | | | | | |
| |
SOFTWARE & SERVICES - 10.8% | | | | |
| 874 | | * | | 2U, Inc | | | 43,455 | |
| 1,358 | | * | | 8x8, Inc | | | 24,498 | |
| 754 | | * | | A10 Networks, Inc | | | 4,705 | |
| 10,759 | | | | Accenture plc | | | 1,517,127 | |
| 1,810 | | * | | ACI Worldwide, Inc | | | 50,083 | |
| 8,198 | | * | | Adobe, Inc | | | 1,854,716 | |
| 2,865 | | * | | Akamai Technologies, Inc | | | 174,994 | |
| 492 | | * | | Alarm.com Holdings, Inc | | | 25,520 | |
| 829 | | | | Alliance Data Systems Corp | | | 124,416 | |
| 399 | | * | | Altair Engineering, Inc | | | 11,004 | |
| 470 | | *,e | | Alteryx, Inc | | | 27,951 | |
| 273 | | * | | Amber Road, Inc | | | 2,247 | |
| 2,546 | | | | Amdocs Ltd | | | 149,145 | |
| 370 | | | | American Software, Inc (Class A) | | | 3,866 | |
| 300 | | * | | Anaplan, Inc | | | 7,962 | |
| 1,376 | | * | | Ansys, Inc | | | 196,685 | |
| 237 | | * | | Appfolio, Inc | | | 14,035 | |
| 543 | | * | | Apptio, Inc | | | 20,612 | |
| 1,169 | | * | | Aspen Technology, Inc | | | 96,068 | |
| 1,474 | | * | | Atlassian Corp plc | | | 131,157 | |
| 3,666 | | * | | Autodesk, Inc | | | 471,484 | |
| 7,353 | | | | Automatic Data Processing, Inc | | | 964,125 | |
| 162 | | * | | Avalara, Inc | | | 5,046 | |
| 1,669 | | * | | Avaya Holdings Corp | | | 24,301 | |
| 527 | | * | | Benefitfocus, Inc | | | 24,094 | |
| 2,278 | | * | | Black Knight, Inc | | | 102,647 | |
| 741 | | | | Blackbaud, Inc | | | 46,609 | |
| 535 | | * | | Blackline, Inc | | | 21,908 | |
| 2,283 | | | | Booz Allen Hamilton Holding Co | | | 102,895 | |
| 626 | | * | | Bottomline Technologies, Inc | | | 30,048 | |
| 2,047 | | * | | Box, Inc | | | 34,553 | |
| 460 | | * | | Brightcove, Inc | | | 3,238 | |
| 1,930 | | | | Broadridge Financial Solutions, Inc | | | 185,763 | |
| 379 | | * | | CACI International, Inc (Class A) | | | 54,587 | |
| 4,753 | | * | | Cadence Design Systems, Inc | | | 206,660 | |
| 126 | | * | | Carbon Black, Inc | | | 1,691 | |
| 391 | | * | | Carbonite, Inc | | | 9,877 | |
| 708 | | * | | Cardtronics plc | | | 18,408 | |
| 222 | | | | Cass Information Systems, Inc | | | 11,748 | |
| 2,269 | | | | CDK Global, Inc | | | 108,640 | |
| 712 | | * | | Ceridian HCM Holding, Inc | | | 24,557 | |
| 378 | | * | | ChannelAdvisor Corp | | | 4,290 | |
| 620 | | * | | Cision Ltd | | | 7,254 | |
| 2,356 | | | | Citrix Systems, Inc | | | 241,396 | |
| 1,550 | | * | | Cloudera, Inc | | | 17,143 | |
| 9,739 | | | | Cognizant Technology Solutions Corp (Class A) | | | 618,232 | |
| 606 | | * | | Commvault Systems, Inc | | | 35,809 | |
| 3,045 | | * | | Conduent, Inc | | | 32,368 | |
| 399 | | | | ConvergeOne Holdings, Inc | | | 4,940 | |
| 807 | | * | | Cornerstone OnDemand, Inc | | | 40,697 | |
| 857 | | * | | Coupa Software, Inc | | | 53,871 | |
| 520 | | | | CSG Systems International, Inc | | | 16,520 | |
| 157 | | * | | Digimarc Corp | | | 2,277 | |
| 1,232 | | * | | DocuSign, Inc | | | 49,379 | |
| 152 | | * | | Domo, Inc | | | 2,984 | |
| 4,799 | | | | DXC Technology Co | | | 255,163 | |
| 387 | | e | | Ebix, Inc | | | 16,471 | |
| 291 | | * | | eGain Corp | | | 1,912 | |
73
TIAA-CREF LIFE FUNDS -Stock Index Fund
| | | | | | | | |
SHARES | | | | COMPANY | | VALUE | |
| | | | | | | |
| 135 | | * | | Elastic NV | | $ | 9,650 | |
| 527 | | * | | Ellie Mae, Inc | | | 33,111 | |
| 895 | | * | | Endurance International Group Holdings, Inc | | | 5,952 | |
| 665 | | * | | Envestnet, Inc | | | 32,711 | |
| 818 | | * | | EPAM Systems, Inc | | | 94,896 | |
| 898 | | * | | Euronet Worldwide, Inc | | | 91,937 | |
| 422 | | * | | Everbridge, Inc | | | 23,953 | |
| 989 | | * | | Everi Holdings, Inc | | | 5,093 | |
| 941 | | | | EVERTEC, Inc | | | 27,007 | |
| 266 | | * | | Evo Payments, Inc | | | 6,562 | |
| 795 | | * | | Exela Technologies, Inc | | | 3,093 | |
| 511 | | * | | ExlService Holdings, Inc | | | 26,889 | |
| 486 | | * | | Fair Isaac Corp | | | 90,882 | |
| 5,515 | | | | Fidelity National Information Services, Inc | | | 565,563 | |
| 3,709 | | * | | FireEye, Inc | | | 60,123 | |
| 1,318 | | * | | First American Corp | | | 44,048 | |
| 8,946 | | * | | First Data Corp | | | 151,277 | |
| 6,756 | | * | | Fiserv, Inc | | | 496,498 | |
| 812 | | * | | Five9, Inc | | | 35,501 | |
| 1,454 | | * | | FleetCor Technologies, Inc | | | 270,037 | |
| 464 | | * | | ForeScout Technologies, Inc | | | 12,059 | |
| 2,302 | | * | | Fortinet, Inc | | | 162,130 | |
| 1,455 | | * | | Gartner, Inc | | | 186,007 | |
| 2,688 | | | | Genpact Ltd | | | 72,549 | |
| 2,692 | | | | Global Payments, Inc | | | 277,626 | |
| 2,667 | | * | | GoDaddy, Inc | | | 175,009 | |
| 477 | | *,e | | GTT Communications, Inc | | | 11,286 | |
| 1,282 | | * | | Guidewire Software, Inc | | | 102,855 | |
| 450 | | | | Hackett Group, Inc | | | 7,205 | |
| 1,110 | | * | | Hortonworks, Inc | | | 16,006 | |
| 632 | | * | | HubSpot, Inc | | | 79,461 | |
| 139 | | * | | I3 Verticals, Inc | | | 3,350 | |
| 524 | | * | | Imperva, Inc | | | 29,182 | |
| 513 | | * | | Information Services Group, Inc | | | 2,175 | |
| 506 | | * | | Instructure, Inc | | | 18,980 | |
| 319 | | *,e | | Internap Corp | | | 1,324 | |
| 15,344 | | | | International Business Machines Corp | | | 1,744,152 | |
| 4,070 | | | | Intuit, Inc | | | 801,180 | |
| 736 | | | | j2 Global, Inc | | | 51,064 | |
| 1,367 | | | | Jack Henry & Associates, Inc | | | 172,953 | |
| 2,386 | | | | Leidos Holdings, Inc | | | 125,790 | |
| 1,126 | | * | | Limelight Networks, Inc | | | 2,635 | |
| 827 | | * | | Liveperson, Inc | | | 15,597 | |
| 1,208 | | * | | LiveRamp Holdings, Inc | | | 46,665 | |
| 811 | | | | LogMeIn, Inc | | | 66,153 | |
| 1,102 | | * | | Manhattan Associates, Inc | | | 46,692 | |
| 349 | | | | Mantech International Corp (Class A) | | | 18,251 | |
| 15,329 | | | | MasterCard, Inc (Class A) | | | 2,891,816 | |
| 1,014 | | | | MAXIMUS, Inc | | | 66,001 | |
| 127,214 | | | | Microsoft Corp | | | 12,921,126 | |
| 147 | | * | | MicroStrategy, Inc (Class A) | | | 18,779 | |
| 573 | | * | | MINDBODY, Inc | | | 20,857 | |
| 467 | | * | | Mitek Systems, Inc | | | 5,048 | |
| 872 | | * | | MobileIron, Inc | | | 4,002 | |
| 351 | | * | | Model N, Inc | | | 4,644 | |
| 445 | | * | | MoneyGram International, Inc | | | 890 | |
| 644 | | | | Monotype Imaging Holdings, Inc | | | 9,995 | |
| 713 | | * | | New Relic, Inc | | | 57,732 | |
| 1,004 | | | | NIC, Inc | | | 12,530 | |
| 5,319 | | * | | Nuance Communications, Inc | | | 70,370 | |
| 2,346 | | * | | Nutanix, Inc | | | 97,570 | |
| 1,388 | | * | | Okta, Inc | | | 88,554 | |
| 469 | | * | | OneSpan, Inc | | | 6,074 | |
| 42,755 | | | | Oracle Corp | | | 1,930,388 | |
| 202 | | * | | Park City Group, Inc | | | 1,206 | |
74
TIAA-CREF LIFE FUNDS -Stock Index Fund
| | | | | | | | |
SHARES | | | | COMPANY | | VALUE | |
| | | | | | | |
| 5,370 | | | | Paychex, Inc | | $ | 349,856 | |
| 870 | | * | | Paycom Software, Inc | | | 106,532 | |
| 401 | | * | | Paylocity Holding Corp | | | 24,144 | |
| 19,811 | | * | | PayPal Holdings, Inc | | | 1,665,907 | |
| 570 | | | | Pegasystems, Inc | | | 27,263 | |
| 509 | | * | | Perficient, Inc | | | 11,330 | |
| 2,303 | | | | Perspecta, Inc | | | 39,658 | |
| 401 | | * | | Pluralsight, Inc | | | 9,444 | |
| 307 | | | | Presidio, Inc | | | 4,006 | |
| 449 | | * | | PRGX Global, Inc | | | 4,252 | |
| 766 | | | | Progress Software Corp | | | 27,185 | |
| 810 | | * | | Proofpoint, Inc | | | 67,886 | |
| 410 | | * | | PROS Holdings, Inc | | | 12,874 | |
| 1,957 | | * | | PTC, Inc | | | 162,235 | |
| 587 | | * | | Q2 Holdings, Inc | | | 29,086 | |
| 144 | | | | QAD, Inc (Class A) | | | 5,664 | |
| 485 | | * | | Qualys, Inc | | | 36,249 | |
| 578 | | * | | Rapid7, Inc | | | 18,010 | |
| 1,124 | | * | | RealPage, Inc | | | 54,166 | |
| 2,975 | | * | | Red Hat, Inc | | | 522,529 | |
| 1,074 | | * | | RingCentral, Inc | | | 88,541 | |
| 4,526 | | | | Sabre Corp | | | 97,943 | |
| 1,162 | | * | | SailPoint Technologies Holding, Inc | | | 27,295 | |
| 12,068 | | * | | salesforce.com, Inc | | | 1,652,954 | |
| 682 | | | | Science Applications International Corp | | | 43,443 | |
| 96 | | *,e | | SecureWorks Corp | | | 1,621 | |
| 457 | | * | | SendGrid, Inc | | | 19,729 | |
| 2,923 | | * | | ServiceNow, Inc | | | 520,440 | |
| 1,229 | | * | | ServiceSource International LLC | | | 1,327 | |
| 118 | | *,e | | ShotSpotter, Inc | | | 3,679 | |
| 420 | | * | | SolarWinds Corp | | | 5,809 | |
| 2,335 | | * | | Splunk, Inc | | | 244,825 | |
| 256 | | * | | SPS Commerce, Inc | | | 21,089 | |
| 4,836 | | * | | Square, Inc | | | 271,251 | |
| 3,601 | | | | SS&C Technologies Holdings, Inc | | | 162,441 | |
| 301 | | *,e | | SVMK, Inc | | | 3,693 | |
| 580 | | e | | Switch, Inc | | | 4,060 | |
| 605 | | * | | Sykes Enterprises, Inc | | | 14,962 | |
| 10,223 | | | | Symantec Corp | | | 193,164 | |
| 2,573 | | * | | Synopsys, Inc | | | 216,750 | |
| 1,150 | | * | | Tableau Software, Inc | | | 138,000 | |
| 737 | | * | | Telaria, Inc | | | 2,012 | |
| 485 | | * | | TeleNav, Inc | | | 1,969 | |
| 218 | | * | | Tenable Holdings, Inc | | | 4,837 | |
| 2,058 | | * | | Teradata Corp | | | 78,945 | |
| 1,831 | | | | TiVo Corp | | | 17,230 | |
| 3,016 | | | | Total System Services, Inc | | | 245,171 | |
| 508 | | * | | Trade Desk, Inc | | | 58,958 | |
| 1,927 | | | | Travelport Worldwide Ltd | | | 30,100 | |
| 235 | | | | TTEC Holdings, Inc | | | 6,714 | |
| 143 | | *,e | | Tucows, Inc | | | 8,589 | |
| 1,161 | | * | | Twilio, Inc | | | 103,677 | |
| 664 | | * | | Tyler Technologies, Inc | | | 123,384 | |
| 533 | | * | | Ultimate Software Group, Inc | | | 130,516 | |
| 769 | | *,e | | Unisys Corp | | | 8,943 | |
| 106 | | * | | Upland Software, Inc | | | 2,881 | |
| 446 | | * | | Varonis Systems, Inc | | | 23,593 | |
| 1,007 | | * | | Verint Systems, Inc | | | 42,606 | |
| 1,801 | | * | | VeriSign, Inc | | | 267,070 | |
| 766 | | *,e | | VirnetX Holding Corp | | | 1,838 | |
| 427 | | * | | Virtusa Corp | | | 18,186 | |
| 29,564 | | | | Visa, Inc (Class A) | | | 3,900,674 | |
| 1,222 | | | | VMware, Inc (Class A) | | | 167,573 | |
| 7,633 | | | | Western Union Co | | | 130,219 | |
| 664 | | * | | WEX, Inc | | | 93,000 | |
75
TIAA-CREF LIFE FUNDS -Stock Index Fund
| | | | | | | | |
SHARES | | | | COMPANY | | VALUE | |
| | | | | | | |
| 2,470 | | * | | Workday, Inc | | $ | 394,410 | |
| 379 | | * | | Workiva, Inc | | | 13,602 | |
| 4,995 | | * | | Worldpay, Inc | | | 381,768 | |
| 1,309 | | * | | Yext, Inc | | | 19,439 | |
| 1,663 | | * | | Zendesk, Inc | | | 97,069 | |
| 803 | | * | | Zix Corp | | | 4,601 | |
| 1,013 | | * | | Zscaler, Inc | | | 39,720 | |
| | | | | | | | |
| | | | TOTAL SOFTWARE & SERVICES | | | 46,195,118 | |
| | | | | | | | |
| |
TECHNOLOGY HARDWARE & EQUIPMENT - 5.3% | | | | |
| 1,699 | | * | | 3D Systems Corp | | | 17,279 | |
| 806 | | | | Adtran, Inc | | | 8,656 | |
| 513 | | * | | Aerohive Networks, Inc | | | 1,672 | |
| 400 | | * | | Agilysys, Inc | | | 5,736 | |
| 5,036 | | | | Amphenol Corp (Class A) | | | 408,017 | |
| 430 | | * | | Anixter International, Inc | | | 23,353 | |
| 79,717 | | | | Apple, Inc | | | 12,574,560 | |
| 285 | | *,e | | Applied Optoelectronics, Inc | | | 4,398 | |
| 978 | | * | | Arista Networks, Inc | | | 206,065 | |
| 226 | | *,e | | Arlo Technologies, Inc | | | 2,255 | |
| 2,818 | | * | | ARRIS International plc | | | 86,146 | |
| 1,464 | | * | | Arrow Electronics, Inc | | | 100,943 | |
| 470 | | * | | Avid Technology, Inc | | | 2,232 | |
| 1,997 | | | | Avnet, Inc | | | 72,092 | |
| 720 | | | | AVX Corp | | | 10,980 | |
| 438 | | | | Badger Meter, Inc | | | 21,554 | |
| 144 | | | | Bel Fuse, Inc (Class B) | | | 2,652 | |
| 636 | | | | Belden CDT, Inc | | | 26,566 | |
| 773 | | | | Benchmark Electronics, Inc | | | 16,372 | |
| 528 | | * | | CalAmp Corp | | | 6,869 | |
| 643 | | * | | Calix, Inc | | | 6,269 | |
| 1,029 | | * | | Casa Systems, Inc | | | 13,511 | |
| 2,397 | | | | CDW Corp | | | 194,277 | |
| 2,191 | | * | | Ciena Corp | | | 74,297 | |
| 76,114 | | | | Cisco Systems, Inc | | | 3,298,020 | |
| 153 | | * | | Clearfield, Inc | | | 1,518 | |
| 2,598 | | | | Cognex Corp | | | 100,465 | |
| 382 | | * | | Coherent, Inc | | | 40,381 | |
| 3,172 | | * | | CommScope Holding Co, Inc | | | 51,989 | |
| 356 | | | | Comtech Telecommunications Corp | | | 8,665 | |
| 375 | | * | | Control4 Corp | | | 6,600 | |
| 13,392 | | | | Corning, Inc | | | 404,572 | |
| 622 | | * | | Cray, Inc | | | 13,429 | |
| 485 | | | | CTS Corp | | | 12,557 | |
| 548 | | | | Daktronics, Inc | | | 4,055 | |
| 2,192 | | * | | Dell Technologies, Inc | | | 107,142 | |
| 1,043 | | e | | Diebold, Inc | | | 2,597 | |
| 400 | | * | | Digi International, Inc | | | 4,036 | |
| 1,151 | | | | Dolby Laboratories, Inc (Class A) | | | 71,178 | |
| 250 | | *,e | | Eastman Kodak Co | | | 637 | |
| 740 | | * | | EchoStar Corp (Class A) | | | 27,173 | |
| 447 | | * | | Electro Scientific Industries, Inc | | | 13,392 | |
| 717 | | * | | Electronics for Imaging, Inc | | | 17,782 | |
| 202 | | * | | ePlus, Inc | | | 14,376 | |
| 1,698 | | * | | Extreme Networks, Inc | | | 10,358 | |
| 1,006 | | * | | F5 Networks, Inc | | | 163,002 | |
| 561 | | * | | Fabrinet | | | 28,785 | |
| 256 | | * | | FARO Technologies, Inc | | | 10,404 | |
| 2,329 | | * | | Finisar Corp | | | 50,306 | |
| 2,680 | | * | | Fitbit, Inc | | | 13,320 | |
| 2,414 | | | | Flir Systems, Inc | | | 105,106 | |
| 1,256 | | * | | Harmonic, Inc | | | 5,928 | |
| 25,322 | | | | Hewlett Packard Enterprise Co | | | 334,504 | |
| 26,771 | | | | HP, Inc | | | 547,735 | |
76
TIAA-CREF LIFE FUNDS -Stock Index Fund
| | | | | | | | |
SHARES | | | | COMPANY | | VALUE | |
| | | | | | | |
| 909 | | * | | II-VI, Inc | | $ | 29,506 | |
| 400 | | * | | Immersion Corp | | | 3,584 | |
| 2,249 | | * | | Infinera Corp | | | 8,973 | |
| 554 | | * | | Insight Enterprises, Inc | | | 22,575 | |
| 539 | | | | InterDigital, Inc | | | 35,806 | |
| 631 | | * | | IPG Photonics Corp | | | 71,486 | |
| 397 | | * | | Iteris, Inc | | | 1,481 | |
| 536 | | * | | Itron, Inc | | | 25,347 | |
| 2,790 | | | | Jabil Circuit, Inc | | | 69,164 | |
| 5,692 | | | | Juniper Networks, Inc | | | 153,172 | |
| 1,292 | | | | Kemet Corp | | | 22,662 | |
| 3,258 | | * | | Keysight Technologies, Inc | | | 202,257 | |
| 411 | | * | | Kimball Electronics, Inc | | | 6,366 | |
| 1,352 | | * | | Knowles Corp | | | 17,995 | |
| 254 | | * | | KVH Industries, Inc | | | 2,614 | |
| 375 | | | | Littelfuse, Inc | | | 64,305 | |
| 1,378 | | * | | Lumentum Holdings, Inc | | | 57,890 | |
| 509 | | *,e | | Maxwell Technologies, Inc | | | 1,054 | |
| 49 | | | | Mesa Laboratories, Inc | | | 10,211 | |
| 569 | | | | Methode Electronics, Inc | | | 13,252 | |
| 2,764 | | | | Motorola, Inc | | | 317,971 | |
| 261 | | | | MTS Systems Corp | | | 10,474 | |
| 171 | | * | | Napco Security Technologies, Inc | | | 2,693 | |
| 1,665 | | | | National Instruments Corp | | | 75,558 | |
| 1,908 | | * | | NCR Corp | | | 44,037 | |
| 4,378 | | | | NetApp, Inc | | | 261,235 | |
| 505 | | * | | Netgear, Inc | | | 26,275 | |
| 1,389 | | * | | Netscout Systems, Inc | | | 32,822 | |
| 105 | | *,e | | nLight, Inc | | | 1,867 | |
| 497 | | * | | Novanta, Inc | | | 31,311 | |
| 280 | | * | | OSI Systems, Inc | | | 20,524 | |
| 1,446 | | * | | Palo Alto Networks, Inc | | | 272,354 | |
| 182 | | * | | PAR Technology Corp | | | 3,958 | |
| 291 | | | | Park Electrochemical Corp | | | 5,258 | |
| 196 | | | | PC Connection, Inc | | | 5,827 | |
| 526 | | | | Plantronics, Inc | | | 17,411 | |
| 521 | | * | | Plexus Corp | | | 26,613 | |
| 2,657 | | * | | Pure Storage, Inc | | | 42,725 | |
| 326 | | * | | Quantenna Communications, Inc | | | 4,678 | |
| 704 | | * | | Ribbon Communications, Inc | | | 3,393 | |
| 281 | | * | | Rogers Corp | | | 27,836 | |
| 1,157 | | * | | Sanmina Corp | | | 27,837 | |
| 381 | | * | | Scansource, Inc | | | 13,099 | |
| 776 | | * | | Stratasys Ltd | | | 13,976 | |
| 548 | | * | | Synaptics, Inc | | | 20,391 | |
| 645 | | | | SYNNEX Corp | | | 52,142 | |
| 545 | | * | | Tech Data Corp | | | 44,586 | |
| 3,952 | | * | | Trimble Navigation Ltd | | | 130,060 | |
| 1,439 | | * | | TTM Technologies, Inc | | | 14,001 | |
| 362 | | e | | Ubiquiti Networks, Inc | | | 35,986 | |
| 591 | | * | | USA Technologies, Inc | | | 2,299 | |
| 830 | | *,e | | Viasat, Inc | | | 48,928 | |
| 3,584 | | * | | Viavi Solutions, Inc | | | 36,019 | |
| 2,099 | | | | Vishay Intertechnology, Inc | | | 37,803 | |
| 161 | | * | | Vishay Precision Group, Inc | | | 4,867 | |
| 5,010 | | | | Western Digital Corp | | | 185,220 | |
| 3,647 | | | | Xerox Corp | | | 72,065 | |
| 924 | | * | | Zebra Technologies Corp (Class A) | | | 147,129 | |
| | | | | | | | |
| | | | TOTAL TECHNOLOGY HARDWARE & EQUIPMENT | | | 22,297,691 | |
| | | | | | | | |
| |
TELECOMMUNICATION SERVICES - 1.9% | | | | |
| 121,390 | | | | AT&T, Inc | | | 3,464,471 | |
| 110 | | | | ATN International, Inc | | | 7,868 | |
| 1,215 | | * | | Boingo Wireless, Inc | | | 24,993 | |
77
TIAA-CREF LIFE FUNDS -Stock Index Fund
| | | | | | | | |
SHARES | | | | COMPANY | | VALUE | |
| | | | | | | |
| 16,015 | | | | CenturyLink, Inc | | $ | 242,627 | |
| 727 | | * | | Cincinnati Bell, Inc | | | 5,656 | |
| 635 | | | | Cogent Communications Group, Inc | | | 28,708 | |
| 1,064 | | | | Consolidated Communications Holdings, Inc | | | 10,512 | |
| 1,231 | | *,e | | Frontier Communications Corp | | | 2,930 | |
| 890 | | *,e | | Gogo, Inc | | | 2,661 | |
| 666 | | * | | Intelsat S.A. | | | 14,246 | |
| 1,842 | | * | | Iridium Communications, Inc | | | 33,985 | |
| 1,450 | | * | | NII Holdings, Inc | | | 6,395 | |
| 259 | | * | | Ooma, Inc | | | 3,595 | |
| 1,000 | | * | | Orbcomm, Inc | | | 8,260 | |
| 184 | | * | | pdvWireless, Inc | | | 6,880 | |
| 728 | | | | Shenandoah Telecom Co | | | 32,214 | |
| 309 | | | | Spok Holdings, Inc | | | 4,097 | |
| 9,867 | | * | | Sprint Corp | | | 57,426 | |
| 1,512 | | | | Telephone & Data Systems, Inc | | | 49,200 | |
| 5,207 | | * | | T-Mobile US, Inc | | | 331,217 | |
| 247 | | * | | US Cellular Corp | | | 12,837 | |
| 69,435 | | | | Verizon Communications, Inc | | | 3,903,636 | |
| 4,303 | | * | | Vonage Holdings Corp | | | 37,565 | |
| 3,200 | | * | | Zayo Group Holdings, Inc | | | 73,088 | |
| | | | | | | | |
| | | | TOTAL TELECOMMUNICATION SERVICES | | | 8,365,067 | |
| | | | | | | | |
| |
TRANSPORTATION - 2.0% | | | | |
| 818 | | * | | Air Transport Services Group, Inc | | | 18,659 | |
| 2,129 | | | | Alaska Air Group, Inc | | | 129,550 | |
| 203 | | | | Allegiant Travel Co | | | 20,345 | |
| 123 | | | | Amerco, Inc | | | 40,358 | |
| 6,977 | | | | American Airlines Group, Inc | | | 224,031 | |
| 378 | | | | Arkansas Best Corp | | | 12,950 | |
| 363 | | * | | Atlas Air Worldwide Holdings, Inc | | | 15,315 | |
| 1,153 | | * | | Avis Budget Group, Inc | | | 25,919 | |
| 2,375 | | | | CH Robinson Worldwide, Inc | | | 199,714 | |
| 512 | | | | Copa Holdings S.A. (Class A) | | | 40,300 | |
| 542 | | | | Costamare, Inc | | | 2,379 | |
| 185 | | * | | Covenant Transportation Group, Inc | | | 3,552 | |
| 13,565 | | | | CSX Corp | | | 842,793 | |
| 306 | | * | | Daseke, Inc | | | 1,126 | |
| 10,586 | | | | Delta Air Lines, Inc | | | 528,241 | |
| 609 | | * | | Eagle Bulk Shipping, Inc | | | 2,808 | |
| 427 | | * | | Echo Global Logistics, Inc | | | 8,681 | |
| 2,887 | | | | Expeditors International of Washington, Inc | | | 196,576 | |
| 4,134 | | | | FedEx Corp | | | 666,938 | |
| 466 | | | | Forward Air Corp | | | 25,560 | |
| 127 | | * | | Genco Shipping & Trading Ltd | | | 1,002 | |
| 1,141 | | * | | Genesee & Wyoming, Inc (Class A) | | | 84,457 | |
| 828 | | | | Hawaiian Holdings, Inc | | | 21,868 | |
| 728 | | | | Heartland Express, Inc | | | 13,322 | |
| 866 | | * | | Hertz Global Holdings, Inc | | | 11,821 | |
| 505 | | * | | Hub Group, Inc (Class A) | | | 18,720 | |
| 1,477 | | | | JB Hunt Transport Services, Inc | | | 137,420 | |
| 5,176 | | * | | JetBlue Airways Corp | | | 83,127 | |
| 1,654 | | | | Kansas City Southern Industries, Inc | | | 157,874 | |
| 947 | | * | | Kirby Corp | | | 63,790 | |
| 2,000 | | | | Knight-Swift Transportation Holdings, Inc | | | 50,140 | |
| 719 | | | | Landstar System, Inc | | | 68,787 | |
| 1,216 | | | | Macquarie Infrastructure Co LLC | | | 44,457 | |
| 531 | | | | Marten Transport Ltd | | | 8,597 | |
| 668 | | | | Matson, Inc | | | 21,389 | |
| 4,566 | | | | Norfolk Southern Corp | | | 682,800 | |
| 1,051 | | | | Old Dominion Freight Line | | | 129,788 | |
| 310 | | * | | PAM Transportation Services, Inc | | | 12,217 | |
| 124 | | | | Park-Ohio Holdings Corp | | | 3,806 | |
| 580 | | * | | Radiant Logistics, Inc | | | 2,465 | |
78
TIAA-CREF LIFE FUNDS -Stock Index Fund
| | | | | | | | |
SHARES | | | | COMPANY | | VALUE | |
| | | | | | | |
| 883 | | | | Ryder System, Inc | | $ | 42,516 | |
| 780 | | * | | Safe Bulkers, Inc | | | 1,388 | |
| 390 | | * | | Saia, Inc | | | 21,770 | |
| 932 | | | | Schneider National, Inc | | | 17,400 | |
| 934 | | | | Scorpio Bulkers, Inc | | | 5,165 | |
| 802 | | | | Skywest, Inc | | | 35,665 | |
| 8,950 | | | | Southwest Airlines Co | | | 415,996 | |
| 1,133 | | * | | Spirit Airlines, Inc | | | 65,623 | |
| 12,291 | | | | Union Pacific Corp | | | 1,698,985 | |
| 4,047 | | * | | United Continental Holdings, Inc | | | 338,855 | |
| 11,537 | | | | United Parcel Service, Inc (Class B) | | | 1,125,204 | |
| 122 | | | | Universal Truckload Services, Inc | | | 2,207 | |
| 315 | | * | | US Xpress Enterprises, Inc | | | 1,767 | |
| 669 | | * | | USA Truck, Inc | | | 10,015 | |
| 701 | | | | Werner Enterprises, Inc | | | 20,708 | |
| 2,130 | | * | | XPO Logistics, Inc | | | 121,495 | |
| 521 | | * | | YRC Worldwide, Inc | | | 1,641 | |
| | | | | | | | |
| | | | TOTAL TRANSPORTATION | | | 8,550,042 | |
| | | | | | | | |
| |
UTILITIES - 3.2% | | | | |
| 11,476 | | | | AES Corp | | | 165,943 | |
| 892 | | | | Allete, Inc | | | 67,988 | |
| 4,101 | | | | Alliant Energy Corp | | | 173,267 | |
| 4,027 | | | | Ameren Corp | | | 262,681 | |
| 8,264 | | | | American Electric Power Co, Inc | | | 617,651 | |
| 819 | | | | American States Water Co | | | 54,906 | |
| 3,029 | | | | American Water Works Co, Inc | | | 274,942 | |
| 3,091 | | | | Aqua America, Inc | | | 105,681 | |
| 177 | | * | | AquaVenture Holdings Ltd | | | 3,344 | |
| 111 | | | | Artesian Resources Corp | | | 3,871 | |
| 1,866 | | *,e | | Atlantic Power Corp | | | 4,049 | |
| 1,817 | | | | Atmos Energy Corp | | | 168,472 | |
| 1,049 | | | | Avangrid, Inc | | | 52,544 | |
| 1,326 | | | | Avista Corp | | | 56,328 | |
| 1,043 | | | | Black Hills Corp | | | 65,480 | |
| 324 | | *,e | | Cadiz, Inc | | | 3,337 | |
| 747 | | | | California Water Service Group | | | 35,602 | |
| 8,194 | | | | Centerpoint Energy, Inc | | | 231,317 | |
| 244 | | | | Chesapeake Utilities Corp | | | 19,837 | |
| 545 | | | | Clearway Energy, Inc (Class A) | | | 9,221 | |
| 1,281 | | | | Clearway Energy, Inc (Class C) | | | 22,097 | |
| 4,698 | | | | CMS Energy Corp | | | 233,256 | |
| 165 | | | | Connecticut Water Service, Inc | | | 11,034 | |
| 5,107 | | | | Consolidated Edison, Inc | | | 390,481 | |
| 420 | | | | Consolidated Water Co, Inc | | | 4,897 | |
| 10,762 | | | | Dominion Resources, Inc | | | 769,053 | |
| 2,969 | | | | DTE Energy Co | | | 327,481 | |
| 11,878 | | | | Duke Energy Corp | | | 1,025,071 | |
| 5,084 | | | | Edison International | | | 288,619 | |
| 767 | | | | El Paso Electric Co | | | 38,450 | |
| 2,999 | | | | Entergy Corp | | | 258,124 | |
| 4,614 | | | | Evergy, Inc | | | 261,937 | |
| 5,377 | | | | Eversource Energy | | | 349,720 | |
| 16,230 | | | | Exelon Corp | | | 731,973 | |
| 8,056 | | | | FirstEnergy Corp | | | 302,503 | |
| 133 | | | | Global Water Resources, Inc | | | 1,349 | |
| 1,875 | | | | Hawaiian Electric Industries, Inc | | | 68,662 | |
| 864 | | | | Idacorp, Inc | | | 80,404 | |
| 3,502 | | | | MDU Resources Group, Inc | | | 83,488 | |
| 640 | | | | MGE Energy, Inc | | | 38,374 | |
| 240 | | | | Middlesex Water Co | | | 12,804 | |
| 1,346 | | | | National Fuel Gas Co | | | 68,888 | |
| 1,312 | | | | New Jersey Resources Corp | | | 59,919 | |
| 8,012 | | | | NextEra Energy, Inc | | | 1,392,646 | |
79
TIAA-CREF LIFE FUNDS -Stock Index Fund
| | | | | | | | |
SHARES | | | | COMPANY | | VALUE | |
| | | | | | | |
| 6,223 | | | | NiSource, Inc | | $ | 157,753 | |
| 445 | | | | Northwest Natural Holding Co | | | 26,905 | |
| 871 | | | | NorthWestern Corp | | | 51,772 | |
| 4,986 | | | | NRG Energy, Inc | | | 197,446 | |
| 3,602 | | | | OGE Energy Corp | | | 141,162 | |
| 811 | | | | ONE Gas, Inc | | | 64,556 | |
| 751 | | | | Ormat Technologies, Inc | | | 39,277 | |
| 743 | | | | Otter Tail Corp | | | 36,883 | |
| 1,257 | | | | Pattern Energy Group, Inc | | | 23,405 | |
| 8,339 | | * | | PG&E Corp | | | 198,051 | |
| 1,858 | | | | Pinnacle West Capital Corp | | | 158,302 | |
| 1,320 | | | | PNM Resources, Inc | | | 54,239 | |
| 1,479 | | | | Portland General Electric Co | | | 67,812 | |
| 12,105 | | | | PPL Corp | | | 342,935 | |
| 8,474 | | | | Public Service Enterprise Group, Inc | | | 441,072 | |
| 250 | | * | | Pure Cycle Corp | | | 2,482 | |
| 105 | | | | RGC Resources, Inc | | | 3,146 | |
| 2,297 | | | | SCANA Corp | | | 109,751 | |
| 4,513 | | | | Sempra Energy | | | 488,261 | |
| 254 | | | | SJW Corp | | | 14,127 | |
| 1,236 | | | | South Jersey Industries, Inc | | | 34,361 | |
| 16,893 | | | | Southern Co | | | 741,941 | |
| 699 | | | | Southwest Gas Corp | | | 53,473 | |
| 162 | | e | | Spark Energy, Inc | | | 1,204 | |
| 907 | | | | Spire, Inc | | | 67,191 | |
| 2,000 | | | | TerraForm Power, Inc | | | 22,440 | |
| 2,984 | | | | UGI Corp | | | 159,196 | |
| 217 | | | | Unitil Corp | | | 10,989 | |
| 1,461 | | | | Vectren Corp | | | 105,163 | |
| 6,610 | | * | | Vistra Energy Corp | | | 151,303 | |
| 5,177 | | | | WEC Energy Group, Inc | | | 358,559 | |
| 8,216 | | | | Xcel Energy, Inc | | | 404,802 | |
| 203 | | | | York Water Co | | | 6,508 | |
| | | | | | | | |
| | | | TOTAL UTILITIES | | | 13,934,158 | |
| | | | | | | | |
| | | | TOTAL COMMON STOCKS | | | 420,824,489 | |
| | | | | | | | |
| | | | (Cost $229,306,999) | | | | |
|
RIGHTS / WARRANTS - 0.0% | |
| |
COMMERCIAL & PROFESSIONAL SERVICES - 0.0% | | | | |
| 1,666 | | † | | Media General, Inc | | | 0 | |
| | | | | | | | |
| | | | TOTAL COMMERCIAL & PROFESSIONAL SERVICES | | | 0 | |
| | | | | | | | |
| |
PHARMACEUTICALS, BIOTECHNOLOGY & LIFE SCIENCES - 0.0% | | | | |
| 118 | | † | | Forest Laboratories, Inc CVR | | | 112 | |
| 145 | | | | Tobira Therapeutics, Inc | | | 9 | |
| | | | TOTAL PHARMACEUTICALS, BIOTECHNOLOGY & LIFE SCIENCES | | | 121 | |
| | | | | | | | |
| | | | TOTAL RIGHTS / WARRANTS | | | 121 | |
| | | | | | | | |
| | | | (Cost $9) | | | | |
| | | | | | | | | | | | | | | | |
PRINCIPAL | | | | ISSUER | | RATE | | | MATURITY
DATE | | | | |
| | | | | | | | | | | | | | |
SHORT-TERM INVESTMENTS - 2.5% | | | | | | | | | | | | |
| | | |
GOVERNMENT AGENCY DEBT - 1.9% | | | | | | | | | | | | |
| $ 8,320,000 | | | | Federal Home Loan Bank (FHLB) | | | 2.150 | % | | | 01/02/19 | | | | 8,320,000 | |
| | | | | | | | | | | | | | | | |
| | | | TOTAL GOVERNMENT AGENCY DEBT | | | | | | | | | | | 8,320,000 | |
| | | | | | | | | | | | | | | | |
80
TIAA-CREF LIFE FUNDS -Stock Index Fund
| | | | | | | | | | | | | | | | |
SHARES | | | | COMPANY | | | | | | | | VALUE | |
| | | |
INVESTMENTS IN REGISTERED INVESTMENT COMPANIES - 0.6% | | | | | | | | | | | | |
| 2,374,724 | | c | | State Street Navigator Securities Lending Government Money Market Portfolio | | | | | | | | | | $ | 2,374,724 | |
| | | | | | | | | | | | | | | | |
| | | | TOTAL INVESTMENTS IN REGISTERED INVESTMENT COMPANIES | | | | | | | | | | | 2,374,724 | |
| | | | | | | | | | | | | | | | |
| | | | TOTAL SHORT-TERM INVESTMENTS | | | | | | | | | | | 10,694,724 | |
| | | | | | | | | | | | | | | | |
| | | | (Cost $10,694,227) | | | | | | | | | | | | |
| | | | TOTAL INVESTMENTS - 100.5% | | | | | | | | | | | 431,519,334 | |
| | | | (Cost $240,001,235) | | | | | | | | | | | | |
| | | | OTHER ASSETS & LIABILITIES, NET - (0.5)% | | | | | | | | | | | (1,991,990 | ) |
| | | | | | | | | | | | | | | | |
| | | | NET ASSETS - 100.0% | | | | | | | | | | $ | 429,527,344 | |
| | | | | | | | | | | | | | | | |
Abbreviation(s):
| CVR | Contingent Value Right |
| REIT | Real Estate Investment Trust |
| † | Security is categorized as Level 3 in the fair value hierarchy. |
| c | Investments made with cash collateral received from securities on loan. |
| d | All or a portion of these securities have been segregated to cover margin requirements on open futures contracts. |
| e | All or a portion of these securities are out on loan. The aggregate value of securities on loan is $2,286,558. |
Futures contracts outstanding as of December 31, 2018 were as follows (See Note 3):
| | | | | | | | | | | | | | | | | | |
| Description | | Number of long (short)
contracts | | | Expiration date | | Notional
amount | | | Value | | | Unrealized
appreciation
(depreciation) | |
S&P 500 E Mini Index | | | 65 | | | 03/15/19 | | $ | 8,409,011 | | | $ | 8,141,900 | | | $ | (267,111 | ) |
81
TIAA-CREF LIFE FUNDS -International Equity Fund
TIAA-CREF LIFE FUNDS
INTERNATIONAL EQUITY FUND
SCHEDULE OF INVESTMENTS
December 31, 2018
| | | | | | | | |
SHARES | | | | COMPANY | | VALUE | |
| | | | | | | | |
COMMON STOCKS - 95.2% | | | | |
| |
AUSTRIA - 0.6% | | | | |
| 26,042 | | | | Wienerberger AG. | | $ | 537,420 | |
| | | | | | | | |
| | | | TOTAL AUSTRIA | | | 537,420 | |
| | | | | | | | |
| |
DENMARK - 1.1% | | | | |
| 3,567 | | | | Rockwool International AS (B Shares) | | | 932,783 | |
| | | | | | | | |
| | | | TOTAL DENMARK | | | 932,783 | |
| | | | | | | | |
|
FRANCE - 19.2% | |
| 75,481 | | | | Accor S.A. | | | 3,209,783 | |
| 1,737 | | | | Airbus SE | | | 165,605 | |
| 46,795 | | g | | ALD S.A. | | | 557,254 | |
| 115,574 | | | | Credit Agricole S.A. | | | 1,243,856 | |
| 5,658 | | | | Essilor International S.A. | | | 717,196 | |
| 1,459 | | | | Kering | | | 683,495 | |
| 13,343 | | | | Nexity | | | 602,422 | |
| 31,254 | | | | Sanofi-Aventis | | | 2,711,279 | |
| 56,924 | | | | Schneider Electric S.A. | | | 3,861,224 | |
| 33,477 | | | | Vinci S.A. | | | 2,752,879 | |
| | | | | | | | |
| | | | TOTAL FRANCE | | | 16,504,993 | |
| | | | | | | | |
|
GERMANY - 11.1% | |
| 8,191 | | | | BASF SE | | | 570,532 | |
| 21,186 | | | | Bayerische Motoren Werke AG. | | | 1,718,293 | |
| 5,394 | | | | Continental AG. | | | 751,038 | |
| 58,100 | | | | Daimler AG. (Registered) | | | 3,062,735 | |
| 31,551 | | | | Lanxess AG. | | | 1,450,602 | |
| 7,906 | | | | Porsche AG. | | | 464,970 | |
| 106,877 | | | | TUI AG. (DI) | | | 1,536,114 | |
| | | | | | | | |
| | | | TOTAL GERMANY | | | 9,554,284 | |
| | | | | | | | |
|
HONG KONG - 0.4% | |
| 7,948 | | | | Hong Kong Exchanges and Clearing Ltd | | | 230,000 | |
| 7,464 | | | | Melco Crown Entertainment Ltd (ADR) | | | 131,516 | |
| | | | | | | | |
| | | | TOTAL HONG KONG | | | 361,516 | |
| | | | | | | | |
|
INDIA - 1.0% | |
| 8,990 | | | | HDFC Bank Ltd | | | 273,474 | |
| 13,483 | | | | Housing Development Finance Corp | | | 379,874 | |
| 7,393 | | | | IndusInd Bank Ltd | | | 169,283 | |
| 14,765 | | * | | Motherson Sumi Systems Ltd | | | 35,290 | |
| | | | | | | | |
| | | | TOTAL INDIA | | | 857,921 | |
| | | | | | | | |
|
ITALY - 8.1% | |
| 165,882 | | | | Davide Campari-Milano S.p.A | | | 1,404,754 | |
| 125,870 | | | | Mediobanca S.p.A. | | | 1,065,041 | |
| 26,588 | | | | Moncler S.p.A | | | 884,786 | |
| 190,759 | | | | Prada S.p.A | | | 629,424 | |
| 267,198 | | | | UniCredit S.p.A. | | | 3,026,524 | |
| | | | | | | | |
| | | | TOTAL ITALY | | | 7,010,529 | |
| | | | | | | | |
82
TIAA-CREF LIFE FUNDS -International Equity Fund
| | | | | | | | |
SHARES | | | | COMPANY | | VALUE | |
| | | | | | | | |
JAPAN - 20.5% | | | | |
| 51,151 | | | | Hitachi Ltd | | $ | 1,356,025 | |
| 47,086 | | | | Ishikawajima-Harima Heavy Industries Co Ltd | | | 1,296,825 | |
| 205,209 | | | | JX Holdings, Inc | | | 1,065,758 | |
| 59,930 | | | | Komatsu Ltd | | | 1,287,892 | |
| 18,011 | | | | Konami Corp | | | 791,438 | |
| 13,600 | | | | Murata Manufacturing Co Ltd | | | 1,832,596 | |
| 7,020 | | | | Nintendo Co Ltd | | | 1,864,084 | |
| 66,850 | | | | Sony Corp | | | 3,222,813 | |
| 56,384 | | e | | Takeda Pharmaceutical Co Ltd | | | 1,911,106 | |
| 52,302 | | | | Toyota Motor Corp | | | 3,027,583 | |
| | | | | | | | |
| | | | TOTAL JAPAN | | | 17,656,120 | |
| | | | | | | | |
| |
KOREA, REPUBLIC OF - 0.5% | | | | |
| 2,314 | | | | Samsung SDI Co Ltd | | | 454,835 | |
| | | | | | | | |
| | | | TOTAL KOREA, REPUBLIC OF | | | 454,835 | |
| | | | | | | | |
| |
NETHERLANDS - 0.1% | | | | |
| 167 | | *,e,g | | Adyen NV | | | 90,220 | |
| | | | | | | | |
| | | | TOTAL NETHERLANDS | | | 90,220 | |
| | | | | | | | |
| |
NORWAY - 1.0% | | | | |
| 23,246 | | | | Yara International ASA | | | 896,118 | |
| | | | | | | | |
| | | | TOTAL NORWAY | | | 896,118 | |
| | | | | | | | |
| |
SPAIN - 1.1% | | | | |
| 77,238 | | *,e | | Siemens Gamesa Renewable Energy | | | 940,406 | |
| | | | | | | | |
| | | | TOTAL SPAIN | | | 940,406 | |
| | | | | | | | |
| |
SWEDEN - 3.4% | | | | |
| 103,293 | | | | Electrolux AB (Series B) | | | 2,177,285 | �� |
| 49,611 | | | | Hennes & Mauritz AB (B Shares) | | | 705,522 | |
| | | | | | | | |
| | | | TOTAL SWEDEN | | | 2,882,807 | |
| | | | | | | | |
| |
SWITZERLAND - 5.7% | | | | |
| 641 | | | | Burckhardt Compression Holding AG. | | | 150,387 | |
| 270,031 | | | | Credit Suisse Group | | | 2,951,895 | |
| 503 | | | | Geberit AG. | | | 195,879 | |
| 11,611 | | | | Nestle S.A. | | | 942,381 | |
| 899 | | | | Sika AG. | | | 114,194 | |
| 4,862 | | | | Vifor Pharma AG. | | | 529,060 | |
| | | | | | | | |
| | | | TOTAL SWITZERLAND | | | 4,883,796 | |
| | | | | | | | |
| |
UNITED KINGDOM - 21.4% | | | | |
| 102,788 | | | | BAE Systems plc | | | 601,192 | |
| 137,066 | | | | CNH Industrial NV | | | 1,238,430 | |
| 14,335 | | | | Experian Group Ltd | | | 347,508 | |
| 29,583 | | | | Linde plc | | | 4,696,112 | |
| 5,114,133 | | | | Lloyds TSB Group plc | | | 3,371,133 | |
| 33,845 | | | | Reckitt Benckiser Group plc | | | 2,591,725 | |
| 1,258,984 | | | | Tesco plc | | | 3,053,238 | |
| 163,977 | | | | Travis Perkins plc | | | 2,235,527 | |
| 14,699 | | | | Weir Group plc | | | 243,404 | |
| | | | | | | | |
| | | | TOTAL UNITED KINGDOM | | | 18,378,269 | |
| | | | | | | | |
| | | | TOTAL COMMON STOCKS | | | 81,942,017 | |
| | | | | | | | |
| | | | (Cost $98,659,789) | | | | |
83
TIAA-CREF LIFE FUNDS -International Equity Fund
| | | | | | | | | | | | | | | | |
PRINCIPAL | | | | ISSUER | | RATE | | | MATURITY
DATE | | | VALUE | |
| | | | | | | | | | | | | | |
SHORT-TERM INVESTMENTS - 8.1% | | | | | |
| |
GOVERNMENT AGENCY DEBT - 5.5% | | | | | |
| $ 4,670,000 | | | | Federal Home Loan Bank (FHLB) | | | 2.150 | % | | | 01/02/19 | | | $ | 4,670,000 | |
| | | | | | | | | | | | | | | | |
| | | | TOTAL GOVERNMENT AGENCY DEBT | | | | 4,670,000 | |
| | | | | | | | | | | | | | | | |
| | | | | | | | | | | | | | | | |
SHARES | | | | COMPANY | | | | | | | | | |
| | | | | | | | | | | | | | |
INVESTMENTS IN REGISTERED INVESTMENT COMPANIES - 2.6% | | | | | |
| 2,244,124 | | c | | State Street Navigator Securities Lending Government Money Market Portfolio | | | | | | | | 2,244,124 | |
| | | | | | | | | | | | | | | | |
| | | | TOTAL INVESTMENTS IN REGISTERED INVESTMENT COMPANIES | | | | 2,244,124 | |
| | | | | | | | | | | | | | | | |
| | | | TOTAL SHORT-TERM INVESTMENTS | | | | | | | | | | | 6,914,124 | |
| | | | | | | | | | | | | | | | |
| | | | (Cost $6,913,845) | | | | | | | | | | | | |
| | | | TOTAL INVESTMENTS - 103.3% | | | | | | | | | | | 88,856,141 | |
| | | | (Cost $105,573,634) | | | | | | | | | | | | |
| | | | OTHER ASSETS & LIABILITIES, NET - (3.3)% | | | | (2,805,264 | ) |
| | | | | | | | | | | | | | | | |
| | | | NET ASSETS - 100.0% | | | | | | | | | | $ | 86,050,877 | |
| | | | | | | | | | | | | | | | |
Abbreviation(s):
| ADR | American Depositary Receipt |
| c | Investments made with cash collateral received from securities on loan. |
| e | All or a portion of these securities are out on loan. The aggregate value of securities on loan is $2,151,129. |
| g | Security is exempt from registration under Rule 144(A) of the Securities Act of 1933. Such securities are deemed liquid and may be resold in transactions exempt from registration to qualified institutional buyers. At 12/31/18, the aggregate value of these securities was $647,474 or 0.8% of net assets. |
84
TIAA-CREF LIFE FUNDS -International Equity Fund
TIAA-CREF LIFE FUNDS
INTERNATIONAL EQUITY FUND
SUMMARY OF MARKET VALUES BY SECTOR
December 31, 2018
| | | | | | | | |
SECTOR | | VALUE | | | % OF
NET
ASSETS | |
CONSUMER DISCRETIONARY | | $ | 22,957,842 | | | | 26.7 | % |
INDUSTRIALS | | | 16,807,195 | | | | 19.5 | |
FINANCIALS | | | 12,711,081 | | | | 14.8 | |
MATERIALS | | | 8,264,979 | | | | 9.6 | |
CONSUMER STAPLES | | | 7,992,098 | | | | 9.3 | |
HEALTH CARE | | | 5,151,445 | | | | 6.0 | |
INFORMATION TECHNOLOGY | | | 3,733,676 | | | | 4.3 | |
COMMUNICATION SERVICES | | | 2,655,521 | | | | 3.1 | |
ENERGY | | | 1,065,758 | | | | 1.2 | |
REAL ESTATE | | | 602,422 | | | | 0.7 | |
SHORT-TERM INVESTMENTS | | | 6,914,124 | | | | 8.1 | |
OTHER ASSETS & LIABILITIES, NET | | | (2,805,264 | ) | | | (3.3 | ) |
| | | | | | | | |
NET ASSETS | | $ | 86,050,877 | | | | 100.0 | % |
| | | | | | | | |
85
TIAA-CREF LIFE FUNDS-Bond Fund
TIAA-CREF LIFE FUNDS
BOND FUND
SCHEDULE OF INVESTMENTS
December 31, 2018
| | | | | | | | | | | | | | | | | | |
PRINCIPAL | | | | ISSUER | | REFERENCE RATE & SPREAD | | RATE | | | MATURITY
DATE | | | VALUE | |
| | | | | | | | | | | | | | | | |
BANK LOAN OBLIGATIONS - 1.5% | | | | | |
| |
COMMERCIAL & PROFESSIONAL SERVICES - 0.1% | | | | | |
| $ 71,969 | | i | | ProQuest LLC | | LIBOR 1 M + 3.250% | | | 5.772 | % | | | 10/24/21 | | | $ | 69,990 | |
| 99,747 | | i | | Spin Holdco, Inc | | LIBOR 3 M + 3.250% | | | 5.686 | | | | 11/14/22 | | | | 94,959 | |
| | | | | | | | | | | | | | | | | | |
| | | | TOTAL COMMERCIAL & PROFESSIONAL SERVICES | | | | 164,949 | |
| | | | | | | | | |
| |
CONSUMER DURABLES & APPAREL - 0.0% | | | | | |
| 99,500 | | i | | Samsonite IP Holdings Sarl | | LIBOR 1 M + 1.750% | | | 4.272 | | | | 04/25/25 | | | | 94,848 | |
| | | | | | | | | | | | | | | | | | |
| | | | TOTAL CONSUMER DURABLES & APPAREL | | | | 94,848 | |
| | | | | | | | | |
| |
CONSUMER SERVICES - 0.2% | | | | | |
| 73,359 | | i | | Allied Universal Holdco LLC | | LIBOR 1 M + 3.750% | | | 6.272 | | | | 07/28/22 | | | | 69,434 | |
| 96,781 | | i | | KUEHG Corp | | LIBOR 3 M + 3.750% | | | 6.553 | | | | 02/21/25 | | | | 92,729 | |
| 99,499 | | i | | Las Vegas Sands LLC | | LIBOR 1 M + 1.750% | | | 4.272 | | | | 03/27/25 | | | | 94,787 | |
| | | | | | | | | | | | | | | | | | |
| | | | TOTAL CONSUMER SERVICES | | | | 256,950 | |
| | | | | | | | | |
| |
ENERGY - 0.0% | | | | | |
| 15,000 | | i | | California Resources Corp | | LIBOR 1 M + 10.375% | | | 12.897 | | | | 12/31/21 | | | | 14,663 | |
| | | | | | | | | | | | | | | | | | |
| | | | TOTAL ENERGY | | | | 14,663 | |
| | | | | | | | | |
| |
FOOD, BEVERAGE & TOBACCO - 0.0% | | | | | |
| 17,361 | | i | | Hostess Brands LLC | | LIBOR 1 and 3 M + 2.250% | | | 4.777 | | | | 08/03/22 | | | | 27,793 | |
| | | | | | | | | | | | | | | | | | |
| | | | TOTAL FOOD, BEVERAGE & TOBACCO | | | | 27,793 | |
| | | | | | | | | |
| |
HEALTH CARE EQUIPMENT & SERVICES - 0.2% | | | | | |
| 95,680 | | i | | DaVita HealthCare Partners, Inc | | LIBOR 1 M + 2.750% | | | 5.272 | | | | 06/24/21 | | | | 94,794 | |
| 250,000 | | i | | Envision Healthcare Corp | | LIBOR 1 M + 3.750% | | | 6.272 | | | | 10/10/25 | | | | 232,410 | |
| 36,733 | | i | | Greatbatch Ltd | | LIBOR 1 M + 3.000% | | | 5.390 | | | | 10/27/22 | | | | 35,717 | |
| | | | | | | | | | | | | | | | | | |
| | | | TOTAL HEALTH CARE EQUIPMENT & SERVICES | | | | 362,921 | |
| | | | | | | | | |
| |
INSURANCE - 0.0% | | | | | |
| 99,500 | | i | | Acrisure LLC | | LIBOR 1 M + 3.750% | | | 6.272 | | | | 11/22/23 | | | | 93,779 | |
| | | | | | | | | | | | | | | | | | |
| | | | TOTAL INSURANCE | | | | 93,779 | |
| | | | | | | | | |
| |
MATERIALS - 0.2% | | | | | |
| 100,000 | | h,i | | Messer Industries USA, Inc | | LIBOR 3 M + 2.500% | | | 2.500 | | | | 10/01/25 | | | | 94,667 | |
| 1,481 | | i | | Plaze, Inc | | LIBOR 1 and 3 M + 3.500% | | | 5.896 | | | | 07/29/22 | | | | 23,881 | |
| 100,000 | | i | | Starfruit US Holdco LLC | | LIBOR 1 M + 3.250% | | | 5.750 | | | | 10/01/25 | | | | 95,500 | |
| | | | | | | | | | | | | | | | | | |
| | | | TOTAL MATERIALS | | | | 214,048 | |
| | | | | | | | | |
| |
MEDIA & ENTERTAINMENT - 0.2% | | | | | |
| 23,263 | | i | | CDS US Intermediate Holdings, Inc | | LIBOR 1 and 3 M + 3.750% | | | 6.553 | | | | 07/08/22 | | | | 89,954 | |
| 99,499 | | i | | Lions Gate Capital Holdings LLC | | LIBOR 1 M + 2.250% | | | 4.772 | | | | 03/24/25 | | | | 95,581 | |
| 99,747 | | i | | Nielsen Finance LLC | | LIBOR 1 M + 2.000% | | | 4.387 | | | | 10/04/23 | | | | 96,630 | |
| | | | | | | | | | | | | | | | | | |
| | | | TOTAL MEDIA & ENTERTAINMENT | | | | 282,165 | |
| | | | | | | | | |
| | | | |
PHARMACEUTICALS, BIOTECHNOLOGY & LIFE SCIENCES - 0.0% | | | | | | | | | | | | | | |
| 97,468 | | i | | Valeant Pharmaceuticals International, Inc | | LIBOR 1 M + 3.000% | | | 5.379 | | | | 06/02/25 | | | | 92,893 | |
| | | | | | | | | | | | | | | | | | |
| | | | TOTAL PHARMACEUTICALS, BIOTECHNOLOGY & LIFE SCIENCES | | | | 92,893 | |
| | | | | | | | | |
86
TIAA-CREF LIFE FUNDS-Bond Fund
| | | | | | | | | | | | | | | | | | |
PRINCIPAL | | | | ISSUER | | REFERENCE RATE & SPREAD | | RATE | | | MATURITY
DATE | | | VALUE | |
| | | | | | | | | | | | | | | | |
REAL ESTATE - 0.0% | | | | | | | | | | | | | | |
| $ 99,750 | | i | | DTZ US Borrower LLC | | LIBOR 1 M + 3.250% | | | 5.772 | % | | | 08/21/25 | | | $ | 95,261 | |
| 99,744 | | i | | MGM Growth Properties LLC | | LIBOR 1 M + 2.000% | | | 4.522 | | | | 03/23/25 | | | | 95,291 | |
| | | | | | | | | | | | | | | | | | |
| | | | TOTAL REAL ESTATE | | | | 190,552 | |
| | | | | | | | | |
| | | | |
SOFTWARE & SERVICES - 0.3% | | | | | | | | | | | | | | |
| 496,250 | | i | | Mitchell International, Inc | | LIBOR 1 M + 3.250% | | | 5.772 | | | | 11/29/24 | | | | 477,333 | |
| 99,496 | | i | | NeuStar, Inc | | LIBOR 1 M + 3.500% | | | 6.022 | | | | 08/08/24 | | | | 95,392 | |
| | | | | | | | | | | | | | | | | | |
| | | | TOTAL SOFTWARE & SERVICES | | | | 572,725 | |
| | | | | | | | | |
| | | | |
TECHNOLOGY HARDWARE & EQUIPMENT - 0.1% | | | | | | | | | | | | | | |
| 99,748 | | i | | Dell International LLC | | LIBOR 1 M + 2.000% | | | 4.530 | | | | 09/07/23 | | | | 95,675 | |
| 99,750 | | i | | Plantronics, Inc | | LIBOR 1 M + 2.500% | | | 5.022 | | | | 07/02/25 | | | | 95,785 | |
| 64,562 | | i | | Sensata Technologies BV | | LIBOR 2 M + 1.750% | | | 4.209 | | | | 10/14/21 | | | | 63,728 | |
| | | | | | | | | | | | | | | | | | |
| | | | TOTAL TECHNOLOGY HARDWARE & EQUIPMENT | | | | 255,188 | |
| | | | | | | | | |
| | | | |
TELECOMMUNICATION SERVICES - 0.1% | | | | | | | | | | | | | | |
| 99,492 | | i | | CNT Holdings III Corp | | LIBOR 1 M + 3.250% | | | 5.780 | | | | 01/22/23 | | | | 95,463 | |
| | | | | | | | | | | | | | | | | | |
| | | | TOTAL TELECOMMUNICATION SERVICES | | | | 95,463 | |
| | | | | | | | | |
| | | | |
TRANSPORTATION - 0.1% | | | | | | | | | | | | | | |
| 98,990 | | i | | American Airlines, Inc | | LIBOR 1 M + 2.000% | | | 4.455 | | | | 12/14/23 | | | | 93,917 | |
| 99,497 | | i | | TransDigm, Inc | | LIBOR 1 M + 2.500% | | | 5.022 | | | | 08/22/24 | | | | 93,688 | |
| | | | | | | | | | | | | | | | | | |
| | | | TOTAL TRANSPORTATION | | | | 187,605 | |
| | | | | | | | | |
| | | | TOTAL BANK LOAN OBLIGATIONS | | | | 2,906,542 | |
| | | | | | | | | | | | | | | | | | |
| | | | (Cost $3,036,740) | | | | | | | | | | | | | | |
| |
BONDS - 94.7% | | | | | |
| |
CORPORATE BONDS - 37.8% | | | | | |
| | | | |
AUTOMOBILES & COMPONENTS - 0.5% | | | | | | | | | | | | | | |
| 125,000 | | | | Aptiv plc | | | | | 3.150 | | | | 11/19/20 | | | | 124,063 | |
| 100,000 | | g | | Dana Financing Luxembourg Sarl | | | | | 6.500 | | | | 06/01/26 | | | | 95,875 | |
| 200,000 | | | | General Motors Co | | | | | 4.200 | | | | 10/01/27 | | | | 180,364 | |
| 125,000 | | | | General Motors Co | | | | | 5.200 | | | | 04/01/45 | | | | 103,778 | |
| 200,000 | | g | | Hyundai Capital America | | | | | 3.250 | | | | 09/20/22 | | | | 194,496 | |
| 175,000 | | | | Magna International, Inc | | | | | 3.625 | | | | 06/15/24 | | | | 175,746 | |
| | | | | | | | | | | | | | | | | | |
| | | | TOTAL AUTOMOBILES & COMPONENTS | | | | | | | | 874,322 | |
| | | | | | | | | | | | | |
| | | | |
BANKS - 6.3% | | | | | | | | | | | | | | |
| 200,000 | | g | | Akbank TAS | | | | | 7.200 | | | | 03/16/27 | | | | 175,725 | |
| 200,000 | | g | | Banco del Estado de Chile | | | | | 2.668 | | | | 01/08/21 | | | | 195,500 | |
| 200,000 | | g | | Banco Internacional del Peru SAA Interbank | | | | | 3.375 | | | | 01/18/23 | | | | 190,802 | |
| 200,000 | | | | Banco Santander S.A. | | | | | 3.125 | | | | 02/23/23 | | | | 189,078 | |
| 200,000 | | | | Banco Santander S.A. | | | | | 3.800 | | | | 02/23/28 | | | | 177,999 | |
| 300,000 | | | | Bank of America Corp | | | | | 2.151 | | | | 11/09/20 | | | | 294,560 | |
| 200,000 | | | | Bank of America Corp | | | | | 3.875 | | | | 08/01/25 | | | | 197,942 | |
| 300,000 | | | | Bank of America Corp | | | | | 3.248 | | | | 10/21/27 | | | | 277,424 | |
| 125,000 | | | | Bank of America Corp | | | | | 3.419 | | | | 12/20/28 | | | | 116,838 | |
| 100,000 | | | | Bank of Montreal | | | | | 3.803 | | | | 12/15/32 | | | | 92,600 | |
| 225,000 | | g | | Bank of Tokyo-Mitsubishi UFJ Ltd | | | | | 2.350 | | | | 09/08/19 | | | | 223,697 | |
| 200,000 | | | | Barclays plc | | | | | 4.338 | | | | 05/16/24 | | | | 194,438 | |
| 125,000 | | | | Barclays plc | | | | | 3.650 | | | | 03/16/25 | | | | 115,507 | |
| 175,000 | | | | Capital One Bank USA NA | | | | | 2.650 | | | | 08/08/22 | | | | 168,045 | |
| 60,000 | | | | Capital One Bank USA NA | | | | | 3.375 | | | | 02/15/23 | | | | 57,931 | |
| 750,000 | | | | Citigroup, Inc | | | | | 3.200 | | | | 10/21/26 | | | | 692,625 | |
| 175,000 | | | | Citigroup, Inc | | | | | 4.300 | | | | 11/20/26 | | | | 168,370 | |
| 200,000 | | | | Citigroup, Inc | | | | | 3.668 | | | | 07/24/28 | | | | 189,042 | |
| 100,000 | | | | Citizens Bank NA | | | | | 2.650 | | | | 05/26/22 | | | | 97,149 | |
| 125,000 | | | | Compass Bank | | | | | 2.875 | | | | 06/29/22 | | | | 119,772 | |
87
TIAA-CREF LIFE FUNDS-Bond Fund
| | | | | | | | | | | | | | | | | | |
PRINCIPAL | | | | ISSUER | | REFERENCE RATE & SPREAD | | RATE | | | MATURITY
DATE | | | VALUE | |
| | | | | | | | | | | | | | | | |
| $ 250,000 | | g | | Cooperatieve Rabobank UA | | | | | 3.875 | % | | | 09/26/23 | | | $ | 250,849 | |
| 250,000 | | | | Cooperatieve Rabobank UA | | | | | 3.750 | | | | 07/21/26 | | | | 234,403 | |
| 100,000 | | g | | Credit Agricole S.A. | | | | | 2.500 | | | | 04/15/19 | | | | 99,845 | |
| 150,000 | | g | | Credit Agricole S.A. | | | | | 3.250 | | | | 10/04/24 | | | | 140,237 | |
| 125,000 | | | | Discover Bank | | | | | 3.200 | | | | 08/09/21 | | | | 123,696 | |
| 100,000 | | | | HSBC Holdings plc | | | | | 3.262 | | | | 03/13/23 | | | | 97,861 | |
| 200,000 | | | | HSBC Holdings plc | | | | | 3.033 | | | | 11/22/23 | | | | 193,572 | |
| 350,000 | | | | HSBC Holdings plc | | | | | 4.292 | | | | 09/12/26 | | | | 345,637 | |
| 200,000 | | | | HSBC Holdings plc | | | | | 4.375 | | | | 11/23/26 | | | | 193,724 | |
| 200,000 | | | | HSBC Holdings plc | | | | | 4.041 | | | | 03/13/28 | | | | 191,453 | |
| 250,000 | | | | Huntington National Bank | | | | | 2.500 | | | | 08/07/22 | | | | 241,513 | |
| 200,000 | | g | | ING Groep NV | | | | | 4.625 | | | | 01/06/26 | | | | 201,447 | |
| 375,000 | | | | JPMorgan Chase & Co | | | | | 2.750 | | | | 06/23/20 | | | | 372,793 | |
| 325,000 | | | | JPMorgan Chase & Co | | | | | 2.295 | | | | 08/15/21 | | | | 317,071 | |
| 200,000 | | | | JPMorgan Chase & Co | | | | | 2.776 | | | | 04/25/23 | | | | 193,920 | |
| 150,000 | | | | JPMorgan Chase & Co | | | | | 2.700 | | | | 05/18/23 | | | | 144,071 | |
| 350,000 | | | | JPMorgan Chase & Co | | | | | 3.200 | | | | 06/15/26 | | | | 329,786 | |
| 175,000 | | | | JPMorgan Chase & Co | | | | | 2.950 | | | | 10/01/26 | | | | 161,704 | |
| 100,000 | | | | JPMorgan Chase & Co | | | | | 3.882 | | | | 07/24/38 | | | | 91,111 | |
| 80,000 | | | | KeyBank NA | | | | | 2.500 | | | | 12/15/19 | | | | 79,510 | |
| 100,000 | | g | | Macquarie Bank Ltd | | | | | 2.600 | | | | 06/24/19 | | | | 99,701 | |
| 225,000 | | | | Manufacturers & Traders Trust Co | | | | | 2.100 | | | | 02/06/20 | | | | 222,558 | |
| 150,000 | | | | Mizuho Financial Group, Inc | | | | | 3.922 | | | | 09/11/24 | | | | 151,576 | |
| 350,000 | | | | PNC Bank NA | | | | | 2.600 | | | | 07/21/20 | | | | 346,873 | |
| 250,000 | | | | PNC Bank NA | | | | | 2.450 | | | | 11/05/20 | | | | 246,888 | |
| 150,000 | | | | PNC Bank NA | | | | | 2.700 | | | | 11/01/22 | | | | 145,755 | |
| 200,000 | | | | Royal Bank of Canada | | | | | 3.700 | | | | 10/05/23 | | | | 200,789 | |
| 200,000 | | | | Santander Holdings USA, Inc | | | | | 3.400 | | | | 01/18/23 | | | | 192,187 | |
| 100,000 | | | | Santander Holdings USA, Inc | | | | | 4.400 | | | | 07/13/27 | | | | 94,673 | |
| 100,000 | | | | Santander UK Group Holdings plc | | | | | 3.571 | | | | 01/10/23 | | | | 95,713 | |
| 300,000 | | g | | Skandinaviska Enskilda Banken AB | | | | | 2.625 | | | | 11/17/20 | | | | 295,660 | |
| 150,000 | | | | Sumitomo Mitsui Banking Corp | | | | | 2.450 | | | | 01/16/20 | | | | 148,790 | |
| 250,000 | | | | Sumitomo Mitsui Financial Group, Inc | | | | | 2.442 | | | | 10/19/21 | | | | 243,753 | |
| 125,000 | | | | SunTrust Banks, Inc | | | | | 2.900 | | | | 03/03/21 | | | | 123,914 | |
| 100,000 | | | | SunTrust Banks, Inc | | | | | 2.750 | | | | 05/01/23 | | | | 96,558 | |
| 100,000 | | | | SunTrust Banks, Inc | | | | | 4.050 | | | | 11/03/25 | | | | 101,735 | |
| 250,000 | | | | Toronto-Dominion Bank | | | | | 1.850 | | | | 09/11/20 | | | | 245,382 | |
| 100,000 | | | | Toronto-Dominion Bank | | | | | 3.625 | | | | 09/15/31 | | | | 94,495 | |
| 200,000 | | g | | Turkiye Is Bankasi | | | | | 5.500 | | | | 04/21/22 | | | | 180,794 | |
| 200,000 | | g | | UBS AG. | | | | | 2.450 | | | | 12/01/20 | | | | 196,346 | |
| 125,000 | | | | UnionBanCal Corp | | | | | 3.500 | | | | 06/18/22 | | | | 125,292 | |
| 200,000 | | g,i | | United Overseas Bank Ltd | | LIBOR 3 M + 0.480% | | | 2.957 | | | | 04/23/21 | | | | 199,486 | |
| 150,000 | | | | Westpac Banking Corp | | | | | 4.322 | | | | 11/23/31 | | | | 141,704 | |
| | | | | | | | | | | | | | | | | | |
| | | | TOTAL BANKS | | | | | | | | 11,929,869 | |
| | | | | | | | | | | | | |
| | | | |
CAPITAL GOODS - 0.9% | | | | | | | | | | | | | | |
| 50,000 | | g | | Anixter, Inc | | | | | 6.000 | | | | 12/01/25 | | | | 49,625 | |
| 50,000 | | g | | Cleaver-Brooks, Inc | | | | | 7.875 | | | | 03/01/23 | | | | 48,250 | |
| 150,000 | | | | General Electric Co | | | | | 4.125 | | | | 10/09/42 | | | | 117,003 | |
| 175,000 | | | | Lockheed Martin Corp | | | | | 2.500 | | | | 11/23/20 | | | | 173,047 | |
| 100,000 | | | | Lockheed Martin Corp | | | | | 3.550 | | | | 01/15/26 | | | | 99,277 | |
| 150,000 | | g | | Molex Electronic Technologies LLC | | | | | 2.878 | | | | 04/15/20 | | | | 148,532 | |
| 200,000 | | g | | Molex Electronic Technologies LLC | | | | | 3.900 | | | | 04/15/25 | | | | 199,061 | |
| 100,000 | | | | Mosaic Co | | | | | 4.875 | | | | 11/15/41 | | | | 91,196 | |
| 175,000 | | | | Rockwell Collins, Inc | | | | | 3.500 | | | | 03/15/27 | | | | 164,360 | |
| 125,000 | | | | Roper Technologies, Inc | | | | | 3.800 | | | | 12/15/26 | | | | 121,947 | |
| 100,000 | | g | | Stena AB | | | | | 7.000 | | | | 02/01/24 | | | | 91,000 | |
| 100,000 | | | | Textron, Inc | | | | | 3.875 | | | | 03/01/25 | | | | 97,517 | |
| 250,000 | | | | United Technologies Corp | | | | | 4.125 | | | | 11/16/28 | | | | 248,242 | |
| 150,000 | | | | United Technologies Corp | | | | | 4.450 | | | | 11/16/38 | | | | 145,669 | |
| | | | | | | | | | | | | | | | | | |
| | | | TOTAL CAPITAL GOODS | | | | | | | | 1,794,726 | |
| | | | | | | | | | | | | |
88
TIAA-CREF LIFE FUNDS -Bond Fund
| | | | | | | | | | | | | | | | | | |
PRINCIPAL | | | | ISSUER | | | | RATE | | | MATURITY
DATE | | | VALUE | |
| | | | | | | | | | | | | | | | |
COMMERCIAL & PROFESSIONAL SERVICES - 0.5% | | | | | | | | | | | | | | |
| $ 100,000 | | | | ADT Corp | | | | | 6.250 | % | | | 10/15/21 | | | $ | 101,375 | |
| 350,000 | | | | Republic Services, Inc | | | | | 3.550 | | | | 06/01/22 | | | | 351,442 | |
| 290,000 | | | | Republic Services, Inc | | | | | 2.900 | | | | 07/01/26 | | | | 273,679 | |
| 75,000 | | | | United Rentals North America, Inc | | | | | 5.500 | | | | 07/15/25 | | | | 70,688 | |
| 175,000 | | | | Waste Management, Inc | | | | | 3.150 | | | | 11/15/27 | | | | 167,178 | |
| 50,000 | | | | Waste Management, Inc | | | | | 3.900 | | | | 03/01/35 | | | | 48,577 | |
| 50,000 | | | | Waste Management, Inc | | | | | 4.100 | | | | 03/01/45 | | | | 48,333 | |
| | | | | | | | | | | | | | | | | | |
| | | | TOTAL COMMERCIAL & PROFESSIONAL SERVICES | | | | | | | | 1,061,272 | |
| | | | | | | | | | | | | |
| | | | |
CONSUMER DURABLES & APPAREL - 0.1% | | | | | | | | | | | | | | |
| 175,000 | | | | Newell Rubbermaid, Inc | | | | | 4.200 | | | | 04/01/26 | | | | 171,114 | |
| | | | | | | | | | | | | | | | | | |
| | | | TOTAL CONSUMER DURABLES & APPAREL | | | | | | | | 171,114 | |
| | | | | | | | | | | | | |
| | | | |
CONSUMER SERVICES - 0.4% | | | | | | | | | | | | | | |
| 500,000 | | g | | Anheuser-Busch Cos LLC | | | | | 3.650 | | | | 02/01/26 | | | | 472,620 | |
| 60,000 | | | | Boyd Gaming Corp | | | | | 6.000 | | | | 08/15/26 | | | | 56,100 | |
| 60,000 | | g | | International Game Technology plc | | | | | 6.250 | | | | 01/15/27 | | | | 57,600 | |
| 200,000 | | g | | Sands China Ltd | | | | | 5.125 | | | | 08/08/25 | | | | 198,122 | |
| 70,000 | | | | Speedway Motorsports, Inc | | | | | 5.125 | | | | 02/01/23 | | | | 68,600 | |
| | | | | | | | | | | | | | | | | | |
| | | | TOTAL CONSUMER SERVICES | | | | | | | | 853,042 | |
| | | | | | | | | | | | | |
| | | | |
DIVERSIFIED FINANCIALS - 3.4% | | | | | | | | | | | | | | |
| 120,000 | | | | AerCap Ireland Capital DAC | | | | | 3.500 | | | | 01/15/25 | | | | 109,530 | |
| 200,000 | | | | American Express Co | | | | | 2.500 | | | | 08/01/22 | | | | 193,026 | |
| 50,000 | | | | American Express Credit Corp | | | | | 2.700 | | | | 03/03/22 | | | | 49,008 | |
| 100,000 | | g | | Avolon Holdings Funding Ltd | | | | | 5.125 | | | | 10/01/23 | | | | 95,500 | |
| 50,000 | | | | Bank of New York Mellon Corp | | | | | 5.450 | | | | 05/15/19 | | | | 50,459 | |
| 125,000 | | | | Berkshire Hathaway, Inc | | | | | 3.125 | | | | 03/15/26 | | | | 121,216 | |
| 75,000 | | g | | BPCE S.A. | | | | | 4.000 | | | | 09/12/23 | | | | 74,148 | |
| 200,000 | | g | | Credit Suisse Group AG. | | | | | 2.997 | | | | 12/14/23 | | | | 190,307 | |
| 200,000 | | | | Credit Suisse Group Funding Guernsey Ltd | | | | | 3.800 | | | | 06/09/23 | | | | 196,245 | |
| 150,000 | | | | Credit Suisse Group Funding Guernsey Ltd | | | | | 3.750 | | | | 03/26/25 | | | | 143,499 | |
| 175,000 | | | | Deutsche Bank AG. | | | | | 3.950 | | | | 02/27/23 | | | | 165,217 | |
| 150,000 | | | | Ford Motor Credit Co LLC | | | | | 3.096 | | | | 05/04/23 | | | | 135,589 | |
| 100,000 | | | | GE Capital International Funding Co | | | | | 4.418 | | | | 11/15/35 | | | | 84,131 | |
| 125,000 | | | | General Motors Financial Co, Inc | | | | | 3.950 | | | | 04/13/24 | | | | 118,705 | |
| 300,000 | | | | Goldman Sachs Group, Inc | | | | | 3.500 | | | | 01/23/25 | | | | 284,493 | |
| 250,000 | | | | Goldman Sachs Group, Inc | | | | | 3.691 | | | | 06/05/28 | | | | 232,472 | |
| 100,000 | | | | Goldman Sachs Group, Inc | | | | | 4.017 | | | | 10/31/38 | | | | 87,969 | |
| 125,000 | | | | Goldman Sachs Group, Inc | | | | | 4.800 | | | | 07/08/44 | | | | 119,192 | |
| 200,000 | | g | | GrupoSura Finance S.A. | | | | | 5.500 | | | | 04/29/26 | | | | 200,000 | |
| 100,000 | | | | Icahn Enterprises LP | | | | | 6.250 | | | | 02/01/22 | | | | 98,750 | |
| 250,000 | | g | | ICICI Bank Ltd | | | | | 3.800 | | | | 12/14/27 | | | | 225,807 | |
| 100,000 | | | | International Lease Finance Corp | | | | | 5.875 | | | | 08/15/22 | | | | 104,740 | |
| 50,000 | | | | Jefferies Group LLC | | | | | 4.150 | | | | 01/23/30 | | | | 42,904 | |
| 100,000 | | | | Legg Mason, Inc | | | | | 2.700 | | | | 07/15/19 | | | | 99,722 | |
| 100,000 | | | | Legg Mason, Inc | | | | | 3.950 | | | | 07/15/24 | | | | 98,556 | |
| 150,000 | | | | Morgan Stanley | | | | | 3.125 | | | | 01/23/23 | | | | 146,426 | |
| 250,000 | | | | Morgan Stanley | | | | | 3.737 | | | | 04/24/24 | | | | 248,090 | |
| 600,000 | | | | Morgan Stanley | | | | | 3.125 | | | | 07/27/26 | | | | 553,790 | |
| 100,000 | | g | | Quicken Loans, Inc | | | | | 5.250 | | | | 01/15/28 | | | | 88,500 | |
| 125,000 | | | | TD Ameritrade Holding Corp | | | | | 3.300 | | | | 04/01/27 | | | | 119,624 | |
| 150,000 | | g | | UBS Group Funding Jersey Ltd | | | | | 2.950 | | | | 09/24/20 | | | | 148,387 | |
| 200,000 | | g | | UBS Group Funding Jersey Ltd | | | | | 2.650 | | | | 02/01/22 | | | | 193,567 | |
| 175,000 | | | | Unilever Capital Corp | | | | | 2.900 | | | | 05/05/27 | | | | 166,188 | |
| 1,125,000 | | | | Wells Fargo & Co | | | | | 2.625 | | | | 07/22/22 | | | | 1,084,739 | |
| 300,000 | | | | Wells Fargo & Co | | | | | 3.000 | | | | 04/22/26 | | | | 279,693 | |
| 75,000 | | | | Wells Fargo & Co | | | | | 3.584 | | | | 05/22/28 | | | | 72,046 | |
| | | | | | | | | | | | | | | | | | |
| | | | TOTAL DIVERSIFIED FINANCIALS | | | | 6,422,235 | |
| | | | | | | | | | | | | |
89
TIAA-CREF LIFE FUNDS-Bond Fund
| | | | | | | | | | | | | | | | | | |
PRINCIPAL | | | | ISSUER | | | | RATE | | | MATURITY
DATE | | | VALUE | |
| | | | | | | | | | | | | | | | |
ENERGY - 4.1% | | | | | | | | | | | | | | | | | | |
| $ 100,000 | | | | Anadarko Petroleum Corp | | | | | 5.550 | % | | | 03/15/26 | | | $ | 104,781 | |
| 25,000 | | | | Anadarko Petroleum Corp | | | | | 4.500 | | | | 07/15/44 | | | | 21,211 | |
| 100,000 | | | | Andeavor Logistics LP | | | | | 4.250 | | | | 12/01/27 | | | | 94,454 | |
| 100,000 | | | | Andeavor Logistics LP | | | | | 5.200 | | | | 12/01/47 | | | | 90,141 | |
| 100,000 | | g | | APT Pipelines Ltd | | | | | 4.250 | | | | 07/15/27 | | | | 97,357 | |
| 100,000 | | | | BP Capital Markets America, Inc | | | | | 2.520 | | | | 09/19/22 | | | | 96,701 | |
| 300,000 | | | | BP Capital Markets America, Inc | | | | | 3.796 | | | | 09/21/25 | | | | 301,580 | |
| 300,000 | | | | BP Capital Markets plc | | | | | 2.315 | | | | 02/13/20 | | | | 297,401 | |
| 125,000 | | | | BP Capital Markets plc | | | | | 3.279 | | | | 09/19/27 | | | | 119,045 | |
| 125,000 | | | | Cenovus Energy, Inc | | | | | 4.450 | | | | 09/15/42 | | | | 97,859 | |
| 100,000 | | g | | Cheniere Energy Partners LP | | | | | 5.625 | | | | 10/01/26 | | | | 93,500 | |
| 100,000 | | | | Cimarex Energy Co | | | | | 3.900 | | | | 05/15/27 | | | | 92,845 | |
| 125,000 | | | | Concho Resources, Inc | | | | | 3.750 | | | | 10/01/27 | | | | 117,738 | |
| 125,000 | | | | Continental Resources, Inc | | | | | 3.800 | | | | 06/01/24 | | | | 118,325 | |
| 100,000 | | | | Devon Energy Corp | | | | | 5.000 | | | | 06/15/45 | | | | 88,673 | |
| 50,000 | | | | Ecopetrol S.A. | | | | | 5.875 | | | | 09/18/23 | | | | 52,125 | |
| 60,000 | | | | Ecopetrol S.A. | | | | | 5.875 | | | | 05/28/45 | | | | 56,567 | |
| 100,000 | | | | Enbridge, Inc | | | | | 3.700 | | | | 07/15/27 | | | | 94,768 | |
| 150,000 | | | | Energy Transfer Partners LP | | | | | 4.750 | | | | 01/15/26 | | | | 145,857 | |
| 150,000 | | | | Energy Transfer Partners LP | | | | | 4.950 | | | | 06/15/28 | | | | 147,057 | |
| 100,000 | | | | Enterprise Products Operating LLC | | | | | 3.700 | | | | 02/15/26 | | | | 98,577 | |
| 100,000 | | | | Enterprise Products Operating LLC | | | | | 4.150 | | | | 10/16/28 | | | | 99,558 | |
| 100,000 | | | | Enterprise Products Operating LLC | | | | | 4.250 | | | | 02/15/48 | | | | 88,762 | |
| 17,000 | | †,g | | EP Energy LLC | | | | | 9.375 | | | | 05/01/24 | | | | 7,565 | |
| 100,000 | | | | EQT Corp | | | | | 3.900 | | | | 10/01/27 | | | | 86,257 | |
| 100,000 | | | | Exterran Partners LP | | | | | 6.000 | | | | 04/01/21 | | | | 96,000 | |
| 75,000 | | | | Exterran Partners LP | | | | | 6.000 | | | | 10/01/22 | | | | 70,500 | |
| 150,000 | | | | Exxon Mobil Corp | | | | | 2.397 | | | | 03/06/22 | | | | 147,200 | |
| 125,000 | | | | Genesis Energy LP | | | | | 6.250 | | | | 05/15/26 | | | | 107,187 | |
| 100,000 | | | | HollyFrontier Corp | | | | | 5.875 | | | | 04/01/26 | | | | 101,136 | |
| 425,000 | | | | Kinder Morgan, Inc | | | | | 4.300 | | | | 03/01/28 | | | | 417,243 | |
| 150,000 | | | | Marathon Oil Corp | | | | | 2.700 | | | | 06/01/20 | | | | 147,762 | |
| 175,000 | | | | MPLX LP | | | | | 4.125 | | | | 03/01/27 | | | | 166,709 | |
| 125,000 | | | | MPLX LP | | | | | 4.000 | | | | 03/15/28 | | | | 117,226 | |
| 125,000 | | | | MPLX LP | | | | | 4.500 | | | | 04/15/38 | | | | 109,287 | |
| 125,000 | | | | MPLX LP | | | | | 4.700 | | | | 04/15/48 | | | | 108,450 | |
| 150,000 | | | | Noble Energy, Inc | | | | | 3.850 | | | | 01/15/28 | | | | 135,804 | |
| 150,000 | | | | Noble Energy, Inc | | | | | 5.050 | | | | 11/15/44 | | | | 129,359 | |
| 100,000 | | | | ONE Gas, Inc | | | | | 3.610 | | | | 02/01/24 | | | | 100,287 | |
| 100,000 | | | | ONEOK, Inc | | | | | 4.000 | | | | 07/13/27 | | | | 95,429 | |
| 125,000 | | | | ONEOK, Inc | | | | | 4.550 | | | | 07/15/28 | | | | 123,861 | |
| 100,000 | | | | Petrobras Global Finance BV | | | | | 5.999 | | | | 01/27/28 | | | | 94,151 | |
| 50,000 | | | | Petrobras Global Finance BV | | | | | 7.250 | | | | 03/17/44 | | | | 49,275 | |
| 75,000 | | | | Petroleos Mexicanos | | | | | 6.375 | | | | 02/04/21 | | | | 75,825 | |
| 100,000 | | | | Petroleos Mexicanos | | | | | 3.500 | | | | 01/30/23 | | | | 90,500 | |
| 80,000 | | | | Petroleos Mexicanos | | | | | 4.250 | | | | 01/15/25 | | | | 69,920 | |
| 100,000 | | | | Petroleos Mexicanos | | | | | 6.500 | | | | 03/13/27 | | | | 94,000 | |
| 50,000 | | | | Petroleos Mexicanos | | | | | 5.350 | | | | 02/12/28 | | | | 43,625 | |
| 25,000 | | | | Petroleos Mexicanos | | | | | 6.500 | | | | 01/23/29 | | | | 23,312 | |
| 175,000 | | | | Phillips 66 Partners LP | | | | | 3.550 | | | | 10/01/26 | | | | 163,652 | |
| 100,000 | | | | Phillips 66 Partners LP | | | | | 4.900 | | | | 10/01/46 | | | | 91,380 | |
| 45,000 | | | | Pioneer Natural Resources Co | | | | | 7.500 | | | | 01/15/20 | | | | 46,756 | |
| 150,000 | | | | Pioneer Natural Resources Co | | | | | 3.450 | | | | 01/15/21 | | | | 149,545 | |
| 50,000 | | | | Range Resources Corp | | | | | 5.750 | | | | 06/01/21 | | | | 48,375 | |
| 250,000 | | g | | Reliance Industries Ltd | | | | | 3.667 | | | | 11/30/27 | | | | 228,378 | |
| 175,000 | | | | Sabine Pass Liquefaction LLC | | | | | 4.200 | | | | 03/15/28 | | | | 167,489 | |
| 75,000 | | | | Shell International Finance BV | | | | | 2.250 | | | | 01/06/23 | | | | 72,122 | |
| 75,000 | | | | Shell International Finance BV | | | | | 4.000 | | | | 05/10/46 | | | | 72,529 | |
| 200,000 | | | | Statoil ASA | | | | | 2.450 | | | | 01/17/23 | | | | 194,313 | |
| 125,000 | | | | Sunoco Logistics Partners Operations LP | | | | | 4.000 | | | | 10/01/27 | | | | 114,678 | |
| 50,000 | | | | Sunoco LP | | | | | 4.875 | | | | 01/15/23 | | | | 48,750 | |
90
TIAA-CREF LIFE FUNDS-Bond Fund
| | | | | | | | | | | | | | | | | | |
PRINCIPAL | | | | ISSUER | | | | RATE | | | MATURITY
DATE | | | VALUE | |
| | | | | | | | | | | | | | | | |
| $ 25,000 | | g | | Targa Resources Partners LP | | | | | 5.875 | % | | | 04/15/26 | | | $ | 24,312 | |
| 10,000 | | | | Tesoro Logistics LP | | | | | 6.375 | | | | 05/01/24 | | | | 10,325 | |
| 250,000 | | | | TransCanada PipeLines Ltd | | | | | 4.250 | | | | 05/15/28 | | | | 247,733 | |
| 40,000 | | g | | USA Compression Partners LP | | | | | 6.875 | | | | 04/01/26 | | | | 38,400 | |
| 25,000 | | | | Vale Overseas Ltd | | | | | 6.875 | | | | 11/21/36 | | | | 28,588 | |
| 125,000 | | | | Valero Energy Partners LP | | | | | 4.500 | | | | 03/15/28 | | | | 122,466 | |
| 150,000 | | | | Western Gas Partners LP | | | | | 3.950 | | | | 06/01/25 | | | | 141,380 | |
| 50,000 | | | | Western Gas Partners LP | | | | | 4.650 | | | | 07/01/26 | | | | 48,377 | |
| 25,000 | | | | Whiting Petroleum Corp | | | | | 6.625 | | | | 01/15/26 | | | | 21,438 | |
| 75,000 | | | | Williams Partners LP | | | | | 3.600 | | | | 03/15/22 | | | | 73,634 | |
| 75,000 | | | | Williams Partners LP | | | | | 4.900 | | | | 01/15/45 | | | | 68,132 | |
| 150,000 | | g | | YPF S.A. | | | | | 6.950 | | | | 07/21/27 | | | | 122,250 | |
| | | | | | | | | | | | | | | | | | |
| | | | TOTAL ENERGY | | | | | | | | 7,767,754 | |
| | | | | | | | | | | | | |
|
FOOD & STAPLES RETAILING - 1.3% | |
| 100,000 | | | | Albertsons Cos LLC | | | | | 6.625 | | | | 06/15/24 | | | | 92,750 | |
| 175,000 | | | | CVS Health Corp | | | | | 3.700 | | | | 03/09/23 | | | | 173,117 | |
| 275,000 | | | | CVS Health Corp | | | | | 2.875 | | | | 06/01/26 | | | | 250,604 | |
| 500,000 | | | | CVS Health Corp | | | | | 4.300 | | | | 03/25/28 | | | | 489,594 | |
| 400,000 | | | | CVS Health Corp | | | | | 4.780 | | | | 03/25/38 | | | | 383,720 | |
| 100,000 | | | | CVS Health Corp | | | | | 5.050 | | | | 03/25/48 | | | | 97,390 | |
| 140,000 | | | | Ingles Markets, Inc | | | | | 5.750 | | | | 06/15/23 | | | | 138,250 | |
| 100,000 | | | | Kroger Co | | | | | 3.700 | | | | 08/01/27 | | | | 94,455 | |
| 100,000 | | | | Walgreens Boots Alliance, Inc | | | | | 3.450 | | | | 06/01/26 | | | | 94,032 | |
| 450,000 | | | | Walmart, Inc | | | | | 3.700 | | | | 06/26/28 | | | | 456,832 | |
| 125,000 | | | | Walmart, Inc | | | | | 3.950 | | | | 06/28/38 | | | | 123,991 | |
| | | | | | | | | | | | | | | | | | |
| | | | TOTAL FOOD & STAPLES RETAILING | | | | | | | | 2,394,735 | |
| | | | | | | | | | | | | |
|
FOOD, BEVERAGE & TOBACCO - 1.2% | |
| 123,000 | | | | Anheuser-Busch InBev Finance, Inc | | | | | 2.650 | | | | 02/01/21 | | | | 120,897 | |
| 150,000 | | | | Anheuser-Busch InBev Finance, Inc | | | | | 3.300 | | | | 02/01/23 | | | | 146,050 | |
| 125,000 | | | | Anheuser-Busch InBev Worldwide, Inc | | | | | 4.600 | | | | 04/15/48 | | | | 112,214 | |
| 250,000 | | | | BAT Capital Corp | | | | | 3.557 | | | | 08/15/27 | | | | 222,062 | |
| 100,000 | | | | Campbell Soup Co | | | | | 4.150 | | | | 03/15/28 | | | | 93,154 | |
| 100,000 | | | | ConAgra Brands, Inc | | | | | 4.850 | | | | 11/01/28 | | | | 98,397 | |
| 100,000 | | | | Constellation Brands, Inc | | | | | 4.400 | | | | 11/15/25 | | | | 100,243 | |
| 200,000 | | | | Constellation Brands, Inc | | | | | 3.600 | | | | 02/15/28 | | | | 184,297 | |
| 200,000 | | | | Diageo Capital plc | | | | | 3.500 | | | | 09/18/23 | | | | 200,715 | |
| 200,000 | | | | Diageo Capital plc | | | | | 3.875 | | | | 05/18/28 | | | | 203,743 | |
| 150,000 | | g | | Heineken NV | | | | | 3.500 | | | | 01/29/28 | | | | 144,732 | |
| 100,000 | | g | | Heineken NV | | | | | 4.350 | | | | 03/29/47 | | | | 95,224 | |
| 100,000 | | | | Kellogg Co | | | | | 3.400 | | | | 11/15/27 | | | | 93,186 | |
| 175,000 | | | | Mondelez International, Inc | | | | | 4.125 | | | | 05/07/28 | | | | 174,732 | |
| 100,000 | | | | Tyson Foods, Inc | | | | | 3.900 | | | | 09/28/23 | | | | 99,854 | |
| 100,000 | | | | Tyson Foods, Inc | | | | | 3.550 | | | | 06/02/27 | | | | 93,182 | |
| 100,000 | | | | Tyson Foods, Inc | | | | | 5.100 | | | | 09/28/48 | | | | 96,087 | |
| | | | | | | | | | | | | | | | | | |
| | | | TOTAL FOOD, BEVERAGE & TOBACCO | | | | | | | | 2,278,769 | |
| | | | | | | | | | | | | |
|
HEALTH CARE EQUIPMENT & SERVICES - 0.6% | |
| 150,000 | | | | Anthem, Inc | | | | | 3.650 | | | | 12/01/27 | | | | 143,398 | |
| 250,000 | | | | Becton Dickinson and Co | | | | | 3.700 | | | | 06/06/27 | | | | 236,344 | |
| 75,000 | | | | Cardinal Health, Inc | | | | | 3.410 | | | | 06/15/27 | | | | 68,181 | |
| 100,000 | | | | Covidien International Finance S.A. | | | | | 3.200 | | | | 06/15/22 | | | | 99,714 | |
| 50,000 | | g | | Enterprise Merger Sub, Inc | | | | | 8.750 | | | | 10/15/26 | | | | 43,250 | |
| 50,000 | | g | | MEDNAX, Inc | | | | | 6.250 | | | | 01/15/27 | | | | 48,250 | |
| 75,000 | | | | Medtronic, Inc | | | | | 4.625 | | | | 03/15/45 | | | | 78,740 | |
| 50,000 | | | | Tenet Healthcare Corp | | | | | 8.125 | | | | 04/01/22 | | | | 50,125 | |
| 175,000 | | | | Thermo Fisher Scientific, Inc | | | | | 2.950 | | | | 09/19/26 | | | | 161,584 | |
| 50,000 | | | | Thermo Fisher Scientific, Inc | | | | | 3.200 | | | | 08/15/27 | | | | 46,495 | |
| 100,000 | | | | Zimmer Biomet Holdings, Inc | | | | | 3.700 | | | | 03/19/23 | | | | 98,927 | |
| 55,000 | | | | Zimmer Holdings, Inc | | | | | 3.550 | | | | 04/01/25 | | | | 52,298 | |
| | | | | | | | | | | | | |
| | | | TOTAL HEALTH CARE EQUIPMENT & SERVICES | | | | | | | | 1,127,306 | |
| | | | | | | | | | | | | |
91
TIAA-CREF LIFE FUNDS-Bond Fund
| | | | | | | | | | | | | | | | | | |
PRINCIPAL | | | | ISSUER | | | | RATE | | | MATURITY
DATE | | | VALUE | |
| | | | | | | | | | | | | | | | |
INSURANCE - 1.7% | |
| $ 100,000 | | | | ACE INA Holdings, Inc | | | | | 2.875 | % | | | 11/03/22 | | | $ | 99,148 | |
| 100,000 | | | | Allstate Corp | | | | | 3.280 | | | | 12/15/26 | | | | 98,059 | |
| 100,000 | | | | Allstate Corp | | | | | 5.750 | | | | 08/15/53 | | | | 97,500 | |
| 100,000 | | | | American Financial Group, Inc | | | | | 3.500 | | | | 08/15/26 | | | | 94,384 | |
| 90,000 | | | | American International Group, Inc | | | | | 3.750 | | | | 07/10/25 | | | | 86,212 | |
| 125,000 | | | | American International Group, Inc | | | | | 3.900 | | | | 04/01/26 | | | | 120,428 | |
| 175,000 | | | | Aon plc | | | | | 3.500 | | | | 06/14/24 | | | | 170,871 | |
| 200,000 | | | | Children’s Hospital Medic | | | | | 4.268 | | | | 05/15/44 | | | | 203,273 | |
| 100,000 | | | | CNA Financial Corp | | | | | 3.950 | | | | 05/15/24 | | | | 99,066 | |
| 100,000 | | | | CNA Financial Corp | | | | | 3.450 | | | | 08/15/27 | | | | 93,093 | |
| 100,000 | | | | Hartford Financial Services Group, Inc | | | | | 4.300 | | | | 04/15/43 | | | | 93,019 | |
| 150,000 | | | | HCA, Inc | | | | | 5.625 | | | | 09/01/28 | | | | 144,750 | |
| 100,000 | | | | Humana, Inc | | | | | 3.950 | | | | 03/15/27 | | | | 97,751 | |
| 100,000 | | | | Lincoln National Corp | | | | | 3.800 | | | | 03/01/28 | | | | 97,045 | |
| 100,000 | | | | Markel Corp | | | | | 3.500 | | | | 11/01/27 | | | | 94,421 | |
| 100,000 | | | | MetLife, Inc | | | | | 3.600 | | | | 11/13/25 | | | | 98,706 | |
| 175,000 | | | | Prudential Financial, Inc | | | | | 3.878 | | | | 03/27/28 | | | | 175,970 | |
| 100,000 | | g | | Prudential Funding LLC | | | | | 6.750 | | | | 09/15/23 | | | | 111,473 | |
| 225,000 | | | | Travelers Cos, Inc | | | | | 4.000 | | | | 05/30/47 | | | | 216,290 | |
| 150,000 | | | | UnitedHealth Group, Inc | | | | | 2.950 | | | | 10/15/27 | | | | 141,796 | |
| 100,000 | | | | UnitedHealth Group, Inc | | | | | 3.750 | | | | 10/15/47 | | | | 91,654 | |
| 500,000 | | g,i | | Vitality Re IX Ltd | | | | | 3.955 | | | | 01/10/22 | | | | 495,650 | |
| 25,000 | | | | WR Berkley Corp | | | | | 5.375 | | | | 09/15/20 | | | | 25,740 | |
| | | | | | | | | | | | | | | | | | |
| | | | TOTAL INSURANCE | | | | | | | | 3,046,299 | |
| | | | | | | | | | | | | |
|
MATERIALS - 1.1% | |
| 35,000 | | | | Air Products & Chemicals, Inc | | | | | 4.375 | | | | 08/21/19 | | | | 35,292 | |
| 100,000 | | | | Albemarle Corp | | | | | 5.450 | | | | 12/01/44 | | | | 100,085 | |
| 100,000 | | | | ArcelorMittal | | | | | 6.250 | | | | 02/25/22 | | | | 105,834 | |
| 200,000 | | g | | Corp Nacional del Cobre de Chile-CODELCO | | | | | 3.625 | | | | 08/01/27 | | | | 190,470 | |
| 100,000 | | g | | CRH America Finance, Inc | | | | | 3.400 | | | | 05/09/27 | | | | 91,854 | |
| 100,000 | | g | | Dow Chemical Co | | | | | 4.550 | | | | 11/30/25 | | | | 101,778 | |
| 50,000 | | | | Dow Chemical Co | | | | | 4.375 | | | | 11/15/42 | | | | 43,932 | |
| 300,000 | | | | DowDuPont, Inc | | | | | 4.725 | | | | 11/15/28 | | | | 311,136 | |
| 250,000 | | | | International Paper Co | | | | | 4.350 | | | | 08/15/48 | | | | 214,186 | |
| 200,000 | | g | | Inversiones CMPC S.A. | | | | | 4.375 | | | | 04/04/27 | | | | 189,848 | |
| 100,000 | | g | | James Hardie International Finance DAC | | | | | 4.750 | | | | 01/15/25 | | | | 91,000 | |
| 50,000 | | | | Newmont Mining Corp | | | | | 4.875 | | | | 03/15/42 | | | | 47,369 | |
| 100,000 | | | | Nutrien Ltd | | | | | 3.375 | | | | 03/15/25 | | | | 93,990 | |
| 60,000 | | g | | OCI NV | | | | | 6.625 | | | | 04/15/23 | | | | 58,893 | |
| 80,000 | | g | | Owens-Brockway Glass Container, Inc | | | | | 5.875 | | | | 08/15/23 | | | | 80,200 | |
| 100,000 | | | | Rio Tinto Finance USA Ltd | | | | | 3.750 | | | | 06/15/25 | | | | 100,254 | |
| 200,000 | | g | | SABIC Capital II BV | | | | | 4.000 | | | | 10/10/23 | | | | 198,998 | |
| 100,000 | | | | Sherwin-Williams Co | | | | | 3.450 | | | | 06/01/27 | | | | 93,269 | |
| 100,000 | | | | Westlake Chemical Corp | | | | | 3.600 | | | | 08/15/26 | | | | 91,735 | |
| | | | | | | | | | | | | | | | | | |
| | | | TOTAL MATERIALS | | | | | | | | 2,240,123 | |
| | | | | | | | | | | | | |
|
MEDIA & ENTERTAINMENT - 2.0% | |
| 500,000 | | | | 21st Century Fox America, Inc | | | | | 3.000 | | | | 09/15/22 | | | | 494,022 | |
| 50,000 | | | | 21st Century Fox America, Inc | | | | | 6.900 | | | | 08/15/39 | | | | 65,781 | |
| 100,000 | | | | AMC Entertainment Holdings, Inc | | | | | 5.875 | | | | 02/15/22 | | | | 97,000 | |
| 25,000 | | | | CBS Corp | | | | | 2.900 | | | | 06/01/23 | | | | 23,826 | |
| 100,000 | | | | CBS Corp | | | | | 3.375 | | | | 02/15/28 | | | | 90,726 | |
| 75,000 | | | | Charter Communications Operating LLC | | | | | 3.579 | | | | 07/23/20 | | | | 74,907 | |
| 75,000 | | | | Charter Communications Operating LLC | | | | | 4.464 | | | | 07/23/22 | | | | 75,717 | |
| 325,000 | | | | Charter Communications Operating LLC | | | | | 4.908 | | | | 07/23/25 | | | | 323,020 | |
92
TIAA-CREF LIFE FUNDS-Bond Fund
| | | | | | | | | | | | | | | | | | |
PRINCIPAL | | | | ISSUER | | | | RATE | | | MATURITY
DATE | | | VALUE | |
| | | | | | | | | | | | | | | | |
| $ 100,000 | | | | Charter Communications Operating LLC | | | | | 5.375 | % | | | 05/01/47 | | | $ | 90,727 | |
| 300,000 | | | | Comcast Corp | | | | | 3.700 | | | | 04/15/24 | | | | 301,810 | |
| 200,000 | | | | Comcast Corp | | | | | 3.950 | | | | 10/15/25 | | | | 202,459 | |
| 300,000 | | | | Comcast Corp | | | | | 2.350 | | | | 01/15/27 | | | | 268,495 | |
| 300,000 | | | | Comcast Corp | | | | | 3.200 | | | | 07/15/36 | | | | 258,357 | |
| 100,000 | | | | Discovery Communications LLC | | | | | 2.950 | | | | 03/20/23 | | | | 95,760 | |
| 100,000 | | | | Discovery Communications LLC | | | | | 3.950 | | | | 03/20/28 | | | | 92,779 | |
| 50,000 | | g | | EMI Music Publishing Group North America Holdings, Inc | | | 7.625 | | | | 06/15/24 | | | | 53,250 | |
| 100,000 | | g | | Gray Escrow, Inc | | | | | 7.000 | | | | 05/15/27 | | | | 97,492 | |
| 40,000 | | g | | Meredith Corp | | | | | 6.875 | | | | 02/01/26 | | | | 39,100 | |
| 125,000 | | g | | NBC Universal Enterprise, Inc | | | | | 1.974 | | | | 04/15/19 | | | | 124,602 | |
| 50,000 | | g | | Nielsen Finance LLC | | | | | 5.000 | | | | 04/15/22 | | | | 47,750 | |
| 100,000 | | | | RELX Capital, Inc | | | | | 3.500 | | | | 03/16/23 | | | | 99,201 | |
| 15,000 | | g | | Tegna, Inc | | | | | 4.875 | | | | 09/15/21 | | | | 14,663 | |
| 80,000 | | g | | Tegna, Inc | | | | | 5.500 | | | | 09/15/24 | | | | 77,500 | |
| 75,000 | | | | Time Warner Cable, Inc | | | | | 5.875 | | | | 11/15/40 | | | | 70,768 | |
| 450,000 | | | | Time Warner, Inc | | | | | 2.100 | | | | 06/01/19 | | | | 447,908 | |
| 175,000 | | | | Time Warner, Inc | | | | | 3.600 | | | | 07/15/25 | | | | 165,821 | |
| 100,000 | | | | Time Warner, Inc | | | | | 3.800 | | | | 02/15/27 | | | | 93,881 | |
| 50,000 | | | | Viacom, Inc | | | | | 5.850 | | | | 09/01/43 | | | | 48,926 | |
| | | | | | | | | | | | | | | | | | |
| | | | TOTAL MEDIA & ENTERTAINMENT | | | | | | | | 3,936,248 | |
| | | | | | | | | | | | | |
|
PHARMACEUTICALS, BIOTECHNOLOGY & LIFE SCIENCES - 1.8% | |
| 100,000 | | | | Abbott Laboratories | | | | | 3.875 | | | | 09/15/25 | | | | 101,304 | |
| 227,000 | | | | Abbott Laboratories | | | | | 3.750 | | | | 11/30/26 | | | | 224,303 | |
| 100,000 | | | | Abbott Laboratories | | | | | 5.300 | | | | 05/27/40 | | | | 110,396 | |
| 100,000 | | | | AbbVie, Inc | | | | | 3.750 | | | | 11/14/23 | | | | 99,488 | |
| 150,000 | | | | AbbVie, Inc | | | | | 3.200 | | | | 05/14/26 | | | | 139,088 | |
| 300,000 | | | | AbbVie, Inc | | | | | 4.250 | | | | 11/14/28 | | | | 291,421 | |
| 125,000 | | | | AbbVie, Inc | | | | | 4.400 | | | | 11/06/42 | | | | 110,510 | |
| 100,000 | | | | Actavis Funding SCS | | | | | 3.800 | | | | 03/15/25 | | | | 97,664 | |
| 100,000 | | | | Actavis Funding SCS | | | | | 4.550 | | | | 03/15/35 | | | | 94,954 | |
| 100,000 | | | | AstraZeneca plc | | | | | 3.125 | | | | 06/12/27 | | | | 93,073 | |
| 150,000 | | | | AstraZeneca plc | | | | | 4.000 | | | | 01/17/29 | | | | 147,750 | |
| 200,000 | | g | | Bayer US Finance II LLC | | | | | 4.375 | | | | 12/15/28 | | | | 191,069 | |
| 200,000 | | g | | Bayer US Finance II LLC | | | | | 4.625 | | | | 06/25/38 | | | | 181,827 | |
| 75,000 | | | | Celgene Corp | | | | | 3.875 | | | | 08/15/25 | | | | 72,232 | |
| 275,000 | | | | Celgene Corp | | | | | 3.450 | | | | 11/15/27 | | | | 250,395 | |
| 150,000 | | | | Gilead Sciences, Inc | | | | | 2.950 | | | | 03/01/27 | | | | 139,726 | |
| 36,000 | | | | Gilead Sciences, Inc | | | | | 4.000 | | | | 09/01/36 | | | | 32,854 | |
| 50,000 | | | | Gilead Sciences, Inc | | | | | 4.150 | | | | 03/01/47 | | | | 46,122 | |
| 100,000 | | | | GlaxoSmithKline Capital, Inc | | | | | 3.875 | | | | 05/15/28 | | | | 101,684 | |
| 150,000 | | | | Johnson & Johnson | | | | | 2.900 | | | | 01/15/28 | | | | 143,855 | |
| 100,000 | | | | Johnson & Johnson | | | | | 3.400 | | | | 01/15/38 | | | | 93,193 | |
| 25,000 | | | | Mylan NV | | | | | 3.950 | | | | 06/15/26 | | | | 22,797 | |
| 125,000 | | g | | Mylan, Inc | | | | | 4.550 | | | | 04/15/28 | | | | 116,571 | |
| 175,000 | | | | Novartis Capital Corp | | | | | 3.000 | | | | 11/20/25 | | | | 169,602 | |
| 150,000 | | | | Teva Pharmaceutical Finance Netherlands III BV | | | | | 3.150 | | | | 10/01/26 | | | | 114,541 | |
| 50,000 | | g | | Valeant Pharmaceuticals International, Inc | | | | | 5.500 | | | | 03/01/23 | | | | 45,584 | |
| 50,000 | | g | | VRX Escrow Corp | | | | | 5.875 | | | | 05/15/23 | | | | 46,250 | |
| | | | | | | | | | | | | | | | | | |
| | | | TOTAL PHARMACEUTICALS, BIOTECHNOLOGY & LIFE SCIENCES | | | | | | | | 3,278,253 | |
| | | | | | | | | | | | | |
|
REAL ESTATE - 2.3% | |
| 100,000 | | | | Alexandria Real Estate Equities, Inc | | | | | 3.950 | | | | 01/15/27 | | | | 97,084 | |
| 100,000 | | | | Alexandria Real Estate Equities, Inc | | | | | 3.950 | | | | 01/15/28 | | | | 96,642 | |
| 100,000 | | | | American Tower Corp | | | | | 3.000 | | | | 06/15/23 | | | | 96,206 | |
| 50,000 | | | | American Tower Corp | | | | | 3.375 | | | | 10/15/26 | | | | 46,540 | |
| 100,000 | | | | Boston Properties LP | | | | | 4.500 | | | | 12/01/28 | | | | 102,307 | |
| 150,000 | | | | Brandywine Operating Partnership LP | | | | | 4.100 | | | | 10/01/24 | | | | 148,365 | |
93
TIAA-CREF LIFE FUNDS-Bond Fund
| | | | | | | | | | | | | | | | | | |
PRINCIPAL | | | | ISSUER | | | | RATE | | | MATURITY
DATE | | | VALUE | |
| | | | | | | | | | | | | | | | |
| $ 100,000 | | | | Brandywine Operating Partnership LP | | | | | 3.950 | % | | | 11/15/27 | | | $ | 95,066 | |
| 200,000 | | | | Brixmor Operating Partnership LP | | | | | 3.850 | | | | 02/01/25 | | | | 193,402 | |
| 160,000 | | | | Brixmor Operating Partnership LP | | | | | 4.125 | | | | 06/15/26 | | | | 155,009 | |
| 75,000 | | | | Brixmor Operating Partnership LP | | | | | 3.900 | | | | 03/15/27 | | | | 71,032 | |
| 35,000 | | | | Camden Property Trust | | | | | 4.625 | | | | 06/15/21 | | | | 35,859 | |
| 100,000 | | | | Camden Property Trust | | | | | 2.950 | | | | 12/15/22 | | | | 97,822 | |
| 100,000 | | | | Camden Property Trust | | | | | 4.100 | | | | 10/15/28 | | | | 101,303 | |
| 110,000 | | | | Crown Castle International Corp | | | | | 4.875 | | | | 04/15/22 | | | | 113,183 | |
| 50,000 | | | | Crown Castle International Corp | | | | | 3.700 | | | | 06/15/26 | | | | 47,722 | |
| 87,000 | | | | DDR Corp | | | | | 3.625 | | | | 02/01/25 | | | | 83,107 | |
| 50,000 | | | | Digital Realty Trust LP | | | | | 3.700 | | | | 08/15/27 | | | | 47,218 | |
| 100,000 | | | | Duke Realty LP | | | | | 3.250 | | | | 06/30/26 | | | | 95,159 | |
| 100,000 | | | | Equity One, Inc | | | | | 3.750 | | | | 11/15/22 | | | | 99,836 | |
| 75,000 | | | | Essex Portfolio LP | | | | | 3.375 | | | | 01/15/23 | | | | 73,978 | |
| 100,000 | | | | Healthcare Realty Trust, Inc | | | | | 3.750 | | | | 04/15/23 | | | | 98,458 | |
| 175,000 | | | | Healthcare Realty Trust, Inc | | | | | 3.875 | | | | 05/01/25 | | | | 170,584 | |
| 100,000 | | | | Healthcare Trust of America Holdings LP | | | | | 3.700 | | | | 04/15/23 | | | | 98,457 | |
| 125,000 | | | | Healthcare Trust of America Holdings LP | | | | | 3.500 | | | | 08/01/26 | | | | 117,549 | |
| 100,000 | | | | Highwoods Realty LP | | | | | 3.875 | | | | 03/01/27 | | | | 97,067 | |
| 100,000 | | | | Highwoods Realty LP | | | | | 4.125 | | | | 03/15/28 | | | | 97,900 | |
| 100,000 | | | | Kilroy Realty LP | | | | | 4.750 | | | | 12/15/28 | | | | 101,911 | |
| 50,000 | | | | Kimco Realty Corp | | | | | 3.800 | | | | 04/01/27 | | | | 48,110 | |
| 100,000 | | | | Mid-America Apartments LP | | | | | 4.300 | | | | 10/15/23 | | | | 102,507 | |
| 125,000 | | | | Mid-America Apartments LP | | | | | 3.750 | | | | 06/15/24 | | | | 123,812 | |
| 100,000 | | | | Mid-America Apartments LP | | | | | 3.600 | | | | 06/01/27 | | | | 96,269 | |
| 50,000 | | | | National Retail Properties, Inc | | | | | 3.800 | | | | 10/15/22 | | | | 50,255 | |
| 100,000 | | | | National Retail Properties, Inc | | | | | 3.300 | | | | 04/15/23 | | | | 97,823 | |
| 100,000 | | | | National Retail Properties, Inc | | | | | 4.000 | | | | 11/15/25 | | | | 98,985 | |
| 150,000 | | | | Regency Centers LP | | | | | 3.900 | | | | 11/01/25 | | | | 147,745 | |
| 200,000 | | | | Regency Centers LP | | | | | 3.600 | | | | 02/01/27 | | | | 191,294 | |
| 125,000 | | | | Ventas Realty LP | | | | | 4.000 | | | | 03/01/28 | | | | 121,217 | |
| 50,000 | | | | Weingarten Realty Investors | | | | | 3.375 | | | | 10/15/22 | | | | 49,296 | |
| 100,000 | | | | Weingarten Realty Investors | | | | | 3.500 | | | | 04/15/23 | | | | 98,288 | |
| 100,000 | | | | Weingarten Realty Investors | | | | | 4.450 | | | | 01/15/24 | | | | 101,746 | |
| 100,000 | | | | Weingarten Realty Investors | | | | | 3.850 | | | | 06/01/25 | | | | 97,475 | |
| 100,000 | | | | Weingarten Realty Investors | | | | | 3.250 | | | | 08/15/26 | | | | 92,596 | |
| 25,000 | | | | Welltower, Inc | | | | | 4.000 | | | | 06/01/25 | | | | 24,684 | |
| | | | | | | | | | | | | | | | | | |
| | | | TOTAL REAL ESTATE | | | | | | | | 4,220,868 | |
| | | | | | | | | | | | | |
| | | | |
RETAILING - 0.9% | | | | | | | | | | | | | | |
| 25,000 | | | | Asbury Automotive Group, Inc | | | | | 6.000 | | | | 12/15/24 | | | | 23,937 | |
| 50,000 | | | | AutoNation, Inc | | | | | 3.800 | | | | 11/15/27 | | | | 44,600 | |
| 300,000 | | | | AutoZone, Inc | | | | | 2.500 | | | | 04/15/21 | | | | 293,350 | |
| 200,000 | | | | Home Depot, Inc | | | | | 2.000 | | | | 04/01/21 | | | | 196,041 | |
| 150,000 | | | | Home Depot, Inc | | | | | 3.350 | | | | 09/15/25 | | | | 148,163 | |
| 100,000 | | | | Home Depot, Inc | | | | | 3.000 | | | | 04/01/26 | | | | 96,721 | |
| 100,000 | | | | Home Depot, Inc | | | | | 4.500 | | | | 12/06/48 | | | | 103,516 | |
| 100,000 | | | | Home Depot, Inc | | | | | 3.500 | | | | 09/15/56 | | | | 84,227 | |
| 40,000 | | | | Men’s Wearhouse, Inc | | | | | 7.000 | | | | 07/01/22 | | | | 40,200 | |
| 125,000 | | | | O’Reilly Automotive, Inc | | | | | 3.600 | | | | 09/01/27 | | | | 119,161 | |
| 100,000 | | †,g | | PetSmart, Inc | | | | | 7.125 | | | | 03/15/23 | | | | 58,250 | |
| 125,000 | | g | | Rolls-Royce plc | | | | | 2.375 | | | | 10/14/20 | | | | 122,946 | |
| 100,000 | | g | | Rolls-Royce plc | | | | | 3.625 | | | | 10/14/25 | | | | 95,872 | |
| 100,000 | | g | | Staples, Inc | | | | | 8.500 | | | | 09/15/25 | | | | 90,220 | |
| 125,000 | | | | Target Corp | | | | | 3.625 | | | | 04/15/46 | | | | 109,611 | |
| | | | | | | | | | | | | | | | | | |
| | | | TOTAL RETAILING | | | | | | | | 1,626,815 | |
| | | | | | | | | | | | | |
|
SEMICONDUCTORS & SEMICONDUCTOR EQUIPMENT - 0.3% | |
| 300,000 | | | | Intel Corp | | | | | 2.875 | | | | 05/11/24 | | | | 292,653 | |
| 70,000 | | | | Intel Corp | | | | | 2.600 | | | | 05/19/26 | | | | 65,572 | |
| 25,000 | | | | Intel Corp | | | | | 3.734 | | | | 12/08/47 | | | | 23,139 | |
94
TIAA-CREF LIFE FUNDS-Bond Fund
| | | | | | | | | | | | | | | | | | |
PRINCIPAL | | | | ISSUER | | | | RATE | | | MATURITY
DATE | | | VALUE | |
| | | | | | | | | | | | | | | | |
| $ 100,000 | | | | Texas Instruments, Inc | | | | | 2.625 | % | | | 05/15/24 | | | $ | 96,629 | |
| 25,000 | | | | Texas Instruments, Inc | | | | | 4.150 | | | | 05/15/48 | | | | 24,983 | |
| | | | | | | | | | | | | | | | | | |
| | | | TOTAL SEMICONDUCTORS & SEMICONDUCTOR EQUIPMENT | | | | | | | | 502,976 | |
| | | | | | | | | | | | | |
|
SOFTWARE & SERVICES - 1.0% | |
| 100,000 | | | | Activision Blizzard, Inc | | | | | 2.300 | | | | 09/15/21 | | | | 97,385 | |
| 75,000 | | | | Activision Blizzard, Inc | | | | | 3.400 | | | | 09/15/26 | | | | 70,483 | |
| 100,000 | | | | IHS Markit Ltd | | | | | 4.125 | | | | 08/01/23 | | | | 98,980 | |
| 100,000 | | | | IHS Markit Ltd | | | | | 4.750 | | | | 08/01/28 | | | | 97,628 | |
| 400,000 | | | | Microsoft Corp | | | | | 2.400 | | | | 08/08/26 | | | | 374,322 | |
| 100,000 | | | | Microsoft Corp | | | | | 4.100 | | | | 02/06/37 | | | | 102,810 | |
| 110,000 | | | | Microsoft Corp | | | | | 3.700 | | | | 08/08/46 | | | | 105,895 | |
| 100,000 | | | | NCR Corp | | | | | 5.875 | | | | 12/15/21 | | | | 97,500 | |
| 125,000 | | | | Oracle Corp | | | | | 2.500 | | | | 05/15/22 | | | | 122,350 | |
| 275,000 | | | | Oracle Corp | | | | | 2.650 | | | | 07/15/26 | | | | 254,994 | |
| 100,000 | | | | Oracle Corp | | | | | 3.800 | | | | 11/15/37 | | | | 93,625 | |
| 125,000 | | | | Oracle Corp | | | | | 4.000 | | | | 11/15/47 | | | | 116,492 | |
| 75,000 | | g | | Refinitiv US Holdings | | | | | 8.250 | | | | 11/15/26 | | | | 68,531 | |
| 100,000 | | | | salesforce.com, Inc | | | | | 3.700 | | | | 04/11/28 | | | | 100,588 | |
| 125,000 | | | | Total System Services, Inc | | | | | 4.450 | | | | 06/01/28 | | | | 122,741 | |
| | | | | | | | | | | | | | | | | | |
| | | | TOTAL SOFTWARE & SERVICES | | | | | | | | 1,924,324 | |
| | | | | | | | | | | | | |
|
TECHNOLOGY HARDWARE & EQUIPMENT - 1.2% | |
| 200,000 | | | | Amphenol Corp | | | | | 3.125 | | | | 09/15/21 | | | | 198,199 | |
| 275,000 | | | | Apple, Inc | | | | | 2.450 | | | | 08/04/26 | | | | 254,299 | |
| 500,000 | | | | Apple, Inc | | | | | 3.200 | | | | 05/11/27 | | | | 482,813 | |
| 75,000 | | | | Broadcom Corp | | | | | 3.875 | | | | 01/15/27 | | | | 67,327 | |
| 50,000 | | | | Broadcom Corp | | | | | 3.500 | | | | 01/15/28 | | | | 43,346 | |
| 250,000 | | | | Cisco Systems, Inc | | | | | 1.850 | | | | 09/20/21 | | | | 243,079 | |
| 75,000 | | g | | CommScope, Inc | | | | | 5.500 | | | | 06/15/24 | | | | 68,625 | |
| 100,000 | | | | Corning, Inc | | | | | 4.375 | | | | 11/15/57 | | | | 83,681 | |
| 225,000 | | g | | Dell International LLC | | | | | 4.420 | | | | 06/15/21 | | | | 224,769 | |
| 100,000 | | g | | Dell International LLC | | | | | 6.020 | | | | 06/15/26 | | | | 100,498 | |
| 100,000 | | | | L3 Technologies, Inc | | | | | 3.850 | | | | 06/15/23 | | | | 100,149 | |
| 100,000 | | | | Motorola Solutions, Inc | | | | | 4.600 | | | | 02/23/28 | | | | 97,835 | |
| 100,000 | | g | | NXP BV | | | | | 4.875 | | | | 03/01/24 | | | | 100,439 | |
| 150,000 | | | | Tyco Electronics Group S.A. | | | | | 3.500 | | | | 02/03/22 | | | | 150,130 | |
| 100,000 | | | | Tyco Electronics Group S.A. | | | | | 3.700 | | | | 02/15/26 | | | | 97,264 | |
| | | | | | | | | | | | | | | | | | |
| | | | TOTAL TECHNOLOGY HARDWARE & EQUIPMENT | | | | | | | | 2,312,453 | |
| | | | | | | | | | | | | |
| | | |
TELECOMMUNICATION SERVICES - 1.6% | | | | | | | | | | | | |
| 450,000 | | | | AT&T, Inc | | | | | 3.400 | | | | 05/15/25 | | | | 423,007 | |
| 300,000 | | | | AT&T, Inc | | | | | 4.300 | | | | 02/15/30 | | | | 283,688 | |
| 150,000 | | | | AT&T, Inc | | | | | 4.500 | | | | 05/15/35 | | | | 134,803 | |
| 125,000 | | | | AT&T, Inc | | | | | 5.150 | | | | 11/15/46 | | | | 116,307 | |
| 100,000 | | | | AT&T, Inc | | | | | 4.500 | | | | 03/09/48 | | | | 86,218 | |
| 200,000 | | g | | C&W Senior Financing Designated Activity Co | | | | | 7.500 | | | | 10/15/26 | | | | 192,250 | |
| 50,000 | | | | Deutsche Telekom International Finance BV | | | | | 8.750 | | | | 06/15/30 | | | | 65,253 | |
| 200,000 | | g | | ENTEL Chile S.A. | | | | | 4.875 | | | | 10/30/24 | | | | 194,613 | |
| 50,000 | | | | France Telecom S.A. | | | | | 5.375 | | | | 01/13/42 | | | | 52,833 | |
| 200,000 | | g | | MTN Mauritius Investment Ltd | | | | | 6.500 | | | | 10/13/26 | | | | 195,012 | |
| 100,000 | | | | Telefonica Emisiones SAU | | | | | 4.103 | | | | 03/08/27 | | | | 96,424 | |
| 50,000 | | | | T-Mobile USA, Inc | | | | | 6.375 | | | | 03/01/25 | | | | 50,623 | |
| 100,000 | | | | Verizon Communications, Inc | | | | | 3.376 | | | | 02/15/25 | | | | 97,020 | |
| 683,000 | | | | Verizon Communications, Inc | | | | | 4.329 | | | | 09/21/28 | | | | 686,230 | |
| 258,000 | | | | Verizon Communications, Inc | | | | | 4.272 | | | | 01/15/36 | | | | 241,713 | |
| 100,000 | | | | Verizon Communications, Inc | | | | | 4.125 | | | | 08/15/46 | | | | 88,350 | |
| 150,000 | | | | Vodafone Group plc | | | | | 4.375 | | | | 05/30/28 | | | | 145,597 | |
| | | | | | | | | | | | | | | | | | |
| | | | TOTAL TELECOMMUNICATION SERVICES | | | | | | | | 3,149,941 | |
| | | | | | | | | | | | | |
95
TIAA-CREF LIFE FUNDS-Bond Fund
| | | | | | | | | | | | | | | | | | |
PRINCIPAL | | | | ISSUER | | | | RATE | | | MATURITY
DATE | | | VALUE | |
| | | | | | | | | | | | | | | | |
TRANSPORTATION - 1.1% | | | | | | | | | | | | |
| $ 100,000 | | | | CSX Corp | | | | | 3.800 | % | | | 03/01/28 | | | $ | 98,170 | |
| 100,000 | | | | CSX Corp | | | | | 4.250 | | | | 03/15/29 | | | | 101,595 | |
| 100,000 | | | | CSX Corp | | | | | 3.800 | | | | 11/01/46 | | | | 88,201 | |
| 200,000 | | | | CSX Corp | | | | | 4.300 | | | | 03/01/48 | | | | 190,694 | |
| 200,000 | | | | Delta Air Lines, Inc | | | | | 3.625 | | | | 03/15/22 | | | | 195,709 | |
| 125,000 | | | | Delta Air Lines, Inc | | | | | 3.800 | | | | 04/19/23 | | | | 122,993 | |
| 200,000 | | g | | DP World Ltd | | | | | 5.625 | | | | 09/25/48 | | | | 188,000 | |
| 100,000 | | | | FedEx Corp | | | | | 4.100 | | | | 02/01/45 | | | | 86,306 | |
| 100,000 | | | | FedEx Corp | | | | | 4.050 | | | | 02/15/48 | | | | 83,882 | |
| 200,000 | | | | Kansas City Southern | | | | | 2.350 | | | | 05/15/20 | | | | 196,973 | |
| 100,000 | | | | Norfolk Southern Corp | | | | | 4.150 | | | | 02/28/48 | | | | 93,444 | |
| 175,000 | | | | Northrop Grumman Corp | | | | | 3.250 | | | | 01/15/28 | | | | 163,620 | |
| 100,000 | | | | Northrop Grumman Corp | | | | | 4.030 | | | | 10/15/47 | | | | 91,082 | |
| 200,000 | | g | | Pelabuhan Indonesia III Persero PT | | | | | 4.500 | | | | 05/02/23 | | | | 196,364 | |
| 100,000 | | | | Union Pacific Corp | | | | | 3.950 | | | | 09/10/28 | | | | 99,926 | |
| 125,000 | | | | Union Pacific Corp | | | | | 4.500 | | | | 09/10/48 | | | | 123,433 | |
| | | | | | | | | | | | | | | | | | |
| | | | TOTAL TRANSPORTATION | | | | | | | | 2,120,392 | |
| | | | | | | | | | | | | |
| | | |
UTILITIES - 3.5% | | | | | | | | | | | | |
| 100,000 | | | | AEP Transmission Co LLC | | | | | 3.100 | | | | 12/01/26 | | | | 96,673 | |
| 100,000 | | | | AEP Transmission Co LLC | | | | | 4.000 | | | | 12/01/46 | | | | 95,619 | |
| 50,000 | | | | AES Corp | | | | | 4.875 | | | | 05/15/23 | | | | 48,875 | |
| 200,000 | | | | AGL Capital Corp | | | | | 3.875 | | | | 11/15/25 | | | | 197,502 | |
| 100,000 | | | | Alabama Power Co | | | | | 4.150 | | | | 08/15/44 | | | | 97,969 | |
| 100,000 | | | | American Water Capital Corp | | | | | 3.000 | | | | 12/01/26 | | | | 94,768 | |
| 100,000 | | | | American Water Capital Corp | | | | | 4.000 | | | | 12/01/46 | | | | 94,324 | |
| 150,000 | | | | American Water Capital Corp | | | | | 3.750 | | | | 09/01/47 | | | | 134,983 | |
| 75,000 | | | | Atmos Energy Corp | | | | | 8.500 | | | | 03/15/19 | | | | 75,821 | |
| 125,000 | | | | Baltimore Gas & Electric Co | | | | | 3.750 | | | | 08/15/47 | | | | 114,794 | |
| 50,000 | | | | Berkshire Hathaway Energy Co | | | | | 3.250 | | | | 04/15/28 | | | | 47,593 | |
| 200,000 | | | | Black Hills Corp | | | | | 4.250 | | | | 11/30/23 | | | | 201,751 | |
| 100,000 | | | | Black Hills Corp | | | | | 3.150 | | | | 01/15/27 | | | | 93,666 | |
| 75,000 | | g | | Calpine Corp | | | | | 5.250 | | | | 06/01/26 | | | | 68,437 | |
| 200,000 | | | | Carolina Power & Light Co | | | | | 5.300 | | | | 01/15/19 | | | | 200,133 | |
| 25,000 | | g | | Clearway Energy Operating LLC | | | | | 5.750 | | | | 10/15/25 | | | | 23,875 | |
| 100,000 | | | | CMS Energy Corp | | | | | 3.600 | | | | 11/15/25 | | | | 98,356 | |
| 25,000 | | | | Connecticut Light & Power Co | | | | | 5.500 | | | | 02/01/19 | | | | 25,039 | |
| 100,000 | | | | Consolidated Edison, Inc | | | | | 2.000 | | | | 05/15/21 | | | | 97,011 | |
| 100,000 | | | | DTE Electric Co | | | | | 3.750 | | | | 08/15/47 | | | | 93,163 | |
| 15,000 | | | | Duke Energy Carolinas LLC | | | | | 4.300 | | | | 06/15/20 | | | | 15,289 | |
| 100,000 | | | | Duke Energy Corp | | | | | 1.800 | | | | 09/01/21 | | | | 95,711 | |
| 150,000 | | | | Duke Energy Corp | | | | | 2.650 | | | | 09/01/26 | | | | 136,633 | |
| 100,000 | | | | Entergy Corp | | | | | 2.950 | | | | 09/01/26 | | | | 92,306 | |
| 200,000 | | g | | Eskom Holdings SOC Ltd | | | | | 6.350 | | | | 08/10/28 | | | | 192,719 | |
| 200,000 | | g | | Eskom Holdings SOC Ltd | | | | | 8.450 | | | | 08/10/28 | | | | 188,221 | |
| 175,000 | | | | Exelon Generation Co LLC | | | | | 3.400 | | | | 03/15/22 | | | | 172,235 | |
| 150,000 | | | | Fortis, Inc | | | | | 3.055 | | | | 10/04/26 | | | | 137,006 | |
| 100,000 | | | | Indiana Michigan Power Co | | | | | 3.750 | | | | 07/01/47 | | | | 91,394 | |
| 25,000 | | | | Integrys Energy Group, Inc | | | | | 4.170 | | | | 11/01/20 | | | | 25,341 | |
| 200,000 | | g | | Israel Electric Corp Ltd | | | | | 4.250 | | | | 08/14/28 | | | | 190,409 | |
| 100,000 | | | | LG&E and KU Energy LLC | | | | | 3.750 | | | | 11/15/20 | | | | 100,367 | |
| 125,000 | | | | MidAmerican Energy Co | | | | | 3.650 | | | | 08/01/48 | | | | 115,234 | |
| 200,000 | | g | | Minejesa Capital BV | | | | | 4.625 | | | | 08/10/30 | | | | 178,525 | |
| 250,000 | | | | NextEra Energy Capital Holdings, Inc | | | | | 3.550 | | | | 05/01/27 | | | | 238,694 | |
| 125,000 | | | | NiSource Finance Corp | | | | | 3.490 | | | | 05/15/27 | | | | 119,347 | |
| 100,000 | | | | NRG Energy, Inc | | | | | 6.250 | | | | 05/01/24 | | | | 101,500 | |
| 50,000 | | | | NRG Energy, Inc | | | | | 5.750 | | | | 01/15/28 | | | | 48,000 | |
| 125,000 | | | | Ohio Power Co | | | | | 4.150 | | | | 04/01/48 | | | | 123,532 | |
| 125,000 | | | | Oncor Electric Delivery Co LLC | | | | | 2.150 | | | | 06/01/19 | | | | 124,628 | |
| 100,000 | | | | Pacific Gas & Electric Co | | | | | 3.750 | | | | 08/15/42 | | | | 74,275 | |
| 125,000 | | | | Pacific Gas & Electric Co | | | | | 4.250 | | | | 03/15/46 | | | | 97,244 | |
| 300,000 | | | | PPL Capital Funding, Inc | | | | | 4.200 | | | | 06/15/22 | | | | 303,652 | |
96
TIAA-CREF LIFE FUNDS-Bond Fund
| | | | | | | | | | | | | | | | | | |
PRINCIPAL | | | | ISSUER | | | | RATE | | | MATURITY
DATE | | | VALUE | |
| | | | | | | | | | | | | | | | |
| $ 250,000 | | | | PPL Electric Utilities Corp | | | | | 3.000 | % | | | 09/15/21 | | | $ | 250,442 | |
| 50,000 | | | | Progress Energy, Inc | | | | | 7.050 | | | | 03/15/19 | | | | 50,378 | |
| 175,000 | | | | PSEG Power LLC | | | | | 3.850 | | | | 06/01/23 | | | | 175,132 | |
| 80,000 | | | | Public Service Co of Colorado | | | | | 4.750 | | | | 08/15/41 | | | | 83,176 | |
| 100,000 | | | | Public Service Co of Oklahoma | | | | | 5.150 | | | | 12/01/19 | | | | 101,841 | |
| 125,000 | | | | Sempra Energy | | | | | 2.875 | | | | 10/01/22 | | | | 120,547 | |
| 100,000 | | | | Southern California Edison Co | | | | | 4.125 | | | | 03/01/48 | | | | 94,813 | |
| 100,000 | | | | Southern Co Gas Capital Corp | | | | | 3.950 | | | | 10/01/46 | | | | 87,661 | |
| 150,000 | | | | Southern Power Co | | | | | 2.500 | | | | 12/15/21 | | | | 145,675 | |
| 150,000 | | | | Southern Power Co | | | | | 4.150 | | | | 12/01/25 | | | | 148,712 | |
| 150,000 | | | | Southwest Gas Corp | | | | | 3.700 | | | | 04/01/28 | | | | 149,287 | |
| 55,000 | | | | Virginia Electric & Power Co | | | | | 2.950 | | | | 01/15/22 | | | | 54,408 | |
| 75,000 | | | | Virginia Electric & Power Co | | | | | 2.950 | | | | 11/15/26 | | | | 71,112 | |
| 50,000 | | | | Virginia Electric & Power Co | | | | | 3.500 | | | | 03/15/27 | | | | 49,268 | |
| 100,000 | | | | Xcel Energy, Inc | | | | | 3.350 | | | | 12/01/26 | | | | 97,072 | |
| 35,000 | | | | Xcel Energy, Inc | | | | | 4.800 | | | | 09/15/41 | | | | 35,663 | |
| | | | | | | | | | | | | | | | | | |
| | | | TOTAL UTILITIES | | | | | | | | 6,677,801 | |
| | | | | | | | | | | | | |
| | | | TOTAL CORPORATE BONDS | | | | | | | | | | | 71,711,637 | |
| | | | | | | | | | | | | | | | | | |
| | | | (Cost $74,181,105) | | | | | | | | | | | | | | |
| | | | |
GOVERNMENT BONDS - 34.2% | | | | | | | | | | | | | | |
| | | | |
AGENCY SECURITIES - 0.2% | | | | | | | | | | | | | | |
| 400,000 | | | | Private Export Funding Corp (PEFCO) | | | | | 2.250 | | | | 03/15/20 | | | | 398,017 | |
| | | | | | | | | | | | | | | | | | |
| | | | TOTAL AGENCY SECURITIES | | | | | | | | 398,017 | |
| | | | | | | | | | | | | |
| | | | |
FOREIGN GOVERNMENT BONDS - 3.2% | | | | | | | | | | | | | | |
| 200,000 | | | | Argentina Republic Government International Bond | | | | | 5.625 | | | | 01/26/22 | | | | 168,750 | |
| 200,000 | | g | | Bermuda Government International Bond | | | | | 3.717 | | | | 01/25/27 | | | | 190,234 | |
| 250,000 | | g | | Bermuda Government International Bond | | | | | 4.750 | | | | 02/15/29 | | | | 254,062 | |
| 150,000 | | g | | Caisse d’Amortissement de la Dette Sociale | | | | | 1.875 | | | | 07/28/20 | | | | 148,022 | |
| 200,000 | | | | Colombia Government International Bond | | | | | 5.000 | | | | 06/15/45 | | | | 190,400 | |
| 200,000 | | g | | Costa Rica Government International Bond | | | | | 7.158 | | | | 03/12/45 | | | | 172,250 | |
| 225,000 | | g | | Ecuador Government International Bond | | | | | 9.650 | | | | 12/13/26 | | | | 204,750 | |
| 200,000 | | g | | Egypt Government International Bond | | | | | 5.577 | | | | 02/21/23 | | | | 189,908 | |
| 100,000 | | | | European Investment Bank | | | | | 4.875 | | | | 02/15/36 | | | | 122,566 | |
| 200,000 | | g | | Export-Import Bank of India | | | | | 3.875 | | | | 02/01/28 | | | | 188,491 | |
| 250,000 | | g | | Guatemala Government International Bond | | | | | 4.500 | | | | 05/03/26 | | | | 234,375 | |
| EUR 170,000 | | g | | Hellenic Republic Government International Bond | | | | | 3.375 | | | | 02/15/25 | | | | 188,200 | |
| $ 200,000 | | | | Japan Bank for International Cooperation | | | | | 2.375 | | | | 04/20/26 | | | | 191,129 | |
| 1,000,000 | | | | KFW | | | | | 2.750 | | | | 10/01/20 | | | | 1,001,985 | |
| 250,000 | | g | | Korea Housing Finance Corp | | | | | 2.000 | | | | 10/11/21 | | | | 240,934 | |
| 100,000 | | | | Mexico Government International Bond | | | | | 4.000 | | | | 10/02/23 | | | | 99,531 | |
| 250,000 | | | | Mexico Government International Bond | | | | | 4.150 | | | | 03/28/27 | | | | 241,728 | |
| 200,000 | | | | Mexico Government International Bond | | | | | 4.750 | | | | 03/08/44 | | | | 181,800 | |
| 100,000 | | g | | Nigeria Government International Bond | | | | | 7.143 | | | | 02/23/30 | | | | 88,542 | |
| 200,000 | | | | Panama Government International Bond | | | | | 4.500 | | | | 05/15/47 | | | | 194,250 | |
| 200,000 | | g | | Perusahaan Penerbit SBSN Indonesia III | | | | | 3.400 | | | | 03/29/22 | | | | 195,500 | |
| 200,000 | | g | | Perusahaan Penerbit SBSN Indonesia III | | | | | 4.400 | | | | 03/01/28 | | | | 195,194 | |
| 125,000 | | | | Peruvian Government International Bond | | | | | 5.625 | | | | 11/18/50 | | | | 146,750 | |
| 150,000 | | g | | Provincia de Buenos Aires | | | | | 7.875 | | | | 06/15/27 | | | | 108,001 | |
| 200,000 | | g | | Provincia de Mendoza Argentina | | | | | 8.375 | | | | 05/19/24 | | | | 162,000 | |
| 226,000 | | g | | Romanian Government International Bond | | | | | 5.125 | | | | 06/15/48 | | | | 218,336 | |
| 200,000 | | g | | Senegal Government International Bond | | | | | 6.750 | | | | 03/13/48 | | | | 165,866 | |
| UYU 2,765,000 | | g | | Uruguay Government International Bond | | | | | 9.875 | | | | 06/20/22 | | | | 84,234 | |
| $ 70,000 | | | | Uruguay Government International Bond | | | | | 5.100 | | | | 06/18/50 | | | | 68,705 | |
| 200,000 | | g | | Zambia Government International Bond | | | | | 8.500 | | | | 04/14/24 | | | | 148,856 | |
| | | | | | | | | | | | | | | | | | |
| | | | TOTAL FOREIGN GOVERNMENT BONDS | | | | | | | | 5,985,349 | |
| | | | | | | | | | | | | |
97
TIAA-CREF LIFE FUNDS-Bond Fund
| | | | | | | | | | | | | | | | | | |
PRINCIPAL | | | | ISSUER | | | | RATE | | | MATURITY
DATE | | | VALUE | |
| | | | | | | | | | | | | | | | |
MORTGAGE BACKED - 16.3% | | | | | | | | | | | | | | |
| $ 204,030 | | | | Federal Home Loan Mortgage Corp (FHLMC) | | | | | 3.500 | % | | | 08/15/43 | | | $ | 208,036 | |
| 82,514 | | | | FHLMC | | | | | 3.500 | | | | 09/15/44 | | | | 83,497 | |
| 270,680 | | i | | FHLMC | | | | | 5.992 | | | | 06/15/48 | | | | 296,559 | |
| 402,683 | | i | | FHLMC | | | | | 5.912 | | | | 10/15/48 | | | | 436,319 | |
| 39,847 | | | | Federal Home Loan Mortgage Corp Gold (FGLMC) | | | | | 5.000 | | | | 06/01/36 | | | | 42,289 | |
| 13,541 | | | | FGLMC | | | | | 5.000 | | | | 07/01/39 | | | | 14,334 | |
| 313,805 | | | | FGLMC | | | | | 3.500 | | | | 04/01/45 | | | | 315,315 | |
| 1,261,934 | | | | FGLMC | | | | | 3.500 | | | | 10/01/45 | | | | 1,267,715 | |
| 404,890 | | | | FGLMC | | | | | 4.000 | | | | 12/01/45 | | | | 415,740 | |
| 437,128 | | | | FGLMC | | | | | 3.500 | | | | 08/01/46 | | | | 439,673 | |
| 1,325,158 | | | | FGLMC | | | | | 3.000 | | | | 01/01/47 | | | | 1,292,244 | |
| 1,496,209 | | | | FGLMC | | | | | 3.000 | | | | 02/01/47 | | | | 1,459,622 | |
| 19,939 | | | | FGLMC | | | | | 4.500 | | | | 06/01/47 | | | | 21,051 | |
| 575,033 | | | | FGLMC | | | | | 4.000 | | | | 09/01/47 | | | | 590,066 | |
| 748,466 | | | | FGLMC | | | | | 3.500 | | | | 03/01/48 | | | | 750,738 | |
| 228,237 | | | | FGLMC | | | | | 4.000 | | | | 03/01/48 | | | | 234,165 | |
| 193,977 | | | | FGLMC | | | | | 4.000 | | | | 07/01/48 | | | | 199,001 | |
| 266,351 | | | | FGLMC | | | | | 4.500 | | | | 08/01/48 | | | | 278,982 | |
| 25,130 | | | | Federal National Mortgage Association (FNMA) | | | | | 6.000 | | | | 08/01/21 | | | | 25,767 | |
| 87,366 | | | | FNMA | | | | | 3.500 | | | | 01/01/26 | | | | 88,528 | |
| 208,152 | | | | FNMA | | | | | 3.500 | | | | 06/01/32 | | | | 212,086 | |
| 800,457 | | | | FNMA | | | | | 3.500 | | | | 07/01/32 | | | | 810,768 | |
| 143,217 | | | | FNMA | | | | | 3.000 | | | | 11/01/32 | | | | 142,980 | |
| 151,622 | | | | FNMA | | | | | 5.000 | | | | 05/01/35 | | | | 161,035 | |
| 7,308 | | | | FNMA | | | | | 7.500 | | | | 07/01/35 | | | | 7,327 | |
| 205,316 | | | | FNMA | | | | | 5.000 | | | | 02/01/36 | | | | 218,100 | |
| 94,321 | | | | FNMA | | | | | 5.000 | | | | 07/01/41 | | | | 100,161 | |
| 62,622 | | | | FNMA | | | | | 4.500 | | | | 03/01/44 | | | | 65,455 | |
| 334,832 | | | | FNMA | | | | | 4.500 | | | | 10/01/44 | | | | 349,960 | |
| 679,254 | | | | FNMA | | | | | 4.500 | | | | 11/01/44 | | | | 710,287 | |
| 114,077 | | | | FNMA | | | | | 5.000 | | | | 11/01/44 | | | | 121,124 | |
| 79,093 | | | | FNMA | | | | | 3.000 | | | | 02/25/45 | | | | 79,030 | |
| 451,782 | | | | FNMA | | | | | 3.000 | | | | 02/25/45 | | | | 451,405 | |
| 1,439,970 | | | | FNMA | | | | | 3.000 | | | | 12/25/45 | | | | 1,427,482 | |
| 783,533 | | | | FNMA | | | | | 3.500 | | | | 01/01/46 | | | | 786,957 | |
| 502,326 | | | | FNMA | | | | | 4.000 | | | | 01/01/46 | | | | 516,392 | |
| 317,458 | | | | FNMA | | | | | 3.000 | | | | 11/01/46 | | | | 309,961 | |
| 885,650 | | | | FNMA | | | | | 3.500 | | | | 12/01/46 | | | | 887,812 | |
| 828,191 | | | | FNMA | | | | | 3.500 | | | | 01/01/47 | | | | 829,064 | |
| 323,376 | | | | FNMA | | | | | 3.500 | | | | 11/01/47 | | | | 323,568 | |
| 236,163 | | | | FNMA | | | | | 4.500 | | | | 01/01/48 | | | | 247,522 | |
| 227,437 | | | | FNMA | | | | | 4.500 | | | | 02/01/48 | | | | 238,365 | |
| 1,089,366 | | | | FNMA | | | | | 3.000 | | | | 02/25/48 | | | | 1,078,715 | |
| 209,205 | | | | FNMA | | | | | 4.000 | | | | 03/01/48 | | | | 214,691 | |
| 988,122 | | | | FNMA | | | | | 4.500 | | | | 03/01/48 | | | | 1,035,598 | |
| 3,351,163 | | | | FNMA | | | | | 4.000 | | | | 04/01/48 | | | | 3,429,488 | |
| 190,873 | | | | FNMA | | | | | 4.500 | | | | 05/01/48 | | | | 200,045 | |
| 142,988 | | | | FNMA | | | | | 4.500 | | | | 05/01/48 | | | | 149,991 | |
| 676,360 | | h | | FNMA | | | | | 4.000 | | | | 06/01/48 | | | | 689,832 | |
| 258,989 | | | | FNMA | | | | | 5.000 | | | | 08/01/48 | | | | 276,603 | |
| 478,088 | | | | FNMA | | | | | 4.500 | | | | 12/01/48 | | | | 495,359 | |
| 497,934 | | | | FNMA | | | | | 5.000 | | | | 12/01/48 | | | | 522,329 | |
| 7,062 | | | | Government National Mortgage Association (GNMA) | | | | | 5.000 | | | | 03/15/34 | | | | 7,343 | |
| 51,083 | | | | GNMA | | | | | 5.000 | | | | 06/15/34 | | | | 53,155 | |
| 6,184 | | | | GNMA | | | | | 5.000 | | | | 04/15/38 | | | | 6,560 | |
| 2,932 | | | | GNMA | | | | | 6.000 | | | | 08/20/38 | | | | 3,186 | |
| 18,657 | | | | GNMA | | | | | 4.500 | | | | 04/15/40 | | | | 19,491 | |
| 366,835 | | | | GNMA | | | | | 4.000 | | | | 06/20/46 | | | | 58,708 | |
| 907,220 | | | | GNMA | | | | | 3.000 | | | | 12/20/47 | | | | 892,855 | |
98
TIAA-CREF LIFE FUNDS-Bond Fund
| | | | | | | | | | | | | | | | | | |
PRINCIPAL | | | | ISSUER | | REFERENCE
RATE & SPREAD | | RATE | | | MATURITY
DATE | | | VALUE | |
| | | | | | | | | | | | | | | | |
| $1,238,141 | | | | GNMA | | | | | 3.500 | % | | | 12/20/47 | | | $ | 1,247,163 | |
| 848,482 | | | | GNMA | | | | | 3.000 | | | | 01/20/48 | | | | 835,047 | |
| 1,445,872 | | | | GNMA | | | | | 3.500 | | | | 01/20/48 | | | | 1,456,407 | |
| 675,000 | | | | GNMA | | | | | 4.000 | | | | 12/20/48 | | | | 688,631 | |
| | | | | | | | | | | | | | | | | | |
| | | | TOTAL MORTGAGE BACKED | | | | 30,817,679 | |
| | | | | | | | | | | | | | | | | | |
|
MUNICIPAL BONDS - 1.5% | |
| 100,000 | | | | Commonwealth Financing Authority | | | | | 3.864 | | | | 06/01/38 | | | | 98,618 | |
| 1,750,000 | | | | State of Illinois | | | | | 5.100 | | | | 06/01/33 | | | | 1,668,503 | |
| 1,000,000 | | | | State of Texas | | | | | 3.295 | | | | 10/01/25 | | | | 1,013,080 | |
| | | | | | | | | | | | | | | | | | |
| | | | TOTAL MUNICIPAL BONDS | | | | | | | | 2,780,201 | |
| | | | | | | | | | | | | | | | | | |
|
U.S. TREASURY SECURITIES - 13.0% | |
| 100,000 | | | | United States Treasury Bond | | | | | 3.500 | | | | 02/15/39 | | | | 109,528 | |
| 1,000,000 | | | | United States Treasury Bond | | | | | 3.125 | | | | 11/15/41 | | | | 1,025,592 | |
| 2,935,700 | | | | United States Treasury Bond | | | | | 3.000 | | | | 11/15/45 | | | | 2,934,923 | |
| 290,000 | | | | United States Treasury Bond | | | | | 2.500 | | | | 05/15/46 | | | | 262,020 | |
| 1,865,000 | | | | United States Treasury Bond | | | | | 2.875 | | | | 11/15/46 | | | | 1,816,621 | |
| 765,000 | | | | United States Treasury Bond | | | | | 3.000 | | | | 05/15/47 | | | | 763,065 | |
| 2,060,000 | | | | United States Treasury Bond | | | | | 3.125 | | | | 05/15/48 | | | | 2,102,727 | |
| 1,610,000 | | | | United States Treasury Bond | | | | | 3.000 | | | | 08/15/48 | | | | 1,605,160 | |
| 300,000 | | | | United States Treasury Bond | | | | | 3.375 | | | | 11/15/48 | | | | 321,351 | |
| 900,000 | | | | United States Treasury Note | | | | | 1.125 | | | | 01/31/19 | | | | 899,139 | |
| 75,000 | | | | United States Treasury Note | | | | | 1.125 | | | | 02/28/19 | | | | 74,849 | |
| 8,000 | | | | United States Treasury Note | | | | | 1.375 | | | | 09/30/19 | | | | 7,926 | |
| 45,000 | | | | United States Treasury Note | | | | | 1.500 | | | | 10/31/19 | | | | 44,580 | |
| 70,000 | | | | United States Treasury Note | | | | | 1.750 | | | | 11/30/19 | | | | 69,450 | |
| 100,000 | | | | United States Treasury Note | | | | | 1.625 | | | | 03/15/20 | | | | 98,880 | |
| 485,000 | | | | United States Treasury Note | | | | | 2.500 | | | | 05/31/20 | | | | 484,533 | |
| 1,000,000 | | | | United States Treasury Note | | | | | 2.750 | | | | 11/30/20 | | | �� | 1,004,343 | |
| 2,590,000 | | | | United States Treasury Note | | | | | 2.625 | | | | 12/15/21 | | | | 2,601,512 | |
| 175,000 | | | | United States Treasury Note | | | | | 2.000 | | | | 11/30/22 | | | | 171,820 | |
| 75,000 | | | | United States Treasury Note | | | | | 1.625 | | | | 05/31/23 | | | | 72,255 | |
| 1,780,000 | | | | United States Treasury Note | | | | | 2.875 | | | | 09/30/23 | | | | 1,808,857 | |
| 135,000 | | | | United States Treasury Note | | | | | 2.875 | | | | 10/31/23 | | | | 137,240 | |
| 505,000 | | | | United States Treasury Note | | | | | 2.125 | | | | 03/31/24 | | | | 495,022 | |
| 300,000 | | | | United States Treasury Note | | | | | 2.000 | | | | 04/30/24 | | | | 292,073 | |
| 475,000 | | | | United States Treasury Note | | | | | 2.125 | | | | 09/30/24 | | | | 464,191 | |
| 250,000 | | | | United States Treasury Note | | | | | 2.250 | | | | 10/31/24 | | | | 245,848 | |
| 4,430,000 | | | | United States Treasury Note | | | | | 3.125 | | | | 11/15/28 | | | | 4,598,139 | |
| | | | | | | | | | | | | | | | | | |
| | | | TOTAL U.S. TREASURY SECURITIES | | | | | | | | 24,511,644 | |
| | | | | | | | | | | | | | | | | | |
| | | | TOTAL GOVERNMENT BONDS | | | | | | | | | | | | | 64,492,890 | |
| | | | | | | | | | | | | | | | | | |
| | | | (Cost $65,113,773) | | | | | | | | | | | | | | |
STRUCTURED ASSETS - 22.7% | |
|
ASSET BACKED - 10.3% | |
| 500,000 | | | | American Express Credit Account Master Trust
Series - 2017 7 (Class A) | | | | | 2.350 | | | | 05/15/25 | | | | 491,172 | |
| 200,000 | | | | AmeriCredit Automobile Receivables Trust
Series - 2015 3 (Class D) | | | | | 3.340 | | | | 08/08/21 | | | | 200,650 | |
| 500,000 | | g | | Avis Budget Rental Car Funding AESOP LLC
Series - 2017 2A (Class A) | | | | | 2.970 | | | | 03/20/24 | | | | 489,406 | |
| 850,000 | | g,i | | BlueMountain CLO Ltd
Series - 2018 3A (Class B) | | LIBOR 3 M + 1.770% | | | 4.206 | | | | 10/25/30 | | | | 832,946 | |
| 1,000,000 | | g | | Capital Automotive REIT
Series - 2014 1A (Class A) | | | | | 3.660 | | | | 10/15/44 | | | | 996,635 | |
| 491,667 | | g | | Capital Automotive REIT
Series - 2017 1A (Class A1) | | | | | 3.870 | | | | 04/15/47 | | | | 491,586 | |
| 500,000 | | | | Capital One Multi-Asset Execution Trust
Series - 2017 A6 (Class A6) | | | | | 2.290 | | | | 07/15/25 | | | | 488,217 | |
| 75,000 | | | | CarMax Auto Owner Trust
Series - 2015 2 (Class B) | | | | | 2.150 | | | | 03/15/21 | | | | 74,677 | |
| 55,000 | | | | CarMax Auto Owner Trust
Series - 2015 2 (Class C) | | | | | 2.390 | | | | 03/15/21 | | | | 54,796 | |
99
TIAA-CREF LIFE FUNDS-Bond Fund
| | | | | | | | | | | | | | | | | | |
PRINCIPAL | | | | ISSUER | | REFERENCE
RATE & SPREAD | | RATE | | | MATURITY
DATE | | | VALUE | |
| | | | | | | | | | | | | | | | |
| $ 500,000 | | | | CarMax Auto Owner Trust
Series - 2017 4 (Class A4) | | | | | 2.330 | % | | | 05/15/23 | | | $ | 492,570 | |
| 144,702 | | †,g,i | | CBRE Realty Finance
Series - 2007 1A (Class A2) | | LIBOR 3 M + 0.300% | | | 2.708 | | | | 04/07/52 | | | | 2,004 | |
| 11,486 | | | | Centex Home Equity
Series - 2002 A (Class AF6) | | | | | 5.540 | | | | 01/25/32 | | | | 11,578 | |
| 500,000 | | | | CFCRE Commercial Mortgage Trust
Series - 2016 C7 (Class ASB) | | | | | 3.644 | | | | 12/10/54 | | | | 506,958 | |
| 500,000 | | | | CNH Equipment Trust
Series - 2017 C (Class A4) | | | | | 2.360 | | | | 11/15/24 | | | | 493,315 | |
| 100,000 | | i | | COMM Mortgage Trust
Series - 2015 CR23 (Class C) | | | | | 4.252 | | | | 05/10/48 | | | | 97,534 | |
| 495,000 | | g | | DB Master Finance LLC
Series - 2017 1A (Class A2I) | | | | | 3.629 | | | | 11/20/47 | | | | 478,279 | |
| 487,499 | | g | | Domino’s Pizza Master Issuer LLC
Series - 2015 1A (Class A2II) | | | | | 4.474 | | | | 10/25/45 | | | | 492,028 | |
| 493,750 | | g | | Domino’s Pizza Master Issuer LLC
Series - 2017 1A (Class A2II) | | | | | 3.082 | | | | 07/25/47 | | | | 481,061 | |
| 522,375 | | g | | Domino’s Pizza Master Issuer LLC
Series - 2018 1A (Class A2I) | | | | | 4.116 | | | | 07/25/48 | | | | 515,359 | |
| 500,000 | | g | | Ford Credit Auto Owner Trust
Series - 2017 2 (Class A) | | | | | 2.360 | | | | 03/15/29 | | | | 487,052 | |
| 500,000 | | g | | Ford Credit Auto Owner Trust
Series - 2018 1 (Class A) | | | | | 3.190 | | | | 07/15/31 | | | | 496,106 | |
| 500,000 | | | | Ford Credit Floorplan Master Owner Trust
Series - 2017 2 (Class A1) | | | | | 2.160 | | | | 09/15/22 | | | | 492,601 | |
| 500,000 | | | | Ford Credit Floorplan Master Owner Trust
Series - 2017 3 (Class A) | | | | | 2.480 | | | | 09/15/24 | | | | 490,004 | |
| 145,000 | | g,i | | FREMF Mortgage Trust
Series - 2015 K45 (Class B) | | | | | 3.591 | | | | 04/25/48 | | | | 140,741 | |
| 250,000 | | | | GM Financial Automobile Leasing Trust
Series - 2018 3 (Class A2A) | | | | | 2.890 | | | | 09/21/20 | | | | 249,729 | |
| 500,000 | | g | | GM Financial Consumer Automobile Receivables Trust
Series - 2017 3A (Class A4) | | | | | 2.130 | | | | 03/16/23 | | | | 491,724 | |
| 100,000 | | g | | GMF Floorplan Owner Revolving Trust
Series - 2017 1 (Class A1) | | | | | 2.220 | | | | 01/18/22 | | | | 99,141 | |
| 214,781 | | g | | HERO Funding Trust
Series - 2017 3A (Class A1) | | | | | 3.190 | | | | 09/20/48 | | | | 212,569 | |
| 214,781 | | g | | HERO Funding Trust
Series - 2017 3A (Class A2) | | | | | 3.950 | | | | 09/20/48 | | | | 219,268 | |
| 500,000 | | g | | Hertz Vehicle Financing II LP | | | | | 3.290 | | | | 02/25/24 | | | | 495,622 | |
| | | | Series - 2018 1A (Class A) | | | | | | | | | | | | | | |
| 750,000 | | g,i | | Madison Park Funding Ltd
Series - 2018 29A (Class B) | | LIBOR 3 M + 1.750% | | | 1.000 | | | | 10/18/30 | | | | 733,876 | |
| 24,107 | | i | | Morgan Stanley ABS Capital I, Inc Trust
Series - 2004 NC1 (Class M1) | | LIBOR 1 M + 1.050% | | | 3.266 | | | | 12/27/33 | | | | 23,987 | |
| 713,545 | | g | | MVW Owner Trust
Series - 2017 1A (Class A) | | | | | 2.420 | | | | 12/20/34 | | | | 699,213 | |
| 500,000 | | | | Nissan Auto Lease Trust
Series - 2017 B (Class A3) | | | | | 2.050 | | | | 09/15/20 | | | | 496,332 | |
| 42,652 | | g,i | | Orange Lake Timeshare Trust
Series - 2014 AA (Class B) | | | | | 3.030 | | | | 07/09/29 | | | | 41,996 | |
| 222,871 | | g | | Pretium Mortgage Credit Partners I LLC (Step Bond)
Series - 2018 NPL3 (Class A1) | | | | | 4.125 | | | | 08/25/33 | | | | 222,087 | |
| 180,000 | | | | Santander Drive Auto Receivables Trust
Series - 2018 5 (Class A2A) | | | | | 2.970 | | | | 07/15/21 | | | | 179,813 | |
| 125,000 | | | | Santander Drive Auto Receivables Trust
Series - 2018 5 (Class A3) | | | | | 3.190 | | | | 03/15/22 | | | | 124,618 | |
| 500,000 | | g | | Santander Retail Auto Lease Trust
Series - 2017 A (Class A4) | | | | | 2.370 | | | | 01/20/22 | | | | 494,815 | |
| 68,878 | | g | | SLM Student Loan Trust
Series - 2012 A (Class A2) | | | | | 3.830 | | | | 01/17/45 | | | | 68,935 | |
| 236,085 | | g | | Sofi Professional Loan Program LLC
Series - 2018 D (Class A1FX) | | | | | 3.120 | | | | 02/25/48 | | | | 236,076 | |
| 500,000 | | g | | SoFi Professional Loan Program LLC
Series - 2017 F (Class A2FX) | | | | | 2.840 | | | | 01/25/41 | | | | 488,531 | |
100
TIAA-CREF LIFE FUNDS -Bond Fund
| | | | | | | | | | | | | | | | | | |
PRINCIPAL | | | | ISSUER | | REFERENCE
RATE & SPREAD | | RATE | | | MATURITY
DATE | | | VALUE | |
| | | | | | | | | | | | | | | | |
| $ 157,150 | | g | | SolarCity LMC
Series - 2014 2 (Class A) | | | | | 4.020 | % | | | 07/20/44 | | | $ | 156,284 | |
| 180,193 | | g | | SpringCastle America Funding LLC
Series - 2016 AA (Class A) | | | | | 3.050 | | | | 04/25/29 | | | | 178,453 | |
| 500,000 | | | | Synchrony Credit Card Master Note Trust
Series - 2017 2 (Class A) | | | | | 2.620 | | | | 10/15/25 | | | | 493,207 | |
| 250,000 | | g | | Tesla Auto Lease Trust
Series - 2018 B (Class A) | | | | | 3.710 | | | | 08/20/21 | | | | 250,603 | |
| 500,000 | | g | | Verizon Owner Trust
Series - 2017 1A (Class A) | | | | | 2.060 | | | | 09/20/21 | | | | 496,280 | |
| 800,000 | | | | Verizon Owner Trust
Series - 2018 A (Class A1A) | | | | | 3.230 | | | | 04/20/23 | | | | 804,823 | |
| 419,450 | | g | | VOLT LXV LLC (Step Bond)
Series - 2018 NPL1 (Class A1) | | | | | 3.750 | | | | 04/25/48 | | | | 415,323 | |
| 100,000 | | g | | VOLT LXXIII LLC (Step Bond)
Series - 2018 NPL9 (Class A1A) | | | | | 4.458 | | | | 10/25/48 | | | | 100,025 | |
| 250,000 | | g,i | | Voya CLO Ltd
Series - 2018 3A (Class B) | | LIBOR 3 M + 1.650% | | | 0.000 | | | | 10/15/31 | | | | 245,094 | |
| 35,287 | | g | | Wachovia Amortization Controlled Heloc NIM
Series - 2006 N1 (Class N1) | | | | | 5.683 | | | | 08/12/47 | | | | 34,877 | |
| 495,000 | | g | | Wendys Funding LLC
Series - 2018 1A (Class A2I) | | | | | 3.573 | | | | 03/15/48 | | | | 474,378 | |
| 350,000 | | | | World Omni Auto Receivables Trust
Series - 2018 D (Class A2A) | | | | | 3.010 | | | | 04/15/22 | | | | 349,878 | |
| 200,000 | | | | World Omni Auto Receivables Trust
Series - 2018 D (Class A3) | | | | | 3.330 | | | | 04/15/24 | | | | 202,265 | |
| | | | | | | | | | | | | | | | | | |
| | | | TOTAL ASSET BACKED | | | | | | | | | | | | | 19,577,097 | |
| | | | | | | | | | | | | | | | | | |
|
OTHER MORTGAGE BACKED - 12.4% | |
| 941,816 | | g,i | | Agate Bay Mortgage Trust
Series - 2015 6 (Class A9) | | | | | 3.500 | | | | 09/25/45 | | | | 915,089 | |
| 25,187 | | g,i | | Banc of America Commercial Mortgage Trust
Series - 2007 4 (Class E) | | | | | 5.752 | | | | 02/10/51 | | | | 25,525 | |
| 200,000 | | g | | BBCMS Trust
Series - 2015 SRCH (Class A2) | | | | | 4.197 | | | | 08/10/35 | | | | 202,523 | |
| 57,297 | | i | | CHL Mortgage Pass-Through Trust
Series - 2004 HYB9 (Class 1A1) | | | | | 4.225 | | | | 02/20/35 | | | | 57,589 | |
| 1,000,000 | | | | Citigroup Commercial Mortgage Trust
Series - 2016 GC37 (Class A4) | | | | | 3.314 | | | | 04/10/49 | | | | 987,308 | |
| 500,000 | | | | Citigroup Commercial Mortgage Trust
Series - 2016 GC37 (Class AS) | | | | | 3.576 | | | | 04/10/49 | | | | 498,396 | |
| 750,000 | | | | COMM Mortgage Trust
Series - 2012 CR4 (Class A3) | | | | | 2.853 | | | | 10/15/45 | | | | 736,720 | |
| 600,000 | | i | | COMM Mortgage Trust
Series - 2014 CR18 (Class B) | | | | | 4.456 | | | | 07/15/47 | | | | 610,796 | |
| 300,000 | | i | | COMM Mortgage Trust
Series - 2015 CR22 (Class AM) | | | | | 3.603 | | | | 03/10/48 | | | | 297,987 | |
| 390,000 | | g,i | | COMM Mortgage Trust
Series - 2015 CR23 (Class CMB) | | | | | 3.685 | | | | 05/10/48 | | | | 390,591 | |
| 500,000 | | | | COMM Mortgage Trust
Series - 2015 CR23 (Class AM) | | | | | 3.801 | | | | 05/10/48 | | | | 500,331 | |
| 550,000 | | i | | COMM Mortgage Trust
Series - 2015 CR23 (Class B) | | | | | 4.183 | | | | 05/10/48 | | | | 552,340 | |
| 500,000 | | | | COMM Mortgage Trust
Series - 2015 CR24 (Class A5) | | | | | 3.696 | | | | 08/10/48 | | | | 505,759 | |
| 195,000 | | i | | Connecticut Avenue Securities
Series - 2014 C02 (Class 1M2) | | LIBOR 1 M + 2.600% | | | 5.106 | | | | 05/25/24 | | | | 204,287 | |
| 189,065 | | i | | Connecticut Avenue Securities
Series - 2014 C03 (Class 1M2) | | LIBOR 1 M + 3.000% | | | 5.506 | | | | 07/25/24 | | | | 198,787 | |
| 345,501 | | i | | Connecticut Avenue Securities
Series - 2016 C04 (Class 1M1) | | LIBOR 1 M + 1.450% | | | 3.956 | | | | 01/25/29 | | | | 346,778 | |
| 567,900 | | i | | Connecticut Avenue Securities
Series - 2016 C06 (Class 1M1) | | LIBOR 1 M + 1.300% | | | 3.806 | | | | 04/25/29 | | | | 569,937 | |
| 64,848 | | i | | Connecticut Avenue Securities
Series - 2017 C03 (Class 1M1) | | LIBOR 1 M + 0.950% | | | 3.456 | | | | 10/25/29 | | | | 64,898 | |
| 441,333 | | i | | Connecticut Avenue Securities
Series - 2018 C01 (Class 1M1) | | LIBOR 1 M + 0.600% | | | 3.106 | | | | 07/25/30 | | | | 439,763 | |
101
TIAA-CREF LIFE FUNDS -Bond Fund
| | | | | | | | | | | | | | | | | | |
PRINCIPAL | | | | ISSUER | | REFERENCE
RATE & SPREAD | | RATE | | | MATURITY
DATE | | | VALUE | |
| | | | | | | | | | | | | | | | |
| $ 42,494 | | i | | Connecticut Avenue Securities
Series - 2018 C03 (Class 1M1) | | LIBOR 1 M + 0.680% | | | 3.186 | % | | | 10/25/30 | | | $ | 42,385 | |
| 65,999 | | i | | Connecticut Avenue Securities
Series - 2018 C04 (Class 2M1) | | LIBOR 1 M + 0.750% | | | 3.256 | | | | 12/25/30 | | | | 65,948 | |
| 120,089 | | i | | Connecticut Avenue Securities
Series - 2018 C05 (Class 1M1) | | LIBOR 1 M + 0.720% | | | 3.226 | | | | 01/25/31 | | | | 119,805 | |
| 63,000 | | i | | Connecticut Avenue Securities
Series - 2018 C05 (Class 1M2) | | LIBOR 1 M + 2.350% | | | 4.856 | | | | 01/25/31 | | | | 61,406 | |
| 101,000 | | i | | Connecticut Avenue Securities
Series - 2018 C06 (Class 2M2) | | LIBOR 1 M + 2.100% | | | 4.606 | | | | 03/25/31 | | | | 97,231 | |
| 68,787 | | g,i | | Connecticut Avenue Securities
Series - 2018 R07 (Class 1M1) | | LIBOR 1 M + 0.750% | | | 3.256 | | | | 04/25/31 | | | | 68,680 | |
| 1,300,000 | | g,i | | DBUBS Mortgage Trust
Series - 2011 LC2A (Class D) | | | | | 5.534 | | | | 07/10/44 | | | | 1,337,341 | |
| 175,000 | | g,i | | DBUBS Mortgage Trust
Series - 2011 LC1A (Class C) | | | | | 5.698 | | | | 11/10/46 | | | | 182,624 | |
| 219,979 | | g,i | | Flagstar Mortgage Trust
Series - 2018 3INV (Class A3) | | | | | 4.000 | | | | 05/25/48 | | | | 220,205 | |
| 96,945 | | g,i | | Flagstar Mortgage Trust
Series - 2018 5 (Class A11) | | | | | 4.000 | | | | 09/25/48 | | | | 95,855 | |
| 1,000,000 | | i | | GS Mortgage Securities Corp II
Series - 2018 GS9 (Class A4) | | | | | 3.992 | | | | 03/10/51 | | | | 1,019,416 | |
| 67,515 | | i | | HarborView Mortgage Loan Trust
Series - 2005 11 (Class 2A1A) | | LIBOR 1 M + 0.620% | | | 3.090 | | | | 08/19/45 | | | | 66,870 | |
| 400,000 | | g | | Hudson Yards Mortgage Trust
Series - 2016 10HY (Class A) | | | | | 2.835 | | | | 08/10/38 | | | | 379,344 | |
| 300,000 | | g | | JP Morgan Chase Commercial Mortgage Securities Trust
Series - 2012 HSBC (Class C) | | | | | 4.021 | | | | 07/05/32 | | | | 304,620 | |
| 364,000 | | g,i | | JP Morgan Chase Commercial Mortgage Securities Trust
Series - 2011 C3 (Class D) | | | | | 5.660 | | | | 02/15/46 | | | | 368,294 | |
| 100,000 | | g,i | | JP Morgan Chase Commercial Mortgage Securities Trust
Series - 2011 C4 (Class C) | | | | | 5.398 | | | | 07/15/46 | | | | 103,963 | |
| 400,000 | | | | JP Morgan Chase Commercial Mortgage Securities Trust
Series - 2017 JP6 (Class AS) | | | | | 3.744 | | | | 07/15/50 | | | | 391,940 | |
| 155,520 | | i | | JP Morgan Mortgage Acquisition Trust
Series - 2007 CH5 (Class A1) | | LIBOR 1 M + 0.160% | | | 2.666 | | | | 06/25/37 | | | | 151,894 | |
| 63,780 | | g,i | | JP Morgan Mortgage Trust
Series - 2016 1 (Class A13) | | | | | 3.500 | | | | 05/25/46 | | | | 61,908 | |
| 36,428 | | g,i | | JP Morgan Mortgage Trust
Series - 2017 1 (Class A3) | | | | | 3.500 | | | | 01/25/47 | | | | 35,948 | |
| 47,339 | | g,i | | JP Morgan Mortgage Trust
Series - 2017 2 (Class A13) | | | | | 3.500 | | | | 05/25/47 | | | | 46,126 | |
| 48,081 | | g,i | | JP Morgan Mortgage Trust
Series - 2017 3 (Class 1A5) | | | | | 3.500 | | | | 08/25/47 | | | | 47,477 | |
| 477,171 | | g,i | | JP Morgan Mortgage Trust
Series - 2018 5 (Class A5) | | | | | 3.500 | | | | 10/25/48 | | | | 470,573 | |
| 454,405 | | g,i | | JP Morgan Mortgage Trust
Series - 2018 6 (Class 1A3) | | | | | 3.500 | | | | 12/25/48 | | | | 448,689 | |
| 63,602 | | g,i | | JP Morgan Mortgage Trust
Series - 2018 8 (Class A13) | | | | | 4.000 | | | | 01/25/49 | | | | 62,963 | |
| 142,523 | | g,i | | JP Morgan Mortgage Trust
Series - 2018 9 (Class A13) | | | | | 4.000 | | | | 02/25/49 | | | | 141,914 | |
| 680,000 | | | | JPMBB Commercial Mortgage Securities Trust
Series - 2014 C21 (Class A5) | | | | | 3.775 | | | | 08/15/47 | | | | 690,570 | |
| 500,000 | | i | | JPMBB Commercial Mortgage Securities Trust
Series - 2015 C29 (Class AS) | | | | | 3.917 | | | | 05/15/48 | | | | 497,975 | |
| 500,000 | | | | JPMBB Commercial Mortgage Securities Trust
Series - 2015 C31 (Class AS) | | | | | 4.106 | | | | 08/15/48 | | | | 502,071 | |
| 200,000 | | i | | JPMBB Commercial Mortgage Securities Trust
Series - 2015 C31 (Class B) | | | | | 4.617 | | | | 08/15/48 | | | | 204,072 | |
| 23,634 | | i | | LB-UBS Commercial Mortgage Trust
Series - 2007 C6 (Class AM) | | | | | 6.114 | | | | 07/15/40 | | | | 23,635 | |
102
TIAA-CREF LIFE FUNDS -Bond Fund
| | | | | | | | | | | | | | | | | | |
PRINCIPAL | | | | ISSUER | | REFERENCE
RATE & SPREAD | | RATE | | | MATURITY
DATE | | | VALUE | |
| | | | | | | | | | | | | | | | |
| $ 328,128 | | i | | Morgan Stanley Bank of America Merrill Lynch Trust
Series - 2014 C14 (Class AS) | | | | | 4.384 | % | | | 02/15/47 | | | $ | 341,496 | |
| 628,927 | | | | Morgan Stanley Bank of America Merrill Lynch Trust
Series - 2015 C21 (Class AS) | | | | | 3.652 | | | | 03/15/48 | | | | 630,480 | |
| 9,985 | | i | | Morgan Stanley Capital I Trust
Series - 2006 HQ10 (Class AJ) | | | | | 5.389 | | | | 11/12/41 | | | | 9,948 | |
| 142,697 | | g,i | | Sequoia Mortgage Trust
Series - 2016 3 (Class A10) | | | | | 3.500 | | | | 11/25/46 | | | | 140,831 | |
| 556,448 | | g,i | | Sequoia Mortgage Trust
Series - 2018 5 (Class A4) | | | | | 3.500 | | | | 05/25/48 | | | | 551,898 | |
| 88,374 | | g,i | | Sequoia Mortgage Trust
Series - 2018 CH2 (Class A21) | | | | | 4.000 | | | | 06/25/48 | | | | 88,547 | |
| 92,905 | | g,i | | Sequoia Mortgage Trust
Series - 2018 6 (Class A4) | | | | | 4.000 | | | | 07/25/48 | | | | 93,417 | |
| 491,600 | | g,i | | Sequoia Mortgage Trust
Series - 2018 8 (Class A19) | | | | | 4.000 | | | | 11/25/48 | | | | 488,935 | |
| 170,155 | | i | | Structured Agency Credit Risk Debt Note (STACR)
Series - 2014 HQ2 (Class M2) | | LIBOR 1 M + 2.200% | | | 4.706 | | | | 09/25/24 | | | | 173,717 | |
| 250,000 | | i | | Structured Agency Credit Risk Debt Note (STACR)
Series - 2015 HQ1 (Class M3) | | LIBOR 1 M + 3.800% | | | 6.306 | | | | 03/25/25 | | | | 263,349 | |
| 191,611 | | i | | Structured Agency Credit Risk Debt Note (STACR)
Series - 2015 HQ2 (Class M2) | | LIBOR 1 M + 1.950% | | | 4.456 | | | | 05/25/25 | | | | 194,551 | |
| 7,438 | | i | | Structured Agency Credit Risk Debt Note (STACR)
Series - 2017 DNA1 (Class M1) | | LIBOR 1 M + 1.200% | | | 3.706 | | | | 07/25/29 | | | | 7,472 | |
| 917,619 | | i | | Structured Agency Credit Risk Debt Note (STACR)
Series - 2017 DNA3 (Class M1) | | LIBOR 1 M + 0.750% | | | 3.256 | | | | 03/25/30 | | | | 914,830 | |
| 54,246 | | g,i | | Structured Agency Credit Risk Debt Note (STACR)
Series - 2018 SPI2 (Class M1) | | | | | 3.819 | | | | 05/25/48 | | | | 54,014 | |
| 114,857 | | g,i | | Structured Agency Credit Risk Debt Note (STACR)
Series - 2018 SPI3 (Class M1) | | | | | 4.167 | | | | 08/25/48 | | | | 115,149 | |
| 600,000 | | | | UBS Commercial Mortgage Trust
Series - 2017 C7 (Class ASB) | | | | | 3.586 | | | | 12/15/50 | | | | 605,521 | |
| 538,679 | | i | | Wachovia Bank Commercial Mortgage Trust
Series - 2007 C34 (Class AJ) | | | | | 6.141 | | | | 05/15/46 | | | | 541,866 | |
| 72,000 | | i | | Wachovia Bank Commercial Mortgage Trust
Series - 2007 C34 (Class C) | | | | | 6.216 | | | | 05/15/46 | | | | 72,570 | |
| 500,000 | | | | Wells Fargo Commercial Mortgage Trust
Series - 2015 NXS1 (Class A5) | | | | | 3.148 | | | | 05/15/48 | | | | 491,000 | |
| 490,000 | | | | Wells Fargo Commercial Mortgage Trust
Series - 2015 NXS1 (Class AS) | | | | | 3.406 | | | | 05/15/48 | | | | 486,308 | |
| 50,000 | | g,i | | Wells Fargo Mortgage Backed Securities Trust
Series - 2010 C1 (Class B) | | | | | 5.276 | | | | 11/15/43 | | | | 51,393 | |
| 645,000 | | i | | WFRBS Commercial Mortgage Trust
Series - 2013 C18 (Class AS) | | | | | 4.387 | | | | 12/15/46 | | | | 669,666 | |
| | | | | | | | | | | | | | | | | | |
| | | | TOTAL OTHER MORTGAGE BACKED | | | | | | | | | | | | | 23,404,104 | |
| | | | | | | | | | | | | | | | | | |
| | | | TOTAL STRUCTURED ASSETS | | | | | | | | | | | | | 42,981,201 | |
| | | | | | | | | | | | | | | | | | |
| | | | (Cost $43,253,587) | | | | | | | | | | | | | | |
| | | | TOTAL BONDS | | | | | | | | | | | | | 179,185,728 | |
| | | | | | | | | | | | | | | | | | |
| | | | (Cost $182,548,465) | | | | | | | | | | | | | | |
| | | | | | | | | | | | | | | | | | |
103
TIAA-CREF LIFE FUNDS -Bond Fund
| | | | | | | | | | | | | | | | | | |
SHARES | | | | COMPANY | | | | RATE | | | MATURITY
DATE | | | VALUE | |
| | | | | | | | | | | | | | | | |
PREFERRED STOCKS - 0.1% | | | | | | | | | | | | | | |
|
BANKS - 0.1% | |
| 5,517 | | * | | Federal Home Loan Mortgage Corp | | | | | 8.375 | % | | | N/A | ‡ | | $ | 38,619 | |
| 17,265 | | * | | Federal National Mortgage Association | | | | | 8.250 | | | | N/A | ‡ | | | 119,991 | |
| | | | | | | | | | | | | | | | | | |
| | | | TOTAL BANKS | | | | 158,610 | |
| | | | | | | | | | | | | | | | | | |
| | | | TOTAL PREFERRED STOCKS | | | | | | | | 158,610 | |
| | | | | | | | | | | | | | | | | | |
| | | | (Cost $569,550) | | | | | | | | | | | | | | |
| | | | | | | | | | | | | | | | | | |
PRINCIPAL | | | | ISSUER | | | | | | | | | | | |
| | | | | | | | | | | | | | | | |
SHORT-TERM INVESTMENTS - 3.1% | | | | | | | | | | | | | | |
| | | | |
GOVERNMENT AGENCY DEBT - 3.1% | | | | | | | | | | | | | | |
| $5,980,000 | | | | Federal Home Loan Bank (FHLB) | | | | | 2.150 | | | | 01/02/19 | | | | 5,980,000 | |
| | | | | | | | | | | | | | | | | | |
| | | | TOTAL GOVERNMENT AGENCY DEBT | | | | 5,980,000 | |
| | | | | | | | | | | | | | | | | | |
| | | | TOTAL SHORT-TERM INVESTMENTS | | | | | | | | 5,980,000 | |
| | | | | | | | | | | | | | | | | | |
| | | | (Cost $5,979,643) | | | | | | | | | | | | | | |
| | | | TOTAL INVESTMENTS - 99.4% | | | | | | | | 188,230,880 | |
| | | | (Cost $192,134,398) | | | | | | | | | | | | | | |
| | | | OTHER ASSETS & LIABILITIES, NET - 0.6% | | | | 1,054,004 | |
| | | | | | | | | | | | | | | | | | |
| | | | NET ASSETS - 100.0% | | | | | | | $ | 189,284,884 | |
| | | | | | | | | | | | | | | | | | |
Abbreviation(s):
| LIBOR | London Interbank Offered Rate |
| REIT | Real Estate Investment Trust |
| † | Security is categorized as Level 3 in the fair value hierarchy. |
| g | Security is exempt from registration under Rule 144(A) of the Securities Act of 1933. Such securities are deemed liquid and may be resold in transactions exempt from registration to qualified institutional buyers. At 12/31/18, the aggregate value of these securities was $35,179,665 or 18.6% of net assets. |
| h | All or a portion of these securities were purchased on a delayed delivery basis. |
| i | Floating or variable rate security includes the reference rate and spread, unless the variable rate is based on the underlying asset of the security. Coupon rate reflects the rate at period end. |
104
TIAA-CREF LIFE FUNDS -Money Market Fund
TIAA-CREF LIFE FUNDS
MONEY MARKET FUND
SCHEDULE OF INVESTMENTS
December 31, 2018
| | | | | | | | | | | | | | | | | | |
PRINCIPAL | | | | ISSUER | | | | RATE | | | MATURITY
DATE | | | VALUE | |
| | | | | | | | | | | | | | | | |
| | |
SHORT-TERM INVESTMENTS - 101.4% | | | | | | | | | |
| | |
GOVERNMENT AGENCY DEBT - 60.7% | | | | | | | | | |
| $ 910,000 | | | | Federal Agricultural Mortgage Corp (FAMC) | | | | | 0.010 | % | | | 01/02/19 | | | $ | 909,945 | |
| 510,000 | | | | FAMC | | | | | 0.010 | | | | 01/04/19 | | | | 509,902 | |
| 695,000 | | | | FAMC | | | | | 0.010 | | | | 01/25/19 | | | | 693,934 | |
| 500,000 | | | | FAMC | | | | | 0.010 | | | | 02/11/19 | | | | 498,662 | |
| 100,000 | | | | Federal Farm Credit Bank (FFCB) | | | | | 0.010 | | | | 01/02/19 | | | | 99,994 | |
| 720,000 | | | | FFCB | | | | | 0.010 | | | | 01/11/19 | | | | 719,570 | |
| 750,000 | | | | FFCB | | | | | 0.010 | | | | 01/16/19 | | | | 749,306 | |
| 1,000,000 | | | | FFCB | | | | | 0.010 | | | | 01/29/19 | | | | 998,242 | |
| 1,000,000 | | | | FFCB | | | | | 0.010 | | | | 02/05/19 | | | | 997,735 | |
| 675,000 | | | | FFCB | | | | | 0.010 | | | | 02/06/19 | | | | 673,441 | |
| 100,000 | | | | FFCB | | | | | 0.010 | | | | 02/11/19 | | | | 99,745 | |
| 1,000,000 | | | | FFCB | | | | | 0.010 | | | | 02/19/19 | | | | 996,869 | |
| 225,000 | | | | FFCB | | | | | 0.010 | | | | 02/27/19 | | | | 224,209 | |
| 500,000 | | | | FFCB | | | | | 0.010 | | | | 03/18/19 | | | | 497,519 | |
| 300,000 | | | | FFCB | | | | | 0.010 | | | | 03/19/19 | | | | 298,492 | |
| 250,000 | | | | FFCB | | | | | 0.010 | | | | 03/20/19 | | | | 248,722 | |
| 200,000 | | | | FFCB | | | | | 0.010 | | | | 03/21/19 | | | | 198,991 | |
| 200,000 | | | | FFCB | | | | | 0.010 | | | | 03/22/19 | | | | 198,951 | |
| 100,000 | | | | FFCB | | | | | 0.010 | | | | 03/25/19 | | | | 99,433 | |
| 500,000 | | | | FFCB | | | | | 0.010 | | | | 04/05/19 | | | | 496,841 | |
| 200,000 | | | | FFCB | | | | | 0.010 | | | | 04/09/19 | | | | 198,639 | |
| 500,000 | | | | FFCB | | | | | 0.010 | | | | 04/18/19 | | | | 496,389 | |
| 500,000 | | | | FFCB | | | | | 0.010 | | | | 04/22/19 | | | | 496,207 | |
| 500,000 | | | | FFCB | | | | | 0.010 | | | | 04/26/19 | | | | 496,103 | |
| 400,000 | | | | FFCB | | | | | 0.010 | | | | 05/02/19 | | | | 396,706 | |
| 500,000 | | | | FFCB | | | | | 0.010 | | | | 05/06/19 | | | | 495,677 | |
| 205,000 | | | | FFCB | | | | | 0.010 | | | | 05/08/19 | | | | 203,192 | |
| 500,000 | | | | FFCB | | | | | 0.010 | | | | 05/20/19 | | | | 495,231 | |
| 1,200,000 | | | | FFCB | | | | | 0.010 | | | | 05/23/19 | | | | 1,188,324 | |
| 148,000 | | | | Federal Home Loan Bank (FHLB) | | | | | 0.010 | | | | 01/02/19 | | | | 147,991 | |
| 100,000 | | | | FHLB | | | | | 0.010 | | | | 01/04/19 | | | | 99,981 | |
| 300,000 | | | | FHLB | | | | | 0.010 | | | | 01/09/19 | | | | 299,849 | |
| 380,000 | | | | FHLB | | | | | 0.010 | | | | 01/14/19 | | | | 379,675 | |
| 200,000 | | | | FHLB | | | | | 0.010 | | | | 01/15/19 | | | | 199,820 | |
| 500,000 | | | | FHLB | | | | | 0.010 | | | | 01/16/19 | | | | 499,524 | |
| 295,000 | | | | FHLB | | | | | 0.010 | | | | 01/17/19 | | | | 294,693 | |
| 500,000 | | | | FHLB | | | | | 0.010 | | | | 01/25/19 | | | | 499,230 | |
| 1,250,000 | | | | FHLB | | | | | 0.010 | | | | 01/28/19 | | | | 1,247,854 | |
| 500,000 | | | | FHLB | | | | | 0.010 | | | | 01/29/19 | | | | 499,102 | |
| 1,500,000 | | | | FHLB | | | | | 0.010 | | | | 01/30/19 | | | | 1,497,219 | |
| 800,000 | | | | FHLB | | | | | 0.010 | | | | 01/31/19 | | | | 798,443 | |
| 865,000 | | | | FHLB | | | | | 0.010 | | | | 02/01/19 | | | | 863,246 | |
| 500,000 | | | | FHLB | | | | | 0.010 | | | | 02/06/19 | | | | 498,835 | |
| 2,460,000 | | | | FHLB | | | | | 0.010 | | | | 02/11/19 | | | | 2,453,354 | |
| 1,700,000 | | | | FHLB | | | | | 0.010 | | | | 02/12/19 | | | | 1,695,325 | |
| 200,000 | | | | FHLB | | | | | 0.010 | | | | 02/14/19 | | | | 199,450 | |
| 500,000 | | | | FHLB | | | | | 0.010 | | | | 02/15/19 | | | | 498,494 | |
| 500,000 | | | | FHLB | | | | | 0.010 | | | | 02/19/19 | | | | 498,394 | |
| 1,525,000 | | | | FHLB | | | | | 0.010 | | | | 02/20/19 | | | | 1,520,131 | |
| 1,070,000 | | | | FHLB | | | | | 0.010 | | | | 02/22/19 | | | | 1,066,306 | |
| 980,000 | | | | FHLB | | | | | 0.010 | | | | 02/25/19 | | | | 976,399 | |
| 500,000 | | | | FHLB | | | | | 0.010 | | | | 02/27/19 | | | | 498,112 | |
| 414,000 | | | | FHLB | | | | | 0.010 | | | | 03/05/19 | | | | 412,259 | |
| 500,000 | | | | FHLB | | | | | 0.010 | | | | 03/08/19 | | | | 497,894 | |
105
TIAA-CREF LIFE FUNDS -Money Market Fund
| | | | | | | | | | | | | | | | | | |
PRINCIPAL | | | | ISSUER | | | | RATE | | | MATURITY
DATE | | | VALUE | |
| | | | | | | | | | | | | | | | |
| $ 800,000 | | | | FHLB | | | | | 0.010 | % | | | 03/11/19 | | | $ | 796,335 | |
| 500,000 | | | | FHLB | | | | | 0.010 | | | | 03/12/19 | | | | 497,681 | |
| 1,125,000 | | | | FHLB | | | | | 0.010 | | | | 03/13/19 | | | | 1,119,631 | |
| 500,000 | | | | FHLB | | | | | 0.010 | | | | 03/20/19 | | | | 497,378 | |
| 160,000 | | | | FHLB | | | | | 0.010 | | | | 03/21/19 | | | | 159,143 | |
| 1,500,000 | | | | FHLB | | | | | 0.010 | | | | 03/26/19 | | | | 1,491,495 | |
| 500,000 | | | | FHLB | | | | | 0.010 | | | | 03/27/19 | | | | 497,119 | |
| 800,000 | | | | FHLB | | | | | 0.010 | | | | 03/28/19 | | | | 795,490 | |
| 500,000 | | | | FHLB | | | | | 0.010 | | | | 04/02/19 | | | | 496,929 | |
| 1,151,000 | | | | FHLB | | | | | 0.010 | | | | 04/10/19 | | | | 1,143,372 | |
| 1,155,000 | | | | Federal Home Loan Mortgage Corp (FHLMC) | | | | | 0.010 | | | | 01/04/19 | | | | 1,154,791 | |
| 1,000,000 | | | | FHLMC | | | | | 0.010 | | | | 01/07/19 | | | | 999,638 | |
| 1,500,000 | | | | FHLMC | | | | | 0.010 | | | | 01/08/19 | | | | 1,499,367 | |
| 1,105,000 | | | | FHLMC | | | | | 0.010 | | | | 01/09/19 | | | | 1,104,462 | |
| 1,000,000 | | | | FHLMC | | | | | 0.010 | | | | 01/18/19 | | | | 998,914 | |
| 345,000 | | | | FHLMC | | | | | 0.010 | | | | 01/22/19 | | | | 344,543 | |
| 1,049,000 | | | | FHLMC | | | | | 0.010 | | | | 01/23/19 | | | | 1,047,561 | |
| 500,000 | | | | FHLMC | | | | | 0.010 | | | | 02/08/19 | | | | 498,802 | |
| 1,000,000 | | | | FHLMC | | | | | 0.010 | | | | 02/13/19 | | | | 997,193 | |
| 1,210,000 | | | | FHLMC | | | | | 0.010 | | | | 02/25/19 | | | | 1,205,665 | |
| 1,085,000 | | | | FHLMC | | | | | 0.010 | | | | 02/26/19 | | | | 1,081,037 | |
| 500,000 | | | | FHLMC | | | | | 0.010 | | | | 03/04/19 | | | | 497,946 | |
| 545,000 | | | | FHLMC | | | | | 0.010 | | | | 03/22/19 | | | | 542,136 | |
| 1,480,000 | | | | FHLMC | | | | | 0.010 | | | | 03/26/19 | | | | 1,471,746 | |
| 328,000 | | | | FHLMC | | | | | 0.010 | | | | 04/17/19 | | | | 325,658 | |
| 132,000 | | | | Federal National Mortgage Association (FNMA) | | | 0.010 | | | | 01/04/19 | | | | 131,976 | |
| 965,000 | | | | FNMA | | | | | 0.010 | | | | 01/11/19 | | | | 964,405 | |
| 985,000 | | | | FNMA | | | | | 0.010 | | | | 01/14/19 | | | | 984,198 | |
| 1,205,000 | | | | FNMA | | | | | 0.010 | | | | 01/22/19 | | | | 1,203,432 | |
| 255,000 | | | | FNMA | | | | | 0.010 | | | | 02/04/19 | | | | 254,448 | |
| 500,000 | | | | FNMA | | | | | 0.010 | | | | 02/06/19 | | | | 498,830 | |
| 1,000,000 | | | | FNMA | | | | | 0.010 | | | | 02/07/19 | | | | 997,657 | |
| 500,000 | | | | FNMA | | | | | 0.010 | | | | 02/12/19 | | | | 498,661 | |
| 500,000 | | | | FNMA | | | | | 0.010 | | | | 02/13/19 | | | | 498,599 | |
| 318,000 | | | | FNMA | | | | | 0.010 | | | | 02/15/19 | | | | 317,088 | |
| 500,000 | | | | FNMA | | | | | 0.010 | | | | 02/27/19 | | | | 498,120 | |
| 500,000 | | | | FNMA | | | | | 0.010 | | | | 03/01/19 | | | | 498,099 | |
| 420,000 | | | | FNMA | | | | | 0.010 | | | | 03/05/19 | | | | 418,284 | |
| 1,000,000 | | | | FNMA | | | | | 0.010 | | | | 03/06/19 | | | | 995,764 | |
| 700,000 | | | | FNMA | | | | | 0.010 | | | | 03/20/19 | | | | 696,405 | |
| | | | | | | | | | | | | | | | | | |
| | | | TOTAL GOVERNMENT AGENCY DEBT | | | | 63,538,549 | |
| | | | | | | | | | | | | | | | | | |
| | | | |
TREASURY DEBT - 23.8% | | | | | | | | | | | | | | |
| 2,228,000 | | | | United States Treasury Bill | | | | | 0.010 | | | | 01/03/19 | | | | 2,227,731 | |
| 1,000,000 | | | | United States Treasury Bill | | | | | 0.010 | | | | 01/08/19 | | | | 999,541 | |
| 1,483,000 | | | | United States Treasury Bill | | | | | 0.010 | | | | 01/10/19 | | | | 1,482,201 | |
| 1,500,000 | | | | United States Treasury Bill | | | | | 0.010 | | | | 01/17/19 | | | | 1,498,532 | |
| 1,490,000 | | | | United States Treasury Bill | | | | | 0.010 | | | | 01/24/19 | | | | 1,487,896 | |
| 1,120,000 | | | | United States Treasury Bill | | | | | 0.010 | | | | 01/31/19 | | | | 1,117,800 | |
| 1,000,000 | | | | United States Treasury Bill | | | | | 0.010 | | | | 02/05/19 | | | | 997,732 | |
| 500,000 | | | | United States Treasury Bill | | | | | 0.010 | | | | 02/07/19 | | | | 498,832 | |
| 2,000,000 | | | | United States Treasury Bill | | | | | 0.010 | | | | 02/12/19 | | | | 1,994,512 | |
| 1,500,000 | | | | United States Treasury Bill | | | | | 0.010 | | | | 02/14/19 | | | | 1,495,855 | |
| 1,485,000 | | | | United States Treasury Bill | | | | | 0.010 | | | | 02/21/19 | | | | 1,480,153 | |
| 1,000,000 | | | | United States Treasury Bill | | | | | 0.010 | | | | 02/28/19 | | | | 996,259 | |
| 870,000 | | | | United States Treasury Bill | | | | | 0.010 | | | | 03/07/19 | | | | 866,341 | |
| 1,025,000 | | | | United States Treasury Bill | | | | | 0.010 | | | | 03/14/19 | | | | 1,020,164 | |
| 500,000 | | | | United States Treasury Bill | | | | | 0.010 | | | | 03/21/19 | | | | 497,443 | |
| 1,095,000 | | | | United States Treasury Bill | | | | | 0.010 | | | | 04/04/19 | | | | 1,088,306 | |
| 745,000 | | | | United States Treasury Bill | | | | | 0.010 | | | | 04/11/19 | | | | 740,030 | |
| 1,180,000 | | | | United States Treasury Bill | | | | | 0.010 | | | | 04/18/19 | | | | 1,171,554 | |
| 1,320,000 | | | | United States Treasury Note | | | | | 1.125 | | | | 01/15/19 | | | | 1,319,443 | |
106
TIAA-CREF LIFE FUNDS -Money Market Fund
| | | | | | | | | | | | | | | | | | |
PRINCIPAL | | | | ISSUER | | REFERENCE
RATE & SPREAD | | RATE | | | MATURITY
DATE | | | VALUE | |
| | | | | | | | | | | | | | | | |
| $ 500,000 | | | | United States Treasury Note | | | | | 1.250 | % | | | 01/31/19 | | | $ | 499,581 | |
| 500,000 | | | | United States Treasury Note | | | | | 0.750 | | | | 02/15/19 | | | | 499,006 | |
| 500,000 | | | | United States Treasury Note | | | | | 1.500 | | | | 02/28/19 | | | | 499,277 | |
| 400,000 | | | | United States Treasury Note | | | | | 1.000 | | | | 03/15/19 | | | | 398,881 | |
| | | | | | | | | | | | | | | | | | |
| | | | TOTAL TREASURY DEBT | | | | | | | | | | | | | 24,877,070 | |
| | | | | | | | | | | | | | | | | | |
|
VARIABLE RATE SECURITIES - 16.9% | |
| 300,000 | | i | | Federal Agricultural Mortgage Corp (FAMC) | | LIBOR 1 M - 0.075% | | | 2.272 | | | | 02/04/19 | | | | 300,000 | |
| 500,000 | | i | | FAMC | | LIBOR 1 M - 0.105% | | | 2.244 | | | | 03/01/19 | | | | 500,000 | |
| 500,000 | | i | | FAMC | | EFFR + 0.010% | | | 2.410 | | | | 04/01/19 | | | | 500,000 | |
| 500,000 | | i | | FAMC | | LIBOR 3 M - 0.210% | | | 2.435 | | | | 05/20/19 | | | | 500,000 | |
| 500,000 | | i | | FAMC | | EFFR + 0.150% | | | 2.550 | | | | 09/27/19 | | | | 500,000 | |
| 500,000 | | i | | FAMC | | LIBOR 3 M - 0.200% | | | 2.567 | | | | 11/01/19 | | | | 500,000 | |
| 500,000 | | i | | FAMC | | EFFR + 0.120% | | | 2.520 | | | | 02/26/20 | | | | 500,000 | |
| 500,000 | | i | | Federal Farm Credit Bank (FFCB) | | FRED - 3.020% | | | 2.480 | | | | 01/14/19 | | | | 500,019 | |
| 500,000 | | i | | FFCB | | LIBOR 3 M - 0.160% | | | 2.276 | | | | 01/15/19 | | | | 500,000 | |
| 500,000 | | i | | FFCB | | LIBOR 1 M - 0.110% | | | 2.396 | | | | 01/25/19 | | | | 500,002 | |
| 500,000 | | i | | FFCB | | FRED - 3.020% | | | 2.480 | | | | 03/27/19 | | | | 500,129 | |
| 500,000 | | i | | FFCB | | LIBOR 1 M - 0.145% | | | 2.377 | | | | 03/29/19 | | | | 499,994 | |
| 500,000 | | i | | FFCB | | EFFR - 0.000% | | | 2.400 | | | | 04/15/19 | | | | 499,941 | |
| 500,000 | | i | | FFCB | | LIBOR 1 M - 0.125% | | | 2.258 | | | | 06/07/19 | | | | 500,000 | |
| 250,000 | | i | | FFCB | | FRED - 3.080% | | | 2.420 | | | | 06/27/19 | | | | 250,012 | |
| 250,000 | | i | | FFCB | | FRED - 3.080% | | | 2.420 | | | | 08/16/19 | | | | 249,985 | |
| 600,000 | | i | | FFCB | | FRED - 3.075% | | | 2.425 | | | | 09/25/19 | | | | 599,648 | |
| 300,000 | | i | | FFCB | | FRED - 3.080% | | | 2.420 | | | | 10/10/19 | | | | 299,791 | |
| 300,000 | | i | | FFCB | | US Treasury Bill 3 M + 0.050% | | | 2.480 | | | | 10/18/19 | | | | 300,000 | |
| 250,000 | | i | | FFCB | | FRED - 3.065% | | | 2.435 | | | | 12/26/19 | | | | 249,901 | |
| 300,000 | | i | | FFCB | | US Treasury Bill 3 M + 0.055% | | | 2.485 | | | | 01/27/20 | | | | 300,000 | |
| 500,000 | | i | | FFCB | | FRED - 2.980% | | | 2.520 | | | | 02/20/20 | | | | 500,000 | |
| 300,000 | | i | | FFCB | | FRED - 2.870% | | | 2.630 | | | | 05/29/20 | | | | 300,000 | |
| 1,000,000 | | i | | FFCB | | FRED - 2.960% | | | 2.540 | | | | 07/09/20 | | | | 999,887 | |
| 500,000 | | i | | FFCB | | US Treasury Bill 3 M + 0.045% | | | 2.475 | | | | 08/17/20 | | | | 499,959 | |
| 500,000 | | i | | Federal Home Loan Bank (FHLB) | | LIBOR 3 M - 0.200% | | | 2.245 | | | | 01/18/19 | | | | 500,002 | |
| 500,000 | | i | | FHLB | | LIBOR 1 M - 0.040% | | | 2.464 | | | | 02/22/19 | | | | 500,040 | |
| 400,000 | | i | | FHLB | | LIBOR 3 M - 0.235% | | | 2.504 | | | | 03/06/19 | | | | 399,966 | |
| 1,000,000 | | i | | FHLB | | SOFR + 0.040% | | | 2.500 | | | | 05/15/19 | | | | 1,000,000 | |
| 500,000 | | i | | FHLB | | LIBOR 1 M - 0.070% | | | 2.351 | | | | 07/12/19 | | | | 499,998 | |
| 500,000 | | i | | FHLB | | SOFR + 0.060% | | | 2.520 | | | | 09/10/19 | | | | 500,000 | |
| 500,000 | | i | | Federal Home Loan Mortgage Corp (FHLMC) | | SOFR + 0.025% | | | 2.485 | | | | 05/08/19 | | | | 500,000 | |
| 500,000 | | i | | FHLMC | | SOFR + 0.030% | | | 2.490 | | | | 06/19/19 | | | | 500,000 | |
| 230,000 | | i | | FHLMC | | LIBOR 3 M - 0.165% | | | 2.243 | | | | 07/05/19 | | | | 230,056 | |
| 750,000 | | i | | FHLMC | | LIBOR 1 M - 0.100% | | | 2.287 | | | | 08/08/19 | | | | 750,013 | |
| 500,000 | | i | | Federal National Mortgage Association (FNMA) | | SOFR + 0.070% | | | 2.530 | | | | 10/30/19 | | | | 500,000 | |
| 500,000 | | i | | United States Treasury Floating Rate Note | | US Treasury Bill 3 M + 0.033% | | | 2.463 | | | | 04/30/20 | | | | 500,052 | |
| | | | | | | | | | | | | | | | | | |
| | | | TOTAL VARIABLE RATE SECURITIES | | | | | | | | | | | | | 17,729,395 | |
| | | | | | | | | | | | | | | | | | |
| | | | TOTAL SHORT-TERM INVESTMENTS | | | | | | | | | | | | | 106,145,014 | |
| | | | | | | | | | | | | | | | | | |
| | | | (Cost $106,145,014) | | | | | | | | | | | | | | |
| | | | TOTAL PORTFOLIO - 101.4% | | | | | | | | | | | | | 106,145,014 | |
| | | | (Cost $106,145,014) | | | | | | | | | | | | | | |
| | | | OTHER ASSETS & LIABILITIES, NET - (1.4)% | | | | | | | | | | | | | (1,475,226 | ) |
| | | | | | | | | | | | | | | | | | |
| | | | NET ASSETS - 100.0% | | | | | | | | | | | | $ | 104,669,788 | |
| | | | | | | | | | | | | | | | | | |
Abbreviation(s):
| EFFR | Effective Federal Funds Rate |
| FRED | Federal Bank Prime Loan Rate |
| LIBOR | London Interbank Offered Rate |
| SOFR | Secure Overnight Financing Rate |
| i | Floating or variable rate security includes the reference rate and spread, unless the variable rate is based on the underlying asset of the security. Coupon rate reflects the rate at period end. |
107
TIAA-CREF LIFE FUNDS - Balanced Fund
TIAA-CREF LIFE FUNDS
BALANCED FUND
SCHEDULE OF INVESTMENTS
December 31, 2018
| | | | | | | | | | | | | | | | |
SHARES | | | | SECURITY | | | | | | | | VALUE | |
| | | | | | | | | | | | | |
TIAA-CREF Life Funds - 99.9%(a) | | | | | | | | | | | | |
| | | |
FIXED INCOME - 50.7% | | | | | | | | | | | | |
| 2,874,005 | | | | TIAA-CREF Life Bond Fund | | | | | | | | | | $ | 28,625,094 | |
| | | | | | | | | | | | | | | | |
| | | | TOTAL FIXED INCOME | | | | | | | | | | | 28,625,094 | |
| | | | | | | | | | | | | | | | |
| | | |
INTERNATIONAL EQUITY - 9.9% | | | | | | | | | | | | |
| 792,577 | | | | TIAA-CREF Life International Equity Fund | | | | | | | | | | | 5,603,517 | |
| | | | | | | | | | | | | | | | |
| | | | TOTAL INTERNATIONAL EQUITY | | | | | | | | | | | 5,603,517 | |
| | | | | | | | | | | | | | | | |
| | | | | | | | | | | | | | | | |
| | | |
U.S. EQUITY - 39.3% | | | | | | | | | | | | |
| 359,805 | | | | TIAA-CREF Life Growth Equity Fund | | | | | | | | | | | 4,940,128 | |
| 357,778 | | | | TIAA-CREF Life Growth & Income Fund | | | | | | | | | | | 5,559,876 | |
| 408,243 | | | | TIAA-CREF LifeLarge-Cap Value Fund | | | | | | | | | | | 5,062,214 | |
| 89,581 | | | | TIAA-CREF Life Real Estate Securities Fund | | | | | | | | | | | 1,102,748 | |
| 89,347 | | | | TIAA-CREF LifeSmall-Cap Equity Fund | | | | | | | | | | | 1,108,791 | |
| 202,990 | | | | TIAA-CREF Life Stock Index Fund | | | | | | | | | | | 4,453,590 | |
| | | | | | | | | | | | | | | | |
| | | | TOTAL U.S. EQUITY | | | | | | | | | | | 22,227,347 | |
| | | | | | | | | | | | | | | | |
| | | | TOTAL TIAA-CREF LIFE FUNDS | | | | | | | | | | | 56,455,958 | |
| | | | | | | | | | | | | | | | |
| | | | (Cost $55,664,846) | | | | | | | | | | | | |
| | | | TOTAL INVESTMENTS - 99.9% | | | | | | | | | | | 56,455,958 | |
| | | | (Cost $55,664,846) | | | | | | | | | | | | |
| | | | OTHER ASSETS & LIABILITIES, NET - 0.1% | | | | | | | | | | | 60,340 | |
| | | | | | | | | | | | | | | | |
| | | | NET ASSETS - 100.0% | | | | | | | | | | $ | 56,516,298 | |
| | | | | | | | | | | | | | | | |
| (a) | The Fund invests its assets in the affiliated TIAA-CREF Life Funds. |
108
Report of Independent Registered Public Accounting Firm
To the Board of Trustees of TIAA-CREF Life Funds and Shareholders of Growth Equity Fund, Growth & Income Fund,Large-Cap Value Fund, Real Estate Securities Fund,Small-Cap Equity Fund, Social Choice Equity Fund, Stock Index Fund, International Equity Fund, Bond Fund, Money Market Fund, and Balanced Fund
Opinions on the Financial Statements
We have audited the accompanying statements of assets and liabilities, including the summary portfolios of investments, ofGrowth Equity Fund, Growth & Income Fund,Large-Cap Value Fund, Real Estate Securities Fund,Small-Cap Equity Fund, Social Choice Equity Fund, Stock Index Fund, International Equity Fund, Bond Fund, Money Market Fund, and portfolio of investments, of Balanced Fund, (constituting TIAA-CREF Life Funds, hereafter collectively referred to as the “Funds”) as of December 31, 2018, the related statements of operations for the year ended December 31, 2018, the statements of changes in net assets for each of the two years in the period ended December 31, 2018, including the related notes,and the financial highlights for each of the periods indicated therein (included in Item 1 of this FormN-CSR) and the schedules of investments (included in Item 6 of thisForm N-CSR) as of December 31, 2018 (collectively referred to as the “financial statements”). In our opinion, the financial statements present fairly, in all material respects, the financial position of each of the Funds as of December 31, 2018, the results of each of their operations for the year then ended, the changes in each of their net assets for each of the two years in the period ended December 31, 2018 and each of the financial highlightsfor each of the periods indicated therein in conformity with accounting principles generally accepted in the United States of America.
Basis for Opinions
These financial statements are the responsibility of the Funds’ management. Our responsibility is to express an opinion on the Funds’ financial statements based on our audits. We are a public accounting firm registered with the Public Company Accounting Oversight Board (United States) (PCAOB) and are required to be independent with respect to the Funds in accordance with the U.S. federal securities laws and the applicable rules and regulations of the Securities and Exchange Commission and the PCAOB.
We conducted our audits of these financial statements in accordance with the standards of the PCAOB. Those standards require that we plan and perform the audit to obtain reasonable assurance about whether the financial statements are free of material misstatement, whether due to error or fraud.
Our audits included performing procedures to assess the risks of material misstatement of the financial statements, whether due to error or fraud, and performing procedures that respond to those risks. Such procedures included examining, on a test basis, evidence regarding the amounts and disclosures in the financial statements. Our audits also included evaluating the accounting principles used and significant estimates made by management, as well as evaluating the overall presentation of the financial statements. Our procedures included confirmation of securities owned as of December 31, 2018 by correspondence with the custodian, transfer agentand brokers; when replies were not received from brokers, we performed other auditing procedures. We believe that our audits provide a reasonable basis for our opinions.
/s/ PricewaterhouseCoopers LLP
Baltimore, Maryland
February 20, 2019
We have served as the auditor of one or more investment companies in TIAA-CREF Funds’ investment company group since 2005.
109
Item 7. Disclosure of Proxy Voting Policies and Procedures forClosed-End Management Investment Companies.
Not Applicable.
Item 8. Portfolio Managers ofClosed-End Management Investment Companies.
Not Applicable.
Item 9. Purchases of Equity Securities byClosed-End Management Investment Company and Affiliated Purchasers.
Not Applicable.
Item 10. Submission of Matters to a Vote of Security Holders.
There were no material changes to the procedures by which shareholders may recommend nominees to the Registrant’s Board of Trustees.
Item 11. Controls and Procedures.
(a) An evaluation was performed within 90 days of the filing date of the report under the supervision of the Registrant’s management, including the principal executive officer and principal financial officer, of the effectiveness of the design and operation of the Registrant’s disclosure controls and procedures. Based on that evaluation, the Registrant’s management, including the principal executive officer and principal financial officer, concluded that the Registrant’s disclosure controls and procedures were effective for this annual reporting period.
(b) There were no changes in the Registrant’s internal control over financial reporting that occurred during the Registrant’s annual period covered by this report that materially affected, or are reasonably likely to materially affect, the Registrant’s internal control over financial reporting.
Item 12. Exhibits.
12(a)(1) Copy of current SOX code of ethics for Senior Financial Officers
12(a)(2)(i) Section 302 certification of the principal executive officer
12(a)(2)(ii) Section 302 certification of the principal financial officer
12(b) Section 906 certification of principal executive officer and principal financial officer
SIGNATURES
Pursuant to the requirements of the Securities Exchange Act of 1934 and the Investment Company Act of 1940, the Registrant has duly caused this report to be signed on its behalf by the undersigned, thereunto duly authorized.
| | | | | | | | |
| | | | TIAA-CREF LIFE FUNDS |
| | | | |
| Dated: February 20, 2019 | | | | By: | | /s/ Bradley Finkle | | |
| | | | | | Bradley Finkle |
| | | | | | Principal Executive Officer and President |
|
Pursuant to the requirements of the Securities Exchange Act of 1934 and the Investment Company Act of 1940, this report has been signed below by the following persons on behalf of the Registrant and in the capacities and on the dates indicated. |
| | | | |
| Dated: February 20, 2019 | | | | By: | | /s/ Bradley Finkle | | |
| | | | | | Bradley Finkle |
| | | | | | Principal Executive Officer and President (principal executive officer) |
| | | | |
| Dated: February 20, 2019 | | | | By: | | /s/ E. Scott Wickerham | | |
| | | | | | E. Scott Wickerham |
| | | | | | Principal Financial Officer, Principal Accounting Officer and Treasurer |
| | | | | | (principal financial officer) |
EXHIBIT INDEX
Item 12. Exhibits.
12(a)(1) Copy of current SOX code of ethics for Senior Financial Officers
12(a)(2)(i) Section 302 certification of the principal executive officer
12(a)(2)(ii) Section 302 certification of the principal financial officer
12(b) Section 906 certification of principal executive officer and principal financial officer