| | | |
| Vanguard® Money Market Funds | | |
| | | |
| | | |
| > Annual Report | | |
| | | |
| | | |
| | | |
| | | |
| August 31, 2006 | | |
| | | |
| 
|
| | | |
| Vanguard Prime Money Market Fund | |
| | |
| Vanguard Federal Money Market Fund | |
| | |
| Vanguard Treasury Money Market Fund | |
| | |
| Vanguard Admiral™ Treasury Money Market Fund | |
| | | | |
> | The returns of Vanguard’s four money market funds for the fiscal year ended |
| August 31, 2006, ranged from 4.1% to 4.6%, reflecting differences in the funds’ |
| investment mandates and costs. |
| |
| |
> | Yields rose sharply for all of the funds, reflecting seven increases in the federal |
| funds rate during the funds’ fiscal year. |
| |
| |
> | The funds’ long-term returns remain comfortably ahead of the returns of their |
| peer-group averages. |
Contents | |
| |
Your Fund’s Total Returns | 1 |
Chairman’s Letter | 2 |
Advisor’s Report | 7 |
Prime Money Market Fund | 9 |
Federal Money Market Fund | 26 |
Treasury Money Market Fund | 36 |
Admiral Treasury Money Market Fund | 45 |
About Your Fund’s Expenses | 56 |
Trustees Renew Advisory Arrangement | 58 |
Glossary | 59 |
Please note: The opinions expressed in this report are just that—informed opinions. They should not be considered promises or advice. Also, please keep in mind that the information and opinions cover the period through the date on the cover of this report. Of course, the risks of investing in your fund are spelled out in the prospectus.
Your Fund’s Total Returns
Fiscal Year Ended August 31, 2006 | | | |
| | | SEC 7-Day |
| | Average | Annualized |
| Vanguard | Competing | Yield2 |
Vanguard Money Market Fund | Fund | Fund1 | 8/31/2006 |
Prime | | | |
Investor Shares | 4.4% | 3.7% | 5.1% |
Institutional Shares3 | 4.6 | 4.2 | 5.3 |
Federal | 4.3 | 3.8 | 5.1 |
Treasury | 4.1 | 3.5 | 4.8 |
Admiral Treasury4 | 4.2 | 3.5 | 4.9 |
1 Peer groups are: for the Prime Money Market Fund Investor Shares, the Average Money Market Fund; for the Prime Money Market Fund Institutional Shares, the Average Institutional Money Market Fund; for the Federal Money Market Fund, the Average Government Money Market Fund; for the Treasury and Admiral Treasury Money Market Funds, the iMoneyNet Money Fund Report’s Average 100% Treasury Fund. For the Prime and Federal Money Market Funds, derived from data provided by Lipper Inc.; for the Treasury and Admiral Treasury Money Market Funds, data provided by iMoneyNet, Inc.
2 SEC 7-day annualized yield as of August 31, 2006. The yield of a money market fund more closely reflects the current earnings of the fund than its total return.
3 This class of shares carries low expenses and is available for a minimum initial investment of $5 million.
4 Minimum initial investment is $50,000.
1

Chairman’s Letter
Dear Shareholder,
The Federal Reserve Board’s campaign to boost interest rates resulted in seven rate increases during your fund’s fiscal year. Yields of Vanguard’s money market funds rose accordingly, enhancing their returns. For the year ended August 31, 2006, total returns ranged from 4.1% for the Treasury Money Market Fund to 4.6% for the Prime Money Market Fund’s Institutional Shares. Each of the funds produced a return that exceeded the average return of its mutual fund peers.
The funds’ competitive advantage comes largely from their lower costs. The table on page 4 illustrates this advantage by comparing each fund’s expense ratio with that of its peer group average. The table on page 5 shows the changes in yield over the year for each fund.
Rising interest rates dampened bond returns
At its August 8, 2006, meeting, the Federal Reserve Board left its target for the federal funds rate unchanged, at 5.25%. This brought at least a temporary halt to the Fed’s two-year inflation-fighting campaign, which had been marked by 17 consecutive rate hikes.
The broad market for taxable U.S. bonds finished the one-year period with a modest return of 1.7%. Municipal bonds fared somewhat better. The yield curve remained essentially flat, with a very small
2
difference between the yields of 3-month and 30-year U.S. Treasury issues, although yields rose modestly at both ends of the maturity spectrum.
Stocks climbed for much of the year, then began to waver
During the fiscal year, stocks climbed steadily through the first three quarters, before becoming increasingly volatile amid concerns over higher oil prices and fears that the U.S. economy was stalling. Indeed, the marked slowdown in the housing market in recent months suggests that the economy may have shifted into a lower gear.
The broad U.S. stock market gained 8.8% for the year, with small-capitalization stocks slightly outperforming their large-cap counterparts. As has been the case for the past several years, returns from international equities continued to outshine domestic stocks. For U.S.-based investors, a weaker dollar further boosted these returns when international gains were converted back into U.S. dollars.
Money market funds’ fate tied to federal funds rate
The rising interest rate environment that prevailed for the year ended August 31, 2006, led to the funds’ highest returns since 2001, when the Fed cut rates sharply to stimulate an economy shaken by terrorist attacks.
Market Barometer | | | |
| | Average Annual Total Returns |
| | Periods Ended August 31, 2006 |
| One Year | Three Years | Five Years |
Bonds | | | |
Lehman Aggregate Bond Index (Broad taxable market) | 1.7% | 4.0% | 4.9% |
Lehman Municipal Bond Index | 3.0 | 5.1 | 5.0 |
Citigroup 3-Month Treasury Bill Index | 4.3 | 2.5 | 2.2 |
| | | |
| | | |
Stocks | | | |
Russell 1000 Index (Large-caps) | 8.7% | 11.5% | 5.3% |
Russell 2000 Index (Small-caps) | 9.4 | 14.4 | 10.3 |
Dow Jones Wilshire 5000 Index (Entire market) | 8.8 | 12.0 | 6.1 |
MSCI All Country World Index ex USA (International) | 25.4 | 25.0 | 13.8 |
| | | |
| | | |
CPI | | | |
Consumer Price Index | 3.8% | 3.4% | 2.8% |
| | | | |
3
The funds’ 2006 fiscal year opened with the Fed’s target short-term rate at 3.50%; 12 months later, the rate stood at 5.25%. Money market funds, with holdings that mature much more quickly than those of bond funds, are uniquely positioned to benefit from rising short-term rates.
Each fund met its mandate to generate superior relative returns, provide liquidity, and preserve principal (the share price of each held steady at $1, as is expected but not guaranteed). The variance in the funds’ returns primarily reflects incremental differences in risk exposure and cost within this group of low-risk, low-cost funds. The Prime Money Market Fund typically invests more than half of its assets in high-quality short-term corporate issues, which generally pay higher yields due to the higher risk these issues carry relative to government securities. Returns for the fund’s Institutional Shares—which require an initial investment of at least $5 million—were enhanced by the even lower operating costs that come with economies of scale.
At the other end of the spectrum are the Treasury and Admiral Treasury Money Market Funds. Both funds invest only in U.S. Treasury bills or other securities backed by the “full faith and credit” of the U.S. government. These securities offer unmatched quality, and therefore lower yields than most other money market instruments. In the middle is the Federal Money Market Fund, which seeks to improve on the returns of an all-Treasury portfolio by investing in securities that—while of high quality—need not be backed
Expense Ratios1 | | |
Your fund compared with its peer group | | |
| Fund | Peer Group |
| Expense | Expense |
Money Market Fund | Ratio | Ratio |
Prime | | |
Investor Shares | 0.29% | 0.87% |
Institutional Shares | 0.09 | 0.45 |
Federal | 0.29 | 0.77 |
Treasury | 0.29 | 0.75 |
Admiral Treasury | 0.13 | 0.75 |
1 Fund expense ratios reflect the fiscal year ended August 31, 2006. Peer groups are: for the Prime Money Market Fund Investor Shares, the Average Money Market Fund; for the Prime Money Market Institutional Shares, the Average Institutional Money Market Fund; for the Federal Money Market Fund, the Average Government Money Market Fund; for the Treasury and Admiral Treasury Money Market Funds, the Average U.S. Treasury Money Market Fund. Peer-group expense ratios are derived from data provided by Lipper Inc. and capture information through year-end 2005. by the government’s full faith and credit, thus providing opportunities for higher yield.
4
During the fiscal year, the funds’ advisor, Vanguard Fixed Income Group, kept the portfolios’ maturities relatively short. As their short-term holdings matured, the funds were well positioned to take advantage of the higher yields paid by newly issued securities in the period.
The funds have demonstrated excellent long-term performance
The Vanguard Money Market Funds have delivered outstanding performance over the long term, as their cost advantage compounds to impressive effect. The funds also benefit from the investment-management skills of our Fixed Income Group, whose portfolio managers have for 25 years demonstrated an ability to select the best mix of securities matching each fund’s investment mandate.
The table on page 6 shows the average annual returns for the funds and their average peers for the ten years ended August 31, 2006. It also shows the growth of hypothetical $10,000 investments in each ($50,000 for the Admiral Treasury Money Market Fund; $5 million for the Prime Money Market Fund’s Institutional Shares). In each case, our money market fund would have produced a higher total return than its average peer.
Higher rates shouldn’t change role of money market funds
When interest rates have climbed and money market funds and certificates of deposit look more attractive, investors
Changes in Yields | | |
| SEC 7-Day Annualized Yield |
| August 31, | August 31, |
Money Market Fund | 2006 | 2005 |
Prime | | |
Investor Shares | 5.11% | 3.22% |
Institutional Shares | 5.31 | 3.42 |
Federal | 5.05 | 3.22 |
Treasury | 4.75 | 3.05 |
Admiral Treasury | 4.92 | 3.21 |
5
can be tempted to overweight these investments in their portfolios. If you find yourself among this group, it’s worth asking: “What in my situation has changed to merit a change in my asset allocation?” We encourage investors to implement an asset allocation plan based on their tolerance for risk (that is, the amount of volatility in the stock market that they can stomach), their time horizon, and their investment goals. Such a portfolio should be broadly diversified among the stock and bond markets, with a small slice reserved for emergency reserves in a money market fund. The Vanguard Money Market Funds are ideal for that portion of your portfolio.
That said, shifting a larger proportion of your assets into money market funds as rates rise can keep you from benefiting from the higher returns expected from stock and bond funds. If you are a long-term investor, we encourage you not to abandon your carefully chosen asset allocation strategy by reacting to the continual fluctuations in interest rates that characterize dynamic financial markets.
Thank you for entrusting your assets to Vanguard.
Sincerely,

John J. Brennan
Chairman and Chief Executive Officer
September 14, 2006
Total Returns | | | | | |
Ten Years Ended August 31, 2006 | | | | |
| Average Annual Return | | | Final Value of a $10,000 Initial Investment1 |
| | Average | | | Average |
| Vanguard | Competing | | Vanguard | Competing |
Money Market Fund | Fund | Fund | | Fund | Fund |
Prime | | | | | |
Investor Shares | 3.8% | 3.2% | $ | 14,475 | $ 13,684 |
Institutional Shares | 4.0 | 3.6 | | 7,377,878 | 7,143,342 |
Federal | 3.7 | 3.2 | | 14,419 | 13,731 |
Treasury | 3.5 | 3.1 | | 14,111 | 13,581 |
Admiral Treasury | 3.7 | 3.1 | | 71,757 | 67,904 |
1 For Prime Money Market Fund Institutional Shares, final value of a $5 million initial investment; for Admiral Treasury Money Market Fund, final value of a $50,000 initial investment.
6
Advisor’s Report
During the 12 months ended August 31, 2006, the Vanguard Money Market Funds generated returns ranging from 4.1% for the Treasury Money Market Fund to 4.6% for the Institutional Shares of the Prime Money Market Fund. All four funds outperformed the average returns of their peer groups.
The investment environment
It could not go on forever. At its August 8 meeting, the Federal Reserve Board elected to leave its target for the federal funds rate unchanged, snapping a streak of 17 consecutive rate hikes. The decision suspended the chain of events that brought the yield of Vanguard Prime Money Market Fund’s Investor Shares from a low of 0.74% in 2004 to 5.11% as of August 31, 2006.
While a pause may not imply the end of the tightening cycle, the number of investors concerned by weakness in the housing market seems to have overtaken those of us more squarely focused on elevated inflation risks. Regional housing conditions are likely to vary widely, but absent a broad national downturn in housing or a rapid escalation in the unemployment rate (currently 4.7%), fears of a housing-led recession appear overdone.
Management of the funds
Despite the Fed’s recent pause, the past 12 months featured a continuation of the rising-rate themes that have characterized the money markets since June 2004. As the Fed tightened monetary policy with seven consecutive 25-basis-point rate hikes during the fiscal year, we kept the average maturities of the Federal and Prime Money Market Funds at the short, or bearish, ends of their typical ranges. This positioning allowed us to reinvest maturing issues more frequently, locking in higher interest rates as they became available.
The Treasury and Admiral Treasury Money Market Funds followed a different strategy. We kept the portfolios’ average maturities in their neutral band. This positioning allowed us to take advantage of the relative “steepness” of the U.S. Treasury yield curve—a spread between shorter-and longer-term Treasury bill yields that reflects the unique supply and demand dynamics of the Treasury bill market.
The two Treasury Money Market Funds were invested primarily in Treasury bills while the Federal and Prime Money Market Funds’ portfolios maintained their customary emphasis on highly liquid securities that offer superior credit quality.
7
Consistent with this objective, we looked for opportunities to enhance the credit quality of each portfolio. For example, when the spreads between Treasuries (the highest-quality securities) and other money market instruments tightened, we added Treasuries to both portfolios to take advantage of the securities’ superior risk–reward characteristics. We also added U.S. government agency securities to the Prime Money Market Fund’s portfolio of highly liquid bank obligations and commercial paper.
The Vanguard Money Market Funds’ strong performances relative to their peer groups reflected not only disciplined portfolio management but also the funds’ low costs. Low costs are an important contributor to investment success in any asset class. In the market for relatively low-yielding short-term securities, however, costs loom especially large.
David R. Glocke, Principal
Vanguard Fixed Income Group
September 20, 2006
8
Prime Money Market Fund
Fund Profile | |
As of August 31, 2006 | |
| |
Financial Attributes | |
| |
Yield | |
Investor Shares | 5.1% |
Institutional Shares | 5.3% |
Average Weighted Maturity | 39 days |
Average Quality1 | Aa1 |
Expense Ratio | |
Investor Shares | 0.29% |
Institutional Shares | 0.09% |
Distribution by Credit Quality1(% of portfolio) | |
| |
Aaa | 30% |
Aa | 65 |
A | 5 |
Sector Diversification (% of portfolio) | |
| |
Banker’s Acceptances | 3% |
Finance | |
Commercial Paper | 29 |
Certificates of Deposit | 45 |
Treasury/Agency | 13 |
Other | 10 |
1 Moody’s Investors Service.
See page 59 for a glossary of investment terms.
9
Prime Money Market Fund
Performance Summary
Investment returns will fluctuate. All of the returns in this report represent past performance, which is not a guarantee of future results that may be achieved by the fund. (For performance data current to the most recent month-end, which may be higher or lower than that cited, visit our website at www.vanguard.com.) The returns shown do not reflect taxes that a shareholder would pay on fund distributions. An investment in a money market fund is not insured or guaranteed by the Federal Deposit Insurance Corporation or any other government agency. Although the fund seeks to preserve the value of your investment at $1 per share, it is possible to lose money by investing in the fund. The annualized yields shown reflect the current earnings of the fund more closely than do the average annual returns.
Cumulative Performance: August 31, 1996–August 31, 2006
Initial Investment of $10,000
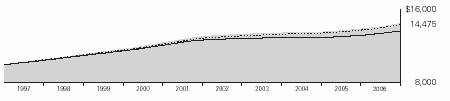
| Average Annual Total Returns | Final Value |
| Periods Ended August 31, 2006 | of a $10,000 |
| One Year | Five Years | Ten Years | Investment |
Prime Money Market Fund Investor Shares | 4.38% | 2.14% | 3.77% | $14,475 |
Citigroup 3-Month Treasury Index | 4.27 | 2.20 | 3.68 | 14,351 |
Average Money Market Fund1 | 3.68 | 1.54 | 3.19 | 13,684 |
| | | | Final Value of |
| | | | a $5,000,000 |
| One Year | Five Years | Ten Years | Investment |
Prime Money Market Fund Institutional Shares | 4.58% | 2.35% | 3.97% | $7,377,878 |
Citigroup 3-Month Treasury Index | 4.27 | 2.20 | 3.68 | 7,175,389 |
Average Institutional Money Market Fund1 | 4.21 | 1.98 | 3.63 | 7,143,342 |
1 Returns for Average Money Market Fund and Average Institutional Money Market Fund are derived from data provided by Lipper Inc.
Note: See Financial Highlights tables on pages 23 and 24 for dividend information.
10
Prime Money Market Fund
Fiscal-Year Total Returns (%): August 31, 1996–August 31, 2006 | |
| Prime Money Market Fund | Average |
Fiscal Year | Investor Shares | Fund1 |
1997 | 5.4% | 4.8% |
1998 | 5.5 | 4.9 |
1999 | 5.0 | 4.4 |
2000 | 5.9 | 5.3 |
2001 | 5.4 | 4.8 |
2002 | 2.1 | 1.4 |
2003 | 1.1 | 0.6 |
2004 | 0.8 | 0.4 |
2005 | 2.3 | 1.7 |
2006 | 4.4 | 3.7 |
SEC 7-Day Annualized Yield (8/31/2006): 5.11% | | |
Average Annual Total Returns: Periods Ended June 30, 2006 | | |
This table presents average annual total returns through the latest calendar quarter—rather than through the end of the fiscal period. Securities and Exchange Commission rules require that we provide this information. |
| | | | |
| Inception Date | One Year | Five Years | Ten Years |
Prime Money Market Fund | | | | |
Investor Shares | 6/4/1975 | 4.03% | 2.09% | 3.77% |
Institutional Shares | 10/3/1989 | 4.23 | 2.30 | 3.97 |
1 Returns for Average Money Market Fund are derived from data provided by Lipper Inc.
11
Prime Money Market Fund
Financial Statements
Statement of Net Assets
As of August 31, 2006
The fund provides a complete list of its holdings four times in each fiscal year, at the quarter-ends. For the second and fourth fiscal quarters, the lists appear in the fund’s semiannual and annual reports to shareholders. For the first and third fiscal quarters, the fund files the lists with the Securities and Exchange Commission on Form N-Q. Shareholders can look up the fund’s Forms N-Q on the SEC’s website at www.sec.gov. Forms N-Q may also be reviewed and copied at the SEC’s Public Reference Room (see the back cover of this report for further information).
| | | Face | Market |
| | Maturity | Amount | Value• |
| Yield1 | Date | ($000) | ($000) |
U.S. Government and Agency Obligations (13.7%) | | | |
2 Federal Home Loan Bank | 5.095%–5.131% | 9/1/06 | 833,169 | 833,169 |
2 Federal Home Loan Bank | 5.221% | 9/6/06 | 968,480 | 967,781 |
2 Federal Home Loan Bank | 5.167% | 9/8/06 | 885,000 | 884,122 |
2 Federal Home Loan Bank | 5.206% | 9/13/06 | 132,000 | 131,774 |
2 Federal Home Loan Bank | 5.295% | 9/20/06 | 32,000 | 31,912 |
2 Federal Home Loan Bank | 5.393% | 9/29/06 | 496,242 | 494,189 |
2 Federal National Mortgage Assn. | 5.295% | 9/13/06 | 59,480 | 59,376 |
2 Federal National Mortgage Assn. | 5.306% | 9/20/06 | 147,000 | 146,594 |
2 Federal National Mortgage Assn. | 5.360% | 10/4/06 | 199,502 | 198,535 |
U.S. Treasury Bill | 5.151% | 9/7/06 | 2,000,000 | 1,998,290 |
U.S. Treasury Bill | 5.183% | 9/15/06 | 3,000,000 | 2,993,965 |
U.S. Treasury Bill | 5.049% | 11/9/06 | 1,000,000 | 990,445 |
Total U.S. Government and Agency Obligations | | | |
(Cost $9,730,152) | | | | 9,730,152 |
Commercial Paper (30.4%) | | | | |
Bank Holding Company (0.9%) | | | | |
HSBC USA, Inc. | 5.380% | 9/19/06 | 125,000 | 124,668 |
HSBC USA, Inc. | 5.440% | 9/22/06 | 191,000 | 190,402 |
HSBC USA, Inc. | 5.426% | 10/23/06 | 49,000 | 48,621 |
HSBC USA, Inc. | 5.430% | 11/6/06 | 95,000 | 94,068 |
State Street Corp. | 5.402% | 10/26/06 | 164,000 | 162,665 |
State Street Corp. | 5.393% | 10/30/06 | 20,000 | 19,826 |
| | | | 640,250 |
Finance—Auto (1.0%) | | | | |
DaimlerChrysler Rev. Auto Conduit LLC 1 | 5.249% | 9/6/06 | 45,000 | 44,968 |
DaimlerChrysler Rev. Auto Conduit LLC 1 | 5.292% | 9/12/06 | 48,000 | 47,923 |
DaimlerChrysler Rev. Auto Conduit LLC 2 | 5.398% | 9/6/06 | 88,592 | 88,526 |
Toyota Motor Credit Corp. | 5.443% | 10/11/06 | 98,000 | 97,415 |
Toyota Motor Credit Corp. | 5.412% | 10/30/06 | 255,000 | 252,768 |
Toyota Motor Credit Corp. | 5.423% | 11/2/06 | 124,000 | 122,857 |
Toyota Motor Credit Corp. | 5.331% | 11/20/06 | 47,000 | 46,451 |
| | | | 700,908 |
Finance—Other (6.0%) | | | | |
American Express Credit Corp. | 5.378% | 9/19/06 | 198,000 | 197,472 |
3 CRC Funding, LLC | 5.188% | 9/5/06 | 100,000 | 99,943 |
3 CRC Funding, LLC | 5.441% | 10/12/06 | 50,000 | 49,694 |
3 Cafco, LLC | 5.376% | 11/13/06 | 116,000 | 114,752 |
12
Prime Money Market Fund
| | | Face | Market |
| | Maturity | Amount | Value• |
| Yield1 | Date | ($000) | ($000) |
General Electric Capital Corp. | 5.268% | 9/11/06 | 202,000 | 201,708 |
General Electric Capital Corp. | 5.443% | 9/27/06 | 108,000 | 107,581 |
General Electric Capital Corp. | 5.433% | 10/5/06 | 26,000 | 25,868 |
General Electric Capital Corp. | 5.443% | 10/18/06 | 532,000 | 528,270 |
General Electric Capital Corp. | 5.392% | 11/2/06 | 314,000 | 311,123 |
3 GovCo Inc. | 5.188% | 9/5/06 | 98,000 | 97,944 |
3 GovCo Inc. | 5.260% | 9/8/06 | 16,000 | 15,984 |
3 GovCo Inc. | 5.275% | 9/12/06 | 49,000 | 48,922 |
3 GovCo Inc. | 5.465% | 10/6/06 | 25,000 | 24,869 |
3 GovCo Inc. | 5.465%–5.468% | 10/10/06 | 242,000 | 240,587 |
3 GovCo Inc. | 5.465% | 10/12/06 | 12,000 | 11,926 |
3 GovCo Inc. | 5.445% | 10/17/06 | 50,000 | 49,657 |
3 GovCo Inc. | 5.485% | 10/19/06 | 23,000 | 22,834 |
3 GovCo Inc. | 5.436% | 10/23/06 | 395,000 | 391,942 |
3 GovCo Inc. | 5.454% | 10/25/06 | 15,100 | 14,978 |
3 GovCo Inc. | 5.457% | 11/6/06 | 50,000 | 49,507 |
3 GovCo Inc. | 5.349%–5.351% | 11/20/06 | 152,000 | 150,218 |
3 Liberty Street Funding Corp. | 5.323% | 9/5/06 | 30,000 | 29,982 |
3 Liberty Street Funding Corp. | 5.454% | 9/15/06 | 6,000 | 5,987 |
3 Liberty Street Funding Corp. | 5.291% | 10/3/06 | 150,000 | 149,299 |
3 Old Line Funding LLC | 5.387% | 9/5/06 | 35,450 | 35,429 |
3 Old Line Funding LLC | 5.388% | 9/6/06 | 50,740 | 50,702 |
3 Old Line Funding LLC | 5.385% | 9/7/06 | 83,000 | 82,926 |
3 Old Line Funding LLC | 5.330% | 9/14/06 | 26,617 | 26,566 |
3 Old Line Funding LLC | 5.294% | 9/15/06 | 20,000 | 19,959 |
3 Old Line Funding LLC | 5.309%–5.345% | 9/21/06 | 64,000 | 63,811 |
3 Park Avenue Receivables Co. LLC | 5.323% | 9/5/06 | 131,381 | 131,304 |
3 Park Avenue Receivables Co. LLC | 5.324% | 9/6/06 | 128,000 | 127,906 |
3 Park Avenue Receivables Co. LLC | 5.296% | 10/10/06 | 35,021 | 34,821 |
3 Park Avenue Receivables Co. LLC | 5.299% | 10/11/06 | 101,766 | 101,171 |
3 Park Avenue Receivables Co. LLC | 5.302% | 10/17/06 | 98,000 | 97,341 |
3 Preferred Receivables Funding Co. LLC | 5.429% | 9/13/06 | 10,000 | 9,982 |
3 Variable Funding Capital Co., LLC | 5.272% | 9/8/06 | 5,000 | 4,995 |
3 Variable Funding Capital Co., LLC | 5.357% | 10/3/06 | 194,000 | 193,084 |
3 Variable Funding Capital Co., LLC | 5.342% | 10/6/06 | 327,000 | 325,317 |
| | | | 4,246,361 |
Foreign Banks (15.8%) | | | | |
ABN–AMRO NA Finance Inc. | 5.393% | 11/3/06 | 186,200 | 184,467 |
ANZ (Delaware) Inc. | 5.328% | 10/10/06 | 49,000 | 48,720 |
ANZ (Delaware) Inc. | 5.350% | 10/11/06 | 200,000 | 198,822 |
ANZ (Delaware) Inc. | 5.419% | 10/18/06 | 288,000 | 285,990 |
ANZ (Delaware) Inc. | 5.427% | 10/27/06 | 100,000 | 99,168 |
CBA (Delaware) Finance Inc. | 5.208% | 9/5/06 | 57,825 | 57,792 |
CBA (Delaware) Finance Inc. | 5.371% | 9/14/06 | 64,750 | 64,626 |
CBA (Delaware) Finance Inc. | 5.280%–5.372% | 9/15/06 | 456,500 | 455,571 |
CBA (Delaware) Finance Inc. | 5.388% | 9/19/06 | 225,000 | 224,402 |
CBA (Delaware) Finance Inc. | 5.441% | 9/29/06 | 14,000 | 13,942 |
CBA (Delaware) Finance Inc. | 5.455% | 10/6/06 | 290,000 | 288,483 |
CBA (Delaware) Finance Inc. | 5.454% | 10/23/06 | 185,000 | 183,562 |
CBA (Delaware) Finance Inc. | 5.434% | 10/24/06 | 30,000 | 29,763 |
3 Danske Corp. | 5.266% | 9/14/06 | 64,100 | 63,980 |
3 Danske Corp. | 5.374% | 9/21/06 | 405,000 | 403,808 |
3 Danske Corp. | 5.444% | 9/25/06 | 31,000 | 30,889 |
3 Danske Corp. | 5.428%–5.431% | 10/19/06 | 174,000 | 172,758 |
3 Danske Corp. | 5.409% | 10/25/06 | 195,995 | 194,425 |
13
Prime Money Market Fund
| | | Face | Market |
| | Maturity | Amount | Value• |
| Yield1 | Date | ($000) | ($000) |
3 Danske Corp. | 5.427% | 11/6/06 | 495,000 | 490,145 |
Dexia Delaware LLC | 5.337% | 11/21/06 | 237,000 | 234,192 |
European Investment Bank | 5.247% | 10/11/06 | 66,930 | 66,543 |
European Investment Bank | 5.265% | 11/22/06 | 1,081,000 | 1,068,208 |
HBOS Treasury Services PLC | 5.226%–5.232% | 9/5/06 | 142,263 | 142,182 |
HBOS Treasury Services PLC | 5.460% | 9/26/06 | 14,000 | 13,948 |
HBOS Treasury Services PLC | 5.457% | 10/10/06 | 34,000 | 33,802 |
HBOS Treasury Services PLC | 5.434% | 10/18/06 | 200,000 | 198,600 |
HBOS Treasury Services PLC | 5.446% | 10/26/06 | 57,000 | 56,532 |
HBOS Treasury Services PLC | 5.399% | 11/9/06 | 25,000 | 24,745 |
ING (U.S.) Funding LLC | 5.445% | 9/26/06 | 125,000 | 124,534 |
ING (U.S.) Funding LLC | 5.446% | 9/27/06 | 100,000 | 99,612 |
ING (U.S.) Funding LLC | 5.426% | 10/30/06 | 120,000 | 118,948 |
ING (U.S.) Funding LLC | 5.336% | 11/27/06 | 34,000 | 33,568 |
Lloyds TSB Bank PLC | 5.319% | 9/20/06 | 31,000 | 30,914 |
3 National Australia Funding (Delaware) | 5.247% | 9/1/06 | 275,000 | 275,000 |
3 National Australia Funding (Delaware) | 5.292% | 9/5/06 | 196,000 | 195,885 |
3 National Australia Funding (Delaware) | 5.324% | 9/8/06 | 400,000 | 399,588 |
Nordea North America Inc. | 5.218%–5.219% | 9/1/06 | 81,000 | 81,000 |
Nordea North America Inc. | 5.252%–5.264% | 9/11/06 | 96,500 | 96,361 |
Nordea North America Inc. | 5.464% | 10/19/06 | 28,500 | 28,295 |
Nordea North America Inc. | 5.368%–5.373% | 11/8/06 | 252,000 | 249,478 |
Nordea North America Inc. | 5.335% | 11/27/06 | 220,000 | 217,203 |
Rabobank USA Financial Corp. | 5.423% | 10/3/06 | 45,000 | 44,786 |
Santander Central Hispano Finance (Delaware) Inc. | 5.249% | 9/7/06 | 23,000 | 22,980 |
Santander Central Hispano Finance (Delaware) Inc. | 5.312% | 10/17/06 | 15,000 | 14,899 |
Santander Central Hispano Finance (Delaware) Inc. | 5.440% | 10/27/06 | 17,000 | 16,858 |
Santander Central Hispano Finance (Delaware) Inc. | 5.392% | 11/6/06 | 332,000 | 328,762 |
Societe Generale N.A. Inc. | 5.430% | 10/11/06 | 15,000 | 14,911 |
Societe Generale N.A. Inc. | 5.435% | 11/1/06 | 577,500 | 572,255 |
Svenska Handelsbanken, Inc. | 5.457% | 10/10/06 | 31,000 | 30,819 |
Svenska Handelsbanken, Inc. | 5.441% | 10/30/06 | 20,000 | 19,824 |
Svenska Handelsbanken, Inc. | 5.346% | 11/27/06 | 495,000 | 488,696 |
UBS Finance (Delaware), LLC | 5.368% | 9/19/06 | 496,000 | 494,687 |
UBS Finance (Delaware), LLC | 5.455% | 10/6/06 | 43,000 | 42,775 |
UBS Finance (Delaware), LLC | 5.454% | 10/12/06 | 146,493 | 145,595 |
UBS Finance (Delaware), LLC | 5.450% | 10/13/06 | 334,000 | 331,906 |
3 Westpac Banking Corp. | 5.215%–5.219% | 9/1/06 | 178,700 | 178,700 |
3 Westpac Banking Corp. | 5.239%–5.266% | 9/7/06 | 103,500 | 103,411 |
3 Westpac Banking Corp. | 5.460% | 9/28/06 | 190,000 | 189,233 |
3 Westpac Banking Corp. | 5.453% | 10/5/06 | 130,000 | 129,339 |
3 Westpac Banking Corp. | 5.431% | 10/24/06 | 80,369 | 79,735 |
3 Westpac Banking Corp. | 5.436% | 10/30/06 | 100,000 | 99,122 |
3 Westpac Banking Corp. | 5.344% | 11/20/06 | 127,000 | 125,513 |
3 Westpac Trust Securities NZ Ltd. | 5.228% | 9/1/06 | 52,500 | 52,500 |
3 Westpac Trust Securities NZ Ltd. | 5.440% | 10/18/06 | 228,000 | 226,403 |
3 Westpac Trust Securities NZ Ltd. | 5.436% | 10/23/06 | 17,000 | 16,868 |
3 Westpac Trust Securities NZ Ltd. | 5.437% | 11/6/06 | 15,000 | 14,853 |
3 Westpac Trust Securities NZ Ltd. | 5.393% | 11/8/06 | 149,000 | 147,503 |
| | | | 11,213,384 |
Foreign Finance Other (2.2%) | | | | |
3 IXIS Commercial Paper Corp. | 5.299% | 10/25/06 | 146,000 | 144,850 |
3 IXIS Commercial Paper Corp. | 5.299% | 10/26/06 | 49,000 | 48,607 |
3 IXIS Commercial Paper Corp. | 5.331% | 11/27/06 | 98,000 | 96,754 |
3 KFW International Finance Inc. | 5.197% | 9/7/06 | 542,000 | 541,537 |
14
Prime Money Market Fund
| | | Face | Market |
| | Maturity | Amount | Value• |
| Yield1 | Date | ($000) | ($000) |
3 KFW International Finance Inc. | 5.398% | 10/10/06 | 490,000 | 487,173 |
3 KFW International Finance Inc. | 5.386% | 10/16/06 | 50,000 | 49,668 |
3 KFW International Finance Inc. | 5.388% | 10/17/06 | 168,000 | 166,859 |
| | | | 1,535,448 |
Foreign Government (0.6%) | | | | |
Export Development Canada | 5.396% | 10/24/06 | 35,000 | 34,726 |
Export Development Canada | 5.397% | 10/25/06 | 198,000 | 196,418 |
Export Development Canada | 5.395% | 10/30/06 | 190,000 | 188,343 |
| | | | 419,487 |
Foreign Industrial (3.0%) | | | | |
3 Nestle Capital Corp. | 5.398% | 10/10/06 | 97,000 | 96,440 |
3 Nestle Capital Corp. | 5.348% | 11/2/06 | 35,000 | 34,682 |
3 Nestle Capital Corp. | 5.341% | 11/6/06 | 100,000 | 99,034 |
3 Nestle Capital Corp. | 5.320% | 11/13/06 | 90,625 | 89,660 |
3 Nestle Capital Corp. | 5.298%–5.309% | 11/14/06 | 156,000 | 154,321 |
3 Nestle Capital Corp. | 5.272%–5.277% | 11/27/06 | 200,000 | 197,486 |
Shell International Finance B.V. | 5.413% | 9/29/06 | 80,000 | 79,668 |
3 Total Capital | 5.211% | 9/6/06 | 90,000 | 89,936 |
3 Total Capital | 5.398%–5.404% | 10/17/06 | 1,100,000 | 1,092,512 |
3 Total Capital | 5.351% | 11/7/06 | 182,000 | 180,212 |
3 Unilever Capital Corp. | 5.292% | 9/5/06 | 15,000 | 14,991 |
| | | | 2,128,942 |
Industrial (0.9%) | | | | |
Chevron Funding Corp. | 5.248% | 9/1/06 | 96,000 | 96,000 |
Chevron Funding Corp. | 5.402% | 10/24/06 | 50,000 | 49,608 |
General Electric Co. | 5.268% | 9/11/06 | 98,000 | 97,858 |
3 Wal-Mart Stores, Inc. | 5.252% | 9/19/06 | 225,000 | 224,413 |
3 Wal-Mart Stores, Inc. | 5.267% | 10/11/06 | 60,037 | 59,689 |
3 Wal-Mart Stores, Inc. | 5.299% | 11/7/06 | 44,890 | 44,453 |
3 Wal-Mart Stores, Inc. | 5.310% | 11/13/06 | 22,354 | 22,116 |
3 Wal-Mart Stores, Inc. | 5.308% | 11/21/06 | 20,000 | 19,764 |
3 Wal-Mart Stores, Inc. | 5.321% | 11/27/06 | 19,000 | 18,759 |
| | | | 632,660 |
Total Commercial Paper (Cost $21,517,440) | | | 21,517,440 |
Certificates of Deposit (30.8%) | | | | |
Certificates of Deposit—U.S. Banks (6.7%) | | | |
Branch Banking & Trust Co. | 5.370% | 9/5/06 | 198,000 | 198,000 |
Branch Banking & Trust Co. | 5.410% | 9/20/06 | 294,000 | 294,000 |
Branch Banking & Trust Co. | 5.410% | 9/21/06 | 148,000 | 148,000 |
Citizens Bank N.A. | 5.450% | 9/20/06 | 96,000 | 96,000 |
HSBC Bank USA, N.A. | 5.380% | 11/9/06 | 912,000 | 912,000 |
SunTrust Banks | 5.210% | 9/5/06 | 650,000 | 650,000 |
SunTrust Banks | 5.400% | 10/23/06 | 700,000 | 700,000 |
Wells Fargo Bank, N.A. | 5.380% | 9/5/06 | 905,000 | 905,000 |
Wells Fargo Bank, N.A. | 5.280% | 9/14/06 | 161,000 | 161,000 |
Wells Fargo Bank, N.A. | 5.310% | 9/18/06 | 660,500 | 660,500 |
| | | | 4,724,500 |
Yankee Certificates of Deposit—U.S. Branches (24.1%) | | | |
Abbey National Treasury Services PLC | | | | |
(Stamford Branch) | 5.220% | 9/5/06 | 940,000 | 940,000 |
Abbey National Treasury Services PLC | | | | |
(Stamford Branch) | 5.430% | 10/17/06 | 64,000 | 64,000 |
Australia and New Zealand Banking Group Ltd. | | | |
(New York Branch) | 5.430% | 10/13/06 | 96,100 | 96,100 |
15
Prime Money Market Fund
| | | Face | Market |
| | Maturity | Amount | Value• |
| Yield1 | Date | ($000) | ($000) |
Australia and New Zealand Banking Group Ltd. | | | | |
(New York Branch) | 5.420% | 10/24/06 | 195,000 | 195,000 |
BNP Paribas (New York Branch) | 5.240% | 9/8/06 | 25,000 | 25,000 |
BNP Paribas (New York Branch) | 5.275% | 9/13/06 | 600,000 | 600,000 |
BNP Paribas (New York Branch) | 5.310% | 9/18/06 | 296,000 | 296,000 |
BNP Paribas (New York Branch) | 5.440% | 10/19/06 | 120,000 | 120,000 |
BNP Paribas (New York Branch) | 5.430% | 11/1/06 | 175,000 | 175,000 |
BNP Paribas (New York Branch) | 5.445% | 11/7/06 | 305,000 | 305,000 |
BNP Paribas (New York Branch) | 5.345% | 11/24/06 | 67,000 | 67,000 |
Bank of Montreal (Chicago Branch) | 5.280% | 9/11/06 | 196,000 | 196,000 |
Bank of Montreal (Chicago Branch) | 5.450% | 10/20/06 | 328,000 | 328,000 |
Bank of Montreal (Chicago Branch) | 5.450% | 10/31/06 | 558,000 | 558,000 |
Bank of Nova Scotia (Portland Branch) | 5.460% | 10/24/06 | 118,000 | 118,000 |
Barclays Bank PLC (New York Branch) | 5.210% | 9/5/06 | 34,000 | 34,000 |
Barclays Bank PLC (New York Branch) | 5.440% | 9/26/06 | 100,000 | 100,000 |
Barclays Bank PLC (New York Branch) | 5.360% | 10/10/06 | 83,000 | 83,000 |
Barclays Bank PLC (New York Branch) | 5.450% | 10/16/06 | 62,000 | 62,000 |
Barclays Bank PLC (New York Branch) | 5.430% | 10/20/06 | 25,000 | 25,000 |
Barclays Bank PLC (New York Branch) | 5.480% | 10/20/06 | 131,600 | 131,604 |
Barclays Bank PLC (New York Branch) | 5.460% | 10/26/06 | 307,000 | 307,000 |
Barclays Bank PLC (New York Branch) | 5.350% | 11/20/06 | 665,000 | 665,000 |
Barclays Bank PLC (New York Branch) | 5.340% | 11/28/06 | 300,000 | 300,000 |
Calyon (New York Branch) | 5.230% | 9/6/06 | 50,000 | 50,000 |
Canadian Imperial Bank of Commerce | | | | |
(New York Branch) | 5.400% | 10/6/06 | 160,000 | 160,000 |
Canadian Imperial Bank of Commerce | | | | |
(New York Branch) | 5.340% | 10/10/06 | 279,000 | 279,000 |
Dexia Credit Local S.A. | 5.210% | 9/6/06 | 55,000 | 55,000 |
Dexia Credit Local S.A. | 5.430% | 10/10/06 | 43,000 | 43,000 |
Dexia Credit Local S.A. | 5.430% | 10/17/06 | 260,000 | 260,000 |
Dexia Credit Local S.A. | 5.440% | 10/26/06 | 146,000 | 146,000 |
Dexia Credit Local S.A. | 5.440% | 10/27/06 | 398,000 | 398,000 |
Dexia Credit Local S.A. | 5.390% | 11/6/06 | 607,000 | 607,000 |
Fortis Bank NV-SA (New York Branch) | 5.375% | 9/18/06 | 688,000 | 688,000 |
Fortis Bank NV-SA (New York Branch) | 4.500% | 10/19/06 | 30,450 | 30,405 |
Fortis Bank NV-SA (New York Branch) | 5.470% | 10/24/06 | 247,000 | 247,000 |
Fortis Bank NV-SA (New York Branch) | 5.430% | 10/27/06 | 327,000 | 327,000 |
Fortis Bank NV-SA (New York Branch) | 5.390% | 11/8/06 | 85,000 | 85,000 |
HSH Nordbank AG (New York Branch) | 5.410% | 10/2/06 | 31,000 | 31,000 |
HSH Nordbank AG (New York Branch) | 5.400% | 10/3/06 | 201,000 | 201,000 |
HSH Nordbank AG (New York Branch) | 5.315% | 10/18/06 | 195,000 | 195,000 |
Landesbank Baden-Wuerttemberg (New York Branch) | 5.320% | 10/23/06 | 700,000 | 700,000 |
Nordea Bank Finland PLC (New York Branch) | 5.440% | 9/26/06 | 650,000 | 650,000 |
Nordea Bank Finland PLC (New York Branch) | 5.440% | 10/11/06 | 54,500 | 54,500 |
Rabobank Nederland (New York Branch) | 5.190% | 9/6/06 | 525,000 | 525,000 |
Rabobank Nederland (New York Branch) | 5.400% | 11/1/06 | 43,000 | 43,000 |
Rabobank Nederland (New York Branch) | 5.155% | 11/3/06 | 43,375 | 43,352 |
Rabobank Nederland (New York Branch) | 5.340% | 11/15/06 | 579,000 | 579,000 |
Royal Bank of Canada (New York Branch) | 5.220% | 9/5/06 | 304,000 | 304,000 |
Royal Bank of Canada (New York Branch) | 5.280% | 9/15/06 | 306,000 | 306,000 |
Royal Bank of Canada (New York Branch) | 5.400% | 9/21/06 | 71,225 | 71,224 |
Royal Bank of Canada (New York Branch) | 5.425% | 11/1/06 | 421,000 | 421,000 |
Royal Bank of Scotland PLC (New York Branch) | 5.420% | 10/10/06 | 492,000 | 492,000 |
Royal Bank of Scotland PLC (New York Branch) | 5.420% | 10/25/06 | 997,000 | 997,000 |
Royal Bank of Scotland PLC (New York Branch) | 5.340% | 11/24/06 | 161,000 | 161,000 |
Societe Generale (New York Branch) | 5.290% | 9/15/06 | 280,000 | 280,000 |
Svenska Handelsbanken, AB (New York Branch) | 5.180% | 9/7/06 | 137,000 | 137,000 |
16
Prime Money Market Fund
| | | Face | Market |
| | Maturity | Amount | Value• |
| Yield1 | Date | ($000) | ($000) |
Svenska Handelsbanken, AB (New York Branch) | 5.460% | 10/16/06 | 250,000 | 250,000 |
Svenska Handelsbanken, AB (New York Branch) | 5.300% | 10/23/06 | 220,000 | 220,000 |
Toronto Dominion Bank (New York Branch) | 5.420% | 9/19/06 | 475,000 | 475,000 |
Toronto Dominion Bank (New York Branch) | 5.100% | 10/4/06 | 99,000 | 98,960 |
UBS AG (Stamford Branch) | 5.220% | 9/8/06 | 81,500 | 81,500 |
UBS AG (Stamford Branch) | 5.270% | 9/14/06 | 510,000 | 510,000 |
UBS AG (Stamford Branch) | 5.280% | 9/20/06 | 35,000 | 35,000 |
UBS AG (Stamford Branch) | 4.490% | 10/19/06 | 30,000 | 29,955 |
Westpac Banking Corp. (New York Branch) | 5.320% | 10/10/06 | 23,000 | 23,000 |
| | | | 17,080,600 |
Total Certificates of Deposit (Cost $21,805,100) | | | 21,805,100 |
Eurodollar Certificates of Deposit (16.3%) | | | | |
ABN AMRO Bank N.V. | 5.225% | 9/8/06 | 540,000 | 540,000 |
ABN AMRO Bank N.V. | 5.430% | 10/10/06 | 510,000 | 510,000 |
ABN AMRO Bank N.V. | 5.335% | 11/24/06 | 160,000 | 160,000 |
Australia and New Zealand Banking Group, Ltd. | 5.430% | 10/10/06 | 98,000 | 98,000 |
BNP Paribas | 5.280% | 9/14/06 | 109,000 | 109,000 |
BNP Paribas | 5.440% | 10/11/06 | 49,000 | 49,000 |
Bank of Nova Scotia | 5.280% | 9/14/06 | 229,000 | 229,000 |
Bank of Nova Scotia | 5.300% | 9/14/06 | 153,000 | 152,998 |
Bank of Nova Scotia | 5.310% | 9/18/06 | 343,000 | 343,000 |
Bank of Nova Scotia | 5.410% | 9/18/06 | 100,000 | 100,000 |
Bank of Nova Scotia | 5.410% | 9/18/06 | 250,000 | 250,001 |
Barclays Bank PLC | 5.437% | 10/10/06 | 267,000 | 267,000 |
Barclays Bank PLC | 5.362% | 11/24/06 | 70,000 | 70,000 |
Commonwealth Bank of Australia | 5.280% | 9/18/06 | 65,000 | 65,000 |
Credit Agricole S.A. | 5.285% | 9/15/06 | 63,000 | 63,000 |
Credit Agricole S.A. | 5.460% | 10/16/06 | 46,000 | 46,000 |
Credit Agricole S.A. | 5.475% | 10/23/06 | 500,000 | 500,000 |
Credit Agricole S.A. | 5.435% | 11/6/06 | 709,000 | 709,000 |
Credit Agricole S.A. | 5.355% | 11/30/06 | 350,000 | 350,000 |
Deutsche Bank AG | 5.280% | 9/14/06 | 41,000 | 41,000 |
Deutsche Bank AG | 5.285% | 9/15/06 | 120,000 | 120,000 |
Deutsche Bank AG | 5.330% | 10/18/06 | 245,000 | 245,003 |
Deutsche Bank AG | 5.465% | 10/23/06 | 144,000 | 144,000 |
Deutsche Bank AG | 5.330% | 10/25/06 | 200,000 | 200,006 |
Deutsche Bank AG | 5.370% | 11/16/06 | 500,000 | 500,000 |
Deutsche Bank AG | 5.345% | 11/24/06 | 146,000 | 146,000 |
HBOS Treasury Services PLC | 5.340% | 9/18/06 | 73,000 | 73,000 |
HBOS Treasury Services PLC | 5.440% | 10/19/06 | 522,000 | 522,000 |
HBOS Treasury Services PLC | 5.450% | 11/1/06 | 438,000 | 438,000 |
HBOS Treasury Services PLC | 5.380% | 11/13/06 | 220,000 | 220,004 |
HSBC Bank PLC | 5.240% | 9/8/06 | 48,000 | 48,000 |
HSBC Bank PLC | 5.250% | 9/11/06 | 48,000 | 48,000 |
HSBC Bank PLC | 5.475% | 10/23/06 | 98,000 | 98,000 |
HSBC Bank PLC | 5.445% | 10/26/06 | 98,000 | 98,001 |
HSBC Bank PLC | 5.440% | 10/27/06 | 49,000 | 49,000 |
HSBC Bank PLC | 5.440% | 11/6/06 | 13,000 | 13,000 |
ING Bank N.V. | 5.270% | 9/13/06 | 353,000 | 353,000 |
ING Bank N.V. | 5.460% | 9/29/06 | 262,000 | 262,000 |
ING Bank N.V. | 5.435% | 10/10/06 | 65,000 | 65,000 |
ING Bank N.V. | 5.430% | 11/6/06 | 327,000 | 327,000 |
ING Bank N.V. | 5.350% | 12/1/06 | 300,000 | 300,000 |
Landesbank Hessen-Thuringen | 5.430% | 9/21/06 | 660,000 | 660,000 |
Lloyds TSB Bank PLC | 5.420% | 10/26/06 | 924,000 | 924,000 |
National Australia Bank Ltd. | 5.330% | 11/24/06 | 525,000 | 525,000 |
17
Prime Money Market Fund
| | | Face | Market |
| | Maturity | Amount | Value• |
| Yield1 | Date | ($000) | ($000) |
Societe Generale | 5.450% | 9/28/06 | 128,000 | 128,000 |
Societe Generale | 5.465% | 10/10/06 | 195,000 | 195,000 |
Societe Generale | 5.375% | 11/16/06 | 188,000 | 188,000 |
Total Eurodollar Certificates of Deposit | | | | |
(Cost $11,541,013) | | | | 11,541,013 |
Other Notes (3.0%) | | | | |
Bank of America, N.A. | 5.270% | 9/7/06 | 120,500 | 120,500 |
Bank of America, N.A. | 5.455% | 10/6/06 | 37,000 | 37,000 |
Bank of America, N.A. | 5.460% | 10/10/06 | 210,000 | 210,000 |
Bank of America, N.A. | 5.445% | 10/16/06 | 250,000 | 250,000 |
Bank of America, N.A. | 5.430% | 10/30/06 | 595,000 | 595,000 |
Bank of America, N.A. | 5.350% | 11/16/06 | 467,000 | 467,000 |
Bank of America, N.A. | 5.345% | 11/20/06 | 65,000 | 65,000 |
Bank of America, N.A. | 5.345% | 11/27/06 | 350,000 | 350,000 |
Total Other Notes (Cost $2,094,500) | | | | 2,094,500 |
Repurchase Agreements (9.9%) | | | | |
Bank of America Securities, LLC | | | | |
(Dated 8/31/06, Repurchase Value $759,111,000, | | | | |
collateralized by Federal Farm Credit Bank | | | | |
Discount Note, 1/3/07–5/15/07, Federal Farm | | | | |
Credit Bank 3.000%, 4/15/08, Federal Home Loan | | | | |
Bank Discount Note, 9/8/06–11/29/06, Federal | | | | |
Home Loan Bank 2.625%–5.500%, 9/15/06–7/15/36, | | | | |
Federal Home Loan Mortgage Corp. Discount Note, | | | | |
5/29/07, Federal Home Loan Mortgage Corp. | | | | |
4.750%–5.625%, 3/15/11–11/17/15, Federal National | | | | |
Mortgage Assn. 4.625%–7.125%, 1/15/09–10/15/13) | 5.260% | 9/1/06 | 759,000 | 759,000 |
Barclays Capital, Inc. | | | | |
(Dated 8/31/06, Repurchase Value $953,140,000, | | | | |
collateralized by Federal Farm Credit Bank 2.625%, | | | | |
9/17/07, Federal Home Loan Bank 2.625%–5.125%, | | | | |
10/15/06–8/15/19, Federal Home Loan Mortgage | | | | |
Corp. Discount Note, 10/3/06–3/20/07, Federal | | | | |
Home Loan Mortgage Corp. 3.625%–5.250%, | | | | |
9/15/06–5/21/09, Federal National Mortgage Assn. | | | | |
Discount Note, 10/6/06–6/1/07, Federal National | | | | |
Mortgage Assn. 4.875%, 8/27/07) | 5.270% | 9/1/06 | 953,000 | 953,000 |
Citigroup Global Markets, Inc. | | | | |
(Dated 8/31/06, Repurchase Value $397,129,000, | | | | |
collateralized by Federal Farm Credit Bank Discount | | | | |
Note, 9/22/06, Federal Home Loan Bank Discount | | | | |
Note, 9/6/06, Federal Home Loan Mortgage Corp. | | | | |
Discount Note, 6/26/07, Federal National Mortgage | | | | |
Assn. Discount Note, 9/13/06–12/13/06 Federal | | | | |
National Mortgage Assn. 4.625%–8.100%, | | | | |
3/15/07–8/12/19) | 5.270% | 9/1/06 | 397,071 | 397,071 |
Credit Suisse Securities (USA), LLC | | | | |
(Dated 8/31/06, Repurchase Value $796,117,000, | | | | |
collateralized by Federal Home Loan Mortgage Corp. | | | | |
4.250%–5.750%, 3/15/07–7/15/14, Federal National | | | | |
Mortgage Assn. 3.250%–6.250%, 1/15/08–5/15/29) | 5.280% | 9/1/06 | 796,000 | 796,000 |
18
Prime Money Market Fund
| | | Face | Market |
| | Maturity | Amount | Value• |
| Yield1 | Date | ($000) | ($000) |
Deutsche Bank Securities, Inc. | | | | |
(Dated 8/31/06, Repurchase Value $1,145,168,000, | | | | |
collateralized by Federal Farm Credit Bank 2.625%, | | | | |
9/17/07, Federal Home Loan Bank Discount Note, | | | | |
12/29/06, Federal Home Loan Bank 4.000%, 1/23/07, | | | | |
Federal Home Loan Mortgage Corp. 2.875%–5.625%, | | | | |
12/15/06–1/15/13, Federal National Mortgage Assn. | | | | |
Discount Note, 9/13/06, Federal National Mortgage | | | | |
Assn. 4.375%–7.125%, 10/15/06–11/15/10) | 5.280% | 9/1/06 | 1,145,000 | 1,145,000 |
Goldman, Sachs & Co. Inc. | | | | |
(Dated 8/31/06, Repurchase Value $500,072,000, | | | | |
collateralized by Federal Home Loan Bank Discount | | | | |
Note, 9/18/06, Federal Home Loan Bank | | | | |
3.500%–6.045%, 11/15/06–7/15/36, Federal Home | | | | |
Loan Mortgage Corp. Discount Note, 2/16/07, | | | | |
Federal Home Loan Mortgage Corp. 2.375%–6.000%, | | | | |
12/15/06–1/15/14, Federal National Mortgage Assn. | | | | |
Discount Note, 12/29/06, Federal National Mortgage | | | | |
Assn. 3.125%–7.250%, 12/15/07–5/15/30) | 5.240% | 9/1/06 | 500,000 | 500,000 |
Goldman, Sachs & Co. Inc. | | | | |
(Dated 8/31/06, Repurchase Value $192,028,000, | | | | |
collateralized by Federal Home Loan Bank | | | | |
2.750%–5.470%, 1/16/07–6/18/14, Federal Home | | | | |
Loan Mortgage Corp. Discount Note, 10/23/06, | | | | |
Federal National Mortgage Assn. 4.125%, 4/15/14) | 5.270% | 9/1/06 | 192,000 | 192,000 |
Morgan Stanley & Co., Inc. | | | | |
(Dated 8/31/06, Repurchase Value $500,072,000, | | | | |
collateralized by Federal Farm Credit Bank Discount | | | | |
Note, 9/1/06–12/6/06, Federal Farm Credit Bank | | | | |
2.625%–9.800%, 9/7/06–9/23/21, Federal Home | | | | |
Loan Bank 2.625%–5.125%, 10/16/06–10/14/08, | | | | |
U.S. Treasury Note 2.000%, 1/15/14–7/15/14) | 5.200% | 9/1/06 | 500,000 | 500,000 |
Morgan Stanley & Co., Inc. | | | | |
(Dated 8/31/06, Repurchase Value $490,071,000, | | | | |
collateralized by Federal Farm Credit Bank Discount | | | | |
Note, 9/1/06–12/6/06, Federal Farm Credit Bank | | | | |
2.625%–9.800%, 9/7/06–9/23/21, Federal Home | | | | |
Loan Bank 2.625%–5.125%, 10/16/06–10/14/08, | | | | |
U.S. Treasury Note 2.000%, 1/15/14–7/15/14) | 5.250% | 9/1/06 | 490,000 | 490,000 |
Societe Generale, New York Branch | | | | |
(Dated 8/31/06, Repurchase Value $148,022,000, | | | | |
collateralized by Federal Home Loan Mortgage Corp. | | | | |
5.000%, 9/1/35, Federal National Mortgage Assn. | | | | |
4.000%–4.500%, 6/1/18–8/1/20, Government | | | | |
National Mortgage Assn. 6.000%, 7/15/35–1/15/36) | 5.280% | 9/1/06 | 148,000 | 148,000 |
UBS Securities LLC | | | | |
(Dated 8/31/06, Repurchase Value $1,162,235,000, | | | | |
collateralized by Federal Home Loan Mortgage Corp. | | | | |
4.000%–4.500%, 12/15/09–1/15/14, Federal National | | | | |
Mortgage Assn. 3.875%–5.125%, 7/15/08–4/15/15) | 5.270% | 9/1/06 | 1,162,065 | 1,162,065 |
Total Repurchase Agreements (Cost $7,042,136) | | | | 7,042,136 |
Total Investments (104.1%) (Cost $73,730,341) | | | | 73,730,341 |
19
Prime Money Market Fund
| Market |
| Value• |
| ($000) |
Other Assets and Liabilities (–4.1%) | |
Other Assets—Note B | 604,552 |
Payables for Investment Securities Purchased | (3,293,965) |
Other Liabilities | (194,227) |
| (2,883,640) |
Net Assets (100%) | 70,846,701 |
| |
| |
At August 31, 2006, net assets consisted of: | |
| Amount |
| ($000) |
Paid-in Capital | 70,849,332 |
Undistributed Net Investment Income | — |
Accumulated Net Realized Losses | (2,631) |
Unrealized Appreciation | — |
Net Assets | 70,846,701 |
| |
Investor Shares—Net Assets | |
Applicable to 64,580,049,682 outstanding $.001 par value shares of | |
beneficial interest (unlimited authorization) | 64,577,813 |
Net Asset Value Per Share—Investor Shares | $1.00 |
| |
Institutional Shares—Net Assets | |
Applicable to 6,269,279,099 outstanding $.001 par value shares of | |
beneficial interest (unlimited authorization) | 6,268,888 |
Net Asset Value Per Share—Institutional Shares | $1.00 |
• | See Note A in Notes to Financial Statements. |
1 Represents annualized yield at date of purchase for discount securities, and coupon for coupon-bearing securities.
2 The issuer operates under a congressional charter; its securities are neither issued nor guaranteed by the U.S. government. If needed, access to additional funding from the U.S. Treasury (beyond the issuer’s line of credit) would require congressional action.
3 Security exempt from registration under Section 4(2) of the Securities Act of 1933. Such securities may be sold in transactions exempt from registration only to dealers in that program or other “accredited investors.” At August 31, 2006, the aggregate value of these securities was $10,437,913,000, representing 14.7% of net assets.
20
Prime Money Market Fund
Statement of Operations
| Year Ended |
| August 31, 2006 |
| ($000) |
Investment Income | |
Income | |
Interest | 2,731,658 |
Total Income | 2,731,658 |
Expenses | |
The Vanguard Group—Note B | |
Investment Advisory Services | 5,295 |
Management and Administrative | |
Investor Shares | 133,858 |
Institutional Shares | 2,750 |
Marketing and Distribution | |
Investor Shares | 14,522 |
Institutional Shares | 1,629 |
Custodian Fees | 857 |
Auditing Fees | 25 |
Shareholders’ Reports | |
Investor Shares | 851 |
Institutional Shares | 8 |
Trustees’ Fees and Expenses | 65 |
Total Expenses | 159,860 |
Net Investment Income | 2,571,798 |
Realized Net Gain (Loss) on Investment Securities Sold | (850) |
Change in Unrealized Appreciation (Depreciation) of Investment Securities | — |
Net Increase (Decrease) in Net Assets Resulting from Operations | 2,570,948 |
21
Prime Money Market Fund
Statement of Changes in Net Assets
| Year Ended August 31, |
| 2006 | 2005 |
| ($000) | ($000) |
Increase (Decrease) in Net Assets | | |
Operations | | |
Net Investment Income | 2,571,798 | 1,154,504 |
Realized Net Gain (Loss) | (850) | (1,317) |
Change in Unrealized Appreciation (Depreciation) | — | — |
Net Increase (Decrease) in Net Assets Resulting from Operations | 2,570,948 | 1,153,187 |
Distributions | | |
Net Investment Income | | |
Investor Shares | (2,322,506) | (1,017,327) |
Institutional Shares | (249,292) | (137,177) |
Realized Capital Gain | | |
Investor Shares | — | — |
Institutional Shares | — | — |
Total Distributions | (2,571,798) | (1,154,504) |
Capital Share Transactions—Investor Shares (at $1.00) | | |
Issued | 77,995,216 | 53,527,640 |
Issued in Lieu of Cash Distributions | 2,258,557 | 989,557 |
Redeemed | (62,129,327) | (51,945,847) |
Net Increase (Decrease)—Investor Shares | 18,124,446 | 2,571,350 |
Capital Share Transactions—Institutional Shares (at $1.00) | | |
Issued | 7,088,080 | 6,082,949 |
Issued in Lieu of Cash Distributions | 235,871 | 127,098 |
Redeemed | (6,819,158) | (5,746,955) |
Net Increase (Decrease)—Institutional Shares | 504,793 | 463,092 |
Total Increase (Decrease) | 18,628,389 | 3,033,125 |
Net Assets | | |
Beginning of Period | 52,218,312 | 49,185,187 |
End of Period | 70,846,701 | 52,218,312 |
22
Prime Money Market Fund
Financial Highlights
Investor Shares | | | | | |
| | | | Year Ended August 31, |
For a Share Outstanding Throughout Each Period | 2006 | 2005 | 2004 | 2003 | 2002 |
Net Asset Value, Beginning of Period | $1.00 | $1.00 | $1.00 | $1.00 | $1.00 |
Investment Operations | | | | | |
Net Investment Income | .043 | .023 | .008 | .011 | .021 |
Net Realized and Unrealized | | | | | |
Gain (Loss) on Investments | — | — | — | — | — |
Total from Investment Operations | .043 | .023 | .008 | .011 | .021 |
Distributions | | | | | |
Dividends from Net Investment Income | (.043) | (.023) | (.008) | (.011) | (.021) |
Distributions from Realized Capital Gains | — | — | — | — | — |
Total Distributions | (.043) | (.023) | (.008) | (.011) | (.021) |
Net Asset Value, End of Period | $1.00 | $1.00 | $1.00 | $1.00 | $1.00 |
| | | | | |
Total Return | 4.38% | 2.31% | 0.83% | 1.12% | 2.09% |
| | | | | |
Ratios/Supplemental Data | | | | | |
Net Assets, End of Period (Millions) | $64,578 | $46,454 | $43,884 | $47,341 | $49,784 |
Ratio of Total Expenses to | | | | | |
Average Net Assets | 0.29% | 0.30% | 0.30% | 0.32% | 0.33% |
Ratio of Net Investment | | | | | |
Income to Average Net Assets | 4.33% | 2.29% | 0.82% | 1.12% | 2.07% |
| | | | | | |
23
Prime Money Market Fund
Institutional Shares | | | | | |
| | | | Year Ended August 31, |
For a Share Outstanding Throughout Each Period | 2006 | 2005 | 2004 | 2003 | 2002 |
Net Asset Value, Beginning of Period | $1.00 | $1.00 | $1.00 | $1.00 | $1.00 |
Investment Operations | | | | | |
Net Investment Income | .045 | .025 | .010 | .013 | .023 |
Net Realized and Unrealized | | | | | |
Gain (Loss) on Investments | — | — | — | — | — |
Total from Investment Operations | .045 | .025 | .010 | .013 | .023 |
Distributions | | | | | |
Dividends from Net Investment Income | (.045) | (.025) | (.010) | (.013) | (.023) |
Distributions from Realized Capital Gains | — | — | — | — | — |
Total Distributions | (.045) | (.025) | (.010) | (.013) | (.023) |
Net Asset Value, End of Period | $1.00 | $1.00 | $1.00 | $1.00 | $1.00 |
| | | | | |
Total Return | 4.58% | 2.52% | 1.05% | 1.33% | 2.31% |
| | | | | |
Ratios/Supplemental Data | | | | | |
Net Assets, End of Period (Millions) | $6,269 | $5,764 | $5,301 | $4,296 | $3,893 |
Ratio of Total Expenses to | | | | | |
Average Net Assets | 0.09% | 0.09% | 0.09% | 0.10% | 0.11% |
Ratio of Net Investment | | | | | |
Income to Average Net Assets | 4.53% | 2.51% | 1.05% | 1.32% | 2.27% |
| | | | | | |
See accompanying Notes, which are an integral part of the Financial Statements.
24
Prime Money Market Fund
Notes to Financial Statements
Vanguard Prime Money Market Fund is registered under the Investment Company Act of 1940 as an open-end investment company, or mutual fund. The fund invests in short-term debt instruments of companies primarily operating in specific industries, particularly financial services; the issuers’ abilities to meet their obligations may be affected by economic developments in such industries.
The fund offers two classes of shares, Investor Shares and Institutional Shares. Investor Shares are available to any investor who meets the fund’s minimum purchase requirements. Institutional Shares are designed for investors who meet certain administrative and servicing criteria and invest a minimum of $5 million.
A. The following significant accounting policies conform to generally accepted accounting principles for U.S. mutual funds. The fund consistently follows such policies in preparing its financial statements.
1. Security Valuation: Securities are valued at amortized cost, which approximates market value.
2. Repurchase Agreements: The fund may invest in repurchase agreements. Securities pledged as collateral for repurchase agreements are held by a custodian bank until the agreements mature. Each agreement requires that the market value of the collateral be sufficient to cover payments of interest and principal; however, in the event of default or bankruptcy by the other party to the agreement, retention of the collateral may be subject to legal proceedings.
3. Federal Income Taxes: The fund intends to continue to qualify as a regulated investment company and distribute all of its taxable income. Accordingly, no provision for federal income taxes is required in the financial statements.
4. Distributions: Dividends from net investment income are declared daily and paid on the first business day of the following month.
5. Other: Interest income is accrued daily. Premiums and discounts on debt securities purchased are amortized and accreted, respectively, to interest income over the lives of the respective securities. Security transactions are accounted for on the date the securities are bought or sold. Costs used to determine realized gains (losses) on the sale of investment securities are those of the specific securities sold.
Each class of shares has equal rights as to assets and earnings, except that each class separately bears certain class-specific expenses related to maintenance of shareholder accounts (included in Management and Administrative expenses) and shareholder reporting. Marketing and distribution expenses are allocated to each class of shares based on a method approved by the board of trustees. Income, other non-class-specific expenses, and gains and losses on investments are allocated to each class of shares based on its relative net assets.
B. The Vanguard Group furnishes at cost investment advisory, corporate management, administrative, shareholder accounting, marketing, and distribution services. The costs of such services are allocated to the fund under methods approved by the board of trustees. The fund has committed to provide up to 0.40% of its assets in capital contributions to Vanguard. At August 31, 2006, the fund had contributed capital of $7,409,000 to Vanguard (included in Other Assets), representing 0.01% of the fund’s net assets and 7.41% of Vanguard’s capitalization. The fund’s trustees and officers are also directors and officers of Vanguard.
C. In June 2006, the Financial Accounting Standards Board issued Interpretation No. 48 (“FIN 48”), “Accounting for Uncertainty in Income Taxes.” FIN 48 establishes the minimum threshold for recognizing, and a system for measuring, the benefits of tax-return positions in financial statements. FIN 48 will be effective for the fund’s fiscal year beginning September 1, 2007. Management is in the process of analyzing the fund’s tax positions for purposes of implementing FIN 48; based on the analysis completed to date, management does not believe the adoption of FIN 48 will result in any material impact to the fund’s financial statements.
25
Federal Money Market Fund |
| |
Fund Profile | |
As of August 31, 2006 | |
| |
Financial Attributes | |
| |
Yield | 5.1% |
Average Weighted Maturity | 31 days |
Average Quality1 | Aaa |
Expense Ratio | 0.29% |
Distribution by Credit Quality1(% of portfolio) | |
| |
Aaa | 100% |
Sector Diversification (% of portfolio) | |
| |
Treasury/Agency | 62% |
Other | 38 |
1 Moody’s Investors Service.
See page 59 for a glossary of investment terms.
26
Federal Money Market Fund
Performance Summary
Investment returns will fluctuate. All of the returns in this report represent past performance, which is not a guarantee of future results that may be achieved by the fund. (For performance data current to the most recent month-end, which may be higher or lower than that cited, visit our website at www.vanguard.com.) The returns shown do not reflect taxes that a shareholder would pay on fund distributions. An investment in a money market fund is not insured or guaranteed by the Federal Deposit Insurance Corporation or any other government agency. Although the fund seeks to preserve the value of your investment at $1 per share, it is possible to lose money by investing in the fund. The annualized yields shown reflect the current earnings of the fund more closely than do the average annual returns.
Cumulative Performance: August 31, 1996–August 31, 2006
Initial Investment of $10,000
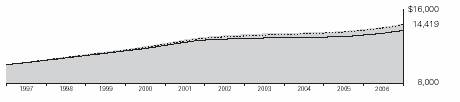
| | Average Annual Total Returns | Final Value |
| Periods Ended August 31, 2006 | of a $10,000 |
| One Year | Five Years | Ten Years | Investment |
Federal Money Market Fund | 4.31% | 2.12% | 3.73% | $14,419 |
Citigroup 3-Month Treasury Index | 4.27 | 2.20 | 3.68 | 14,351 |
Average Government Money Market Fund1 | 3.76 | 1.59 | 3.22 | 13,731 |
| | | | | | |
1 | Returns for Average Government Money Market Fund are derived from data provided by Lipper Inc. |
Note: See Financial Highlights table on page 34 for dividend information.
27
Federal Money Market Fund
Fiscal-Year Total Returns (%): August 31, 1996–August 31, 2006 | |
| Federal Money | Average |
Fiscal Year | Market Fund | Fund1 |
1997 | 5.3% | 4.8% |
1998 | 5.4 | 5.0 |
1999 | 4.9 | 4.4 |
2000 | 5.8 | 5.3 |
2001 | 5.4 | 4.8 |
2002 | 2.1 | 1.5 |
2003 | 1.1 | 0.7 |
2004 | 0.8 | 0.4 |
2005 | 2.3 | 1.7 |
2006 | 4.3 | 3.8 |
SEC 7-Day Annualized Yield (8/31/2006): 5.05% | | |
Average Annual Total Returns: Periods Ended June 30, 2006
This table presents average annual total returns through the latest calendar quarter—rather than through the end of the fiscal period. Securities and Exchange Commission rules require that we provide this information.
| Inception Date | One Year | Five Years | Ten Years |
Federal Money Market Fund | 7/13/1981 | 3.97% | 2.08% | 3.73% |
1 Returns for Average Government Money Market Fund are derived from data provided by Lipper Inc.
28
Federal Money Market Fund
Financial Statements
Statement of Net Assets
As of August 31, 2006
The fund provides a complete list of its holdings four times in each fiscal year, at the quarter-ends. For the second and fourth fiscal quarters, the lists appear in the fund’s semiannual and annual reports to shareholders. For the first and third fiscal quarters, the fund files the lists with the Securities and Exchange Commission on Form N-Q. Shareholders can look up the fund’s Forms N-Q on the SEC’s website at www.sec.gov. Forms N-Q may also be reviewed and copied at the SEC’s Public Reference Room (see the back cover of this report for further information).
| | | Face | Market |
| | Maturity | Amount | Value• |
| Yield1 | Date | ($000) | ($000) |
U.S. Government and Agency Obligations (61.9%) | | | |
2 Federal Home Loan Bank | 5.136% | 9/6/06 | 207,400 | 207,254 |
2 Federal Home Loan Bank | 5.295%–5.300% | 9/20/06 | 467,023 | 465,735 |
2 Federal Home Loan Bank | 5.318% | 10/13/06 | 86,976 | 86,443 |
2 Federal Home Loan Bank | 5.323% | 10/20/06 | 91,699 | 91,043 |
2 Federal Home Loan Bank | 5.321% | 10/27/06 | 200,000 | 198,367 |
2 Federal Home Loan Bank | 5.217% | 11/22/06 | 100,000 | 98,827 |
2 Federal Home Loan Bank | 5.216%–5.224% | 11/24/06 | 200,000 | 197,594 |
2 Federal Home Loan Mortgage Corp. | 5.289% | 9/12/06 | 78,187 | 78,062 |
2 Federal Home Loan Mortgage Corp. | 5.294% | 9/19/06 | 77,825 | 77,622 |
2 Federal Home Loan Mortgage Corp. | 5.337%–5.325% | 10/3/06 | 415,000 | 413,055 |
2 Federal Home Loan Mortgage Corp. | 5.352% | 10/10/06 | 150,000 | 149,142 |
2 Federal Home Loan Mortgage Corp. | 5.321%–5.350% | 10/17/06 | 213,149 | 211,714 |
2 Federal Home Loan Mortgage Corp. | 5.321% | 10/24/06 | 400,000 | 396,908 |
2 Federal Home Loan Mortgage Corp. | 5.250%–5.290% | 10/31/06 | 104,850 | 103,940 |
2 Federal Home Loan Mortgage Corp. | 5.228%–5.268% | 11/7/06 | 179,736 | 178,003 |
2 Federal Home Loan Mortgage Corp. | 5.212%–5.238% | 11/14/06 | 169,218 | 167,422 |
2 Federal National Mortgage Assn. | 5.295% | 9/13/06 | 27,000 | 26,953 |
2 Federal National Mortgage Assn. | 5.321% | 10/11/06 | 39,000 | 38,772 |
2 Federal National Mortgage Assn. | 5.329% | 10/25/06 | 272,891 | 270,738 |
2 Federal National Mortgage Assn. | 5.248% | 11/1/06 | 267,410 | 265,061 |
2 Federal National Mortgage Assn. | 5.212% | 11/15/06 | 215,005 | 212,698 |
Total U.S. Government and Agency Obligations | | | |
(Cost $3,935,353) | | | | 3,935,353 |
Repurchase Agreements (38.2%) | | | | |
Barclays Capital Inc. | | | | |
(Dated 8/31/06, Repurchase Value $388,057,000, | | | | |
collateralized by Federal Home Loan Bank | | | | |
5.365%–5.625%, 6/11/21–9/9/24, Federal Home Loan | | | | |
Mortgage Corp. Discount Note, 10/24/06–7/24/07, | | | | |
Federal National Mortgage Assn. 7.125%, 6/15/10) | 5.270% | 9/1/06 | 388,000 | 388,000 |
Bank of America Securities, LLC | | | | |
(Dated 8/31/06, Repurchase Value $307,045,000, | | | | |
collateralized by Federal Home Loan Bank Discount | | | | |
Note, 2/28/07, Federal Home Loan Bank 4.500%, | | | | |
5/11/07, Federal Home Loan Mortgage Discount Note, | | | | |
3/20/07–7/23/07, Federal National Mortgage Assn. | | | | |
Discount Note, 6/29/07, Federal National Mortgage | | | | |
Assn. 5.250%–6.625%, 10/30/07–11/15/30) | 5.260% | 9/1/06 | 307,000 | 307,000 |
| | | | | | | | | | | |
29
Federal Money Market Fund
| | | Face | Market |
| | Maturity | Amount | Value• |
| Yield1 | Date | ($000) | ($000) |
Citigroup Global Markets, Inc. | | | | |
(Dated 8/31/06, Repurchase Value $156,023,000, | | | | |
collateralized by Federal Home Loan Mortgage Corp. | | | | |
3.375%, 4/15/09, U.S. Treasury Note 4.125%, 8/15/10) | 5.270% | 9/1/06 | 156,000 | 156,000 |
Deutsche Bank Securities Inc. | | | | |
(Dated 8/31/06, Repurchase Value $463,068,000, | | | | |
collateralized by Federal Home Loan Mortgage Corp. | | | | |
5.250%–7.000%, 9/15/09–7/18/11, Federal National | | | | |
Mortgage Assn. 4.625%–5.500%, 1/15/08–3/15/11) | 5.280% | 9/1/06 | 463,000 | 463,000 |
Credit Suisse First Boston (USA), LLC | | | | |
(Dated 8/31/06, Repurchase Value $312,046,000, | | | | |
collateralized by Federal Home Mortgage Corp. | | | | |
4.625%–5.750%, 2/21/08–1/15/12) | 5.280% | 9/1/06 | 312,000 | 312,000 |
Goldman, Sachs & Co. | | | | |
(Dated 8/31/06, Repurchase Value $78,011,000, | | | | |
collateralized by Federal Home Loan Bank | | | | |
3.750%–4.625%, 1/16/07–9/11/20, Federal | | | | |
Home Loan Mortgage Corp. 4.125%, 10/18/10, | | | | |
Federal National Mortgage Assn. 6.000%, 5/15/11) | 5.270% | 9/1/06 | 78,000 | 78,000 |
Morgan Stanley & Co., Inc. | | | | |
(Dated 8/31/06, Repurchase Value $198,279,000, | | | | |
collateralized by Federal Farm Credit Bank | | | | |
3.625%–6.500%, 9/29/06–6/20/16) | 5.250% | 9/1/06 | 198,250 | 198,250 |
Societe Generale, New York Branch | | | | |
(Dated 8/31/06, Repurchase Value $60,009,000, | | | | |
collateralized by Federal National Mortgage Assn. | | | | |
5.000%, 3/1/21–8/1/35, Government National | | | | |
Mortgage Assn. 6.000%, 7/15/35) | 5.280% | 9/1/06 | 60,000 | 60,000 |
UBS Securities LLC | | | | |
(Dated 8/31/06, Repurchase Value $468,069,000, | | | | |
collateralized by Federal Home Loan Mortgage Corp. | | | | |
3.500%–5.125%, 9/15/07–10/15/08, Federal National | | | | |
Mortgage Assn. 3.000%–7.250%, 8/15/07–5/15/30) | 5.270% | 9/1/06 | 468,000 | 468,000 |
Total Repurchase Agreements (Cost $2,430,250) | | | | 2,430,250 |
Total Investments (100.1%) (Cost $6,365,603) | | | | 6,365,603 |
Other Assets and Liabilities (–0.1%) | | | | |
Other Assets—Note B | | | | 20,871 |
Liabilities | | | | (26,793) |
| | | | (5,922) |
Net Assets (100%) | | | | |
Applicable to 6,359,686,742 outstanding $.001 par value shares of beneficial interest (unlimited authorization) | | | $6,359,681 |
Net Asset Value Per Share | | | | $1.00 |
| | | | | |
30
Federal Money Market Fund
At August 31, 2006, net assets consisted of: | | |
| Amount | Per |
| ($000) | Share |
Paid-in Capital | 6,359,698 | $1.00 |
Undistributed Net Investment Income | — | — |
Accumulated Net Realized Losses | (17) | — |
Unrealized Appreciation | — | — |
Net Assets | 6,359,681 | $1.00 |
• | See Note A in Notes to Financial Statements. |
1 Represents annualized yield at date of purchase for discount securities, and coupon for coupon-bearing securities.
2 The issuer operates under a congressional charter; its securities are neither issued nor guaranteed by the U.S. government.
If needed, access to additional funding from the U.S. Treasury (beyond the issuer’s line of credit) would require congressional action.
31
Federal Money Market Fund
Statement of Operations
| Year Ended |
| August 31, 2006 |
| ($000) |
Investment Income | |
Income | |
Interest | 265,781 |
Total Income | 265,781 |
Expenses | |
The Vanguard Group—Note B | |
Investment Advisory Services | 538 |
Management and Administrative | 14,515 |
Marketing and Distribution | 1,656 |
Custodian Fees | 108 |
Auditing Fees | 24 |
Shareholders’ Reports | 97 |
Trustees’ Fees and Expenses | 7 |
Total Expenses | 16,945 |
Net Investment Income | 248,836 |
Realized Net Gain (Loss) on Investment Securities Sold | 39 |
Change in Unrealized Appreciation (Depreciation) of Investment Securities | — |
Net Increase (Decrease) in Net Assets Resulting from Operations | 248,875 |
32
Federal Money Market Fund
Statement of Changes in Net Assets
| Year Ended August 31, |
| 2006 | 2005 |
| ($000) | ($000) |
Increase (Decrease) in Net Assets | | |
Operations | | |
Net Investment Income | 248,836 | 123,391 |
Realized Net Gain (Loss) | 39 | (44) |
Change in Unrealized Appreciation (Depreciation) | — | — |
Net Increase (Decrease) in Net Assets Resulting from Operations | 248,875 | 123,347 |
Distributions | | |
Net Investment Income | (248,836) | (123,391) |
Realized Capital Gain | — | — |
Total Distributions | (248,836) | (123,391) |
Capital Share Transactions (at $1.00) | | |
Issued | 5,467,907 | 4,174,291 |
Issued in Lieu of Cash Distributions | 242,468 | 120,167 |
Redeemed | (4,857,418) | (4,363,020) |
Net Increase (Decrease) from Capital Share Transactions | 852,957 | (68,562) |
Total Increase (Decrease) | 852,996 | (68,606) |
Net Assets | | |
Beginning of Period | 5,506,685 | 5,575,291 |
End of Period | 6,359,681 | 5,506,685 |
33
Federal Money Market Fund
Financial Highlights
| | | Year Ended August 31, |
For a Share Outstanding Throughout Each Period | 2006 | 2005 | 2004 | 2003 | 2002 |
Net Asset Value, Beginning of Period | $1.00 | $1.00 | $1.00 | $1.00 | $1.00 |
Investment Operations | | | | | |
Net Investment Income | .042 | .022 | .008 | .011 | .021 |
Net Realized and Unrealized | | | | | |
Gain (Loss) on Investments | — | — | — | — | — |
Total from Investment Operations | .042 | .022 | .008 | .011 | .021 |
Distributions | | | | | |
Dividends from Net Investment Income | (.042) | (.022) | (.008) | (.011) | (.021) |
Distributions from Realized Capital Gains | — | — | — | — | — |
Total Distributions | (.042) | (.022) | (.008) | (.011) | (.021) |
Net Asset Value, End of Period | $1.00 | $1.00 | $1.00 | $1.00 | $1.00 |
| | | | | |
Total Return | 4.31% | 2.26% | 0.82% | 1.11% | 2.12% |
| | | | | |
Ratios/Supplemental Data | | | | | |
Net Assets, End of Period (Millions) | $6,360 | $5,507 | $5,575 | $6,289 | $6,794 |
Ratio of Total Expenses to | | | | | |
Average Net Assets | 0.29% | 0.30% | 0.30% | 0.32% | 0.33% |
Ratio of Net Investment | | | | | |
Income to Average Net Assets | 4.25% | 2.23% | 0.81% | 1.11% | 2.10% |
See accompanying Notes, which are an integral part of the Financial Statements.
34
Federal Money Market Fund
Notes to Financial Statements
Vanguard Federal Money Market Fund is registered under the Investment Company Act of 1940 as an open-end investment company, or mutual fund. The fund invests in short-term debt instruments issued by the U.S. government or its agencies and instrumentalities, and repurchase agreements collateralized by such instruments.
A. The following significant accounting policies conform to generally accepted accounting principles for U.S. mutual funds. The fund consistently follows such policies in preparing its financial statements.
1. Security Valuation: Securities are valued at amortized cost, which approximates market value.
2. Repurchase Agreements: The fund may invest in repurchase agreements. Securities pledged as collateral for repurchase agreements are held by a custodian bank until the agreements mature. Each agreement requires that the market value of the collateral be sufficient to cover payments of interest and principal; however, in the event of default or bankruptcy by the other party to the agreement, retention of the collateral may be subject to legal proceedings.
3. Federal Income Taxes: The fund intends to continue to qualify as a regulated investment company and distribute all of its taxable income. Accordingly, no provision for federal income taxes is required in the financial statements.
4. Distributions: Dividends from net investment income are declared daily and paid on the first business day of the following month.
5. Other: Interest income is accrued daily. Premiums and discounts on debt securities purchased are amortized and accreted, respectively, to interest income over the lives of the respective securities. Security transactions are accounted for on the date the securities are bought or sold. Costs used to determine realized gains (losses) on the sale of investment securities are those of the specific securities sold.
B. The Vanguard Group furnishes at cost investment advisory, corporate management, administrative, shareholder accounting, marketing, and distribution services. The costs of such services are allocated to the fund under methods approved by the board of trustees. The fund has committed to provide up to 0.40% of its assets in capital contributions to Vanguard. At August 31, 2006, the fund had contributed capital of $681,000 to Vanguard (included in Other Assets), representing 0.01% of the fund’s net assets and 0.68% of Vanguard’s capitalization. The fund’s trustees and officers are also directors and officers of Vanguard.
C. In June 2006, the Financial Accounting Standards Board issued Interpretation No. 48 (“FIN 48”), “Accounting for Uncertainty in Income Taxes.” FIN 48 establishes the minimum threshold for recognizing, and a system for measuring, the benefits of tax-return positions in financial statements. FIN 48 will be effective for the fund’s fiscal year beginning September 1, 2007. Management is in the process of analyzing the fund’s tax positions for purposes of implementing FIN 48; based on the analysis completed to date, management does not believe the adoption of FIN 48 will result in any material impact to the fund’s financial statements.
35
Treasury Money Market Fund
Fund Profile | |
As of August 31, 2006 | |
| |
Financial Attributes | |
| |
Yield | 4.8% |
Average Weighted Maturity | 51 days |
Average Quality1 | Aaa |
Expense Ratio | 0.29% |
| |
| |
| |
Distribution by Credit Quality1(% of portfolio) | |
| |
Aaa | 100% |
Sector Diversification (% of portfolio) | |
| |
Treasury | 100% |
1 Moody’s Investors Service.
See page 59 for a glossary of investment terms.
36
Treasury Money Market Fund
Performance Summary
Investment returns will fluctuate. All of the returns in this report represent past performance, which is not a guarantee of future results that may be achieved by the fund. (For performance data current to the most recent month-end, which may be higher or lower than that cited, visit our website at www.vanguard.com.) The returns shown do not reflect taxes that a shareholder would pay on fund distributions. An investment in a money market fund is not insured or guaranteed by the Federal Deposit Insurance Corporation or any other government agency. Although the fund seeks to preserve the value of your investment at $1 per share, it is possible to lose money by investing in the fund. The annualized yields shown reflect the current earnings of the fund more closely than do the average annual returns.
Cumulative Performance: August 31, 1996–August 31, 2006
Initial Investment of $10,000
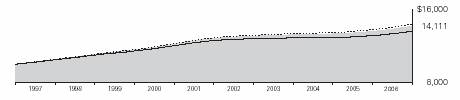
| | Average Annual Total Returns | Final Value |
| | Periods Ended August 31, 2006 | of a $10,000 |
| One Year | Five Years | Ten Years | Investment |
Treasury Money Market Fund1 | 4.06% | 1.98% | 3.50% | $14,111 |
Citigroup 3-Month Treasury Index | 4.27 | 2.20 | 3.68 | 14,351 |
iMoneyNet Money Fund Report’s | | | | |
Average 100% Treasury Fund | 3.54 | 1.55 | 3.11 | 13,581 |
| | | | | |
1 Prior to December 2, 1996, known as the U.S. Treasury Portfolio.
Note: See Financial Highlights table on page 43 for dividend information.
37
Treasury Money Market Fund
Fiscal-Year Total Returns (%): August 31, 1996–August 31, 2006 | |
| Treasury Money | Average |
Fiscal Year | Market Fund1 | Fund2 |
1997 | 5.1% | 4.8% |
1998 | 5.1 | 4.8 |
1999 | 4.5 | 4.2 |
2000 | 5.4 | 5.0 |
2001 | 5.1 | 4.7 |
2002 | 2.0 | 1.6 |
2003 | 1.0 | 0.7 |
2004 | 0.7 | 0.4 |
2005 | 2.1 | 1.6 |
2006 | 4.1 | 3.5 |
SEC 7-Day Annualized Yield (8/31/2006): 4.75% | | |
Average Annual Total Returns: Periods Ended June 30, 2006
This table presents average annual total returns through the latest calendar quarter—rather than through the end of the fiscal period. Securities and Exchange Commission rules require that we provide this information.
| Inception Date | One Year | Five Years | Ten Years |
Treasury Money Market Fund1 | 3/9/1983 | 3.74% | 1.94% | 3.51% |
1 Prior to December 2, 1996, known as the U.S. Treasury Portfolio.
2 Derived from iMoneyNet Money Fund Report’s Average 100% Treasury Fund.
38
Treasury Money Market Fund
Financial Statements
Statement of Net Assets
As of August 31, 2006
The fund provides a complete list of its holdings four times in each fiscal year, at the quarter-ends. For the second and fourth fiscal quarters, the lists appear in the fund’s semiannual and annual reports to shareholders. For the first and third fiscal quarters, the fund files the lists with the Securities and Exchange Commission on Form N-Q. Shareholders can look up the fund’s Forms N-Q on the SEC’s website at www.sec.gov. Forms N-Q may also be reviewed and copied at the SEC’s Public Reference Room (see the back cover of this report for further information).
| | | Face | Market |
| | Maturity | Amount | Value• |
| Yield1 | Date | ($000) | ($000) |
U.S. Government Securities (99.7%) | | | | |
U.S. Treasury Bill | 4.772%–4.808% | 9/07/06 | 516,161 | 515,755 |
U.S. Treasury Bill | 4.755%–4.760% | 9/14/06 | 182,818 | 182,510 |
U.S. Treasury Bill | 4.758%–4.895% | 9/21/06 | 507,116 | 505,770 |
U.S. Treasury Bill | 4.937%–5.101% | 9/28/06 | 88,200 | 87,877 |
U.S. Treasury Bill | 5.002%–5.018% | 10/05/06 | 549,827 | 547,259 |
U.S. Treasury Bill | 4.984%–4.992% | 10/12/06 | 220,000 | 218,766 |
U.S. Treasury Bill | 5.005%–5.031% | 10/19/06 | 298,953 | 296,977 |
U.S. Treasury Bill | 5.033% | 10/26/06 | 351,000 | 348,335 |
U.S. Treasury Bill | 5.004%–5.057% | 11/02/06 | 576,435 | 571,495 |
U.S. Treasury Bill | 5.020%–5.043% | 11/09/06 | 490,250 | 485,571 |
U.S. Treasury Bill | 4.998%–5.054% | 11/16/06 | 373,452 | 369,528 |
U.S. Treasury Bill | 5.038%–5.039% | 11/24/06 | 718,087 | 709,751 |
U.S. Treasury Bill | 5.028% | 11/30/06 | 157,000 | 155,051 |
U.S. Treasury Note | 6.500% | 10/15/06 | 65,000 | 65,086 |
U.S. Treasury Note | 2.875% | 11/30/06 | 150,000 | 149,152 |
Total U.S. Government Securities (Cost $5,208,883) | | | 5,208,883 |
Other Assets and Liabilities (0.3%) | | | | |
Other Assets—Note B | | | | 27,314 |
Liabilities | | | | (13,281) |
| | | | 14,033 |
Net Assets (100%) | | | | |
Applicable to 5,223,131,444 outstanding $.001 par value shares of beneficial interest (unlimited authorization) | | | 5,222,916 |
Net Asset Value Per Share | | | | $1.00 |
39
Treasury Money Market Fund
At August 31, 2006, net assets consisted of: | | |
| Amount | Per |
| ($000) | Share |
Paid-in Capital | 5,223,159 | $1.00 |
Undistributed Net Investment Income | — | — |
Accumulated Net Realized Losses | (243) | — |
Unrealized Appreciation | — | — |
Net Assets | 5,222,916 | $1.00 |
• | See Note A in Notes to Financial Statements. |
1 Represents annualized yield at date of purchase for discount securities, and coupon for coupon-bearing securities.
40
Treasury Money Market Fund
Statement of Operations
| Year Ended |
| August 31, 2006 |
| ($000) |
Investment Income | |
Income | |
Interest | 212,419 |
Total Income | 212,419 |
Expenses | |
The Vanguard Group—Note B | |
Investment Advisory Services | 453 |
Management and Administrative | 12,258 |
Marketing and Distribution | 1,391 |
Custodian Fees | 81 |
Auditing Fees | 16 |
Shareholders’ Reports | 93 |
Trustees’ Fees and Expenses | 6 |
Total Expenses | 14,298 |
Net Investment Income | 198,121 |
Realized Net Gain (Loss) on Investment Securities Sold | (475) |
Change in Unrealized Appreciation (Depreciation) of Investment Securities | — |
Net Increase (Decrease) in Net Assets Resulting from Operations | 197,646 |
41
Treasury Money Market Fund
Statement of Changes in Net Assets
| Year Ended August 31, |
| 2006 | 2005 |
| ($000) | ($000) |
Increase (Decrease) in Net Assets | | |
Operations | | |
Net Investment Income | 198,121 | 96,285 |
Realized Net Gain (Loss) | (475) | (239) |
Change in Unrealized Appreciation (Depreciation) | — | — |
Net Increase (Decrease) in Net Assets Resulting from Operations | 197,646 | 96,046 |
Distributions | | |
Net Investment Income | (198,121) | (96,285) |
Realized Capital Gain | — | — |
Total Distributions | (198,121) | (96,285) |
Capital Share Transactions (at $1.00) | | |
Issued | 4,924,240 | 3,999,075 |
Issued in Lieu of Cash Distributions | 193,061 | 93,702 |
Redeemed | (4,451,544) | (4,162,837) |
Net Increase (Decrease) from Capital Share Transactions | 665,757 | (70,060) |
Total Increase (Decrease) | 665,282 | (70,299) |
Net Assets | | |
Beginning of Period | 4,557,634 | 4,627,933 |
End of Period | 5,222,916 | 4,557,634 |
42
Treasury Money Market Fund
Financial Highlights
| | | | Year Ended August 31, |
For a Share Outstanding Throughout Each Period | 2006 | 2005 | 2004 | 2003 | 2002 |
Net Asset Value, Beginning of Period | $1.00 | $1.00 | $1.00 | $1.00 | $1.00 |
Investment Operations | | | | | |
Net Investment Income | .040 | .021 | .007 | .010 | .020 |
Net Realized and Unrealized | | | | | |
Gain (Loss) on Investments | — | — | — | — | — |
Total from Investment Operations | .040 | .021 | .007 | .010 | .020 |
Distributions | | | | | |
Dividends from Net Investment Income | (.040) | (.021) | (.007) | (.010) | (.020) |
Distributions from Realized Capital Gains | — | — | — | — | — |
Total Distributions | (.040) | (.021) | (.007) | (.010) | (.020) |
Net Asset Value, End of Period | $1.00 | $1.00 | $1.00 | $1.00 | $1.00 |
| | | | | |
Total Return | 4.06% | 2.12% | 0.74% | 1.03% | 1.98% |
| | | | | |
Ratios/Supplemental Data | | | | | |
Net Assets, End of Period (Millions) | $5,223 | $4,558 | $4,628 | $4,959 | $4,822 |
Ratio of Total Expenses to | | | | | |
Average Net Assets | 0.29% | 0.30% | 0.30% | 0.32% | 0.33% |
Ratio of Net Investment | | | | | |
Income to Average Net Assets | 4.01% | 2.10% | 0.73% | 1.03% | 1.95% |
See accompanying Notes, which are an integral part of the Financial Statements.
43
Treasury Money Market Fund
Notes to Financial Statements
Vanguard Treasury Money Market Fund is registered under the Investment Company Act of 1940 as an open-end investment company, or mutual fund. The fund invests in short-term debt instruments backed by the full faith and credit of the U.S. government.
A. The following significant accounting policies conform to generally accepted accounting principles for U.S. mutual funds. The fund consistently follows such policies in preparing its financial statements.
1. Security Valuation: Securities are valued at amortized cost, which approximates market value.
2. Federal Income Taxes: The fund intends to continue to qualify as a regulated investment company and distribute all of its taxable income. Accordingly, no provision for federal income taxes is required in the financial statements.
3. Distributions: Dividends from net investment income are declared daily and paid on the first business day of the following month.
4. Other: Interest income is accrued daily. Premiums and discounts on debt securities purchased are amortized and accreted, respectively, to interest income over the lives of the respective securities. Security transactions are accounted for on the date securities are bought or sold. Costs used to determine realized gains (losses) on the sale of investment securities are those of the specific securities sold.
B. The Vanguard Group furnishes at cost investment advisory, corporate management, administrative, shareholder accounting, marketing, and distribution services. The costs of such services are allocated to the fund under methods approved by the board of trustees. The fund has committed to provide up to 0.40% of its assets in capital contributions to Vanguard. At August 31, 2006, the fund had contributed capital of $564,000 to Vanguard (included in Other Assets), representing 0.01% of the fund’s net assets and 0.56% of Vanguard’s capitalization. The fund’s trustees and officers are also directors and officers of Vanguard.
C. In June 2006, the Financial Accounting Standards Board issued Interpretation No. 48 (“FIN 48”), “Accounting for Uncertainty in Income Taxes.” FIN 48 establishes the minimum threshold for recognizing, and a system for measuring, the benefits of tax-return positions in financial statements. FIN 48 will be effective for the fund’s fiscal year beginning September 1, 2007. Management is in the process of analyzing the fund’s tax positions for purposes of implementing FIN 48; based on the analysis completed to date, management does not believe the adoption of FIN 48 will result in any material impact to the fund’s financial statements.
44
Admiral Treasury Money Market Fund
Fund Profile | |
As of August 31, 2006 | |
| |
Financial Attributes | |
| |
Yield | 4.9% |
Average Weighted Maturity | 56 days |
Average Quality1 | Aaa |
Expense Ratio | 0.13% |
Distribution by Credit Quality1(% of portfolio) | |
| |
Aaa | 100% |
Sector Diversification (% of portfolio) | |
| |
Treasury | 100% |
1 Moody’s Investors Service.
See page 59 for a glossary of investment terms.
45
Admiral Treasury Money Market Fund
Performance Summary
Investment returns will fluctuate. All of the returns in this report represent past performance, which is not a guarantee of future results that may be achieved by the fund. (For performance data current to the most recent month-end, which may be higher or lower than that cited, visit our website at www.vanguard.com.) The returns shown do not reflect taxes that a shareholder would pay on fund distributions. An investment in a money market fund is not insured or guaranteed by the Federal Deposit Insurance Corporation or any other government agency. Although the fund seeks to preserve the value of your investment at $1 per share, it is possible to lose money by investing in the fund. The annualized yields shown reflect the current earnings of the fund more closely than do the average annual returns.
Cumulative Performance: August 31, 1996–August 31, 2006
Initial Investment of $50,000
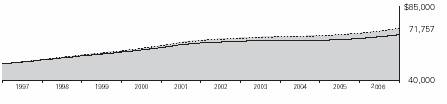
| | Average Annual Total Returns | Final Value |
| Periods Ended August 31, 2006 | of a $50,000 |
| One Year | Five Years | Ten Years | Investment |
Admiral Treasury Money Market Fund | 4.22% | 2.15% | 3.68% | $71,757 |
Citigroup 3-Month Treasury Index | 4.27 | 2.20 | 3.68 | 71,754 |
iMoneyNet Money Fund Report’s | | | | |
Average 100% Treasury Fund | 3.54 | 1.55 | 3.11 | 67,904 |
| | | | | |
Note: See Financial Highlights table on page 52 for dividend information.
46
Admiral Treasury Money Market Fund
Fiscal-Year Total Returns (%): August 31, 1996–August 31, 2006 | |
| Admiral Treasury | Average |
Fiscal Year | Money Market Fund | Fund1 |
1997 | 5.3% | 4.8% |
1998 | 5.3 | 4.8 |
1999 | 4.7 | 4.2 |
2000 | 5.5 | 5.0 |
2001 | 5.3 | 4.7 |
2002 | 2.1 | 1.6 |
2003 | 1.2 | 0.7 |
2004 | 0.9 | 0.4 |
2005 | 2.3 | 1.6 |
2006 | 4.2 | 3.5 |
SEC 7-Day Annualized Yield (8/31/2006): 4.92% | | |
Average Annual Total Returns: Periods Ended June 30, 2006
This table presents average annual total returns through the latest calendar quarter—rather than through the end of the fiscal period. Securities and Exchange Commission rules require that we provide this information.
| Inception Date | One Year | Five Years | Ten Years |
Admiral Treasury Money Market Fund | 12/14/1992 | 3.90% | 2.11% | 3.68% |
1 Derived from iMoneyNet Money Fund Report’s Average 100% Treasury Fund.
47
Admiral Treasury Money Market Fund
Financial Statements
Statement of Net Assets
As of August 31, 2006
The fund provides a complete list of its holdings four times in each fiscal year, at the quarter-ends. For the second and fourth fiscal quarters, the lists appear in the fund’s semiannual and annual reports to shareholders. For the first and third fiscal quarters, the fund files the lists with the Securities and Exchange Commission on Form N-Q. Shareholders can look up the fund’s Forms N-Q on the SEC’s website at www.sec.gov. Forms N-Q may also be reviewed and copied at the SEC’s Public Reference Room (see the back cover of this report for further information).
| | | Face | Market |
| | Maturity | Amount | Value• |
| Yield1 | Date | ($000) | ($000) |
U.S. Government Securities (100.0%) | | | | |
U.S. Treasury Bill | 4.772%–4.808% | 09/07/06 | 1,042,667 | 1,041,847 |
U.S. Treasury Bill | 4.753% | 09/14/06 | 68,062 | 67,948 |
U.S. Treasury Bill | 4.758%–4.900% | 09/21/06 | 2,279,984 | 2,273,912 |
U.S. Treasury Bill | 4.937%–5.101% | 09/28/06 | 232,302 | 231,453 |
U.S. Treasury Bill | 5.002%–5.018% | 10/05/06 | 1,401,085 | 1,394,531 |
U.S. Treasury Bill | 4.984%–4.992% | 10/12/06 | 760,000 | 755,737 |
U.S. Treasury Bill | 5.009%–5.031% | 10/19/06 | 1,520,000 | 1,509,954 |
U.S. Treasury Bill | 5.033% | 10/26/06 | 749,000 | 743,313 |
U.S. Treasury Bill | 5.005%–5.057% | 11/02/06 | 1,680,627 | 1,666,233 |
U.S. Treasury Bill | 5.020%–5.043% | 11/09/06 | 1,519,767 | 1,505,261 |
U.S. Treasury Bill | 4.998%–5.054% | 11/16/06 | 1,379,428 | 1,364,927 |
U.S. Treasury Bill | 5.039%–5.049% | 11/24/06 | 2,878,138 | 2,844,713 |
U.S. Treasury Bill | 5.028% | 11/30/06 | 43,000 | 42,466 |
U.S. Treasury Note | 6.500% | 10/15/06 | 185,000 | 185,245 |
U.S. Treasury Note | 2.875% | 11/30/06 | 350,000 | 348,022 |
Total U.S. Government Securities (Cost $15,975,562) | | | 15,975,562 |
Other Assets and Liabilities (0.0%) | | | | |
Other Assets—Note B | | | | 58,607 |
Liabilities | | | | (51,797) |
| | | | 6,810 |
Net Assets (100%) | | | | |
Applicable to 15,983,959,705 outstanding $.001 par value shares of beneficial interest (unlimited authorization) | | | 15,982,372 |
Net Asset Value Per Share | | | | $1.00 |
48
Admiral Treasury Money Market Fund
At August 31, 2006, net assets consisted of: | | |
| Amount | Per |
| ($000) | Share |
Paid-in Capital | 15,983,961 | $1.00 |
Undistributed Net Investment Income | — | — |
Accumulated Net Realized Losses | (1,589) | — |
Unrealized Appreciation | — | — |
Net Assets | 15,982,372 | $1.00 |
• | See Note A in Notes to Financial Statements. |
1 Represents annualized yield at date of purchase for discount securities, and coupon for coupon-bearing securities.
49
Admiral Treasury Money Market Fund
Statement of Operations | |
| Year Ended |
| August 31, 2006 |
| ($000) |
Investment Income | |
Income | |
Interest | 641,276 |
Total Income | 641,276 |
Expenses | |
The Vanguard Group—Note B | |
Investment Advisory Services | 1,371 |
Management and Administrative | 13,076 |
Marketing and Distribution | 4,214 |
Custodian Fees | 239 |
Auditing Fees | 16 |
Shareholders’ Reports | 67 |
Trustees’ Fees and Expenses | 14 |
Total Expenses | 18,997 |
Net Investment Income | 622,279 |
Realized Net Gain (Loss) on Investment Securities Sold | (587) |
Change in Unrealized Appreciation (Depreciation) of Investment Securities | — |
Net Increase (Decrease) in Net Assets Resulting from Operations | 621,692 |
50
Admiral Treasury Money Market Fund
Statement of Changes in Net Assets | | |
| Year Ended August 31, |
| 2006 | 2005 |
| ($000) | ($000) |
Increase (Decrease) in Net Assets | | |
Operations | | |
Net Investment Income | 622,279 | 312,421 |
Realized Net Gain (Loss) | (587) | (914) |
Change in Unrealized Appreciation (Depreciation) | — | — |
Net Increase (Decrease) in Net Assets Resulting from Operations | 621,692 | 311,507 |
Distributions | | |
Net Investment Income | (622,279) | (312,421) |
Realized Capital Gain | — | — |
Total Distributions | (622,279) | (312,421) |
Capital Share Transactions (at $1.00) | | |
Issued | 16,807,460 | 14,687,464 |
Issued in Lieu of Cash Distributions | 592,915 | 294,990 |
Redeemed | (15,254,987) | (14,414,113) |
Net Increase (Decrease) from Capital Share Transactions | 2,145,388 | 568,341 |
Total Increase (Decrease) | 2,144,801 | 567,427 |
Net Assets | | |
Beginning of Period | 13,837,571 | 13,270,144 |
End of Period | 15,982,372 | 13,837,571 |
51
Admiral Treasury Money Market Fund
Financial Highlights | | | | | |
| | | | | |
| | | | Year Ended August 31, |
For a Share Outstanding Throughout Each Period | 2006 | 2005 | 2004 | 2003 | 2002 |
Net Asset Value, Beginning of Period | $1.00 | $1.00 | $1.00 | $1.00 | $1.00 |
Investment Operations | | | | | |
Net Investment Income | .041 | .023 | .009 | .012 | .021 |
Net Realized and Unrealized | | | | | |
Gain (Loss) on Investments | — | — | — | — | — |
Total from Investment Operations | .041 | .023 | .009 | .012 | .021 |
Distributions | | | | | |
Dividends from Net Investment Income | (.041) | (.023) | (.009) | (.012) | (.021) |
Distributions from Realized Capital Gains | — | — | — | — | — |
Total Distributions | (.041) | (.023) | (.009) | (.012) | (.021) |
Net Asset Value, End of Period | $1.00 | $1.00 | $1.00 | $1.00 | $1.00 |
| | | | | |
Total Return | 4.22% | 2.29% | 0.91% | 1.20% | 2.15% |
| | | | | |
Ratios/Supplemental Data | | | | | |
Net Assets, End of Period (Millions) | $15,982 | $13,838 | $13,270 | $13,129 | $10,608 |
Ratio of Total Expenses to | | | | | |
Average Net Assets | 0.13% | 0.13% | 0.13% | 0.14% | 0.14% |
Ratio of Net Investment | | | | | |
Income to Average Net Assets | 4.15% | 2.27% | 0.91% | 1.18% | 2.09% |
See accompanying Notes, which are an integral part of the Financial Statements.
52
Admiral Treasury Money Market Fund
Notes to Financial Statements
Vanguard Admiral Treasury Money Market Fund is registered under the Investment Company Act of 1940 as an open-end investment company, or mutual fund. The fund invests in short-term debt instruments backed by the full faith and credit of the U.S. government.
A. The following significant accounting policies conform to generally accepted accounting principles for U.S. mutual funds. The fund consistently follows such policies in preparing its financial statements.
1. Security Valuation: Securities are valued at amortized cost, which approximates market value.
2. Federal Income Taxes: The fund intends to continue to qualify as a regulated investment company and distribute all of its taxable income. Accordingly, no provision for federal income taxes is required in the financial statements.
3. Distributions: Dividends from net investment income are declared daily and paid on the first business day of the following month.
4. Other: Interest income is accrued daily. Premiums and discounts on debt securities purchased are amortized and accreted, respectively, to interest income over the lives of the respective securities. Security transactions are accounted for on the date securities are bought or sold. Costs used to determine realized gains (losses) on the sale of investment securities are those of the specific securities sold.
B. The Vanguard Group furnishes at cost investment advisory, corporate management, administrative, shareholder accounting, marketing, and distribution services. The costs of such services are allocated to the fund under methods approved by the board of trustees. The fund has committed to provide up to 0.40% of its assets in capital contributions to Vanguard. At August 31, 2006, the fund had contributed capital of $1,728,000 to Vanguard (included in Other Assets), representing 0.01% of the fund’s net assets and 1.73% of Vanguard’s capitalization. The fund’s trustees and officers are also directors and officers of Vanguard.
C. In June 2006, the Financial Accounting Standards Board issued Interpretation No. 48 (“FIN 48”), “Accounting for Uncertainty in Income Taxes.” FIN 48 establishes the minimum threshold for recognizing, and a system for measuring, the benefits of tax-return positions in financial statements. FIN 48 will be effective for the fund’s fiscal year beginning September 1, 2007. Management is in the process of analyzing the fund’s tax positions for purposes of implementing FIN 48; based on the analysis completed to date, management does not believe the adoption of FIN 48 will result in any material impact to the fund’s financial statements.
53
Report of Independent Registered Public Accounting Firm
To the Trustees of Vanguard Money Market Reserves, Vanguard Treasury Funds and Vanguard Admiral Funds and the Shareholders of Vanguard Prime Money Market Fund, Vanguard Federal Money Market Fund, Vanguard Treasury Money Market Fund and Vanguard Admiral Treasury Money Market Fund:
In our opinion, the accompanying statements of net assets and the related statements of operations and of changes in net assets and the financial highlights present fairly, in all material respects, the financial position of Vanguard Prime Money Market Fund, Vanguard Federal Money Market Fund, Vanguard Treasury Money Market Fund and Vanguard Admiral Treasury Money Market Fund (the “Funds”) at August 31, 2006, the results of each of their operations for the year then ended, the changes in each of their net assets for each of the two years in the period then ended and the financial highlights for each of the five years in the period then ended, in conformity with accounting principles generally accepted in the United States of America. These financial statements and financial highlights (hereafter referred to as ���financial statements”) are the responsibility of the Funds’ management; our responsibility is to express an opinion on these financial statements based on our audits. We conducted our audits of these financial statements in accordance with the standards of the Public Company Accounting Oversight Board (United States). Those standards require that we plan and perform the audit to obtain reasonable assurance about whether the financial statements are free of material misstatement. An audit includes examining, on a test basis, evidence supporting the amounts and disclosures in the financial statements, assessing the accounting principles used and significant estimates made by management, and evaluating the overall financial statement presentation. We believe that our audits, which included confirmation of securities at August 31, 2006 by correspondence with the custodian and brokers, provide a reasonable basis for our opinion.
PricewaterhouseCoopers LLP
Philadelphia, Pennsylvania
October 12, 2006
54
Special 2006 tax information (unaudited) for Vanguard Prime Money Market Fund
This information for the fiscal year ended August 31, 2006, is included pursuant to provisions of the Internal Revenue Code.
For non-resident alien shareholders, 38.6% of income dividends are interest related dividends.
Special 2006 tax information (unaudited) for Vanguard Federal Money Market Fund
This information for the fiscal year ended August 31, 2006, is included pursuant to provisions of the Internal Revenue Code.
For non-resident alien shareholders, 48.0% of income dividends are interest related dividends.
Special 2006 tax information (unaudited) for Vanguard Treasury Money Market Fund
This information for the fiscal year ended August 31, 2006, is included pursuant to provisions of the Internal Revenue Code.
For non-resident alien shareholders, 47.8% of income dividends are interest related dividends.
Special 2006 tax information (unaudited) for Vanguard Admiral Treasury Money Market Fund
This information for the fiscal year ended August 31, 2006, is included pursuant to provisions of the Internal Revenue Code.
For non-resident alien shareholders, 48.1% of income dividends are interest related dividends.
55
About Your Fund’s Expenses
As a shareholder of the fund, you incur ongoing costs, which include costs for portfolio management, administrative services, and shareholder reports (like this one), among others. Operating expenses, which are deducted from a fund’s gross income, directly reduce the investment return of the fund.
A fund’s expenses are expressed as a percentage of its average net assets. This figure is known as the expense ratio. The following examples are intended to help you understand the ongoing costs (in dollars) of investing in your fund and to compare these costs with those of other mutual funds. The examples are based on an investment of $1,000 made at the beginning of the period shown and held for the entire period.
The table on page 57 illustrates your fund’s costs in two ways:
• Based on actual fund return. This section helps you to estimate the actual expenses that you paid over the period. The “Ending Account Value” shown is derived from the fund’s actual return, and the third column shows the dollar amount that would have been paid by an investor who started with $1,000 in the fund. You may use the information here, together with the amount you invested, to estimate the expenses that you paid over the period.
To do so, simply divide your account value by $1,000 (for example, an $8,600 account value divided by $1,000 = 8.6), then multiply the result by the number given for your fund under the heading “Expenses Paid During Period.”
• Based on hypothetical 5% yearly return. This section is intended to help you compare your fund’s costs with those of other mutual funds. It assumes that the fund had a yearly return of 5% before expenses, but that the expense ratio is unchanged. In this case—because the return used is not the fund’s actual return—the results do not apply to your investment. The example is useful in making comparisons because the Securities and Exchange Commission requires all mutual funds to calculate expenses based on a 5% return. You can assess your fund’s costs by comparing this hypothetical example with the hypothetical examples that appear in shareholder reports of other funds.
Note that the expenses shown in the table on page 57 are meant to highlight and help you compare ongoing costs only and do not reflect any transactional costs or account maintenance fees. They do not include your fund’s low-balance fee, which is described in the prospectus (the fee does not apply to the Prime Money Market Fund’s Institutional Shares). If this fee were applied to your account, your costs would be higher. Your fund does not charge transaction fees, such as purchase or redemption fees, nor does it carry a “sales load.”
The calculations assume no shares were bought or sold during the period. Your actual costs may have been higher or lower, depending on the amount of your investment and the timing of any purchases or redemptions.
You can find more information about the fund’s expenses, including annual expense ratios, in the Financial Statements section of this report. For additional information on operating expenses and other shareholder costs, please refer to the appropriate fund prospectus.
56
Six Months Ended August 31, 2006 | | | |
| Beginning | Ending | Expenses |
| Account Value | Account Value | Paid During |
Money Market Fund | 2/28/2006 | 8/31/2006 | Period1 |
Based on Actual Fund Return | | | |
Prime | | | |
Investor Shares | $1,000.00 | $1,024.22 | $1.48 |
Institutional Shares | 1,000.00 | 1,025.21 | 0.46 |
Federal | 1,000.00 | 1,023.85 | 1.48 |
Treasury | 1,000.00 | 1,022.58 | 1.48 |
Admiral Treasury | 1,000.00 | 1,023.33 | 0.66 |
Based on Hypothetical 5% Yearly Return | | | |
Prime | | | |
Investor Shares | $1,000.00 | $1,023.74 | $1.48 |
Institutional Shares | 1,000.00 | 1,024.75 | 0.46 |
Federal | 1,000.00 | 1,023.74 | 1.48 |
Treasury | 1,000.00 | 1,023.74 | 1.48 |
Admiral Treasury | 1,000.00 | 1,024.55 | 0.66 |
1 These calculations are based on expenses incurred in the most recent six-month period. The funds’ annualized six-month expense ratios for that period are: for the Prime Money Market Fund, 0.29% for Investor Shares and 0.09% for Institutional Shares; for the Federal Money Market Fund, 0.29%; for the Treasury Money Market Fund, 0.29%; for the Admiral Treasury Money Market Fund, 0.13%. The dollar amounts shown as “Expenses Paid” are equal to the annualized expense ratio multiplied by the average account value over the period, multiplied by the number of days in the most recent six-month period, then divided by the number of days in the most recent 12-month period.
57
Trustees Renew Advisory Arrangement
The board of trustees of Vanguard Prime Money Market Fund, Federal Money Market Fund, Treasury Money Market Fund, and Admiral Treasury Money Market Fund has renewed the funds’ investment advisory arrangement with The Vanguard Group, Inc. Vanguard—through its Fixed Income Group—serves as the investment advisor for the funds. The board determined that continuing the funds’ internalized management structure was in the best interests of the funds and their shareholders.
The board based its decision upon its most recent evaluation of the advisor’s investment staff, portfolio management process, and performance. The trustees considered the factors discussed below, among others. However, no single factor determined whether the board approved the arrangement. Rather, it was the totality of the circumstances that drove the board’s decision.
Nature, extent, and quality of services
The board considered the quality of the funds’ investment management over both short- and long-term periods and took into account the organizational depth and stability of the advisor. Vanguard has been managing investments for more than two decades. George U. Sauter, Vanguard managing director and chief investment officer, has been in the investment management business since 1985. Robert F. Auwaerter, principal in charge of the Fixed Income Group, has been in the investment management business since 1978. The Fixed Income Group adheres to a sound, disciplined investment management process; the team has considerable experience, stability, and depth.
The board concluded that Vanguard’s experience, stability, depth, and performance, among other factors, warranted continuation of the advisory arrangement.
Investment performance
The board considered the short- and long-term performance of the funds, including any periods of outperformance or underperformance of relevant benchmarks and peer groups. The board noted that the funds have performed in line with expectations, and that their results have been consistent with their investment strategies. Information about the funds’ performance, including some of the data considered by the board, can be found in the Performance Summary pages of this report.
Cost
The funds’ expense ratios were far below the average expense ratios charged by funds in their respective peer groups. The funds’ advisory fees were also well below their peer-group averages. Information about the funds’ expense ratios appears in the About Your Fund’s Expenses section of this report as well as in the Financial Statements sections.
The board does not conduct a profitability analysis of Vanguard because of Vanguard’s unique “at-cost” structure. Unlike most other mutual fund management companies, Vanguard is owned by the funds it oversees, and produces “profits” only in the form of reduced expenses for fund shareholders.
The benefit of economies of scale
The board of trustees concluded that the funds’ low-cost arrangement with Vanguard ensures that the funds will realize economies of scale as they grow, with the cost to shareholders declining as fund assets increase.
The board will consider whether to renew the advisory arrangement again after a one-year period.
58
Glossary
Average Quality. An indicator of credit risk, this figure is the average of the ratings assigned to a fund’s fixed income holdings by credit-rating agencies. The agencies make their judgment after appraising an issuer’s ability to meet its obligations. Quality is graded on a scale, with Aaa or AAA indicating the most creditworthy bond issuers. U.S. Treasury securities are considered to have the highest credit quality.
Average Weighted Maturity. The average length of time until fixed income securities held by a fund reach maturity and are repaid. The figure reflects the proportion of fund assets represented by each security.
Expense Ratio. The percentage of a fund’s average net assets used to pay its annual administrative and advisory expenses. These expenses directly reduce returns to investors.
Yield. A snapshot of a fund’s interest income. The yield is expressed as a percentage of the fund’s net asset value. For money market funds, yield is based on income earned over the past seven days and is annualized, or projected forward for the coming year.
59
The People Who Govern Your Fund
The trustees of your mutual fund are there to see that the fund is operated and managed in your best interests since, as a shareholder, you are a part owner of the fund. Your fund’s trustees also serve on the board of directors of The Vanguard Group, Inc., which is owned by the Vanguard funds and provides services to them on an at-cost basis.
A majority of Vanguard’s board members are independent, meaning that they have no affiliation with Vanguard or the funds they oversee, apart from the sizable personal investments they have made as private individuals.
Our independent board members bring distinguished backgrounds in business, academia, and public service to their task of working with Vanguard officers to establish the policies and oversee the activities of the funds. Among board members’ responsibilities are selecting investment advisors for the funds; monitoring fund operations, performance, and costs; reviewing contracts; nominating and selecting new trustees/directors; and electing Vanguard officers.
Each trustee serves a fund until its termination; or until the trustee’s retirement, resignation, or death; or otherwise as specified in the fund’s organizational documents. Any trustee may be removed at a shareholders’ meeting by a vote representing two-thirds of the net asset value of all shares of the fund together with shares of other Vanguard funds organized within the same trust. The table on these two pages shows information for each trustee and executive officer of the fund. The mailing address of the trustees and officers is P.O. Box 876, Valley Forge, PA 19482.
Chairman of the Board, Chief Executive Officer, and Trustee |
| |
John J. Brennan1 | |
Born 1954 | Principal Occupation(s) During the Past Five Years: Chairman of the Board, Chief |
Trustee since May 1987; | Executive Officer, and Director/Trustee of The Vanguard Group, Inc., and of each |
Chairman of the Board and | of the investment companies served by The Vanguard Group. |
Chief Executive Officer | |
142 Vanguard Funds Overseen |
| |
Independent Trustees | |
| |
Charles D. Ellis | |
Born 1937 | Principal Occupation(s) During the Past Five Years: Applecore Partners (pro bono ventures |
Trustee since January 2001 | in education); Senior Advisor to Greenwich Associates (international business strategy |
142 Vanguard Funds Overseen | consulting); Successor Trustee of Yale University; Overseer of the Stern School of Business |
| at New York University; Trustee of the Whitehead Institute for Biomedical Research. |
| |
Rajiv L. Gupta | |
Born 1945 | Principal Occupation(s) During the Past Five Years: Chairman and Chief Executive Officer |
Trustee since December 20012 | of Rohm and Haas Co. (chemicals); Board Member of the American Chemistry Council; |
142 Vanguard Funds Overseen | Director of Tyco International, Ltd. (diversified manufacturing and services) (since 2005); |
| Trustee of Drexel University and of the Chemical Heritage Foundation. |
| |
Amy Gutmann | |
Born 1949 | Principal Occupation(s) During the Past Five Years: President of the University of |
Trustee since June 2006 | Pennsylvania since 2004; Professor in the School of Arts and Sciences, Annenberg School |
142 Vanguard Funds Overseen | for Communication, and Graduate School of Education of the University of Pennsylvania |
| since 2004; Provost (2001–2004) and Laurance S. Rockefeller Professor of Politics and the |
| University Center for Human Values (1990–2004), Princeton University; Director of Carnegie |
| Corporation of New York and of Philadelphia 2016 (since 2005) and of Schuylkill River |
| Development Corporation and Greater Philadelphia Chamber of Commerce (since 2004). |
JoAnn Heffernan Heisen | |
Born 1950 | Principal Occupation(s) During the Past Five Years: Corporate Vice President and Chief |
Trustee since July 1998 | Global Diversity Officer (since January 2006), Vice President and Chief Information |
142 Vanguard Funds Overseen | Officer (1997–2005), and Member of the Executive Committee of Johnson & Johnson |
| (pharmaceuticals/consumer products); Director of the University Medical Center at |
| Princeton and Women’s Research and Education Institute. |
| |
André F. Perold | |
Born 1952 | Principal Occupation(s) During the Past Five Years: George Gund Professor of Finance and |
Trustee since December 2004 | Banking, Harvard Business School (since 2000); Senior Associate Dean, Director of Faculty |
142 Vanguard Funds Overseen | Recruiting, and Chair of Finance Faculty, Harvard Business School; Director and Chairman |
| of UNX, Inc. (equities trading firm) (since 2003); Director of registered investment |
| companies advised by Merrill Lynch Investment Managers and affiliates (1985–2004), |
| Genbel Securities Limited (South African financial services firm) (1999–2003), Gensec |
| Bank (1999–2003), Sanlam, Ltd. (South African insurance company) (2001–2003), and |
| Stockback, Inc. (credit card firm) (2000–2002). |
| |
Alfred M. Rankin, Jr. | |
Born 1941 | Principal Occupation(s) During the Past Five Years: Chairman, President, Chief Executive |
Trustee since January 1993 | Officer, and Director of NACCO Industries, Inc. (forklift trucks/housewares/ lignite); |
142 Vanguard Funds Overseen | Director of Goodrich Corporation (industrial products/aircraft systems and services). |
| |
J. Lawrence Wilson | |
Born 1936 | Principal Occupation(s) During the Past Five Years: Retired Chairman and Chief Executive |
Trustee since April 1985 | Officer of Rohm and Haas Co. (chemicals); Director of Cummins Inc. (diesel engines), |
142 Vanguard Funds Overseen | MeadWestvaco Corp. (packaging products), and AmerisourceBergen Corp. (pharmaceutical |
| distribution); Trustee of Vanderbilt University and of Culver Educational Foundation. |
| |
Executive Officers1 | |
| |
Heidi Stam | |
Born 1956 | Principal Occupation(s) During the Past Five Years: Principal of The Vanguard Group, Inc., |
Secretary since July 2005 | since November 1997; General Counsel of The Vanguard Group since July 2005; |
142 Vanguard Funds Overseen | Secretary of The Vanguard Group and of each of the investment companies served |
| by The Vanguard Group since July 2005. |
| |
Thomas J. Higgins | |
Born 1957 | Principal Occupation(s) During the Past Five Years: Principal of The Vanguard Group, Inc.; |
Treasurer since July 1998 | Treasurer of each of the investment companies served by The Vanguard Group. |
142 Vanguard Funds Overseen | |
| |
Vanguard Senior Management Team |
| |
R. Gregory Barton | Kathleen C. Gubanich | Michael S. Miller |
Mortimer J. Buckley | Paul A. Heller | Ralph K. Packard |
James H. Gately | F. William McNabb, III | George U. Sauter |
| |
Founder | |
| |
John C. Bogle | |
Chairman and Chief Executive Officer, 1974–1996 |
1 Officers of the funds are “interested persons” as defined in the Investment Company Act of 1940.
2 December 2002 for Vanguard Equity Income Fund, Vanguard Growth Equity Fund, the Vanguard Municipal Bond Funds, and the Vanguard State Tax-Exempt Funds.
More information about the trustees is in the Statement of Additional Information, available from The Vanguard Group.
| 
|
| P.O. Box 2600 |
| Valley Forge, PA 19482-2600 |
Connect with Vanguard™ > www.vanguard.com
Fund Information > 800-662-7447 | Vanguard, Admiral, Connect with Vanguard, and the ship |
| logo are trademarks of The Vanguard Group, Inc. |
Direct Investor Account Services > 800-662-2739 | |
| |
Institutional Investor Services > 800-523-1036 | All other marks are the exclusive property of their |
| respective owners. |
Text Telephone > 800-952-3335 | |
| |
| All comparative mutual fund data are from Lipper Inc. |
| or Morningstar, Inc., unless otherwise noted. |
| |
| |
| You can obtain a free copy of Vanguard’s proxy voting |
This material may be used in conjunction | guidelines by visiting our website, www.vanguard.com, |
with the offering of shares of any Vanguard | and searching for “proxy voting guidelines,” or by calling |
fund only if preceded or accompanied by | Vanguard at 800-662-2739. They are also available from |
the fund’s current prospectus. | the SEC’s website, www.sec.gov. In addition, you may |
| obtain a free report on how your fund voted the proxies for |
| securities it owned during the 12 months ended June 30. |
| To get the report, visit either www.vanguard.com |
| or www.sec.gov. |
| |
| You can review and copy information about your fund |
| at the SEC’s Public Reference Room in Washington, D.C. |
| To find out more about this public service, call the SEC |
| at 202-551-8090. Information about your fund is also |
| available on the SEC’s website, and you can receive |
| copies of this information, for a fee, by sending a |
| request in either of two ways: via e-mail addressed to |
| publicinfo@sec.gov or via regular mail addressed to the |
| Public Reference Section, Securities and Exchange |
| Commission, Washington, DC 20549-0102. |
| |
| |
| |
| |
| © 2006 The Vanguard Group, Inc. |
| All rights reserved. |
| Vanguard Marketing Corporation, Distributor. |
| |
| Q300 102006 |
Item 4: Principal Accountant Fees and Services.
(a) Audit Fees.
(b) Audit-Related Fees.
Includes fees billed in connection with assurance and related services provided to the Registrant, The Vanguard Group, Inc., Vanguard Marketing Corporation, and other registered investment companies in the Vanguard Group.
(c) Tax Fees.
Includes fees billed in connection with tax compliance, planning and advice services provided to the Registrant, The Vanguard Group, Inc., Vanguard Marketing Corporation, and other registered investment companies in the Vanguard Group and related to income and excise taxes.
(d) All Other Fees.
Includes fees billed for services related to risk management and privacy matters. Services were provided to the Registrant, The Vanguard Group, Inc., Vanguard Marketing Corporation, and other registered investment companies in the Vanguard Group.
(e) (1) Pre-Approval Policies. The policy of the Registrant’s Audit Committee is to consider and, if appropriate, approve before the principal accountant is engaged for such services, all specific audit and non-audit services provided to: (1) the Registrant; (2) The Vanguard Group, Inc.; (3) other entities controlled by The Vanguard Group, Inc. that provide ongoing services to the Registrant; and (4) other registered investment companies in the Vanguard Group. In making a determination, the Audit Committee considers whether the services are consistent with maintaining the principal accountant’s independence.
In the event of a contingency situation in which the principal accountant is needed to provide services in between scheduled Audit Committee meetings, the Chairman of the Audit Committee would be called on to consider and, if appropriate, pre-approve audit or permitted non-audit services in an amount sufficient to complete services through the next Audit Committee meeting, and to determine if such services would be consistent with maintaining the accountant’s independence. At the next scheduled Audit Committee meeting, services and fees would be presented to the Audit Committee for formal consideration, and, if appropriate, approval by the entire Audit Committee. The Audit Committee would again consider whether such services and fees are consistent with maintaining the principal accountant’s independence.
The Registrant’s Audit Committee is informed at least annually of all audit and non-audit services provided by the principal accountant to the Vanguard complex, whether such services are provided to: (1) the Registrant; (2) The Vanguard Group, Inc.; (3) other entities controlled by The Vanguard Group, Inc. that provide ongoing services to the Registrant; or other registered investment companies in the Vanguard Group.
(2) No percentage of the principal accountant’s fees or services were approved pursuant to the waiver provision of paragraph (c)(7)(i)(C) of Rule 2-01 of Regulation S-X.
(g) Aggregate Non-Audit Fees.
Includes fees billed for non-audit services provided to the Registrant, The Vanguard Group, Inc., Vanguard Marketing Corporation, and other registered investment companies in the Vanguard Group.
(h) For the most recent fiscal year, the Audit Committee has determined that the provision of all non-audit services was consistent with maintaining the principal accountant’s independence.
(a) Disclosure Controls and Procedures. The Principal Executive and Financial Officers concluded that the Registrant’s Disclosure Controls and Procedures are effective based on their evaluation of the Disclosure Controls and Procedures as of a date within 90 days of the filing date of this report.
(b) Internal Control Over Financial Reporting. There were no significant changes in Registrant’s internal control over financial reporting or in other factors that could significantly affect this control subsequent to the date of the evaluation, including any corrective actions with regard to significant deficiencies and material weaknesses.
(a) Code of Ethics.
(b) Certifications.
Pursuant to the requirements of the Securities Exchange Act of 1934 and the Investment Company Act of 1940, the registrant has duly caused this report to be signed on its behalf by the undersigned, thereunto duly authorized.
Pursuant to the requirements of the Securities Exchange Act of 1934 and the Investment Company Act of 1940, this report has been signed below by the following persons on behalf of the registrant and in the capacities and on the dates indicated.
*By Power of Attorney. See File Number 002-65955-99, filed on July 27, 2006. Incorporated by Reference.