> | Vanguard’s four money market funds posted returns ranging from 2.9% to 3.8% for the fiscal year ended August 31, 2008. |
> | The Federal Reserve Board cut its short-term interest rate target seven times during the period, leading to the lowest money market returns since 2005. |
> | The funds’ returns exceeded those for their respective peer groups—not only for the year but for the decade ended August 31. |
Vanguard participates in the Treasury Guarantee Program. See page 7. |
Contents | |
| |
Your Fund’s Total Returns | 1 |
President’s Letter | 2 |
Advisor’s Report | 8 |
Prime Money Market Fund | 10 |
Federal Money Market Fund | 26 |
Treasury Money Market Fund | 37 |
Admiral Treasury Money Market Fund | 47 |
About Your Fund’s Expenses | 59 |
Trustees Approve Advisory Arrangement | 61 |
Glossary | 62 |
Past performance is not a guarantee of future results. Investment returns will fluctuate. (Current performance may be lower or higher than the performance data cited. For performance data current to the most recent month-end, visit our website at www.vanguard.com/performance.)
Please note: The opinions expressed in this report are just that—informed opinions. They should not be considered promises or advice. Also, please keep in mind that the information and opinions cover the period through the date on the front of this report. Of course, the risks of investing in your fund are spelled out in the prospectus.
Your Fund’s Total Returns
Fiscal Year Ended August 31, 2008 | | | |
| | | 7-Day SEC |
| Ticker | Total | Yield1 |
| Symbol | Returns | 8/31/2008 |
Vanguard Prime Money Market Fund | | | |
Investor Shares | VMMXX | 3.6% | 2.17% |
Average Money Market Fund2 | | 3.0 | — |
Institutional Shares3 | VMRXX | 3.8 | 2.32 |
Average Institutional Money Market Fund2 | | 3.5 | — |
| | | |
Vanguard Federal Money Market Fund | VMFXX | 3.5% | 2.01% |
Average Government Money Market Fund2 | | 2.7 | — |
| | | |
Vanguard Treasury Money Market Fund | VMPXX | 2.9% | 1.67% |
iMoneyNet Money Fund Report’s Average 100% Treasury Fund2 | | 2.1 | — |
| | | |
Vanguard Admiral Treasury Money Market Fund4 | VUSXX | 3.1% | 1.80% |
iMoneyNet Money Fund Report’s Average 100% Treasury Fund2 | | 2.1 | — |
1 The yield of a money market fund more closely reflects the current earnings of the fund than its total return.
2 For the Prime and Federal Money Market Funds, peer-group returns are derived from data provided by Lipper Inc.; for the Treasury and Admiral Treasury Money Market Funds, peer-group returns are based on data provided by iMoneyNet, Inc.
3 This class of shares carries low expenses and is available for a minimum initial investment of $5 million.
4 Minimum initial investment is $50,000.
1

President’s Letter
Dear Shareholder,
During the 12 months ended August 31, 2008, short-term interest rates fell to their lowest level in four years. The decline in market rates pushed down the yields of money market funds.
Total returns for the four Vanguard Money Market Funds during the period ranged from 2.9% for the Treasury Money Market Fund to 3.8% for the Prime Money Market Fund’s Institutional Shares. Each fund earned more than the average return of its respective peer group.
The funds’ low costs and high credit standards helped them to generate competitive yields during a period of pronounced uncertainty that affected even ostensibly low-risk money market securities.
The table on page 4 illustrates our cost advantage by comparing the expense ratios of the funds and their peer groups. The table on page 4 shows the change in yield over the year for each fund.
Risk-aversion increased, and Treasuries outperformed
During the period, the collapse in subprime mortgage-backed securities and the aftershocks prompted a flight to safety by many investors. Short-term U.S. Treasury securities were among the fixed income market’s best performers. Over the 12 months, the broad taxable bond market returned a respectable 5.9%, largely reflecting the Treasury bond rally.
2
As risk-aversion increased, the difference between the yields of Treasury bonds and those of all other securities increased, depressing the price of corporate debt. (Yield and price move in opposite directions.) Even as corporate bonds grew cheaper, the prices of most goods and services rose quickly, powered by escalating energy prices.
The combination of fast-rising prices, financial turmoil, and economic weakness put the Federal Reserve Board in an uncomfortable position. The Fed decided that it was imperative to respond to the financial crisis with a dramatic easing of monetary policy through interest rate cuts, even as it recognized that the result might be higher inflation. Over the full
12 months, the Fed reduced its target for the federal funds rate seven times, cutting the target rate from 5.25% to 2.00%.
Stocks performed poorly as volatility returned
Stocks lost ground as credit-market turmoil spread throughout the global economy. Over the full 12 months, the broad U.S. stock market lost about –10% of its value. International markets followed a similar path, returning –12.2% for the year.
The descent was bumpy. After years of relative calm, the U.S. market routinely rose or fell by more than a percentage point in a day’s trading. The volatility reflected a seemingly endless series
Market Barometer | | | |
| Average Annual Total Returns |
| Periods Ended August 31, 2008 |
| One Year | Three Years | Five Years |
Bonds | | | |
Lehman U.S. Aggregate Bond Index (Broad taxable market) | 5.9% | 4.3% | 4.6% |
Lehman Municipal Bond Index | 4.5 | 3.3 | 4.4 |
Citigroup 3-Month Treasury Bill Index | 2.8 | 4.0 | 3.1 |
| | | |
Stocks | | | |
Russell 1000 Index (Large-caps) | –10.6% | 3.9% | 7.4% |
Russell 2000 Index (Small-caps) | –5.5 | 4.8 | 9.6 |
Dow Jones Wilshire 5000 Index (Entire market) | –9.9 | 4.2 | 7.9 |
MSCI All Country World Index ex USA (International) | –12.2 | 10.7 | 16.1 |
| | | |
CPI | | | |
Consumer Price Index | 5.4% | 3.7% | 3.5% |
3
of unnerving developments: the persistent rise in energy prices, further deterioration in the housing market, a string of bank failures, and the broad economy’s deceleration.
Funds’ high quality and low costs gave them a competitive advantage
The yields of Vanguard’s money market funds fell during the fiscal year as the Fed slashed short-term interest rates. On August 31, each fund’s yield was less than half its level a year earlier.
While the ongoing shake-up in the financial industry resulted in defaults and downgrades of many investment securities, the Vanguard Money Market Funds managed to steer clear of the turmoil while producing peer-beating total returns. These results reflect several factors: the funds’ customary emphasis on high-quality securities, the diligent work of the credit analysts in Vanguard Fixed Income Group, and the funds’ low operating costs.
Expense Ratios1 | | |
Your Fund Compared With Its Peer Group | | |
| Fund | Peer-Group |
| Expense | Expense |
Money Market Fund | Ratio | Ratio |
Prime | | |
Investor Shares | 0.24% | 0.90% |
Institutional Shares | 0.08 | 0.44 |
Federal | 0.24 | 0.79 |
Treasury | 0.24 | 0.76 |
Admiral Treasury | 0.10 | 0.76 |
Changes in Yields | | |
| 7-Day SEC Yield |
| August 31, | August 31, |
Money Market Fund | 2008 | 2007 |
Prime | | |
Investor Shares | 2.17% | 5.11% |
Institutional Shares | 2.32 | 5.27 |
Federal | 2.01 | 5.03 |
Treasury | 1.67 | 4.54 |
Admiral Treasury | 1.80 | 4.64 |
1 Fund expense ratios shown are from the prospectus dated December 28, 2007. The expense ratios for the fiscal year ended August 31, 2008, were 0.23% for the Prime Money Market Investor Shares and 0.08% for the Institutional Shares; 0.23% for the Federal Money Market Fund; 0.23% for the Treasury Money Market Fund; and 0.10% for the Admiral Treasury Money Market Fund. Peer groups are: for the Prime Money Market Fund Investor Shares, the Average Money Market Fund; for the Prime Money Market Fund Institutional Shares, the Average Institutional Money Market Fund; for the Federal Money Market Fund, the Average Government Money Market Fund; for the Treasury and Admiral Treasury Money Market Funds, the Average U.S. Treasury Money Market Fund. Peer-group expense ratios are derived from data provided by Lipper Inc. and capture information through year-end 2007.
4
As can be expected, the four funds had slight variations in performance. The variation is largely due to incremental differences in risk exposure and cost within this group of low-risk, low-cost portfolios. The share price of each fund remained at $1, as is expected but not guaranteed.
A long-term analysis shows the funds outperforming peers
A look at the ten-year performance of the Vanguard Money Market Funds underscores the benefits of their rigorous quality standards combined with very low costs. The funds’ advisor, our Fixed Income Group, has no need to take on extra risk in pursuit of marginally higher yields; our higher-cost competitors, in contrast, do face such pressure. This strategy has helped the Vanguard funds to outperform their peer-group averages over the long term.
The table below shows the average annual returns for the funds and their peer groups for the ten years ended August 31, 2008.
The funds help investors to save regardless of market volatility
Declining money market yields can be frustrating for investors who enjoyed income more than twice as high just a year ago.
Total Returns | | |
Ten Years Ended August 31, 2008 | | |
| Average Annual Return |
| | Average |
| Vanguard | Competing |
Money Market Fund | Fund | Fund1 |
Prime | | |
Investor Shares | 3.6% | 3.0% |
Institutional Shares | 3.8 | 3.4 |
Federal | 3.5 | 3.0 |
Treasury | 3.3 | 2.8 |
Admiral Treasury | 3.4 | 2.8 |
Investment returns will fluctuate. The figures shown represent past performance, which is not a guarantee of future results that may be achieved by the funds. Current performance may be lower or higher than the performance data cited. For performance data current to the most recent month-end, visit our website at www.vanguard.com/performance.
1 Peer groups are: for the Prime Money Market Fund Investor Shares, the Average Money Market Fund; for the Prime Money Market Fund Institutional Shares, the Average Institutional Money Market Fund; for the Federal Money Market Fund, the Average Government Money Market Fund; for the Treasury and Admiral Treasury Money Market Funds, the iMoneyNet Money Fund Report’s Average 100% Treasury Fund. For the Prime and Federal Money Market Funds, peer-group returns are derived from data provided by Lipper Inc.; for the Treasury and Admiral Treasury Money Market Funds, peer-group returns are based on data provided by iMoneyNet, Inc.
5
But these periodic fluctuations in the market and in short-term interest rates should not be a surprise to us. Markets are dynamic, and the pace of change during periods of crisis can be breathtaking.
In such unsettled times, it is critical to keep an eye on how well your investment is managed and how much you are paying for that service. At Vanguard, where money market investors pay less than one-half the average expense ratio of competing funds, you keep a greater portion of your funds’ return regardless of market conditions.
Vanguard’s four money market funds are an effective vehicle to help you address your short-term savings needs.
Thank you for investing your assets at Vanguard.
Sincerely,

F. William McNabb III
President and Chief Executive Officer
September 11, 2008
6
Vanguard money market funds to participate in Treasury Guarantee Program
After the close of the fiscal period, the financial market’s upheaval intensified, leading to a decline in the net asset value of an institutional money market fund at another company. This development provoked concern among investors. In response, the U.S. Treasury introduced a temporary program to guarantee the account values of eligible money market funds. On October 7, the trustees of the Vanguard money market funds elected to participate in the program.
Vanguard remains highly confident in the ability of its money market funds to maintain a stable net asset value of $1 per share. The funds emphasize high-quality, very liquid securities. At no time were our funds in danger of “breaking the buck.” We don’t anticipate ever needing the Treasury’s coverage.
Why we are participating
Vanguard chose to participate in the Treasury program because our trustees regard it as a helpful step in restoring normal conditions in the credit markets, a development that will benefit our funds’ shareholders. The trustees also recognize that, despite Vanguard’s confidence in the management of its funds, the program offers some protection from developments we cannot control, such as the potential investor reaction if problems should occur with money market funds at other firms.
The Treasury will decide in December whether to extend the temporary program. If the program is extended, there is no assurance that the funds will continue to participate.
Program details
The Treasury program provides coverage to shareholders for amounts that they held in participating taxable and tax-exempt money market funds at the close of business on September 19, 2008. The coverage lasts for three months. To participate, each Vanguard money market fund is required to pay an up-front fee of 0.01% ($1 per $10,000) of net assets as of September 19.
Coverage will be triggered if a participating fund’s net asset value falls below $0.995 and the trustees of the fund decide to liquidate the fund, which means selling all of its assets and redeeming all investors’ shares. Shareholders will be covered for the lesser of the value of their accounts as of September 19, 2008, or the value of their accounts on the date of liquidation.
7
Advisor’s Report
During the past 12 months, the Vanguard Money Market Funds posted returns ranging from 2.9% to 3.8%. All of the funds outpaced their peer groups’ average returns for the year ended August 31, 2008.
The investment environment
Faced with a financial crisis, the Federal Reserve Board slashed the federal funds rate target from 5.25% to 2.00% in a series of attempts to stimulate the economy and prevent it from heading into a recession.
Commercial banks and Wall Street dealers, saddled with securities they could no longer market, received relief from the Fed in the form of bold new programs designed to fund their illiquid positions. Many of these securities were backed by home mortgages, which had lost value because of the housing market’s deterioration.
In recent years, competitive pressure has encouraged some money market funds to push the envelope in their search for higher yields—a hazard we have managed to avoid. Wall Street responded to the market’s demand with a steady stream of highly rated, complex products such as structured investment vehicles (SIVs), which manufacture ostensibly high-quality securities from lower-quality assets. During the past year, SIVs came under pressure as questions were raised about the assets that backed them. Ultimately, the U.S. Treasury stepped in to help resolve the illiquidity problems in this market. Many SIVs were eventually able to obtain credit or liquidity support from banks, but only after prolonged periods of uncertainty and rapid deterioration in credit ratings.
We note that Vanguard money market funds have never held securities issued by SIVs. Our credit analysis team steered us away from these investments, protecting Vanguard clients.
Conditions were similarly eventful at Fannie Mae and Freddie Mac—more formally known as the Federal National Mortgage Association and the Federal Home Loan Mortgage Corporation—the giant, government-sponsored mortgage companies that are a significant presence in the money markets. On September 7, shortly after the close of the funds’ fiscal year, U.S. Treasury Secretary Henry Paulson announced that the government was taking steps to address the systemic risk posed by the mortgage companies’ troubled balance sheets.
The Federal Housing Finance Agency was appointed conservator of Fannie Mae and Freddie Mac. The Treasury will ensure that the companies are adequately capitalized by purchasing senior preferred stock on a quarterly basis. The Treasury also established a secured lending facility open to both companies, as well as to the Federal Home Loan Banks (this facility
8
expires at the end of 2009). In addition, the Treasury announced that it will establish a temporary program to purchase mortgage-backed securities issued by government agencies.
The management of the funds
During the year, Vanguard Prime Money Market Fund accumulated a large position in U.S. Treasury securities. Our original plan was to limit the size of this position, using it as a substitute for large overnight investments in repurchase agreements, which were becoming increasingly difficult to arrange. As the credit markets deteriorated, however, these Treasury securities evolved into a core holding. When market conditions improve, we will modify this stance.
Vanguard Federal Money Market Fund accumulated significant Treasury holdings after concerns grew that Fannie Mae and Freddie Mac could face difficulty raising capital. In view of the government’s supportive actions, we anticipate increasing the fund’s exposure to those companies once again.
In the Treasury and Admiral Treasury Money Market Funds, we maintained average maturities that were longer than usual because of the steepness of the Treasury-bill yield curve.
During this tumultuous 12 months, all the Vanguard Money Market Funds benefited from their customary emphasis on high-quality, liquid securities. As always, our efforts to produce peer-beating returns while upholding these stringent criteria were enhanced by the funds’ low operating costs.
David R. Glocke, Principal
John C. Lanius, Portfolio Manager
Vanguard Fixed Income Group
September 16, 2008
9
Prime Money Market Fund
Fund Profile
As of August 31, 2008
Financial Attributes | |
| |
7-Day SEC Yield1 | |
Investor Shares | 2.17% |
Institutional Shares | 2.32% |
Average Weighted Maturity | 67 days |
Average Quality2 | Aaa |
Expense Ratio (8/31/2007)3 | |
Investor Shares | 0.24% |
Institutional Shares | 0.08% |
Distribution by Credit Quality2 (% of portfolio) |
| |
Aaa | 58.0% |
Aa | 38.0 |
A | 4.0 |
Sector Diversification (% of portfolio) | |
| |
Banker’s Acceptances | 2.8% |
Finance | |
Commercial Paper | 14.4 |
Certificates of Deposit | 28.3 |
Treasury/Agency | 53.3 |
Other | 1.2 |
1 See the Glossary for a definition.
2 Moody’s Investors Service.
3 The expense ratios shown are from the prospectus dated December 28, 2007. The expense ratios for the fiscal year ended
August 31, 2008, were 0.23% for Investor Shares and 0.08% for Institutional Shares.
10
Prime Money Market Fund
Performance Summary
Investment returns will fluctuate. All of the returns in this report represent past performance, which is not a guarantee of future results that may be achieved by the fund. (Current performance may be lower or higher than the performance data cited. For performance data current to the most recent month-end, visit our website at www.vanguard.com/performance.) The returns shown do not reflect taxes that a shareholder would pay on fund distributions. An investment in a money market fund is not insured or guaranteed by the Federal Deposit Insurance Corporation or any other government agency. Although the fund seeks to preserve the value of your investment at $1 per share, it is possible to lose money by investing in the fund. The fund’s 7-day SEC yield reflects its current earnings more closely than do the average annual returns.
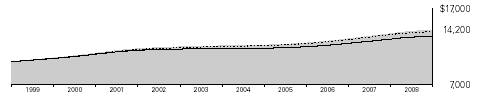
Cumulative Performance: August 31, 1998–August 31, 2008
Initial Investment of $10,000
| |
| Average Annual Total Returns | Final Value of |
| Periods Ended August 31, 2008 | a $10,000 |
| One Year | Five Years | Ten Years | Investment |
Prime Money Market Fund Investor Shares1 | 3.60% | 3.26% | 3.57% | $14,200 |
Citigroup 3-Month Treasury Bill Index | 2.79 | 3.08 | 3.42 | 13,992 |
Average Money Market Fund2 | 3.01 | 2.65 | 2.97 | 13,397 |
| | | | Final Value of |
| | | | a $5,000,000 |
| One Year | Five Years | Ten Years | Investment |
Prime Money Market Fund Institutional Shares | 3.75% | 3.45% | 3.76% | $7,234,718 |
Citigroup 3-Month Treasury Index | 2.79 | 3.08 | 3.42 | 6,996,141 |
Average Institutional Money Market Fund2 | 3.48 | 3.11 | 3.42 | 7,001,221 |
1 Total returns do not include the account service fee that may be applicable to certain accounts with balances below $10,000.
2 Returns for the Average Money Market Fund and Average Institutional Money Market Fund are derived from data provided by Lipper Inc.
11
Prime Money Market Fund
Fiscal-Year Total Returns (%): August 31, 1998–August 31, 2008 |
| | |
| Prime Money | |
| Market Fund | Average |
Fiscal Year | Investor Shares1 | Fund2 |
1999 | 5.0% | 4.4% |
2000 | 5.9 | 5.3 |
2001 | 5.4 | 4.8 |
2002 | 2.1 | 1.4 |
2003 | 1.1 | 0.6 |
2004 | 0.8 | 0.4 |
2005 | 2.3 | 1.7 |
2006 | 4.4 | 3.7 |
2007 | 5.2 | 4.6 |
2008 | 3.6 | 3.0 |
7-day SEC yield (8/31/2008): 2.17% | | |
Average Annual Total Returns: Periods Ended June 30, 2008
This table presents average annual total returns through the latest calendar quarter—rather than through the end of the fiscal period. Securities and Exchange Commission rules require that we provide this information.
| Inception Date | One Year | Five Years | Ten Years |
Investor Shares1 | 6/4/1975 | 4.11% | 3.21% | 3.62% |
Institutional Shares | 10/3/1989 | 4.27 | 3.40 | 3.82 |
1 Total returns do not include the account service fee that may be applicable to certain accounts with balances below $10,000.
2 Returns for the Average Money Market Fund are derived from data provided by Lipper Inc. Note: See Financial Highlights tables for dividend information.
12
Prime Money Market Fund
Financial Statements
Statement of Net Assets
As of August 31, 2008
The fund provides a complete list of its holdings four times in each fiscal year, at the quarter-ends. For the second and fourth fiscal quarters, the lists appear in the fund’s semiannual and annual reports to shareholders. For the first and third fiscal quarters, the fund files the lists with the Securities and Exchange Commission on Form N-Q. Shareholders can look up the fund’s Forms N-Q on the SEC’s website at www.sec.gov. Forms N-Q may also be reviewed and copied at the SEC’s Public Reference Room (see the back cover of this report for further information).
| | | | Face | Market |
| | | Maturity | Amount | Value• |
| | Yield1 | Date | ($000) | ($000) |
U.S. Government and Agency Obligations (53.1%) | | | |
2,3 | Federal Farm Credit Bank | 2.651% | 10/6/08 | 74,000 | 73,999 |
2 | Federal Home Loan Bank | 1.950% | 9/2/08 | 94,000 | 93,995 |
2 | Federal Home Loan Bank | 2.411% | 9/5/08 | 400,109 | 400,002 |
2,3 | Federal Home Loan Bank | 2.548% | 9/5/08 | 1,917,000 | 1,916,955 |
2,3 | Federal Home Loan Bank | 2.651% | 9/22/08 | 378,000 | 377,994 |
2 | Federal Home Loan Bank | 2.485%–2.486% | 9/24/08 | 1,198,230 | 1,196,339 |
2 | Federal Home Loan Bank | 2.445% | 9/26/08 | 313,000 | 312,472 |
2 | Federal Home Loan Bank | 2.513% | 10/1/08 | 2,385,000 | 2,380,031 |
2 | Federal Home Loan Bank | 2.362% | 10/8/08 | 1,500,000 | 1,496,380 |
2 | Federal Home Loan Bank | 2.668% | 10/22/08 | 515,604 | 513,668 |
2,3 | Federal Home Loan Bank | 2.636% | 10/24/08 | 195,000 | 194,989 |
2 | Federal Home Loan Bank | 2.699% | 10/27/08 | 845,641 | 842,116 |
2,3 | Federal Home Loan Mortgage Corp. | 2.639% | 9/26/08 | 413,000 | 412,937 |
2,3 | Federal Home Loan Mortgage Corp. | 2.641% | 9/30/08 | 3,425,000 | 3,424,895 |
2 | Federal Home Loan Mortgage Corp. | 2.597% | 11/24/08 | 200,000 | 198,796 |
2 | Federal National Mortgage Assn. | 2.441% | 9/3/08 | 350,000 | 349,953 |
2 | Federal National Mortgage Assn. | 2.459% | 9/10/08 | 130,000 | 129,920 |
2,3 | Federal National Mortgage Assn. | 2.621% | 10/6/08 | 2,700,000 | 2,699,543 |
2 | Federal National Mortgage Assn. | 2.614% | 10/8/08 | 144,000 | 143,615 |
2 | Federal National Mortgage Assn. | 2.668% | 10/22/08 | 660,000 | 657,522 |
2 | Federal National Mortgage Assn. | 2.465% | 10/29/08 | 181,975 | 181,257 |
2 | Federal National Mortgage Assn. | 2.465% | 11/12/08 | 245,000 | 243,800 |
| U.S. Treasury Bill | 1.877% | 9/18/08 | 2,000,000 | 1,998,239 |
| U.S. Treasury Bill | 1.753% | 9/25/08 | 1,804,800 | 1,802,694 |
| U.S. Treasury Bill | 1.874% | 10/9/08 | 700,000 | 698,622 |
| U.S. Treasury Bill | 1.715% | 10/30/08 | 1,650,000 | 1,645,403 |
| U.S. Treasury Bill | 1.903% | 11/20/08 | 5,000,000 | 4,979,056 |
| U.S. Treasury Bill | 1.939% | 11/28/08 | 5,000,000 | 4,976,533 |
| U.S. Treasury Bill | 2.082% | 1/8/09 | 4,325,000 | 4,293,074 |
| U.S. Treasury Bill | 1.967% | 1/15/09 | 3,000,000 | 2,977,900 |
| U.S. Treasury Bill | 1.898% | 1/29/09 | 3,000,000 | 2,976,500 |
| U.S. Treasury Bill | 1.939% | 2/5/09 | 4,000,000 | 3,966,507 |
| U.S. Treasury Bill | 2.041% | 2/12/09 | 3,000,000 | 2,972,393 |
| U.S. Treasury Bill | 2.000% | 2/19/09 | 4,000,000 | 3,962,380 |
| U.S. Treasury Bill | 1.944% | 2/26/09 | 1,000,000 | 990,482 |
Total U.S. Government and Agency Obligations (Cost $56,480,961) | | 56,480,961 |
13
Prime Money Market Fund
| | | | Face | Market |
| | | Maturity | Amount | Value• |
| | Yield1 | Date | ($000) | ($000) |
Commercial Paper (14.3%) | | | | |
Finance—Auto (1.2%) | | | | |
| American Honda Finance Corp. | 2.156% | 9/3/08 | 48,250 | 48,244 |
| American Honda Finance Corp. | 2.443%–2.473% | 9/8/08 | 225,500 | 225,393 |
| American Honda Finance Corp. | 2.443% | 9/9/08 | 55,000 | 54,970 |
| American Honda Finance Corp. | 2.390% | 9/10/08 | 88,000 | 87,948 |
| American Honda Finance Corp. | 2.444% | 9/12/08 | 46,750 | 46,715 |
4 | BMW US Capital LLC | 2.061% | 9/5/08 | 50,000 | 49,989 |
4 | BMW US Capital LLC | 2.063% | 9/22/08 | 25,000 | 24,969 |
| Toyota Motor Credit Corp. | 2.466% | 9/11/08 | 225,000 | 224,847 |
| Toyota Motor Credit Corp. | 2.617% | 10/1/08 | 19,000 | 18,959 |
| Toyota Motor Credit Corp. | 2.619% | 10/27/08 | 401,000 | 399,378 |
| Toyota Motor Credit Corp. | 2.587% | 11/24/08 | 98,000 | 97,412 |
| | | | | 1,278,824 |
Finance—Other (1.4%) | | | | |
| General Electric Capital Corp. | 2.516% | 9/8/08 | 500,000 | 499,757 |
| General Electric Capital Corp. | 2.516% | 9/9/08 | 500,000 | 499,722 |
| General Electric Capital Corp. | 2.518% | 10/16/08 | 180,000 | 179,438 |
| General Electric Capital Corp. | 2.590% | 11/13/08 | 320,000 | 318,332 |
| | | | | 1,497,249 |
Foreign Banks (5.7%) | | | | |
4 | Australia & New Zealand Banking Group, Ltd. | 2.758% | 9/5/08 | 50,500 | 50,485 |
4 | Australia & New Zealand Banking Group, Ltd. | 2.647% | 9/8/08 | 100,000 | 99,949 |
4 | Australia & New Zealand Banking Group, Ltd. | 2.769% | 11/4/08 | 200,000 | 199,022 |
4 | Australia & New Zealand Banking Group, Ltd. | 2.730% | 11/17/08 | 223,450 | 222,155 |
| Bank of Scotland PLC | 2.921% | 9/22/08 | 11,400 | 11,381 |
| CBA (Delaware) Finance Inc. | 2.719% | 9/12/08 | 196,500 | 196,338 |
| CBA (Delaware) Finance Inc. | 2.729% | 9/15/08 | 100,000 | 99,895 |
| CBA (Delaware) Finance Inc. | 2.738% | 11/21/08 | 100,000 | 99,388 |
| CBA (Delaware) Finance Inc. | 2.739% | 11/25/08 | 82,000 | 81,473 |
4 | Danske Corp. | 2.647% | 9/8/08 | 441,500 | 441,274 |
4 | Danske Corp. | 2.729%–2.789% | 9/15/08 | 224,650 | 224,411 |
4 | Danske Corp. | 2.790% | 9/19/08 | 162,350 | 162,125 |
4 | Danske Corp. | 2.739% | 10/15/08 | 142,000 | 141,528 |
4 | Danske Corp. | 2.739% | 10/17/08 | 230,000 | 229,201 |
4 | Danske Corp. | 2.729% | 11/12/08 | 135,000 | 134,268 |
4 | Danske Corp. | 2.729% | 11/13/08 | 165,000 | 164,093 |
| Dexia Delaware LLC | 2.660% | 9/8/08 | 100,000 | 99,949 |
| Nordea North America Inc. | 2.719% | 10/9/08 | 200,000 | 199,430 |
| Santander Central Hispano Finance | | | | |
| (Delaware), Inc. | 2.667% | 9/5/08 | 419,500 | 419,376 |
| Santander Central Hispano Finance | | | | |
| (Delaware), Inc. | 2.770% | 9/19/08 | 400,000 | 399,450 |
| Santander Central Hispano Finance | | | | |
| (Delaware), Inc. | 2.800% | 11/12/08 | 159,900 | 159,011 |
| Svenska Handelsbanken, Inc. | 2.729% | 10/23/08 | 489,000 | 487,086 |
| Svenska Handelsbanken, Inc. | 2.729% | 11/12/08 | 303,350 | 301,706 |
| Svenska Handelsbanken, Inc. | 2.729% | 11/13/08 | 200,000 | 198,901 |
4 | Westpac Banking Corp. | 2.749% | 9/17/08 | 200,000 | 199,757 |
4 | Westpac Banking Corp. | 2.709% | 10/7/08 | 495,500 | 494,167 |
4 | Westpac Banking Corp. | 2.750% | 11/5/08 | 500,000 | 497,535 |
| | | | | 6,013,354 |
| | | | | | |
14
Prime Money Market Fund
| | | | Face | Market |
| | | Maturity | Amount | Value• |
| | Yield1 | Date | ($000) | ($000) |
Foreign Government (0.2%) | | | | |
4 | Electricite de France | 2.217%–2.415% | 10/10/08 | 197,915 | 197,423 |
4 | Electricite de France | 2.334% | 10/20/08 | 25,000 | 24,921 |
4 | Electricite de France | 2.313% | 11/10/08 | 48,750 | 48,532 |
| | | | | 270,876 |
Foreign Industrial (3.6%) | | | | |
4 | BASF SE | 2.344% | 9/3/08 | 125,000 | 124,984 |
4 | BASF SE | 2.314% | 9/8/08 | 62,750 | 62,722 |
4 | BASF SE | 2.465% | 9/15/08 | 233,000 | 232,778 |
4 | BASF SE | 2.383% | 10/2/08 | 58,750 | 58,630 |
4 | BASF SE | 2.364% | 10/16/08 | 52,050 | 51,897 |
4 | BASF SE | 2.354% | 10/23/08 | 195,000 | 194,341 |
4 | Nestle Capital Corp. | 2.182% | 11/12/08 | 195,000 | 194,154 |
4 | Nestle Capital Corp. | 2.182% | 11/13/08 | 244,000 | 242,926 |
4 | Nestle Capital Corp. | 2.182% | 11/14/08 | 115,000 | 114,487 |
4 | Nestle Capital Corp. | 2.203% | 12/1/08 | 493,000 | 490,271 |
4 | Novartis Finance Corp. | 2.291%–2.311% | 10/1/08 | 287,000 | 286,452 |
4 | Novartis Finance Corp. | 2.311% | 10/2/08 | 115,000 | 114,772 |
4 | Novartis Finance Corp. | 2.281% | 10/3/08 | 42,500 | 42,414 |
4 | Novartis Finance Corp. | 2.313% | 10/14/08 | 196,000 | 195,461 |
4 | Procter & Gamble International Funding SCA | 2.310% | 9/2/08 | 211,000 | 210,987 |
4 | Procter & Gamble International Funding SCA | 2.230% | 10/1/08 | 100,450 | 100,264 |
4 | Procter & Gamble International Funding SCA | 2.212% | 10/20/08 | 137,675 | 137,263 |
4 | Procter & Gamble International Funding SCA | 2.139% | 11/5/08 | 40,000 | 39,846 |
4 | Sanofi-Aventis | 2.333% | 10/3/08 | 63,000 | 62,870 |
4 | Shell International Finance BV | 2.157% | 9/8/08 | 285,700 | 285,581 |
4 | Shell International Finance BV | 2.157% | 9/11/08 | 96,600 | 96,542 |
4 | Shell International Finance BV | 2.158% | 9/18/08 | 18,950 | 18,931 |
4 | Total Capital | 2.311%–2.313% | 9/30/08 | 430,580 | 429,782 |
| | | | | 3,788,355 |
Industrial (2.2%) | | | | |
| Chevron Funding Corp. | 2.156% | 9/12/08 | 25,000 | 24,982 |
| Chevron Funding Corp. | 2.155% | 10/1/08 | 81,000 | 80,855 |
| Chevron Funding Corp. | 2.155% | 10/2/08 | 32,500 | 32,440 |
4 | Coca-Cola Co. | 2.414% | 10/2/08 | 90,000 | 89,814 |
4 | Coca-Cola Co. | 2.363% | 10/3/08 | 24,000 | 23,950 |
4 | Coca-Cola Co. | 2.333% | 10/6/08 | 80,500 | 80,318 |
4 | Coca-Cola Co. | 2.210% | 10/7/08 | 305,000 | 304,329 |
4 | Coca-Cola Co. | 2.170% | 11/3/08 | 119,000 | 118,550 |
4 | IBM Corp. | 2.121% | 9/2/08 | 40,000 | 39,998 |
4 | IBM Corp. | 2.145% | 9/8/08 | 40,000 | 39,983 |
4 | IBM International Group Capital LLC | 2.104%–2.259% | 9/2/08 | 85,000 | 84,995 |
4 | IBM International Group Capital LLC | 2.260% | 9/3/08 | 25,000 | 24,997 |
4 | Johnson & Johnson | 2.100% | 10/14/08 | 98,000 | 97,755 |
| Merck & Co. Inc. | 2.157% | 9/8/08 | 192,800 | 192,719 |
| Merck & Co. Inc. | 2.157% | 9/10/08 | 160,000 | 159,914 |
4 | Pepsico Inc. | 2.063% | 9/25/08 | 74,500 | 74,398 |
4 | Pfizer Inc. | 2.202% | 9/2/08 | 234,000 | 233,986 |
4 | Pfizer Inc. | 2.211% | 10/17/08 | 147,000 | 146,587 |
4 | Procter & Gamble Co. | 2.122% | 9/4/08 | 143,000 | 142,975 |
4 | Procter & Gamble Co. | 2.123% | 9/8/08 | 94,500 | 94,462 |
4 | United Parcel Service, Inc. | 2.157% | 9/3/08 | 33,550 | 33,546 |
4 | Wal-Mart Stores, Inc. | 2.020% | 9/23/08 | 196,600 | 196,360 |
4 | Wal-Mart Stores, Inc. | 2.371% | 12/9/08 | 34,250 | 34,029 |
| | | | | 2,351,942 |
15
Prime Money Market Fund
| | | Face | Market |
| | Maturity | Amount | Value• |
| Yield1 | Date | ($000) | ($000) |
Insurance (0.0%) | | | | |
USAA Capital Corp | 2.212% | 11/14/08 | 47,650 | 47,435 |
Total Commercial Paper (Cost $15,248,035) | | | | 15,248,035 |
Certificates of Deposit (18.2%) | | | | |
Certificates of Deposit—U.S. Banks (1.8%) | | | | |
Branch Banking & Trust Co. | 2.720% | 12/1/08 | 243,500 | 243,500 |
Citibank, N.A. | 2.770% | 9/11/08 | 150,000 | 150,000 |
Citibank, N.A. | 2.430% | 9/29/08 | 440,000 | 439,995 |
Citibank, N.A. | 2.740% | 11/12/08 | 398,000 | 398,000 |
Citibank, N.A. | 2.750% | 11/25/08 | 257,000 | 257,000 |
Fifth Third Bank | 2.720% | 9/15/08 | 400,000 | 400,000 |
| | | | 1,888,495 |
Yankee Certificates of Deposit—U.S. Branches (16.4%) | | | |
Abbey National Treasury Services PLC | | | | |
(Stamford Branch) | 2.770% | 12/1/08 | 500,000 | 500,000 |
BNP Paribas (New York Branch) | 2.700% | 9/2/08 | 400,000 | 400,000 |
BNP Paribas (New York Branch) | 2.750% | 10/16/08 | 400,000 | 400,000 |
BNP Paribas (New York Branch) | 2.780% | 11/12/08 | 500,000 | 500,000 |
Banco Bilbao Vizcaya Argentaria, SA | | | | |
(New York Branch) | 2.700% | 9/4/08 | 200,000 | 200,000 |
Banco Bilbao Vizcaya Argentaria, SA | | | | |
(New York Branch) | 2.760% | 9/15/08 | 200,000 | 200,000 |
Banco Bilbao Vizcaya Argentaria, SA | | | | |
(New York Branch) | 2.815% | 9/22/08 | 100,000 | 100,000 |
Banco Bilbao Vizcaya Argentaria, SA | | | | |
(New York Branch) | 2.770% | 10/16/08 | 400,000 | 400,000 |
Banco Santander (New York Branch) | 2.780% | 10/9/08 | 175,000 | 175,000 |
Bank of Scotland PLC (New York Branch) | 2.700% | 9/2/08 | 400,000 | 400,000 |
Bank of Scotland PLC (New York Branch) | 2.790% | 9/11/08 | 200,000 | 200,000 |
Bank of Scotland PLC (New York Branch) | 2.850% | 12/4/08 | 500,000 | 500,000 |
Barclays Bank PLC (New York Branch) | 2.700% | 9/2/08 | 600,000 | 600,000 |
Barclays Bank PLC (New York Branch) | 2.820% | 10/7/08 | 240,500 | 240,500 |
Barclays Bank PLC (New York Branch) | 2.800% | 11/14/08 | 500,000 | 500,000 |
Deutsche Bank AG (New York Branch) | 2.700% | 11/3/08 | 200,000 | 200,000 |
Deutsche Bank AG (New York Branch) | 2.700% | 11/3/08 | 300,000 | 300,000 |
Dexia Credit Local (New York Branch) | 2.660% | 9/3/08 | 210,000 | 210,000 |
Dexia Credit Local (New York Branch) | 2.660% | 9/5/08 | 250,000 | 250,000 |
Fortis Bank SA/NV (New York Branch) | 2.700% | 9/2/08 | 300,000 | 300,000 |
Fortis Bank SA/NV (New York Branch) | 2.700% | 9/2/08 | 200,000 | 200,000 |
Fortis Bank SA/NV (New York Branch) | 2.800% | 10/14/08 | 700,000 | 700,000 |
KBC Bank N.V. (New York Branch) | 2.680% | 9/9/08 | 489,000 | 489,000 |
KBC Bank N.V. (New York Branch) | 2.650% | 10/27/08 | 500,000 | 500,000 |
Lloyds TSB Bank PLC (New York Branch) | 2.680% | 10/22/08 | 495,000 | 495,000 |
Nordea Bank Finland PLC (New York Branch) | 2.650% | 9/11/08 | 600,000 | 600,000 |
Nordea Bank Finland PLC (New York Branch) | 2.720% | 11/4/08 | 200,000 | 200,000 |
Rabobank Nederland NV (New York Branch) | 2.700% | 9/10/08 | 250,000 | 250,000 |
Rabobank Nederland NV (New York Branch) | 2.700% | 9/22/08 | 500,000 | 500,000 |
Rabobank Nederland NV (New York Branch) | 2.720% | 10/7/08 | 250,000 | 250,000 |
Rabobank Nederland NV (New York Branch) | 2.700% | 11/6/08 | 250,000 | 250,000 |
Rabobank Nederland NV (New York Branch) | 2.700% | 11/14/08 | 250,000 | 250,000 |
Royal Bank of Scotland PLC (New York Branch) | 2.790% | 9/16/08 | 500,000 | 500,000 |
Royal Bank of Scotland PLC (New York Branch) | 2.750% | 10/14/08 | 600,000 | 600,000 |
Royal Bank of Scotland PLC (New York Branch) | 2.815% | 11/24/08 | 400,000 | 400,000 |
Svenska Handelsbanken (New York Branch) | 2.700% | 9/10/08 | 500,000 | 500,000 |
Bank of Montreal (Chicago Branch) | 2.630% | 9/25/08 | 200,000 | 200,000 |
16
Prime Money Market Fund
| | | Face | Market |
| | Maturity | Amount | Value• |
| Yield1 | Date | ($000) | ($000) |
Bank of Montreal (Chicago Branch) | 2.750% | 10/22/08 | 294,750 | 294,750 |
Bank of Nova Scotia (Houston Branch) | 2.700% | 9/11/08 | 500,000 | 500,000 |
Bank of Nova Scotia (Houston Branch) | 2.580% | 10/14/08 | 250,000 | 250,000 |
Bank of Nova Scotia (Houston Branch) | 2.720% | 10/15/08 | 250,000 | 250,000 |
Bank of Nova Scotia (Houston Branch) | 2.690% | 11/12/08 | 250,000 | 250,000 |
Bank of Nova Scotia (Houston Branch) | 2.690% | 11/13/08 | 250,000 | 250,000 |
Royal Bank of Canada (New York Branch) | 2.700% | 9/10/08 | 500,000 | 500,000 |
Royal Bank of Canada (New York Branch) | 2.710% | 11/6/08 | 200,000 | 200,000 |
Royal Bank of Canada (New York Branch) | 2.710% | 11/10/08 | 300,000 | 300,000 |
Toronto Dominion Bank (New York Branch) | 2.700% | 9/11/08 | 325,000 | 325,000 |
Toronto Dominion Bank (New York Branch) | 2.720% | 9/22/08 | 300,000 | 300,000 |
Toronto Dominion Bank (New York Branch) | 2.770% | 9/29/08 | 125,000 | 125,000 |
Toronto Dominion Bank (New York Branch) | 2.700% | 11/3/08 | 318,000 | 318,000 |
Toronto Dominion Bank (New York Branch) | 2.710% | 11/6/08 | 182,000 | 182,000 |
| | | | 17,504,250 |
Total Certificates of Deposit (Cost $19,392,745) | | | | 19,392,745 |
Eurodollar Certificates of Deposit (10.1%) | | | | |
Australia & New Zealand Banking Group, Ltd. | 2.700% | 9/3/08 | 100,000 | 100,000 |
Australia & New Zealand Banking Group, Ltd. | 2.700% | 9/4/08 | 98,000 | 98,000 |
Australia & New Zealand Banking Group, Ltd. | 2.760% | 10/23/08 | 260,000 | 260,002 |
Australia & New Zealand Banking Group, Ltd. | 2.750% | 11/14/08 | 75,000 | 75,000 |
Australia & New Zealand Banking Group, Ltd. | 2.750% | 12/1/08 | 400,000 | 400,000 |
Banco Bilbao Vizcaya Argentaria, SA | 2.800% | 11/6/08 | 300,000 | 300,000 |
Bank of Scotland PLC | 2.810% | 11/24/08 | 500,000 | 500,000 |
Barclays Bank PLC | 2.955% | 12/8/08 | 80,000 | 79,997 |
BNP Paribas | 2.700% | 9/8/08 | 200,000 | 200,000 |
BNP Paribas | 2.820% | 12/1/08 | 400,000 | 400,000 |
Commonwealth Bank of Australia | 2.800% | 9/19/08 | 160,000 | 160,000 |
Commonwealth Bank of Australia | 2.800% | 9/22/08 | 197,000 | 197,000 |
Commonwealth Bank of Australia | 2.760% | 10/9/08 | 300,000 | 300,000 |
Commonwealth Bank of Australia | 2.750% | 10/22/08 | 200,000 | 200,000 |
Credit Agricole S.A. | 2.700% | 9/2/08 | 153,000 | 153,000 |
Credit Agricole S.A. | 2.700% | 9/2/08 | 132,000 | 132,000 |
Credit Agricole S.A. | 2.700% | 9/4/08 | 200,000 | 200,000 |
Credit Agricole S.A. | 2.820% | 12/1/08 | 500,000 | 500,000 |
HSBC Bank PLC | 2.670% | 9/10/08 | 200,000 | 200,000 |
HSBC Bank PLC | 2.700% | 9/15/08 | 200,000 | 200,000 |
HSBC Bank PLC | 2.770% | 10/16/08 | 444,000 | 444,000 |
HSBC Bank PLC | 2.770% | 11/14/08 | 222,000 | 222,000 |
HSBC Bank PLC | 2.790% | 11/25/08 | 246,000 | 246,000 |
ING Bank N.V. | 2.780% | 9/15/08 | 500,000 | 500,000 |
ING Bank N.V. | 2.790% | 10/9/08 | 500,000 | 500,000 |
KBC Bank N.V. | 2.750% | 10/17/08 | 500,000 | 500,003 |
Lloyds TSB Bank PLC | 2.680% | 9/15/08 | 700,000 | 700,000 |
Lloyds TSB Bank PLC | 2.720% | 11/21/08 | 305,000 | 305,000 |
National Australia Bank Ltd. | 2.700% | 9/3/08 | 300,000 | 300,000 |
National Australia Bank Ltd. | 2.700% | 9/4/08 | 400,000 | 400,000 |
National Australia Bank Ltd. | 2.760% | 10/21/08 | 300,000 | 300,000 |
National Australia Bank Ltd. | 2.790% | 11/26/08 | 500,000 | 500,000 |
Societe Generale | 2.750% | 9/23/08 | 380,000 | 380,000 |
Societe Generale | 2.900% | 10/9/08 | 700,000 | 700,000 |
Total Eurodollar Certificates of Deposit (Cost $10,652,002) | | | 10,652,002 |
17
Prime Money Market Fund
| | | Face | Market |
| | Maturity | Amount | Value• |
| Yield1 | Date | ($000) | ($000) |
Other Notes (2.8%) | | | | |
Bank of America, NA | 2.720% | 10/23/08 | 500,000 | 500,000 |
Bank of America, NA | 2.760% | 11/4/08 | 500,000 | 500,000 |
Wells Fargo Bank NA | 2.430% | 9/10/08 | 500,000 | 500,000 |
Wells Fargo Bank NA | 2.500% | 10/21/08 | 500,000 | 500,000 |
Wells Fargo Bank NA | 2.620% | 11/25/08 | 500,000 | 500,000 |
Wells Fargo Bank NA | 2.620% | 12/1/08 | 500,000 | 500,000 |
Total Other Notes (Cost $3,000,000) | | | | 3,000,000 |
Repurchase Agreements (1.2%) | | | | |
Banc of America Securities, LLC | | | | |
(Dated 8/29/08, Repurchase Value $94,022,000, | | | | |
collateralized by Federal Home Loan Bank | | | | |
Discount Note, 6/15/09, Federal Home Loan Bank | | | | |
4.000%–5.750%, 12/12/08–6/11/21, Federal Home | | | | |
Loan Mortgage Corp. 0.000%–5.000%, | | | | |
6/11/09–1/15/10, Federal National Mortgage Assn. | | | | |
3.625%–6.625%, 11/15/10–8/15/11) | 2.100% | 9/2/08 | 94,000 | 94,000 |
Barclays Capital Inc. | | | | |
(Dated 8/29/08, Repurchase Value $98,023,000, | | | | |
collateralized by Federal Home Loan | | | | |
Mortgage Corp. 2.265%, 4/14/09) | 2.110% | 9/2/08 | 98,000 | 98,000 |
BNP Paribas Securities Corp. | | | | |
(Dated 8/29/08, Repurchase Value $190,045,000, | | | | |
collateralized by Federal Home Loan Bank | | | | |
Discount Note, 10/31/08, Federal National | | | | |
Mortgage Assn. 3.375%, 12/15/08) | 2.110% | 9/2/08 | 190,000 | 190,000 |
Citigroup Global Markets, Inc. | | | | |
(Dated 8/29/08, Repurchase Value $94,022,000, | | | | |
collateralized by Federal Home Loan Bank Discount | | | | |
Note, 11/28/08, Federal Home Loan Mortgage Corp. | | | | |
5.000%, 2/16/17, Federal National Mortgage Assn. | | | | |
4.375%, 9/13/10) | 2.100% | 9/2/08 | 94,000 | 94,000 |
Credit Suisse Securities (USA), LLC | | | | |
(Dated 8/29/08, Repurchase Value $211,379,000, | | | | |
collateralized by Federal Home Loan Bank 4.875%, | | | | |
11/18/11, Federal Home Loan Mortgage Corp. | | | | |
3.500%–6.875%, 9/15/10–5/29/13, Federal National | | | | |
Mortgage Assn. 2.375%–4.750%, | | | | |
2/10/10–11/19/12) | 2.120% | 9/2/08 | 211,329 | 211,329 |
Greenwich Capital Markets, Inc. | | | | |
(Dated 8/29/08, Repurchase Value $286,067,000, | | | | |
collateralized by Federal Home Loan Mortgage Corp. | | | | |
6.625%, 9/15/09, Federal National Mortgage Assn. | | | | |
4.875%–6.625%, 4/15/09–9/15/09) | 2.120% | 9/2/08 | 286,000 | 286,000 |
J.P. Morgan Securities Inc. | | | | |
(Dated 8/29/08, Repurchase Value $108,025,000, | | | | |
collateralized by Federal National Mortgage Assn. | | | | |
7.125%, 6/15/10) | 2.110% | 9/2/08 | 108,000 | 108,000 |
UBS Securities LLC | | | | |
(Dated 8/29/08, Repurchase Value $165,039,000, | | | | |
collateralized by U.S. Treasury Note | | | | |
4.500%, 2/15/09) | 2.120% | 9/2/08 | 165,000 | 165,000 |
Total Repurchase Agreements (Cost $1,246,329) | | | | 1,246,329 |
Total Investments (99.7%) (Cost $106,020,072) | | | | 106,020,072 |
18
Prime Money Market Fund
| Market |
| Value• |
| ($000) |
Other Assets and Liabilities (0.3%) | |
Other Assets | 578,124 |
Liabilities | (271,034) |
| 307,090 |
Net Assets (100%) | 106,327,162 |
At August 31, 2008, net assets consisted of: | |
| Amount |
| ($000) |
Paid-in Capital | 106,323,856 |
Undistributed Net Investment Income | — |
Accumulated Net Realized Gains | 3,306 |
Net Assets | 106,327,162 |
| |
Investor Shares—Net Assets | |
Applicable to 92,480,636,211 outstanding $.001 par value shares of | |
beneficial interest (unlimited authorization) | 92,483,489 |
Net Asset Value Per Share—Investor Shares | $1.00 |
| |
Institutional Shares—Net Assets | |
Applicable to 13,843,226,097 outstanding $.001 par value shares of | |
beneficial interest (unlimited authorization) | 13,843,673 |
Net Asset Value Per Share—Institutional Shares | $1.00 |
• | See Note A in Notes to Financial Statements. |
1 Represents annualized yield at date of purchase for discount securities, and coupon for coupon-bearing securities.
2 The issuer operates under a congressional charter; its securities are neither issued nor guaranteed by the U.S. government.
3 Adjustable-rate note.
4 Security exempt from registration under Section 4(2) of the Securities Act of 1933. Such securities may be sold in transactions exempt from registration only to dealers in that program or other “accredited investors.” At August 31, 2008, the aggregate value of these securities was $9,255,191,000, representing 8.7% of net assets.
See accompanying Notes, which are an integral part of the Financial Statements.
19
Prime Money Market Fund
Statement of Operations
| Year Ended |
| August 31, 2008 |
| ($000) |
Investment Income | |
Income | |
Interest | 3,841,575 |
Total Income | 3,841,575 |
Expenses | |
The Vanguard Group—Note B | |
Investment Advisory Services | 9,423 |
Management and Administrative—Investor Shares | 174,303 |
Management and Administrative—Institutional Shares | 5,184 |
Marketing and Distribution—Investor Shares | 23,297 |
Marketing and Distribution—Institutional Shares | 3,133 |
Custodian Fees | 1,601 |
Auditing Fees | 27 |
Shareholders’ Reports—Investor Shares | 913 |
Shareholders’ Reports—Institutional Shares | 42 |
Trustees’ Fees and Expenses | 138 |
Total Expenses | 218,061 |
Net Investment Income | 3,623,514 |
Realized Net Gain (Loss) on Investment Securities Sold | 8,193 |
Net Increase (Decrease) in Net Assets Resulting from Operations | 3,631,707 |
20
Prime Money Market Fund
Statement of Changes in Net Assets
| Year Ended August 31, |
| 2008 | 2007 |
| ($000) | ($000) |
Increase (Decrease) in Net Assets | | |
Operations | | |
Net Investment Income | 3,623,514 | 4,219,193 |
Realized Net Gain (Loss) | 8,193 | (2,256) |
Net Increase (Decrease) in Net Assets Resulting from Operations | 3,631,707 | 4,216,937 |
Distributions | | |
Net Investment Income | | |
Investor Shares | (3,177,270) | (3,771,878) |
Institutional Shares | (446,244) | (447,315) |
Realized Capital Gain | | |
Investor Shares | — | — |
Institutional Shares | — | — |
Total Distributions | (3,623,514) | (4,219,193) |
Capital Share Transactions—Investor Shares (at $1.00) | | |
Issued | 106,732,520 | 96,242,797 |
Issued in Lieu of Cash Distributions | 3,079,532 | 3,654,662 |
Redeemed | (101,387,654) | (80,421,310) |
Net increase (Decrease)—Investor Shares | 8,424,398 | 19,476,149 |
Capital Share Transactions—Institutional Shares (at $1.00) | | |
Issued | 18,040,054 | 15,512,668 |
Issued in Lieu of Cash Distributions | 424,301 | 419,628 |
Redeemed | (14,643,359) | (12,179,315) |
Net increase (Decrease)—Institutional Shares | 3,820,996 | 3,752,981 |
Total Increase (Decrease) | 12,253,587 | 23,226,874 |
Net Assets | | |
Beginning of Period | 94,073,575 | 70,846,701 |
End of Period | 106,327,162 | 94,073,575 |
See accompanying Notes, which are an integral part of the Financial Statements.
21
Prime Money Market Fund
Financial Highlights
Investor Shares | | | | | |
| Year Ended August 31, |
For a Share Outstanding Throughout Each Period | 2008 | 2007 | 2006 | 2005 | 2004 |
Net Asset Value, Beginning of Period | $1.00 | $1.00 | $1.00 | $1.00 | $1.00 |
Investment Operations | | | | | |
Net Investment Income | .035 | .051 | .043 | .023 | .008 |
Net Realized and Unrealized Gain (Loss) | | | | | |
on Investments | — | — | — | — | — |
Total from Investment Operations | .035 | .051 | .043 | .023 | .008 |
Distributions | | | | | |
Dividends from Net Investment Income | (.035) | (.051) | (.043) | (.023) | (.008) |
Distributions from Realized Capital Gains | — | — | — | — | — |
Total Distributions | (.035) | (.051) | (.043) | (.023) | (.008) |
Net Asset Value, End of Period | $1.00 | $1.00 | $1.00 | $1.00 | $1.00 |
| | | | | |
Total Return1 | 3.60% | 5.23% | 4.38% | 2.31% | 0.83% |
| | | | | |
Ratios/Supplemental Data | | | | | |
Net Assets, End of Period (Millions) | $92,483 | $84,052 | $64,578 | $46,454 | $43,884 |
Ratio of Total Expenses to | | | | | |
Average Net Assets | 0.23% | 0.24% | 0.29% | 0.30% | 0.30% |
Ratio of Net Investment Income to | | | | | |
Average Net Assets | 3.49% | 5.10% | 4.33% | 2.29% | 0.82% |
1 Total returns do not include the account service fee that may be applicable to certain accounts with balances below $10,000.
See accompanying Notes, which are an integral part of the Financial Statements.
22
Prime Money Market Fund
Institutional Shares | | | | | |
| Year Ended August 31, |
For a Share Outstanding Throughout Each Period | 2008 | 2007 | 2006 | 2005 | 2004 |
Net Asset Value, Beginning of Period | $1.00 | $1.00 | $1.00 | $1.00 | $1.00 |
Investment Operations | | | | | |
Net Investment Income | .037 | .053 | .045 | .025 | .010 |
Net Realized and Unrealized Gain (Loss) | | | | | |
on Investments | — | — | — | — | — |
Total from Investment Operations | .037 | .053 | .045 | .025 | .010 |
Distributions | | | | | |
Dividends from Net Investment Income | (.037) | (.053) | (.045) | (.025) | (.010) |
Distributions from Realized Capital Gains | — | — | — | — | — |
Total Distributions | (.037) | (.053) | (.045) | (.025) | (.010) |
Net Asset Value, End of Period | $1.00 | $1.00 | $1.00 | $1.00 | $1.00 |
| | | | | |
Total Return | 3.75% | 5.39% | 4.58% | 2.52% | 1.05% |
| | | | | |
Ratios/Supplemental Data | | | | | |
Net Assets, End of Period (Millions) | $13,844 | $10,022 | $6,269 | $5,764 | $5,301 |
Ratio of Total Expenses to | | | | | |
Average Net Assets | 0.08% | 0.08% | 0.09% | 0.09% | 0.09% |
Ratio of Net Investment Income to | | | | | |
Average Net Assets | 3.64% | 5.26% | 4.53% | 2.51% | 1.05% |
See accompanying Notes, which are an integral part of the Financial Statements.
23
Prime Money Market Fund
Notes to Financial Statements
Vanguard Prime Money Market Fund is registered under the Investment Company Act of 1940 as an open-end investment company, or mutual fund. The fund invests in short-term debt instruments of companies primarily operating in specific industries, particularly financial services; the issuers’ abilities to meet their obligations may be affected by economic developments in such industries. The fund offers two classes of shares, Investor Shares and Institutional Shares. Investor Shares are available to any investor who meets the fund’s minimum purchase requirements. Institutional Shares are designed for investors who meet certain administrative and service criteria and invest a minimum of $5 million.
A. The following significant accounting policies conform to generally accepted accounting principles for U.S. mutual funds. The fund consistently follows such policies in preparing its financial statements.
1. Security Valuation: Securities are valued at amortized cost, which approximates market value.
2. Repurchase Agreements: The fund may invest in repurchase agreements. Securities pledged as collateral for repurchase agreements are held by a custodian bank until the agreements mature. Each agreement requires that the market value of the collateral be sufficient to cover payments of interest and principal; however, in the event of default or bankruptcy by the other party to the agreement, retention of the collateral may be subject to legal proceedings.
3. Federal Income Taxes: The fund intends to continue to qualify as a regulated investment company and distribute all of its taxable income. Management has analyzed the fund’s tax positions taken on federal income tax returns for all open tax years (tax years ended August 31, 2005–2008), and has concluded that no provision for federal income tax is required in the fund’s financial statements.
4. Distributions: Dividends from net investment income are declared daily and paid on the first business day of the following month.
5. Other: Interest income is accrued daily. Premiums and discounts on debt securities purchased are amortized and accreted, respectively, to interest income over the lives of the respective securities. Security transactions are accounted for on the date the securities are bought or sold. Costs used to determine realized gains (losses) on the sale of investment securities are those of the specific securities sold.
Each class of shares has equal rights as to assets and earnings, except that each class separately bears certain class-specific expenses related to maintenance of shareholder accounts (included in Management and Administrative expenses) and shareholder reporting. Marketing and distribution expenses are allocated to each class of shares based on a method approved by the board of trustees. Income, other non-class-specific expenses, and gains and losses on investments are allocated to each class of shares based on its relative net assets.
B. The Vanguard Group furnishes at cost investment advisory, corporate management, administrative, marketing, and distribution services. The costs of such services are allocated to the fund under methods approved by the board of trustees. The fund has committed to provide up to 0.40% of its net assets in capital contributions to Vanguard. At August 31, 2008, the fund had contributed capital of $9,199,000 to Vanguard (included in Other Assets), representing 0.01% of the fund’s net assets and 9.20% of Vanguard’s capitalization. The fund’s trustees and officers are also directors and officers of Vanguard.
C. In September 2006, the Financial Accounting Standards Board issued Statement of Financial Accounting Standards No. 157 (“FAS 157”), “Fair Value Measurements.” FAS 157 establishes a framework for measuring fair value and expands disclosures about fair value measurements in financial statements.
24
Prime Money Market Fund
The various inputs that may be used to determine the value of the fund’s investments are summarized in three broad levels. The inputs or methodologies used for valuing securities are not necessarily an indication of the risk associated with investing in those securities.
Level 1—Quoted prices in active markets for identical securities.
Level 2—Other significant observable inputs (including quoted prices for similar securities, interest rates, prepayment speeds, credit risk, etc.).
Level 3—Significant unobservable inputs (including the fund’s own assumptions used to determine the fair value of investments).
At August 31, 2008, 100% of the fund’s investments were valued using amortized cost, in accordance with rules under the Investment Company Act of 1940. Amortized cost approximates the current fair value of a security, but since the value is not obtained from a quoted price in an active market, securities valued at amortized cost are considered to be valued using Level 2 inputs.
D. On October 7, 2008, the board of trustees approved the fund’s participation in a temporary program introduced by the U.S. Treasury to guarantee the account values of shareholders in a money market fund in the event the fund’s net asset value falls below $0.995 and the fund’s trustees decide to liquidate the fund. The program covers the lesser of a shareholder's account value on September 19, 2008, or on the date of liquidation. To participate, the fund is required to pay a fee of 0.01% of its net assets as of September 19, 2008; this expense will be borne by the fund. The coverage lasts until December 18, 2008. The Treasury will decide in December whether to extend the temporary program. If the program is extended, the trustees will decide whether the fund will continue to participate.
25
Federal Money Market Fund
Fund Profile
As of August 31, 2008
Financial Attributes | |
| |
7-Day SEC Yield1 | 2.01% |
Average Weighted Maturity | 58 days |
Average Quality2 | Aaa |
Expense Ratio (8/31/2007)3 | 0.24% |
Distribution by Credit Quality2 (% of portfolio) |
| |
Aaa | 100.0% |
Sector Diversification (% of portfolio) | |
| |
U.S. Government/Agency | 84.0% |
Other | 16.0 |
1 See the Glossary for a definition.
2 Moody’s Investors Service.
3 The expense ratio shown is from the prospectus dated December 28, 2007. The expense ratio for the fiscal year ended August 31, 2008, was 0.23%.
26
Federal Money Market Fund
Performance Summary
Investment returns will fluctuate. All of the returns in this report represent past performance, which is not a guarantee of future results that may be achieved by the fund. (Current performance may be lower or higher than the performance data cited. For performance data current to the most recent month-end, visit our website at www.vanguard.com/performance.) The returns shown do not reflect taxes that a shareholder would pay on fund distributions. An investment in a money market fund is not insured or guaranteed by the Federal Deposit Insurance Corporation or any other government agency. Although the fund seeks to preserve the value of your investment at $1 per share, it is possible to lose money by investing in the fund. The fund’s 7-day SEC yield reflects its current earnings more closely than do the average annual returns.
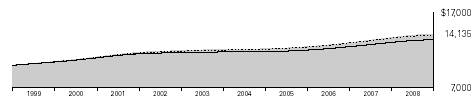
Cumulative Performance: August 31, 1998–August 31, 2008
Initial Investment of $10,000
| Average Annual Total Returns | Final Value of |
| Periods Ended August 31, 2008 | a $10,000 |
| One Year | Five Years | Ten Years | Investment |
Federal Money Market Fund1 | 3.46% | 3.19% | 3.52% | $14,135 |
Citigroup 3-Month Treasury Bill Index | 2.79 | 3.08 | 3.42 | 13,992 |
Average Government Money Market Fund2 | 2.73 | 2.63 | 2.97 | 13,403 |
1 Total returns do not include the account service fee that may be applicable to certain accounts with balances below $10,000.
2 Returns for the Average Government Money Market Fund are derived from data provided by Lipper Inc.
27
Federal Money Market Fund
Fiscal-Year Total Returns (%): August 31, 1998–August 31, 2008
| Federal Money | Average |
Fiscal Year | Market Fund1 | Fund |
1999 | 4.9% | 4.4% |
2000 | 5.8 | 5.3 |
2001 | 5.4 | 4.8 |
2002 | 2.1 | 1.5 |
2003 | 1.1 | 0.7 |
2004 | 0.8 | 0.4 |
2005 | 2.3 | 1.7 |
2006 | 4.3 | 3.8 |
2007 | 5.2 | 4.6 |
2008 | 3.5 | 2.7 |
7-day SEC yield (8/31/2008): 2.01% | | |
Average Annual Total Returns: Periods Ended June 30, 2008
This table presents average annual total returns through the latest calendar quarter—rather than through the end of the fiscal period. Securities and Exchange Commission rules require that we provide this information.
| Inception Date | One Year | Five Years | Ten Years |
Federal Money Market Fund1 | 7/13/1981 | 4.00% | 3.15% | 3.58% |
1 Total returns do not include the account service fee that may be applicable to certain accounts with balances below $10,000.
2 Returns for the Average Government Money Market Fund are derived from data provided by Lipper Inc.
Note: See Financial Highlights table for dividend information.
28
Federal Money Market Fund
Financial Statements
Statement of Net Assets
As of August 31, 2008
The fund provides a complete list of its holdings four times in each fiscal year, at the quarter-ends. For the second and fourth fiscal quarters, the lists appear in the fund’s semiannual and annual reports to shareholders. For the first and third fiscal quarters, the fund files the lists with the Securities and Exchange Commission on Form N-Q. Shareholders can look up the fund’s Forms N-Q on the SEC’s website at www.sec.gov. Forms N-Q may also be reviewed and copied at the SEC’s Public Reference Room (see the back cover of this report for further information).
| | | | Face | Market |
| | | Maturity | Amount | Value• |
| | Yield1 | Date | ($000) | ($000) |
U.S. Government and Agency Obligations (86.7%) | | | |
2,3 | Federal Farm Credit Bank | 2.651% | 10/6/08 | 75,000 | 74,999 |
2,3 | Federal Home Loan Bank | 2.548% | 9/5/08 | 70,000 | 69,998 |
2 | Federal Home Loan Bank | 2.354% | 9/12/08 | 300,000 | 299,786 |
2,3 | Federal Home Loan Bank | 2.664% | 9/17/08 | 350,000 | 349,996 |
2,3 | Federal Home Loan Bank | 2.659% | 9/19/08 | 150,000 | 149,998 |
2,3 | Federal Home Loan Bank | 2.651% | 9/22/08 | 75,000 | 74,999 |
2 | Federal Home Loan Bank | 2.374%–2.513% | 10/1/08 | 249,000 | 248,493 |
2 | Federal Home Loan Bank | 2.573% | 10/2/08 | 50,000 | 49,890 |
2 | Federal Home Loan Bank | 2.362% | 10/8/08 | 125,000 | 124,698 |
2 | Federal Home Loan Bank | 2.668% | 10/22/08 | 75,000 | 74,718 |
2,3 | Federal Home Loan Bank | 2.636% | 10/24/08 | 300,000 | 299,983 |
2 | Federal Home Loan Bank | 2.699% | 10/27/08 | 100,000 | 99,583 |
2 | Federal Home Loan Bank | 2.465% | 11/5/08 | 75,000 | 74,668 |
2 | Federal Home Loan Bank | 2.465% | 11/7/08 | 100,000 | 99,544 |
2,3 | Federal Home Loan Bank | 2.687% | 11/18/08 | 70,000 | 70,000 |
2,3 | Federal Home Loan Mortgage Corp. | 2.641% | 9/30/08 | 500,000 | 499,985 |
2 | Federal Home Loan Mortgage Corp. | 2.565% | 10/14/08 | 65,507 | 65,307 |
2 | Federal Home Loan Mortgage Corp. | 2.445% | 10/27/08 | 193,271 | 192,540 |
2 | Federal Home Loan Mortgage Corp. | 2.445% | 10/28/08 | 64,880 | 64,630 |
2 | Federal Home Loan Mortgage Corp. | 2.444% | 11/3/08 | 27,130 | 27,015 |
2 | Federal Home Loan Mortgage Corp. | 2.597% | 11/24/08 | 100,000 | 99,398 |
2 | Federal National Mortgage Assn. | 2.224% | 9/17/08 | 105,930 | 105,825 |
2 | Federal National Mortgage Assn. | 2.353%–2.354% | 10/1/08 | 281,150 | 280,602 |
2 | Federal National Mortgage Assn. | 2.584% | 10/8/08 | 371,361 | 370,380 |
2 | Federal National Mortgage Assn. | 2.425%–2.465% | 11/12/08 | 190,077 | 189,153 |
| U.S. Treasury Bill | 1.827% | 9/4/08 | 300,000 | 299,955 |
| U.S. Treasury Bill | 1.461% | 9/11/08 | 400,000 | 399,839 |
| U.S. Treasury Bill | 1.877% | 9/18/08 | 400,000 | 399,648 |
| U.S. Treasury Bill | 1.542% | 9/25/08 | 100,000 | 99,898 |
| U.S. Treasury Bill | 1.674% | 10/23/08 | 50,000 | 49,880 |
| U.S. Treasury Bill | 1.859%–1.903% | 11/20/08 | 600,000 | 597,510 |
| U.S. Treasury Bill | 1.939% | 11/28/08 | 300,000 | 298,592 |
| U.S. Treasury Bill | 2.082% | 1/8/09 | 100,000 | 99,262 |
| U.S. Treasury Bill | 1.967% | 1/15/09 | 100,000 | 99,263 |
| U.S. Treasury Bill | 1.939% | 2/5/09 | 400,000 | 396,651 |
| U.S. Treasury Bill | 2.041% | 2/12/09 | 400,000 | 396,319 |
| U.S. Treasury Bill | 2.000% | 2/19/09 | 300,000 | 297,179 |
| U.S. Treasury Bill | 1.944% | 2/26/09 | 300,000 | 297,145 |
Total U.S. Government and Agency Obligations (Cost $7,787,329) | | 7,787,329 |
29
Federal Money Market Fund
| | | Face | Market |
| | Maturity | Amount | Value• |
| Yield1 | Date | ($000) | ($000) |
Repurchase Agreements (13.1%) | | | | |
Banc of America Securities, LLC | | | | |
(Dated 8/29/08, Repurchase Value $88,021,000 | | | | |
collateralized by Federal Farm Credit Bank | | | | |
5.500%, 8/16/21, Federal Home Loan Bank | | | | |
3.050%-4.875%, 9/12/08–6/12/15, Federal | | | | |
Home Loan Mortgage Corp. 3.250%–6.250%, | | | | |
6/11/09–7/15/32, Federal National | | | | |
Mortgage Assn. 4.375%–6.375%, | | | | |
6/15/09–3/15/13) | 2.100% | 9/2/08 | 88,000 | 88,000 |
Barclays Capital Inc. | | | | |
(Dated 8/29/08, Repurchase Value $84,020,000 | | | | |
collateralized by Federal National Mortgage Assn. | | | | |
6.625%, 11/15/10) | 2.110% | 9/2/08 | 84,000 | 84,000 |
BNP Paribas Securities Corp | | | | |
(Dated 8/29/08, Repurchase Value $176,041,000 | | | | |
collateralized by Federal Home Loan Bank 2.535%, | | | | |
12/26/08, Federal National Mortgage Assn. | | | | |
3.375%, 12/15/08) | 2.110% | 9/2/08 | 176,000 | 176,000 |
Citigroup Global Markets, Inc. | | | | |
(Dated 8/29/08, Repurchase Value $88,021,000 | | | | |
collateralized by Federal National Mortgage Assn. | | | | |
3.625%–6.625%, 9/15/09–2/12/13) | 2.100% | 9/2/08 | 88,000 | 88,000 |
Credit Suisse Securities (USA), LLC | | | | |
(Dated 8/29/08, Repurchase Value $198,047,000 | | | | |
collateralized by Federal Home Loan Bank | | | | |
5.125%, 3/14/36, Federal National Mortgage Assn. | | | | |
2.875%–4.875%, 11/3/09–6/13/18) | 2.120% | 9/2/08 | 198,000 | 198,000 |
Greenwich Capital Markets, Inc. | | | | |
(Dated 8/29/08, Repurchase Value $265,062,000 | | | | |
collateralized by Federal Home Loan | | | | |
Mortgage Corp. 4.750%, 1/19/16, | | | | |
Federal National Mortgage Assn. | | | | |
4.875%–5.125%, 4/15/09–7/13/09) | 2.120% | 9/2/08 | 265,000 | 265,000 |
J.P. Morgan Securities Inc. | | | | |
(Dated 8/29/08, Repurchase Value $100,023,000 | | | | |
collateralized by Federal Home Loan Mortgage | | | | |
Corp. 4.125%, 12/21/12, Federal National | | | | |
Mortgage Assn. 7.125%, 6/15/10) | 2.110% | 9/2/08 | 100,000 | 100,000 |
UBS Securities LLC | | | | |
(Dated 8/29/08, Repurchase Value $177,246,000 | | | | |
collateralized by U.S Treasury Note | | | | |
6.500%, 2/15/10) | 2.120% | 9/2/08 | 177,204 | 177,204 |
Total Repurchase Agreements (Cost $1,176,204) | | | | 1,176,204 |
Total Investments (99.8%) (Cost $8,963,533) | | | | 8,963,533 |
Other Assets and Liabilities (0.2%) | | | | |
Other Assets | | | | 37,234 |
Liabilities | | | | (18,588) |
| | | | 18,646 |
Net Assets (100%) | | | | |
Applicable to 8,982,151,114 outstanding $.001 par value shares of | | |
beneficial interest (unlimited authorization) | | | | 8,982,179 |
Net Asset Value Per Share | | | | $1.00 |
30
Federal Money Market Fund
At August 31, 2008, net assets consisted of: | |
| Amount |
| ($000) |
Paid-in Capital | 8,982,163 |
Undistributed Net Investment Income | — |
Accumulated Net Realized Gains | 16 |
Net Assets | 8,982,179 |
• | See Note A in Notes to Financial Statements. |
1 Represents annualized yield at date of purchase for discount securities, and coupon for coupon-bearing securities.
2 The issuer operates under a congressional charter; its securities are neither issued nor guaranteed by the U.S. government.
3 Adjustable-rate note.
See accompanying Notes, which are an integral part of the Financial Statements.
31
Federal Money Market Fund
Statement of Operations
| Year Ended |
| August 31, 2008 |
| ($000) |
Investment Income | |
Income | |
Interest | 312,195 |
Total Income | 312,195 |
Expenses | |
The Vanguard Group—Note B | |
Investment Advisory Services | 794 |
Management and Administrative | 16,828 |
Marketing and Distribution | 2,217 |
Custodian Fees | 153 |
Auditing Fees | 23 |
Shareholders’ Reports | 90 |
Trustees’ Fees and Expenses | 12 |
Total Expenses | 20,117 |
Net Investment Income | 292,078 |
Realized Net Gain (Loss) on Investment Securities Sold | 54 |
Net Increase (Decrease) in Net Assets Resulting from Operations | 292,132 |
See accompanying Notes, which are an integral part of the Financial Statements.
32
Federal Money Market Fund
Statement of Changes in Net Assets
| Year Ended August 31, |
| 2008 | 2007 |
| ($000) | ($000) |
Increase (Decrease) in Net Assets | | |
Operations | | |
Net Investment Income | 292,078 | 345,057 |
Realized Net Gain (Loss) | 54 | (21) |
Net Increase (Decrease) in Net Assets Resulting from Operations | 292,132 | 345,036 |
Distributions | | |
Net Investment Income | (292,078) | (345,057) |
Realized Capital Gain | — | — |
Total Distributions | (292,078) | (345,057) |
Capital Share Transactions (at $1.00) | | |
Issued | 10,018,883 | 6,184,183 |
Issued in Lieu of Cash Distributions | 282,195 | 335,363 |
Redeemed | (8,991,301) | (5,206,858) |
Net Increase (Decrease) from Capital Share Transactions | 1,309,777 | 1,312,688 |
Total Increase (Decrease) | 1,309,831 | 1,312,667 |
Net Assets | | |
Beginning of Period | 7,672,348 | 6,359,681 |
End of Period | 8,982,179 | 7,672,348 |
See accompanying Notes, which are an integral part of the Financial Statements.
33
Federal Money Market Fund
Financial Highlights
| Year Ended August 31, |
For a Share Outstanding Throughout Each Period | 2008 | 2007 | 2006 | 2005 | 2004 |
Net Asset Value, Beginning of Period | $1.00 | $1.00 | $1.00 | $1.00 | $1.00 |
Investment Operations | | | | | |
Net Investment Income | .034 | .051 | .042 | .022 | .008 |
Net Realized and Unrealized Gain (Loss) | | | | | |
on Investments | — | — | — | — | — |
Total from Investment Operations | .034 | .051 | .042 | .022 | .008 |
Distributions | | | | | |
Dividends from Net Investment Income | (.034) | (.051) | (.042) | (.022) | (.008) |
Distributions from Realized Capital Gains | — | — | — | — | — |
Total Distributions | (.034) | (.051) | (.042) | (.022) | (.008) |
Net Asset Value, End of Period | $1.00 | $1.00 | $1.00 | $1.00 | $1.00 |
| | | | | |
Total Return1 | 3.46% | 5.17% | 4.31% | 2.26% | 0.82% |
| | | | | |
Ratios/Supplemental Data | | | | | |
Net Assets, End of Period (Millions) | $8,982 | $7,672 | $6,360 | $5,507 | $5,575 |
Ratio of Total Expenses to | | | | | |
Average Net Assets | 0.23% | 0.24% | 0.29% | 0.30% | 0.30% |
Ratio of Net Investment Income to | | | | | |
Average Net Assets | 3.33% | 5.05% | 4.25% | 2.23% | 0.81% |
1 Total returns do not include the account service fee that may be applicable to certain accounts with balances below $10,000.
See accompanying Notes, which are an integral part of the Financial Statements.
34
Federal Money Market Fund
Notes to Financial Statements
Vanguard Federal Money Market Fund is registered under the Investment Company Act of 1940 as an open-end investment company, or mutual fund. The fund invests in short-term debt instruments issued by the U.S. government or its agencies and instrumentalities, and repurchase agreements collateralized by such instruments.
A. The following significant accounting policies conform to generally accepted accounting principles for U.S. mutual funds. The fund consistently follows such policies in preparing its financial statements.
1. Security Valuation: Securities are valued at amortized cost, which approximates market value.
2. Repurchase Agreements: The fund may invest in repurchase agreements. Securities pledged as collateral for repurchase agreements are held by a custodian bank until the agreements mature. Each agreement requires that the market value of the collateral be sufficient to cover payments of interest and principal; however, in the event of default or bankruptcy by the other party to the agreement, retention of the collateral may be subject to legal proceedings.
3. Federal Income Taxes: The fund intends to continue to qualify as a regulated investment company and distribute all of its taxable income. Management has analyzed the fund’s tax positions taken on federal income tax returns for all open tax years (tax years ended August 31, 2005–2008), and has concluded that no provision for federal income tax is required in the fund’s financial statements.
4. Distributions: Dividends from net investment income are declared daily and paid on the first business day of the following month.
5. Other: Interest income is accrued daily. Premiums and discounts on debt securities purchased are amortized and accreted, respectively, to interest income over the lives of the respective securities. Security transactions are accounted for on the date the securities are bought or sold. Costs used to determine realized gains (losses) on the sale of investment securities are those of the specific securities sold.
B. The Vanguard Group furnishes at cost investment advisory, corporate management, administrative, marketing, and distribution services. The costs of such services are allocated to the fund under methods approved by the board of trustees. The fund has committed to provide up to 0.40% of its net assets in capital contributions to Vanguard. At August 31, 2008, the fund had contributed capital of $777,000 to Vanguard (included in Other Assets), representing 0.01% of the fund’s net assets and 0.78% of Vanguard’s capitalization. The fund’s trustees and officers are also directors and officers of Vanguard.
C. In September 2006, the Financial Accounting Standards Board issued Statement of Financial Accounting Standards No. 157 (“FAS 157”), “Fair Value Measurements.” FAS 157 establishes a framework for measuring fair value and expands disclosures about fair value measurements in financial statements.
35
Federal Money Market Fund
The various inputs that may be used to determine the value of the fund’s investments are summarized in three broad levels. The inputs or methodologies used for valuing securities are not necessarily an indication of the risk associated with investing in those securities.
Level 1—Quoted prices in active markets for identical securities.
Level 2—Other significant observable inputs (including quoted prices for similar securities, interest rates, prepayment speeds, credit risk, etc.).
Level 3—Significant unobservable inputs (including the fund’s own assumptions used to determine the fair value of investments).
At August 31, 2008, 100% of the fund’s investments were valued using amortized cost, in accordance with rules under the Investment Company Act of 1940. Amortized cost approximates the current fair value of a security, but since the value is not obtained from a quoted price in an active market, securities valued at amortized cost are considered to be valued using Level 2 inputs.
D. On October 7, 2008, the board of trustees approved the fund’s participation in a temporary program introduced by the U.S. Treasury to guarantee the account values of shareholders in a money market fund in the event the fund’s net asset value falls below $0.995 and the fund’s trustees decide to liquidate the fund. The program covers the lesser of a shareholder's account value on September 19, 2008, or on the date of liquidation. To participate, the fund is required to pay a fee of 0.01% of its net assets as of September 19, 2008; this expense will be borne by the fund. The coverage lasts until December 18, 2008. The Treasury will decide in December whether to extend the temporary program. If the program is extended, the trustees will decide whether the fund will continue to participate.
36
Treasury Money Market Fund
Fund Profile
As of August 31, 2008
Financial Attributes | |
| |
7-Day SEC Yield1 | 1.67% |
Average Weighted Maturity | 77 days |
Average Quality2 | Aaa |
Expense Ratio (8/31/2007)3 | 0.24% |
Distribution by Credit Quality2 (% of portfolio) | |
| |
Aaa | 100.0% |
Sector Diversification (% of portfolio) | |
| |
Treasury | 100.0% |
1 See the Glossary for a definition.
2 Moody’s Investors Service.
3 The expense ratio shown is from the prospectus dated December 28, 2007. The expense ratio for the fiscal year ended August 31, 2008, was 0.23%.
37
Treasury Money Market Fund
Performance Summary
Investment returns will fluctuate. All of the returns in this report represent past performance, which is not a guarantee of future results that may be achieved by the fund. (Current performance may be lower or higher than the performance data cited. For performance data current to the most recent month-end, visit our website at www.vanguard.com/performance.) The returns shown do not reflect taxes that a shareholder would pay on fund distributions. An investment in a money market fund is not insured or guaranteed by the Federal Deposit Insurance Corporation or any other government agency. Although the fund seeks to preserve the value of your investment at $1 per share, it is possible to lose money by investing in the fund. The fund’s 7-day SEC yield reflects its current earnings more closely than do the average annual returns.
Cumulative Performance: August 31, 1998–August 31, 2008
Initial Investment of $10,000
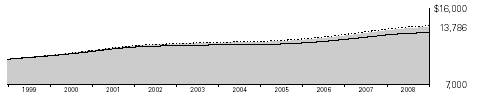
| Average Annual Total Returns | Final Value of |
| Periods Ended August 31, 2008 | a $10,000 |
| One Year | Five Years | Ten Years | Investment |
Treasury Money Market Fund1 | 2.94% | 2.94% | 3.26% | $13,786 |
Citigroup 3-Month Treasury Bill Index | 2.79 | 3.08 | 3.42 | 13,992 |
iMoneyNet Money Fund Report’s | | | | |
Average 100% Treasury Fund | 2.08 | 2.38 | 2.80 | 13,175 |
1 Total returns do not include the account service fee that may be applicable to certain accounts with balances below $10,000.
38
Treasury Money Market Fund
Fiscal-Year Total Returns (%): August 31, 1998–August 31, 2008 | | |
| | |
| Treasury Money | Average |
Fiscal Year | Market Fund1 | Fund2 |
1999 | 4.5% | 4.2% |
2000 | 5.4 | 5.0 |
2001 | 5.1 | 4.7 |
2002 | 2.0 | 1.6 |
2003 | 1.0 | 0.7 |
2004 | 0.7 | 0.4 |
2005 | 2.1 | 1.6 |
2006 | 4.1 | 3.5 |
2007 | 4.9 | 4.3 |
2008 | 2.9 | 2.1 |
7-day SEC yield (8/31/2008): 1.67% | | |
Average Annual Total Returns: Periods Ended June 30, 2008
This table presents average annual total returns through the latest calendar quarter—rather than through the end of the fiscal period. Securities and Exchange Commission rules require that we provide this information.
| Inception Date | One Year | Five Years | Ten Years |
Treasury Money Market Fund1 | 3/9/1983 | 3.46% | 2.90% | 3.32% |
1 Total returns do not include the account service fee that may be applicable to certain accounts with balances below $10,000.
2 Derived from iMoneyNet Money Fund Report’s Average 100% Treasury Fund.
Note: See Financial Highlights table for dividend information.
39
Treasury Money Market Fund
Financial Statements
Statement of Net Assets
As of August 31, 2008
The fund provides a complete list of its holdings four times in each fiscal year, at the quarter-ends. For the second and fourth fiscal quarters, the lists appear in the fund’s semiannual and annual reports to shareholders. For the first and third fiscal quarters, the fund files the lists with the Securities and Exchange Commission on Form N-Q. Shareholders can look up the fund’s Forms N-Q on the SEC’s website at www.sec.gov. Forms N-Q may also be reviewed and copied at the SEC’s Public Reference Room (see the back cover of this report for further information).
| | | Face | Market |
| | Maturity | Amount | Value• |
| Yield1 | Date | ($000) | ($000) |
U.S. Government Securities (99.8%) | | | | |
U.S. Treasury Bill | 1.304%–1.828% | 9/4/08 | 545,533 | 545,452 |
U.S. Treasury Bill | 1.461%–1.873% | 9/11/08 | 661,000 | 660,671 |
U.S. Treasury Bill | 1.707%–2.061% | 9/18/08 | 565,368 | 564,853 |
U.S. Treasury Bill | 1.727%–1.864% | 9/25/08 | 364,232 | 363,793 |
U.S. Treasury Bill | 1.909% | 10/2/08 | 475,000 | 474,223 |
U.S. Treasury Bill | 1.613% | 10/9/08 | 338,000 | 337,429 |
U.S. Treasury Bill | 1.694% | 10/23/08 | 528,000 | 526,719 |
U.S. Treasury Bill | 1.715% | 10/30/08 | 170,000 | 169,526 |
U.S. Treasury Bill | 1.755% | 11/6/08 | 232,000 | 231,260 |
U.S. Treasury Bill | 1.879% | 11/13/08 | 345,000 | 343,692 |
U.S. Treasury Bill | 1.859% | 11/20/08 | 200,000 | 199,178 |
U.S. Treasury Bill | 1.939% | 11/28/08 | 300,000 | 298,592 |
U.S. Treasury Bill | 2.082% | 1/8/09 | 265,000 | 263,044 |
U.S. Treasury Bill | 1.939% | 1/22/09 | 800,000 | 793,899 |
U.S. Treasury Bill | 1.898% | 1/29/09 | 275,000 | 272,846 |
U.S. Treasury Bill | 1.939% | 2/5/09 | 262,000 | 259,806 |
U.S. Treasury Bill | 1.877% | 2/12/09 | 8,703 | 8,629 |
U.S. Treasury Bill | 2.000% | 2/19/09 | 465,000 | 460,627 |
U.S. Treasury Bill | 1.944% | 2/26/09 | 102,000 | 101,029 |
Total U.S. Government Securities (Cost $6,875,268) | | | 6,875,268 |
Other Assets and Liabilities (0.2%) | | | | |
Other Assets | | | | 26,323 |
Liabilities | | | | (13,272) |
| | | | 13,051 |
Net Assets (100%) | | | | |
Applicable to 6,888,084,999 outstanding $.001 par value shares of | | |
beneficial interest (unlimited authorization) | | | 6,888,319 |
Net Asset Value Per Share | | | | $1.00 |
40
Treasury Money Market Fund
At August 31, 2008, net assets consisted of: | |
| Amount |
| ($000) |
Paid-in Capital | 6,888,113 |
Undistributed Net Investment Income | — |
Accumulated Net Realized Gains | 206 |
Net Assets | 6,888,319 |
• | See Note A in Notes to Financial Statements. |
1 Represents annualized yield at date of purchase for discount securities, and coupon for coupon-bearing securities.
See accompanying Notes, which are an integral part of the Financial Statements.
41
Treasury Money Market Fund
Statement of Operations
| Year Ended |
| August 31, 2008 |
| ($000) |
Investment Income | |
Income | |
Interest | 195,271 |
Total Income | 195,271 |
Expenses | |
The Vanguard Group—Note B | |
Investment Advisory Services | 575 |
Management and Administrative | 12,207 |
Marketing and Distribution | 1,603 |
Custodian Fees | 100 |
Auditing Fees | 18 |
Shareholders’ Reports | 84 |
Trustees’ Fees and Expenses | 9 |
Total Expenses | 14,596 |
Net Investment Income | 180,675 |
Realized Net Gain (Loss) on Investment Securities Sold | (283) |
Net Increase (Decrease) in Net Assets Resulting from Operations | 180,392 |
See accompanying Notes, which are an integral part of the Financial Statements.
42
Treasury Money Market Fund
Statement of Changes in Net Assets
| Year Ended August 31, |
| 2008 | 2007 |
| ($000) | ($000) |
Increase (Decrease) in Net Assets | | |
Operations | | |
Net Investment Income | 180,675 | 254,497 |
Realized Net Gain (Loss) | (283) | 732 |
Net Increase (Decrease) in Net Assets Resulting from Operations | 180,392 | 255,229 |
Distributions | | |
Net Investment Income | (180,675) | (254,497) |
Realized Capital Gain | — | — |
Total Distributions | (180,675) | (254,497) |
Capital Share Transactions (at $1.00) | | |
Issued | 6,279,590 | 4,658,601 |
Issued in Lieu of Cash Distributions | 175,540 | 248,231 |
Redeemed | (5,457,898) | (4,239,110) |
Net Increase (Decrease) from Capital Share Transactions | 997,232 | 667,722 |
Total Increase (Decrease) | 996,949 | 668,454 |
Net Assets | | |
Beginning of Period | 5,891,370 | 5,222,916 |
End of Period | 6,888,319 | 5,891,370 |
See accompanying Notes, which are an integral part of the Financial Statements.
43
Treasury Money Market Fund
Financial Highlights
| Year Ended August 31, |
For a Share Outstanding Throughout Each Period | 2008 | 2007 | 2006 | 2005 | 2004 |
Net Asset Value, Beginning of Period | $1.00 | $1.00 | $1.00 | $1.00 | $1.00 |
Investment Operations | | | | | |
Net Investment Income | .029 | .048 | .040 | .021 | .007 |
Net Realized and Unrealized Gain (Loss) | | | | | |
on Investments | — | — | — | — | — |
Total from Investment Operations | .029 | .048 | .040 | .021 | .007 |
Distributions | | | | | |
Dividends from Net Investment Income | (.029) | (.048) | (.040) | (.021) | (.007) |
Distributions from Realized Capital Gains | — | — | — | — | — |
Total Distributions | (.029) | (.048) | (.040) | (.021) | (.007) |
Net Asset Value, End of Period | $1.00 | $1.00 | $1.00 | $1.00 | $1.00 |
| | | | | |
Total Return1 | 2.94% | 4.88% | 4.06% | 2.12% | 0.74% |
| | | | | |
Ratios/Supplemental Data | | | | | |
Net Assets, End of Period (Millions) | $6,888 | $5,891 | $5,223 | $4,558 | $4,628 |
Ratio of Total Expenses to | | | | | |
Average Net Assets | 0.23% | 0.24% | 0.29% | 0.30% | 0.30% |
Ratio of Net Investment Income to | | | | | |
Average Net Assets | 2.84% | 4.76% | 4.01% | 2.10% | 0.73% |
1 Total returns do not include the account service fee that may be applicable to certain accounts with balances below $10,000.
See accompanying Notes, which are an integral part of the Financial Statements.
44
Treasury Money Market Fund
Notes to Financial Statements
Vanguard Treasury Money Market Fund is registered under the Investment Company Act of 1940 as an open-end investment company, or mutual fund. The fund invests in short-term debt instruments backed by the full faith and credit of the U.S. government.
A. The following significant accounting policies conform to generally accepted accounting principles for U.S. mutual funds. The fund consistently follows such policies in preparing its financial statements.
1. Security Valuation: Securities are valued at amortized cost, which approximates market value.
2. Federal Income Taxes: The fund intends to continue to qualify as a regulated investment company and distribute all of its taxable income. Management has analyzed the fund’s tax positions taken on federal income tax returns for all open tax years (tax years ended August 31, 2005–2008), and has concluded that no provision for federal income tax is required in the fund’s financial statements.
3. Distributions: Dividends from net investment income are declared daily and paid on the first business day of the following month.
4. Other: Interest income is accrued daily. Premiums and discounts on debt securities purchased are amortized and accreted, respectively, to interest income over the lives of the respective securities. Security transactions are accounted for on the date securities are bought or sold. Costs used to determine realized gains (losses) on the sale of investment securities are those of the specific securities sold.
B. The Vanguard Group furnishes at cost investment advisory, corporate management, administrative, marketing, and distribution services. The costs of such services are allocated to the fund under methods approved by the board of trustees. The fund has committed to provide up to 0.40% of its net assets in capital contributions to Vanguard. At August 31, 2008, the fund had contributed capital of $592,000 to Vanguard (included in Other Assets), representing 0.01% of the fund’s net assets and 0.59% of Vanguard’s capitalization. The fund’s trustees and officers are also directors and officers of Vanguard.
C. In September 2006, the Financial Accounting Standards Board issued Statement of Financial Accounting Standards No. 157 (“FAS 157”), “Fair Value Measurements.” FAS 157 establishes a framework for measuring fair value and expands disclosures about fair value measurements in financial statements.
The various inputs that may be used to determine the value of the fund’s investments are summarized in three broad levels. The inputs or methodologies used for valuing securities are not necessarily an indication of the risk associated with investing in those securities.
Level 1—Quoted prices in active markets for identical securities.
Level 2—Other significant observable inputs (including quoted prices for similar securities, interest rates, prepayment speeds, credit risk, etc.).
Level 3—Significant unobservable inputs (including the fund’s own assumptions used to determine the fair value of investments).
At August 31, 2008, 100% of the fund’s investments were valued using amortized cost, in accordance with rules under the Investment Company Act of 1940. Amortized cost approximates the current fair value of a security, but since the value is not obtained from a quoted price in an active market, securities valued at amortized cost are considered to be valued using Level 2 inputs.
Treasury Money Market Fund
D. On October 7, 2008, the board of trustees approved the fund’s participation in a temporary program introduced by the U.S. Treasury to guarantee the account values of shareholders in a money market fund in the event the fund’s net asset value falls below $0.995 and the fund’s trustees decide to liquidate the fund. The program covers the lesser of a shareholder's account value on September 19, 2008, or on the date of liquidation. To participate, the fund is required to pay a fee of 0.01% of its net assets as of September 19, 2008; this expense will be borne by the fund. The coverage lasts until December 18, 2008. The Treasury will decide in December whether to extend the temporary program. If the program is extended, the trustees will decide whether the fund will continue to participate.
46
Admiral Treasury Money Market Fund
Fund Profile
As of August 31, 2008
Financial Attributes | |
| |
7-Day SEC Yield1 | 1.80% |
Average Weighted Maturity | 78 days |
Average Quality2 | Aaa |
Expense Ratio (8/31/2007)3 | 0.10% |
Distribution by Credit Quality2 (% of portfolio) | |
| |
Aaa | 100.0% |
Sector Diversification (% of portfolio) | |
| |
Treasury | 100.0% |
1 See the Glossary for a definition.
2 Moody’s Investors Service.
3 The expense ratio shown is from the prospectus dated December 28, 2007. The expense ratio for the fiscal year ended August 31, 2008, was 0.10%.
47
Admiral Treasury Money Market Fund
Performance Summary
Investment returns will fluctuate. All of the returns in this report represent past performance, which is not a guarantee of future results that may be achieved by the fund. (Current performance may be lower or higher than the performance data cited. For performance data current to the most recent month-end, visit our website at www.vanguard.com/performance.) The returns shown do not reflect taxes that a shareholder would pay on fund distributions. An investment in a money market fund is not insured or guaranteed by the Federal Deposit Insurance Corporation or any other government agency. Although the fund seeks to preserve the value of your investment at $1 per share, it is possible to lose money by investing in the fund. The fund’s 7-day SEC yield reflects its current earnings more closely than do the average annual returns.
Cumulative Performance: August 31, 1998–August 31, 2008
Initial Investment of $50,000
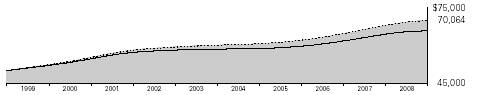
| | Average Annual Total Returns | Final Value of |
| Periods Ended August 31, 2008 | a $50,000 |
| One Year | Five Years | Ten Years | Investment |
Admiral Treasury Money Market Fund | 3.08% | 3.09% | 3.43% | $70,064 |
Citigroup 3-Month Treasury Bill Index | 2.79 | 3.08 | 3.42 | 69,961 |
iMoneyNet Money Fund Report’s | | | | |
Average 100% Treasury Fund | 2.08 | 2.38 | 2.80 | 65,877 |
48
Admiral Treasury Money Market Fund
Fiscal-Year Total Returns (%): August 31, 1998–August 31, 2008 | | |
| | |
| Admiral Treasury | Average |
Fiscal Year | Money Market Fund | Fund1 |
1999 | 4.7% | 4.2% |
2000 | 5.5 | 5.0 |
2001 | 5.3 | 4.7 |
2002 | 2.1 | 1.6 |
2003 | 1.2 | 0.7 |
2004 | 0.9 | 0.4 |
2005 | 2.3 | 1.6 |
2006 | 4.2 | 3.5 |
2007 | 5.0 | 4.3 |
2008 | 3.1 | 2.1 |
7-day SEC yield (8/31/2008): 1.80% | | |
Average Annual Total Returns: Periods Ended June 30, 2008
This table presents average annual total returns through the latest calendar quarter—rather than through the end of the fiscal period. Securities and Exchange Commission rules require that we provide this information.
| Inception Date | One Year | Five Years | Ten Years |
Admiral Treasury Money Market Fund | 12/14/1992 | 3.60% | 3.06% | 3.49% |
1 Derived from iMoneyNet Money Fund Report’s Average 100% Treasury Fund.
Note: See Financial Highlights table for dividend information.
49
Admiral Treasury Money Market Fund
Financial Statements
Statement of Net Assets
As of August 31, 2008
The fund provides a complete list of its holdings four times in each fiscal year, at the quarter-ends. For the second and fourth fiscal quarters, the lists appear in the fund’s semiannual and annual reports to shareholders. For the first and third fiscal quarters, the fund files the lists with the Securities and Exchange Commission on Form N-Q. Shareholders can look up the fund’s Forms N-Q on the SEC’s website at www.sec.gov. Forms N-Q may also be reviewed and copied at the SEC’s Public Reference Room (see the back cover of this report for further information).
| | | Face | Market |
| | Maturity | Amount | Value• |
| Yield1 | Date | ($000) | ($000) |
U.S. Government Securities (99.9%) | | | | |
U.S. Treasury Bill | 1.791%–1.828% | 9/4/08 | 1,643,800 | 1,643,551 |
U.S. Treasury Bill | 1.461%–1.873% | 9/11/08 | 668,708 | 668,411 |
U.S. Treasury Bill | 1.710%–2.061% | 9/18/08 | 1,913,613 | 1,911,862 |
U.S. Treasury Bill | 1.864% | 9/25/08 | 695,000 | 694,141 |
U.S. Treasury Bill | 1.909% | 10/2/08 | 1,439,000 | 1,436,646 |
U.S. Treasury Bill | 1.613% | 10/9/08 | 1,060,000 | 1,058,210 |
U.S. Treasury Bill | 1.613%–1.628% | 10/16/08 | 900,000 | 898,190 |
U.S. Treasury Bill | 1.694% | 10/23/08 | 56,000 | 55,864 |
U.S. Treasury Bill | 1.715% | 10/30/08 | 1,520,000 | 1,515,765 |
U.S. Treasury Bill | 1.717%–1.755% | 11/6/08 | 1,198,000 | 1,194,210 |
U.S. Treasury Bill | 1.879% | 11/13/08 | 1,460,000 | 1,454,464 |
U.S. Treasury Bill | 1.859% | 11/20/08 | 2,895,000 | 2,883,098 |
U.S. Treasury Bill | 1.939% | 11/28/08 | 1,422,000 | 1,415,326 |
U.S. Treasury Bill | 2.071% | 12/11/08 | 636,000 | 632,342 |
U.S. Treasury Bill | 2.082% | 1/8/09 | 675,000 | 670,017 |
U.S. Treasury Bill | 1.939% | 1/22/09 | 2,550,000 | 2,530,552 |
U.S. Treasury Bill | 1.898% | 1/29/09 | 1,120,000 | 1,111,227 |
U.S. Treasury Bill | 1.939% | 2/5/09 | 800,000 | 793,301 |
U.S. Treasury Bill | 1.877% | 2/12/09 | 13,273 | 13,161 |
U.S. Treasury Bill | 1.944% | 2/26/09 | 700,000 | 693,337 |
Total U.S. Government Securities (Cost $23,273,675) | | | 23,273,675 |
Other Assets and Liabilities (0.1%) | | | | |
Other Assets | | | | 58,753 |
Liabilities | | | | (43,448) |
| | | | 15,305 |
Net Assets (100%) | | | | |
Applicable to 23,288,231,147 outstanding $.001 par value shares of | | |
beneficial interest (unlimited authorization) | | | 23,288,980 |
Net Asset Value Per Share | | | | $1.00 |
50
Admiral Treasury Money Market Fund
At August 31, 2008, net assets consisted of: | |
| Amount |
| ($000) |
Paid-in Capital | 23,288,233 |
Undistributed Net Investment Income | — |
Accumulated Net Realized Gains | 747 |
Net Assets | 23,288,980 |
• | See Note A in Notes to Financial Statements. |
1 Represents annualized yield at date of purchase for discount securities, and coupon for coupon-bearing securities.
See accompanying Notes, which are an integral part of the Financial Statements.
51
Admiral Treasury Money Market Fund
Statement of Operations
| Year Ended |
| August 31, 2008 |
| ($000) |
Investment Income | |
Income | |
Interest | 655,152 |
Total Income | 655,152 |
Expenses | |
The Vanguard Group—Note B | |
Investment Advisory Services | 1,924 |
Management and Administrative | 13,099 |
Marketing and Distribution | 5,381 |
Custodian Fees | 249 |
Auditing Fees | 19 |
Shareholders’ Reports | 67 |
Trustees’ Fees and Expenses | 24 |
Total Expenses | 20,763 |
Net Investment Income | 634,389 |
Realized Net Gain (Loss) on Investment Securities Sold | (142) |
Net Increase (Decrease) in Net Assets Resulting from Operations | 634,247 |
See accompanying Notes, which are an integral part of the Financial Statements.
52
Admiral Treasury Money Market Fund
Statement of Changes in Net Assets
| Year Ended August 31, |
| 2008 | 2007 |
| ($000) | ($000) |
Increase (Decrease) in Net Assets | | |
Operations | | |
Net Investment Income | 634,389 | 847,691 |
Realized Net Gain (Loss) | (142) | 2,478 |
Net Increase (Decrease) in Net Assets Resulting from Operations | 634,247 | 850,169 |
Distributions | | |
Net Investment Income | (634,389) | (847,691) |
Realized Capital Gain | — | — |
Total Distributions | (634,389) | (847,691) |
Capital Share Transactions (at $1.00) | | |
Issued | 19,825,341 | 17,590,283 |
Issued in Lieu of Cash Distributions | 601,195 | 808,325 |
Redeemed | (17,201,363) | (14,319,509) |
Net Increase (Decrease) from Capital Share Transactions | 3,225,173 | 4,079,099 |
Total Increase (Decrease) | 3,225,031 | 4,081,577 |
Net Assets | | |
Beginning of Period | 20,063,949 | 15,982,372 |
End of Period | 23,288,980 | 20,063,949 |
See accompanying Notes, which are an integral part of the Financial Statements.
53
Admiral Treasury Money Market Fund
Financial Highlights
| Year Ended August 31, |
For a Share Outstanding Throughout Each Period | 2008 | 2007 | 2006 | 2005 | 2004 |
Net Asset Value, Beginning of Period | $1.00 | $1.00 | $1.00 | $1.00 | $1.00 |
Investment Operations | | | | | |
Net Investment Income | .030 | .049 | .041 | .023 | .009 |
Net Realized and Unrealized Gain (Loss) | | | | | |
on Investments | — | — | — | — | — |
Total from Investment Operations | .030 | .049 | .041 | .023 | .009 |
Distributions | | | | | |
Dividends from Net Investment Income | (.030) | (.049) | (.041) | (.023) | (.009) |
Distributions from Realized Capital Gains | — | — | — | — | — |
Total Distributions | (.030) | (.049) | (.041) | (.023) | (.009) |
Net Asset Value, End of Period | $1.00 | $1.00 | $1.00 | $1.00 | $1.00 |
| | | | | |
Total Return | 3.08% | 5.02% | 4.22% | 2.29% | 0.91% |
| | | | | |
Ratios/Supplemental Data | | | | | |
Net Assets, End of Period (Millions) | $23,289 | $20,064 | $15,982 | $13,838 | $13,270 |
Ratio of Total Expenses to | | | | | |
Average Net Assets | 0.10% | 0.10% | 0.13% | 0.13% | 0.13% |
Ratio of Net Investment Income to | | | | | |
Average Net Assets | 2.98% | 4.90% | 4.15% | 2.27% | 0.91% |
See accompanying Notes, which are an integral part of the Financial Statements.
54
Admiral Treasury Money Market Fund
Notes to Financial Statements
Vanguard Admiral Treasury Money Market Fund is registered under the Investment Company Act
of 1940 as an open-end investment company, or mutual fund. The fund invests in short-term debt
instruments backed by the full faith and credit of the U.S. government.
A. The following significant accounting policies conform to generally accepted accounting principles
for U.S. mutual funds. The fund consistently follows such policies in preparing its financial statements.
1. Security Valuation: Securities are valued at amortized cost, which approximates market value.
2. Federal Income Taxes: The fund intends to continue to qualify as a regulated investment company
and distribute all of its taxable income. Management has analyzed the fund’s tax positions taken on
federal income tax returns for all open tax years (tax years ended August 31, 2005–2008), and has
concluded that no provision for federal income tax is required in the fund’s financial statements.
3. Distributions: Dividends from net investment income are declared daily and paid on the first
business day of the following month.
4. Other: Interest income is accrued daily. Premiums and discounts on debt securities purchased are
amortized and accreted, respectively, to interest income over the lives of the respective securities.
Security transactions are accounted for on the date securities are bought or sold. Costs used to
determine realized gains (losses) on the sale of investment securities are those of the specific
securities sold.
B. The Vanguard Group furnishes at cost investment advisory, corporate management, administrative,
marketing, and distribution services. The costs of such services are allocated to the fund under methods
approved by the board of trustees. The fund has committed to provide up to 0.40% of its net assets in
capital contributions to Vanguard. At August 31, 2008, the fund had contributed capital of $1,985,000
to Vanguard (included in Other Assets), representing 0.01% of the fund’s net assets and 1.98% of
Vanguard’s capitalization. The fund’s trustees and officers are also directors and officers of Vanguard.
C. In September 2006, the Financial Accounting Standards Board issued Statement of Financial
Accounting Standards No. 157 (“FAS 157”), “Fair Value Measurements.” FAS 157 establishes a
framework for measuring fair value and expands disclosures about fair value measurements in
financial statements.
The various inputs that may be used to determine the value of the fund’s investments are summarized
in three broad levels. The inputs or methodologies used for valuing securities are not necessarily an
indication of the risk associated with investing in those securities.
Level 1—Quoted prices in active markets for identical securities.
Level 2—Other significant observable inputs (including quoted prices for similar securities, interest
rates, prepayment speeds, credit risk, etc.).
Level 3—Significant unobservable inputs (including the fund’s own assumptions used to determine
the fair value of investments).
At August 31, 2008, 100% of the fund’s investments were valued using amortized cost, in accordance
with rules under the Investment Company Act of 1940. Amortized cost approximates the current fair
value of a security, but since the value is not obtained from a quoted price in an active market,
securities valued at amortized cost are considered to be valued using Level 2 inputs.
55
Admiral Treasury Money Market Fund
D. On October 7, 2008, the board of trustees approved the fund’s participation in a temporary program introduced by the U.S. Treasury to guarantee the account values of shareholders in a money market fund in the event the fund’s net asset value falls below $0.995 and the fund’s trustees decide to liquidate the fund. The program covers the lesser of a shareholder's account value on September 19, 2008, or on the date of liquidation. To participate, the fund is required to pay a fee of 0.01% of its net assets as of September 19, 2008; this expense will be borne by the fund. The coverage lasts until December 18, 2008. The Treasury will decide in December whether to extend the temporary program. If the program is extended, the trustees will decide whether the fund will continue to participate.
56
Report of Independent Registered Public Accounting Firm
To the Trustees of Vanguard Money Market Reserves, Vanguard Treasury Funds and Vanguard Admiral Funds and the Shareholders of Vanguard Prime Money Market Fund, Vanguard Federal Money Market Fund, Vanguard Treasury Money Market Fund and Vanguard Admiral Treasury Money Market Fund:
In our opinion, the accompanying statements of net assets and the related statements of operations and of changes in net assets and the financial highlights present fairly, in all material respects, the financial position of Vanguard Prime Money Market Fund, Vanguard Federal Money Market Fund, Vanguard Treasury Money Market Fund, and Vanguard Admiral Treasury Money Market Fund (the “Funds”) at August 31, 2008, the results of each of their operations for the year then ended, the changes in each of their net assets for each of the two years in the period then ended, and the financial highlights for each of the five years in the period then ended, in conformity with accounting principles generally accepted in the United States of America. These financial statements and financial highlights (hereafter referred to as “financial statements”) are the responsibility of the Funds’ management; our responsibility is to express an opinion on these financial statements based on our audits. We conducted our audits of these financial statements in accordance with the standards of the Public Company Accounting Oversight Board (United States). Those standards require that we plan and perform the audit to obtain reasonable assurance about whether the financial statements are free of material misstatement. An audit includes examining, on a test basis, evidence supporting the amounts and disclosures in the financial statements, assessing the accounting principles used and significant estimates made by management, and evaluating the overall financial statement presentation. We believe that our audits, which included confirmation of securities at August 31, 2008 by correspondence with the custodians and brokers, provide a reasonable basis for our opinion.
PricewaterhouseCoopers LLP
Philadelphia, Pennsylvania
October 14, 2008
57
Special 2008 tax information (unaudited) for Vanguard Prime Money Market Fund |
|
This information for the fiscal year ended August 31, 2008, is included pursuant to provisions of the |
Internal Revenue Code. |
|
For non-resident alien shareholders, 78.5% of income dividends are interest-related dividends. |
|
|
Special 2008 tax information (unaudited) for Vanguard Federal Money Market Fund |
|
This information for the fiscal year ended August 31, 2008, is included pursuant to provisions of the |
Internal Revenue Code. |
|
For non-resident alien shareholders, 100% of income dividends are interest-related dividends. |
|
|
Special 2008 tax information (unaudited) for Vanguard Treasury Money Market Fund |
|
This information for the fiscal year ended August 31, 2008, is included pursuant to provisions of the |
Internal Revenue Code. |
|
For non-resident alien shareholders, 100% of income dividends are interest-related dividends. |
|
|
Special 2008 tax information (unaudited) for Vanguard Admiral Treasury Money Market Fund |
|
This information for the fiscal year ended August 31, 2008, is included pursuant to provisions of the |
Internal Revenue Code. |
|
For non-resident alien shareholders, 100% of income dividends are interest-related dividends. |
58
About Your Fund’s Expenses
As a shareholder of the fund, you incur ongoing costs, which include costs for portfolio management, administrative services, and shareholder reports (like this one), among others. Operating expenses, which are deducted from a fund’s gross income, directly reduce the investment return of the fund.
A fund’s expenses are expressed as a percentage of its average net assets. This figure is known as the expense ratio. The following examples are intended to help you understand the ongoing costs (in dollars) of investing in your fund and to compare these costs with those of other mutual funds. The examples are based on an investment of $1,000 made at the beginning of the period shown and held for the entire period.
The accompanying table illustrates your fund’s costs in two ways:
• Based on actual fund return. This section helps you to estimate the actual expenses that you paid over the period. The “Ending Account Value” shown is derived from the fund’s actual return, and the third column shows the dollar amount that would have been paid by an investor who started with $1,000 in the fund. You may use the information here, together with the amount you invested, to estimate the expenses that you paid over the period.
To do so, simply divide your account value by $1,000 (for example, an $8,600 account value divided by $1,000 = 8.6), then multiply the result by the number given for your fund under the heading “Expenses Paid During Period.”
• Based on hypothetical 5% yearly return. This section is intended to help you compare your fund’s costs with those of other mutual funds. It assumes that the fund had a yearly return of 5% before expenses, but that the expense ratio is unchanged. In this case—because the return used is not the fund’s actual return—the results do not apply to your investment. The example is useful in making comparisons because the Securities and Exchange Commission requires all mutual funds to calculate expenses based on a 5% return. You can assess your fund’s costs by comparing this hypothetical example with the hypothetical examples that appear in shareholder reports of other funds.
Note that the expenses shown in the table are meant to highlight and help you compare ongoing costs only and do not reflect transaction costs incurred by the fund for buying and selling securities. Further, the expenses do not include the account service fee described in the prospectus (the fee does not apply to the Prime Money Market Fund’s Institutional Shares or the Admiral Treasury Money Market Fund). If such a fee were applied to your account, your costs would be higher. Your fund does not charge transaction fees, such as purchase or redemption fees, nor does it carry a “sales load.”
The calculations assume no shares were bought or sold during the period. Your actual costs may have been higher or lower, depending on the amount of your investment and the timing of any purchases or redemptions.
You can find more information about the fund’s expenses, including annual expense ratios, in the Financial Statements section of this report. For additional information on operating expenses and other shareholder costs, please refer to your fund’s current prospectus.
59
Six Months Ended August 31, 2008 | | | |
| Beginning | Ending | Expenses |
| Account Value | Account Value | Paid During |
Money Market Fund | 2/29/2008 | 8/31/2008 | Period1 |
Based on Actual Fund Return | | | |
Prime | | | |
Investor Shares | $1,000.00 | $1,012.31 | $1.12 |
Institutional Shares | 1,000.00 | 1,013.08 | 0.36 |
Federal | 1,000.00 | 1,011.53 | 1.12 |
Treasury | 1,000.00 | 1,009.72 | 1.17 |
Admiral Treasury | 1,000.00 | 1,010.45 | 0.51 |
Based on Hypothetical 5% Yearly Return | | | |
Prime | | | |
Investor Shares | $1,000.00 | $1,024.10 | $1.12 |
Institutional Shares | 1,000.00 | 1,024.85 | 0.36 |
Federal | 1,000.00 | 1,024.10 | 1.12 |
Treasury | 1,000.00 | 1,024.05 | 1.17 |
Admiral Treasury | 1,000.00 | 1,024.70 | 0.51 |
1 The calculations are based on expenses incurred in the most recent six-month period. The funds’ annualized six-month expense ratios for that period are: for the Prime Money Market Fund, 0.22% for Investor Shares and 0.07% for Institutional Shares; for the Federal Money Market Fund, 0.22%; for the Treasury Money Market Fund, 0.23%; for the Admiral Treasury Money Market Fund, 0.10%. The dollar amounts shown as “Expenses Paid” are equal to the annualized expense ratio multiplied by the average account value over the period, multiplied by the number of days in the most recent six-month period, then divided by the number of days in the most recent 12-month period.
60
Trustees Approve Advisory Arrangement
The board of trustees of Vanguard Prime Money Market Fund, Federal Money Market Fund, Treasury Money Market Fund, and Admiral Treasury Money Market Fund has renewed the funds’ investment advisory arrangement with The Vanguard Group, Inc. Vanguard—through its Fixed Income Group—serves as the investment advisor for the funds. The board determined that continuing the funds’ internalized management structure was in the best interests of the funds and their shareholders.
The board based its decision upon an evaluation of the advisor’s investment staff, portfolio management process, and performance. The trustees considered the factors discussed below, among others. However, no single factor determined whether the board approved the arrangement. Rather, it was the totality of the circumstances that drove the board’s decision.
Nature, extent, and quality of services
The board considered the quality of the funds’ investment management over both the short and long term, and took into account the organizational depth and stability of the advisor. The board noted that Vanguard has been managing investments for more than 25 years. George U. Sauter, Vanguard managing director and chief investment officer, has been in the investment management business since 1985. Robert F. Auwaerter, head of Fixed Income Portfolio Management and principal of Vanguard, has been in the investment management business since 1978. The Fixed Income Group adheres to a sound, disciplined investment-management process; the team has considerable experience, stability, and depth.
The board concluded that Vanguard’s experience, stability, depth, and performance, among other factors, warranted continuation of the advisory arrangement.
Investment performance
The board considered the short- and long-term performance of the funds, including any periods of outperformance or underperformance of relevant benchmarks and peer groups. The board concluded that the funds have performed in line with expectations, and that their results have been consistent with their investment strategies. Information about the funds’ most recent performance can be found in the Performance Summary sections of this report.
Cost
The board concluded that the funds’ expense ratios were far below the average expense ratios charged by funds in their respective peer groups. The board noted that the funds’ advisory expense ratios were also well below their peer-group averages. Information about the funds’ expense ratios appears in the About Your Fund’s Expenses section of this report as well as in the Financial Statements sections.
The board does not conduct a profitability analysis of Vanguard because of Vanguard’s unique “at-cost” structure. Unlike most other mutual fund management companies, Vanguard is owned by the funds it oversees, and produces “profits” only in the form of reduced expenses for fund shareholders.
The benefit of economies of scale
The board of trustees concluded that the funds’ low-cost arrangement with Vanguard ensures that the funds will realize economies of scale as they grow, with the cost to shareholders declining as the funds’ assets increase.
The board will consider whether to renew the advisory arrangement again after a one-year period.
61
Glossary
Average Quality. An indicator of credit risk, this figure is the average of the ratings assigned to a fund’s fixed income holdings by credit-rating agencies. The agencies make their judgment after appraising an issuer’s ability to meet its obligations. Quality is graded on a scale, with Aaa or AAA indicating the most creditworthy bond issuers. U.S. Treasury securities are considered to have the highest credit quality.
Average Weighted Maturity. The average length of time until fixed income securities held by a fund reach maturity and are repaid. The figure reflects the proportion of fund assets represented by each security.
Expense Ratio. The percentage of a fund’s average net assets used to pay its annual administrative and advisory expenses. These expenses directly reduce returns to investors.
Inception Date. The date on which the assets of a fund (or one of its share classes) are first invested in accordance with the fund’s investment objective. For funds with a subscription period, the inception date is the day after that period ends. Investment performance is measured from the inception date.
Yield. A money market fund’s 7-day SEC yield is calculated by annualizing its income distributions for the previous seven days, as required by the U.S. Securities and Exchange Commission.
62
This page intentionally left blank.
The People Who Govern Your Fund
The trustees of your mutual fund are there to see that the fund is operated and managed in your best interests since, as a shareholder, you are a part owner of the fund. Your fund’s trustees also serve on the board of directors of The Vanguard Group, Inc., which is owned by the Vanguard funds and provides services to them on an at-cost basis.
A majority of Vanguard’s board members are independent, meaning that they have no affiliation with Vanguard or the funds they oversee, apart from the sizable personal investments they have made as private individuals.
Our independent board members bring distinguished backgrounds in business, academia, and public service to their task of working with Vanguard officers to establish the policies and oversee the activities of the funds. Among board members’ responsibilities are selecting investment advisors for the funds; monitoring fund operations, performance, and costs; reviewing contracts; nominating and selecting new trustees/directors; and electing Vanguard officers.
Each trustee serves a fund until its termination; or until the trustee’s retirement, resignation, or death; or otherwise as specified in the fund’s organizational documents. Any trustee may be removed at a shareholders’ meeting by a vote representing two-thirds of the net asset value of all shares of the fund together with shares of other Vanguard funds organized within the same trust. The table on these two pages shows information for each trustee and executive officer of the fund. The mailing address of the trustees and officers is P.O. Box 876, Valley Forge, PA 19482.
Chairman of the Board and Trustee |
| |
John J. Brennan1 | |
Born 1954 | Principal Occupation(s) During the Past Five Years: Chairman of the Board and Director/ |
Trustee Since May 1987; | Trustee of The Vanguard Group, Inc., and of each of the investment companies served |
Chairman of the Board | by The Vanguard Group; Director of Vanguard Marketing Corporation; President and Chief |
156 Vanguard Funds Overseen | Executive Officer of The Vanguard Group and of each of the investment companies |
| served by The Vanguard Group (1996–2008). |
| |
Independent Trustees | |
| |
Charles D. Ellis | |
Born 1937 | Principal Occupation(s) During the Past Five Years: Applecore Partners (pro bono ventures |
Trustee Since January 2001 | in education); Senior Advisor to Greenwich Associates (international business strategy |
156 Vanguard Funds Overseen | consulting); Successor Trustee of Yale University; Overseer of the Stern School of Business |
| at New York University; Trustee of the Whitehead Institute for Biomedical Research. |
| |
Emerson U. Fullwood | |
Born 1948 | Principal Occupation(s) During the Past Five Years: Executive Chief Staff and Marketing |
Trustee Since January 2008 | Officer for North America since 2004 and Corporate Vice President of Xerox Corporation |
156 Vanguard Funds Overseen | (photocopiers and printers); Director of SPX Corporation (multi-industry manufacturing), |
| of the United Way of Rochester, and of the Boy Scouts of America. |
| |
Rajiv L. Gupta | |
Born 1945 | Principal Occupation(s) During the Past Five Years: Chairman, President, and |
Trustee Since December 20012 | Chief Executive Officer of Rohm and Haas Co. (chemicals); Board Member of |
156 Vanguard Funds Overseen | the American Chemistry Council; Director of Tyco International, Ltd. (diversified |
| manufacturing and services) since 2005. |
| |
Amy Gutmann | |
Born 1949 | Principal Occupation(s) During the Past Five Years: President of the University of |
Trustee Since June 2006 | Pennsylvania since 2004; Professor in the School of Arts and Sciences, Annenberg School |
156 Vanguard Funds Overseen | for Communication, and Graduate School of Education of the University of Pennsylvania |
| since 2004; Provost (2001–2004) and Laurance S. Rockefeller Professor of Politics and |
| the University Center for Human Values (1990–2004), Princeton University; Director of |
| Carnegie Corporation of New York since 2005 and of Schuylkill River Development |
| Corporation and Greater Philadelphia Chamber of Commerce since 2004; Trustee of |
| the National Constitution Center since 2007. |
JoAnn Heffernan Heisen | |
Born 1950 | Principal Occupation(s) During the Past Five Years: Corporate Vice President and |
Trustee Since July 1998 | Chief Global Diversity Officer since 2006, Vice President and Chief Information |
156 Vanguard Funds Overseen | Officer (1997–2005), and Member of the Executive Committee of Johnson & |
| Johnson (pharmaceuticals/consumer products); Director of the University Medical |
| Center at Princeton and Women’s Research and Education Institute. |
| |
André F. Perold | |
Born 1952 | Principal Occupation(s) During the Past Five Years: George Gund Professor of Finance |
Trustee Since December 2004 | and Banking, Harvard Business School; Senior Associate Dean and Director of Faculty |
156 Vanguard Funds Overseen | Recruiting, Harvard Business School; Director and Chairman of UNX, Inc. (equities |
| trading firm); Chair of the Investment Committee of HighVista Strategies LLC (private |
| investment firm) since 2005. |
| |
Alfred M. Rankin, Jr. | |
Born 1941 | Principal Occupation(s) During the Past Five Years: Chairman, President, Chief Executive |
Trustee Since January 1993 | Officer, and Director of NACCO Industries, Inc. (forklift trucks/housewares/lignite); Director |
156 Vanguard Funds Overseen | of Goodrich Corporation (industrial products/aircraft systems and services). |
| |
| |
J. Lawrence Wilson | |
Born 1936 | Principal Occupation(s) During the Past Five Years: Retired Chairman and Chief Executive |
Trustee Since April 1985 | Officer of Rohm and Haas Co. (chemicals); Director of Cummins Inc. (diesel engines) and |
156 Vanguard Funds Overseen | AmerisourceBergen Corp. (pharmaceutical distribution); Trustee of Vanderbilt University |
| and of Culver Educational Foundation. |
| |
Executive Officers1 | |
| |
Thomas J. Higgins | |
Born 1957 | Principal Occupation(s) During the Past Five Years: Principal of The Vanguard Group, Inc.; |
Treasurer Since July 1998 | Treasurer of each of the investment companies served by The Vanguard Group. |
156 Vanguard Funds Overseen | |
| |
| |
F. William McNabb III | |
Born 1957 | Principal Occupation(s) During the Past Five Years: Chief Executive Officer, Director, |
Chief Executive Officer | and President of The Vanguard Group, Inc., since 2008; Chief Executive Officer and |
Since August 31, 2008 | President of each of the investment companies served by The Vanguard Group since |
President Since March 2008 | 2008; Director of Vanguard Marketing Corporation; Managing Director of The Vanguard |
156 Vanguard Funds Overseen | Group (1995–2008). |
| |
| |
Heidi Stam | |
Born 1956 | Principal Occupation(s) During the Past Five Years: Managing Director of The Vanguard |
Secretary Since July 2005 | Group, Inc., since 2006; General Counsel of The Vanguard Group since 2005; Secretary of |
156 Vanguard Funds Overseen | The Vanguard Group and of each of the investment companies served by The Vanguard |
| Group, since 2005; Director and Senior Vice President of Vanguard Marketing Corporation |
| since 2005; Principal of The Vanguard Group (1997–2006). |
Vanguard Senior Management Team | | |
| | | |
R. Gregory Barton | Kathleen C. Gubanich | Michael S. Miller | Glenn W. Reed |
Mortimer J. Buckley | Paul A. Heller | Ralph K. Packard | George U. Sauter |
Founder |
|
John C. Bogle |
Chairman and Chief Executive Officer, 1974–1996 |
1 These individuals are “interested persons” as defined in the Investment Company Act of 1940.
2 December 2002 for Vanguard Equity Income Fund, Vanguard Growth Equity Fund, the Vanguard Municipal Bond Funds, and the Vanguard State Tax-Exempt Funds.
More information about the trustees is in the Statement of Additional Information, available from The Vanguard Group.
| 
|
| P.O. Box 2600 |
| Valley Forge, PA 19482-2600 |
Connect with Vanguard® > www.vanguard.com
Fund Information > 800-662-7447 | All comparative mutual fund data are from Lipper Inc. |
| or Morningstar, Inc., unless otherwise noted. |
Direct Investor Account Services > 800-662-2739 | |
| |
Institutional Investor Services > 800-523-1036 | You can obtain a free copy of Vanguard’s proxy voting |
| guidelines by visiting our website, www.vanguard.com, |
Text Telephone for People | and searching for “proxy voting guidelines,” or by |
With Hearing Impairment > 800-952-3335 | calling Vanguard at 800-662-2739. The guidelines are |
| also available from the SEC’s website, www.sec.gov. |
| In addition, you may obtain a free report on how your |
This material may be used in conjunction | fund voted the proxies for securities it owned during |
with the offering of shares of any Vanguard | the 12 months ended June 30. To get the report, visit |
fund only if preceded or accompanied by | either www.vanguard.com or www.sec.gov. |
the fund’s current prospectus. | |
| |
| You can review and copy information about your fund |
The funds or securities referred to herein are not | at the SEC’s Public Reference Room in Washington, D.C. |
sponsored, endorsed, or promoted by MSCI, and MSCI | To find out more about this public service, call the SEC |
bears no liability with respect to any such funds or | at 202-551-8090. Information about your fund is also |
securities. For any such funds or securities, the | available on the SEC’s website, and you can receive |
prospectus or the Statement of Additional Information | copies of this information, for a fee, by sending a |
contains a more detailed description of the limited | request in either of two ways: via e-mail addressed to |
relationship MSCI has with The Vanguard Group and | publicinfo@sec.gov or via regular mail addressed to the |
any related funds. | Public Reference Section, Securities and Exchange |
| Commission, Washington, DC 20549-0102. |
| |
Russell is a trademark of The Frank Russell Company. | |
| |
| |
| |
| |
| |
| |
| |
| |
| |
| |
| © 2008 The Vanguard Group, Inc. All rights reserved. |
| Vanguard Marketing Corporation, Distributor. |
| |
| Q300 102008 |
(a) Audit Fees.
Aggregate Audit Fees of Registered Investment Companies in the Vanguard Group.
(b) Audit-Related Fees.
Includes fees billed in connection with assurance and related services provided to the Registrant, The Vanguard Group, Inc., Vanguard Marketing Corporation, and other registered investment companies in the Vanguard Group.
(c) Tax Fees.
Includes fees billed in connection with tax compliance, planning and advice services provided to the Registrant, The Vanguard Group, Inc., Vanguard Marketing Corporation, and other registered investment companies in the Vanguard Group and related to income and excise taxes.
(d) All Other Fees.
Includes fees billed for services related to risk management and privacy matters. Services were provided to the Registrant, The Vanguard Group, Inc., Vanguard Marketing Corporation, and other registered investment companies in the Vanguard Group.
(e) (1) Pre-Approval Policies. The policy of the Registrant’s Audit Committee is to consider and, if appropriate, approve before the principal accountant is engaged for such services, all specific audit and non-audit services provided to: (1) the Registrant; (2) The Vanguard Group, Inc.; (3) other entities controlled by The Vanguard Group, Inc. that provide ongoing services to the Registrant; and (4) other registered investment companies in the Vanguard Group. In making a determination, the Audit Committee considers whether the services are consistent with maintaining the principal accountant’s independence.
In the event of a contingency situation in which the principal accountant is needed to provide services in between scheduled Audit Committee meetings, the Chairman of the Audit Committee would be called on to consider and, if appropriate, pre-approve audit or permitted non-audit services in an amount sufficient to complete services through the next Audit Committee meeting, and to determine if such services would be consistent with maintaining the accountant’s independence. At the next scheduled Audit Committee meeting, services and fees would be presented to the Audit Committee for formal consideration, and, if appropriate, approval by the entire Audit Committee. The Audit Committee would again consider whether such services and fees are consistent with maintaining the principal accountant’s independence.
The Registrant’s Audit Committee is informed at least annually of all audit and non-audit services provided by the principal accountant to the Vanguard complex, whether such services are provided to: (1) the Registrant; (2) The Vanguard Group, Inc.; (3) other entities controlled by The Vanguard Group, Inc. that provide ongoing services to the Registrant; or (4) other registered investment companies in the Vanguard Group.
(2) No percentage of the principal accountant’s fees or services were approved pursuant to the waiver provision of paragraph (c)(7)(i)(C) of Rule 2-01 of Regulation S-X.
(g) Aggregate Non-Audit Fees.
Includes fees billed for non-audit services provided to the Registrant, The Vanguard Group, Inc., Vanguard Marketing Corporation, and other registered investment companies in the Vanguard Group.
(h) For the most recent fiscal year, the Audit Committee has determined that the provision of all non-audit services was consistent with maintaining the principal accountant’s independence.
(a) Disclosure Controls and Procedures. The Principal Executive and Financial Officers concluded that the Registrant's Disclosure Controls and Procedures are effective based on their evaluation of the Disclosure Controls and Procedures as of a date within 90 days of the filing date of this report.
(b) Internal Control Over Financial Reporting. There were no significant changes in Registrant’s Internal Control Over Financial Reporting or in other factors that could significantly affect this control subsequent to the date of the evaluation, including any corrective actions with regard to significant deficiencies and material weaknesses.
Pursuant to the requirements of the Securities Exchange Act of 1934 and the Investment Company Act of 1940, the registrant has duly caused this report to be signed on its behalf by the undersigned, thereunto duly authorized.
Pursuant to the requirements of the Securities Exchange Act of 1934 and the Investment Company Act of 1940, this report has been signed below by the following persons on behalf of the registrant and in the capacities and on the dates indicated.
Heidi Stam, pursuant to a Power of Attorney filed on January 18, 2008, see file Number 2-29601, Incorporated by Reference; and pursuant to a Power of Attorney filed on
September 26, 2008, see File Number 2-47371, Incorporated by Reference.