UNITED STATES
SECURITIES AND EXCHANGE COMMISSION
Washington, D.C. 20549
FORM N-CSR
CERTIFIED SHAREHOLDER REPORT
OF
REGISTERED MANAGEMENT INVESTMENT COMPANIES
Investment Company Act file number: 811-2554
Name of Registrant: Vanguard Money Market Reserves
Address of Registrant:
P.O. Box 2600
Valley Forge, PA 19482
Name and address of agent for service:
Heidi Stam, Esquire
P.O. Box 876
Valley Forge, PA 19482
Registrant’s telephone number, including area code: (610) 669-1000
Date of fiscal year end: August 31
Date of reporting period: September 1, 2010 – August 31, 2011
Item 1: Reports to Shareholders

|
| Annual Report | August 31, 2011 |
| |
| Vanguard Money Market Funds |
| |
| Vanguard Prime Money Market Fund |
| Vanguard Federal Money Market Fund |
| Vanguard AdmiralTM Treasury Money Market Fund |
> For the 12 months ended August 31, 2011, the Vanguard Money Market Funds earned near-zero returns.
> Money market yields have remained negligible because of the Federal Reserve’s ongoing low-interest-rate policy.
> The three Vanguard funds posted slightly positive returns, while the average return of peer-group funds was 0%.
| |
| Contents | |
| Your Fund’s Total Returns. | 1 |
| Chairman’s Letter. | 2 |
| Advisor’s Report. | 8 |
| Prime Money Market Fund. | 9 |
| Federal Money Market Fund. | 32 |
| Admiral Treasury Money Market Fund. | 43 |
| About Your Fund’s Expenses. | 54 |
| Trustees Approve Advisory Arrangement. | 56 |
| Glossary. | 57 |
Please note: The opinions expressed in this report are just that—informed opinions. They should not be considered promises or advice.
Also, please keep in mind that the information and opinions cover the period through the date on the front of this report. Of course, the risks of investing in your fund are spelled out in the prospectus.
See the Glossary for definitions of investment terms used in this report.
About the cover: Vanguard was named for the HMS Vanguard, flagship of British Admiral Horatio Nelson. A ship—whose performance and safety depend on the work of all hands—has served as a fitting metaphor for the Vanguard crew as we strive to help clients reach their financial goals.
Your Fund’s Total Returns
Fiscal Year Ended August 31, 2011
| | |
| | 7-Day SEC | Total |
| | Yields | Returns |
| Vanguard Prime Money Market Fund | | |
| Investor Shares | 0.03% | 0.06% |
| Institutional Shares | 0.11 | 0.17 |
| Money Market Funds Average | | 0.00 |
| Money Market Funds Average: Derived from data provided by Lipper Inc. |
| |
| Vanguard Federal Money Market Fund | 0.01% | 0.02% |
| Government Money Market Funds Average | | 0.00 |
| Government Money Market Funds Average: Derived from data provided by Lipper Inc. |
| |
| Vanguard Admiral Treasury Money Market Fund | 0.01% | 0.02% |
| iMoneyNet Money Fund Report’s 100% Treasury Funds Average | | 0.00 |
| iMoneyNet Money Fund Report’s 100% Treasury Funds Average: Derived from data provided by iMoneyNet, Inc. |
The 7-day SEC yield of a money market fund more closely reflects the current earnings of the fund than its total return.
Institutional Shares are available to certain institutional investors who meet specific administrative, service, and account-size criteria.
1

Chairman’s Letter
Dear Shareholder,
Money market funds over the past 12 months have once again generated negligible returns. Yields of the Vanguard Money Market Funds continued to hover barely above zero as the Federal Reserve held short-term interest rates between 0% and 0.25%. Toward the end of the period, the Fed indicated that it expected to maintain this exceptionally low target at least through mid-2013.
Although it is small comfort, the funds’ advisor, Vanguard Fixed Income Group, has successfully navigated this challenging environment. Our funds’ returns, although tiny, were higher than the 0% average return of their peers.
Just as important, our money market funds followed their mandate to invest in very high-credit-quality securities, thus preserving our shareholders’ principal. Throughout the fiscal year, our three money market funds maintained a net asset value of $1 per share, as is expected but not guaranteed. On August 31, the Prime Money Market Fund’s 7-day SEC yield was 0.03% for Investor Shares, down from 0.07% six months earlier. As expected, the other funds’ yields were even lower.
As I mentioned in our last report to you, U.S. money market funds continue to implement changes required by the Securities and Exchange Commission (SEC) in reaction to the financial crisis of 2008. Besides shortening their average
2
maturity from 90 days to 60 days—which can reduce yields but enhance fund liquidity—money market funds are now posting their holdings five business days after the end of each month on their websites. In addition, the SEC is now posting funds’ “shadow net asset values” at month-end on its own site, with a 60-day delay. Shadow NAVs reflect the typically very minute differences between the amortized cost and the market prices of fund investments.
We have supported these enhancements to transparency and quality. As federal policymakers consider additional changes, Vanguard has been providing research and comments. These developments have not affected the high standards for credit quality and liquidity that we have always applied. We continue to believe that money market funds play an important role in our investors’ portfolios, as well as in the U.S. marketplace and economy.
Treasuries rallied as risk aversion returned
While the yields of money market instruments hovered near zero, bond yields rose (and prices declined) in the first half of the 12-month period as the prospect of improved economic growth and inflationary pressures set the bond market’s tone. Corporate bonds outperformed U.S. Treasury securities.
In the second half, risk aversion set the tone. Investors bid up Treasuries, trimming the yield of the 10-year Treasury note to barely 2%, and government bonds were
Market Barometer
| | | |
| | | Average Annual Total Returns |
| | | Periods Ended August 31, 2011 |
| | One | Three | Five |
| | Year | Years | Years |
| Bonds | | | |
| Barclays Capital U.S. Aggregate Bond Index (Broad | | | |
| taxable market) | 4.62% | 7.23% | 6.56% |
| Barclays Capital Municipal Bond Index (Broad tax-exempt | | | |
| market) | 2.66 | 6.00 | 4.94 |
| Citigroup Three-Month U.S. Treasury Bill Index | 0.12 | 0.24 | 1.69 |
| |
| Stocks | | | |
| Russell 1000 Index (Large-caps) | 19.06% | 0.84% | 1.11% |
| Russell 2000 Index (Small-caps) | 22.19 | 0.83 | 1.53 |
| Dow Jones U.S. Total Stock Market Index | 19.16 | 1.18 | 1.52 |
| MSCI All Country World Index ex USA (International) | 10.34 | -0.97 | 0.79 |
| |
| CPI | | | |
| Consumer Price Index | 3.77% | 1.12% | 2.13% |
3
among the market’s best performers. For the full year, the taxable investment-grade U.S. bond market returned 4.62%; the broad municipal bond market returned 2.66%.
Strong 12-month returns in a tale of two markets
Global stock markets delivered strong returns in a fiscal year marked by distinct periods of strength and then weakness. During the first six months, stock prices surged, with the broad U.S. stock market returning about 29%. As the slow, grinding economic recovery seemed to gather momentum, energy and industrial stocks, which are keenly sensitive to the rhythms of the business cycle, produced the best returns.
In the second six months, growth decelerated and stock market volatility spiked, amplified by Europe’s sovereign-debt drama, political wrangling over the U.S. debt ceiling, and Standard & Poor’s decision to downgrade the U.S. credit rating. (Vanguard’s confidence in the “full faith and credit” of the U.S. government remains unshaken.) Stock prices retreated, and those sectors that led the market in the first half lost ground in the second, displaced as leaders by defensive sectors such as utilities and consumer staples.
Maintaining high credit quality is a critical consideration
Since the Federal Reserve lowered short-term rates to historic lows nearly three years ago, money market fund
Expense Ratios
Your Fund Compared With Its Peer Group
| | | |
| | Investor | Institutional | Peer Group |
| | Shares | Shares | Average |
| Prime Money Market Fund | 0.23% | 0.09% | 0.40% |
| Federal Money Market Fund | 0.22 | — | 0.29 |
| Admiral Treasury Money Market Fund | 0.14 | — | 0.21 |
The fund expense ratios shown are from the prospectus dated December 23, 2010, and represent estimated costs for the current fiscal year. For the fiscal year ended August 31, 2011, the funds’ expense ratios were: for the Prime Money Market Fund, 0.20% for Investor Shares and 0.09% for Institutional Shares; for the Federal Money Market Fund, 0.19%; for the Admiral Treasury Money Market Fund, 0.11%. The expense ratios for the Federal Money Market Fund and the Admiral Treasury Money Market Fund reflect a temporary reduction in operating expenses (described in Note B of the Notes to Financial Statements). Before the reduction, the expense ratios were: for the Federal Money Market Fund, 0.20%; for the Admiral Treasury Money Market Fund, 0.12%.
Peer groups are: for the Prime Money Market Fund, Money Market Funds; for the Federal Money Market Fund, Government Money Market Funds; for the Admiral Treasury Money Market Fund, U.S. Treasury Money Market Funds.
4
yields have fallen to almost nothing. Yields for our three money market funds were a hairsbreadth above zero for the 12 months ended August 31, 2011. Even so, the funds’ returns outpaced the 0% results of their benchmarks and peer-group averages.
At the end of the period, both the Admiral Treasury and Federal Money Market Funds posted a 7-day SEC yield of 0.01%. (These funds have been closed to new investors since 2009.) The Investor Shares of the Prime Money Market Fund yielded 0.03%, while the Institutional Shares, because of their lower expense ratio, yielded 0.11%. Returns for the 12 months were marginally higher.
In this environment, our advisor sought to produce as much income as possible consistent with the funds’ mandate of investing only in very high-quality instruments.
In fact, many investors these days are more concerned about credit quality than they are about the low returns produced by all money market funds—after all, fund advisors can’t control market interest rates, but they can control the nature of the securities the fund owns. Every potential holding—particularly for the Prime Money Market Fund, which invests in corporate and government securities—is thoroughly reviewed by a team of experienced credit analysts.
Total Returns
Ten Years Ended August 31, 2011
| |
| | Average |
| | Annual Return |
| Prime Money Market Fund Investor Shares | 2.09% |
| Money Market Funds Average | 1.59 |
| Money Market Funds Average: Derived from data provided by Lipper Inc. |
| Federal Money Market Fund | 2.02% |
| Government Money Market Funds Average | 1.57 |
| Government Money Market Funds Average: Derived from data provided by Lipper Inc. | |
| Admiral Treasury Money Market Fund | 1.95% |
| iMoneyNet Money Fund Report’s 100% Treasury Funds Average | 1.43 |
| iMoneyNet Money Fund Report’s 100% Treasury Funds Average: Derived from data provided by iMoneyNet, Inc. |
Investment returns will fluctuate. All of the returns in this report represent past performance, which is not a guarantee of future results that may be achieved by the funds. (Current performance may be lower or higher than the performance data cited. For performance data current to the most recent month-end, visit our website at vanguard.com/performance.) An investment in a money market fund is not insured or guaranteed by the Federal Deposit Insurance Corporation or any other government agency. Although a money market fund seeks to preserve the value of your investment at $1 per share, it is possible to lose money by investing in such a fund.
5
The advisor focused on securities issued by higher-rated sources
In recent months, the financial straits of some European governments have led to questions about the impact on money market funds that hold securities issued by banks and other borrowers in the regions. As of August 31, the Prime Money Market Fund had no direct exposure to instruments from issuers based in Greece, Ireland, Italy, Portugal, or Spain—Eurozone countries that, as the daily headlines proclaim, are under intense fiscal pressures. Indeed, the fund has had no such exposure for more than a year.
Most of the fund’s foreign investments are in securities issued by Australian banking institutions. Also represented are issuers from Canada, the United Kingdom, and non-euro countries in Scandinavia. The portfolio owns some securities from creditworthy banks in two Eurozone countries, Luxembourg and the Netherlands. It does not hold any securities from banks based in France or Germany, which have significant exposure to bonds of some of the most distressed Eurozone governments.
On August 31, about half of the Prime Money Market Fund’s assets were invested in U.S. Treasury bills and other U.S. government obligations.
About 24% of its assets were in dollar-denominated certificates of deposit issued mostly by Canadian, Australian, and non-euro European banks. A bit more than 20% of assets were invested in
Changes in Yields
| | |
| | | 7-Day SEC Yield |
| | August 31, | August 31, |
| | 2011 | 2010 |
| Prime Money Market Fund | | |
| Investor Shares | 0.03% | 0.13% |
| Institutional Shares | 0.11 | 0.26 |
| Federal Money Market Fund | 0.01 | 0.05 |
| Admiral Treasury Money Market Fund | 0.01 | 0.02 |
6
commercial paper issued by a wide range of industrial, financial, and governmental institutions across the globe. The portfolio also included a small allocation to U.S. municipal securities.
At the end of the fiscal year, the Admiral Treasury Money Market Fund was invested solely in U.S. Treasury securities, while the Federal Money Market Fund was invested mostly in obligations issued by agencies of the federal government, with the remainder of assets invested in U.S. Treasury bills.
A prudent approach for lean times
When will short-term interest rates emerge from the cellar? No one knows for sure. Predicting their future direction is always an uncertain enterprise, although the Federal Reserve foresees an extended period of rock-bottom rates for money market securities.
In the meantime, Vanguard will continue to manage its money market funds conservatively, with a constant focus on maintaining high credit quality. To that end, the credit analysts in Vanguard Fixed Income Group continually evaluate not only prospective investments but also securities that the portfolio already owns, and they recommend repositioning when warranted.
Balance and diversification for the short and long term
We’re confident that money market funds will remain a key part of the investment landscape, providing investors with a reliable source of stability and liquidity. Their utility is unquestioned, whether serving as a vehicle for investing short- term reserves or as part of a long-term investment plan.
We trust that your portfolio holds a diversified mix of assets, including money market funds, stocks, and bonds, in a steady allocation that fits your long-term needs and your tolerance for risk. Such a balanced, well-diversified portfolio can help put you on the road toward meeting your investment goals.
As always, thank you for your confidence in Vanguard.
Sincerely,

F. William McNabb III
Chairman and Chief Executive Officer
September 13, 2011
7
Advisor’s Report
Throughout the 12 months ended August 31, 2011, the United States continued to struggle under the weight of the deleveraging crisis that has affected everyone from homeowners to overly indebted nations. Consumers were saving more and spending less, leaving business leaders little incentive to hire in the face of sluggish demand.
The Federal Reserve has taken extraordinary measures designed to aid the U.S. economy, most recently by extending its guidance for low interest rates all the way out to 2013. Interest rates have fallen in response, and the Fed is prepared to do more if necessary.
Portfolio adjustments
In 2011, we made some adjustments to the Prime Money Market Fund portfolio. For more than a year, overindebtedness in the European periphery has been significantly affecting the short-term credit markets. In 2010, we stopped purchasing certificates of deposit and commercial paper from banks in Spain, Italy, France, and Germany. In 2011, as the situation became increasingly difficult, we continued to play defense and reduced our exposure throughout the rest of Europe.
The playbook isn’t very different from the one we followed during the depths of the financial crisis: Avoid credits that are under pressure. Invest in diverse, highly liquid assets. Adjust the portfolio’s position in U.S. Treasury and government securities to reflect current conditions.
We have significantly reduced our investment in bank certificates of deposit, most of which was in European credits. While some of those assets have been reallocated into additional Treasury and government securities, others have been diversified into commercial paper issued by names such as Coca-Cola, Pepsi, and Texas Instruments. We also added a number of high-quality asset-backed commercial paper programs, which provide an additional level of portfolio diversification.
The outlook
Demand for Treasuries remains strong amid investor concerns about market volatility and problems overseas. Treasury bill yields are hovering near 0%, with occasional dips into negative territory. With the Fed on hold for the next two years, these yields likely will remain exceptionally low.
Until the housing market begins to show signs of recovery, we expect the supply of agency securities to remain limited. We also expect agency yields to remain close to U.S. Treasury yields because of the agencies’ close ties to the U.S. government.
In the meantime, our approach will remain very conservative, with an emphasis on credit quality and price stability.
David R. Glocke, Principal
Vanguard Fixed Income Group
September 14, 2011
8
Prime Money Market Fund
Fund Profile
As of August 31, 2011
| | |
| Financial Attributes | | |
| | Investor | Institutional |
| | Shares | Shares |
| Ticker Symbol | VMMXX | VMRXX |
| Expense Ratio1 | 0.23% | 0.09% |
| 7-Day SEC Yield | 0.03% | 0.11% |
| Average Weighted | | |
| Maturity | 57 days | 57 days |
| |
| Sector Diversification (% of portfolio) | |
| Certificates of Deposit | | 0.9% |
| Repurchase Agreements | | 0.2 |
| U.S. Treasury Bills | | 20.3 |
| Yankee/Foreign | | 23.9 |
| Commercial Paper | | 20.2 |
| U.S. Government Agency Obligations | 30.1 |
| Other | | 4.4 |
The agency and mortgage-backed securities sectors may include issues from government-sponsored enterprises; such issues are not backed by the full faith and credit of the U.S. government.
| |
| Distribution by Credit Quality (% of portfolio) |
| First Tier | 100.0% |
| For information about these ratings, see the Glossary entry for Credit Quality. |
1 The expense ratios shown are from the prospectus dated December 23, 2010, and represent estimated costs for the current fiscal year. For the fiscal year ended August 31, 2011, the expense ratios were 0.20% for Investor Shares and 0.09% for Institutional Shares.
9
Prime Money Market Fund
Performance Summary
Investment returns will fluctuate. All of the returns in this report represent past performance, which is not a guarantee of future results that may be achieved by the fund. (Current performance may be lower or higher than the performance data cited. For performance data current to the most recent month-end, visit our website at vanguard.com/performance.) The returns shown do not reflect taxes that a shareholder would pay on fund distributions. An investment in a money market fund is not insured or guaranteed by the Federal Deposit Insurance Corporation or any other government agency. Although the fund seeks to preserve the value of your investment at $1 per share, it is possible to lose money by investing in the fund. The fund’s 7-day SEC yield reflects its current earnings more closely than do the average annual returns.
Cumulative Performance: August 31, 2001, Through August 31, 2011
Initial Investment of $10,000

| | | | |
| | Average Annual Total Returns | |
| | Periods Ended August 31, 2011 | |
| | | | | Final Value |
| | One | Five | Ten | of a $10,000 |
| | Year | Years | Years | Investment |
| Prime Money Market Fund Investor | | | | |
| Shares | 0.06% | 2.04% | 2.09% | $12,294 |
| Citigroup Three-Month U.S. Treasury | | | | |
| Bill Index | 0.12 | 1.69 | 1.95 | 12,128 |
| |
| Money Market Funds Average | 0.00 | 1.63 | 1.59 | 11,705 |
Money Market Funds Average: Derived from data provided by Lipper Inc.
| | | | |
| | | | | Final Value |
| | One | Five | Ten | of a $5,000,000 |
| | Year | Years | Years | Investment |
| Prime Money Market Fund Institutional | | | | |
| Shares | 0.17% | 2.18% | 2.26% | $6,255,143 |
| Citigroup Three-Month U.S. Treasury Bill | | | | |
| Index | 0.12 | 1.69 | 1.95 | 6,063,991 |
| Institutional Money Market Funds Average | 0.06 | 1.90 | 1.94 | 6,061,529 |
See Financial Highlights for dividend information.
10
Prime Money Market Fund
Fiscal-Year Total Returns (%): August 31, 2001, Through August 31, 2011
| | |
| | | Money |
| | | Market |
| | | Funds |
| | Investor Shares | Average |
| Fiscal Year | Total Returns | Total Returns |
| 2002 | 2.09% | 1.40% |
| 2003 | 1.12 | 0.60 |
| 2004 | 0.83 | 0.39 |
| 2005 | 2.31 | 1.68 |
| 2006 | 4.38 | 3.69 |
| 2007 | 5.23 | 4.55 |
| 2008 | 3.60 | 3.02 |
| 2009 | 1.31 | 0.62 |
| 2010 | 0.08 | 0.02 |
| 2011 | 0.06 | 0.00 |
| 7-day SEC yield (8/31/2011): 0.03% |
| Money Market Funds Average: Derived from data provided by Lipper Inc. |
Average Annual Total Returns: Periods Ended June 30, 2011
This table presents returns through the latest calendar quarter—rather than through the end of the fiscal period.
Securities and Exchange Commission rules require that we provide this information.
| | | | |
| | Inception | One | Five | Ten |
| | Date | Year | Years | Years |
| Investor Shares | 6/4/1975 | 0.08% | 2.21% | 2.15% |
| Institutional Shares | 10/3/1989 | 0.20 | 2.36 | 2.33 |
11
Prime Money Market Fund
Financial Statements
Statement of Net Assets
As of August 31, 2011
The fund reports a complete list of its holdings in various monthly and quarterly regulatory filings. The fund publishes its holdings on a monthly basis at vanguard.com and files them with the Securities and Exchange Commission on Form N-MFP. The fund’s Form N-MFP filings become public 60 days after the relevant month-end, and may be viewed at sec.gov or via a link on the “Portfolio Holdings” page on vanguard.com. For the second and fourth fiscal quarters, the lists appear in the fund’s semiannual and annual reports to shareholders. For the first and third fiscal quarters, the fund files the lists with the SEC on Form N-Q. Shareholders can look up the fund’s Forms N-Q on the SEC’s website at sec.gov. Forms N-Q may also be reviewed and copied at the SEC’s Public Reference Room (see the back cover of this report for further information).
| | | | | |
| | | | | Face | Market |
| | | | Maturity | Amount | Value |
| | | Yield1 | Date | ($000) | ($000) |
| U.S. Government and Agency Obligations (50.8%) | | | |
| 2 | Fannie Mae Discount Notes | 0.065% | 9/12/11 | 812,000 | 811,984 |
| 2 | Fannie Mae Discount Notes | 0.150% | 9/13/11 | 71,600 | 71,596 |
| 2 | Fannie Mae Discount Notes | 0.085% | 9/14/11 | 30,000 | 29,999 |
| 2 | Fannie Mae Discount Notes | 0.050%–0.060% | 9/21/11 | 301,500 | 301,491 |
| 2 | Fannie Mae Discount Notes | 0.085% | 9/22/11 | 240,600 | 240,588 |
| 2 | Fannie Mae Discount Notes | 0.120% | 10/5/11 | 20,500 | 20,498 |
| 2 | Fannie Mae Discount Notes | 0.160% | 10/6/11 | 200,000 | 199,969 |
| 2 | Fannie Mae Discount Notes | 0.060%–0.160% | 10/12/11 | 572,809 | 572,732 |
| 2 | Fannie Mae Discount Notes | 0.075%–0.190% | 10/19/11 | 613,500 | 613,399 |
| 2 | Fannie Mae Discount Notes | 0.160% | 10/20/11 | 25,000 | 24,995 |
| 2 | Fannie Mae Discount Notes | 0.150% | 10/21/11 | 1,500,000 | 1,499,688 |
| 2 | Fannie Mae Discount Notes | 0.170% | 10/25/11 | 1,000,000 | 999,745 |
| 2 | Fannie Mae Discount Notes | 0.120%–0.170% | 10/26/11 | 588,507 | 588,364 |
| 2 | Fannie Mae Discount Notes | 0.150%–0.160% | 11/7/11 | 260,300 | 260,225 |
| 2 | Fannie Mae Discount Notes | 0.060%–0.080% | 11/9/11 | 95,186 | 95,173 |
| 2 | Fannie Mae Discount Notes | 0.070% | 11/16/11 | 84,667 | 84,654 |
| 2 | Federal Home Loan Bank Discount Notes | 0.050%–0.180% | 9/21/11 | 342,806 | 342,774 |
| 2 | Federal Home Loan Bank Discount Notes | 0.060% | 9/23/11 | 285,000 | 284,990 |
| 2 | Federal Home Loan Bank Discount Notes | 0.055%–0.140% | 9/28/11 | 1,778,600 | 1,778,464 |
| 2 | Federal Home Loan Bank Discount Notes | 0.070% | 9/30/11 | 101,238 | 101,232 |
| 2 | Federal Home Loan Bank Discount Notes | 0.055%–0.120% | 10/5/11 | 248,400 | 248,384 |
| 2 | Federal Home Loan Bank Discount Notes | 0.040%–0.150% | 10/14/11 | 1,513,890 | 1,513,735 |
| 2 | Federal Home Loan Bank Discount Notes | 0.075%–0.190% | 10/19/11 | 357,750 | 357,674 |
| 2 | Federal Home Loan Bank Discount Notes | 0.075%–0.190% | 10/21/11 | 1,230,915 | 1,230,746 |
| 2 | Federal Home Loan Bank Discount Notes | 0.120%–0.160% | 10/26/11 | 350,000 | 349,921 |
| 2 | Federal Home Loan Bank Discount Notes | 0.120%–0.145% | 11/2/11 | 200,000 | 199,952 |
| 2 | Federal Home Loan Bank Discount Notes | 0.060%–0.080% | 11/4/11 | 1,318,277 | 1,318,121 |
| 2 | Federal Home Loan Bank Discount Notes | 0.080% | 11/14/11 | 255,000 | 254,958 |
| 2,3 | Federal Home Loan Banks | 0.173% | 1/9/12 | 593,000 | 592,932 |
| 2,3 | Federal Home Loan Banks | 0.185% | 1/23/12 | 425,000 | 424,958 |
| 2,3 | Federal Home Loan Banks | 0.184% | 1/26/12 | 405,000 | 404,951 |
| 2,3 | Federal Home Loan Banks | 0.151% | 2/1/12 | 750,000 | 749,899 |
| 2,3 | Federal Home Loan Banks | 0.157% | 2/3/12 | 122,000 | 121,984 |
| 2,3 | Federal Home Loan Banks | 0.162% | 2/3/12 | 484,000 | 483,939 |
| 2,3 | Federal Home Loan Mortgage Corp. | 0.168% | 12/16/11 | 515,000 | 514,940 |
| 2,3 | Federal Home Loan Mortgage Corp. | 0.163% | 12/21/11 | 1,500,000 | 1,499,770 |
12
| | | | | |
| Prime Money Market Fund | | | | |
| |
| |
| |
| | | | | Face | Market |
| | | | Maturity | Amount | Value |
| | | Yield1 | Date | ($000) | ($000) |
| 2,3 | Federal Home Loan Mortgage Corp. | 0.168% | 2/16/12 | 470,400 | 470,309 |
| 2,3 | Federal Home Loan Mortgage Corp. | 0.157% | 8/24/12 | 2,515,000 | 2,513,818 |
| 2,3 | Federal Home Loan Mortgage Corp. | 0.151% | 2/4/13 | 1,000,000 | 999,272 |
| 2,3 | Federal Home Loan Mortgage Corp. | 0.173% | 3/21/13 | 907,000 | 906,288 |
| 2,3 | Federal Home Loan Mortgage Corp. | 0.155% | 5/6/13 | 980,000 | 979,208 |
| 2,3 | Federal Home Loan Mortgage Corp. | 0.142% | 6/3/13 | 950,000 | 949,326 |
| 2,3 | Federal Home Loan Mortgage Corp. | 0.160% | 6/17/13 | 83,000 | 82,925 |
| 2,3 | Federal National Mortgage Assn. | 0.235% | 8/23/12 | 1,455,500 | 1,455,068 |
| 2,3 | Federal National Mortgage Assn. | 0.240% | 9/17/12 | 988,000 | 987,791 |
| 2,3 | Federal National Mortgage Assn. | 0.235% | 11/23/12 | 1,772,795 | 1,772,134 |
| 2,3 | Federal National Mortgage Assn. | 0.243% | 12/20/12 | 494,500 | 494,369 |
| 2,3 | Federal National Mortgage Assn. | 0.251% | 12/28/12 | 219,000 | 218,941 |
| 2,3 | Federal National Mortgage Assn. | 0.197% | 8/12/13 | 1,000,000 | 999,408 |
| 2 | Freddie Mac Discount Notes | 0.150% | 9/14/11 | 79,360 | 79,356 |
| 2 | Freddie Mac Discount Notes | 0.070% | 9/30/11 | 41,762 | 41,760 |
| 2 | Freddie Mac Discount Notes | 0.120% | 10/5/11 | 27,000 | 26,997 |
| 2 | Freddie Mac Discount Notes | 0.050% | 10/6/11 | 50,100 | 50,098 |
| 2 | Freddie Mac Discount Notes | 0.040% | 10/12/11 | 150,000 | 149,993 |
| 2 | Freddie Mac Discount Notes | 0.130%–0.160% | 10/17/11 | 182,050 | 182,014 |
| 2 | Freddie Mac Discount Notes | 0.075%–0.170% | 10/24/11 | 539,300 | 539,184 |
| 2 | Freddie Mac Discount Notes | 0.170% | 10/31/11 | 489,584 | 489,445 |
| 2 | Freddie Mac Discount Notes | 0.160% | 11/1/11 | 30,725 | 30,717 |
| 2 | Freddie Mac Discount Notes | 0.080% | 11/2/11 | 62,300 | 62,291 |
| 2 | Freddie Mac Discount Notes | 0.070%–0.080% | 11/7/11 | 458,000 | 457,937 |
| 2 | Freddie Mac Discount Notes | 0.080%–0.150% | 11/9/11 | 331,500 | 331,439 |
| 2 | Freddie Mac Discount Notes | 0.120%–0.150% | 11/14/11 | 174,529 | 174,484 |
| | United States Treasury Bill | 0.170% | 9/1/11 | 253,120 | 253,120 |
| | United States Treasury Bill | 0.155% | 9/8/11 | 1,000,000 | 999,970 |
| | United States Treasury Bill | 0.135% | 9/15/11 | 600,000 | 599,969 |
| | United States Treasury Bill | 0.150% | 9/22/11 | 1,500,000 | 1,499,869 |
| | United States Treasury Bill | 0.170% | 9/29/11 | 1,500,000 | 1,499,802 |
| | United States Treasury Bill | 0.110% | 10/20/11 | 924,000 | 923,862 |
| | United States Treasury Bill | 0.115% | 10/27/11 | 1,000,000 | 999,821 |
| | United States Treasury Bill | 0.100%–0.115% | 11/3/11 | 3,347,671 | 3,347,006 |
| | United States Treasury Bill | 0.100% | 11/25/11 | 1,345,000 | 1,344,682 |
| | United States Treasury Bill | 0.015%–0.115% | 12/1/11 | 2,000,000 | 1,999,671 |
| | United States Treasury Bill | 0.105% | 12/8/11 | 1,000,000 | 999,714 |
| | United States Treasury Bill | 0.105% | 12/15/11 | 1,750,000 | 1,749,464 |
| | United States Treasury Bill | 0.100% | 12/22/11 | 1,250,000 | 1,249,611 |
| | United States Treasury Bill | 0.095%–0.106% | 12/29/11 | 2,150,000 | 2,149,288 |
| | United States Treasury Bill | 0.080% | 1/5/12 | 1,752,000 | 1,751,509 |
| | United States Treasury Bill | 0.100% | 1/26/12 | 1,500,000 | 1,499,388 |
| | United States Treasury Bill | 0.080% | 2/16/12 | 500,000 | 499,813 |
| Total U.S. Government and Agency Obligations (Cost $58,000,555) | | | 58,000,555 |
| Commercial Paper (20.3%) | | | | |
| Finance—Auto (1.5%) | | | | |
| | American Honda Finance Corp. | 0.150%–0.180% | 9/21/11 | 54,500 | 54,495 |
| | American Honda Finance Corp. | 0.170%–0.180% | 10/4/11 | 121,785 | 121,765 |
| | American Honda Finance Corp. | 0.170%–0.180% | 10/5/11 | 140,000 | 139,977 |
| | American Honda Finance Corp. | 0.190% | 10/18/11 | 27,500 | 27,493 |
| | American Honda Finance Corp. | 0.190% | 10/19/11 | 93,000 | 92,976 |
| | American Honda Finance Corp. | 0.190% | 10/20/11 | 124,000 | 123,968 |
| | American Honda Finance Corp. | 0.180% | 10/21/11 | 49,500 | 49,488 |
| | American Honda Finance Corp. | 0.180% | 10/24/11 | 28,000 | 27,993 |
13
| | | | |
| Prime Money Market Fund | | | | |
| |
| |
| |
| | | | Face | Market |
| | | Maturity | Amount | Value |
| | Yield1 | Date | ($000) | ($000) |
| American Honda Finance Corp. | 0.200% | 11/3/11 | 39,500 | 39,486 |
| American Honda Finance Corp. | 0.190%–0.220% | 11/14/11 | 117,100 | 117,051 |
| Toyota Motor Credit Corp. | 0.200% | 10/4/11 | 26,000 | 25,995 |
| Toyota Motor Credit Corp. | 0.280% | 11/10/11 | 12,750 | 12,743 |
| Toyota Motor Credit Corp. | 0.280% | 11/16/11 | 37,000 | 36,978 |
| Toyota Motor Credit Corp. | 0.270%–0.280% | 11/18/11 | 136,000 | 135,918 |
| Toyota Motor Credit Corp. | 0.280% | 11/21/11 | 99,000 | 98,938 |
| Toyota Motor Credit Corp. | 0.280% | 11/28/11 | 99,000 | 98,932 |
| Toyota Motor Credit Corp. | 0.280% | 11/29/11 | 109,000 | 108,925 |
| Toyota Motor Credit Corp. | 0.280% | 11/30/11 | 100,000 | 99,930 |
| Toyota Motor Credit Corp. | 0.341% | 1/19/12 | 116,000 | 115,847 |
| Toyota Motor Credit Corp. | 0.290% | 1/20/12 | 53,000 | 52,940 |
| Toyota Motor Credit Corp. | 0.401% | 2/22/12 | 38,000 | 37,926 |
| Toyota Motor Credit Corp. | 0.401% | 2/24/12 | 111,000 | 110,783 |
| | | | | 1,730,547 |
| Finance—Other (7.2%) | | | | |
| 4 Falcon Asset Securitization Co. LLC | 0.170% | 9/16/11 | 59,000 | 58,996 |
| 4 Falcon Asset Securitization Co. LLC | 0.170% | 9/20/11 | 60,000 | 59,995 |
| 4 Falcon Asset Securitization Co. LLC | 0.170% | 9/26/11 | 160,900 | 160,881 |
| General Electric Capital Corp. | 0.190% | 9/21/11 | 100,000 | 99,989 |
| General Electric Capital Corp. | 0.190% | 9/26/11 | 396,000 | 395,948 |
| General Electric Capital Corp. | 0.190% | 9/28/11 | 565,000 | 564,920 |
| General Electric Capital Corp. | 0.160% | 10/11/11 | 197,000 | 196,965 |
| General Electric Capital Corp. | 0.190% | 11/18/11 | 550,000 | 549,774 |
| General Electric Capital Corp. | 0.250% | 12/20/11 | 250,000 | 249,809 |
| General Electric Capital Corp. | 0.250% | 12/21/11 | 250,000 | 249,807 |
| General Electric Capital Services Inc. | 0.200% | 10/3/11 | 168,000 | 167,970 |
| General Electric Capital Services Inc. | 0.170% | 10/5/11 | 42,200 | 42,193 |
| General Electric Capital Services Inc. | 0.200% | 10/7/11 | 200,000 | 199,960 |
| General Electric Capital Services Inc. | 0.160% | 11/3/11 | 124,000 | 123,965 |
| 4 Govco LLC | 0.200% | 9/7/11 | 117,000 | 116,996 |
| 4 Govco LLC | 0.190% | 9/12/11 | 49,000 | 48,997 |
| 4 Govco LLC | 0.190%–0.200% | 9/13/11 | 197,000 | 196,987 |
| 4 Govco LLC | 0.190% | 9/15/11 | 198,000 | 197,985 |
| 4 Govco LLC | 0.190% | 9/19/11 | 118,000 | 117,989 |
| 4 Govco LLC | 0.190% | 9/21/11 | 157,250 | 157,233 |
| 4 Govco LLC | 0.190% | 9/23/11 | 50,000 | 49,994 |
| 4 Govco LLC | 0.190% | 9/26/11 | 78,500 | 78,490 |
| 4 Govco LLC | 0.260%–0.270% | 11/4/11 | 137,250 | 137,185 |
| 4 Govco LLC | 0.260%–0.330% | 11/14/11 | 213,600 | 213,481 |
| 4 Govco LLC | 0.330% | 11/15/11 | 109,250 | 109,175 |
| 4 Govco LLC | 0.335% | 11/22/11 | 92,000 | 91,930 |
| 4 Govco LLC | 0.335%–0.340% | 11/28/11 | 373,000 | 372,692 |
| 4 Jupiter Securitization Co. LLC | 0.170% | 9/8/11 | 39,000 | 38,999 |
| 4 Jupiter Securitization Co. LLC | 0.170% | 9/16/11 | 59,000 | 58,996 |
| 4 Jupiter Securitization Co. LLC | 0.170% | 9/19/11 | 54,000 | 53,995 |
| 4 Jupiter Securitization Co. LLC | 0.170% | 9/20/11 | 80,000 | 79,993 |
| 4 Jupiter Securitization Co. LLC | 0.170% | 9/26/11 | 39,000 | 38,995 |
| 4 Jupiter Securitization Co. LLC | 0.170% | 10/3/11 | 59,000 | 58,991 |
| 4 Old Line Funding LLC | 0.180% | 9/6/11 | 398,500 | 398,490 |
| 4 Old Line Funding LLC | 0.180% | 9/7/11 | 29,000 | 28,999 |
| 4 Old Line Funding LLC | 0.170% | 9/8/11 | 99,000 | 98,997 |
| 4 Old Line Funding LLC | 0.180% | 9/9/11 | 43,000 | 42,998 |
| 4 Old Line Funding LLC | 0.170% | 9/12/11 | 191,017 | 191,007 |
| 4 Old Line Funding LLC | 0.170% | 9/19/11 | 30,000 | 29,997 |
14
| | | | |
| Prime Money Market Fund | | | | |
| |
| |
| |
| | | | Face | Market |
| | | Maturity | Amount | Value |
| | Yield1 | Date | ($000) | ($000) |
| 4 Old Line Funding LLC | 0.170% | 9/20/11 | 160,000 | 159,986 |
| 4 Old Line Funding LLC | 0.170% | 10/3/11 | 39,000 | 38,994 |
| 4 Old Line Funding LLC | 0.170% | 10/4/11 | 82,500 | 82,487 |
| 4 Old Line Funding LLC | 0.170% | 10/6/11 | 55,308 | 55,299 |
| 4 Straight-A Funding LLC | 0.160% | 9/26/11 | 15,000 | 14,998 |
| 4 Straight-A Funding LLC | 0.160% | 9/26/11 | 98,000 | 97,989 |
| 4 Straight-A Funding LLC | 0.160% | 9/26/11 | 17,431 | 17,429 |
| 4 Straight-A Funding LLC | 0.160% | 9/26/11 | 70,887 | 70,879 |
| 4 Straight-A Funding LLC | 0.160% | 10/3/11 | 127,000 | 126,982 |
| 4 Straight-A Funding LLC | 0.160% | 10/4/11 | 40,000 | 39,994 |
| 4 Straight-A Funding LLC | 0.160% | 10/5/11 | 108,000 | 107,984 |
| 4 Straight-A Funding LLC | 0.160% | 10/11/11 | 50,000 | 49,991 |
| 4 Straight-A Funding LLC | 0.160% | 10/11/11 | 17,645 | 17,642 |
| 4 Straight-A Funding LLC | 0.160% | 10/11/11 | 85,000 | 84,985 |
| 4 Straight-A Funding LLC | 0.160% | 10/20/11 | 100,112 | 100,090 |
| 4 Straight-A Funding LLC | 0.190% | 11/7/11 | 100,000 | 99,965 |
| 4 Straight-A Funding LLC | 0.190% | 11/14/11 | 197,000 | 196,923 |
| 4 Straight-A Funding LLC | 0.190% | 11/14/11 | 260,000 | 259,899 |
| 4 Straight-A Funding LLC | 0.190% | 11/14/11 | 154,721 | 154,661 |
| 4 Straight-A Funding LLC | 0.190% | 11/15/11 | 172,554 | 172,486 |
| 4 Straight-A Funding LLC | 0.190% | 11/16/11 | 94,007 | 93,969 |
| | | | | 8,174,395 |
| Foreign Banks (5.9%) | | | | |
| 4 Australia & New Zealand Banking Group, Ltd. | 0.311% | 10/3/11 | 297,000 | 296,918 |
| 4 Australia & New Zealand Banking Group, Ltd. | 0.280% | 10/6/11 | 150,000 | 149,959 |
| 4 Australia & New Zealand Banking Group, Ltd. | 0.250% | 11/8/11 | 96,105 | 96,060 |
| 4 Australia & New Zealand Banking Group, Ltd. | 0.250% | 11/9/11 | 120,000 | 119,943 |
| 4 Australia & New Zealand Banking Group, Ltd. | 0.230% | 12/2/11 | 183,000 | 182,892 |
| 4 Australia & New Zealand Banking Group, Ltd. | 0.351% | 2/16/12 | 247,000 | 246,597 |
| 4 Commonwealth Bank of Australia | 0.180% | 9/7/11 | 456,000 | 455,986 |
| 4 Commonwealth Bank of Australia | 0.331% | 9/14/11 | 500,000 | 499,940 |
| 4 Commonwealth Bank of Australia | 0.180% | 10/12/11 | 250,000 | 249,949 |
| 4 Commonwealth Bank of Australia | 0.265% | 11/21/11 | 450,000 | 449,732 |
| 4 Commonwealth Bank of Australia | 0.341% | 1/30/12 | 200,000 | 199,715 |
| 4 Commonwealth Bank of Australia | 0.346%–0.401% | 2/13/12 | 493,000 | 492,197 |
| Lloyds TSB Bank PLC | 0.218% | 9/7/11 | 440,000 | 439,984 |
| Rabobank USA Financial Corp. | 0.260% | 11/4/11 | 18,975 | 18,966 |
| 4 Westpac Banking Corp. | 0.190% | 9/6/11 | 114,100 | 114,097 |
| 4 Westpac Banking Corp. | 0.311% | 10/6/11 | 170,000 | 169,949 |
| 4 Westpac Banking Corp. | 0.290% | 10/21/11 | 517,000 | 516,792 |
| 4 Westpac Banking Corp. | 0.280% | 1/12/12 | 500,000 | 499,483 |
| 4 Westpac Banking Corp. | 0.351% | 1/30/12 | 47,450 | 47,380 |
| 4 Westpac Banking Corp. | 0.361% | 2/3/12 | 169,370 | 169,107 |
| 4 Westpac Banking Corp. | 0.351%–0.361% | 2/7/12 | 831,000 | 829,701 |
| 4 Westpac Banking Corp. | 0.371% | 2/16/12 | 499,000 | 498,138 |
| | | | | 6,743,485 |
| Foreign Governments (0.1%) | | | | |
| Banque et Caisse d’Epargne de L’Etat | 0.341% | 9/20/11 | 76,000 | 75,986 |
| Banque et Caisse d’Epargne de L’Etat | 0.260% | 12/5/11 | 75,000 | 74,949 |
| | | | | 150,935 |
| Foreign Industrial (2.5%) | | | | |
| 4 Nestle Capital Corp. | 0.200% | 9/1/11 | 365,000 | 365,000 |
| 4 Nestle Capital Corp. | 0.200% | 9/6/11 | 29,000 | 28,999 |
| 4 Nestle Capital Corp. | 0.120% | 10/11/11 | 400,375 | 400,321 |
15
| | | | |
| Prime Money Market Fund | | | | |
| |
| |
| |
| | | | Face | Market |
| | | Maturity | Amount | Value |
| | Yield1 | Date | ($000) | ($000) |
| 4 Nestle Capital Corp. | 0.150% | 11/10/11 | 106,000 | 105,969 |
| 4 Nestle Capital Corp. | 0.230% | 1/3/12 | 495,000 | 494,608 |
| Nestle Finance International Ltd. | 0.140% | 9/26/11 | 114,500 | 114,489 |
| Nestle Finance International Ltd. | 0.150% | 11/8/11 | 74,200 | 74,179 |
| Nestle Finance International Ltd. | 0.150% | 11/21/11 | 65,000 | 64,978 |
| Nestle Finance International Ltd. | 0.130% | 11/22/11 | 44,504 | 44,491 |
| Nestle Finance International Ltd. | 0.130% | 11/29/11 | 60,100 | 60,080 |
| Nestle Finance International Ltd. | 0.215% | 12/19/11 | 198,000 | 197,871 |
| 4 Novartis Finance Corp. | 0.290% | 9/12/11 | 36,774 | 36,771 |
| 4 Novartis Finance Corp. | 0.210%–0.250% | 10/11/11 | 31,650 | 31,642 |
| 4 Novartis Finance Corp. | 0.220% | 10/12/11 | 49,500 | 49,487 |
| 4 Novartis Securities Investment Ltd. | 0.140% | 9/9/11 | 74,400 | 74,398 |
| 4 Novartis Securities Investment Ltd. | 0.100% | 9/13/11 | 37,250 | 37,249 |
| 4 Novartis Securities Investment Ltd. | 0.180% | 10/11/11 | 46,000 | 45,991 |
| 4 Novartis Securities Investment Ltd. | 0.190% | 11/14/11 | 34,000 | 33,987 |
| 4 Novartis Securities Investment Ltd. | 0.190% | 11/18/11 | 61,000 | 60,975 |
| 4 Sanofi | 0.140% | 9/16/11 | 171,600 | 171,590 |
| 4 Siemens Capital Co. LLC | 0.100% | 9/19/11 | 19,230 | 19,229 |
| 4 Total Capital Canada, Ltd. | 0.311% | 9/16/11 | 40,500 | 40,495 |
| 4 Total Capital Canada, Ltd. | 0.080% | 9/23/11 | 168,100 | 168,092 |
| 4 Total Capital Canada, Ltd. | 0.195% | 2/29/12 | 99,000 | 98,903 |
| | | | | 2,819,794 |
| Industrial (3.1%) | | | | |
| 4 Abbott Laboratories | 0.090% | 9/19/11 | 49,250 | 49,248 |
| 4 Abbott Laboratories | 0.090% | 9/26/11 | 63,000 | 62,996 |
| General Electric Co. | 0.120% | 9/12/11 | 148,000 | 147,994 |
| 4 Johnson & Johnson | 0.160% | 2/28/12 | 50,000 | 49,960 |
| 4 Merck & Co Inc. | 0.110% | 9/7/11 | 73,800 | 73,799 |
| 4 PepsiCo Inc. | 0.080% | 9/6/11 | 27,500 | 27,500 |
| 4 PepsiCo Inc. | 0.080% | 9/12/11 | 118,740 | 118,737 |
| 4 PepsiCo Inc. | 0.100% | 10/3/11 | 49,500 | 49,496 |
| 4 Procter & Gamble Co. | 0.080% | 9/19/11 | 454,000 | 453,982 |
| 4 Procter & Gamble Co. | 0.100% | 10/5/11 | 7,750 | 7,749 |
| 4 Procter & Gamble Co. | 0.100% | 10/7/11 | 78,750 | 78,742 |
| 4 Procter & Gamble Co. | 0.120% | 10/12/11 | 78,000 | 77,989 |
| 4 Procter & Gamble Co. | 0.100%–0.110% | 10/14/11 | 90,995 | 90,984 |
| 4 Procter & Gamble Co. | 0.110% | 10/17/11 | 384,455 | 384,401 |
| 4 Texas Instruments Inc. | 0.120% | 10/7/11 | 117,000 | 116,986 |
| 4 The Coca-Cola Co. | 0.150% | 9/8/11 | 204,750 | 204,744 |
| 4 The Coca-Cola Co. | 0.150% | 9/22/11 | 141,500 | 141,488 |
| 4 The Coca-Cola Co. | 0.150% | 10/3/11 | 78,000 | 77,990 |
| 4 The Coca-Cola Co. | 0.130%–0.150% | 10/4/11 | 176,000 | 175,977 |
| 4 The Coca-Cola Co. | 0.120% | 10/12/11 | 72,225 | 72,215 |
| 4 The Coca-Cola Co. | 0.120% | 10/13/11 | 39,320 | 39,314 |
| 4 The Coca-Cola Co. | 0.150% | 11/1/11 | 98,950 | 98,925 |
| 4 The Coca-Cola Co. | 0.150% | 11/7/11 | 53,500 | 53,485 |
| 4 The Coca-Cola Co. | 0.150% | 11/8/11 | 53,000 | 52,985 |
| 4 The Coca-Cola Co. | 0.130% | 11/23/11 | 160,440 | 160,392 |
| 4 Wal-Mart Stores, Inc. | 0.190% | 9/13/11 | 265,000 | 264,983 |
| 4 Wal-Mart Stores, Inc. | 0.190% | 9/15/11 | 471,000 | 470,965 |
| | | | | 3,604,026 |
| Total Commercial Paper (Cost $23,223,182) | | | | 23,223,182 |
16
| | | | |
| Prime Money Market Fund | | | | |
| |
| |
| |
| | | | Face | Market |
| | | Maturity | Amount | Value |
| | Yield1 | Date | ($000) | ($000) |
| Certificates of Deposit (25.0%) | | | | |
| Domestic Banks (0.9%) | | | | |
| Branch Banking & Trust Co. | 0.150% | 9/19/11 | 160,000 | 160,000 |
| Branch Banking & Trust Co. | 0.150% | 9/20/11 | 60,000 | 60,000 |
| Branch Banking & Trust Co. | 0.150% | 9/22/11 | 175,000 | 175,000 |
| Branch Banking & Trust Co. | 0.160% | 9/22/11 | 275,000 | 275,000 |
| Branch Banking & Trust Co. | 0.170% | 10/3/11 | 109,000 | 109,000 |
| Branch Banking & Trust Co. | 0.210% | 10/5/11 | 300,000 | 300,000 |
| | | | | 1,079,000 |
| Eurodollar Certificates of Deposit (9.2%) | | | | |
| Australia & New Zealand Banking Group, Ltd. | 0.320% | 10/5/11 | 495,000 | 495,000 |
| Australia & New Zealand Banking Group, Ltd. | 0.320% | 10/6/11 | 496,000 | 496,000 |
| Australia & New Zealand Banking Group, Ltd. | 0.310% | 10/18/11 | 300,000 | 300,008 |
| Australia & New Zealand Banking Group, Ltd. | 0.290% | 10/21/11 | 250,000 | 250,000 |
| Australia & New Zealand Banking Group, Ltd. | 0.280% | 11/4/11 | 247,000 | 247,000 |
| Australia & New Zealand Banking Group, Ltd. | 0.350% | 2/9/12 | 250,000 | 250,000 |
| Bank of Nova Scotia | 0.240% | 11/28/11 | 68,000 | 68,000 |
| Commonwealth Bank of Australia | 0.230% | 12/12/11 | 200,000 | 200,000 |
| Commonwealth Bank of Australia | 0.380% | 2/23/12 | 700,000 | 700,000 |
| DNB NOR Bank ASA (London Branch) | 0.195% | 10/12/11 | 1,200,000 | 1,200,007 |
| HSBC Bank PLC | 0.340% | 9/19/11 | 500,000 | 500,000 |
| HSBC Bank PLC | 0.330% | 10/3/11 | 450,000 | 450,000 |
| HSBC Bank PLC | 0.320% | 10/6/11 | 495,000 | 495,000 |
| HSBC Bank PLC | 0.300% | 10/11/11 | 500,000 | 500,000 |
| HSBC Bank PLC | 0.310% | 10/17/11 | 493,000 | 493,000 |
| HSBC Bank PLC | 0.285% | 11/9/11 | 349,000 | 349,003 |
| National Australia Bank Ltd. | 0.330% | 9/2/11 | 245,000 | 245,000 |
| National Australia Bank Ltd. | 0.275% | 12/2/11 | 780,000 | 780,000 |
| National Australia Bank Ltd. | 0.320% | 12/29/11 | 240,000 | 240,000 |
| National Australia Bank Ltd. | 0.320% | 1/12/12 | 1,000,000 | 1,000,000 |
| National Australia Bank Ltd. | 0.400% | 2/16/12 | 750,000 | 750,000 |
| National Australia Bank Ltd. | 0.400% | 2/17/12 | 445,000 | 445,000 |
| | | | | 10,453,018 |
| Yankee Certificates of Deposit (14.9%) | | | | |
| Abbey National Treasury Services PLC | | | | |
| (US Branch) | 0.420% | 9/7/11 | 360,000 | 360,000 |
| Australia & New Zealand Banking Group, Ltd. | | | | |
| (New York Branch) | 0.250% | 11/17/11 | 99,000 | 99,000 |
| Australia & New Zealand Banking Group, Ltd. | | | | |
| (New York Branch) | 0.220% | 12/13/11 | 35,000 | 35,000 |
| Bank of Montreal (Chicago Branch) | 0.190% | 9/28/11 | 430,000 | 430,000 |
| Bank of Montreal (Chicago Branch) | 0.190% | 9/30/11 | 150,000 | 150,000 |
| Bank of Montreal (Chicago Branch) | 0.200% | 11/7/11 | 1,137,000 | 1,137,000 |
| Bank of Montreal (Chicago Branch) | 0.250% | 11/15/11 | 397,000 | 397,000 |
| Bank of Montreal (Chicago Branch) | 0.250% | 11/22/11 | 180,000 | 180,000 |
| Bank of Nova Scotia (Houston Branch) | 0.190% | 9/6/11 | 14,000 | 14,000 |
| Bank of Nova Scotia (Houston Branch) | 0.180% | 9/9/11 | 315,000 | 315,000 |
| Bank of Nova Scotia (Houston Branch) | 0.240% | 11/7/11 | 400,000 | 400,000 |
| Bank of Nova Scotia (Houston Branch) | 0.250% | 11/8/11 | 1,000,000 | 1,000,000 |
| Bank of Nova Scotia (Houston Branch) | 0.235% | 11/18/11 | 600,000 | 599,994 |
| Bank of Nova Scotia (Houston Branch) | 0.260% | 11/22/11 | 420,000 | 420,000 |
| Bank of Nova Scotia (Houston Branch) | 0.250% | 12/16/11 | 150,000 | 150,000 |
| Bank of Nova Scotia (Houston Branch) | 0.250% | 12/20/11 | 280,000 | 280,000 |
17
| | | | |
| Prime Money Market Fund | | | | |
| |
| |
| |
| | | | Face | Market |
| | | Maturity | Amount | Value |
| | Yield1 | Date | ($000) | ($000) |
| Credit Suisse (New York Branch) | 0.260% | 10/26/11 | 200,000 | 200,000 |
| DNB NOR Bank ASA (New York Branch) | 0.300% | 11/28/11 | 500,000 | 500,000 |
| Lloyds TSB Bank PLC (New York Branch) | 0.300% | 11/28/11 | 330,000 | 330,000 |
| Lloyds TSB Bank PLC (New York Branch) | 0.300% | 11/30/11 | 500,000 | 500,000 |
| Nordea Bank Finland PLC (New York Branch) | 0.290% | 11/2/11 | 300,000 | 300,000 |
| Nordea Bank Finland PLC (New York Branch) | 0.310% | 11/30/11 | 500,000 | 500,000 |
| Nordea Bank Finland PLC (New York Branch) | 0.250% | 12/6/11 | 300,000 | 300,000 |
| Nordea Bank Finland PLC (New York Branch) | 0.240% | 12/9/11 | 44,000 | 44,000 |
| Nordea Bank Finland PLC (New York Branch) | 0.280% | 1/11/12 | 640,000 | 640,000 |
| Rabobank Nederland NV (New York Branch) | 0.350% | 9/1/11 | 645,000 | 645,000 |
| Rabobank Nederland NV (New York Branch) | 0.350% | 9/16/11 | 420,000 | 420,000 |
| Rabobank Nederland NV (New York Branch) | 0.340% | 10/6/11 | 175,000 | 175,000 |
| Rabobank Nederland NV (New York Branch) | 0.270% | 11/9/11 | 800,000 | 800,000 |
| Royal Bank of Canada (New York Branch) | 0.320% | 9/14/11 | 495,000 | 495,000 |
| Royal Bank of Canada (New York Branch) | 0.280% | 10/11/11 | 300,000 | 300,000 |
| Royal Bank of Canada (New York Branch) | 0.250% | 12/20/11 | 600,000 | 600,000 |
| Royal Bank of Canada (New York Branch) | 0.350% | 2/22/12 | 492,000 | 492,000 |
| Royal Bank of Scotland PLC (Connecticut Branch) | 0.240% | 10/3/11 | 200,000 | 200,000 |
| Svenska Handelsbanken (New York Branch) | 0.195% | 9/7/11 | 300,000 | 300,000 |
| Svenska Handelsbanken (New York Branch) | 0.300% | 11/1/11 | 250,000 | 250,000 |
| Svenska Handelsbanken (New York Branch) | 0.300% | 11/3/11 | 270,000 | 270,000 |
| Svenska Handelsbanken (New York Branch) | 0.310% | 11/30/11 | 500,000 | 500,000 |
| Toronto Dominion Bank (New York Branch) | 0.170% | 9/1/11 | 297,500 | 297,500 |
| Toronto Dominion Bank (New York Branch) | 0.330% | 9/6/11 | 197,000 | 197,000 |
| Toronto Dominion Bank (New York Branch) | 0.330% | 9/6/11 | 178,000 | 178,000 |
| Toronto Dominion Bank (New York Branch) | 0.330% | 9/9/11 | 75,000 | 75,000 |
| Toronto Dominion Bank (New York Branch) | 0.280% | 10/20/11 | 247,000 | 247,000 |
| Toronto Dominion Bank (New York Branch) | 0.240% | 12/1/11 | 297,500 | 297,500 |
| Toronto Dominion Bank (New York Branch) | 0.350% | 2/15/12 | 297,000 | 297,000 |
| Westpac Banking Corp. (New York Branch) | 0.230% | 12/7/11 | 200,000 | 200,000 |
| Westpac Banking Corp. (New York Branch) | 0.360% | 2/9/12 | 496,000 | 496,000 |
| | | | | 17,012,994 |
| Total Certificates of Deposit (Cost $28,545,012) | | | | 28,545,012 |
| Repurchase Agreements (0.2%) | | | | |
| Barclays Capital Inc. | | | | |
| (Dated 8/31/11, Repurchase Value | | | | |
| $10,000,000, collateralized by U.S. | | | | |
| Treasury Note/Bond 4.500%, 8/15/39) | 0.040% | 9/1/11 | 10,000 | 10,000 |
| Credit Suisse Securities (USA) LLC | | | | |
| (Dated 8/31/11, Repurchase Value | | | | |
| $50,000,000, collateralized by U.S. | | | | |
| Treasury Note/Bond 3.625%, 8/15/19) | 0.050% | 9/1/11 | 50,000 | 50,000 |
| RBC Capital Markets LLC | | | | |
| (Dated 8/31/11, Repurchase Value | | | | |
| $10,000,000, collateralized by U.S. | | | | |
| Treasury Note/Bond 0.500%, 8/15/14) | 0.050% | 9/1/11 | 10,000 | 10,000 |
| RBC Capital Markets LLC | | | | |
| (Dated 8/31/11, Repurchase Value | | | | |
| $71,640,000, collateralized by U.S. | | | | |
| Treasury Note/Bond 0.500%, 8/15/14) | 0.100% | 9/1/11 | 71,640 | 71,640 |
18
| | | | |
| Prime Money Market Fund | | | | |
| |
| |
| |
| | | | Face | Market |
| | | Maturity | Amount | Value |
| | Yield1 | Date | ($000) | ($000) |
| RBS Securities, Inc. | | | | |
| (Dated 8/31/11, Repurchase Value | | | | |
| $30,000,000, collateralized by U.S. | | | | |
| Treasury Note/Bond 0.625%, 6/30/12) | 0.060% | 9/1/11 | 30,000 | 30,000 |
| Total Repurchase Agreements (Cost $171,640) | | | | 171,640 |
| |
| | | | Shares | |
| Money Market Fund (1.3%) | | | | |
| 5 Vanguard Municipal Cash Management Fund | | | | |
| (Cost $1,460,019) | 0.170% | | 1,460,019,065 | 1,460,019 |
| |
| | | | Face | |
| | | | Amount | |
| | | | ($000) | |
| Tax-Exempt Municipal Bonds (3.1%) | | | | |
| Akron OH Bath & Copley Joint Township | | | | |
| Hospital District Revenue (Akron General | | | | |
| Health System) VRDO | 0.160% | 9/7/11 | 19,500 | 19,500 |
| Arizona Health Facilities Authority Revenue | | | | |
| (Banner Health) VRDO | 0.170% | 9/7/11 | 35,400 | 35,400 |
| Arizona Health Facilities Authority Revenue | | | | |
| (Banner Health) VRDO | 0.170% | 9/7/11 | 39,315 | 39,315 |
| Ascension Parish LA Industrial Development | | | | |
| Board Revenue (IMTT-Geismar Project) VRDO | 0.170% | 9/7/11 | 79,000 | 79,000 |
| Bi-State Development Agency of the | | | | |
| Missouri-Illinois Metropolitan District VRDO | 0.210% | 9/7/11 | 29,800 | 29,800 |
| Birmingham AL Public Educational Building | | | | |
| Student Housing Revenue (University of | | | | |
| Alabama at Birmingham Project) VRDO | 0.210% | 9/7/11 | 16,575 | 16,575 |
| Board of Regents of the University of Texas | | | | |
| System Revenue Financing System Revenue | | | | |
| VRDO | 0.090% | 9/7/11 | 17,425 | 17,425 |
| Board of Regents of the University of Texas | | | | |
| System Revenue Financing System Revenue | | | | |
| VRDO | 0.150% | 9/7/11 | 58,300 | 58,300 |
| Board of Regents of the University of Texas | | | | |
| System Revenue Financing System Revenue | | | | |
| VRDO | 0.150% | 9/7/11 | 95,000 | 95,000 |
| Boone County KY Pollution Control Revenue | | | | |
| (Duke Energy Kentucky Inc. Project) VRDO | 0.140% | 9/7/11 | 19,000 | 19,000 |
| California Housing Finance Agency | | | | |
| Home Mortgage Revenue VRDO | 0.150% | 9/7/11 | 24,520 | 24,520 |
| California Housing Finance Agency | | | | |
| Home Mortgage Revenue VRDO | 0.150% | 9/7/11 | 10,300 | 10,300 |
| California Statewide Communities Development | | | | |
| Authority Revenue (Redlands Community | | | | |
| Hospital) VRDO | 0.150% | 9/7/11 | 22,100 | 22,100 |
| Cleveland-Cuyahoga County OH Port Authority | | | | |
| Revenue (SPC Buildings 1 & 3 LLC) VRDO | 0.170% | 9/7/11 | 24,000 | 24,000 |
| Columbus OH Regional Airport Authority Airport | | | | |
| Revenue (Oasbo Expanded Asset Program) | | | | |
| VRDO | 0.210% | 9/7/11 | 19,200 | 19,200 |
19
| | | | |
| Prime Money Market Fund | | | | |
| |
| |
| |
| | | | Face | Market |
| | | Maturity | Amount | Value |
| | Yield1 | Date | ($000) | ($000) |
| Connecticut Health & Educational Facilities | | | | |
| Authority Revenue (Yale University) VRDO | 0.110% | 9/7/11 | 35,000 | 35,000 |
| Curators of the University of Missouri System | | | | |
| Facilities Revenue VRDO | 0.170% | 9/7/11 | 62,150 | 62,150 |
| Delaware River Port Authority Pennsylvania & | | | | |
| New Jersey Revenue VRDO | 0.180% | 9/7/11 | 76,100 | 76,100 |
| District of Columbia Revenue | | | | |
| (George Washington University) VRDO | 0.170% | 9/7/11 | 27,560 | 27,560 |
| District of Columbia Revenue | | | | |
| (Georgetown University) VRDO | 0.170% | 9/7/11 | 17,200 | 17,200 |
| District of Columbia Revenue | | | | |
| (Georgetown University) VRDO | 0.170% | 9/7/11 | 7,575 | 7,575 |
| District of Columbia Revenue | | | | |
| (Washington Drama Society) VRDO | 0.200% | 9/7/11 | 20,375 | 20,375 |
| Fairfax County VA Economic Development | | | | |
| Authority Resource Recovery Revenue | | | | |
| (Lorton Arts Foundation Project) VRDO | 0.190% | 9/7/11 | 10,600 | 10,600 |
| Harris County TX Cultural Education Facilities | | | | |
| Finance Corp. Hospital Revenue (Memorial | | | | |
| Hermann Healthcare System) VRDO | 0.170% | 9/7/11 | 42,000 | 42,000 |
| Harris County TX Cultural Education Facilities | | | | |
| Finance Corp. Medical Facilities Revenue | | | | |
| (Baylor College of Medicine) VRDO | 0.160% | 9/7/11 | 42,500 | 42,500 |
| Idaho Housing & Finance Association | | | | |
| Single Family Mortgage Revenue VRDO | 0.170% | 9/7/11 | 16,800 | 16,800 |
| Idaho Housing & Finance Association | | | | |
| Single Family Mortgage Revenue VRDO | 0.190% | 9/7/11 | 29,205 | 29,205 |
| Illinois Development Finance Authority Revenue | | | | |
| (Chicago Horticultural Society) VRDO | 0.190% | 9/7/11 | 16,300 | 16,300 |
| Illinois Finance Authority Pollution Control | | | | |
| Revenue (Commonwealth Edison Co. Project) | | | | |
| VRDO | 0.160% | 9/7/11 | 29,400 | 29,400 |
| Illinois Finance Authority Revenue | | | | |
| (Carle Foundation) VRDO | 0.150% | 9/7/11 | 31,905 | 31,905 |
| Illinois Finance Authority Revenue | | | | |
| (Carle Healthcare System) VRDO | 0.100% | 9/7/11 | 44,665 | 44,665 |
| Illinois Finance Authority Revenue | | | | |
| (Ingalls Health System) VRDO | 0.150% | 9/7/11 | 43,000 | 43,000 |
| Illinois Finance Authority Revenue | | | | |
| (Little Co. of Mary Hospital & | | | | |
| Health Care Centers) VRDO | 0.200% | 9/7/11 | 17,815 | 17,815 |
| Illinois Finance Authority Revenue | | | | |
| (Museum of Science & Industry) VRDO | 0.210% | 9/7/11 | 13,000 | 13,000 |
| Indiana Development Finance Authority | | | | |
| Educational Facilities Revenue (Indianapolis | | | | |
| Museum of Art Inc. Project) VRDO | 0.160% | 9/7/11 | 14,400 | 14,400 |
| Indiana Educational Facilities Authority Revenue | | | | |
| (Wabash College) VRDO | 0.200% | 9/7/11 | 23,940 | 23,940 |
| Indiana Finance Authority Health System Revenue | | | | |
| (Sisters of St. Francis Health Services Inc. | | | | |
| Obligated Group) VRDO | 0.200% | 9/7/11 | 22,445 | 22,445 |
| Indiana Finance Authority Revenue | | | | |
| (Lease Appropriation) VRDO | 0.180% | 9/7/11 | 15,075 | 15,075 |
| Jacksonville FL Capital Project Revenue VRDO | 0.260% | 9/7/11 | 26,400 | 26,400 |
20
| | | | |
| Prime Money Market Fund | | | �� | |
| |
| |
| |
| | | | Face | Market |
| | | Maturity | Amount | Value |
| | Yield1 | Date | ($000) | ($000) |
| Kentucky Economic Development Finance | | | | |
| Authority Hospital Revenue (Baptist Healthcare | | | | |
| System Obligated Group) VRDO | 0.120% | 9/7/11 | 25,035 | 25,035 |
| Kentucky Higher Education Student Loan Corp. | | | | |
| Student Loan Revenue VRDO | 0.200% | 9/7/11 | 33,235 | 33,235 |
| Knox County TN Health Educational & | | | | |
| Housing Facilities Board Hospital Facilities | | | | |
| (Covenant Healthcare) VRDO | 0.170% | 9/7/11 | 15,690 | 15,690 |
| Los Angeles CA Wastewater System Revenue | | | | |
| VRDO | 0.140% | 9/7/11 | 37,300 | 37,300 |
| Los Angeles CA Wastewater System Revenue | | | | |
| VRDO | 0.160% | 9/7/11 | 20,400 | 20,400 |
| Los Angeles CA Wastewater System Revenue | | | | |
| VRDO | 0.240% | 9/7/11 | 23,200 | 23,200 |
| Los Angeles CA Wastewater System Revenue | | | | |
| VRDO | 0.240% | 9/7/11 | 27,595 | 27,595 |
| Loudoun County VA Industrial Development | | | | |
| Authority Revenue (Howard Hughes Medical | | | | |
| Institute) VRDO | 0.120% | 9/7/11 | 49,365 | 49,365 |
| Loudoun County VA Industrial Development | | | | |
| Authority Revenue (Howard Hughes Medical | | | | |
| Institute) VRDO | 0.130% | 9/7/11 | 18,855 | 18,855 |
| Louisiana Public Facilities Authority Hospital | | | | |
| Revenue (Franciscan Missionaries) VRDO | 0.180% | 9/7/11 | 11,650 | 11,650 |
| Maine Health & Higher Educational Facilities | | | | |
| Authority Revenue (Bowdoin College) VRDO | 0.200% | 9/7/11 | 15,130 | 15,130 |
| Maryland Health & Higher Educational Facilities | | | | |
| Authority Revenue (Johns Hopkins University) | | | | |
| VRDO | 0.130% | 9/7/11 | 30,635 | 30,635 |
| Maryland Health & Higher Educational Facilities | | | | |
| Authority Revenue (University of Maryland | | | | |
| Medical System) VRDO | 0.170% | 9/7/11 | 30,160 | 30,160 |
| Massachusetts Health & Educational Facilities | | | | |
| Authority Revenue (Bentley College) VRDO | 0.150% | 9/7/11 | 21,900 | 21,900 |
| Massachusetts Health & Educational Facilities | | | | |
| Authority Revenue (Dana Farber Cancer | | | | |
| Institute) VRDO | 0.180% | 9/7/11 | 9,015 | 9,015 |
| Massachusetts Health & Educational Facilities | | | | |
| Authority Revenue (MIT) VRDO | 0.150% | 9/7/11 | 19,320 | 19,320 |
| Metropolitan Atlanta GA Rapid Transportation | | | | |
| Authority Georgia Sales Tax Revenue VRDO | 0.150% | 9/7/11 | 43,100 | 43,100 |
| Miami-Dade County FL Special Obligation | | | | |
| Revenue (Juvenile Courthouse Project) VRDO | 0.140% | 9/7/11 | 25,350 | 25,350 |
| Michigan Higher Education Facilities Authority | | | | |
| Revenue (Albion College) VRDO | 0.220% | 9/7/11 | 13,000 | 13,000 |
| Michigan Hospital Finance Authority Revenue | | | | |
| (Henry Ford Health System) VRDO | 0.160% | 9/7/11 | 32,925 | 32,925 |
| Middletown OH Hospital Facilities Revenue | | | | |
| (Atrium Medical Center) VRDO | 0.170% | 9/7/11 | 22,000 | 22,000 |
| Minneapolis & St. Paul MN Housing & | | | | |
| Redevelopment Authority Health Care System | | | | |
| Revenue (Allina Health System) VRDO | 0.150% | 9/7/11 | 15,000 | 15,000 |
| Missouri Health & Educational Facilities Authority | | | | |
| Health Facilities Revenue (BJC Health System) | | | | |
| VRDO | 0.170% | 9/7/11 | 18,000 | 18,000 |
21
| | | | |
| Prime Money Market Fund | | | | |
| |
| |
| |
| | | | Face | Market |
| | | Maturity | Amount | Value |
| | Yield1 | Date | ($000) | ($000) |
| Missouri Health & Educational Facilities Authority | | | | |
| Health Facilities Revenue (SSM Health Care) | | | | |
| VRDO | 0.130% | 9/7/11 | 83,775 | 83,775 |
| New Jersey Health Care Facilities Financing | | | | |
| Authority Revenue (AHS Hospital Corp.) VRDO | 0.210% | 9/7/11 | 19,130 | 19,130 |
| New Jersey Health Care Facilities Financing | | | | |
| Authority Revenue (Hospital Capital Asset | | | | |
| Pooled Program) VRDO | 0.180% | 9/7/11 | 19,600 | 19,600 |
| New Jersey Transportation Trust Fund Authority | | | | |
| Transportation System Revenue VRDO | 0.140% | 9/7/11 | 32,800 | 32,800 |
| New York City NY GO VRDO | 0.140% | 9/7/11 | 58,550 | 58,550 |
| New York City NY GO VRDO | 0.150% | 9/7/11 | 29,800 | 29,800 |
| New York City NY GO VRDO | 0.160% | 9/7/11 | 11,775 | 11,775 |
| New York City NY GO VRDO | 0.160% | 9/7/11 | 9,825 | 9,825 |
| New York City NY Housing Development Corp. | | | | |
| Multi-Family Rental Housing Revenue | | | | |
| (Carnegie Park) VRDO | 0.130% | 9/7/11 | 39,505 | 39,505 |
| New York City NY Housing Development Corp. | | | | |
| Multi-Family Rental Housing Revenue | | | | |
| (Monterey) VRDO | 0.130% | 9/7/11 | 21,980 | 21,980 |
| New York City NY Housing Development Corp. | | | | |
| Multi-Family Rental Housing Revenue | | | | |
| (One Columbus Place Development) VRDO | 0.150% | 9/7/11 | 8,100 | 8,100 |
| New York City NY Housing Development Corp. | | | | |
| Multi-Family Rental Housing Revenue | | | | |
| (West End Towers) VRDO | 0.150% | 9/7/11 | 31,300 | 31,300 |
| New York City NY Industrial Development | | | | |
| Agency Civic Facility Revenue (New York | | | | |
| Law School) VRDO | 0.180% | 9/7/11 | 14,885 | 14,885 |
| New York State Dormitory Authority Revenue | | | | |
| (Fordham University) VRDO | 0.190% | 9/7/11 | 30,805 | 30,805 |
| New York State Dormitory Authority Revenue | | | | |
| (Fordham University) VRDO | 0.190% | 9/7/11 | 30,645 | 30,645 |
| New York State Housing Finance Agency | | | | |
| Housing Revenue (10 Liberty Street) VRDO | 0.140% | 9/7/11 | 20,500 | 20,500 |
| New York State Housing Finance Agency | | | | |
| Housing Revenue (125 West 31st Street) VRDO | 0.170% | 9/7/11 | 42,300 | 42,300 |
| New York State Housing Finance Agency | | | | |
| Housing Revenue (20 River Terrace Housing) | | | | |
| VRDO | 0.170% | 9/7/11 | 17,300 | 17,300 |
| New York State Housing Finance Agency | | | | |
| Housing Revenue (320 West 38th Street) VRDO | 0.140% | 9/7/11 | 31,500 | 31,500 |
| New York State Housing Finance Agency | | | | |
| Housing Revenue (330 West 39th Street) VRDO | 0.190% | 9/7/11 | 26,100 | 26,100 |
| New York State Housing Finance Agency | | | | |
| Housing Revenue (70 Battery Place) VRDO | 0.150% | 9/7/11 | 12,800 | 12,800 |
| New York State Housing Finance Agency | | | | |
| Housing Revenue (Clinton Green - South) VRDO | 0.170% | 9/7/11 | 11,625 | 11,625 |
| New York State Housing Finance Agency | | | | |
| Housing Revenue (Clinton Green North) VRDO | 0.170% | 9/7/11 | 31,845 | 31,845 |
| New York State Housing Finance Agency | | | | |
| Housing Revenue (East 84th Street) VRDO | 0.160% | 9/7/11 | 24,500 | 24,500 |
| New York State Urban Development Corp. | | | | |
| Revenue (Service Contract) VRDO | 0.170% | 9/7/11 | 10,375 | 10,375 |
22
| | | | |
| Prime Money Market Fund | | | | |
| |
| |
| |
| | | | Face | Market |
| | | Maturity | Amount | Value |
| | Yield1 | Date | ($000) | ($000) |
| North Texas Higher Education Authority | | | | |
| Student Loan Revenue VRDO | 0.230% | 9/7/11 | 29,900 | 29,900 |
| North Texas Tollway Authority System Revenue | | | | |
| VRDO | 0.170% | 9/7/11 | 35,100 | 35,100 |
| Oakland University of Michigan Revenue VRDO | 0.170% | 9/7/11 | 8,900 | 8,900 |
| Ohio Air Quality Development Authority Revenue | | | | |
| (Dayton Power & Light Co. Project) VRDO | 0.160% | 9/7/11 | 11,100 | 11,100 |
| Ohio GO VRDO | 0.130% | 9/7/11 | 23,515 | 23,515 |
| Ohio Higher Educational Facility Commission | | | | |
| Revenue (University Hospitals Health | | | | |
| System Inc.) VRDO | 0.160% | 9/7/11 | 25,000 | 25,000 |
| Ohio State University General Receipts Revenue | | | | |
| VRDO | 0.130% | 9/7/11 | 115,300 | 115,300 |
| Ohio State University General Receipts Revenue | | | | |
| VRDO | 0.140% | 9/7/11 | 29,525 | 29,525 |
| Pennsylvania Higher Educational Facilities | | | | |
| Authority Revenue (University of Pennsylvania | | | | |
| Health System) VRDO | 0.140% | 9/7/11 | 45,065 | 45,065 |
| Pittsburgh PA Water & Sewer Authority Revenue | | | | |
| VRDO | 0.310% | 9/7/11 | 57,850 | 57,850 |
| Salem OH Hospital Facilities Revenue | | | | |
| (Salem Community Hospital Project) VRDO | 0.170% | 9/7/11 | 13,400 | 13,400 |
| San Antonio TX Electric & Gas Systems Revenue | | | | |
| VRDO | 0.260% | 9/7/11 | 35,355 | 35,355 |
| Tarrant County TX Cultural Education Facilities | | | | |
| Finance Corp. Revenue (CHRISTUS Health) | | | | |
| VRDO | 0.170% | 9/7/11 | 18,400 | 18,400 |
| Texas Department of Housing & Community | | | | |
| Affairs Single Family Revenue VRDO | 0.170% | 9/7/11 | 28,900 | 28,900 |
| Texas Department of Housing & Community | | | | |
| Affairs Single Family Revenue VRDO | 0.170% | 9/7/11 | 42,400 | 42,400 |
| Texas Department of Housing & Community | | | | |
| Affairs Single Family Revenue VRDO | 0.200% | 9/7/11 | 23,035 | 23,035 |
| Texas Department of Housing & Community | | | | |
| Affairs Single Family Revenue VRDO | 0.220% | 9/7/11 | 34,620 | 34,620 |
| Texas Department of Housing & Community | | | | |
| Affairs Single Mortgage Revenue VRDO | 0.200% | 9/7/11 | 69,085 | 69,085 |
| Torrance CA Hospital Revenue (Torrance | | | | |
| Memorial Medical Center) VRDO | 0.150% | 9/7/11 | 19,600 | 19,600 |
| University of Alabama Birmingham Hospital | | | | |
| Revenue VRDO | 0.250% | 9/7/11 | 24,100 | 24,100 |
| University of South Florida Financing Corp. | | | | |
| COP VRDO | 0.180% | 9/7/11 | 40,700 | 40,700 |
| University of Texas Permanent University Fund | | | | |
| Revenue VRDO | 0.110% | 9/7/11 | 66,305 | 66,305 |
| University of Texas Permanent University Fund | | | | |
| Revenue VRDO | 0.140% | 9/7/11 | 152,100 | 152,100 |
| Utah Housing Corp. Single Family Mortgage | | | | |
| Revenue VRDO | 0.170% | 9/7/11 | 19,250 | 19,250 |
| Utah Housing Corp. Single Family Mortgage | | | | |
| Revenue VRDO | 0.170% | 9/7/11 | 15,500 | 15,500 |
| Virginia Small Business Financing Authority | | | | |
| Health Facilities Revenue (Bon Secours Health | | | | |
| System Inc.) VRDO | 0.180% | 9/7/11 | 7,200 | 7,200 |
23
| | | | | |
| Prime Money Market Fund | | | | |
| |
| |
| |
| | | | | Face | Market |
| | | | Maturity | Amount | Value |
| | | Yield1 | Date | ($000) | ($000) |
| | Warren County KY Revenue (Western Kentucky | | | | |
| | University Student Life Foundation Inc. Project) | | | | |
| | VRDO | 0.200% | 9/7/11 | 19,500 | 19,500 |
| 6 | Washington County PA Authority Revenue | | | | |
| | (Girard Estate Project) VRDO | 0.200% | 9/7/11 | 11,040 | 11,040 |
| | Washington Health Care Facilities Authority | | | | |
| | Revenue (Multi Care Health System) VRDO | 0.170% | 9/7/11 | 24,975 | 24,975 |
| | Washington Health Care Facilities Authority | | | | |
| | Revenue (Swedish Health Services) VRDO | 0.130% | 9/7/11 | 20,500 | 20,500 |
| | West Virginia Hospital Finance Authority Hospital | | | | |
| | Revenue (Charleston Area Medical Center Inc.) | | | | |
| | VRDO | 0.150% | 9/7/11 | 30,045 | 30,045 |
| | Wisconsin Health & Educational Facilities | | | | |
| | Authority Revenue (Aurora Health Care Inc.) | | | | |
| | VRDO | 0.160% | 9/7/11 | 31,200 | 31,200 |
| 6 | Los Angeles CA Department of Water & | | | | |
| | Power Revenue TOB VRDO | 0.270% | 9/7/11 | 13,000 | 13,000 |
| Total Tax-Exempt Municipal Bonds (Cost $3,565,490) | | | | 3,565,490 |
| Taxable Municipal Bonds (0.0%) | | | | |
| 6 | Massachusetts State Transportation Fund | | | | |
| | Revenue TOB VRDO | 0.270% | 9/7/11 | 13,100 | 13,100 |
| 6 | Seattle WA Municipal Light & Power Revenue | | | | |
| | TOB VRDO | 0.270% | 9/7/11 | 6,400 | 6,400 |
| Total Taxable Municipal Bonds (Cost $19,500) | | | | 19,500 |
| Total Investments (100.7%) (Cost $114,985,398) | | | | 114,985,398 |
| Other Assets and Liabilities (-0.7%) | | | | |
| Other Assets | | | | 458,172 |
| Liabilities | | | | (1,300,646) |
| | | | | | (842,474) |
| Net Assets (100%) | | | | 114,142,924 |
24
Prime Money Market Fund
| |
| At August 31, 2011, net assets consisted of: | |
| | Amount |
| | ($000) |
| Paid-in Capital | 114,134,618 |
| Undistributed Net Investment Income | — |
| Accumulated Net Realized Gains | 8,306 |
| Net Assets | 114,142,924 |
| |
| Investor Shares—Net Assets | |
| Applicable to 92,387,498,956 outstanding $.001 par value shares of | |
| beneficial interest (unlimited authorization) | 92,403,666 |
| Net Asset Value Per Share—Investor Shares | $1.00 |
| |
| Institutional Shares—Net Assets | |
| Applicable to 21,736,467,632 outstanding $.001 par value shares of | |
| beneficial interest (unlimited authorization) | 21,739,258 |
| Net Asset Value Per Share—Institutional Shares | $1.00 |
See Note A in Notes to Financial Statements.
1 Represents annualized yield at date of purchase for discount securities, and coupon for coupon-bearing securities.
2 The issuer operates under a congressional charter; its securities are not backed by the full faith and credit of the U.S. government.
3 Adjustable-rate security.
4 Security exempt from registration under Section 4(2) of the Securities Act of 1933. Such securities may be sold in transactions exempt from registration only to dealers in that program or other “accredited investors.” At August 31, 2011, the aggregate value of these securities was $17,337,368,000, representing 15.2% of net assets.
5 Affiliated money market fund available only to Vanguard funds and certain trusts and accounts managed by Vanguard. Rate shown is the 7-day yield.
6 Security exempt from registration under Rule 144A of the Securities Act of 1933. Such securities may be sold in transactions exempt from registration, normally to qualified institutional buyers. At August 31, 2011, the aggregate value of these securities was $43,540,000.
GO—General Obligation Bond.
TOB—Tender Option Bond.
VRDO—Variable Rate Demand Obligation.
See accompanying Notes, which are an integral part of the Financial Statements.
25
Prime Money Market Fund
Statement of Operations
| |
| | Year Ended |
| | August 31, 2011 |
| | ($000) |
| Investment Income | |
| Income | |
| Interest1 | 286,720 |
| Total Income | 286,720 |
| Expenses | |
| The Vanguard Group—Note B | |
| Investment Advisory Services | 5,208 |
| Management and Administrative—Investor Shares | 143,283 |
| Management and Administrative—Institutional Shares | 10,760 |
| Marketing and Distribution—Investor Shares | 28,095 |
| Marketing and Distribution—Institutional Shares | 6,317 |
| Custodian Fees | 1,586 |
| Auditing Fees | 28 |
| Shareholders’ Reports—Investor Shares | 683 |
| Shareholders’ Reports—Institutional Shares | 110 |
| Trustees’ Fees and Expenses | 137 |
| Total Expenses | 196,207 |
| Net Investment Income | 90,513 |
| Realized Net Gain (Loss) on Investment Securities Sold | 1,676 |
| Net Increase (Decrease) in Net Assets Resulting from Operations | 92,189 |
| 1 Interest income from an affiliated company of the fund was $2,577,000. |
See accompanying Notes, which are an integral part of the Financial Statements.
26
Prime Money Market Fund
Statement of Changes in Net Assets
| | |
| | Year Ended August 31, |
| | 2011 | 2010 |
| | ($000) | ($000) |
| Increase (Decrease) in Net Assets | | |
| Operations | | |
| Net Investment Income | 90,513 | 118,919 |
| Realized Net Gain (Loss) | 1,676 | 1,651 |
| Net Increase (Decrease) in Net Assets Resulting from Operations | 92,189 | 120,570 |
| Distributions | | |
| Net Investment Income | | |
| Investor Shares | (55,253) | (78,239) |
| Institutional Shares | (35,260) | (40,680) |
| Realized Capital Gain | | |
| Investor Shares | — | — |
| Institutional Shares | — | — |
| Total Distributions | (90,513) | (118,919) |
| Capital Share Transactions | | |
| Investor Shares | 3,718,120 | (7,395,143) |
| Institutional Shares | 2,631,581 | 784,242 |
| Net Increase (Decrease) from Capital Share Transactions | 6,349,701 | (6,610,901) |
| Total Increase (Decrease) | 6,351,377 | (6,609,250) |
| Net Assets | | |
| Beginning of Period | 107,791,547 | 114,400,797 |
| End of Period | 114,142,924 | 107,791,547 |
See accompanying Notes, which are an integral part of the Financial Statements.
27
Prime Money Market Fund
Financial Highlights
| | | | | |
| Investor Shares | | | | | |
| |
| For a Share Outstanding | | | | Year Ended August 31, |
| Throughout Each Period | 2011 | 2010 | 2009 | 2008 | 2007 |
| Net Asset Value, Beginning of Period | $1.00 | $1.00 | $1.00 | $1.00 | $1.00 |
| Investment Operations | | | | | |
| Net Investment Income | .001 | .001 | .013 | .035 | .051 |
| Net Realized and Unrealized Gain (Loss) | | | | | |
| on Investments | — | — | — | — | — |
| Total from Investment Operations | .001 | .001 | .013 | .035 | .051 |
| Distributions | | | | | |
| Dividends from Net Investment Income | (.001) | (.001) | (.013) | (.035) | (.051) |
| Distributions from Realized Capital Gains | — | — | — | — | — |
| Total Distributions | (.001) | (.001) | (.013) | (.035) | (.051) |
| Net Asset Value, End of Period | $1.00 | $1.00 | $1.00 | $1.00 | $1.00 |
| |
| Total Return1 | 0.06% | 0.08% | 1.31% | 3.60% | 5.23% |
| |
| Ratios/Supplemental Data | | | | | |
| Net Assets, End of Period (Millions) | $92,404 | $88,684 | $96,078 | $92,483 | $84,052 |
| Ratio of Total Expenses to | | | | | |
| Average Net Assets | 0.20% | 0.23% | 0.28%2 | 0.23% | 0.24% |
| Ratio of Net Investment Income to | | | | | |
| Average Net Assets | 0.06% | 0.08% | 1.25% | 3.49% | 5.10% |
1 Total returns do not include account service fees that may have applied in the periods shown. Fund prospectuses provide information about any applicable account service fees.
2 Includes 0.03% of fees to participate in the Treasury Temporary Guarantee Program for Money Market Funds.
See accompanying Notes, which are an integral part of the Financial Statements.
28
Prime Money Market Fund
Financial Highlights
| | | | | |
| Institutional Shares | | | | | |
| |
| For a Share Outstanding | | | | Year Ended August 31, |
| Throughout Each Period | 2011 | 2010 | 2009 | 2008 | 2007 |
| Net Asset Value, Beginning of Period | $1.00 | $1.00 | $1.00 | $1.00 | $1.00 |
| Investment Operations | | | | | |
| Net Investment Income | .002 | .002 | .015 | .037 | .053 |
| Net Realized and Unrealized Gain (Loss) | | | | | |
| on Investments | — | — | — | — | — |
| Total from Investment Operations | .002 | .002 | .015 | .037 | .053 |
| Distributions | | | | | |
| Dividends from Net Investment Income | (.002) | (.002) | (.015) | (.037) | (.053) |
| Distributions from Realized Capital Gains | — | — | — | — | — |
| Total Distributions | (.002) | (.002) | (.015) | (.037) | (.053) |
| Net Asset Value, End of Period | $1.00 | $1.00 | $1.00 | $1.00 | $1.00 |
| |
| Total Return | 0.17% | 0.22% | 1.47% | 3.75% | 5.39% |
| |
| Ratios/Supplemental Data | | | | | |
| Net Assets, End of Period (Millions) | $21,739 | $19,107 | $18,323 | $13,844 | $10,022 |
| Ratio of Total Expenses to | | | | | |
| Average Net Assets | 0.09% | 0.09% | 0.13%1 | 0.08% | 0.08% |
| Ratio of Net Investment Income to | | | | | |
| Average Net Assets | 0.17% | 0.22% | 1.40% | 3.64% | 5.26% |
| 1 Includes 0.03% of fees to participate in the Treasury Temporary Guarantee Program for Money Market Funds. |
See accompanying Notes, which are an integral part of the Financial Statements.
29
Prime Money Market Fund
Notes to Financial Statements
Vanguard Prime Money Market Fund is registered under the Investment Company Act of 1940 as an open-end investment company, or mutual fund. The fund invests in short-term debt instruments of companies primarily operating in specific industries, particularly financial services; the issuers’ abilities to meet their obligations may be affected by economic developments in such industries. The fund offers two classes of shares, Investor Shares and Institutional Shares. Investor Shares are available to any investor who meets the fund’s minimum purchase requirements. Institutional Shares are designed for investors who meet certain administrative, service, and account-size criteria.
A. The following significant accounting policies conform to generally accepted accounting principles for U.S. mutual funds. The fund consistently follows such policies in preparing its financial statements.
1. Security Valuation: Securities are valued at amortized cost, which approximates market value. Investments in Vanguard Municipal Cash Management Fund are valued at that fund’s net asset value.
2. Repurchase Agreements: The fund invests in repurchase agreements. Securities pledged as collateral for repurchase agreements are held by a custodian bank until the agreements mature. Each agreement requires that the market value of the collateral be sufficient to cover payments of interest and principal; however, in the event of default or bankruptcy by the other party to the agreement, retention of the collateral may be subject to legal proceedings.
3. Federal Income Taxes: The fund intends to continue to qualify as a regulated investment company and distribute all of its taxable income. Management has analyzed the fund’s tax positions taken for all open federal income tax years (August 31, 2008–2011), and has concluded that no provision for federal income tax is required in the fund’s financial statements.
4. Distributions: Distributions from net investment income are declared daily and paid on the first business day of the following month.
5. Other: Interest income includes income distributions received from Vanguard Municipal Cash Management Fund and is accrued daily. Premiums and discounts on debt securities purchased are amortized and accreted, respectively, to interest income over the lives of the respective securities. Security transactions are accounted for on the date securities are bought or sold. Costs used to determine realized gains (losses) on the sale of investment securities are those of the specific securities sold.
Each class of shares has equal rights as to assets and earnings, except that each class separately bears certain class-specific expenses related to maintenance of shareholder accounts (included in Management and Administrative expenses) and shareholder reporting. Marketing and distribution expenses are allocated to each class of shares based on a method approved by the board of trustees. Income, other non-class-specific expenses, and gains and losses on investments are allocated to each class of shares based on its relative net assets.
B. The Vanguard Group furnishes at cost investment advisory, corporate management, administrative, marketing, and distribution services. The costs of such services are allocated to the fund under methods approved by the board of trustees. The fund has committed to provide up to 0.40% of its net assets in capital contributions to Vanguard. At August 31, 2011, the fund had contributed capital of $18,107,000 to Vanguard (included in Other Assets), representing 0.02% of the fund’s net assets and 7.24% of Vanguard’s capitalization. The fund’s trustees and officers are also directors and officers of Vanguard. Vanguard and the board of trustees have agreed to temporarily limit certain net operating expenses in excess of the fund’s daily yield so as to maintain a zero or positive yield for the fund. Vanguard and the board of trustees may terminate the temporary expense limitation at any time.
30
Prime Money Market Fund
C. Various inputs may be used to determine the value of the fund’s investments. These inputs are summarized in three broad levels for financial statement purposes. The inputs or methodologies used to value securities are not necessarily an indication of the risk associated with investing in those securities.
Level 1—Quoted prices in active markets for identical securities.
Level 2—Other significant observable inputs (including quoted prices for similar securities, interest rates, prepayment speeds, credit risk, etc.).
Level 3—Significant unobservable inputs (including the fund’s own assumptions used to determine the fair value of investments).
The fund’s investment in Vanguard Municipal Cash Management Fund is valued based on Level 1 inputs. All of the fund’s other investments were valued using amortized cost, in accordance with rules under the Investment Company Act of 1940. Amortized cost approximates the current fair value of a security, but since the value is not obtained from a quoted price in an active market, securities valued at amortized cost are considered to be valued using Level 2 inputs.
D. Capital share transactions for each class of shares were:
| | | | |
| | | | Year Ended August 31, |
| | | 2011 | | 2010 |
| | Amount | Shares | Amount | Shares |
| | ($000) | (000) | ($000) | (000) |
| Investor Shares | | | | |
| Issued | 119,751,906 | 119,751,906 | 99,880,454 | 99,880,454 |
| Issued in Lieu of Cash Distributions | 53,993 | 53,993 | 76,231 | 76,231 |
| Redeemed | (116,087,779) | (116,087,779) | (107,351,828) | (107,351,828) |
| Net Increase (Decrease)—Investor Shares | 3,718,120 | 3,718,120 | (7,395,143) | (7,395,143) |
| Institutional Shares | | | | |
| Issued | 20,303,805 | 20,303,805 | 16,052,323 | 16,052,323 |
| Issued in Lieu of Cash Distributions | 34,248 | 34,248 | 39,524 | 39,524 |
| Redeemed | (17,706,472) | (17,706,472) | (15,307,605) | (15,307,605) |
| Net Increase (Decrease)—Institutional Shares | 2,631,581 | 2,631,581 | 784,242 | 784,242 |
E. In preparing the financial statements as of August 31, 2011, management considered the impact of subsequent events for potential recognition or disclosure in these financial statements.
31
Federal Money Market Fund
Fund Profile
As of August 31, 2011
| |
| Financial Attributes | |
| Ticker Symbol | VMFXX |
| Expense Ratio1 | 0.22% |
| 7-Day SEC Yield | 0.01% |
| Average Weighted | |
| Maturity | 56 days |
| |
| Sector Diversification (% of portfolio) | |
| U.S. Treasury Bills | 10.8% |
| U.S. Government Agency Obligations | 88.8 |
| Repurchase Agreements | 0.4 |
The agency and mortgage-backed securities sectors may include issues from government-sponsored enterprises; such issues are not backed by the full faith and credit of the U.S. government.
| |
| Distribution by Credit Quality (% of portfolio) |
| First Tier | 100.0% |
| For information about these ratings, see the Glossary entry for Credit Quality. |
1 The expense ratio shown is from the prospectus dated December 23, 2010, and represents estimated costs for the current fiscal year. For the fiscal year ended August 31, 2011, the expense ratio was 0.19%, reflecting a temporary reduction in operating expenses (described in Note B of the Notes to Financial Statements). Before this reduction, the expense ratio was 0.20%.
32
Federal Money Market Fund
Performance Summary
Investment returns will fluctuate. All of the returns in this report represent past performance, which is not a guarantee of future results that may be achieved by the fund. (Current performance may be lower or higher than the performance data cited. For performance data current to the most recent month-end, visit our website at vanguard.com/performance.) The returns shown do not reflect taxes that a shareholder would pay on fund distributions. An investment in a money market fund is not insured or guaranteed by the Federal Deposit Insurance Corporation or any other government agency. Although the fund seeks to preserve the value of your investment at $1 per share, it is possible to lose money by investing in the fund. The fund’s 7-day SEC yield reflects its current earnings more closely than do the average annual returns.
Cumulative Performance: August 31, 2001, Through August 31, 2011
Initial Investment of $10,000

| | | | |
| | Average Annual Total Returns | |
| | Periods Ended August 31, 2011 | |
| | | | | Final Value |
| | One | Five | Ten | of a $10,000 |
| | Year | Years | Years | Investment |
| Federal Money Market Fund | 0.02% | 1.93% | 2.02% | $12,218 |
| Citigroup Three-Month U.S. Treasury | | | | |
| Bill Index | 0.12 | 1.69 | 1.95 | 12,128 |
| Government Money Market Funds | | | | |
| Average | 0.00 | 1.53 | 1.57 | 11,680 |
Government Money Market Funds Average: Derived from data provided by Lipper Inc.
See Financial Highlights for dividend information.
33
Federal Money Market Fund
Fiscal-Year Total Returns (%): August 31, 2001, Through August 31, 2011
| | |
| | | Gov’t Money |
| | | Market Funds |
| | | Average |
| Fiscal Year | Total Returns | Total Returns |
| 2002 | 2.12% | 1.48% |
| 2003 | 1.11 | 0.64 |
| 2004 | 0.82 | 0.40 |
| 2005 | 2.26 | 1.73 |
| 2006 | 4.31 | 3.78 |
| 2007 | 5.17 | 4.58 |
| 2008 | 3.46 | 2.71 |
| 2009 | 1.06 | 0.43 |
| 2010 | 0.04 | 0.00 |
| 2011 | 0.02 | 0.00 |
| 7-day SEC yield (8/31/2011): 0.01% |
| Government Money Market Funds Average: Derived from data provided by Lipper Inc. |
Average Annual Total Returns: Periods Ended June 30, 2011
This table presents returns through the latest calendar quarter—rather than through the end of the fiscal period.
Securities and Exchange Commission rules require that we provide this information.
| | | | |
| | Inception | One | Five | Ten |
| | Date | Year | Years | Years |
| Federal Money Market Fund | 7/13/1981 | 0.02% | 2.10% | 2.09% |
34
Federal Money Market Fund
Financial Statements
Statement of Net Assets
As of August 31, 2011
The fund reports a complete list of its holdings in various monthly and quarterly regulatory filings. The fund publishes its holdings on a monthly basis at vanguard.com and files them with the Securities and Exchange Commission on Form N-MFP. The fund’s Form N-MFP filings become public 60 days after the relevant month-end, and may be viewed at sec.gov or via a link on the “Portfolio Holdings” page on vanguard.com. For the second and fourth fiscal quarters, the lists appear in the fund’s semiannual and annual reports to shareholders. For the first and third fiscal quarters, the fund files the lists with the SEC on Form N-Q. Shareholders can look up the fund’s Forms N-Q on the SEC’s website at sec.gov. Forms N-Q may also be reviewed and copied at the SEC’s Public Reference Room (see the back cover of this report for further information).
| | | | | |
| | | | | Face | Market |
| | | | Maturity | Amount | Value |
| | | Yield1 | Date | ($000) | ($000) |
| U.S. Government and Agency Obligations (99.6%) | | | |
| 2 | Fannie Mae Discount Notes | 0.090%–0.170% | 9/1/11 | 68,866 | 68,866 |
| 2 | Fannie Mae Discount Notes | 0.100% | 9/7/11 | 5,225 | 5,225 |
| 2 | Fannie Mae Discount Notes | 0.025%–0.175% | 9/14/11 | 154,050 | 154,043 |
| 2 | Fannie Mae Discount Notes | 0.040% | 9/20/11 | 101,000 | 100,998 |
| 2 | Fannie Mae Discount Notes | 0.180% | 9/21/11 | 20,000 | 19,998 |
| 2 | Fannie Mae Discount Notes | 0.080%–0.090% | 10/4/11 | 13,700 | 13,699 |
| 2 | Fannie Mae Discount Notes | 0.080% | 10/5/11 | 12,000 | 11,999 |
| 2 | Fannie Mae Discount Notes | 0.060%–0.150% | 10/12/11 | 100,526 | 100,512 |
| 2 | Fannie Mae Discount Notes | 0.070% | 10/19/11 | 50,000 | 49,995 |
| 2 | Fannie Mae Discount Notes | 0.100% | 10/24/11 | 6,000 | 5,999 |
| 2 | Fannie Mae Discount Notes | 0.140%–0.145% | 10/26/11 | 88,263 | 88,244 |
| 2 | Fannie Mae Discount Notes | 0.120% | 11/2/11 | 14,675 | 14,672 |
| 2 | Fannie Mae Discount Notes | 0.060% | 11/7/11 | 10,100 | 10,099 |
| 2 | Fannie Mae Discount Notes | 0.065% | 11/9/11 | 7,665 | 7,664 |
| 2 | Fannie Mae Discount Notes | 0.070%–0.130% | 11/16/11 | 81,200 | 81,187 |
| 2 | Fannie Mae Discount Notes | 0.120% | 11/23/11 | 5,000 | 4,999 |
| 2 | Fannie Mae Discount Notes | 0.140% | 11/30/11 | 147,208 | 147,156 |
| 2 | Fannie Mae Discount Notes | 0.080%–0.120% | 12/1/11 | 26,967 | 26,961 |
| 2 | Fannie Mae Discount Notes | 0.140% | 12/7/11 | 51,000 | 50,981 |
| 2 | Fannie Mae Discount Notes | 0.140% | 12/14/11 | 40,000 | 39,984 |
| 2 | Fannie Mae Discount Notes | 0.105% | 1/4/12 | 78,345 | 78,316 |
| 2 | Fannie Mae Discount Notes | 0.220% | 1/18/12 | 90,350 | 90,273 |
| 2 | Fannie Mae Discount Notes | 0.150% | 1/25/12 | 40,000 | 39,976 |
| 2 | Fannie Mae Discount Notes | 0.150% | 2/8/12 | 31,183 | 31,162 |
| 2 | Federal Home Loan Bank Discount Notes | 0.050%–0.170% | 9/7/11 | 145,402 | 145,400 |
| 2 | Federal Home Loan Bank Discount Notes | 0.060%–0.170% | 9/9/11 | 12,330 | 12,330 |
| 2 | Federal Home Loan Bank Discount Notes | 0.110% | 9/13/11 | 3,591 | 3,591 |
| 2 | Federal Home Loan Bank Discount Notes | 0.095% | 9/14/11 | 60,000 | 59,998 |
| 2 | Federal Home Loan Bank Discount Notes | 0.060%–0.095% | 9/16/11 | 54,000 | 53,998 |
| 2 | Federal Home Loan Bank Discount Notes | 0.055% | 9/23/11 | 14,400 | 14,399 |
| 2 | Federal Home Loan Bank Discount Notes | 0.070% | 9/28/11 | 33,757 | 33,755 |
| 2 | Federal Home Loan Bank Discount Notes | 0.070% | 9/30/11 | 155,736 | 155,727 |
| 2 | Federal Home Loan Bank Discount Notes | 0.050% | 10/7/11 | 16,655 | 16,654 |
| 2 | Federal Home Loan Bank Discount Notes | 0.050% | 10/14/11 | 55,000 | 54,997 |
| 2 | Federal Home Loan Bank Discount Notes | 0.100% | 10/19/11 | 9,000 | 8,999 |
| 2 | Federal Home Loan Bank Discount Notes | 0.120% | 10/21/11 | 1,850 | 1,850 |
35
| | | | | |
| Federal Money Market Fund | | | | |
| |
| |
| |
| | | | | Face | Market |
| | | | Maturity | Amount | Value |
| | | Yield1 | Date | ($000) | ($000) |
| 2 | Federal Home Loan Bank Discount Notes | 0.200% | 10/24/11 | 17,900 | 17,895 |
| 2 | Federal Home Loan Bank Discount Notes | 0.120%–0.200% | 10/26/11 | 17,400 | 17,395 |
| 2 | Federal Home Loan Bank Discount Notes | 0.080% | 11/16/11 | 7,400 | 7,399 |
| 2 | Federal Home Loan Bank Discount Notes | 0.080%–0.085% | 11/25/11 | 11,600 | 11,598 |
| 2 | Federal Home Loan Bank Discount Notes | 0.140% | 11/30/11 | 12,700 | 12,695 |
| 2 | Federal Home Loan Bank Discount Notes | 0.140% | 12/7/11 | 11,000 | 10,996 |
| 2 | Federal Home Loan Bank Discount Notes | 0.140% | 12/13/11 | 10,000 | 9,996 |
| 2 | Federal Home Loan Bank Discount Notes | 0.140% | 12/14/11 | 10,000 | 9,996 |
| 2 | Federal Home Loan Bank Discount Notes | 0.100% | 1/11/12 | 30,000 | 29,989 |
| 2 | Federal Home Loan Bank Discount Notes | 0.120% | 1/18/12 | 19,500 | 19,491 |
| 2 | Federal Home Loan Bank Discount Notes | 0.100%–0.150% | 2/10/12 | 69,242 | 69,203 |
| 2 | Federal Home Loan Bank Discount Notes | 0.130% | 2/17/12 | 57,000 | 56,965 |
| 2 | Federal Home Loan Bank Discount Notes | 0.120% | 2/22/12 | 31,000 | 30,982 |
| 2,3 | Federal Home Loan Banks | 0.126% | 9/9/11 | 24,000 | 24,000 |
| 2,3 | Federal Home Loan Banks | 0.168% | 9/23/11 | 41,000 | 40,999 |
| 2,3 | Federal Home Loan Banks | 0.173% | 1/9/12 | 150,000 | 149,983 |
| 2,3 | Federal Home Loan Banks | 0.185% | 1/23/12 | 25,000 | 24,997 |
| 2,3 | Federal Home Loan Banks | 0.157% | 2/3/12 | 100,000 | 99,987 |
| 2,3 | Federal Home Loan Mortgage Corp. | 0.168% | 12/16/11 | 35,000 | 34,996 |
| 2,3 | Federal Home Loan Mortgage Corp. | 0.168% | 2/16/12 | 75,000 | 74,986 |
| 2,3 | Federal Home Loan Mortgage Corp. | 0.157% | 8/24/12 | 60,000 | 59,972 |
| 2,3 | Federal Home Loan Mortgage Corp. | 0.173% | 3/21/13 | 13,000 | 12,990 |
| 2,3 | Federal Home Loan Mortgage Corp. | 0.155% | 5/6/13 | 48,000 | 47,962 |
| 2,3 | Federal Home Loan Mortgage Corp. | 0.142% | 6/3/13 | 60,000 | 59,957 |
| 2,3 | Federal National Mortgage Assn. | 0.235% | 8/23/12 | 160,000 | 160,018 |
| 2,3 | Federal National Mortgage Assn. | 0.240% | 9/17/12 | 40,000 | 39,991 |
| 2,3 | Federal National Mortgage Assn. | 0.235% | 11/23/12 | 70,000 | 69,974 |
| 2,3 | Federal National Mortgage Assn. | 0.197% | 8/12/13 | 30,000 | 29,982 |
| 2 | Freddie Mac Discount Notes | 0.060%–0.115% | 9/6/11 | 22,850 | 22,850 |
| 2 | Freddie Mac Discount Notes | 0.170% | 9/12/11 | 95,000 | 94,995 |
| 2 | Freddie Mac Discount Notes | 0.050% | 9/13/11 | 13,000 | 13,000 |
| 2 | Freddie Mac Discount Notes | 0.150% | 9/14/11 | 34,940 | 34,938 |
| 2 | Freddie Mac Discount Notes | 0.130%–0.180% | 9/19/11 | 43,977 | 43,973 |
| 2 | Freddie Mac Discount Notes | 0.065% | 10/3/11 | 5,300 | 5,300 |
| 2 | Freddie Mac Discount Notes | 0.130%–0.160% | 10/4/11 | 95,755 | 95,741 |
| 2 | Freddie Mac Discount Notes | 0.090% | 10/6/11 | 4,300 | 4,300 |
| 2 | Freddie Mac Discount Notes | 0.065% | 10/12/11 | 4,300 | 4,300 |
| 2 | Freddie Mac Discount Notes | 0.100%–0.200% | 10/24/11 | 345,593 | 345,512 |
| 2 | Freddie Mac Discount Notes | 0.050%–0.080% | 11/2/11 | 29,600 | 29,596 |
| 2 | Freddie Mac Discount Notes | 0.080%–0.120% | 11/7/11 | 180,991 | 180,962 |
| 2 | Freddie Mac Discount Notes | 0.060%–0.080% | 11/9/11 | 36,500 | 36,495 |
| 2 | Freddie Mac Discount Notes | 0.120% | 11/14/11 | 8,350 | 8,348 |
| 2 | Freddie Mac Discount Notes | 0.090% | 11/15/11 | 25,000 | 24,995 |
| 2 | Freddie Mac Discount Notes | 0.140% | 12/5/11 | 35,000 | 34,987 |
| 2 | Freddie Mac Discount Notes | 0.080%–0.090% | 12/6/11 | 35,400 | 35,392 |
| 2 | Freddie Mac Discount Notes | 0.130%–0.140% | 12/12/11 | 36,892 | 36,877 |
| 2 | Freddie Mac Discount Notes | 0.150% | 12/13/11 | 8,000 | 7,997 |
| 2 | Freddie Mac Discount Notes | 0.095% | 12/14/11 | 45,000 | 44,988 |
| 2 | Freddie Mac Discount Notes | 0.105% | 1/3/12 | 52,000 | 51,981 |
| 2 | Freddie Mac Discount Notes | 0.150% | 1/19/12 | 9,000 | 8,995 |
| 2 | Freddie Mac Discount Notes | 0.110% | 2/13/12 | 48,000 | 47,976 |
| | United States Treasury Bill | 0.170% | 9/29/11 | 138,298 | 138,280 |
| | United States Treasury Bill | 0.074% | 11/17/11 | 50,000 | 49,992 |
| | United States Treasury Bill | 0.100% | 11/25/11 | 50,000 | 49,988 |
| | United States Treasury Bill | 0.116% | 12/1/11 | 150,000 | 149,956 |
36
| | | | |
| Federal Money Market Fund | | | | |
| |
| |
| |
| | | | Face | Market |
| | | Maturity | Amount | Value |
| | Yield1 | Date | ($000) | ($000) |
| United States Treasury Bill | 0.105% | 12/8/11 | 30,000 | 29,991 |
| United States Treasury Bill | 0.095%–0.101% | 12/29/11 | 100,000 | 99,968 |
| Total U.S. Government and Agency Obligations (Cost $4,772,773) | | | 4,772,773 |
| Repurchase Agreements (0.4%) | | | | |
| Barclays Capital Inc. | | | | |
| (Dated 8/31/11, Repurchase Value | | | | |
| $5,000,000, collateralized by U.S. | | | | |
| Treasury Bond 4.500%, 8/15/39) | 0.040% | 9/1/11 | 5,000 | 5,000 |
| RBC Capital Market LLC | | | | |
| (Dated 8/31/11, Repurchase Value | | | | |
| $5,000,000, collateralized by U.S. | | | | |
| Treasury Note 0.500%, 8/15/14) | 0.050% | 9/1/11 | 5,000 | 5,000 |
| RBS Securities, Inc. | | | | |
| (Dated 8/31/11, Repurchase Value | | | | |
| $9,098,000, collateralized by U.S. | | | | |
| Treasury Note 2.375%, 10/31/14) | 0.060% | 9/1/11 | 9,098 | 9,098 |
| Total Repurchase Agreements (Cost $19,098) | | | 19,098 |
| Total Investments (100.0%) (Cost $4,791,871) | | | 4,791,871 |
| Other Assets and Liabilities (0.0%) | | | | |
| Other Assets | | | | 7,029 |
| Liabilities | | | | (4,999) |
| | | | | 2,030 |
| Net Assets (100%) | | | | |
| Applicable to 4,793,274,679 outstanding $.001 par value shares of | | | |
| beneficial interest (unlimited authorization) | | | | 4,793,901 |
| Net Asset Value Per Share | | | | $1.00 |
| |
| |
| At August 31, 2011, net assets consisted of: | | | | |
| | | | | Amount |
| | | | | ($000) |
| Paid-in Capital | | | | 4,793,793 |
| Undistributed Net Investment Income | | | | — |
| Accumulated Net Realized Gains | | | | 108 |
| Net Assets | | | | 4,793,901 |
See Note A in Notes to Financial Statements.
1 Represents annualized yield at date of purchase for discount securities, and coupon for coupon-bearing securities.
2 The issuer operates under a congressional charter; its securities are not backed by the full faith and credit of the U.S. government.
3 Adjustable-rate security.
See accompanying Notes, which are an integral part of the Financial Statements.
37
Federal Money Market Fund
Statement of Operations
| |
| | Year Ended |
| | August 31, 2011 |
| | ($000) |
| Investment Income | |
| Income | |
| Interest | 10,989 |
| Total Income | 10,989 |
| Expenses | |
| The Vanguard Group—Note B | |
| Investment Advisory Services | 262 |
| Management and Administrative | 8,529 |
| Marketing and Distribution | 1,688 |
| Custodian Fees | 89 |
| Auditing Fees | 28 |
| Shareholders’ Reports | 43 |
| Trustees’ Fees and Expenses | 7 |
| Total Expenses | 10,646 |
| Expense Reduction—Note B | (560) |
| Net Expenses | 10,086 |
| Net Investment Income | 903 |
| Realized Net Gain (Loss) on Investment Securities Sold | 45 |
| Net Increase (Decrease) in Net Assets Resulting from Operations | 948 |
See accompanying Notes, which are an integral part of the Financial Statements.
38
Federal Money Market Fund
Statement of Changes in Net Assets
| | |
| | Year Ended August 31, |
| | 2011 | 2010 |
| | ($000) | ($000) |
| Increase (Decrease) in Net Assets | | |
| Operations | | |
| Net Investment Income | 903 | 3,190 |
| Realized Net Gain (Loss) | 45 | 63 |
| Net Increase (Decrease) in Net Assets Resulting from Operations | 948 | 3,253 |
| Distributions | | |
| Net Investment Income | (903) | (3,190) |
| Realized Capital Gain | — | — |
| Total Distributions | (903) | (3,190) |
| Capital Share Transactions (at $1.00) | | |
| Issued | 474,221 | 617,905 |
| Issued in Lieu of Cash Distributions | 881 | 3,094 |
| Redeemed | (1,729,232) | (3,959,429) |
| Net Increase (Decrease) from Capital Share Transactions | (1,254,130) | (3,338,430) |
| Total Increase (Decrease) | (1,254,085) | (3,338,367) |
| Net Assets | | |
| Beginning of Period | 6,047,986 | 9,386,353 |
| End of Period | 4,793,901 | 6,047,986 |
See accompanying Notes, which are an integral part of the Financial Statements.
39
Federal Money Market Fund
Financial Highlights
| | | | | |
| For a Share Outstanding | | | | Year Ended August 31, |
| Throughout Each Period | 2011 | 2010 | 2009 | 2008 | 2007 |
| Net Asset Value, Beginning of Period | $1.00 | $1.00 | $1.00 | $1.00 | $1.00 |
| Investment Operations | | | | | |
| Net Investment Income | .0002 | .0004 | .011 | .034 | .051 |
| Net Realized and Unrealized Gain (Loss) | | | | | |
| on Investments | — | — | — | — | — |
| Total from Investment Operations | .0002 | .0004 | .011 | .034 | .051 |
| Distributions | | | | | |
| Dividends from Net Investment Income | (.0002) | (.0004) | (.011) | (.034) | (.051) |
| Distributions from Realized Capital Gains | — | — | — | — | — |
| Total Distributions | (.0002) | (.0004) | (.011) | (.034) | (.051) |
| Net Asset Value, End of Period | $1.00 | $1.00 | $1.00 | $1.00 | $1.00 |
| |
| Total Return1 | 0.02% | 0.04% | 1.06% | 3.46% | 5.17% |
| |
| Ratios/Supplemental Data | | | | | |
| Net Assets, End of Period (Millions) | $4,794 | $6,048 | $9,386 | $8,982 | $7,672 |
| Ratio of Total Expenses to | | | | | |
| Average Net Assets | 0.19%2 | 0.22% | 0.27%3 | 0.23% | 0.24% |
| Ratio of Net Investment Income to | | | | | |
| Average Net Assets | 0.02% | 0.04% | 1.03% | 3.33% | 5.05% |
1 Total returns do not include account service fees that may have applied in the periods shown. Fund prospectuses provide information about any applicable account service fees.
2 The ratio of total expenses to average net assets before an expense reduction was 0.20%. See Note B in the Notes to Financial Statements.
3 Includes 0.02% of fees to participate in the Treasury Temporary Guarantee Program for Money Market Funds.
See accompanying Notes, which are an integral part of the Financial Statements.
40
Federal Money Market Fund
Notes to Financial Statements
Vanguard Federal Money Market Fund is registered under the Investment Company Act of 1940 as an open-end investment company, or mutual fund. The fund invests in short-term debt instruments issued by the U.S. government or its agencies and instrumentalities, and repurchase agreements collateralized by such instruments.
A. The following significant accounting policies conform to generally accepted accounting principles for U.S. mutual funds. The fund consistently follows such policies in preparing its financial statements.
1. Security Valuation: Securities are valued at amortized cost, which approximates market value.
2. Repurchase Agreements: The fund invests in repurchase agreements. Securities pledged as collateral for repurchase agreements are held by a custodian bank until the agreements mature. Each agreement requires that the market value of the collateral be sufficient to cover payments of interest and principal; however, in the event of default or bankruptcy by the other party to the agreement, retention of the collateral may be subject to legal proceedings.
3. Federal Income Taxes: The fund intends to continue to qualify as a regulated investment company and distribute all of its taxable income. Management has analyzed the fund’s tax positions taken for all open federal income tax years (August 31, 2008–2011), and has concluded that no provision for federal income tax is required in the fund’s financial statements.
4. Distributions: Distributions from net investment income are declared daily and paid on the first business day of the following month.
5. Other: Interest income is accrued daily. Premiums and discounts on debt securities purchased are amortized and accreted, respectively, to interest income over the lives of the respective securities. Security transactions are accounted for on the date securities are bought or sold. Costs used to determine realized gains (losses) on the sale of investment securities are those of the specific securities sold.
B. The Vanguard Group furnishes at cost investment advisory, corporate management, administrative, marketing, and distribution services. The costs of such services are allocated to the fund under methods approved by the board of trustees. The fund has committed to provide up to 0.40% of its net assets in capital contributions to Vanguard. At August 31, 2011, the fund had contributed capital of $776,000 to Vanguard (included in Other Assets), representing 0.02% of the fund’s net assets and 0.31% of Vanguard’s capitalization. The fund’s trustees and officers are also directors and officers of Vanguard. Vanguard and the board of trustees have agreed to temporarily limit certain net operating expenses in excess of the fund’s daily yield so as to maintain a zero or positive yield for the fund. Vanguard and the board of trustees may terminate the temporary expense limitation at any time. For the year ended August 31, 2011, Vanguard’s management and administrative expenses were reduced by $560,000 (an effective annual rate of 0.01% of the fund’s net assets).
41
Federal Money Market Fund
C. Various inputs may be used to determine the value of the fund’s investments. These inputs are summarized in three broad levels for financial statement purposes. The inputs or methodologies used to value securities are not necessarily an indication of the risk associated with investing in those securities.
Level 1—Quoted prices in active markets for identical securities.
Level 2—Other significant observable inputs (including quoted prices for similar securities, interest rates, prepayment speeds, credit risk, etc.).
Level 3—Significant unobservable inputs (including the fund’s own assumptions used to determine the fair value of investments).
At August 31, 2011, 100% of the fund’s investments were valued using amortized cost, in accordance with rules under the Investment Company Act of 1940. Amortized cost approximates the current fair value of a security, but since the value is not obtained from a quoted price in an active market, securities valued at amortized cost are considered to be valued using Level 2 inputs.
D. In preparing the financial statements as of August 31, 2011, management considered the impact of subsequent events for potential recognition or disclosure in these financial statements.
42
Admiral Treasury Money Market Fund
Fund Profile
As of August 31, 2011
| |
| Financial Attributes | |
| Ticker Symbol | VUSXX |
| Expense Ratio1 | 0.14% |
| 7-Day SEC Yield | 0.01% |
| Average Weighted | |
| Maturity | 50 days |
| |
| Sector Diversification (% of portfolio) | |
| U.S. Treasury Bills | 100.0% |
The agency and mortgage-backed securities sectors may include issues from government-sponsored enterprises; such issues are not backed by the full faith and credit of the U.S. government.
| |
| Distribution by Credit Quality (% of portfolio) |
| First Tier | 100.0% |
| For information about these ratings, see the Glossary entry for Credit Quality. |
1 The expense ratio shown is from the prospectus dated December 23, 2010, and represents estimated costs for the current fiscal year. For the fiscal year ended August 31, 2011, the expense ratio was 0.11%, reflecting a temporary reduction in operating expenses (described in Note B of the Notes to Financial Statements). Before this reduction, the expense ratio was 0.12% .
43
Admiral Treasury Money Market Fund
Performance Summary
Investment returns will fluctuate. All of the returns in this report represent past performance, which is not a guarantee of future results that may be achieved by the fund. (Current performance may be lower or higher than the performance data cited. For performance data current to the most recent month-end, visit our website at vanguard.com/performance.) The returns shown do not reflect taxes that a shareholder would pay on fund distributions. An investment in a money market fund is not insured or guaranteed by the Federal Deposit Insurance Corporation or any other government agency. Although the fund seeks to preserve the value of your investment at $1 per share, it is possible to lose money by investing in the fund. The fund’s 7-day SEC yield reflects its current earnings more closely than do the average annual returns.
Cumulative Performance: August 31, 2001, Through August 31, 2011
Initial Investment of $50,000
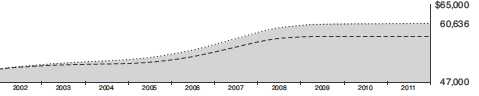
| | | | |
| | Average Annual Total Returns | |
| | Periods Ended August 31, 2011 | |
| | | | | Final Value |
| | One | Five | Ten | of a $50,000 |
| | Year | Years | Years | Investment |
| Admiral Treasury Money Market Fund | 0.02% | 1.75% | 1.95% | $60,636 |
| Citigroup Three-Month U.S. Treasury | | | | |
| Bill Index | 0.12 | 1.69 | 1.95 | 60,640 |
| iMoneyNet Money Fund Report’s | | | | |
| 100% Treasury Funds Average | 0.00 | 1.30 | 1.43 | 57,619 |
iMoneyNet Money Fund Report’s 100% Treasury Funds Average: Derived from data provided by iMoneyNet, Inc.
See Financial Highlights for dividend information.
44
Admiral Treasury Money Market Fund
Fiscal-Year Total Returns (%): August 31, 2001, Through August 31, 2011
| | |
| | | iMoneyNet |
| | | Average |
| Fiscal Year | Total Returns | Total Returns |
| 2002 | 2.15% | 1.58% |
| 2003 | 1.20 | 0.67 |
| 2004 | 0.91 | 0.39 |
| 2005 | 2.29 | 1.61 |
| 2006 | 4.22 | 3.54 |
| 2007 | 5.01 | 4.34 |
| 2008 | 3.08 | 2.08 |
| 2009 | 0.70 | 0.17 |
| 2010 | 0.03 | 0.00 |
| 2011 | 0.02 | 0.00 |
| 7-day SEC yield (8/31/2011): 0.01% |
| iMoneyNet Money Fund Report’s 100% Treasury Funds Average: Derived from data provided by iMoneyNet, Inc. |
Average Annual Total Returns: Periods Ended June 30, 2011
This table presents returns through the latest calendar quarter—rather than through the end of the fiscal period.
Securities and Exchange Commission rules require that we provide this information.
| | | | |
| | Inception | One | Five | Ten |
| | Date | Year | Years | Years |
| Admiral Treasury Money Market | | | | |
| Fund | 12/14/1992 | 0.02% | 1.91% | 2.01% |
45
Admiral Treasury Money Market Fund
Financial Statements
Statement of Net Assets
As of August 31, 2011
The fund reports a complete list of its holdings in various monthly and quarterly regulatory filings. The fund publishes its holdings on a monthly basis at vanguard.com and files them with the Securities and Exchange Commission on Form N-MFP. The fund’s Form N-MFP filings become public 60 days after the relevant month-end, and may be viewed at sec.gov or via a link on the “Portfolio Holdings” page on vanguard.com. For the second and fourth fiscal quarters, the lists appear in the fund’s semiannual and annual reports to shareholders. For the first and third fiscal quarters, the fund files the lists with the SEC on Form N-Q. Shareholders can look up the fund’s Forms N-Q on the SEC’s website at sec.gov. Forms N-Q may also be reviewed and copied at the SEC’s Public Reference Room (see the back cover of this report for further information).
| | | | |
| | | | Face | Market |
| | | Maturity | Amount | Value |
| | Yield1 | Date | ($000) | ($000) |
| U.S. Government and Agency Obligations (108.2%) | | | |
| United States Treasury Bill | 0.060% | 9/1/11 | 1,251,359 | 1,251,359 |
| United States Treasury Bill | 0.045% | 9/8/11 | 1,200,000 | 1,199,989 |
| United States Treasury Bill | 0.050%–0.152% | 9/15/11 | 1,518,000 | 1,517,960 |
| United States Treasury Bill | 0.035%–0.150% | 9/22/11 | 1,445,464 | 1,445,418 |
| United States Treasury Bill | 0.025%–0.170% | 9/29/11 | 950,000 | 949,948 |
| United States Treasury Bill | 0.025% | 10/6/11 | 750,000 | 749,982 |
| United States Treasury Bill | 0.030%–0.110% | 10/13/11 | 1,131,355 | 1,131,263 |
| United States Treasury Bill | 0.020% | 10/20/11 | 969,233 | 969,207 |
| United States Treasury Bill | 0.060%–0.115% | 10/27/11 | 1,301,902 | 1,301,746 |
| United States Treasury Bill | 0.045%–0.047% | 11/10/11 | 1,400,000 | 1,399,876 |
| United States Treasury Bill | 0.035% | 11/17/11 | 1,260,000 | 1,259,906 |
| United States Treasury Bill | 0.015% | 11/25/11 | 1,217,760 | 1,217,717 |
| United States Treasury Bill | 0.015% | 12/1/11 | 1,250,597 | 1,250,550 |
| United States Treasury Bill | 0.095% | 12/29/11 | 394,000 | 393,876 |
| United States Treasury Bill | 0.080% | 1/5/12 | 229,000 | 228,936 |
| United States Treasury Bill | 0.080% | 2/16/12 | 300,000 | 299,888 |
| Total U.S. Government and Agency Obligations (Cost $16,567,621) | | | 16,567,621 |
| Total Investments (108.2%) (Cost $16,567,621) | | | 16,567,621 |
| Other Assets and Liabilities (-8.2%) | | | | |
| Other Assets | | | | 17,090 |
| Liabilities | | | | (1,270,829) |
| | | | | (1,253,739) |
| Net Assets (100%) | | | | |
| Applicable to 15,310,688,678 outstanding $.001 par value shares of | | | |
| beneficial interest (unlimited authorization) | | | | 15,313,882 |
| Net Asset Value Per Share | | | | $1.00 |
46
| |
| Admiral Treasury Money Market Fund | |
| |
| |
| |
| | Market |
| | Value |
| | ($000) |
| Statement of Assets and Liabilities | |
| Assets | |
| Investments in Securities, at Value | 16,567,621 |
| Receivables for Investment Securities Sold | 5,403 |
| Receivables for Capital Shares Issued | 5,222 |
| Other Assets | 6,465 |
| Total Assets | 16,584,711 |
| Liabilities | |
| Payables for Investment Securities Purchased | 1,255,953 |
| Payables for Capital Shares Redeemed | 7,754 |
| Other Liabilities | 7,122 |
| Total Liabilities | 1,270,829 |
| Net Assets | 15,313,882 |
| |
| |
| At August 31, 2011, net assets consisted of: | |
| | Amount |
| | ($000) |
| Paid-in Capital | 15,313,739 |
| Undistributed Net Investment Income | — |
| Accumulated Net Realized Gains | 143 |
| Net Assets | 15,313,882 |
See Note A in Notes to Financial Statements.
1 Represents annualized yield at date of purchase for discount securities, and coupon for coupon-bearing securities.
See accompanying Notes, which are an integral part of the Financial Statements.
47
Admiral Treasury Money Market Fund
Statement of Operations
| |
| | Year Ended |
| | August 31, 2011 |
| | ($000) |
| Investment Income | |
| Income | |
| Interest | 21,548 |
| Total Income | 21,548 |
| Expenses | |
| The Vanguard Group—Note B | |
| Investment Advisory Services | 825 |
| Management and Administrative | 14,783 |
| Marketing and Distribution | 4,078 |
| Custodian Fees | 254 |
| Auditing Fees | 23 |
| Shareholders’ Reports | 60 |
| Trustees’ Fees and Expenses | 19 |
| Total Expenses | 20,042 |
| Expense Reduction—Note B | (1,220) |
| Net Expenses | 18,822 |
| Net Investment Income | 2,726 |
| Realized Net Gain (Loss) on Investment Securities Sold | 110 |
| Net Increase (Decrease) in Net Assets Resulting from Operations | 2,836 |
See accompanying Notes, which are an integral part of the Financial Statements.
48
Admiral Treasury Money Market Fund
Statement of Changes in Net Assets
| | |
| | Year Ended August 31, |
| | 2011 | 2010 |
| | ($000) | ($000) |
| Increase (Decrease) in Net Assets | | |
| Operations | | |
| Net Investment Income | 2,726 | 6,087 |
| Realized Net Gain (Loss) | 110 | 33 |
| Net Increase (Decrease) in Net Assets Resulting from Operations | 2,836 | 6,120 |
| Distributions | | |
| Net Investment Income | (2,726) | (6,087) |
| Realized Capital Gain | — | — |
| Total Distributions | (2,726) | (6,087) |
| Capital Share Transactions (at $1.00) | | |
| Issued | 976,384 | 1,061,537 |
| Issued in Lieu of Cash Distributions | 2,643 | 5,859 |
| Redeemed | (4,391,653) | (7,775,844) |
| Net Increase (Decrease) from Capital Share Transactions | (3,412,626) | (6,708,448) |
| Total Increase (Decrease) | (3,412,516) | (6,708,415) |
| Net Assets | | |
| Beginning of Period | 18,726,398 | 25,434,813 |
| End of Period | 15,313,882 | 18,726,398 |
See accompanying Notes, which are an integral part of the Financial Statements.
49
Admiral Treasury Money Market Fund
Financial Highlights
| | | | | |
| For a Share Outstanding | | | | Year Ended August 31, |
| Throughout Each Period | 2011 | 2010 | 2009 | 2008 | 2007 |
| Net Asset Value, Beginning of Period | $1.00 | $1.00 | $1.00 | $1.00 | $1.00 |
| Investment Operations | | | | | |
| Net Investment Income | .0002 | .0003 | .007 | .030 | .049 |
| Net Realized and Unrealized Gain (Loss) | | | | | |
| on Investments | — | — | — | — | — |
| Total from Investment Operations | .0002 | .0003 | .007 | .030 | .049 |
| Distributions | | | | | |
| Dividends from Net Investment Income | (.0002) | (.0003) | (.007) | (.030) | (.049) |
| Distributions from Realized Capital Gains | — | — | — | — | — |
| Total Distributions | (.0002) | (.0003) | (.007) | (.030) | (.049) |
| Net Asset Value, End of Period | $1.00 | $1.00 | $1.00 | $1.00 | $1.00 |
| |
| Total Return1 | 0.02% | 0.03% | 0.70% | 3.08% | 5.02% |
| |
| Ratios/Supplemental Data | | | | | |
| Net Assets, End of Period (Millions) | $15,314 | $18,726 | $25,435 | $23,289 | $20,064 |
| Ratio of Total Expenses to | | | | | |
| Average Net Assets | 0.11%2 | 0.14% | 0.15%3 | 0.10% | 0.10% |
| Ratio of Net Investment Income to | | | | | |
| Average Net Assets | 0.02% | 0.03% | 0.74% | 2.98% | 4.90% |
1 Total returns do not include account service fees that may have applied in the periods shown. Fund prospectuses provide information about any applicable account service fees.
2 The ratio of total expenses to average net assets before an expense reduction was 0.12%. See Note B in Notes to Financial Statements.
3 Includes 0.03% of fees to participate in the Treasury Temporary Guarantee Program for Money Market Funds.
See accompanying Notes, which are an integral part of the Financial Statements.
50
Admiral Treasury Money Market Fund
Notes to Financial Statements
Vanguard Admiral Treasury Money Market Fund is registered under the Investment Company Act of 1940 as an open-end investment company, or mutual fund. The fund invests in short-term debt instruments backed by the full faith and credit of the U.S. government.
A. The following significant accounting policies conform to generally accepted accounting principles for U.S. mutual funds. The fund consistently follows such policies in preparing its financial statements.
1. Security Valuation: Securities are valued at amortized cost, which approximates market value.
2. Federal Income Taxes: The fund intends to continue to qualify as a regulated investment company and distribute all of its taxable income. Management has analyzed the fund’s tax positions taken for all open federal income tax years (August 31, 2008–2011), and has concluded that no provision for federal income tax is required in the fund’s financial statements.
3. Distributions: Distributions from net investment income are declared daily and paid on the first business day of the following month.
4. Other: Interest income is accrued daily. Premiums and discounts on debt securities purchased are amortized and accreted, respectively, to interest income over the lives of the respective securities. Security transactions are accounted for on the date securities are bought or sold. Costs used to determine realized gains (losses) on the sale of investment securities are those of the specific securities sold.
B. The Vanguard Group furnishes at cost investment advisory, corporate management, administrative, marketing, and distribution services. The costs of such services are allocated to the fund under methods approved by the board of trustees. The fund has committed to provide up to 0.40% of its net assets in capital contributions to Vanguard. At August 31, 2011, the fund had contributed capital of $2,472,000 to Vanguard (included in Other Assets), representing 0.02% of the fund’s net assets and 0.99% of Vanguard’s capitalization. The fund’s trustees and officers are also directors and officers of Vanguard. Vanguard and the board of trustees have agreed to temporarily limit certain net operating expenses in excess of the fund’s daily yield so as to maintain a zero or positive yield for the fund. Vanguard and the board of trustees may terminate the temporary expense limitation at any time. For the year ended August 31, 2011, Vanguard’s management and administrative expenses were reduced by $1,220,000 (an effective annual rate of 0.01% of the fund’s average net assets).
C. Various inputs may be used to determine the value of the fund’s investments. These inputs are summarized in three broad levels for financial statement purposes. The inputs or methodologies used to value securities are not necessarily an indication of the risk associated with investing in those securities.
Level 1—Quoted prices in active markets for identical securities.
Level 2—Other significant observable inputs (including quoted prices for similar securities, interest rates, prepayment speeds, credit risk, etc.).
Level 3—Significant unobservable inputs (including the fund’s own assumptions used to determine the fair value of investments).
At August 31, 2011, 100% of the fund’s investments were valued using amortized cost, in accordance with rules under the Investment Company Act of 1940. Amortized cost approximates the current fair value of a security, but since the value is not obtained from a quoted price in an active market, securities valued at amortized cost are considered to be valued using Level 2 inputs.
D. In preparing the financial statements as of August 31, 2011, management considered the impact of subsequent events for potential recognition or disclosure in these financial statements.
51
Report of Independent Registered
Public Accounting Firm
To the Trustees of Vanguard Money Market Reserves and Vanguard Admiral Funds and the Shareholders of Vanguard Prime Money Market Fund, Vanguard Federal Money Market Fund and Vanguard Admiral Treasury Money Market Fund:
In our opinion, the accompanying statements of net assets, the statement of assets and liabilities and the related statements of operations and of changes in net assets and the financial highlights present fairly, in all material respects, the financial position of Vanguard Prime Money Market Fund, Vanguard Federal Money Market Fund and Vanguard Admiral Treasury Money Market Fund (the “Funds”) at August 31, 2011, the results of each of their operations for the year then ended, the changes in each of their net assets for each of the two years in the period then ended and the financial highlights for each of the five years in the period then ended, in conformity with accounting principles generally accepted in the United States of America. These financial statements and financial highlights (hereafter referred to as “financial statements”) are the responsibility of the Funds’ management; our responsibility is to express an opinion on these financial statements based on our audits. We conducted our audits of these financial statements in accordance with the standards of the Public Company Accounting Oversight Board (United States). Those standards require that we plan and perform the audit to obtain reasonable assurance about whether the financial statements are free of material misstatement. An audit includes examining, on a test basis, evidence supporting the amounts and disclosures in the financial statements, assessing the accounting principles used and significant estimates made by management, and evaluating the overall financial statement presentation. We believe that our audits, which included confirmation of securities at August 31, 2011 by correspondence with the custodians and brokers and by agreement to the underlying ownership records of Vanguard Municipal Cash Management Fund, provide a reasonable basis for our opinion.
PricewaterhouseCoopers LLP
Philadelphia, Pennsylvania
October 11, 2011
52
|
| Special 2011 tax information (unaudited) for Vanguard Prime Money Market Fund |
This information for the fiscal year ended August 31, 2011, is included pursuant to provisions of the Internal Revenue Code.
For nonresident alien shareholders, 73.0% of income dividends are interest-related dividends.
|
| Special 2011 tax information (unaudited) for Vanguard Federal Money Market Fund |
This information for the fiscal year ended August 31, 2011, is included pursuant to provisions of the Internal Revenue Code.
For nonresident alien shareholders, 100% of income dividends are interest-related dividends.
|
| Special 2011 tax information (unaudited) for Vanguard Admiral Treasury Money Market Fund |
This information for the fiscal year ended August 31, 2011, is included pursuant to provisions of the Internal Revenue Code.
For nonresident alien shareholders, 100% of income dividends are interest-related dividends.
53
About Your Fund’s Expenses
As a shareholder of the fund, you incur ongoing costs, which include costs for portfolio management, administrative services, and shareholder reports (like this one), among others. Operating expenses, which are deducted from a fund’s gross income, directly reduce the investment return of the fund.
A fund’s expenses are expressed as a percentage of its average net assets. This figure is known as the expense ratio. The following examples are intended to help you understand the ongoing costs (in dollars) of investing in your fund and to compare these costs with those of other mutual funds. The examples are based on an investment of $1,000 made at the beginning of the period shown and held for the entire period.
The accompanying table illustrates your fund’s costs in two ways:
• Based on actual fund return. This section helps you to estimate the actual expenses that you paid over the period. The ”Ending Account Value“ shown is derived from the fund‘s actual return, and the third column shows the dollar amount that would have been paid by an investor who started with $1,000 in the fund. You may use the information here, together with the amount you invested, to estimate the expenses that you paid over the period.
To do so, simply divide your account value by $1,000 (for example, an $8,600 account value divided by $1,000 = 8.6), then multiply the result by the number given for your fund under the heading ”Expenses Paid During Period.“
• Based on hypothetical 5% yearly return. This section is intended to help you compare your fund‘s costs with those of other mutual funds. It assumes that the fund had a yearly return of 5% before expenses, but that the expense ratio is unchanged. In this case—because the return used is not the fund’s actual return—the results do not apply to your investment. The example is useful in making comparisons because the Securities and Exchange Commission requires all mutual funds to calculate expenses based on a 5% return. You can assess your fund’s costs by comparing this hypothetical example with the hypothetical examples that appear in shareholder reports of other funds.
Note that the expenses shown in the table are meant to highlight and help you compare ongoing costs only and do not reflect transaction costs incurred by the fund for buying and selling securities. Further, the expenses do not include any purchase, redemption, or account service fees described in the fund prospectus. If such fees were applied to your account, your costs would be higher. Your fund does not carry a “sales load.”
The calculations assume no shares were bought or sold during the period. Your actual costs may have been higher or lower, depending on the amount of your investment and the timing of any purchases or redemptions.
You can find more information about the fund’s expenses, including annual expense ratios, in the Financial Statements section of this report. For additional information on operating expenses and other shareholder costs, please refer to your fund’s current prospectus.
54
| | | |
| Six Months Ended August 31, 2011 | | | |
| | Beginning | Ending | Expenses |
| | Account Value | Account Value | Paid During |
| | 2/28/2011 | 8/31/2011 | Period |
| Based on Actual Fund Return | | | |
| Prime Money Market Fund | | | |
| Investor Shares | $1,000.00 | $1,000.27 | $0.86 |
| Institutional Shares | 1,000.00 | 1,000.69 | 0.45 |
| Federal Money Market Fund | $1,000.00 | $1,000.07 | $0.76 |
| Admiral Treasury Money Market Fund | $1,000.00 | $1,000.09 | $0.40 |
| Based on Hypothetical 5% Yearly Return | | | |
| Prime Money Market Fund | | | |
| Investor Shares | $1,000.00 | $1,024.35 | $0.87 |
| Institutional Shares | 1,000.00 | 1,024.75 | 0.46 |
| Federal Money Market Fund | $1,000.00 | $1,024.45 | $0.77 |
| Admiral Treasury Money Market Fund | $1,000.00 | $1,024.80 | $0.41 |
The calculations are based on expenses incurred In the most recent six-month period. The funds’ annualized six-month expense ratios for the period are: for the Prime Money Market Fund, 0.17% for Investor Shares and 0.09% for Institutional Shares; for the Federal Money Market Fund, 0.15%; and for the Admiral Treasury Money Market Fund, 0.08%. The annualized six-month expense ratios for the Federal Money Market Fund and the Admiral Treasury Money Market Fund reflect a temporary reduction in operating expenses (described in Note B of the Notes to Financial Statements). Before the reduction, the annualized six-month expense ratIos were: for the Federal Money Market Fund, 0.17%; for the Admiral Treasury Money Market Fund, 0.09%.
55
Trustees Approve Advisory Arrangement
The board of trustees of Vanguard Prime Money Market Fund, Federal Money Market Fund, and Admiral Treasury Money Market Fund has renewed the funds’ investment advisory arrangement with The Vanguard Group, Inc. Vanguard—through its Fixed Income Group—serves as the investment advisor to the funds. The board determined that continuing the funds’ internalized management structure was in the best interests of the funds and their shareholders.
The board based its decision upon an evaluation of the advisor’s investment staff, portfolio management process, and performance. The trustees considered the factors discussed below, among others. However, no single factor determined whether the board approved the arrangement. Rather, it was the totality of the circumstances that drove the board’s decision.
Nature, extent, and quality of services
The board considered the quality of the funds’ investment management over both the short and long term and took into account the organizational depth and stability of the advisor. The board noted that Vanguard has been managing investments for more than three decades. The Fixed Income Group adheres to a sound, disciplined investment management process; the team has considerable experience, stability, and depth.
The board concluded that Vanguard’s experience, stability, depth, and performance, among other factors, warranted continuation of the advisory arrangement.
Investment performance
The board considered the short- and long-term performance of the funds, including any periods of outperformance or underperformance of relevant benchmarks and peer groups. The board concluded that the funds have performed in line with expectations, and that their results have been consistent with their investment policies. Information about each fund’s most recent performance can be found on the Performance Summary pages of this report.
Cost
The board concluded that each fund’s expense ratio was well below the average expense ratio charged by funds in its peer group and that the funds’ advisory fee rates were also well below their peer-group averages. Information about the funds’ expenses appears in the About Your Fund’s Expenses section of this report as well as in the Financial Statements sections.
The board does not conduct a profitability analysis of Vanguard, because of Vanguard’s unique “at-cost” structure. Unlike most other mutual fund management companies, Vanguard is owned by the funds it oversees, and produces “profits” only in the form of reduced expenses for fund shareholders.
The benefit of economies of scale
The board concluded that the funds’ low-cost arrangement with Vanguard ensures that the funds will realize economies of scale as they grow, with the cost to shareholders declining as fund assets increase.
The board will consider whether to renew the advisory arrangement again after a one-year period.
56
Glossary
SEC Yields. A money market fund’s 7-day SEC yield is calculated by annualizing its income distributions for the previous seven days, as required by the U.S. Securities and Exchange Commission.
Average Weighted Maturity. The average length of time until fixed income securities held by a fund reach maturity and are repaid. The figure reflects the proportion of fund assets represented by each security.
Credit Quality. For Vanguard money market funds, the Distribution by Credit Quality table includes tier ratings for consistency with SEC Rule 2a-7 under the Investment Company Act of 1940, which governs money market funds. A First Tier security is one that is eligible for money market funds and has been rated in the highest short-term rating category for debt obligations by the requisite nationally recognized statistical rating organizations. An unrated security is First Tier if it represents quality comparable to that of a rated security, as determined in accordance with SEC Rule 2a-7. A Second Tier security is one that is eligible for money market funds and is not a First Tier security.
Expense Ratio. The percentage of a fund’s average net assets used to pay its annual administrative and advisory expenses. These expenses directly reduce returns to investors.
Inception Date. The date on which the assets of a fund (or one of its share classes) are first invested in accordance with the fund’s investment objective. For funds with a subscription period, the inception date is the day after that period ends. Investment performance is measured from the inception date.
57
This page intentionally left blank.
This page intentionally left blank.
The People Who Govern Your Fund
The trustees of your mutual fund are there to see that the fund is operated and managed in your best interests since, as a shareholder, you are a part owner of the fund. Your fund’s trustees also serve on the board of directors of The Vanguard Group, Inc., which is owned by the Vanguard funds and provides services to them on an at-cost basis.
A majority of Vanguard’s board members are independent, meaning that they have no affiliation with Vanguard or the funds they oversee, apart from the sizable personal investments they have made as private individuals. The independent board members have distinguished backgrounds in business, academia, and public service. Each of the trustees and executive officers oversees 178 Vanguard funds.
The following table provides information for each trustee and executive officer of the fund. More information about the trustees is in the Statement of Additional Information, which can be obtained, without charge, by contacting Vanguard at 800-662-7447, or online at vanguard.com.
| |
| Interested Trustee1 | and President (2006–2008) of Rohm and Haas Co. |
| | (chemicals); Director of Tyco International, Ltd. |
| F. William McNabb III | (diversified manufacturing and services) and Hewlett- |
| Born 1957. Trustee Since July 2009. Chairman of the | Packard Co. (electronic computer manufacturing); |
| Board. Principal Occupation(s) During the Past Five | Senior Advisor at New Mountain Capital; Trustee |
| Years: Chairman of the Board of The Vanguard Group, | of The Conference Board; Member of the Board of |
| Inc., and of each of the investment companies served | Managers of Delphi Automotive LLP (automotive |
| by The Vanguard Group, since January 2010; Director | components). |
| of The Vanguard Group since 2008; Chief Executive | |
| Officer and President of The Vanguard Group and of | Amy Gutmann |
| each of the investment companies served by The | Born 1949. Trustee Since June 2006. Principal |
| Vanguard Group since 2008; Director of Vanguard | Occupation(s) During the Past Five Years: President |
| Marketing Corporation; Managing Director of The | of the University of Pennsylvania; Christopher H. |
| Vanguard Group (1995–2008). | Browne Distinguished Professor of Political Science |
| | in the School of Arts and Sciences with secondary |
| | appointments at the Annenberg School for Commu- |
| Independent Trustees | nication and the Graduate School of Education |
| | of the University of Pennsylvania; Director of |
| Emerson U. Fullwood | Carnegie Corporation of New York, Schuylkill River |
| Born 1948. Trustee Since January 2008. Principal | Development Corporation, and Greater Philadelphia |
| Occupation(s) During the Past Five Years: Executive | Chamber of Commerce; Trustee of the National |
| Chief Staff and Marketing Officer for North America | Constitution Center; Chair of the Presidential |
| and Corporate Vice President (retired 2008) of Xerox | Commission for the Study of Bioethical Issues. |
| Corporation (document management products and | |
| services); Executive in Residence and 2010 | JoAnn Heffernan Heisen |
| Distinguished Minett Professor at the Rochester | Born 1950. Trustee Since July 1998. Principal |
| Institute of Technology; Director of SPX Corporation | Occupation(s) During the Past Five Years: Corporate |
| (multi-industry manufacturing), the United Way of | Vice President and Chief Global Diversity Officer |
| Rochester, Amerigroup Corporation (managed health | (retired 2008) and Member of the Executive |
| care), the University of Rochester Medical Center, | Committee (1997–2008) of Johnson & Johnson |
| Monroe Community College Foundation, and North | (pharmaceuticals/consumer products); Director of |
| Carolina A&T University. | Skytop Lodge Corporation (hotels), the University |
| | Medical Center at Princeton, the Robert Wood |
| Rajiv L. Gupta | Johnson Foundation, and the Center for Work Life |
| Born 1945. Trustee Since December 2001.2 | Policy; Member of the Advisory Board of the |
| Principal Occupation(s) During the Past Five Years: | Maxwell School of Citizenship and Public Affairs |
| Chairman and Chief Executive Officer (retired 2009) | at Syracuse University. |
| | |
| F. Joseph Loughrey | Thomas J. Higgins | |
| Born 1949. Trustee Since October 2009. Principal | Born 1957. Chief Financial Officer Since September |
| Occupation(s) During the Past Five Years: President | 2008. Principal Occupation(s) During the Past Five |
| and Chief Operating Officer (retired 2009) and Vice | Years: Principal of The Vanguard Group, Inc.; Chief |
| Chairman of the Board (2008–2009) of Cummins Inc. | Financial Officer of each of the investment companies |
| (industrial machinery); Director of SKF AB (industrial | served by The Vanguard Group since 2008; Treasurer |
| machinery), Hillenbrand, Inc. (specialized consumer | of each of the investment companies served by The |
| services), the Lumina Foundation for Education, and | Vanguard Group (1998–2008). |
| Oxfam America; Chairman of the Advisory Council | | |
| for the College of Arts and Letters and Member | Kathryn J. Hyatt | |
| of the Advisory Board to the Kellogg Institute for | Born 1955. Treasurer Since November 2008. Principal |
| International Studies at the University of Notre Dame. | Occupation(s) During the Past Five Years: Principal |
| | of The Vanguard Group, Inc.; Treasurer of each of |
| André F. Perold | the investment companies served by The Vanguard |
| Born 1952. Trustee Since December 2004. Principal | Group since 2008; Assistant Treasurer of each of the |
| Occupation(s) During the Past Five Years: George | investment companies served by The Vanguard Group |
| Gund Professor of Finance and Banking at the Harvard | (1988–2008). | |
| Business School (retired July 2011); Chief Investment | | |
| Officer and co-Managing Partner of HighVista | Heidi Stam | |
| Strategies LLC (private investment firm); Director of | Born 1956. Secretary Since July 2005. Principal |
| Rand Merchant Bank; Overseer of the Museum of | Occupation(s) During the Past Five Years: Managing |
| Fine Arts Boston. | Director of The Vanguard Group, Inc., since 2006; |
| | General Counsel of The Vanguard Group since 2005; |
| Alfred M. Rankin, Jr. | Secretary of The Vanguard Group and of each of the |
| Born 1941. Trustee Since January 1993. Principal | investment companies served by The Vanguard Group |
| Occupation(s) During the Past Five Years: Chairman, | since 2005; Director and Senior Vice President of |
| President, and Chief Executive Officer of NACCO | Vanguard Marketing Corporation since 2005; |
| Industries, Inc. (forklift trucks/housewares/lignite); | Principal of The Vanguard Group (1997–2006). |
| Director of Goodrich Corporation (industrial products/ | | |
| aircraft systems and services) and the National | | |
| Association of Manufacturers; Chairman of the | Vanguard Senior Management Team |
| Federal Reserve Bank of Cleveland; Vice Chairman | | |
| of University Hospitals of Cleveland; President of | R. Gregory Barton | Michael S. Miller |
| the Board of The Cleveland Museum of Art. | Mortimer J. Buckley | James M. Norris |
| | Kathleen C. Gubanich | Glenn W. Reed |
| Peter F. Volanakis | Paul A. Heller | George U. Sauter |
| Born 1955. Trustee Since July 2009. Principal | Martha G. King | |
| Occupation(s) During the Past Five Years: President | | |
| and Chief Operating Officer (retired 2010) of Corning | | |
| Incorporated (communications equipment); Director of | Chairman Emeritus and Senior Advisor |
| Corning Incorporated (2000–2010) and Dow Corning | | |
| (2001–2010); Overseer of the Amos Tuck School of | John J. Brennan | |
| Business Administration at Dartmouth College. | Chairman, 1996–2009 | |
| | Chief Executive Officer and President, 1996–2008 |
| |
| Executive Officers | | |
| | Founder | |
| Glenn Booraem | | |
| Born 1967. Controller Since July 2010. Principal | John C. Bogle | |
| Occupation(s) During the Past Five Years: Principal | Chairman and Chief Executive Officer, 1974–1996 |
| of The Vanguard Group, Inc.; Controller of each of | | |
| the investment companies served by The Vanguard | | |
| Group since 2010; Assistant Controller of each of | | |
| the investment companies served by The Vanguard | | |
| Group (2001–2010). | | |
1 Mr. McNabb is considered an “interested person,” as defined in the Investment Company Act of 1940, because he is an officer of the Vanguard funds.
2 December 2002 for Vanguard Equity Income Fund, Vanguard Growth Equity Fund, the Vanguard Municipal Bond Funds, and the Vanguard State Tax-Exempt Funds.
|  |
| P.O. Box 2600 |
| Valley Forge, PA 19482-2600 |
Connect with Vanguard® > vanguard.com
| |
| Fund Information > 800-662-7447 | |
| Direct Investor Account Services > 800-662-2739 | |
| Institutional Investor Services > 800-523-1036 | |
| Text Telephone for People | |
| With Hearing Impairment > 800-749-7273 | |
| |
| This material may be used in conjunction | |
| with the offering of shares of any Vanguard | |
| fund only if preceded or accompanied by | |
| the fund’s current prospectus. | |
| |
| All comparative mutual fund data are from Lipper Inc. or | |
| Morningstar, Inc., unless otherwise noted. | |
| |
| You can obtain a free copy of Vanguard’s proxy voting | |
| guidelines by visiting vanguard.com/proxyreporting or by | |
| calling Vanguard at 800-662-2739. The guidelines are | |
| also available from the SEC’s website, sec.gov. In | |
| addition, you may obtain a free report on how your fund | |
| voted the proxies for securities it owned during the 12 | |
| months ended June 30. To get the report, visit either | |
| vanguard.com/proxyreporting or sec.gov. | |
| |
| You can review and copy information about your fund at | |
| the SEC’s Public Reference Room in Washington, D.C. To | |
| find out more about this public service, call the SEC at | |
| 202-551-8090. Information about your fund is also | |
| available on the SEC’s website, and you can receive | |
| copies of this information, for a fee, by sending a | |
| request in either of two ways: via e-mail addressed to | |
| publicinfo@sec.gov or via regular mail addressed to the | |
| Public Reference Section, Securities and Exchange | |
| Commission, Washington, DC 20549-1520. | |
| |
| |
| | © 2011 The Vanguard Group, Inc. |
| | All rights reserved. |
| | Vanguard Marketing Corporation, Distributor. |
| |
| | Q300 102011 |
Item 2: Code of Ethics. The Registrant has adopted a code of ethics that applies to the Registrant’s principal executive officer, principal financial officer, principal accounting officer or controller or persons performing similar functions. The Code of Ethics was amended during the reporting period covered by this report to make certain technical, non-material changes.
Item 3: Audit Committee Financial Expert. The following members of the Audit Committee have been determined by the Registrant’s Board of Trustees to be Audit Committee Financial Experts serving on its Audit Committee, and to be independent: Charles D. Ellis, Rajiv L. Gupta, JoAnn Heffernan Heisen, André F. Perold, and Alfred M. Rankin, Jr.
Item 4: Principal Accountant Fees and Services.
(a) Audit Fees.
Audit Fees of the Registrant
Fiscal Year Ended August 31, 2011: $56,000
Fiscal Year Ended August 31, 2010: $52,000
Aggregate Audit Fees of Registered Investment Companies in the Vanguard Group.
Fiscal Year Ended August 31, 2011: $3,978,540
Fiscal Year Ended August 31, 2010: $3,607,060
(b) Audit-Related Fees.
Fiscal Year Ended August 31, 2011: $1,341,750
Fiscal Year Ended August 31, 2010: $791,350
Includes fees billed in connection with assurance and related services provided to the Registrant, The Vanguard Group, Inc., Vanguard Marketing Corporation, and other registered investment companies in the Vanguard Group.
(c) Tax Fees.
Fiscal Year Ended August 31, 2011: $373,830
Fiscal Year Ended August 31, 2010: $336,090
Includes fees billed in connection with tax compliance, planning and advice services provided to the Registrant, The Vanguard Group, Inc., Vanguard Marketing Corporation, and other registered investment companies in the Vanguard Group and related to income and excise taxes.
(d) All Other Fees.
Fiscal Year Ended August 31, 2011: $16,000
Fiscal Year Ended August 31, 2010: $16,000
Includes fees billed for services related to risk management and privacy matters. Services were provided to the Registrant, The Vanguard Group, Inc., Vanguard Marketing Corporation, and other registered investment companies in the Vanguard Group.
(e) (1) Pre-Approval Policies. The policy of the Registrant’s Audit Committee is to consider and, if appropriate, approve before the principal accountant is engaged for such services, all specific audit and non-audit services provided to: (1) the Registrant; (2) The Vanguard Group, Inc.; (3) other entities controlled by The Vanguard Group, Inc. that provide ongoing services to the Registrant; and (4) other registered investment
companies in the Vanguard Group. In making a determination, the Audit Committee considers whether the services are consistent with maintaining the principal accountant’s independence.
In the event of a contingency situation in which the principal accountant is needed to provide services in between scheduled Audit Committee meetings, the Chairman of the Audit Committee would be called on to consider and, if appropriate, pre-approve audit or permitted non-audit services in an amount sufficient to complete services through the next Audit Committee meeting, and to determine if such services would be consistent with maintaining the accountant’s independence. At the next scheduled Audit Committee meeting, services and fees would be presented to the Audit Committee for formal consideration, and, if appropriate, approval by the entire Audit Committee. The Audit Committee would again consider whether such services and fees are consistent with maintaining the principal accountant’s independence.
The Registrant’s Audit Committee is informed at least annually of all audit and non-audit services provided by the principal accountant to the Vanguard complex, whether such services are provided to: (1) the Registrant; (2) The Vanguard Group, Inc.; (3) other entities controlled by The Vanguard Group, Inc. that provide ongoing services to the Registrant; or (4) other registered investment companies in the Vanguard Group.
(2) No percentage of the principal accountant’s fees or services were approved pursuant to the waiver provision of paragraph (c)(7)(i)(C) of Rule 2-01 of Regulation S-X.
(f) For the most recent fiscal year, over 50% of the hours worked under the principal accountant’s engagement were not performed by persons other than full-time, permanent employees of the principal accountant.
(g) Aggregate Non-Audit Fees.
Fiscal Year Ended August 31, 2011: $389,830
Fiscal Year Ended August 31, 2010: $352,090
Includes fees billed for non-audit services provided to the Registrant, The Vanguard Group, Inc., Vanguard Marketing Corporation, and other registered investment companies in the Vanguard Group.
(h) For the most recent fiscal year, the Audit Committee has determined that the provision of all non-audit services was consistent with maintaining the principal accountant’s independence.
Item 5: Audit Committee of Listed Registrants.
Not Applicable.
Item 6: Investments.
Not Applicable.
Item 7: Disclosure of Proxy Voting Policies and Procedures for Closed-End Management Investment Companies.
Not Applicable.
Item 8: Portfolio Managers of Closed-End Management Investment Companies.
Not Applicable.
Item 9: Purchase of Equity Securities by Closed-End Management Investment Company and Affiliated Purchasers.
Not Applicable.
Item 10: Submission of Matters to a Vote of Security Holders.
Not Applicable.
Item 11: Controls and Procedures.
(a) Disclosure Controls and Procedures. The Principal Executive and Financial Officers concluded that the Registrant's Disclosure Controls and Procedures are effective based on their evaluation of the Disclosure Controls and Procedures as of a date within 90 days of the filing date of this report.
(b) Internal Control Over Financial Reporting. There were no significant changes in Registrant’s Internal Control Over Financial Reporting or in other factors that could significantly affect this control subsequent to the date of the evaluation, including any corrective actions with regard to significant deficiencies and material weaknesses.
Item 12: Exhibits.
(a) Code of Ethics.
(b) Certifications.
Pursuant to the requirements of the Securities Exchange Act of 1934 and the Investment Company Act of 1940, the registrant has duly caused this report to be signed on its behalf by the undersigned, thereunto duly authorized.
| |
| | VANGUARD MONEY MARKET RESERVES |
| |
| By: | /s/ F. WILLIAM MCNABB III* |
| | F. WILLIAM MCNABB III |
| | CHIEF EXECUTIVE OFFICER |
| |
| Date: October 20, 2011 |
Pursuant to the requirements of the Securities Exchange Act of 1934 and the Investment Company Act of 1940, this report has been signed below by the following persons on behalf of the registrant and in the capacities and on the dates indicated.
| |
| | VANGUARD MONEY MARKET RESERVES |
| |
| By: | /s/ F. WILLIAM MCNABB III* |
| | F. WILLIAM MCNABB III |
| | CHIEF EXECUTIVE OFFICER |
| |
| Date: October 20, 2011 |
| |
| | VANGUARD MONEY MARKET RESERVES |
| |
| By: | /s/ THOMAS J. HIGGINS* |
| | THOMAS J. HIGGINS |
| | CHIEF FINANCIAL OFFICER |
| |
| Date: October 20, 2011 |
* By: /s/ Heidi Stam
Heidi Stam, pursuant to a Power of Attorney filed on April 26, 2010, see file Number 33-53683, Incorporated by Reference.
THE VANGUARD FUNDS’ CODE OF ETHICS
FOR
SENIOR EXECUTIVE AND FINANCIAL OFFICERS
I. Introduction
The Board of Trustees of each registered investment company that is managed, sponsored, and distributed by The Vanguard Group, Inc. (“VGI”) (each a “Vanguard Fund” and collectively the “Vanguard Funds”) has adopted this code of ethics (the “Code”) as required by Section 406 of the Sarbanes-Oxley Act. The Code applies to the individuals in positions listed on Exhibit A (the “Covered Officers”). All Covered Officers, along with employees of The Vanguard Group, Inc., are subject to separate and distinct obligations from this Code under a Code of Ethics adopted pursuant to Rule 17j-1 under the Investment Company Act of 1940 (“17j-1 Code of Ethics”), policies to prevent the misuse of non-public information, and other internal compliance guidelines and policies that may be in effect from time to time.
This Code is designed to promote:
Honest and ethical conduct, including the ethical handling of conflicts of interest;
Full, fair, accurate, timely, and understandable disclosure in reports and documents that a Vanguard Fund files with, or submits to, the U.S. Securities and Exchange Commission, or in other public communications made by the Vanguard Funds or VGI;
Compliance with applicable laws, governmental rules, and regulations;
Prompt internal reporting to those identified in the Code of violations of the Code; and
Accountability for adherence to the Code.
| II. | Actual or Apparent Conflicts of Interest |
| | A. | Covered Officers should conduct all activities in accordance with the following |
| | | principles: | |
| | | 1. | Shareholders’ interests come first. In the course of fulfilling their duties and responsibilities to Vanguard Fund shareholders, Covered Officers must at all times place the interests of Vanguard Fund shareholders first. In particular, Covered Officers must avoid serving their own personal interests ahead of the interests of Vanguard Fund shareholders. |
| | | 2. | Conflicts of interest must be avoided. Covered Officers must avoid any situation involving an actual or potential conflict of interest or possible impropriety with respect to their duties and responsibilities to Vanguard Fund shareholders. |
| | | 3. | Compromising situations must be avoided. Covered Officers must not take advantage of their position of trust and responsibility. Covered Officers must avoid any situation that might compromise or call into question their exercise of full independent judgment in the best interests of Vanguard Fund shareholders. |
All activities of Covered Officers should be guided by and adhere to these fiduciary standards regardless of whether the activity is specifically described in this Code.
| B. | Restricted Activities |
| | 1. | Prohibition on secondary employment. Covered Officers are prohibited from accepting or serving in any form of secondary employment. Secondary employment that does not create a potential conflict of interest may be approved by the General Counsel of VGI. |
| | 2. | Prohibition on service as director or public official. Unless approved by the General Counsel of VGI, Covered Officers are prohibited from serving on the board of directors of any publicly traded company or in an official capacity for any federal, state, or local government (or governmental agency or instrumentality). |
| | 3. | Prohibition on misuse of Vanguard time or property. Covered Officers are prohibited from making use of time, equipment, services, personnel or property of any Vanguard entity for any purposes other than the performance of their duties and responsibilities in connection with the Vanguard Funds or other Vanguard-related entities. |
| III. | Disclosure and Compliance |
| | A. | Each Covered Officer should be familiar with the disclosure requirements generally |
| | | applicable | to the Vanguard Funds. |
| | B. | Each Covered Officer should not knowingly misrepresent, or cause others to |
| | | misrepresent, | facts about the Vanguard Funds to others, including to the Vanguard |
| | | Funds’ | directors and auditors, or to government regulators and self-regulatory |
| | | organizations. | |
| | C. | Each Covered Officer should, to the extent appropriate within the Covered Officer’s |
| | | area | of responsibility, consult with other officers and employees of VGI and advisers to |
| | | a | Vanguard Fund with the goal of promoting full, fair, accurate, timely and |
| | | understandable | disclosure in the reports and documents the fund files with, or submits |
| | | to, | the SEC and in other public communications made by a Vanguard Fund. |
| | D. | It is the responsibility of each Covered Officer to promote compliance with the |
| | | standards | and restrictions imposed by applicable laws, rules, regulations, and the 17j-1 |
| | | Code | of Ethics. |
| IV. | Reporting and Accountability |
| | A. | Each Covered Officer must: |
| | | 1. | Upon adoption or amendment of the Code (or thereafter as applicable, upon becoming a Covered Officer), affirm in writing that he or she has received, read, and understands the Code; |
| | 2. | Affirm at least annually in writing that he or she has complied with the requirements of the Code; |
| | 3. | Not retaliate against any other Covered Officer or any employee of VGI for reports of potential violations of the Code that are made in good faith; and |
| | 4. | Notify the General Counsel of VGI promptly if the Covered Officer knows of any violations of this Code. |
| B. | The Vanguard Funds will use the following procedures in investigating and enforcing |
| | this | Code: |
| | 1. | The General Counsel of VGI is responsible for applying this Code to specific situations and has the authority to interpret this Code in any particular situation. The General Counsel will report on an as-needed basis to the Board of Trustees regarding activities subject to the Code. |
| | 2. | The General Counsel will take all appropriate action to investigate any potential violations of the Code that are reported to him. |
| | 3. | If, after investigation, the General Counsel believes that no material violation of the Code has occurred, the General Counsel is not required to take any further action. |
| | 4. | Any matter that the General Counsel believes is a material violation of the Code will be reported to the Board of Trustees of the Vanguard Funds. |
| | 5. | If the Board of Trustees of the Vanguard Funds concurs that a material violation of the Code has occurred, the Board will consider appropriate action. Appropriate action may include reassignment, suspension, or dismissal of the applicable Covered Officer(s), or any other sanctions the Board deems appropriate. Appropriate action may also include review of, and appropriate modifications to, applicable policies and procedures. |
| | 6. | Any changes to or waiver of this Code will, to the extent required, be disclosed as provided by SEC rules. |
V. Other Policies and Procedures
This Code shall be the sole code of conduct adopted by the Vanguard Funds for purposes of Section 406 of the Sarbanes-Oxley Act and the rules and forms applicable to registered investment companies thereunder. Insofar as other policies or procedures of the Vanguard Funds, VGI, or other service providers govern or purport to govern the behavior or activities of the Covered Officers, they are superseded by this Code to the extent that they overlap or conflict with the provisions of this Code.
VGI’s and the Vanguard Funds’ 17j-1 Code of Ethics, policies to prevent the misuse of non-public information, and other internal compliance guidelines and policies that may be in effect from time to time are separate requirements applying to the Covered Officers and others, and are not part of this Code.
VI. Amendments
This Code may not be materially amended except by the approval of a majority vote of the independent trustees of the Vanguard Funds’ Board of Trustees. Non-material, technical, and administrative revisions of the Code do not have to be approved by the Board of Trustees. Amendments must be in writing and communicated promptly to the Covered Officers, who shall affirm receipt of the amended Code in accordance with Section IV. A. 1.
VII. Confidentiality
All reports and records prepared or maintained pursuant to this Code shall be considered confidential and shall be maintained and protected accordingly. Except as otherwise required by law or this Code, such matters shall not be disclosed to anyone other than the Vanguard Funds’ Board of Trustees, VGI’s General Counsel and the Chief Compliance Officer of VGI and the Vanguard Funds.
Last Reviewed: March 25, 2011
EXHIBIT A
TO THE VANGUARD FUNDS’ CODE OF ETHICS
FOR
SENIOR EXECUTIVE AND FINANCIAL OFFICERS
Covered Officers:
Chairman, President and Chief Executive Officer of The Vanguard Group, Inc. and the Vanguard Funds
Managing Director of Strategy and Finance of The Vanguard Group, Inc.
Chief Financial Officer of The Vanguard Group, Inc.
Controller of The Vanguard Group, Inc.
Director of Domestic Finance of The Vanguard Group, Inc. Director of International Finance of The Vanguard Group, Inc. Assistant Controller(s) of The Vanguard Group, Inc. Principal of Internal Audit, The Vanguard Group, Inc.
Chief Financial Officer of the Vanguard Funds Treasurer of the Vanguard Funds Controller of the Vanguard Funds Assistant Treasurer(s) of the Vanguard Funds Assistant Controller(s) of the Vanguard Funds