UNITED STATES
SECURITIES AND EXCHANGE COMMISSION
Washington, D.C. 20549
FORM N-CSR
CERTIFIED SHAREHOLDER REPORT
OF
REGISTERED MANAGEMENT INVESTMENT COMPANIES
| | |
| Investment Company Act file number: | 811-02554 |
Name of Registrant: | Vanguard Money Market Reserves |
Address of Registrant: | P.O. Box 2600 |
| | Valley Forge, PA 19482 |
Name and address of agent for service: | Heidi Stam, Esquire
P.O. Box 876
Valley Forge, PA 19482 |
| |
| |
Registrant’s telephone number, including area code: | (610) 669-1000 | |
Date of fiscal year end: | August 31 | |
Date of reporting period: | September 1, 2013 – August 31, 2014 |
Item 1: Reports to Shareholders | |
Annual Report | August 31, 2014
Vanguard Money Market Funds
Vanguard Prime Money Market Fund
Vanguard Federal Money Market Fund
Vanguard Admiral™ Treasury Money Market Fund
The mission continues
On May 1, 1975, Vanguard began operations, a fledgling company based on the simple but revolutionary idea that a mutual fund company should be managed solely in the interest of its investors.
Four decades later, that revolutionary spirit continues to animate the enterprise. Vanguard remains on a mission to give investors the best chance of investment success.
As we mark our 40th anniversary, we thank you for entrusting your assets to Vanguard and giving us the opportunity to help you reach your financial goals in the decades to come.
| Contents | |
| Your Fund’s Total Returns. | 1 |
| Chairman’s Letter. | 2 |
| Advisor’s Report. | 8 |
| Prime Money Market Fund. | 10 |
| Federal Money Market Fund. | 30 |
| Admiral Treasury Money Market Fund. | 42 |
| About Your Fund’s Expenses. | 54 |
| Trustees Approve Advisory Arrangements. | 56 |
| Glossary. | 57 |
Please note: The opinions expressed in this report are just that—informed opinions. They should not be considered promises or advice.
Also, please keep in mind that the information and opinions cover the period through the date on the front of this report. Of course, the
risks of investing in your fund are spelled out in the prospectus.
See the Glossary for definitions of investment terms used in this report.
About the cover: Since our founding, Vanguard has drawn inspiration from the enterprise and valor demonstrated by British
naval hero Horatio Nelson and his command at the Battle of the Nile in 1798. The photograph displays a replica of a merchant
ship from the same era as Nelson’s flagship, the HMS Vanguard.
Your Fund’s Total Returns
| | |
| Fiscal Year Ended August 31, 2014 | | |
| | 7-Day | Total |
| | SEC Yield | Returns |
| Vanguard Prime Money Market Fund | | |
| Investor Shares | 0.01% | 0.02% |
| Money Market Funds Average | | 0.00 |
| Institutional Shares | 0.05% | 0.06% |
| Institutional Money Market Funds Average | | 0.00 |
| Money Market Funds Average and Institutional Money Market Funds Average: Derived from data provided by Lipper, a Thomson Reuters Company. |
|
| |
| Vanguard Federal Money Market Fund | 0.01% | 0.02% |
| Government Money Market Funds Average | 0.00 |
| Government Money Market Funds Average: Derived from data provided by Lipper, a Thomson Reuters Company. |
| |
| Vanguard Admiral Treasury Money Market Fund | 0.01% | 0.01% |
| iMoneyNet Money Fund Report’s 100% Treasury Funds Average | 0.00 |
iMoneyNet Money Fund Report’s 100% Treasury Funds Average: Derived from data provided by iMoneyNet, Inc.
The 7-day SEC yield of a money market fund more closely reflects the current earnings of the fund than its total return.
Institutional Shares are available to certain institutional investors who meet specific administrative, service, and account-size criteria.

Chairman’s Letter
Dear Shareholder,
While longer-term interest rates rose and then fell over the 12 months ended August 31, 2014, very short-term interest rates remained anchored near zero. As a consequence, money market funds provided little in the way of income.
Vanguard Prime Money Market Fund returned 0.02% for Investor Shares, and its Institutional Shares, with their lower expense ratio, returned 0.06%. Vanguard Federal Money Market Fund returned 0.02% and Vanguard Admiral Treasury Money Market Fund 0.01%. Those slim returns were nevertheless more than the 0.00% average return of each of their peer groups.
The funds’ 7-day SEC yields were little changed from a year earlier. As of August 31, the yield of the Prime Money Market Fund held steady at 0.01% for Investor Shares and ticked up from 0.04% to 0.05% for Institutional Shares. The yield of the Federal Money Market Fund slipped from 0.02% to 0.01%, and that of the Admiral Treasury Money Market Fund stood unchanged at 0.01%.
On a separate note, the Securities and Exchange Commission adopted a number of changes in July to money market fund regulations. With these changes, and the significant safeguards it adopted in 2010, the SEC has issued a strong response to those who believe that institutional money market funds pose a systemic risk to the
financial markets. The vast majority of investors in Vanguard money market funds will not be affected by the changes. A brief overview of the new rules can be found in the box on page 7.
Fixed income saw solid gains both at home and abroad
The broad U.S. taxable bond market returned 5.66% for the period, rallying from the drubbing it took a year ago. Municipal bonds fared even better, returning 10.14% as greater investor appetite for tax-exempt income drove up demand and as a decline in new issues limited supply.
International bond markets (as measured by the Barclays Global Aggregate Index ex USD) returned 6.52%. The European Central Bank continued its monetary easing, which included the unprecedented step of lowering a key interest rate below zero, to –0.10%, to try to avert deflation and induce banks to lend and thus fuel economic growth. The central banks of Japan and China implemented stimulus measures as well.
Following such a strong advance for bonds, it’s worth remembering that the current low yields imply lower future returns: As yields drop, the scope for further declines—and increases in prices—diminishes.
Stocks cleared hurdles en route to new highs
Despite an assortment of challenges, the broad U.S. stock market recorded an impressive return of about 25% for the 12 months ended August 31. U.S. stocks
| | | |
| Market Barometer | | | |
| | Average Annual Total Returns
Periods Ended August 31, 2014 |
| |
| | One
Year | Three
Years | Five
Years |
| |
| Bonds | | | |
| Barclays U.S. Aggregate Bond Index (Broad taxable | | | |
| market) | 5.66% | 2.91% | 4.48% |
| Barclays Municipal Bond Index (Broad tax-exempt market) | 10.14 | 4.88 | 5.39 |
| Citigroup Three-Month U.S. Treasury Bill Index | 0.04 | 0.04 | 0.07 |
| |
| Stocks | | | |
| Russell 1000 Index (Large-caps) | 25.36% | 20.80% | 17.24% |
| Russell 2000 Index (Small-caps) | 17.68 | 19.00 | 17.03 |
| Russell 3000 Index (Broad U.S. market) | 24.74 | 20.65 | 17.22 |
| FTSE All-World ex US Index (International) | 18.04 | 9.48 | 8.44 |
| |
| CPI | | | |
| Consumer Price Index | 1.70% | 1.64% | 1.96% |
3
registered positive results in all but two months, and a late-July swoon was followed by an August flurry of record highs.
Investors applauded mostly solid corporate earnings, generally upbeat economic news, and the Federal Reserve’s continued accommodative policies. Still, turmoil in the Middle East and Ukraine, economic worries in Europe and China, and uncertainty about the Fed’s next moves pressured stocks at different times.
International stocks returned about 18%. Emerging markets, after sliding earlier in the period, rebounded to lead the way. The developed markets of the Pacific region and Europe trailed but still notched double-digit returns.
Despite very low rates, the advisor eked out incremental income
Bonds have confounded expectations so far in 2014. The markets had anticipated that yields, which had been rising across the board toward the end of 2013, would continue to do so once the Fed began scaling back its unprecedented bond-buying program. That proved to be the case for some shorter-dated bonds, but a revival in investor demand for longer-dated securities sent their yields in the opposite direction even as the Fed pulled back on its purchases.
The yield of the 10-year U.S. Treasury note fell to 2.34% as of August 31, from 2.76% 12 months earlier, and the 30-year Treasury fell to 3.08% from 3.72%. In contrast, the yield of the 3-month Treasury bill ended
| | |
| Expense Ratios | | |
| Your Fund Compared With Its Peer Group | | |
| | | Peer Group
Average |
| | Fund |
| Prime Money Market | | |
| Investor Shares | 0.17% | 0.23% |
| Institutional Shares | 0.10 | 0.21 |
| Federal Money Market | 0.14 | 0.14 |
| Admiral Treasury Money Market | 0.09 | 0.12 |
The fund expense ratios shown are from the prospectus dated December 23, 2013, and represent estimated costs for the current fiscal year.
For the fiscal year ended August 31, 2014, the funds’ expense ratios were: for the Prime Money Market Fund, 0.14% for Investor Shares and
0.10% for Institutional Shares; for the Federal Money Market Fund, 0.09%; for the Admiral Treasury Money Market Fund, 0.05%. The expense
ratios for the Prime Money Market Fund Investor Shares, the Federal Money Market Fund, and the Admiral Treasury Money Market Fund
reflect a temporary reduction in operating expenses (described in Note B of the Notes to Financial Statements). Before the reduction, the
expense ratios were: for the Prime Money Market Fund Investor Shares, 0.16%; for the Federal Money Market Fund, 0.11%; for the Admiral
Treasury Money Market Fund, 0.09%.
Peer groups: For the Prime Money Market Fund Investor Shares, Money Market Funds, and for the Institutional Shares, Institutional
Money Market Funds; for the Federal Money Market Fund, Government Money Market Funds; and for the Admiral Treasury Money
Market Fund, U.S. Treasury Money Market Funds.
4
the period at 0.03%, and that of the 6-month bill at 0.06%, both very near where they had started.
Even in this environment, the funds’ advisor, Vanguard Fixed Income Group, was able to find some relative value opportunities among U.S. government securities, which are the focus of the Admiral Treasury and Federal Money Market Funds and make up a significant part of the Prime Money Market Fund as well.
The Prime Money Market Fund, which has a broader investment mandate than the other funds, was able to increase its diversification and make a little more income over the 12 months by adding to its overseas holdings. While lightening the fund’s allocation to U.S. government obligations and commercial paper, the fund’s advisor selectively added high-quality European debt offering attractive yields. The decision to reenter the European market reflects the region’s progress in stabilizing its economy and financial system. The fund continued to hold Australian and Canadian debt as well. (All securities the fund invests in are denominated in U.S. dollars to avoid currency risk.)
The advisor also saw relative value in some new types of securities launched in 2014. They included repurchase agreements with the Fed as the counterparty, which were bought by the Prime Money Market Fund, and a two-year floating-rate note issued by the Treasury, which the advisor included in the Admiral Treasury Money Market Fund.
| |
Total Returns
Ten Years Ended August 31, 2014 | |
| |
| | Average
Annual Return |
| |
| Prime Money Market Fund Investor Shares | 1.69% |
| Money Market Funds Average | 1.35 |
| Money Market Funds Average: Derived from data provided by Lipper, a Thomson Reuters Company. |
| |
| Federal Money Market Fund | 1.62% |
| Government Money Market Funds Average | 1.31 |
| Government Money Market Funds Average: Derived from data provided by Lipper, a Thomson Reuters Company. |
| |
| Admiral Treasury Money Market Fund | 1.52% |
| iMoneyNet Money Fund Report’s 100% Treasury Funds Average | 1.16 |
| iMoneyNet Money Fund Report’s 100% Treasury Funds Average: Derived from data provided by Lipper, a Thomson Reuters Company. |
Investment returns will fluctuate. All of the returns in this report represent past performance, which is not a guarantee of future results that may be achieved by the funds. (Current performance may be lower or higher than the performance data cited. For performance data current to the most recent month-end, visit our website at vanguard.com/performance.) An investment in a money market fund is not insured or guaranteed by the Federal Deposit Insurance Corporation or any other government agency. Although a money market fund seeks to preserve the value of your investment at $1 per share, it is possible to lose money by investing in such a fund.
5
For more information about the advisor’s strategies and the funds’ positioning during the year, please see the Advisor’s Report that follows this letter.
Gains that came early on buoyed the three funds’ ten-year returns
Although Fed monetary policy has translated into very low returns for the three funds since the financial crisis began, gains made before then helped lift their performance over the last decade. For the ten years ended August 31, 2014, the average annual return for the Prime Money Market Fund was 1.69% for Investor Shares and 1.82% for Institutional Shares. The Federal Money Market Fund returned a little less than that, 1.62%, and the Admiral Treasury Money Market Fund 1.52%. It’s pleasing to note that all three funds outpaced the average annual returns of their peer funds by 24 to 36 basis points, not insignificant margins given how low yields have been. (A basis point is one-hundredth of a percentage point.)
High costs don’t equal strong fund performance
The adage “You get what you pay for” doesn’t apply to mutual funds. In fact, the reverse is true: Research suggests that higher costs are consistent with weaker returns. (See, for example, Shopping for Alpha: You Get What You Don’t Pay For at vanguard.com/research.)
| | |
| Changes in Yields | | |
| | SEC 7-Day Annualized Yield |
| | August 31, | August 31, |
| Money Market Fund | 2014 | 2013 |
| Prime | | |
| Investor Shares | 0.01% | 0.01% |
| Institutional Shares | 0.05 | 0.04 |
| Federal | 0.01 | 0.02 |
| Admiral Treasury | 0.01 | 0.01 |
6
Wouldn’t paying the highest fees allow you to purchase the services of the greatest talents, and therefore get you the best returns? As it turns out, the data don’t support that argument. The explanation is simple: Every dollar paid for management fees is a dollar less earning potential return. Keeping expenses down can help narrow the gap between what the markets return and what investors actually earn.
That’s why Vanguard seeks to minimize costs on all our funds. Indexing, of course, is the purest expression of low-cost investing. And we negotiate low fees for our actively managed funds, which are run by world-class advisors. It’s a strategy that reflects decades of experience and research, boiled down to one tenet: The less you pay, the more you keep.
As always, thank you for investing with Vanguard.
Sincerely,
F. William McNabb III
Chairman and Chief Executive Officer
September 11, 2014
|
| New rules on money funds won’t affect most Vanguard investors |
| |
| New rules governing money market funds garnered significant attention over the summer. But under these rules, approved by the Securities and Exchange Commission (SEC), it will be business as usual for the vast majority of Vanguard clients invested in such funds. A key point is that money market funds catering to individual investors will be allowed to continue to seek to maintain a stable $1 share price, or net asset value (NAV). |
|
|
|
|
| |
| The SEC has put in place a new framework that will enable a fund’s board of directors to address a “run on the fund” by imposing redemption fees or even suspending redemptions. The board will be able to take these measures when the fund’s liquidity—the percentage of its assets invested in securities that may be readily traded in the market—falls below a certain predefined level. |
|
|
|
|
| |
| More extensive changes are in store for institutional money market funds, which proved more susceptible to large-scale redemptions during the 2008–2009 financial crisis. Most significantly, these funds will have to shift from a fixed share price to a floating NAV. |
|
|
| |
| Although some rules must be implemented sooner, the compliance date for the core reforms is in autumn 2016, which gives investors time to find alternatives if they wish. We will no doubt be reporting to you again as we work through the implications of these changes for our clients and our lineup of funds. |
|
|
|
7
Advisor’s Report
With short-term interest rates hovering near zero for more than five years now, money market instruments yielded little return for the fiscal year ended August 31, 2014. Vanguard Prime Money Market Fund returned 0.02% for Investor Shares and 0.06% for Institutional Shares. Vanguard Federal Money Market Fund returned 0.02% and Vanguard Admiral Treasury Money Market Fund 0.01%. While those returns are frustratingly low, the funds continued to fulfill their crucial role for investors as a very liquid, high-quality cash management vehicle.
The investment environment
Bond yields drifted higher toward the end of 2013 in anticipation that the Federal Reserve would start dialing back its bond purchases given what it deemed to be sufficient underlying strength in the economy. But yields at the longer end of the curve reversed course in the new year, in part because the economy unexpectedly contracted in the first quarter. Severe winter weather took a toll on housing, consumer spending, and employment; that in turn made any imminent rise in interest rates seem less probable. So, too, did forward guidance from the Fed that it was likely to keep rates low even after its bond-buying ended.
A revival in demand in 2014 for longer-term bonds also contributed to the drop in their yields. Some investors began to rebalance their portfolios out of equities and into bonds after last year’s strong run-up in the stock market. More demand also came from international buyers who saw relative value in U.S. bonds. And heightened tensions in Eastern Europe and the Middle East drove more risk-averse investors to turn to bonds as a safe harbor for their assets.
For money market instruments, however, yields remained close to zero throughout the fiscal year.
Portfolio adjustments
As you may have heard, the Securities and Exchange Commission (SEC) announced in July a number of changes to money market fund regulations. The changes aim to ensure greater stability and transparency for these funds. (See page 7.) We expect these changes to have minimal impact on our money market funds, which are already conservatively managed.
As we have a very broad and active credit-review process, European bank debt came back on our radar early this fiscal year because of improvements in the region’s economies and in balance sheets since the financial crisis. In particular, our analysis identified opportunities for the Prime Money Market Fund to further diversify and capture some incremental yield from debt issued by British and Northern European banks. Along with Canadian and Australian debt, the fund’s exposure to foreign securities totaled about 37% of the fund’s assets at the end of the period.
The Prime Money Market Fund also began investing in repurchase agreements with the Fed as the counterparty. In these “repos,” the fund pays cash and receives Treasury bonds from the Fed overnight; in return, the fund receives its money back the next day plus an agreed-upon amount of interest. One attraction of the repos is
8
their very high credit quality given that the counterparty is the Fed. These securities also qualify as weekly liquidity, which makes them useful in light of the new SEC regulations.
In the Admiral Treasury Money Market Fund, we have begun to include 2-year floating-rate Treasury notes. They offer some additional yield over a 3-month Treasury bill as well as some diversification in a portfolio whose choices are limited to securities backed by the full faith and credit of the U.S. government.
The outlook
We expect growth in the U.S. economy to pick up, allowing the Fed to stay on schedule with ending its bond purchases later this year and to begin slowly tightening the federal funds rate sometime in 2015. The tightening is likely to end, however, at a level below the historical average.
As the eventual tightening of monetary policy is likely to be accompanied by an increase in market volatility, we will stand ready to take advantage of any price dislocations that may arise.
We are also entering the new fiscal year with weighted average maturities in the Prime and Federal Money Market Funds a little shorter than they were this time last year. That will give us the dry powder to take advantage of opportunities to invest in higher-yielding securities even if they lengthen the funds’ average maturity.
Whatever the markets may bring, our experienced team of portfolio managers, traders, and credit analysts will continue to seek out ways to produce competitive returns.
David R. Glocke, Principal
Vanguard Fixed Income Group
September 17, 2014
9
Prime Money Market Fund
Fund Profile
As of August 31, 2014
| | |
| Financial Attributes | | |
| | Investor | Institutional |
| | Shares | Shares |
| Ticker Symbol | VMMXX | VMRXX |
| Expense Ratio1 | 0.17% | 0.10% |
| 7-Day SEC Yield | 0.01% | 0.05% |
| Average Weighted | | |
| Maturity | 55 days | 55 days |
| |
| Sector Diversification (% of portfolio) | |
| Certificates of Deposit | 9.3% |
| U.S. Commercial Paper | 5.3 |
| U.S. Government Obligations | 20.0 |
| U.S. Treasury Bills | 25.1 |
| Yankee/Foreign | 37.3 |
| Other | 3.0 |
| The agency and mortgage-backed securities sectors may include issues from government-sponsored enterprises; such issues are generally not backed by the full faith and credit of the U.S. government. |
|
|
|
| |
| Distribution by Credit Quality (% of portfolio) |
| First Tier | 100.0% |
| A First Tier security is one that is eligible for money market funds and has been rated in the highest short-term rating category for debt obligations by nationally recognized statistical rating organizations. Credit-quality ratings are obtained from Barclays and are from Moody's, Fitch, and S&P. The lowest rating for each issue is used. An unrated security is First Tier if it represents quality comparable to that of a rated security, as determined in accordance with SEC Rule 2a-7. For more information about these ratings, see the Glossary entry for Credit Quality. |
|
|
|
|
|
|
|
|
1 The expense ratios shown are from the prospectus dated December 23, 2013, and represent estimated costs for the current fiscal year. For the fiscal year ended August 31, 2014, the expense ratios were 0.14% for Investor Shares and 0.10% for Institutional Shares. The expense ratio for the Prime Money Market Fund Investor Shares reflects a temporary reduction in operating expenses (described in Note B of the Notes to Financial Statements). Before this reduction, the expense ratio for the Prime Money Market Fund Investor Shares was 0.16%.
10
Prime Money Market Fund
Performance Summary
Investment returns will fluctuate. All of the returns in this report represent past performance, which is not a guarantee of future results that may be achieved by the fund. (Current performance may be lower or higher than the performance data cited. For performance data current to the most recent month-end, visit our website at vanguard.com/performance.) The returns shown do not reflect taxes that a shareholder would pay on fund distributions. An investment in a money market fund is not insured or guaranteed by the Federal Deposit Insurance Corporation or any other government agency. Although the fund seeks to preserve the value of your investment at $1 per share, it is possible to lose money by investing in the fund. The fund’s 7-day SEC yield reflects its current earnings more closely than do the average annual returns.
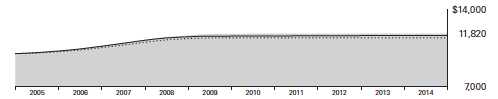
Cumulative Performance: August 31, 2004, Through August 31, 2014
Initial Investment of $10,000
| | | | |
| | Average Annual Total Returns
Periods Ended August 31, 2014 | |
| | |
| Final Value
of a $10,000
Investment |
| | One
Year | Five
Years | Ten
Years |
| |
| Prime Money Market Fund Investor | | | | |
| Shares | 0.02% | 0.04% | 1.69% | $11,820 |
| | | | | |
| Money Market Funds Average | 0.00 | 0.00 | 1.35 | 11,429 |
| Citigroup Three-Month U.S. Treasury | | | | |
| Bill Index | 0.04 | 0.07 | 1.51 | 11,643 |
Money Market Funds Average: Derived from data provided by Lipper, a Thomson Reuters Company.
| | | | |
| | | | | Final Value
of a $5,000,000
Investment |
| | One
Year | Five
Years | Ten
Years |
| |
| Prime Money Market Fund Institutional | | | | |
| Shares | 0.06% | 0.13% | 1.82% | $5,985,450 |
| | | | | |
| Institutional Money Market Funds Average | 0.00 | 0.04 | 1.58 | 5,849,666 |
| Citigroup Three-Month U.S. Treasury Bill | | | | |
| Index | 0.04 | 0.07 | 1.51 | 5,821,292 |
See Financial Highlights for dividend information.
11
Prime Money Market Fund
| | |
| Fiscal-Year Total Returns (%): August 31, 2004, Through August 31, 2014 | Money
Market
Funds
Average
Total Returns |
| | |
| | |
| | |
| | Investor Shares |
| Fiscal Year | Total Returns |
| 2005 | 2.31% | 1.68% |
| 2006 | 4.38 | 3.69 |
| 2007 | 5.23 | 4.55 |
| 2008 | 3.60 | 3.02 |
| 2009 | 1.31 | 0.62 |
| 2010 | 0.08 | 0.02 |
| 2011 | 0.06 | 0.00 |
| 2012 | 0.04 | 0.00 |
| 2013 | 0.02 | 0.00 |
| 2014 | 0.02 | 0.00 |
| 7-day SEC yield (8/31/2014): 0.01% | | |
| Money Market Funds Average: Derived from data provided by Lipper, a Thomson Reuters Company. | |
Average Annual Total Returns: Periods Ended June 30, 2014
This table presents returns through the latest calendar quarter—rather than through the end of the fiscal period. Securities and Exchange Commission rules require that we provide this information.
| | | | |
| | Inception
Date | One
Year | Five
Years | Ten
Years |
| |
| Investor Shares | 6/4/1975 | 0.02% | 0.05% | 1.70% |
| Institutional Shares | 10/3/1989 | 0.06 | 0.14 | 1.84 |
12
Prime Money Market Fund
Financial Statements
Statement of Net Assets
As of August 31, 2014
The fund reports a complete list of its holdings in various monthly and quarterly regulatory filings. The fund publishes its holdings on a monthly basis at vanguard.com and files them with the Securities and Exchange Commission on Form N-MFP. The fund’s Form N-MFP filings become public 60 days after the relevant month-end, and may be viewed at sec.gov or via a link on the “Portfolio Holdings” page on vanguard.com. For the second and fourth fiscal quarters, the lists appear in the fund’s semiannual and annual reports to shareholders. For the first and third fiscal quarters, the fund files the lists with the SEC on Form N-Q. Shareholders can look up the fund’s Forms N-Q on the SEC’s website at sec. gov. Forms N-Q may also be reviewed and copied at the SEC’s Public Reference Room (see the back cover of this report for further information).
| | | | | |
| | | | | Face | Market |
| | | | Maturity | Amount | Value |
| | | Yield1 | Date | ($000) | ($000) |
| U.S. Government and Agency Obligations (44.7%) | | | |
| 2 | Fannie Mae Discount Notes | 0.075% | 9/8/14 | 68,850 | 68,849 |
| 2 | Fannie Mae Discount Notes | 0.070% | 10/2/14 | 88,636 | 88,631 |
| 2 | Fannie Mae Discount Notes | 0.070% | 10/7/14 | 2,316 | 2,316 |
| 2 | Fannie Mae Discount Notes | 0.065% | 10/22/14 | 50,000 | 49,995 |
| 3 | Federal Home Loan Bank Discount Notes | 0.070% | 9/5/14 | 431,816 | 431,813 |
| 3 | Federal Home Loan Bank Discount Notes | 0.070% | 9/10/14 | 534,930 | 534,921 |
| 3 | Federal Home Loan Bank Discount Notes | 0.070%–0.072% | 9/12/14 | 2,461,927 | 2,461,874 |
| 3 | Federal Home Loan Bank Discount Notes | 0.079% | 9/17/14 | 6,103 | 6,103 |
| 3 | Federal Home Loan Bank Discount Notes | 0.079%–0.085% | 9/19/14 | 642,000 | 641,974 |
| 3 | Federal Home Loan Bank Discount Notes | 0.085% | 9/24/14 | 2,050,000 | 2,049,889 |
| 3 | Federal Home Loan Bank Discount Notes | 0.084%–0.085% | 9/26/14 | 836,632 | 836,583 |
| 3 | Federal Home Loan Bank Discount Notes | 0.070% | 10/2/14 | 43,500 | 43,497 |
| 3 | Federal Home Loan Bank Discount Notes | 0.070% | 10/3/14 | 596,301 | 596,263 |
| 3 | Federal Home Loan Bank Discount Notes | 0.070%–0.074% | 10/8/14 | 3,150,000 | 3,149,761 |
| 3 | Federal Home Loan Bank Discount Notes | 0.072%–0.074% | 10/10/14 | 1,165,000 | 1,164,907 |
| 3 | Federal Home Loan Bank Discount Notes | 0.072% | 10/15/14 | 2,908,900 | 2,908,644 |
| 3 | Federal Home Loan Bank Discount Notes | 0.070% | 10/17/14 | 909,000 | 908,919 |
| 3 | Federal Home Loan Bank Discount Notes | 0.065% | 10/22/14 | 25,000 | 24,998 |
| 3 | Federal Home Loan Bank Discount Notes | 0.065% | 10/24/14 | 1,226,875 | 1,226,758 |
| 3 | Federal Home Loan Bank Discount Notes | 0.068% | 10/29/14 | 231,000 | 230,975 |
| 3 | Federal Home Loan Bank Discount Notes | 0.070% | 10/31/14 | 267,450 | 267,419 |
| 3,4 | Federal Home Loan Banks | 0.136% | 10/1/14 | 150,000 | 149,997 |
| 3,4 | Federal Home Loan Banks | 0.101% | 11/3/14 | 199,000 | 199,000 |
| 3,4 | Federal Home Loan Banks | 0.110% | 2/27/15 | 496,000 | 495,975 |
| 3,4 | Federal Home Loan Banks | 0.117% | 3/10/15 | 97,500 | 97,500 |
| 2,4 | Federal National Mortgage Assn. | 0.137% | 9/11/14 | 2,350,000 | 2,349,987 |
| 2,4 | Federal National Mortgage Assn. | 0.125% | 2/27/15 | 3,350,000 | 3,349,588 |
| 2,4 | Federal National Mortgage Assn. | 0.126% | 8/5/15 | 1,775,000 | 1,774,666 |
| 2 | Freddie Mac Discount Notes | 0.075% | 9/10/14 | 43,750 | 43,749 |
| | United States Treasury Bill | 0.083% | 9/11/14 | 250,000 | 249,994 |
| | United States Treasury Bill | 0.051% | 11/13/14 | 1,200,000 | 1,199,876 |
| | United States Treasury Bill | 0.052%–0.053% | 11/28/14 | 2,500,000 | 2,499,680 |
| | United States Treasury Bill | 0.052%–0.055% | 12/4/14 | 2,150,000 | 2,149,699 |
| | United States Treasury Bill | 0.065% | 12/11/14 | 500,000 | 499,909 |
13
Prime Money Market Fund
| | | | |
| | | | Face | Market |
| | | Maturity | Amount | Value |
| | Yield1 | Date | ($000) | ($000) |
| United States Treasury Bill | 0.067%–0.068% | 12/18/14 | 1,700,000 | 1,699,657 |
| United States Treasury Bill | 0.065% | 1/2/15 | 754,325 | 754,157 |
| United States Treasury Bill | 0.058%–0.060% | 1/29/15 | 3,350,000 | 3,349,167 |
| United States Treasury Bill | 0.056% | 2/5/15 | 2,840,000 | 2,839,306 |
| United States Treasury Bill | 0.050%–0.051% | 2/12/15 | 2,784,800 | 2,784,163 |
| United States Treasury Bill | 0.046% | 2/19/15 | 1,000,000 | 999,783 |
| 5 United States Treasury Bill | 0.046%–0.052% | 2/26/15 | 2,495,000 | 2,494,410 |
| United States Treasury Note/Bond | 0.250% | 9/15/14 | 735,000 | 735,034 |
| United States Treasury Note/Bond | 0.250% | 9/30/14 | 703,000 | 703,085 |
| United States Treasury Note/Bond | 2.375% | 9/30/14 | 396,000 | 396,705 |
| United States Treasury Note/Bond | 0.500% | 10/15/14 | 100,000 | 100,046 |
| United States Treasury Note/Bond | 2.375% | 10/31/14 | 1,502,000 | 1,507,580 |
| United States Treasury Note/Bond | 0.375% | 11/15/14 | 3,080,000 | 3,081,835 |
| United States Treasury Note/Bond | 4.250% | 11/15/14 | 767,250 | 773,760 |
| United States Treasury Note/Bond | 0.250% | 11/30/14 | 646,000 | 646,283 |
| United States Treasury Note/Bond | 2.125% | 11/30/14 | 1,138,000 | 1,143,640 |
| United States Treasury Note/Bond | 0.250% | 12/15/14 | 155,000 | 155,082 |
| United States Treasury Note/Bond | 4.000% | 2/15/15 | 50,000 | 50,889 |
| United States Treasury Note/Bond | 0.250% | 2/28/15 | 361,000 | 361,310 |
| United States Treasury Note/Bond | 2.375% | 2/28/15 | 759,500 | 768,166 |
| United States Treasury Note/Bond | 0.375% | 3/15/15 | 300,000 | 300,475 |
| Total U.S. Government and Agency Obligations (Cost $58,399,242) | | | 58,399,242 |
| Commercial Paper (19.5%) | | | | |
| Finance—Auto (1.2%) | | | | |
| American Honda Finance Corp. | 0.130% | 9/22/14 | 80,000 | 79,994 |
| American Honda Finance Corp. | 0.130% | 9/26/14 | 46,000 | 45,996 |
| American Honda Finance Corp. | 0.140% | 10/6/14 | 57,300 | 57,292 |
| American Honda Finance Corp. | 0.140% | 11/6/14 | 91,000 | 90,977 |
| American Honda Finance Corp. | 0.140% | 11/7/14 | 48,000 | 47,987 |
| American Honda Finance Corp. | 0.140% | 11/10/14 | 61,000 | 60,983 |
| American Honda Finance Corp. | 0.140% | 11/13/14 | 54,500 | 54,485 |
| American Honda Finance Corp. | 0.140% | 11/14/14 | 103,000 | 102,970 |
| 4 Toyota Motor Credit Corp. | 0.175% | 9/18/14 | 194,000 | 194,000 |
| Toyota Motor Credit Corp. | 0.200% | 10/1/14 | 145,500 | 145,476 |
| 4 Toyota Motor Credit Corp. | 0.196% | 10/31/14 | 158,000 | 158,000 |
| 4 Toyota Motor Credit Corp. | 0.196% | 11/5/14 | 75,000 | 75,000 |
| 4 Toyota Motor Credit Corp. | 0.199% | 11/7/14 | 99,000 | 99,000 |
| 4 Toyota Motor Credit Corp. | 0.196% | 11/13/14 | 54,000 | 54,000 |
| 4 Toyota Motor Credit Corp. | 0.207% | 12/4/14 | 221,000 | 221,000 |
| 4 Toyota Motor Credit Corp. | 0.196% | 1/5/15 | 74,000 | 74,000 |
| | | | | 1,561,160 |
| Finance—Other (1.3%) | | | | |
| General Electric Capital Corp. | 0.190% | 9/29/14 | 99,000 | 98,985 |
| General Electric Capital Corp. | 0.190% | 10/2/14 | 149,000 | 148,976 |
| General Electric Capital Corp. | 0.190% | 11/4/14 | 233,000 | 232,921 |
| General Electric Capital Corp. | 0.190% | 11/5/14 | 124,500 | 124,457 |
| General Electric Capital Corp. | 0.190% | 11/7/14 | 123,000 | 122,957 |
| General Electric Capital Corp. | 0.190% | 11/12/14 | 123,500 | 123,453 |
| General Electric Capital Corp. | 0.190% | 11/19/14 | 100,000 | 99,958 |
| General Electric Capital Corp. | 0.190% | 12/1/14 | 173,000 | 172,917 |
| General Electric Capital Corp. | 0.170% | 12/4/14 | 76,000 | 75,966 |
| General Electric Capital Corp. | 0.190% | 12/8/14 | 49,500 | 49,475 |
| General Electric Capital Corp. | 0.210% | 2/5/15 | 49,500 | 49,455 |
14
Prime Money Market Fund
| | | | | |
| | | | | Face | Market |
| | | | Maturity | Amount | Value |
| | | Yield1 | Date | ($000) | ($000) |
| | General Electric Capital Corp. | 0.210% | 2/6/15 | 49,500 | 49,454 |
| | General Electric Capital Corp. | 0.200% | 2/13/15 | 99,000 | 98,909 |
| | General Electric Capital Corp. | 0.200% | 2/23/15 | 38,750 | 38,712 |
| 6 | Govco LLC | 0.180% | 9/16/14 | 76,000 | 75,994 |
| 6 | Old Line Funding LLC | 0.150% | 9/29/14 | 59,000 | 58,993 |
| 6 | Old Line Funding LLC | 0.170% | 12/1/14 | 50,027 | 50,006 |
| | | | | | 1,671,588 |
| Foreign Banks (11.8%) | | | | |
| 4,6 | Australia & New Zealand Banking Group, Ltd. | 0.215% | 9/16/14 | 40,000 | 40,000 |
| 4,6 | Australia & New Zealand Banking Group, Ltd. | 0.167% | 10/9/14 | 397,000 | 396,998 |
| 4,6 | Australia & New Zealand Banking Group, Ltd. | 0.165% | 10/24/14 | 377,000 | 377,000 |
| 4,6 | Australia & New Zealand Banking Group, Ltd. | 0.226% | 11/20/14 | 250,000 | 250,000 |
| 4,6 | Australia & New Zealand Banking Group, Ltd. | 0.191% | 2/13/15 | 247,500 | 247,494 |
| 4,6 | Australia & New Zealand Banking Group, Ltd. | 0.225% | 2/25/15 | 417,000 | 417,000 |
| 4,6 | Australia & New Zealand Banking Group, Ltd. | 0.226% | 3/5/15 | 134,000 | 134,000 |
| 4,6 | Australia & New Zealand Banking Group, Ltd. | 0.226% | 3/5/15 | 226,000 | 226,000 |
| 4,6 | Australia & New Zealand Banking Group, Ltd. | 0.228% | 5/7/15 | 247,000 | 246,991 |
| 4,6 | Australia & New Zealand Banking Group, Ltd. | 0.221% | 5/14/15 | 247,500 | 247,491 |
| 4,6 | Commonwealth Bank of Australia | 0.225% | 9/25/14 | 750,000 | 750,000 |
| 4,6 | Commonwealth Bank of Australia | 0.225% | 10/24/14 | 39,500 | 39,502 |
| 4,6 | Commonwealth Bank of Australia | 0.176% | 11/12/14 | 247,500 | 247,500 |
| 4,6 | Commonwealth Bank of Australia | 0.226% | 11/28/14 | 90,000 | 90,000 |
| 4,6 | Commonwealth Bank of Australia | 0.226% | 12/5/14 | 198,000 | 198,000 |
| 4,6 | Commonwealth Bank of Australia | 0.186% | 12/17/14 | 44,000 | 43,999 |
| 4,6 | Commonwealth Bank of Australia | 0.226% | 1/16/15 | 142,000 | 141,997 |
| 4,6 | Commonwealth Bank of Australia | 0.237% | 2/6/15 | 173,000 | 172,996 |
| 4,6 | Commonwealth Bank of Australia | 0.234% | 2/13/15 | 181,000 | 180,997 |
| 4,6 | Commonwealth Bank of Australia | 0.225% | 2/20/15 | 223,000 | 222,997 |
| 4,6 | Commonwealth Bank of Australia | 0.226% | 3/16/15 | 193,000 | 192,995 |
| 4,6 | Commonwealth Bank of Australia | 0.236% | 3/23/15 | 500,000 | 500,000 |
| 4,6 | Commonwealth Bank of Australia | 0.236% | 3/30/15 | 530,000 | 529,992 |
| 6 | DNB Bank ASA | 0.190% | 9/5/14 | 165,000 | 164,996 |
| 6 | DNB Bank ASA | 0.170% | 10/8/14 | 750,000 | 749,869 |
| 4,6 | National Australia Funding Delaware Inc. | 0.205% | 2/23/15 | 1,000,000 | 1,000,000 |
| 6 | Nordea Bank AB | 0.210% | 9/9/14 | 600,000 | 599,972 |
| 6 | Nordea Bank AB | 0.225% | 10/20/14 | 34,650 | 34,639 |
| 6 | Nordea Bank AB | 0.225% | 10/23/14 | 120,000 | 119,961 |
| 6 | Nordea Bank AB | 0.225% | 10/24/14 | 45,000 | 44,985 |
| 6 | Nordea Bank AB | 0.225% | 10/27/14 | 125,000 | 124,956 |
| 6 | Skandinaviska Enskilda Banken AB | 0.170% | 9/4/14 | 305,000 | 304,996 |
| 6 | Skandinaviska Enskilda Banken AB | 0.170% | 9/11/14 | 255,000 | 254,988 |
| 6 | Skandinaviska Enskilda Banken AB | 0.170% | 10/1/14 | 495,000 | 494,930 |
| 6 | Skandinaviska Enskilda Banken AB | 0.170% | 10/2/14 | 136,000 | 135,980 |
| 6 | Svenska Handelsbanken Inc. | 0.220% | 9/26/14 | 375,000 | 374,943 |
| 6 | Svenska Handelsbanken Inc. | 0.205% | 11/7/14 | 495,000 | 494,811 |
| | Swedbank AB | 0.165% | 9/12/14 | 197,000 | 196,990 |
| | Swedbank AB | 0.165% | 9/18/14 | 200,000 | 199,984 |
| | Swedbank AB | 0.165% | 9/23/14 | 150,000 | 149,985 |
| | Swedbank AB | 0.165% | 9/24/14 | 150,000 | 149,984 |
| | Swedbank AB | 0.170% | 10/6/14 | 76,000 | 75,987 |
| | Swedbank AB | 0.180% | 10/7/14 | 167,000 | 166,970 |
| | Swedbank AB | 0.170% | 10/8/14 | 153,000 | 152,973 |
| | Swedbank AB | 0.170% | 10/9/14 | 153,000 | 152,973 |
| | Swedbank AB | 0.170% | 10/10/14 | 13,000 | 12,998 |
15
Prime Money Market Fund
| | | | | |
| | | | | Face | Market |
| | | | Maturity | Amount | Value |
| | | Yield1 | Date | ($000) | ($000) |
| | Swedbank AB | 0.180% | 10/24/14 | 200,000 | 199,947 |
| | Swedbank AB | 0.180% | 10/27/14 | 200,000 | 199,944 |
| | Swedbank AB | 0.180% | 10/28/14 | 100,000 | 99,971 |
| | Swedbank AB | 0.190% | 10/30/14 | 196,000 | 195,939 |
| | Swedbank AB | 0.190% | 10/31/14 | 14,000 | 13,996 |
| | Swedbank AB | 0.190% | 11/6/14 | 185,000 | 184,936 |
| 4,6 | Westpac Banking Corp. | 0.225% | 9/17/14 | 201,000 | 201,000 |
| 4,6 | Westpac Banking Corp. | 0.226% | 9/19/14 | 201,000 | 201,000 |
| 4,6 | Westpac Banking Corp. | 0.225% | 9/22/14 | 1,071,000 | 1,071,000 |
| 4,6 | Westpac Banking Corp. | 0.226% | 11/14/14 | 97,000 | 97,000 |
| 4,6 | Westpac Banking Corp. | 0.229% | 12/8/14 | 550,000 | 550,000 |
| 4,6 | Westpac Banking Corp. | 0.226% | 3/5/15 | 100,000 | 100,006 |
| 4,6 | Westpac Banking Corp. | 0.226% | 3/13/15 | 42,350 | 42,350 |
| 4,6 | Westpac Banking Corp. | 0.227% | 7/10/15 | 200,000 | 199,992 |
| | | | | | 15,409,900 |
| Foreign Governments (1.2%) | | | | |
| 6 | CDP Financial Inc. | 0.150% | 9/9/14 | 49,000 | 48,998 |
| 6 | CDP Financial Inc. | 0.160% | 9/15/14 | 24,750 | 24,748 |
| 6 | CDP Financial Inc. | 0.190% | 9/16/14 | 29,750 | 29,748 |
| 6 | CDP Financial Inc. | 0.160% | 9/18/14 | 19,750 | 19,748 |
| 6 | CDP Financial Inc. | 0.190% | 10/1/14 | 49,500 | 49,492 |
| 6 | CDP Financial Inc. | 0.190% | 10/10/14 | 49,500 | 49,490 |
| 6 | CDP Financial Inc. | 0.190% | 10/28/14 | 39,500 | 39,488 |
| 6 | CDP Financial Inc. | 0.190% | 10/29/14 | 20,000 | 19,994 |
| 6 | CDP Financial Inc. | 0.190% | 11/3/14 | 49,500 | 49,484 |
| 6 | CDP Financial Inc. | 0.190% | 11/4/14 | 24,750 | 24,742 |
| 6 | CDP Financial Inc. | 0.210% | 11/25/14 | 19,750 | 19,740 |
| 7 | CPPIB Capital Inc. | 0.140% | 9/2/14 | 248,000 | 247,999 |
| 7 | CPPIB Capital Inc. | 0.140% | 9/3/14 | 35,000 | 35,000 |
| 7 | CPPIB Capital Inc. | 0.140% | 9/4/14 | 119,000 | 118,999 |
| 7 | CPPIB Capital Inc. | 0.140% | 9/12/14 | 118,500 | 118,495 |
| 7 | CPPIB Capital Inc. | 0.140% | 10/1/14 | 77,000 | 76,991 |
| 7 | CPPIB Capital Inc. | 0.140% | 10/2/14 | 125,500 | 125,485 |
| 7 | CPPIB Capital Inc. | 0.140% | 10/6/14 | 136,750 | 136,731 |
| 7 | PSP Capital Inc. | 0.140% | 9/2/14 | 22,000 | 22,000 |
| 7 | PSP Capital Inc. | 0.140% | 9/5/14 | 15,000 | 15,000 |
| 7 | PSP Capital Inc. | 0.140% | 9/10/14 | 42,000 | 41,998 |
| 7 | PSP Capital Inc. | 0.150% | 9/15/14 | 23,000 | 22,999 |
| 7 | PSP Capital Inc. | 0.150% | 9/17/14 | 52,000 | 51,997 |
| 7 | PSP Capital Inc. | 0.160% | 9/22/14 | 30,750 | 30,747 |
| 7 | PSP Capital Inc. | 0.150% | 10/14/14 | 17,600 | 17,597 |
| 7 | PSP Capital Inc. | 0.150% | 10/16/14 | 24,000 | 23,995 |
| 7 | PSP Capital Inc. | 0.160% | 11/19/14 | 43,250 | 43,235 |
| 7 | PSP Capital Inc. | 0.160% | 11/25/14 | 53,000 | 52,980 |
| | | | | | 1,557,920 |
| Foreign Industrial (1.3%) | | | | |
| 6 | Anheuser-Busch Inbev Worldwide Inc. | 0.120% | 9/2/14 | 31,700 | 31,700 |
| 6 | BASF SE | 0.130% | 9/23/14 | 76,000 | 75,994 |
| 6 | BASF SE | 0.130% | 9/24/14 | 95,000 | 94,992 |
| 6 | BASF SE | 0.130% | 9/26/14 | 76,000 | 75,993 |
| 6 | GlaxoSmithKline Finance plc | 0.120% | 9/3/14 | 99,000 | 98,999 |
| 6 | GlaxoSmithKline Finance plc | 0.120% | 9/15/14 | 146,000 | 145,993 |
| 6 | GlaxoSmithKline Finance plc | 0.130% | 9/25/14 | 38,000 | 37,997 |
| 6 | GlaxoSmithKline Finance plc | 0.130% | 9/30/14 | 168,500 | 168,482 |
16
Prime Money Market Fund
| | | | |
| | | | Face | Market |
| | | Maturity | Amount | Value |
| | Yield1 | Date | ($000) | ($000) |
| 6 GlaxoSmithKline Finance plc | 0.140% | 10/2/14 | 99,000 | 98,988 |
| 6 GlaxoSmithKline Finance plc | 0.140% | 10/8/14 | 123,000 | 122,982 |
| 6 GlaxoSmithKline Finance plc | 0.140% | 10/14/14 | 107,000 | 106,982 |
| 6 GlaxoSmithKline Finance plc | 0.155% | 10/31/14 | 231,000 | 230,940 |
| 6 Nestle Capital Corp. | 0.180% | 1/28/15 | 123,500 | 123,408 |
| Nestle Finance International Ltd. | 0.180% | 2/23/15 | 116,000 | 115,899 |
| 6 Sanofi | 0.130% | 9/19/14 | 39,000 | 38,998 |
| 6 Sanofi | 0.130% | 9/26/14 | 36,000 | 35,997 |
| Toyota Credit Canada Inc. | 0.210% | 9/17/14 | 41,000 | 40,996 |
| Toyota Credit Canada Inc. | 0.210% | 9/18/14 | 42,000 | 41,996 |
| Toyota Credit Canada Inc. | 0.210% | 10/20/14 | 40,000 | 39,989 |
| Toyota Credit Canada Inc. | 0.220% | 1/6/15 | 19,500 | 19,485 |
| | | | | 1,746,810 |
| Industrial (2.7%) | | | | |
| 6 Apple Inc. | 0.150% | 11/5/14 | 19,500 | 19,495 |
| 6 Apple Inc. | 0.150% | 11/10/14 | 20,000 | 19,994 |
| 6 Chevron Corp. | 0.120% | 9/17/14 | 75,000 | 74,996 |
| 6 Chevron Corp. | 0.120% | 9/18/14 | 75,000 | 74,996 |
| 6 Procter & Gamble Co. | 0.160% | 10/23/14 | 49,000 | 48,989 |
| 6 Procter & Gamble Co. | 0.160% | 10/24/14 | 99,000 | 98,977 |
| 6 Procter & Gamble Co. | 0.160% | 10/27/14 | 99,000 | 98,975 |
| 6 Procter & Gamble Co. | 0.160% | 10/30/14 | 72,500 | 72,481 |
| 6 Procter & Gamble Co. | 0.160% | 10/31/14 | 109,000 | 108,971 |
| 6 Procter & Gamble Co. | 0.170% | 12/1/14 | 49,500 | 49,479 |
| 6 The Coca-Cola Co. | 0.180% | 9/2/14 | 49,500 | 49,500 |
| 6 The Coca-Cola Co. | 0.180% | 9/3/14 | 49,500 | 49,499 |
| 6 The Coca-Cola Co. | 0.180% | 9/4/14 | 79,500 | 79,499 |
| 6 The Coca-Cola Co. | 0.180% | 9/5/14 | 79,000 | 78,998 |
| 6 The Coca-Cola Co. | 0.180% | 9/8/14 | 80,000 | 79,997 |
| 6 The Coca-Cola Co. | 0.180% | 10/3/14 | 109,000 | 108,983 |
| 6 The Coca-Cola Co. | 0.180% | 10/9/14 | 148,500 | 148,472 |
| 6 The Coca-Cola Co. | 0.180% | 10/14/14 | 49,500 | 49,489 |
| 6 The Coca-Cola Co. | 0.170% | 11/6/14 | 198,750 | 198,688 |
| 6 The Coca-Cola Co. | 0.170% | 11/12/14 | 49,500 | 49,483 |
| 6 The Coca-Cola Co. | 0.170% | 11/13/14 | 148,500 | 148,449 |
| 6 The Coca-Cola Co. | 0.170% | 11/14/14 | 247,500 | 247,414 |
| 6 The Coca-Cola Co. | 0.170% | 11/17/14 | 124,000 | 123,955 |
| 6 The Coca-Cola Co. | 0.180% | 1/7/15 | 99,000 | 98,937 |
| 6 The Coca-Cola Co. | 0.180% | 1/9/15 | 50,000 | 49,967 |
| 6 The Coca-Cola Co. | 0.190% | 1/29/15 | 198,000 | 197,843 |
| 6 The Coca-Cola Co. | 0.190% | 1/30/15 | 198,000 | 197,842 |
| 6 The Coca-Cola Co. | 0.190% | 2/2/15 | 49,500 | 49,460 |
| 6 The Coca-Cola Co. | 0.190% | 2/5/15 | 74,250 | 74,188 |
| 6 The Coca-Cola Co. | 0.200% | 2/11/15 | 198,000 | 197,821 |
| 6 The Coca-Cola Co. | 0.200% | 2/13/15 | 197,500 | 197,319 |
| 6 The Coca-Cola Co. | 0.200% | 2/18/15 | 97,996 | 97,903 |
| 6 The Coca-Cola Co. | 0.200% | 2/19/15 | 50,000 | 49,952 |
| 6 The Coca-Cola Co. | 0.200% | 2/23/15 | 49,000 | 48,952 |
| 6 The Coca-Cola Co. | 0.200% | 2/25/15 | 50,000 | 49,951 |
| 6 The Coca-Cola Co. | 0.200% | 2/26/15 | 149,000 | 148,853 |
| | | | | 3,538,767 |
| Total Commercial Paper (Cost $25,486,145) | | | | 25,486,145 |
17
Prime Money Market Fund
| | | | |
| | | | Face | Market |
| | | Maturity | Amount | Value |
| | Yield1 | Date | ($000) | ($000) |
| Certificates of Deposit (31.1%) | | | | |
| Domestic Banks (7.9%) | | | | |
| Branch Banking & Trust Co. | 0.190% | 9/24/14 | 455,000 | 455,000 |
| Citibank NA | 0.210% | 9/17/14 | 746,000 | 746,000 |
| Citibank NA | 0.210% | 9/18/14 | 729,000 | 729,000 |
| Citibank NA | 0.200% | 10/1/14 | 985,000 | 985,000 |
| Citibank NA | 0.195% | 10/17/14 | 335,000 | 335,000 |
| Citibank NA | 0.210% | 11/17/14 | 350,000 | 350,000 |
| State Street Bank & Trust Co. | 0.190% | 9/10/14 | 991,000 | 991,000 |
| State Street Bank & Trust Co. | 0.200% | 10/1/14 | 500,000 | 500,000 |
| State Street Bank & Trust Co. | 0.200% | 10/6/14 | 208,500 | 208,500 |
| State Street Bank & Trust Co. | 0.200% | 12/15/14 | 538,000 | 538,000 |
| 4 State Street Bank & Trust Co. | 0.205% | 12/15/14 | 500,000 | 500,000 |
| 4 Wells Fargo Bank NA | 0.206% | 11/5/14 | 510,000 | 510,000 |
| Wells Fargo Bank NA | 0.210% | 11/6/14 | 395,000 | 395,000 |
| 4 Wells Fargo Bank NA | 0.227% | 1/29/15 | 612,000 | 612,000 |
| 4 Wells Fargo Bank NA | 0.227% | 2/11/15 | 495,000 | 495,000 |
| 4 Wells Fargo Bank NA | 0.196% | 2/20/15 | 360,000 | 360,000 |
| 4 Wells Fargo Bank NA | 0.226% | 3/3/15 | 480,000 | 480,000 |
| 4 Wells Fargo Bank NA | 0.225% | 3/24/15 | 400,000 | 400,000 |
| 4 Wells Fargo Bank NA | 0.226% | 4/1/15 | 160,000 | 160,000 |
| 4 Wells Fargo Bank NA | 0.235% | 5/15/15 | 420,000 | 420,000 |
| 4 Wells Fargo Bank NA | 0.236% | 6/4/15 | 70,000 | 70,000 |
| | | | | 10,239,500 |
| Eurodollar Certificates of Deposit (1.3%) | | | | |
| National Australia Bank Ltd. | 0.190% | 9/25/14 | 200,000 | 200,000 |
| National Australia Bank Ltd. | 0.190% | 9/26/14 | 525,000 | 525,000 |
| National Australia Bank Ltd. | 0.200% | 10/27/14 | 200,000 | 200,000 |
| National Australia Bank Ltd. | 0.200% | 10/28/14 | 525,000 | 525,000 |
| National Australia Bank Ltd. | 0.210% | 12/4/14 | 255,000 | 255,000 |
| | | | | 1,705,000 |
| Yankee Certificates of Deposit (21.9%) | | | | |
| 4 Australia & New Zealand Banking Group, Ltd. | | | | |
| (New York Branch) | 0.207% | 1/12/15 | 79,000 | 79,000 |
| 4 Australia & New Zealand Banking Group, Ltd. | | | | |
| (New York Branch) | 0.223% | 3/9/15 | 50,000 | 49,999 |
| 4 Bank of Montreal (Chicago Branch) | 0.176% | 9/3/14 | 770,000 | 770,000 |
| 4 Bank of Montreal (Chicago Branch) | 0.226% | 9/5/14 | 81,150 | 81,150 |
| Bank of Montreal (Chicago Branch) | 0.170% | 9/10/14 | 746,000 | 746,000 |
| Bank of Montreal (Chicago Branch) | 0.170% | 10/2/14 | 620,000 | 620,000 |
| 4 Bank of Montreal (Chicago Branch) | 0.186% | 10/14/14 | 493,000 | 493,000 |
| 4 Bank of Montreal (Chicago Branch) | 0.186% | 11/3/14 | 280,000 | 279,998 |
| 4 Bank of Montreal (Chicago Branch) | 0.189% | 12/8/14 | 115,000 | 114,994 |
| Bank of Nova Scotia (Houston Branch) | 0.180% | 9/15/14 | 700,000 | 699,999 |
| Bank of Nova Scotia (Houston Branch) | 0.180% | 9/16/14 | 140,000 | 140,000 |
| 4 Bank of Nova Scotia (Houston Branch) | 0.185% | 10/27/14 | 350,000 | 349,997 |
| 4 Bank of Nova Scotia (Houston Branch) | 0.187% | 10/31/14 | 779,000 | 778,993 |
| Bank of Nova Scotia (Houston Branch) | 0.200% | 12/4/14 | 645,000 | 645,000 |
| Bank of Nova Scotia (Houston Branch) | 0.220% | 12/12/14 | 208,000 | 208,000 |
| Bank of Nova Scotia (Houston Branch) | 0.230% | 2/18/15 | 430,000 | 429,990 |
| 4 Canadian Imperial Bank of Commerce |
| (New York Branch) | 0.801% | 9/19/14 | 77,000 | 77,025 |
18
Prime Money Market Fund
| | | | |
| | | | Face | Market |
| | | Maturity | Amount | Value |
| | Yield1 | Date | ($000) | ($000) |
| 4 Canadian Imperial Bank of Commerce | | | | |
| (New York Branch) | 0.490% | 11/3/14 | 93,000 | 93,054 |
| Credit Suisse (New York Branch) | 0.220% | 9/5/14 | 500,000 | 500,000 |
| Credit Suisse (New York Branch) | 0.220% | 9/12/14 | 200,000 | 200,000 |
| Credit Suisse (New York Branch) | 0.250% | 9/15/14 | 440,000 | 440,000 |
| Credit Suisse (New York Branch) | 0.250% | 9/16/14 | 535,000 | 535,000 |
| DNB Bank ASA (New York Branch) | 0.165% | 9/9/14 | 193,000 | 193,000 |
| DNB Bank ASA (New York Branch) | 0.165% | 9/23/14 | 198,000 | 198,000 |
| DNB Bank ASA (New York Branch) | 0.165% | 10/8/14 | 149,000 | 149,000 |
| DNB Bank ASA (New York Branch) | 0.165% | 10/9/14 | 65,000 | 65,000 |
| DNB Bank ASA (New York Branch) | 0.185% | 10/23/14 | 198,000 | 198,000 |
| DNB Bank ASA (New York Branch) | 0.185% | 11/3/14 | 300,000 | 300,000 |
| DNB Bank ASA (New York Branch) | 0.180% | 11/18/14 | 750,000 | 750,000 |
| Lloyds TSB Bank plc (New York Branch) | 0.170% | 9/22/14 | 500,000 | 500,000 |
| Lloyds TSB Bank plc (New York Branch) | 0.170% | 10/17/14 | 800,000 | 800,000 |
| Lloyds TSB Bank plc (New York Branch) | 0.170% | 10/17/14 | 500,000 | 500,000 |
| Nordea Bank Finland plc (New York Branch) | 0.205% | 9/15/14 | 425,000 | 424,999 |
| Nordea Bank Finland plc (New York Branch) | 0.205% | 9/17/14 | 425,000 | 424,999 |
| Nordea Bank Finland plc (New York Branch) | 0.210% | 9/18/14 | 357,000 | 357,000 |
| Nordea Bank Finland plc (New York Branch) | 0.220% | 10/22/14 | 95,000 | 94,999 |
| Nordea Bank Finland plc (New York Branch) | 0.215% | 11/3/14 | 115,000 | 114,999 |
| Nordea Bank Finland plc (New York Branch) | 0.215% | 11/24/14 | 200,000 | 199,998 |
| Nordea Bank Finland plc (New York Branch) | 0.215% | 11/24/14 | 250,000 | 249,997 |
| Nordea Bank Finland plc (New York Branch) | 0.215% | 12/1/14 | 215,000 | 215,000 |
| 4 Rabobank Nederland (New York Branch) | 0.187% | 10/6/14 | 575,000 | 575,000 |
| 4 Rabobank Nederland (New York Branch) | 0.188% | 10/7/14 | 611,000 | 611,000 |
| 4 Rabobank Nederland (New York Branch) | 0.186% | 10/14/14 | 1,600,000 | 1,600,000 |
| 4 Rabobank Nederland (New York Branch) | 0.185% | 10/24/14 | 500,000 | 500,000 |
| 4 Rabobank Nederland (New York Branch) | 0.187% | 10/31/14 | 500,000 | 500,000 |
| Rabobank Nederland (New York Branch) | 0.210% | 12/5/14 | 50,000 | 50,001 |
| 4 Royal Bank of Canada (New York Branch) | 0.205% | 11/24/14 | 250,000 | 250,000 |
| 4 Royal Bank of Canada (New York Branch) | 0.206% | 12/1/14 | 440,000 | 440,000 |
| 4 Royal Bank of Canada (New York Branch) | 0.236% | 2/12/15 | 90,500 | 90,500 |
| 4 Royal Bank of Canada (New York Branch) | 0.236% | 2/20/15 | 157,250 | 157,250 |
| 4 Royal Bank of Canada (New York Branch) | 0.235% | 2/23/15 | 450,000 | 450,000 |
| 4 Royal Bank of Canada (New York Branch) | 0.236% | 3/4/15 | 497,000 | 497,000 |
| 4 Royal Bank of Canada (New York Branch) | 0.235% | 3/24/15 | 300,000 | 300,000 |
| Svenska Handelsbanken (New York Branch) | 0.215% | 9/11/14 | 380,000 | 380,000 |
| Svenska Handelsbanken (New York Branch) | 0.225% | 9/26/14 | 99,500 | 99,500 |
| Svenska Handelsbanken (New York Branch) | 0.215% | 11/26/14 | 700,000 | 700,000 |
| Svenska Handelsbanken (New York Branch) | 0.200% | 12/1/14 | 124,000 | 123,998 |
| Svenska Handelsbanken (New York Branch) | 0.215% | 12/12/14 | 495,000 | 495,000 |
| Svenska Handelsbanken (New York Branch) | 0.200% | 12/15/14 | 520,000 | 520,000 |
| Svenska Handelsbanken (New York Branch) | 0.200% | 12/17/14 | 185,000 | 185,000 |
| Toronto Dominion Bank (New York Branch) | 0.200% | 10/6/14 | 496,000 | 496,000 |
| 4 Toronto Dominion Bank (New York Branch) | 0.186% | 10/14/14 | 198,000 | 198,000 |
| 4 Toronto Dominion Bank (New York Branch) | 0.186% | 10/28/14 | 200,000 | 200,000 |
| 4 Toronto Dominion Bank (New York Branch) | 0.215% | 11/18/14 | 510,000 | 510,000 |
| 4 Toronto Dominion Bank (New York Branch) | 0.215% | 11/24/14 | 220,000 | 220,000 |
| 4 Toronto Dominion Bank (New York Branch) | 0.215% | 12/19/14 | 302,000 | 302,000 |
| 4 Toronto Dominion Bank (New York Branch) | 0.216% | 2/3/15 | 495,000 | 495,000 |
| 4 Toronto Dominion Bank (New York Branch) | 0.217% | 2/6/15 | 500,000 | 500,000 |
| 4 Toronto Dominion Bank (New York Branch) | 0.215% | 5/18/15 | 400,000 | 400,000 |
| 4 Toronto Dominion Bank (New York Branch) | 0.227% | 6/8/15 | 296,000 | 296,000 |
19
Prime Money Market Fund
| | | | | |
| | | | | Face | Market |
| | | | Maturity | Amount | Value• |
| | | Yield1 | Date | ($000) | ($000) |
| 4 | Toronto Dominion Bank (New York Branch) | 0.225% | 6/17/15 | 205,000 | 205,000 |
| | UBS AG (Stamford Branch) | 0.170% | 9/2/14 | 275,000 | 275,000 |
| | UBS AG (Stamford Branch) | 0.180% | 9/26/14 | 640,000 | 640,000 |
| 4 | Westpac Banking Corp. (New York Branch) | 0.215% | 9/26/14 | 198,000 | 197,999 |
| 4 | Westpac Banking Corp. (New York Branch) | 0.226% | 11/21/14 | 250,000 | 250,000 |
| 4 | Westpac Banking Corp. (New York Branch) | 0.226% | 12/12/14 | 299,000 | 299,000 |
| 4 | Westpac Banking Corp. (New York Branch) | 0.225% | 12/29/14 | 230,000 | 230,000 |
| 4 | Westpac Banking Corp. (New York Branch) | 0.227% | 1/6/15 | 130,000 | 129,998 |
| 4 | Westpac Banking Corp. (New York Branch) | 0.225% | 7/16/15 | 200,000 | 199,990 |
| | | | | | 28,634,426 |
| Total Certificates of Deposit (Cost $40,578,926) | | | | 40,578,926 |
| Other Notes (1.5%) | | | | |
| | Bank of America NA | 0.190% | 9/4/14 | 300,000 | 300,000 |
| | Bank of America NA | 0.190% | 9/8/14 | 198,000 | 198,000 |
| | Bank of America NA | 0.190% | 9/8/14 | 495,000 | 495,000 |
| | Bank of America NA | 0.190% | 9/9/14 | 198,000 | 198,000 |
| | Bank of America NA | 0.190% | 9/12/14 | 495,000 | 495,000 |
| | Bank of America NA | 0.200% | 10/2/14 | 228,000 | 228,000 |
| Total Other Notes (Cost $1,914,000) | | | | 1,914,000 |
| |
| | | | | Shares | |
| Money Market Fund (1.3%) | | | | |
| 8 | Vanguard Municipal Cash Management Fund | | | | |
| | (Cost $1,743,546) | 0.047% | | 1,743,545,637 | 1,743,546 |
| |
| | | | | Face | |
| | | | | Amount | |
| | | | | ($000) | |
| Tax-Exempt Municipal Bonds (0.1%) | | | | |
| 9 | Arizona Health Facilities Authority Revenue | | | | |
| | (Banner Health) VRDO | 0.050% | 9/5/14 | 25,500 | 25,500 |
| 9 | District of Columbia Revenue | | | | |
| | (Washington Drama Society) VRDO | 0.060% | 9/5/14 | 400 | 400 |
| | Texas Department of Housing & Community | | | | |
| | Affairs Single Family Revenue VRDO | 0.060% | 9/5/14 | 12,940 | 12,940 |
| | Texas Department of Housing & Community | | | | |
| | Affairs Single Mortgage Revenue VRDO | 0.060% | 9/5/14 | 41,200 | 41,200 |
| 9 | Warren County KY Revenue | | | | |
| | (Western Kentucky University Student Life | | | | |
| | Foundation Inc. Project) VRDO | 0.060% | 9/5/14 | 14,900 | 14,900 |
| 9 | Wisconsin Health & Educational Facilities | | | | |
| | Authority Revenue (Gundersen Lutheran) VRDO | 0.080% | 9/5/14 | 11,000 | 11,000 |
| 9 | Wisconsin Health & Educational Facilities | | | | |
| | Authority Revenue (University of Wisconsin | | | | |
| | Medical Foundation) VRDO | 0.070% | 9/5/14 | 20,695 | 20,695 |
| Total Tax-Exempt Municipal Bonds (Cost $126,635) | | | | 126,635 |
| Corporate Bonds (1.2%) | | | | |
| Finance (0.3%) | | | | |
| 4 | Royal Bank of Canada | 0.462% | 1/6/15 | 265,500 | 265,727 |
| 4,7 | National Australia Bank Ltd. | 0.231% | 9/19/14 | 93,075 | 93,077 |
| | | | | | 358,804 |
20
Prime Money Market Fund
| | | | | |
| | | | | Face | Market |
| | | | Maturity | Amount | Value• |
| | | Yield1 | Date | ($000) | ($000) |
| Industrial (0.9%) | | | | |
| 4 | Toyota Motor Credit Corp. | 0.234% | 1/14/15 | 225,000 | 225,008 |
| 4 | Toyota Motor Credit Corp. | 0.231% | 6/10/15 | 596,000 | 596,000 |
| 4 | Toyota Motor Credit Corp. | 0.235% | 8/26/15 | 385,000 | 385,000 |
| | | | | | 1,206,008 |
| Total Corporate Bonds (Cost $1,564,812) | | | | 1,564,812 |
| Taxable Municipal Bonds (0.4%) | | | | |
| 7,9 | BlackRock Municipal Bond Trust TOB VRDO | 0.170% | 9/2/14 | 18,105 | 18,105 |
| 7,9 | BlackRock Municipal Income Investment | | | | |
| | Quality Trust TOB VRDO | 0.170% | 9/2/14 | 9,660 | 9,660 |
| 7,9 | BlackRock Municipal Income Trust TOB VRDO | 0.170% | 9/2/14 | 207,000 | 207,000 |
| 7,9 | BlackRock MuniHoldings Fund II, Inc. TOB VRDO | 0.170% | 9/2/14 | 40,385 | 40,385 |
| 7,9 | BlackRock MuniHoldings Fund, Inc. TOB VRDO | 0.170% | 9/2/14 | 19,165 | 19,165 |
| 7,9 | BlackRock MuniHoldings Quality Fund II, Inc. | | | | |
| | TOB VRDO | 0.170% | 9/2/14 | 100,000 | 100,000 |
| 7,9 | BlackRock MuniHoldings Quality Fund II, Inc. | | | | |
| | TOB VRDO | 0.170% | 9/2/14 | 38,905 | 38,905 |
| 7,9 | BlackRock MuniYield Investment Quality Fund | | | | |
| | TOB VRDO | 0.170% | 9/2/14 | 12,910 | 12,910 |
| 7,9 | BlackRock Strategic Municipal Trust TOB VRDO | 0.170% | 9/2/14 | 9,820 | 9,820 |
| 7,9 | Los Angeles CA Department of Water & Power | | | | |
| | Revenue TOB VRDO | 0.210% | 9/5/14 | 13,000 | 13,000 |
| 7 | Massachusetts Transportation Fund Revenue | | | | |
| | TOB VRDO | 0.210% | 9/5/14 | 13,100 | 13,100 |
| 7 | Seattle WA Municipal Light & Power Revenue | | | | |
| | TOB VRDO | 0.210% | 9/5/14 | 6,400 | 6,400 |
| Total Taxable Municipal Bonds (Cost $488,450) | | | | 488,450 |
| Total Investments (99.8%) (Cost $130,301,756) | | | | 130,301,756 |
| Other Assets and Liabilities (0.2%) | | | | |
| Other Assets | | | | 1,079,158 |
| Liabilities | | | | (771,397) |
| | | | | | 307,761 |
| Net Assets (100%) | | | | 130,609,517 |
21
Prime Money Market Fund
| |
| At August 31, 2014, net assets consisted of: | |
| | Amount |
| | ($000) |
| Paid-in Capital | 130,608,091 |
| Undistributed Net Investment Income | — |
| Accumulated Net Realized Gains | 1,426 |
| Net Assets | 130,609,517 |
| |
| Investor Shares—Net Assets | |
| Applicable to 101,899,778,533 outstanding $.001 par value shares of | |
| beneficial interest (unlimited authorization) | 101,910,455 |
| Net Asset Value Per Share—Investor Shares | $1.00 |
| |
| Institutional Shares—Net Assets | |
| Applicable to 28,697,749,781 outstanding $.001 par value shares of | |
| beneficial interest (unlimited authorization) | 28,699,062 |
| Net Asset Value Per Share—Institutional Shares | $1.00 |
See Note A in Notes to Financial Statements.
1 Represents annualized yield at date of purchase for discount securities, and coupon for coupon-bearing securities.
2 The issuer was placed under federal conservatorship in September 2008; since that time, its daily operations have been managed by the Federal Housing Finance Agency and it receives capital from the U.S. Treasury, as needed to maintain a positive net worth, in exchange for senior preferred stock.
3 The issuer operates under a congressional charter; its securities are generally neither guaranteed by the U.S. Treasury nor backed by the full faith and credit of the U.S. government.
4 Adjustable-rate security.
5 Security purchased on a when-issued or delayed-delivery basis for which the fund has not taken delivery as of August 31, 2014.
6 Security exempt from registration under Section 4(2) of the Securities Act of 1933. Such securities may be sold in transactions exempt from registration only to dealers in that program or other “accredited investors.” At August 31, 2014, the aggregate value of these securities was $18,844,200,000, representing 14.4% of net assets.
7 Security exempt from registration under Rule 144A of the Securities Act of 1933. Such securities may be sold in transactions exempt from registration, normally to qualified institutional buyers. At August 31, 2014, the aggregate value of these securities was $1,763,775,000, representing 1.4% of net assets.
8 Affiliated money market fund available only to Vanguard funds and certain trusts and accounts managed by Vanguard. Rate shown is the
7-day yield.
9 Scheduled principal and interest payments are guaranteed by bank letter of credit.
TOB—Tender Obligation Bond.
VRDO—Variable Rate Demand Obligation.
See accompanying Notes, which are an integral part of the Financial Statements.
22
Prime Money Market Fund
Statement of Operations
| |
| | Year Ended |
| | August 31, 2014 |
| | ($000) |
| Investment Income | |
| Income | |
| Interest1 | 202,081 |
| Total Income | 202,081 |
| Expenses | |
| The Vanguard Group—Note B | |
| Investment Advisory Services | 3,328 |
| Management and Administrative—Investor Shares | 134,377 |
| Management and Administrative—Institutional Shares | 20,074 |
| Marketing and Distribution—Investor Shares | 25,025 |
| Marketing and Distribution—Institutional Shares | 6,816 |
| Custodian Fees | 1,574 |
| Auditing Fees | 32 |
| Shareholders’ Reports—Investor Shares | 791 |
| Shareholders’ Reports—Institutional Shares | 152 |
| Trustees’ Fees and Expenses | 120 |
| Total Expenses | 192,289 |
| Expense Reduction—Note B | (15,805) |
| Net Expenses | 176,484 |
| Net Investment Income | 25,597 |
| Realized Net Gain (Loss) on Investment Securities Sold | 1,258 |
| Net Increase (Decrease) in Net Assets Resulting from Operations | 26,855 |
| 1 Interest income from an affiliated company of the fund was $1,110,000. |
See accompanying Notes, which are an integral part of the Financial Statements.
23
Prime Money Market Fund
Statement of Changes in Net Assets
| | |
| | Year Ended August 31, |
| | 2014 | 2013 |
| | ($000) | ($000) |
| Increase (Decrease) in Net Assets | | |
| Operations |
| Net Investment Income | 25,597 | 36,500 |
| Realized Net Gain (Loss) | 1,258 | 1,603 |
| Net Increase (Decrease) in Net Assets Resulting from Operations | 26,855 | 38,103 |
| Distributions |
| Net Investment Income |
| Investor Shares | (10,239) | (17,736) |
| Institutional Shares | (15,358) | (18,764) |
| Realized Capital Gain1 |
| Investor Shares | (8,860) | — |
| Institutional Shares | (2,363) | — |
| Total Distributions | (36,820) | (36,500) |
| Capital Share Transactions |
| Investor Shares | (241,205) | 11,946,615 |
| Institutional Shares | 1,686,487 | 2,471,452 |
| Net Increase (Decrease) from Capital Share Transactions | 1,445,282 | 14,418,067 |
| Total Increase (Decrease) | 1,435,317 | 14,419,670 |
| Net Assets |
| Beginning of Period | 129,174,200 | 114,754,530 |
| End of Period | 130,609,517 | 129,174,200 |
| 1 Includes fiscal 2014 short-term gain distributions totaling $11,223,000. Short-term gain distributions are treated as ordinary income dividends for tax purposes. |
|
See accompanying Notes, which are an integral part of the Financial Statements.
24
Prime Money Market Fund
Financial Highlights
| | | | | |
| Investor Shares | | | | | |
| |
| For a Share Outstanding | | | Year Ended August 31, |
| Throughout Each Period | 2014 | 2013 | 2012 | 2011 | 2010 |
| Net Asset Value, Beginning of Period | $1.00 | $1.00 | $1.00 | $1.00 | $1.00 |
| Investment Operations |
| Net Investment Income | .0001 | .0002 | .0004 | .001 | .001 |
| Net Realized and Unrealized Gain (Loss) | | | | | |
| on Investments | — | — | — | — | — |
| Total from Investment Operations | .0001 | .0002 | .0004 | .001 | .001 |
| Distributions | |
| Dividends from Net Investment Income | (.0001) | (.0002) | (.0004) | (.001) | (.001) |
| Distributions from Realized Capital Gains | (.0000)1 | — | — | — | — |
| Total Distributions | (.0001) | (.0002) | (.0004) | (.001) | (.001) |
| Net Asset Value, End of Period | $1.00 | $1.00 | $1.00 | $1.00 | $1.00 |
|
| Total Return2 | 0.02% | 0.02% | 0.04% | 0.06% | 0.08% |
|
| Ratios/Supplemental Data | |
| Net Assets, End of Period (Millions) | $101,910 | $102,160 | $90,212 | $92,404 | $88,684 |
| Ratio of Total Expenses to Average Net Assets | 0.14%3 | 0.16%3 | 0.16% | 0.20% | 0.23% |
| Ratio of Net Investment Income to |
| Average Net Assets | 0.01% | 0.02% | 0.04% | 0.06% | 0.08% |
1 Distribution was less than $.0001 per share.
2 Total returns do not include account service fees that may have applied in the periods shown. Fund prospectuses provide information about any applicable account service fees.
3 The ratio of total expenses to average net assets before an expense reduction was 0.16% for 2014 and 0.17% for 2013. See Note B in the Notes to Financial Statements.
See accompanying Notes, which are an integral part of the Financial Statements.
25
Prime Money Market Fund
Financial Highlights
| | | | | |
| Institutional Shares | | | | | |
| |
| For a Share Outstanding | | | | Year Ended August 31, |
| Throughout Each Period | 2014 | 2013 | 2012 | 2011 | 2010 |
| Net Asset Value, Beginning of Period | $1.00 | $1.00 | $1.00 | $1.00 | $1.00 |
| Investment Operations |
| Net Investment Income | .001 | .001 | .001 | .002 | .002 |
| Net Realized and Unrealized Gain (Loss) |
| on Investments | — | — | — | — | — |
| Total from Investment Operations | .001 | .001 | .001 | .002 | .002 |
| Distributions | | | | | |
| Dividends from Net Investment Income | (. 001) | (. 001) | (. 001) | (. 002) | (. 002) |
| Distributions from Realized Capital Gains | (.000)1 | — | — | — | — |
| Total Distributions | (. 001) | (. 001) | (. 001) | (. 002) | (. 002) |
| Net Asset Value, End of Period | $1.00 | $1.00 | $1.00 | $1.00 | $1.00 |
| |
| Total Return | 0.06% | 0.07% | 0.11% | 0.17% | 0.22% |
|
| Ratios/Supplemental Data | | | | | |
| Net Assets, End of Period (Millions) | $28,699 | $27,015 | $24,543 | $21,739 | $19,107 |
| Ratio of Total Expenses to Average Net Assets | 0.10% | 0.10% | 0.09% | 0.09% | 0.09% |
| Ratio of Net Investment Income to |
| Average Net Assets | 0.05% | 0.07% | 0.11% | 0.17% | 0.22% |
| 1 Distribution was less than $.001 per share. |
See accompanying Notes, which are an integral part of the Financial Statements.
26
Prime Money Market Fund
Notes to Financial Statements
Vanguard Prime Money Market Fund is registered under the Investment Company Act of 1940 as an open-end investment company, or mutual fund. The fund invests in short-term debt instruments of companies primarily operating in specific industries, particularly financial services; the issuers’ abilities to meet their obligations may be affected by economic developments in such industries. The fund offers two classes of shares, Investor Shares and Institutional Shares. Investor Shares are available to any investor who meets the fund’s minimum purchase requirements. Institutional Shares are designed for institutional investors who meet certain administrative, service, and account-size criteria.
A. The following significant accounting policies conform to generally accepted accounting principles for U.S. investment companies. The fund consistently follows such policies in preparing its financial statements.
1. Security Valuation: Securities are valued as of the close of trading on the New York Stock Exchange (generally 4 p.m., Eastern time) on the valuation date. Securities are valued at amortized cost, which approximates market value. Investments in Vanguard Municipal Cash Management Fund are valued at that fund’s net asset value.
2. Repurchase Agreements: The fund enters into repurchase agreements with institutional counterparties. Securities pledged as collateral to the fund under repurchase agreements are held by a custodian bank until the agreements mature. Each agreement requires that the market value of the collateral be sufficient to cover payments of interest and principal. The fund further mitigates its counterparty risk by entering into repurchase agreements only with a diverse group of prequalified counterparties, monitoring their financial strength, and entering into master repurchase agreements with its counterparties. The master repurchase agreements provide that, in the event of a counterparty’s default (including bankruptcy), the fund may terminate any repurchase agreements with that counterparty, determine the net amount owed, and sell or retain the collateral up to the net amount owed to the fund. Such action may be subject to legal proceedings, which may delay or limit the disposition of collateral. The fund had no open repurchase agreements at August 31, 2014.
3. Federal Income Taxes: The fund intends to continue to qualify as a regulated investment company and distribute all of its taxable income. Management has analyzed the fund’s tax positions taken for all open federal income tax years (August 31, 2011–2014), and has concluded that no provision for federal income tax is required in the fund’s financial statements.
4. Distributions: Distributions from net investment income are declared daily and paid on the first business day of the following month.
5. Credit Facility: The fund and certain other funds managed by The Vanguard Group participate in a $2.89 billion committed credit facility provided by a syndicate of lenders pursuant to a credit agreement that may be renewed annually; each fund is individually liable for its borrowings, if any, under the credit facility. Borrowings may be utilized for temporary and emergency purposes, and are subject to the fund’s regulatory and contractual borrowing restrictions. The participating funds are charged administrative fees and an annual commitment fee of 0.06% of the undrawn amount of the facility; these fees are allocated to the funds based on a method approved by the fund’s board of trustees and included in Management and Administrative expenses on the fund’s Statement of Operations. Any borrowings under this facility bear interest at a rate equal to the higher of the federal funds rate or LIBOR reference rate plus an agreed-upon spread.
The fund had no borrowings outstanding at August 31, 2014, or at any time during the period then ended.
27
Prime Money Market Fund
6. Other: Interest income includes income distributions received from Vanguard Municipal Cash Management Fund and is accrued daily. Premiums and discounts on debt securities purchased are amortized and accreted, respectively, to interest income over the lives of the respective securities. Security transactions are accounted for on the date securities are bought or sold. Costs used to determine realized gains (losses) on the sale of investment securities are those of the specific securities sold.
Each class of shares has equal rights as to assets and earnings, except that each class separately bears certain class-specific expenses related to maintenance of shareholder accounts (included in Management and Administrative expenses) and shareholder reporting. Marketing and distribution expenses are allocated to each class of shares based on a method approved by the board of trustees. Income, other non-class-specific expenses, and gains and losses on investments are allocated to each class of shares based on its relative net assets.
B. The Vanguard Group furnishes at cost investment advisory, corporate management, administrative, marketing, and distribution services. The costs of such services are allocated to the fund based on methods approved by the board of trustees. The fund has committed to provide up to 0.40% of its net assets in capital contributions to Vanguard. At August 31, 2014, the fund had contributed capital of $13,177,000 to Vanguard (included in Other Assets), representing 0.01% of the fund’s net assets and 5.27% of Vanguard’s capitalization. The fund’s trustees and officers are also directors and officers of Vanguard. Vanguard and the board of trustees have agreed to temporarily limit certain net operating expenses in excess of the fund’s daily yield so as to maintain a zero or positive yield for the fund. Vanguard and the board of trustees may terminate the temporary expense limitation at any time.
For the year ended August 31, 2014, Vanguard’s expenses were reduced by $15,805,000 (an effective annual rate of 0.02% of the average net assets of the Investor Share class).
C. Various inputs may be used to determine the value of the fund’s investments. These inputs are summarized in three broad levels for financial statement purposes. The inputs or methodologies used to value securities are not necessarily an indication of the risk associated with investing in those securities.
Level 1—Quoted prices in active markets for identical securities.
Level 2—Other significant observable inputs (including quoted prices for similar securities, interest rates, prepayment speeds, credit risk, etc.).
Level 3—Significant unobservable inputs (including the fund’s own assumptions used to determine the fair value of investments).
The fund’s investment in Vanguard Municipal Cash Management Fund is valued based on Level 1 inputs. All of the fund’s other investments were valued using amortized cost, in accordance with rules under the Investment Company Act of 1940. Amortized cost approximates the current fair value of a security, but since the value is not obtained from a quoted price in an active market, securities valued at amortized cost are considered to be valued using Level 2 inputs.
28
Prime Money Market Fund
D. Capital share transactions for each class of shares were:
| | | | |
| | | | Year Ended August 31, |
| | | 2014 | | 2013 |
| | Amount
($000) | Shares
(000) | Amount
($000) | Shares
(000) |
|
| Investor Shares |
| Issued | 130,693,911 | 130,693,911 | 133,084,052 | 133,084,052 |
| Issued in Lieu of Cash Distributions | 18,799 | 18,799 | 17,373 | 17,373 |
| Redeemed | (130,953,915) | (130,953,915) | (121,154,810) | (121,154,810) |
| Net Increase (Decrease)—Investor Shares | (241,205) | (241,205) | 11,946,615 | 11,946,615 |
| Institutional Shares |
| Issued | 17,139,226 | 17,139,226 | 17,154,977 | 17,154,977 |
| Issued in Lieu of Cash Distributions | 17,388 | 17,388 | 18,370 | 18,370 |
| Redeemed | (15,470,127) | (15,470,127) | (14,701,895) | (14,701,895) |
| Net Increase (Decrease) —Institutional Shares | 1,686,487 | 1,686,487 | 2,471,452 | 2,471,452 |
E. Management has determined that no material events or transactions occurred subsequent to August 31, 2014, that would require recognition or disclosure in these financial statements.
29
Federal Money Market Fund
Fund Profile
As of August 31, 2014
| |
| Financial Attributes | |
| | |
| Ticker Symbol | VMFXX |
| Expense Ratio1 | 0.14% |
| 7-Day SEC Yield | 0.01% |
| Average Weighted |
| Maturity | 54 days |
| |
| Sector Diversification (% of portfolio) | |
| U.S. Government Obligations | 96.1% |
| U.S. Treasury Bills | 3.9 |
| The agency and mortgage-backed securities sectors may include issues from government-sponsored enterprises; such issues are generally not backed by the full faith and credit of the U.S. government. |
|
|
|
| |
| Distribution by Credit Quality (% of portfolio) |
| First Tier | 100.0% |
| A First Tier security is one that is eligible for money market funds and has been rated in the highest short-term rating category for debt obligations by nationally recognized statistical rating organizations. Credit-quality ratings are obtained from Barclays and are from Moody's, Fitch, and S&P. The lowest rating for each issue is used. An unrated security is First Tier if it represents quality comparable to that of a rated security, as determined in accordance with SEC Rule 2a-7. For more information about these ratings, see the Glossary entry for Credit Quality. |
|
|
|
|
|
|
|
|
1 The expense ratio shown is from the prospectus dated December 23, 2013, and represents estimated costs for the current fiscal year. For the fiscal year ended August 31, 2014, the expense ratio was 0.09%, reflecting a temporary reduction in operating expenses (described in Note B of the Notes to Financial Statements). Before this reduction, the expense ratio was 0.11%.
30
Federal Money Market Fund
Performance Summary
Investment returns will fluctuate. All of the returns in this report represent past performance, which is not a guarantee of future results that may be achieved by the fund. (Current performance may be lower or higher than the performance data cited. For performance data current to the most recent month-end, visit our website at vanguard.com/performance.) The returns shown do not reflect taxes that a shareholder would pay on fund distributions. An investment in a money market fund is not insured or guaranteed by the Federal Deposit Insurance Corporation or any other government agency. Although the fund seeks to preserve the value of your investment at $1 per share, it is possible to lose money by investing in the fund. The fund’s 7-day SEC yield reflects its current earnings more closely than do the average annual returns.
Cumulative Performance: August 31, 2004, Through August 31, 2014
Initial Investment of $10,000
| | | | |
| | Average Annual Total Returns
Periods Ended August 31, 2014 | |
| |
Final Value
of a $10,000
Investment |
| | One
Year | Five
Years | Ten
Years |
| |
| |
| Federal Money Market Fund | 0.02% | 0.02% | 1.62% | $11,741 |
| Government Money Market Funds | | | | |
| Average | 0.00 | 0.00 | 1.31 | 11,391 |
| Citigroup Three-Month U.S. Treasury | | | | |
| Bill Index | 0.04 | 0.07 | 1.51 | 11,643 |
Government Money Market Funds Average: Derived from data provided by Lipper, a Thomson Reuters Company.
See Financial Highlights for dividend information.
31
Federal Money Market Fund
| | |
| Fiscal-Year Total Returns (%): August 31, 2004, Through August 31, 2014 | |
| | | Gov’t Money
Market Funds
Average |
| | |
| | |
| Fiscal Year | Total Returns | Total Returns |
| 2005 | 2.26% | 1.73% |
| 2006 | 4.31 | 3.78 |
| 2007 | 5.17 | 4.58 |
| 2008 | 3.46 | 2.71 |
| 2009 | 1.06 | 0.43 |
| 2010 | 0.04 | 0.00 |
| 2011 | 0.02 | 0.00 |
| 2012 | 0.01 | 0.00 |
| 2013 | 0.01 | 0.00 |
| 2014 | 0.02 | 0.00 |
| 7-day SEC yield (8/31/2014): 0.01% | | |
| Government Money Market Funds Average: Derived from data provided by Lipper, a Thomson Reuters Company. | |
Average Annual Total Returns: Periods Ended June 30, 2014
This table presents returns through the latest calendar quarter—rather than through the end of the fiscal period. Securities and Exchange Commission rules require that we provide this information.
| | | | |
| | Inception
Date | One
Year | Five
Years | Ten
Years |
| |
| Federal Money Market Fund | 7/13/1981 | 0.02% | 0.02% | 1.64% |
32
Federal Money Market Fund
Financial Statements
Statement of Net Assets
As of August 31, 2014
The fund reports a complete list of its holdings in various monthly and quarterly regulatory filings. The fund publishes its holdings on a monthly basis at vanguard.com and files them with the Securities and Exchange Commission on Form N-MFP. The fund’s Form N-MFP filings become public 60 days after the relevant month-end, and may be viewed at sec.gov or via a link on the “Portfolio Holdings” page on vanguard.com. For the second and fourth fiscal quarters, the lists appear in the fund’s semiannual and annual reports to shareholders. For the first and third fiscal quarters, the fund files the lists with the SEC on Form N-Q. Shareholders can look up the fund’s Forms N-Q on the SEC’s website at sec. gov. Forms N-Q may also be reviewed and copied at the SEC’s Public Reference Room (see the back cover of this report for further information).
| | | | | |
| | | | | Face | Market |
| | | | Maturity | Amount | Value |
| | | Yield1 | Date | ($000) | ($000) |
| U.S. Government and Agency Obligations (100.4%) | | | |
| 2 | Fannie Mae Discount Notes | 0.080% | 9/2/14 | 416 | 416 |
| 2 | Fannie Mae Discount Notes | 0.060%–0.100% | 9/3/14 | 50,312 | 50,312 |
| 2 | Fannie Mae Discount Notes | 0.060%–0.070% | 9/8/14 | 42,800 | 42,799 |
| 2 | Fannie Mae Discount Notes | 0.075%–0.095% | 9/10/14 | 41,534 | 41,533 |
| 2 | Fannie Mae Discount Notes | 0.080%–0.095% | 9/17/14 | 60,546 | 60,543 |
| 2 | Fannie Mae Discount Notes | 0.070%–0.080% | 9/22/14 | 34,275 | 34,273 |
| 2 | Fannie Mae Discount Notes | 0.075%–0.088% | 9/24/14 | 59,400 | 59,397 |
| 2 | Fannie Mae Discount Notes | 0.075%–0.085% | 10/1/14 | 18,074 | 18,073 |
| 2 | Fannie Mae Discount Notes | 0.075%–0.090% | 10/2/14 | 25,100 | 25,098 |
| 2 | Fannie Mae Discount Notes | 0.080% | 10/6/14 | 3,713 | 3,713 |
| 2 | Fannie Mae Discount Notes | 0.080% | 10/8/14 | 15,000 | 14,999 |
| 2 | Fannie Mae Discount Notes | 0.085% | 10/14/14 | 3,647 | 3,647 |
| 2 | Fannie Mae Discount Notes | 0.080%–0.092% | 10/15/14 | 18,800 | 18,798 |
| 2 | Fannie Mae Discount Notes | 0.080%–0.100% | 11/12/14 | 13,564 | 13,561 |
| 2 | Fannie Mae Discount Notes | 0.085%–0.100% | 11/17/14 | 11,100 | 11,098 |
| 2 | Fannie Mae Discount Notes | 0.070%–0.100% | 11/19/14 | 24,950 | 24,945 |
| 2 | Fannie Mae Discount Notes | 0.085%–0.100% | 11/26/14 | 10,000 | 9,998 |
| 2 | Fannie Mae Discount Notes | 0.090% | 12/1/14 | 32,100 | 32,093 |
| 2 | Fannie Mae Discount Notes | 0.090%–0.100% | 12/3/14 | 21,650 | 21,645 |
| 2 | Fannie Mae Discount Notes | 0.100% | 12/10/14 | 12,300 | 12,296 |
| 2 | Fannie Mae Discount Notes | 0.100% | 12/12/14 | 3,350 | 3,349 |
| 2 | Fannie Mae Discount Notes | 0.095%–0.110% | 12/17/14 | 33,040 | 33,030 |
| 2 | Fannie Mae Discount Notes | 0.100% | 12/24/14 | 10,910 | 10,907 |
| 2 | Fannie Mae Discount Notes | 0.095% | 1/2/15 | 3,860 | 3,859 |
| 2 | Fannie Mae Discount Notes | 0.090% | 1/5/15 | 6,700 | 6,698 |
| 2 | Fannie Mae Discount Notes | 0.100%–0.110% | 1/21/15 | 26,480 | 26,469 |
| 2 | Fannie Mae Discount Notes | 0.095%–0.105% | 1/28/15 | 24,300 | 24,290 |
| 2 | Fannie Mae Discount Notes | 0.120% | 1/30/15 | 1,000 | 999 |
| 2 | Fannie Mae Discount Notes | 0.100%–0.115% | 2/4/15 | 14,965 | 14,958 |
| 2 | Fannie Mae Discount Notes | 0.105% | 2/17/15 | 4,100 | 4,098 |
| 2 | Fannie Mae Discount Notes | 0.110% | 3/2/15 | 5,000 | 4,997 |
| 2 | Fannie Mae Discount Notes | 0.110%–0.120% | 3/16/15 | 32,800 | 32,780 |
| 3 | Federal Home Loan Bank Discount Notes | 0.085% | 9/5/14 | 25,000 | 25,000 |
| 3 | Federal Home Loan Bank Discount Notes | 0.070%–0.075% | 9/10/14 | 3,700 | 3,700 |
33
Federal Money Market Fund
| | | | | |
| | | | | Face | Market |
| | | | Maturity | Amount | Value |
| | | Yield1 | Date | ($000) | ($000) |
| 3 | Federal Home Loan Bank Discount Notes | 0.080% | 9/12/14 | 9,300 | 9,300 |
| 3 | Federal Home Loan Bank Discount Notes | 0.080% | 9/15/14 | 12,000 | 12,000 |
| 3 | Federal Home Loan Bank Discount Notes | 0.075%–0.100% | 9/19/14 | 11,000 | 11,000 |
| 3 | Federal Home Loan Bank Discount Notes | 0.080%–0.100% | 9/24/14 | 9,900 | 9,899 |
| 3 | Federal Home Loan Bank Discount Notes | 0.080% | 9/26/14 | 17,180 | 17,179 |
| 3 | Federal Home Loan Bank Discount Notes | 0.090% | 10/2/14 | 5,000 | 5,000 |
| 3 | Federal Home Loan Bank Discount Notes | 0.080% | 10/3/14 | 2,500 | 2,500 |
| 3 | Federal Home Loan Bank Discount Notes | 0.080%–0.100% | 10/8/14 | 13,785 | 13,784 |
| 3 | Federal Home Loan Bank Discount Notes | 0.080%–0.100% | 10/10/14 | 9,350 | 9,349 |
| 3 | Federal Home Loan Bank Discount Notes | 0.080% | 10/15/14 | 3,106 | 3,106 |
| 3 | Federal Home Loan Bank Discount Notes | 0.080%–0.090% | 10/17/14 | 36,504 | 36,500 |
| 3 | Federal Home Loan Bank Discount Notes | 0.080%–0.100% | 10/22/14 | 71,634 | 71,625 |
| 3 | Federal Home Loan Bank Discount Notes | 0.078%–0.100% | 10/24/14 | 64,969 | 64,961 |
| 3 | Federal Home Loan Bank Discount Notes | 0.070%–0.100% | 10/29/14 | 41,519 | 41,513 |
| 3 | Federal Home Loan Bank Discount Notes | 0.070%–0.100% | 10/31/14 | 41,954 | 41,948 |
| 3 | Federal Home Loan Bank Discount Notes | 0.080%–0.100% | 11/5/14 | 22,000 | 21,997 |
| 3 | Federal Home Loan Bank Discount Notes | 0.080%–0.100% | 11/7/14 | 5,855 | 5,854 |
| 3 | Federal Home Loan Bank Discount Notes | 0.080%–0.085% | 11/12/14 | 45,530 | 45,522 |
| 3 | Federal Home Loan Bank Discount Notes | 0.080% | 11/14/14 | 2,700 | 2,700 |
| 3 | Federal Home Loan Bank Discount Notes | 0.100% | 11/19/14 | 1,000 | 1,000 |
| 3 | Federal Home Loan Bank Discount Notes | 0.100%–0.110% | 11/28/14 | 5,917 | 5,915 |
| 3 | Federal Home Loan Bank Discount Notes | 0.110% | 12/3/14 | 5,000 | 4,999 |
| 3 | Federal Home Loan Bank Discount Notes | 0.100% | 12/11/14 | 3,000 | 2,999 |
| 3 | Federal Home Loan Bank Discount Notes | 0.110% | 12/17/14 | 1,250 | 1,250 |
| 3 | Federal Home Loan Bank Discount Notes | 0.100% | 12/24/14 | 2,190 | 2,189 |
| 3 | Federal Home Loan Bank Discount Notes | 0.100% | 1/9/15 | 7,300 | 7,297 |
| 3 | Federal Home Loan Bank Discount Notes | 0.105% | 1/16/15 | 8,900 | 8,896 |
| 3 | Federal Home Loan Bank Discount Notes | 0.110% | 1/20/15 | 2,000 | 1,999 |
| 3 | Federal Home Loan Bank Discount Notes | 0.105%–0.130% | 1/29/15 | 8,250 | 8,246 |
| 3,4 | Federal Home Loan Banks | 0.136% | 10/1/14 | 6,000 | 6,000 |
| 3,4 | Federal Home Loan Banks | 0.101% | 11/3/14 | 10,000 | 10,000 |
| 3,4 | Federal Home Loan Banks | 0.095% | 11/25/14 | 60,000 | 59,998 |
| 3,4 | Federal Home Loan Banks | 0.106% | 12/19/14 | 41,000 | 40,999 |
| 3,4 | Federal Home Loan Banks | 0.104% | 2/5/15 | 120,000 | 119,998 |
| 3,4 | Federal Home Loan Banks | 0.096% | 2/13/15 | 45,000 | 44,998 |
| 3,4 | Federal Home Loan Banks | 0.096% | 2/20/15 | 60,000 | 59,995 |
| 3,4 | Federal Home Loan Banks | 0.095% | 2/27/15 | 50,000 | 49,998 |
| 3,4 | Federal Home Loan Banks | 0.117% | 3/10/15 | 2,500 | 2,500 |
| 2,4 | Federal Home Loan Mortgage Corp. | 0.156% | 12/5/14 | 5,000 | 5,001 |
| 2,4 | Federal Home Loan Mortgage Corp. | 0.145% | 6/26/15 | 105,000 | 105,029 |
| 2,4 | Federal Home Loan Mortgage Corp. | 0.145% | 7/16/15 | 50,000 | 50,013 |
| 2,4 | Federal Home Loan Mortgage Corp. | 0.145% | 7/17/15 | 50,000 | 50,016 |
| 2,4 | Federal Home Loan Mortgage Corp. | 0.145% | 11/25/15 | 60,000 | 60,000 |
| 2,4 | Federal National Mortgage Assn. | 0.137% | 9/11/14 | 150,000 | 149,999 |
| 2,4 | Federal National Mortgage Assn. | 0.165% | 1/20/15 | 10,000 | 10,002 |
| 2,4 | Federal National Mortgage Assn. | 0.125% | 2/27/15 | 82,000 | 81,993 |
| 2,4 | Federal National Mortgage Assn. | 0.126% | 8/5/15 | 30,000 | 29,994 |
| 2 | Freddie Mac Discount Notes | 0.060%–0.070% | 9/2/14 | 18,720 | 18,720 |
| 2 | Freddie Mac Discount Notes | 0.080%–0.095% | 9/4/14 | 12,450 | 12,450 |
| 2 | Freddie Mac Discount Notes | 0.065%–0.095% | 9/5/14 | 5,600 | 5,600 |
| 2 | Freddie Mac Discount Notes | 0.070% | 9/9/14 | 4,193 | 4,193 |
| 2 | Freddie Mac Discount Notes | 0.060%–0.070% | 9/11/14 | 58,850 | 58,849 |
| 2 | Freddie Mac Discount Notes | 0.060%–0.070% | 9/12/14 | 25,040 | 25,039 |
| 2 | Freddie Mac Discount Notes | 0.095%–0.100% | 9/15/14 | 40,391 | 40,389 |
34
Federal Money Market Fund
| | | | |
| | | | Face | Market |
| | | Maturity | Amount | Value |
| | Yield1 | Date | ($000) | ($000) |
| 2 Freddie Mac Discount Notes | 0.100% | 9/16/14 | 1,600 | 1,600 |
| 2 Freddie Mac Discount Notes | 0.070%–0.075% | 9/24/14 | 33,179 | 33,177 |
| 2 Freddie Mac Discount Notes | 0.080% | 9/25/14 | 15,000 | 14,999 |
| 2 Freddie Mac Discount Notes | 0.075%–0.080% | 9/26/14 | 31,100 | 31,098 |
| 2 Freddie Mac Discount Notes | 0.078% | 9/29/14 | 4,000 | 4,000 |
| 2 Freddie Mac Discount Notes | 0.072%–0.080% | 10/6/14 | 29,494 | 29,492 |
| 2 Freddie Mac Discount Notes | 0.070% | 10/7/14 | 19,500 | 19,499 |
| 2 Freddie Mac Discount Notes | 0.080% | 10/14/14 | 11,600 | 11,599 |
| 2 Freddie Mac Discount Notes | 0.080% | 10/15/14 | 4,400 | 4,400 |
| 2 Freddie Mac Discount Notes | 0.080%–0.085% | 10/16/14 | 7,040 | 7,039 |
| 2 Freddie Mac Discount Notes | 0.080%–0.090% | 10/17/14 | 35,430 | 35,426 |
| 2 Freddie Mac Discount Notes | 0.085%–0.090% | 10/20/14 | 10,500 | 10,499 |
| 2 Freddie Mac Discount Notes | 0.080% | 10/21/14 | 3,000 | 3,000 |
| 2 Freddie Mac Discount Notes | 0.080% | 10/22/14 | 3,000 | 3,000 |
| 2 Freddie Mac Discount Notes | 0.080%–0.090% | 10/23/14 | 7,302 | 7,301 |
| 2 Freddie Mac Discount Notes | 0.080% | 10/24/14 | 18,500 | 18,498 |
| 2 Freddie Mac Discount Notes | 0.080%–0.085% | 10/27/14 | 24,381 | 24,378 |
| 2 Freddie Mac Discount Notes | 0.085% | 10/31/14 | 7,000 | 6,999 |
| 2 Freddie Mac Discount Notes | 0.080%–0.090% | 11/3/14 | 34,340 | 34,335 |
| 2 Freddie Mac Discount Notes | 0.095% | 11/4/14 | 2,500 | 2,500 |
| 2 Freddie Mac Discount Notes | 0.085%–0.095% | 11/10/14 | 9,825 | 9,823 |
| 2 Freddie Mac Discount Notes | 0.070%–0.100% | 11/12/14 | 7,730 | 7,729 |
| 2 Freddie Mac Discount Notes | 0.085%–0.090% | 11/13/14 | 14,465 | 14,462 |
| 2 Freddie Mac Discount Notes | 0.080%–0.095% | 11/17/14 | 10,727 | 10,725 |
| 2 Freddie Mac Discount Notes | 0.090% | 11/18/14 | 3,000 | 2,999 |
| 2 Freddie Mac Discount Notes | 0.095% | 11/19/14 | 10,350 | 10,348 |
| 2 Freddie Mac Discount Notes | 0.090% | 11/26/14 | 5,100 | 5,099 |
| 2 Freddie Mac Discount Notes | 0.100% | 12/1/14 | 3,081 | 3,080 |
| 2 Freddie Mac Discount Notes | 0.100% | 12/8/14 | 14,000 | 13,996 |
| 2 Freddie Mac Discount Notes | 0.090%–0.100% | 12/11/14 | 17,469 | 17,464 |
| 2 Freddie Mac Discount Notes | 0.085% | 12/15/14 | 1,000 | 1,000 |
| 2 Freddie Mac Discount Notes | 0.100%–0.110% | 12/22/14 | 15,080 | 15,075 |
| 2 Freddie Mac Discount Notes | 0.100% | 12/29/14 | 16,250 | 16,245 |
| 2 Freddie Mac Discount Notes | 0.120% | 1/12/15 | 2,500 | 2,499 |
| 2 Freddie Mac Discount Notes | 0.130% | 1/13/15 | 1,800 | 1,799 |
| 2 Freddie Mac Discount Notes | 0.120% | 1/14/15 | 1,005 | 1,005 |
| 2 Freddie Mac Discount Notes | 0.130% | 1/20/15 | 3,334 | 3,332 |
| 2 Freddie Mac Discount Notes | 0.110% | 1/21/15 | 4,900 | 4,898 |
| 2 Freddie Mac Discount Notes | 0.120% | 1/22/15 | 1,700 | 1,699 |
| 2 Freddie Mac Discount Notes | 0.100% | 2/2/15 | 7,300 | 7,297 |
| 2 Freddie Mac Discount Notes | 0.105% | 2/4/15 | 1,000 | 1,000 |
| 2 Freddie Mac Discount Notes | 0.140% | 2/9/15 | 1,405 | 1,404 |
| 2 Freddie Mac Discount Notes | 0.110% | 2/13/15 | 3,000 | 2,998 |
| 2 Freddie Mac Discount Notes | 0.110% | 3/16/15 | 7,100 | 7,096 |
| 2 Freddie Mac Discount Notes | 0.110% | 3/17/15 | 38,900 | 38,877 |
| United States Treasury Bill | 0.060% | 12/11/14 | 25,000 | 24,996 |
| United States Treasury Bill | 0.068% | 12/18/14 | 25,000 | 24,995 |
| United States Treasury Bill | 0.065% | 1/2/15 | 25,000 | 24,994 |
| United States Treasury Note/Bond | 0.250% | 9/15/14 | 10,000 | 10,001 |
| United States Treasury Note/Bond | 0.250% | 9/30/14 | 60,000 | 60,008 |
| United States Treasury Note/Bond | 2.375% | 9/30/14 | 3,500 | 3,506 |
| United States Treasury Note/Bond | 0.250% | 10/31/14 | 4,000 | 4,001 |
| United States Treasury Note/Bond | 2.375% | 10/31/14 | 35,000 | 35,132 |
| United States Treasury Note/Bond | 0.375% | 11/15/14 | 5,500 | 5,503 |
| United States Treasury Note/Bond | 4.250% | 11/15/14 | 8,654 | 8,728 |
35
Federal Money Market Fund
| | | | |
| | | | Face | Market |
| | | Maturity | Amount | Value |
| | Yield1 | Date | ($000) | ($000) |
| United States Treasury Note/Bond | 0.250% | 11/30/14 | 50,000 | 50,022 |
| United States Treasury Note/Bond | 2.125% | 11/30/14 | 2,670 | 2,683 |
| United States Treasury Note/Bond | 4.000% | 2/15/15 | 25,000 | 25,445 |
| United States Treasury Note/Bond | 0.250% | 2/28/15 | 37,000 | 37,031 |
| United States Treasury Note/Bond | 2.375% | 2/28/15 | 32,500 | 32,871 |
| Total U.S. Government and Agency Obligations (Cost $3,121,375) | | | 3,121,375 |
| Total Investments (100.4%) (Cost $3,121,375) | | | | 3,121,375 |
| Other Assets and Liabilities (-0.4%) | | | | |
| Other Assets | | | | 22,573 |
| Liabilities | | | | (35,576) |
| | | | | (13,003) |
| Net Assets (100%) | | | | |
| Applicable to 3,107,837,915 outstanding $.001 par value shares of | | | |
| beneficial interest (unlimited authorization) | | | | 3,108,372 |
| Net Asset Value Per Share | | | | $1.00 |
| |
| |
| At August 31, 2014, net assets consisted of: | | | | |
| | | | | Amount |
| | | | | ($000) |
| Paid-in Capital | | | | 3,108,347 |
| Undistributed Net Investment Income | | | | — |
| Accumulated Net Realized Gains | | | | 25 |
| Net Assets | | | | 3,108,372 |
See Note A in Notes to Financial Statements.
1 Represents annualized yield at date of purchase for discount securities, and coupon for coupon-bearing securities.
2 The issuer was placed under federal conservatorship in September 2008; since that time, its daily operations have been managed by the Federal Housing Finance Agency and it receives capital from the U.S. Treasury, as needed to maintain a positive net worth, in exchange for senior preferred stock.
3 The issuer operates under a congressional charter; its securities are generally neither guaranteed by the U.S. Treasury nor backed by the full faith and credit of the U.S. government.
4 Adjustable-rate security.
See accompanying Notes, which are an integral part of the Financial Statements.
36
Federal Money Market Fund
Statement of Operations
| |
| | Year Ended |
| | August 31, 2014 |
| | ($000) |
| Investment Income | |
| Income | |
| Interest | 3,333 |
| Total Income | 3,333 |
| Expenses | |
| The Vanguard Group—Note B | |
| Investment Advisory Services | 86 |
| Management and Administrative | 2,879 |
| Marketing and Distribution | 547 |
| Custodian Fees | 40 |
| Auditing Fees | 32 |
| Shareholders’ Reports | 36 |
| Trustees’ Fees and Expenses | 4 |
| Total Expenses | 3,624 |
| Expense Reduction—Note B | (622) |
| Net Expenses | 3,002 |
| Net Investment Income | 331 |
| Realized Net Gain (Loss) on Investment Securities Sold | 18 |
| Net Increase (Decrease) in Net Assets Resulting from Operations | 349 |
See accompanying Notes, which are an integral part of the Financial Statements.
37
Federal Money Market Fund
Statement of Changes in Net Assets
| | Year Ended August 31, |
| | 2014
($000) | 2013
($000) |
|
| Increase (Decrease) in Net Assets |
| Operations |
| Net Investment Income | 331 | 512 |
| Realized Net Gain (Loss) | 18 | 61 |
| Net Increase (Decrease) in Net Assets Resulting from Operations | 349 | 573 |
| Distributions | | |
| Net Investment Income | (331) | (512) |
| Realized Capital Gain1 | (206) | — |
| Total Distributions | (537) | (512) |
| Capital Share Transactions (at $1.00 per share) |
| Issued | 307,101 | 345,150 |
| Issued in Lieu of Cash Distributions | 528 | 503 |
| Redeemed | (720,738) | (927,215) |
| Net Increase (Decrease) from Capital Share Transactions | (413,109) | (581,562) |
| Total Increase (Decrease) | (413,297) | (581,501) |
| Net Assets |
| Beginning of Period | 3,521,669 | 4,103,170 |
| End of Period | 3,108,372 | 3,521,669 |
| 1 Includes fiscal 2014 short-term gain distributions totaling $206,000. Short-term gain distributions are treated as ordinary income dividends for tax purposes. |
|
See accompanying Notes, which are an integral part of the Financial Statements.
38
Federal Money Market Fund
Financial Highlights
| | | | | |
| For a Share Outstanding | | | Year Ended August 31, |
| Throughout Each Period | 2014 | 2013 | 2012 | 2011 | 2010 |
| Net Asset Value, Beginning of Period | $1.00 | $1.00 | $1.00 | $1.00 | $1.00 |
| Investment Operations |
| Net Investment Income | .0001 | .0001 | .0001 | .0002 | .0004 |
| Net Realized and Unrealized Gain (Loss) |
| on Investments | — | — | — | — | — |
| Total from Investment Operations | .0001 | .0001 | .0001 | .0002 | .0004 |
| Distributions |
| Dividends from Net Investment Income | (.0001) | (.0001) | (.0001) | (.0002) | (.0004) |
| Distributions from Realized Capital Gains | (.0000)1 | — | — | — | — |
| Total Distributions | (.0001) | (.0001) | (.0001) | (.0002) | (.0004) |
| Net Asset Value, End of Period | $1.00 | $1.00 | $1.00 | $1.00 | $1.00 |
|
| Total Return2 | 0.02% | 0.01% | 0.01% | 0.02% | 0.04% |
|
| Ratios/Supplemental Data | | | | | |
| Net Assets, End of Period (Millions) | $3,108 | $3,522 | $4,103 | $4,794 | $6,048 |
| Ratio of Expenses to Average Net Assets | 0.09%3 | 0.13%3 | 0.12%3 | 0.19%3 | 0.22% |
| Ratio of Net Investment Income to |
| Average Net Assets | 0.01% | 0.01% | 0.01% | 0.02% | 0.04% |
1 Distribution was less than $.0001 per share.
2 Total returns do not include account service fees that may have applied in the periods shown. Fund prospectuses provide information about any applicable account service fees.
3 The ratio of total expenses to average net assets before an expense reduction was 0.11% for 2014, 0.14% for 2013, 0.16% for 2012, and 0.20% for 2011. See Note B in the Notes to Financial Statements.
See accompanying Notes, which are an integral part of the Financial Statements.
39
Federal Money Market Fund
Notes to Financial Statements
Vanguard Federal Money Market Fund is registered under the Investment Company Act of 1940 as an open-end investment company, or mutual fund. The fund invests in short-term debt instruments issued by the U.S. government or its agencies and instrumentalities, and repurchase agreements collateralized by such instruments.
A. The following significant accounting policies conform to generally accepted accounting principles for U.S. investment companies. The fund consistently follows such policies in preparing its financial statements.
1. Security Valuation: Securities are valued as of the close of trading on the New York Stock Exchange (generally 4 p.m., Eastern time) on the valuation date. Securities are valued at amortized cost, which approximates market value.
2. Repurchase Agreements: The fund enters into repurchase agreements with institutional counterparties. Securities pledged as collateral to the fund under repurchase agreements are held by a custodian bank until the agreements mature. Each agreement requires that the market value of the collateral be sufficient to cover payments of interest and principal. The fund further mitigates its counterparty risk by entering into repurchase agreements only with a diverse group of prequalified counterparties, monitoring their financial strength, and entering into master repurchase agreements with its counterparties. The master repurchase agreements provide that, in the event of a counterparty’s default (including bankruptcy), the fund may terminate any repurchase agreements with that counterparty, determine the net amount owed, and sell or retain the collateral up to the net amount owed to the fund. Such action may be subject to legal proceedings, which may delay or limit the disposition of collateral. The fund had no open repurchase agreements at August 31, 2014.
3. Federal Income Taxes: The fund intends to continue to qualify as a regulated investment company and distribute all of its taxable income. Management has analyzed the fund’s tax positions taken for all open federal income tax years (August 31, 2011–2014), and has concluded that no provision for federal income tax is required in the fund’s financial statements.
4. Distributions: Distributions from net investment income are declared daily and paid on the first business day of the following month.
5. Credit Facility: The fund and certain other funds managed by The Vanguard Group participate in a $2.89 billion committed credit facility provided by a syndicate of lenders pursuant to a credit agreement that may be renewed annually; each fund is individually liable for its borrowings, if any, under the credit facility. Borrowings may be utilized for temporary and emergency purposes, and are subject to the fund’s regulatory and contractual borrowing restrictions. The participating funds are charged administrative fees and an annual commitment fee of 0.06% of the undrawn amount of the facility; these fees are allocated to the funds based on a method approved by the fund’s board of trustees and included in Management and Administrative expenses on the fund’s Statement of Operations. Any borrowings under this facility bear interest at a rate equal to the higher of the federal funds rate or LIBOR reference rate plus an agreed-upon spread.
The fund had no borrowings outstanding at August 31, 2014, or at any time during the period then ended.
6. Other: Interest income is accrued daily. Premiums and discounts on debt securities purchased are amortized and accreted, respectively, to interest income over the lives of the respective securities. Security transactions are accounted for on the date securities are bought or sold. Costs used to determine realized gains (losses) on the sale of investment securities are those of the specific securities sold.
40
Federal Money Market Fund
B. The Vanguard Group furnishes at cost investment advisory, corporate management, administrative, marketing, and distribution services. The costs of such services are allocated to the fund based on methods approved by the board of trustees. The fund has committed to provide up to 0.40% of its net assets in capital contributions to Vanguard. At August 31, 2014, the fund had contributed capital of $318,000 to Vanguard (included in Other Assets), representing 0.01% of the fund’s net assets and 0.13% of Vanguard’s capitalization. The fund’s trustees and officers are also directors and officers of Vanguard. Vanguard and the board of trustees have agreed to temporarily limit certain net operating expenses in excess of the fund’s daily yield so as to maintain a zero or positive yield for the fund. Vanguard and the board of trustees may terminate the temporary expense limitation at any time.
For the year ended August 31, 2014, Vanguard’s expenses were reduced by $622,000 (an effective annual rate of 0.02% of the fund’s average net assets).
C. Various inputs may be used to determine the value of the fund’s investments. These inputs are summarized in three broad levels for financial statement purposes. The inputs or methodologies used to value securities are not necessarily an indication of the risk associated with investing in those securities.
Level 1—Quoted prices in active markets for identical securities.
Level 2—Other significant observable inputs (including quoted prices for similar securities, interest rates, prepayment speeds, credit risk, etc.).
Level 3—Significant unobservable inputs (including the fund’s own assumptions used to determine the fair value of investments).
At August 31, 2014, 100% of the market value of the fund’s investments was determined using amortized cost, in accordance with rules under the Investment Company Act of 1940. Amortized cost approximates the current fair value of a security, but since the value is not obtained from a quoted price in an active market, securities valued at amortized cost are considered to be valued using Level 2 inputs.
D. Management has determined that no material events or transactions occurred subsequent to August 31, 2014, that would require recognition or disclosure in these financial statements.
41
Admiral Treasury Money Market Fund
Fund Profile
As of August 31, 2014
| |
| Financial Attributes | |
| Ticker Symbol | VUSXX |
| Expense Ratio1 | 0.09% |
| 7-Day SEC Yield | 0.01% |
| Average Weighted |
| Maturity | 58 days |
| |
| Sector Diversification (% of portfolio) |
| U.S. Treasury Bills | 100.0% |
| The agency and mortgage-backed securities sectors may include issues from government-sponsored enterprises; such issues are generally not backed by the full faith and credit of the U.S. government. |
|
|
|
| |
| Distribution by Credit Quality (% of portfolio) |
|
| First Tier | 100.0% |
| A First Tier security is one that is eligible for money market funds and has been rated in the highest short-term rating category for debt obligations by nationally recognized statistical rating organizations. Credit-quality ratings are obtained from Barclays and are from Moody's, Fitch, and S&P. The lowest rating for each issue is used. An unrated security is First Tier if it represents quality comparable to that of a rated security, as determined in accordance with SEC Rule 2a-7. For more information about these ratings, see the Glossary entry for Credit Quality. |
|
|
|
|
|
|
|
|
|
1 The expense ratio shown is from the prospectus dated December 23, 2013, and represents estimated costs for the current fiscal year. For the fiscal year ended August 31, 2014, the expense ratio was 0.05%, reflecting a temporary reduction in operating expenses (described in Note B of the Notes to Financial Statements). Before this reduction, the expense ratio was 0.09%.
42
Admiral Treasury Money Market Fund
Performance Summary
Investment returns will fluctuate. All of the returns in this report represent past performance, which is not a guarantee of future results that may be achieved by the fund. (Current performance may be lower or higher than the performance data cited. For performance data current to the most recent month-end, visit our website at vanguard.com/performance.) The returns shown do not reflect taxes that a shareholder would pay on fund distributions. An investment in a money market fund is not insured or guaranteed by the Federal Deposit Insurance Corporation or any other government agency. Although the fund seeks to preserve the value of your investment at $1 per share, it is possible to lose money by investing in the fund. The fund’s 7-day SEC yield reflects its current earnings more closely than do the average annual returns.
Cumulative Performance: August 31, 2004, Through August 31, 2014
Initial Investment of $50,000
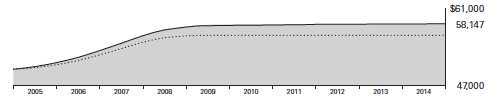
| | | | |
| | Average Annual Total Returns
Periods Ended August 31, 2014 | |
| | |
One
Year | Five
Years | Ten
Years | Final Value
of a $50,000
Investment |
|
|
|
| Admiral Treasury Money Market | | | | |
| Fund | 0.01% | 0.02% | 1.52% | $58,147 |
| iMoneyNet Money Fund Report’s | | | | |
| 100% Treasury Funds Average | 0.00 | 0.00 | 1.16 | 56,124 |
| Citigroup Three-Month U.S. Treasury | | | | |
| Bill Index | 0.04 | 0.07 | 1.51 | 58,213 |
iMoneyNet Money Fund Report’s 100% Treasury Funds Average: Derived from data provided by Lipper, a Thomson Reuters Company.
See Financial Highlights for dividend information.
43
Admiral Treasury Money Market Fund
| | |
| Fiscal-Year Total Returns (%): August 31, 2004, Through August 31, 2014 | |
| | | iMoneyNet
Average
Total Returns |
| | |
| Fiscal Year | Total Returns |
| 2005 | 2.29% | 1.61% |
| 2006 | 4.22 | 3.54 |
| 2007 | 5.01 | 4.34 |
| 2008 | 3.08 | 2.08 |
| 2009 | 0.70 | 0.17 |
| 2010 | 0.03 | 0.00 |
| 2011 | 0.02 | 0.00 |
| 2012 | 0.01 | 0.00 |
| 2013 | 0.02 | 0.00 |
| 2014 | 0.01 | 0.00 |
| 7-day SEC yield (8/31/2014): 0.01% | | |
| iMoneyNet Money Fund Report’s 100% Treasury Funds Average: Derived from data provided by iMoneyNet, Inc. | |
Average Annual Total Returns: Periods Ended June 30, 2014
This table presents returns through the latest calendar quarter—rather than through the end of the fiscal period. Securities and Exchange Commission rules require that we provide this information.
| | | | |
| | Inception
Date | One
Year | Five
Years | Ten
Years |
| |
| Admiral Treasury Money Market | | | | |
| Fund | 12/14/1992 | 0.01% | 0.02% | 1.54% |
44
Admiral Treasury Money Market Fund
Financial Statements
Statement of Net Assets
As of August 31, 2014
The fund reports a complete list of its holdings in various monthly and quarterly regulatory filings. The fund publishes its holdings on a monthly basis at vanguard.com and files them with the Securities and Exchange Commission on Form N-MFP. The fund’s Form N-MFP filings become public 60 days after the relevant month-end, and may be viewed at sec.gov or via a link on the “Portfolio Holdings” page on vanguard.com. For the second and fourth fiscal quarters, the lists appear in the fund’s semiannual and annual reports to shareholders. For the first and third fiscal quarters, the fund files the lists with the SEC on Form N-Q. Shareholders can look up the fund’s Forms N-Q on the SEC’s website at sec. gov. Forms N-Q may also be reviewed and copied at the SEC’s Public Reference Room (see the back cover of this report for further information).
| | | | |
| | | | Face | Market |
| | | Maturity | Amount | Value |
| | Yield1 | Date | ($000) | ($000) |
| U.S. Government and Agency Obligations (99.8%) | | | |
| United States Treasury Bill | 0.035% | 9/4/14 | 833,694 | 833,692 |
| United States Treasury Bill | 0.038% | 9/11/14 | 800,000 | 799,992 |
| United States Treasury Bill | 0.037% | 9/18/14 | 795,000 | 794,986 |
| United States Treasury Bill | 0.040% | 10/2/14 | 380,000 | 379,987 |
| United States Treasury Bill | 0.031% | 10/9/14 | 550,000 | 549,982 |
| United States Treasury Bill | 0.025% | 10/23/14 | 212,000 | 211,992 |
| United States Treasury Bill | 0.034% | 10/30/14 | 725,000 | 724,960 |
| United States Treasury Bill | 0.026% | 11/6/14 | 900,000 | 899,958 |
| United States Treasury Bill | 0.028% | 11/13/14 | 690,000 | 689,962 |
| United States Treasury Bill | 0.035% | 11/20/14 | 920,000 | 919,928 |
| United States Treasury Bill | 0.028% | 11/28/14 | 950,000 | 949,936 |
| United States Treasury Bill | 0.058%–0.065% | 12/11/14 | 125,010 | 124,990 |
| United States Treasury Bill | 0.056% | 2/5/15 | 160,000 | 159,961 |
| 2 United States Treasury Floating Rate Note | 0.100% | 7/31/16 | 150,000 | 150,000 |
| United States Treasury Note/Bond | 0.250% | 9/30/14 | 309,000 | 309,048 |
| United States Treasury Note/Bond | 2.375% | 9/30/14 | 182,000 | 182,337 |
| United States Treasury Note/Bond | 0.500% | 10/15/14 | 200,000 | 200,106 |
| United States Treasury Note/Bond | 0.250% | 10/31/14 | 55,000 | 55,018 |
| United States Treasury Note/Bond | 4.250% | 11/15/14 | 635,000 | 640,407 |
| United States Treasury Note/Bond | 0.375% | 11/15/14 | 115,000 | 115,071 |
| United States Treasury Note/Bond | 2.125% | 11/30/14 | 585,000 | 587,953 |
| United States Treasury Note/Bond | 0.250% | 11/30/14 | 65,000 | 65,028 |
| Total U.S. Government and Agency Obligations (Cost $10,345,294) | | | 10,345,294 |
| Total Investments (99.8%) (Cost $10,345,294) | | | 10,345,294 |
| Other Assets and Liabilities (0.2%) | | | | |
| Other Assets | | | | 24,492 |
| Liabilities | (5,171) |
| | 19,321 |
| Net Assets (100%) |
Applicable to 10,361,612,164 outstanding $.001 par value shares of
beneficial interest (unlimited authorization) | |
| 10,364,615 |
| Net Asset Value Per Share | | | | $1.00 |
45
Admiral Treasury Money Market Fund
| |
| At August 31, 2014, net assets consisted of: | |
| | Amount |
| | ($000) |
| Paid-in Capital | 10,364,652 |
| Undistributed Net Investment Income | — |
| Accumulated Net Realized Losses | (37) |
| Net Assets | 10,364,615 |
See Note A in Notes to Financial Statements.
1 Represents annualized yield at date of purchase for discount securities, and coupon for coupon-bearing securities.
2 Adjustable-rate security.
See accompanying Notes, which are an integral part of the Financial Statements.
46
Admiral Treasury Money Market Fund
Statement of Operations
| |
| | Year Ended |
| | August 31, 2014 |
| | ($000) |
| Investment Income |
| Income |
| Interest | 6,392 |
| Total Income | 6,392 |
| Expenses |
| The Vanguard Group—Note B |
| Investment Advisory Services | 285 |
| Management and Administrative | 7,769 |
| Marketing and Distribution | 1,606 |
| Custodian Fees | 115 |
| Auditing Fees | 27 |
| Shareholders’ Reports | 64 |
| Trustees’ Fees and Expenses | 9 |
| Total Expenses | 9,875 |
| Expense Reduction—Note B | (4,579) |
| Net Expenses | 5,296 |
| Net Investment Income | 1,096 |
| Realized Net Gain (Loss) on Investment Securities Sold | (54) |
| Net Increase (Decrease) in Net Assets Resulting from Operations | 1,042 |
See accompanying Notes, which are an integral part of the Financial Statements.
47
Admiral Treasury Money Market Fund
Statement of Changes in Net Assets
| | |
| | Year Ended August 31, |
| | 2014 | 2013 |
| | ($000) | ($000) |
| Increase (Decrease) in Net Assets |
| Operations |
| Net Investment Income | 1,096 | 1,989 |
| Realized Net Gain (Loss) | (54) | 3 |
| Net Increase (Decrease) in Net Assets Resulting from Operations | 1,042 | 1,992 |
| Distributions |
| Net Investment Income | (1,096) | (1,989) |
| Realized Capital Gain1 | (185) | — |
| Total Distributions | (1,281) | (1,989) |
| Capital Share Transactions (at $1.00 per share) |
| Issued | 615,277 | 733,020 |
| Issued in Lieu of Cash Distributions | 1,248 | 1,932 |
| Redeemed | (1,911,196) | (2,429,133) |
| Net Increase (Decrease) from Capital Share Transactions | (1,294,671) | (1,694,181) |
| Total Increase (Decrease) | (1,294,910) | (1,694,178) |
| Net Assets |
| Beginning of Period | 11,659,525 | 13,353,703 |
| End of Period | 10,364,615 | 11,659,525 |
| 1 Includes fiscal 2014 short-term gain distributions totaling $185,000. Short-term gain distributions are treated as ordinary income dividends for tax purposes. |
|
See accompanying Notes, which are an integral part of the Financial Statements.
48
Admiral Treasury Money Market Fund
Financial Highlights
| | | | | |
| For a Share Outstanding | | | Year Ended August 31, |
| Throughout Each Period | 2014 | 2013 | 2012 | 2011 | 2010 |
| Net Asset Value, Beginning of Period | $1.00 | $1.00 | $1.00 | $1.00 | $1.00 |
| Investment Operations |
| Net Investment Income | .0001 | .0002 | .0001 | .0002 | .0003 |
| Net Realized and Unrealized Gain |
| (Loss) on Investments | — | — | — | — | — |
| Total from Investment Operations | .0001 | .0002 | .0001 | .0002 | .0003 |
| Distributions | | | | | |
| Dividends from Net Investment Income | (.0001) | (.0002) | (.0001) | (.0002) | (.0003) |
| Distributions from Realized Capital Gains | (.0000)1 | — | — | — | — |
| Total Distributions | (.0001) | (.0002) | (.0001) | (.0002) | (.0003) |
| Net Asset Value, End of Period | $1.00 | $1.00 | $1.00 | $1.00 | $1.00 |
|
| Total Return2 | 0.01% | 0.02% | 0.01% | 0.02% | 0.03% |
|
| Ratios/Supplemental Data | | | | | |
| Net Assets, End of Period (Millions) | $10,365 | $11,660 | $13,354 | $15,314 | $18,726 |
| Ratio of Total Expenses to Average Net Assets | 0.05%3 | 0.08%3 | 0.05%3 | 0.11%3 | 0.14% |
| Ratio of Net Investment Income to |
| Average Net Assets | 0.01% | 0.02% | 0.01% | 0.02% | 0.03% |
1 Distributions from realized capital gains were less than $.0001 per share.
2 Total returns do not include account service fees that may have applied in the periods shown. Fund prospectuses provide information about any applicable account service fees.
3 The ratio of total expenses to average net assets before an expense reduction was 0.09% for 2014, 0.09% for 2013, 0.10% for 2012, and 0.12% for 2011. See Note B in the Notes to Financial Statements.
See accompanying Notes, which are an integral part of the Financial Statements.
49
Admiral Treasury Money Market Fund
Notes to Financial Statements
Vanguard Admiral Treasury Money Market Fund is registered under the Investment Company Act of 1940 as an open-end investment company, or mutual fund. The fund invests in short-term debt instruments backed by the full faith and credit of the U.S. government.
A. The following significant accounting policies conform to generally accepted accounting principles for U.S. investment companies. The fund consistently follows such policies in preparing its financial statements.
1. Security Valuation: Securities are valued as of the close of trading on the New York Stock Exchange (generally 4 p.m., Eastern time) on the valuation date. Securities are valued at amortized cost, which approximates market value.
2. Federal Income Taxes: The fund intends to continue to qualify as a regulated investment company and distribute all of its taxable income. Management has analyzed the fund’s tax positions taken for all open federal income tax years (August 31, 2011–2014), and has concluded that no provision for federal income tax is required in the fund’s financial statements.
3. Distributions: Distributions from net investment income are declared daily and paid on the first business day of the following month.
4. Credit Facility: The fund and certain other funds managed by The Vanguard Group participate in a $2.89 billion committed credit facility provided by a syndicate of lenders pursuant to a credit agreement that may be renewed annually; each fund is individually liable for its borrowings, if any, under the credit facility. Borrowings may be utilized for temporary and emergency purposes, and are subject to the fund’s regulatory and contractual borrowing restrictions. The participating funds are charged administrative fees and an annual commitment fee of 0.06% of the undrawn amount of the facility; these fees are allocated to the funds based on a method approved by the fund’s board of trustees and included in Management and Administrative expenses on the fund’s Statement of Operations. Any borrowings under this facility bear interest at a rate equal to the higher of the federal funds rate or LIBOR reference rate plus an agreed-upon spread.
The fund had no borrowings outstanding at August 31, 2014, or at any time during the period then ended.
5. Other: Interest income is accrued daily. Premiums and discounts on debt securities purchased are amortized and accreted, respectively, to interest income over the lives of the respective securities. Security transactions are accounted for on the date securities are bought or sold. Costs used to determine realized gains (losses) on the sale of investment securities are those of the specific securities sold.
B. The Vanguard Group furnishes at cost investment advisory, corporate management, administrative, marketing, and distribution services. The costs of such services are allocated to the fund based on methods approved by the board of trustees. The fund has committed to provide up to 0.40% of its net assets in capital contributions to Vanguard. At August 31, 2014, the fund had contributed capital of $1,058,000 to Vanguard (included in Other Assets), representing 0.01% of the fund’s net assets and 0.42% of Vanguard’s capitalization. The fund’s trustees and officers are also directors and officers of Vanguard. Vanguard and the board of trustees have agreed to temporarily limit certain net operating expenses in excess of the fund’s daily yield so as to maintain a zero or positive yield for the fund. Vanguard and the board of trustees may terminate the temporary expense limitation at any time.
For the year ended August 31, 2014, Vanguard’s expenses were reduced by $4,579,000 (an effective annual rate of 0.04% of the fund’s average net assets).
50
Admiral Treasury Money Market Fund
C. Various inputs may be used to determine the value of the fund’s investments. These inputs are summarized in three broad levels for financial statement purposes. The inputs or methodologies used to value securities are not necessarily an indication of the risk associated with investing in those securities.
Level 1—Quoted prices in active markets for identical securities.
Level 2—Other significant observable inputs (including quoted prices for similar securities, interest rates, prepayment speeds, credit risk, etc.).
Level 3—Significant unobservable inputs (including the fund’s own assumptions used to determine the fair value of investments).
At August 31, 2014, 100% of the market value of the fund’s investments was determined using amortized cost, in accordance with rules under the Investment Company Act of 1940. Amortized cost approximates the current fair value of a security, but since the value is not obtained from a quoted price in an active market, securities valued at amortized cost are considered to be valued using Level 2 inputs.
D. Management has determined that no material events or transactions occurred subsequent to August 31, 2014, that would require recognition or disclosure in these financial statements.
51
Report of Independent Registered
Public Accounting Firm
To the Board of Trustees of Vanguard Money Market Reserves and Vanguard Admiral Funds and the Shareholders of Vanguard Prime Money Market Fund, Vanguard Federal Money Market Fund and Vanguard Admiral Treasury Money Market Fund:
In our opinion, the accompanying statements of net assets and the related statements of operations and of changes in net assets and the financial highlights present fairly, in all material respects, the financial position of Vanguard Prime Money Market Fund and Vanguard Federal Money Market Fund (constituting separate portfolios of Vanguard Money Market Reserves) and Vanguard Admiral Treasury Money Market Fund (constituting a separate portfolio of Vanguard Admiral Funds) (hereafter referred to as the “Funds”) at August 31, 2014, the results of each of their operations for the year then ended, the changes in each of their net assets for each of the two years in the period then ended, and the financial highlights for each of the five years in the period then ended, in conformity with accounting principles generally accepted in the United States of America. These financial statements and financial highlights (hereafter referred to as “financial statements”) are the responsibility of the Funds’ management. Our responsibility is to express an opinion on these financial statements based on our audits. We conducted our audits of these financial statements in accordance with the standards of the Public Company Accounting Oversight Board (United States). Those standards require that we plan and perform the audit to obtain reasonable assurance about whether the financial statements are free of material misstatement. An audit includes examining, on a test basis, evidence supporting the amounts and disclosures in the financial statements, assessing the accounting principles used and significant estimates made by management, and evaluating the overall financial statement presentation. We believe that our audits, which included confirmation of securities at August 31, 2014 by correspondence with the custodian and by agreement to the underlying ownership records of the transfer agent, provide a reasonable basis for our opinion.
/s/PricewaterhouseCoopers LLP
Philadelphia, Pennsylvania
October 10, 2014
52
| |
| |
Special 2014 tax information (unaudited) for Vanguard Prime Money Market Fund |
|
This information for the fiscal year ended August 31, 2014, is included pursuant to provisions of the Internal Revenue Code. |
|
|
|
For nonresident alien shareholders, 74.5% of income dividends are interest-related dividends. |
| |
| |
| Special 2014 tax information (unaudited) for Vanguard Federal Money Market Fund |
|
| This information for the fiscal year ended August 31, 2014, is included pursuant to provisions of the Internal Revenue Code. |
|
| For nonresident alien shareholders, 100% of income dividends are interest-related dividends. |
| |
| |
| Special 2014 tax information (unaudited) for Vanguard Admiral Treasury Money Market Fund |
| This information for the fiscal year ended August 31, 2014, is included pursuant to provisions of the Internal Revenue Code. |
|
| For nonresident alien shareholders, 100% of income dividends are interest-related dividends. |
53
About Your Fund’s Expenses
As a shareholder of the fund, you incur ongoing costs, which include costs for portfolio management, administrative services, and shareholder reports (like this one), among others. Operating expenses, which are deducted from a fund’s gross income, directly reduce the investment return of the fund.
A fund’s expenses are expressed as a percentage of its average net assets. This figure is known as the expense ratio. The following examples are intended to help you understand the ongoing costs (in dollars) of investing in your fund and to compare these costs with those of other mutual funds. The examples are based on an investment of $1,000 made at the beginning of the period shown and held for the entire period.
The accompanying table illustrates your fund’s costs in two ways:
• Based on actual fund return. This section helps you to estimate the actual expenses that you paid over the period. The ”Ending Account Value“ shown is derived from the fund‘s actual return, and the third column shows the dollar amount that would have been paid by an investor who started with $1,000 in the fund. You may use the information here, together with the amount you invested, to estimate the expenses that you paid over the period.
To do so, simply divide your account value by $1,000 (for example, an $8,600 account value divided by $1,000 = 8.6), then multiply the result by the number given for your fund under the heading ”Expenses Paid During Period.“
• Based on hypothetical 5% yearly return. This section is intended to help you compare your fund‘s costs with those of other mutual funds. It assumes that the fund had a yearly return of 5% before expenses, but that the expense ratio is unchanged. In this case—because the return used is not the fund’s actual return—the results do not apply to your investment. The example is useful in making comparisons because the Securities and Exchange Commission requires all mutual funds to calculate expenses based on a 5% return. You can assess your fund’s costs by comparing this hypothetical example with the hypothetical examples that appear in shareholder reports of other funds.
Note that the expenses shown in the table are meant to highlight and help you compare ongoing costs only and do not reflect transaction costs incurred by the fund for buying and selling securities. Further, the expenses do not include any purchase, redemption, or account service fees described in the fund prospectus. If such fees were applied to your account, your costs would be higher. Your fund does not carry a “sales load.”
The calculations assume no shares were bought or sold during the period. Your actual costs may have been higher or lower, depending on the amount of your investment and the timing of any purchases or redemptions.
You can find more information about the fund’s expenses, including annual expense ratios, in the Financial Statements section of this report. For additional information on operating expenses and other shareholder costs, please refer to your fund’s current prospectus.
54
| | | |
| Six Months Ended August 31, 2014 | | | |
| | Beginning
Account Value
2/28/2014 | Ending
Account Value
8/31/2014 | Expenses
Paid During
Period |
| |
| |
| Based on Actual Fund Return |
| Prime Money Market Fund |
| Investor Shares | $1,000.00 | $1,000.05 | $0.76 |
| Institutional Shares | 1,000.00 | 1,000.29 | 0.50 |
| Federal Money Market Fund | $1,000.00 | $1,000.05 | $0.45 |
| Admiral Treasury Money Market Fund | $1,000.00 | $1,000.05 | $0.20 |
| Based on Hypothetical 5% Yearly Return |
| Prime Money Market Fund |
| Investor Shares | $1,000.00 | $1,024.45 | $0.77 |
| Institutional Shares | 1,000.00 | 1,024.70 | 0.51 |
| Federal Money Market Fund | $1,000.00 | $1,024.75 | $0.46 |
| Admiral Treasury Money Market Fund | $1,000.00 | $1,025.00 | $0.20 |
| The calculations are based on expenses incurred in the most recent six-month period. The funds’ annualized six-month expense ratios for the period are: for the Prime Money Market Fund, 0.15% for Investor Shares and 0.10% for Institutional Shares; for the Federal Money Market Fund, 0.09%; and for the Admiral Treasury Money Market Fund, 0.04%. The annualized six-month expense ratios for the Prime Money Market Fund Investor Shares, the Federal Money Market Fund, and the Admiral Treasury Money Market Fund reflect a temporary reduction in operating expenses (described in Note B of the Notes to Financial Statements). Before the reduction, the annualized six-month expense ratios were: for the Prime Money Market Fund Investor Shares, 0.16%; for the Federal Money Market Fund, 0.11%; for the Admiral Treasury Money Market Fund, 0.09%. |
|
|
|
|
|
|
55
Trustees Approve Advisory Arrangements
The board of trustees of Vanguard Prime Money Market Fund, Federal Money Market Fund, and Admiral Treasury Money Market Fund has renewed each fund’s investment advisory arrangement with The Vanguard Group, Inc. (Vanguard). Vanguard—through its Fixed Income Group—serves as the investment advisor for each fund. The board determined that continuing each fund’s internalized management structure was in the best interests of each fund and its shareholders.
The board based its decision upon an evaluation of the advisor’s investment staff, portfolio management process, and performance. The trustees considered the factors discussed below, among others. However, no single factor determined whether the board approved the arrangements. Rather, it was the totality of the circumstances that drove the board’s decision.
Nature, extent, and quality of services
The board considered the quality of each fund’s investment management services over both the short and long term and took into account the organizational depth and stability of the advisor. The board noted that Vanguard has been managing investments for more than three decades. The Fixed Income Group adheres to a sound, disciplined investment management process; the team has considerable experience, stability, and depth.
The board concluded that Vanguard’s experience, stability, depth, and performance, among other factors, warranted continuation of each advisory arrangement.
Investment performance
The board considered the short- and long-term performance of the funds, including any periods size=2>of outperformance or underperformance relative to a benchmark index and peer group. The board concluded that the performance was such that each advisory arrangement should continue. Information about the funds’ most recent performance can be found on the Performance Summary pages of this report.
Cost
The board concluded that each fund’s expense ratio was well below the average expense ratio charged by funds in its peer group and that each fund’s advisory fee rate was also well below its peer-group average. Information about the funds’ expenses appears in the About Your Fund’s Expenses section of this report as well as in the Financial Statements sections.
The board does not conduct a profitability analysis of Vanguard, because of Vanguard’s unique “at-cost” structure. Unlike most other mutual fund management companies, Vanguard is owned by the funds it oversees, and produces “profits” only in the form of reduced expenses for fund shareholders.
The benefit of economies of scale
The board concluded that each fund’s at-cost arrangement with Vanguard ensures that the funds will realize economies of scale as they grow, with the cost to shareholders declining as fund assets increase.
The board will consider whether to renew the advisory arrangements again after a one-year period.
56
Glossary
SEC Yields. A money market fund’s 7-day SEC yield is calculated by annualizing its income distributions for the previous seven days, as required by the U.S. Securities and Exchange Commission.
Average Weighted Maturity. The average length of time until fixed income securities held by a fund reach maturity and are repaid. The figure reflects the proportion of fund assets represented by each security.
Credit Quality. For Vanguard money market funds, the Distribution by Credit Quality table includes tier ratings for consistency with SEC Rule 2a-7 under the Investment Company Act of 1940, which governs money market funds. A First Tier security is one that is eligible for money market funds and has been rated in the highest short-term rating category for debt obligations by the requisite nationally recognized statistical rating organizations. An unrated security is First Tier if it represents quality comparable to that of a rated security, as determined in accordance with SEC Rule 2a-7. A Second Tier security is one that is eligible for money market funds and is not a First Tier security.
Expense Ratio. A fund’s total annual operating expenses expressed as a percentage of the fund’s average net assets. The expense ratio includes management and administrative expenses, but does not include the transaction costs of buying and selling portfolio securities.
Inception Date. The date on which the assets of a fund (or one of its share classes) are first invested in accordance with the fund’s investment objective. For funds with a subscription period, the inception date is the day after that period ends. Investment performance is measured from the inception date.
57
This page intentionally left blank.
This page intentionally left blank.
The People Who Govern Your Fund
The trustees of your mutual fund are there to see that the fund is operated and managed in your best interests since, as a shareholder, you are a part owner of the fund. Your fund’s trustees also serve on the board of directors of The Vanguard Group, Inc., which is owned by the Vanguard funds and provides services to them on an at-cost basis.
A majority of Vanguard’s board members are independent, meaning that they have no affiliation with Vanguard or the funds they oversee, apart from the sizable personal investments they have made as private individuals. The independent board members have distinguished backgrounds in business, academia, and public service. Each of the trustees and executive officers oversees 177 Vanguard funds.
The following table provides information for each trustee and executive officer of the fund. More information about the trustees is in the Statement of Additional Information, which can be obtained, without charge, by contacting Vanguard at 800-662-7447, or online at vanguard.com.
| |
| InterestedTrustee1 | and Delphi Automotive LLP (automotive components); |
| | Senior Advisor at New Mountain Capital. |
| F. William McNabb III | |
| Born 1957. Trustee Since July 2009. Chairman of the | Amy Gutmann |
| Board. Principal Occupation(s) During the Past Five | Born 1949. Trustee Since June 2006. Principal |
| Years: Chairman of the Board of The Vanguard Group, | Occupation(s) During the Past Five Years: President of |
| Inc., and of each of the investment companies served | the University of Pennsylvania; Christopher H. Browne |
| by The Vanguard Group, since January 2010; Director | Distinguished Professor of Political Science, School of |
| of The Vanguard Group since 2008; Chief Executive | Arts and Sciences, and Professor of Communication, |
| Officer and President of The Vanguard Group, and of | Annenberg School for Communication, with secondary |
| each of the investment companies served by The | faculty appointments in the Department of Philosophy, |
| Vanguard Group, since 2008; Director of Vanguard | School of Arts and Sciences, and at the Graduate |
| Marketing Corporation; Managing Director of The | School of Education, University of Pennsylvania; |
| Vanguard Group (1995–2008). | Trustee of the National Constitution Center; Chair |
| | of the Presidential Commission for the Study of |
| IndependentTrustees | Bioethical Issues. |
| |
| Emerson U. Fullwood | JoAnn Heffernan Heisen |
| Born 1948. Trustee Since January 2008. Principal | Born 1950. Trustee Since July 1998. Principal |
| Occupation(s) During the Past Five Years: Executive | Occupation(s) During the Past Five Years: Corporate |
| Chief Staff and Marketing Officer for North America | Vice President and Chief Global Diversity Officer |
| and Corporate Vice President (retired 2008) of Xerox | (retired 2008) and Member of the Executive |
| Corporation (document management products and | Committee (1997–2008) of Johnson & Johnson |
| services); Executive in Residence and 2009–2010 | (pharmaceuticals/medical devices/consumer |
| Distinguished Minett Professor at the Rochester | products); Director of Skytop Lodge Corporation |
| Institute of Technology; Director of SPX Corporation | (hotels), the University Medical Center at Princeton, |
| (multi-industry manufacturing), the United Way of | the Robert Wood Johnson Foundation, and the Center |
| Rochester, Amerigroup Corporation (managed health | for Talent Innovation; Member of the Advisory Board |
| care), the University of Rochester Medical Center, | of the Maxwell School of Citizenship and Public Affairs |
| Monroe Community College Foundation, and North | at Syracuse University. |
| Carolina A&T University. | |
| F. Joseph Loughrey |
| Rajiv L. Gupta | Born 1949. Trustee Since October 2009. Principal |
| Born 1945. Trustee Since December 2001.2 | Occupation(s) During the Past Five Years: President |
| Principal Occupation(s) During the Past Five Years: | and Chief Operating Officer (retired 2009) of Cummins |
| Chairman and Chief Executive Officer (retired 2009) | Inc. (industrial machinery); Chairman of the Board |
| and President (2006–2008) of Rohm and Haas Co. | of Hillenbrand, Inc. (specialized consumer services), |
| (chemicals); Director of Tyco International, Ltd. | and of Oxfam America; Director of SKF AB (industrial |
| (diversified manufacturing and services), Hewlett- | machinery), Hyster-Yale Materials Handling, Inc. |
| Packard Co. (electronic computer manufacturing), | (forklift trucks), the Lumina Foundation for Education, |
| |
| | |
| and the V Foundation for Cancer Research; Member | Executive Officers | |
| of the Advisory Council for the College of Arts and | | |
| Letters and of the Advisory Board to the Kellogg | Glenn Booraem | |
| Institute for International Studies, both at the | Born 1967. Controller Since July 2010. Principal |
| University of Notre Dame. | Occupation(s) During the Past Five Years: Principal |
| | of The Vanguard Group, Inc.; Controller of each of |
| Mark Loughridge | the investment companies served by The Vanguard |
| Born 1953. Trustee Since March 2012. Principal | Group; Assistant Controller of each of the investment |
| Occupation(s) During the Past Five Years: Senior Vice | companies served by The Vanguard Group (2001–2010). |
| President and Chief Financial Officer (retired 2013) | | |
| at IBM (information technology services); Fiduciary | Thomas J. Higgins | |
| Member of IBM’s Retirement Plan Committee (2004– | Born 1957. Chief Financial Officer Since September |
| 2013); Member of the Council on Chicago Booth. | 2008. Principal Occupation(s) During the Past Five |
| | Years: Principal of The Vanguard Group, Inc.; Chief |
| Scott C. Malpass | Financial Officer of each of the investment companies |
| Born 1962. Trustee Since March 2012. Principal | served by The Vanguard Group; Treasurer of each of |
| Occupation(s) During the Past Five Years: Chief | the investment companies served by The Vanguard |
| Investment Officer and Vice President at the University | Group (1998–2008). | |
| of Notre Dame; Assistant Professor of Finance at the | | |
| Mendoza College of Business at Notre Dame; Member | Kathryn J. Hyatt | |
| of the Notre Dame 403(b) Investment Committee; | Born 1955. Treasurer Since November 2008. Principal |
| Board Member of TIFF Advisory Services, Inc. | Occupation(s) During the Past Five Years: Principal of |
| (investment advisor); Member of the Investment | The Vanguard Group, Inc.; Treasurer of each of the |
| Advisory Committees of the Financial Industry | investment companies served by The Vanguard |
| Regulatory Authority (FINRA) and of Major League | Group; Assistant Treasurer of each of the investment |
| Baseball. | companies served by The Vanguard Group (1988–2008). |
| |
| André F. Perold | Heidi Stam | |
| Born 1952. Trustee Since December 2004. Principal | Born 1956. Secretary Since July 2005. Principal |
| Occupation(s) During the Past Five Years: George | Occupation(s) During the Past Five Years: Managing |
| Gund Professor of Finance and Banking, Emeritus | Director of The Vanguard Group, Inc.; General Counsel |
| at the Harvard Business School (retired 2011); | of The Vanguard Group; Secretary of The Vanguard |
| Chief Investment Officer and Managing Partner of | Group and of each of the investment companies |
| HighVista Strategies LLC (private investment firm); | served by The Vanguard Group; Director and Senior |
| Director of Rand Merchant Bank; Overseer of the | Vice President of Vanguard Marketing Corporation. |
| Museum of Fine Arts Boston. | | |
| | Vanguard Senior ManagementTeam |
| Alfred M. Rankin, Jr. | | |
| Born 1941. Trustee Since January 1993. Principal | Mortimer J. Buckley | Chris D. McIsaac |
| Occupation(s) During the Past Five Years: Chairman, | Kathleen C. Gubanich | Michael S. Miller |
| President, and Chief Executive Officer of NACCO | Paul A. Heller | James M. Norris |
| Industries, Inc. (housewares/lignite), and of Hyster- | Martha G. King | Glenn W. Reed |
| Yale Materials Handling, Inc. (forklift trucks); Chairman | John T. Marcante | |
| of the Board of University Hospitals of Cleveland. | | |
| |
| Peter F. Volanakis | Chairman Emeritus and Senior Advisor |
| Born 1955. Trustee Since July 2009. Principal | | |
| Occupation(s) During the Past Five Years: President | John J. Brennan | |
| and Chief Operating Officer (retired 2010) of Corning | Chairman, 1996–2009 | |
| Incorporated (communications equipment); Trustee of | Chief Executive Officer and President, 1996–2008 |
| Colby-Sawyer College; Member of the Advisory Board | | |
| of the Norris Cotton Cancer Center and of the Advisory | Founder |
| Board of the Parthenon Group (strategy consulting). | | |
| John C. Bogle | |
| Chairman and Chief Executive Officer, 1974–1996 |
| | |
| | | |
| | |
1 Mr. McNabb is considered an “interested person,” as defined in the Investment Company Act of 1940, because he is an officer of the Vanguard funds.
2 December 2002 for Vanguard Equity Income Fund, the Vanguard Municipal Bond Funds, and the Vanguard State Tax-Exempt Funds.
|  |
| | P.O. Box 2600 |
| | Valley Forge, PA 19482-2600 |
| |
| |
| |
| Connect with Vanguard® > vanguard.com |
| |
| |
| |
| Fund Information > 800-662-7447 | |
| Direct Investor Account Services > 800-662-2739 | |
| Institutional Investor Services > 800-523-1036 | |
| Text Telephone for People | |
| With Hearing Impairment > 800-749-7273 | |
| |
| This material may be used in conjunction | |
| with the offering of shares of any Vanguard | |
| fund only if preceded or accompanied by | |
| the fund’s current prospectus. | |
| |
| All comparative mutual fund data are from Lipper, a | |
| Thomson Reuters Company, or Morningstar, Inc., unless | |
| otherwise noted. | |
| |
| You can obtain a free copy of Vanguard’s proxy voting | |
| guidelines by visiting vanguard.com/proxyreporting or by | |
| calling Vanguard at 800-662-2739. The guidelines are | |
| also available from the SEC’s website, sec.gov. In | |
| addition, you may obtain a free report on how your fund | |
| voted the proxies for securities it owned during the 12 | |
| months ended June 30. To get the report, visit either | |
| vanguard.com/proxyreporting or sec.gov. | |
| |
| You can review and copy information about your fund at | |
| the SEC’s Public Reference Room in Washington, D.C. To | |
| find out more about this public service, call the SEC at | |
| 202-551-8090. Information about your fund is also | |
| available on the SEC’s website, and you can receive | |
| copies of this information, for a fee, by sending a | |
| request in either of two ways: via e-mail addressed to | |
| publicinfo@sec.gov or via regular mail addressed to the | |
| Public Reference Section, Securities and Exchange | |
| Commission, Washington, DC 20549-1520. | |
| |
| | © 2014 The Vanguard Group, Inc. |
| | All rights reserved. |
| | Vanguard Marketing Corporation, Distributor. |
| |
| | Q300 102014 |
Item 2: Code of Ethics. The Registrant has adopted a code of ethics that applies to the Registrant’s principal executive officer, principal financial officer, principal accounting officer or controller or persons performing similar functions. The Code of Ethics was amended during the reporting period covered by this report to make certain technical, non-material changes.
Item 3: Audit Committee Financial Expert. The following members of the Audit Committee have been determined by the Registrant’s Board of Trustees to be Audit Committee Financial Experts serving on its Audit Committee, and to be independent: Rajiv L. Gupta, Amy Gutmann, JoAnn Heffernan Heisen, F. Joseph Loughrey, Mark Loughridge, Scott C. Malpass, André F. Perold, and Alfred M. Rankin, Jr.
Item 4: Principal Accountant Fees and Services.
(a) Audit Fees.
Audit Fees of the Registrant
Fiscal Year Ended August 31, 2014: $64,000 Fiscal Year Ended August 31, 2013: $57,000
Aggregate Audit Fees of Registered Investment Companies in the Vanguard Group.
Fiscal Year Ended August 31, 2014: $6,605,127
Fiscal Year Ended August 31, 2013: $5,714,113
Includes fees billed in connection with audits of the Registrant, other registered investment companies in the Vanguard complex, The Vanguard Group, Inc. and Vanguard Marketing Corporation.
(b) Audit-Related Fees.
Fiscal Year Ended August 31, 2014: $2,176,479
Fiscal Year Ended August 31, 2013: $1,552,950
Includes fees billed in connection with assurance and related services provided to the Registrant, other registered investment companies in the Vanguard complex, The Vanguard Group, Inc., and Vanguard Marketing Corporation.
(c) Tax Fees.
Fiscal Year Ended August 31, 2014: $316,869
Fiscal Year Ended August 31, 2013: $110,000
Includes fees billed in connection with tax compliance, planning, and advice services provided to the Registrant, other registered investment companies in the Vanguard complex, The Vanguard Group, Inc., and Vanguard Marketing Corporation.
(d) All Other Fees.
Fiscal Year Ended August 31, 2014: $198,163
Fiscal Year Ended August 31, 2013: $132,000
Includes fees billed for services related to tax reported information provided to the Registrant, other registered investment companies in the Vanguard complex, The Vanguard Group, Inc., and Vanguard Marketing Corporation.
(e) (1) Pre-Approval Policies. The policy of the Registrant’s Audit Committee is to consider and, if appropriate, approve before the principal accountant is engaged for such services, all specific audit and non-audit services provided to: the Registrant, other registered investment companies in the Vanguard complex, The Vanguard Group, Inc., and entities controlled by The Vanguard Group, Inc. that provide ongoing services to the Registrant. In making a determination, the Audit Committee considers whether the services are consistent with maintaining the principal accountant’s independence.
In the event of a contingency situation in which the principal accountant is needed to provide services in between scheduled Audit Committee meetings, the Chairman of the Audit Committee would be called on to consider and, if appropriate, pre-approve audit or permitted non-audit services in an amount sufficient to complete services through the next Audit Committee meeting, and to determine if such services would be consistent with maintaining the accountant’s independence. At the next scheduled Audit Committee meeting, services and fees would be presented to the Audit Committee for formal consideration, and, if appropriate, approval by the entire Audit Committee. The Audit Committee would again consider whether such services and fees are consistent with maintaining the principal accountant’s independence.
The Registrant’s Audit Committee is informed at least annually of all audit and non-audit services provided by the principal accountant to the Vanguard complex, whether such services are provided to: the Registrant, other registered investment companies in the Vanguard complex, The Vanguard Group, Inc., or other entities controlled by The Vanguard Group, Inc. that provide ongoing services to the Registrant.
(2) No percentage of the principal accountant’s fees or services were approved pursuant to the waiver provision of paragraph (c)(7)(i)(C) of Rule 2-01 of Regulation S-X.
(f) For the most recent fiscal year, over 50% of the hours worked under the principal accountant’s engagement were not performed by persons other than full-time, permanent employees of the principal accountant.
(g) Aggregate Non-Audit Fees.
Fiscal Year Ended August 31, 2014: $515,032
Fiscal Year Ended August 31, 2013: $242,000
Includes fees billed for non-audit services provided to the Registrant, other registered investment companies in the Vanguard complex, The Vanguard Group, Inc., and Vanguard Marketing Corporation.
(h) For the most recent fiscal year, the Audit Committee has determined that the provision of all non-audit services was consistent with maintaining the principal accountant’s independence.
Item 5: Audit Committee of Listed Registrants.
Not Applicable.
Item 6: Investments.
Not Applicable.
Item 7: Disclosure of Proxy Voting Policies and Procedures for Closed-End Management Investment Companies.
Not Applicable.
Item 8: Portfolio Managers of Closed-End Management Investment Companies.
Not Applicable.
Item 9: Purchase of Equity Securities by Closed-End Management Investment Company and Affiliated Purchasers.
Not Applicable.
Item 10: Submission of Matters to a Vote of Security Holders.
Not Applicable.
Item 11: Controls and Procedures.
(a) Disclosure Controls and Procedures. The Principal Executive and Financial Officers concluded that the Registrant’s Disclosure Controls and Procedures are effective based on their evaluation of the Disclosure Controls and Procedures as of a date within 90 days of the filing date of this report.
(b) Internal Control Over Financial Reporting. There were no significant changes in Registrant’s Internal Control Over Financial Reporting or in other factors that could
significantly affect this control subsequent to the date of the evaluation, including any corrective actions with regard to significant deficiencies and material weaknesses.
Item 12: Exhibits.
(a) Code of Ethics.
(b) Certifications.
Pursuant to the requirements of the Securities Exchange Act of 1934 and the Investment Company Act of 1940, the registrant has duly caused this report to be signed on its behalf by the undersigned, thereunto duly authorized.
| |
| | VANGUARD MONEY MARKET RESERVES |
| |
| BY: | /s/ F. WILLIAM MCNABB III* |
| | F. WILLIAM MCNABB III |
| | CHIEF EXECUTIVE OFFICER |
Date: October 22, 2014
Pursuant to the requirements of the Securities Exchange Act of 1934 and the Investment Company Act of 1940, this report has been signed below by the following persons on behalf of the registrant and in the capacities and on the dates indicated.
| |
| | VANGUARD MONEY MARKET RESERVES |
| |
| BY: | /s/ F. WILLIAM MCNABB III* |
| | F. WILLIAM MCNABB III |
| | CHIEF EXECUTIVE OFFICER |
Date: October 22, 2014 |
| | VANGUARD MONEY MARKET RESERVES |
| |
| BY: | /s/ THOMAS J. HIGGINS* |
| | THOMAS J. HIGGINS |
| | CHIEF FINANCIAL OFFICER |
| Date: October 22, 2014 |
* By: /s/ Heidi Stam
Heidi Stam, pursuant to a Power of Attorney filed on April 22, 2014 see file Number
2-17620, Incorporated by Reference.
