UNITED STATES
SECURITIES AND EXCHANGE COMMISSION
Washington, D.C. 20549
FORM N-CSR
CERTIFIED SHAREHOLDER REPORT
OF
REGISTERED MANAGEMENT INVESTMENT COMPANIES
Investment Company Act file number: 811-02554
Name of Registrant: Vanguard Money Market Reserves
Address of Registrant:
P.O. Box 2600
Valley Forge, PA 19482
Name and address of agent for service:
Heidi Stam, Esquire
P.O. Box 876
Valley Forge, PA 19482
Registrant’s telephone number, including area code: (610) 669-1000
Date of fiscal year end: August 31
Date of reporting period: September 1, 2012 – August 31, 2013
Item 1: Reports to Shareholders
| 
|
| Annual Report | August 31, 2013 |
| Vanguard Money Market Funds |
| |
 |
Vanguard’s Principles for Investing Success
We want to give you the best chance of investment success. These principles, grounded in Vanguard’s research and experience, can put you on the right path.
Goals. Create clear, appropriate investment goals.
Balance. Develop a suitable asset allocation using broadly diversified funds. Cost. Minimize cost.
Discipline. Maintain perspective and long-term discipline.
A single theme unites these principles: Focus on the things you can control.We believe there is no wiser course for any investor.
| |
| Contents | |
| Your Fund’s Total Returns. | 1 |
| Chairman’s Letter. | 2 |
| Advisor’s Report. | 9 |
| Prime Money Market Fund. | 11 |
| Federal Money Market Fund. | 35 |
| Admiral Treasury Money Market Fund. | 47 |
| About Your Fund’s Expenses. | 59 |
| Trustees Approve Advisory Arrangement. | 61 |
| Glossary. | 62 |
Please note: The opinions expressed in this report are just that—informed opinions. They should not be considered promises or advice. Also, please keep in mind that the information and opinions cover the period through the date on the front of this report. Of course, the risks of investing in your fund are spelled out in the prospectus.
See the Glossary for definitions of investment terms used in this report.
About the cover: The ship's wheel represents leadership and guidance, essential qualities in navigating difficult seas. This one is a replica based on an 18th-century British vessel. The HMS Vanguard, another ship of that era, served as the flagship for Admiral Horatio Nelson when he defeated a French fleet at the Battle of the Nile.
Your Fund’s Total Returns
| | |
| Fiscal Year Ended August 31, 2013 | | |
| |
| | 7-Day SEC | Total |
| | Yield | Returns |
| Vanguard Prime Money Market Fund | | |
| Investor Shares | 0.01% | 0.02% |
| Institutional Shares | 0.04 | 0.07 |
| Money Market Funds Average | | 0.00 |
| Money Market Funds Average: Derived from data provided by Lipper, a Thomson Reuters Company. | |
| |
| Vanguard Federal Money Market Fund | 0.02% | 0.01% |
| Government Money Market Funds Average | | 0.00 |
| Government Money Market Funds Average: Derived from data provided by Lipper, a Thomson Reuters Company. | |
| |
| Vanguard Admiral Treasury Money Market Fund | 0.01% | 0.02% |
| iMoneyNet Money Fund Report’s 100% Treasury Funds Average | | 0.00 |
iMoneyNet Money Fund Report’s 100% Treasury Funds Average: Derived from data provided by Lipper, a Thomson Reuters Company.
The 7-day SEC yield of a money market fund more closely reflects the current earnings of the fund than its total return.
Institutional Shares are available to certain institutional investors who meet specific administrative, service, and account-size criteria.
1

Chairman’s Letter
Dear Shareholder,
While longer-term interest rates jumped during the 12 months ended August 31, 2013, because of uncertainty about when the Federal Reserve might start scaling back its stimulus efforts, shorter-term bond yields remained exceptionally low. Consequently, money market returns remained paper thin. Vanguard Prime Money Market Fund returned 0.02% for Investor Shares and 0.07% for Institutional Shares, which have a lower expense ratio. Vanguard Federal Money Market Fund returned 0.01% and Vanguard Admiral Treasury Money Market Fund returned 0.02%. Although it’s of little comfort, the funds managed to do better than the average return of their peer groups, which in each case was 0.00%.
As of August 31, the Prime Money Market Fund’s 7-day SEC yield had slipped to 0.01% from 0.04% a year earlier for Investor Shares and to 0.04% from 0.11% for Institutional Shares. At the end of the period, the 7-day SEC yield was 0.02% for the Federal Money Market Fund and 0.01% for the Admiral Treasury Money Market Fund. (These two funds have been closed to new investors since 2009.)
On a separate note, the Securities and Exchange Commission proposed a number of regulatory changes for money market funds in June. Vanguard has been active in working with the SEC and other
2
agencies to preserve these funds’ time-tested benefits. We will continue to take the lead in advocating for the value we see in these funds for our shareholders and their portfolios.
Bond returns turned negative amid worry about the Fed’s next move
Bonds, which maintained slightly positive returns overall through the first eight months of the period, reversed course in May and then continued to retreat as investors anticipated reductions in the Fed’s bond-buying program.
The broad U.S. taxable bond market returned –2.47% for the 12 months. The yield of the 10-year Treasury note finished at 2.76%, up from 1.56% at the end of August 2012. Municipal bonds suffered more, returning –3.70% for the fiscal year.
Stocks posted robust results despite setbacks at the finish
U.S. stocks advanced about 20% in the 12 months ended August 31 despite slipping in June and August. Through most of the fiscal year, stocks surged as the economy continued to show modest growth and investors appeared more receptive to risk.
Much of the market’s recent weakness was linked to concerns over monetary policy. Heightened strife in the Middle East also contributed to anxiety in the global markets.
| | | |
| Market Barometer | | | |
| | | Average Annual Total Returns |
| | | Periods Ended August 31, 2013 |
| | One | Three | Five |
| | Year | Years | Years |
| Bonds | | | |
| Barclays U.S. Aggregate Bond Index (Broad taxable | | | |
| market) | -2.47% | 2.58% | 4.93% |
| Barclays Municipal Bond Index (Broad tax-exempt market) | -3.70 | 2.45 | 4.52 |
| Citigroup Three-Month U.S. Treasury Bill Index | 0.07 | 0.08 | 0.17 |
| |
| Stocks | | | |
| Russell 1000 Index (Large-caps) | 19.84% | 18.74% | 7.59% |
| Russell 2000 Index (Small-caps) | 26.27 | 20.50 | 7.98 |
| Russell 3000 Index (Broad U.S. market) | 20.32 | 18.87 | 7.63 |
| MSCI All Country World Index ex USA (International) | 12.98 | 6.93 | 1.48 |
| |
| CPI | | | |
| Consumer Price Index | 1.52% | 2.32% | 1.32% |
3
International stocks in aggregate finished with a return of about 13%. Developed markets in the Pacific region and Europe posted results closer to those of the United States. Returns for emerging-market stocks were virtually flat as economic growth slowed in China and Brazil.
Although global economic worries and tensions over conflicts abroad have unsettled markets, Jonathan Lemco, a senior sovereign debt analyst in Vanguard’s Taxable Credit Research Group, pointed out that investors can still manage risks amid international instability. “Vanguard believes a diversified portfolio is the best way to spread the risk of geopolitical uncertainty,” he said.
Longer-term rates driven higher, while shorter-term rates stayed low
With growth remaining sluggish and unemployment high, the Federal Reserve continued to provide unprecedented stimulus to the economy throughout the period. Its efforts included buying $40 billion per month of mortgage bonds to support the housing market and $45 billion per month of Treasuries to hold borrowing costs down for households and businesses. The Fed also kept its federal funds target rate—the rate banks charge one another for overnight loans—anchored at 0.00%–0.25% to keep short-term interest rates low.
Given the magnitude of this support, it was not surprising that the financial markets were rattled when Fed officials began
| | | |
| Expense Ratios | | | |
| Your Fund Compared With Its Peer Group | | | |
| | Investor | Institutional | Peer Group |
| | Shares | Shares | Average |
| Prime Money Market Fund | 0.16% | 0.09% | 0.23% |
| Federal Money Market Fund | 0.16 | — | 0.12 |
| Admiral Treasury Money Market Fund | 0.10 | — | 0.08 |
The fund expense ratios shown are from the prospectus dated December 28, 2012, and represent estimated costs for the current fiscal year. For the fiscal year ended August 31, 2013, the funds’ expense ratios were: for the Prime Money Market Fund, 0.16% for Investor Shares and 0.10% for Institutional Shares; for the Federal Money Market Fund, 0.13%; for the Admiral Treasury Money Market Fund, 0.08%. The expense ratios for the Prime Money Market Fund Investor Shares, the Federal Money Market Fund, and the Admiral Treasury Money Market Fund reflect a temporary reduction in operating expenses (described in Note B of the Notes to Financial Statements). Before the reduction, the expense ratios were: for the Prime Money Market Fund Investor Shares, 0.17%; for the Federal Money Market Fund, 0.14%; for the Admiral Treasury Money Market Fund, 0.09%.
Peer groups: For the Prime Money Market Fund, Money Market Funds; for the Federal Money Market Fund, Government Money Market Funds; and for the Admiral Treasury Money Market Fund, U.S. Treasury Money Market Funds. In most, if not all, cases, the expense ratios for funds in the peer groups are based on net operating expenses after reimbursement and/or fee waivers by fund sponsors. In contrast, the Vanguard money market funds’ expense ratios in the table above do not reflect expense reductions.
4
signaling in May that further improvements in the housing and labor markets might warrant “letting up a bit on the gas pedal,” as the Fed chairman put it, before the end of the year. The prospect of the central bank beginning to taper its efforts sooner than the market had been anticipating drove the yields of longer-term bonds substantially higher and their prices lower. (Bond yields and prices move in opposite directions.)
Short-term bond yields were affected much less, however, as they more closely track the federal funds target rate, which the Fed expects to keep near zero for some time. Its latest guidance was that the rate will stay exceptionally low at least as long as inflation remains contained and the unemployment rate stays above 6.5% (the rate stood at 7.3% in August).
While money market yields were meager, the funds’ advisor, Vanguard Fixed Income Group, was able to add value by keeping costs low and by seeking out relative value opportunities among securities with high credit quality.
A source of liquidity and safety for all three funds was their “risk-free” holdings in U.S. Treasury bills. During the period, the advisor found more relative value for the Federal and Prime Money Market Funds among U.S. government obligations—primarily notes issued by Fannie Mae and
| |
| Total Returns | |
| Ten Years Ended August 31, 2013 | |
| | Average |
| | Annual Return |
| Prime Money Market Fund Investor Shares | 1.77% |
| Money Market Funds Average | 1.38 |
| Money Market Funds Average: Derived from data provided by Lipper, a Thomson Reuters Company. | |
| |
| Federal Money Market Fund | 1.70% |
| Government Money Market Funds Average | 1.35 |
| Government Money Market Funds Average: Derived from data provided by Lipper, a Thomson Reuters Company. | |
| |
| Admiral Treasury Money Market Fund | 1.61% |
| iMoneyNet Money Fund Report’s 100% Treasury Funds Average | 1.20 |
| iMoneyNet Money Fund Report’s 100% Treasury Funds Average: Derived from data provided by iMoneyNet, Inc. | |
Investment returns will fluctuate. All of the returns in this report represent past performance, which is not a guarantee of future results that may be achieved by the funds. (Current performance may be lower or higher than the performance data cited. For performance data current to the most recent month-end, visit our website at vanguard.com/performance.) An investment in a money market fund is not insured or guaranteed by the Federal Deposit Insurance Corporation or any other government agency. Although a money market fund seeks to preserve the value of your investment at $1 per share, it is possible to lose money by investing in such a fund.
5
Freddie Mac that are not backed by the full faith and credit of the U.S. government but are nonetheless of very high credit quality.
Within the Prime Money Market Fund, which has a broader investment mandate, the advisor also took advantage of opportunities to invest in high-quality foreign debt denominated in U.S. dollars. The yields on offer and the advantage of greater diversification led the advisor to invest in securities of Canadian and Australian banks in particular, while avoiding their European counterparts during the period under review.
Money market returns haven’t always been so low
While short-term interest rates have been negligible for several years now, the annualized return of the funds over the last ten years reflects the higher rates that existed before the financial crisis. The average annual return for the Prime Money Market Fund over the past ten years was 1.77% for Investor Shares and 1.91% for Institutional Shares. The Federal Money Market Fund returned 1.70% and the Admiral Treasury Money Market Fund returned 1.61% for the same period. It’s pleasing to note that the returns of all three funds were well ahead of the average returns of their peer groups, thanks in part to the experienced and
| | |
| Changes in Yields | | |
| | | 7-Day SEC Yield |
| | August 31, | August 31, |
| Money Market Fund | 2013 | 2012 |
| Prime | | |
| Investor Shares | 0.01% | 0.04% |
| Institutional Shares | 0.04 | 0.11 |
| Federal | 0.02 | 0.01 |
| Admiral Treasury | 0.01 | 0.02 |
6
astute management team that oversees the funds as well as our low-cost structure for running them.
In pursuing investment goals, your long-term asset mix is key
As I mentioned earlier, financial markets were rattled by the prospect that the Fed might begin scaling back its massive bond-buying program. Bond yields jumped (and so prices fell), and the stock market experienced some turmoil.
Volatility and increased uncertainty can tempt investors to deviate from their investment plan. In the mutual fund industry, for example, the recent rise in bond yields has led to net redemptions from bond funds as investors try to sidestep losses that might arise from a sustained climb in interest rates.
Keep in mind, however, that although interest rates remain low, nobody is certain what their next move will be—much less how financial markets will react to the change.
In fact, it’s precisely because short-term market movements are unpredictable that trying to time the markets often fails, as Vanguard and other researchers have found. A recent Vanguard research paper notes that although many investors alter their portfolios based on emotional reactions to market movements,
|
| Your fund distributed a small capital gain |
| Shortly after the close of the fiscal year, your money market fund made a small |
| distribution of short-term capital gains. You can view the amount per share on |
| Vanguard’s website by visiting the “Distributions” section of your fund’s profile. |
| |
| Although uncommon for money market funds, capital gains distributions have |
| become more common in recent years because of the unusual interest rate |
| environment. Declining rates drive up the prices of securities, which then may |
| generate a gain if they are sold. These short-term capital gains are taxed as |
| ordinary income. |
| |
| Consistent with their investment objectives, all three funds maintained their |
| share price of $1, as is expected but not guaranteed. |
7
investment success actually is “largely determined by the long-term mixture of assets in a portfolio.” (You can find the full report, Vanguard’s Framework for Constructing Diversified Portfolios, at vanguard.com/research.)
We continue to believe that sticking to a well-diversified portfolio of stocks, bonds, and money market instruments over the long haul—rather than making impulsive changes to try to avoid potential losses or capitalize on perceived opportunities—gives you the best chance of meeting your investment goals.
As always, thank you for your confidence in Vanguard.
Sincerely,
F. William McNabb III
Chairman and Chief Executive Officer
September 13, 2013
8
Advisor’s Report
For the 12 months ended August 31, 2013, returns for the three Vanguard Money Market Funds in this report were negligible, ranging from 0.01% for the Federal Money Market Fund to 0.07% for Institutional Shares of the Prime Money Market Fund. The average return for each fund’s peer group was 0%.
The Federal Reserve has continued to keep short-term rates at extremely low levels since December 2008, extending what has been a challenging environment for money market investors. Moreover, while economic conditions have shown steady improvement, the pace remains subdued, leading us to conclude that we are headed for another year of exceptionally low returns for money market funds.
Portfolio adjustments
Given our outlook for interest rates, we kept the weighted average maturity of the portfolio at the upper end of the permitted range. This allowed us to capture more of the higher yields offered by longer-dated securities.
We continue to manage our investments with an eye toward maintaining a high degree of liquidity and safety in the portfolios. Our allocation to U.S. Treasury and agency securities in the Prime Money Market Fund, our flagship fund, is crucial to achieving this goal. During critical periods throughout the financial crisis, U.S. Treasury and agency securities outperformed other money market assets while remaining highly liquid. Their yields may be lower because of their superior quality and liquidity, but Vanguard’s expense ratio advantage helps balance that out.
That said, the Admiral Treasury Money Market Fund and the Prime Money Market Fund had both lightened their allocation a little to Treasuries by the end of the period in favor of the slightly better yields available from agency securities. In addition, we shifted the asset mix of the Prime Money Market Fund to take advantage of relative value opportunities, primarily in Canadian government debt issued in U.S. dollars and commercial paper issued by U.S. industrial corporations.
The outlook
We have continued to monitor conditions in Europe, but refrained from investing in European banks during the period. While we still believe a number of countries in the southern periphery of Europe remain vulnerable to external shocks and counterproductive domestic policy choices, the conditions that led us to avoid all European bank debt have subsided. As of this writing, we have begun to diversify our holdings, primarily by adding securities issued by a limited number of U.K. and Northern European banks. These institutions were insulated from the conditions that plagued their southern counterparts.
9
The Securities and Exchange Commission (SEC) recently proposed money market fund reforms that go beyond the changes the commission adopted in 2010 in the wake of the financial crisis to enhance the funds’ stability and safety. We appreciate the commission’s efforts in moving this debate forward and have welcomed the opportunity to review and comment on its latest proposal to ensure that your interests are represented.
While the regulatory environment is going to continue to evolve, we remain confident in the stability and safety of our money market funds, in part because we manage our funds conservatively, keep costs low, and invest only in securities that our skilled and experienced credit analysts identify as being of the highest quality.
David R. Glocke, Principal
Vanguard Fixed Income Group
September 19, 2013
10
Prime Money Market Fund
Fund Profile
As of August 31, 2013
| | |
| Financial Attributes | | |
| | Investor | Institutional |
| | Shares | Shares |
| Ticker Symbol | VMMXX | VMRXX |
| Expense Ratio1 | 0.16% | 0.09% |
| 7-Day SEC Yield | 0.01% | 0.04% |
| Average Weighted | | |
| Maturity | 59 days | 59 days |
| |
| Sector Diversification (% of portfolio) | |
| Certificates of Deposit | 10.6% |
| Corporate Bonds | 0.2 |
| Repurchase Agreements | 0.1 |
| U.S. Commercial Paper | 11.2 |
| U.S. Government Agency Obligations | 35.4 |
| U.S. Treasury Bills | 14.4 |
| Yankee/Foreign | 25.0 |
| Other | 3.1 |
The agency and mortgage-backed securities sectors may include issues from government-sponsored enterprises; such issues are generally not backed by the full faith and credit of the U.S. government.
| |
| Distribution by Credit Quality (% of portfolio) |
| First Tier | 100.0% |
For information about these ratings, see the Glossary entry for Credit Quality.
1 The expense ratios shown are from the prospectus dated December 28, 2012, and represent estimated costs for the current fiscal year. For the fiscal year ended August 31, 2013, the expense ratios were 0.16% for Investor Shares and 0.10% for Institutional Shares. The expense ratio for the Prime Money Market Fund Investor Shares reflects a temporary reduction in operating expenses (described in Note B of the Notes to Financial Statements). Before this reduction, the expense ratio for the Prime Money Market Fund Investor Shares was 0.17%.
11
Prime Money Market Fund
Performance Summary
Investment returns will fluctuate. All of the returns in this report represent past performance, which is not a guarantee of future results that may be achieved by the fund. (Current performance may be lower or higher than the performance data cited. For performance data current to the most recent month-end, visit our website at vanguard.com/performance.) The returns shown do not reflect taxes that a shareholder would pay on fund distributions. An investment in a money market fund is not insured or guaranteed by the Federal Deposit Insurance Corporation or any other government agency. Although the fund seeks to preserve the value of your investment at $1 per share, it is possible to lose money by investing in the fund. The fund’s 7-day SEC yield reflects its current earnings more closely than do the average annual returns.
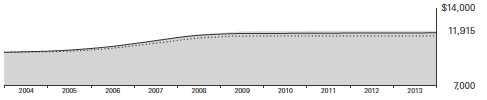
Cumulative Performance: August 31, 2003, Through August 31, 2013
Initial Investment of $10,000
| | | | |
| | | Average Annual Total Returns | |
| | Periods Ended August 31, 2013 | |
| | | | | Final Value |
| | One | Five | Ten | of a $10,000 |
| | Year | Years | Years | Investment |
| Prime Money Market Fund Investor | | | | |
| Shares | 0.02% | 0.30% | 1.77% | $11,915 |
| Money Market Funds Average | 0.00 | 0.13 | 1.38 | 11,474 |
| Citigroup Three-Month U.S. Treasury | | | | |
| Bill Index | 0.07 | 0.17 | 1.62 | 11,739 |
Money Market Funds Average: Derived from data provided by Lipper, a Thomson Reuters Company.
| | | | |
| | | | | Final Value |
| | One | Five | Ten | of a $5,000,000 |
| | Year | Years | Years | Investment |
| Prime Money Market Fund Institutional | | | | |
| Shares | 0.07% | 0.41% | 1.91% | $6,044,202 |
| Institutional Money Market Funds Average | 0.01 | 0.22 | 1.66 | 5,893,100 |
| Citigroup Three-Month U.S. Treasury Bill | | | | |
| Index | 0.07 | 0.17 | 1.62 | 5,877,371 |
See Financial Highlights for dividend information.
12
Prime Money Market Fund
| | |
| Fiscal-Year Total Returns (%): August 31, 2003, Through August 31, 2013 | |
| | | Money |
| | | Market |
| | | Funds |
| | Investor Shares | Average |
| Fiscal Year | Total Returns | Total Returns |
| 2004 | 0.83% | 0.39% |
| 2005 | 2.31 | 1.68 |
| 2006 | 4.38 | 3.69 |
| 2007 | 5.23 | 4.55 |
| 2008 | 3.60 | 3.02 |
| 2009 | 1.31 | 0.62 |
| 2010 | 0.08 | 0.02 |
| 2011 | 0.06 | 0.00 |
| 2012 | 0.04 | 0.00 |
| 2013 | 0.02 | 0.00 |
| 7-day SEC yield (8/31/2013): 0.01% |
| Money Market Funds Average: Derived from data provided by Lipper, a Thomson Reuters Company. |
Average Annual Total Returns: Periods Ended June 30, 2013
This table presents returns through the latest calendar quarter—rather than through the end of the fiscal period.
Securities and Exchange Commission rules require that we provide this information.
| | | | |
| | Inception | One | Five | Ten |
| | Date | Year | Years | Years |
| Investor Shares | 6/4/1975 | 0.02% | 0.38% | 1.78% |
| Institutional Shares | 10/3/1989 | 0.09 | 0.49 | 1.93 |
13
Prime Money Market Fund
Financial Statements
Statement of Net Assets
As of August 31, 2013
The fund reports a complete list of its holdings in various monthly and quarterly regulatory filings. The fund publishes its holdings on a monthly basis at vanguard.com and files them with the Securities and Exchange Commission on Form N-MFP. The fund’s Form N-MFP filings become public 60 days after the relevant month-end, and may be viewed at sec.gov or via a link on the “Portfolio Holdings” page on vanguard.com. For the second and fourth fiscal quarters, the lists appear in the fund’s semiannual and annual reports to shareholders. For the first and third fiscal quarters, the fund files the lists with the SEC on Form N-Q. Shareholders can look up the fund’s Forms N-Q on the SEC’s website at sec. gov. Forms N-Q may also be reviewed and copied at the SEC’s Public Reference Room (see the back cover of this report for further information).
| | | | | |
| | | | | Face | Market |
| | | | Maturity | Amount | Value |
| | | Yield1 | Date | ($000) | ($000) |
| U.S. Government and Agency Obligations (50.7%) | | | |
| 2 | Fannie Mae Discount Notes | 0.150% | 9/3/13 | 1,000,000 | 999,992 |
| 2 | Fannie Mae Discount Notes | 0.135%–0.140% | 9/11/13 | 125,486 | 125,481 |
| 2 | Fannie Mae Discount Notes | 0.140% | 12/26/13 | 175,000 | 174,921 |
| 2 | Fannie Mae Discount Notes | 0.110% | 1/8/14 | 250,000 | 249,901 |
| 3 | Federal Home Loan Bank Discount Notes | 0.075%–0.078% | 9/6/13 | 667,766 | 667,759 |
| 3 | Federal Home Loan Bank Discount Notes | 0.078%–0.137% | 9/11/13 | 899,195 | 899,171 |
| 3 | Federal Home Loan Bank Discount Notes | 0.090%–0.140% | 9/13/13 | 812,600 | 812,571 |
| 3 | Federal Home Loan Bank Discount Notes | 0.100% | 9/18/13 | 23,175 | 23,174 |
| 3 | Federal Home Loan Bank Discount Notes | 0.100%–0.130% | 9/20/13 | 1,105,706 | 1,105,644 |
| 3 | Federal Home Loan Bank Discount Notes | 0.120% | 10/9/13 | 42,500 | 42,495 |
| 3 | Federal Home Loan Bank Discount Notes | 0.105%–0.110% | 10/16/13 | 191,039 | 191,014 |
| 3 | Federal Home Loan Bank Discount Notes | 0.105% | 10/18/13 | 781,800 | 781,693 |
| 3 | Federal Home Loan Bank Discount Notes | 0.103% | 10/25/13 | 350,000 | 349,946 |
| 3 | Federal Home Loan Bank Discount Notes | 0.105% | 10/30/13 | 1,303,000 | 1,302,776 |
| 3 | Federal Home Loan Bank Discount Notes | 0.105%–0.108% | 11/1/13 | 128,172 | 128,149 |
| 3 | Federal Home Loan Bank Discount Notes | 0.100% | 11/13/13 | 308,000 | 307,938 |
| 3 | Federal Home Loan Bank Discount Notes | 0.100% | 11/15/13 | 593,770 | 593,646 |
| 3 | Federal Home Loan Bank Discount Notes | 0.100% | 11/19/13 | 44,000 | 43,990 |
| 3 | Federal Home Loan Bank Discount Notes | 0.050%–0.105% | 11/22/13 | 458,000 | 457,926 |
| 3 | Federal Home Loan Bank Discount Notes | 0.100%–0.105% | 11/27/13 | 805,000 | 804,803 |
| 3 | Federal Home Loan Bank Discount Notes | 0.055% | 11/29/13 | 51,000 | 50,993 |
| 3 | Federal Home Loan Bank Discount Notes | 0.098% | 2/12/14 | 42,000 | 41,981 |
| 3 | Federal Home Loan Bank Discount Notes | 0.098%–0.100% | 2/14/14 | 80,842 | 80,805 |
| 3 | Federal Home Loan Bank Discount Notes | 0.095%–0.100% | 2/19/14 | 534,500 | 534,249 |
| 3,4 | Federal Home Loan Banks | 0.133% | 11/22/13 | 150,000 | 149,993 |
| 3,4 | Federal Home Loan Banks | 0.156% | 12/6/13 | 50,000 | 49,999 |
| 3,4 | Federal Home Loan Banks | 0.159% | 12/26/13 | 1,525,000 | 1,525,000 |
| 3,4 | Federal Home Loan Banks | 0.104% | 1/15/14 | 135,000 | 134,998 |
| 3,4 | Federal Home Loan Banks | 0.136% | 4/3/14 | 1,465,000 | 1,465,000 |
| 3,4 | Federal Home Loan Banks | 0.124% | 4/25/14 | 388,000 | 388,000 |
| 3,4 | Federal Home Loan Banks | 0.126% | 6/5/14 | 400,000 | 400,000 |
| 3,4 | Federal Home Loan Banks | 0.126% | 6/5/14 | 150,000 | 150,000 |
| 3,4 | Federal Home Loan Banks | 0.126% | 6/6/14 | 1,400,000 | 1,400,000 |
| 3,4 | Federal Home Loan Banks | 0.126% | 6/6/14 | 931,500 | 931,500 |
| 3,4 | Federal Home Loan Banks | 0.126% | 7/3/14 | 482,000 | 482,000 |
| 3,4 | Federal Home Loan Banks | 0.167% | 10/1/14 | 150,000 | 149,967 |
14
Prime Money Market Fund
| | | | | |
| | | | | Face | Market |
| | | | Maturity | Amount | Value |
| | | Yield1 | Date | ($000) | ($000) |
| 3,4 | Federal Home Loan Banks | 0.139% | 2/27/15 | 496,000 | 495,925 |
| 2,4 | Federal Home Loan Mortgage Corp. | 0.156% | 11/4/13 | 64,780 | 64,780 |
| 2,4 | Federal National Mortgage Assn. | 0.155% | 11/8/13 | 1,365,500 | 1,365,428 |
| 2,4 | Federal National Mortgage Assn. | 0.155% | 11/14/13 | 1,000,000 | 999,940 |
| 2,4 | Federal National Mortgage Assn. | 0.165% | 9/11/14 | 2,350,000 | 2,349,512 |
| 2,4 | Federal National Mortgage Assn. | 0.154% | 2/27/15 | 3,350,000 | 3,348,748 |
| 2,4 | Federal National Mortgage Assn. | 0.156% | 8/5/15 | 1,775,000 | 1,774,305 |
| 2 | Freddie Mac Discount Notes | 0.140% | 9/3/13 | 307,000 | 306,998 |
| 2 | Freddie Mac Discount Notes | 0.133%–0.135% | 9/9/13 | 351,667 | 351,657 |
| 2 | Freddie Mac Discount Notes | 0.128% | 9/16/13 | 58,528 | 58,525 |
| 2 | Freddie Mac Discount Notes | 0.125% | 9/23/13 | 50,000 | 49,996 |
| 2 | Freddie Mac Discount Notes | 0.125% | 9/30/13 | 840,000 | 839,915 |
| 2 | Freddie Mac Discount Notes | 0.090% | 10/22/13 | 50,000 | 49,994 |
| 2 | Freddie Mac Discount Notes | 0.100% | 11/4/13 | 613,484 | 613,375 |
| 2 | Freddie Mac Discount Notes | 0.075%–0.100% | 11/12/13 | 297,995 | 297,940 |
| 2 | Freddie Mac Discount Notes | 0.075%–0.100% | 11/18/13 | 578,467 | 578,364 |
| 2 | Freddie Mac Discount Notes | 0.100% | 11/25/13 | 325,000 | 324,923 |
| 2 | Freddie Mac Discount Notes | 0.100%–0.140% | 12/3/13 | 286,750 | 286,667 |
| 2 | Freddie Mac Discount Notes | 0.150% | 12/16/13 | 121,630 | 121,576 |
| 2 | Freddie Mac Discount Notes | 0.150% | 12/23/13 | 1,040,625 | 1,040,135 |
| 2 | Freddie Mac Discount Notes | 0.138% | 12/30/13 | 520,000 | 519,761 |
| 2 | Freddie Mac Discount Notes | 0.098% | 1/13/14 | 300,000 | 299,891 |
| 2 | Freddie Mac Discount Notes | 0.095%–0.100% | 2/18/14 | 248,500 | 248,384 |
| | United States Treasury Bill | 0.120% | 9/5/13 | 850,000 | 849,989 |
| | United States Treasury Bill | 0.113% | 9/12/13 | 1,000,000 | 999,966 |
| | United States Treasury Bill | 0.038%–0.040% | 9/26/13 | 2,500,000 | 2,499,938 |
| | United States Treasury Bill | 0.108%–0.111% | 10/3/13 | 1,710,000 | 1,709,834 |
| | United States Treasury Bill | 0.101% | 10/10/13 | 500,000 | 499,946 |
| | United States Treasury Bill | 0.085% | 11/7/13 | 725,000 | 724,885 |
| | United States Treasury Bill | 0.056%–0.057% | 11/14/13 | 1,500,000 | 1,499,826 |
| | United States Treasury Bill | 0.038%–0.041% | 11/29/13 | 3,600,000 | 3,599,642 |
| | United States Treasury Bill | 0.073% | 1/23/14 | 500,000 | 499,854 |
| | United States Treasury Bill | 0.073%–0.077% | 2/6/14 | 2,828,834 | 2,827,909 |
| | United States Treasury Bill | 0.077% | 2/13/14 | 1,000,000 | 999,647 |
| | United States Treasury Bill | 0.078% | 2/20/14 | 2,190,000 | 2,189,187 |
| | United States Treasury Note/Bond | 3.125% | 9/30/13 | 594,000 | 595,439 |
| | United States Treasury Note/Bond | 0.500% | 10/15/13 | 447,000 | 447,215 |
| | United States Treasury Note/Bond | 2.750% | 10/31/13 | 415,000 | 416,809 |
| | United States Treasury Note/Bond | 0.500% | 11/15/13 | 517,800 | 518,207 |
| | United States Treasury Note/Bond | 4.250% | 11/15/13 | 481,000 | 485,051 |
| | United States Treasury Note/Bond | 0.250% | 11/30/13 | 40,000 | 40,015 |
| | United States Treasury Note/Bond | 2.000% | 11/30/13 | 568,000 | 570,656 |
| | United States Treasury Note/Bond | 0.750% | 12/15/13 | 1,234,000 | 1,236,294 |
| | United States Treasury Note/Bond | 0.125% | 12/31/13 | 148,500 | 148,514 |
| | United States Treasury Note/Bond | 1.000% | 1/15/14 | 1,681,000 | 1,686,553 |
| | United States Treasury Note/Bond | 1.250% | 2/15/14 | 1,304,000 | 1,310,650 |
| | United States Treasury Note/Bond | 4.000% | 2/15/14 | 700,000 | 712,374 |
| | United States Treasury Note/Bond | 0.250% | 2/28/14 | 764,000 | 764,414 |
| | United States Treasury Note/Bond | 1.875% | 2/28/14 | 267,000 | 269,341 |
| | United States Treasury Note/Bond | 1.250% | 3/15/14 | 1,225,000 | 1,232,480 |
| | United States Treasury Note/Bond | 0.250% | 3/31/14 | 357,000 | 357,282 |
| | United States Treasury Note/Bond | 1.750% | 3/31/14 | 746,000 | 752,953 |
| | United States Treasury Note/Bond | 1.250% | 4/15/14 | 599,000 | 603,198 |
| Total U. S. Government and Agency Obligations (Cost $65,432,282) | | | 65,432,282 |
15
Prime Money Market Fund
| | | | |
| | | | Face | Market |
| | | Maturity | Amount | Value |
| | Yield1 | Date | ($000) | ($000) |
| Commercial Paper (28.0%) | | | | |
| Finance—Auto (2.4%) | | | | |
| American Honda Finance Corp. | 0.130% | 9/18/13 | 65,000 | 64,996 |
| American Honda Finance Corp. | 0.130% | 9/19/13 | 165,750 | 165,739 |
| American Honda Finance Corp. | 0.150% | 9/23/13 | 10,000 | 9,999 |
| American Honda Finance Corp. | 0.135%–0.150% | 9/24/13 | 81,100 | 81,093 |
| American Honda Finance Corp. | 0.135%–0.180% | 9/25/13 | 65,000 | 64,994 |
| American Honda Finance Corp. | 0.130%–0.160% | 10/4/13 | 125,500 | 125,484 |
| American Honda Finance Corp. | 0.120%–0.150% | 10/21/13 | 248,500 | 248,450 |
| American Honda Finance Corp. | 0.120%–0.130% | 10/22/13 | 36,000 | 35,994 |
| American Honda Finance Corp. | 0.120% | 10/28/13 | 77,700 | 77,685 |
| American Honda Finance Corp. | 0.120% | 10/29/13 | 27,750 | 27,745 |
| American Honda Finance Corp. | 0.120% | 11/6/13 | 55,500 | 55,488 |
| American Honda Finance Corp. | 0.110% | 11/12/13 | 69,250 | 69,235 |
| American Honda Finance Corp. | 0.120% | 11/13/13 | 142,000 | 141,965 |
| 5 BMW US Capital LLC | 0.120% | 9/3/13 | 24,500 | 24,500 |
| 5 BMW US Capital LLC | 0.120% | 9/4/13 | 24,000 | 24,000 |
| 5 BMW US Capital LLC | 0.120% | 9/5/13 | 49,500 | 49,499 |
| 5 BMW US Capital LLC | 0.120% | 9/11/13 | 39,500 | 39,499 |
| 5 BMW US Capital LLC | 0.120% | 9/12/13 | 22,000 | 21,999 |
| 5 BMW US Capital LLC | 0.120% | 9/23/13 | 67,000 | 66,995 |
| 5 BMW US Capital LLC | 0.130% | 10/7/13 | 22,000 | 21,997 |
| 5 BMW US Capital LLC | 0.130% | 10/8/13 | 18,000 | 17,998 |
| 5 BMW US Capital LLC | 0.130% | 10/9/13 | 35,250 | 35,245 |
| 5 BMW US Capital LLC | 0.130% | 10/11/13 | 30,000 | 29,996 |
| 5 BMW US Capital LLC | 0.130% | 10/15/13 | 66,000 | 65,990 |
| 5 BMW US Capital LLC | 0.130% | 10/16/13 | 89,500 | 89,485 |
| 5 BMW US Capital LLC | 0.130% | 10/17/13 | 34,250 | 34,244 |
| 5 BMW US Capital LLC | 0.130% | 10/18/13 | 52,000 | 51,991 |
| 5 BMW US Capital LLC | 0.110% | 10/21/13 | 29,750 | 29,745 |
| 5 BMW US Capital LLC | 0.110% | 10/28/13 | 117,800 | 117,780 |
| 5 BMW US Capital LLC | 0.120% | 11/4/13 | 50,000 | 49,989 |
| 5 BMW US Capital LLC | 0.120% | 11/5/13 | 22,500 | 22,495 |
| Toyota Motor Credit Corp. | 0.210% | 9/11/13 | 32,670 | 32,668 |
| Toyota Motor Credit Corp. | 0.240% | 10/1/13 | 26,250 | 26,245 |
| Toyota Motor Credit Corp. | 0.230% | 10/2/13 | 168,000 | 167,967 |
| Toyota Motor Credit Corp. | 0.220% | 10/15/13 | 32,000 | 31,991 |
| Toyota Motor Credit Corp. | 0.210% | 11/8/13 | 189,000 | 188,925 |
| 4 Toyota Motor Credit Corp. | 0.175% | 12/10/13 | 221,000 | 221,000 |
| 4 Toyota Motor Credit Corp. | 0.175% | 12/11/13 | 194,000 | 194,000 |
| Toyota Motor Credit Corp. | 0.240% | 1/6/14 | 74,000 | 73,937 |
| Toyota Motor Credit Corp. | 0.230% | 2/3/14 | 157,750 | 157,594 |
| | | | | 3,056,641 |
| Finance—Other (3.0%) | | | | |
| General Electric Capital Corp. | 0.150% | 10/2/13 | 297,000 | 296,962 |
| General Electric Capital Corp. | 0.150% | 10/4/13 | 248,000 | 247,966 |
| General Electric Capital Corp. | 0.150% | 10/8/13 | 198,000 | 197,969 |
| General Electric Capital Corp. | 0.130% | 10/11/13 | 157,000 | 156,977 |
| General Electric Capital Corp. | 0.190% | 10/15/13 | 99,000 | 98,977 |
| General Electric Capital Corp. | 0.130% | 10/18/13 | 150,000 | 149,974 |
| General Electric Capital Corp. | 0.130% | 10/23/13 | 80,000 | 79,985 |
| General Electric Capital Corp. | 0.150% | 10/25/13 | 248,000 | 247,944 |
| General Electric Capital Corp. | 0.150% | 11/1/13 | 196,000 | 195,950 |
| General Electric Capital Corp. | 0.150% | 11/4/13 | 196,000 | 195,948 |
16
Prime Money Market Fund
| | | | | |
| | | | | Face | Market |
| | | | Maturity | Amount | Value |
| | | Yield1 | Date | ($000) | ($000) |
| | General Electric Capital Corp. | 0.150% | 11/7/13 | 33,000 | 32,991 |
| | General Electric Capital Corp. | 0.150% | 11/22/13 | 250,000 | 249,915 |
| | General Electric Capital Corp. | 0.150% | 12/5/13 | 175,000 | 174,931 |
| 5 | Jupiter Securitization Co. LLC | 0.130% | 9/27/13 | 25,000 | 24,998 |
| 5 | Old Line Funding LLC | 0.160% | 9/17/13 | 49,500 | 49,496 |
| 5 | Old Line Funding LLC | 0.120%–0.130% | 9/23/13 | 67,685 | 67,680 |
| 5 | Old Line Funding LLC | 0.170% | 9/25/13 | 134,000 | 133,985 |
| 5 | Old Line Funding LLC | 0.150%–0.200% | 10/17/13 | 260,127 | 260,062 |
| 5 | Old Line Funding LLC | 0.200% | 10/18/13 | 222,000 | 221,942 |
| 5 | Old Line Funding LLC | 0.200% | 10/22/13 | 38,000 | 37,989 |
| 5 | Old Line Funding LLC | 0.200% | 10/23/13 | 14,098 | 14,094 |
| 5 | Old Line Funding LLC | 0.200% | 10/24/13 | 50,000 | 49,985 |
| 5 | Old Line Funding LLC | 0.200% | 10/25/13 | 24,500 | 24,493 |
| 5 | Old Line Funding LLC | 0.200% | 10/29/13 | 40,500 | 40,487 |
| 5 | Old Line Funding LLC | 0.200% | 11/1/13 | 78,000 | 77,974 |
| 5 | Old Line Funding LLC | 0.200% | 11/8/13 | 39,500 | 39,485 |
| 5 | Old Line Funding LLC | 0.200% | 11/12/13 | 222,000 | 221,911 |
| 5 | Old Line Funding LLC | 0.190%–0.200% | 11/18/13 | 133,500 | 133,442 |
| 5 | Old Line Funding LLC | 0.200% | 12/9/13 | 83,500 | 83,454 |
| 5 | Old Line Funding LLC | 0.200% | 12/18/13 | 76,000 | 75,954 |
| 5 | Old Line Funding LLC | 0.200% | 12/23/13 | 40,000 | 39,975 |
| 5 | Old Line Funding LLC | 0.200% | 1/6/14 | 26,000 | 25,982 |
| | | | | | 3,949,877 |
| Foreign Banks (3.5%) | | | | |
| 4,5 | Australia & New Zealand Banking Group, Ltd. | 0.185% | 10/8/13 | 466,500 | 466,500 |
| 4,5 | Australia & New Zealand Banking Group, Ltd. | 0.185% | 10/9/13 | 298,000 | 298,000 |
| 4,5 | Australia & New Zealand Banking Group, Ltd. | 0.185% | 11/8/13 | 240,000 | 240,000 |
| 4,5 | Australia & New Zealand Banking Group, Ltd. | 0.184% | 11/25/13 | 37,000 | 37,000 |
| 4,5 | Australia & New Zealand Banking Group, Ltd. | 0.183% | 12/23/13 | 123,000 | 123,000 |
| 4,5 | Australia & New Zealand Banking Group, Ltd. | 0.174% | 1/24/14 | 264,000 | 264,000 |
| 5 | Commonwealth Bank of Australia | 0.230% | 10/22/13 | 43,000 | 42,986 |
| 5 | Commonwealth Bank of Australia | 0.220% | 10/29/13 | 28,143 | 28,133 |
| 4,5 | Commonwealth Bank of Australia | 0.316% | 11/1/13 | 46,500 | 46,508 |
| 5 | Commonwealth Bank of Australia | 0.225% | 11/12/13 | 100,000 | 99,955 |
| 5 | Commonwealth Bank of Australia | 0.220% | 12/2/13 | 40,000 | 39,978 |
| 5 | Commonwealth Bank of Australia | 0.215% | 12/5/13 | 30,905 | 30,888 |
| 5 | Commonwealth Bank of Australia | 0.215%–0.230% | 12/16/13 | 205,015 | 204,881 |
| 4,5 | Westpac Banking Corp. | 0.184% | 9/25/13 | 185,000 | 185,000 |
| 4,5 | Westpac Banking Corp. | 0.184% | 9/26/13 | 185,000 | 185,000 |
| 4,5 | Westpac Banking Corp. | 0.184% | 9/27/13 | 185,000 | 185,000 |
| 4,5 | Westpac Banking Corp. | 0.182% | 9/30/13 | 670,000 | 670,000 |
| 4,5 | Westpac Banking Corp. | 0.182% | 9/30/13 | 450,000 | 450,000 |
| 4,5 | Westpac Banking Corp. | 0.184% | 10/16/13 | 150,000 | 150,000 |
| 4,5 | Westpac Banking Corp. | 0.184% | 10/21/13 | 150,000 | 150,000 |
| 4,5 | Westpac Banking Corp. | 0.184% | 10/25/13 | 73,000 | 73,000 |
| 4,5 | Westpac Banking Corp. | 0.184% | 10/28/13 | 100,000 | 100,000 |
| 4,5 | Westpac Banking Corp. | 0.186% | 11/7/13 | 218,000 | 218,000 |
| 4,5 | Westpac Banking Corp. | 0.184% | 11/20/13 | 73,000 | 73,000 |
| 4,5 | Westpac Banking Corp. | 0.318% | 1/13/14 | 118,000 | 118,049 |
| 4,5 | Westpac Banking Corp. | 0.315% | 1/24/14 | 39,500 | 39,518 |
| | | | | | 4,518,396 |
| Foreign Governments (7.1%) | | | | |
| | Canada | 0.170% | 9/27/13 | 37,000 | 36,995 |
| | Canada | 0.170% | 10/7/13 | 18,000 | 17,997 |
17
Prime Money Market Fund
| | | | |
| | | | Face | Market |
| | | Maturity | Amount | Value |
| | Yield1 | Date | ($000) | ($000) |
| 8 CPPIB Capital Inc. | 0.150% | 9/3/13 | 25,000 | 25,000 |
| 8 CPPIB Capital Inc. | 0.150% | 9/9/13 | 250,000 | 249,992 |
| 8 CPPIB Capital Inc. | 0.150% | 9/10/13 | 298,000 | 297,989 |
| 8 CPPIB Capital Inc. | 0.150% | 9/11/13 | 248,000 | 247,990 |
| 8 CPPIB Capital Inc. | 0.150% | 9/12/13 | 49,500 | 49,498 |
| 8 CPPIB Capital Inc. | 0.150% | 9/17/13 | 77,000 | 76,995 |
| 8 CPPIB Capital Inc. | 0.150% | 9/23/13 | 127,500 | 127,488 |
| 8 CPPIB Capital Inc. | 0.150% | 9/24/13 | 100,000 | 99,990 |
| 8 CPPIB Capital Inc. | 0.150% | 9/25/13 | 44,000 | 43,996 |
| 8 CPPIB Capital Inc. | 0.150% | 10/2/13 | 151,500 | 151,480 |
| 8 CPPIB Capital Inc. | 0.150% | 10/10/13 | 19,000 | 18,997 |
| 8 CPPIB Capital Inc. | 0.150%–0.190% | 10/11/13 | 82,000 | 81,985 |
| 8 CPPIB Capital Inc. | 0.150% | 10/16/13 | 20,000 | 19,996 |
| 8 CPPIB Capital Inc. | 0.150% | 10/21/13 | 15,750 | 15,747 |
| 8 CPPIB Capital Inc. | 0.180% | 10/22/13 | 29,000 | 28,993 |
| 8 CPPIB Capital Inc. | 0.190% | 11/1/13 | 107,000 | 106,966 |
| 8 CPPIB Capital Inc. | 0.190% | 11/7/13 | 148,000 | 147,948 |
| 8 CPPIB Capital Inc. | 0.190% | 11/8/13 | 36,000 | 35,987 |
| 8 CPPIB Capital Inc. | 0.150%–0.190% | 11/12/13 | 221,000 | 220,917 |
| 8 CPPIB Capital Inc. | 0.150% | 11/15/13 | 20,000 | 19,994 |
| 8 CPPIB Capital Inc. | 0.150% | 11/21/13 | 74,000 | 73,975 |
| 8 CPPIB Capital Inc. | 0.180% | 1/16/14 | 15,000 | 14,990 |
| 8 CPPIB Capital Inc. | 0.180% | 1/31/14 | 17,000 | 16,987 |
| Export Development Canada | 0.150% | 9/10/13 | 36,800 | 36,799 |
| Export Development Canada | 0.180% | 10/7/13 | 24,000 | 23,996 |
| Export Development Canada | 0.180%–0.190% | 10/8/13 | 94,000 | 93,982 |
| Export Development Canada | 0.140% | 11/1/13 | 196,000 | 195,954 |
| Export Development Canada | 0.140% | 11/5/13 | 100,000 | 99,975 |
| Export Development Canada | 0.140% | 11/12/13 | 200,000 | 199,944 |
| Export Development Canada | 0.170% | 11/15/13 | 197,000 | 196,930 |
| Export Development Canada | 0.160% | 11/18/13 | 25,000 | 24,991 |
| Export Development Canada | 0.160% | 11/19/13 | 99,000 | 98,965 |
| Export Development Canada | 0.160% | 11/22/13 | 198,000 | 197,928 |
| Export Development Canada | 0.160% | 12/2/13 | 149,000 | 148,939 |
| Export Development Canada | 0.155% | 12/9/13 | 200,000 | 199,915 |
| 5 Hydro-Quebec | 0.120% | 10/16/13 | 40,000 | 39,994 |
| 5 Hydro-Quebec | 0.100% | 11/15/13 | 20,000 | 19,996 |
| Province of British Columbia | 0.130% | 10/10/13 | 36,000 | 35,995 |
| Province of British Columbia | 0.140% | 10/22/13 | 33,000 | 32,993 |
| Province of British Columbia | 0.150% | 11/4/13 | 49,500 | 49,487 |
| Province of British Columbia | 0.145% | 11/12/13 | 9,775 | 9,772 |
| Province of British Columbia | 0.145% | 11/18/13 | 53,000 | 52,983 |
| Province of British Columbia | 0.150% | 11/22/13 | 50,000 | 49,983 |
| Province of British Columbia | 0.160% | 12/4/13 | 54,500 | 54,477 |
| Province of British Columbia | 0.160% | 12/11/13 | 99,000 | 98,956 |
| Province of Ontario | 0.135%–0.150% | 9/6/13 | 91,900 | 91,898 |
| Province of Ontario | 0.150% | 9/12/13 | 44,000 | 43,998 |
| Province of Ontario | 0.140% | 9/19/13 | 49,500 | 49,497 |
| Province of Ontario | 0.140% | 10/4/13 | 21,000 | 20,997 |
| Province of Ontario | 0.180% | 10/7/13 | 137,750 | 137,725 |
| Province of Ontario | 0.120% | 10/8/13 | 22,000 | 21,997 |
| Province of Ontario | 0.180% | 10/9/13 | 143,000 | 142,973 |
| Province of Ontario | 0.180% | 10/11/13 | 76,000 | 75,985 |
| Province of Ontario | 0.140%–0.170% | 10/15/13 | 150,000 | 149,971 |
| Province of Ontario | 0.140% | 10/16/13 | 12,000 | 11,998 |
18
Prime Money Market Fund
| | | | |
| | | | Face | Market |
| | | Maturity | Amount | Value |
| | Yield1 | Date | ($000) | ($000) |
| Province of Ontario | 0.110% | 10/29/13 | 20,000 | 19,996 |
| Province of Ontario | 0.150% | 11/1/13 | 28,000 | 27,993 |
| Province of Ontario | 0.140% | 11/5/13 | 49,500 | 49,487 |
| Province of Ontario | 0.120% | 11/6/13 | 49,000 | 48,989 |
| Province of Ontario | 0.130%–0.150% | 11/7/13 | 110,000 | 109,972 |
| Province of Ontario | 0.100%–0.160% | 11/18/13 | 75,000 | 74,977 |
| Province of Ontario | 0.160% | 11/22/13 | 24,500 | 24,491 |
| Province of Ontario | 0.100%–0.160% | 11/25/13 | 125,000 | 124,956 |
| Province of Ontario | 0.100% | 11/26/13 | 104,000 | 103,975 |
| Province of Ontario | 0.100% | 11/27/13 | 20,000 | 19,995 |
| Province of Ontario | 0.160% | 11/29/13 | 25,000 | 24,990 |
| Province of Ontario | 0.160% | 12/5/13 | 144,000 | 143,939 |
| Province of Ontario | 0.150% | 1/21/14 | 60,000 | 59,965 |
| 8 PSP Capital Inc. | 0.200% | 10/7/13 | 19,500 | 19,496 |
| 8 PSP Capital Inc. | 0.190% | 10/15/13 | 26,500 | 26,494 |
| 8 PSP Capital Inc. | 0.190% | 11/12/13 | 90,000 | 89,966 |
| 8 PSP Capital Inc. | 0.190% | 11/13/13 | 156,500 | 156,440 |
| 8 PSP Capital Inc. | 0.190% | 11/15/13 | 83,000 | 82,967 |
| 8 PSP Capital Inc. | 0.180% | 11/18/13 | 14,500 | 14,494 |
| 8 PSP Capital Inc. | 0.190% | 11/21/13 | 29,500 | 29,487 |
| 8 PSP Capital Inc. | 0.180% | 12/6/13 | 15,000 | 14,993 |
| 8 PSP Capital Inc. | 0.190% | 12/11/13 | 28,000 | 27,985 |
| 8 PSP Capital Inc. | 0.190% | 12/13/13 | 24,500 | 24,487 |
| 8 PSP Capital Inc. | 0.180% | 2/3/14 | 17,750 | 17,736 |
| 8 PSP Capital Inc. | 0.190% | 2/18/14 | 11,750 | 11,739 |
| 5 Quebec | 0.150% | 9/5/13 | 32,200 | 32,199 |
| 5 Quebec | 0.130% | 9/11/13 | 100,000 | 99,996 |
| 5 Quebec | 0.130%–0.150% | 9/12/13 | 245,000 | 244,990 |
| 5 Quebec | 0.150% | 9/13/13 | 36,000 | 35,998 |
| 5 Quebec | 0.110%–0.120% | 10/1/13 | 103,100 | 103,090 |
| 5 Quebec | 0.140% | 10/4/13 | 27,000 | 26,997 |
| 5 Quebec | 0.120% | 10/10/13 | 500,000 | 499,935 |
| 5 Quebec | 0.120%–0.130% | 10/17/13 | 468,000 | 467,927 |
| 5 Quebec | 0.130% | 10/24/13 | 100,000 | 99,981 |
| 5 Quebec | 0.120% | 11/1/13 | 22,500 | 22,495 |
| 5 Quebec | 0.120% | 11/6/13 | 32,500 | 32,493 |
| 5 Quebec | 0.100% | 11/19/13 | 49,500 | 49,489 |
| 5 Quebec | 0.100% | 11/20/13 | 503,500 | 503,388 |
| Queensland Treasury Corp. | 0.200% | 9/12/13 | 36,000 | 35,998 |
| Queensland Treasury Corp. | 0.240% | 10/15/13 | 150,000 | 149,956 |
| Queensland Treasury Corp. | 0.240% | 10/18/13 | 75,000 | 74,976 |
| Queensland Treasury Corp. | 0.130% | 10/24/13 | 25,000 | 24,995 |
| Queensland Treasury Corp. | 0.230%–0.240% | 10/29/13 | 151,000 | 150,943 |
| Queensland Treasury Corp. | 0.130% | 10/30/13 | 65,500 | 65,486 |
| Queensland Treasury Corp. | 0.140% | 11/6/13 | 99,000 | 98,975 |
| Queensland Treasury Corp. | 0.150% | 11/14/13 | 30,500 | 30,491 |
| | | | | 9,139,692 |
| Foreign Industrial (5.2%) | | | | |
| 5 BASF SE | 0.140% | 9/20/13 | 79,000 | 78,994 |
| 5 BASF SE | 0.150% | 9/25/13 | 200,000 | 199,980 |
| 5 BASF SE | 0.150% | 9/26/13 | 100,000 | 99,990 |
| 5 GlaxoSmithKline Finance plc | 0.150% | 9/3/13 | 63,000 | 62,999 |
| 5 GlaxoSmithKline Finance plc | 0.140% | 9/4/13 | 236,000 | 235,997 |
| 5 GlaxoSmithKline Finance plc | 0.100%–0.120% | 10/2/13 | 245,000 | 244,976 |
| 5 GlaxoSmithKline Finance plc | 0.150% | 10/9/13 | 123,500 | 123,480 |
19
Prime Money Market Fund
| | | | |
| | | | Face | Market |
| | | Maturity | Amount | Value |
| | Yield1 | Date | ($000) | ($000) |
| 5 Nestle Capital Corp. | 0.200% | 9/6/13 | 47,000 | 46,999 |
| 5 Nestle Capital Corp. | 0.250% | 9/17/13 | 10,000 | 9,999 |
| 5 Nestle Capital Corp. | 0.190% | 10/1/13 | 600,000 | 599,905 |
| 5 Nestle Capital Corp. | 0.140% | 10/7/13 | 396,000 | 395,945 |
| 5 Nestle Capital Corp. | 0.140% | 10/8/13 | 68,000 | 67,990 |
| 5 Nestle Capital Corp. | 0.150% | 11/13/13 | 368,000 | 367,888 |
| 5 Nestle Capital Corp. | 0.145% | 11/14/13 | 113,000 | 112,966 |
| 5 Nestle Capital Corp. | 0.120% | 11/18/13 | 214,000 | 213,944 |
| Nestle Finance International Ltd. | 0.150% | 9/24/13 | 230,000 | 229,978 |
| Nestle Finance International Ltd. | 0.150% | 9/26/13 | 115,000 | 114,988 |
| Nestle Finance International Ltd. | 0.200% | 10/3/13 | 235,000 | 234,958 |
| Nestle Finance International Ltd. | 0.200% | 10/15/13 | 45,000 | 44,989 |
| Nestle Finance International Ltd. | 0.200% | 10/16/13 | 98,000 | 97,976 |
| Nestle Finance International Ltd. | 0.140% | 11/1/13 | 228,000 | 227,946 |
| Nestle Finance International Ltd. | 0.140% | 11/5/13 | 53,000 | 52,987 |
| Nestle Finance International Ltd. | 0.125%–0.130% | 11/7/13 | 356,500 | 356,417 |
| Nestle Finance International Ltd. | 0.165% | 11/13/13 | 198,000 | 197,934 |
| Nestle Finance International Ltd. | 0.165% | 11/14/13 | 149,300 | 149,249 |
| 5 Reckitt Benckiser Treasury Services plc | 0.140% | 9/6/13 | 99,000 | 98,998 |
| 5 Reckitt Benckiser Treasury Services plc | 0.150% | 9/16/13 | 31,444 | 31,442 |
| 5 Reckitt Benckiser Treasury Services plc | 0.125% | 11/7/13 | 159,750 | 159,713 |
| 5 Roche Holdings Inc. | 0.110% | 9/10/13 | 49,500 | 49,499 |
| 5 Roche Holdings Inc. | 0.110%–0.120% | 9/12/13 | 97,000 | 96,997 |
| 5 Roche Holdings Inc. | 0.090% | 11/8/13 | 40,300 | 40,293 |
| 5 Sanofi | 0.140% | 9/19/13 | 224,000 | 223,984 |
| 5 Sanofi | 0.150% | 9/20/13 | 237,100 | 237,081 |
| 5 Sanofi | 0.150% | 9/25/13 | 335,000 | 334,967 |
| 5 Sanofi | 0.140% | 9/27/13 | 107,200 | 107,189 |
| 5 Siemens Capital Co. LLC | 0.120% | 9/10/13 | 200,000 | 199,994 |
| 5 Siemens Capital Co. LLC | 0.120% | 9/12/13 | 75,000 | 74,997 |
| 5 Total Capital Canada Ltd. | 0.160% | 1/13/14 | 200,000 | 199,881 |
| 5 Total Capital Canada Ltd. | 0.140% | 2/3/14 | 72,000 | 71,957 |
| Toyota Credit Canada Inc. | 0.260% | 9/17/13 | 48,500 | 48,494 |
| Toyota Credit Canada Inc. | 0.260% | 9/19/13 | 50,000 | 49,994 |
| Toyota Credit Canada Inc. | 0.220% | 10/21/13 | 19,000 | 18,994 |
| Toyota Credit Canada Inc. | 0.260% | 1/2/14 | 21,000 | 20,981 |
| Toyota Credit Canada Inc. | 0.250% | 1/6/14 | 20,000 | 19,982 |
| 5 Unilever Capital Corp. | 0.110% | 9/9/13 | 90,000 | 89,998 |
| | | | | 6,744,909 |
| Industrial (6.8%) | | | | |
| Caterpillar Financial Services Corp. | 0.110% | 9/3/13 | 75,000 | 75,000 |
| Caterpillar Financial Services Corp. | 0.110% | 9/4/13 | 58,600 | 58,600 |
| Caterpillar Financial Services Corp. | 0.150% | 9/23/13 | 231,000 | 230,979 |
| Caterpillar Financial Services Corp. | 0.170% | 9/26/13 | 141,000 | 140,983 |
| 5 Chevron Corp. | 0.090% | 9/3/13 | 65,000 | 65,000 |
| 5 Chevron Corp. | 0.090% | 9/4/13 | 200,000 | 199,999 |
| Exxon Mobil Corp. | 0.130% | 10/11/13 | 495,000 | 494,928 |
| Exxon Mobil Corp. | 0.090% | 10/25/13 | 200,000 | 199,973 |
| Exxon Mobil Corp. | 0.090% | 10/30/13 | 43,000 | 42,994 |
| Exxon Mobil Corp. | 0.090% | 10/31/13 | 300,000 | 299,955 |
| Exxon Mobil Corp. | 0.090% | 11/1/13 | 150,000 | 149,977 |
| General Electric Co. | 0.110% | 9/25/13 | 200,000 | 199,985 |
| General Electric Co. | 0.110% | 9/26/13 | 298,000 | 297,977 |
| General Electric Co. | 0.110% | 9/27/13 | 59,000 | 58,995 |
| 5 Google Inc. | 0.150% | 11/5/13 | 21,000 | 20,994 |
20
Prime Money Market Fund
| | | | |
| | | | Face | Market |
| | | Maturity | Amount | Value |
| | Yield1 | Date | ($000) | ($000) |
| 5 Google Inc. | 0.120% | 11/13/13 | 99,000 | 98,976 |
| 5 Google Inc. | 0.150% | 1/15/14 | 75,000 | 74,958 |
| 5 Google Inc. | 0.140% | 2/6/14 | 55,000 | 54,966 |
| 5 Honeywell International Inc. | 0.120% | 9/23/13 | 8,900 | 8,899 |
| 5 Honeywell International Inc. | 0.120% | 9/26/13 | 50,000 | 49,996 |
| 5 Procter & Gamble Co. | 0.110% | 10/16/13 | 24,500 | 24,497 |
| 5 Procter & Gamble Co. | 0.150% | 11/4/13 | 471,000 | 470,874 |
| 5 Procter & Gamble Co. | 0.100% | 11/6/13 | 75,750 | 75,736 |
| 5 Procter & Gamble Co. | 0.100% | 11/8/13 | 62,100 | 62,088 |
| 5 Procter & Gamble Co. | 0.090% | 11/15/13 | 75,000 | 74,986 |
| 5 Procter & Gamble Co. | 0.140% | 11/19/13 | 124,000 | 123,962 |
| 5 Procter & Gamble Co. | 0.090% | 11/26/13 | 204,500 | 204,456 |
| 5 Procter & Gamble Co. | 0.080% | 11/27/13 | 36,100 | 36,093 |
| 5 Procter & Gamble Co. | 0.080% | 12/2/13 | 40,300 | 40,292 |
| 5 Procter & Gamble Co. | 0.080% | 12/4/13 | 149,000 | 148,969 |
| 5 Syngenta Wilmington Inc. | 0.100% | 9/17/13 | 55,000 | 54,998 |
| 5 The Coca-Cola Co. | 0.200% | 9/3/13 | 163,000 | 162,998 |
| 5 The Coca-Cola Co. | 0.180% | 10/3/13 | 98,750 | 98,734 |
| 5 The Coca-Cola Co. | 0.180% | 10/7/13 | 208,550 | 208,512 |
| 5 The Coca-Cola Co. | 0.180% | 10/8/13 | 100,000 | 99,982 |
| 5 The Coca-Cola Co. | 0.180% | 10/9/13 | 100,000 | 99,981 |
| 5 The Coca-Cola Co. | 0.140% | 10/23/13 | 99,000 | 98,980 |
| 5 The Coca-Cola Co. | 0.140% | 10/24/13 | 100,000 | 99,979 |
| 5 The Coca-Cola Co. | 0.140% | 10/25/13 | 100,000 | 99,979 |
| 5 The Coca-Cola Co. | 0.190% | 11/4/13 | 187,000 | 186,937 |
| 5 The Coca-Cola Co. | 0.180%–0.190% | 11/5/13 | 326,000 | 325,891 |
| 5 The Coca-Cola Co. | 0.140%–0.170% | 11/6/13 | 257,500 | 257,426 |
| 5 The Coca-Cola Co. | 0.140% | 11/8/13 | 225,000 | 224,941 |
| 5 The Coca-Cola Co. | 0.140% | 11/12/13 | 200,000 | 199,944 |
| 5 The Coca-Cola Co. | 0.170% | 11/19/13 | 303,750 | 303,637 |
| 5 The Coca-Cola Co. | 0.170% | 11/20/13 | 131,000 | 130,951 |
| 5 The Coca-Cola Co. | 0.160% | 12/5/13 | 287,000 | 286,879 |
| 5 The Coca-Cola Co. | 0.160% | 12/6/13 | 173,000 | 172,926 |
| 5 The Coca-Cola Co. | 0.160% | 12/9/13 | 159,000 | 158,930 |
| 5 The Coca-Cola Co. | 0.160% | 12/10/13 | 17,000 | 16,992 |
| 5 The Coca-Cola Co. | 0.160% | 12/11/13 | 49,000 | 48,978 |
| 5 The Coca-Cola Co. | 0.190% | 12/19/13 | 74,000 | 73,957 |
| 5 The Coca-Cola Co. | 0.190% | 1/3/14 | 50,000 | 49,967 |
| 5 The Coca-Cola Co. | 0.190% | 1/7/14 | 38,000 | 37,974 |
| 5 The Coca-Cola Co. | 0.180% | 1/8/14 | 29,000 | 28,981 |
| 5 The Coca-Cola Co. | 0.170% | 2/10/14 | 27,000 | 26,979 |
| 5 The Coca-Cola Co. | 0.170% | 2/27/14 | 104,000 | 103,912 |
| 5 The Coca-Cola Co. | 0.170%–0.180% | 3/3/14 | 215,000 | 214,810 |
| 5 The Coca-Cola Co. | 0.170% | 3/4/14 | 125,000 | 124,891 |
| 5 The Coca-Cola Co. | 0.170% | 3/5/14 | 85,000 | 84,926 |
| 5 Wal-Mart Stores, Inc. | 0.100% | 10/16/13 | 49,500 | 49,494 |
| 5 Wal-Mart Stores, Inc. | 0.100%–0.110% | 10/17/13 | 59,250 | 59,242 |
| 5 Wal-Mart Stores, Inc. | 0.100% | 10/18/13 | 59,500 | 59,492 |
| 5 Wal-Mart Stores, Inc. | 0.100% | 10/21/13 | 29,750 | 29,746 |
| 5 Wal-Mart Stores, Inc. | 0.090% | 11/1/13 | 99,500 | 99,485 |
| 5 Wal-Mart Stores, Inc. | 0.100% | 11/4/13 | 198,500 | 198,465 |
| 5 Wal-Mart Stores, Inc. | 0.100% | 11/5/13 | 99,600 | 99,582 |
| | | | | 8,766,565 |
| Total Commercial Paper (Cost $36,176,080) | | | | 36,176,080 |
21
Prime Money Market Fund
| | | | |
| | | | Face | Market |
| | | Maturity | Amount | Value |
| | Yield1 | Date | ($000) | ($000) |
| Certificates of Deposit (19.4%) | | | | |
| Domestic Banks (4.0%) | | | | |
| JPMorgan Chase Bank NA | 0.160% | 10/1/13 | 730,000 | 730,000 |
| JPMorgan Chase Bank NA | 0.180% | 10/1/13 | 280,000 | 280,000 |
| JPMorgan Chase Bank NA | 0.180% | 10/1/13 | 88,000 | 88,000 |
| JPMorgan Chase Bank NA | 0.180% | 10/7/13 | 219,000 | 219,000 |
| 4 Wells Fargo Bank NA | 0.185% | 9/11/13 | 459,000 | 459,000 |
| 4 Wells Fargo Bank NA | 0.175% | 9/13/13 | 834,000 | 834,000 |
| 4 Wells Fargo Bank NA | 0.175% | 10/9/13 | 414,000 | 414,000 |
| 4 Wells Fargo Bank NA | 0.175% | 10/10/13 | 115,000 | 115,000 |
| 4 Wells Fargo Bank NA | 0.184% | 11/27/13 | 192,500 | 192,511 |
| 4 Wells Fargo Bank NA | 0.176% | 2/5/14 | 495,000 | 495,000 |
| Wells Fargo Bank NA | 0.220% | 2/12/14 | 500,000 | 500,000 |
| Wells Fargo Bank NA | 0.220% | 2/19/14 | 495,000 | 495,000 |
| 4 Wells Fargo Bank NA | 0.203% | 2/24/14 | 361,000 | 361,000 |
| | | | | 5,182,511 |
| Eurodollar Certificates of Deposit (6.7%) | | | | |
| 4 Australia & New Zealand Banking Group, Ltd. | 0.200% | 10/11/13 | 432,000 | 432,000 |
| 4 Australia & New Zealand Banking Group, Ltd. | 0.204% | 10/17/13 | 170,000 | 170,000 |
| 4 Australia & New Zealand Banking Group, Ltd. | 0.204% | 10/24/13 | 432,000 | 432,000 |
| 4 Australia & New Zealand Banking Group, Ltd. | 0.207% | 11/1/13 | 646,000 | 646,000 |
| 4 Commonwealth Bank of Australia | 0.175% | 9/13/13 | 50,000 | 50,000 |
| 4 Commonwealth Bank of Australia | 0.175% | 10/8/13 | 840,000 | 840,000 |
| 4 Commonwealth Bank of Australia | 0.175% | 10/15/13 | 407,000 | 407,000 |
| 4 Commonwealth Bank of Australia | 0.174% | 11/20/13 | 126,000 | 126,000 |
| 4 Commonwealth Bank of Australia | 0.175% | 2/10/14 | 468,000 | 468,000 |
| 4 Commonwealth Bank of Australia | 0.174% | 2/19/14 | 522,000 | 522,000 |
| 4 Commonwealth Bank of Australia | 0.173% | 2/24/14 | 706,000 | 706,000 |
| 4 National Australia Bank Ltd. | 0.174% | 9/18/13 | 121,000 | 121,000 |
| 4 National Australia Bank Ltd. | 0.177% | 10/2/13 | 1,033,000 | 1,033,000 |
| 4 National Australia Bank Ltd. | 0.194% | 10/21/13 | 480,000 | 480,000 |
| 4 National Australia Bank Ltd. | 0.193% | 10/23/13 | 525,000 | 525,000 |
| 4 National Australia Bank Ltd. | 0.196% | 12/6/13 | 64,000 | 64,000 |
| 4 National Australia Bank Ltd. | 0.194% | 12/18/13 | 128,000 | 128,000 |
| 4 National Australia Bank Ltd. | 0.204% | 12/27/13 | 72,000 | 72,000 |
| 4 National Australia Bank Ltd. | 0.206% | 1/6/14 | 50,000 | 50,000 |
| 4 National Australia Bank Ltd. | 0.209% | 1/27/14 | 1,319,000 | 1,319,000 |
| 4 National Australia Bank Ltd. | 0.214% | 2/19/14 | 41,000 | 41,000 |
| 4 National Australia Bank Ltd. | 0.213% | 2/28/14 | 37,000 | 37,000 |
| | | | | 8,669,000 |
| Yankee Certificates of Deposit (8.7%) | | | | |
| 4 Australia & New Zealand Banking Group, Ltd. | | | | |
| (New York Branch) | 0.176% | 12/5/13 | 50,000 | 50,000 |
| 4 Australia & New Zealand Banking Group, Ltd. | | | | |
| (New York Branch) | 0.177% | 1/2/14 | 114,000 | 114,000 |
| Australia & New Zealand Banking Group, Ltd. | | | | |
| (New York Branch) | 0.200% | 1/10/14 | 54,500 | 54,504 |
| Australia & New Zealand Banking Group, Ltd. | | | | |
| (New York Branch) | 0.190% | 2/20/14 | 248,000 | 247,994 |
| Bank of Montreal (Chicago Branch) | 0.180% | 9/13/13 | 590,000 | 590,000 |
| Bank of Montreal (Chicago Branch) | 0.180% | 9/16/13 | 590,000 | 590,000 |
| Bank of Montreal (Chicago Branch) | 0.200% | 10/16/13 | 491,000 | 491,000 |
| Bank of Montreal (Chicago Branch) | 0.150% | 10/22/13 | 465,000 | 465,000 |
| Bank of Montreal (Chicago Branch) | 0.150% | 10/24/13 | 392,000 | 392,000 |
22
Prime Money Market Fund
| | | | |
| | | | Face | Market |
| | | Maturity | Amount | Value |
| | Yield1 | Date | ($000) | ($000) |
| Bank of Montreal (Chicago Branch) | 0.180% | 11/8/13 | 21,000 | 21,000 |
| Bank of Montreal (Chicago Branch) | 0.170% | 12/2/13 | 33,000 | 33,000 |
| Bank of Nova Scotia (Houston Branch) | 0.150% | 9/3/13 | 115,000 | 115,000 |
| Bank of Nova Scotia (Houston Branch) | 0.150% | 9/6/13 | 43,000 | 43,000 |
| Bank of Nova Scotia (Houston Branch) | 0.170% | 9/24/13 | 45,000 | 45,000 |
| Bank of Nova Scotia (Houston Branch) | 0.160% | 10/16/13 | 570,000 | 569,997 |
| Bank of Nova Scotia (Houston Branch) | 0.150% | 10/18/13 | 248,000 | 248,000 |
| Bank of Nova Scotia (Houston Branch) | 0.140% | 10/23/13 | 470,000 | 469,997 |
| Bank of Nova Scotia (Houston Branch) | 0.140% | 11/6/13 | 600,000 | 599,995 |
| Bank of Nova Scotia (Houston Branch) | 0.150% | 11/12/13 | 460,000 | 459,995 |
| Bank of Nova Scotia (Houston Branch) | 0.160% | 12/2/13 | 142,000 | 141,998 |
| Canadian Imperial Bank of Commerce | | | | |
| (New York Branch) | 0.100% | 10/15/13 | 300,000 | 300,000 |
| Canadian Imperial Bank of Commerce | | | | |
| (New York Branch) | 0.080% | 11/26/13 | 250,000 | 250,000 |
| Canadian Imperial Bank of Commerce | | | | |
| (New York Branch) | 0.080% | 11/27/13 | 250,000 | 250,000 |
| 4 Commonwealth Bank of Australia | | | | |
| (New York Branch) | 0.186% | 9/6/13 | 127,000 | 127,000 |
| 4 Commonwealth Bank of Australia | | | | |
| (New York Branch) | 0.184% | 11/18/13 | 111,000 | 111,000 |
| 4 Toronto Dominion Bank (New York Branch) | 0.186% | 9/4/13 | 218,000 | 218,000 |
| 4 Toronto Dominion Bank (New York Branch) | 0.185% | 9/16/13 | 175,000 | 175,000 |
| 4 Toronto Dominion Bank (New York Branch) | 0.183% | 10/23/13 | 198,000 | 198,000 |
| 4 Toronto Dominion Bank (New York Branch) | 0.186% | 11/7/13 | 495,000 | 495,000 |
| 4 Toronto Dominion Bank (New York Branch) | 0.164% | 11/20/13 | 350,000 | 350,000 |
| Toronto Dominion Bank (New York Branch) | 0.220% | 11/22/13 | 39,500 | 39,500 |
| 4 Toronto Dominion Bank (New York Branch) | 0.164% | 11/29/13 | 196,000 | 196,000 |
| 4 Toronto Dominion Bank (New York Branch) | 0.175% | 12/13/13 | 161,000 | 161,000 |
| 4 Toronto Dominion Bank (New York Branch) | 0.234% | 12/20/13 | 172,000 | 172,021 |
| 4 Toronto Dominion Bank (New York Branch) | 0.174% | 12/23/13 | 199,000 | 199,000 |
| Toronto Dominion Bank (New York Branch) | 0.200% | 1/15/14 | 230,000 | 230,000 |
| Toronto Dominion Bank (New York Branch) | 0.220% | 2/3/14 | 400,000 | 400,000 |
| Toronto Dominion Bank (New York Branch) | 0.220% | 2/3/14 | 95,000 | 95,000 |
| Toronto Dominion Bank (New York Branch) | 0.220% | 2/5/14 | 185,000 | 185,000 |
| Toronto Dominion Bank (New York Branch) | 0.220% | 2/13/14 | 175,000 | 175,000 |
| Toronto Dominion Bank (New York Branch) | 0.220% | 2/18/14 | 541,000 | 541,000 |
| Westpac Banking Corp. (New York Branch) | 0.190% | 9/30/13 | 50,000 | 50,000 |
| 4 Westpac Banking Corp. (New York Branch) | 0.184% | 10/24/13 | 73,000 | 73,000 |
| 4 Westpac Banking Corp. (New York Branch) | 0.186% | 11/4/13 | 360,000 | 360,000 |
| 4 Westpac Banking Corp. (New York Branch) | 0.182% | 12/30/13 | 106,000 | 106,000 |
| 4 Westpac Banking Corp. (New York Branch) | 0.184% | 12/30/13 | 50,000 | 50,000 |
| | | | | 11,248,001 |
| Total Certificates of Deposit (Cost $25,099,512) | | | | 25,099,512 |
| Repurchase Agreements (0.1%) | | | | |
| Bank of Nova Scotia | | | | |
| (Dated 8/30/13, Repurchase Value $20,000,000, | | | | |
| collateralized by U.S. Treasury Note/Bond | | | | |
| 2.000%, 1/15/14; with a value of $20,400,000) | 0.040% | 9/3/13 | 20,000 | 20,000 |
| RBC Capital Markets LLC | | | | |
| (Dated 8/30/13, Repurchase Value $40,091,000, | | | | |
| collateralized by U.S. Treasury Note/Bond | | | | |
| 2.000%, 2/15/22; with a value of $40,893,000) | 0.030% | 9/3/13 | 40,091 | 40,091 |
23
Prime Money Market Fund
| | | | |
| | | | Face | Market |
| | | Maturity | Amount | Value |
| | Yield1 | Date | ($000) | ($000) |
| TD Securities (USA) LLC | | | | |
| (Dated 8/30/13, Repurchase Value $12,000,000, | | | | |
| collateralized by U.S. Treasury Note/Bond | | | | |
| 0.625%, 8/15/16, and U.S. Treasury Bill | | | | |
| 0.000%, 12/26/13; with a value of $12,240,000) | 0.030% | 9/3/13 | 12,000 | 12,000 |
| Total Repurchase Agreements (Cost $72,091) | | | | 72,091 |
| |
| | | | Shares | |
| Money Market Fund (1.3%) | | | | |
| 6 Vanguard Municipal Cash Management Fund | | | | |
| (Cost $1,678,903) | 0.079% | | 1,678,903,000 | 1,678,903 |
| |
| | | | Face | |
| | | | Amount | |
| | | | ($000) | |
| Tax-Exempt Municipal Bonds (1.5%) | | | | |
| 7 Apache County AZ Industrial Development | | | | |
| Authority Pollution Control Revenue | | | | |
| (Tucson Electric Power Co. Project) VRDO | 0.080% | 9/6/13 | 37,000 | 37,000 |
| 7 Arizona Health Facilities Authority Revenue | | | | |
| (Banner Health) VRDO | 0.080% | 9/6/13 | 35,000 | 35,000 |
| 7 Ascension Parish LA Industrial Development | | | | |
| Board Revenue (IMTT-Geismar Project) VRDO | 0.060% | 9/6/13 | 79,000 | 79,000 |
| 7 Burlington KS Environmental Improvement | | | | |
| Revenue (Kansas City Power & Light Co. | | | | |
| Project) VRDO | 0.070% | 9/6/13 | 29,000 | 29,000 |
| 7 Burlington KS Environmental Improvement | | | | |
| Revenue (Kansas City Power & Light Co. | | | | |
| Project) VRDO | 0.070% | 9/6/13 | 42,250 | 42,250 |
| 7 California Educational Facilities Authority | | | | |
| Revenue (University of San Francisco) VRDO | 0.060% | 9/6/13 | 8,800 | 8,800 |
| 7 California Educational Facilities Authority | | | | |
| Revenue (University of San Francisco) VRDO | 0.060% | 9/6/13 | 13,375 | 13,375 |
| 7 California Housing Finance Agency Multifamily | | | | |
| Housing Revenue VRDO | 0.050% | 9/6/13 | 20,180 | 20,180 |
| 7 California Statewide Communities Development | | | | |
| Authority Multifamily Housing Revenue | | | | |
| (Wilshire Court Project) VRDO | 0.050% | 9/6/13 | 11,900 | 11,900 |
| 7 Clackamas County OR Hospital Facility Authority | | | | |
| Revenue (Legacy Health System) VRDO | 0.050% | 9/6/13 | 9,700 | 9,700 |
| 7 Clark County NV Airport System Revenue VRDO | 0.070% | 9/6/13 | 12,200 | 12,200 |
| 7 Clark County NV Industrial Development | | | | |
| Revenue (Southwest Gas Corp. Project) VRDO | 0.080% | 9/6/13 | 14,300 | 14,300 |
| 7 Cleveland-Cuyahoga County OH Port Authority | | | | |
| Revenue (SPC Buildings 1 & 3 LLC) VRDO | 0.070% | 9/6/13 | 16,970 | 16,970 |
| 7 Colorado Health Facilities Authority Revenue | | | | |
| (Evangelical Lutheran Good Samaritan | | | | |
| Society Project) VRDO | 0.050% | 9/6/13 | 10,000 | 10,000 |
| 7 Columbus OH Regional Airport Authority Airport | | | | |
| Revenue (Oasbo Expanded Asset Program) | | | | |
| VRDO | 0.060% | 9/6/13 | 16,700 | 16,700 |
| 7 Contra Costa County CA Multifamily Housing | | | | |
| Revenue (Park Regency) VRDO | 0.040% | 9/6/13 | 46,700 | 46,700 |
24
Prime Money Market Fund
| | | | |
| | | | Face | Market |
| | | Maturity | Amount | Value |
| | Yield1 | Date | ($000) | ($000) |
| Curators of the University of Missouri System | | | | |
| Facilities Revenue VRDO | 0.050% | 9/6/13 | 61,940 | 61,940 |
| 7 District of Columbia Revenue | | | | |
| (World Wildlife Fund Inc.) VRDO | 0.080% | 9/6/13 | 19,500 | 19,500 |
| 7 Geneva NY Industrial Development Agency | | | | |
| Civic Facility Revenue (Colleges of the Seneca | | | | |
| Project) VRDO | 0.080% | 9/6/13 | 12,325 | 12,325 |
| 7 Glendale AZ Industrial Development Authority | | | | |
| Revenue (Midwestern University) VRDO | 0.080% | 9/6/13 | 33,975 | 33,975 |
| 7 Greenville County SC Hospital System Revenue | | | | |
| VRDO | 0.050% | 9/6/13 | 13,000 | 13,000 |
| 7 Gwinnett County GA Development Authority | | | | |
| Revenue (Nilhan Hospitality LLC) VRDO | 0.050% | 9/6/13 | 11,400 | 11,400 |
| 7 Hanover County VA Economic Development | | | | |
| Authority Revenue (Bon Secours Health | | | | |
| System Inc.) VRDO | 0.060% | 9/6/13 | 11,955 | 11,955 |
| 7 Idaho Housing & Finance Association | | | | |
| Single Family Mortgage Revenue VRDO | 0.070% | 9/6/13 | 18,200 | 18,200 |
| 7 Illinois Finance Authority Revenue | | | | |
| (Carle Foundation) VRDO | 0.060% | 9/6/13 | 18,225 | 18,225 |
| 7 Illinois Finance Authority Revenue (Little Co. of | | | | |
| Mary Hospital & Health Care Centers) VRDO | 0.070% | 9/6/13 | 15,620 | 15,620 |
| 7 Illinois Finance Authority Revenue (Northwest | | | | |
| Community Hospital) VRDO | 0.060% | 9/6/13 | 27,415 | 27,415 |
| 7 Illinois Finance Authority Revenue (Southern | | | | |
| Illinois Healthcare Enterprises Inc.) VRDO | 0.080% | 9/6/13 | 39,000 | 39,000 |
| 7 Johnson City TN Health & Educational Facilities | | | | |
| Board Hospital Revenue (STS Health Alliance) | | | | |
| VRDO | 0.050% | 9/6/13 | 32,140 | 32,140 |
| 7 Lee Memorial Health System Florida Hospital | | | | |
| Revenue VRDO | 0.060% | 9/6/13 | 6,425 | 6,425 |
| 7 Louisiana Public Facilities Authority Hospital | | | | |
| Revenue (Franciscan Missionaries | | | | |
| of Our Lady Health System Project) VRDO | 0.060% | 9/6/13 | 13,900 | 13,900 |
| 7 Maine Health & Higher Educational Facilities | | | | |
| Authority Revenue (Bowdoin College) VRDO | 0.060% | 9/6/13 | 14,600 | 14,600 |
| 7 Maine Health & Higher Educational Facilities | | | | |
| Authority Revenue VRDO | 0.070% | 9/6/13 | 55,430 | 55,430 |
| 7 Massachusetts Development Finance Agency | | | | |
| Revenue (Wentworth Institute of Technology) | | | | |
| VRDO | 0.070% | 9/6/13 | 4,000 | 4,000 |
| 7 Massachusetts Health & Educational Facilities | | | | |
| Authority Revenue (Baystate Medical Center) | | | | |
| VRDO | 0.050% | 9/6/13 | 11,000 | 11,000 |
| Massachusetts Health & Educational Facilities | | | | |
| Authority Revenue (MIT) VRDO | 0.050% | 9/6/13 | 19,320 | 19,320 |
| Missouri Health & Educational Facilities | | | | |
| Authority Health Facilities Revenue | | | | |
| (BJC Health System) VRDO | 0.060% | 9/6/13 | 18,000 | 18,000 |
| 7 Missouri Health & Educational Facilities | | | | |
| Authority Health Facilities Revenue | | | | |
| (SSM Health System) VRDO | 0.070% | 9/6/13 | 77,535 | 77,535 |
| 7 New York City NY Housing Development Corp. | | | | |
| Multi-Family Rental Housing Revenue | | | | |
| (One Columbus Place Development) VRDO | 0.060% | 9/6/13 | 68,100 | 68,100 |
25
Prime Money Market Fund
| | | | |
| | | | Face | Market |
| | | Maturity | Amount | Value |
| | Yield1 | Date | ($000) | ($000) |
| 7 New York City NY Housing Development Corp. | | | | |
| Multi-Family Rental Housing Revenue | | | | |
| (Related-Sierra Development) VRDO | 0.060% | 9/6/13 | 32,500 | 32,500 |
| 7 New York City NY Housing Development Corp. | | | | |
| Multi-Family Rental Housing Revenue | | | | |
| (West End Towers) VRDO | 0.060% | 9/6/13 | 31,300 | 31,300 |
| 7 New York State Housing Finance Agency Housing | | | | |
| Revenue (125 West 31st Street) VRDO | 0.080% | 9/6/13 | 42,300 | 42,300 |
| 7 New York State Housing Finance Agency Housing | | | | |
| Revenue (20 River Terrace Housing) VRDO | 0.080% | 9/6/13 | 17,300 | 17,300 |
| 7 New York State Housing Finance Agency Housing | | | | |
| Revenue (70 Battery Place) VRDO | 0.060% | 9/6/13 | 12,800 | 12,800 |
| 7 New York State Housing Finance Agency Housing | | | | |
| Revenue (Clinton Green North) VRDO | 0.080% | 9/6/13 | 31,845 | 31,845 |
| 7 New York State Housing Finance Agency Housing | | | | |
| Revenue (Clinton Green South) VRDO | 0.080% | 9/6/13 | 11,625 | 11,625 |
| 7 New York State Housing Finance Agency Housing | | | | |
| Revenue (East 84th Street) VRDO | 0.060% | 9/6/13 | 24,500 | 24,500 |
| 7 New York State Housing Finance Agency Housing | | | | |
| Revenue (West 17th Street) VRDO | 0.060% | 9/6/13 | 11,710 | 11,710 |
| 7 North Carolina Medical Care Commission Health | | | | |
| Systems Revenue (Catholic Health East) VRDO | 0.070% | 9/6/13 | 6,910 | 6,910 |
| 7 Oakland University of Michigan Revenue VRDO | 0.090% | 9/6/13 | 16,120 | 16,120 |
| Ohio State University General Receipts Revenue | | | | |
| VRDO | 0.060% | 9/6/13 | 6,200 | 6,200 |
| 7 Piedmont SC Municipal Power Agency Revenue | | | | |
| VRDO | 0.060% | 9/6/13 | 16,000 | 16,000 |
| Posey County IN Economic Development | | | | |
| Revenue (Midwest Fertilizer Corp. Project) PUT | 0.750% | 10/17/13 | 306,500 | 306,500 |
| 7 Raleigh Durham NC Airport Authority Revenue | | | | |
| VRDO | 0.060% | 9/6/13 | 8,000 | 8,000 |
| 7 Rhode Island Health & Educational Building Corp. | | | | |
| Higher Education Facility Revenue | | | | |
| (Rogers Williams University) VRDO | 0.060% | 9/6/13 | 7,275 | 7,275 |
| 7 Salem OR Hospital Facility Authority Revenue | | | | |
| (Salem Hospital Project) VRDO | 0.060% | 9/6/13 | 16,500 | 16,500 |
| 7 San Francisco CA City & County | | | | |
| International Airport Revenue VRDO | 0.060% | 9/6/13 | 33,000 | 33,000 |
| 7 St. Charles County MO Public Water Supply | | | | |
| District No.2 Revenue VRDO | 0.060% | 9/6/13 | 13,000 | 13,000 |
| 7 St. Cloud MN Health Care Revenue | | | | |
| (Centracare Health System) VRDO | 0.060% | 9/6/13 | 21,995 | 21,995 |
| 7 Sunshine State Governmental Financing | | | | |
| Commission Florida Revenue | | | | |
| (Miami Dade County Program) VRDO | 0.070% | 9/6/13 | 13,800 | 13,800 |
| Texas Department of Housing & Community | | | | |
| Affairs Single Family Revenue VRDO | 0.070% | 9/6/13 | 42,400 | 42,400 |
| Texas Department of Housing & Community | | | | |
| Affairs Single Family Revenue VRDO | 0.070% | 9/6/13 | 34,620 | 34,620 |
| Texas Department of Housing & Community | | | | |
| Affairs Single Family Revenue VRDO | 0.070% | 9/6/13 | 28,900 | 28,900 |
| Texas Department of Housing & Community | | | | |
| Affairs Single Family Revenue VRDO | 0.090% | 9/6/13 | 16,445 | 16,445 |
| Texas Department of Housing & Community | | | | |
| Affairs Single Mortgage Revenue VRDO | 0.090% | 9/6/13 | 51,990 | 51,990 |
26
Prime Money Market Fund
| | | | | |
| | | | | Face | Market |
| | | | Maturity | Amount | Value |
| | | Yield1 | Date | ($000) | ($000) |
| 7 | University of Colorado Hospital Authority | | | | |
| | Revenue VRDO | 0.070% | 9/6/13 | 21,010 | 21,010 |
| 7 | West Virginia Hospital Finance Authority Hospital | | | | |
| | Revenue (Charleston Area Medical Center Inc.) | | | | |
| | VRDO | 0.070% | 9/6/13 | 29,555 | 29,555 |
| 7 | Wisconsin Health & Educational Facilities | | | | |
| | Authority Revenue (Gundersen Lutheran) VRDO | 0.080% | 9/6/13 | 11,000 | 11,000 |
| 7 | Wisconsin Health & Educational Facilities | | | | |
| | Authority Revenue (University of Wisconsin | | | | |
| | Medical Foundation) VRDO | 0.070% | 9/6/13 | 20,855 | 20,855 |
| 7 | Wyoming Student Loan Corp. Student | | | | |
| | Loan Revenue VRDO | 0.060% | 9/6/13 | 31,180 | 31,180 |
| Total Tax-Exempt Municipal Bonds (Cost $1,975,215) | | | 1,975,215 |
| Corporate Bonds (0.2%) | | | | |
| Finance (0.2%) | | | | |
| 4 | Royal Bank of Canada (New York Branch) | 0.475% | 9/3/13 | 21,500 | 21,500 |
| 4 | Canadian Imperial Bank of Commerce | | | | |
| | (New York Branch) | 0.716% | 10/31/13 | 80,000 | 80,076 |
| | General Electric Capital Corp. | 1.875% | 9/16/13 | 54,500 | 54,536 |
| 4,8 | Westpac Banking Corp. | 0.973% | 9/24/13 | 39,000 | 39,019 |
| Total Corporate Bonds (Cost $195,131) | | | | 195,131 |
| Sovereign Bonds (U.S. Dollar-Denominated) (0.0%) | | | | |
| | Province of Ontario (Cost $10,507) | 1.375% | 1/27/14 | 10,460 | 10,507 |
| Taxable Municipal Bonds (0.3%) | | | | |
| 7,8 | BlackRock Municipal Bond Trust TOB VRDO | 0.090% | 9/3/13 | 18,105 | 18,105 |
| 7,8 | BlackRock Municipal Income Investment | | | | |
| | Quality Trust TOB VRDO | 0.090% | 9/3/13 | 9,660 | 9,660 |
| 7,8 | BlackRock Municipal Income Trust TOB VRDO | 0.090% | 9/3/13 | 207,000 | 207,000 |
| 7,8 | BlackRock MuniHoldings Fund II, Inc. TOB VRDO | 0.090% | 9/3/13 | 21,850 | 21,850 |
| 7,8 | BlackRock MuniHoldings Fund, Inc. TOB VRDO | 0.090% | 9/3/13 | 19,165 | 19,165 |
| 7,8 | BlackRock MuniHoldings Quality Fund II, Inc. | | | | |
| | TOB VRDO | 0.090% | 9/3/13 | 100,000 | 100,000 |
| 7,8 | BlackRock MuniHoldings Quality Fund II, Inc. | | | | |
| | TOB VRDO | 0.090% | 9/3/13 | 19,875 | 19,875 |
| 7,8 | BlackRock MuniYield Investment Quality Fund | | | | |
| | TOB VRDO | 0.090% | 9/3/13 | 12,910 | 12,910 |
| 7,8 | BlackRock Strategic Municipal Trust TOB VRDO | 0.090% | 9/3/13 | 9,820 | 9,820 |
| 7,8 | Los Angeles CA Department of Water & Power | | | | |
| | Revenue TOB VRDO | 0.220% | 9/6/13 | 13,000 | 13,000 |
| 8 | Massachusetts Transportation Fund Revenue | | | | |
| | TOB VRDO | 0.220% | 9/6/13 | 13,100 | 13,100 |
| 8 | Seattle WA Municipal Light & Power Revenue | | | | |
| | TOB VRDO | 0.220% | 9/6/13 | 6,400 | 6,400 |
| Total Taxable Municipal Bonds (Cost $450,885) | | | | 450,885 |
| Total Investments (101.5%) (Cost $131,090,606) | | | | 131,090,606 |
| Other Assets and Liabilities (-1.5%) | | | | |
| Other Assets | | | | 920,873 |
| Liabilities | | | | (2,837,279) |
| | | | | | (1,916,406) |
| Net Assets (100%) | | | | 129,174,200 |
27
Prime Money Market Fund
| |
| At August 31, 2013, net assets consisted of: | |
| | Amount |
| | ($000) |
| Paid-in Capital | 129,162,809 |
| Undistributed Net Investment Income | — |
| Accumulated Net Realized Gains | 11,391 |
| Net Assets | 129,174,200 |
| |
| Investor Shares—Net Assets | |
| Applicable to 102,140,983,453 outstanding $.001 par value shares of | |
| beneficial interest (unlimited authorization) | 102,159,532 |
| Net Asset Value Per Share—Investor Shares | $1.00 |
| |
| Institutional Shares—Net Assets | |
| Applicable to 27,011,262,291 outstanding $.001 par value shares of | |
| beneficial interest (unlimited authorization) | 27,014,668 |
| Net Asset Value Per Share—Institutional Shares | $1.00 |
See Note A in Notes to Financial Statements.
1 Represents annualized yield at date of purchase for discount securities, and coupon for coupon-bearing securities.
2 The issuer was placed under federal conservatorship in September 2008; since that time, its daily operations have been managed by the Federal Housing Finance Agency and it receives capital from the U.S. Treasury, as needed to maintain a positive net worth, in exchange for senior preferred stock.
3 The issuer operates under a congressional charter; its securities are generally neither guaranteed by the U.S. Treasury nor backed by the full faith and credit of the U.S. government.
4 Adjustable-rate security.
5 Security exempt from registration under Section 4(2) of the Securities Act of 1933. Such securities may be sold in transactions exempt from registration only to dealers in that program or other “accredited investors.” At August 31, 2013, the aggregate value of these securities was $20,609,460,000, representing 16.0% of net assets.
6 Affiliated money market fund available only to Vanguard funds and certain trusts and accounts managed by Vanguard. Rate shown is the 7-day yield.
7 Scheduled principal and interest payments are guaranteed by bank letter of credit.
8 Security exempt from registration under Rule 144A of the Securities Act of 1933. Such securities may be sold in transactions exempt from registration, normally to qualified institutional buyers. At August 31, 2013, the aggregate value of these securities was $3,180,088,000, representing 2.5% of net assets.
PUT—Put Option Obligation.
TOB—Tender Option Bond.
VRDO—Variable Rate Demand Obligation.
See accompanying Notes, which are an integral part of the Financial Statements.
28
Prime Money Market Fund
| |
| Statement of Operations | |
| |
| | Year Ended |
| | August 31, 2013 |
| | ($000) |
| Investment Income | |
| Income | |
| Interest1 | 209,533 |
| Total Income | 209,533 |
| Expenses | |
| The Vanguard Group—Note B | |
| Investment Advisory Services | 3,308 |
| Management and Administrative—Investor Shares | 127,981 |
| Management and Administrative—Institutional Shares | 17,697 |
| Marketing and Distribution—Investor Shares | 24,956 |
| Marketing and Distribution—Institutional Shares | 6,735 |
| Custodian Fees | 1,515 |
| Auditing Fees | 29 |
| Shareholders’ Reports—Investor Shares | 750 |
| Shareholders’ Reports—Institutional Shares | 151 |
| Trustees’ Fees and Expenses | 165 |
| Total Expenses | 183,287 |
| Expense Reduction—Note B | (10,254) |
| Net Expenses | 173,033 |
| Net Investment Income | 36,500 |
| Realized Net Gain (Loss) on Investment Securities Sold | 1,603 |
| Net Increase (Decrease) in Net Assets Resulting from Operations | 38,103 |
| 1 Interest income from an affiliated company of the fund was $2,099,000. | |
See accompanying Notes, which are an integral part of the Financial Statements.
29
Prime Money Market Fund
| | |
| Statement of Changes in Net Assets | | |
| |
| | Year Ended August 31, |
| | 2013 | 2012 |
| | ($000) | ($000) |
| Increase (Decrease) in Net Assets | | |
| Operations | | |
| Net Investment Income | 36,500 | 57,450 |
| Realized Net Gain (Loss) | 1,603 | 1,405 |
| Net Increase (Decrease) in Net Assets Resulting from Operations | 38,103 | 58,855 |
| Distributions | | |
| Net Investment Income | | |
| Investor Shares | (17,736) | (32,517) |
| Institutional Shares | (18,764) | (24,933) |
| Realized Capital Gain | | |
| Investor Shares | — | — |
| Institutional Shares | — | — |
| Total Distributions | (36,500) | (57,450) |
| Capital Share Transactions | | |
| Investor Shares | 11,946,615 | (2,193,142) |
| Institutional Shares | 2,471,452 | 2,803,343 |
| Net Increase (Decrease) from Capital Share Transactions | 14,418,067 | 610,201 |
| Total Increase (Decrease) | 14,419,670 | 611,606 |
| Net Assets | | |
| Beginning of Period | 114,754,530 | 114,142,924 |
| End of Period | 129,174,200 | 114,754,530 |
See accompanying Notes, which are an integral part of the Financial Statements.
30
Prime Money Market Fund
Financial Highlights
| | | | | |
| Investor Shares | | | | | |
| |
| For a Share Outstanding | | | | Year Ended August 31, |
| Throughout Each Period | 2013 | 2012 | 2011 | 2010 | 2009 |
| Net Asset Value, Beginning of Period | $1.00 | $1.00 | $1.00 | $1.00 | $1.00 |
| Investment Operations | | | | | |
| Net Investment Income | . 0002 | . 0004 | .001 | .001 | .013 |
| Net Realized and Unrealized Gain (Loss) | | | | | |
| on Investments | — | — | — | — | — |
| Total from Investment Operations | . 0002 | . 0004 | .001 | .001 | .013 |
| Distributions | | | | | |
| Dividends from Net Investment Income | (. 0002) | (. 0004) | (. 001) | (. 001) | (. 013) |
| Distributions from Realized Capital Gains | — | — | — | — | — |
| Total Distributions | (. 0002) | (. 0004) | (. 001) | (. 001) | (. 013) |
| Net Asset Value, End of Period | $1.00 | $1.00 | $1.00 | $1.00 | $1.00 |
| |
| Total Return1 | 0.02% | 0.04% | 0.06% | 0.08% | 1.31% |
| |
| Ratios/Supplemental Data | | | | | |
| Net Assets, End of Period (Millions) | $102,160 | $90,212 | $92,404 | $88,684 | $96,078 |
| Ratio of Expenses to Average Net Assets | 0.16%2 | 0.16% | 0.20% | 0.23% | 0.28%3 |
| Ratio of Net Investment Income to | | | | | |
| Average Net Assets | 0.02% | 0.04% | 0.06% | 0.08% | 1.25% |
1 Total returns do not include account service fees that may have applied in the periods shown. Fund prospectuses provide information about any applicable account service fees.
2 The ratio of total expenses to average net assets before an expense reduction was 0.17%. See Note B in the Notes to Financial Statements.
3 Includes 0.03% of fees to participate in the Treasury Guarantee Program for Money Market Funds.
See accompanying Notes, which are an integral part of the Financial Statements.
31
Prime Money Market Fund
Financial Highlights
| | | | | |
| Institutional Shares | | | | | |
| |
| For a Share Outstanding | | | Year Ended August 31, |
| Throughout Each Period | 2013 | 2012 | 2011 | 2010 | 2009 |
| Net Asset Value, Beginning of Period | $1.00 | $1.00 | $1.00 | $1.00 | $1.00 |
| Investment Operations | | | | | |
| Net Investment Income | . 001 | . 001 | . 002 | . 002 | . 015 |
| Net Realized and Unrealized Gain (Loss) | | | | | |
| on Investments | — | — | — | — | — |
| Total from Investment Operations | . 001 | . 001 | . 002 | . 002 | . 015 |
| Distributions | | | | | |
| Dividends from Net Investment Income | (. 001) | (. 001) | (. 002) | (. 002) | (. 015) |
| Distributions from Realized Capital Gains | — | — | — | — | — |
| Total Distributions | (. 001) | (. 001) | (. 002) | (. 002) | (. 015) |
| Net Asset Value, End of Period | $1.00 | $1.00 | $1.00 | $1.00 | $1.00 |
| |
| Total Return | 0.07% | 0.11% | 0.17% | 0.22% | 1.47% |
| |
| Ratios/Supplemental Data | | | | | |
| Net Assets, End of Period (Millions) | $27,015 | $24,543 | $21,739 | $19,107 | $18,323 |
| Ratio of Expenses to Average Net Assets | 0.10% | 0.09% | 0.09% | 0.09% | 0.13%1 |
| Ratio of Net Investment Income to | | | | | |
| Average Net Assets | 0.07% | 0.11% | 0.17% | 0.22% | 1.40% |
| 1 Includes 0.03% of fees to participate in the Treasury Guarantee Program for Money Market Funds. |
See accompanying Notes, which are an integral part of the Financial Statements.
32
Prime Money Market Fund
Notes to Financial Statements
Vanguard Prime Money Market Fund is registered under the Investment Company Act of 1940 as an open-end investment company, or mutual fund. The fund invests in short-term debt instruments of companies primarily operating in specific industries, particularly financial services; the issuers’ abilities to meet their obligations may be affected by economic developments in such industries. The fund offers two classes of shares, Investor Shares and Institutional Shares. Investor Shares are available to any investor who meets the fund’s minimum purchase requirements. Institutional Shares are designed for institutional investors who meet certain administrative, service, and account-size criteria.
A. The following significant accounting policies conform to generally accepted accounting principles for U.S. mutual funds. The fund consistently follows such policies in preparing its financial statements.
1. Security Valuation: Securities are valued at amortized cost, which approximates market value. Investments in Vanguard Municipal Cash Management Fund are valued at that fund’s net asset value.
2. Repurchase Agreements: The fund may enter into repurchase agreements with institutional counterparties. Securities pledged as collateral to the fund under repurchase agreements are held by a custodian bank until the agreements mature. Each agreement requires that the market value of the collateral be sufficient to cover payments of interest and principal. The fund further mitigates its counterparty risk by entering into repurchase agreements only with a diverse group of pre-qualified counterparties, monitoring their financial strength, and entering into master repurchase agreements with its counterparties. The master repurchase agreements provide that, in the event of a counter-party’s default (including bankruptcy), the fund may terminate any repurchase agreements with that counterparty, determine the net amount owed, and sell or retain the collateral up to the net amount owed to the fund. Such action may be subject to legal proceedings, which may delay or limit the disposition of collateral.
3. Federal Income Taxes: The fund intends to continue to qualify as a regulated investment company and distribute all of its taxable income. Management has analyzed the fund’s tax positions taken for all open federal income tax years (August 31, 2010–2013), and has concluded that no provision for federal income tax is required in the fund’s financial statements.
4. Distributions: Distributions from net investment income are declared daily and paid on the first business day of the following month.
5. Other: Interest income includes income distributions received from Vanguard Municipal Cash Management Fund and is accrued daily. Premiums and discounts on debt securities purchased are amortized and accreted, respectively, to interest income over the lives of the respective securities. Security transactions are accounted for on the date securities are bought or sold. Costs used to determine realized gains (losses) on the sale of investment securities are those of the specific securities sold.
Each class of shares has equal rights as to assets and earnings, except that each class separately bears certain class-specific expenses related to maintenance of shareholder accounts (included in Management and Administrative expenses) and shareholder reporting. Marketing and distribution expenses are allocated to each class of shares based on a method approved by the board of trustees. Income, other non-class-specific expenses, and gains and losses on investments are allocated to each class of shares based on its relative net assets.
B. The Vanguard Group furnishes at cost investment advisory, corporate management, administrative, marketing, and distribution services. The costs of such services are allocated to the fund under methods approved by the board of trustees. The fund has committed to provide up to 0.40% of its net assets in capital contributions to Vanguard. At August 31, 2013, the fund had contributed capital of
33
Prime Money Market Fund
$15,213,000 to Vanguard (included in Other Assets), representing 0.01% of the fund’s net assets and 6.08% of Vanguard’s capitalization. The fund’s trustees and officers are also directors and officers of Vanguard. Vanguard and the board of trustees have agreed to temporarily limit certain net operating expenses in excess of the fund’s daily yield so as to maintain a zero or positive yield for the fund. Vanguard and the board of trustees may terminate the temporary expense limitation at any time. For the year ended August 31, 2013, Vanguard’s expenses were reduced by $10,254,000 (an effective annual rate of 0.01% of the fund’s average net assets).
C. Various inputs may be used to determine the value of the fund’s investments. These inputs are summarized in three broad levels for financial statement purposes. The inputs or methodologies used to value securities are not necessarily an indication of the risk associated with investing in those securities.
Level 1—Quoted prices in active markets for identical securities.
Level 2—Other significant observable inputs (including quoted prices for similar securities, interest rates, prepayment speeds, credit risk, etc.).
Level 3—Significant unobservable inputs (including the fund’s own assumptions used to determine the fair value of investments).
The fund’s investment in Vanguard Municipal Cash Management Fund is valued based on Level 1 inputs. All of the fund’s other investments were valued using amortized cost, in accordance with rules under the Investment Company Act of 1940. Amortized cost approximates the current fair value of a security, but since the value is not obtained from a quoted price in an active market, securities valued at amortized cost are considered to be valued using Level 2 inputs.
D. Capital share transactions for each class of shares were:
| | | | |
| | | | Year Ended August 31, |
| | | 2013 | | 2012 |
| | Amount | Shares | Amount | Shares |
| | ($000) | (000) | ($000) | (000) |
| Investor Shares | | | | |
| Issued | 133,084,052 | 133,084,052 | 103,443,975 | 103,443,975 |
| Issued in Lieu of Cash Distributions | 17,373 | 17,373 | 31,844 | 31,844 |
| Redeemed | (121,154,810) | (121,154,810) | (105,668,961) | (105,668,961) |
| Net Increase (Decrease)—Investor Shares | 11,946,615 | 11,946,615 | (2,193,142) | (2,193,142) |
| Institutional Shares | | | | |
| Issued | 17,154,977 | 17,154,977 | 18,703,639 | 18,703,639 |
| Issued in Lieu of Cash Distributions | 18,370 | 18,370 | 24,338 | 24,338 |
| Redeemed | (14,701,895) | (14,701,895) | (15,924,634) | (15,924,634) |
| Net Increase (Decrease)—Institutional Shares | 2,471,452 | 2,471,452 | 2,803,343 | 2,803,343 |
E. Management has determined that no material events or transactions occurred subsequent to August 31, 2013, that would require recognition in these financial statements. The fund distributed $11,224,000 ($0.000086 per share) of short-term capital gains to shareholders of record on September 20, 2013.
34
Federal Money Market Fund
Fund Profile
As of August 31, 2013
| |
| Financial Attributes | |
| Ticker Symbol | VMFXX |
| Expense Ratio1 | 0.16% |
| 7-Day SEC Yield | 0.02% |
| Average Weighted | |
| Maturity | 56 days |
| |
| Sector Diversification (% of portfolio) | |
| Repurchase Agreements | 0.1% |
| U.S. Government Agency Obligations | 99.0 |
| U.S. Treasury Bills | 0.9 |
The agency and mortgage-backed securities sectors may include issues from government-sponsored enterprises; such issues are generally not backed by the full faith and credit of the U.S. government.
| |
| Distribution by Credit Quality (% of portfolio) |
| First Tier | 100.0% |
For information about these ratings, see the Glossary entry for Credit Quality.
1 The expense ratio shown is from the prospectus dated December 28, 2012, and represents estimated costs for the current fiscal year. For the fiscal year ended August 31, 2013, the expense ratio was 0.13%, reflecting a temporary reduction in operating expenses (described in Note B of the Notes to Financial Statements). Before this reduction, the expense ratio was 0.14%.
35
Federal Money Market Fund
Performance Summary
Investment returns will fluctuate. All of the returns in this report represent past performance, which is not a guarantee of future results that may be achieved by the fund. (Current performance may be lower or higher than the performance data cited. For performance data current to the most recent month-end, visit our website at vanguard.com/performance.) The returns shown do not reflect taxes that a shareholder would pay on fund distributions. An investment in a money market fund is not insured or guaranteed by the Federal Deposit Insurance Corporation or any other government agency. Although the fund seeks to preserve the value of your investment at $1 per share, it is possible to lose money by investing in the fund. The fund’s 7-day SEC yield reflects its current earnings more closely than do the average annual returns.
Cumulative Performance: August 31, 2003, Through August 31, 2013
Initial Investment of $10,000
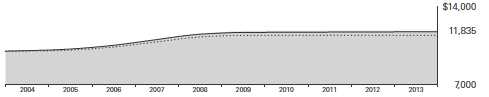
| | | | |
| | | Average Annual Total Returns | |
| | Periods Ended August 31, 2013 | |
| | | | | Final Value |
| | One | Five | Ten | of a $10,000 |
| | Year | Years | Years | Investment |
| Federal Money Market Fund | 0.01% | 0.23% | 1.70% | $11,835 |
| Government Money Market Funds | | | | |
| Average | 0.00 | 0.09 | 1.35 | 11,436 |
| Citigroup Three-Month U.S. Treasury | | | | |
| Bill Index | 0.07 | 0.17 | 1.62 | 11,739 |
Government Money Market Funds Average: Derived from data provided by Lipper, a Thomson Reuters Company.
See Financial Highlights for dividend information.
36
Federal Money Market Fund
| | |
| Fiscal-Year Total Returns (%): August 31, 2003, Through August 31, 2013 | |
| | | Gov’t Money |
| | | Market Funds |
| | | Average |
| Fiscal Year | Total Returns | Total Returns |
| 2004 | 0.82% | 0.40% |
| 2005 | 2.26 | 1.73 |
| 2006 | 4.31 | 3.78 |
| 2007 | 5.17 | 4.58 |
| 2008 | 3.46 | 2.71 |
| 2009 | 1.06 | 0.43 |
| 2010 | 0.04 | 0.00 |
| 2011 | 0.02 | 0.00 |
| 2012 | 0.01 | 0.00 |
| 2013 | 0.01 | 0.00 |
| 7-day SEC yield (8/31/2013): 0.02% | | |
| Government Money Market Funds Average: Derived from data provided by Lipper, a Thomson Reuters Company. |
Average Annual Total Returns: Periods Ended June 30, 2013
This table presents returns through the latest calendar quarter—rather than through the end of the fiscal period.
Securities and Exchange Commission rules require that we provide this information.
| | | | |
| | Inception | One | Five | Ten |
| | Date | Year | Years | Years |
| Federal Money Market Fund | 7/13/1981 | 0.01% | 0.29% | 1.71% |
37
Federal Money Market Fund
Financial Statements
Statement of Net Assets
As of August 31, 2013
The fund reports a complete list of its holdings in various monthly and quarterly regulatory filings. The fund publishes its holdings on a monthly basis at vanguard.com and files them with the Securities and Exchange Commission on Form N-MFP. The fund’s Form N-MFP filings become public 60 days after the relevant month-end, and may be viewed at sec.gov or via a link on the “Portfolio Holdings” page on vanguard.com. For the second and fourth fiscal quarters, the lists appear in the fund’s semiannual and annual reports to shareholders. For the first and third fiscal quarters, the fund files the lists with the SEC on Form N-Q. Shareholders can look up the fund’s Forms N-Q on the SEC’s website at sec. gov. Forms N-Q may also be reviewed and copied at the SEC’s Public Reference Room (see the back cover of this report for further information).
| | | | | |
| | | | | Face | Market |
| | | | Maturity | Amount | Value |
| | | Yield1 | Date | ($000) | ($000) |
| U.S. Government and Agency Obligations (98.4%) | | | |
| 2 | Fannie Mae Discount Notes | 0.070%–0.140% | 9/3/13 | 27,400 | 27,400 |
| 2 | Fannie Mae Discount Notes | 0.075%–0.110% | 9/4/13 | 48,552 | 48,552 |
| 2 | Fannie Mae Discount Notes | 0.080%–0.130% | 9/16/13 | 86,050 | 86,047 |
| 2 | Fannie Mae Discount Notes | 0.090%–0.100% | 9/18/13 | 135,000 | 134,994 |
| 2 | Fannie Mae Discount Notes | 0.130% | 9/25/13 | 1,317 | 1,317 |
| 2 | Fannie Mae Discount Notes | 0.085%–0.140% | 10/1/13 | 51,862 | 51,858 |
| 2 | Fannie Mae Discount Notes | 0.105%–0.130% | 10/2/13 | 14,000 | 13,999 |
| 2 | Fannie Mae Discount Notes | 0.130% | 10/3/13 | 4,100 | 4,099 |
| 2 | Fannie Mae Discount Notes | 0.120% | 10/9/13 | 35,000 | 34,996 |
| 2 | Fannie Mae Discount Notes | 0.125% | 10/15/13 | 8,000 | 7,999 |
| 2 | Fannie Mae Discount Notes | 0.070% | 10/21/13 | 3,100 | 3,100 |
| 2 | Fannie Mae Discount Notes | 0.080%–0.110% | 10/23/13 | 13,330 | 13,328 |
| 2 | Fannie Mae Discount Notes | 0.110%–0.150% | 11/1/13 | 10,124 | 10,122 |
| 2 | Fannie Mae Discount Notes | 0.105%–0.115% | 11/6/13 | 42,700 | 42,692 |
| 2 | Fannie Mae Discount Notes | 0.105% | 11/13/13 | 3,100 | 3,099 |
| 2 | Fannie Mae Discount Notes | 0.090% | 11/18/13 | 2,225 | 2,225 |
| 2 | Fannie Mae Discount Notes | 0.080% | 11/27/13 | 5,000 | 4,999 |
| 2 | Fannie Mae Discount Notes | 0.100% | 12/4/13 | 5,150 | 5,149 |
| 2 | Fannie Mae Discount Notes | 0.160% | 12/11/13 | 2,500 | 2,499 |
| 2 | Fannie Mae Discount Notes | 0.080% | 12/16/13 | 2,000 | 1,999 |
| 2 | Fannie Mae Discount Notes | 0.090%–0.150% | 12/18/13 | 25,592 | 25,583 |
| 2 | Fannie Mae Discount Notes | 0.143% | 12/26/13 | 30,000 | 29,986 |
| 2 | Fannie Mae Discount Notes | 0.100% | 1/2/14 | 1,000 | 1,000 |
| 2 | Fannie Mae Discount Notes | 0.090%–0.110% | 1/8/14 | 15,100 | 15,094 |
| 2 | Fannie Mae Discount Notes | 0.100% | 1/15/14 | 8,790 | 8,787 |
| 2 | Fannie Mae Discount Notes | 0.100%–0.110% | 1/27/14 | 7,200 | 7,197 |
| 2 | Fannie Mae Discount Notes | 0.110% | 2/3/14 | 1,000 | 999 |
| 2 | Fannie Mae Discount Notes | 0.110% | 2/12/14 | 12,549 | 12,543 |
| 3 | Federal Home Loan Bank Discount Notes | 0.110% | 9/3/13 | 8,000 | 8,000 |
| 3 | Federal Home Loan Bank Discount Notes | 0.070%–0.130% | 9/4/13 | 17,850 | 17,850 |
| 3 | Federal Home Loan Bank Discount Notes | 0.080%–0.093% | 9/6/13 | 35,400 | 35,400 |
| 3 | Federal Home Loan Bank Discount Notes | 0.078%–0.140% | 9/11/13 | 37,000 | 36,999 |
| 3 | Federal Home Loan Bank Discount Notes | 0.130%–0.135% | 9/13/13 | 8,700 | 8,700 |
| 3 | Federal Home Loan Bank Discount Notes | 0.090% | 9/20/13 | 2,300 | 2,300 |
| 3 | Federal Home Loan Bank Discount Notes | 0.130% | 9/23/13 | 1,400 | 1,400 |
| 3 | Federal Home Loan Bank Discount Notes | 0.135% | 9/26/13 | 1,000 | 1,000 |
38
Federal Money Market Fund
| | | | | |
| | | | | Face | Market |
| | | | Maturity | Amount | Value• |
| | | Yield1 | Date | ($000) | ($000) |
| 3 | Federal Home Loan Bank Discount Notes | 0.100%–0.140% | 10/2/13 | 27,700 | 27,697 |
| 3 | Federal Home Loan Bank Discount Notes | 0.120% | 10/4/13 | 61,100 | 61,093 |
| 3 | Federal Home Loan Bank Discount Notes | 0.120%–0.135% | 10/9/13 | 23,625 | 23,622 |
| 3 | Federal Home Loan Bank Discount Notes | 0.070% | 10/11/13 | 2,700 | 2,700 |
| 3 | Federal Home Loan Bank Discount Notes | 0.120% | 10/16/13 | 10,000 | 9,998 |
| 3 | Federal Home Loan Bank Discount Notes | 0.075%–0.120% | 10/18/13 | 108,000 | 107,988 |
| 3 | Federal Home Loan Bank Discount Notes | 0.070% | 10/23/13 | 1,000 | 1,000 |
| 3 | Federal Home Loan Bank Discount Notes | 0.103% | 10/25/13 | 35,000 | 34,995 |
| 3 | Federal Home Loan Bank Discount Notes | 0.105% | 10/30/13 | 20,000 | 19,997 |
| 3 | Federal Home Loan Bank Discount Notes | 0.090% | 11/1/13 | 3,200 | 3,199 |
| 3 | Federal Home Loan Bank Discount Notes | 0.069%–0.080% | 11/6/13 | 64,664 | 64,655 |
| 3 | Federal Home Loan Bank Discount Notes | 0.080%–0.085% | 11/8/13 | 12,450 | 12,448 |
| 3 | Federal Home Loan Bank Discount Notes | 0.080% | 11/20/13 | 2,100 | 2,100 |
| 3 | Federal Home Loan Bank Discount Notes | 0.080% | 12/11/13 | 5,000 | 4,999 |
| 3 | Federal Home Loan Bank Discount Notes | 0.140% | 12/13/13 | 3,600 | 3,598 |
| 3 | Federal Home Loan Bank Discount Notes | 0.110% | 12/18/13 | 7,000 | 6,998 |
| 3 | Federal Home Loan Bank Discount Notes | 0.150% | 12/20/13 | 5,000 | 4,998 |
| 3 | Federal Home Loan Bank Discount Notes | 0.110% | 1/8/14 | 11,500 | 11,495 |
| 3 | Federal Home Loan Bank Discount Notes | 0.110% | 1/10/14 | 12,600 | 12,595 |
| 3 | Federal Home Loan Bank Discount Notes | 0.100% | 1/16/14 | 1,000 | 1,000 |
| 3 | Federal Home Loan Bank Discount Notes | 0.100% | 1/17/14 | 10,595 | 10,591 |
| 3 | Federal Home Loan Bank Discount Notes | 0.085%–0.100% | 1/22/14 | 3,300 | 3,299 |
| 3 | Federal Home Loan Bank Discount Notes | 0.110% | 2/7/14 | 3,100 | 3,098 |
| 3 | Federal Home Loan Bank Discount Notes | 0.100%–0.110% | 2/14/14 | 5,195 | 5,192 |
| 3 | Federal Home Loan Bank Discount Notes | 0.085% | 2/21/14 | 12,000 | 11,995 |
| 3,4 | Federal Home Loan Banks | 0.146% | 9/6/13 | 20,000 | 20,000 |
| 3,4 | Federal Home Loan Banks | 0.133% | 11/22/13 | 30,000 | 29,999 |
| 3,4 | Federal Home Loan Banks | 0.159% | 12/26/13 | 25,000 | 25,000 |
| 3,4 | Federal Home Loan Banks | 0.136% | 4/3/14 | 25,000 | 25,000 |
| 3,4 | Federal Home Loan Banks | 0.124% | 4/25/14 | 30,000 | 30,000 |
| 3,4 | Federal Home Loan Banks | 0.127% | 5/1/14 | 40,000 | 39,999 |
| 3,4 | Federal Home Loan Banks | 0.126% | 5/6/14 | 33,000 | 33,000 |
| 3,4 | Federal Home Loan Banks | 0.126% | 6/6/14 | 60,000 | 60,000 |
| 3,4 | Federal Home Loan Banks | 0.126% | 7/3/14 | 14,000 | 14,000 |
| 3,4 | Federal Home Loan Banks | 0.167% | 10/1/14 | 6,000 | 5,999 |
| 3,4 | Federal Home Loan Banks | 0.134% | 12/19/14 | 41,000 | 40,997 |
| 2,4 | Federal Home Loan Mortgage Corp. | 0.156% | 11/4/13 | 59,000 | 59,002 |
| 2,4 | Federal National Mortgage Assn. | 0.155% | 11/8/13 | 50,000 | 49,997 |
| 2,4 | Federal National Mortgage Assn. | 0.155% | 11/14/13 | 65,000 | 64,996 |
| 2,4 | Federal National Mortgage Assn. | 0.164% | 6/20/14 | 47,000 | 46,998 |
| 2,4 | Federal National Mortgage Assn. | 0.165% | 9/11/14 | 150,000 | 149,969 |
| 2,4 | Federal National Mortgage Assn. | 0.154% | 2/27/15 | 60,000 | 59,977 |
| 2,4 | Federal National Mortgage Assn. | 0.156% | 8/5/15 | 30,000 | 29,988 |
| 2 | Freddie Mac Discount Notes | 0.075% | 9/3/13 | 5,000 | 5,000 |
| 2 | Freddie Mac Discount Notes | 0.100%–0.110% | 9/4/13 | 19,400 | 19,400 |
| 2 | Freddie Mac Discount Notes | 0.100%–0.120% | 9/5/13 | 16,000 | 16,000 |
| 2 | Freddie Mac Discount Notes | 0.090%–0.125% | 9/9/13 | 10,546 | 10,546 |
| 2 | Freddie Mac Discount Notes | 0.085% | 9/10/13 | 2,500 | 2,500 |
| 2 | Freddie Mac Discount Notes | 0.140% | 9/13/13 | 2,300 | 2,300 |
| 2 | Freddie Mac Discount Notes | 0.080%–0.140% | 9/16/13 | 28,565 | 28,564 |
| 2 | Freddie Mac Discount Notes | 0.100%–0.130% | 9/23/13 | 42,000 | 41,997 |
| 2 | Freddie Mac Discount Notes | 0.090%–0.093% | 9/30/13 | 48,400 | 48,396 |
| 2 | Freddie Mac Discount Notes | 0.090%–0.140% | 10/1/13 | 3,714 | 3,714 |
| 2 | Freddie Mac Discount Notes | 0.090% | 10/3/13 | 3,500 | 3,500 |
| 2 | Freddie Mac Discount Notes | 0.075%–0.160% | 10/8/13 | 52,503 | 52,497 |
39
Federal Money Market Fund
| | | | |
| | | | Face | Market |
| | | Maturity | Amount | Value |
| | Yield1 | Date | ($000) | ($000) |
| 2 Freddie Mac Discount Notes | 0.110% | 10/10/13 | 5,274 | 5,273 |
| 2 Freddie Mac Discount Notes | 0.070%–0.120% | 10/15/13 | 51,365 | 51,359 |
| 2 Freddie Mac Discount Notes | 0.090% | 10/21/13 | 10,000 | 9,999 |
| 2 Freddie Mac Discount Notes | 0.090%–0.130% | 10/22/13 | 32,100 | 32,095 |
| 2 Freddie Mac Discount Notes | 0.080%–0.110% | 10/28/13 | 168,450 | 168,423 |
| 2 Freddie Mac Discount Notes | 0.055%–0.130% | 11/5/13 | 19,920 | 19,916 |
| 2 Freddie Mac Discount Notes | 0.075%–0.120% | 11/12/13 | 121,320 | 121,299 |
| 2 Freddie Mac Discount Notes | 0.115% | 11/18/13 | 3,200 | 3,199 |
| 2 Freddie Mac Discount Notes | 0.120% | 12/2/13 | 3,500 | 3,499 |
| 2 Freddie Mac Discount Notes | 0.140% | 12/3/13 | 20,000 | 19,993 |
| 2 Freddie Mac Discount Notes | 0.100% | 12/5/13 | 4,500 | 4,499 |
| 2 Freddie Mac Discount Notes | 0.080%–0.110% | 12/9/13 | 9,401 | 9,399 |
| 2 Freddie Mac Discount Notes | 0.105%–0.160% | 12/16/13 | 18,200 | 18,194 |
| 2 Freddie Mac Discount Notes | 0.140% | 12/23/13 | 22,468 | 22,458 |
| 2 Freddie Mac Discount Notes | 0.138% | 12/30/13 | 30,000 | 29,986 |
| 2 Freddie Mac Discount Notes | 0.110%–0.125% | 1/14/14 | 4,700 | 4,698 |
| 2 Freddie Mac Discount Notes | 0.100%–0.110% | 1/15/14 | 4,571 | 4,569 |
| 2 Freddie Mac Discount Notes | 0.100% | 1/21/14 | 2,370 | 2,369 |
| 2 Freddie Mac Discount Notes | 0.100% | 1/22/14 | 7,000 | 6,997 |
| 2 Freddie Mac Discount Notes | 0.100%–0.115% | 1/23/14 | 25,444 | 25,433 |
| 2 Freddie Mac Discount Notes | 0.100%–0.105% | 2/3/14 | 22,200 | 22,190 |
| 2 Freddie Mac Discount Notes | 0.095%–0.110% | 2/4/14 | 16,420 | 16,412 |
| 2 Freddie Mac Discount Notes | 0.100% | 2/10/14 | 9,000 | 8,996 |
| 2 Freddie Mac Discount Notes | 0.110%–0.130% | 2/11/14 | 4,128 | 4,126 |
| 2 Freddie Mac Discount Notes | 0.100% | 2/18/14 | 20,000 | 19,990 |
| 2 Freddie Mac Discount Notes | 0.085%–0.110% | 2/24/14 | 29,696 | 29,683 |
| United States Treasury Bill | 0.108% | 9/26/13 | 20,000 | 19,998 |
| United States Treasury Bill | 0.057% | 11/14/13 | 10,000 | 9,999 |
| United States Treasury Note/Bond | 0.750% | 9/15/13 | 13,000 | 13,003 |
| United States Treasury Note/Bond | 0.125% | 9/30/13 | 15,000 | 15,001 |
| United States Treasury Note/Bond | 3.125% | 9/30/13 | 86,407 | 86,615 |
| United States Treasury Note/Bond | 0.500% | 10/15/13 | 10,000 | 10,005 |
| United States Treasury Note/Bond | 2.750% | 10/31/13 | 32,000 | 32,139 |
| United States Treasury Note/Bond | 4.250% | 11/15/13 | 56,487 | 56,966 |
| United States Treasury Note/Bond | 0.500% | 11/15/13 | 66,200 | 66,256 |
| United States Treasury Note/Bond | 0.250% | 11/30/13 | 920 | 920 |
| United States Treasury Note/Bond | 2.000% | 11/30/13 | 36,000 | 36,169 |
| United States Treasury Note/Bond | 0.750% | 12/15/13 | 15,000 | 15,028 |
| United States Treasury Note/Bond | 0.125% | 12/31/13 | 58,439 | 58,445 |
| United States Treasury Note/Bond | 1.500% | 12/31/13 | 70,693 | 71,022 |
| United States Treasury Note/Bond | 4.000% | 2/15/14 | 4,000 | 4,070 |
| United States Treasury Note/Bond | 1.875% | 2/28/14 | 30,000 | 30,264 |
| United States Treasury Note/Bond | 1.750% | 3/31/14 | 90,000 | 90,859 |
| Total U.S. Government and Agency Obligations (Cost $3,465,809) | | | 3,465,809 |
| Repurchase Agreements (0.1%) | | | | |
| Bank of Nova Scotia | | | | |
| (Dated 8/30/13, Repurchase Value $3,332,000, | | | |
| collateralized by U.S. Treasury Note/Bond | | | | |
| 0.125%, 4/15/18; with a value of $3,399,000) | 0.040% | 9/3/13 | 3,332 | 3,332 |
| Total Investments (98.5%) (Cost $3,469,141) | | | | 3,469,141 |
40
Federal Money Market Fund
| |
| | Market |
| | Value |
| | ($000) |
| Other Assets and Liabilities (1.5%) | |
| Other Assets | 55,470 |
| Liabilities | (2,942) |
| | 52,528 |
| Net Assets (100%) | |
| Applicable to 3,520,946,353 outstanding $.001 par value shares of | |
| beneficial interest (unlimited authorization) | 3,521,669 |
| Net Asset Value Per Share | $1.00 |
| |
| At August 31, 2013, net assets consisted of: | |
| | Amount |
| | ($000) |
| Paid-in Capital | 3,521,456 |
| Undistributed Net Investment Income | — |
| Accumulated Net Realized Gains | 213 |
| Net Assets | 3,521,669 |
See Note A in Notes to Financial Statements.1 Represents annualized yield at date of purchase for discount securities, and coupon for coupon-bearing securities.2 The issuer was placed under federal conservatorship in September 2008; since that time, its daily operations have been managed by the Federal Housing Finance Agency and it receives capital from the U.S. Treasury, as needed to maintain a positive net worth, in exchange for senior preferred stock.3 The issuer operates under a congressional charter; its securities are generally neither guaranteed by the U.S. Treasury nor backed by the full faith and credit of the U.S. government.4 Adjustable-rate security. See accompanying Notes, which are an integral part of the Financial Statements.41
Federal Money Market Fund
| |
| Statement of Operations | |
| |
| | Year Ended |
| | August 31, 2013 |
| | ($000) |
| Investment Income | |
| Income | |
| Interest | 5,436 |
| Total Income | 5,436 |
| Expenses | |
| The Vanguard Group—Note B | |
| Investment Advisory Services | 105 |
| Management and Administrative | 4,540 |
| Marketing and Distribution | 649 |
| Custodian Fees | 50 |
| Auditing Fees | 28 |
| Shareholders’ Reports | 38 |
| Trustees’ Fees and Expenses | 6 |
| Total Expenses | 5,416 |
| Expense Reduction—Note B | (492) |
| Net Expenses | 4,924 |
| Net Investment Income | 512 |
| Realized Net Gain (Loss) on Investment Securities Sold | 61 |
| Net Increase (Decrease) in Net Assets Resulting from Operations | 573 |
See accompanying Notes, which are an integral part of the Financial Statements.
42
Federal Money Market Fund
| | |
| Statement of Changes in Net Assets | | |
| |
| | Year Ended August 31, |
| | 2013 | 2012 |
| | ($000) | ($000) |
| Increase (Decrease) in Net Assets | | |
| Operations | | |
| Net Investment Income | 512 | 444 |
| Realized Net Gain (Loss) | 61 | 35 |
| Net Increase (Decrease) in Net Assets Resulting from Operations | 573 | 479 |
| Distributions | | |
| Net Investment Income | (512) | (444) |
| Realized Capital Gain | — | — |
| Total Distributions | (512) | (444) |
| Capital Share Transactions (at $1.00 per share) | | |
| Issued | 345,150 | 379,852 |
| Issued in Lieu of Cash Distributions | 503 | 435 |
| Redeemed | (927,215) | (1,071,053) |
| Net Increase (Decrease) from Capital Share Transactions | (581,562) | (690,766) |
| Total Increase (Decrease) | (581,501) | (690,731) |
| Net Assets | | |
| Beginning of Period | 4,103,170 | 4,793,901 |
| End of Period | 3,521,669 | 4,103,170 |
See accompanying Notes, which are an integral part of the Financial Statements.
43
Federal Money Market Fund
Financial Highlights
| | | | | |
| For a Share Outstanding | | | Year Ended August 31, |
| Throughout Each Period | 2013 | 2012 | 2011 | 2010 | 2009 |
| Net Asset Value, Beginning of Period | $1.00 | $1.00 | $1.00 | $1.00 | $1.00 |
| Investment Operations | | | | | |
| Net Investment Income | . 0001 | . 0001 | . 0002 | . 0004 | .011 |
| Net Realized and Unrealized Gain (Loss) | | | | | |
| on Investments | — | — | — | — | — |
| Total from Investment Operations | . 0001 | . 0001 | . 0002 | . 0004 | .011 |
| Distributions | | | | | |
| Dividends from Net Investment Income | (. 0001) | (. 0001) | (. 0002) | (. 0004) | (.011) |
| Distributions from Realized Capital Gains | — | — | — | — | — |
| Total Distributions | (. 0001) | (. 0001) | (. 0002) | (. 0004) | (.011) |
| Net Asset Value, End of Period | $1.00 | $1.00 | $1.00 | $1.00 | $1.00 |
| |
| Total Return1 | 0.01% | 0.01% | 0.02% | 0.04% | 1.06% |
| |
| Ratios/Supplemental Data | | | | | |
| Net Assets, End of Period (Millions) | $3,522 | $4,103 | $4,794 | $6,048 | $9,386 |
| Ratio of Expenses to Average Net Assets | 0.13%2 | 0.12%2 | 0.19%2 | 0.22% | 0.27%3 |
| Ratio of Net Investment Income to | | | | | |
| Average Net Assets | 0.01% | 0.01% | 0.02% | 0.04% | 1.03% |
1 Total returns do not include account service fees that may have applied in the periods shown. Fund prospectuses provide information about any applicable account service fees.
2 The ratio of total expenses to average net assets before an expense reduction was 0.14% for 2013, 0.16% for 2012, and 0.20% for 2011.
See Note B in the Notes to Financial Statements.
3 Includes 0.02% of fees to participate in the Treasury Temporary Guarantee Program for Money Market Funds.
See accompanying Notes, which are an integral part of the Financial Statements.
44
Federal Money Market Fund
Notes to Financial Statements
Vanguard Federal Money Market Fund is registered under the Investment Company Act of 1940 as an open-end investment company, or mutual fund. The fund invests in short-term debt instruments issued by the U.S. government or its agencies and instrumentalities, and repurchase agreements collateralized by such instruments.
A. The following significant accounting policies conform to generally accepted accounting principles for U.S. mutual funds. The fund consistently follows such policies in preparing its financial statements.
1. Security Valuation: Securities are valued at amortized cost, which approximates market value.
2. Repurchase Agreements: The fund may enter into repurchase agreements with institutional counterparties. Securities pledged as collateral to the fund under repurchase agreements are held by a custodian bank until the agreements mature. Each agreement requires that the market value of the collateral be sufficient to cover payments of interest and principal. The fund further mitigates its counterparty risk by entering into repurchase agreements only with a diverse group of pre-qualified counterparties, monitoring their financial strength, and entering into master repurchase agreements with its counterparties. The master repurchase agreements provide that, in the event of a counter-party’s default (including bankruptcy), the fund may terminate any repurchase agreements with that counterparty, determine the net amount owed, and sell or retain the collateral up to the net amount owed to the fund. Such action may be subject to legal proceedings, which may delay or limit the disposition of collateral.
3. Federal Income Taxes: The fund intends to continue to qualify as a regulated investment company and distribute all of its taxable income. Management has analyzed the fund’s tax positions taken for all open federal income tax years (August 31, 2010–2013), and has concluded that no provision for federal income tax is required in the fund’s financial statements.
4. Distributions: Distributions from net investment income are declared daily and paid on the first business day of the following month.
5. Other: Interest income is accrued daily. Premiums and discounts on debt securities purchased are amortized and accreted, respectively, to interest income over the lives of the respective securities. Security transactions are accounted for on the date securities are bought or sold. Costs used to determine realized gains (losses) on the sale of investment securities are those of the specific securities sold.
B. The Vanguard Group furnishes at cost investment advisory, corporate management, administrative, marketing, and distribution services. The costs of such services are allocated to the fund under methods approved by the board of trustees. The fund has committed to provide up to 0.40% of its net assets in capital contributions to Vanguard. At August 31, 2013, the fund had contributed capital of $426,000 to Vanguard (included in Other Assets), representing 0.01% of the fund’s net assets and 0.17% of Vanguard’s capitalization. The fund’s trustees and officers are also directors and officers of Vanguard. Vanguard and the board of trustees have agreed to temporarily limit certain net operating expenses in excess of the fund’s daily yield so as to maintain a zero or positive yield for the fund. Vanguard and the board of trustees may terminate the temporary expense limitation at any time. For the year ended August 31, 2013, Vanguard’s expenses were reduced by $492,000 (an effective annual rate of 0.01% of the fund’s average net assets).
45
Federal Money Market Fund
C. Various inputs may be used to determine the value of the fund’s investments. These inputs are summarized in three broad levels for financial statement purposes. The inputs or methodologies used to value securities are not necessarily an indication of the risk associated with investing in those securities.
Level 1—Quoted prices in active markets for identical securities.
Level 2—Other significant observable inputs (including quoted prices for similar securities, interest rates, prepayment speeds, credit risk, etc.).
Level 3—Significant unobservable inputs (including the fund’s own assumptions used to determine the fair value of investments).
At August 31, 2013, 100% of the market value of the fund’s investments was determined using amortized cost, in accordance with rules under the Investment Company Act of 1940. Amortized cost approximates the current fair value of a security, but since the value is not obtained from a quoted price in an active market, securities valued at amortized cost are considered to be valued using Level 2 inputs.
D. Management has determined that no material events or transactions occurred subsequent to August 31, 2013, that would require recognition in these financial statements. The fund distributed $206,000 ($0.000059 per share) of short-term capital gains to shareholders of record on September 20, 2013.
46
Admiral Treasury Money Market Fund
Fund Profile
As of August 31, 2013
| |
| Financial Attributes | |
| Ticker Symbol | VUSXX |
| Expense Ratio1 | 0.10% |
| 7-Day SEC Yield | 0.01% |
| Average Weighted | |
| Maturity | 53 days |
| |
| Sector Diversification (% of portfolio) | |
| U.S. Treasury Bills | 100.0% |
The agency and mortgage-backed securities sectors may include issues from government-sponsored enterprises; such issues are generally not backed by the full faith and credit of the U.S. government.
| |
| Distribution by Credit Quality (% of portfolio) |
| First Tier | 100.0% |
For information about these ratings, see the Glossary entry for Credit Quality.
1 The expense ratio shown is from the prospectus dated December 28, 2012, and represents estimated costs for the current fiscal year. For the fiscal year ended August 31, 2013, the expense ratio was 0.08%, reflecting a temporary reduction in operating expenses (described in Note B of the Notes to Financial Statements). Before this reduction, the expense ratio was 0.09%.
47
Admiral Treasury Money Market Fund
Performance Summary
Investment returns will fluctuate. All of the returns in this report represent past performance, which is not a guarantee of future results that may be achieved by the fund. (Current performance may be lower or higher than the performance data cited. For performance data current to the most recent month-end, visit our website at vanguard.com/performance.) The returns shown do not reflect taxes that a shareholder would pay on fund distributions. An investment in a money market fund is not insured or guaranteed by the Federal Deposit Insurance Corporation or any other government agency. Although the fund seeks to preserve the value of your investment at $1 per share, it is possible to lose money by investing in the fund. The fund’s 7-day SEC yield reflects its current earnings more closely than do the average annual returns.
Cumulative Performance: August 31, 2003, Through August 31, 2013
Initial Investment of $50,000
| | | | |
| | | Average Annual Total Returns | |
| | Periods Ended August 31, 2013 | |
| | | | | Final Value |
| | One | Five | Ten | of a $50,000 |
| | Year | Years | Years | Investment |
| Admiral Treasury Money Market | | | | |
| Fund | 0.02% | 0.15% | 1.61% | $58,672 |
| iMoneyNet Money Fund Report’s | | | | |
| 100% Treasury Funds Average | 0.00 | 0.03 | 1.20 | 56,343 |
| Citigroup Three-Month U.S. Treasury | | | | |
| Bill Index | 0.07 | 0.17 | 1.62 | 58,697 |
iMoneyNet Money Fund Report’s 100% Treasury Funds Average: Derived from data provided by iMoneyNet, Inc.
See Financial Highlights for dividend information.
48
Admiral Treasury Money Market Fund
| | |
| Fiscal-Year Total Returns (%): August 31, 2003, Through August 31, 2013 | |
| | | iMoneyNet |
| | | Average |
| Fiscal Year | Total Returns | Total Returns |
| 2004 | 0.91% | 0.39% |
| 2005 | 2.29 | 1.61 |
| 2006 | 4.22 | 3.54 |
| 2007 | 5.01 | 4.34 |
| 2008 | 3.08 | 2.08 |
| 2009 | 0.70 | 0.17 |
| 2010 | 0.03 | 0.00 |
| 2011 | 0.02 | 0.00 |
| 2012 | 0.01 | 0.00 |
| 2013 | 0.02 | 0.00 |
| 7-day SEC yield (8/31/2013): 0.01% |
| iMoneyNet Money Fund Report’s 100% Treasury Funds Average: Derived from data provided by iMoneyNet, Inc. |
Average Annual Total Returns: Periods Ended June 30, 2013
This table presents returns through the latest calendar quarter—rather than through the end of the fiscal period.
Securities and Exchange Commission rules require that we provide this information.
| | | | |
| | Inception | One | Five | Ten |
| | Date | Year | Years | Years |
| Admiral Treasury Money Market | | | | |
| Fund | 12/14/1992 | 0.02% | 0.21% | 1.63% |
49
Admiral Treasury Money Market Fund
Financial Statements
Statement of Net Assets
As of August 31, 2013
The fund reports a complete list of its holdings in various monthly and quarterly regulatory filings. The fund publishes its holdings on a monthly basis at vanguard.com and files them with the Securities and Exchange Commission on Form N-MFP. The fund’s Form N-MFP filings become public 60 days after the relevant month-end, and may be viewed at sec.gov or via a link on the “Portfolio Holdings” page on vanguard.com. For the second and fourth fiscal quarters, the lists appear in the fund’s semiannual and annual reports to shareholders. For the first and third fiscal quarters, the fund files the lists with the SEC on Form N-Q. Shareholders can look up the fund’s Forms N-Q on the SEC’s website at sec. gov. Forms N-Q may also be reviewed and copied at the SEC’s Public Reference Room (see the back cover of this report for further information).
| | | | |
| | | | Face | Market |
| | | Maturity | Amount | Value |
| | Yield1 | Date | ($000) | ($000) |
| U.S. Government and Agency Obligations (99.9%) | | | |
| United States Treasury Bill | 0.048%–0.120% | 9/5/13 | 836,481 | 836,476 |
| United States Treasury Bill | 0.051%–0.113% | 9/12/13 | 875,000 | 874,985 |
| United States Treasury Bill | 0.048% | 9/19/13 | 725,000 | 724,983 |
| United States Treasury Bill | 0.049%–0.106% | 9/26/13 | 812,233 | 812,192 |
| United States Treasury Bill | 0.052%–0.111% | 10/3/13 | 870,000 | 869,953 |
| United States Treasury Bill | 0.052% | 10/10/13 | 820,000 | 819,954 |
| United States Treasury Bill | 0.043%–0.088% | 10/17/13 | 800,165 | 800,112 |
| United States Treasury Bill | 0.037% | 10/24/13 | 685,000 | 684,963 |
| United States Treasury Bill | 0.030% | 10/31/13 | 740,536 | 740,499 |
| United States Treasury Bill | 0.038% | 11/7/13 | 895,000 | 894,937 |
| United States Treasury Bill | 0.057% | 11/14/13 | 800,000 | 799,906 |
| United States Treasury Bill | 0.055% | 11/21/13 | 840,000 | 839,896 |
| United States Treasury Bill | 0.041%–0.082% | 11/29/13 | 710,000 | 709,884 |
| United States Treasury Bill | 0.078% | 12/19/13 | 100,000 | 99,976 |
| United States Treasury Bill | 0.103% | 12/26/13 | 200,000 | 199,934 |
| United States Treasury Bill | 0.090% | 1/2/14 | 200,000 | 199,939 |
| United States Treasury Bill | 0.074% | 1/16/14 | 125,000 | 124,965 |
| United States Treasury Bill | 0.073% | 1/23/14 | 115,000 | 114,966 |
| United States Treasury Bill | 0.078% | 2/20/14 | 100,000 | 99,963 |
| United States Treasury Note/Bond | 0.125% | 9/30/13 | 300,000 | 300,014 |
| United States Treasury Note/Bond | 3.125% | 9/30/13 | 93,000 | 93,225 |
| United States Treasury Note/Bond | 2.750% | 10/31/13 | 11,426 | 11,475 |
| Total U. S. Government and Agency Obligations (Cost $11,653,197) | | | 11,653,197 |
| Total Investments (99.9%) (Cost $11,653,197) | | | 11,653,197 |
50
Admiral Treasury Money Market Fund
| |
| | Market |
| | Value |
| | ($000) |
| Other Assets and Liabilities (0.1%) | |
| Other Assets | 12,919 |
| Liabilities | (6,591) |
| | 6,328 |
| Net Assets (100%) | |
| Applicable to 11,656,283,199 outstanding $.001 par value shares of | |
| beneficial interest (unlimited authorization) | 11,659,525 |
| Net Asset Value Per Share | $1.00 |
| |
| At August 31, 2013, net assets consisted of: | |
| | Amount |
| | ($000) |
| Paid-in Capital | 11,659,323 |
| Undistributed Net Investment Income | — |
| Accumulated Net Realized Gains | 202 |
| Net Assets | 11,659,525 |
See Note A in Notes to Financial Statements.1 Represents annualized yield at date of purchase for discount securities, and coupon for coupon-bearing securities. See accompanying Notes, which are an integral part of the Financial Statements.51
Admiral Treasury Money Market Fund
| |
| Statement of Operations | |
| |
| | Year Ended |
| | August 31, 2013 |
| | ($000) |
| Investment Income | |
| Income | |
| Interest | 11,884 |
| Total Income | 11,884 |
| Expenses | |
| The Vanguard Group—Note B | |
| Investment Advisory Services | 343 |
| Management and Administrative | 8,734 |
| Marketing and Distribution | 1,890 |
| Custodian Fees | 120 |
| Auditing Fees | 23 |
| Shareholders’ Reports | 50 |
| Trustees’ Fees and Expenses | 16 |
| Total Expenses | 11,176 |
| Expense Reduction—Note B | (1,281) |
| Net Expenses | 9,895 |
| Net Investment Income | 1,989 |
| Realized Net Gain (Loss) on Investment Securities Sold | 3 |
| Net Increase (Decrease) in Net Assets Resulting from Operations | 1,992 |
See accompanying Notes, which are an integral part of the Financial Statements.
52
Admiral Treasury Money Market Fund
| | |
| Statement of Changes in Net Assets | | |
| |
| | Year Ended August 31, |
| | 2013 | 2012 |
| | ($000) | ($000) |
| Increase (Decrease) in Net Assets | | |
| Operations | | |
| Net Investment Income | 1,989 | 1,553 |
| Realized Net Gain (Loss) | 3 | 46 |
| Net Increase (Decrease) in Net Assets Resulting from Operations | 1,992 | 1,599 |
| Distributions | | |
| Net Investment Income | (1,989) | (1,553) |
| Realized Capital Gain | — | — |
| Total Distributions | (1,989) | (1,553) |
| Capital Share Transactions (at $1.00 per share) | | |
| Issued | 733,020 | 865,430 |
| Issued in Lieu of Cash Distributions | 1,932 | 1,508 |
| Redeemed | (2,429,133) | (2,827,163) |
| Net Increase (Decrease) from Capital Share Transactions | (1,694,181) | (1,960,225) |
| Total Increase (Decrease) | (1,694,178) | (1,960,179) |
| Net Assets | | |
| Beginning of Period | 13,353,703 | 15,313,882 |
| End of Period | 11,659,525 | 13,353,703 |
See accompanying Notes, which are an integral part of the Financial Statements.
53
Admiral Treasury Money Market Fund
Financial Highlights
| | | | | |
| For a Share Outstanding | | | Year Ended August 31, |
| Throughout Each Period | 2013 | 2012 | 2011 | 2010 | 2009 |
| Net Asset Value, Beginning of Period | $1.00 | $1.00 | $1.00 | $1.00 | $1.00 |
| Investment Operations | | | | | |
| Net Investment Income | . 0002 | . 0001 | . 0002 | . 0003 | . 007 |
| Net Realized and Unrealized Gain (Loss) | | | | | |
| on Investments | — | — | — | — | — |
| Total from Investment Operations | . 0002 | . 0001 | . 0002 | . 0003 | . 007 |
| Distributions | | | | | |
| Dividends from Net Investment Income | (. 0002) | (. 0001) | (. 0002) | (. 0003) | (. 007) |
| Distributions from Realized Capital Gains | — | — | — | — | — |
| Total Distributions | (. 0002) | (. 0001) | (. 0002) | (. 0003) | (. 007) |
| Net Asset Value, End of Period | $1.00 | $1.00 | $1.00 | $1.00 | $1.00 |
| |
| Total Return1 | 0.02% | 0.01% | 0.02% | 0.03% | 0.70% |
| |
| Ratios/Supplemental Data | | | | | |
| Net Assets, End of Period (Millions) | $11,660 | $13,354 | $15,314 | $18,726 | $25,435 |
| Ratio of Expenses to Average Net Assets | 0.08%2 | 0.05%2 | 0.11%2 | 0.14% | 0.15%3 |
| Ratio of Net Investment Income to | | | | | |
| Average Net Assets | 0.02% | 0.01% | 0.02% | 0.03% | 0.74% |
1 Total returns do not include account service fees that may have applied in the periods shown. Fund prospectuses provide information about any applicable account service fees.
2 The ratio of total expenses to average net assets before an expense reduction was 0.09% for 2013, 0.10% for 2012, and 0.12% for 2011.
See Note B in the Notes to Financial Statements.
3 Includes 0.03% of fees to participate in the Treasury Temporary Guarantee Program for Money Market Funds.
See accompanying Notes, which are an integral part of the Financial Statements.
54
Admiral Treasury Money Market Fund
Notes to Financial Statements
Vanguard Admiral Treasury Money Market Fund is registered under the Investment Company Act of 1940 as an open-end investment company, or mutual fund. The fund invests in short-term debt instruments backed by the full faith and credit of the U.S. government.
A. The following significant accounting policies conform to generally accepted accounting principles for U.S. mutual funds. The fund consistently follows such policies in preparing its financial statements.
1. Security Valuation: Securities are valued at amortized cost, which approximates market value.
2. Federal Income Taxes: The fund intends to continue to qualify as a regulated investment company and distribute all of its taxable income. Management has analyzed the fund’s tax positions taken for all open federal income tax years (August 31, 2010–2013), and has concluded that no provision for federal income tax is required in the fund’s financial statements.
3. Distributions: Distributions from net investment income are declared daily and paid on the first business day of the following month.
4. Other: Interest income is accrued daily. Premiums and discounts on debt securities purchased are amortized and accreted, respectively, to interest income over the lives of the respective securities. Security transactions are accounted for on the date securities are bought or sold. Costs used to determine realized gains (losses) on the sale of investment securities are those of the specific securities sold.
B. The Vanguard Group furnishes at cost investment advisory, corporate management, administrative, marketing, and distribution services. The costs of such services are allocated to the fund under methods approved by the board of trustees. The fund has committed to provide up to 0.40% of its net assets in capital contributions to Vanguard. At August 31, 2013, the fund had contributed capital of $1,410,000 to Vanguard (included in Other Assets), representing 0.01% of the fund’s net assets and 0.56% of Vanguard’s capitalization. The fund’s trustees and officers are also directors and officers of Vanguard. Vanguard and the board of trustees have agreed to temporarily limit certain net operating expenses in excess of the fund’s daily yield so as to maintain a zero or positive yield for the fund. Vanguard and the board of trustees may terminate the temporary expense limitation at any time. For the year ended August 31, 2013, Vanguard’s expenses were reduced by $1,281,000 (an effective annual rate of 0.01% of the fund’s average net assets).
C. Various inputs may be used to determine the value of the fund’s investments. These inputs are summarized in three broad levels for financial statement purposes. The inputs or methodologies used to value securities are not necessarily an indication of the risk associated with investing in those securities.
Level 1—Quoted prices in active markets for identical securities.
Level 2—Other significant observable inputs (including quoted prices for similar securities, interest rates, prepayment speeds, credit risk, etc.).
Level 3—Significant unobservable inputs (including the fund’s own assumptions used to determine the fair value of investments).
55
Admiral Treasury Money Market Fund
At August 31, 2013, 100% of the market value of the fund’s investments was determined using amortized cost, in accordance with rules under the Investment Company Act of 1940. Amortized cost approximates the current fair value of a security, but since the value is not obtained from a quoted price in an active market, securities valued at amortized cost are considered to be valued using Level 2 inputs.
D. Management has determined that no material events or transactions occurred subsequent to August 31, 2013, that would require recognition in these financial statements. The fund distributed $185,000 ($0.000016 per share) of short-term capital gains to shareholders of record on September 20, 2013.
56
Report of Independent Registered Public Accounting Firm
To the Trustees of Vanguard Money Market Reserves and Vanguard Admiral Funds and the Shareholders of Vanguard Prime Money Market Fund, Vanguard Federal Money Market Fund and Vanguard Admiral Treasury Money Market Fund:
In our opinion, the accompanying statements of net assets and the related statements of operations and of changes in net assets and the financial highlights present fairly, in all material respects, the financial position of Vanguard Prime Money Market Fund, Vanguard Federal Money Market Fund and Vanguard Admiral Treasury Money Market Fund (the “Funds”) at August 31, 2013, the results of each of their operations for the year then ended, the changes in each of their net assets for each of the two years in the period then ended, and the financial highlights for each of the five years in the period then ended, in conformity with accounting principles generally accepted in the United States of America. These financial statements and financial highlights (hereafter referred to as “financial statements”) are the responsibility of the Funds’ management; our responsibility is to express an opinion on these financial statements based on our audits. We conducted our audits of these financial statements in accordance with the standards of the Public Company Accounting Oversight Board (United States). Those standards require that we plan and perform the audit to obtain reasonable assurance about whether the financial statements are free of material misstatement. An audit includes examining, on a test basis, evidence supporting the amounts and disclosures in the financial statements, assessing the accounting principles used and significant estimates made by management, and evaluating the overall financial statement presentation. We believe that our audits, which included confirmation of securities at August 31, 2013 by correspondence with the custodian and brokers and by agreement to the underlying ownership records of the transfer agent, provide a reasonable basis for our opinion.
/s/PricewaterhouseCoopers LLP
Philadelphia, Pennsylvania
October 10, 2013
57
Special 2013 tax information (unaudited) for Vanguard Prime Money Market Fund
This information for the fiscal year ended August 31, 2013, is included pursuant to provisions of the Internal Revenue Code.
For nonresident alien shareholders, 67.8% of income dividends are interest-related dividends.
Special 2013 tax information (unaudited) for Vanguard Federal Money Market Fund
This information for the fiscal year ended August 31, 2013, is included pursuant to provisions of the Internal Revenue Code.
For nonresident alien shareholders, 100% of income dividends are interest-related dividends.
Special 2013 tax information (unaudited) for Vanguard Admiral Treasury Money Market Fund
This information for the fiscal year ended August 31, 2013, is included pursuant to provisions of the Internal Revenue Code.
For nonresident alien shareholders, 100% of income dividends are interest-related dividends.
58
About Your Fund’s Expenses
As a shareholder of the fund, you incur ongoing costs, which include costs for portfolio management, administrative services, and shareholder reports (like this one), among others. Operating expenses, which are deducted from a fund’s gross income, directly reduce the investment return of the fund.
A fund’s expenses are expressed as a percentage of its average net assets. This figure is known as the expense ratio. The following examples are intended to help you understand the ongoing costs (in dollars) of investing in your fund and to compare these costs with those of other mutual funds. The examples are based on an investment of $1,000 made at the beginning of the period shown and held for the entire period.
The accompanying table illustrates your fund’s costs in two ways:
• Based on actual fund return. This section helps you to estimate the actual expenses that you paid over the period. The ”Ending Account Value“ shown is derived from the fund‘s actual return, and the third column shows the dollar amount that would have been paid by an investor who started with $1,000 in the fund. You may use the information here, together with the amount you invested, to estimate the expenses that you paid over the period.
To do so, simply divide your account value by $1,000 (for example, an $8,600 account value divided by $1,000 = 8.6), then multiply the result by the number given for your fund under the heading ”Expenses Paid During Period.“
• Based on hypothetical 5% yearly return. This section is intended to help you compare your fund‘s costs with those of other mutual funds. It assumes that the fund had a yearly return of 5% before expenses, but that the expense ratio is unchanged. In this case—because the return used is not the fund’s actual return—the results do not apply to your investment. The example is useful in making comparisons because the Securities and Exchange Commission requires all mutual funds to calculate expenses based on a 5% return. You can assess your fund’s costs by comparing this hypothetical example with the hypothetical examples that appear in shareholder reports of other funds.
Note that the expenses shown in the table are meant to highlight and help you compare ongoing costs only and do not reflect transaction costs incurred by the fund for buying and selling securities. Further, the expenses do not include any purchase, redemption, or account service fees described in the fund prospectus. If such fees were applied to your account, your costs would be higher. Your fund does not carry a “sales load.”
The calculations assume no shares were bought or sold during the period. Your actual costs may have been higher or lower, depending on the amount of your investment and the timing of any purchases or redemptions.
You can find more information about the fund’s expenses, including annual expense ratios, in the Financial Statements section of this report. For additional information on operating expenses and other shareholder costs, please refer to your fund’s current prospectus.
59
| | | |
| Six Months Ended August 31, 2013 | | | |
| | Beginning | Ending | Expenses |
| | Account Value | Account Value | Paid During |
| | 2/28/2013 | 8/31/2013 | Period |
| Based on Actual Fund Return | | | |
| Prime Money Market Fund | | | |
| Investor Shares | $1,000.00 | $1,000.06 | $0.76 |
| Institutional Shares | 1,000.00 | 1,000.27 | 0.50 |
| Federal Money Market Fund | $1,000.00 | $1,000.09 | $0.55 |
| Admiral Treasury Money Market Fund | $1,000.00 | $1,000.05 | $0.35 |
| Based on Hypothetical 5% Yearly Return | | | |
| Prime Money Market Fund | | | |
| Investor Shares | $1,000.00 | $1,024.45 | $0.77 |
| Institutional Shares | 1,000.00 | 1,024.70 | 0.51 |
| Federal Money Market Fund | $1,000.00 | $1,024.65 | $0.56 |
| Admiral Treasury Money Market Fund | $1,000.00 | $1,024.85 | $0.36 |
The calculations are based on expenses incurred in the most recent six-month period. The funds’ annualized six-month expense ratios for the period are: for the Prime Money Market Fund, 0.15% for Investor Shares and 0.10% for Institutional Shares; for the Federal Money Market Fund, 0.11%; and for the Admiral Treasury Money Market Fund, 0.07%. The annualized six-month expense ratios for the Prime Money Market Fund Investor Shares, the Federal Money Market Fund, and the Admiral Treasury Money Market Fund reflect a temporary reduction in operating expenses (described in Note B of the Notes to Financial Statements). Before the reduction, the annualized six-month expense ratios were: for the Prime Money Market Fund Investor Shares, 0.16%; for the Federal Money Market Fund, 0.12%; for the Admiral Treasury Money Market Fund, 0.08%.
60
Trustees Approve Advisory Arrangement
The board of trustees of Vanguard Prime Money Market Fund, Federal Money Market Fund, and Admiral Treasury Money Market Fund has renewed the funds’ investment advisory arrangement with The Vanguard Group, Inc. (Vanguard). Vanguard—through its Fixed Income Group—serves as the investment advisor to the funds. The board determined that continuing the funds’ internalized management structure was in the best interests of the funds and their shareholders.
The board based its decision upon an evaluation of the advisor’s investment staff, portfolio management process, and performance. The trustees considered the factors discussed below, among others. However, no single factor determined whether the board approved the arrangement. Rather, it was the totality of the circumstances that drove the board’s decision.
Nature, extent, and quality of services
The board considered the quality of the funds’ investment management services over both the short and long term and took into account the organizational depth and stability of the advisor. The board noted that Vanguard has been managing investments for more than three decades. The Fixed Income Group adheres to a sound, disciplined investment management process; the team has considerable experience, stability, and depth.
The board concluded that Vanguard’s experience, stability, depth, and performance, among other factors, warranted continuation of the advisory arrangement.
Investment performance
The board considered the short- and long-term performance of the funds, including any periods of outperformance or underperformance relative to a benchmark index and peer group. The board concluded that the performance was such that the advisory arrangement should continue. Information about each fund’s most recent performance can be found on the Performance Summary pages of this report.
Cost
The board concluded that each fund’s expense ratio was well below the average expense ratio charged by funds in its peer group and that the funds’ advisory fee rates were also well below their peer-group averages. Information about the funds’ expenses appears in the About Your Fund’s Expenses section of this report as well as in the Financial Statements sections.
The board does not conduct a profitability analysis of Vanguard, because of Vanguard’s unique “at-cost” structure. Unlike most other mutual fund management companies, Vanguard is owned by the funds it oversees, and produces “profits” only in the form of reduced expenses for fund shareholders.
The benefit of economies of scale
The board concluded that the funds’ at-cost arrangement with Vanguard ensures that the funds will realize economies of scale as they grow, with the cost to shareholders declining as fund assets increase.
The board will consider whether to renew the advisory arrangement again after a one-year period.
61
Glossary
SEC Yields. A money market fund’s 7-day SEC yield is calculated by annualizing its income distributions for the previous seven days, as required by the U.S. Securities and Exchange Commission.
Average Weighted Maturity. The average length of time until fixed income securities held by a fund reach maturity and are repaid. The figure reflects the proportion of fund assets represented by each security.
Credit Quality. For Vanguard money market funds, the Distribution by Credit Quality table includes tier ratings for consistency with SEC Rule 2a-7 under the Investment Company Act of 1940, which governs money market funds. A First Tier security is one that is eligible for money market funds and has been rated in the highest short-term rating category for debt obligations by the requisite nationally recognized statistical rating organizations. An unrated security is First Tier if it represents quality comparable to that of a rated security, as determined in accordance with SEC Rule 2a-7. A Second Tier security is one that is eligible for money market funds and is not a First Tier security.
Expense Ratio. A fund’s total annual operating expenses expressed as a percentage of the fund’s average net assets. The expense ratio includes management and administrative expenses, but does not include the transaction costs of buying and selling portfolio securities.
Inception Date. The date on which the assets of a fund (or one of its share classes) are first invested in accordance with the fund’s investment objective. For funds with a subscription period, the inception date is the day after that period ends. Investment performance is measured from the inception date.
62
This page intentionally left blank.
The People Who Govern Your Fund
The trustees of your mutual fund are there to see that the fund is operated and managed in your best interests since, as a shareholder, you are a part owner of the fund. Your fund’s trustees also serve on the board of directors of The Vanguard Group, Inc., which is owned by the Vanguard funds and provides services to them on an at-cost basis.
A majority of Vanguard’s board members are independent, meaning that they have no affiliation with Vanguard or the funds they oversee, apart from the sizable personal investments they have made as private individuals. The independent board members have distinguished backgrounds in business, academia, and public service. Each of the trustees and executive officers oversees 181 Vanguard funds.
The following table provides information for each trustee and executive officer of the fund. More information about the trustees is in the Statement of Additional Information, which can be obtained, without charge, by contacting Vanguard at 800-662-7447, or online at vanguard.com.
| |
| InterestedTrustee1 | and Delphi Automotive LLP (automotive components); |
| | Senior Advisor at New Mountain Capital; Trustee of |
| F. William McNabb III | The Conference Board. |
| Born 1957. Trustee Since July 2009. Chairman of the | |
| Board. Principal Occupation(s) During the Past Five | Amy Gutmann |
| Years: Chairman of the Board of The Vanguard Group, | Born 1949. Trustee Since June 2006. Principal |
| Inc., and of each of the investment companies served | Occupation(s) During the Past Five Years: President |
| by The Vanguard Group, since January 2010; Director | of the University of Pennsylvania; Christopher H. |
| of The Vanguard Group since 2008; Chief Executive | Browne Distinguished Professor of Political Science |
| Officer and President of The Vanguard Group and of | in the School of Arts and Sciences with secondary |
| each of the investment companies served by The | appointments at the Annenberg School for |
| Vanguard Group since 2008; Director of Vanguard | Communication and the Graduate School of Education |
| Marketing Corporation; Managing Director of The | of the University of Pennsylvania; Member of the |
| Vanguard Group (1995–2008). | National Commission on the Humanities and Social |
| | Sciences; Trustee of Carnegie Corporation of New |
| IndependentTrustees | York and of the National Constitution Center; Chair |
| of the U. S. Presidential Commission for the Study |
| Emerson U. Fullwood | of Bioethical Issues. |
| Born 1948. Trustee Since January 2008. Principal | |
| Occupation(s) During the Past Five Years: Executive | JoAnn Heffernan Heisen |
| Chief Staff and Marketing Officer for North America | Born 1950. Trustee Since July 1998. Principal |
| and Corporate Vice President (retired 2008) of Xerox | Occupation(s) During the Past Five Years: Corporate |
| Corporation (document management products and | Vice President and Chief Global Diversity Officer |
| services); Executive in Residence and 2010 | (retired 2008) and Member of the Executive |
| Distinguished Minett Professor at the Rochester | Committee (1997–2008) of Johnson & Johnson |
| Institute of Technology; Director of SPX Corporation | (pharmaceuticals/medical devices/consumer |
| (multi-industry manufacturing), the United Way of | products); Director of Skytop Lodge Corporation |
| Rochester, Amerigroup Corporation (managed health | (hotels), the University Medical Center at Princeton, |
| care), the University of Rochester Medical Center, | the Robert Wood Johnson Foundation, and the Center |
| Monroe Community College Foundation, and North | for Talent Innovation; Member of the Advisory Board |
| Carolina A&T University. | of the Maxwell School of Citizenship and Public Affairs |
| | at Syracuse University. |
| |
| Rajiv L. Gupta | F. Joseph Loughrey |
| Born 1945. Trustee Since December 2001. 2 | Born 1949. Trustee Since October 2009. Principal |
| Principal Occupation(s) During the Past Five Years: | Occupation(s) During the Past Five Years: President |
| Chairman and Chief Executive Officer (retired 2009) | and Chief Operating Officer (retired 2009) of Cummins |
| and President (2006–2008) of Rohm and Haas Co. | Inc. (industrial machinery); Chairman of the Board of |
| (chemicals); Director of Tyco International, Ltd. | Hillenbrand, Inc. (specialized consumer services) and |
| (diversified manufacturing and services), Hewlett- | of Oxfam America; Director of SKF AB (industrial |
| Packard Co. (electronic computer manufacturing), | |
| | |
| machinery) and the Lumina Foundation for Education; | Executive Officers | |
| Member of the Advisory Council for the College of | | |
| Arts and Letters and of the Advisory Board to the | Glenn Booraem | |
| Kellogg Institute for International Studies, both at | Born 1967. Controller Since July 2010. Principal |
| the University of Notre Dame. | Occupation(s) During the Past Five Years: Principal |
| | of The Vanguard Group, Inc.; Controller of each of |
| Mark Loughridge | the investment companies served by The Vanguard |
| Born 1953. Trustee Since March 2012. Principal | Group; Assistant Controller of each of the investment |
| Occupation(s) During the Past Five Years: Senior Vice | companies served by The Vanguard Group (2001–2010). |
| President and Chief Financial Officer at IBM (information | | |
| technology services); Fiduciary Member of IBM’s | Thomas J. Higgins | |
| Retirement Plan Committee. | Born 1957. Chief Financial Officer Since September |
| | 2008. Principal Occupation(s) During the Past Five |
| Scott C. Malpass | Years: Principal of The Vanguard Group, Inc.; Chief |
| Born 1962. Trustee Since March 2012. Principal | Financial Officer of each of the investment companies |
| Occupation(s) During the Past Five Years: Chief | served by The Vanguard Group; Treasurer of each of |
| Investment Officer and Vice President at the University | the investment companies served by The Vanguard |
| of Notre Dame; Assistant Professor of Finance at the | Group (1998–2008). | |
| Mendoza College of Business at Notre Dame; Member | | |
| of the Notre Dame 403(b) Investment Committee; | Kathryn J. Hyatt | |
| Director of TIFF Advisory Services, Inc. (investment | Born 1955. Treasurer Since November 2008. Principal |
| advisor); Member of the Investment Advisory | Occupation(s) During the Past Five Years: Principal of |
| Committees of the Financial Industry Regulatory | The Vanguard Group, Inc.; Treasurer of each of the |
| Authority (FINRA) and of Major League Baseball. | investment companies served by The Vanguard |
| | Group; Assistant Treasurer of each of the investment |
| André F. Perold | companies served by The Vanguard Group (1988–2008). |
| Born 1952. Trustee Since December 2004. Principal | | |
| Occupation(s) During the Past Five Years: George | Heidi Stam | |
| Gund Professor of Finance and Banking at the Harvard | Born 1956. Secretary Since July 2005. Principal |
| Business School (retired 2011); Chief Investment | Occupation(s) During the Past Five Years: Managing |
| Officer and Managing Partner of HighVista Strategies | Director of The Vanguard Group, Inc.; General Counsel |
| LLC (private investment firm); Director of Rand | of The Vanguard Group; Secretary of The Vanguard |
| Merchant Bank; Overseer of the Museum of Fine | Group and of each of the investment companies |
| Arts Boston. | served by The Vanguard Group; Director and Senior |
| | Vice President of Vanguard Marketing Corporation. |
| Alfred M. Rankin, Jr. | | |
| Born 1941. Trustee Since January 1993. Principal | | |
| | Vanguard Senior ManagementTeam |
| Occupation(s) During the Past Five Years: Chairman, | | |
| President, and Chief Executive Officer of NACCO | Mortimer J. Buckley | Chris D. McIsaac |
| Industries, Inc. (housewares/lignite) and of Hyster-Yale | Kathleen C. Gubanich | Michael S. Miller |
| Materials Handling, Inc. (forklift trucks); Director of | Paul A. Heller | James M. Norris |
| the National Association of Manufacturers; Chairman | Martha G. King | Glenn W. Reed |
| of the Board of University Hospitals of Cleveland; | John T. Marcante | |
| Advisory Chairman of the Board of The Cleveland | |
| Museum of Art. | | |
| | Chairman Emeritus and Senior Advisor |
| | |
| Peter F. Volanakis | John J. Brennan | |
| Born 1955. Trustee Since July 2009. Principal | Chairman, 1996–2009 | |
| Occupation(s) During the Past Five Years: President | Chief Executive Officer and President, 1996–2008 |
| and Chief Operating Officer (retired 2010) of Corning | | |
| Incorporated (communications equipment); Director | Founder | |
| of SPX Corporation (multi-industry manufacturing); | | |
| Overseer of the Amos Tuck School of Business | John C. Bogle | |
| Administration at Dartmouth College; Advisor to the | Chairman and Chief Executive Officer, 1974–1996 |
| Norris Cotton Cancer Center. | | |
1 Mr. McNabb is considered an “interested person,” as defined in the Investment Company Act of 1940, because he is an officer of the Vanguard funds.
2 December 2002 for Vanguard Equity Income Fund, Vanguard Growth Equity Fund, the Vanguard Municipal Bond Funds, and the Vanguard State Tax-Exempt Funds.
|  |
| P.O. Box 2600 |
| Valley Forge, PA 19482-2600 |
Connect with Vanguard® > vanguard.com | |
| | |
Fund Information > 800-662-7447
Direct Investor Account Services > 800-662-2739
Institutional Investor Services > 800-523-1036
Text Telephone for People
With Hearing Impairment > 800-749-7273
This material may be used in conjunction
with the offering of shares of any Vanguard
fund only if preceded or accompanied by
the fund’s current prospectus.
All comparative mutual fund data are from Lipper, a
Thomson Reuters Company, or Morningstar, Inc., unless
otherwise noted.
You can obtain a free copy of Vanguard’s proxy voting
guidelines by visiting vanguard.com/proxyreporting or by
calling Vanguard at 800-662-2739. The guidelines are
also available from the SEC’s website, sec.gov. In
addition, you may obtain a free report on how your fund
voted the proxies for securities it owned during the 12
months ended June 30. To get the report, visit either
vanguard.com/proxyreporting or sec.gov.
You can review and copy information about your fund at
the SEC’s Public Reference Room in Washington, D.C. To
find out more about this public service, call the SEC at
202-551-8090. Information about your fund is also
available on the SEC’s website, and you can receive
copies of this information, for a fee, by sending a
request in either of two ways: via e-mail addressed to
publicinfo@sec.gov or via regular mail addressed to the
Public Reference Section, Securities and Exchange
Commission, Washington, DC 20549-1520. | |
| © 2013 The Vanguard Group, Inc.
All rights reserved.
Vanguard Marketing Corporation, Distributor.
102013 |
Item 2: Code of Ethics. The Registrant has adopted a code of ethics that applies to the Registrant’s principal executive officer, principal financial officer, principal accounting officer or controller or persons performing similar functions. The Code of Ethics was amended during the reporting period covered by this report to make certain technical, non-material changes.
Item 3: Audit Committee Financial Expert. The following members of the Audit Committee have been determined by the Registrant’s Board of Trustees to be Audit Committee Financial Experts serving on its Audit Committee, and to be independent: Rajiv L. Gupta, Amy Gutmann, JoAnn Heffernan Heisen, F. Joseph Loughrey, Mark Loughridge, Scott C. Malpass, André F. Perold, and Alfred M. Rankin, Jr.
Item 4: Principal Accountant Fees and Services.
(a) Audit Fees.
Audit Fees of the Registrant
Fiscal Year Ended August 31, 2013: $57,000
Fiscal Year Ended August 31, 2012: $56,000
Aggregate Audit Fees of Registered Investment Companies in the Vanguard Group.
Fiscal Year Ended August 31, 2013: $5,714,113
Fiscal Year Ended August 31, 2012: $4,809,780
Includes fees billed in connection with audits of the Registrant and other registered investment companies in the Vanguard complex. Also includes fees billed in connection with audits of The Vanguard Group, Inc. and Vanguard Marketing Corporation for Fiscal Year Ended August 31, 2013.
(b) Audit-Related Fees.
Fiscal Year Ended August 31, 2013: $1,552,950
Fiscal Year Ended August 31, 2012: $1,812,565
Includes fees billed in connection with assurance and related services provided to the Registrant, other registered investment companies in the Vanguard complex, The Vanguard Group, Inc., and Vanguard Marketing Corporation.
(c) Tax Fees.
Fiscal Year Ended August 31, 2013: $110,000
Fiscal Year Ended August 31, 2012: $490,518
Includes fees billed in connection with tax compliance, planning, and advice services provided to the Registrant, other registered investment companies in the Vanguard complex, The Vanguard Group, Inc., and Vanguard Marketing Corporation. Also includes fees billed in connection with certain tax services related to audits of the Registrant and other registered investment companies in the Vanguard complex for Fiscal Year Ended August 31, 2012.
(d) All Other Fees.
Fiscal Year Ended August 31, 2013: $132,000
Fiscal Year Ended August 31, 2012: $16,000
Includes fees billed in connection with tax compliance, planning, and advice services provided to the Registrant, other registered investment companies in the Vanguard complex, The Vanguard Group, Inc., and Vanguard Marketing Corporation.
(e) (1) Pre-Approval Policies. The policy of the Registrant’s Audit Committee is to consider and, if appropriate, approve before the principal accountant is engaged for such services, all specific audit and non-audit services provided to: the Registrant, other registered investment companies in the Vanguard complex, The Vanguard Group, Inc., and entities controlled by The Vanguard Group, Inc. that provide ongoing services to the Registrant. In making a determination, the Audit Committee considers whether the services are consistent with maintaining the principal accountant’s independence.
In the event of a contingency situation in which the principal accountant is needed to provide services in between scheduled Audit Committee meetings, the Chairman of the Audit Committee would be called on to consider and, if appropriate, pre-approve audit or permitted non-audit services in an amount sufficient to complete services through the next Audit Committee meeting, and to determine if such services would be consistent with maintaining the accountant’s independence. At the next scheduled Audit Committee meeting, services and fees would be presented to the Audit Committee for formal consideration, and, if appropriate, approval by the entire Audit Committee. The Audit Committee would again consider whether such services and fees are consistent with maintaining the principal accountant’s independence.
The Registrant’s Audit Committee is informed at least annually of all audit and non-audit services provided by the principal accountant to the Vanguard complex, whether such services are provided to: the Registrant, other registered investment companies in the Vanguard complex, The Vanguard Group, Inc., or other entities controlled by The Vanguard Group, Inc. that provide ongoing services to the Registrant.
(2) No percentage of the principal accountant’s fees or services were approved pursuant to the waiver provision of paragraph (c)(7)(i)(C) of Rule 2-01 of Regulation S-X.
(f) For the most recent fiscal year, over 50% of the hours worked under the principal accountant’s engagement were not performed by persons other than full-time, permanent employees of the principal accountant.
(g) Aggregate Non-Audit Fees.
Fiscal Year Ended August 31, 2013: $242,000
Fiscal Year Ended August 31, 2012: $506,518
Includes fees billed for non-audit services provided to the Registrant, other registered investment companies in the Vanguard complex, The Vanguard Group, Inc., and Vanguard Marketing Corporation.
(h) For the most recent fiscal year, the Audit Committee has determined that the provision of all non-audit services was consistent with maintaining the principal accountant’s independence.
Item 5: Audit Committee of Listed Registrants.
Not Applicable.
Item 6: Investments.
Not Applicable.
Item 7: Disclosure of Proxy Voting Policies and Procedures for Closed-End Management Investment Companies.
Not Applicable.
Item 8: Portfolio Managers of Closed-End Management Investment Companies.
Not Applicable.
Item 9: Purchase of Equity Securities by Closed-End Management Investment Company and Affiliated Purchasers.
Not Applicable.
Item 10: Submission of Matters to a Vote of Security Holders.
Not Applicable.
Item 11: Controls and Procedures.
(a) Disclosure Controls and Procedures. The Principal Executive and Financial Officers concluded that the Registrant’s Disclosure Controls and Procedures are effective based on their evaluation of the Disclosure Controls and Procedures as of a date within 90 days of the filing date of this report.
(b) Internal Control Over Financial Reporting. There were no significant changes in Registrant’s Internal Control Over Financial Reporting or in other factors that could significantly affect this control subsequent to the date of the evaluation, including any corrective actions with regard to significant deficiencies and material weaknesses.
Item 12: Exhibits.
(a) Code of Ethics.
(b) Certifications.
Pursuant to the requirements of the Securities Exchange Act of 1934 and the Investment Company Act of 1940, the registrant has duly caused this report to be signed on its behalf by the undersigned, thereunto duly authorized.
| |
| | VANGUARD MONEY MARKET RESERVES |
| |
| By: | /s/ F. WILLIAM MCNABB III* |
| | F. WILLIAM MCNABB III |
| | CHIEF EXECUTIVE OFFICER |
| |
| Date: October 21, 2013 |
Pursuant to the requirements of the Securities Exchange Act of 1934 and the Investment Company Act of 1940, this report has been signed below by the following persons on behalf of the registrant and in the capacities and on the dates indicated.
| |
| | VANGUARD MONEY MARKET RESERVES |
| |
| By: | /s/ F. WILLIAM MCNABB III* |
| | F. WILLIAM MCNABB III |
| | CHIEF EXECUTIVE OFFICER |
| |
| Date: October 21, 2013 |
| |
| | VANGUARD MONEY MARKET RESERVES |
| |
| By: | /s/ THOMAS J. HIGGINS* |
| | THOMAS J. HIGGINS |
| | CHIEF FINANCIAL OFFICER |
| |
| Date: October 21, 2013 |
* By: /s/ Heidi Stam
Heidi Stam, pursuant to a Power of Attorney filed on March 27, 2012 see file Number 2-11444, Incorporated by Reference.
