UNITED STATES
SECURITIES AND EXCHANGE COMMISSION
Washington, D.C. 20549
FORM N-CSR
CERTIFIED SHAREHOLDER REPORT
OF
REGISTERED MANAGEMENT INVESTMENT COMPANIES
Investment Company Act file number: 811-02554
Name of Registrant: Vanguard Money Market Reserves
Address of Registrant:
P.O. Box 2600
Valley Forge, PA 19482
Name and address of agent for service:
Heidi Stam, Esquire
P.O. Box 876
Valley Forge, PA 19482
Registrant’s telephone number, including area code: (610) 669-1000
Date of fiscal year end: August 31
Date of reporting period: September 1, 2011 – August 31, 2012
Item 1: Reports to Shareholders
|  |
| Annual Report | August 31, 2012 |
| |
| Vanguard Money Market Funds |
| |
| |
 |
| |
| Vanguard Prime Money Market Fund |
| Vanguard Federal Money Market Fund |
| Vanguard Admiral™ Treasury Money Market Fund |
> For the 12 months ended August 31, 2012, returns for the Vanguard Money Market Funds remained near 0%.
> The results can largely be attributed to the Federal Reserve’s monetary policy, which has kept short-term interest rates anchored near zero for more than three years.
> While yields are disappointingly low, our money market funds have continued to serve as high-quality, liquid investments for investors with short-term savings goals.
| |
| Contents | |
| Your Fund’s Total Returns. | 1 |
| Chairman’s Letter. | 2 |
| Advisor’s Report. | 8 |
| Prime Money Market Fund. | 10 |
| Federal Money Market Fund. | 34 |
| Admiral Treasury Money Market Fund. | 45 |
| About Your Fund’s Expenses. | 57 |
| Trustees Approve Advisory Arrangement. | 59 |
| Glossary. | 60 |
Please note: The opinions expressed in this report are just that—informed opinions. They should not be considered promises or advice.
Also, please keep in mind that the information and opinions cover the period through the date on the front of this report. Of course, the risks of investing in your fund are spelled out in the prospectus.
See the Glossary for definitions of investment terms used in this report.
About the cover: Our cover photograph shows rigging on the HMSSurprise, a replica of an 18th-century Royal Navy frigate. It was featured in a movie based on Patrick O’Brian’s sea novels, set amid the Napoleonic wars. Vanguard was named for another ship of that era, the HMS Vanguard, which was the flagship of British Admiral Horatio Nelson at the Battle of the Nile.
| | |
| Your Fund’s Total Returns | | |
| |
| |
| |
| |
| Fiscal Year Ended August 31, 2012 | | |
| |
| | 7-Day SEC | Total |
| | Yield | Returns |
| Vanguard Prime Money Market Fund | | |
| Investor Shares | 0.04% | 0.04% |
| Institutional Shares | 0.11 | 0.11 |
| Money Market Funds Average | | 0.00 |
| Money Market Funds Average: Derived from data provided by Lipper Inc. | | |
| |
| Vanguard Federal Money Market Fund | 0.01% | 0.01% |
| Government Money Market Funds Average | | 0.00 |
| Government Money Market Funds Average: Derived from data provided by Lipper Inc. | | |
| |
| Vanguard Admiral Treasury Money Market Fund | 0.02% | 0.01% |
| iMoneyNet Money Fund Report’s 100% Treasury Funds Average | | 0.00 |
iMoneyNet Money Fund Report’s 100% Treasury Funds Average: Derived from data provided by iMoneyNet, Inc.
The 7-day SEC yield of a money market fund more closely reflects the current earnings of the fund than its total return.
Institutional Shares are available to certain institutional investors who meet specific administrative, service, and account-size criteria.
1

Chairman’s Letter
Dear Shareholder,
The past 12 months were marked by familiar concerns—the pace of the recovery in the United States, the debt crisis in Europe, and a slowdown in growth in emerging markets. And the response from the Federal Reserve and a number of central banks abroad was familiar as well—further monetary policy action to lower borrowing costs for households and corporations.
In this environment of cheap money, returns for the Vanguard Money Market Funds hovered near zero. The Prime Money Market Fund returned 0.04% for Investor Shares, while Institutional Shares, with their lower expense ratio, fared slightly better at 0.11%. Both the Federal and Admiral Treasury Money Market Funds returned 0.01%. Although it’s of little comfort, the funds managed to do better than the average return of 0.00% for their peer groups.
As of August 31, 2012, the Prime Money Market Fund’s 7-day SEC yield had inched up to 0.04% from 0.03% a year earlier for Investor Shares and stood unchanged at 0.11% for Institutional Shares. Yields of the Federal and Admiral Treasury Money Market Funds were 0.01% and 0.02%, respectively, compared with 0.01% for both funds a year earlier. (These two funds have been closed to new investors since 2009.) All three money market funds maintained a net asset value of $1 per share, as is expected but not guaranteed.
2
Near the end of the period under review, the Securities and Exchange Commission announced that it would not move ahead at that time with proposed regulatory changes for money market funds. These changes would have gone beyond the significant regulatory improvements the SEC adopted in 2010. Regulators continue to evaluate money market funds, however, and debate about next steps continues. While the regulatory environment may be in flux, that has not affected the high standards for credit quality and liquidity that we have always applied to Vanguard money market funds as we seek to provide a stable and liquid cash-management tool for investors.
Bonds continued their march, as yields dropped to record lows
Bonds produced solid returns for the period; the broad U.S. taxable market advanced nearly 6% for the 12 months. Long-term U.S. Treasuries were particularly strong as they benefited from the Federal Reserve’s bond-buying program, known as Operation Twist.
As bond prices rose, the yield of the 10-year U.S. Treasury note fell to a record low in July, closing below 1.5%. (Bond yields and prices move in opposite directions.) Bondholders have enjoyed years of strong returns. But as Tim Buckley, our incoming chief investment
| | | |
| Market Barometer | | | |
| | | Average Annual Total Returns |
| | | Periods Ended August 31, 2012 |
| | One | Three | Five |
| | Year | Years | Years |
| Bonds | | | |
| Barclays U.S. Aggregate Bond Index (Broad taxable | | | |
| market) | 5.78% | 6.51% | 6.66% |
| Barclays Municipal Bond Index (Broad tax-exempt market) | 8.78 | 7.02 | 6.24 |
| Citigroup Three-Month U.S. Treasury Bill Index | 0.05 | 0.08 | 0.71 |
| |
| Stocks | | | |
| Russell 1000 Index (Large-caps) | 17.33% | 13.82% | 1.47% |
| Russell 2000 Index (Small-caps) | 13.40 | 13.89 | 1.90 |
| Dow Jones U.S. Total Stock Market Index | 16.74 | 13.87 | 1.73 |
| MSCI All Country World Index ex USA (International) | -1.92 | 3.64 | -3.59 |
| |
| CPI | | | |
| Consumer Price Index | 1.69% | 2.20% | 2.07% |
3
officer, has noted, investors shouldn’t be surprised if future results are more modest. As yields tumble, the scope for further declines—and price increases—diminishes.
As it has since December 2008, the Federal Reserve Board held its target for the shortest-term interest rates between 0% and 0.25%, keeping a tight rein on the returns from money market funds and savings accounts.
U.S. stocks shook off concerns to produce double-digit returns
U.S. stocks generated robust gains, returning nearly 17%. They seemed to get a lift as the U.S. economy continued to grow, albeit at a modest rate, and avoided the “double-dip” recession that some investors had feared.
Though European stocks posted strong returns in local-currency terms, this performance was much more modest when converted into U.S. dollars—a result of the dollar’s strengthening against the euro during the 12 months. Signs of slowing economic growth restrained returns for emerging markets and the developed markets of the Pacific region.
Questions about the finances of European governments and banks continued to preoccupy investors. Although the situation in Europe is very fluid, Vanguard
Expense Ratios
Your Fund Compared With Its Peer Group
| | | |
| | Investor | Institutional | Peer Group |
| | Shares | Shares | Average |
| Prime Money Market Fund | 0.20% | 0.09% | 0.28% |
| Federal Money Market Fund | 0.20 | — | 0.19 |
| Admiral Treasury Money Market Fund | 0.12 | — | 0.16 |
The fund expense ratios shown are from the prospectus dated December 27, 2011, and represent estimated costs for the current fiscal year. For the fiscal year ended August 31, 2012, the funds’ expense ratios were: for the Prime Money Market Fund, 0.16% for Investor Shares and 0.09% for Institutional Shares; for the Federal Money Market Fund, 0.12%; for the Admiral Treasury Money Market Fund, 0.05%. The expense ratios for the Federal Money Market Fund and the Admiral Treasury Money Market Fund reflect a temporary reduction in operating expenses (described in Note B of the Notes to Financial Statements). Before the reduction, the expense ratios were: for the Federal Money Market Fund, 0.16%; for the Admiral Treasury Money Market Fund, 0.10%.
Peer groups: For the Prime Money Market Fund, Money Market Funds; for the Federal Money Market Fund, Government Money Market Funds; and for the Admiral Treasury Money Market Fund, U.S. Treasury Money Market Funds.
4
economists believe the most likely scenario is that the Eurozone will “muddle through” for several years, with occasional spikes in market volatility, as fiscal tightening continues in the face of weak economic growth.
Monetary policy keeping a lid on money market returns
Signs that global growth was slowing over the past 12 months spurred central banks around the world into action. While China, Brazil, and the European Central Bank cut their interest rates, the Federal Reserve had little room to maneuver given that it has kept the federal funds rate at a target range of 0.00%–0.25% since 2008. However, the Fed announced in January that it was extending the period through which it expects interest rates to remain “exceptionally low” from mid-2013 to late 2014. (It pushed the date out even further—to mid-2015—just after the close of the period under review.) And in June, citing weak economic data as well as “significant downside risks” in global financial markets, the Fed lowered its growth forecast for the U.S. economy and announced it would extend its Operation Twist program until the end of 2012. Through the program, which began in September 2011 and was originally scheduled to end in June, the Fed sells shorter-term Treasuries and buys longer-term ones to drive down longer-term financing costs.
Operation Twist, along with sustained demand for longer-term Treasuries as a safe haven in turbulent financial markets,
Total Returns
Ten Years Ended August 31, 2012
| |
| | Average |
| | Annual Return |
| Prime Money Market Fund Investor Shares | 1.88% |
| Money Market Funds Average | 1.45 |
| Money Market Funds Average: Derived from data provided by Lipper Inc. | |
| |
| Federal Money Market Fund | 1.81% |
| Government Money Market Funds Average | 1.42 |
| Government Money Market Funds Average: Derived from data provided by Lipper Inc. | |
| |
| Admiral Treasury Money Market Fund | 1.73% |
| iMoneyNet Money Fund Report’s 100% Treasury Funds Average | 1.27 |
| iMoneyNet Money Fund Report’s 100% Treasury Funds Average: Derived from data provided by iMoneyNet, Inc. | |
Investment returns will fluctuate. All of the returns in this report represent past performance, which is not a guarantee of future results that may be achieved by the funds. (Current performance may be lower or higher than the performance data cited. For performance data current to the most recent month-end, visit our website at vanguard.com/performance.) An investment in a money market fund is not insured or guaranteed by the Federal Deposit Insurance Corporation or any other government agency. Although a money market fund seeks to preserve the value of your investment at $1 per share, it is possible to lose money by investing in such a fund.
5
contributed to a flattening of the yield curve during the 12-month period: Yields of Treasuries with maturities of less than 3 years rose slightly, while yields of securities with longer maturities declined (the yield of the 3-month T-bill, for example, rose from 0.01% to 0.09%, while the yield of the 10-year Treasury note fell from 2.22% to 1.56%).
With yields low across all money market instruments, returns for all three Vanguard funds hovered near zero. That said, the funds’ advisor, Vanguard (through its Fixed Income Group), continued to seek as much income as possible while maintaining high credit-quality standards.
The Prime Money Market Fund had exposure to the debt of foreign banks in the form of commercial paper (a type of unsecured loan) and dollar-denominated certificates of deposit. Because of the ongoing financial troubles in Europe, the advisor had eliminated all of the fund’s direct exposure to European banks by the end of 2011 while increasing its exposure to Australian and Canadian banks of higher credit quality. Altogether, holdings of foreign banks stood at around 19% of the fund’s assets at the end of the 12-month period.
| | |
| Changes in Yields | | |
| | | 7-Day SEC Yield |
| | August 31, | August 31, |
| | 2012 | 2011 |
| Prime Money Market Fund | | |
| Investor Shares | 0.04% | 0.03% |
| Institutional Shares | 0.11 | 0.11 |
| Federal Money Market Fund | 0.01 | 0.01 |
| Admiral Treasury Money Market Fund | 0.02 | 0.01 |
6
The Prime Money Market Fund also had limited exposure to corporate debt as well as to repurchase agreements, which represent very short-term loans of government securities.
Looking at a decade of returns paints a brighter picture
Short-term interest rates have not always been as low as they are now. Despite near-zero returns for the past several years, the Prime Money Market Fund generated an average annualized return for the past ten years of 1.88% for Investor Shares and 2.04% for Institutional Shares. The Federal and Admiral Treasury Money Market Funds returned 1.81% and 1.73%, respectively, for the same period. On a comparative basis, all three funds performed well, outpacing the average returns of their peer-fund groups.
Why have money market funds in your portfolio?
We believe that every asset in your portfolio should be there for a reason. With yields from money market funds so low, some investors might be wondering if their money wouldn’t be better off elsewhere. But if you have a short-term savings goal, holding a money market fund in your portfolio can still make sense. Like the yields on other savings vehicles, the yields of the Vanguard Money Market Funds have been disappointing. The funds have nevertheless succeeded in providing savers with a stable, highly liquid place to hold cash for shorter-term needs. These funds invest in high-quality, short-term instruments with the aim of preserving your capital in both stable financial markets and in periods of uncertainty. And they are designed to ensure that your capital is readily available should you need to access it.
But not all money market funds are created equal. Our in-house credit analysis has allowed us to avoid some of the recent potholes—in the Prime Money Market Fund, for example, we eliminated direct exposure to French, Italian, and Spanish banks back in December 2010. And preserving liquidity is a central goal, so in periods of market volatility, the advisor will often tilt the Prime Money Market Fund’s allocation toward U.S. Treasury securities, as it did during the financial crisis.
For further details on how our money market funds are managed and what role they can play in a portfolio, we invite you to consult a recent Vanguard commentary on that topic, The Buck Stops Here: Vanguard Money Market Funds, available at vanguard.com/research.
As always, thank you for your confidence in Vanguard.
Sincerely,

F. William McNabb III
Chairman and Chief Executive Officer
September 14, 2012
7
Advisor’s Report
With short-term interest rates anchored near zero, returns for the three Vanguard Money Market Funds for the 12 months ended August 31, 2012, ranged from 0.01% for the Federal and Admiral Treasury Money Market Funds to 0.11% for Institutional Shares of the Prime Money Market Fund.
During the period, the weak labor market and strains in global financial markets prompted further monetary action from the Federal Reserve. In September 2011, it announced “Operation Twist,” which involves selling short-term U.S. Treasuries and reinvesting the proceeds in longer-dated Treasuries with the aim of driving down financing costs for businesses and consumers. And to aid the mortgage market in particular, the Fed began reinvesting maturing positions in agency debt and agency mortgage-backed securities (MBS) in additional agency MBS. In June 2012, it announced that Operation Twist would continue through the end of the year and that the federal funds target rate was likely to remain extremely low through 2014 rather than through mid-2013, as it had previously indicated (a timetable it extended even further in September).
Toward the end of the period, the Securities and Exchange Commission announced that it would not be moving forward for the time being with a number of regulatory changes for money market funds beyond those adopted in 2010.
At this time, policymakers and other regulatory bodies continue to debate whether additional changes might be called for.
Portfolio adjustments
Given the uncertainties in the financial markets and our conservative approach to investing, shifts in the funds’ asset mix during the period were generally not that significant, as they reflected a search for relative value, but only among very high-quality assets. For example, we favored the higher yields of agency securities compared with Treasuries at the beginning of the period, but as the difference in their yields narrowed, we added Treasuries for their liquidity.
Similarly, we sought out investment opportunities among foreign banks (in the form of certificates of deposit and commercial paper), but limited our holdings to high-quality Canadian and Australian financial institutions while eliminating all exposure to European banks.
More than a dozen global banks, including five centered in the United States, were downgraded by Moody’s Investors Service in June. As the move was largely anticipated, we were able to make adjustments to the Prime Money Market Fund well in advance of the downgrades, avoiding any significant impact to its portfolio.
8
The outlook
Short-term interest rates don’t look likely to move higher any time soon. Just after the close of the period under review, the Federal Reserve announced that it was once again pushing out how long it expects to keep the federal funds rate at “exceptionally low levels,” this time until at least mid-2015. The Fed also announced that it would start buying $40 billion of mortgage-backed securities per month, which will certainly provide further support to that segment of the market.
The situation in Europe remains a concern. Although European governments have taken significant steps to address some of the liquidity issues in their own marketplace, the conditions that were problematic two years ago are still in place today. We will continue to monitor developments in Europe, but are likely to remain on the sidelines until we see fundamental improvements.
We will continue to position the portfolios conservatively, given the level of uncertainty in the markets, which means favoring the credit quality and price stability afforded by U.S. Treasuries and agency securities.
David R. Glocke, Principal
Vanguard Fixed Income Group
September 14, 2012
9
Prime Money Market Fund
Fund Profile
As of August 31, 2012
| | |
| Financial Attributes | | |
| | Investor | Institutional |
| | Shares | Shares |
| Ticker Symbol | VMMXX | VMRXX |
| Expense Ratio1 | 0.20% | 0.09% |
| 7-Day SEC Yield | 0.04% | 0.11% |
| Average Weighted | | |
| Maturity | 58 days | 58 days |
| |
| Sector Diversification (% of portfolio) | |
| Commercial Paper | 9.5% |
| Certificates of Deposit | 4.9 |
| Yankee/Foreign | 26.1 |
| U.S. Treasury Bills | 32.8 |
| U.S. Government Agency Obligations | 21.3 |
| Repurchase Agreements | 0.2 |
| Other | 5.2 |
The agency and mortgage-backed securities sectors may include issues from government-sponsored enterprises; such issues are generally not backed by the full faith and credit of the U.S. government.
| |
| Distribution by Credit Quality (% of portfolio) | |
| First Tier | 100.0% |
For information about these ratings, see the Glossary entry for Credit Quality.
1 The expense ratios shown are from the prospectus dated December 27, 2011, and represent estimated costs for the current fiscal year. For the fiscal year ended August 31, 2012, the expense ratios were 0.16% for Investor Shares and 0.09% for Institutional Shares.
10
Prime Money Market Fund
Performance Summary
Investment returns will fluctuate. All of the returns in this report represent past performance, which is not a guarantee of future results that may be achieved by the fund. (Current performance may be lower or higher than the performance data cited. For performance data current to the most recent month-end, visit our website at vanguard.com/performance.) The returns shown do not reflect taxes that a shareholder would pay on fund distributions. An investment in a money market fund is not insured or guaranteed by the Federal Deposit Insurance Corporation or any other government agency. Although the fund seeks to preserve the value of your investment at $1 per share, it is possible to lose money by investing in the fund. The fund’s 7-day SEC yield reflects its current earnings more closely than do the average annual returns.
Cumulative Performance: August 31, 2002, Through August 31, 2012
Initial Investment of $10,000

| | | | |
| | | Average Annual Total Returns | |
| | | Periods Ended August 31, 2012 | |
| | | | | Final Value |
| | One | Five | Ten | of a $10,000 |
| | Year | Years | Years | Investment |
| Prime Money Market Fund Investor | | | | |
| Shares | 0.04% | 1.01% | 1.88% | $12,046 |
| Money Market Funds Average | 0.00 | 0.73 | 1.45 | 11,543 |
| Citigroup Three-Month U.S. Treasury | | | | |
| Bill Index | 0.05 | 0.71 | 1.74 | 11,882 |
Money Market Funds Average: Derived from data provided by Lipper Inc.
| | | | |
| | | | | Final Value |
| | One | Five | Ten | of a $5,000,000 |
| | Year | Years | Years | Investment |
| Prime Money Market Fund Institutional | | | | |
| Shares | 0.11% | 1.13% | 2.04% | $6,120,361 |
| Institutional Money Market Funds Average | 0.05 | 0.91 | 1.76 | 5,951,705 |
| Citigroup Three-Month U.S. Treasury Bill | | | | |
| Index | 0.05 | 0.71 | 1.74 | 5,941,062 |
See Financial Highlights for dividend information.
11
Prime Money Market Fund
Fiscal-Year Total Returns (%): August 31, 2002, Through August 31, 2012
| | |
| | | Money |
| | | Market |
| | | Funds |
| | Investor Shares | Average |
| Fiscal Year | Total Returns | Total Returns |
| 2003 | 1.12 % | 0.60% |
| 2004 | 0.83 | 0.39 |
| 2005 | 2.31 | 1.68 |
| 2006 | 4.38 | 3.69 |
| 2007 | 5.23 | 4.55 |
| 2008 | 3.60 | 3.02 |
| 2009 | 1.31 | 0.62 |
| 2010 | 0.08 | 0.02 |
| 2011 | 0.06 | 0.00 |
| 2012 | 0.04 | 0.00 |
7-day SEC yield (8/31/2012): 0.04%
Money Market Funds Average: Derived from data provided by Lipper Inc.
Average Annual Total Returns: Periods Ended June 30, 2012
This table presents returns through the latest calendar quarter—rather than through the end of the fiscal period.
Securities and Exchange Commission rules require that we provide this information.
| | | | |
| | Inception | One | Five | Ten |
| | Date | Year | Years | Years |
| Investor Shares | 6/4/1975 | 0.03% | 1.18% | 1.91% |
| Institutional Shares | 10/3/1989 | 0.10 | 1.31 | 2.07 |
12
Prime Money Market Fund
Financial Statements
Statement of Net Assets
As of August 31, 2012
The fund reports a complete list of its holdings in various monthly and quarterly regulatory filings. The fund publishes its holdings on a monthly basis at vanguard.com and files them with the Securities and Exchange Commission on Form N-MFP. The fund’s Form N-MFP filings become public 60 days after the relevant month-end, and may be viewed at sec.gov or via a link on the “Portfolio Holdings” page on vanguard.com. For the second and fourth fiscal quarters, the lists appear in the fund’s semiannual and annual reports to shareholders. For the first and third fiscal quarters, the fund files the lists with the SEC on Form N-Q. Shareholders can look up the fund’s Forms N-Q on the SEC’s website at sec.gov. Forms N-Q may also be reviewed and copied at the SEC’s Public Reference Room (see the back cover of this report for further information).
| | | | | |
| | | | | Face | Market |
| | | | Maturity | Amount | Value |
| | | Yield1 | Date | ($000) | ($000) |
| U.S. Government and Agency Obligations (54.1%) | | | |
| 2 | Fannie Mae Discount Notes | 0.160% | 9/4/12 | 74,000 | 73,999 |
| 2 | Fannie Mae Discount Notes | 0.160% | 9/5/12 | 50,000 | 49,999 |
| 2 | Fannie Mae Discount Notes | 0.130% | 9/12/12 | 50,000 | 49,998 |
| 2 | Fannie Mae Discount Notes | 0.130% | 9/19/12 | 160,000 | 159,990 |
| 2 | Fannie Mae Discount Notes | 0.130% | 9/26/12 | 71,000 | 70,994 |
| 2 | Fannie Mae Discount Notes | 0.160% | 10/3/12 | 107,000 | 106,985 |
| 2 | Fannie Mae Discount Notes | 0.130%–0.140% | 10/10/12 | 151,000 | 150,978 |
| 2 | Fannie Mae Discount Notes | 0.136% | 10/31/12 | 59,000 | 58,987 |
| 2 | Fannie Mae Discount Notes | 0.130%–0.135% | 11/7/12 | 338,303 | 338,219 |
| 2 | Fannie Mae Discount Notes | 0.130% | 11/14/12 | 82,500 | 82,478 |
| 2 | Fannie Mae Discount Notes | 0.160% | 2/6/13 | 99,400 | 99,330 |
| 3 | Federal Home Loan Bank Discount Notes | 0.130%–0.160% | 9/5/12 | 81,454 | 81,453 |
| 3 | Federal Home Loan Bank Discount Notes | 0.125% | 9/7/12 | 331,500 | 331,493 |
| 3 | Federal Home Loan Bank Discount Notes | 0.125%–0.130% | 9/12/12 | 476,100 | 476,081 |
| 3 | Federal Home Loan Bank Discount Notes | 0.135% | 9/14/12 | 192,000 | 191,991 |
| 3 | Federal Home Loan Bank Discount Notes | 0.130%–0.160% | 9/19/12 | 311,000 | 310,980 |
| 3 | Federal Home Loan Bank Discount Notes | 0.130% | 9/21/12 | 670,250 | 670,202 |
| 3 | Federal Home Loan Bank Discount Notes | 0.125%–0.130% | 9/26/12 | 1,195,000 | 1,194,893 |
| 3 | Federal Home Loan Bank Discount Notes | 0.130% | 9/28/12 | 158,500 | 158,484 |
| 3 | Federal Home Loan Bank Discount Notes | 0.134% | 10/3/12 | 1,050,000 | 1,049,875 |
| 3 | Federal Home Loan Bank Discount Notes | 0.140% | 10/10/12 | 1,103,900 | 1,103,733 |
| 3 | Federal Home Loan Bank Discount Notes | 0.140%–0.145% | 10/12/12 | 307,000 | 306,950 |
| 3 | Federal Home Loan Bank Discount Notes | 0.130%–0.140% | 10/17/12 | 208,305 | 208,269 |
| 3 | Federal Home Loan Bank Discount Notes | 0.130% | 10/19/12 | 1,335,215 | 1,334,984 |
| 3 | Federal Home Loan Bank Discount Notes | 0.128%–0.130% | 11/7/12 | 723,600 | 723,426 |
| 3 | Federal Home Loan Bank Discount Notes | 0.137%–0.140% | 11/9/12 | 499,050 | 498,919 |
| 3 | Federal Home Loan Bank Discount Notes | 0.135%–0.140% | 11/14/12 | 467,200 | 467,067 |
| 3 | Federal Home Loan Bank Discount Notes | 0.130% | 11/16/12 | 150,400 | 150,359 |
| 3 | Federal Home Loan Bank Discount Notes | 0.130% | 11/21/12 | 401,300 | 401,183 |
| 3 | Federal Home Loan Bank Discount Notes | 0.130% | 11/23/12 | 703,726 | 703,515 |
| 3 | Federal Home Loan Bank Discount Notes | 0.130% | 11/28/12 | 250,000 | 249,920 |
| 3 | Federal Home Loan Bank Discount Notes | 0.160% | 2/22/13 | 350,000 | 349,729 |
| 2,4 | Federal Home Loan Mortgage Corp. | 0.194% | 2/4/13 | 1,000,000 | 999,782 |
| 2,4 | Federal Home Loan Mortgage Corp. | 0.197% | 3/21/13 | 907,000 | 906,747 |
| 2,4 | Federal Home Loan Mortgage Corp. | 0.194% | 5/6/13 | 980,000 | 979,681 |
| 2,4 | Federal Home Loan Mortgage Corp. | 0.195% | 6/3/13 | 950,000 | 949,711 |
13
| | | | | |
| Prime Money Market Fund | | | | |
| |
| |
| |
| | | | | Face | Market |
| | | | Maturity | Amount | Value |
| | | Yield1 | Date | ($000) | ($000) |
| 2,4 | Federal Home Loan Mortgage Corp. | 0.188% | 6/17/13 | 83,000 | 82,967 |
| 2,4 | Federal National Mortgage Assn. | 0.268% | 9/17/12 | 988,000 | 987,991 |
| 2,4 | Federal National Mortgage Assn. | 0.258% | 11/23/12 | 1,772,795 | 1,772,673 |
| 2,4 | Federal National Mortgage Assn. | 0.267% | 12/20/12 | 494,500 | 494,470 |
| 2,4 | Federal National Mortgage Assn. | 0.266% | 12/28/12 | 219,000 | 218,986 |
| 2,4 | Federal National Mortgage Assn. | 0.229% | 8/12/13 | 1,000,000 | 999,713 |
| 2,4 | Federal National Mortgage Assn. | 0.213% | 11/8/13 | 1,250,000 | 1,249,551 |
| 2,4 | Federal National Mortgage Assn. | 0.210% | 11/14/13 | 1,000,000 | 999,643 |
| 2 | Freddie Mac Discount Notes | 0.140%–0.160% | 9/4/12 | 314,968 | 314,964 |
| 2 | Freddie Mac Discount Notes | 0.130%–0.150% | 9/10/12 | 199,000 | 198,993 |
| 2 | Freddie Mac Discount Notes | 0.130%–0.160% | 9/17/12 | 373,077 | 373,055 |
| 2 | Freddie Mac Discount Notes | 0.160% | 9/24/12 | 90,000 | 89,991 |
| 2 | Freddie Mac Discount Notes | 0.160% | 10/3/12 | 20,590 | 20,587 |
| 2 | Freddie Mac Discount Notes | 0.140% | 10/9/12 | 200,000 | 199,970 |
| 2 | Freddie Mac Discount Notes | 0.135% | 10/11/12 | 42,000 | 41,994 |
| 2 | Freddie Mac Discount Notes | 0.130% | 10/25/12 | 84,300 | 84,284 |
| 2 | Freddie Mac Discount Notes | 0.140% | 11/13/12 | 125,000 | 124,964 |
| 2 | Freddie Mac Discount Notes | 0.130% | 11/26/12 | 125,429 | 125,390 |
| | United States Treasury Bill | 0.100%–0.135% | 9/6/12 | 1,636,500 | 1,636,473 |
| | United States Treasury Bill | 0.085%–0.090% | 9/13/12 | 1,118,649 | 1,118,623 |
| | United States Treasury Bill | 0.150% | 9/27/12 | 1,950,000 | 1,949,789 |
| | United States Treasury Bill | 0.140% | 10/4/12 | 2,725,000 | 2,724,650 |
| | United States Treasury Bill | 0.150% | 10/11/12 | 2,500,000 | 2,499,583 |
| | United States Treasury Bill | 0.111% | 10/18/12 | 300,000 | 299,956 |
| | United States Treasury Bill | 0.108%–0.110% | 10/25/12 | 331,699 | 331,644 |
| | United States Treasury Bill | 0.105%–0.150% | 11/1/12 | 1,270,000 | 1,269,711 |
| | United States Treasury Bill | 0.084%–0.107% | 11/8/12 | 600,000 | 599,922 |
| | United States Treasury Bill | 0.133%–0.150% | 11/15/12 | 2,525,000 | 2,524,250 |
| | United States Treasury Bill | 0.105%–0.147% | 11/23/12 | 2,792,562 | 2,791,727 |
| | United States Treasury Bill | 0.141%–0.146% | 11/29/12 | 1,292,000 | 1,291,543 |
| | United States Treasury Bill | 0.130% | 12/6/12 | 155,000 | 154,947 |
| | United States Treasury Bill | 0.140%–0.141% | 12/13/12 | 1,800,000 | 1,799,277 |
| | United States Treasury Bill | 0.146%–0.148% | 12/20/12 | 800,000 | 799,640 |
| | United States Treasury Bill | 0.145%–0.153% | 12/27/12 | 1,900,000 | 1,899,080 |
| | United States Treasury Bill | 0.147%–0.148% | 1/10/13 | 564,405 | 564,102 |
| | United States Treasury Bill | 0.140%–0.153% | 1/17/13 | 2,000,000 | 1,998,873 |
| | United States Treasury Bill | 0.140%–0.141% | 1/24/13 | 1,450,000 | 1,449,177 |
| | United States Treasury Bill | 0.146%–0.147% | 1/31/13 | 1,490,000 | 1,489,078 |
| | United States Treasury Bill | 0.138%–0.142% | 2/7/13 | 1,800,000 | 1,798,885 |
| | United States Treasury Bill | 0.145% | 2/14/13 | 400,000 | 399,732 |
| | United States Treasury Bill | 0.144%–0.145% | 2/21/13 | 1,600,000 | 1,598,887 |
| | United States Treasury Note/Bond | 1.375% | 9/15/12 | 500,000 | 500,242 |
| | United States Treasury Note/Bond | 4.250% | 9/30/12 | 1,454,000 | 1,458,745 |
| | United States Treasury Note/Bond | 1.375% | 10/15/12 | 350,000 | 350,514 |
| | United States Treasury Note/Bond | 0.375% | 10/31/12 | 477,000 | 477,174 |
| | United States Treasury Note/Bond | 1.375% | 11/15/12 | 450,000 | 451,116 |
| | United States Treasury Note/Bond | 4.000% | 11/15/12 | 250,000 | 251,967 |
| | United States Treasury Note/Bond | 0.500% | 11/30/12 | 200,000 | 200,167 |
| | United States Treasury Note/Bond | 3.875% | 2/15/13 | 900,000 | 915,123 |
| Total U.S. Government and Agency Obligations (Cost $62,016,167) | | | 62,016,167 |
| Commercial Paper (21.7%) | | | | |
| Bank Holding Company (0.2%) | | | | |
| | PNC Bank NA | 0.210% | 12/3/12 | 217,000 | 216,882 |
14
| | | | |
| Prime Money Market Fund | | | | |
| |
| |
| |
| | | | Face | Market |
| | | Maturity | Amount | Value |
| | Yield1 | Date | ($000) | ($000) |
| Finance—Auto (1.6%) | | | | |
| American Honda Finance Corp. | 0.180%–0.190% | 9/21/12 | 192,000 | 191,980 |
| American Honda Finance Corp. | 0.190% | 9/24/12 | 114,500 | 114,486 |
| American Honda Finance Corp. | 0.190% | 10/9/12 | 47,000 | 46,991 |
| American Honda Finance Corp. | 0.190% | 10/18/12 | 89,400 | 89,378 |
| American Honda Finance Corp. | 0.190% | 10/22/12 | 87,350 | 87,326 |
| 5 BMW US Capital LLC | 0.170% | 9/10/12 | 24,500 | 24,499 |
| 5 BMW US Capital LLC | 0.170% | 9/13/12 | 161,000 | 160,991 |
| 5 BMW US Capital LLC | 0.170% | 9/18/12 | 118,000 | 117,990 |
| 5 BMW US Capital LLC | 0.200% | 11/21/12 | 23,000 | 22,990 |
| 5 BMW US Capital LLC | 0.200% | 11/29/12 | 25,000 | 24,988 |
| Toyota Motor Credit Corp. | 0.381% | 10/2/12 | 26,250 | 26,241 |
| Toyota Motor Credit Corp. | 0.381% | 10/9/12 | 168,000 | 167,933 |
| Toyota Motor Credit Corp. | 0.371% | 10/15/12 | 31,500 | 31,486 |
| Toyota Motor Credit Corp. | 0.401% | 11/13/12 | 51,000 | 50,959 |
| Toyota Motor Credit Corp. | 0.401% | 11/14/12 | 137,500 | 137,387 |
| Toyota Motor Credit Corp. | 0.321% | 12/10/12 | 225,000 | 224,800 |
| Toyota Motor Credit Corp. | 0.321% | 12/13/12 | 194,000 | 193,822 |
| Toyota Motor Credit Corp. | 0.341% | 2/19/13 | 45,750 | 45,676 |
| Toyota Motor Credit Corp. | 0.341% | 2/20/13 | 112,500 | 112,317 |
| | | | | 1,872,240 |
| Finance—Other (5.3%) | | | | |
| 5 Chariot Funding LLC | 0.220% | 11/14/12 | 46,000 | 45,979 |
| 5 Chariot Funding LLC | 0.220% | 11/15/12 | 39,000 | 38,982 |
| General Electric Capital Corp. | 0.210% | 9/26/12 | 392,000 | 391,943 |
| General Electric Capital Corp. | 0.240% | 10/29/12 | 39,000 | 38,985 |
| General Electric Capital Corp. | 0.180% | 11/2/12 | 172,000 | 171,947 |
| General Electric Capital Corp. | 0.180% | 11/5/12 | 172,000 | 171,944 |
| General Electric Capital Corp. | 0.180% | 11/7/12 | 117,600 | 117,561 |
| General Electric Capital Corp. | 0.180% | 11/8/12 | 157,000 | 156,947 |
| General Electric Capital Corp. | 0.180% | 11/13/12 | 194,000 | 193,929 |
| General Electric Capital Corp. | 0.180% | 11/29/12 | 344,000 | 343,847 |
| 5 Jupiter Securitization Co. LLC | 0.220% | 11/14/12 | 100,000 | 99,955 |
| 5 Jupiter Securitization Co. LLC | 0.220% | 11/16/12 | 78,000 | 77,964 |
| 5 Old Line Funding LLC | 0.200% | 9/10/12 | 72,048 | 72,044 |
| 5 Old Line Funding LLC | 0.200%–0.210% | 9/17/12 | 64,500 | 64,494 |
| 5 Old Line Funding LLC | 0.200% | 9/24/12 | 79,000 | 78,990 |
| 5 Old Line Funding LLC | 0.200% | 9/25/12 | 96,500 | 96,487 |
| 5 Old Line Funding LLC | 0.210% | 10/1/12 | 138,000 | 137,976 |
| 5 Old Line Funding LLC | 0.210% | 10/15/12 | 202,500 | 202,448 |
| 5 Old Line Funding LLC | 0.200% | 10/18/12 | 106,000 | 105,972 |
| 5 Old Line Funding LLC | 0.200% | 10/22/12 | 213,400 | 213,340 |
| 5 Old Line Funding LLC | 0.200%–0.210% | 10/23/12 | 194,200 | 194,143 |
| 5 Old Line Funding LLC | 0.200% | 10/25/12 | 28,912 | 28,903 |
| 5 Old Line Funding LLC | 0.200% | 10/29/12 | 79,850 | 79,824 |
| 5 Old Line Funding LLC | 0.200% | 11/2/12 | 38,000 | 37,987 |
| 5 Old Line Funding LLC | 0.200% | 11/5/12 | 58,000 | 57,979 |
| 5 Old Line Funding LLC | 0.200% | 11/7/12 | 36,250 | 36,237 |
| 5 Old Line Funding LLC | 0.200% | 11/8/12 | 129,682 | 129,633 |
| 5 Old Line Funding LLC | 0.200% | 11/13/12 | 117,000 | 116,953 |
| 5 Old Line Funding LLC | 0.200% | 11/14/12 | 180,000 | 179,926 |
| 5 Old Line Funding LLC | 0.200% | 11/15/12 | 106,000 | 105,956 |
| 5 Old Line Funding LLC | 0.200% | 11/19/12 | 39,000 | 38,983 |
| 5 Old Line Funding LLC | 0.200% | 11/20/12 | 94,000 | 93,958 |
| 5 Old Line Funding LLC | 0.200% | 11/21/12 | 32,289 | 32,274 |
15
| | | | | |
| Prime Money Market Fund | | | | |
| |
| |
| |
| | | | | Face | Market |
| | | | Maturity | Amount | Value |
| | | Yield1 | Date | ($000) | ($000) |
| 5 | Old Line Funding LLC | 0.200% | 11/27/12 | 58,000 | 57,972 |
| 5 | Old Line Funding LLC | 0.200% | 11/29/12 | 39,000 | 38,981 |
| 5 | Straight-A Funding LLC | 0.180% | 9/4/12 | 57,500 | 57,499 |
| 5 | Straight-A Funding LLC | 0.180% | 9/6/12 | 8,000 | 8,000 |
| 5 | Straight-A Funding LLC | 0.180% | 9/10/12 | 14,000 | 13,999 |
| 5 | Straight-A Funding LLC | 0.180% | 9/12/12 | 15,750 | 15,749 |
| 5 | Straight-A Funding LLC | 0.180% | 9/18/12 | 10,726 | 10,725 |
| 5 | Straight-A Funding LLC | 0.180% | 9/24/12 | 78,000 | 77,991 |
| 5 | Straight-A Funding LLC | 0.180% | 9/24/12 | 171,000 | 170,980 |
| 5 | Straight-A Funding LLC | 0.180% | 9/24/12 | 37,000 | 36,996 |
| 5 | Straight-A Funding LLC | 0.180% | 9/25/12 | 15,026 | 15,024 |
| 5 | Straight-A Funding LLC | 0.180% | 9/25/12 | 15,000 | 14,998 |
| 5 | Straight-A Funding LLC | 0.180% | 9/26/12 | 41,892 | 41,887 |
| 5 | Straight-A Funding LLC | 0.180% | 10/1/12 | 15,028 | 15,026 |
| 5 | Straight-A Funding LLC | 0.180% | 10/1/12 | 153,180 | 153,157 |
| 5 | Straight-A Funding LLC | 0.180% | 10/2/12 | 39,000 | 38,994 |
| 5 | Straight-A Funding LLC | 0.180% | 10/2/12 | 57,500 | 57,491 |
| 5 | Straight-A Funding LLC | 0.180% | 10/2/12 | 50,000 | 49,992 |
| 5 | Straight-A Funding LLC | 0.180% | 10/3/12 | 113,500 | 113,482 |
| 5 | Straight-A Funding LLC | 0.180% | 10/4/12 | 56,661 | 56,652 |
| 5 | Straight-A Funding LLC | 0.180% | 10/5/12 | 45,381 | 45,373 |
| 5 | Straight-A Funding LLC | 0.180% | 10/5/12 | 21,000 | 20,996 |
| 5 | Straight-A Funding LLC | 0.180% | 10/9/12 | 50,000 | 49,991 |
| 5 | Straight-A Funding LLC | 0.180% | 10/9/12 | 62,500 | 62,488 |
| 5 | Straight-A Funding LLC | 0.180% | 10/9/12 | 25,055 | 25,050 |
| 5 | Straight-A Funding LLC | 0.180% | 10/10/12 | 10,000 | 9,998 |
| 5 | Straight-A Funding LLC | 0.180% | 10/10/12 | 10,751 | 10,749 |
| 5 | Straight-A Funding LLC | 0.180% | 10/10/12 | 32,390 | 32,384 |
| 5 | Straight-A Funding LLC | 0.180% | 10/11/12 | 64,056 | 64,043 |
| 5 | Straight-A Funding LLC | 0.180% | 10/12/12 | 156,200 | 156,168 |
| 5 | Straight-A Funding LLC | 0.180% | 10/16/12 | 39,000 | 38,991 |
| 5 | Straight-A Funding LLC | 0.180% | 10/17/12 | 94,000 | 93,978 |
| 5 | Straight-A Funding LLC | 0.180% | 10/18/12 | 20,000 | 19,995 |
| 5 | Straight-A Funding LLC | 0.180% | 10/18/12 | 77,800 | 77,782 |
| 5 | Straight-A Funding LLC | 0.180% | 10/22/12 | 24,018 | 24,012 |
| 5 | Straight-A Funding LLC | 0.180% | 10/23/12 | 38,000 | 37,990 |
| 5 | Straight-A Funding LLC | 0.180% | 10/23/12 | 9,657 | 9,654 |
| 5 | Straight-A Funding LLC | 0.180% | 10/26/12 | 15,000 | 14,996 |
| 5 | Straight-A Funding LLC | 0.180% | 10/26/12 | 14,040 | 14,036 |
| 5 | Straight-A Funding LLC | 0.180% | 10/29/12 | 100,058 | 100,029 |
| 5 | Straight-A Funding LLC | 0.180% | 10/30/12 | 20,000 | 19,994 |
| 5 | Straight-A Funding LLC | 0.180% | 11/1/12 | 28,324 | 28,315 |
| 5 | Straight-A Funding LLC | 0.180% | 11/2/12 | 56,000 | 55,983 |
| 5 | Straight-A Funding LLC | 0.180% | 11/5/12 | 10,000 | 9,997 |
| 5 | Straight-A Funding LLC | 0.180% | 11/8/12 | 10,057 | 10,054 |
| 5 | Straight-A Funding LLC | 0.180% | 11/28/12 | 39,000 | 38,983 |
| | | | | | 6,072,114 |
| Foreign Banks (5.6%) | | | | |
| 5 | Australia & New Zealand Banking Group, Ltd. | 0.295% | 11/8/12 | 113,000 | 112,937 |
| 4,5 | Australia & New Zealand Banking Group, Ltd. | 0.268% | 11/19/12 | 250,000 | 249,997 |
| 5 | Australia & New Zealand Banking Group, Ltd. | 0.290% | 3/1/13 | 247,000 | 246,640 |
| 5 | Commonwealth Bank of Australia | 0.341% | 9/4/12 | 288,250 | 288,242 |
| 5 | Commonwealth Bank of Australia | 0.341% | 9/6/12 | 100,000 | 99,995 |
| 4,5 | Commonwealth Bank of Australia | 0.290% | 10/10/12 | 390,000 | 390,000 |
| 4,5 | Commonwealth Bank of Australia | 0.289% | 10/11/12 | 391,000 | 391,000 |
16
| | | | | |
| Prime Money Market Fund | | | | |
| |
| |
| |
| | | | | Face | Market |
| | | | Maturity | Amount | Value |
| | | Yield1 | Date | ($000) | ($000) |
| 4,5 | Commonwealth Bank of Australia | 0.287% | 10/18/12 | 400,000 | 400,000 |
| 4,5 | Commonwealth Bank of Australia | 0.287% | 11/19/12 | 396,000 | 396,000 |
| 4,5 | Commonwealth Bank of Australia | 0.287% | 11/21/12 | 81,000 | 81,000 |
| 5 | Commonwealth Bank of Australia | 0.300% | 2/25/13 | 86,600 | 86,472 |
| 5 | Commonwealth Bank of Australia | 0.300% | 2/28/13 | 592,000 | 591,112 |
| 4,5 | Westpac Banking Corp. | 0.286% | 9/26/12 | 438,000 | 438,000 |
| 4,5 | Westpac Banking Corp. | 0.296% | 10/2/12 | 786,000 | 786,000 |
| 4,5 | Westpac Banking Corp. | 0.289% | 10/11/12 | 359,000 | 359,000 |
| 4,5 | Westpac Banking Corp. | 0.288% | 10/17/12 | 318,000 | 318,000 |
| 4,5 | Westpac Banking Corp. | 0.276% | 11/2/12 | 193,000 | 193,000 |
| 4,5 | Westpac Banking Corp. | 0.336% | 2/1/13 | 335,000 | 335,000 |
| 4,5 | Westpac Banking Corp. | 0.336% | 2/4/13 | 597,000 | 597,000 |
| 5 | Westpac Banking Corp. | 0.300% | 2/26/13 | 24,000 | 23,964 |
| | | | | | 6,383,359 |
| Foreign Governments (0.7%) | | | | |
| 5 | Hydro-Quebec | 0.170% | 10/29/12 | 77,000 | 76,979 |
| | Province of Ontario | 0.170% | 10/29/12 | 13,000 | 12,996 |
| | Province of Ontario | 0.170% | 10/31/12 | 114,960 | 114,927 |
| | Province of Ontario | 0.170% | 11/7/12 | 25,000 | 24,992 |
| | Province of Ontario | 0.170% | 11/9/12 | 26,000 | 25,992 |
| | Province of Ontario | 0.170% | 11/19/12 | 55,500 | 55,479 |
| | Province of Ontario | 0.200% | 12/20/12 | 58,000 | 57,965 |
| 5 | Quebec | 0.180% | 10/18/12 | 22,000 | 21,995 |
| 5 | Quebec | 0.180% | 10/22/12 | 66,000 | 65,983 |
| 5 | Quebec | 0.180% | 10/23/12 | 69,000 | 68,982 |
| 5 | Quebec | 0.180% | 10/29/12 | 98,500 | 98,471 |
| 5 | Quebec | 0.180% | 10/30/12 | 59,000 | 58,983 |
| 5 | Quebec | 0.180% | 11/1/12 | 85,000 | 84,974 |
| 5 | Quebec | 0.180% | 11/19/12 | 28,000 | 27,989 |
| | | | | | 796,707 |
| Foreign Industrial (5.6%) | | | | |
| 5 | Nestle Capital Corp. | 0.291% | 10/9/12 | 666,000 | 665,796 |
| 5 | Nestle Capital Corp. | 0.291% | 10/16/12 | 50,000 | 49,982 |
| 5 | Nestle Capital Corp. | 0.291% | 10/17/12 | 98,000 | 97,964 |
| 5 | Nestle Capital Corp. | 0.301% | 10/26/12 | 247,500 | 247,387 |
| 5 | Nestle Capital Corp. | 0.260% | 3/4/13 | 496,000 | 495,341 |
| 5 | Nestle Capital Corp. | 0.260% | 3/12/13 | 495,000 | 494,314 |
| | Nestle Finance International Ltd. | 0.291% | 10/12/12 | 153,000 | 152,949 |
| | Nestle Finance International Ltd. | 0.291% | 10/15/12 | 150,000 | 149,947 |
| | Nestle Finance International Ltd. | 0.301% | 10/26/12 | 45,000 | 44,979 |
| | Nestle Finance International Ltd. | 0.301% | 11/1/12 | 97,000 | 96,951 |
| | Nestle Finance International Ltd. | 0.265% | 3/25/13 | 244,000 | 243,632 |
| | Nestle Finance International Ltd. | 0.265% | 3/26/13 | 376,000 | 375,430 |
| | Nestle Finance International Ltd. | 0.265% | 4/1/13 | 296,000 | 295,538 |
| 5 | Novartis Securities Investment Ltd. | 0.180% | 9/4/12 | 24,000 | 24,000 |
| 5 | Novartis Securities Investment Ltd. | 0.180% | 9/5/12 | 74,900 | 74,898 |
| 5 | Novartis Securities Investment Ltd. | 0.180% | 9/6/12 | 59,000 | 58,998 |
| 5 | Novartis Securities Investment Ltd. | 0.180% | 9/10/12 | 98,000 | 97,996 |
| 5 | Novartis Securities Investment Ltd. | 0.180% | 9/11/12 | 112,500 | 112,494 |
| 5 | Novartis Securities Investment Ltd. | 0.180% | 9/12/12 | 31,500 | 31,498 |
| 5 | Novartis Securities Investment Ltd. | 0.180% | 9/14/12 | 82,000 | 81,995 |
| 5 | Sanofi | 0.190% | 9/6/12 | 80,000 | 79,998 |
| 5 | Sanofi | 0.190% | 9/26/12 | 199,000 | 198,974 |
| 5 | Sanofi | 0.200% | 9/27/12 | 248,000 | 247,964 |
17
| | | | |
| Prime Money Market Fund | | | | |
| |
| |
| |
| | | | Face | Market |
| | | Maturity | Amount | Value |
| | Yield1 | Date | ($000) | ($000) |
| 5 Siemens Capital Co. LLC | 0.200% | 9/10/12 | 1,137,000 | 1,136,943 |
| 5 Total Capital Canada Ltd. | 0.320% | 9/14/12 | 236,000 | 235,973 |
| 5 Total Capital Canada Ltd. | 0.180% | 10/19/12 | 112,000 | 111,973 |
| 5 Total Capital Canada Ltd. | 0.255% | 10/26/12 | 49,000 | 48,981 |
| 5 Total Capital Canada Ltd. | 0.180% | 11/21/12 | 164,750 | 164,683 |
| 5 Total Capital Canada Ltd. | 0.220% | 10/10/12 | 141,000 | 140,966 |
| 5 Total Capital Canada Ltd. | 0.280% | 12/12/12 | 146,000 | 145,884 |
| Toyota Credit Canada Inc. | 0.351% | 9/24/12 | 49,500 | 49,489 |
| Toyota Credit Canada Inc. | 0.190% | 10/25/12 | 19,000 | 18,995 |
| Toyota Credit Canada Inc. | 0.300% | 1/9/13 | 19,500 | 19,479 |
| | | | | 6,492,391 |
| Industrial (2.7%) | | | | |
| General Electric Co. | 0.170%–0.190% | 9/26/12 | 863,000 | 862,889 |
| General Electric Co. | 0.170%–0.190% | 9/27/12 | 335,000 | 334,955 |
| General Electric Co. | 0.280% | 2/20/13 | 99,000 | 98,868 |
| 5 Procter & Gamble Co. | 0.150% | 9/10/12 | 250,000 | 249,991 |
| 5 The Coca-Cola Co. | 0.200% | 9/17/12 | 160,000 | 159,986 |
| 5 The Coca-Cola Co. | 0.190% | 9/21/12 | 19,750 | 19,748 |
| 5 The Coca-Cola Co. | 0.190% | 9/24/12 | 37,500 | 37,495 |
| 5 The Coca-Cola Co. | 0.190% | 9/25/12 | 39,000 | 38,995 |
| 5 The Coca-Cola Co. | 0.220% | 10/4/12 | 29,500 | 29,494 |
| 5 The Coca-Cola Co. | 0.220% | 10/5/12 | 24,000 | 23,995 |
| 5 The Coca-Cola Co. | 0.220% | 10/10/12 | 40,750 | 40,740 |
| 5 The Coca-Cola Co. | 0.220% | 10/11/12 | 79,000 | 78,981 |
| 5 The Coca-Cola Co. | 0.200% | 10/16/12 | 39,000 | 38,990 |
| 5 The Coca-Cola Co. | 0.210% | 10/19/12 | 62,500 | 62,483 |
| 5 The Coca-Cola Co. | 0.210% | 10/22/12 | 55,000 | 54,984 |
| 5 The Coca-Cola Co. | 0.210% | 10/24/12 | 143,500 | 143,456 |
| 5 The Coca-Cola Co. | 0.190%–0.210% | 10/25/12 | 151,950 | 151,906 |
| 5 The Coca-Cola Co. | 0.190% | 10/26/12 | 116,900 | 116,866 |
| 5 The Coca-Cola Co. | 0.190% | 10/29/12 | 65,000 | 64,980 |
| 5 The Coca-Cola Co. | 0.200% | 11/8/12 | 15,000 | 14,994 |
| 5 The Coca-Cola Co. | 0.200% | 11/9/12 | 147,000 | 146,944 |
| 5 The Coca-Cola Co. | 0.200% | 11/19/12 | 77,000 | 76,966 |
| 5 The Coca-Cola Co. | 0.180% | 11/29/12 | 118,050 | 117,997 |
| 5 The Coca-Cola Co. | 0.180% | 12/4/12 | 100,000 | 99,953 |
| 5 The Coca-Cola Co. | 0.180% | 12/5/12 | 25,000 | 24,988 |
| | | | | 3,091,644 |
| Total Commercial Paper (Cost $24,925,337) | | | | 24,925,337 |
| Certificates of Deposit (18.6%) | | | | |
| Domestic Banks (4.8%) | | | | |
| Branch Banking & Trust Co. | 0.190% | 9/25/12 | 236,250 | 236,250 |
| Branch Banking & Trust Co. | 0.190% | 10/1/12 | 157,500 | 157,500 |
| Branch Banking & Trust Co. | 0.190% | 10/9/12 | 118,000 | 118,000 |
| Branch Banking & Trust Co. | 0.190% | 10/10/12 | 236,500 | 236,500 |
| Branch Banking & Trust Co. | 0.190% | 10/17/12 | 500,000 | 500,000 |
| State Street Bank & Trust Co. | 0.250% | 9/17/12 | 435,000 | 435,000 |
| State Street Bank & Trust Co. | 0.190% | 10/10/12 | 306,000 | 306,000 |
| State Street Bank & Trust Co. | 0.190% | 10/16/12 | 792,000 | 792,000 |
| State Street Bank & Trust Co. | 0.190% | 10/17/12 | 985,000 | 985,000 |
| State Street Bank & Trust Co. | 0.180% | 10/29/12 | 496,000 | 496,000 |
| State Street Bank & Trust Co. | 0.180% | 11/1/12 | 232,000 | 232,000 |
| Wells Fargo Bank NA | 0.200% | 9/17/12 | 1,000,000 | 1,000,000 |
| | | | | 5,494,250 |
18
| | | | |
| Prime Money Market Fund | | | | |
| |
| |
| |
| | | | Face | Market |
| | | Maturity | Amount | Value |
| | Yield1 | Date | ($000) | ($000) |
| Eurodollar Certificates of Deposit (6.0%) | | | | |
| Australia & New Zealand Banking Group, Ltd. | 0.350% | 10/19/12 | 550,000 | 550,000 |
| Australia & New Zealand Banking Group, Ltd. | 0.330% | 10/25/12 | 198,000 | 198,000 |
| Australia & New Zealand Banking Group, Ltd. | 0.330% | 10/29/12 | 125,000 | 125,000 |
| Australia & New Zealand Banking Group, Ltd. | 0.320% | 10/30/12 | 250,000 | 250,000 |
| Australia & New Zealand Banking Group, Ltd. | 0.300% | 11/2/12 | 173,000 | 173,000 |
| Australia & New Zealand Banking Group, Ltd. | 0.300% | 11/5/12 | 99,000 | 99,000 |
| Australia & New Zealand Banking Group, Ltd. | 0.300% | 11/5/12 | 225,000 | 225,000 |
| Australia & New Zealand Banking Group, Ltd. | 0.300% | 11/9/12 | 94,000 | 94,000 |
| Australia & New Zealand Banking Group, Ltd. | 0.300% | 11/16/12 | 399,000 | 399,000 |
| 4 Australia & New Zealand Banking Group, Ltd. | 0.326% | 1/25/13 | 335,000 | 335,000 |
| 4 Australia & New Zealand Banking Group, Ltd. | 0.340% | 2/11/13 | 260,000 | 260,000 |
| Commonwealth Bank of Australia | 0.335% | 2/15/13 | 500,000 | 500,000 |
| Commonwealth Bank of Australia | 0.310% | 2/22/13 | 500,000 | 500,000 |
| 4 National Australia Bank Ltd. | 0.345% | 9/27/12 | 1,000,000 | 1,000,000 |
| National Australia Bank Ltd. | 0.345% | 10/25/12 | 450,000 | 450,000 |
| 4 National Australia Bank Ltd. | 0.300% | 10/29/12 | 533,000 | 533,000 |
| 4 National Australia Bank Ltd. | 0.329% | 2/13/13 | 1,250,000 | 1,250,000 |
| | | | | 6,941,000 |
| Yankee Certificates of Deposit (7.8%) | | | | |
| Bank of Montreal (Chicago Branch) | 0.210% | 10/3/12 | 508,000 | 508,000 |
| Bank of Montreal (Chicago Branch) | 0.210% | 10/5/12 | 624,000 | 624,000 |
| Bank of Montreal (Chicago Branch) | 0.210% | 10/9/12 | 165,000 | 165,000 |
| Bank of Montreal (Chicago Branch) | 0.180% | 10/23/12 | 100,000 | 100,000 |
| Bank of Montreal (Chicago Branch) | 0.180% | 11/5/12 | 390,000 | 390,000 |
| Bank of Montreal (Chicago Branch) | 0.190% | 11/14/12 | 495,000 | 495,000 |
| 4 Bank of Nova Scotia (Houston Branch) | 0.305% | 10/3/12 | 418,000 | 418,000 |
| 4 Bank of Nova Scotia (Houston Branch) | 0.276% | 10/29/12 | 390,000 | 389,993 |
| 4 Bank of Nova Scotia (Houston Branch) | 0.273% | 11/8/12 | 1,000,000 | 1,000,000 |
| Bank of Nova Scotia (Houston Branch) | 0.290% | 11/9/12 | 595,000 | 594,995 |
| Bank of Nova Scotia (Houston Branch) | 0.290% | 11/19/12 | 452,000 | 452,000 |
| Bank of Nova Scotia (Houston Branch) | 0.270% | 12/5/12 | 99,000 | 99,018 |
| 4 Bank of Nova Scotia (Houston Branch) | 0.309% | 1/14/13 | 100,000 | 100,000 |
| Toronto Dominion Bank (New York Branch) | 0.280% | 10/29/12 | 453,000 | 453,000 |
| Toronto Dominion Bank (New York Branch) | 0.280% | 11/1/12 | 234,000 | 234,000 |
| Toronto Dominion Bank (New York Branch) | 0.280% | 11/5/12 | 555,000 | 555,000 |
| Toronto Dominion Bank (New York Branch) | 0.300% | 12/26/12 | 285,000 | 285,000 |
| Toronto Dominion Bank (New York Branch) | 0.300% | 1/18/13 | 295,000 | 295,000 |
| 4 Toronto Dominion Bank (New York Branch) | 0.443% | 2/4/13 | 34,000 | 34,012 |
| Toronto Dominion Bank (New York Branch) | 0.290% | 2/7/13 | 695,000 | 695,000 |
| Toronto Dominion Bank (New York Branch) | 0.300% | 2/15/13 | 500,000 | 500,000 |
| Toronto Dominion Bank (New York Branch) | 0.300% | 2/20/13 | 150,000 | 150,000 |
| 4 Westpac Banking Corp. (New York Branch) | 0.276% | 11/2/12 | 382,000 | 382,000 |
| | | | | 8,919,018 |
| Total Certificates of Deposit (Cost $21,354,268) | | | | 21,354,268 |
| Repurchase Agreements (0.2%) | | | | |
| Goldman Sachs & Co. | | | | |
| (Dated 8/31/12, Repurchase Value $33,879,000, | | | | |
| collateralized by Federal Home Loan Mortgage | | | | |
| Corp. 2.000%, 8/25/16) | 0.190% | 9/4/12 | 33,878 | 33,878 |
19
| | | | |
| Prime Money Market Fund | | | | |
| |
| |
| |
| | | | Face | Market |
| | | Maturity | Amount | Value |
| | Yield1 | Date | ($000) | ($000) |
| JP Morgan Securities LLC | | | | |
| (Dated 8/31/12, Repurchase Value $94,002,000, | | | | |
| collateralized by U.S. Treasury Note/Bond 0.250%, | | | | |
| 8/31/14) | 0.180% | 9/4/12 | 94,000 | 94,000 |
| RBC Capital Markets LLC | | | | |
| (Dated 8/31/12, Repurchase Value $47,001,000, | | | | |
| collateralized by U.S. Treasury Note/Bond 1.875%, | | | | |
| 9/30/17) | 0.150% | 9/4/12 | 47,000 | 47,000 |
| TD Securities (USA) LLC | | | | |
| Dated 8/31/12, Repurchase Value $59,001,000, | | | | |
| collateralized by U.S. Treasury Bill 0.000%, | | | | |
| 9/17/12) | 0.170% | 9/4/12 | 59,000 | 59,000 |
| Total Repurchase Agreements (Cost $233,878) | | | | 233,878 |
| |
| | | | Shares | |
| Money Market Fund (1.4%) | | | | |
| 6 Vanguard Municipal Cash Management Fund | | | | |
| (Cost $1,650,717) | 0.155% | | 1,650,716,555 | 1,650,717 |
| |
| | | | Face | |
| | | | Amount | |
| | | | ($000) | |
| Tax-Exempt Municipal Bonds (3.3%) | | | | |
| 7 ABAG Finance Authority for Nonprofit Corps. | | | | |
| California Revenue (Miramar Apartments) VRDO | 0.150% | 9/7/12 | 11,900 | 11,900 |
| 7 ABAG Finance Authority for Nonprofit Corps. | | | | |
| California Revenue (Southport Apartments) VRDO | 0.150% | 9/7/12 | 15,700 | 15,700 |
| 7 Akron OH Bath & Copley Joint Township Hospital | | | | |
| District Revenue (Akron General Health System) | | | | |
| VRDO | 0.200% | 9/7/12 | 19,500 | 19,500 |
| 7 Albany NY Industrial Development Agency | | | | |
| Revenue (The College of Saint Rose Project) | | | | |
| VRDO | 0.170% | 9/7/12 | 13,400 | 13,400 |
| 7 Arizona Health Facilities Authority Revenue | | | | |
| (Banner Health) VRDO | 0.190% | 9/7/12 | 35,955 | 35,955 |
| 7 Arizona Health Facilities Authority Revenue | | | | |
| (Banner Health) VRDO | 0.190% | 9/7/12 | 38,715 | 38,715 |
| 7 Ascension Parish LA Industrial Development | | | | |
| Board Revenue (IMTT-Geismar Project) VRDO | 0.140% | 9/7/12 | 79,000 | 79,000 |
| 7 Bi-State Development Agency of the | | | | |
| Missouri-Illinois Metropolitan District Revenue | | | | |
| VRDO | 0.200% | 9/7/12 | 29,800 | 29,800 |
| 7 Birmingham AL Public Educational Building | | | | |
| Student Housing Revenue (University of | | | | |
| Alabama at Birmingham Project) VRDO | 0.170% | 9/7/12 | 16,015 | 16,015 |
| 7 Buffalo NY Municipal Water System Revenue | | | | |
| VRDO | 0.150% | 9/7/12 | 11,700 | 11,700 |
| 7 California Housing Finance Agency Home | | | | |
| Mortgage Revenue VRDO | 0.150% | 9/7/12 | 17,100 | 17,100 |
| 7 California Housing Finance Agency Multifamily | | | | |
| Housing Revenue VRDO | 0.170% | 9/7/12 | 20,915 | 20,915 |
20
| | | | |
| Prime Money Market Fund | | | | |
| |
| |
| |
| | | | Face | Market |
| | | Maturity | Amount | Value |
| | Yield1 | Date | ($000) | ($000) |
| 7 California Statewide Communities Development | | | | |
| Authority Multifamily Housing Revenue | | | | |
| (Belmont Project) VRDO | 0.170% | 9/7/12 | 8,300 | 8,300 |
| 7 California Statewide Communities Development | | | | |
| Authority Multifamily Housing Revenue | | | | |
| (Wilshire Court Project) VRDO | 0.160% | 9/7/12 | 11,900 | 11,900 |
| 7 California Statewide Communities Development | | | | |
| Authority Revenue (Redlands Community | | | | |
| Hospital) VRDO | 0.160% | 9/7/12 | 22,100 | 22,100 |
| 7 Clackamas County OR Hospital Facility Authority | | | | |
| Revenue (Legacy Health System) VRDO | 0.150% | 9/7/12 | 9,700 | 9,700 |
| 7 Clark County NV Industrial Development Revenue | | | | |
| (Southwest Gas Corp.) VRDO | 0.190% | 9/7/12 | 27,500 | 27,500 |
| 7 Cleveland-Cuyahoga County OH Port Authority | | | | |
| Revenue (SPC Buildings 1 & 3 LLC) VRDO | 0.160% | 9/7/12 | 23,500 | 23,500 |
| 7 Cobb County GA Hospital Authority Revenue | | | | |
| (Equipment Pool Project) VRDO | 0.170% | 9/7/12 | 11,200 | 11,200 |
| 7 Colorado Health Facilities Authority Revenue | | | | |
| (Evangelical Lutheran Good Samaritan | | | | |
| Society Project) VRDO | 0.140% | 9/7/12 | 10,000 | 10,000 |
| 7 Columbus OH Regional Airport Authority Airport | | | | |
| Revenue (Oasbo Expanded Asset Program) | | | | |
| VRDO | 0.170% | 9/7/12 | 17,725 | 17,725 |
| Connecticut Health & Educational Facilities | | | | |
| Authority Revenue (Yale University) VRDO | 0.150% | 9/7/12 | 35,000 | 35,000 |
| Curators of the University of Missouri System | | | | |
| Facilities Revenue VRDO | 0.160% | 9/7/12 | 62,150 | 62,150 |
| 7 Delaware River Port Authority Pennsylvania & | | | | |
| New Jersey Revenue VRDO | 0.160% | 9/7/12 | 76,100 | 76,100 |
| 7 District of Columbia Revenue (Georgetown | | | | |
| University) VRDO | 0.170% | 9/7/12 | 7,575 | 7,575 |
| 7 District of Columbia Revenue (Georgetown | | | | |
| University) VRDO | 0.170% | 9/7/12 | 17,200 | 17,200 |
| 7 District of Columbia Revenue (Washington | | | | |
| Drama Society) VRDO | 0.200% | 9/7/12 | 20,160 | 20,160 |
| 7 Fairfax County VA Economic Development | | | | |
| Authority Resource Recovery Revenue | | | | |
| (Lorton Arts Foundation Project) VRDO | 0.170% | 9/7/12 | 10,600 | 10,600 |
| 7 Greenville County SC Hospital System Revenue | | | | |
| VRDO | 0.150% | 9/7/12 | 13,000 | 13,000 |
| 7 Hanover County VA Economic Development | | | | |
| Authority Revenue (Bon Secours Health | | | | |
| System Inc.) VRDO | 0.180% | 9/7/12 | 12,255 | 12,255 |
| 7 Harris County TX Cultural Education Facilities | | | | |
| Finance Corp. Hospital Revenue (Memorial | | | | |
| Hermann Healthcare System) VRDO | 0.160% | 9/7/12 | 42,000 | 42,000 |
| 7 Harris County TX Cultural Education Facilities | | | | |
| Finance Corp. Medical Facilities Revenue | | | | |
| (Baylor College of Medicine) VRDO | 0.190% | 9/7/12 | 42,500 | 42,500 |
| 7 Idaho Housing & Finance Association Single | | | | |
| Family Mortgage Revenue VRDO | 0.150% | 9/7/12 | 14,900 | 14,900 |
| 7 Idaho Housing & Finance Association Single | | | | |
| Family Mortgage Revenue VRDO | 0.170% | 9/7/12 | 29,205 | 29,205 |
| 7 Illinois Development Finance Authority Revenue | | | | |
| (Chicago Horticultural Society) VRDO | 0.170% | 9/7/12 | 16,300 | 16,300 |
21
| | | | |
| Prime Money Market Fund | | | | |
| |
| |
| |
| | | | Face | Market |
| | | Maturity | Amount | Value |
| | Yield1 | Date | ($000) | ($000) |
| 7 Illinois Finance Authority Revenue | | | | |
| (Carle Foundation) VRDO | 0.170% | 9/7/12 | 31,905 | 31,905 |
| 7 Illinois Finance Authority Revenue (Ingalls Health | | | | |
| System) VRDO | 0.190% | 9/7/12 | 43,000 | 43,000 |
| 7 Illinois Finance Authority Revenue (Little Co. of | | | | |
| Mary Hospital & Health Care Centers) VRDO | 0.180% | 9/7/12 | 17,075 | 17,075 |
| 7 Illinois Finance Authority Revenue (Museum of | | | | |
| Science & Industry) VRDO | 0.180% | 9/7/12 | 12,500 | 12,500 |
| 7 Indiana Development Finance Authority | | | | |
| Educational Facilities Revenue (Indianapolis | | | | |
| Museum of Art Inc. Project) VRDO | 0.170% | 9/7/12 | 14,400 | 14,400 |
| 7 Indiana Educational Facilities Authority Revenue | | | | |
| (Wabash College) VRDO | 0.180% | 9/7/12 | 22,790 | 22,790 |
| 7 Indiana Finance Authority Health System Revenue | | | | |
| (Sisters of St. Francis Health Services Inc. | | | | |
| Obligated Group) VRDO | 0.180% | 9/7/12 | 39,340 | 39,340 |
| Indiana Finance Authority Revenue (Lease | | | | |
| Appropriation) VRDO | 0.180% | 9/7/12 | 15,075 | 15,075 |
| 7 Kentucky Economic Development Finance | | | | |
| Authority Hospital Revenue (Baptist Healthcare | | | | |
| System Obligated Group) VRDO | 0.130% | 9/7/12 | 25,035 | 25,035 |
| 7 Lincoln County WY Pollution Control Revenue | | | | |
| (PacifiCorp Project) VRDO | 0.180% | 9/7/12 | 17,200 | 17,200 |
| 7 Los Angeles CA Wastewater System Revenue | | | | |
| VRDO | 0.160% | 9/7/12 | 9,135 | 9,135 |
| Loudoun County VA Industrial Development | | | | |
| Authority Revenue (Howard Hughes Medical | | | | |
| Institute) VRDO | 0.140% | 9/7/12 | 18,855 | 18,855 |
| 7 Louisiana Public Facilities Authority Hospital | | | | |
| Revenue (Franciscan Missionaries) VRDO | 0.170% | 9/7/12 | 11,650 | 11,650 |
| 7 Maine Health & Higher Educational Facilities | | | | |
| Authority Revenue (Bowdoin College) VRDO | 0.180% | 9/7/12 | 15,130 | 15,130 |
| 7 Maryland Health & Higher Educational Facilities | | | | |
| Authority Revenue (University of Maryland | | | | |
| Medical System) VRDO | 0.160% | 9/7/12 | 29,765 | 29,765 |
| 7 Massachusetts Development Finance Agency | | | | |
| Revenue (Simmons College) VRDO | 0.160% | 9/7/12 | 40,000 | 40,000 |
| 7 Massachusetts Health & Educational Facilities | | | | |
| Authority Revenue (Baystate Medical Center) | | | | |
| VRDO | 0.150% | 9/7/12 | 16,000 | 16,000 |
| 7 Massachusetts Health & Educational Facilities | | | | |
| Authority Revenue (Bentley College) VRDO | 0.160% | 9/7/12 | 21,900 | 21,900 |
| 7 Massachusetts Health & Educational Facilities | | | | |
| Authority Revenue (Dana Farber Cancer Institute) | | | | |
| VRDO | 0.150% | 9/7/12 | 20,015 | 20,015 |
| Massachusetts Health & Educational Facilities | | | | |
| Authority Revenue (MIT) VRDO | 0.160% | 9/7/12 | 19,320 | 19,320 |
| 7 Miami-Dade County FL Special Obligation | | | | |
| Revenue (Juvenile Courthouse Project) VRDO | 0.150% | 9/7/12 | 25,350 | 25,350 |
| 7 Michigan Higher Education Facilities Authority | | | | |
| Revenue (Albion College Project) VRDO | 0.180% | 9/7/12 | 12,700 | 12,700 |
| 7 Michigan Hospital Finance Authority Revenue | | | | |
| (Henry Ford Health System) VRDO | 0.170% | 9/7/12 | 32,595 | 32,595 |
| 7 Middletown OH Hospital Facilities Revenue | | | | |
| (Atrium Medical Center) VRDO | 0.190% | 9/7/12 | 21,800 | 21,800 |
22
| | | | |
| Prime Money Market Fund | | | | |
| |
| |
| |
| | | | Face | Market |
| | | Maturity | Amount | Value |
| | Yield1 | Date | ($000) | ($000) |
| 7 Minneapolis & St. Paul MN Housing & | | | | |
| Redevelopment Authority Health Care System | | | | |
| Revenue (Allina Health System) VRDO | 0.150% | 9/7/12 | 15,000 | 15,000 |
| Missouri Health & Educational Facilities Authority | | | | |
| Health Facilities Revenue (BJC Health System) | | | | |
| VRDO | 0.160% | 9/7/12 | 18,000 | 18,000 |
| 7 Missouri Health & Educational Facilities Authority | | | | |
| Health Facilities Revenue (SSM Health System) | | | | |
| VRDO | 0.160% | 9/7/12 | 83,275 | 83,275 |
| 7 Nassau NY Health Care Corp. VRDO | 0.170% | 9/7/12 | 15,000 | 15,000 |
| 7 New Jersey Health Care Facilities Financing | | | | |
| Authority Revenue (Hospital Capital Asset | | | | |
| Pooled Program) VRDO | 0.200% | 9/7/12 | 19,600 | 19,600 |
| 7 New York City NY GO VRDO | 0.150% | 9/7/12 | 29,825 | 29,825 |
| 7 New York City NY GO VRDO | 0.160% | 9/7/12 | 15,800 | 15,800 |
| 7 New York City NY Housing Development Corp. | | | | |
| Multi-Family Rental Housing Revenue | | | | |
| (Carnegie Park) VRDO | 0.140% | 9/7/12 | 39,505 | 39,505 |
| 7 New York City NY Housing Development Corp. | | | | |
| Multi-Family Rental Housing Revenue (Monterey) | | | | |
| VRDO | 0.140% | 9/7/12 | 21,980 | 21,980 |
| 7 New York City NY Housing Development Corp. | | | | |
| Multi-Family Rental Housing Revenue | | | | |
| (One Columbus Place Development) VRDO | 0.170% | 9/7/12 | 68,100 | 68,100 |
| 7 New York City NY Housing Development Corp. | | | | |
| Multi-Family Rental Housing Revenue | | | | |
| (Related-Sierra Development) VRDO | 0.170% | 9/7/12 | 32,500 | 32,500 |
| 7 New York City NY Housing Development Corp. | | | | |
| Multi-Family Rental Housing Revenue | | | | |
| (West End Towers) VRDO | 0.170% | 9/7/12 | 31,300 | 31,300 |
| 7 New York City NY Industrial Development Agency | | | | |
| Civic Facility Revenue (New York Law School) | | | | |
| VRDO | 0.170% | 9/7/12 | 14,435 | 14,435 |
| 7 New York State Dormitory Authority Revenue | | | | |
| (Royal Charter Properties) VRDO | 0.160% | 9/7/12 | 71,500 | 71,500 |
| 7 New York State Housing Finance Agency Housing | | | | |
| Revenue (10 Liberty Street) VRDO | 0.140% | 9/7/12 | 20,500 | 20,500 |
| 7 New York State Housing Finance Agency Housing | | | | |
| Revenue (125 West 31st Street) VRDO | 0.180% | 9/7/12 | 42,300 | 42,300 |
| 7 New York State Housing Finance Agency Housing | | | | |
| Revenue (160 West 62nd Street) VRDO | 0.170% | 9/7/12 | 95,990 | 95,990 |
| 7 New York State Housing Finance Agency Housing | | | | |
| Revenue (20 River Terrace Housing) VRDO | 0.180% | 9/7/12 | 17,300 | 17,300 |
| 7 New York State Housing Finance Agency Housing | | | | |
| Revenue (320 West 38th Street) VRDO | 0.150% | 9/7/12 | 61,500 | 61,500 |
| 7 New York State Housing Finance Agency Housing | | | | |
| Revenue (320 West 38th Street) VRDO | 0.150% | 9/7/12 | 37,935 | 37,935 |
| 7 New York State Housing Finance Agency Housing | | | | |
| Revenue (70 Battery Place) VRDO | 0.180% | 9/7/12 | 12,800 | 12,800 |
| 7 New York State Housing Finance Agency Housing | | | | |
| Revenue (Clinton Green South) VRDO | 0.180% | 9/7/12 | 11,625 | 11,625 |
| 7 New York State Housing Finance Agency Housing | | | | |
| Revenue (Clinton Green North) VRDO | 0.180% | 9/7/12 | 31,845 | 31,845 |
| 7 New York State Housing Finance Agency Housing | | | | |
| Revenue (Clinton Park) VRDO | 0.190% | 9/7/12 | 15,000 | 15,000 |
23
| | | | |
| Prime Money Market Fund | | | | |
| |
| |
| |
| | | | Face | Market |
| | | Maturity | Amount | Value |
| | Yield1 | Date | ($000) | ($000) |
| 7 New York State Housing Finance Agency Housing | | | | |
| Revenue (East 84th Street) VRDO | 0.170% | 9/7/12 | 24,500 | 24,500 |
| 7 New York State Housing Finance Agency Housing | | | | |
| Revenue (Gotham West Housing) VRDO | 0.150% | 9/7/12 | 25,000 | 25,000 |
| 7 New York State Housing Finance Agency Housing | | | | |
| Revenue (Gotham West Housing) VRDO | 0.150% | 9/7/12 | 38,000 | 38,000 |
| 7 New York State Urban Development Corp. | | | | |
| Revenue (Service Contract) VRDO | 0.160% | 9/7/12 | 21,875 | 21,875 |
| 7 North Carolina Capital Facilities Finance Agency | | | | |
| Revenue (YMCA of the Triangle) VRDO | 0.190% | 9/7/12 | 11,100 | 11,100 |
| 7 North Carolina Capital Facilities Finance Agency | | | | |
| Revenue (YMCA of the Triangle) VRDO | 0.190% | 9/7/12 | 10,950 | 10,950 |
| 7 North Carolina Medical Care Commission Health | | | | |
| Care Facilities Revenue (Vidant Health) VRDO | 0.160% | 9/7/12 | 40,000 | 40,000 |
| 7 North Carolina Medical Care Commission Health | | | | |
| Care Facilities Revenue (WakeMed) VRDO | 0.170% | 9/7/12 | 27,500 | 27,500 |
| 7 Oakland University of Michigan Revenue VRDO | 0.160% | 9/7/12 | 8,600 | 8,600 |
| 7 Ohio Air Quality Development Authority Revenue | | | | |
| (Dayton Power & Light Co. Project) VRDO | 0.180% | 9/7/12 | 11,100 | 11,100 |
| 7 Ohio Higher Educational Facility Commission | | | | |
| Revenue (University Hospitals Health | | | | |
| System Inc.) VRDO | 0.180% | 9/7/12 | 25,000 | 25,000 |
| Ohio State University General Receipts Revenue | | | | |
| VRDO | 0.160% | 9/7/12 | 115,300 | 115,300 |
| Ohio State University General Receipts Revenue | | | | |
| VRDO | 0.160% | 9/7/12 | 6,600 | 6,600 |
| 7 Piedmont SC Municipal Power Agency Revenue | | | | |
| VRDO | 0.180% | 9/7/12 | 16,000 | 16,000 |
| 7 Richmond CA Multifamily Housing Revenue | | | | |
| (Baycliff Apartments Project) VRDO | 0.150% | 9/7/12 | 20,890 | 20,890 |
| 7 Russell County VA Industrial Development | | | | |
| Authority Hospital Revenue (STS Health Alliance) | | | | |
| VRDO | 0.170% | 9/7/12 | 9,365 | 9,365 |
| 7 Salem OH Hospital Facilities Improvement | | | | |
| Revenue (Salem Community Hospital Project) | | | | |
| VRDO | 0.180% | 9/7/12 | 12,745 | 12,745 |
| 7 Salem OR Hospital Facility Authority Revenue | | | | |
| (Salem Hospital Project) VRDO | 0.160% | 9/7/12 | 16,500 | 16,500 |
| 7 San Antonio TX Hotel Occupancy Tax Revenue | | | | |
| VRDO | 0.180% | 9/7/12 | 22,000 | 22,000 |
| 7 San Diego CA Housing Authority Multifamily | | | | |
| Housing Revenue (Villa Nueva Apartments) VRDO 0.150% | 9/7/12 | 29,600 | 29,600 |
| 7 Simi Valley CA Multifamily Housing Revenue | | | | |
| (Parker Ranch Project) VRDO | 0.150% | 9/7/12 | 23,700 | 23,700 |
| 7 Smyth County VA Industrial Development | | | | |
| Authority Hospital Revenue VRDO | 0.150% | 9/7/12 | 22,100 | 22,100 |
| 7 St. Joseph MO Industrial Development Authority | | | | |
| Health Facilities Revenue (Heartland Regional | | | | |
| Medical Center) VRDO | 0.150% | 9/7/12 | 20,500 | 20,500 |
| 7 Syracuse NY Industrial Development Agency | | | | |
| Civic Facility Revenue (Syracuse University | | | | |
| Project) VRDO | 0.160% | 9/7/12 | 14,000 | 14,000 |
| 7 Tarrant County TX Cultural Education Facilities | | | | |
| Finance Corp. Hospital Revenue (Baylor Health | | | | |
| Care System Project) VRDO | 0.160% | 9/7/12 | 28,000 | 28,000 |
24
| | | | |
| Prime Money Market Fund | | | | |
| |
| |
| |
| | | | Face | Market |
| | | Maturity | Amount | Value |
| | Yield1 | Date | ($000) | ($000) |
| 7 Tarrant County TX Cultural Education Facilities | | | | |
| Finance Corp. Hospital Revenue (Scott & White | | | | |
| Healthcare Project) VRDO | 0.170% | 9/7/12 | 68,000 | 68,000 |
| Texas Department of Housing & Community | | | | |
| Affairs Single Family Revenue VRDO | 0.180% | 9/7/12 | 28,900 | 28,900 |
| Texas Department of Housing & Community | | | | |
| Affairs Single Family Revenue VRDO | 0.180% | 9/7/12 | 42,400 | 42,400 |
| Texas Department of Housing & Community | | | | |
| Affairs Single Family Revenue VRDO | 0.180% | 9/7/12 | 34,620 | 34,620 |
| Texas Department of Housing & Community | | | | |
| Affairs Single Family Revenue VRDO | 0.210% | 9/7/12 | 21,025 | 21,025 |
| Texas Department of Housing & Community | | | | |
| Affairs Single Mortgage Revenue VRDO | 0.210% | 9/7/12 | 64,065 | 64,065 |
| 8 Texas GO TOB VRDO | 0.200% | 9/4/12 | 496,000 | 496,000 |
| 7 Torrance CA Hospital Revenue (Torrance Memorial | | | | |
| Medical Center) VRDO | 0.180% | 9/7/12 | 19,600 | 19,600 |
| 7 University of South Florida Financing Corp. | | | | |
| COP VRDO | 0.180% | 9/7/12 | 39,675 | 39,675 |
| 7 Utah Housing Corp. Single Family Mortgage | | | | |
| Revenue VRDO | 0.150% | 9/7/12 | 6,800 | 6,800 |
| 7 Virginia Small Business Financing Authority | | | | |
| Health Facilities Revenue (Bon Secours Health | | | | |
| System Inc.) VRDO | 0.160% | 9/7/12 | 7,200 | 7,200 |
| 7 Warren County KY Revenue (Western Kentucky | | | | |
| University Student Life Foundation Inc. Project) | | | | |
| VRDO | 0.180% | 9/7/12 | 18,800 | 18,800 |
| 7 Warren County KY Revenue (Western Kentucky | | | | |
| University Student Life Foundation Inc. Project) | | | | |
| VRDO | 0.180% | 9/7/12 | 13,010 | 13,010 |
| 7 Washington Housing Finance Commission | | | | |
| Non-profit Housing Revenue (Rockwood | | | | |
| Retirement Communities Program) VRDO | 0.160% | 9/7/12 | 6,100 | 6,100 |
| 7 West Virginia Hospital Finance Authority Hospital | | | | |
| Revenue (Charleston Area Medical Center Inc.) | | | | |
| VRDO | 0.190% | 9/7/12 | 29,840 | 29,840 |
| 7 Whittier CA Health Facility Revenue (Presbyterian | | | | |
| Intercommunity Hospital) VRDO | 0.140% | 9/7/12 | 20,500 | 20,500 |
| 7 Wisconsin Health & Educational Facilities | | | | |
| Authority Revenue (Aurora Health Care Inc.) | | | | |
| VRDO | 0.160% | 9/7/12 | 31,200 | 31,200 |
| Total Tax-Exempt Municipal Bonds (Cost $3,754,380) | | | | 3,754,380 |
| Corporate Bonds (0.1%) | | | | |
| Finance (0.1%) | | | | |
| 4 Royal Bank of Canada (New York Branch) | 0.597% | 1/28/13 | 37,420 | 37,472 |
| 4 Royal Bank of Canada (New York Branch) | 0.530% | 1/8/13 | 75,000 | 75,067 |
| General Electric Capital Corp. | 2.800% | 1/8/13 | 49,500 | 49,896 |
| General Electric Capital Corp. | 5.450% | 1/15/13 | 19,475 | 19,827 |
| Total Corporate Bonds (Cost $182,262) | | | | 182,262 |
25
| | | | | |
| Prime Money Market Fund | | | | |
| |
| |
| |
| | | | | Face | Market |
| | | | Maturity | Amount | Value |
| | | Yield1 | Date | ($000) | ($000) |
| Taxable Municipal Bonds (0.4%) | | | | |
| Taxable Municipal Bonds (0.4%) | | | | |
| 7,8 | BlackRock Municipal Bond Trust TOB VRDO | 0.290% | 9/4/12 | 18,105 | 18,105 |
| 7,8 | BlackRock Municipal Income Investment Quality | | | | |
| | Trust TOB VRDO | 0.290% | 9/4/12 | 9,660 | 9,660 |
| 7,8 | BlackRock Municipal Income Trust TOB VRDO | 0.290% | 9/4/12 | 207,000 | 207,000 |
| 7,8 | BlackRock MuniHoldings Fund II, Inc. TOB VRDO | 0.290% | 9/4/12 | 21,850 | 21,850 |
| 7,8 | BlackRock MuniHoldings Fund, Inc. TOB VRDO | 0.290% | 9/4/12 | 19,165 | 19,165 |
| 7,8 | BlackRock MuniHoldings Quality Fund II, Inc. | | | | |
| | TOB VRDO | 0.290% | 9/4/12 | 19,875 | 19,875 |
| 7,8 | BlackRock MuniHoldings Quality Fund II, Inc. | | | | |
| | TOB VRDO | 0.290% | 9/4/12 | 100,000 | 100,000 |
| 7,8 | BlackRock MuniYield Investment Quality Fund | | | | |
| | TOB VRDO | 0.290% | 9/4/12 | 12,910 | 12,910 |
| 7,8 | BlackRock Strategic Municipal Trust TOB VRDO | 0.290% | 9/4/12 | 9,820 | 9,820 |
| 7,8 | Los Angeles CA Department of Water & Power | | | | |
| | Revenue TOB VRDO | 0.250% | 9/7/12 | 13,000 | 13,000 |
| 8 | Massachusetts Transportation Fund Revenue | | | | |
| | TOB VRDO | 0.250% | 9/7/12 | 13,100 | 13,100 |
| 7,8 | Seattle WA Municipal Light & Power Revenue | | | | |
| | TOB VRDO | 0.250% | 9/7/12 | 6,400 | 6,400 |
| Total Taxable Municipal Bonds (Cost $450,885) | | | | 450,885 |
| Total Investments (99.8%) (Cost $114,567,894) | | | | 114,567,894 |
| Other Assets and Liabilities (0.2%) | | | | |
| Other Assets | | | | 496,873 |
| Liabilities | | | | (310,237) |
| | | | | | 186,636 |
| Net Assets (100%) | | | | 114,754,530 |
26
| |
| Prime Money Market Fund | |
| |
| |
| At August 31, 2012, net assets consisted of: | |
| | Amount |
| | ($000) |
| Paid-in Capital | 114,744,804 |
| Undistributed Net Investment Income | — |
| Accumulated Net Realized Gains | 9,726 |
| Net Assets | 114,754,530 |
| |
| Investor Shares—Net Assets | |
| Applicable to 90,194,361,339 outstanding $.001 par value shares of | |
| beneficial interest (unlimited authorization) | 90,211,644 |
| Net Asset Value Per Share—Investor Shares | $1.00 |
| |
| Institutional Shares—Net Assets | |
| Applicable to 24,539,810,565 outstanding $.001 par value shares of | |
| beneficial interest (unlimited authorization) | 24,542,886 |
| Net Asset Value Per Share—Institutional Shares | $1.00 |
See Note A in Notes to Financial Statements.
1 Represents annualized yield at date of purchase for discount securities, and coupon for coupon-bearing securities.
2 The issuer was placed under federal conservatorship in September 2008; since that time, its daily operations have been managed by the Federal Housing Finance Agency and it receives capital from the U.S. Treasury, as needed to maintain a positive net worth, in exchange for senior preferred stock.
3 The issuer operates under a congressional charter; its securities are generally neither guaranteed by the U.S. Treasury nor backed by the full faith and credit of the U.S. government.
4 Adjustable-rate security.
5 Security exempt from registration under Section 4(2) of the Securities Act of 1933. Such securities may be sold in transactions exempt from registration only to dealers in that program or other “accredited investors.” At August 31, 2012, the aggregate value of these securities was $18,564,118,000, representing 16.2% of net assets.
6 Affiliated money market fund available only to Vanguard funds and certain trusts and accounts managed by Vanguard. Rate shown is the 7-day yield.
7 Scheduled principal and interest payments are guaranteed by bank letter of credit.
8 Security exempt from registration under Rule 144A of the Securities Act of 1933. Such securities may be sold in transactions exempt from registration, normally to qualified institutional buyers. At August 31, 2012, the aggregate value of these securities was $946,885,000, representing 0.8% of net assets.
COP—Certificate of Participation.
GO—General Obligation Bond.
TOB—Tender Option Bond.
VRDO—Variable Rate Demand Obligation.
See accompanying Notes, which are an integral part of the Financial Statements.
27
Prime Money Market Fund
Statement of Operations
| |
| | Year Ended |
| | August 31, 2012 |
| | ($000) |
| Investment Income | |
| Income | |
| Interest1 | 224,102 |
| Total Income | 224,102 |
| Expenses | |
| The Vanguard Group—Note B | |
| Management and Administrative—Investor Shares | 117,418 |
| Management and Administrative—Institutional Shares | 12,801 |
| Marketing and Distribution—Investor Shares | 26,606 |
| Marketing and Distribution—Institutional Shares | 6,684 |
| Custodian Fees | 1,912 |
| Auditing Fees | 28 |
| Shareholders’ Reports—Investor Shares | 926 |
| Shareholders’ Reports—Institutional Shares | 155 |
| Trustees’ Fees and Expenses | 122 |
| Total Expenses | 166,652 |
| Net Investment Income | 57,450 |
| Realized Net Gain (Loss) on Investment Securities Sold | 1,405 |
| Net Increase (Decrease) in Net Assets Resulting from Operations | 58,855 |
| 1 Interest income from an affiliated company of the fund was $2,199,000. |
See accompanying Notes, which are an integral part of the Financial Statements.
28
Prime Money Market Fund
Statement of Changes in Net Assets
| | |
| | Year Ended August 31, |
| | 2012 | 2011 |
| | ($000) | ($000) |
| Increase (Decrease) in Net Assets | | |
| Operations | | |
| Net Investment Income | 57,450 | 90,513 |
| Realized Net Gain (Loss) | 1,405 | 1,676 |
| Net Increase (Decrease) in Net Assets Resulting from Operations | 58,855 | 92,189 |
| Distributions | | |
| Net Investment Income | | |
| Investor Shares | (32,517) | (55,253) |
| Institutional Shares | (24,933) | (35,260) |
| Realized Capital Gain | | |
| Investor Shares | — | — |
| Institutional Shares | — | — |
| Total Distributions | (57,450) | (90,513) |
| Capital Share Transactions | | |
| Investor Shares | (2,193,142) | 3,718,120 |
| Institutional Shares | 2,803,343 | 2,631,581 |
| Net Increase (Decrease) from Capital Share Transactions | 610,201 | 6,349,701 |
| Total Increase (Decrease) | 611,606 | 6,351,377 |
| Net Assets | | |
| Beginning of Period | 114,142,924 | 107,791,547 |
| End of Period | 114,754,530 | 114,142,924 |
See accompanying Notes, which are an integral part of the Financial Statements.
29
Prime Money Market Fund
Financial Highlights
Investor Shares
| | | | | |
| For a Share Outstanding | | | | Year Ended August 31, |
| Throughout Each Period | 2012 | 2011 | 2010 | 2009 | 2008 |
| Net Asset Value, Beginning of Period | $1.00 | $1.00 | $1.00 | $1.00 | $1.00 |
| Investment Operations | | | | | |
| Net Investment Income | .0004 | .001 | .001 | .013 | .035 |
| Net Realized and Unrealized Gain (Loss) | | | | | |
| on Investments | — | — | — | — | — |
| Total from Investment Operations | .0004 | .001 | .001 | .013 | .035 |
| Distributions | | | | | |
| Dividends from Net Investment Income | (.0004) | (.001) | (.001) | (.013) | (.035) |
| Distributions from Realized Capital Gains | — | — | — | — | — |
| Total Distributions | (.0004) | (.001) | (.001) | (.013) | (.035) |
| Net Asset Value, End of Period | $1.00 | $1.00 | $1.00 | $1.00 | $1.00 |
| |
| Total Return1 | 0.04% | 0.06% | 0.08% | 1.31% | 3.60% |
| |
| Ratios/Supplemental Data | | | | | |
| Net Assets, End of Period (Millions) | $90,212 | $92,404 | $88,684 | $96,078 | $92,483 |
| Ratio of Total Expenses to | | | | | |
| Average Net Assets | 0.16% | 0.20% | 0.23% | 0.28%2 | 0.23% |
| Ratio of Net Investment Income to | | | | | |
| Average Net Assets | 0.04% | 0.06% | 0.08% | 1.25% | 3.49% |
1 Total returns do not include account service fees that may have applied in the periods shown. Fund prospectuses provide information about any applicable account service fees.
2 Includes 0.03% of fees to participate in the Treasury Temporary Guarantee Program for Money Market Funds.
See accompanying Notes, which are an integral part of the Financial Statements.
30
Prime Money Market Fund
Financial Highlights
Institutional Shares
| | | | | |
| For a Share Outstanding | | | | Year Ended August 31, |
| Throughout Each Period | 2012 | 2011 | 2010 | 2009 | 2008 |
| Net Asset Value, Beginning of Period | $1.00 | $1.00 | $1.00 | $1.00 | $1.00 |
| Investment Operations | | | | | |
| Net Investment Income | .001 | .002 | .002 | .015 | .037 |
| Net Realized and Unrealized Gain (Loss) | | | | | |
| on Investments | — | — | — | — | — |
| Total from Investment Operations | .001 | .002 | .002 | .015 | .037 |
| Distributions | | | | | |
| Dividends from Net Investment Income | (.001) | (.002) | (.002) | (.015) | (.037) |
| Distributions from Realized Capital Gains | — | — | — | — | — |
| Total Distributions | (.001) | (.002) | (.002) | (.015) | (.037) |
| Net Asset Value, End of Period | $1.00 | $1.00 | $1.00 | $1.00 | $1.00 |
| |
| Total Return | 0.11% | 0.17% | 0.22% | 1.47% | 3.75% |
| |
| Ratios/Supplemental Data | | | | | |
| Net Assets, End of Period (Millions) | $24,543 | $21,739 | $19,107 | $18,323 | $13,844 |
| Ratio of Total Expenses to | | | | | |
| Average Net Assets | 0.09% | 0.09% | 0.09% | 0.13%1 | 0.08% |
| Ratio of Net Investment Income to | | | | | |
| Average Net Assets | 0.11% | 0.17% | 0.22% | 1.40% | 3.64% |
1 Includes 0.03% of fees to participate in the Treasury Temporary Guarantee Program for Money Market Funds.
See accompanying Notes, which are an integral part of the Financial Statements.
31
Prime Money Market Fund
Notes to Financial Statements
Vanguard Prime Money Market Fund is registered under the Investment Company Act of 1940 as an open-end investment company, or mutual fund. The fund invests in short-term debt instruments of companies primarily operating in specific industries, particularly financial services; the issuers’ abilities to meet their obligations may be affected by economic developments in such industries. The fund offers two classes of shares, Investor Shares and Institutional Shares. Investor Shares are available to any investor who meets the fund’s minimum purchase requirements. Institutional Shares are designed for institutional investors who meet certain administrative, service, and account-size criteria.
A. The following significant accounting policies conform to generally accepted accounting principles for U.S. mutual funds. The fund consistently follows such policies in preparing its financial statements.
1. Security Valuation: Securities are valued at amortized cost, which approximates market value. Investments in Vanguard Municipal Cash Management Fund are valued at that fund’s net asset value.
2. Repurchase Agreements: The fund may enter into repurchase agreements. Securities pledged as collateral for repurchase agreements are held by a custodian bank until the agreements mature. Each agreement requires that the market value of the collateral be sufficient to cover payments of interest and principal. In the event of default or bankruptcy by the other party to the agreement, the fund may sell or retain the collateral; however, such action may be subject to legal proceedings.
3. Federal Income Taxes: The fund intends to continue to qualify as a regulated investment company and distribute all of its taxable income. Management has analyzed the fund’s tax positions taken for all open federal income tax years (August 31, 2009–2012), and has concluded that no provision for federal income tax is required in the fund’s financial statements.
4. Distributions: Distributions from net investment income are declared daily and paid on the first business day of the following month.
5. Other: Interest income includes income distributions received from Vanguard Municipal Cash Management Fund and is accrued daily. Premiums and discounts on debt securities purchased are amortized and accreted, respectively, to interest income over the lives of the respective securities. Security transactions are accounted for on the date securities are bought or sold. Costs used to determine realized gains (losses) on the sale of investment securities are those of the specific securities sold.
Each class of shares has equal rights as to assets and earnings, except that each class separately bears certain class-specific expenses related to maintenance of shareholder accounts (included in Management and Administrative expenses) and shareholder reporting. Marketing and distribution expenses are allocated to each class of shares based on a method approved by the board of trustees. Income, other non-class-specific expenses, and gains and losses on investments are allocated to each class of shares based on its relative net assets.
B. The Vanguard Group furnishes at cost investment advisory, corporate management, administrative, marketing, and distribution services. The costs of such services are allocated to the fund under methods approved by the board of trustees. The fund has committed to provide up to 0.40% of its net assets in capital contributions to Vanguard. At August 31, 2012, the fund had contributed capital of $16,449,000 to Vanguard (included in Other Assets), representing 0.01% of the fund’s net assets and 6.58% of Vanguard’s capitalization. The fund’s trustees and officers are also directors and officers of Vanguard. Vanguard and the board of trustees have agreed to temporarily limit certain net operating expenses in excess of the fund’s daily yield so as to maintain a zero or positive yield for the fund. Vanguard and the board of trustees may terminate the temporary expense limitation at any time.
32
Prime Money Market Fund
C. Various inputs may be used to determine the value of the fund’s investments. These inputs are summarized in three broad levels for financial statement purposes. The inputs or methodologies used to value securities are not necessarily an indication of the risk associated with investing in those securities.
Level 1—Quoted prices in active markets for identical securities.
Level 2—Other significant observable inputs (including quoted prices for similar securities, interest rates, prepayment speeds, credit risk, etc.).
Level 3—Significant unobservable inputs (including the fund’s own assumptions used to determine the fair value of investments).
The fund’s investment in Vanguard Municipal Cash Management Fund is valued based on Level 1 inputs. All of the fund’s other investments were valued using amortized cost, in accordance with rules under the Investment Company Act of 1940. Amortized cost approximates the current fair value of a security, but since the value is not obtained from a quoted price in an active market, securities valued at amortized cost are considered to be valued using Level 2 inputs.
D. Capital share transactions for each class of shares were:
| | | | |
| | | | Year Ended August 31, |
| | | 2012 | | 2011 |
| | Amount | Shares | Amount | Shares |
| | ($000) | (000) | ($000) | (000) |
| Investor Shares | | | | |
| Issued | 103,443,975 | 103,443,975 | 119,751,906 | 119,751,906 |
| Issued in Lieu of Cash Distributions | 31,844 | 31,844 | 53,993 | 53,993 |
| Redeemed | (105,668,961) | (105,668,961) | (116,087,779) | (116,087,779) |
| Net Increase (Decrease)—Investor Shares | (2,193,142) | (2,193,142) | 3,718,120 | 3,718,120 |
| Institutional Shares | | | | |
| Issued | 18,703,639 | 18,703,639 | 20,303,805 | 20,303,805 |
| Issued in Lieu of Cash Distributions | 24,338 | 24,338 | 34,248 | 34,248 |
| Redeemed | (15,924,634) | (15,924,634) | (17,706,472) | (17,706,472) |
| Net Increase (Decrease) —Institutional Shares | 2,803,343 | 2,803,343 | 2,631,581 | 2,631,581 |
E. In preparing the financial statements as of August 31, 2012, management considered the impact of subsequent events for potential recognition or disclosure in these financial statements.
33
Federal Money Market Fund
Fund Profile
As of August 31, 2012
| |
| Financial Attributes | |
| Ticker Symbol | VMFXX |
| Expense Ratio1 | 0.20% |
| 7-Day SEC Yield | 0.01% |
| Average Weighted | |
| Maturity | 59 days |
| |
| Sector Diversification (% of portfolio) | |
| U.S. Treasury Bills | 34.1% |
| U.S. Government Agency Obligations | 65.3 |
| Repurchase Agreements | 0.6 |
The agency and mortgage-backed securities sectors may include issues from government-sponsored enterprises; such issues are generally not backed by the full faith and credit of the U.S. government.
| |
| Distribution by Credit Quality (% of portfolio) | |
| First Tier | 100.0% |
For information about these ratings, see the Glossary entry for Credit Quality.
1 The expense ratio shown is from the prospectus dated December 27, 2011, and represents estimated costs for the current fiscal year. For the fiscal year ended August 31, 2012, the expense ratio was 0.12%, reflecting a temporary reduction in operating expenses (described in Note B of the Notes to Financial Statements). Before this reduction, the expense ratio was 0.16%.
34
Federal Money Market Fund
Performance Summary
Investment returns will fluctuate. All of the returns in this report represent past performance, which is not a guarantee of future results that may be achieved by the fund. (Current performance may be lower or higher than the performance data cited. For performance data current to the most recent month-end, visit our website at vanguard.com/performance.) The returns shown do not reflect taxes that a shareholder would pay on fund distributions. An investment in a money market fund is not insured or guaranteed by the Federal Deposit Insurance Corporation or any other government agency. Although the fund seeks to preserve the value of your investment at $1 per share, it is possible to lose money by investing in the fund. The fund’s 7-day SEC yield reflects its current earnings more closely than do the average annual returns.
Cumulative Performance: August 31, 2002, Through August 31, 2012
Initial Investment of $10,000
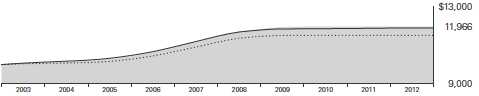
| | | | |
| | | Average Annual Total Returns | |
| | | Periods Ended August 31, 2012 | |
| | | | | Final Value |
| | One | Five | Ten | of a $10,000 |
| | Year | Years | Years | Investment |
| Federal Money Market Fund | 0.01% | 0.91% | 1.81% | $11,966 |
| Government Money Market Funds | | | | |
| Average | 0.00 | 0.62 | 1.42 | 11,510 |
| Citigroup Three-Month U.S. Treasury | | | | |
| Bill Index | 0.05 | 0.71 | 1.74 | 11,882 |
Government Money Market Funds Average: Derived from data provided by Lipper Inc.See Financial Highlights for dividend information.
35
Federal Money Market Fund
Fiscal-Year Total Returns (%): August 31, 2002, Through August 31, 2012
| | |
| | | Gov’t Money |
| | | Market Funds |
| | | Average |
| Fiscal Year | Total Returns | Total Returns |
| 2003 | 1.11% | 0.64% |
| 2004 | 0.82 | 0.40 |
| 2005 | 2.26 | 1.73 |
| 2006 | 4.31 | 3.78 |
| 2007 | 5.17 | 4.58 |
| 2008 | 3.46 | 2.71 |
| 2009 | 1.06 | 0.43 |
| 2010 | 0.04 | 0.00 |
| 2011 | 0.02 | 0.00 |
| 2012 | 0.01 | 0.00 |
7-day SEC yield (8/31/2012): 0.01%
Government Money Market Funds Average: Derived from data provided by Lipper Inc.
Average Annual Total Returns: Periods Ended June 30, 2012
This table presents returns through the latest calendar quarter—rather than through the end of the fiscal period.
Securities and Exchange Commission rules require that we provide this information.
| | | | |
| | Inception | One | Five | Ten |
| | Date | Year | Years | Years |
| Federal Money Market Fund | 7/13/1981 | 0.01% | 1.08% | 1.84% |
36
Federal Money Market Fund
Financial Statements
Statement of Net Assets
As of August 31, 2012
The fund reports a complete list of its holdings in various monthly and quarterly regulatory filings. The fund publishes its holdings on a monthly basis at vanguard.com and files them with the Securities and Exchange Commission on Form N-MFP. The fund’s Form N-MFP filings become public 60 days after the relevant month-end, and may be viewed at sec.gov or via a link on the “Portfolio Holdings” page on vanguard.com. For the second and fourth fiscal quarters, the lists appear in the fund’s semiannual and annual reports to shareholders. For the first and third fiscal quarters, the fund files the lists with the SEC on Form N-Q. Shareholders can look up the fund’s Forms N-Q on the SEC’s website at sec.gov. Forms N-Q may also be reviewed and copied at the SEC’s Public Reference Room (see the back cover of this report for further information).
| | | | | |
| | | | | Face | Market |
| | | | Maturity | Amount | Value |
| | | Yield1 | Date | ($000) | ($000) |
| U.S. Government and Agency Obligations (99.5%) | | | |
| 2 | Fannie Mae Discount Notes | 0.170% | 9/12/12 | 16,850 | 16,849 |
| 2 | Fannie Mae Discount Notes | 0.140%–0.150% | 9/19/12 | 32,495 | 32,493 |
| 2 | Fannie Mae Discount Notes | 0.170% | 9/26/12 | 7,809 | 7,808 |
| 2 | Fannie Mae Discount Notes | 0.140% | 10/1/12 | 54,500 | 54,494 |
| 2 | Fannie Mae Discount Notes | 0.140%–0.160% | 10/3/12 | 50,000 | 49,993 |
| 2 | Fannie Mae Discount Notes | 0.140%–0.150% | 10/10/12 | 31,269 | 31,264 |
| 2 | Fannie Mae Discount Notes | 0.140% | 10/15/12 | 54,200 | 54,191 |
| 2 | Fannie Mae Discount Notes | 0.140%–0.150% | 10/17/12 | 29,000 | 28,994 |
| 2 | Fannie Mae Discount Notes | 0.140% | 11/7/12 | 37,000 | 36,990 |
| 2 | Fannie Mae Discount Notes | 0.140% | 11/14/12 | 24,000 | 23,993 |
| 2 | Fannie Mae Discount Notes | 0.180% | 12/3/12 | 5,000 | 4,998 |
| 2 | Fannie Mae Discount Notes | 0.185% | 1/23/13 | 26,244 | 26,225 |
| 2 | Fannie Mae Discount Notes | 0.170%–0.172% | 2/14/13 | 9,100 | 9,093 |
| 2 | Fannie Mae Discount Notes | 0.170% | 2/20/13 | 5,700 | 5,695 |
| 2 | Fannie Mae Discount Notes | 0.160% | 2/27/13 | 60,000 | 59,952 |
| 3 | Federal Home Loan Bank Discount Notes | 0.140% | 9/5/12 | 10,000 | 10,000 |
| 3 | Federal Home Loan Bank Discount Notes | 0.130%–0.140% | 9/14/12 | 109,173 | 109,168 |
| 3 | Federal Home Loan Bank Discount Notes | 0.130% | 9/17/12 | 25,000 | 24,999 |
| 3 | Federal Home Loan Bank Discount Notes | 0.140% | 9/19/12 | 10,426 | 10,425 |
| 3 | Federal Home Loan Bank Discount Notes | 0.160% | 9/28/12 | 50,000 | 49,994 |
| 3 | Federal Home Loan Bank Discount Notes | 0.160% | 10/3/12 | 7,000 | 6,999 |
| 3 | Federal Home Loan Bank Discount Notes | 0.134% | 10/5/12 | 75,000 | 74,990 |
| 3 | Federal Home Loan Bank Discount Notes | 0.140% | 10/10/12 | 145,050 | 145,028 |
| 3 | Federal Home Loan Bank Discount Notes | 0.140%–0.145% | 10/12/12 | 25,350 | 25,346 |
| 3 | Federal Home Loan Bank Discount Notes | 0.140% | 10/15/12 | 4,100 | 4,099 |
| 3 | Federal Home Loan Bank Discount Notes | 0.140% | 10/17/12 | 3,000 | 2,999 |
| 3 | Federal Home Loan Bank Discount Notes | 0.140%–0.150% | 10/19/12 | 21,512 | 21,508 |
| 3 | Federal Home Loan Bank Discount Notes | 0.140% | 10/24/12 | 118,000 | 117,976 |
| 3 | Federal Home Loan Bank Discount Notes | 0.135% | 10/31/12 | 5,000 | 4,999 |
| 3 | Federal Home Loan Bank Discount Notes | 0.130% | 11/2/12 | 4,520 | 4,519 |
| 3 | Federal Home Loan Bank Discount Notes | 0.128%–0.130% | 11/7/12 | 145,000 | 144,965 |
| 3 | Federal Home Loan Bank Discount Notes | 0.140% | 11/9/12 | 13,000 | 12,996 |
| 3 | Federal Home Loan Bank Discount Notes | 0.140% | 11/14/12 | 1,500 | 1,500 |
| 3 | Federal Home Loan Bank Discount Notes | 0.135% | 11/21/12 | 35,000 | 34,989 |
| 3 | Federal Home Loan Bank Discount Notes | 0.180% | 11/23/12 | 12,800 | 12,795 |
37
| | | | | |
| Federal Money Market Fund | | | | |
| |
| |
| |
| | | | | Face | Market |
| | | | Maturity | Amount | Value |
| | | Yield1 | Date | ($000) | ($000) |
| 3 | Federal Home Loan Bank Discount Notes | 0.180% | 12/5/12 | 4,100 | 4,098 |
| 3 | Federal Home Loan Bank Discount Notes | 0.180% | 12/21/12 | 60,000 | 59,967 |
| 3 | Federal Home Loan Bank Discount Notes | 0.170% | 2/4/13 | 5,000 | 4,996 |
| 3 | Federal Home Loan Bank Discount Notes | 0.165% | 2/20/13 | 2,800 | 2,798 |
| 3,4 | Federal Home Loan Banks | 0.186% | 11/1/12 | 10,000 | 10,000 |
| 3,4 | Federal Home Loan Banks | 0.166% | 12/27/12 | 97,240 | 97,245 |
| 2,4 | Federal Home Loan Mortgage Corp. | 0.186% | 11/2/12 | 13,725 | 13,725 |
| 2,4 | Federal Home Loan Mortgage Corp. | 0.197% | 3/21/13 | 13,000 | 12,996 |
| 2,4 | Federal Home Loan Mortgage Corp. | 0.194% | 5/6/13 | 48,000 | 47,985 |
| 2,4 | Federal Home Loan Mortgage Corp. | 0.195% | 6/3/13 | 60,000 | 59,982 |
| 2,4 | Federal Home Loan Mortgage Corp. | 0.188% | 6/17/13 | 123,200 | 123,226 |
| 2,4 | Federal National Mortgage Assn. | 0.268% | 9/17/12 | 42,500 | 42,500 |
| 2,4 | Federal National Mortgage Assn. | 0.258% | 11/23/12 | 106,700 | 106,704 |
| 2,4 | Federal National Mortgage Assn. | 0.266% | 12/28/12 | 7,700 | 7,703 |
| 2,4 | Federal National Mortgage Assn. | 0.229% | 8/12/13 | 30,000 | 29,991 |
| 2,4 | Federal National Mortgage Assn. | 0.213% | 11/8/13 | 50,000 | 49,982 |
| 2,4 | Federal National Mortgage Assn. | 0.210% | 11/14/13 | 65,000 | 64,977 |
| 2 | Freddie Mac Discount Notes | 0.170% | 9/10/12 | 35,000 | 34,999 |
| 2 | Freddie Mac Discount Notes | 0.130% | 9/17/12 | 50,000 | 49,997 |
| 2 | Freddie Mac Discount Notes | 0.160% | 9/24/12 | 10,000 | 9,999 |
| 2 | Freddie Mac Discount Notes | 0.130%–0.160% | 10/1/12 | 80,792 | 80,782 |
| 2 | Freddie Mac Discount Notes | 0.135% | 10/11/12 | 10,000 | 9,998 |
| 2 | Freddie Mac Discount Notes | 0.140% | 10/15/12 | 85,000 | 84,985 |
| 2 | Freddie Mac Discount Notes | 0.150% | 10/22/12 | 6,800 | 6,799 |
| 2 | Freddie Mac Discount Notes | 0.120%–0.150% | 10/29/12 | 105,000 | 104,979 |
| 2 | Freddie Mac Discount Notes | 0.150% | 11/1/12 | 6,800 | 6,798 |
| 2 | Freddie Mac Discount Notes | 0.130% | 11/5/12 | 35,000 | 34,992 |
| 2 | Freddie Mac Discount Notes | 0.145% | 11/6/12 | 4,300 | 4,299 |
| 2 | Freddie Mac Discount Notes | 0.140% | 11/13/12 | 12,136 | 12,133 |
| 2 | Freddie Mac Discount Notes | 0.150% | 11/15/12 | 7,000 | 6,998 |
| 2 | Freddie Mac Discount Notes | 0.145%–0.150% | 11/19/12 | 10,700 | 10,697 |
| 2 | Freddie Mac Discount Notes | 0.140% | 11/27/12 | 57,600 | 57,581 |
| 2 | Freddie Mac Discount Notes | 0.180%–0.250% | 12/10/12 | 17,900 | 17,890 |
| 2 | Freddie Mac Discount Notes | 0.150%–0.180% | 1/3/13 | 24,450 | 24,437 |
| 2 | Freddie Mac Discount Notes | 0.170% | 2/11/13 | 6,693 | 6,688 |
| 2 | Freddie Mac Discount Notes | 0.160% | 2/25/13 | 50,000 | 49,961 |
| | United States Treasury Bill | 0.138% | 9/6/12 | 50,000 | 49,999 |
| | United States Treasury Bill | 0.146% | 9/13/12 | 50,000 | 49,998 |
| | United States Treasury Bill | 0.150% | 9/27/12 | 50,000 | 49,995 |
| | United States Treasury Bill | 0.140% | 10/4/12 | 50,000 | 49,994 |
| | United States Treasury Bill | 0.115%–0.126% | 10/18/12 | 140,000 | 139,978 |
| | United States Treasury Bill | 0.150% | 11/1/12 | 50,000 | 49,987 |
| | United States Treasury Bill | 0.148% | 11/15/12 | 120,000 | 119,963 |
| | United States Treasury Bill | 0.143%–0.145% | 11/23/12 | 50,000 | 49,983 |
| | United States Treasury Bill | 0.143%–0.146% | 11/29/12 | 43,000 | 42,985 |
| | United States Treasury Bill | 0.143% | 12/13/12 | 125,000 | 124,949 |
| | United States Treasury Bill | 0.150% | 12/20/12 | 50,000 | 49,977 |
| | United States Treasury Bill | 0.153%–0.155% | 12/27/12 | 90,000 | 89,955 |
| | United States Treasury Bill | 0.145% | 2/21/13 | 150,000 | 149,895 |
| | United States Treasury Note/Bond | 1.375% | 9/15/12 | 56,000 | 56,025 |
| | United States Treasury Note/Bond | 4.250% | 9/30/12 | 56,000 | 56,182 |
| | United States Treasury Note/Bond | 1.375% | 10/15/12 | 38,000 | 38,055 |
| | United States Treasury Note/Bond | 0.375% | 10/31/12 | 18,000 | 18,007 |
| | United States Treasury Note/Bond | 3.875% | 10/31/12 | 5,000 | 5,030 |
| | United States Treasury Note/Bond | 1.375% | 11/15/12 | 100,000 | 100,248 |
38
Federal Money Market Fund
| | | | |
| | | | Face | Market |
| | | Maturity | Amount | Value |
| | Yield1 | Date | ($000) | ($000) |
| United States Treasury Note/Bond | 3.375% | 11/30/12 | 17,000 | 17,133 |
| United States Treasury Note/Bond | 0.500% | 11/30/12 | 140,000 | 140,116 |
| United States Treasury Note/Bond | 1.125% | 12/15/12 | 15,000 | 15,040 |
| Total U.S. Government and Agency Obligations (Cost $4,080,707) | | | 4,080,707 |
| Repurchase Agreements (0.4%) | | | | |
| Goldman Sachs & Co. | | | | |
| (Dated 8/31/12, Repurchase Value $2,000,000, | | | | |
| collateralized by Federal Farm Credit Bank | | | | |
| 0.350%–2.940%, 9/23/13–10/3/23) | 0.190% | 9/4/12 | 2,000 | 2,000 |
| JP Morgan Securities LLC | | | | |
| (Dated 8/31/12, Repurchase Value $7,000,000, | | | | |
| collateralized by U.S. Treasury Note/Bond | | | | |
| 0.250%, 8/31/14) | 0.180% | 9/4/12 | 7,000 | 7,000 |
| RBC Capital Markets LLC | | | | |
| (Dated 8/31/12, Repurchase Value $3,000,000, | | | | |
| collateralized by U.S. Treasury Note/Bond | | | | |
| 2.625%, 7/31/14) | 0.150% | 9/4/12 | 3,000 | 3,000 |
| TD Securities (USA) LLC | | | | |
| (Dated 8/31/12, Repurchase Value $5,000,000, | | | | |
| collateralized by U.S. Treasury Note/Bond | | | | |
| 1.250%, 3/15/14) | 0.170% | 9/4/12 | 5,000 | 5,000 |
| Total Repurchase Agreements (Cost $17,000) | | | | 17,000 |
| Total Investments (99.9%) (Cost $4,097,707) | | | | 4,097,707 |
| Other Assets and Liabilities (0.1%) | | | | |
| Other Assets | | | | 9,850 |
| Liabilities | | | | (4,387) |
| | | | | 5,463 |
| Net Assets (100%) | | | | |
| Applicable to 4,102,508,514 outstanding $.001 par value shares of | | | |
| beneficial interest (unlimited authorization) | | | | 4,103,170 |
| Net Asset Value Per Share | | | | $1.00 |
| |
| At August 31, 2012, net assets consisted of: | |
| | Amount |
| | ($000) |
| Paid-in Capital | 4,103,024 |
| Undistributed Net Investment Income | — |
| Accumulated Net Realized Gains | 146 |
| Net Assets | 4,103,170 |
See Note A in Notes to Financial Statements.
1 Represents annualized yield at date of purchase for discount securities, and coupon for coupon-bearing securities.
2 The issuer was placed under federal conservatorship in September 2008; since that time, its daily operations have been managed by the Federal Housing Finance Agency and it receives capital from the U.S. Treasury, as needed to maintain a positive net worth, in exchange for senior preferred stock.
3 The issuer operates under a congressional charter; its securities are generally neither guaranteed by the U.S. Treasury nor backed by the full faith and credit of the U.S. government.
4 Adjustable-rate security.
See accompanying Notes, which are an integral part of the Financial Statements.
39
| |
| Federal Money Market Fund | |
| |
| |
| Statement of Operations | |
| |
| | Year Ended |
| | August 31, 2012 |
| | ($000) |
| Investment Income | |
| Income | |
| Interest | 5,947 |
| Total Income | 5,947 |
| Expenses | |
| The Vanguard Group—Note B | |
| Investment Advisory Services | 203 |
| Management and Administrative | 5,879 |
| Marketing and Distribution | 910 |
| Custodian Fees | 74 |
| Auditing Fees | 28 |
| Shareholders’ Reports | 49 |
| Trustees’ Fees and Expenses | 5 |
| Total Expenses | 7,148 |
| Expense Reduction—Note B | (1,645) |
| Net Expenses | 5,503 |
| Net Investment Income | 444 |
| Realized Net Gain (Loss) on Investment Securities Sold | 35 |
| Net Increase (Decrease) in Net Assets Resulting from Operations | 479 |
See accompanying Notes, which are an integral part of the Financial Statements.
40
| | |
| Federal Money Market Fund | | |
| |
| |
| Statement of Changes in Net Assets | | |
| |
| | Year Ended August 31, |
| | 2012 | 2011 |
| | ($000) | ($000) |
| Increase (Decrease) in Net Assets | | |
| Operations | | |
| Net Investment Income | 444 | 903 |
| Realized Net Gain (Loss) | 35 | 45 |
| Net Increase (Decrease) in Net Assets Resulting from Operations | 479 | 948 |
| Distributions | | |
| Net Investment Income | (444) | (903) |
| Realized Capital Gain | — | — |
| Total Distributions | (444) | (903) |
| Capital Share Transactions (at $1.00) | | |
| Issued | 379,852 | 474,221 |
| Issued in Lieu of Cash Distributions | 435 | 881 |
| Redeemed | (1,071,053) | (1,729,232) |
| Net Increase (Decrease) from Capital Share Transactions | (690,766) | (1,254,130) |
| Total Increase (Decrease) | (690,731) | (1,254,085) |
| Net Assets | | |
| Beginning of Period | 4,793,901 | 6,047,986 |
| End of Period | 4,103,170 | 4,793,901 |
See accompanying Notes, which are an integral part of the Financial Statements.
41
| | | | | |
| Federal Money Market Fund | | | | | |
| |
| |
| Financial Highlights | | | | | |
| |
| |
| For a Share Outstanding | | | Year Ended August 31, |
| Throughout Each Period | 2012 | 2011 | 2010 | 2009 | 2008 |
| Net Asset Value, Beginning of Period | $1.00 | $1.00 | $1.00 | $1.00 | $1.00 |
| Investment Operations | | | | | |
| Net Investment Income | .0001 | .0002 | .0004 | .011 | .034 |
| Net Realized and Unrealized Gain (Loss) | | | | | |
| on Investments | — | — | — | — | — |
| Total from Investment Operations | .0001 | .0002 | .0004 | .011 | .034 |
| Distributions | | | | | |
| Dividends from Net Investment Income | (.0001) | (.0002) | (.0004) | (.011) | (.034) |
| Distributions from Realized Capital Gains | — | — | — | — | — |
| Total Distributions | (.0001) | (.0002) | (.0004) | (.011) | (.034) |
| Net Asset Value, End of Period | $1.00 | $1.00 | $1.00 | $1.00 | $1.00 |
| |
| Total Return1 | 0.01% | 0.02% | 0.04% | 1.06% | 3.46% |
| |
| Ratios/Supplemental Data | | | | | |
| Net Assets, End of Period (Millions) | $4,103 | $4,794 | $6,048 | $9,386 | $8,982 |
| Ratio of Expenses to | | | | | |
| Average Net Assets | 0.12%2 | 0.19%2 | 0.22% | 0.27%3 | 0.23% |
| Ratio of Net Investment Income to | | | | | |
| Average Net Assets | 0.01% | 0.02% | 0.04% | 1.03% | 3.33% |
1 Total returns do not include account service fees that may have applied in the periods shown. Fund prospectuses provide information about any applicable account service fees.
2 The ratios of total expenses to average net assets before expense reductions were 0.16% and 0.20%. See Note B in the Notes to Financial Statements.
3 Includes 0.02% of fees to participate in the Treasury Temporary Guarantee Program for Money Market Funds.
See accompanying Notes, which are an integral part of the Financial Statements.
42
Federal Money Market Fund
Notes to Financial Statements
Vanguard Federal Money Market Fund is registered under the Investment Company Act of 1940 as an open-end investment company, or mutual fund. The fund invests in short-term debt instruments issued by the U.S. government or its agencies and instrumentalities, and repurchase agreements collateralized by such instruments.
A. The following significant accounting policies conform to generally accepted accounting principles for U.S. mutual funds. The fund consistently follows such policies in preparing its financial statements. 1. Security Valuation: Securities are valued at amortized cost, which approximates market value.
2. Repurchase Agreements: The fund may enter into repurchase agreements. Securities pledged as collateral for repurchase agreements are held by a custodian bank until the agreements mature. Each agreement requires that the market value of the collateral be sufficient to cover payments of interest and principal. In the event of default or bankruptcy by the other party to the agreement, the fund may sell or retain the collateral; however, such action may be subject to legal proceedings.
3. Federal Income Taxes: The fund intends to continue to qualify as a regulated investment company and distribute all of its taxable income. Management has analyzed the fund’s tax positions taken for all open federal income tax years (August 31, 2009–2012), and has concluded that no provision for federal income tax is required in the fund’s financial statements.
4. Distributions: Distributions from net investment income are declared daily and paid on the first business day of the following month.
5. Other: Interest income is accrued daily. Premiums and discounts on debt securities purchased are amortized and accreted, respectively, to interest income over the lives of the respective securities. Security transactions are accounted for on the date securities are bought or sold. Costs used to determine realized gains (losses) on the sale of investment securities are those of the specific securities sold.
B. The Vanguard Group furnishes at cost investment advisory, corporate management, administrative, marketing, and distribution services. The costs of such services are allocated to the fund under methods approved by the board of trustees. The fund has committed to provide up to 0.40% of its net assets in capital contributions to Vanguard. At August 31, 2012, the fund had contributed capital of $600,000 to Vanguard (included in Other Assets), representing 0.01% of the fund’s net assets and 0.24% of Vanguard’s capitalization. The fund’s trustees and officers are also directors and officers of Vanguard. Vanguard and the board of trustees have agreed to temporarily limit certain net operating expenses in excess of the fund’s daily yield so as to maintain a zero or positive yield for the fund. Vanguard and the board of trustees may terminate the temporary expense limitation at any time. For the year ended August 31, 2012, Vanguard’s expenses were reduced by $1,645,000 (an effective annual rate of 0.04% of the fund’s average net assets).
43
Federal Money Market Fund
C. Various inputs may be used to determine the value of the fund’s investments. These inputs are summarized in three broad levels for financial statement purposes. The inputs or methodologies used to value securities are not necessarily an indication of the risk associated with investing in those securities.
Level 1—Quoted prices in active markets for identical securities.
Level 2—Other significant observable inputs (including quoted prices for similar securities, interest rates, prepayment speeds, credit risk, etc.).
Level 3—Significant unobservable inputs (including the fund’s own assumptions used to determine the fair value of investments).
At August 31, 2012, 100% of the market value of the fund’s investments was determined using amortized cost, in accordance with rules under the Investment Company Act of 1940. Amortized cost approximates the current fair value of a security, but since the value is not obtained from a quoted price in an active market, securities valued at amortized cost are considered to be valued using Level 2 inputs.
D. In preparing the financial statements as of August 31, 2012, management considered the impact of subsequent events for potential recognition or disclosure in these financial statements.
44
Admiral Treasury Money Market Fund
Fund Profile
As of August 31, 2012
| |
| Financial Attributes | |
| Ticker Symbol | VUSXX |
| Expense Ratio1 | 0.12% |
| 7-Day SEC Yield | 0.02% |
| Average Weighted | |
| Maturity | 56 days |
| |
| Sector Diversification (% of portfolio) | |
| U.S. Treasury Bills | 100.0% |
The agency and mortgage-backed securities sectors may include issues from government-sponsored enterprises; such issues are generally not backed by the full faith and credit of the U.S. government.
| |
| Distribution by Credit Quality (% of portfolio) |
| First Tier | 100.0% |
For information about these ratings, see the Glossary entry for Credit Quality.
1 The expense ratio shown is from the prospectus dated December 27, 2011, and represents estimated costs for the current fiscal year. For the fiscal year ended August 31, 2012, the expense ratio was 0.05%, reflecting a temporary reduction in operating expenses (described in Note B of the Notes to Financial Statements). Before this reduction, the expense ratio was 0.10%.
45
Admiral Treasury Money Market Fund
Performance Summary
Investment returns will fluctuate. All of the returns in this report represent past performance, which is not a guarantee of future results that may be achieved by the fund. (Current performance may be lower or higher than the performance data cited. For performance data current to the most recent month-end, visit our website at vanguard.com/performance.) The returns shown do not reflect taxes that a shareholder would pay on fund distributions. An investment in a money market fund is not insured or guaranteed by the Federal Deposit Insurance Corporation or any other government agency. Although the fund seeks to preserve the value of your investment at $1 per share, it is possible to lose money by investing in the fund. The fund’s 7-day SEC yield reflects its current earnings more closely than do the average annual returns.
Cumulative Performance: August 31, 2002, Through August 31, 2012
Initial Investment of $50,000
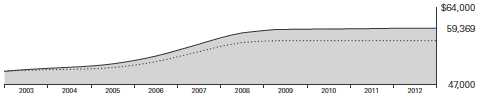
| | | | |
| | | Average Annual Total Returns | |
| | | Periods Ended August 31, 2012 | |
| | | | | Final Value |
| | One | Five | Ten | of a $50,000 |
| | Year | Years | Years | Investment |
| Admiral Treasury Money Market | | | | |
| Fund | 0.01% | 0.76% | 1.73% | $59,369 |
| iMoneyNet Money Fund Report’s | | | | |
| 100% Treasury Funds Average | 0.00 | 0.45 | 1.27 | 56,722 |
| Citigroup Three-Month U.S. Treasury | | | | |
| Bill Index | 0.05 | 0.71 | 1.74 | 59,411 |
iMoneyNet Money Fund Report’s 100% Treasury Funds Average: Derived from data provided by iMoneyNet, Inc.
See Financial Highlights for dividend information.
46
Admiral Treasury Money Market Fund
Fiscal-Year Total Returns (%): August 31, 2002, Through August 31, 2012
| | |
| | | iMoneyNet |
| | | Average |
| Fiscal Year | Total Returns | Total Returns |
| 2003 | 1.20% | 0.67% |
| 2004 | 0.91 | 0.39 |
| 2005 | 2.29 | 1.61 |
| 2006 | 4.22 | 3.54 |
| 2007 | 5.01 | 4.34 |
| 2008 | 3.08 | 2.08 |
| 2009 | 0.70 | 0.17 |
| 2010 | 0.03 | 0.00 |
| 2011 | 0.02 | 0.00 |
| 2012 | 0.01 | 0.00 |
7-day SEC yield (8/31/2012): 0.02%
iMoneyNet Money Fund Report’s 100% Treasury Funds Average: Derived from data provided by iMoneyNet, Inc.
Average Annual Total Returns: Periods Ended June 30, 2012
This table presents returns through the latest calendar quarter—rather than through the end of the fiscal period.
Securities and Exchange Commission rules require that we provide this information.
| | | | |
| | Inception | One | Five | Ten |
| | Date | Year | Years | Years |
| Admiral Treasury Money Market | | | | |
| Fund | 12/14/1992 | 0.01% | 0.92% | 1.76% |
47
Admiral Treasury Money Market Fund
Financial Statements
Statement of Net Assets
As of August 31, 2012
The fund reports a complete list of its holdings in various monthly and quarterly regulatory filings. The fund publishes its holdings on a monthly basis at vanguard.com and files them with the Securities and Exchange Commission on Form N-MFP. The fund’s Form N-MFP filings become public 60 days after the relevant month-end, and may be viewed at sec.gov or via a link on the “Portfolio Holdings” page on vanguard.com. For the second and fourth fiscal quarters, the lists appear in the fund’s semiannual and annual reports to shareholders. For the first and third fiscal quarters, the fund files the lists with the SEC on Form N-Q. Shareholders can look up the fund’s Forms N-Q on the SEC’s website at sec.gov. Forms N-Q may also be reviewed and copied at the SEC’s Public Reference Room (see the back cover of this report for further information).
| | | | |
| | | | Face | Market |
| | | Maturity | Amount | Value |
| | Yield1 | Date | ($000) | ($000) |
| U.S. Government and Agency Obligations (100.0%) | | | |
| United States Cash Management Bill | 0.113% | 9/17/12 | 3,955 | 3,955 |
| United States Treasury Bill | 0.076%–0.120% | 9/6/12 | 672,843 | 672,835 |
| United States Treasury Bill | 0.076%–0.090% | 9/13/12 | 810,786 | 810,762 |
| United States Treasury Bill | 0.096%–0.098% | 9/20/12 | 1,020,000 | 1,019,947 |
| United States Treasury Bill | 0.091%–0.150% | 9/27/12 | 1,422,000 | 1,421,890 |
| United States Treasury Bill | 0.103%–0.140% | 10/4/12 | 1,200,000 | 1,199,870 |
| United States Treasury Bill | 0.093%–0.150% | 10/11/12 | 918,000 | 917,879 |
| United States Treasury Bill | 0.091% | 10/18/12 | 624,000 | 623,926 |
| United States Treasury Bill | 0.090%–0.091% | 10/25/12 | 881,000 | 880,881 |
| United States Treasury Bill | 0.108%–0.150% | 11/1/12 | 790,000 | 789,840 |
| United States Treasury Bill | 0.100%–0.145% | 11/8/12 | 900,000 | 899,814 |
| United States Treasury Bill | 0.110%–0.148% | 11/15/12 | 825,000 | 824,791 |
| United States Treasury Bill | 0.104%–0.143% | 11/23/12 | 968,000 | 967,754 |
| United States Treasury Bill | 0.110% | 11/29/12 | 750,000 | 749,796 |
| United States Treasury Bill | 0.145% | 1/10/13 | 228,000 | 227,880 |
| United States Treasury Bill | 0.143% | 1/17/13 | 250,000 | 249,864 |
| United States Treasury Bill | 0.140% | 1/24/13 | 140,000 | 139,921 |
| United States Treasury Bill | 0.138% | 2/7/13 | 200,000 | 199,878 |
| United States Treasury Bill | 0.145% | 2/14/13 | 100,000 | 99,933 |
| United States Treasury Note/Bond | 0.500% | 11/30/12 | 550,000 | 550,458 |
| United States Treasury Note/Bond | 3.875% | 2/15/13 | 100,000 | 101,678 |
| Total U.S. Government and Agency Obligations (Cost $13,353,552) | | | 13,353,552 |
| Total Investments (100.0%) (Cost $13,353,552) | | | 13,353,552 |
48
| |
| Admiral Treasury Money Market Fund | |
| |
| |
| | Market |
| | Value |
| | ($000) |
| Other Assets and Liabilities (0.0%) | |
| Other Assets | 13,611 |
| Liabilities | (13,460) |
| | 151 |
| Net Assets (100%) | |
| Applicable to 13,350,463,734 outstanding $.001 par value shares of | |
| beneficial interest (unlimited authorization) | 13,353,703 |
| Net Asset Value Per Share | $1.00 |
| |
| At August 31, 2012, net assets consisted of: | |
| | Amount |
| | ($000) |
| Paid-in Capital | 13,353,510 |
| Undistributed Net Investment Income | — |
| Accumulated Net Realized Gains | 193 |
| Net Assets | 13,353,703 |
See Note A in Notes to Financial Statements.
1 Represents annualized yield at date of purchase for discount securities, and coupon for coupon-bearing securities.
See accompanying Notes, which are an integral part of the Financial Statements.
49
Admiral Treasury Money Market Fund
Statement of Operations
| |
| | Year Ended |
| | August 31, 2012 |
| | ($000) |
| Investment Income | |
| Income | |
| Interest | 8,739 |
| Total Income | 8,739 |
| Expenses | |
| The Vanguard Group—Note B | |
| Investment Advisory Services | 652 |
| Management and Administrative | 10,572 |
| Marketing and Distribution | 2,570 |
| Custodian Fees | 214 |
| Auditing Fees | 23 |
| Shareholders’ Reports | 75 |
| Trustees’ Fees and Expenses | 14 |
| Total Expenses | 14,120 |
| Expense Reduction—Note B | (6,934) |
| Net Expenses | 7,186 |
| Net Investment Income | 1,553 |
| Realized Net Gain (Loss) on Investment Securities Sold | 46 |
| Net Increase (Decrease) in Net Assets Resulting from Operations | 1,599 |
See accompanying Notes, which are an integral part of the Financial Statements.
50
Admiral Treasury Money Market Fund
Statement of Changes in Net Assets
| | |
| | Year Ended August 31, |
| | 2012 | 2011 |
| | ($000) | ($000) |
| Increase (Decrease) in Net Assets | | |
| Operations | | |
| Net Investment Income | 1,553 | 2,726 |
| Realized Net Gain (Loss) | 46 | 110 |
| Net Increase (Decrease) in Net Assets Resulting from Operations | 1,599 | 2,836 |
| Distributions | | |
| Net Investment Income | (1,553) | (2,726) |
| Realized Capital Gain | — | — |
| Total Distributions | (1,553) | (2,726) |
| Capital Share Transactions (at $1.00) | | |
| Issued | 865,430 | 976,384 |
| Issued in Lieu of Cash Distributions | 1,508 | 2,643 |
| Redeemed | (2,827,163) | (4,391,653) |
| Net Increase (Decrease) from Capital Share Transactions | (1,960,225) | (3,412,626) |
| Total Increase (Decrease) | (1,960,179) | (3,412,516) |
| Net Assets | | |
| Beginning of Period | 15,313,882 | 18,726,398 |
| End of Period | 13,353,703 | 15,313,882 |
See accompanying Notes, which are an integral part of the Financial Statements.
51
Admiral Treasury Money Market Fund
Financial Highlights
| | | | | |
| For a Share Outstanding | | | Year Ended August 31, |
| Throughout Each Period | 2012 | 2011 | 2010 | 2009 | 2008 |
| Net Asset Value, Beginning of Period | $1.00 | $1.00 | $1.00 | $1.00 | $1.00 |
| Investment Operations | | | | | |
| Net Investment Income | .0001 | .0002 | .0003 | .007 | .030 |
| Net Realized and Unrealized Gain (Loss) | | | | | |
| on Investments | — | — | — | — | — |
| Total from Investment Operations | .0001 | .0002 | .0003 | .007 | .030 |
| Distributions | | | | | |
| Dividends from Net Investment Income | (.0001) | (.0002) | (.0003) | (.007) | (.030) |
| Distributions from Realized Capital Gains | — | — | — | — | — |
| Total Distributions | (.0001) | (.0002) | (.0003) | (.007) | (.030) |
| Net Asset Value, End of Period | $1.00 | $1.00 | $1.00 | $1.00 | $1.00 |
| |
| Total Return1 | 0.01% | 0.02% | 0.03% | 0.70% | 3.08% |
| |
| Ratios/Supplemental Data | | | | | |
| Net Assets, End of Period (Millions) | $13,354 | $15,314 | $18,726 | $25,435 | $23,289 |
| Ratio of Expenses to | | | | | |
| Average Net Assets | 0.05%2 | 0.11%2 | 0.14% | 0.15%3 | 0.10% |
| Ratio of Net Investment Income to | | | | | |
| Average Net Assets | 0.01% | 0.02% | 0.03% | 0.74% | 2.98% |
1 Total returns do not include account service fees that may have applied in the periods shown. Fund prospectuses provide information about any applicable account service fees.
2 The ratios of total expenses to average net assets before expense reductions were 0.10% and 0.12%. See Note B in Notes to Financial Statements.
3 Includes 0.03% of fees to participate in the Treasury Temporary Guarantee Program for Money Market Funds.
See accompanying Notes, which are an integral part of the Financial Statements.
52
Admiral Treasury Money Market Fund
Notes to Financial Statements
Vanguard Admiral Treasury Money Market Fund is registered under the Investment Company Act 1940 as an open-end investment company, or mutual fund. The fund invests in short-term debt instruments backed by the full faith and credit of the U.S. government.
A. The following significant accounting policies conform to generally accepted accounting principles for U.S. mutual funds. The fund consistently follows such policies in preparing its financial statements 1. Security Valuation: Securities are valued at amortized cost, which approximates market value.
2. Federal Income Taxes: The fund intends to continue to qualify as a regulated investment company and distribute all of its taxable income. Management has analyzed the fund’s tax positions taken for all open federal income tax years (August 31, 2009–2012), and has concluded that no provision for federal income tax is required in the fund’s financial statements.
3. Distributions: Distributions from net investment income are declared daily and paid on the first business day of the following month.
4. Other: Interest income is accrued daily. Premiums and discounts on debt securities purchased amortized and accreted, respectively, to interest income over the lives of the respective securities. Security transactions are accounted for on the date securities are bought or sold. Costs used to determine realized gains (losses) on the sale of investment securities are those of the specific securities sold.
B. The Vanguard Group furnishes at cost investment advisory, corporate management, administrative, marketing, and distribution services. The costs of such services are allocated to the fund under methods approved by the board of trustees. The fund has committed to provide up to 0.40% of its net assets in capital contributions to Vanguard. At August 31, 2012, the fund had contributed capital of $1,953,000 to Vanguard (included in Other Assets), representing 0.01% of the fund’s net assets and 0.78% of Vanguard’s capitalization. The fund’s trustees and officers are also directors and officers of Vanguard. Vanguard and the board of trustees have agreed to temporarily limit certain net operating expenses in excess of the fund’s daily yield so as to maintain a zero or positive yield for the fund. Vanguard and the board of trustees may terminate the temporary expense limitation at any time. For the year ended August 31, 2012, Vanguard’s expenses were reduced by $6,934,000 (an effective annual rate of 0.05% of the fund’s average net assets).
C. Various inputs may be used to determine the value of the fund’s investments. These inputs are summarized in three broad levels for financial statement purposes. The inputs or methodologies used to value securities are not necessarily an indication of the risk associated with investing in those securities.
Level 1—Quoted prices in active markets for identical securities.
Level 2—Other significant observable inputs (including quoted prices for similar securities, interest rates, prepayment speeds, credit risk, etc.).
Level 3—Significant unobservable inputs (including the fund’s own assumptions used to determine the fair value of investments).
53
Admiral Treasury Money Market Fund
At August 31, 2012, 100% of the market value of the fund’s investments was determined using amortized cost, in accordance with rules under the Investment Company Act of 1940. Amortized cost approximates the current fair value of a security, but since the value is not obtained from a quoted price in an active market, securities valued at amortized cost are considered to be valued using Level 2 inputs.
D. In preparing the financial statements as of August 31, 2012, management considered the impact of subsequent events for potential recognition or disclosure in these financial statements.
54
Report of Independent Registered
Public Accounting Firm
To the Trustees of Vanguard Money Market Reserves and Vanguard Admiral Funds and the Shareholders of Vanguard Prime Money Market Fund, Vanguard Federal Money Market Fund and Vanguard Admiral Treasury Money Market Fund:
In our opinion, the accompanying statements of net assets and the related statements of operations and of changes in net assets and the financial highlights present fairly, in all material respects, the financial position of Vanguard Prime Money Market Fund, Vanguard Federal Money Market Fund and Vanguard Admiral Treasury Money Market Fund (the “Funds”) at August 31, 2012, the results of each of their operations for the year then ended, the changes in each of their net assets for each of the two years in the period then ended and the financial highlights for each of the five years in the period then ended, in conformity with accounting principles generally accepted in the United States of America. These financial statements and financial highlights (hereafter referred to as “financial statements”) are the responsibility of the Funds’ management; our responsibility is to express an opinion on these financial statements based on our audits. We conducted our audits of these financial statements in accordance with the standards of the Public Company Accounting Oversight Board (United States). Those standards require that we plan and perform the audit to obtain reasonable assurance about whether the financial statements are free of material misstatement. An audit includes examining, on a test basis, evidence supporting the amounts and disclosures in the financial statements, assessing the accounting principles used and significant estimates made by management, and evaluating the overall financial statement presentation. We believe that our audits, which included confirmation of securities at August 31, 2012 by correspondence with the custodians and brokers and by agreement to the underlying ownership records of Vanguard Municipal Cash Management Fund, provide a reasonable basis for our opinion.
PricewaterhouseCoopers LLP
Philadelphia, Pennsylvania
October 11, 2012
55
| |
| Special 2012 tax information (unaudited) for Vanguard Prime Money Market Fund |
| |
| This information for the fiscal year ended August 31, 2012, is included pursuant to provisions of the |
| Internal Revenue Code. |
| |
| For nonresident alien shareholders, 70.0% of income dividends are interest-related dividends. |
| |
| |
| Special 2012 tax information (unaudited) for Vanguard Federal Money Market Fund |
| |
| This information for the fiscal year ended August 31, 2012, is included pursuant to provisions of the |
| Internal Revenue Code. |
| |
| For nonresident alien shareholders, 100% of income dividends are interest-related dividends. |
| |
| |
| Special 2012 tax information (unaudited) for Vanguard Admiral Treasury Money Market Fund |
| |
| This information for the fiscal year ended August 31, 2012, is included pursuant to provisions of the |
| Internal Revenue Code. |
| |
| For nonresident alien shareholders, 100% of income dividends are interest-related dividends. |
56
About Your Fund’s Expenses
As a shareholder of the fund, you incur ongoing costs, which include costs for portfolio management, administrative services, and shareholder reports (like this one), among others. Operating expenses, which are deducted from a fund’s gross income, directly reduce the investment return of the fund.
A fund’s expenses are expressed as a percentage of its average net assets. This figure is known as the expense ratio. The following examples are intended to help you understand the ongoing costs (in dollars) of investing in your fund and to compare these costs with those of other mutual funds. The examples are based on an investment of $1,000 made at the beginning of the period shown and held for the entire period.
The accompanying table illustrates your fund’s costs in two ways:
• Based on actual fund return. This section helps you to estimate the actual expenses that you paid over the period. The ”Ending Account Value“ shown is derived from the fund‘s actual return, and the third column shows the dollar amount that would have been paid by an investor who started with $1,000 in the fund. You may use the information here, together with the amount you invested, to estimate the expenses that you paid over the period.
To do so, simply divide your account value by $1,000 (for example, an $8,600 account value divided by $1,000 = 8.6), then multiply the result by the number given for your fund under the heading ”Expenses Paid During Period.“
• Based on hypothetical 5% yearly return. This section is intended to help you compare your fund‘s costs with those of other mutual funds. It assumes that the fund had a yearly return of 5% before expenses, but that the expense ratio is unchanged. In this case—because the return used is not the fund’s actual return—the results do not apply to your investment. The example is useful in making comparisons because the Securities and Exchange Commission requires all mutual funds to calculate expenses based on a 5% return. You can assess your fund’s costs by comparing this hypothetical example with the hypothetical examples that appear in shareholder reports of other funds.
Note that the expenses shown in the table are meant to highlight and help you compare ongoing costs only and do not reflect transaction costs incurred by the fund for buying and selling securities. Further, the expenses do not include any purchase, redemption, or account service fees described in the fund prospectus. If such fees were applied to your account, your costs would be higher. Your fund does not carry a “sales load.”
The calculations assume no shares were bought or sold during the period. Your actual costs may have been higher or lower, depending on the amount of your investment and the timing of any purchases or redemptions.
You can find more information about the fund’s expenses, including annual expense ratios, in the Financial Statements section of this report. For additional information on operating expenses and other shareholder costs, please refer to your fund’s current prospectus.
57
| | | |
| Six Months Ended August 31, 2012 | | | |
| | Beginning | Ending | Expenses |
| | Account Value | Account Value | Paid During |
| | 2/29/2012 | 8/31/2012 | Period |
| Based on Actual Fund Return | | | |
| Prime Money Market Fund | | | |
| Investor Shares | $1,000.00 | $1,000.21 | $0.81 |
| Institutional Shares | 1,000.00 | 1,000.54 | 0.45 |
| Federal Money Market Fund | $1,000.00 | $1,000.05 | $0.71 |
| Admiral Treasury Money Market Fund | $1,000.00 | $1,000.06 | $0.40 |
| Based on Hypothetical 5% Yearly Return | | | |
| Prime Money Market Fund | | | |
| Investor Shares | $1,000.00 | $1,024.40 | $0.82 |
| Institutional Shares | 1,000.00 | 1,024.75 | 0.46 |
| Federal Money Market Fund | $1,000.00 | $1,024.50 | $0.71 |
| Admiral Treasury Money Market Fund | $1,000.00 | $1,024.80 | $0.41 |
The calculations are based on expenses incurred in the most recent six-month period. The funds’ annualized six-month expense ratios for the period are: for the Prime Money Market Fund, 0.16% for Investor Shares and 0.09% for Institutional Shares; for the Federal Money Market Fund, 0.14%; and for the Admiral Treasury Money Market Fund, 0.08%. The annualized six-month expense ratios for the Federal Money Market Fund and the Admiral Treasury Money Market Fund reflect a temporary reduction in operating expenses (described in Note B of the Notes to Financial Statements). Before the reduction, the annualized six-month expense ratios were: for the Federal Money Market Fund, 0.18%; and for the Admiral Treasury Money Market Fund, 0.13%.
58
Trustees Approve Advisory Arrangement
The board of trustees of Vanguard Prime Money Market Fund, Federal Money Market Fund, and Admiral Treasury Money Market Fund has renewed the funds’ investment advisory arrangement with The Vanguard Group, Inc. Vanguard—through its Fixed Income Group—serves as the investment advisor to the funds. The board determined that continuing the funds’ internalized management structure was in the best interests of the funds and their shareholders.
The board based its decision upon an evaluation of the advisor’s investment staff, portfolio management process, and performance. The trustees considered the factors discussed below, among others. However, no single factor determined whether the board approved the arrangement. Rather, it was the totality of the circumstances that drove the board’s decision.
Nature, extent, and quality of services
The board considered the quality of the funds’ investment management over both the short and long term and took into account the organizational depth and stability of the advisor. The board noted that Vanguard has been managing investments for more than three decades. The Fixed Income Group adheres to a sound, disciplined investment management process; the team has considerable experience, stability, and depth.
The board concluded that Vanguard’s experience, stability, depth, and performance, among other factors, warranted continuation of the advisory arrangement.
Investment performance
The board considered the short- and long-term performance of the funds, including any periods of outperformance or underperformance of relevant benchmarks and peer groups. The board concluded that the funds have performed in line with expectations, and that their results have been consistent with their investment policies. Information about each fund’s most recent performance can be found on the Performance Summary pages of this report.
Cost
The board concluded that each fund’s expense ratio was well below the average expense ratio charged by funds in its peer group and that the funds’ advisory fee rates were also well below their peer-group averages. Information about the funds’ expenses appears in the About Your Fund’s Expenses section of this report as well as in the Financial Statements sections.
The board does not conduct a profitability analysis of Vanguard, because of Vanguard’s unique “at-cost” structure. Unlike most other mutual fund management companies, Vanguard is owned by the funds it oversees, and produces “profits” only in the form of reduced expenses for fund shareholders.
The benefit of economies of scale
The board concluded that the funds’ low-cost arrangement with Vanguard ensures that the funds will realize economies of scale as they grow, with the cost to shareholders declining as fund assets increase.
The board will consider whether to renew the advisory arrangement again after a one-year period.
59
Glossary
SEC Yields. A money market fund’s 7-day SEC yield is calculated by annualizing its income distributions for the previous seven days, as required by the U.S. Securities and Exchange Commission.
Average Weighted Maturity. The average length of time until fixed income securities held by a fund reach maturity and are repaid. The figure reflects the proportion of fund assets represented by each security.
Credit Quality. For Vanguard money market funds, the Distribution by Credit Quality table includes tier ratings for consistency with SEC Rule 2a-7 under the Investment Company Act of 1940, which governs money market funds. A First Tier security is one that is eligible for money market funds and has been rated in the highest short-term rating category for debt obligations by the requisite nationally recognized statistical rating organizations. An unrated security is First Tier if it represents quality comparable to that of a rated security, as determined in accordance with SEC Rule 2a-7. A Second Tier security is one that is eligible for money market funds and is not a First Tier security.
Expense Ratio. A fund’s total annual operating expenses expressed as a percentage of the fund’s average net assets. The expense ratio includes management and administrative expenses, but does not include the transaction costs of buying and selling portfolio securities.
Inception Date. The date on which the assets of a fund (or one of its share classes) are first invested in accordance with the fund’s investment objective. For funds with a subscription period, the inception date is the day after that period ends. Investment performance is measured from the inception date.
60
This page intentionally left blank.
This page intentionally left blank.
This page intentionally left blank.
The People Who Govern Your Fund
The trustees of your mutual fund are there to see that the fund is operated and managed in your best interests since, as a shareholder, you are a part owner of the fund. Your fund’s trustees also serve on the board of directors of The Vanguard Group, Inc., which is owned by the Vanguard funds and provides services to them on an at-cost basis.
A majority of Vanguard’s board members are independent, meaning that they have no affiliation with Vanguard or the funds they oversee, apart from the sizable personal investments they have made as private individuals. The independent board members have distinguished backgrounds in business, academia, and public service. Each of the trustees and executive officers oversees 179 Vanguard funds.
The following table provides information for each trustee and executive officer of the fund. More information about the trustees is in the Statement of Additional Information, which can be obtained, without charge, by contacting Vanguard at 800-662-7447, or online at vanguard.com.
| |
| InterestedTrustee1 | and Delphi Automotive LLP (automotive components); |
| | Senior Advisor at New Mountain Capital; Trustee of |
| F. William McNabb III | The Conference Board. |
| Born 1957. Trustee Since July 2009. Chairman of the | |
| Board. Principal Occupation(s) During the Past Five | Amy Gutmann |
| Years: Chairman of the Board of The Vanguard Group, | Born 1949. Trustee Since June 2006. Principal |
| Inc., and of each of the investment companies served | Occupation(s) During the Past Five Years: President |
| by The Vanguard Group, since January 2010; Director | of the University of Pennsylvania; Christopher H. |
| of The Vanguard Group since 2008; Chief Executive | Browne Distinguished Professor of Political Science |
| Officer and President of The Vanguard Group and of | in the School of Arts and Sciences with secondary |
| each of the investment companies served by The | appointments at the Annenberg School for |
| Vanguard Group since 2008; Director of Vanguard | Communication and the Graduate School of Education |
| Marketing Corporation; Managing Director of The | of the University of Pennsylvania; Member of the |
| Vanguard Group (1995–2008). | National Commission on the Humanities and Social |
| | Sciences; Trustee of Carnegie Corporation of New |
| | York and of the National Constitution Center; Chair |
| IndependentTrustees | of the U. S. Presidential Commission for the Study |
| | of Bioethical Issues. |
| Emerson U. Fullwood | |
| Born 1948. Trustee Since January 2008. Principal | JoAnn Heffernan Heisen |
| Occupation(s) During the Past Five Years: Executive | Born 1950. Trustee Since July 1998. Principal |
| Chief Staff and Marketing Officer for North America | Occupation(s) During the Past Five Years: Corporate |
| and Corporate Vice President (retired 2008) of Xerox | Vice President and Chief Global Diversity Officer |
| Corporation (document management products and | (retired 2008) and Member of the Executive |
| services); Executive in Residence and 2010 | Committee (1997–2008) of Johnson & Johnson |
| Distinguished Minett Professor at the Rochester | (pharmaceuticals/medical devices/consumer |
| Institute of Technology; Director of SPX Corporation | products); Director of Skytop Lodge Corporation |
| (multi-industry manufacturing), the United Way of | (hotels), the University Medical Center at Princeton, |
| Rochester, Amerigroup Corporation (managed health | the Robert Wood Johnson Foundation, and the Center |
| care), the University of Rochester Medical Center, | for Talent Innovation; Member of the Advisory Board |
| Monroe Community College Foundation, and North | of the Maxwell School of Citizenship and Public Affairs |
| Carolina A&T University. | at Syracuse University. |
| |
| Rajiv L. Gupta | F. Joseph Loughrey |
| Born 1945. Trustee Since December 2001.2 | Born 1949. Trustee Since October 2009. Principal |
| Principal Occupation(s) During the Past Five Years: | Occupation(s) During the Past Five Years: President |
| Chairman and Chief Executive Officer (retired 2009) | and Chief Operating Officer (retired 2009) of Cummins |
| and President (2006–2008) of Rohm and Haas Co. | Inc. (industrial machinery); Director of SKF AB |
| (chemicals); Director of Tyco International, Ltd. | (industrial machinery), Hillenbrand, Inc. (specialized |
| (diversified manufacturing and services), Hewlett- | consumer services), the Lumina Foundation for |
| Packard Co. (electronic computer manufacturing), | |
| | |
| Education, and Oxfam America; Chairman of the | Executive Officers | |
| Advisory Council for the College of Arts and Letters | | |
| and Member of the Advisory Board to the Kellogg | Glenn Booraem | |
| Institute for International Studies at the University | Born 1967. Controller Since July 2010. Principal |
| of Notre Dame. | Occupation(s) During the Past Five Years: Principal |
| | of The Vanguard Group, Inc.; Controller of each of |
| Mark Loughridge | the investment companies served by The Vanguard |
| Born 1953. Trustee Since March 2012. Principal | Group; Assistant Controller of each of the investment |
| Occupation(s) During the Past Five Years: Senior Vice | companies served by The Vanguard Group (2001–2010). |
| President and Chief Financial Officer at IBM (information | | |
| technology services); Fiduciary Member of IBM’s | Thomas J. Higgins | |
| Retirement Plan Committee. | Born 1957. Chief Financial Officer Since September |
| | 2008. Principal Occupation(s) During the Past Five |
| Scott C. Malpass | Years: Principal of The Vanguard Group, Inc.; Chief |
| Born 1962. Trustee Since March 2012. Principal | Financial Officer of each of the investment companies |
| Occupation(s) During the Past Five Years: Chief | served by The Vanguard Group; Treasurer of each of |
| Investment Officer and Vice President at the University | the investment companies served by The Vanguard |
| of Notre Dame; Assistant Professor of Finance at the | Group (1998–2008). | |
| Mendoza College of Business at Notre Dame; Member | | |
| of the Notre Dame 403(b) Investment Committee; | Kathryn J. Hyatt | |
| Director of TIFF Advisory Services, Inc. (investment | Born 1955. Treasurer Since November 2008. Principal |
| advisor); Member of the Investment Advisory | Occupation(s) During the Past Five Years: Principal of |
| Committees of the Financial Industry Regulatory | The Vanguard Group, Inc.; Treasurer of each of the |
| Authority (FINRA) and of Major League Baseball. | investment companies served by The Vanguard |
| | Group; Assistant Treasurer of each of the investment |
| André F. Perold | companies served by The Vanguard Group (1988–2008). |
| Born 1952. Trustee Since December 2004. Principal | | |
| Occupation(s) During the Past Five Years: George | Heidi Stam | |
| Gund Professor of Finance and Banking at the Harvard | Born 1956. Secretary Since July 2005. Principal |
| Business School (retired 2011); Chief Investment | Occupation(s) During the Past Five Years: Managing |
| Officer and Managing Partner of HighVista Strategies | Director of The Vanguard Group, Inc.; General Counsel |
| LLC (private investment firm); Director of Rand | of The Vanguard Group; Secretary of The Vanguard |
| Merchant Bank; Overseer of the Museum of Fine | Group and of each of the investment companies |
| Arts Boston. | served by The Vanguard Group; Director and Senior |
| | Vice President of Vanguard Marketing Corporation. |
| Alfred M. Rankin, Jr. | | |
| Born 1941. Trustee Since January 1993. Principal | | |
| Occupation(s) During the Past Five Years: Chairman, | Vanguard Senior ManagementTeam |
| President, and Chief Executive Officer of NACCO | | |
| Industries, Inc. (forklift trucks/housewares/lignite); | Mortimer J. Buckley | Michael S. Miller |
| Director of Goodrich Corporation (industrial products/ | Kathleen C. Gubanich | James M. Norris |
| aircraft systems and services) and the National | Paul A. Heller | Glenn W. Reed |
| Association of Manufacturers; Chairman of the Board | Martha G. King | George U. Sauter |
| of the Federal Reserve Bank of Cleveland and of | Chris D. McIsaac | |
| University Hospitals of Cleveland; Advisory Chairman | | |
| of the Board of The Cleveland Museum of Art. | | |
| Chairman Emeritus and Senior Advisor |
| Peter F. Volanakis | | |
| Born 1955. Trustee Since July 2009. Principal | John J. Brennan | |
| Occupation(s) During the Past Five Years: President | Chairman, 1996–2009 | |
| and Chief Operating Officer (retired 2010) of Corning | Chief Executive Officer and President, 1996–2008 | |
| Incorporated (communications equipment); Director | | |
| of SPX Corporation (multi-industry manufacturing); | |
| Overseer of the Amos Tuck School of Business | Founder | |
| Administration at Dartmouth College; Advisor to the | John C. Bogle | |
| Norris Cotton Cancer Center. | Chairman and Chief Executive Officer, 1974–1996 | |
| | |
1 Mr. McNabb is considered an “interested person,” as defined in the Investment Company Act of 1940, because he is an officer of the Vanguard funds.
2 December 2002 for Vanguard Equity Income Fund, Vanguard Growth Equity Fund, the Vanguard Municipal Bond Funds, and the Vanguard State Tax-Exempt Funds.
|  |
| P.O. Box 2600 |
| Valley Forge, PA 19482-2600 |
| |
| Connect with Vanguard® > vanguard.com | |
| |
| |
| |
| Fund Information > 800-662-7447 | |
| Direct Investor Account Services > 800-662-2739 | |
| Institutional Investor Services > 800-523-1036 | |
| Text Telephone for People | |
| With Hearing Impairment > 800-749-7273 | |
| |
| This material may be used in conjunction | |
| with the offering of shares of any Vanguard | |
| fund only if preceded or accompanied by | |
| the fund’s current prospectus. | |
| |
| All comparative mutual fund data are from Lipper Inc. or | |
| Morningstar, Inc., unless otherwise noted. | |
| |
| You can obtain a free copy of Vanguard’s proxy voting | |
| guidelines by visiting vanguard.com/proxyreporting or by | |
| calling Vanguard at 800-662-2739. The guidelines are | |
| also available from the SEC’s website, sec.gov. In | |
| addition, you may obtain a free report on how your fund | |
| voted the proxies for securities it owned during the 12 | |
| months ended June 30. To get the report, visit either | |
| vanguard.com/proxyreporting or sec.gov. | |
| |
| You can review and copy information about your fund at | |
| the SEC’s Public Reference Room in Washington, D.C. To | |
| find out more about this public service, call the SEC at | |
| 202-551-8090. Information about your fund is also | |
| available on the SEC’s website, and you can receive | |
| copies of this information, for a fee, by sending a | |
| request in either of two ways: via e-mail addressed to | |
| publicinfo@sec.gov or via regular mail addressed to the | |
| Public Reference Section, Securities and Exchange | |
| Commission, Washington, DC 20549-1520. | |
| |
| |
| | © 2012 The Vanguard Group, Inc. |
| | All rights reserved. |
| | Vanguard Marketing Corporation, Distributor. |
| |
| | Q300 102012 |
Item 2: Code of Ethics. The Registrant has adopted a code of ethics that applies to the Registrant’s principal executive officer, principal financial officer, principal accounting officer or controller or persons performing similar functions. The Code of Ethics was amended during the reporting period covered by this report to make certain technical, non-material changes.
Item 3: Audit Committee Financial Expert. The following members of the Audit Committee have been determined by the Registrant’s Board of Trustees to be Audit Committee Financial Experts serving on its Audit Committee, and to be independent: Rajiv L. Gupta, Amy Gutmann, JoAnn Heffernan Heisen, F. Joseph Loughrey, Mark Loughridge, Scott C. Malpass, André F. Perold, and Alfred M. Rankin, Jr.
Item 4: Principal Accountant Fees and Services.
(a) Audit Fees.
Audit Fees of the Registrant
Fiscal Year Ended August 31, 2012: $56,000 Fiscal Year Ended August 31, 2011: $56,000
Aggregate Audit Fees of Registered Investment Companies in the Vanguard Group.
Fiscal Year Ended August 31, 2012: $4,809,780
Fiscal Year Ended August 31, 2011: $3,978,540
(b) Audit-Related Fees.
Fiscal Year Ended August 31, 2012: $1,812,565
Fiscal Year Ended August 31, 2011: $1,341,750
Includes fees billed in connection with assurance and related services provided to the Registrant, The Vanguard Group, Inc., Vanguard Marketing Corporation, and other registered investment companies in the Vanguard Group.
(c) Tax Fees.
Fiscal Year Ended August 31, 2012: $490,518
Fiscal Year Ended August 31, 2011: $373,830
Includes fees billed in connection with tax compliance, planning and advice services provided to the Registrant, The Vanguard Group, Inc., Vanguard Marketing Corporation, and other registered investment companies in the Vanguard Group and related to income and excise taxes.
(d) All Other Fees.
Fiscal Year Ended August 31, 2012: $16,000
Fiscal Year Ended August 31, 2011: $16,000
Includes fees billed for services related to risk management and privacy matters. Services were provided to the Registrant, The Vanguard Group, Inc., Vanguard Marketing Corporation, and other registered investment companies in the Vanguard Group.
(e) (1) Pre-Approval Policies. The policy of the Registrant’s Audit Committee is to consider and, if appropriate, approve before the principal accountant is engaged for such services, all specific audit and non-audit services provided to: (1) the Registrant; (2) The Vanguard Group, Inc.; (3) other entities controlled by The Vanguard Group, Inc. that provide ongoing services to the Registrant; and (4) other registered investment companies in the Vanguard Group. In making a determination, the Audit Committee considers whether the services are consistent with maintaining the principal accountant’s independence.
In the event of a contingency situation in which the principal accountant is needed to provide services in between scheduled Audit Committee meetings, the Chairman of the Audit Committee would be called on to consider and, if appropriate, pre-approve audit or permitted non-audit services in an amount sufficient to complete services through the next Audit Committee meeting, and to determine if such services would be consistent with maintaining the accountant’s independence. At the next scheduled Audit Committee meeting, services and fees would be presented to the Audit Committee for formal consideration, and, if appropriate, approval by the entire Audit Committee. The Audit Committee would again consider whether such services and fees are consistent with maintaining the principal accountant’s independence.
The Registrant’s Audit Committee is informed at least annually of all audit and non-audit services provided by the principal accountant to the Vanguard complex, whether such services are provided to: (1) the Registrant; (2) The Vanguard Group, Inc.; (3) other entities controlled by The Vanguard Group, Inc. that provide ongoing services to the Registrant; or (4) other registered investment companies in the Vanguard Group.
(2) No percentage of the principal accountant’s fees or services were approved pursuant to the waiver provision of paragraph (c)(7)(i)(C) of Rule 2-01 of Regulation S-X.
(f) For the most recent fiscal year, over 50% of the hours worked under the principal accountant’s engagement were not performed by persons other than full-time, permanent employees of the principal accountant.
(g) Aggregate Non-Audit Fees.
Fiscal Year Ended August 31, 2012: $506,518
Fiscal Year Ended August 31, 2011: $389,830
Includes fees billed for non-audit services provided to the Registrant, The Vanguard Group, Inc., Vanguard Marketing Corporation, and other registered investment companies in the Vanguard Group.
(h) For the most recent fiscal year, the Audit Committee has determined that the provision of all non-audit services was consistent with maintaining the principal accountant’s independence.
Item 5: Audit Committee of Listed Registrants.
Not Applicable.
Item 6: Investments.
Not Applicable.
Item 7: Disclosure of Proxy Voting Policies and Procedures for Closed-End Management Investment Companies.
Not Applicable.
Item 8: Portfolio Managers of Closed-End Management Investment Companies.
Not Applicable.
Item 9: Purchase of Equity Securities by Closed-End Management Investment Company and Affiliated Purchasers.
Not Applicable.
Item 10: Submission of Matters to a Vote of Security Holders.
Not Applicable.
Item 11: Controls and Procedures.
(a) Disclosure Controls and Procedures. The Principal Executive and Financial Officers concluded that the Registrant's Disclosure Controls and Procedures are effective based on their evaluation of the Disclosure Controls and Procedures as of a date within 90 days of the filing date of this report.
(b) Internal Control Over Financial Reporting. There were no significant changes in Registrant’s Internal Control Over Financial Reporting or in other factors that could significantly affect this control subsequent to the date of the evaluation, including any corrective actions with regard to significant deficiencies and material weaknesses.
Item 12: Exhibits.
(a) Code of Ethics. (b) Certifications.
Pursuant to the requirements of the Securities Exchange Act of 1934 and the Investment Company Act of 1940, the registrant has duly caused this report to be signed on its behalf by the undersigned, thereunto duly authorized.
| |
| | VANGUARD MONEY MARKET RESERVES |
| |
| By: | /s/ F. WILLIAM MCNABB III* |
| | F. WILLIAM MCNABB III |
| | CHIEF EXECUTIVE OFFICER |
| |
| Date: October 17, 2012 |
Pursuant to the requirements of the Securities Exchange Act of 1934 and the Investment Company Act of 1940, this report has been signed below by the following persons on behalf of the registrant and in the capacities and on the dates indicated.
| |
| | VANGUARD MONEY MARKET RESERVES |
| |
| By: | /s/ F. WILLIAM MCNABB III* |
| | F. WILLIAM MCNABB III |
| | CHIEF EXECUTIVE OFFICER |
| |
| Date: October 17, 2012 |
| |
| | VANGUARD MONEY MARKET RESERVES |
| |
| By: | /s/ THOMAS J. HIGGINS* |
| | THOMAS J. HIGGINS |
| | CHIEF FINANCIAL OFFICER |
| |
| Date: October 17, 2012 |
* By: /s/ Heidi Stam
Heidi Stam, pursuant to a Power of Attorney filed on March 27, 2012 see file Number 2-11444, Incorporated by Reference.