UNITED STATES
SECURITIES AND EXCHANGE COMMISSION
Washington, D.C. 20549
FORM N-CSR
CERTIFIED SHAREHOLDER REPORT
OF
REGISTERED MANAGEMENT INVESTMENT COMPANIES
Investment Company Act file number: 811-02554
Name of Registrant: Vanguard Money Market Reserves
Address of Registrant: P.O. Box 2600
Valley Forge, PA 19482
Name and address of agent for service: Anne E. Robinson, Esquire
P.O. Box 876
Valley Forge, PA 19482
Registrant’s telephone number, including area code: (610) 669-1000
Date of fiscal year end: August 31
Date of reporting period: September 1, 2016 – August 31, 2017
Item 1: Reports to Shareholders

Annual Report | August 31, 2018
Vanguard Money Market Funds
Vanguard Prime Money Market Fund
Vanguard Federal Money Market Fund
Vanguard Treasury Money Market Fund
Vanguard’s Principles for Investing Success
We want to give you the best chance of investment success. These principles, grounded in Vanguard’s research and experience, can put you on the right path.
Goals. Create clear, appropriate investment goals.
Balance. Develop a suitable asset allocation using broadly diversified funds. Cost. Minimize cost.
Discipline. Maintain perspective and long-term discipline.
A single theme unites these principles: Focus on the things you can control.
We believe there is no wiser course for any investor.
| |
| Contents | |
| Your Fund’s Performance at a Glance. | 1 |
| CEO’s Perspective. | 3 |
| Advisor’s Report. | 5 |
| Prime Money Market Fund. | 7 |
| Federal Money Market Fund. | 26 |
| Treasury Money Market Fund. | 42 |
| About Your Fund’s Expenses. | 55 |
| Trustees Approve Advisory Arrangements. | 57 |
| Glossary. | 59 |
Please note: The opinions expressed in this report are just that—informed opinions. They should not be considered promises or advice. Also, please keep in mind that the information and opinions cover the period through the date on the front of this report. Of course, the risks of investing in your fund are spelled out in the prospectus.
See the Glossary for definitions of investment terms used in this report.
Your Fund’s Performance at a Glance
• For the 12 months ended August 31, 2018, Vanguard Prime Money Market Fund returned 1.59% for Investor Shares and 1.66% for Admiral Shares. Vanguard Federal Money Market Fund returned 1.42% and Vanguard Treasury Money Market Fund 1.43%. All three funds surpassed the average returns of their peers.
• The Federal Reserve raised the federal funds rate three times during the period, pushing its target range to 1.75%–2%. With the economy expanding, unemployment low, and inflation near the Fed’s target of 2%, additional rate hikes are expected.
• In addition to their low expense ratios, all three funds benefited from adding U.S.
Treasury bills, which cheapened on the prospect of rising rates. Exposure to floating-rate notes, which adjust more quickly than fixed-rate securities to changes in interest rates, also added value.
• In the Prime Money Market Fund, dollar-denominated issuance from Canadian, Australian, and Northern European banks was modestly positive.
| | |
| Total Returns: Fiscal Year Ended August 31, 2018 | | |
| | 7-Day SEC | Total |
| | Yield | Returns |
| Vanguard Prime Money Market Fund | | |
| Investor Shares | 2.08% | 1.59% |
| Admiral™ Shares | 2.14 | 1.66 |
| Money Market Funds Average | | 1.16 |
| Money Market Funds Average: Derived from data provided by Lipper, a Thomson Reuters Company. | | |
| |
| Vanguard Federal Money Market Fund | 1.93% | 1.42% |
| Government Money Market Funds Average | | 0.87 |
| Government Money Market Funds Average: Derived from data provided by Lipper, a Thomson Reuters Company. | |
| |
| Vanguard Treasury Money Market Fund | 1.95% | 1.43% |
| iMoneyNet Money Fund Report’s 100% Treasury Funds Average | | 0.92 |
| iMoneyNet Money Fund Report’s 100% Treasury Funds Average: Derived from data provided by iMoneyNet, Inc. | |
| The 7-day SEC yield of a money market fund more closely reflects the current earnings of the fund than its total return. | |
| Admiral Shares carry lower expenses and are available to investors who meet certain account-balance requirements. | |
1
| |
| Total Returns: Ten Years Ended August 31, 2018 | |
| | Average |
| | Annual Return |
| Prime Money Market Fund Investor Shares | 0.43% |
| Money Market Funds Average | 0.23 |
| Money Market Funds Average: Derived from data provided by Lipper, a Thomson Reuters Company. | |
| Federal Money Market Fund | 0.34% |
| Government Money Market Funds Average | 0.15 |
| Government Money Market Funds Average: Derived from data provided by Lipper, a Thomson Reuters Company. | |
| Treasury Money Market Fund | 0.29% |
| iMoneyNet Money Fund Report’s 100% Treasury Funds Average | 0.13 |
| iMoneyNet Money Fund Report’s 100% Treasury Funds Average: Derived from data provided by iMoneyNet, Inc. | |
Investment returns will fluctuate. All of the returns in this report represent past performance, which is not a guarantee of future results that may be achieved by the funds. (Current performance may be lower or higher than the performance data cited. For performance data current to the most recent month-end, visit our website at vanguard.com/performance.)
| | |
| Expense Ratios | | |
| Your Fund Compared With Its Peer Group | | |
| | | Peer Group |
| | Fund | Average |
| Prime Money Market Fund | | |
| Investor Shares | 0.16% | 0.50% |
| Admiral Shares | 0.10 | 0.50 |
| Federal Money Market Fund | 0.11 | 0.48 |
| Treasury Money Market Fund | 0.09 | 0.40 |
The fund expense ratios shown are from the prospectus dated December 22, 2017, and represent estimated costs for the current fiscal year. For the fiscal year ended August 31, 2018, the funds’ expense ratios were: for the Prime Money Market Fund, 0.16% for Investor Shares and 0.10% for Admiral Shares; for the Federal Money Market Fund, 0.11%; and for the Treasury Money Market Fund, 0.09%.
Peer groups: For the Prime Money Market Fund Investor Shares and Admiral Shares, Money Market Funds; for the Federal Money Market Fund, Government Money Market Funds; and for the Treasury Money Market Fund, iMoneyNet Money Fund Report’s 100% Treasury Funds.
2
CEO’s Perspective

Tim Buckley
President and Chief Executive Officer
Dear Shareholder,
Over the years, I’ve found that prudent investors exhibit a common trait: discipline. No matter how the markets move or what new investing fad hits the headlines, those who stay focused on their goals and tune out the noise are set up for long-term success.
The prime gateway to investing is saving, and you don’t usually become a saver without a healthy dose of discipline. Savers make the decision to sock away part of their income, which means spending less and delaying gratification, no matter how difficult that may be.
Of course, disciplined investing extends beyond diligent saving. The financial markets, in the short term especially, are unpredictable; I have yet to meet the investor who can time them perfectly. It takes discipline to resist the urge to go all-in when markets are frothy or to retreat when things look bleak.
Staying put with your investments is one strategy for handling volatility. Another, rebalancing, requires even more discipline because it means steering your money away from strong performers and toward poorer performers.
Patience—a form of discipline—is also the friend of long-term investors. Higher returns are the potential reward for weathering the market’s turbulence and uncertainty.
3
We have been enjoying one of the longest bull markets in history, but it won’t continue forever. Prepare yourself now for how you will react when volatility comes back. Don’t panic. Don’t chase returns or look for answers outside the asset classes you trust. And be sure to rebalance periodically, even when there’s turmoil.
Whether you’re a master of self-control, get a boost from technology, or work with a professional advisor, know that discipline
is necessary to get the most out of your investment portfolio. And know that Vanguard is with you for the entire ride.
Thank you for your continued loyalty.

Mortimer J. Buckley
President and Chief Executive Officer
September 13, 2018
| | | |
| Market Barometer | | | |
| | | Average Annual Total Returns |
| | | Periods Ended August 31, 2018 |
| | One Year | Three Years | Five Years |
| Stocks | | | |
| Russell 1000 Index (Large-caps) | 19.82% | 15.84% | 14.36% |
| Russell 2000 Index (Small-caps) | 25.45 | 16.11 | 13.00 |
| Russell 3000 Index (Broad U.S. market) | 20.25 | 15.86 | 14.25 |
| FTSE All-World ex US Index (International) | 3.51 | 8.31 | 5.82 |
| |
| Bonds | | | |
| Bloomberg Barclays U. S. Aggregate Bond Index | | | |
| (Broad taxable market) | -1.05% | 1.76% | 2.49% |
| Bloomberg Barclays Municipal Bond Index | | | |
| (Broad tax-exempt market) | 0.49 | 2.71 | 4.12 |
| FTSE Three-Month U. S. Treasury Bill Index | 1.49 | 0.74 | 0.44 |
| |
| CPI | | | |
| Consumer Price Index | 2.70% | 1.90% | 1.52% |
4
Advisor’s Report
For the 12 months ended August 31, 2018, Vanguard Prime Money Market Fund returned 1.59% for Investor Shares, while Admiral Shares, with their lower expense ratio, returned 1.66%. Vanguard Federal Money Market Fund returned 1.42% and Vanguard Treasury Money Market Fund 1.43%. Each fund outpaced the average return of its peer group.
Vanguard would like to thank David Glocke, who retired at the end of June, for his skillful stewardship of the Vanguard Money Market Funds over the last two decades. He was also instrumental in developing the depth and breadth of our money market fund management team, which includes John Lanius and Nafis Smith, the current managers of the funds covered in this report.
The investment environment
Macroeconomic fundamentals were robust throughout the 12 months. Despite two brief federal government shutdowns early in 2018 and ongoing trade uncertainties, business confidence held up and consumer spending remained solid. Unemployment hit an 18-year low, finishing the period at 3.9%. The tax cuts enacted in late 2017 and the March passage of a bill increasing federal spending added to optimism about growth. Inflation moved up to hover near the Federal Reserve’s 2% target with some help from an increase in the price of oil.
The Fed, acknowledging the economy’s health, moved further down the path toward monetary policy normalization. It continued
shrinking the $4.5 trillion balance sheet it had amassed as part of the monetary stimulus it began providing in the wake of the 2007–2009 financial crisis. The Fed raised the federal funds target rate in December, March, and June, to 1.75%–2%, and penciled in additional hikes this year and next. (It raised rates another quarter percentage point just after the close of the funds’ fiscal year.)
Demand for longer-term U.S. Treasury bonds was supported at times by escalating trade tensions, political uncertainty in Europe, and geopolitical flare-ups. But the outlook for continuing growth and rising inflation expectations led yields on these securities to end the period higher.
The rise in shorter-term bond yields, which are more influenced by Fed action, was more pronounced.
Management of the funds
As the supply of Treasury bills increased between February and April, we began buying them to increase our funds’ safety and liquidity, while reducing our purchases of short-dated bank products.
We extended the funds’ weighted average life as the spread between 3-month U.S. dollar London Interbank Offered Rate (LIBOR) and the 3-month Overnight Indexed Swap (OIS) widened between February and April. LIBOR is a short-term bank funding rate, and OIS represents market expectations for the path of short-term interest rates. The LIBOR–OIS
5
spread is considered a measure of the health of the banking system. We believe that this widening episode was not systemic, so we took the opportunity to extend the funds’ weighted average life.
We continued to buy floating-rate notes for the protection they provide in a rising-rate environment. Their yields reset periodically, often monthly, to reflect prevailing interest rates. When rates are rising, these securities help the funds’ yields adjust upward more quickly than if they were holding only fixed-rate instruments.
We manage the funds with an emphasis on safety and liquidity above all else, resulting in a bias toward high-quality assets. Our funds are nonetheless able to achieve competitive returns because of the persistent competitive advantage provided by their low operating costs compared with those of their peer groups.
The outlook
In the absence of any external shocks, the U.S. economy is on pace to break above its long-term potential growth rate in 2018 given the tax cuts and increased government spending coming on top of solid fundamentals. That, along with some upward pressure on wages given how tight the labor market has become, may put the U.S. core personal consumption expenditures price index a little above 2% at the end of 2018.
We see this bounce as cyclical, however, and still expect long-term structural pressures from an aging population, global sourcing of goods and labor, and technological disruptions to result in moderate long-run growth and inflation.
Some upward adjustments to the Fed’s assumptions—the economy growing a little faster, unemployment falling a little lower, and inflation running a little higher—should justify further rate hikes this year and next.
We may continue to see bouts of volatility related to inflation and interest rate expectations. Other potential triggers include the midterm elections, an intensification of trade disputes, flare-ups in geopolitical tensions, Brexit uncertainty, and missteps by central banks.
As always, whatever the markets may bring, our experienced team of portfolio managers, credit analysts, and traders will continue to seek out opportunities to produce competitive returns.
John C. Lanius, Portfolio Manager
Nafis T. Smith, Portfolio Manager
Vanguard Fixed Income Group
September 26, 2018
6
Prime Money Market Fund
Fund Profile
As of August 31, 2018
| | |
| Financial Attributes | | |
| | Investor | Admiral |
| | Shares | Shares |
| Ticker Symbol | VMMXX | VMRXX |
| Expense Ratio1 | 0.16% | 0.10% |
| 7-Day SEC Yield | 2.08% | 2.14% |
| Average Weighted | | |
| Maturity | 48 days | 48 days |
| |
| Sector Diversification (% of portfolio) | |
| Certificates of Deposit | | 6.8% |
| U.S. Commercial Paper | | 2.7 |
| Repurchase Agreements | | 0.3 |
| U.S. Government Obligations | 5.4 |
| U.S. Treasury Bills | | 29.0 |
| Yankee/Foreign | | 55.8 |
The agency and mortgage-backed securities sectors may include issues from government-sponsored
enterprises; such issues are generally not backed by the full faith and credit of the U.S.
government.
1 The expense ratios shown are from the prospectus dated December 22, 2017, and represent estimated costs for the current fiscal year. For the fiscal year ended August 31, 2018, the expense ratios were 0.16% for Investor Shares and 0.10% for Admiral Shares.
7
Prime Money Market Fund
Performance Summary
Investment returns will fluctuate. All of the returns in this report represent past performance, which is not a guarantee of future results that may be achieved by the fund. (Current performance may be lower or higher than the performance data cited. For performance data current to the most recent month-end, visit our website at vanguard.com/performance.) The returns shown do not reflect taxes that a shareholder would pay on fund distributions. The fund is only available to retail investors (natural persons). You could lose money by investing in the fund. Although the fund seeks to preserve the value of your investment at $1 per share, it cannot guarantee it will do so. The fund may impose a fee upon the sale of your shares or may temporarily suspend your ability to sell shares if the fund’s liquidity falls below required minimums because of market conditions or other factors. An investment in the fund is not insured or guaranteed by the Federal Deposit Insurance Corporation or any other government agency. The fund’s sponsor has no legal obligation to provide financial support to the fund, and you should not expect that the sponsor will provide financial support to the fund at any time. The fund’s 7-day SEC yield reflects its current earnings more closely than do the average annual returns.
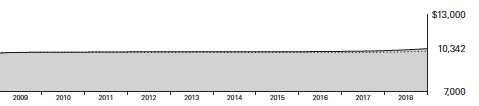
Cumulative Performance: August 31, 2008, Through August 31, 2018
Initial Investment of $10,000

| | | | |
| | Average Annual Total Returns | |
| | Periods Ended August 31, 2018 | |
| |
| | | | | Final Value |
| | One | Five | Ten | of a $10,000 |
| | Year | Years | Years | Investment |
| |
| Prime Money Market Fund Investor | | | | |
| Shares | 1.59% | 0.55% | 0.43% | $10,436 |
| |
| Money Market Funds Average | 1.16 | 0.32 | 0.23 | 10,228 |
| FTSE Three-Month U.S. Treasury Bill | | | | |
| Index | 1.49 | 0.44 | 0.31 | 10,334 |
| Money Market Funds Average: Derived from data provided by Lipper, a Thomson Reuters Company. | | |
See Financial Highlights for dividend information.
8
| | | | |
| Prime Money Market Fund | | | | |
| |
| |
| |
| |
| | Average Annual Total Returns | |
| | Periods Ended August 31, 2018 | |
| | | | | Final Value |
| | One | Five | Ten | of a $5,000,000 |
| | Year | Years | Years | Investment |
| Prime Money Market Fund Admiral Shares | 1.66% | 0.61% | 0.51% | $5,260,056 |
| Money Market Funds Average | 1.16 | 0.32 | 0.23 | 5,114,234 |
| FTSE Three-Month U.S. Treasury Bill Index | 1.49 | 0.44 | 0.31 | 5,167,018 |
Fiscal-Year Total Returns (%): August 31, 2008, Through August 31, 2018
| | |
| | | Money |
| | | Market |
| | | Funds |
| | Investor Shares | Average |
| Fiscal Year | Total Returns | Total Returns |
| 2009 | 1.31% | 0.62% |
| 2010 | 0.08 | 0.02 |
| 2011 | 0.06 | 0.00 |
| 2012 | 0.04 | 0.00 |
| 2013 | 0.02 | 0.00 |
| 2014 | 0.02 | 0.00 |
| 2015 | 0.02 | 0.00 |
| 2016 | 0.32 | 0.04 |
| 2017 | 0.83 | 0.43 |
| 2018 | 1.59 | 1.16 |
7-day SEC yield (8/31/2018): 2.08%
Money Market Funds Average: Derived from data provided by Lipper, a Thomson Reuters Company.
Average Annual Total Returns: Periods Ended June 30, 2018
This table presents returns through the latest calendar quarter—rather than through the end of the fiscal period.
Securities and Exchange Commission rules require that we provide this information.
| | | | |
| | Inception | One | Five | Ten |
| | Date | Year | Years | Years |
| Investor Shares | 6/4/1975 | 1.43% | 0.48% | 0.43% |
| Admiral Shares | 10/3/1989 | 1.49 | 0.54 | 0.51 |
9
Prime Money Market Fund
Financial Statements
Statement of Net Assets
As of August 31, 2018
The fund reports a complete list of its holdings in various monthly and quarterly regulatory filings. The fund publishes its holdings on a monthly basis at vanguard.com and files them with the Securities and Exchange Commission on Form N-MFP. The fund’s Form N-MFP filings may be viewed at sec.gov or via a link on the “Portfolio Holdings” page on vanguard.com. For the second and fourth fiscal quarters, the lists appear in the fund’s semiannual and annual reports to shareholders. For the first and third fiscal quarters, the fund files the lists with the SEC on Form N-Q. Shareholders can look up the fund’s Forms N-Q on the SEC’s website at sec.gov. Forms N-Q may also be reviewed and copied at the SEC’s Public Reference Room (see the back cover of this report for further information).
| | | | | | |
| | | | | | Face | Market |
| | | | | Maturity | Amount | Value • |
| | | | Yield1 | Date | ($000) | ($000) |
| U.S. Government and Agency Obligations (34.3%) | | | |
| 2 | Fannie Mae Discount Notes | | 1.931% | 9/5/18 | 79,250 | 79,233 |
| 3 | Federal Home Loan Bank Discount | | | | | |
| | Notes | 1.911%–1.941% | 9/5/18 | 859,300 | 859,117 |
| 3 | Federal Home Loan Bank Discount | | | | | |
| | Notes | 1.924%–1.941% | 9/7/18 | 499,950 | 499,790 |
| 3 | Federal Home Loan Bank Discount | | | | | |
| | Notes | | 1.941% | 9/11/18 | 125,611 | 125,543 |
| 3 | Federal Home Loan Bank Discount | | | | | |
| | Notes | 1.911%–1.931% | 9/12/18 | 1,682,509 | 1,681,521 |
| 3 | Federal Home Loan Bank Discount | | | | | |
| | Notes | | 1.932% | 9/13/18 | 183,500 | 183,382 |
| 3 | Federal Home Loan Bank Discount | | | | | |
| | Notes | | 2.057% | 10/26/18 | 922,050 | 919,162 |
| | United States Treasury Bill | 1.901%–1.908% | 9/6/18 | 1,131,244 | 1,130,945 |
| | United States Treasury Bill | | 1.901% | 9/13/18 | 250,000 | 249,842 |
| | United States Treasury Bill | | 1.955% | 10/11/18 | 3,000,000 | 2,993,517 |
| | United States Treasury Bill | | 1.990% | 10/18/18 | 3,000,000 | 2,992,245 |
| | United States Treasury Bill | 1.980%–2.005% | 10/25/18 | 4,500,000 | 4,486,657 |
| | United States Treasury Bill | | 2.010% | 11/1/18 | 4,000,000 | 3,986,478 |
| | United States Treasury Bill | | 2.020% | 11/8/18 | 3,250,000 | 3,237,680 |
| | United States Treasury Bill | 2.041%–2.048% | 11/15/18 | 3,000,000 | 2,987,298 |
| | United States Treasury Bill | 2.046%–2.102% | 11/23/18 | 4,500,000 | 4,478,521 |
| | United States Treasury Bill | | 2.091% | 11/29/18 | 2,000,000 | 1,989,716 |
| | United States Treasury Bill | | 2.184% | 1/31/19 | 500,000 | 495,440 |
| | United States Treasury Bill | | 2.204% | 2/7/19 | 1,500,000 | 1,485,557 |
| | United States Treasury Bill | | 2.204% | 2/14/19 | 1,000,000 | 989,948 |
| 4 | United States Treasury Floating Rate Note | 2.261% | 10/31/18 | 1,500,000 | 1,500,002 |
| Total U.S. Government and Agency Obligations (Cost $37,351,594) | | 37,351,594 |
| Commercial Paper (39.1%) | | | | | |
| Bank Holding Company (1.4%) | | | | | |
| 5 | ABN Amro Funding USA LLC | | 2.410% | 9/4/18 | 28,750 | 28,744 |
| 5 | ABN Amro Funding USA LLC | | 2.369% | 10/11/18 | 176,750 | 176,288 |
| 5 | ABN Amro Funding USA LLC | 2.368%–2.369% | 10/12/18 | 90,250 | 90,008 |
10
| | | | | |
| Prime Money Market Fund | | | | |
| |
| |
| |
| | | | | Face | Market |
| | | | Maturity | Amount | Value • |
| | | Yield1 | Date | ($000) | ($000) |
| 5 | ABN Amro Funding USA LLC | 2.368% | 10/17/18 | 100,000 | 99,700 |
| 5 | ABN Amro Funding USA LLC | 2.369% | 11/2/18 | 102,000 | 101,587 |
| 5 | ABN Amro Funding USA LLC | 2.369% | 11/6/18 | 148,500 | 147,860 |
| 5 | ABN Amro Funding USA LLC | 2.369% | 11/16/18 | 47,500 | 47,264 |
| 5 | ABN Amro Funding USA LLC | 2.263% | 11/19/18 | 25,000 | 24,877 |
| 5 | ABN Amro Funding USA LLC | 2.348% | 11/20/18 | 32,500 | 32,332 |
| 5 | ABN Amro Funding USA LLC | 2.369% | 11/21/18 | 32,500 | 32,328 |
| 5 | ABN Amro Funding USA LLC | 2.369% | 11/27/18 | 9,000 | 8,949 |
| 5 | ABN Amro Funding USA LLC | 2.369% | 12/3/18 | 92,110 | 91,551 |
| | Bank of New York Mellon | 2.419% | 9/25/18 | 49,500 | 49,421 |
| | Bank of Tokyo-Mitsubishi UFJ Ltd. | | | | |
| | (New York Branch) | 2.338% | 10/19/18 | 494,000 | 492,472 |
| | Bank of Tokyo-Mitsubishi UFJ Ltd. | | | | |
| | (New York Branch) | 2.318% | 12/6/18 | 56,000 | 55,657 |
| | | | | | 1,479,038 |
| Finance—Auto (1.3%) | | | | |
| | American Honda Finance Corp. | 2.233% | 9/18/18 | 174,325 | 174,142 |
| | American Honda Finance Corp. | 2.233% | 9/19/18 | 193,750 | 193,535 |
| | American Honda Finance Corp. | 2.222% | 11/5/18 | 30,500 | 30,378 |
| | American Honda Finance Corp. | 2.233% | 11/19/18 | 79,250 | 78,864 |
| | Toyota Motor Credit Corp. | 2.348% | 10/22/18 | 247,500 | 246,683 |
| | Toyota Motor Credit Corp. | 2.348% | 10/24/18 | 247,500 | 246,651 |
| | Toyota Motor Credit Corp. | 2.338% | 11/7/18 | 79,000 | 78,659 |
| | Toyota Motor Credit Corp. | 2.349% | 11/13/18 | 29,750 | 29,609 |
| | Toyota Motor Credit Corp. | 2.349% | 11/14/18 | 56,000 | 55,732 |
| | Toyota Motor Credit Corp. | 2.369% | 12/5/18 | 63,750 | 63,355 |
| | Toyota Motor Credit Corp. | 2.369% | 12/6/18 | 63,750 | 63,350 |
| | Toyota Motor Credit Corp. | 2.307% | 12/14/18 | 150,000 | 149,008 |
| | | | | | 1,409,966 |
| Foreign Banks (27.6%) | | | | |
| 5,6 | Australia & New Zealand Banking Group Ltd. | 2.249% | 9/6/18 | 220,000 | 220,000 |
| 5,6 | Australia & New Zealand Banking Group Ltd. | 2.349% | 9/7/18 | 249,000 | 249,000 |
| 5,6 | Australia & New Zealand Banking Group Ltd. | 2.333% | 9/10/18 | 255,000 | 255,000 |
| 5,6 | Australia & New Zealand Banking Group Ltd. | 2.230% | 9/24/18 | 135,500 | 135,500 |
| 5,6 | Australia & New Zealand Banking Group Ltd. | 2.465% | 9/27/18 | 165,000 | 164,999 |
| 5,6 | Australia & New Zealand Banking Group Ltd. | 2.273% | 11/29/18 | 524,500 | 524,500 |
| 5 | Australia & New Zealand Banking Group Ltd. | 2.399% | 12/5/18 | 122,750 | 121,982 |
| 5,6 | Australia & New Zealand Banking Group Ltd. | 2.289% | 12/6/18 | 150,000 | 149,990 |
| 5,6 | Australia & New Zealand Banking Group Ltd. | 2.273% | 12/10/18 | 120,000 | 120,000 |
| 5,6 | Australia & New Zealand Banking Group Ltd. | 2.317% | 12/14/18 | 65,000 | 65,000 |
| 5 | Australia & New Zealand Banking Group Ltd. | 2.430% | 12/14/18 | 178,500 | 177,262 |
| 5 | Australia & New Zealand Banking Group Ltd. | 2.420% | 2/25/19 | 500,000 | 494,125 |
| 5,6 | Australia & New Zealand Banking Group Ltd. | 2.329% | 3/7/19 | 65,000 | 65,000 |
| 5,6 | Bank of Nova Scotia | 2.507% | 9/19/18 | 34,000 | 34,000 |
| 5,6 | Bank of Nova Scotia | 2.299% | 9/21/18 | 655,000 | 655,000 |
| 5 | Bank of Nova Scotia | 2.430% | 11/26/18 | 150,000 | 149,140 |
| 5,6 | Bank of Nova Scotia | 2.320% | 1/4/19 | 148,750 | 148,750 |
| 5,6 | Bank of Nova Scotia | 2.313% | 1/15/19 | 500,000 | 500,000 |
| 5,6 | Bank of Nova Scotia | 2.327% | 1/18/19 | 506,000 | 506,000 |
| 5,6 | Bank of Nova Scotia | 2.197% | 2/13/19 | 120,000 | 120,000 |
| 5,6 | Canadian Imperial Bank of Commerce | 2.337% | 1/11/19 | 434,000 | 434,000 |
| 5,6 | Commonwealth Bank of Australia | 2.256% | 9/24/18 | 136,000 | 136,000 |
| 5,6 | Commonwealth Bank of Australia | 2.255% | 9/28/18 | 180,000 | 180,000 |
| 5,6 | Commonwealth Bank of Australia | 2.329% | 2/7/19 | 222,750 | 222,750 |
11
| | | | | |
| Prime Money Market Fund | | | | |
| |
| |
| |
| | | | | Face | Market |
| | | | Maturity | Amount | Value • |
| | | Yield1 | Date | ($000) | ($000) |
| 5,6 | Commonwealth Bank of Australia | 2.333% | 2/8/19 | 247,500 | 247,500 |
| 5,6 | Commonwealth Bank of Australia | 2.395% | 2/25/19 | 584,000 | 584,000 |
| | Credit Suisse AG | 2.354% | 9/14/18 | 940,000 | 939,206 |
| 5 | Danske Corp. | 2.253% | 10/26/18 | 45,500 | 45,344 |
| 5 | Danske Corp. | 2.253% | 10/29/18 | 324,750 | 323,578 |
| 5 | Danske Corp. | 2.259% | 10/31/18 | 269,500 | 268,492 |
| 5 | Danske Corp. | 2.254% | 11/1/18 | 106,000 | 105,598 |
| 5 | Danske Corp. | 2.254% | 11/2/18 | 130,750 | 130,246 |
| 5 | DNB Bank ASA | 2.343% | 10/1/18 | 500,000 | 499,033 |
| 5 | DNB Bank ASA | 2.419% | 11/6/18 | 275,000 | 273,795 |
| 5 | DNB Bank ASA | 2.336% | 11/26/18 | 250,000 | 248,616 |
| 5,6 | HSBC Bank plc | 2.266% | 10/24/18 | 123,000 | 123,000 |
| 5,6 | HSBC Bank plc | 2.265% | 10/25/18 | 61,250 | 61,250 |
| 5,6 | HSBC Bank plc | 2.280% | 11/5/18 | 86,000 | 86,000 |
| 5,6 | HSBC Bank plc | 2.285% | 11/26/18 | 142,600 | 142,600 |
| 5,6 | HSBC Bank plc | 2.325% | 1/25/19 | 341,000 | 341,000 |
| 5,6 | HSBC Bank plc | 2.342% | 2/1/19 | 239,000 | 239,000 |
| 5,6 | HSBC Bank plc | 2.337% | 2/12/19 | 43,000 | 43,000 |
| 5,6 | HSBC Bank plc | 2.415% | 2/26/19 | 187,000 | 187,000 |
| 5,6 | HSBC Bank plc | 2.527% | 4/18/19 | 550,000 | 550,000 |
| | ING US Funding LLC | 2.308% | 10/4/18 | 118,500 | 118,251 |
| | ING US Funding LLC | 2.370% | 11/1/18 | 346,500 | 345,120 |
| | ING US Funding LLC | 2.371% | 11/2/18 | 346,500 | 345,098 |
| | ING US Funding LLC | 2.328%–2.331% | 12/21/18 | 500,000 | 496,437 |
| | ING US Funding LLC | 2.328% | 12/24/18 | 99,035 | 98,311 |
| | ING US Funding LLC | 2.329% | 12/27/18 | 68,095 | 67,584 |
| | Lloyds Bank plc | 2.368% | 11/21/18 | 179,000 | 178,058 |
| | Lloyds Bank plc | 2.409% | 12/4/18 | 148,500 | 147,577 |
| 6 | Lloyds Bank plc | 2.329% | 12/7/18 | 500,000 | 500,000 |
| | Lloyds Bank plc | 2.430% | 12/21/18 | 584,000 | 579,678 |
| | Lloyds Bank plc | 2.440% | 12/24/18 | 147,500 | 146,374 |
| | Lloyds Bank plc | 2.451% | 1/7/19 | 49,500 | 49,074 |
| 6 | Lloyds Bank plc | 2.213% | 2/15/19 | 50,000 | 50,000 |
| 6 | Lloyds Bank plc | 2.219% | 2/21/19 | 133,500 | 133,500 |
| 6 | Lloyds Bank plc | 2.206% | 2/22/19 | 99,000 | 99,000 |
| 5,6 | National Australia Bank Ltd. | 2.277% | 9/19/18 | 760,000 | 760,000 |
| 5,6 | National Australia Bank Ltd. | 2.355% | 11/30/18 | 778,000 | 778,000 |
| 5,6 | National Australia Bank Ltd. | 2.262% | 5/3/19 | 483,000 | 483,000 |
| 5,6 | National Australia Bank Ltd. | 2.234% | 5/16/19 | 65,000 | 65,000 |
| 5,6 | National Australia Bank Ltd. | 2.230% | 5/17/19 | 335,000 | 335,000 |
| 5 | Nederlandse Waterschapsbank NV | 1.951% | 9/4/18 | 861,250 | 861,110 |
| 5 | Nederlandse Waterschapsbank NV | 1.951% | 9/5/18 | 292,000 | 291,937 |
| 5 | Nederlandse Waterschapsbank NV | 1.951% | 9/6/18 | 317,500 | 317,414 |
| 5 | Nederlandse Waterschapsbank NV | 1.951% | 9/7/18 | 528,500 | 528,328 |
| 5 | Nordea Bank AB | 2.245% | 9/5/18 | 500,000 | 499,877 |
| 5 | Nordea Bank AB | 2.287% | 12/4/18 | 600,000 | 596,444 |
| 5 | NRW Bank | 1.916% | 9/4/18 | 600,000 | 599,904 |
| 5 | NRW Bank | 1.936% | 9/5/18 | 396,750 | 396,665 |
| 5 | NRW Bank | 1.941% | 9/6/18 | 400,300 | 400,192 |
| | Santander UK plc | 2.256% | 9/18/18 | 29,750 | 29,719 |
| | Santander UK plc | 2.257% | 9/20/18 | 59,750 | 59,679 |
| | Santander UK plc | 2.328% | 10/5/18 | 600,000 | 598,691 |
| | Santander UK plc | 2.338% | 10/16/18 | 450,000 | 448,695 |
| | Santander UK plc | 2.353% | 11/6/18 | 250,000 | 248,930 |
12
| | | | | |
| Prime Money Market Fund | | | | |
| |
| |
| |
| | | | | Face | Market |
| | | | Maturity | Amount | Value • |
| | | Yield1 | Date | ($000) | ($000) |
| | Santander UK plc | 2.329% | 12/5/18 | 202,000 | 200,769 |
| 5 | Sumitomo Mitsui Banking Corp. | 2.349% | 10/12/18 | 50,000 | 49,867 |
| 5 | Sumitomo Mitsui Banking Corp. | 2.358% | 11/16/18 | 338,000 | 336,330 |
| 5 | Svenska Handelsbanken AB | 2.435% | 1/4/19 | 150,000 | 148,747 |
| 5 | Svenska Handelsbanken AB | 2.474% | 3/15/19 | 82,887 | 81,792 |
| | Swedbank AB | 2.245%–2.296% | 9/4/18 | 709,000 | 708,867 |
| | Swedbank AB | 2.399% | 11/1/18 | 124,000 | 123,502 |
| | Swedbank AB | 2.399% | 11/2/18 | 87,000 | 86,645 |
| | Swedbank AB | 2.339% | 11/20/18 | 77,000 | 76,603 |
| | Swedbank AB | 2.339% | 11/23/18 | 146,000 | 145,219 |
| | Swedbank AB | 2.340% | 11/26/18 | 146,000 | 145,191 |
| | Swedbank AB | 2.340% | 11/27/18 | 36,000 | 35,798 |
| | Swedbank AB | 2.339% | 12/3/18 | 25,975 | 25,819 |
| | Swedbank AB | 2.287% | 12/4/18 | 41,000 | 40,757 |
| | Swedbank AB | 2.450% | 12/24/18 | 88,000 | 87,326 |
| | Swedbank AB | 2.419% | 2/11/19 | 150,000 | 148,377 |
| 5,6 | Toronto-Dominion Bank | 2.257% | 9/14/18 | 260,000 | 260,000 |
| 5 | Toronto-Dominion Bank | 2.296% | 9/19/18 | 347,000 | 346,604 |
| 5,6 | Toronto-Dominion Bank | 2.267% | 11/14/18 | 792,000 | 792,000 |
| 5,6 | Toronto-Dominion Bank | 2.310% | 12/5/18 | 208,000 | 208,000 |
| 5,6 | Toronto-Dominion Bank | 2.353% | 2/8/19 | 200,000 | 200,000 |
| 5,6 | Toronto-Dominion Bank | 2.251% | 5/9/19 | 440,000 | 440,000 |
| 5,6 | Toronto-Dominion Bank | 2.281% | 8/9/19 | 450,000 | 450,000 |
| 5,6 | Westpac Banking Corp. | 2.267% | 9/20/18 | 250,000 | 249,999 |
| 5,6 | Westpac Banking Corp. | 2.255% | 9/27/18 | 199,000 | 198,999 |
| 5,6 | Westpac Banking Corp. | 2.255% | 9/28/18 | 200,000 | 200,000 |
| 5,6 | Westpac Banking Corp. | 2.283% | 12/10/18 | 340,000 | 339,995 |
| 5,6 | Westpac Banking Corp. | 2.296% | 1/24/19 | 83,000 | 82,994 |
| 5,6 | Westpac Banking Corp. | 2.367% | 6/12/19 | 366,500 | 366,500 |
| 5,6 | Westpac Banking Corp. | 2.367% | 6/13/19 | 153,000 | 153,000 |
| 5,6 | Westpac Banking Corp. | 2.285% | 7/26/19 | 385,000 | 385,000 |
| 5,6 | Westpac Banking Corp. | 2.267% | 8/8/19 | 100,000 | 100,000 |
| | | | | | 30,133,603 |
| Foreign Governments (4.9%) | | | | |
| 5 | Alberta (Province Of) | 2.278% | 9/4/18 | 50,000 | 49,991 |
| 5 | Alberta (Province Of) | 2.252% | 10/1/18 | 30,900 | 30,842 |
| 5 | Alberta (Province Of) | 2.430% | 11/8/18 | 98,975 | 98,526 |
| 5 | Alberta (Province Of) | 2.396%–2.398% | 11/13/18 | 146,500 | 145,796 |
| 5 | Alberta (Province Of) | 2.371% | 11/21/18 | 99,000 | 98,477 |
| 5 | Alberta (Province Of) | 2.428% | 12/20/18 | 297,000 | 294,822 |
| 5 | Alberta (Province Of) | 2.430%–2.440% | 1/7/19 | 158,500 | 157,143 |
| 5 | Alberta (Province Of) | 2.439% | 1/10/19 | 64,500 | 63,934 |
| 5 | Alberta (Province Of) | 2.419%–2.429% | 1/22/19 | 84,250 | 83,448 |
| 5 | Alberta (Province Of) | 2.420% | 1/30/19 | 59,500 | 58,903 |
| | BNG Bank NV | 1.951% | 9/5/18 | 556,750 | 556,629 |
| | BNG Bank NV | 1.951% | 9/6/18 | 365,750 | 365,651 |
| 5 | CDP Financial Inc. | 2.457%–2.489% | 9/14/18 | 83,550 | 83,476 |
| 5 | CDP Financial Inc. | 2.511% | 10/1/18 | 162,150 | 161,815 |
| 5 | CDP Financial Inc. | 2.501%–2.522% | 10/2/18 | 32,700 | 32,630 |
| 5 | CDP Financial Inc. | 2.223% | 10/26/18 | 22,500 | 22,424 |
| 5 | CDP Financial Inc. | 2.420% | 10/31/18 | 36,500 | 36,355 |
| 5 | CDP Financial Inc. | 2.409% | 12/17/18 | 162,950 | 161,797 |
| 5 | CDP Financial Inc. | 2.428% | 12/18/18 | 102,300 | 101,563 |
| 5 | CDP Financial Inc. | 2.427% | 12/19/18 | 44,500 | 44,177 |
13
| | | | | |
| Prime Money Market Fund | | | | |
| |
| |
| |
| | | | | Face | Market |
| | | | Maturity | Amount | Value • |
| | | Yield1 | Date | ($000) | ($000) |
| 5 | CDP Financial Inc. | 2.399% | 2/1/19 | 49,750 | 49,249 |
| 7 | CPPIB Capital Inc. | 2.319% | 1/3/19 | 100,000 | 99,208 |
| | Export Development Canada | 2.337% | 10/22/18 | 43,500 | 43,358 |
| | Export Development Canada | 2.419% | 11/2/18 | 148,500 | 147,889 |
| | Export Development Canada | 2.400% | 1/3/19 | 66,250 | 65,707 |
| | Export Development Canada | 2.390% | 1/4/19 | 132,500 | 131,410 |
| | Export Development Canada | 2.401% | 1/8/19 | 66,250 | 65,685 |
| | Export Development Canada | 2.425% | 2/1/19 | 99,000 | 97,990 |
| | Export Development Canada | 2.420% | 3/1/19 | 94,000 | 92,870 |
| | Export Development Canada | 2.421% | 3/4/19 | 198,000 | 195,581 |
| | Export Development Canada | 2.410% | 3/5/19 | 133,750 | 132,114 |
| | Export Development Canada | 2.410% | 3/6/19 | 99,000 | 97,783 |
| 7 | Ontario Teachers’ Finance Trust | 2.340% | 9/6/18 | 26,000 | 25,992 |
| 7 | Ontario Teachers’ Finance Trust | 2.258% | 9/18/18 | 31,250 | 31,217 |
| 7 | Ontario Teachers’ Finance Trust | 2.515% | 10/9/18 | 20,000 | 19,948 |
| 7 | Ontario Teachers’ Finance Trust | 2.353% | 10/19/18 | 17,500 | 17,446 |
| 7 | Ontario Teachers’ Finance Trust | 2.496% | 10/29/18 | 82,861 | 82,533 |
| 7 | Ontario Teachers’ Finance Trust | 2.309% | 11/16/18 | 61,169 | 60,876 |
| 7 | Ontario Teachers’ Finance Trust | 2.475% | 11/26/18 | 49,500 | 49,211 |
| 7 | Ontario Teachers’ Finance Trust | 2.474% | 11/27/18 | 94,800 | 94,241 |
| 7 | Ontario Teachers’ Finance Trust | 2.422% | 11/30/18 | 100,000 | 99,402 |
| 7 | Ontario Teachers’ Finance Trust | 2.410%–2.431% | 12/4/18 | 74,000 | 73,539 |
| 7 | Ontario Teachers’ Finance Trust | 2.431% | 12/18/18 | 25,000 | 24,820 |
| 7 | Ontario Teachers’ Finance Trust | 2.496% | 1/17/19 | 25,000 | 24,764 |
| 7 | Ontario Teachers’ Finance Trust | 2.406%–2.487% | 2/8/19 | 199,150 | 196,996 |
| 7 | Ontario Teachers’ Finance Trust | 2.484% | 3/1/19 | 147,100 | 145,288 |
| 7 | Ontario Teachers’ Finance Trust | 2.452% | 3/8/19 | 49,500 | 48,874 |
| 7 | Ontario Teachers’ Finance Trust | 2.539% | 3/13/19 | 69,250 | 68,322 |
| 7 | Ontario Teachers’ Finance Trust | 2.562% | 3/29/19 | 34,750 | 34,242 |
| 6,7 | PSP Capital Inc. | 2.245% | 10/26/18 | 122,500 | 122,500 |
| 7 | PSP Capital Inc. | 2.379% | 1/7/19 | 148,500 | 147,259 |
| 7 | PSP Capital Inc. | 2.420% | 2/27/19 | 99,000 | 97,823 |
| | | | | | 5,332,536 |
| Foreign Industrial (2.5%) | | | | |
| 5 | Nestle Capital Corp. | 2.245% | 9/5/18 | 178,250 | 178,206 |
| 5 | Nestle Capital Corp. | 2.247% | 10/4/18 | 150,000 | 149,693 |
| 5 | Nestle Capital Corp. | 2.308% | 10/9/18 | 147,250 | 146,894 |
| 5 | Nestle Capital Corp. | 2.338% | 11/13/18 | 207,500 | 206,524 |
| 5 | Nestle Capital Corp. | 2.339% | 11/19/18 | 197,750 | 196,743 |
| 5 | Nestle Capital Corp. | 2.358% | 12/3/18 | 200,000 | 198,796 |
| 5 | Nestle Capital Corp. | 2.378% | 12/10/18 | 99,000 | 98,354 |
| 5 | Nestle Capital Corp. | 2.257%–2.389% | 12/11/18 | 285,750 | 283,915 |
| 5 | Nestle Capital Corp. | 2.410% | 1/8/19 | 198,000 | 196,311 |
| 5 | Nestle Capital Corp. | 2.409% | 1/9/19 | 99,000 | 98,149 |
| 5 | Nestle Capital Corp. | 2.410% | 2/11/19 | 396,000 | 391,733 |
| | Nestle Finance International Ltd. | 2.287% | 12/19/18 | 113,635 | 112,854 |
| | Nestle Finance International Ltd. | 2.429% | 2/15/19 | 99,000 | 97,898 |
| | Nestle Finance International Ltd. | 2.430% | 2/20/19 | 297,750 | 294,336 |
| 5 | Total Capital Canada Ltd. | 2.222% | 10/24/18 | 65,250 | 65,038 |
| | Toyota Credit Canada Inc. | 2.389% | 11/26/18 | 32,750 | 32,565 |
| | Toyota Credit Canada Inc. | 2.389% | 11/27/18 | 32,750 | 32,562 |
| | | | | | 2,780,571 |
14
| | | | |
| Prime Money Market Fund | | | | |
| |
| |
| |
| | | | Face | Market |
| | | Maturity | Amount | Value • |
| | Yield1 | Date | ($000) | ($000) |
| Industrial (1.4%) | | | | |
| 5 Apple Inc. | 2.280% | 12/11/18 | 168,500 | 167,432 |
| 5 Apple Inc. | 2.367% | 1/2/19 | 237,500 | 235,601 |
| 5 Apple Inc. | 2.345%–2.355% | 1/8/19 | 237,500 | 235,521 |
| 5 Apple Inc. | 2.346% | 1/23/19 | 64,250 | 63,654 |
| 5 Apple Inc. | 2.357% | 1/28/19 | 118,000 | 116,862 |
| 5 Henkel of America Inc. | 2.266% | 9/24/18 | 99,000 | 98,858 |
| 5 Henkel of America Inc. | 2.266% | 9/25/18 | 35,750 | 35,696 |
| 5 Henkel of America Inc. | 2.233%–2.252% | 10/22/18 | 62,950 | 62,751 |
| 5 Henkel of America Inc. | 2.253% | 10/24/18 | 33,150 | 33,041 |
| 5 Henkel of America Inc. | 2.223% | 11/6/18 | 39,950 | 39,788 |
| 5 The Coca-Cola Co. | 2.267% | 9/18/18 | 14,750 | 14,734 |
| 5 The Coca-Cola Co. | 2.267% | 9/19/18 | 14,750 | 14,733 |
| 5 The Coca-Cola Co. | 2.245% | 10/4/18 | 200,000 | 199,591 |
| 5 The Coca-Cola Co. | 2.267% | 12/5/18 | 32,000 | 31,810 |
| 5 The Coca-Cola Co. | 2.247% | 12/14/18 | 158,500 | 157,479 |
| | | | | 1,507,551 |
| Total Commercial Paper (Cost $42,643,265) | | | 42,643,265 |
| Certificates of Deposit (24.3%) | | | | |
| Domestic Banks (5.0%) | | | | |
| Citibank NA | 2.350% | 11/1/18 | 738,000 | 738,000 |
| 6 HSBC Bank USA NA | 2.271% | 10/2/18 | 153,000 | 153,000 |
| 6 HSBC Bank USA NA | 2.281% | 11/2/18 | 71,975 | 71,975 |
| 6 HSBC Bank USA NA | 2.286% | 11/23/18 | 82,250 | 82,250 |
| 6 HSBC Bank USA NA | 2.285% | 11/27/18 | 30,750 | 30,750 |
| 6 HSBC Bank USA NA | 2.320% | 12/4/18 | 148,250 | 148,250 |
| 6 HSBC Bank USA NA | 2.420% | 2/4/19 | 264,750 | 264,750 |
| 6 HSBC Bank USA NA | 2.239% | 3/21/19 | 50,000 | 50,000 |
| 6 HSBC Bank USA NA | 2.264% | 4/1/19 | 265,250 | 265,250 |
| 6 State Street Bank & Trust Co. | 2.265% | 9/28/18 | 297,000 | 297,000 |
| 6 State Street Bank & Trust Co. | 2.283% | 10/29/18 | 297,000 | 297,000 |
| 6 State Street Bank & Trust Co. | 2.286% | 11/26/18 | 596,000 | 596,000 |
| 6 Wells Fargo Bank NA | 2.433% | 9/17/18 | 233,000 | 233,000 |
| 6 Wells Fargo Bank NA | 2.513% | 9/28/18 | 470,000 | 470,000 |
| Wells Fargo Bank NA | 2.410% | 11/2/18 | 500,000 | 500,000 |
| Wells Fargo Bank NA | 2.400% | 12/3/18 | 249,000 | 249,000 |
| 6 Wells Fargo Bank NA | 2.232% | 2/4/19 | 500,000 | 500,000 |
| 6 Wells Fargo Bank NA | 2.230% | 2/5/19 | 525,000 | 525,000 |
| | | | | 5,471,225 |
| Yankee Certificates of Deposit (19.3%) | | | | |
| 6 Bank of Montreal (Chicago Branch) | 2.267% | 9/12/18 | 259,000 | 259,000 |
| 6 Bank of Montreal (Chicago Branch) | 2.309% | 9/21/18 | 399,000 | 399,000 |
| 6 Bank of Montreal (Chicago Branch) | 2.316% | 9/24/18 | 277,000 | 277,000 |
| 6 Bank of Montreal (Chicago Branch) | 2.443% | 10/15/18 | 139,000 | 139,000 |
| 6 Bank of Montreal (Chicago Branch) | 2.490% | 11/6/18 | 150,000 | 150,000 |
| 6 Bank of Montreal (Chicago Branch) | 2.331% | 1/2/19 | 275,000 | 275,000 |
| 6 Bank of Montreal (Chicago Branch) | 2.332% | 2/1/19 | 300,000 | 300,000 |
| 6 Bank of Montreal (Chicago Branch) | 2.332% | 2/1/19 | 170,000 | 170,000 |
| 6 Bank of Montreal (Chicago Branch) | 2.330% | 2/4/19 | 150,000 | 150,000 |
| 6 Bank of Montreal (Chicago Branch) | 2.307% | 2/12/19 | 350,000 | 350,000 |
| 6 Bank of Montreal (Chicago Branch) | 2.251% | 3/4/19 | 160,000 | 160,000 |
| 6 Bank of Nova Scotia (Houston Branch) | 2.370% | 10/5/18 | 145,000 | 145,000 |
| 6 Bank of Nova Scotia (Houston Branch) | 2.309% | 12/21/18 | 210,000 | 210,000 |
15
| | | | |
| Prime Money Market Fund | | | | |
| |
| |
| |
| | | | Face | Market |
| | | Maturity | Amount | Value • |
| | Yield1 | Date | ($000) | ($000) |
| Canadian Imperial Bank of Commerce | | | | |
| (New York Branch) | 2.000% | 9/17/18 | 14,250 | 14,248 |
| 6 Canadian Imperial Bank of Commerce | | | | |
| (New York Branch) | 2.307% | 9/20/18 | 420,000 | 420,000 |
| 6 Canadian Imperial Bank of Commerce | | | | |
| (New York Branch) | 2.360% | 10/5/18 | 525,000 | 525,000 |
| 6 Canadian Imperial Bank of Commerce | | | | |
| (New York Branch) | 2.307% | 10/22/18 | 74,000 | 73,993 |
| 6 Canadian Imperial Bank of Commerce | | | | |
| (New York Branch) | 2.320% | 2/5/19 | 175,000 | 175,000 |
| 6 Commonwealth Bank of Australia | | | | |
| (New York Branch) | 2.193% | 2/15/19 | 99,000 | 99,000 |
| 6 DNB Bank ASA (New York Branch) | 2.267% | 1/18/19 | 440,000 | 440,000 |
| 6 DNB Bank ASA (New York Branch) | 2.236% | 1/23/19 | 550,000 | 550,000 |
| MUFG Bank Ltd. (New York Branch) | 2.350% | 10/29/18 | 455,000 | 455,000 |
| MUFG Bank Ltd. (New York Branch) | 2.340% | 11/6/18 | 500,000 | 500,000 |
| MUFG Bank Ltd. (New York Branch) | 2.350% | 11/9/18 | 100,000 | 100,000 |
| MUFG Bank Ltd. (New York Branch) | 2.360% | 11/16/18 | 350,000 | 350,000 |
| MUFG Bank Ltd. (New York Branch) | 2.320% | 12/10/18 | 30,000 | 30,000 |
| MUFG Bank Ltd. (New York Branch) | 2.330% | 12/20/18 | 170,000 | 170,000 |
| Nordea Bank AB (New York Branch) | 2.390% | 12/7/18 | 495,000 | 494,993 |
| 6 Nordea Bank AB (New York Branch) | 2.245% | 2/25/19 | 454,250 | 454,250 |
| 6 Nordea Bank AB (New York Branch) | 2.223% | 4/1/19 | 450,000 | 450,000 |
| 6 Nordea Bank AB (New York Branch) | 2.233% | 5/15/19 | 48,500 | 48,500 |
| 6 Nordea Bank AB (New York Branch) | 2.230% | 5/17/19 | 750,000 | 749,973 |
| 6 Royal Bank of Canada (New York Branch) | 2.257% | 9/12/18 | 260,000 | 260,000 |
| 6 Royal Bank of Canada (New York Branch) | 2.460% | 9/17/18 | 140,000 | 140,000 |
| 6 Royal Bank of Canada (New York Branch) | 2.411% | 10/9/18 | 993,000 | 993,000 |
| 6 Royal Bank of Canada (New York Branch) | 2.329% | 1/7/19 | 400,000 | 400,000 |
| 6 Royal Bank of Canada (New York Branch) | 2.317% | 1/22/19 | 150,000 | 150,000 |
| 6 Royal Bank of Canada (New York Branch) | 2.320% | 2/5/19 | 400,000 | 400,000 |
| 6 Royal Bank of Canada (New York Branch) | 2.307% | 2/11/19 | 495,000 | 495,000 |
| 6 Royal Bank of Canada (New York Branch) | 2.254% | 4/1/19 | 270,000 | 270,000 |
| 6 Royal Bank of Canada (New York Branch) | 2.306% | 4/23/19 | 150,000 | 150,000 |
| 6 Skandinaviska Enskilda Banken AB | | | | |
| (New York Branch) | 2.427% | 9/19/18 | 750,000 | 750,000 |
| 6 Skandinaviska Enskilda Banken AB | | | | |
| (New York Branch) | 2.440% | 10/5/18 | 298,000 | 298,000 |
| 6 Skandinaviska Enskilda Banken AB | | | | |
| (New York Branch) | 2.440% | 10/5/18 | 386,100 | 386,100 |
| 6 Skandinaviska Enskilda Banken AB | | | | |
| (New York Branch) | 2.397% | 10/19/18 | 520,000 | 520,000 |
| 6 Sumitomo Mitsui Banking Corp. | | | | |
| (New York Branch) | 2.285% | 11/1/18 | 623,000 | 623,000 |
| 6 Sumitomo Mitsui Banking Corp. | | | | |
| (New York Branch) | 2.187% | 12/13/18 | 429,000 | 429,000 |
| 6 Svenska HandelsBanken AB | | | | |
| (New York Branch) | 2.240% | 9/4/18 | 569,000 | 569,000 |
| 6 Svenska HandelsBanken AB | | | | |
| (New York Branch) | 2.259% | 9/7/18 | 272,000 | 272,000 |
| 6 Svenska HandelsBanken AB | | | | |
| (New York Branch) | 2.279% | 9/21/18 | 470,000 | 470,000 |
| 6 Svenska HandelsBanken AB | | | | |
| (New York Branch) | 2.307% | 11/19/18 | 1,000,000 | 1,000,000 |
16
| | | | |
| Prime Money Market Fund | | | | |
| |
| |
| |
| | | | Face | Market |
| | | Maturity | Amount | Value • |
| | Yield1 | Date | ($000) | ($000) |
| 6 Svenska HandelsBanken AB | | | | |
| (New York Branch) | 2.299% | 12/21/18 | 138,000 | 138,000 |
| 6 Svenska HandelsBanken AB | | | | |
| (New York Branch) | 2.235% | 2/28/19 | 530,000 | 530,000 |
| 6 Svenska HandelsBanken AB | | | | |
| (New York Branch) | 2.264% | 4/1/19 | 400,000 | 400,000 |
| 6 Svenska HandelsBanken AB | | | | |
| (New York Branch) | 2.247% | 5/20/19 | 100,000 | 100,000 |
| 6 Swedbank AB (New York Branch) | 2.440% | 10/5/18 | 140,000 | 140,000 |
| 6 Swedbank AB (New York Branch) | 2.290% | 11/6/18 | 750,000 | 750,000 |
| Toronto-Dominion Bank (New York Branch) | 2.500% | 1/7/19 | 520,000 | 520,000 |
| 6 Westpac Banking Corp. (New York Branch) | 2.293% | 1/10/19 | 62,000 | 61,971 |
| 6 Westpac Banking Corp. (New York Branch) | 2.317% | 2/13/19 | 234,000 | 234,000 |
| 6 Westpac Banking Corp. (New York Branch) | 2.317% | 2/14/19 | 500,000 | 500,000 |
| | | | | 21,033,028 |
| Total Certificates of Deposit (Cost $26,504,253) | | | | 26,504,253 |
| Other Notes (1.8%) | | | | |
| 6 Bank of America NA | 2.297% | 9/10/18 | 157,000 | 157,000 |
| 6 Bank of America NA | 2.467% | 10/22/18 | 250,000 | 250,000 |
| 6 Bank of America NA | 2.466% | 10/23/18 | 250,000 | 250,000 |
| Bank of America NA | 2.410% | 11/1/18 | 247,500 | 247,500 |
| 6 Bank of America NA | 2.501% | 11/2/18 | 346,500 | 346,500 |
| Bank of America NA | 2.420% | 11/5/18 | 247,500 | 247,500 |
| 6 Bank of America NA | 2.473% | 11/8/18 | 154,250 | 154,250 |
| Bank of America NA | 2.400% | 11/13/18 | 247,500 | 247,500 |
| 6 Bank of America NA | 2.332% | 4/1/19 | 52,500 | 52,528 |
| Total Other Notes (Cost $1,952,778) | | | | 1,952,778 |
| Repurchase Agreements (0.3%) | | | | |
| JP Morgan Securities LLC | | | | |
| (Dated 8/31/18, Repurchase Value | | | | |
| $332,072,000, collateralized by U. S. | | | | |
| Treasury Note/Bond 1.625%–2.750%, | | | | |
| 7/31/20–7/31/23, with a value of | | | | |
| $338,640,000) (Cost $332,000) | 1.950% | 9/4/18 | 332,000 | 332,000 |
| Taxable Municipal Bonds (0.0%) | | | | |
| 8 Greene County GA Development Authority | | | | |
| Revenue VRDO (Cost $6,250) | 2.000% | 9/7/18 | 6,250 | 6,250 |
| Total Investments (99.8%) (Cost $108,790,140) | | | | 108,790,140 |
17
| |
| Prime Money Market Fund | |
| |
| |
| |
| | Amount |
| | ($000) |
| Other Assets and Liabilities (0.2%) | |
| Other Assets | |
| Investment in Vanguard | 5,428 |
| Receivables for Accrued Income | 68,546 |
| Receivables for Capital Shares Issued | 254,286 |
| Other Assets | 90,607 |
| Total Other Assets | 418,867 |
| Liabilities | |
| Payables for Capital Shares Redeemed | (172,857) |
| Payables for Distributions | (11,972) |
| Payables to Vanguard | (8,059) |
| Other Liabilities | (428) |
| Total Liabilities | (193,316) |
| Net Assets (100%) | 109,015,691 |
| |
| |
| At August 31, 2018, net assets consisted of: | |
| | Amount |
| | ($000) |
| Paid-in Capital | 109,011,976 |
| Overdistributed Net Investment Income | (13) |
| Accumulated Net Realized Gains | 3,728 |
| Net Assets | 109,015,691 |
| |
| Investor Shares—Net Assets | |
| Applicable to 92,885,694,144 outstanding $.001 par value shares of | |
| beneficial interest (unlimited authorization) | 92,898,002 |
| Net Asset Value Per Share—Investor Shares | $1.00 |
| |
| Admiral Shares—Net Assets | |
| Applicable to 16,115,718,767 outstanding $.001 par value shares of | |
| beneficial interest (unlimited authorization) | 16,117,689 |
| Net Asset Value Per Share—Admiral Shares | $1.00 |
• See Note A in Notes to Financial Statements.
1 Represents annualized yield at date of purchase for discount securities, and coupon for coupon-bearing securities.
2 The issuer was placed under federal conservatorship in September 2008; since that time, its daily operations have been managed
by the Federal Housing Finance Agency and it receives capital from the U.S. Treasury, as needed to maintain a positive net worth,
in exchange for senior preferred stock.
3 The issuer operates under a congressional charter; its securities are generally neither guaranteed by the U.S. Treasury nor backed
by the full faith and credit of the U.S. government.
4 Adjustable-rate security based upon 3-month U.S. Treasury Bill Auction High Money Market Yield plus spread.
5 Security exempt from registration under Section 4(2) of the Securities Act of 1933. Such securities may be sold in transactions
exempt from registration only to dealers in that program or other “accredited investors.” At August 31, 2018, the aggregate value
of these securities was $29,004,511,000, representing 26.6% of net assets.
6 Adjustable-rate security based upon 1-month USD LIBOR plus spread.
7 Security exempt from registration under Rule 144A of the Securities Act of 1933. Such securities may be sold in transactions
exempt from registration, normally to qualified institutional buyers. At August 31, 2018, the aggregate value of these securities
was $1,564,501,000, representing 1.4% of net assets.
8 Scheduled principal and interest payments are guaranteed by bank letter of credit.
VRDO—Variable Rate Demand Obligation.
See accompanying Notes, which are an integral part of the Financial Statements.
18
| |
| Prime Money Market Fund | |
| |
| |
| Statement of Operations | |
| |
| | Year Ended |
| | August 31, 2018 |
| | ($000) |
| Investment Income | |
| Income | |
| Interest | 1,731,386 |
| Total Income | 1,731,386 |
| Expenses | |
| The Vanguard Group—Note B | |
| Investment Advisory Services | 3,049 |
| Management and Administrative—Investor Shares | 113,783 |
| Management and Administrative—Admiral Shares | 11,654 |
| Marketing and Distribution—Investor Shares | 18,502 |
| Marketing and Distribution—Admiral Shares | 838 |
| Custodian Fees | 880 |
| Auditing Fees | 34 |
| Shareholders’ Reports and Proxy—Investor Shares | 1,288 |
| Shareholders’ Reports and Proxy—Admiral Shares | 75 |
| Trustees’ Fees and Expenses | 91 |
| Total Expenses | 150,194 |
| Net Investment Income | 1,581,192 |
| Realized Net Gain (Loss) on Investment Securities Sold | (4,203) |
| Net Increase (Decrease) in Net Assets Resulting from Operations | 1,576,989 |
See accompanying Notes, which are an integral part of the Financial Statements.
19
| | |
| Prime Money Market Fund | | |
| |
| |
| Statement of Changes in Net Assets | | |
| |
| | Year Ended August 31, |
| | 2018 | 2017 |
| | ($000) | ($000) |
| Increase (Decrease) in Net Assets | | |
| Operations | | |
| Net Investment Income | 1,581,192 | 834,141 |
| Realized Net Gain (Loss) | (4,203) | 1,961 |
| Net Increase (Decrease) in Net Assets Resulting from Operations | 1,576,989 | 836,102 |
| Distributions | | |
| Net Investment Income | | |
| Investor Shares | (1,363,449) | (726,141) |
| Admiral Shares | (217,801) | (107,955) |
| Realized Capital Gain | | |
| Investor Shares | — | — |
| Admiral Shares | — | — |
| Total Distributions | (1,581,250) | (834,096) |
| Capital Share Transactions (at $1.00 per share) | | |
| Investor Shares | 8,015,413 | (15,325,634) |
| Admiral Shares | 4,121,058 | (4,432,381) |
| Net Increase (Decrease) from Capital Share Transactions | 12,136,471 | (19,758,015) |
| Total Increase (Decrease) | 12,132,210 | (19,756,009) |
| Net Assets | | |
| Beginning of Period | 96,883,481 | 116,639,490 |
| End of Period1 | 109,015,691 | 96,883,481 |
1 Net Assets—End of Period includes undistributed (overdistributed) net investment income of ($13,000) and $45,000.
See accompanying Notes, which are an integral part of the Financial Statements.
20
Prime Money Market Fund
Financial Highlights
| | | | | |
| Investor Shares | | | | | |
| |
| For a Share Outstanding | | | Year Ended August 31, |
| Throughout Each Period | 2018 | 2017 | 2016 | 2015 | 2014 |
| Net Asset Value, Beginning of Period | $1.00 | $1.00 | $1.00 | $1.00 | $1.00 |
| Investment Operations | | | | | |
| Net Investment Income | . 0161 | .0081 | .0032 | .0002 | .0001 |
| Net Realized and Unrealized Gain (Loss) | | | | | |
| on Investments | — | — | — | — | — |
| Total from Investment Operations | .016 | .008 | .0032 | .0002 | .0001 |
| Distributions | | | | | |
| Dividends from Net Investment Income | (.016) | (.008) | (.0032) | (.0002) | (.0001) |
| Distributions from Realized Capital Gains | — | — | — | — | (.0000) |
| Total Distributions | (.016) | (.008) | (.0032) | (.0002) | (.0001) |
| Net Asset Value, End of Period | $1.00 | $1.00 | $1.00 | $1.00 | $1.00 |
| |
| Total Return 3 | 1.59% | 0.83% | 0.32% | 0.02% | 0.02% |
| |
| Ratios/Supplemental Data | | | | | |
| Net Assets, End of Period (Millions) | $92,898 | $84,886 | $100,210 | $105,820 | $101,910 |
| Ratio of Total Expenses to Average Net Assets4 | 0.16% | 0.16% | 0.16% | 0.15% | 0.14% |
| Ratio of Net Investment Income to | | | | | |
| Average Net Assets | 1.59% | 0.82% | 0.32% | 0.02% | 0.01% |
1 Calculated based on average shares outstanding.
2 Distribution was less than $.0001 per share.
3 Total returns do not include account service fees that may have applied in the periods shown. Fund prospectuses provide information about any applicable account service fees.
4 Vanguard and the board of trustees have agreed to temporarily limit certain net operating expenses in excess of the fund’s daily yield in order to maintain a zero or positive yield for the fund. Vanguard and the board of trustees may terminate the temporary expense limitation at any time. The fund is not obligated to repay this amount to Vanguard. The ratio of total expenses to average net assets before an expense reduction was 0.16% for 2016, 0.16% for 2015, and 0.16% for 2014. For the years ended August 31, 2018 and 2017, there were no expense reductions.
See accompanying Notes, which are an integral part of the Financial Statements.
21
| | | | | |
| Prime Money Market Fund | | | | | |
| |
| |
| Financial Highlights | | | | | |
| |
| |
| Admiral Shares | | | | | |
| |
| For a Share Outstanding | | | Year Ended August 31, |
| Throughout Each Period | 2018 | 2017 | 2016 | 2015 | 2014 |
| Net Asset Value, Beginning of Period | $1.00 | $1.00 | $1.00 | $1.00 | $1.00 |
| Investment Operations | | | | | |
| Net Investment Income | . 0161 | .0091 | .004 | .001 | .001 |
| Net Realized and Unrealized Gain (Loss) | | | | | |
| on Investments | — | — | — | — | — |
| Total from Investment Operations | .016 | .009 | .004 | .001 | .001 |
| Distributions | | | | | |
| Dividends from Net Investment Income | (.016) | (.009) | (.004) | (.001) | (.001) |
| Distributions from Realized Capital Gains | — | — | — | — | (.000)2 |
| Total Distributions | (.016) | (.009) | (.004) | (.001) | (.001) |
| Net Asset Value, End of Period | $1.00 | $1.00 | $1.00 | $1.00 | $1.00 |
| |
| Total Return 3 | 1.66% | 0.89% | 0.38% | 0.07% | 0.06% |
| |
| Ratios/Supplemental Data | | | | | |
| Net Assets, End of Period (Millions) | $16,118 | $11,997 | $16,429 | $28,988 | $28,699 |
| Ratio of Total Expenses to Average Net Assets | 0.10% | 0.10% | 0.10% | 0.10% | 0.10% |
| Ratio of Net Investment Income to | | | | | |
| Average Net Assets | 1.65% | 0.88% | 0.38% | 0.07% | 0.05% |
Institutional Shares were renamed Admiral Shares in December 2015. Prior periods’ Financial Highlights are for the Institutional class.
1 Calculated based on average shares outstanding.
2 Distribution was less than $.0001 per share.
3 Total returns do not include account service fees that may have applied in the periods shown. Fund prospectuses provide information about any applicable account service fees.
See accompanying Notes, which are an integral part of the Financial Statements.
22
Prime Money Market Fund
Notes to Financial Statements
Vanguard Prime Money Market Fund is registered under the Investment Company Act of 1940 as an open-end investment company, or mutual fund. The fund invests in short-term debt instruments of companies primarily operating in specific industries, particularly financial services; the issuers’ abilities to meet their obligations may be affected by economic developments in such industries. The fund offers two classes of shares, Investor Shares and Admiral Shares. Investor Shares are available to any investor who meets the fund’s minimum purchase requirements. Admiral Shares are designed for investors who meet certain administrative, service, and account-size criteria.
A. The following significant accounting policies conform to generally accepted accounting principles for U.S. investment companies. The fund consistently follows such policies in preparing its financial statements.
1. Security Valuation: Securities are valued as of the close of trading on the New York Stock Exchange (generally 4 p.m., Eastern time) on the valuation date. Securities are valued at amortized cost, which approximates market value.
2. Repurchase Agreements: The fund enters into repurchase agreements with institutional counter-parties. Securities pledged as collateral to the fund under repurchase agreements are held by a custodian bank until the agreements mature, and in the absence of a default, such collateral cannot be repledged, resold, or rehypothecated. Each agreement requires that the market value of the collateral be sufficient to cover payments of interest and principal. The fund further mitigates its counterparty risk by entering into repurchase agreements only with a diverse group of prequalified counterparties, monitoring their financial strength, and entering into master repurchase agreements with its counterparties. The master repurchase agreements provide that, in the event of a counter-party’s default (including bankruptcy), the fund may terminate any repurchase agreements with that counterparty, determine the net amount owed, and sell or retain the collateral up to the net amount owed to the fund. Such action may be subject to legal proceedings, which may delay or limit the disposition of collateral.
3. Federal Income Taxes: The fund intends to continue to qualify as a regulated investment company and distribute all of its taxable income. Management has analyzed the fund’s tax positions taken for all open federal income tax years (August 31, 2015–2018), and has concluded that no provision for federal income tax is required in the fund’s financial statements.
4. Distributions: Distributions from net investment income are declared daily and paid on the first business day of the following month. Annual distributions from realized capital gains, if any, are recorded on the ex-dividend date. Distributions are determined on a tax basis and may differ from net investment income and realized capital gains for financial reporting purposes.
5. Credit Facility: The fund and certain other funds managed by The Vanguard Group (“Vanguard”) participate in a $3.1 billion committed credit facility provided by a syndicate of lenders pursuant to a credit agreement that may be renewed annually; each fund is individually liable for its borrowings, if any, under the credit facility. Borrowings may be utilized for temporary and emergency purposes, and are subject to the fund’s regulatory and contractual borrowing restrictions. The participating funds are charged administrative fees and an annual commitment fee of 0.10% of the undrawn amount of the facility; these fees are allocated to the funds based on a method approved by the fund’s board of trustees and included in Management and Administrative expenses on the fund’s Statement of Operations. Any borrowings under this facility bear interest at a rate based upon the higher of the one-month London Interbank Offered Rate, federal funds effective rate, or overnight bank funding rate plus an agreed-upon spread.
23
Prime Money Market Fund
The fund had no borrowings outstanding at August 31, 2018, or at any time during the period then ended.
6. Other: Interest income is accrued daily. Premiums and discounts on debt securities purchased are amortized and accreted, respectively, to interest income over the lives of the respective securities. Security transactions are accounted for on the date securities are bought or sold. Costs used to determine realized gains (losses) on the sale of investment securities are those of the specific securities sold.
Each class of shares has equal rights as to assets and earnings, except that each class separately bears certain class-specific expenses related to maintenance of shareholder accounts (included in Management and Administrative expenses), shareholder reporting, and the proxy. Marketing and distribution expenses are allocated to each class of shares based on a method approved by the board of trustees. Income, other non-class-specific expenses, and gains and losses on investments are allocated to each class of shares based on its relative net assets.
B. In accordance with the terms of a Funds’ Service Agreement (the “FSA”) between Vanguard and the fund, Vanguard furnishes to the fund investment advisory, corporate management, administrative, marketing, and distribution services at Vanguard’s cost of operations (as defined by the FSA). These costs of operations are allocated to the fund based on methods and guidelines approved by the board of trustees. Vanguard does not require reimbursement in the current period for certain costs of operations (such as deferred compensation/benefits and risk/insurance costs); the fund’s liability for these costs of operations is included in Payables to Vanguard on the Statement of Net Assets. All other costs of operations payable to Vanguard are generally settled twice a month.
Upon the request of Vanguard, the fund may invest up to 0.40% of its net assets as capital in Vanguard. At August 31, 2018, the fund had contributed to Vanguard capital in the amount of $5,428,000, representing 0.00% of the fund’s net assets and 2.17% of Vanguard’s capitalization. The fund’s trustees and officers are also directors and employees, respectively, of Vanguard.
C. Various inputs may be used to determine the value of the fund’s investments. These inputs are summarized in three broad levels for financial statement purposes. The inputs or methodologies used to value securities are not necessarily an indication of the risk associated with investing in those securities.
Level 1—Quoted prices in active markets for identical securities.
Level 2—Other significant observable inputs (including quoted prices for similar securities, interest rates, prepayment speeds, credit risk, etc.).
Level 3—Significant unobservable inputs (including the fund’s own assumptions used to determine the fair value of investments). Any investments valued with significant unobservable inputs are noted on the Statement of Net Assets.
At August 31, 2018, 100% of the market value of the fund’s investments was determined using amortized cost, in accordance with rules under the Investment Company Act of 1940. Amortized cost approximates the current fair value of a security, but since the value is not obtained from a quoted price in an active market, securities valued at amortized cost are considered to be valued using Level 2 inputs.
D. Permanent differences, if any, are reclassified among capital accounts in the financial statements to reflect their tax character. These reclassifications have no effect on net assets or net asset value per share.
24
Prime Money Market Fund
Temporary differences between book-basis and tax-basis components of accumulated net earnings (losses) arise when certain items of income, gain, or loss are recognized in different periods for financial statement and tax purposes; these differences will reverse at some time in the future.
As of period end, the tax components of accumulated net earnings (losses) are detailed in the table asfollows:
| |
| | Amount |
| | ($000) |
| Undistributed ordinary income | 19,891 |
| Undistributed long-term gains | — |
| Capital loss carryforwards (non-expiring) | (4,204) |
| Net unrealized gains (losses) | — |
As of August 31, 2018, gross unrealized appreciation and depreciation for investments and derivatives based on cost for U.S. federal income tax purposes were as follows:
| |
| | Amount |
| | ($000) |
| Tax cost | 108,790,140 |
| Gross unrealized appreciation | — |
| Gross unrealized depreciation | — |
| Net unrealized appreciation (depreciation) | — |
E. Capital share transactions for each class of shares were:
| | | | |
| | | | Year Ended August 31, |
| | | 2018 | | 2017 |
| | Amount | Shares | Amount | Shares |
| | ($000) | (000) | ($000) | (000) |
| Investor Shares | | | | |
| Issued | 57,734,205 | 57,734,439 | 64,128,512 | 64,127,620 |
| Issued in Lieu of Cash Distributions | 1,273,993 | 1,273,993 | 680,319 | 680,319 |
| Redeemed | (50,992,785) | (50,992,785) | (80,134,465) | (80,134,468) |
| Net Increase (Decrease) —Investor Shares | 8,015,413 | 8,015,647 | (15,325,634) | (15,326,529) |
| Admiral Shares | | | | |
| Issued | 11,041,702 | 11,041,469 | 8,144,434 | 8,145,324 |
| Issued in Lieu of Cash Distributions | 202,222 | 202,222 | 102,733 | 102,733 |
| Redeemed | (7,122,866) | (7,122,866) | (12,679,548) | (12,679,548) |
| Net Increase (Decrease)—Admiral Shares | 4,121,058 | 4,120,825 | (4,432,381) | (4,431,491) |
F. Management has determined that no events or transactions occurred subsequent to August 31, 2018, that would require recognition or disclosure in these financial statements.
25
Federal Money Market Fund
Fund Profile
As of August 31, 2018
| |
| Financial Attributes | |
| Ticker Symbol | VMFXX |
| Expense Ratio1 | 0.11% |
| 7-Day SEC Yield | 1.93% |
| Average Weighted | |
| Maturity | 55 days |
| |
| Sector Diversification (% of portfolio) | |
| Repurchase Agreements | 16.4% |
| U.S. Government Obligations | 27.7 |
| U.S. Treasury Bills | 55.9 |
The agency and mortgage-backed securities sectors may include
issues from government-sponsored enterprises; such issues are
generally not backed by the full faith and credit of the U.S.
government.
1 The expense ratio shown is from the prospectus dated December 22, 2017, and represents estimated costs for the current fiscal year. For the fiscal year ended August 31, 2018, the expense ratio was 0.11%.
26
Federal Money Market Fund
Performance Summary
Investment returns will fluctuate. All of the returns in this report represent past performance, which is not a guarantee of future results that may be achieved by the fund. (Current performance may be lower or higher than the performance data cited. For performance data current to the most recent month-end, visit our website at vanguard.com/performance.) The returns shown do not reflect taxes that a shareholder would pay on fund distributions. You could lose money by investing in the fund. Although the fund seeks to preserve the value of your investment at $1 per share, it cannot guarantee it will do so. An investment in the fund is not insured or guaranteed by the Federal Deposit Insurance Corporation or any other government agency. The fund’s sponsor has no legal obligation to provide financial support to the fund, and you should not expect that the sponsor will provide financial support to the fund at any time. The fund’s 7-day SEC yield reflects its current earnings more closely than do the average annual returns.
Cumulative Performance: August 31, 2008, Through August 31, 2018
Initial Investment of $10,000
| | | | |
| | Average Annual Total Returns | |
| | Periods Ended August 31, 2018 | |
| |
| | | | | Final Value |
| | One | Five | Ten | of a $10,000 |
| | Year | Years | Years | Investment |
| |
| Federal Money Market Fund | 1.42% | 0.45% | 0.34% | $10,342 |
| Government Money Market Funds | | | | |
| Average | 0.87 | 0.21 | 0.15 | 10,150 |
| FTSE Three-Month U.S. Treasury Bill | | | | |
| Index | 1.49 | 0.44 | 0.31 | 10,334 |
| Government Money Market Funds Average: Derived from data provided by Lipper, a Thomson Reuters Company. | |
See Financial Highlights for dividend information.
27
| | |
| Federal Money Market Fund | | |
| |
| |
| |
| |
| Fiscal-Year Total Returns (%): August 31, 2008, Through August 31, 2018 | |
| | | Gov't Money |
| | | Market Funds Average |
| Fiscal Year | Total Returns | Total Returns |
| 2009 | 1.06% | 0.43% |
| 2010 | 0.04 | 0.00 |
| 2011 | 0.02 | 0.00 |
| 2012 | 0.01 | 0.00 |
| 2013 | 0.01 | 0.00 |
| 2014 | 0.02 | 0.00 |
| 2015 | 0.01 | 0.00 |
| 2016 | 0.23 | 0.00 |
| 2017 | 0.57 | 0.19 |
| 2018 | 1.42 | 0.87 |
| 7-day SEC yield (8/31/2018): 1.93% | | |
| Government Money Market Funds Average: Derived from data provided by Lipper, a Thomson Reuters Company. |
Average Annual Total Returns: Periods Ended June 30, 2018
This table presents returns through the latest calendar quarter—rather than through the end of the fiscal period.
Securities and Exchange Commission rules require that we provide this information.
| | | | |
| | Inception | One | Five | Ten |
| | Date | Year | Years | Years |
| Federal Money Market Fund | 7/13/1981 | 1.26% | 0.38% | 0.34% |
28
Federal Money Market Fund
Financial Statements
Statement of Net Assets
As of August 31, 2018
The fund reports a complete list of its holdings in various monthly and quarterly regulatory filings. The fund publishes its holdings on a monthly basis at vanguard.com and files them with the Securities and Exchange Commission on Form N-MFP. The fund’s Form N-MFP filings may be viewed at sec.gov or via a link on the “Portfolio Holdings” page on vanguard.com. For the second and fourth fiscal quarters, the lists appear in the fund’s semiannual and annual reports to shareholders. For the first and third fiscal quarters, the fund files the lists with the SEC on Form N-Q. Shareholders can look up the fund’s Forms N-Q on the SEC’s website at sec.gov. Forms N-Q may also be reviewed and copied at the SEC’s Public Reference Room (see the back cover of this report for further information).
| | | | | |
| | | | | Face | Market |
| | | | Maturity | Amount | Value • |
| | | Yield1 | Date | ($000) | ($000) |
| U.S. Government and Agency Obligations (83.5%) | | | |
| 2 | Fannie Mae Discount Notes | 2.000% | 10/24/18 | 100,000 | 99,707 |
| 2 | Fannie Mae Discount Notes | 2.080% | 11/14/18 | 20,000 | 19,915 |
| 2 | Fannie Mae Discount Notes | 2.091% | 11/21/18 | 19,211 | 19,121 |
| 3 | Federal Home Loan Bank Discount | | | | |
| | Notes | 1.925%–1.951% | 9/5/18 | 230,100 | 230,051 |
| 3 | Federal Home Loan Bank Discount | | | | |
| | Notes | 1.971% | 9/6/18 | 91,661 | 91,636 |
| 3 | Federal Home Loan Bank Discount | | | | |
| | Notes | 1.925%–1.941% | 9/7/18 | 505,050 | 504,887 |
| 3 | Federal Home Loan Bank Discount | | | | |
| | Notes | 1.921%–1.941% | 9/10/18 | 225,140 | 225,031 |
| 3 | Federal Home Loan Bank Discount | | | | |
| | Notes | 1.921% | 9/11/18 | 150,000 | 149,920 |
| 3 | Federal Home Loan Bank Discount | | | | |
| | Notes | 1.924% | 9/12/18 | 1,500,000 | 1,499,121 |
| 3 | Federal Home Loan Bank Discount | | | | |
| | Notes | 1.965% | 9/17/18 | 500,000 | 499,567 |
| 3 | Federal Home Loan Bank Discount | | | | |
| | Notes | 1.944% | 9/20/18 | 750,000 | 749,236 |
| 3 | Federal Home Loan Bank Discount | | | | |
| | Notes | 1.965% | 10/1/18 | 300,000 | 299,510 |
| 3 | Federal Home Loan Bank Discount | | | | |
| | Notes | 1.961% | 10/3/18 | 50,000 | 49,913 |
| 3 | Federal Home Loan Bank Discount | | | | |
| | Notes | 2.046% | 10/19/18 | 56,550 | 56,396 |
| 3 | Federal Home Loan Bank Discount | | | | |
| | Notes | 2.035%–2.036% | 10/24/18 | 175,000 | 174,477 |
| 3 | Federal Home Loan Bank Discount | | | | |
| | Notes | 2.057%–2.086% | 10/26/18 | 1,524,650 | 1,519,878 |
| 3 | Federal Home Loan Bank Discount | | | | |
| | Notes | 2.076% | 11/14/18 | 317,990 | 316,640 |
| 3 | Federal Home Loan Bank Discount | | | | |
| | Notes | 2.080% | 11/16/18 | 261,000 | 259,860 |
29
| | | | | |
| Federal Money Market Fund | | | | |
| |
| |
| |
| | | | | Face | Market |
| | | | Maturity | Amount | Value • |
| | | Yield1 | Date | ($000) | ($000) |
| 3 | Federal Home Loan Bank Discount | | | | |
| | Notes | 2.064%–2.111% | 11/21/18 | 383,300 | 381,531 |
| 3 | Federal Home Loan Bank Discount | | | | |
| | Notes | 2.090% | 11/23/18 | 530,000 | 527,460 |
| 3 | Federal Home Loan Bank Discount | | | | |
| | Notes | 2.070% | 11/26/18 | 500,000 | 497,545 |
| 3 | Federal Home Loan Bank Discount | | | | |
| | Notes | 2.059%–2.070% | 11/27/18 | 624,540 | 621,445 |
| 3 | Federal Home Loan Bank Discount | | | | |
| | Notes | 2.086% | 12/3/18 | 377,815 | 375,795 |
| 3 | Federal Home Loan Bank Discount | | | | |
| | Notes | 2.120% | 12/21/18 | 350,000 | 347,728 |
| 3 | Federal Home Loan Bank Discount | | | | |
| | Notes | 2.125% | 12/24/18 | 120,000 | 119,198 |
| 3,4 | Federal Home Loan Banks | 1.935% | 9/4/18 | 240,500 | 240,500 |
| 3,4 | Federal Home Loan Banks | 1.937% | 9/18/18 | 240,000 | 239,996 |
| 3,4 | Federal Home Loan Banks | 1.950% | 9/27/18 | 600,000 | 600,000 |
| 3,4 | Federal Home Loan Banks | 1.930% | 10/26/18 | 1,000,000 | 1,000,000 |
| 3,5 | Federal Home Loan Banks | 1.993% | 11/8/18 | 100,000 | 99,999 |
| 3,4 | Federal Home Loan Banks | 1.952% | 11/20/18 | 1,000,000 | 1,000,000 |
| 3,4 | Federal Home Loan Banks | 1.989% | 11/21/18 | 500,000 | 500,000 |
| 3,4 | Federal Home Loan Banks | 1.986% | 11/23/18 | 230,000 | 230,000 |
| 3,4 | Federal Home Loan Banks | 1.972% | 11/28/18 | 600,000 | 600,000 |
| 3,4 | Federal Home Loan Banks | 1.942% | 12/3/18 | 789,900 | 789,900 |
| 3,4 | Federal Home Loan Banks | 2.005% | 3/28/19 | 250,000 | 250,000 |
| 3,4 | Federal Home Loan Banks | 1.962% | 4/1/19 | 250,000 | 250,000 |
| 3,4 | Federal Home Loan Banks | 1.962% | 4/1/19 | 450,000 | 450,000 |
| 3,4 | Federal Home Loan Banks | 1.962% | 4/1/19 | 250,000 | 250,000 |
| 3,4 | Federal Home Loan Banks | 1.950% | 4/26/19 | 1,000,000 | 1,000,000 |
| 3,4 | Federal Home Loan Banks | 1.957% | 5/1/19 | 250,000 | 250,000 |
| 3,6 | Federal Home Loan Banks | 2.152% | 5/24/19 | 380,000 | 380,378 |
| 3,4 | Federal Home Loan Banks | 1.997% | 7/19/19 | 750,000 | 750,000 |
| 3,4 | Federal Home Loan Banks | 1.960% | 7/26/19 | 88,000 | 88,000 |
| 3,4 | Federal Home Loan Banks | 1.960% | 7/26/19 | 375,000 | 375,000 |
| 3,4 | Federal Home Loan Banks | 1.960% | 7/26/19 | 450,000 | 450,000 |
| 3,4 | Federal Home Loan Banks | 1.977% | 8/1/19 | 250,000 | 250,000 |
| 3,4 | Federal Home Loan Banks | 1.982% | 11/1/19 | 500,000 | 500,000 |
| 3,4 | Federal Home Loan Banks | 1.982% | 11/4/19 | 250,000 | 250,000 |
| 3,4 | Federal Home Loan Banks | 1.979% | 11/7/19 | 250,000 | 250,000 |
| 3,4 | Federal Home Loan Banks | 1.979% | 11/7/19 | 250,000 | 250,000 |
| 2,4 | Federal Home Loan Mortgage Corp. | 1.959% | 12/7/18 | 1,500,000 | 1,500,000 |
| 2,4 | Federal Home Loan Mortgage Corp. | 1.935% | 1/30/19 | 1,000,000 | 1,000,000 |
| 2,4 | Federal Home Loan Mortgage Corp. | 1.965% | 6/28/19 | 250,000 | 250,042 |
| 2,4 | Federal Home Loan Mortgage Corp. | 1.980% | 7/5/19 | 250,000 | 250,050 |
| 2,4 | Federal Home Loan Mortgage Corp. | 1.983% | 8/8/19 | 1,000,000 | 1,000,000 |
| 2,4 | Federal Home Loan Mortgage Corp. | 1.967% | 8/12/19 | 1,000,000 | 1,000,000 |
| 2 | Freddie Mac Discount Notes | 1.923%–1.929% | 9/4/18 | 35,000 | 34,994 |
| 2 | Freddie Mac Discount Notes | 1.936% | 9/5/18 | 50,000 | 49,989 |
| 2 | Freddie Mac Discount Notes | 1.928% | 9/10/18 | 100,000 | 99,952 |
| 2 | Freddie Mac Discount Notes | 1.959%–2.010% | 10/2/18 | 240,000 | 239,597 |
| 2 | Freddie Mac Discount Notes | 2.030% | 10/11/18 | 34,000 | 33,924 |
| 2 | Freddie Mac Discount Notes | 1.991%–2.010% | 10/18/18 | 341,667 | 340,779 |
| 2 | Freddie Mac Discount Notes | 2.061% | 11/5/18 | 200,000 | 199,260 |
| 2 | Freddie Mac Discount Notes | 2.081% | 11/20/18 | 75,000 | 74,655 |
30
| | | | | |
| Federal Money Market Fund | | | | | |
| |
| |
| |
| | | | | Face | Market |
| | | | Maturity | Amount | Value • |
| | | Yield1 | Date | ($000) | ($000) |
| 2 Freddie Mac Discount Notes | | 2.121% | 11/29/18 | 89,375 | 88,909 |
| United States Treasury Bill | | 1.919% | 9/6/18 | 2,091,384 | 2,090,829 |
| United States Treasury Bill | | 1.913% | 9/27/18 | 419,856 | 419,281 |
| United States Treasury Bill | | 1.950% | 10/4/18 | 1,450,000 | 1,447,421 |
| United States Treasury Bill | | 1.955% | 10/11/18 | 5,000,000 | 4,989,195 |
| United States Treasury Bill | | 1.990% | 10/18/18 | 5,000,000 | 4,987,075 |
| United States Treasury Bill | 1.980%–2.005% | 10/25/18 | 4,000,000 | 3,988,135 |
| United States Treasury Bill | 2.002%–2.010% | 11/1/18 | 5,400,000 | 5,381,771 |
| United States Treasury Bill | 2.020%–2.026% | 11/8/18 | 5,000,000 | 4,981,035 |
| United States Treasury Bill | 2.041%–2.056% | 11/15/18 | 4,500,000 | 4,480,953 |
| United States Treasury Bill | 2.046%–2.099% | 11/23/18 | 5,500,000 | 5,474,053 |
| United States Treasury Bill | 2.091%–2.092% | 11/29/18 | 5,250,000 | 5,223,001 |
| United States Treasury Bill | | 2.097% | 12/13/18 | 2,450,000 | 2,435,455 |
| United States Treasury Bill | | 2.163% | 1/24/19 | 750,000 | 743,535 |
| United States Treasury Bill | | 2.184% | 1/31/19 | 2,000,000 | 1,981,760 |
| United States Treasury Bill | | 2.204% | 2/7/19 | 2,500,000 | 2,475,929 |
| United States Treasury Bill | | 2.204% | 2/14/19 | 3,000,000 | 2,969,843 |
| United States Treasury Bill | | 2.209% | 2/21/19 | 2,000,000 | 1,979,000 |
| 5 United States Treasury Floating Rate Note | 2.261% | 10/31/18 | 600,000 | 600,001 |
| Total U.S. Government and Agency Obligations (Cost $83,739,764) | | 83,739,764 |
| Repurchase Agreements (16.4%) | | | | | |
| Bank of Montreal | | | | | |
| (Dated 7/24/18, Repurchase Value | | | | | |
| $250,597,000, collateralized by | | | | | |
| Treasury Inflation Indexed Note/Bond | | | | | |
| 0.125%–3.875%, 1/15/22–2/15/48, | | | | | |
| U.S. Treasury Bill 0.000%, 9/27/18, | | | | | |
| and U.S. Treasury Note/Bond | | | | | |
| 1.000%–4.250%, 1/31/19–8/15/47, | | | | | |
| with a value of $255,000,000) | | 1.910% | 9/7/18 | 250,000 | 250,000 |
| Bank of Montreal | | | | | |
| (Dated 8/10/18, Repurchase Value | | | | | |
| $500,829,000, collateralized by | | | | | |
| Treasury Inflation Indexed Note/Bond | | | | | |
| 0.125%–3.875%, 1/15/20–2/15/41, U.S. | | | | |
| Treasury Bill 0.000%, 9/27/18–8/15/19, | | | | |
| and U.S. Treasury Note/Bond | | | | | |
| 0.750%–5.000%, 11/30/18–8/15/48, | | | | | |
| with a value of $510,000,000) | | 1.990% | 10/9/18 | 500,000 | 500,000 |
| Bank of Montreal | | | | | |
| (Dated 8/14/18, Repurchase Value | | | | | |
| $500,810,000, collateralized by | | | | | |
| Treasury Inflation Indexed Note/Bond | | | | | |
| 0.125%–0.750%, 4/15/20–7/15/28, U.S. | | | | |
| Treasury Bill 0.000%, 9/27/18–5/23/19, | | | | |
| and U.S. Treasury Note/Bond | | | | | |
| 1.000%–4.250%, 6/30/19–8/15/48, | | | | | |
| with a value of $510,000,000) | | 2.010% | 10/12/18 | 500,000 | 500,000 |
31
| | | | |
| Federal Money Market Fund | | | | |
| |
| |
| |
| | | | Face | Market |
| | | Maturity | Amount | Value • |
| | Yield1 | Date | ($000) | ($000) |
| Bank of Nova Scotia | | | | |
| (Dated 8/31/18, Repurchase Value | | | | |
| $1,300,282,000, collateralized by | | | | |
| Treasury Inflation Indexed Note/Bond | | | | |
| 0.125%–3.875%, 4/15/19–2/15/45, U.S. | | | | |
| Treasury Bill 0.000%, 9/6/18–4/15/19, | | | | |
| and U.S. Treasury Note/Bond | | | | |
| 0.750%–3.750%, 9/30/18–8/15/48, | | | | |
| with a value of $1,326,000,000) | 1.950% | 9/4/18 | 1,300,000 | 1,300,000 |
| Canadian Imperial Bank of Commerce | | | | |
| (Dated 8/28/18, Repurchase Value | | | | |
| $200,076,000, collateralized by | | | | |
| Treasury Inflation Indexed Note/Bond | | | | |
| 0.125%, 4/15/19, and U.S. Treasury | | | | |
| Note/Bond 1.625%–4.375%, | | | | |
| 1/31/22–11/15/46, with a value of | | | | |
| $204,000,000) | 1.950% | 9/4/18 | 200,000 | 200,000 |
| Canadian Imperial Bank of Commerce | | | | |
| (Dated 8/31/18, Repurchase Value | | | | |
| $2,050,446,000, collateralized by | | | | |
| Treasury Inflation Indexed Note/Bond | | | | |
| 0.125%–1.750%, 4/15/20–1/15/28, | | | | |
| and U.S. Treasury Note/Bond | | | | |
| 1.375%–3.625%, 4/30/20–11/15/46, | | | | |
| with a value of $2,091,000,000) | 1.960% | 9/4/18 | 2,050,000 | 2,050,000 |
| Canadian Imperial Bank of Commerce | | | | |
| (Dated 8/30/18, Repurchase Value | | | | |
| $1,000,381,000, collateralized by | | | | |
| Treasury Inflation Indexed Note/Bond | | | | |
| 0.125%, 4/15/20, and U.S. Treasury | | | | |
| Note/Bond 1.375%–4.375%, | | | | |
| 10/31/19–5/15/47, with a value of | | | | |
| $1,020,000,000) | 1.960% | 9/6/18 | 1,000,000 | 1,000,000 |
| Credit Agricole Corporate & Investment | | | | |
| Bank NY Branch (Dated 8/28/18, | | | | |
| Repurchase Value $1,000,379,000, | | | | |
| collateralized by Treasury Inflation | | | | |
| Indexed Note/Bond 0.125%–1.750%, | | | | |
| 1/15/23–1/15/28, U. S. Treasury Bill | | | | |
| 0.000%, 9/20/18–2/7/19, and U.S. | | | | |
| Treasury Note/Bond 1.375%–3.125%, | | | | |
| 9/30/20–5/15/46, with a value of | | | | |
| $1,020,000,000) | 1.950% | 9/4/18 | 1,000,000 | 1,000,000 |
| Credit Agricole Corporate & Investment | | | | |
| Bank NY Branch (Dated 8/31/18, | | | | |
| Repurchase Value $1,000,218,000, | | | | |
| collateralized by U. S. Treasury Note/Bond | | | | |
| 2.000%–2.625%, 11/15/20–2/15/25, | | | | |
| with a value of $1,020,000,000) | 1.960% | 9/4/18 | 1,000,000 | 1,000,000 |
32
| | | | |
| Federal Money Market Fund | | | | |
| |
| |
| |
| | | | Face | Market |
| | | Maturity | Amount | Value • |
| | Yield1 | Date | ($000) | ($000) |
| Credit Agricole Corporate & Investment | | | | |
| Bank NY Branch (Dated 8/30/18, | | | | |
| Repurchase Value $1,000,381,000, | | | | |
| collateralized by Treasury Inflation Indexed | | | | |
| Note/Bond 0.125%, 1/15/22, U.S. Treasury | | | | |
| Bill 0.000%, 10/25/18–1/31/19, and U.S. | | | | |
| Treasury Note/Bond 0.750%– 6.250%, | | | | |
| 9/30/18–8/15/46, with a value of | | | | |
| $1,020,000,000) | 1.960% | 9/6/18 | 1,000,000 | 1,000,000 |
| Credit Agricole Corporate & Investment | | | | |
| Bank NY Branch (Dated 8/31/18, Repurchase | | | | |
| Value $1,000,379,000, collateralized by | | | | |
| Treasury Inflation Indexed Note/Bond | | | | |
| 0.375%–3.875%, 7/15/23–4/15/29, and | | | | |
| U. S. Treasury Note/Bond 1.125%–3.000%, | | | | |
| 3/31/19–2/15/48, with a value of | | | | |
| $1,020,000,000) | 1.950% | 9/7/18 | 1,000,000 | 1,000,000 |
| JP Morgan Securities LLC | | | | |
| (Dated 8/31/18, Repurchase Value | | | | |
| $550,119,000, collateralized by U. S. | | | | |
| Treasury Note/Bond 0.875%–2.625%, | | | | |
| 1/31/19–3/31/25, with a value of | | | | |
| $561,000,000) | 1.950% | 9/4/18 | 550,000 | 550,000 |
| Mizuho Securities (USA) Inc. | | | | |
| (Dated 8/31/18, Repurchase Value | | | | |
| $500,109,000, collateralized by U. S. | | | | |
| Treasury Bill 0.000%, 5/23/19–7/18/19, | | | | |
| and U.S. Treasury Note/Bond | | | | |
| 1.000%–2.875%, 11/30/19–11/15/46, | | | | |
| with a value of $510,000,000) | 1.960% | 9/4/18 | 500,000 | 500,000 |
| RBC Dominion Securities Inc. | | | | |
| (Dated 8/20/18, Repurchase Value | | | | |
| $100,080,000, collateralized by | | | | |
| Treasury Inflation Indexed Note/Bond | | | | |
| 0.125%–1.375%, 4/15/19–2/15/44, | | | | |
| and U.S. Treasury Note/Bond | | | | |
| 1.000%–5.500%, 7/31/19–2/15/46, | | | | |
| with a value of $102,000,000) | 1.920% | 9/4/18 | 100,000 | 100,000 |
| RBC Capital Markets LLC | | | | |
| (Dated 8/27/18, Repurchase Value | | | | |
| $750,325,000, collateralized by | | | | |
| Treasury Inflation Indexed Note/Bond | | | | |
| 0.125%–2.375%, 4/15/20–1/15/25, | | | | |
| and U.S. Treasury Note/Bond | | | | |
| 1.625%–4.375%, 6/15/21–5/15/46, | | | | |
| with a value of $765,000,000) | 1.950% | 9/4/18 | 750,000 | 750,000 |
| RBC Capital Markets LLC | | | | |
| (Dated 8/28/18, Repurchase Value | | | | |
| $1,350,585,000, collateralized by | | | | |
| Treasury Inflation Indexed Note/Bond | | | | |
| 0.125%–3.875%, 4/15/19–4/15/29, | | | | |
| and U.S. Treasury Note/Bond | | | | |
| 1.750%–3.125%, 1/31/22–2/15/48, | | | | |
| with a value of $1,377,000,000) | 1.950% | 9/5/18 | 1,350,000 | 1,350,000 |
33
| | | | |
| Federal Money Market Fund | | | | |
| |
| |
| |
| | | | Face | Market |
| | | Maturity | Amount | Value • |
| | Yield1 | Date | ($000) | ($000) |
| RBC Capital Markets LLC | | | | |
| (Dated 8/31/18, Repurchase Value | | | | |
| $2,450,929,000, collateralized by | | | | |
| Treasury Inflation Indexed Note/Bond | | | | |
| 0.125%–2.375%, 4/15/19–2/15/48, | | | | |
| and U.S. Treasury Note/Bond | | | | |
| 1.000%–4.375%, 8/31/19–8/15/47, | | | | |
| with a value of $2,499,000,000) | 1.950% | 9/7/18 | 2,450,000 | 2,450,000 |
| RBC Dominion Securities Inc. | | | | |
| (Dated 8/31/18, Repurchase Value | | | | |
| $350,133,000, collateralized by | | | | |
| Treasury Inflation Indexed Note/Bond | | | | |
| 0.125%–1.000%, 4/15/19–2/15/48, | | | | |
| and U.S. Treasury Note/Bond | | | | |
| 0.875%–5.500%, 7/31/19–2/15/47, | | | | |
| with a value of $357,000,000) | 1.950% | 9/7/18 | 350,000 | 350,000 |
| TD Securities (USA) LLC | | | | |
| (Dated 8/28/18, Repurchase Value | | | | |
| $100,038,000, collateralized by U. S. | | | | |
| Treasury Note/Bond 1.250%–2.125%, | | | | |
| 4/30/19– 6/30/22, with a value of | | | | |
| $102,000,000) | 1.950% | 9/4/18 | 100,000 | 100,000 |
| TD Securities (USA) LLC | | | | |
| (Dated 8/28/18, Repurchase Value | | | | |
| $275,105,000, collateralized by Federal | | | | |
| National Mortgage Assn. 7.125%, | | | | |
| 1/15/30, and U.S. Treasury Note/Bond | | | | |
| 1.500%–3.625%, 10/31/19–2/15/28, | | | | |
| with a value of $280,745,000) | 1.960% | 9/4/18 | 275,000 | 275,000 |
| TD Securities (USA) LLC | | | | |
| (Dated 8/30/18, Repurchase Value | | | | |
| $200,076,000, collateralized by U. S. | | | | |
| Treasury Note/Bond 1.625%–2.875%, | | | | |
| 6/30/19–8/15/28, with a value of | | | | |
| $204,000,000) | 1.960% | 9/6/18 | 200,000 | 200,000 |
| Total Repurchase Agreements (Cost $16,425,000) | | | 16,425,000 |
| Total Investments (99.9%) (Cost $100,164,764) | | | | 100,164,764 |
34
| |
| Federal Money Market Fund | |
| |
| |
| |
| |
| | Amount |
| | ($000) |
| Other Assets and Liabilities (0.1%) | |
| Other Assets | |
| Investment in Vanguard | 5,054 |
| Receivables for Accrued Income | 18,822 |
| Receivables for Capital Shares Issued | 222,486 |
| Other Assets | 25,657 |
| Total Other Assets | 272,019 |
| Liabilities | |
| Payables for Investment Securities Purchased | (24,576) |
| Payables for Capital Shares Redeemed | (117,655) |
| Payables for Distributions | (2,342) |
| Payables to Vanguard | (5,402) |
| Total Liabilities | (149,975) |
| Net Assets (100%) | |
| Applicable to 100,289,016,434 outstanding $.001 par value shares of | |
| beneficial interest (unlimited authorization) | 100,286,808 |
| Net Asset Value Per Share | $1.00 |
| |
| |
| At August 31, 2018, net assets consisted of: | |
| | Amount |
| | ($000) |
| Paid-in Capital | 100,289,525 |
| Undistributed Net Investment Income | 1 |
| Accumulated Net Realized Losses | (2,718) |
| Net Assets | 100,286,808 |
• See Note A in Notes to Financial Statements.
1 Represents annualized yield at date of purchase for discount securities, and coupon for coupon-bearing securities.
2 The issuer was placed under federal conservatorship in September 2008; since that time, its daily operations have been managed
by the Federal Housing Finance Agency and it receives capital from the U.S. Treasury, as needed to maintain a positive net worth,
in exchange for senior preferred stock.
3 The issuer operates under a congressional charter; its securities are generally neither guaranteed by the U.S. Treasury nor backed
by the full faith and credit of the U.S. government.
4 Adjustable-rate security based upon 1-month USD LIBOR plus spread.
5 Adjustable-rate security based upon 3-month U.S. Treasury Bill Auction High Money Market Yield plus spread.
6 Adjustable-rate security based upon 3-month USD LIBOR plus spread.
See accompanying Notes, which are an integral part of the Financial Statements.
35
| |
| Federal Money Market Fund | |
| |
| |
| Statement of Operations | |
| |
| | Year Ended |
| | August 31, 2018 |
| | ($000) |
| Investment Income | |
| Income | |
| Interest | 1,379,957 |
| Total Income | 1,379,957 |
| Expenses | |
| The Vanguard Group—Note B | |
| Investment Advisory Services | 2,759 |
| Management and Administrative | 73,952 |
| Marketing and Distribution | 19,447 |
| Custodian Fees | 754 |
| Auditing Fees | 33 |
| Shareholders’ Reports and Proxy | 1,466 |
| Trustees’ Fees and Expenses | 109 |
| Total Expenses | 98,520 |
| Net Investment Income | 1,281,437 |
| Realized Net Gain (Loss) on Investment Securities Sold | (2,178) |
| Net Increase (Decrease) in Net Assets Resulting from Operations | 1,279,259 |
See accompanying Notes, which are an integral part of the Financial Statements.
36
| | |
| Federal Money Market Fund | | |
| |
| |
| Statement of Changes in Net Assets | | |
| |
| | Year Ended August 31, |
| | 2018 | 2017 |
| | ($000) | ($000) |
| Increase (Decrease) in Net Assets | | |
| Operations | | |
| Net Investment Income | 1,281,437 | 402,841 |
| Realized Net Gain (Loss) | (2,178) | (596) |
| Net Increase (Decrease) in Net Assets Resulting from Operations | 1,279,259 | 402,245 |
| Distributions | | |
| Net Investment Income | (1,281,485) | (402,787) |
| Realized Capital Gain | — | — |
| Total Distributions | (1,281,485) | (402,787) |
| Capital Share Transactions (at $1.00 per share) | | |
| Issued | 80,892,899 | 88,362,924 |
| Issued in Lieu of Cash Distributions | 1,259,244 | 395,681 |
| Redeemed | (61,314,694) | (48,110,472) |
| Net Increase (Decrease) from Capital Share Transactions | 20,837,449 | 40,648,133 |
| Total Increase (Decrease) | 20,835,223 | 40,647,591 |
| Net Assets | | |
| Beginning of Period | 79,451,585 | 38,803,994 |
| End of Period1 | 100,286,808 | 79,451,585 |
| 1 Net Assets—End of Period includes undistributed (overdistributed) net investment income of $1,000 and $49,000. | |
See accompanying Notes, which are an integral part of the Financial Statements.
37
| | | | | |
| Federal Money Market Fund | | | | | |
| |
| |
| Financial Highlights | | | | | |
| |
| |
| For a Share Outstanding | | | Year Ended August 31, |
| Throughout Each Period | 2018 | 2017 | 2016 | 2015 | 2014 |
| Net Asset Value, Beginning of Period | $1.00 | $1.00 | $1.00 | $1.00 | $1.00 |
| Investment Operations | | | | | |
| Net Investment Income | . 0141 | .0061 | .0022 | .0001 | .0001 |
| Net Realized and Unrealized Gain (Loss) | | | | | |
| on Investments | — | — | — | — | — |
| Total from Investment Operations | .014 | .006 | .0022 | .0001 | .0001 |
| Distributions | | | | | |
| Dividends from Net Investment Income | (.014) | (.006) | (.0022) | (.0001) | (.0001) |
| Distributions from Realized Capital Gains | — | — | — | — | (.0000)2 |
| Total Distributions | (.014) | (.006) | (.0022) | (.0001) | (.0001) |
| Net Asset Value, End of Period | $1.00 | $1.00 | $1.00 | $1.00 | $1.00 |
| |
| Total Return 3 | 1.42% | 0.57% | 0.23% | 0.01% | 0.02% |
| |
| Ratios/Supplemental Data | | | | | |
| Net Assets, End of Period (Millions) | $100,287 | $79,452 | $38,804 | $3,325 | $3,108 |
| Ratio of Total Expenses to Average Net Assets4 | 0.11% | 0.11% | 0.11% | 0.10% | 0.09% |
| Ratio of Net Investment Income to | | | | | |
| Average Net Assets | 1.43% | 0.60% | 0.27% | 0.01% | 0.01% |
1 Calculated based on average shares outstanding.
2 Distribution was less than $.0001 per share.
3 Total returns do not include account service fees that may have applied in the periods shown. Fund prospectuses provide information
about any applicable account service fees.
4 Vanguard and the board of trustees have agreed to temporarily limit certain net operating expenses in excess of the fund’s daily yield
in order to maintain a zero or positive yield for the fund. Vanguard and the board of trustees may terminate the temporary expense
limitation at any time. The fund is not obligated to repay this amount to Vanguard. The ratio of total expenses to average net assets
before an expense reduction was 0.11% for 2016, 0.11% for 2015, and 0.11% for 2014. For the years ended August 31, 2018 and 2017,
there were no expense reductions.
See accompanying Notes, which are an integral part of the Financial Statements.
38
Federal Money Market Fund
Notes to Financial Statements
Vanguard Federal Money Market Fund is registered under the Investment Company Act of 1940 as an open-end investment company, or mutual fund. The fund invests in short-term debt instruments issued by the U.S. government or its agencies and instrumentalities, and repurchase agreements collateralized by such instruments.
A. The following significant accounting policies conform to generally accepted accounting principles for U.S. investment companies. The fund consistently follows such policies in preparing its financial statements.
1. Security Valuation: Securities are valued as of the close of trading on the New York Stock Exchange (generally 4 p.m., Eastern time) on the valuation date. Securities are valued at amortized cost, which approximates market value.
2. Repurchase Agreements: The fund enters into repurchase agreements with institutional counter-parties. Securities pledged as collateral to the fund under repurchase agreements are held by a custodian bank until the agreements mature, and in the absence of a default, such collateral cannot be repledged, resold, or rehypothecated. Each agreement requires that the market value of the collateral be sufficient to cover payments of interest and principal. The fund further mitigates its counterparty risk by entering into repurchase agreements only with a diverse group of prequalified counterparties, monitoring their financial strength, and entering into master repurchase agreements with its counterparties. The master repurchase agreements provide that, in the event of a counter-party’s default (including bankruptcy), the fund may terminate any repurchase agreements with that counterparty, determine the net amount owed, and sell or retain the collateral up to the net amount owed to the fund. Such action may be subject to legal proceedings, which may delay or limit the disposition of collateral.
3. Federal Income Taxes: The fund intends to continue to qualify as a regulated investment company and distribute all of its taxable income. Management has analyzed the fund’s tax positions taken for all open federal income tax years (August 31, 2015–2018), and has concluded that no provision for federal income tax is required in the fund’s financial statements.
4. Distributions: Distributions from net investment income are declared daily and paid on the first business day of the following month. Annual distributions from realized capital gains, if any, are recorded on the ex-dividend date. Distributions are determined on a tax basis and may differ from net investment income and realized capital gains for financial reporting purposes.
5. Credit Facility: The fund and certain other funds managed by The Vanguard Group (“Vanguard”) participate in a $3.1 billion committed credit facility provided by a syndicate of lenders pursuant to a credit agreement that may be renewed annually; each fund is individually liable for its borrowings, if any, under the credit facility. Borrowings may be utilized for temporary and emergency purposes, and are subject to the fund’s regulatory and contractual borrowing restrictions. The participating funds are charged administrative fees and an annual commitment fee of 0.10% of the undrawn amount of the facility; these fees are allocated to the funds based on a method approved by the fund’s board of trustees and included in Management and Administrative expenses on the fund’s
39
Federal Money Market Fund
Statement of Operations. Any borrowings under this facility bear interest at a rate based upon the higher of the one-month London Interbank Offered Rate, federal funds effective rate, or overnight bank funding rate plus an agreed-upon spread.
The fund had no borrowings outstanding at August 31, 2018, or at any time during the period then ended.
6. Other: Interest income is accrued daily. Premiums and discounts on debt securities purchased are amortized and accreted, respectively, to interest income over the lives of the respective securities. Security transactions are accounted for on the date securities are bought or sold. Costs used to determine realized gains (losses) on the sale of investment securities are those of the specific securities sold.
B. In accordance with the terms of a Funds’ Service Agreement (the “FSA”) between Vanguard and the fund, Vanguard furnishes to the fund investment advisory, corporate management, administrative, marketing, and distribution services at Vanguard’s cost of operations (as defined by the FSA). These costs of operations are allocated to the fund based on methods and guidelines approved by the board of trustees. Vanguard does not require reimbursement in the current period for certain costs of operations (such as deferred compensation/benefits and risk/insurance costs); the fund’s liability for these costs of operations is included in Payables to Vanguard on the Statement of Net Assets. All other costs of operations payable to Vanguard are generally settled twice a month.
Upon the request of Vanguard, the fund may invest up to 0.40% of its net assets as capital in Vanguard. At August 31, 2018, the fund had contributed to Vanguard capital in the amount of $5,054,000, representing 0.01% of the fund’s net assets and 2.02% of Vanguard’s capitalization. The fund’s trustees and officers are also directors and employees, respectively, of Vanguard.
C. Various inputs may be used to determine the value of the fund’s investments. These inputs are summarized in three broad levels for financial statement purposes. The inputs or methodologies used to value securities are not necessarily an indication of the risk associated with investing in those securities.
Level 1—Quoted prices in active markets for identical securities.
Level 2—Other significant observable inputs (including quoted prices for similar securities, interest rates, prepayment speeds, credit risk, etc.).
Level 3—Significant unobservable inputs (including the fund’s own assumptions used to determine the fair value of investments). Any investments valued with significant unobservable inputs are noted on the Statement of Net Assets.
At August 31, 2018, 100% of the market value of the fund’s investments was determined using amortized cost, in accordance with rules under the Investment Company Act of 1940. Amortized cost approximates the current fair value of a security, but since the value is not obtained from a quoted price in an active market, securities valued at amortized cost are considered to be valued using Level 2 inputs.
40
Federal Money Market Fund
D. Permanent differences, if any, are reclassified among capital accounts in the financial statements to reflect their tax character. These reclassifications have no effect on net assets or net asset value per share.
Temporary differences between book-basis and tax-basis components of accumulated net earnings (losses) arise when certain items of income, gain, or loss are recognized in different periods for financial statement and tax purposes; these differences will reverse at some time in the future.
As of period end, the tax components of accumulated net earnings (losses) are detailed in the table asfollows:
| |
| | Amount |
| | ($000) |
| Undistributed ordinary income | 2,400 |
| Undistributed long-term gains | — |
| Capital loss carryforwards (non-expiring) | (2,775) |
| Net unrealized gains (losses) | — |
As of August 31, 2018, gross unrealized appreciation and depreciation for investments and derivatives based on cost for U.S. federal income tax purposes were as follows:
| |
| | Amount |
| | ($000) |
| Tax cost | 100,164,764 |
| Gross unrealized appreciation | — |
| Gross unrealized depreciation | — |
| Net unrealized appreciation (depreciation) | — |
E. Management has determined that no events or transactions occurred subsequent to August 31, 2018, that would require recognition or disclosure in these financial statements.
41
Treasury Money Market Fund
Fund Profile
As of August 31, 2018
| |
| Financial Attributes | |
| Ticker Symbol | VUSXX |
| Expense Ratio1 | 0.09% |
| 7-Day SEC Yield | 1.95% |
| Average Weighted | |
| Maturity | 56 days |
| |
| Sector Diversification (% of portfolio) | |
| U.S. Treasury Bills | 100.0% |
The agency and mortgage-backed securities sectors may include
issues from government-sponsored enterprises; such issues are
generally not backed by the full faith and credit of the U.S.
government.
1 The expense ratio shown is from the prospectus dated December 22, 2017, and represents estimated costs for the current fiscal year. For the fiscal year ended August 31, 2018, the expense ratio was 0.09%.
42
Treasury Money Market Fund
Performance Summary
Investment returns will fluctuate. All of the returns in this report represent past performance, which is not a guarantee of future results that may be achieved by the fund. (Current performance may be lower or higher than the performance data cited. For performance data current to the most recent month-end, visit our website at vanguard.com/performance.) The returns shown do not reflect taxes that a shareholder would pay on fund distributions. You could lose money by investing in the fund. Although the fund seeks to preserve the value of your investment at $1 per share, it cannot guarantee it will do so. An investment in the fund is not insured or guaranteed by the Federal Deposit Insurance Corporation or any other government agency. The fund’s sponsor has no legal obligation to provide financial support to the fund, and you should not expect that the sponsor will provide financial support to the fund at any time. The fund’s 7-day SEC yield reflects its current earnings more closely than do the average annual returns.
Cumulative Performance: August 31, 2008, Through August 31, 2018
Initial Investment of $50,000
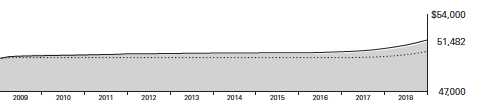
| | | | |
| | Average Annual Total Returns | |
| | Periods Ended August 31, 2018 | |
| |
| | | | | Final Value |
| | One | Five | Ten | of a $50,000 |
| | Year | Years | Years | Investment |
| |
| Treasury Money Market Fund | 1.43% | 0.43% | 0.29% | $51,482 |
| iMoneyNet Money Fund Report’s | | | | |
| • • • • • • •• 100% Treasury Funds Average | 0.92 | 0.22 | 0.13 | 50,644 |
| FTSE Three-Month U.S. Treasury Bill | | | | |
| Index | 1.49 | 0.44 | 0.31 | 51,670 |
| iMoneyNet Money Fund Report’s 100% Treasury Funds Average: Derived from data provided by iMoneyNet, Inc. | |
See Financial Highlights for dividend information.
43
Treasury Money Market Fund
| | |
| Fiscal-Year Total Returns (%): August 31, 2008, Through August 31, 2018 | |
| | | iMoneyNet |
| | | Average |
| Fiscal Year | Total Returns | Total Returns |
| 2009 | 0.70% | 0.17% |
| 2010 | 0.03 | 0.00 |
| 2011 | 0.02 | 0.00 |
| 2012 | 0.01 | 0.00 |
| 2013 | 0.02 | 0.00 |
| 2014 | 0.01 | 0.00 |
| 2015 | 0.01 | 0.00 |
| 2016 | 0.17 | 0.00 |
| 2017 | 0.54 | 0.19 |
| 2018 | 1.43 | 0.92 |
| 7-day SEC yield (8/31/2018): 1.95% | | |
| iMoneyNet Money Fund Report’s 100% Treasury Funds Average: Derived from data provided by iMoneyNet, Inc. | |
Average Annual Total Returns: Periods Ended June 30, 2018
This table presents returns through the latest calendar quarter—rather than through the end of the fiscal period.
Securities and Exchange Commission rules require that we provide this information.
| | | | |
| | Inception | One | Five | Ten |
| | Date | Year | Years | Years |
| Treasury Money Market Fund | 12/14/1992 | 1.26% | 0.37% | 0.29% |
44
Treasury Money Market Fund
Financial Statements
Statement of Net Assets
As of August 31, 2018
The fund reports a complete list of its holdings in various monthly and quarterly regulatory filings. The fund publishes its holdings on a monthly basis at vanguard.com and files them with the Securities and Exchange Commission on Form N-MFP. The fund’s Form N-MFP filings may be viewed at sec.gov or via a link on the “Portfolio Holdings” page on vanguard.com. For the second and fourth fiscal quarters, the lists appear in the fund’s semiannual and annual reports to shareholders. For the first and third fiscal quarters, the fund files the lists with the SEC on Form N-Q. Shareholders can look up the fund’s Forms N-Q on the SEC’s website at sec.gov. Forms N-Q may also be reviewed and copied at the SEC’s Public Reference Room (see the back cover of this report for further information).
| | | | | | |
| | | | | | Face | Market |
| | | | | Maturity | Amount | Value • |
| | | | Yield1 | Date | ($000) | ($000) |
| U. S. Government and Agency Obligations (99.7%) | | | |
| | United States Treasury Bill | 1.905%–1.922% | 9/6/18 | 1,587,232 | 1,586,811 |
| | United States Treasury Bill | 1.865%–1.906% | 9/13/18 | 49,172 | 49,141 |
| | United States Treasury Bill | 1.904%–1.929% | 9/20/18 | 1,196,787 | 1,195,579 |
| | United States Treasury Bill | 1.909%–1.933% | 9/27/18 | 1,494,883 | 1,492,822 |
| | United States Treasury Bill | 1.950%–1.963% | 10/4/18 | 1,137,858 | 1,135,834 |
| | United States Treasury Bill | 1.944%–1.955% | 10/11/18 | 887,371 | 885,453 |
| | United States Treasury Bill | 1.971%–1.990% | 10/18/18 | 1,078,000 | 1,075,225 |
| | United States Treasury Bill | | 1.980% | 10/25/18 | 1,262,000 | 1,258,271 |
| | United States Treasury Bill | | 2.010% | 11/1/18 | 900,000 | 896,950 |
| | United States Treasury Bill | 2.020%–2.027% | 11/8/18 | 2,096,673 | 2,088,724 |
| | United States Treasury Bill | 2.031%–2.042% | 11/15/18 | 1,293,963 | 1,288,495 |
| | United States Treasury Bill | 2.046%–2.047% | 11/23/18 | 1,476,117 | 1,469,191 |
| | United States Treasury Bill | 2.091%–2.092% | 11/29/18 | 1,277,000 | 1,270,432 |
| | United States Treasury Bill | | 2.097% | 12/13/18 | 433,000 | 430,429 |
| | United States Treasury Bill | | 2.163% | 1/17/19 | 300,000 | 297,539 |
| | United States Treasury Bill | 2.180%–2.184% | 1/31/19 | 500,523 | 495,960 |
| | United States Treasury Bill | | 2.204% | 2/7/19 | 300,000 | 297,112 |
| | United States Treasury Bill | | 2.204% | 2/14/19 | 250,000 | 247,487 |
| 2 | United States Treasury Floating Rate Note | 2.261% | 10/31/18 | 899,825 | 899,826 |
| 2 | United States Treasury Floating Rate Note | 2.091% | 1/31/20 | 500,000 | 500,000 |
| Total U.S. Government and Agency Obligations (Cost $18,861,281) | | 18,861,281 |
| Total Investments (99.7%) (Cost $18,861,281) | | | | 18,861,281 |
45
| |
| Treasury Money Market Fund | |
| |
| |
| |
| |
| | Amount |
| | ($000) |
| Other Assets and Liabilities (0.3%) | |
| Other Assets | |
| Investment in Vanguard | 926 |
| Receivables for Accrued Income | 2,669 |
| Receivables for Capital Shares Issued | 93,712 |
| Other Assets | 3,992 |
| Total Other Assets | 101,299 |
| Liabilities | |
| Payables for Capital Shares Redeemed | (48,881) |
| Payables for Distributions | (1,574) |
| Payables to Vanguard | (829) |
| Total Liabilities | (51,284) |
| Net Assets (100%) | |
| Applicable to 18,909,167,407 outstanding $.001 par value shares of | |
| beneficial interest (unlimited authorization) | 18,911,296 |
| Net Asset Value Per Share | $1.00 |
| |
| |
| At August 31, 2018, net assets consisted of: | |
| | Amount |
| | ($000) |
| Paid-in Capital | 18,912,207 |
| Undistributed Net Investment Income | 1 |
| Accumulated Net Realized Losses | (912) |
| Net Assets | 18,911,296 |
• See Note A in Notes to Financial Statements.
1 Represents annualized yield at date of purchase for discount securities, and coupon for coupon-bearing securities.
2 Adjustable-rate security based upon 3-month U.S. Treasury Bill Auction High Money Market Yield plus spread.
See accompanying Notes, which are an integral part of the Financial Statements.
46
| |
| Treasury Money Market Fund | |
| |
| |
| Statement of Operations | |
| |
| | Year Ended |
| | August 31, 2018 |
| | ($000) |
| Investment Income | |
| Income | |
| Interest | 252,217 |
| Total Income | 252,217 |
| Expenses | |
| The Vanguard Group—Note B | |
| Investment Advisory Services | 510 |
| Management and Administrative | 10,467 |
| Marketing and Distribution | 3,574 |
| Custodian Fees | 162 |
| Auditing Fees | 29 |
| Shareholders’ Reports and Proxy | 134 |
| Trustees’ Fees and Expenses | 11 |
| Total Expenses | 14,887 |
| Net Investment Income | 237,330 |
| Realized Net Gain (Loss) on Investment Securities Sold | (480) |
| Net Increase (Decrease) in Net Assets Resulting from Operations | 236,850 |
See accompanying Notes, which are an integral part of the Financial Statements.
47
| | |
| Treasury Money Market Fund | | |
| |
| |
| Statement of Changes in Net Assets | | |
| |
| | Year Ended August 31, |
| | 2018 | 2017 |
| | ($000) | ($000) |
| Increase (Decrease) in Net Assets | | |
| Operations | | |
| Net Investment Income | 237,330 | 80,882 |
| Realized Net Gain (Loss) | (480) | (407) |
| Net Increase (Decrease) in Net Assets Resulting from Operations | 236,850 | 80,475 |
| Distributions | | |
| Net Investment Income | (237,338) | (80,873) |
| Realized Capital Gain | — | — |
| Total Distributions | (237,338) | (80,873) |
| Capital Share Transactions (at $1.00 per share) | | |
| Issued | 11,971,071 | 9,585,836 |
| Issued in Lieu of Cash Distributions | 227,052 | 78,567 |
| Redeemed | (8,925,092) | (6,828,339) |
| Net Increase (Decrease) from Capital Share Transactions | 3,273,031 | 2,836,064 |
| Total Increase (Decrease) | 3,272,543 | 2,835,666 |
| Net Assets | | |
| Beginning of Period | 15,638,753 | 12,803,087 |
| End of Period1 | 18,911,296 | 15,638,753 |
| 1 Net Assets—End of Period includes undistributed (overdistributed) net investment income of $1,000 and $9,000. |
See accompanying Notes, which are an integral part of the Financial Statements.
48
| | | | | |
| Treasury Money Market Fund | | | | | |
| |
| |
| Financial Highlights | | | | | |
| |
| |
| For a Share Outstanding | | | Year Ended August 31, |
| Throughout Each Period | 2018 | 2017 | 2016 | 2015 | 2014 |
| Net Asset Value, Beginning of Period | $1.00 | $1.00 | $1.00 | $1.00 | $1.00 |
| Investment Operations | | | | | |
| Net Investment Income | . 0141 | .0051 | .0017 | .0001 | .0001 |
| Net Realized and Unrealized Gain (Loss) | | | | | |
| on Investments | — | — | — | — | — |
| Total from Investment Operations | .014 | .005 | .0017 | .0001 | .0001 |
| Distributions | | | | | |
| Dividends from Net Investment Income | (.014) | (.005) | (.0017) | (.0001) | (.0001) |
| Distributions from Realized Capital Gains | — | — | — | — | (.0000)2 |
| Total Distributions | (.014) | (.005) | (.0017) | (.0001) | (.0001) |
| Net Asset Value, End of Period | $1.00 | $1.00 | $1.00 | $1.00 | $1.00 |
| |
| Total Return 3 | 1.43% | 0.54% | 0.17% | 0.01% | 0.01% |
| |
| Ratios/Supplemental Data | | | | | |
| Net Assets, End of Period (Millions) | $18,911 | $15,639 | $12,803 | $9,388 | $10,365 |
| Ratio of Total Expenses to Average Net Assets4 | 0.09% | 0.09% | 0.09% | 0.04% | 0.05% |
| Ratio of Net Investment Income to | | | | | |
| Average Net Assets | 1.43% | 0.55% | 0.18% | 0.01% | 0.01% |
1 Calculated based on average shares outstanding.
2 Distribution was less than $.0001 per share.
3 Total returns do not include account service fees that may have applied in the periods shown. Fund prospectuses provide information
about any applicable account service fees.
4 Vanguard and the board of trustees have agreed to temporarily limit certain net operating expenses in excess of the fund’s daily yield
in order to maintain a zero or positive yield for the fund. Vanguard and the board of trustees may terminate the temporary expense
limitation at any time. The fund is not obligated to repay this amount to Vanguard. The ratio of total expenses to average net assets
before an expense reduction was 0.09% for 2016, 0.09% for 2015, and 0.09% for 2014. For the years ended August 31, 2018 and 2017,
there were no expense reductions.
See accompanying Notes, which are an integral part of the Financial Statements.
49
Treasury Money Market Fund
Notes to Financial Statements
Vanguard Treasury Money Market Fund is registered under the Investment Company Act of 1940 as an open-end investment company, or mutual fund. The fund invests in short-term debt instruments backed by the full faith and credit of the U.S. government.
A. The following significant accounting policies conform to generally accepted accounting principles for U.S. investment companies. The fund consistently follows such policies in preparing its financial statements.
1. Security Valuation: Securities are valued as of the close of trading on the New York Stock Exchange (generally 4 p.m., Eastern time) on the valuation date. Securities are valued at amortized cost, which approximates market value.
2. Federal Income Taxes: The fund intends to continue to qualify as a regulated investment company and distribute all of its taxable income. Management has analyzed the fund’s tax positions taken for all open federal income tax years (August 31, 2015–2018), and has concluded that no provision for federal income tax is required in the fund’s financial statements.
3. Distributions: Distributions from net investment income are declared daily and paid on the first business day of the following month. Annual distributions from realized capital gains, if any, are recorded on the ex-dividend date. Distributions are determined on a tax basis and may differ from net investment income and realized capital gains for financial reporting purposes.
4. Credit Facility: The fund and certain other funds managed by The Vanguard Group (“Vanguard”) participate in a $3.1 billion committed credit facility provided by a syndicate of lenders pursuant to a credit agreement that may be renewed annually; each fund is individually liable for its borrowings, if any, under the credit facility. Borrowings may be utilized for temporary and emergency purposes, and are subject to the fund’s regulatory and contractual borrowing restrictions. The participating funds are charged administrative fees and an annual commitment fee of 0.10% of the undrawn amount of the facility; these fees are allocated to the funds based on a method approved by the fund’s board of trustees and included in Management and Administrative expenses on the fund’s Statement of Operations. Any borrowings under this facility bear interest at a rate based upon the higher of the one-month London Interbank Offered Rate, federal funds effective rate, or overnight bank funding rate plus an agreed-upon spread.
The fund had no borrowings outstanding at August 31, 2018, or at any time during the period then ended.
5. Other: Interest income is accrued daily. Premiums and discounts on debt securities purchased are amortized and accreted, respectively, to interest income over the lives of the respective securities. Security transactions are accounted for on the date securities are bought or sold. Costs used to determine realized gains (losses) on the sale of investment securities are those of the specific securities sold.
B. In accordance with the terms of a Funds’ Service Agreement (the “FSA”) between Vanguard and the fund, Vanguard furnishes to the fund investment advisory, corporate management, administrative, marketing, and distribution services at Vanguard’s cost of operations (as defined by the FSA). These costs of operations are allocated to the fund based on methods and guidelines approved by the board of trustees. Vanguard does not require reimbursement in the current period for certain costs of operations (such as deferred compensation/benefits and risk/insurance costs);
50
Treasury Money Market Fund
the fund’s liability for these costs of operations is included in Payables to Vanguard on the Statement of Net Assets. All other costs of operations payable to Vanguard are generally settled twice a month.
Upon the request of Vanguard, the fund may invest up to 0.40% of its net assets as capital in Vanguard. At August 31, 2018, the fund had contributed to Vanguard capital in the amount of $926,000, representing 0.00% of the fund’s net assets and 0.37% of Vanguard’s capitalization. The fund’s trustees and officers are also directors and employees, respectively, of Vanguard.
C. Various inputs may be used to determine the value of the fund’s investments. These inputs are summarized in three broad levels for financial statement purposes. The inputs or methodologies used to value securities are not necessarily an indication of the risk associated with investing in those securities.
Level 1—Quoted prices in active markets for identical securities.
Level 2—Other significant observable inputs (including quoted prices for similar securities, interest rates, prepayment speeds, credit risk, etc.).
Level 3—Significant unobservable inputs (including the fund’s own assumptions used to determine the fair value of investments). Any investments valued with significant unobservable inputs are noted on the Statement of Net Assets.
At August 31, 2018, 100% of the market value of the fund’s investments was determined using amortized cost, in accordance with rules under the Investment Company Act of 1940. Amortized cost approximates the current fair value of a security, but since the value is not obtained from a quoted price in an active market, securities valued at amortized cost are considered to be valued using Level 2 inputs.
D. Permanent differences, if any, are reclassified among capital accounts in the financial statements to reflect their tax character. These reclassifications have no effect on net assets or net asset value per share.
Temporary differences between book-basis and tax-basis components of accumulated net earnings (losses) arise when certain items of income, gain, or loss are recognized in different periods for financial statement and tax purposes; these differences will reverse at some time in the future. As of period end, the tax components of accumulated net earnings (losses) are detailed in the table as follows:
| |
| | Amount |
| | ($000) |
| Undistributed ordinary income | 1,586 |
| Undistributed long-term gains | — |
| Capital loss carryforwards (non-expiring) | (923) |
| Net unrealized gains (losses) | — |
51
Treasury Money Market Fund
As of August 31, 2018, gross unrealized appreciation and depreciation for investments and derivatives based on cost for U.S. federal income tax purposes were as follows:
| |
| | Amount |
| | ($000) |
| Tax cost | 18,861,281 |
| Gross unrealized appreciation | — |
| Gross unrealized depreciation | — |
| Net unrealized appreciation (depreciation) | — |
E. Management has determined that no events or transactions occurred subsequent to August 31, 2018, that would require recognition or disclosure in these financial statements.
52
Report of Independent Registered Public Accounting Firm
To the Boards of Trustees of Vanguard Money Market Reserves and Vanguard Admiral Funds and Shareholders of Vanguard Prime Money Market Fund, Vanguard Federal Money Market Fund and Vanguard Treasury Money Market Fund
Opinions on the Financial Statements
We have audited the accompanying statements of net assets of Vanguard Prime Money Market Fund and Vanguard Federal Money Market Fund (constituting Vanguard Money Market Reserves) and Vanguard Treasury Money Market Fund (one of the funds constituting Vanguard Admiral Funds) (hereafter collectively referred to as the “Funds”) as of August 31, 2018, the related statements of operations for the year ended August 31, 2018, the statements of changes in net assets for each of the two years in the period ended August 31, 2018, including the related notes, and the financial highlights for each of the five years in the period ended August 31, 2018 (collectively referred to as the “financial statements”). In our opinion, the financial statements present fairly, in all material respects, the financial position of each of the Funds as of August 31, 2018, the results of each of their operations for the year then ended, the changes in each of their net assets for each of the two years in the period ended August 31, 2018 and each of the financial highlights for each of the five years in the period ended August 31, 2018 in conformity with accounting principles generally accepted in the United States of America.
Basis for Opinions
These financial statements are the responsibility of the Funds’ management. Our responsibility is to express an opinion on the Funds’ financial statements based on our audits. We are a public accounting firm registered with the Public Company Accounting Oversight Board (United States) (“PCAOB”) and are required to be independent with respect to the Funds in accordance with the U.S. federal securities laws and the applicable rules and regulations of the Securities and Exchange Commission and the PCAOB.
We conducted our audits of these financial statements in accordance with the standards of the PCAOB. Those standards require that we plan and perform the audit to obtain reasonable assurance about whether the financial statements are free of material misstatement, whether due to error or fraud.
Our audits included performing procedures to assess the risks of material misstatement of the financial statements, whether due to error or fraud, and performing procedures that respond to those risks. Such procedures included examining, on a test basis, evidence regarding the amounts and disclosures in the financial statements. Our audits also included evaluating the accounting principles used and significant estimates made by management, as well as evaluating the overall presentation of the financial statements. Our procedures included confirmation of securities owned as of August 31, 2018 by correspondence with the custodian and brokers and by agreement to the underlying ownership records of the transfer agent; when replies were not received from brokers, we performed other auditing procedures. We believe that our audits provide a reasonable basis for our opinions.
/s/PricewaterhouseCoopers LLP
Philadelphia, Pennsylvania
October 16, 2018
We have served as the auditor of one or more investment companies in The Vanguard Group of Funds since 1975.
53
Special 2018 tax information (unaudited) for Vanguard Prime Money Market Fund
This information for the fiscal year ended August 31, 2018, is included pursuant to provisions of the Internal Revenue Code.
For nonresident alien shareholders, 64.2% of income dividends are interest-related dividends.
Special 2018 tax information (unaudited) for Vanguard Federal Money Market Fund
This information for the fiscal year ended August 31, 2018, is included pursuant to provisions of the Internal Revenue Code.
For nonresident alien shareholders, 100% of income dividends are interest-related dividends.
Special 2018 tax information (unaudited) for Vanguard Treasury Money Market Fund
This information for the fiscal year ended August 31, 2018, is included pursuant to provisions of the Internal Revenue Code.
For nonresident alien shareholders, 100% of income dividends are interest-related dividends
54
About Your Fund’s Expenses
As a shareholder of the fund, you incur ongoing costs, which include costs for portfolio management, administrative services, and shareholder reports (like this one), among others. Operating expenses, which are deducted from a fund’s gross income, directly reduce the investment return of the fund.
A fund’s expenses are expressed as a percentage of its average net assets. This figure is known as the expense ratio. The following examples are intended to help you understand the ongoing costs (in dollars) of investing in your fund and to compare these costs with those of other mutual funds. The examples are based on an investment of $1,000 made at the beginning of the period shown and held for the entire period.
The accompanying table illustrates your fund’s costs in two ways:
• Based on actual fund return. This section helps you to estimate the actual expenses that you paid over the period. The ”Ending Account Value“ shown is derived from the fund‘s actual return, and the third column shows the dollar amount that would have been paid by an investor who started with $1,000 in the fund. You may use the information here, together with the amount you invested, to estimate the expenses that you paid over the period.
To do so, simply divide your account value by $1,000 (for example, an $8,600 account value divided by $1,000 = 8.6), then multiply the result by the number given for your fund under the heading ”Expenses Paid During Period.“
• Based on hypothetical 5% yearly return. This section is intended to help you compare your fund‘s costs with those of other mutual funds. It assumes that the fund had a yearly return of 5% before expenses, but that the expense ratio is unchanged. In this case—because the return used is not the fund’s actual return—the results do not apply to your investment. The example is useful in making comparisons because the Securities and Exchange Commission requires all mutual funds to calculate expenses based on a 5% return. You can assess your fund’s costs by comparing this hypothetical example with the hypothetical examples that appear in shareholder reports of other funds.
Note that the expenses shown in the table are meant to highlight and help you compare ongoing costs only and do not reflect transaction costs incurred by the fund for buying and selling securities. Further, the expenses do not include any purchase, redemption, or account service fees described in the fund prospectus. If such fees were applied to your account, your costs would be higher. Your fund does not carry a “sales load.”
The calculations assume no shares were bought or sold during the period. Your actual costs may have been higher or lower, depending on the amount of your investment and the timing of any purchases or redemptions.
You can find more information about the fund’s expenses, including annual expense ratios, in the Financial Statements section of this report. For additional information on operating expenses and other shareholder costs, please refer to your fund’s current prospectus.
55
| | | |
| Six Months Ended August 31, 2018 | | | |
| | Beginning | Ending | Expenses |
| | Account Value | Account Value | Paid During |
| | 2/28/2018 | 8/31/2018 | Period |
| Based on Actual Fund Return | | | |
| Prime Money Market Fund | | | |
| Investor Shares | $1,000.00 | $1,009.59 | $0.81 |
| Admiral Shares | 1,000.00 | 1,009.89 | 0.51 |
| Federal Money Market Fund | $1,000.00 | $1,008.57 | $0.56 |
| Treasury Money Market Fund | $1,000.00 | $1,008.70 | $0.46 |
| Based on Hypothetical 5% Yearly Return | | | |
| Prime Money Market Fund | | | |
| Investor Shares | $1,000.00 | $1,024.40 | $0.82 |
| Admiral Shares | 1,000.00 | 1,024.70 | 0.51 |
| Federal Money Market Fund | $1,000.00 | $1,024.65 | $0.56 |
| Treasury Money Market Fund | $1,000.00 | $1,024.75 | $0.46 |
The calculations are based on expenses incurred in the most recent six-month period. The funds’ annualized six-month expense ratios for the period are: for the Prime Money Market Fund, 0.16% for Investor Shares and 0.10% for Admiral Shares; for the Federal Money Market Fund, 0.11%; and for the Treasury Money Market Fund, 0.09%. The dollar amounts shown as “Expenses Paid” are equal to the annualized expense ratio multiplied by the average account value over the period, multiplied by the number of days in the most recent six-month period, then divided by the number of days in the most recent 12-month period (184/365).
56
Trustees Approve Advisory Arrangements
The board of trustees of Vanguard Prime Money Market Fund, Vanguard Federal Money Market Fund, and Vanguard Treasury Money Market Fund has renewed each fund’s investment advisory arrangement with The Vanguard Group, Inc. (Vanguard), through its Fixed Income Group. The board determined that continuing each fund’s internalized management structure was in the best interests of the fund and its shareholders.
The board based its decision upon an evaluation of the advisor’s investment staff, portfolio management process, and performance. This evaluation included information provided to the board by Vanguard’s Portfolio Review Department, which is responsible for fund and advisor oversight and product management. The Portfolio Review Department met regularly with the advisor and made monthly presentations to the board during the fiscal year that directed the board’s focus to relevant information and topics.
The board, or an investment committee made up of board members, also received information throughout the year through advisor presentations. For each advisor presentation, the board was provided with letters and reports that included information about, among other things, the advisory firm and the advisor’s assessment of the investment environment, portfolio performance, and portfolio characteristics.
In addition, the board received monthly reports, which included a Market and Economic Report, a Fund Dashboard Monthly Summary, and a Fund Performance Report.
Prior to their meeting, the trustees were provided with a memo and materials that summarized the information they had received over the course of the year. They also considered the factors discussed below, among others. However, no single factor determined whether the board approved the arrangements. Rather, it was the totality of the circumstances that drove the board’s decision.
Nature, extent, and quality of services
The board reviewed the quality of each fund’s investment management services over both the short and long term and took into account the organizational depth and stability of the advisor. The board considered that Vanguard has been managing investments for more than four decades. The Fixed Income Group adheres to a sound, disciplined investment management process; the team has considerable experience, stability, and depth.
The board concluded that Vanguard’s experience, stability, depth, and performance, among other factors, warranted continuation of each advisory arrangement.
Investment performance
The board considered the short- and long-term performance of each fund, including any periods of outperformance or underperformance compared with a relevant benchmark index and peer group. The board concluded that the performance was such that each advisory arrangement should continue. Information about each fund’s most recent performance can be found on the Performance Summary pages of this report.
Cost
The board concluded that each fund’s expense ratio was well below the average expense ratio charged by funds in its peer group and that each fund’s advisory expenses were also well below its peer-group average. Information about the funds’ expenses appears in the About Your Fund’s Expenses section of this report as well as in the Financial Statements sections.
57
The board does not conduct a profitability analysis of Vanguard because of Vanguard’s unique “at-cost” structure. Unlike most other mutual fund management companies, Vanguard is owned by the funds it oversees and produces “profits” only in the form of reduced expenses for fund shareholders.
The benefit of economies of scale
The board concluded that each fund’s at-cost arrangement with Vanguard ensures that the funds will realize economies of scale as they grow, with the cost to shareholders declining as fund assets increase.
The board will consider whether to renew the advisory arrangements again after a one-year period.
58
Glossary
SEC Yields. A money market fund’s 7-day SEC yield is calculated by annualizing its income distributions for the previous seven days, as required by the U.S. Securities and Exchange Commission.
Average Weighted Maturity. The average length of time until fixed income securities held by a fund reach maturity and are repaid. The figure reflects the proportion of fund assets represented by each security.
Expense Ratio. A fund’s total annual operating expenses expressed as a percentage of the fund’s average net assets. The expense ratio includes management and administrative expenses, but does not include the transaction costs of buying and selling portfolio securities.
Inception Date. The date on which the assets of a fund (or one of its share classes) are first invested in accordance with the fund’s investment objective. For funds with a subscription period, the inception date is the day after that period ends. Investment performance is measured from the inception date.
59
This page intentionally left blank.
This page intentionally left blank.
This page intentionally left blank.
This page intentionally left blank.
This page intentionally left blank.
This page intentionally left blank.
This page intentionally left blank.
The People Who Govern Your Fund
The trustees of your mutual fund are there to see that the fund is operated and managed in your best interests since, as a shareholder, you are a part owner of the fund. Your fund’s trustees also serve on the board of directors of The Vanguard Group, Inc., which is owned by the Vanguard funds and provides services to them on an at-cost basis.
A majority of Vanguard’s board members are independent, meaning that they have no affiliation with Vanguard or the funds they oversee, apart from the sizable personal investments they have made as private individuals. The independent board members have distinguished backgrounds in business, academia, and public service. Each of the trustees and executive officers oversees 208 Vanguard funds.
Information for each trustee and executive officer of the fund appears below. The mailing address of the trustees and officers is P.O. Box 876, Valley Forge, PA 19482. More information about the trustees is in the Statement of Additional Information, which can be obtained, without charge, by contacting Vanguard at 800-662-7447, or online at vanguard.com.
Interested Trustees1
F. William McNabb III
Born in 1957. Trustee since July 2009. Principal occupation(s) during the past five years and other experience: chairman of the board (January 2010–present) of Vanguard and of each of the investment companies served by Vanguard, trustee (2009–present) of each of the investment companies served by Vanguard, and director (2008–present) of Vanguard. Chief executive officer and president (2008–2017) of Vanguard and each of the investment companies served by Vanguard, managing director (1995–2008) of Vanguard, and director (1997–2018) of Vanguard Marketing Corporation. Director (2018–present) of UnitedHealth Group.
Mortimer J. Buckley
Born in 1969. Trustee since January 2018. Principal occupation(s) during the past five years and other experience: chief executive officer (January 2018–present) of Vanguard; chief executive officer, president, and trustee (January 2018–present) of each of the investment companies served by Vanguard; president and director (2017–present) of Vanguard; and president (February 2018–present) of Vanguard Marketing Corporation. Chief investment officer (2013–2017), managing director (2002–2017), head of the Retail Investor Group (2006–2012), and chief information officer (2001–2006) of Vanguard. Chairman of the board (2011–2017) of the Children’s Hospital of Philadelphia.
Independent Trustees
Emerson U. Fullwood
Born in 1948. Trustee since January 2008. Principal occupation(s) during the past five years and other experience: executive chief staff and marketing officer for North America and corporate vice president (retired 2008) of Xerox Corporation (document management products and services). Former president of the Worldwide Channels Group, Latin America, and Worldwide Customer Service and executive chief staff officer of Developing Markets of Xerox. Executive in residence and 2009–2010 Distinguished Minett Professor at the Rochester Institute of Technology. Lead director of SPX FLOW, Inc. (multi-industry manufacturing). Director of the University of Rochester Medical Center, the Monroe Community College Foundation, the United Way of Rochester, North Carolina A&T University, and Roberts Wesleyan College. Trustee of the University of Rochester.
Amy Gutmann
Born in 1949. Trustee since June 2006. Principal occupation(s) during the past five years and other experience: president (2004–present) of the University of Pennsylvania. Christopher H. Browne Distinguished Professor of Political Science, School of Arts and Sciences, and professor of communication, Annenberg School for Communication, with secondary faculty appointments in the Department of Philosophy, School of Arts and Sciences, and at the Graduate School of Education, University of Pennsylvania. Trustee of the National Constitution Center.
1 Mr. McNabb and Mr. Buckley are considered “interested persons,” as defined in the Investment Company Act of 1940, because they are officers of the Vanguard funds.
JoAnn Heffernan Heisen
Born in 1950. Trustee since July 1998. Principal occupation(s) during the past five years and other experience: corporate vice president of Johnson & Johnson (pharmaceuticals/medical devices/consumer products) and member of its executive committee (1997–2008). Chief global diversity officer (retired 2008), vice president and chief information officer (1997–2006), controller (1995–1997), treasurer (1991–1995), and assistant treasurer (1989–1991) of Johnson & Johnson. Director of Skytop Lodge Corporation (hotels) and the Robert Wood Johnson Foundation. Member of the advisory board of the Institute for Women’s Leadership at Rutgers University.
F. Joseph Loughrey
Born in 1949. Trustee since October 2009. Principal occupation(s) during the past five years and other experience: president and chief operating officer (retired 2009) and vice chairman of the board (2008–2009) of Cummins Inc. (industrial machinery). Chairman of the board of Hillenbrand, Inc. (specialized consumer services), Oxfam America, and the Lumina Foundation for Education. Director of the V Foundation for Cancer Research. Member of the advisory council for the College of Arts and Letters and chair of the advisory board to the Kellogg Institute for International Studies, both at the University of Notre Dame.
Mark Loughridge
Born in 1953. Trustee since March 2012. Principal occupation(s) during the past five years and other experience: senior vice president and chief financial officer (retired 2013) of IBM (information technology services). Fiduciary member of IBM’s Retirement Plan Committee (2004–2013), senior vice president and general manager (2002–2004) of IBM Global Financing, vice president and controller (1998–2002) of IBM, and a variety of other prior management roles at IBM. Member of the Council on Chicago Booth.
Scott C. Malpass
Born in 1962. Trustee since March 2012. Principal occupation(s) during the past five years and other experience: chief investment officer (1989–present) and vice president (1996–present) of the University of Notre Dame. Assistant professor of finance at the Mendoza College of Business, University of Notre Dame, and member of the Notre Dame 403(b) Investment Committee. Chairman of the board of TIFF Advisory Services, Inc. Member of the board of Catholic Investment Services, Inc. (investment advisors), the board of advisors for Spruceview Capital Partners, and the board of superintendence of the Institute for the Works of Religion.
Deanna Mulligan
Born in 1963. Trustee since January 2018. Principal occupation(s) during the past five years and other experience: president (2010–present) and chief executive officer (2011–present) of The Guardian Life Insurance Company of America. Chief operating officer (2010–2011) and executive vice president (2008–2010) of Individual Life and Disability of The Guardian Life Insurance Company of America. Member of the board of The Guardian Life Insurance Company of America, the American Council of Life Insurers, the Partnership for New York City (business leadership), and the Committee Encouraging Corporate Philanthropy. Trustee of the Economic Club of New York and the Bruce Museum (arts and science). Member of the Advisory Council for the Stanford Graduate School of Business.
André F. Perold
Born in 1952. Trustee since December 2004. Principal occupation(s) during the past five years and other experience: George Gund Professor of Finance and Banking, Emeritus at the Harvard Business School (retired 2011). Chief investment officer and co-managing partner of HighVista Strategies LLC (private investment firm). Overseer of the Museum of Fine Arts Boston.
Sarah Bloom Raskin
Born in 1961. Trustee since January 2018. Principal occupation(s) during the past five years and other experience: deputy secretary (2014–2017) of the United States Department of the Treasury. Governor (2010–2014) of the Federal Reserve Board. Commissioner (2007–2010) of financial regulation for the State of Maryland. Member of the board of directors (2012–2014) of Neighborhood Reinvestment Corporation. Director of i(x) Investments, LLC.
Peter F. Volanakis
Born in 1955. Trustee since July 2009. Principal occupation(s) during the past five years and other experience: president and chief operating officer (retired 2010) of Corning Incorporated (communications equipment) and director of Corning Incorporated (2000–2010) and Dow Corning (2001–2010). Director (2012) of SPX Corporation (multi-industry manufacturing). Overseer of the Amos Tuck School of Business Administration, Dartmouth College (2001–2013). Chairman of the board of trustees of Colby-Sawyer College. Member of the Board of Hypertherm Inc. (industrial cutting systems, software, and consumables).
Executive Officers
Glenn Booraem
Born in 1967. Principal occupation(s) during the past five years and other experience: principal of Vanguard. Investment stewardship officer (2017–present), treasurer (2015–2017), controller (2010–2015), and assistant controller (2001–2010) of each of the investment companies served by Vanguard.
Christine M. Buchanan
Born in 1970. Principal occupation(s) during the past five years and other experience: principal of Vanguard and global head of Fund Administration at Vanguard. Treasurer (2017–present) of each of the investment companies served by Vanguard. Partner (2005–2017) at KPMG LLP (audit, tax, and advisory services).
Brian Dvorak
Born in 1973. Principal occupation(s) during the past five years and other experience: principal of Vanguard. Chief compliance officer (2017–present) of Vanguard and each of the investment companies served by Vanguard. Assistant vice president (2017–present) of Vanguard Marketing Corporation. Vice president and director of Enterprise Risk Management (2011–2013) at Oppenheimer Funds, Inc.
Thomas J. Higgins
Born in 1957. Principal occupation(s) during the past five years and other experience: principal of Vanguard. Chief financial officer (2008–present) and treasurer (1998–2008) of each of the investment companies served by Vanguard.
Peter Mahoney
Born in 1974. Principal occupation(s) during the past five years and other experience: principal of Vanguard. Controller (2015–present) of each of the investment companies served by Vanguard. Head of International Fund Services (2008–2014) at Vanguard.
Anne E. Robinson
Born in 1970. Principal occupation(s) during the past five years and other experience: general counsel (2016–present) of Vanguard. Secretary (2016–present) of Vanguard and of each of the investment companies served by Vanguard. Managing director (2016–present) of Vanguard. Director and senior vice president (2016–2018) of Vanguard Marketing Corporation. Managing director and general counsel of Global Cards and Consumer Services (2014–2016) at Citigroup. Counsel (2003–2014) at American Express.
Michael Rollings
Born in 1963. Principal occupation(s) during the past five years and other experience: finance director (2017–present) and treasurer (2017) of each of the investment companies served by Vanguard. Managing director (2016–present) of Vanguard. Chief financial officer (2016–present) of Vanguard. Director (2016–present) of Vanguard Marketing Corporation. Executive vice president and chief financial officer (2006–2016) of MassMutual Financial Group.
Vanguard Senior Management Team
| |
| Mortimer J. Buckley | James M. Norris |
| Gregory Davis | Thomas M. Rampulla |
| John James | Karin A. Risi |
| Martha G. King | Anne E. Robinson |
| John T. Marcante | Michael Rollings |
| Chris D. McIsaac | |
Chairman Emeritus and Senior Advisor
John J. Brennan
Chairman, 1996–2009
Chief Executive Officer and President, 1996–2008
Founder
John C. Bogle
Chairman and Chief Executive Officer, 1974–1996
|  |
| | P.O. Box 2600 |
| | Valley Forge, PA 19482-2600 |
| |
| |
| |
| Connect with Vanguard® > vanguard.com |
| |
| |
| |
| Fund Information > 800-662-7447 | Source for Bloomberg Barclays indexes: Bloomberg |
| Direct Investor Account Services > 800-662-2739 | Index Services Limited. Copyright 2018, Bloomberg. All |
| | rights reserved. |
| Institutional Investor Services > 800-523-1036 | |
| Text Telephone for People | |
| Who Are Deaf or Hard of Hearing > 800-749-7273 | |
| |
| This material may be used in conjunction | |
| with the offering of shares of any Vanguard | |
| fund only if preceded or accompanied by | |
| the fund’s current prospectus. | |
| |
| All comparative mutual fund data are from Lipper, a | |
| Thomson Reuters Company, or Morningstar, Inc., unless | |
| otherwise noted. | |
| |
| You can obtain a free copy of Vanguard’s proxy voting | |
| guidelines by visiting vanguard.com/proxyreporting or by | |
| calling Vanguard at 800-662-2739. The guidelines are | |
| also available from the SEC’s website, sec.gov. In | |
| addition, you may obtain a free report on how your fund | |
| voted the proxies for securities it owned during the 12 | |
| months ended June 30. To get the report, visit either | |
| vanguard.com/proxyreporting or sec.gov. | |
| |
| You can review and copy information about your fund at | |
| the SEC’s Public Reference Room in Washington, D.C. To | |
| find out more about this public service, call the SEC at | |
| 202-551-8090. Information about your fund is also | |
| available on the SEC’s website, and you can receive | |
| copies of this information, for a fee, by sending a | |
| request in either of two ways: via email addressed to | |
| publicinfo@sec.gov or via regular mail addressed to the | |
| Public Reference Section, Securities and Exchange | |
| Commission, Washington, DC 20549-1520. | |
| | © 2018 The Vanguard Group, Inc. |
| | All rights reserved. |
| | Vanguard Marketing Corporation, Distributor. |
| |
| | Q300 102018 |
Item 2: Code of Ethics. The Registrant has adopted a code of ethics that applies to the Registrant’s
principal executive officer, principal financial officer, principal accounting officer or controller or
persons performing similar functions. The Code of Ethics was amended during the reporting
period covered by this report to make certain technical, non-material changes.
Item 3: Audit Committee Financial Expert. All members of the Audit Committee have been
determined by the Registrant’s Board of Trustees to be Audit Committee Financial Experts and to
be independent: Rajiv L. Gupta, JoAnn Heffernan Heisen, F. Joseph Loughrey, Mark Loughridge,
and Peter F. Volanakis.
Item 4: Principal Accountant Fees and Services.
(a) Audit Fees.
Audit Fees of the Registrant
Fiscal Year Ended August 31, 2017: $65,000
Fiscal Year Ended August 31, 2016: $69,000
Aggregate Audit Fees of Registered Investment Companies in the Vanguard Group.
Fiscal Year Ended August 31, 2017: $8,424,459
Fiscal Year Ended August 31, 2016: $9,629,849
Includes fees billed in connection with audits of the Registrant, other registered investment
companies in the Vanguard complex, The Vanguard Group, Inc. and Vanguard Marketing
Corporation.
(b) Audit-Related Fees.
Fiscal Year Ended August 31, 2017: $3,194,093
Fiscal Year Ended August 31, 2016: $2,717,627
Includes fees billed in connection with assurance and related services provided to the
Registrant, other registered investment companies in the Vanguard complex, The Vanguard
Group, Inc., and Vanguard Marketing Corporation.
(c) Tax Fees.
Fiscal Year Ended August 31, 2017: $274,313
Fiscal Year Ended August 31, 2016: $254,050
Includes fees billed in connection with tax compliance, planning, and advice services
provided to the Registrant, other registered investment companies in the Vanguard complex,
The Vanguard Group, Inc., and Vanguard Marketing Corporation.
(d) All Other Fees.
Fiscal Year Ended August 31, 2017: $0
Fiscal Year Ended August 31, 2016: $214,225
Includes fees billed for services related to tax reported information provided to the
Registrant, other registered investment companies in the Vanguard complex, The Vanguard
Group, Inc., and Vanguard Marketing Corporation.
(e) (1) Pre-Approval Policies. The policy of the Registrant’s Audit Committee is to
consider and, if appropriate, approve before the principal accountant is engaged for such
services, all specific audit and non-audit services provided to: the Registrant, other registered
investment companies in the Vanguard complex, The Vanguard Group, Inc., and entities
controlled by The Vanguard Group, Inc. that provide ongoing services to the Registrant. In
making a determination, the Audit Committee considers whether the services are consistent
with maintaining the principal accountant’s independence.
In the event of a contingency situation in which the principal accountant is needed to
provide services in between scheduled Audit Committee meetings, the Chairman of the Audit
Committee would be called on to consider and, if appropriate, pre-approve audit or permitted
non-audit services in an amount sufficient to complete services through the next Audit
Committee meeting, and to determine if such services would be consistent with maintaining
the accountant’s independence. At the next scheduled Audit Committee meeting, services
and fees would be presented to the Audit Committee for formal consideration, and, if
appropriate, approval by the entire Audit Committee. The Audit Committee would again
consider whether such services and fees are consistent with maintaining the principal
accountant’s independence.
The Registrant’s Audit Committee is informed at least annually of all audit and non-
audit services provided by the principal accountant to the Vanguard complex, whether such
services are provided to: the Registrant, other registered investment companies in the
Vanguard complex, The Vanguard Group, Inc., or other entities controlled by The Vanguard
Group, Inc. that provide ongoing services to the Registrant.
(2) No percentage of the principal accountant’s fees or services were approved pursuant to
the waiver provision of paragraph (c)(7)(i)(C) of Rule 2-01 of Regulation S-X.
(f) For the most recent fiscal year, over 50% of the hours worked under the principal
accountant’s engagement were not performed by persons other than full-time, permanent
employees of the principal accountant.
(g) Aggregate Non-Audit Fees.
Fiscal Year Ended August 31, 2017: $274,313
Fiscal Year Ended August 31, 2016: $468,275
Includes fees billed for non-audit services provided to the Registrant, other registered
investment companies in the Vanguard complex, The Vanguard Group, Inc., and Vanguard
Marketing Corporation.
(h) For the most recent fiscal year, the Audit Committee has determined that the provision
of all non-audit services was consistent with maintaining the principal accountant’s
independence.
Item 5: Audit Committee of Listed Registrants.
Not Applicable.
Item 6: Investments.
Not Applicable.
Item 7: Disclosure of Proxy Voting Policies and Procedures for Closed-End Management
Investment Companies.
Not Applicable.
Item 8: Portfolio Managers of Closed-End Management Investment Companies.
Not Applicable.
Item 9: Purchase of Equity Securities by Closed-End Management Investment Company and
Affiliated Purchasers.
Not Applicable.
Item 10: Submission of Matters to a Vote of Security Holders.
Not Applicable.
Item 11: Controls and Procedures.
(a) Disclosure Controls and Procedures. The Principal Executive and Financial
Officers concluded that the Registrant’s Disclosure Controls and Procedures are effective
based on their evaluation of the Disclosure Controls and Procedures as of a date within 90
days of the filing date of this report.
(b) Internal Control Over Financial Reporting. There were no significant changes in
Registrant’s Internal Control Over Financial Reporting or in other factors that could
significantly affect this control subsequent to the date of the evaluation, including any
corrective actions with regard to significant deficiencies and material weaknesses.
Item 12: Disclosure of Securities Lending Activities for Closed-End Management
Investment Companies.
Not Applicable.
Item 13: Exhibits.
(a) Code of Ethics.
(b) Certifications.
Pursuant to the requirements of the Securities Exchange Act of 1934 and the Investment
Company Act of 1940, the registrant has duly caused this report to be signed on its behalf by
the undersigned, thereunto duly authorized.
| |
| | VANGUARD MONEY MARKET RESERVES |
| |
| |
| BY: | /s/ F. WILLIAM MCNABB III* |
| | F. WILLIAM MCNABB III |
| | CHIEF EXECUTIVE OFFICER |
| |
| Date: October 18, 2017 |
Pursuant to the requirements of the Securities Exchange Act of 1934 and the Investment Company Act of 1940, this report has been signed below by the following persons on behalf of the registrant and in the capacities and on the dates indicated.
| |
| | VANGUARD MONEY MARKET RESERVES |
| |
| |
| BY: | /s/ F. WILLIAM MCNABB III* |
| | F. WILLIAM MCNABB III |
| | CHIEF EXECUTIVE OFFICER |
| |
| Date: October 18, 2017 |
| |
| | VANGUARD MONEY MARKET RESERVES |
| |
| |
| BY: | /s/ THOMAS J. HIGGINS* |
| | THOMAS J. HIGGINS |
| | CHIEF FINANCIAL OFFICER |
| |
| Date: October 18, 2017 |
* By: /s/ Anne E. Robinson
Anne E. Robinson, pursuant to a Power of Attorney filed on October 4, 2016 see file Number
33-32548, Incorporated by Reference.