UNITED STATES
SECURITIES AND EXCHANGE COMMISSION
Washington, D.C. 20549
FORM N-CSR
CERTIFIED SHAREHOLDER REPORT OF REGISTERED
MANAGEMENT INVESTMENT COMPANIES
Investment Company Act file number | 811-08979 |
|
Victory Variable Insurance Funds |
(Exact name of registrant as specified in charter) |
|
4900 Tiedeman Road, 4th Floor, Brooklyn, Ohio | | 44144 |
(Address of principal executive offices) | | (Zip code) |
|
Citi Fund Services Ohio, Inc., 4400 Easton Commons, Suite 200, Columbus, OH 43219 |
(Name and address of agent for service) |
|
Registrant’s telephone number, including area code: | 800-539-3863 | |
|
Date of fiscal year end: | December 31 | |
|
Date of reporting period: | December 31, 2018 | |
| | | | | | | | |
Item 1. Reports to Stockholders.

December 31, 2018
Annual Report
Victory Variable Insurance Funds
Victory INCORE Investment Quality Bond VIP Series
Beginning on January 1, 2021, as permitted by regulations adopted by the Securities and Exchange Commission, paper copies of the Victory Funds' shareholder reports will no longer be sent by mail, unless you specifically request paper copies of the reports from the Victory Funds or from your financial intermediary, such as a broker-dealer or bank. Instead, the reports will be made available on www.VictoryFunds.com, and you will be notified by mail each time a report is posted and provided with a website link to access the report. If you already elected to receive shareholder reports electronically, you will not be affected by this change, and you need not take any action.
You may elect to receive shareholder reports and other communications from the Victory Funds or your financial intermediary electronically sooner than January 1, 2021 by notifying your financial intermediary directly or, if you are a direct investor, by calling 800-539-3863 or by sending an e-mail request to TA.Processing@FISGlobal.com.
You may elect to receive all future reports in paper free of charge. If you invest through a financial intermediary, you can contact your financial intermediary to request that you continue to receive paper copies of your reports. If you invest directly with the Victory Funds, you can call 800-539-3863 or send an e-mail request to TA.Processing@FISGlobal.com. Your election to receive reports in paper will apply to all Victory Funds you hold directly or through your financial intermediary.
www.vcm.com
News, Information And Education 24 Hours A Day, 7 Days A Week
The Victory Funds site gives fund shareholders, prospective shareholders, and investment professionals a convenient way to access fund information, get guidance, and track fund performance anywhere they can access the Internet. The site includes:
• Detailed performance records
• Daily share prices
• The latest fund news
• Investment resources to help you become a better investor
• A section dedicated to investment professionals
Whether you're a potential investor searching for the fund that matches your investment philosophy, a seasoned investor interested in planning tools, or an investment professional, www.vcm.com has what you seek. Visit us anytime. We're always open.
Victory Variable
Insurance Funds
Table of Contents
Shareholder Letter (Unaudited) | | | 3 | | |
Fund Review and Commentary (Unaudited) | | | 4 | | |
Financial Statements | |
Schedule of Portfolio Investments | | | 8 | | |
Statement of Assets and Liabilities | | | 15 | | |
Statement of Operations | | | 16 | | |
Statements of Changes in Net Assets | | | 17 | | |
Financial Highlights | | | 18 | | |
Notes to Financial Statements | | | 19 | | |
Report of Ernst & Young LLP, Independent
Registered Public Accounting Firm | | | 31 | | |
Supplemental Information (Unaudited) | |
Trustee and Officer Information | | | 32 | | |
Proxy Voting and Form N-Q Information | | | 35 | | |
Expense Examples | | | 35 | | |
Advisory Contract Renewal | | | 37 | | |
Privacy Policy (inside back cover) | | | |
The Fund is distributed by Victory Capital Advisers, Inc. Victory Capital Management Inc. is the investment adviser to the Fund and receives fees from the Fund for performing services for the Fund.
This report is not authorized for distribution to prospective investors unless preceded or accompanied by a current prospectus of the Fund.
For additional information about any Victory Fund, including fees, expenses, and risks, view our prospectus online at www.vcm.com or call 800-539-3863. Read it carefully before you invest or send money.
The information in this annual report is based on data obtained from recognized services and sources and is believed to be reliable. Any opinions, projections, or recommendations in this report are subject to change without notice and are not intended as individual investment advice. Past investment performance of the Fund, markets or securities mentioned herein should not be considered to be indicative of future results.
• NOT FDIC INSURED • NO BANK GUARANTEE
• MAY LOSE VALUE

Call Victory at:
800-539-FUND (800-539-3863)
Visit our website at:
www.vcm.com
1
This page is intentionally left blank.
2
Victory Funds Letter to Shareholders
Dear Shareholder,
What a difference a year makes. The year ended December 31, 2018, was marked by an abrupt return of volatility, which had largely been missing in action for years. Consider the range of highs and lows we witnessed. For the S&P 500 Index, it was a year in which we celebrated an all-time high in late summer, only to be followed by the worst December since the 2008 financial crisis. And if that wasn't enough volatility, the Dow Jones Industrial Average also registered several of its worst-ever, single-day point declines during 2018.
Through all that the S&P 500 clocked in with its first negative annual return since 2008, falling by 4.4 percent. Given the risk-off sentiment that was obvious as the year drew to a close, it's no surprise that small-cap stocks, as measured by the Russell 2000 Index, fared even worse, falling approximately 11.0 percent for the year. The challenges for equity investors were also evident around the world as the MSCI ACWI and Emerging Markets indexes declined 8.9 and 14.3 percent, respectively.
So what ushered in the renewed era of volatility and these challenging times? There were multiple culprits. For starters, trade tensions ratcheted up throughout the year as anti-global rhetoric bloomed into a series of new tariffs, which sparked concerns of a prolonged trade war with China. The Federal Reserve remained persistent in its monetary tightening, raising the benchmark interest rate four times throughout the year to a range of 2.25 to 2.5 percent. And then the year ended with a partial shutdown of the federal government. These factors conspired to elevate concerns of a possible recession here and abroad.
Yet despite the headline risks, we think it's critically important to remain focused on the data. By all accounts, the U.S. economy continued chugging along in 2018 with a real gross domestic product (GDP) rising 3.4 percent in the third quarter of 2018, the latest figures available from the Bureau of Economic Analysis. Moreover, the labor picture continues to shine with consistent monthly job growth and an unemployment rate of 3.9 percent. All this comes against a backdrop of low inflation and solid corporate earnings.
The markets, it appears, have been vacillating between the dire headlines and higher perceived risks on one hand, and the continued positive economic data on the other. Of course, no one knows where the Fed will stop raising rates, nor is there any certainty on how the trade turmoil ultimately gets resolved. For now, however, we continue to embrace our solid economic fundamentals. Moreover, we believe all of Victory Capital's independent investment franchises are well positioned to take advantage of any short-term valuation dislocations resulting from the current era of heightened volatility.
On the following pages, you will find information relating to your Victory Funds investment. If you have any questions, we encourage you to contact your financial advisor. Or, if you invest with us directly, you may call (800) 539-3863, or visit our website at www.vcm.com.
My colleagues and I sincerely appreciate the confidence you have placed in the Victory Funds, and we value the opportunity to help meet your investment goals.

Christopher K. Dyer, CFA
President,
Victory Funds
3
Victory Variable Insurance Funds
Victory INCORE Investment Quality Bond VIP Series
Portfolio Holdings
As a Percentage of Total Investments

Economic Perspective
As investors reflect on 2018, the old adage of coming in like a lion and going out like a lamb should resonate strongly. While financial markets were certainly more volatile through the first three quarters of the year, we entered the fourth quarter with equities at record highs, interest rates trending higher given the strong U.S. economy and credit spreads only modestly wider on the year. Clouds of uncertainty had been slowly gathering over the markets for several months and finally unleashed a significantly higher degree of volatility across global equity and fixed income markets. The CBOE Volatility (VIX) index, a market estimate of future volatility, more than doubled in the fourth quarter and closed the year at 25.42, up 130% from the end of 2017.
A plethora of factors contributed to the shift in sentiment in the fourth quarter; increasing concern for a policy error from the Federal Reserve (the Fed), further deterioration in the U.S./China trade relationship, slowing global growth, particularly in China, political chaos in Washington and the EU and the uncertain outcome of the Brexit negotiations. Despite some positive news late in the quarter — a 90-day trade truce with China, an OPEC agreement to cut oil production and a softer tone from Fed chair Powell — equity returns ended on a negative note for the year, credit spreads continued to widen and the front end of the yield curve inverted. The S&P 500 Index was down 13.97% for the quarter and down 6.24% for the year. The ICE Bank of America Merrill Lynch US Corporate Index saw its option-adjusted spread (OAS) widen 46 basis points during the quarter to end the year at 159 basis points, underperforming U.S. Treasuries by 2.84%. Perhaps one additional headwind to risk assets in 2019 will be cash as a competing asset class. Not too long-ago investors earned virtually nothing on cash balances, yet are now earning 2-2.5% with little to no duration or credit risk, which may appeal to some risk-averse investors should volatility remain elevated or increase. For perspective, 3-month Treasury bills now have a higher yield than the dividend yield on the S&P 500 Index.
Federal Reserve Chairman Powell's comments in early October suggesting monetary policy was a "long way from neutral" following three rate increases in 2018, incited fears of a Fed policy error and an increasing likelihood of an economic recession. Interest rates increased and equities began to fall following these comments. The subsequent spike in equity volatility, a sharp decline in oil prices and lack of inflationary pressure had many speculating the Fed may signal a pause in rate increases at their November meeting. The FOMC disappointed in that regard, interest rates reversed course and equity volatility moved higher. While Chairman Powell attempted to walk those comments back a bit in late November, it was too late given the committee's apparent determination to continue raising short-term rates. Further complicating the FOMC's agenda were Chairman Powell's comments following the December rate increase that the balance sheet normalization was "on autopilot." The market interpreted this such that even if the Fed did slow the pace of rate increases in 2019, the
4
Victory Variable Insurance Funds
Victory INCORE Investment Quality Bond VIP Series (continued)
shift from quantitative easing to quantitative tightening is on a preset path and the risk of policy error remains elevated. While the Fed did reduce their outlook for rate increases in 2019 from 3 to 2 moves, it was not enough to calm the financial markets. Chairman Powell again reversed course on January 4, saying the Fed would be flexible in managing the balance sheet.
The second and third quarters of 2018 were the strongest back-to back-growth quarters in the U.S. since 2014. Furthermore, the unemployment rate gradually declined throughout the year and wage growth broke above 3% on a year-over-year basis. Both the services and manufacturing sectors remained comfortably in expansionary territory and consumer and business confidence remained elevated. Combine these factors with inflation metrics near the Fed's 2% target rate and the case could be made for the Federal Open Market Committee to continue its gradual path of rate increases. While the data in hand was supportive of the move, the disconnect between the market and the Fed appeared to be the outlook given growing uncertainties. Complicating their decision-making process further was the increasing criticism of the rate increases, and Chairman Powell specifically, from President Trump. It remains an interesting question if the Fed would have increased rates in December had that dynamic not been present. We believe the public criticism left them little choice but to raise rates and demonstrate their independence and unwillingness to bow to political pressure.
In 2019, we expect economic growth to slow back towards the 2% area as the marginal benefits from fiscal stimulus (tax reform) and deregulation fade, trade uncertainty slows business investment and tighter financial conditions resulting from lower equity markets and higher interest rates impacts sentiment and spending. With that said, we do not expect to see a recession in the U.S. in 2019, but do see rising risks for 2020 if the Fed continues to raise rates on their current path and if there is not a positive resolution to the U.S. and China trade relationship soon.
Market Summary and Fund Attribution
The Victory INCORE Investment Quality Bond VIP Series ("Fund") seeks to provide a high level of current income and capital appreciation without undue risk to principal. The Fund underperformed the Bloomberg Barclays U.S. Aggregate Bond Index ("Index") for 2018, -0.41% versus 0.01%. The underperformance was driven largely by the allocation to high yield credit as spreads widened dramatically late in the year, as well as the underweight position in U.S. Treasuries. This was somewhat offset by positive allocation effects from securitized sectors, most notably agency mortgage-backed securities. Security selection was additive to performance in most sectors except for industrials in the corporate bond space. Duration and yield curve positioning contributed positively to relative performance.
Coming into 2018, many expected negative absolute returns in fixed income given the likelihood of higher interest rates resulting from continued monetary policy tightening. This rang true for most of the year, but as volatility spiked in the fourth quarter and bond investors pushed back forcefully against the Fed's forecast by driving yields lower, many fixed income indices posted positive returns for the year. The Index generated a total return of 0.01% for 2018 after having been down 2.38% through October. Interest rates did continue to rise, but when the books closed on 2018, short term rates were up two to three times those of intermediate and long-term maturities flattening the yield curve further. The spread between
5
Victory Variable Insurance Funds
Victory INCORE Investment Quality Bond VIP Series (continued)
2-year and 10-year Treasury notes declined to 19 basis points (0.19%) while the 2-year to 5-year spread ended the year at 2 basis points (0.02%). The spread relationship between 1-year and 5-year notes witnessed an inversion of 9 basis points, underscoring the market's view of the Fed heading for a policy error if they continue tightening monetary policy via rates and quantitative tightening.
Within the Index, corporate bonds were the glaring underperformer for both the quarter and the year with excess returns of -3.10% and -3.15%, respectively. Credit concerns at General Electric (GE) and the large California utilities resulting from the wild fires, coupled with heavy outflows from high grade bond funds, pressured spreads materially wider. Additionally, fears of rating downgrades and recession added to anxiety and exacerbated the underperformance. For the year, excess returns in utilities fared the worst (-3.94%), followed by industrials (-3.34%) then financials (-2.62%). In the structured sectors, agency mortgages were the weakest performer from an excess returns perspective (-0.59%), followed by commercial mortgage backed securities (-0.39%), while asset-backed securities posted positive excess returns (0.13%). Corporate bonds were the only sector to post negative absolute returns for the year, all other primary sectors were positive, led by asset-backed securities at 1.77%. Interestingly, asset-backed securities were also the only sector to post positive excess returns for the full year. High yield credit suffered a similar year as investment grade credit, only worse. This sector posted an absolute return of -2.08% for the year and underperformed U.S. Treasuries by -3.58%.
During the period, the Fund used both long and short positions in U.S. Treasury futures and U.S. Federal Funds Futures, as well as credit default swaps. The Fund entered into these transactions to more efficiently manage the Fund's total portfolio risks, in terms of duration, curve exposure and credit quality, which would be more costly and restrictive to manage by investing directly in a selection of cash bonds or ETFs. The derivatives strategy with regards to futures contributed +22 basis points to overall performance while the credit default swap strategy contributed approximately -20 basis points for the 12 months ended December 31, 2018.
Market Positioning
Our allocation to investment grade (IG) credit declined further in the fourth quarter and resulted in an underweight position in BBB-rated corporate bonds relative to the Index. Additionally, our high yield exposure ended the year well below our maximum position. Our proprietary credit momentum signal continued to reduce exposure to IG credit as the option adjusted spread (OAS) of BBB-rated corporate bonds widened significantly over the trailing three months. Given this movement in OAS, valuations are now looking more compelling relative to fundamentals, yet we remain patient and ready to add risk when appropriate. Yield curve positioning and duration will be actively-managed based upon our proprietary trading signals as well as changes in the shape of the yield curve. The market's assessment of the Fed's actions/communication, as reflected by changes in the shape of the curve, will be a focal point in the coming quarters.
6
Victory Variable Insurance Funds
Victory INCORE Investment Quality Bond VIP Series (continued)
Average Annual Return
Year Ended December 31, 2018
| | Class I | |
INCEPTION DATE | | 5/1/83 | |
| | |
Net Asset
Value | | Bloomberg
Barclays U.S.
Aggregate
Bond Index1 | |
One Year | | | –0.41 | % | | | 0.01 | % | |
Three Year | | | 2.40 | % | | | 2.06 | % | |
Five Year | | | 2.60 | % | | | 2.52 | % | |
Ten Year | | | 4.32 | % | | | 3.48 | % | |
Since Inception | | | 6.64 | % | | | N/A | | |
Expense Ratios
Gross | | | 0.61 | % | |
With Applicable Waivers | | | 0.56 | % | |
Past performance is not indicative of future results. The performance data quoted represents past performance and current returns may be lower or higher. The investment return and principal value will fluctuate so that an investor's shares, when redeemed, may be worth more or less than the original cost. To obtain performance information current to the most recent month's end, please visit www.vcm.com.
The above expense ratios are from the Fund's prospectus dated May 1, 2018. Additional information pertaining to the Fund's expense ratios as of December 31, 2018 can be found in the financial highlights.
The total return figures set forth above include all waivers of fees for various periods since inception. Without such fee waivers, the total returns would have been lower. Some fee waivers are voluntary and may be modified or terminated at any time. The total returns do not include any insurance, sales or administrative charges of variable annuity or life insurance contracts. If these charges were included, the total returns would have been lower.
Victory INCORE Investment Quality Bond VIP Series — Growth of $10,000

1The Bloomberg Barclays U.S. Aggregate Bond Index is generally considered to be representative of U.S. bond market activity. The Bloomberg Barclays U.S. Aggregate Bond Index is an unmanaged index that is not available for direct investment. There are no expenses associated with the index while there are expenses associated with the Fund. It is not possible to invest directly in an index.
The graph reflects investment of growth of a hypothetical $10,000 investment in the Fund. Past performance is no guarantee of future results.
The graph and table do not reflect the deduction of taxes that a shareholder would pay on Fund distributions or the redemption of Fund shares.
7
Victory Variable Insurance Funds
Victory INCORE Investment Quality Bond VIP Series | | Schedule of Portfolio Investments
December 31, 2018 | |
Security Description | | Principal
Amount | | Value | |
Asset Backed Securities (4.4%) | |
AmeriCredit Automobile Receivables Trust , Series 2018-1, Class B,
3.26%, 1/18/24, Callable 1/18/22 @ 100 (a) | | $ | 1,000,000 | | | $ | 1,001,602 | | |
Avis Budget Rental Car Funding (AESOP) LLC , Series 2014-1, Class A,
2.46%, 7/20/20 (a) (b) | | | 4,000,000 | | | | 3,989,652 | | |
CarMax Auto Owner Trust , Series 2015-3, Class B,
2.28%, 4/15/21, Callable 11/15/19 @ 100 | | | 3,225,000 | | | | 3,201,158 | | |
Drive Auto Receivables Trust , Series 2017-3, Class B,
2.30%, 5/17/21, Callable 7/15/20 @ 100 | | | 928,219 | | | | 927,135 | | |
Drive Auto Receivables Trust , Series 2017-1, Class B,
2.36%, 3/15/21, Callable 7/15/20 @ 100 (a) | | | 404,749 | | | | 404,574 | | |
DT Auto Owner Trust , Series 2017-2A, Class B,
2.44%, 2/15/21, Callable 9/15/20 @ 100 (a) (b) | | | 834,111 | | | | 833,589 | | |
DT Auto Owner Trust , Series 2017-3A, Class B,
2.40%, 5/17/21, Callable 1/15/21 @ 100 (b) | | | 1,678,942 | | | | 1,675,888 | | |
Popular ABS Mortgage Pass-Through Trust , Series 2005-2, Class AV1B,
2.77% (LIBOR01M+26bps), 4/25/35, Callable 6/25/20 @ 100 (c) | | | 911,784 | | | | 906,325 | | |
Santander Drive Auto Receivables Trust , Series 2017-3, Class B,
2.19%, 3/15/22, Callable 12/15/20 @ 100 (a) | | | 3,495,000 | | | | 3,470,084 | | |
Santander Drive Auto Receivables Trust , Series 2018-2, Class B,
3.03%, 9/15/22, Callable 5/15/21 @ 100 (a) | | | 4,250,000 | | | | 4,242,019 | | |
Santander Drive Auto Receivables Trust , Series 2017-2, Class B,
2.21%, 10/15/21, Callable 6/15/20 @ 100 (a) | | | 4,123,000 | | | | 4,111,208 | | |
Santander Retail Auto Lease Trust , Series 2018-A, Class B,
3.20%, 4/20/22, Callable 3/20/21 @ 100 (a) (b) | | | 3,825,000 | | | | 3,813,862 | | |
Total Asset Backed Securities (Cost $28,649,051) | | | 28,577,096 | | |
Collateralized Mortgage Obligations (2.5%) | |
Commercial Mortgage Trust , Series 2012-CR4, Class B,
3.70%, 10/15/45 (b) | | | 4,580,000 | | | | 4,394,159 | | |
DBUBS Mortgage Trust , Series 2011-LC1A, Class A3,
5.00%, 11/10/46 (a) (b) | | | 4,500,000 | | | | 4,612,044 | | |
GS Mortgage Securities Trust , Series 2012-GC6, Class B,
5.65%, 1/10/45 (a) (b) (d) | | | 3,250,000 | | | | 3,409,015 | | |
Morgan Stanley BAML Trust , Series 2013-C13, Class A2,
2.94%, 11/15/46 (a) | | | 603,301 | | | | 601,706 | | |
WF-RBS Commercial Mortgage Trust , Series 2012-C6, Class B,
4.70%, 4/15/45 | | | 3,275,000 | | | | 3,349,789 | | |
Total Collateralized Mortgage Obligations (Cost $17,845,924) | | | 16,366,713 | | |
Residential Mortgage Backed Securities (1.0%) | |
Ameriquest Mortgage Securities, Inc. , Series 2003-5, Class A6,
4.16%, 4/25/33, Callable 1/25/19 @ 100 (a) (d) | | | 84,772 | | | | 84,594 | | |
Bear Stearns Alt-A Trust , Series 2003-3, Class 2A,
4.36%, 10/25/33, Callable 1/25/19 @ 100 (a) (d) | | | 1,136,182 | | | | 1,132,916 | | |
Countrywide Home Loans, Inc. , Series 2002-19, Class 1A1,
6.25%, 11/25/32, Callable 1/25/19 @ 100 | | | 142,696 | | | | 142,696 | | |
See notes to financial statements.
8
Victory Variable Insurance Funds
Victory INCORE Investment Quality Bond VIP Series | | Schedule of Portfolio Investments — continued
December 31, 2018 | |
Security Description | | Principal
Amount | | Value | |
Credit Suisse First Boston Mortgage Securities Corp. , Series 2002-HE16,
Class M1, 3.83% (LIBOR01M+132bps), 10/25/32,
Callable 1/25/19 @ 100 (c) | | $ | 1,012,389 | | | $ | 1,008,722 | | |
GSR Mortgage Loan Trust , Series 2004-10F, Class 6A1,
5.00%, 9/25/34, Callable 1/25/19 @ 100 (a) | | | 381,546 | | | | 381,546 | | |
JPMorgan Mortgage Trust , Series 2004-S2, Class 1A3,
4.75%, 11/25/19, Callable 5/25/19 @ 100 (a) | | | 54,431 | | | | 54,313 | | |
JPMorgan Mortgage Trust , Series 2016-4, Class A5,
3.50%, 10/25/46, Callable 8/25/37 @ 100 (a) (b) (d) | | | 1,664,953 | | | | 1,654,592 | | |
MASTR Adjustable Rate Mortgage Trust , Series 2004-13, Class 3A1,
4.44%, 11/21/34, Callable 1/21/19 @ 100 (d) | | | 804,774 | | | | 804,774 | | |
Prime Mortgage Trust , Series 2004-2, Class A3,
5.25%, 11/25/19, Callable 1/25/19 @ 100 (a) | | | 19,375 | | | | 19,375 | | |
Residential Funding Mortgage Securities I, Inc. , Series 2005-S3, Class A1,
4.75%, 3/25/20, Callable 1/25/19 @ 100 (a) | | | 58,012 | | | | 58,008 | | |
Structured Asset Securities Corp. , Series 2004-21XS, Class 2A6A,
5.24%, 12/25/34, Callable 1/25/19 @ 100 (a) (d) | | | 839 | | | | 840 | | |
Wells Fargo Mortgage Backed Securities Trust , Series 2004-Y,
Class 3A1, 4.92%, 11/25/34, Callable 1/25/19 @ 100 (a) (d) | | | 1,150,352 | | | | 1,150,352 | | |
Wells Fargo Mortgage Backed Securities Trust , Series 2005-2, Class 2A1,
4.75%, 4/25/20, Callable 1/25/19 @ 100 (a) | | | 27,247 | | | | 27,247 | | |
Total Residential Mortgage Backed Securities (Cost $6,588,757) | | | 6,519,975 | | |
Corporate Bonds (20.9%) | |
Communication Services (2.2%): | |
AT&T, Inc.
2.30%, 3/11/19 (a) | | | 9,000,000 | | | | 8,985,600 | | |
5.15%, 11/15/46, Callable 5/15/46 @ 100 (a) | | | 3,833,000 | | | | 3,568,907 | | |
SES Global Americas Holdings GP, 5.30%, 3/25/44 (b) | | | 2,475,000 | | | | 2,142,707 | | |
| | | | 14,697,214 | | |
Consumer Discretionary (1.7%): | |
Hasbro, Inc., 6.35%, 3/15/40 | | | 2,155,000 | | | | 2,265,508 | | |
Magna International, Inc., 3.63%, 6/15/24, Callable 3/15/24 @ 100 | | | 4,305,000 | | | | 4,250,413 | | |
NIKE, Inc., 3.88%, 11/1/45, Callable 5/1/45 @ 100 | | | 2,624,000 | | | | 2,512,585 | | |
Ross Stores, Inc., 3.38%, 9/15/24, Callable 6/15/24 @ 100 | | | 1,220,000 | | | | 1,204,482 | | |
| | | | 10,232,988 | | |
Consumer Staples (1.3%): | |
Estee Lauder Cos., Inc., 4.15%, 3/15/47, Callable 9/15/46 @ 100 | | | 1,000,000 | | | | 1,001,540 | | |
Mead Johnson Nutrition Co.
3.00%, 11/15/20 (e) | | | 3,000,000 | | | | 2,990,850 | | |
4.60%, 6/1/44, Callable 12/1/43 @ 100 (a) | | | 2,091,000 | | | | 2,143,191 | | |
Reynolds American, Inc., 5.70%, 8/15/35, Callable 2/15/35 @ 100 | | | 1,835,000 | | | | 1,789,529 | | |
| | | | 7,925,110 | | |
Energy (1.0%): | |
Dolphin Energy Ltd., 5.89%, 6/15/19 (b) | | | 174,400 | | | | 175,507 | | |
Exxon Mobil Corp., 4.11%, 3/1/46, Callable 9/1/45 @ 100 | | | 1,032,000 | | | | 1,047,810 | | |
Marathon Petroleum Corp.
6.50%, 3/1/41, Callable 9/1/40 @ 100 | | | 1,285,000 | | | | 1,382,519 | | |
5.85%, 12/15/45, Callable 6/15/45 @ 100 | | | 850,000 | | | | 844,365 | | |
See notes to financial statements.
9
Victory Variable Insurance Funds
Victory INCORE Investment Quality Bond VIP Series | | Schedule of Portfolio Investments — continued
December 31, 2018 | |
Security Description | | Principal
Amount | | Value | |
Statoil ASA, 3.95%, 5/15/43 | | $ | 930,000 | | | $ | 885,611 | | |
Valero Energy Corp., 6.63%, 6/15/37 | | | 2,520,000 | | | | 2,777,443 | | |
| | | | 7,113,255 | | |
Financials (8.6%): | |
Aflac, Inc.
2.88%, 10/15/26, Callable 7/15/26 @ 100 | | | 2,450,000 | | | | 2,279,407 | | |
4.75%, 1/15/49, Callable 7/15/48 @ 100 | | | 595,000 | | | | 607,132 | | |
Alleghany Corp., 4.90%, 9/15/44, Callable 3/15/44 @ 100 | | | 1,648,000 | | | | 1,654,905 | | |
Bank of America Corp.
2.33%, (LIBOR03M+63bps), 10/1/21, Callable 10/1/20 @ 100 (c) | | | 1,875,000 | | | | 1,834,688 | | |
2.50%, 10/21/22, Callable 10/21/21 @ 100, MTN | | | 3,500,000 | | | | 3,359,755 | | |
3.25%, 10/21/27, Callable 10/21/26 @ 100 | | | 1,775,000 | | | | 1,643,153 | | |
BB&T Corp., 2.75%, 4/1/22, MTN, Callable 3/1/22 @ 100 | | | 3,550,000 | | | | 3,484,431 | | |
Cincinnati Financial Corp., 6.13%, 11/1/34 | | | 2,170,000 | | | | 2,534,451 | | |
Citigroup, Inc., 3.88%(LIBOR03M+117bps), 1/24/39,
Callable 1/24/38 @ 100 (c) | | | 1,760,000 | | | | 1,573,669 | | |
HSBC Holdings PLC, 5.10%, 4/5/21 (a) | | | 5,000,000 | | | | 5,164,050 | | |
JPMorgan Chase & Co., 5.60%, 7/15/41 | | | 1,710,000 | | | | 1,932,488 | | |
KeyBank NA, 2.25%, 3/16/20 | | | 6,523,000 | | | | 6,452,290 | | |
Morgan Stanley
3.75%, 2/25/23 (a) | | | 3,000,000 | | | | 2,994,780 | | |
3.13%, 7/27/26, MTN | | | 5,500,000 | | | | 5,069,680 | | |
Newcrest Finance Pty Ltd., 5.75%, 11/15/41 (b) | | | 1,720,000 | | | | 1,703,884 | | |
The Goldman Sachs Group, Inc.
2.35%, 11/15/21, Callable 11/15/20 @ 100 | | | 4,540,000 | | | | 4,374,063 | | |
5.75%, 1/24/22 (a) | | | 2,750,000 | | | | 2,879,360 | | |
UBS Group Funding Switzerland AG, 2.95%, 9/24/20 (a) (b) | | | 3,750,000 | | | | 3,710,138 | | |
Wells Fargo & Co., 4.90%, 11/17/45 (a) | | | 1,850,000 | | | | 1,801,919 | | |
| | | | 55,054,243 | | |
Health Care (1.9%): | |
Amgen, Inc., 4.40%, 5/1/45, Callable 11/1/44 @ 100 | | | 1,825,000 | | | | 1,709,916 | | |
Express Scripts Holding Co., 2.25%, 6/15/19 (a) | | | 3,102,000 | | | | 3,088,413 | | |
Gilead Sciences, Inc.
4.40%, 12/1/21, Callable 9/1/21 @ 100 (a) | | | 6,150,000 | | | | 6,342,494 | | |
4.80%, 4/1/44, Callable 10/1/43 @ 100 | | | 1,285,000 | | | | 1,282,957 | | |
| | | | 12,423,780 | | |
Industrials (1.5%): | |
AerCap Ireland Capital Ltd., 3.75%, 5/15/19 (a) | | | 2,900,000 | | | | 2,899,536 | | |
Canadian National Railway Co., 3.20%, 8/2/46, Callable 2/2/46 @ 100 | | | 825,000 | | | | 705,771 | | |
Kansas City Southern, 4.95%, 8/15/45, Callable 2/15/45 @ 100 | | | 1,440,000 | | | | 1,453,176 | | |
Rockwell Automation, Inc., 6.25%, 12/1/37 | | | 1,151,000 | | | | 1,387,312 | | |
Snap-on, Inc., 4.10%, 3/1/48, Callable 9/1/47 @ 100 | | | 1,100,000 | | | | 1,066,428 | | |
Valmont Industries, Inc., 5.00%, 10/1/44, Callable 4/1/44 @ 100 (a) | | | 2,603,000 | | | | 2,292,384 | | |
| | | | 9,804,607 | | |
Information Technology (0.7%): | |
Apple, Inc., 4.65%, 2/23/46, Callable 8/23/45 @ 100 | | | 1,569,000 | | | | 1,658,904 | | |
NVIDIA Corp., 2.20%, 9/16/21, Callable 8/16/21 @ 100 (e) | | | 1,230,000 | | | | 1,201,624 | | |
Texas Instruments, Inc., 4.15%, 5/15/48, Callable 11/15/47 @ 100 | | | 1,512,000 | | | | 1,509,520 | | |
| | | | 4,370,048 | | |
See notes to financial statements.
10
Victory Variable Insurance Funds
Victory INCORE Investment Quality Bond VIP Series | | Schedule of Portfolio Investments — continued
December 31, 2018 | |
Security Description | | Principal
Amount | | Value | |
Materials (0.6%): | |
LyondellBasell Industries NV, 5.00%, 4/15/19, Callable 2/7/19 @ 100 (a) | | $ | 1,800,000 | | | $ | 1,801,170 | | |
Rio Tinto Finance USA Ltd.
3.75%, 6/15/25, Callable 3/15/25 @ 100 | | | 1,415,000 | | | | 1,418,183 | | |
5.20%, 11/2/40 (e) | | | 723,000 | | | | 799,848 | | |
| | | | 4,019,201 | | |
Utilities (1.4%): | |
Arizona Public Service Co., 2.95%, 9/15/27, Callable 6/15/27 @ 100 | | | 1,800,000 | | | | 1,691,082 | | |
Consolidated Edison, Inc., 6.30%, 8/15/37 | | | 1,870,000 | | | | 2,284,504 | | |
Iberdrola International BV
6.75%, 9/15/33 | | | 373,000 | | | | 429,129 | | |
6.75%, 7/15/36 (e) | | | 783,000 | | | | 935,481 | | |
Nevada Power Co., 6.65%, 4/1/36 (a) | | | 600,000 | | | | 767,742 | | |
Oklahoma G&E Co., 5.25%, 5/15/41, Callable 11/15/40 @ 100 | | | 1,546,000 | | | | 1,702,285 | | |
Public Service Enterprise Group, Inc., 4.00%, 6/1/44,
Callable 12/1/43 @ 100 | | | 1,289,000 | | | | 1,238,587 | | |
| | | | 9,048,810 | | |
Total Corporate Bonds (Cost $139,919,786) | | | 134,689,256 | | |
U.S. Government Mortgage Backed Agencies (62.1%) | |
Federal Home Loan Mortgage Corp.
5.00%, 6/15/23 – 7/1/39 (a) | | | 2,043,268 | | | | 2,163,136 | | |
Series 4139, Class DA, 1.25%, 12/15/27 (a) | | | 7,884,802 | | | | 7,472,041 | | |
Series 4395, Class PA, 2.50%, 4/15/37 (a) | | | 3,049,119 | | | | 2,963,296 | | |
7.00%, 9/1/38 (a) | | | 77,650 | | | | 88,552 | | |
Series 4290, Class CA, 3.50%, 12/15/38 – 3/1/48 (a) | | | 30,806,409 | | | | 30,945,872 | | |
Series 3713, Class PA, 2.00%, 2/15/40 – 3/15/40 (a) | | | 9,382,652 | | | | 9,094,192 | | |
4.00%, 1/1/41 (a) | | | 2,024,751 | | | | 2,084,703 | | |
4.50%, 1/1/41 – 5/1/47 (a) | | | 12,495,629 | | | | 13,026,453 | | |
Series 4049, Class AB, 2.75%, 12/15/41 (a) | | | 1,524,368 | | | | 1,510,601 | | |
Series 4494, Class JA, 3.75%, 5/15/42 (a) | | | 6,099,258 | | | | 6,227,855 | | |
| | | | 75,576,701 | | |
Federal National Mortgage Association
6.00%, 8/1/21 – 2/1/37 (a) | | | 2,881,957 | | | | 3,188,520 | | |
5.00%, 4/1/23 – 12/1/39 (a) | | | 1,416,745 | | | | 1,504,451 | | |
7.50%, 12/1/29 (a) | | | 46,931 | | | | 53,677 | | |
8.00%, 1/1/30 – 9/1/30 (a) | | | 24,195 | | | | 27,828 | | |
7.00%, 2/1/32 – 6/1/32 (a) | | | 38,746 | | | | 44,148 | | |
4.63%(LIBOR12M+166bps), 12/1/36 (a) (c) | | | 137,945 | | | | 140,706 | | |
5.50%, 1/1/38 – 2/1/39 (a) | | | 902,495 | | | | 973,151 | | |
4.50%, 12/1/38 – 6/1/40 (a) | | | 9,713,951 | | | | 10,069,667 | | |
Series 2013-33, Class UD, 2.50%, 4/25/39 – 12/25/47 (a) | | | 9,286,424 | | | | 9,040,121 | | |
Series 2013-137, Class A, 3.50%, 3/25/40 – 12/25/50 (a) (f) | | | 115,540,716 | | | | 115,804,972 | | |
4.00%, 9/1/40 – 1/25/49 (a) (f) | | | 73,808,589 | | | | 75,452,406 | | |
Series 2011-101, Class LA, 3.00%, 10/25/40 – 1/25/49 (a) (f) | | | 85,968,130 | | | | 84,085,178 | | |
Series 2013-81, Class KA, 2.75%, 9/25/42 | | | 6,070,611 | | | | 5,935,384 | | |
Series 2013-44, Class PB, 1.75%, 1/25/43 | | | 6,503,444 | | | | 6,049,673 | | |
| | | | 312,369,882 | | |
See notes to financial statements.
11
Victory Variable Insurance Funds
Victory INCORE Investment Quality Bond VIP Series | | Schedule of Portfolio Investments — continued
December 31, 2018 | |
Security Description | | Shares or
Principal
Amount | | Value | |
Government National Mortgage Association
6.00%, 10/15/32 (a) | | $ | 103,800 | | | $ | 114,676 | | |
Series 2014-42, Class AD, 2.50%, 7/16/41 | | | 522,412 | | | | 511,327 | | |
Series 2016-116, Class GA, 1.75%, 11/20/44 | | | 12,028,027 | | | | 11,300,784 | | |
| | | | 11,926,787 | | |
Multi-family (0.0%): (g) | |
Collateralized Mortgage Obligations (0.0%): (g) | |
Government National Mortgage Association
6.00%, 12/15/33 (a) | | | 35,131 | | | | 39,298 | | |
Total U.S. Government Mortgage Backed Agencies (Cost $402,652,080) | | | 399,912,668 | | |
U.S. Treasury Obligations (25.3%) | |
U.S. Treasury Bonds
2.88%, 5/15/43 (a) | | | 11,646,000 | | | | 11,369,959 | | |
3.63%, 2/15/44 (a) | | | 9,638,000 | | | | 10,677,204 | | |
3.00%, 2/15/48 | | | 20,760,000 | | | | 20,650,850 | | |
U.S. Treasury Notes
2.75%, 9/30/20 | | | 9,400,000 | | | | 9,435,637 | | |
2.75%, 4/30/23 (a) | | | 16,008,000 | | | | 16,176,010 | | |
2.75%, 8/31/23 | | | 38,191,000 | | | | 38,622,301 | | |
2.88%, 10/31/23 | | | 7,000,000 | | | | 7,117,393 | | |
2.00%, 8/15/25 (a) | | | 16,219,000 | | | | 15,638,862 | | |
2.75%, 2/15/28 (a) | | | 30,450,000 | | | | 30,608,782 | | |
2.88%, 8/15/28 | | | 2,902,000 | | | | 2,946,903 | | |
Total U.S. Treasury Obligations (Cost $158,058,375) | | | 163,243,901 | | |
Collateral for Securities Loaned^ (0.3%) | |
BlackRock Liquidity Funds TempFund Portfolio, Institutional
Class, 2.49% (h) | | | 372,175 | | | | 372,175 | | |
Fidelity Investments Money Market Government Portfolio,
Class I, 2.28% (h) | | | 537,775 | | | | 537,775 | | |
Fidelity Investments Prime Money Market Portfolio,
Class I, 2.46% (h) | | | 16,606 | | | | 16,606 | | |
Goldman Sachs Financial Square Prime Obligations Fund, Institutional
Class, 2.55% (h) | | | 206,766 | | | | 206,766 | | |
JPMorgan Prime Money Market Fund, Capital Class,
2.49% (h) | | | 330,805 | | | | 330,805 | | |
Morgan Stanley Institutional Liquidity Prime Portfolio, Institutional
Class, 2.58% (h) | | | 496,239 | | | | 496,239 | | |
Total Collateral for Securities Loaned (Cost $1,960,366) | | | 1,960,366 | | |
Total Investments (Cost $755,674,339) — 116.5% | | | 751,269,975 | | |
Liabilities in excess of other assets — (16.5)% | | | (106,268,538 | ) | |
NET ASSETS — 100.00% | | $ | 645,001,437 | | |
^ Purchased with cash collateral from securities on loan.
(a) All or a portion of this security has been segregated as collateral for derivative instruments.
See notes to financial statements.
12
Victory Variable Insurance Funds
Victory INCORE Investment Quality Bond VIP Series | | Schedule of Portfolio Investments — continued
December 31, 2018 | |
(b) Rule 144A security or other security that is restricted as to resale to institutional investors. The Fund's Adviser has deemed this security to be liquid based upon procedures approved by the Board of Trustees. As of December 31, 2018, the fair value of these securities was $32,115,037 and amounted to 4.9% of net assets.
(c) Variable or Floating-Rate Security. Rate disclosed is as of December 31, 2018.
(d) The rate for certain asset backed and mortgage backed securities may vary based on factors relating to the pool of assets underlying the security. The rate disclosed is the rate in effect at December 31, 2018.
(e) All or a portion of this security is on loan.
(f) Security purchased on a when-issued basis.
(g) Amount represents less than 0.05% of net assets.
(h) Rate disclosed is the daily yield on December 31, 2018.
bps — Basis points
LIBOR — London InterBank Offered Rate
LIBOR01M — 1 Month US Dollar LIBOR, rate disclosed as of December 31, 2018, based on the last reset date of the security
LIBOR03M — 3 Month US Dollar LIBOR, rate disclosed as of December 31, 2018, based on the last reset date of the security
LIBOR12M — 12 Month US Dollar LIBOR, rate disclosed as of December 31, 2018, based on the last reset date of the security
LLC — Limited Liability Company
MTN — Medium Term Note
PLC — Public Limited Company
Futures Contracts Purchased
| | | Number of
Contracts | | Expiration
Date | | Notional
Amount | | Value | | Unrealized
Appreciation
(Depreciation) | |
5-Year U.S. Treasury Note Future | | | 175 | | | 3/29/19 | | $ | 19,842,598 | | | $ | 20,070,313 | | | $ | 227,715 | | |
Futures Contracts Sold
| | | Number of
Contracts | | Expiration
Date | | Notional
Amount | | Value | | Unrealized
Appreciation
(Depreciation) | |
10-Year U.S. Treasury Note Future | | | 317 | | | 3/20/19 | | $ | 38,108,778 | | | $ | 38,678,946 | | | $ | (570,168 | ) | |
2-Year U.S.Treasury Note Future | | | 145 | | | 3/29/19 | | | 30,585,834 | | | | 30,785,327 | | | | (199,493 | ) | |
30-Year U.S. Treasury Bond Future | | | 128 | | | 3/20/19 | | | 17,905,683 | | | | 18,688,000 | | | | (782,317 | ) | |
| | | | | | | | | | | $ | (1,551,978 | ) | |
Total unrealized appreciation | | | | | | | | | | $ | 227,715 | | |
Total unrealized depreciation | | | | | | | | | | | (1,551,978 | ) | |
Total net unrealized appreciation(depreciation) | | | | | | | | | | $ | (1,324,263 | ) | |
See notes to financial statements.
13
Victory Variable Insurance Funds
Victory INCORE Investment Quality Bond VIP Series | | Schedule of Portfolio Investments — continued
December 31, 2018 | |
Credit Default Swap Agreements — Sell Protection (a)
Underlying
Instrument | | Fixed
Deal
Received
Rate | | Expiration
Date | | Payment
Frequency | | Implied
Credit
Spread at
December 31,
2018 (b) | | Notional
Amount (c) | | Value | | Premiums
Paid
(Received) | | Unrealized
Appreciation
(Depreciation) | |
CDX North
America
High Yield
Index;
Series 31 | | | 5.00 | % | | 12/20/23 | | Daily | | | 4.46 | % | | $ | 60,800,000 | | | $ | 1,241,851 | | | $ | 4,407,260 | | | $ | (3,165,409 | ) | |
| | | $ | 1,241,851 | | | $ | 4,407,260 | | | $ | (3,165,409 | ) | |
(a) When a credit event occurs as defined under the terms of the swap agreement, the Fund as a seller of credit protection will either (i) pay to the buyer of protection an amount equal to the par value of the defaulted reference entity and take delivery of the reference entity or (ii) pay a net amount equal to the par value of the defaulted reference entity less its recovery value.
(b) Implied credit spread, represented in absolute terms, utilized in determining the value of the credit default swap agreements as of period end will serve as an indicator of the current status of the payment/performance risk and represent the likelihood or risk of default for the credit derivative. The implied credit spread of a referenced entity reflects the cost of buying/selling protection and may include payments required to be made to enter into the agreement. Generally, wider credit spreads represent a perceived deterioration of the referenced entity's credit soundness and a greater likelihood or risk of default or other credit event occurring as defined under the terms of the swap agreement.
(c) The notional amount represents the maximum potential amount the Fund could be required to pay as a seller of credit protection if a credit event occurs, as defined under the terms of the swap agreement, for each security included in the CDX North America High Yield Index.
See notes to financial statements.
14
Victory Variable Insurance Funds | | Statement of Assets and Liabilities
December 31, 2018 | |
| | | Victory INCORE
Investment Quality
Bond VIP Series | |
ASSETS: | |
Investments, at value (Cost $755,674,339) | | $ | 751,269,975 | (a) | |
Cash and cash equivalents | | | 10,801,618 | | |
Deposits with brokers for futures contracts | | | 817,949 | | |
Deposits with brokers for swap agreements | | | 4,318,538 | | |
Interest and dividends receivable | | | 3,523,041 | | |
Receivable for capital shares issued | | | 13,503 | | |
Receivable for investments sold | | | 1,330,574 | | |
Variation margin receivable on open futures contracts | | | 43,750 | | |
Variation margin receivable on open swap agreements | | | 74,308 | | |
Receivable from Adviser | | | 186,847 | | |
Total Assets | | | 772,380,103 | | |
LIABILITIES: | |
Payables: | |
Collateral received on loaned securities | | | 1,960,366 | | |
Investments purchased | | | 124,641,125 | | |
Capital shares redeemed | | | 94,550 | | |
Variation margin on open futures contracts | | | 204,230 | | |
Accrued expenses and other payables: | |
Investment advisory fees | | | 274,382 | | |
Administration fees | | | 33,674 | | |
Custodian fees | | | 7,920 | | |
Transfer agent fees | | | 72,928 | | |
Chief Compliance Officer fees | | | 1,228 | | |
Trustees' fees | | | 628 | | |
Other accrued expenses | | | 87,635 | | |
Total Liabilities | | | 127,378,666 | | |
NET ASSETS: | |
Capital | | | 649,062,734 | | |
Total distributable earnings/(loss) | | | (4,061,297 | ) | |
Net Assets | | $ | 645,001,437 | | |
Shares Outstanding (unlimited shares authorized, with a par value
of $0.001 per share): | | | 53,966,829 | | |
Net asset value: | | $ | 11.95 | | |
(a) Includes $1,900,810 of securities on loan.
See notes to financial statements.
15
Victory Variable Insurance Funds | | Statement of Operations
For the Year Ended December 31, 2018 | |
| | | Victory INCORE
Investment Quality
Bond VIP Series | |
Investment Income: | |
Interest | | $ | 21,343,031 | | |
Securities lending (net of fees) | | | 15,762 | | |
Total Income | | | 21,358,793 | | |
Expenses: | |
Investment advisory fees | | | 3,462,863 | | |
Administration fees | | | 413,829 | | |
Custodian fees | | | 33,004 | | |
Transfer agent fees | | | 146,671 | | |
Trustees' fees | | | 56,873 | | |
Chief Compliance Officer fees | | | 6,008 | | |
Legal and audit fees | | | 94,036 | | |
Interest expense on interfund lending | | | 29 | | |
Other expenses | | | 105,307 | | |
Total Expenses | | | 4,318,620 | | |
Expenses waived/reimbursed by Adviser | | | (441,458 | ) | |
Net Expenses | | | 3,877,162 | | |
Net Investment Income (Loss) | | | 17,481,631 | | |
Realized/Unrealized Gains (Losses) from Investment Transactions: | |
Net realized gains (losses) from investment transactions | | | (10,355,978 | ) | |
Net realized gains (losses) from futures transactions | | | (2,898,933 | ) | |
Net realized gains (losses) from swap transactions | | | 2,246,399 | | |
Net change in unrealized appreciation/depreciation on investments | | | (6,335,521 | ) | |
Net change in unrealized appreciation/depreciation on futures transactions | | | (1,125,053 | ) | |
Net change in unrealized appreciation/depreciation on swap transactions | | | (3,373,041 | ) | |
Net realized/unrealized gains (losses) on investments | | | (21,842,127 | ) | |
Change in net assets resulting from operations | | $ | (4,360,496 | ) | |
See notes to financial statements.
16
Victory Variable Insurance Funds | | Statements of Changes in Net Assets | |
| | | Victory INCORE Investment
Quality Bond VIP Series | |
| | | Year
Ended
December 31,
2018 | | Year
Ended
December 31,
2017 | |
From Investment Activities: | |
Operations: | |
Net investment income (loss) | | $ | 17,481,631 | | | $ | 16,911,088 | | |
Net realized gains (losses) from investment transactions | | | (11,008,512 | ) | | | 4,641,216 | | |
Net change in unrealized appreciation (depreciation)
on investments | | | (10,833,615 | ) | | | 8,760,833 | | |
Change in net assets resulting from operations | | | (4,360,496 | ) | | | 30,313,137 | | |
Distributions to Shareholders: (a) | |
Change in net assets resulting from distributions to shareholders | | | (4,289,680 | ) | | | (17,209,084 | ) | |
Change in net assets resulting from capital transactions | | | (73,069,861 | ) | | | (2,674,726 | ) | |
Change in net assets | | | (81,720,037 | ) | | | 10,429,327 | | |
Net Assets: | |
Beginning of period | | | 726,721,474 | | | | 716,292,147 | | |
End of period | | $ | 645,001,437 | | | $ | 726,721,474 | | |
Capital Transactions: | |
Proceeds from shares issued | | $ | 47,220,231 | | | $ | 84,023,731 | | |
Distributions reinvested | | | 4,289,680 | | | | 17,209,084 | | |
Cost of shares redeemed | | | (124,579,772 | ) | | | (103,907,541 | ) | |
Change in net assets resulting from capital transactions | | $ | (73,069,861 | ) | | $ | (2,674,726 | ) | |
Share Transactions: | |
Issued | | | 3,953,299 | | | | 6,961,615 | | |
Reinvested | | | 360,968 | | | | 1,429,326 | | |
Redeemed | | | (10,495,215 | ) | | | (8,518,824 | ) | |
Change in Shares | | | (6,180,948 | ) | | | (127,883 | ) | |
(a) Current and prior year distributions to shareholders have been reclassified and conform to amended GAAP presentation under Regulation S-X (See Item 10 in the Notes to Financial Statements).
See notes to financial statements.
17
Victory Variable Insurance Funds | | Financial Highlights | |
For a Share Outstanding Throughout Each Period
| | | Victory INCORE Investment Quality Bond VIP Series | |
| | | Year
Ended
December 31,
2018 | | Year
Ended
December 31,
2017 | | Year
Ended
December 31,
2016 | | Year
Ended
December 31,
2015 | | Year
Ended
December 31,
2014 | |
Net Asset Value, Beginning of Period | | $ | 12.08 | | | $ | 11.88 | | | $ | 11.98 | | | $ | 12.38 | | | $ | 12.18 | | |
Investment Activities: | |
Net investment income (loss) | | | 0.30 | (a) | | | 0.28 | (a) | | | 0.27 | (a) | | | 0.31 | (a) | | | 0.38 | | |
Net realized and unrealized gains
(losses) on investments | | | (0.35 | ) | | | 0.21 | | | | 0.15 | | | | (0.27 | ) | | | 0.30 | | |
Total from Investment
Activities | | | (0.05 | ) | | | 0.49 | | | | 0.42 | | | | 0.04 | | | | 0.68 | | |
Distributions to Shareholders: | |
Net investment income | | | (0.08 | ) | | | (0.29 | ) | | | (0.30 | ) | | | (0.32 | ) | | | (0.38 | ) | |
Net realized gains from investments | | | — | (b) | | | — | | | | (0.22 | ) | | | (0.12 | ) | | | (0.10 | ) | |
Total Distributions to
Shareholders | | | (0.08 | ) | | | (0.29 | ) | | | (0.52 | ) | | | (0.44 | ) | | | (0.48 | ) | |
Capital Contributions from Prior
Custodian, Net (See Note 8) | | | — | | | | — | | | | — | (b) | | | — | | | | — | | |
Net Asset Value, End of Period | | $ | 11.95 | | | $ | 12.08 | | | $ | 11.88 | | | $ | 11.98 | | | $ | 12.38 | | |
Total Return (c) | | | (0.41 | )% | | | 4.15 | % | | | 3.53 | %(d) | | | 0.33 | % | | | 5.55 | % | |
Ratios/Supplemental Data: | |
Net Assets at end of period (000) | | $ | 645,001 | | | $ | 726,721 | | | $ | 716,292 | | | $ | 755,696 | | | $ | 802,377 | | |
Ratio of net expenses to average net assets | | | 0.56 | % | | | 0.56 | % | | | 0.55 | % | | | 0.56 | % | | | 0.56 | % | |
Ratio of net investment income (loss) to
average net assets | | | 2.52 | % | | | 2.28 | % | | | 2.17 | % | | | 2.47 | % | | | 2.93 | % | |
Ratio of gross expenses to average net assets | | | 0.62 | %(e) | | | 0.61 | %(e) | | | 0.55 | % | | | 0.56 | % | | | 0.56 | % | |
Portfolio turnover | | | 109 | % | | | 83 | % | | | 142 | % | | | 41 | % | | | 47 | % | |
(a) Per share net investment income (loss) has been calculated using the average daily shares method.
(b) Amount is less than $0.005 per share.
(c) Total returns do not reflect the effects of charges deducted pursuant to the terms of The Guardian Insurance & Annuity Company, Inc's variable contracts. Inclusion of such charges would reduce the total returns for all periods shown.
(d) The Fund received monies related to a nonrecurring refund from the prior Custodian. The corresponding impact to the total return was less than 0.01% for the period shown. (See Note 8)
(e) During the period, certain fees were reduced and/or reimbursed. If such fee reductions and/or reimbursements had not occurred, the ratios would have been as indicated.
See notes to financial statements.
18
Victory Variable Insurance Funds | | Notes to Financial Statements
December 31, 2018 | |
1. Organization:
Victory Variable Insurance Funds (the "Trust") was organized on February 11, 1998 as a Delaware statutory trust. The Trust is registered under the Investment Company Act of 1940, as amended (the "1940 Act"), as a diversified open-end investment company. The Trust is comprised of nine funds and is authorized to issue an unlimited number of shares, which are units of beneficial interest with a par value of $0.001 per share.
The accompanying financial statements are those of the Victory INCORE Investment Quality Bond VIP Series (the "Fund"). The Fund offers a single class of shares: Class I Shares. Sales of shares of the Fund may only be made to certain separate accounts of The Guardian Insurance & Annuity Company, Inc. ("GIAC") that fund certain variable annuity and variable life insurance contracts issued by GIAC. GIAC is a wholly owned subsidiary of The Guardian Life Insurance Company of America ("Guardian Life").
Under the Trust's organizational documents, its officers and trustees are indemnified against certain liabilities arising out of the performance of their duties to the Fund. In addition, in the normal course of business, the Fund enters into contracts with its vendors and others that provide for general indemnifications. The Fund's maximum exposure under these arrangements is unknown, as this would involve future claims that may be made against the Fund. However, based on experience, the Fund expects that risk of loss to be remote.
2. Significant Accounting Policies:
The following is a summary of significant accounting policies followed by the Trust in the preparation of its financial statements. The policies are in conformity with accounting principles generally accepted in the United States of America ("GAAP"). The preparation of financial statements in accordance with GAAP requires management to make estimates and assumptions that affect the reported amounts of assets and liabilities and disclosure of contingent assets and liabilities at the date of the financial statements and the reported amounts of income and expenses for the period. Actual results could differ from those estimates. The Fund follows the specialized accounting and reporting requirements under GAAP that are applicable to investment companies.
Investment Valuation:
The Fund records investments at fair value. Fair value is defined as the price that would be received to sell an asset or paid to transfer a liability in an orderly transaction between market participants at the measurement date.
The valuation techniques described below maximize the use of observable inputs and minimize the use of unobservable inputs in determining fair value. The inputs used for valuing the Fund's investments are summarized in the three broad levels listed below:
• Level 1 — quoted prices in active markets for identical securities
• Level 2 — other significant observable inputs (including quoted prices for similar securities or interest rates applicable to those securities, etc.)
• Level 3 — significant unobservable inputs (including the Fund's own assumptions in determining the fair value of investments)
Changes in valuation techniques may result in transfers in or out of an assigned level within the disclosure hierarchy. The inputs or methodologies used for valuation techniques are not necessarily an indication of the risk associated with entering into those investments.
Portfolio securities listed or traded on securities exchanges, including American Depositary Receipts ("ADRs") and Rights, are valued at the closing price on the exchange or system where the security is principally traded, if available, or at the Nasdaq Official Closing Price. If there have been no sales for that day on the exchange or system, then a security is valued at the last available bid quotation on the exchange or system where the security is principally traded. In each of these situations, valuations are typically categorized as Level 1 in the fair value hierarchy.
19
Victory Variable Insurance Funds | | Notes to Financial Statements — continued
December 31, 2018 | |
Futures contracts are valued at the settlement price established each day by the board of trade or an exchange on which they are traded. These valuations are typically categorized as Level 1 in the fair value hierarchy.
Swap agreements are valued at the mean between the current bid and ask prices. These valuations are typically categorized as Level 2 in the fair value hierarchy.
Debt securities of United States ("U.S.") issuers (other than short-term investments maturing in 60 days or less), including corporate and municipal securities, are valued on the basis of bid valuations provided by dealers or an independent pricing service approved by the Trust's Board of Trustees (the "Board"). Short-term investments maturing in 60 days or less may be valued at amortized cost, which approximates market value. Under the amortized cost method, premium or discount, if any, is amortized or accreted, respectively, on a constant basis to the maturity of the security. In each of these situations, valuations are typically categorized as Level 2 in the fair value hierarchy.
Investments for which there are no such quotations, or for which quotations do not appear reliable, are valued at fair value in accordance with procedures established by and under the general supervision and responsibility of the Board. These valuations are typically categorized as Level 2 or Level 3 in the fair value hierarchy, based on the observability of inputs used to determine the fair value.
A summary of the valuations as of December 31, 2018, based upon the three levels defined above, is included in the table below while the breakdown, by category, of investments is disclosed in the Schedule of Portfolio Investments:
| | | LEVEL 1 —
Quoted Prices | | LEVEL 2 —
Other Significant
Observable Inputs | | Total | |
| | | Investments
in
Securities | | Other
Financial
Investments^ | | Investments
in
Securities | | Other
Financial
Investments^ | | Investments
in
Securities | | Other
Financial
Investments^ | |
Asset Backed Securities | | $ | — | | | $ | — | | | $ | 28,577,096 | | | $ | — | | | $ | 28,577,096 | | | $ | — | | |
Collateralized Mortgage Obligations | | | — | | | | — | | | | 16,366,713 | | | | — | | | | 16,366,713 | | | | — | | |
Residential Mortgage Backed Securities | | | — | | | | — | | | | 6,519,975 | | | | — | | | | 6,519,975 | | | | — | | |
Corporate Bonds | | | — | | | | — | | | | 134,689,256 | | | | — | | | | 134,689,256 | | | | — | | |
U.S. Government Mortgage Backed Agencies | | | — | | | | — | | | | 399,912,668 | | | | — | | | | 399,912,668 | | | | — | | |
U.S. Treasury Obligations | | | — | | | | — | | | | 163,243,901 | | | | — | | | | 163,243,901 | | | | — | | |
Collateral for Securities Loaned | | | 1,960,366 | | | | — | | | | — | | | | — | | | | 1,960,366 | | | | — | | |
Futures Contracts | | | — | | | | (1,324,263 | ) | | | — | | | | — | | | | — | | | | (1,324,263 | ) | |
Credit Default Swap Agreements | | | — | | | | — | | | | — | | | | (3,165,409 | ) | | | — | | | | (3,165,409 | ) | |
Total | | $ | 1,960,366 | | | $ | (1,324,263 | ) | | $ | 749,309,609 | | | $ | (3,165,409 | ) | | $ | 751,269,975 | | | $ | (4,489,672 | ) | |
^ Other Financial instruments include any derivative instruments not reflected in the Schedule of Portfolio Investments as investment securities, such as futures contracts and swap agreements. These instruments are generally recorded in the financial statements at the unrealized gain or loss on the investment.
For the year ended December 31, 2018, there were no Level 3 investments for which significant unobservable inputs were used to determine fair value.
Securities Purchased on a When-Issued Basis:
The Fund may purchase securities on a when-issued basis. When-issued securities are securities purchased for delivery beyond normal settlement periods at a stated price and/or yield, thereby involving the risk that the price and/or yield obtained may be more or less than those available in the market when delivery takes place. At the time the Fund makes the commitment to purchase a security on a when-issued basis, the Fund records the transaction and reflects the value of the security in determining net asset value. No interest accrues to the Fund until the transaction settles and payment takes place. Normally, the settlement date occurs within one month of the purchase. A segregated
20
Victory Variable Insurance Funds | | Notes to Financial Statements — continued
December 31, 2018 | |
account is established and the Fund maintains cash and/or marketable securities at least equal in value to commitments for when-issued securities. If the Fund owns when-issued securities, these values are included in "Payable for investments purchased" on the accompanying Statements of Assets and Liabilities. As of December 31, 2018, the Fund had no outstanding when-issued purchase commitments.
Loans:
Floating rate loans in which the Fund invests are primarily "senior" loans. Senior floating rate loans typically hold a senior position in the capital structure of the borrower, are typically secured by specific collateral, and have a claim on the assets and/or stock of the borrower that is senior to that held by subordinated debtholders and stockholders of the borrower. While these protections may reduce risk, these investments still present significant credit risk. A significant portion of the Fund's floating rate investments may be issued in connection with highly leveraged transactions such as leveraged buyouts, leveraged recapitalization loans, and other types of acquisition financing. Obligations in these types of transactions are subject to greater credit risk (including default and bankruptcy) than many other investments and may be, or become, illiquid. See the note below regarding below investment grade securities.
The Fund may purchase second lien loans (secured loans with a claim on collateral subordinate to a senior lender's claim on such collateral), fixed rate loans, unsecured loans, and other debt obligations.
Transactions in loans often settle on a delayed basis, and the Fund may not receive the proceeds from the sale of a loan or pay for a loan purchase for a substantial period of time after entering into the transactions.
Below Investment Grade Securities:
The Fund may invest in below investment grade securities (i.e. lower-quality, "junk" debt), which are subject to various risks. Lower-quality debt is considered to be speculative because it is less certain that the issuer will be able to pay interest or repay the principal than in the case of investment grade debt. These securities can involve a substantially greater risk of default than higher-rated securities, and their values can decline significantly over short periods of time. Lower-quality debt securities tend to be more sensitive to adverse news about their issuers, the market and the economy in general, than higher-quality debt securities. The market for these securities can be less liquid, especially during periods of recession or general market decline.
Investment Companies:
The Fund may invest in portfolios of open-end investment companies. These investment companies value securities in their portfolios for which market quotations are readily available at their market values (generally the last reported sale price) and all other securities and assets at their fair value by the methods established by the board of directors of the underlying fund.
Derivative Instruments:
Futures Contracts:
The Fund may enter into contracts for the future delivery of securities or foreign currencies and futures contracts based on a specific security, class of securities, foreign currency or an index, and purchase or sell options on any such futures contracts. A futures contract on a securities index is an agreement obligating either party to pay, and entitling the other party to receive, while the contract is outstanding, cash payments based on the level of a specified securities index. No physical delivery of the underlying asset is made. The Fund may enter into futures contracts in an effort to hedge against market risks. The acquisition of put and call options on futures contracts will give the Fund the right (but not the obligation), for a specified price, to sell or to purchase the underlying futures contract, upon exercise of the option, at any time during the option period. Futures transactions involve brokerage costs and require the Fund to segregate assets to cover contracts that would require it to purchase securities or
21
Victory Variable Insurance Funds | | Notes to Financial Statements — continued
December 31, 2018 | |
currencies. A good faith margin deposit, known as initial margin, of cash or government securities with a broker or custodian is required to initiate and maintain open positions in futures contracts. Subsequent payments, known as variation margin, are made or received by the Fund based on the change in the market value of the position and are recorded as unrealized appreciation or depreciation until the contract is closed out, at which time the gain or loss is realized. The Fund may lose the expected benefit of futures transactions if interest rates, exchange rates or securities prices change in an unanticipated manner. Such unanticipated changes may also result in lower overall performance than if the Fund had not entered into any futures transactions. In addition, the value of the Fund's futures positions may not prove to be perfectly or even highly correlated with the value of its portfolio securities or foreign currencies, limiting the Fund's ability to hedge effectively against interest rate, exchange rate and/or market risk and giving rise to additional risks. There is no assurance of liquidity in the secondary market for purposes of closing out futures positions. The collateral held by the Fund is presented on the Statement of Assets and Liabilities under Deposits with brokers for futures contracts.
As of December 31, 2018, the Fund entered into Futures Contracts primarily for the strategy of hedging or other purposes, including but not limited to, providing liquidity and equitizing cash.
Credit Derivatives:
The Fund may enter into credit derivatives, including centrally-cleared credit default swaps on individual obligations or credit indices. The Fund may use these investments (i) as alternatives to direct long or short investment in a particular security or securities, (ii) to adjust the Fund's asset allocation or risk exposure, or (iii) for hedging purposes. The use by the Fund of credit default swaps may have the effect of creating a short position in a security. Credit derivatives can create investment leverage and may create additional investment risks that may subject the Fund to greater volatility than investments in more traditional securities, as described in the Fund's Statement of Additional Information.
Credit default swap ("CDS") agreements on credit indices involve one party making a stream of payments (referred to as the buyer of protection) to another party (the seller of protection) in exchange for the right to receive a specified return in the event of a write-down, principal shortfall, interest shortfall or default of all or part of the referenced entities comprising the credit index. A credit index is a basket of credit instruments or exposures designed to be representative of a specific sector of the credit market as a whole. These indices are made up of reference credits that are judged by a poll of dealers to be the most liquid entities in the CDS.
The counterparty risk for cleared swap agreements is generally lower than uncleared over-the-counter swap agreements because generally a clearing organization becomes substituted for each counterparty to a cleared swap agreement and, in effect, guarantees each party's performance under the contract as each party to a trade looks only to the clearing organization for performance of financial obligations. However, there can be no assurance that the clearing organization, or its members, will satisfy its obligations to the Fund.
The Fund may enter into CDS agreements either as a buyer or seller. The Fund may buy protection under a CDS to attempt to mitigate the risk of default or credit quality deterioration in one or more individual holdings or in a segment of the fixed income securities market. The Fund may sell protection under a CDS in an attempt to gain exposure to an underlying issuer's credit quality characteristics without investing directly in that issuer. For swaps entered with an individual counterparty, the Fund bears the risk of loss of the uncollateralized amount expected to be received under a CDS agreement in the event of the default or bankruptcy of the counterparty. CDS agreements are generally valued at a price at which the counterparty to such agreement would terminate the agreement. The Fund may also enter into cleared swaps.
Upon entering into a cleared CDS, the Fund may be required to deposit with the broker an amount of cash or cash equivalents in the range of approximately 3% to 6% of the notional amount for CDS on high yield debt issuers (this amount is subject to change by the clearing organization that clears the trade). This amount, known as "initial margin," is in the nature of a performance bond or good faith deposit on the CDS and is returned to a Fund upon termination of the CDS, assuming all contractual obligations have been satisfied. Subsequent payments, known as "variation margin," to and from the
22
Victory Variable Insurance Funds | | Notes to Financial Statements — continued
December 31, 2018 | |
broker will be made daily as the price of the CDS fluctuates, making the long and short positions in the CDS contract more or less valuable, a process known as "marking-to-market." The premium (discount) payments are built into the daily price of the CDS and thus are amortized through the variation margin. The variation margin payment also includes the daily portion of the periodic payment stream.
The maximum potential amount of future payments (undiscounted) that the Fund as a seller of protection could be required to make under a CDS agreement equals the notional amount of the agreement. Notional amounts of each individual CDS agreement outstanding as of period end for which the Fund is the seller of protection are disclosed on the Schedule of Portfolio Investments. These potential amounts would be partially offset by any recovery values of the respective referenced obligations, upfront payments received upon entering into the agreement, periodic interest payments, or net amounts received from the settlement of buy protection CDS agreements entered into by the Fund for the same referenced entity or entities.
As of December 31, 2018, the Fund entered into centrally cleared CDS agreements primarily for the strategy of asset allocation and risk exposure management.
Summary of Derivative Instruments:
The following table presents the effect of derivative instruments on the Statement of Assets and Liabilities, categorized by risk exposure, as of December 31, 2018.
| | | Assets | | Liabilities | |
| | | Variation
Margin
Receivable
on Open
Futures
Contracts* | | Variation
Margin
Receivable
on Open
Swap
Agreements* | | Variation
Margin
Payable on
Open
Futures
Contracts* | | Variation
Margin
Payable on
Open
Swap
Agreements* | |
Credit Risk Exposure | | $ | — | | | $ | — | | | $ | — | | | $ | 3,165,409 | | |
Interest Rate Risk Exposure | | | 227,715 | | | | — | | | | 1,551,978 | | | | — | | |
* Includes cumulative appreciation (depreciation) of futures contracts and centrally cleared swap agreements as reported in the Schedule of Investments. Only current day's variation margin is reported within the Statement of Assets and Liabilities.
The following table presents the effect of derivative instruments on the Statement of Operations, categorized by risk exposure, for the year ended December 31, 2018.
| | | Net Realized Gains (Losses) on
Derivatives Recognized as
a Result from Operations | | Net Change in Unrealized
Appreciation/Depreciation
on Derivatives Recognized
as a Result of Operations | |
| | | Net Realized
Gains (Losses)
from Futures
Transactions | | Net Realized
Gains (Losses)
from Swap
Transactions | | Net Change in
Unrealized
Appreciation/
Depreciation
on Futures
Transactions | | Change in Net
Unrealized
Appreciation/
Depreciation
on Swap
Transactions | |
Credit Risk Exposure | | $ | — | | | $ | 2,246,399 | | | $ | — | | | $ | (3,373,041 | ) | |
Interest Rate Risk Exposure | | | (2,898,933 | ) | | | — | | | | (1,125,053 | ) | | | — | | |
All open derivative positions at period end are reflected on the Fund's Schedule of Portfolio Investments. The underlying face value of open derivative positions relative to the Fund's net assets at period end is generally representative of the notional amount of open positions to net assets throughout the period.
Investment Transactions and Related Income:
Changes in holdings of investments are accounted for no later than one business day following the trade date. For financial reporting purposes, however, investment transactions are accounted for on
23
Victory Variable Insurance Funds | | Notes to Financial Statements — continued
December 31, 2018 | |
trade date on the last business day of the reporting period. Interest income is recognized on an accrual basis and includes, where applicable, the amortization of premiums or accretion of discounts. Dividend income is recorded on the ex-dividend date. Gains or losses realized on sales of securities are determined by comparing the identified cost of the security lot sold with the net sales proceeds.
The Fund may receive other income from investment in loan assignments and/or unfunded commitments, including amendment fees, consent fees and commitment fees. These fees are recorded as income when received by the Fund. These amounts are included in Interest Income in the Statement of Operations.
Withholding taxes on interest, dividends and gains as a result of certain investments in ADRs by the Fund have been provided for in accordance with each investment's applicable country's tax rules and rates.
Securities Lending:
The Trust has entered into a Master Securities Lending Agreement ("MSLA") with Citibank, N.A. ("Citibank" or the "Agent"). Under the terms of the MSLA, the Fund may lend securities to certain broker-dealers and banks in exchange for collateral in the amount of at least 102% of the value of U.S. securities loaned or at least 105% of the value of non-U.S. securities loaned, marked-to-market daily. Any collateral shortfalls associated with increases in the valuation of the securities loaned are adjusted the next business day. The collateral can be received in the form of cash collateral and/or non-cash collateral. Non-cash collateral can include U.S. Government Securities, letters of credit and certificates of deposit. The cash collateral is invested in short-term instruments or cash equivalents as noted on the Fund's Schedule of Portfolio Investments. The Trust does not have effective control of the non-cash collateral and therefore it is not disclosed in the Fund's Schedule of Portfolio Investments. The Fund continues to benefit from interest or dividends on the securities loaned and may also earn a return from the collateral. The Fund pays various fees in connection with the investment of cash collateral. The Fund pays the Agent fees based on the investment income received from securities lending activities. Securities lending income is disclosed in the Fund's Statement of Operations. Although risk is mitigated by the collateral, the Fund could experience a delay in recovering its securities and possible loss of income or value if the borrower fails to return them.
Securities lending transactions are entered into by the Fund under the MSLA, which permits the Fund, under certain circumstances such as an event of default, to offset amounts payable by the Fund to the same counterparty against amounts receivable from the counterparty to create a net payment due to or from the Fund.
The following table is a summary of the Fund's securities lending transactions which are subject to offset under the MSLA as of December 31, 2018. These transactions are accounted for as secured borrowings with an overnight and continuous contractual maturity for cash collateral, and greater than overnight and continuous contractual maturity for non-cash collateral.
Gross
Amount of
Recognized
Assets
(Value of | | Value of
Cash | | Value of Non-cash Collateral
Received by Maturity | | | |
Securities
on Loan) | | Collateral
Received | | <30 Days | | Between 30 &
90 days | | >90 Days | | Net
Amount | |
| $ | 1,900,810 | | | $ | 1,960,366 | | | $ | — | | | $ | — | | | $ | — | | | $ | 59,556 | | |
Dividends to Shareholders:
Dividends from net investment income, if any, are declared and paid annually by the Fund. Distributable net realized gains, if any, are declared and distributed at least annually.
The amounts of dividends from net investment income and distributions from net realized gains are determined in accordance with federal income tax regulations, which may differ from GAAP. To the
24
Victory Variable Insurance Funds | | Notes to Financial Statements — continued
December 31, 2018 | |
extent these "book/tax" differences are permanent in nature (e.g., net operating loss, distribution reclassification, and deemed distribution due to shareholder redemptions), such amounts are reclassified within the components of net assets based on their federal tax-basis treatment; temporary differences (e.g., wash sales) do not require reclassification. To the extent dividends and distributions exceed net investment income and net realized gains for tax purposes, they are reported as distributions of capital. Net investment losses incurred by the Fund may be reclassified as an offset to capital on the accompanying Statement of Assets and Liabilities.
As of December 31, 2018, on the Statement of Assets and Liabilities, there were no permanent book-to-tax differences, reclassification adjustments.
Federal Income Taxes:
It is the policy of the Fund to continue to qualify as a regulated investment company by complying with the provisions available to certain investment companies, as defined in applicable sections of the Internal Revenue Code, and to make distributions of net investment income and net realized gains sufficient to relieve it from all, or substantially all, federal income taxes. Accordingly, no provision for federal income taxes is required in the financial statements. The Fund has a tax year end of December 31.
Management of the Fund has reviewed tax positions taken in tax years that remain subject to examination by all major tax jurisdictions, including federal (i.e., the last four tax year ends and the interim tax period since then). Management believes that there is no tax liability resulting from unrecognized tax benefits related to uncertain tax positions taken.
Allocations:
Expenses directly attributable to the Fund are charged to the Fund, while expenses which are attributable to more than one fund in the Trust, or jointly with an affiliated trust, are allocated among the respective funds in the Trust and/or affiliated trust based upon net assets or another appropriate basis.
Affiliated Securities Transactions:
Pursuant to Rule 17a-7 under the 1940 Act, the Fund may engage in securities transactions with affiliated investment companies and advisory accounts managed by the Adviser and any applicable sub-adviser. Any such purchase or sale transaction must be effected without brokerage commission or other remuneration, except for customary transfer fees. The transaction must be effected at the current market price, which is either the security's last sale price on an exchange or, if there are no transactions in the security that day, at the average of the highest bid and lowest asked price. For the year ended December 31, 2018, the Fund did not engage in any Rule 17a-7 transactions under the 1940 Act.
3. Purchases and Sales of Securities:
Purchases and sales of securities (excluding securities maturing less than one year from acquisition) for the year ended December 31, 2018 were as follows for the Fund:
Purchases
(excluding U.S.
Government
Securities) | | Sales
(excluding U.S.
Government
Securities) | | Purchases
of U.S.
Government
Securities | | Sales
of U.S.
Government
Securities | |
| $ | 147,714,823 | | | $ | 337,828,145 | | | $ | 580,696,532 | | | $ | 442,311,712 | | |
25
Victory Variable Insurance Funds | | Notes to Financial Statements — continued
December 31, 2018 | |
4. Fees and Transactions with Affiliates and Related Parties:
Investment advisory services are provided to the Fund by Victory Capital Management Inc. ("VCM" or the "Adviser"), a New York corporation registered as an investment adviser with the Securities and Exchange Commission ("SEC"). The Adviser is a wholly-owned indirect subsidiary of Victory Capital Holdings Inc., a publicly traded Delaware corporation, and a wholly-owned direct subsidiary of Victory Capital Operating, LLC.
Under the terms of the Investment Advisory Agreement, the Adviser is entitled to receive 0.50% of the average daily net assets of the Fund. The Adviser may use its resources to assist with the Fund's distribution and marketing expenses.
VCM also serves as the Fund's administrator and fund accountant. Under an Administration and Fund Accounting Agreement, VCM is paid for its services an annual fee at a rate of 0.08% of the first $15 billion in average daily net assets of the Trust, Victory Portfolios and Victory Portfolios II (collectively, the "Trusts"), 0.05% of the average daily net assets above $15 billion to $30 billion of the Trusts and 0.04% of the average daily net assets over $30 billion of the Trusts.
Citi Fund Services Ohio, Inc. ("Citi"), an affiliate of Citibank, N.A., acts as sub-administrator and sub-fund accountant to the Fund pursuant to a Sub-Administration and Sub-Fund Accounting Services Agreement between VCM and Citi. VCM pays Citi a fee for providing these services. The Trust reimburses VCM and Citi for all of their reasonable out-of-pocket expenses incurred in providing these services.
FIS Investor Services, LLC ("FIS") serves as the Fund's transfer agent. Under the Transfer Agent Agreement, the Trust pays FIS a fee for its services and reimburses FIS for all of their reasonable out-of-pocket expenses incurred in providing these services.
The Chief Compliance Officer ("CCO") is an employee of the Adviser, which pays the compensation of the CCO and his support staff. The Trust has entered into an Agreement to provide compliance services with the Adviser, pursuant to which the Adviser furnishes its compliance personnel, including the services of the CCO, and other resources reasonably necessary to provide the Trust with compliance oversight services related to the design, administration and oversight of a compliance program for the Trust in accordance with Rule 38a-1 under the 1940 Act. Funds in the Trust, Victory Portfolios, Victory Institutional Funds, and Victory Portfolios II (collectively, the "Victory Funds Complex"), in the aggregate, compensate the Adviser for these services.
The Victory Funds Complex pays an annual retainer to each Independent Trustee, plus an additional annual retainer to the Chairman of the Board. The aggregate amount of the fees and expenses of the Independent Trustees are allocated amongst all the funds in the Victory Funds Complex and are presented in the Statement of Operations.
Shearman & Sterling LLP provides legal services to the Trust.
Victory Capital Advisers, Inc. (the "Distributor"), an affiliate of the Adviser, serves as distributor for the continuous offering of the shares of the Fund pursuant to a Distribution Agreement between the Distributor and the Trust.
The Adviser has entered into an expense limitation agreement with the Fund until at least April 30, 2019. Under the terms of the agreement, to the extent that ordinary operating expenses incurred by certain classes of the Fund in any fiscal year exceed the expense limit for such classes of the Fund, such excess amounts will be the liability of the Adviser. Interest, taxes, brokerage commissions, other expenditures which are capitalized in accordance with GAAP, and other extraordinary expenses not incurred in the ordinary course of a Fund's business are excluded from the expense limitation agreement. For the year ended December 31, 2018, the expense limit (excluding voluntary waivers) is 0.56%.
The Fund has agreed to repay fees and expenses that were waived or reimbursed by the Adviser for a period up to three fiscal years after such waiver or reimbursement was made to the extent such payments or repayments would not cause the expenses of a class to exceed the original expense limitation in place at the time of the waiver or reimbursement or any expense limitation agreement in
26
Victory Variable Insurance Funds | | Notes to Financial Statements — continued
December 31, 2018 | |
place at the time of repayment. As of December 31, 2018, the following amounts are available to be repaid to the Adviser. Amounts repaid to the Adviser during the year ended, if any, are reflected on the Statement of Operations as "Recoupment of prior expenses waived/reimbursed by Adviser".
| | | Expires 12/31/2020 | | Expires 12/31/2021 | |
| | | $ | 362,552 | | | $ | 441,458 | | |
The Adviser may voluntarily waive or reimburse additional fees to assist the Fund in maintaining a competitive expense ratio. Voluntary waivers and reimbursements applicable to the Fund are not available to be recouped at a future time. There were no voluntary waivers or reimbursements for the year ended December 31, 2018.
Certain officers and/or interested trustees of the Fund are also officers and/or employees of the Adviser, Administrator, Fund Accountant, Sub-Administrator, Sub-Fund Accountant, and Legal.
5. Risks:
The Fund may be subject to other risks in addition to these identified risks.
An investment in the Fund's shares represents an indirect investment in the securities owned by the Fund, some of which will be traded on a national securities exchange or in the over-the-counter markets. The value of the securities in which the Fund invests, like other market investments, may move up or down, sometimes rapidly and unpredictably. The value of the securities in which the Fund invests may affect the value of the Fund's shares. An investment in the Fund's shares at any point in time may be worth less than the original investment, even after taking into account the reinvestment of the Fund's distributions.
The Fund will be subject to credit risk with respect to the amount it expects to receive from counterparties for financial instruments entered into by the Fund. The Fund may be negatively impacted if a counterparty becomes bankrupt or otherwise fails to perform its obligations due to financial difficulties. The Fund may experience significant delays in obtaining any recovery in bankruptcy or other reorganization proceeding and the Fund may obtain only limited recovery or may obtain no recovery in such circumstances. The Fund typically enters into transactions with counterparties whose credit ratings are investment grade, as determined by a nationally recognized statistical rating organization or, if unrated, judged by the Adviser to be of comparable quality.
The Fund will be subject to credit and interest rate risk with respect to fixed income securities. Credit risk refers to the ability of an issuer to make timely payments of interest and principal. Interest rates may rise or the rate of inflation may increase, impacting the value of investments in fixed income securities. A debt issuers' credit quality may be downgraded or an issuer may default. Interest rates may fluctuate due to changes in governmental fiscal policy initiatives and resulting market reaction to those initiatives.
6. Borrowing and Interfund Lending:
Line of Credit:
The Victory Funds Complex participates in a short-term, demand note "Line of Credit" agreement with Citibank. Under the agreement with Citibank, the Victory Funds Complex may borrow up to $250 million, of which $100 million is committed and $150 million is uncommitted. $40 million of the Line of Credit is reserved for use by the Victory Floating Rate Fund, another series of the Victory Funds Complex, with that Fund paying the related commitment fees for that amount. The purpose of the agreement is to meet temporary or emergency cash needs, including redemption requests that might otherwise require the untimely disposition of securities. The current agreement was amended on July 27, 2018 with a new termination date of July 26, 2019. Citibank receives an annual commitment fee of 0.15% on $100 million for providing the Line of Credit. For the year ended December 31, 2018, Citibank earned approximately $150,000 in commitment fees from the Victory Funds Complex. Each fund in the Victory Funds Complex pays a pro-rata portion of the commitment fees plus any interest on
27
Victory Variable Insurance Funds | | Notes to Financial Statements — continued
December 31, 2018 | |
amounts borrowed. Interest accrued by the Fund during the period is presented on the Statement of Operations under Interest expense on line of credit.
The Fund did not utilize or participate in the Line of Credit during the year ended December 31, 2018.
Interfund Lending:
The Trust and Adviser rely on an exemptive order granted by the SEC in March 2017 (the "Order"), permitting the establishment and operation of an Interfund Lending Facility (the "Facility"). The Facility allows the Fund to directly lend and borrow money to or from any other Victory Fund relying upon the Order at rates beneficial to both the borrowing and lending funds. Advances under the Facility are allowed for temporary or emergency purposes, including the meeting of redemption requests that otherwise might require the untimely disposition of securities, and are subject to each Fund's borrowing restrictions. The interfund loan rate is determined, as specified in the Order, by averaging the current repurchase agreement rate and the current bank loan rate. Interest accrued by the Fund during the period is presented on the Statement of Operations under Interest expense on interfund lending.
The average loans for the days outstanding and average interest rate the Fund during the year ended December 31, 2018 were as follows:
| | | Borrower or
Lender | | Amount
Outstanding
at
December 31,
2018 | | Average
Borrowing* | | Days
Borrowing
Outstanding | | Average
Interest
Rate* | | Maximum
Borrowing
During the
Period | |
| | | | | Borrower | | $ | — | | | $ | 375,000 | | | | 1 | | | | 2.85 | % | | $ | 375,000 | | |
*For the year ended December 31, 2018, based on the number of days borrowings were outstanding.
7. Federal Income Tax Information:
The tax character of distributions paid during the tax years ended, as noted below, were as follows (total distributions paid may differ from the Statements of Changes in Net Assets because, for tax purposes, dividends are recognized when actually paid).
| | | Year Ended December 31, 2018 | |
| | | Distributions paid from | |
| | | Ordinary
Income | | Net
Long-Term
Capital Gains | | Total
Distributions
Paid | |
| | | | | $ | 4,289,680 | | | $ | — | | | $ | 4,289,680 | | |
| | | Year Ended December 31, 2017 | |
| | | Distributions paid from | |
| | | Ordinary
Income | | Net
Long-Term
Capital Gains | | Total
Distributions
Paid | |
| | | | | $ | 17,209,084 | | | $ | — | | | $ | 17,209,084 | | |
As of the tax year ended December 31, 2018, the components of accumulated earnings (deficit) on a tax basis were as follows:
Undistributed
Ordinary
Income | | Undistributed
Long-Term
Capital Gains | | Accumulated
Earnings | | Accumulated
Capital and
Other
Losses | | Unrealized
Appreciation
(Depreciation)* | | Total
Accumulated
Earnings
(Deficit) | |
$ | 17,229,581 | | | $ | — | | | $ | 17,229,581 | | | $ | (13,332,054 | ) | | $ | (7,958,824 | ) | | $ | (4,061,297 | ) | |
*The difference between the book-basis and tax-basis unrealized appreciation (depreciation) is attributable primarily to tax deferral of losses on wash sales.
28
Victory Variable Insurance Funds | | Notes to Financial Statements — continued
December 31, 2018 | |
As of the tax year ended December 31, 2018, the Fund has short term and long term capital loss carryforwards of $5,300,039 and $8,032,015 respectively that are not subject to expiration.
During the tax year ended December 31, 2018, the Fund did not utilize capital loss carryforwards.
As of December 31, 2018, the cost basis for federal income tax purposes, gross unrealized appreciation, gross unrealized depreciation and net unrealized appreciation (depreciation) for investments were as follows:
Cost of
Investments
for Federal
Tax Purposes | | Gross
Unrealized
Appreciation | | Gross
Unrealized
Depreciation | | Net
Unrealized
Appreciation
(Depreciation) | |
| $ | 757,144,561 | | | $ | 8,870,390 | | | $ | (16,829,214 | ) | | $ | (7,958,824 | ) | |
8. Capital Contribution from Prior Custodian:
During 2016, the Fund received notification from the Fund's prior custodian, State Street Bank and Trust ("State Street"), related to over-billing on certain categories of expenses during the approximately 16-year period from 1998 through October 31, 2014. The over-billing primarily related to categories of expenses that involved an allocation of general costs among multiple clients.
State Street paid the refunded amounts during January 2017. Based on billing information received during 2016 from State Street and an analysis of any expense limitation agreements that were in place during the period of the over-billing, including the application of any recoupment provisions in such agreements, the Adviser received a portion of the refund.
The portion of the refund retained by the Fund was accounted for as a capital contribution and is reflected on the Financial Highlights as "Capital Contribution from Prior Custodian, Net".
9. Fund Ownership:
Ownership of more than 25% of the voting securities of a fund creates presumptions of control of the fund, under section 2(a)(9) of the 1940 Act. As of December 31, 2018, the shareholders listed below held more than 25% of the shares outstanding of the Fund and may be deemed to control the Fund.
| | | Shareholder | | Percent | |
| | | | | GIAC | | | 100 | % | |
10. Recent Accounting Pronouncements:
In October 2016, the SEC released its Final Rules on Investment Company Reporting Modernization (the "Rules"). The Rules introduced two new regulatory reporting forms for investment companies, Form N-PORT and Form N-CEN. The Fund's compliance date for Form N-PORT was June 1, 2018, and the Fund will make its initial filing with the SEC on Form N-PORT for the period ending March 31, 2019. Effective with the period ended June 30, 2018, the Fund was required to maintain, and make available to the SEC upon request, the information required to be included in Form N-PORT. Form N-PORT will replace Form N-Q filings effective with the requirement to file the Form N-PORT with the SEC for the period ending March 31, 2019. The Fund's compliance date for Form N-CEN was June 1, 2018, and the Fund will make its initial filing on Form N-CEN for the period ended December 31, 2018. Form N-CEN will replace Form N-SAR filings. The Fund's adoption of these amendments have no effect on the Fund's net assets or results of operations.
In March 2017, the Financial Accounting Standards Board ("FASB") issued Accounting Standards Update ("ASU") No. 2017-08 "Premium Amortization on Purchased Callable Debt Securities" ("ASU 2017-08"), which shortens the premium amortization period for purchased non-contingently callable debt securities. ASU 2017-08 specifies that the premium amortization period ends at the earliest call date, for purchased non-contingently callable debt securities. ASU 2017-08 is effective for
29
Victory Variable Insurance Funds | | Notes to Financial Statements — continued
December 31, 2018 | |
fiscal years, and interim periods within those fiscal years, beginning after December 15, 2018. Management does not believe that adoption of ASU 2017-08 will materially impact the Fund's financial statements.
In August 2018, the FASB issued ASU No. 2018-13, "Fair Value Measurements" ("ASU 2018-13"). This update makes certain removals from, changes to and additions to existing disclosure requirements for fair value measurements. ASU 2018-13 does not change fair value measurements already required or permitted by existing standards. ASU 2018-13 is effective for financial statements issued for fiscal years beginning after December 15, 2019, and interim periods within those fiscal years. As permitted, the Fund has early adopted ASU 2018-13 with the financial statements prepared as of December 31, 2018.
In August 2018, the SEC adopted amendments to certain financial statement disclosure requirements to conform them to GAAP for investment companies. These amendments made certain disclosure requirements effective under Regulation S-X. The Fund's adoption of these amendments, effective with the financial statements prepared as of December 31, 2018 had no effect on the Fund's net assets or results of operations. As a result of adopting these amendments, the distributions to shareholders in the December 31, 2017 Statements of Changes in Net Assets presented herein have been reclassified to conform to the current year presentation, which includes all distributions to each class of shareholders, other than tax basis return of capital distributions, in one line item per share class. Distributions to shareholders for the year ended December 31, 2017 from net investment income and net realized gains in the Fund were as follows:
Distributions to Shareholders:
From net investment income: | | $ | (17,209,084 | ) | |
From net Realized Gains: | | | — | | |
11. Subsequent Events:
The Fund has evaluated the need for additional disclosures or adjustments resulting from subsequent events through the date these financial statements were issued. Based on this evaluation, there were no subsequent events to report that would have a material impact on the Fund's financial statements.
30
REPORT OF INDEPENDENT REGISTERED PUBLIC ACCOUNTING FIRM
To the Shareholders and the Board of Trustees of Victory INCORE Investment Quality Bond VIP Series
Opinion on the Financial Statements
We have audited the accompanying statement of assets and liabilities of Victory INCORE Investment Quality Bond VIP Series (the "Fund") (one of the funds constituting the Victory Variable Insurance Funds (the "Trust")), including the portfolio of investments, as of December 31, 2018, and the related statement of operations for the year then ended, the statements of changes in net assets for each of the two years in the period then ended, the financial highlights for each of the three years in the period then ended and the related notes (collectively referred to as the "financial statements"). In our opinion, the financial statements present fairly, in all material respects, the financial position of the Fund (one of the funds constituting the Trust) at December 31, 2018, and the results of its operations for the year then ended, the changes in its net assets for each of the two years in the period then ended and its financial highlights for each of the three years in the period then ended, in conformity with U.S. generally accepted accounting principles.
The financial highlights of the Fund for each of the periods presented through December 31, 2015 were audited by other auditors, whose report dated February 22, 2016 expressed an unqualified opinion on those financial highlights.
Basis for Opinion
These financial statements are the responsibility of the Trust's management. Our responsibility is to express an opinion on the Fund's financial statements based on our audits. We are a public accounting firm registered with the Public Company Accounting Oversight Board (United States) (PCAOB) and are required to be independent with respect to the Trust in accordance with the U.S. federal securities laws and the applicable rules and regulations of the Securities and Exchange Commission and the PCAOB.
We conducted our audits in accordance with the standards of the PCAOB. Those standards require that we plan and perform the audit to obtain reasonable assurance about whether the financial statements are free of material misstatement, whether due to error or fraud. The Trust is not required to have, nor were we engaged to perform, an audit of the Trust's internal control over financial reporting. As part of our audit we are required to obtain an understanding of internal control over financial reporting but not for the purpose of expressing an opinion on the effectiveness of the Trust's internal control over financial reporting. Accordingly, we express no such opinion.
Our audits included performing procedures to assess the risks of material misstatement of the financial statements, whether due to error or fraud, and performing procedures that respond to those risks. Such procedures included examining, on a test basis, evidence regarding the amounts and disclosures in the financial statements. Our procedures included confirmation of securities owned as of December 31, 2018, by correspondence with the custodian, transfer agent, and brokers or by other appropriate auditing procedures where replies from brokers were not received. Our audits also included evaluating the accounting principles used and significant estimates made by management, as well as evaluating the overall presentation of the financial statements. We believe that our audits provide a reasonable basis for our opinion.

We have served as the auditor of one or more Victory Capital's investment companies since 1995.
Cincinnati, Ohio
February 15, 2019
31
Victory Variable Insurance Funds | | Supplemental Information
December 31, 2018 | |
(Unaudited)
Trustee and Officer Information
Board of Trustees:
Overall responsibility for management of the Trust rests with the Board. The Trust is managed by the Board in accordance with the laws of the State of Delaware. There are currently ten Trustees, nine of whom are not "interested persons" of the Trust within the meaning of that term under the 1940 Act ("Independent Trustees") and one of whom is an "interested person" of the Trust within the meaning of that term under the 1940 Act ("Interested Trustee"). The Trustees, in turn, elect the officers of the Trust to actively supervise its day-to-day operations.
The following tables list the Trustees, their ages, position with the Trust, commencement of service, principal occupations during the past five years and any directorships of other investment companies or companies whose securities are registered under the Securities Exchange Act of 1934, as amended, or who file reports under that Act. Each Trustee oversees nine portfolios in the Trust, one portfolio in Victory Institutional Funds, 42 portfolios in Victory Portfolios and 20 portfolios in Victory Portfolios II, each a registered investment company that, together with the Trust, comprise the Victory Funds Complex. Each Trustee's address is c/o Victory Variable Insurance Funds, 4900 Tiedeman Road, 4th Floor, Brooklyn, Ohio 44144. Each Trustee has an indefinite term.
Name and Age | | Position
Held with
the Trust | | Date
Commenced
Service | | Principal Occupation
During Past 5 Years | | Other
Directorships
Held During
Past 5 Years | |
Independent Trustees. | |
David Brooks Adcock, 67 | | Trustee | | February 2005 | | Consultant (since 2006). | | Chair and Trustee, Turner Funds (December 2016-December 2017). | |
Nigel D.T. Andrews, 71 | | Vice Chair and Trustee | | August 2002 | | Retired. | | Director, TCG BDC II, Inc. (since 2017); Director, TCG BDC I, Inc. (formerly Carlyle GMS Finance, Inc.) (since 2012); Director, Old Mutual US Asset Management (2002-2014). | |
E. Lee Beard, 67* | | Trustee | | February 2005 | | Retired (since 2015); Consultant, The Henlee Group, LLC (consulting) (2005-2015). | | None. | |
Dennis M. Bushe, 75 | | Trustee | | July 2016 | | Retired. | | Trustee, RS Investment Trust and RS Variable Products Trust (November 2011-July 2016). | |
32
Victory Variable Insurance Funds | | Supplemental Information — continued
December 31, 2018 | |
(Unaudited)
Name and Age | | Position
Held with
the Trust | | Date
Commenced
Service | | Principal Occupation
During Past 5 Years | | Other
Directorships
Held During
Past 5 Years | |
Sally M. Dungan, 64 | | Trustee | | February 2011 | | Chief Investment Officer, Tufts University (since 2002). | | None. | |
John L. Kelly, 65 | | Trustee | | February 2015 | | Partner, McCarvill Capital Partners (September 2016-September 2017); Advisor(January 2016-April 2016) and Managing Partner (August 2014- January 2016), Endgate Commodities LLC; Chief Operating Officer, Liquidnet Holdings, Inc. (2011-2014). | | Director, Caledonia Mining Corporation (since May 2012). | |
David L. Meyer, 61* | | Trustee | | December 2008 | | Retired. | | None. | |
Gloria S. Nelund, 57 | | Trustee | | July 2016 | | Chair, CEO and Co-Founder of TriLinc Global, LLC, an investment firm. | | TriLinc Global Impact Fund, LLC (since 2012); Trustee, RS Investment Trust and RS Variable Products Trust (November 2007-July 2016). | |
Leigh A. Wilson, 74 | | Chair and Trustee | | February 1998 | | Private Investor. | | Chair (since 2013), Caledonia Mining Corporation. | |
Interested Trustee. | |
David C. Brown, 46** | | Trustee | | May 2008 | | Chairman and Chief Executive Officer (since 2013), Co-Chief Executive Officer (2011-2013), the Adviser; Chairman and Chief Executive Officer, Victory Capital Holdings, Inc. (since 2013). | | None. | |
* The Board has designated Mr. Meyer and Ms. Beard as its Audit Committee Financial Experts.
** Mr. Brown is an "Interested Person" by reason of his relationship with the Adviser.
The Statement of Additional Information includes additional information about the Trustees of the Trust and is available, without charge, by calling 800-539-3863.
33
Victory Variable Insurance Funds | | Supplemental Information — continued
December 31, 2018 | |
(Unaudited)
Officers:
The officers of the Trust, their ages, commencement of service and their principal occupations during the past five years, are detailed in the following table. Each officer serves until the earlier of his or her resignation, removal, retirement, death, or the election of a successor. The mailing address of each officer of the Trust is 4900 Tiedeman Road, 4th Floor, Brooklyn, Ohio 44144. The officers of the Trust receive no compensation directly from the Trust for performing the duties of their offices.
Name and Age | | Position with
the Trust | | Date
Commenced
Service | | Principal Occupation During Past 5 Years | |
Christopher K. Dyer, 57 | | President | | February 2006* | | Director of Mutual Fund Administration, the Adviser. | |
Scott A. Stahorsky, 49 | | Vice President | | December 2014 | | Manager, Fund Administration, the Adviser (since 2015); Senior Analyst, Fund Administration, the Adviser (prior to 2015). | |
Erin G. Wagner, 45 | | Secretary | | December 2014 | | Associate General Counsel, the Adviser (since 2013). | |
Allan Shaer, 53 | | Treasurer | | May 2017 | | Senior Vice President, Financial Administration, Citi Fund Services Ohio, Inc. (since 2016); Vice President, Mutual Fund Administration, JP Morgan Chase (2011-2016). | |
Christopher A. Ponte, 34 | | Assistant Treasurer | | December 2017 | | Manager, Fund Administration, the Adviser (since 2017); Senior Analyst, Fund Administration, the Adviser (prior to 2017); Chief Financial Officer, Victory Capital Advisers, Inc. (since 2018). | |
Colin Kinney, 45 | | Chief Compliance Officer | | July 2017 | | Chief Compliance Officer (since 2013) and Chief Risk Officer (2009-2017), the Adviser. | |
Chuck Booth, 58 | | Anti-Money Laundering Compliance Officer and Identity Theft Officer | | May 2015 | | Director, Regulatory Administration and CCO Support Services, Citi Fund Services Ohio, Inc. | |
Jay G. Baris, 65 | | Assistant Secretary | | February 1998 | | Partner, Shearman & Sterling LLP (since 2018); Partner, Morrison & Foerster LLP (2011-2017). | |
* On December 3, 2014, Mr. Dyer resigned as Secretary of the Trust and accepted the position of President.
34
Victory Variable Insurance Funds | | Supplemental Information — continued
December 31, 2018 | |
(Unaudited)
Proxy Voting and Form N-Q Information
Proxy Voting:
Information regarding the policies and procedures that the Fund uses to determine how to vote proxies relating to portfolio securities is available without charge, upon request, by calling 800-539-3863. The information is also included in the Fund's Statement of Additional Information, which is available on the SEC's website at www.sec.gov.
Information relating to how the Fund voted proxies relating to portfolio securities held during the most recent twelve months ended June 30 is available on the SEC's website at www.sec.gov.
Availability of Schedules of Portfolio Investments:
The Trust expects to file a complete list of Schedules of Portfolio Investments with the SEC for the first and third quarter of each fiscal year on Form N-PORT beginning March 1, 2019. Prior to that date, the Trust has filed a complete list of Schedules of Portfolio Investments with the SEC for the first and third quarters of each fiscal year on Form N-Q. Forms N-PORT and Forms N-Q are available on the SEC's website at www.sec.gov.
Expense Examples
As a shareholder of the Fund, you may incur two types of costs: (1) transaction costs and (2) ongoing costs, including management fees, distribution and service (12b-1) fees, and other Fund expenses. These examples are intended to help you understand your ongoing costs (in dollars) of investing in the Fund and to compare these costs with the ongoing costs of investing in other mutual funds.
These examples are based on an investment of $1,000 invested at the beginning of the period and held for the entire period from July 1, 2018 through December 31, 2018.
The Actual Expense figures in the table below provide information about actual account values and actual expenses. You may use the information below, together with the amount you invested, to estimate the expenses that you paid over the period. Simply divide your account value by $1,000 (for example, an $8,600 account value divided by $1,000 = 8.6), then multiply the result by the number in the table under the heading entitled "Actual Expenses Paid During Period" to estimate the expenses you paid on your account during this period.
The Hypothetical Expense figures in the table below provide information about hypothetical account values and hypothetical expenses based on the Fund's actual expense ratio and an assumed rate of return of 5% per year before expenses, which is not the Fund's actual return. The hypothetical account values and expenses may not be used to estimate the actual ending account balance or expenses you paid for the period. You may use this information to compare this 5% hypothetical example with the 5% hypothetical examples that appear in shareholder reports of other funds.
Please note the expenses shown in the table are meant to highlight your ongoing costs only and do not reflect any transactional costs. Therefore, the table is useful in comparing ongoing costs only, and will not help you determine the relative total costs of owning different funds. In addition, if these transactional costs were included, your costs would have been higher.
Beginning
Account Value
7/1/18 | | Actual
Ending
Account Value
12/31/18 | | Hypothetical
Ending
Account Value
12/31/18 | | Actual
Expenses
Paid During
Period
7/1/18-12/31/18* | | Hypothetical
Expenses
Paid During
Period
7/1/18-12/31/18* | | Annualized
Expense Ratio
During Period
7/1/18-12/31/18 | |
| $ | 1,000.00 | | | $ | 1,010.90 | | | $ | 1,022.38 | | | $ | 2.84 | | | $ | 2.85 | | | | 0.56 | % | |
* Expenses are equal to the average account value multiplied by the Fund's annualized expense ratio multiplied by 184/365 (the number of days in the most recent fiscal half-year divided by the number of days in the fiscal year).
35
Victory Variable Insurance Funds | | Supplemental Information — continued
December 31, 2018 | |
(Unaudited)
Additional Federal Income Tax Information
For the year ended December 31, 2018, the Fund designated short-term capital gain distributions in the amount of $127,507.
36
Victory Variable Insurance Funds | | Supplemental Information — continued
December 31, 2018 | |
(Unaudited)
Considerations of the Board in Continuing the Investment Advisory Agreement (the "Agreement")
The Board approved the Agreement on behalf of the Series at a meeting, which was called for that purpose, on December 5, 2018. The Board also considered information relating to the Series and the Agreement provided throughout the year and, more specifically, at a meeting on October 23, 2018. The Board noted that prior to the Series' reorganization on July 29, 2016, the Series was managed by RS Investment Management Co. LLC, which was acquired by the Adviser on July 29, 2016. In considering whether to approve the Agreement, the Board requested, and the Adviser provided, information that the Board believed to be reasonably necessary to reach its conclusions. The Board, including the Independent Trustees, evaluated this information along with other information obtained throughout the year and was advised by legal counsel to the Series and by independent legal counsel to the Independent Trustees. In addition, in 2017 the Independent Trustees, through their counsel, retained an independent consultant to assist with a review of the overall process for conducting the annual review of these advisory arrangements. The Board considered the Series' advisory fee, expense ratio and investment performance as significant factors in determining whether the Agreement should be continued. In considering whether the compensation paid to the Adviser was fair and reasonable, the Board also evaluated, among other things, the following factors:
• The requirements of the Series for the services provided by the Adviser;
• The nature, quality and extent of the services provided and expected to be provided;
• The performance of the Series as compared to comparable funds;
• The fees payable for the services and whether the fee arrangements provided for economies of scale that would benefit Series shareholders as the Series grows;
• Whether the fee would be sufficient to enable the Adviser to attract and retain experienced personnel and continue to provide quality services to the Series;
• Fees paid by other clients of the Adviser whose accounts are managed in a similar investment style and any differences in the services provided to the other clients compared to those provided to the Series;
• Total expenses of the Series, taking into consideration any distribution or shareholder servicing fees;
• Management's commitment to operating the Series at competitive expense levels;
• The profitability of the Adviser (as reflected by comparing fees earned against an estimate of the Adviser's costs) with respect to the Adviser's relationship with the Series;
• Research and other service benefits received by the Adviser obtained through payment of client commissions for securities transactions;
• Other benefits received by the Adviser, and its affiliates, including revenues paid to the Adviser, or its affiliates, by the Series for administration and fund accounting services, and distribution;
• The capabilities and financial condition of the Adviser;
• Current economic and industry trends; and
• The historical relationship between the Series and the Adviser.
The Board reviewed the Series' current management fee, comprised of the advisory fee plus the administrative services fee paid to the Adviser, in the context of the Adviser's profitability of the Series. In addition, the Board compared the Series' total operating expense ratio on a net and gross basis, taking into consideration any distribution or shareholder servicing fees and management fees with a universe of comparable mutual funds compiled by an independent consultant, FUSE Research Network, LLC ("FUSE"), and a peer group of funds with similar investment strategies selected by FUSE from the universe. The Board reviewed the factors and methodology used by FUSE in the selection of the Series' peer group, including FUSE's selection of a broad universe of funds using the standard Retail Morningstar Categories, the more specific universe of comparable funds, and peer groups of funds with comparable investment strategies and asset levels, among other factors. The Board also reviewed any changes to FUSE's methodology as compared to the prior year, including as a result of input from the Adviser, if any. The Board also reviewed fees and other information related to the Adviser's management of similarly managed institutional or private accounts, and the differences in the services provided to the other accounts, to the extent applicable. The Board noted that the advisory fee arrangements
37
Victory Variable Insurance Funds | | Supplemental Information — continued
December 31, 2018 | |
(Unaudited)
for the Series do not include breakpoints, which are generally viewed as a method by which the investment adviser shares any economies of scale with a fund as a fund grows. The Board also considered the Adviser's commitment to limit expenses as discussed in more detail below.
The Board reviewed the Series' performance over one-, three-, five- and ten-year periods against the performance of the Series' selected peer group and benchmark index. The Board recognized that the performance of the Series and the peer group funds are net of expenses, while the performance of the benchmark index is gross returns. The Board considered the additional resources that the Adviser has committed to enhance portfolio analysis, compliance and trading systems.
The Board reviewed various other specific factors with respect to the Series, as described below. In their deliberations, the Trustees did not rank the importance of any particular information or factor considered and each Trustee may have attributed different weights to various factors.
The Board concluded that the Series' gross annual management fee was reasonable as compared to the median gross management fee charged to the funds in the Series' peer group. The Board noted that the Series' net annual expense ratio, taking into account any shareholder servicing or distribution fees, was reasonable as compared to the median expense ratio for the peer group. The Board considered the Adviser's contractual agreement to waive its fees and reimburse expenses for a specified period of time, as described in the Series' prospectus. The Board then compared the Series' performance for the one-, three-, five- and ten-year periods ended June 30, 2018, to that of the median performance of the peer group and benchmark index for the same periods and considered the fact that the Series outperformed the benchmark index for all periods reviewed, outperformed the peer group for the one-, three- and five-year periods and underperformed the peer group for the ten-year period.
Having considered, among other things: (1) that the Series' management fee was within the ranges of advisory fees charged to comparable mutual funds; (2) that the Series' total expense ratio was reasonable; (3) the Adviser's willingness to limit the expenses for a period of time would provide stability to the Series' expenses during that period; and (4) the performance of the Series, the Board concluded that the Agreement continued to be in the best interests of the Series' shareholders.
The Board noted that the Adviser's INCORE investment management team replaced the predecessor fund's investment sub-adviser as portfolio managers for the Series upon completion of the Series' reorganization.
Conclusion
Based on its review of the information requested and provided, and following extended discussions, the Board determined that the Agreement, on behalf of the Series, was consistent with the best interests of the Series and its shareholders, and the Board unanimously approved the Agreement, on behalf of the Series, for an additional annual period on the basis of the foregoing review and discussions and the following considerations, among others:
• The fairness and reasonableness of the investment advisory fee payable to the Adviser under the Agreement in light of the investment advisory services provided, the costs of these services, the profitability of the Adviser's relationship with the Series and the comparability of the fee paid to the fees paid by other investment companies;
• The nature, quality and extent of the investment advisory services provided by the Adviser;
• The Adviser's entrepreneurial commitment to the management of the Series and the creation of a broad-based family of funds, which could entail a substantial commitment of the Adviser's resources to the successful operation of the Series;
• The Adviser's representations regarding its staffing and capabilities to manage the Series, including the retention of personnel with relevant portfolio management experience;
• The Adviser's efforts to enhance investment results by, among other things, developing quality portfolio management teams; and
• The overall high quality of the personnel, operations, financial condition, investment management capabilities, methodologies and performance of the Adviser.
38
Privacy Policy
Protecting the Privacy of Information
The Trust respects your right to privacy. We also know that you expect us to conduct and process your business in an accurate and efficient manner. To do so, we must collect and maintain certain personal information about you. This is the information we collect from you on applications or other forms, and from the transactions you make with us or third parties. It may include your name, address, social security number, account transactions and balances, and information about investment goals and risk tolerance.
We do not disclose any information about you or about former customers to anyone except as permitted or required by law. Specifically, we may disclose the information we collect to companies that perform services on our behalf, such as the transfer agent that processes shareholder accounts and printers and mailers that assist us in the distribution of investor materials. We may also disclose this information to companies that perform marketing services on our behalf. This allows us to continue to offer you Victory investment products and services that meet your investing needs, and to effect transactions that you request or authorize. These companies will use this information only in connection with the services for which we hired them. They are not permitted to use or share this information for any other purpose.
To protect your personal information internally, we permit access only by authorized employees and maintain physical, electronic and procedural safeguards to guard your personal information.*
* You may have received communications regarding information about privacy policies from other financial institutions which gave you the opportunity to "opt-out" of certain information sharing with companies which are not affiliated with that financial institution. The Trust does not share information with other companies for purposes of marketing solicitations for products other than the Trust. Therefore, the Trust does not provide opt-out options to their shareholders.
Victory Funds
P.O. Box 182593
Columbus, Ohio 43218-2593

Visit our website at: | | Call Victory at: | |
www.vcm.com | | 800-539-FUND (800-539-3863) | |
VVIF-RS-IIQBVIP-AR (12/18)

December 31, 2018
Annual Report
Victory Variable Insurance Funds
Victory High Yield VIP Series
Beginning on January 1, 2021, as permitted by regulations adopted by the Securities and Exchange Commission, paper copies of the Victory Funds' shareholder reports will no longer be sent by mail, unless you specifically request paper copies of the reports from the Victory Funds or from your financial intermediary, such as a broker-dealer or bank. Instead, the reports will be made available on www.VictoryFunds.com, and you will be notified by mail each time a report is posted and provided with a website link to access the report. If you already elected to receive shareholder reports electronically, you will not be affected by this change, and you need not take any action.
You may elect to receive shareholder reports and other communications from the Victory Funds or your financial intermediary electronically sooner than January 1, 2021 by notifying your financial intermediary directly or, if you are a direct investor, by calling 800-539-3863 or by sending an e-mail request to TA.Processing@FISGlobal.com.
You may elect to receive all future reports in paper free of charge. If you invest through a financial intermediary, you can contact your financial intermediary to request that you continue to receive paper copies of your reports. If you invest directly with the Victory Funds, you can call 800-539-3863 or send an e-mail request to TA.Processing@FISGlobal.com. Your election to receive reports in paper will apply to all Victory Funds you hold directly or through your financial intermediary.
www.vcm.com
News, Information And Education 24 Hours A Day, 7 Days A Week
The Victory Funds site gives fund shareholders, prospective shareholders, and investment professionals a convenient way to access fund information, get guidance, and track fund performance anywhere they can access the Internet. The site includes:
• Detailed performance records
• Daily share prices
• The latest fund news
• Investment resources to help you become a better investor
• A section dedicated to investment professionals
Whether you're a potential investor searching for the fund that matches your investment philosophy, a seasoned investor interested in planning tools, or an investment professional, www.vcm.com has what you seek. Visit us anytime. We're always open.
Victory Variable Insurance Funds
Table of Contents
Shareholder Letter (Unaudited) | | | 3 | | |
Fund Review and Commentary (Unaudited) | | | 4 | | |
Financial Statements | |
Schedule of Portfolio Investments | | | 7 | | |
Statement of Assets and Liabilities | | | 11 | | |
Statement of Operations | | | 12 | | |
Statements of Changes in Net Assets | | | 13 | | |
Financial Highlights | | | 14 | | |
Notes to Financial Statements | | | 15 | | |
Report of Ernst & Young LLP,
Independent Registered Public Accounting Firm | | | 24 | | |
Supplemental Information (Unaudited) | |
Trustee and Officer Information | | | 25 | | |
Proxy Voting and Form N-Q Information | | | 28 | | |
Expense Examples | | | 28 | | |
Additional Federal Income Tax Information | | | 29 | | |
Advisory Contract Renewal | | | 30 | | |
Privacy Policy (inside back cover) | | | |
The Fund is distributed by Victory Capital Advisers, Inc. Victory Capital Management Inc. is the investment adviser to the Fund and receives fees from the Fund for performing services for the Fund.
This report is not authorized for distribution to prospective investors unless preceded or accompanied by a current prospectus of the Fund.
For additional information about any Victory Fund, including fees, expenses, and risks, view our prospectus online at www.vcm.com or call 800-539-3863. Read it carefully before you invest or send money.
The information in this annual report is based on data obtained from recognized services and sources and is believed to be reliable. Any opinions, projections, or recommendations in this report are subject to change without notice and are not intended as individual investment advice. Past investment performance of the Fund, markets or securities mentioned herein should not be considered to be indicative of future results.
• NOT FDIC INSURED • NO BANK GUARANTEE
• MAY LOSE VALUE

Call Victory at:
800-539-FUND (800-539-3863)
Visit our website at:
www.vcm.com
1
This page is intentionally left blank.
2
Victory Funds Letter to Shareholders
Dear Shareholder,
What a difference a year makes. The year ended December 31, 2018, was marked by an abrupt return of volatility, which had largely been missing in action for years. Consider the range of highs and lows we witnessed. For the S&P 500 Index, it was a year in which we celebrated an all-time high in late summer, only to be followed by the worst December since the 2008 financial crisis. And if that wasn't enough volatility, the Dow Jones Industrial Average also registered several of its worst-ever, single-day point declines during 2018.
Through all that the S&P 500 clocked in with its first negative annual return since 2008, falling by 4.4 percent. Given the risk-off sentiment that was obvious as the year drew to a close, it's no surprise that small-cap stocks, as measured by the Russell 2000 Index, fared even worse, falling approximately 11.0 percent for the year. The challenges for equity investors were also evident around the world as the MSCI ACWI and Emerging Markets indexes declined 8.9 and 14.3 percent, respectively.
So what ushered in the renewed era of volatility and these challenging times? There were multiple culprits. For starters, trade tensions ratcheted up throughout the year as anti-global rhetoric bloomed into a series of new tariffs, which sparked concerns of a prolonged trade war with China. The Federal Reserve remained persistent in its monetary tightening, raising the benchmark interest rate four times throughout the year to a range of 2.25 to 2.5 percent. And then the year ended with a partial shutdown of the federal government. These factors conspired to elevate concerns of a possible recession here and abroad.
Yet despite the headline risks, we think it's critically important to remain focused on the data. By all accounts, the U.S. economy continued chugging along in 2018 with a real gross domestic product (GDP) rising 3.4 percent in the third quarter of 2018, the latest figures available from the Bureau of Economic Analysis. Moreover, the labor picture continues to shine with consistent monthly job growth and an unemployment rate of 3.9 percent. All this comes against a backdrop of low inflation and solid corporate earnings.
The markets, it appears, have been vacillating between the dire headlines and higher perceived risks on one hand, and the continued positive economic data on the other. Of course, no one knows where the Fed will stop raising rates, nor is there any certainty on how the trade turmoil ultimately gets resolved. For now, however, we continue to embrace our solid economic fundamentals. Moreover, we believe all of Victory Capital's independent investment franchises are well positioned to take advantage of any short-term valuation dislocations resulting from the current era of heightened volatility.
On the following pages, you will find information relating to your Victory Funds investment. If you have any questions, we encourage you to contact your financial advisor. Or, if you invest with us directly, you may call (800) 539-3863, or visit our website at www.vcm.com.
My colleagues and I sincerely appreciate the confidence you have placed in the Victory Funds, and we value the opportunity to help meet your investment goals.

Christopher K. Dyer, CFA
President,
Victory Funds
3
Victory Variable Insurance Funds
Victory High Yield VIP Series
Portfolio Holdings
As a Percentage of Total Investments
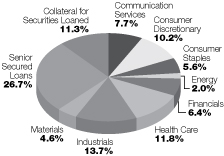
Performance Summary
The Victory High Yield VIP Series ("Fund") seeks to provide current income. The Fund outperformed its benchmark, the Bloomberg Barclays U.S. Corporate High Yield Bond Index (the "Index"), in 2018, returning 0.29% compared with -2.08% for the Index.
Security selection was the chief contributor to the outperformance, with asset allocation also positive.
The top contributors to performance relative to the Index were an allocation to floating rate bank loans, which are not in the Index, and both asset allocation and security selection in energy. Security selection in CCC-rated bonds was also very strong, outweighing the negative impact of an overweight there.
Security selection in health care detracted from relative performance, as did both asset allocation and security selection in media & entertainment and building materials.
Market Review
The final months of 2018 were an all-you-can-eat banquet of worry for investors, particularly in equities and corporate bonds. Among the concerns: rising interest rates and an aging economic boom at home, slowing economies overseas, trade disputes, tumbling energy prices, dysfunction in Washington, scandals over online privacy and election meddling, and a bungling Brexit.
The concerns that shook the markets in the fourth quarter were not new and there were spikes in volatility in the first and second quarters of 2018, but a strong domestic economy and solid corporate earnings limited their impact on returns until the fourth quarter.
Market Recap
The U.S. high yield market benefitted from a favorable technical climate, solid corporate fundamentals and the relative strength of the U.S. economy throughout much of 2018. The high yield market's domestic focus also helped in a year marked by trade disputes and weakening growth overseas. But none of that was enough to stave off a dramatic reversal at the end of the year that generated an Index return of -4.5% in the fourth quarter and wiped out the Index's gains for the year.
Amid an overall market shakeup in the fourth quarter, sharply weaker oil prices and concerns about the health of some weaker investment grade companies combined to pressure the Index, 16% of which is composed of energy companies. In addition, the leveraged loan market, which is also mostly below investment grade, was offering attractive yields for investors and better terms for issuers.
For the full year, high yield corporate bonds underperformed comparable-maturity Treasuries, but still they held up far better in relation to Treasurys than investment grade corporates.
4
Victory Variable Insurance Funds
Victory High Yield VIP Series (continued)
Portfolio Review
By the beginning of the fourth quarter, we had come to view the energy sector as overvalued, and we reduced energy exposure from 10% to about 1% just before oil prices started to collapse in early October. This had a strong positive impact on relative performance in both the fourth quarter and the full year. Quality sector changes within the portfolio were limited given our view that tighter spreads are making some sections of the market less attractive. We remained underweight in BB-rated bonds, which we view as most vulnerable to interest rate and duration risk. Toward the end of the year, we began to reduce our exposure to CCC-rated bonds, reflecting our view that a pivot toward higher quality will be required over the next 12-15 months.
Recognizing that leveraged loans may currently offer investors a compelling relative value, we have maintained the portfolio's exposure at 30%. We believe loans also offer a high-quality, high-yielding alternative to longer-term BB-rated bonds, which can respond particularly negatively to rising interest rates. We continue to watch for an inflection point in the relative value of bonds and loans.
We also are monitoring the energy and commodities markets for attractive re-entry points. As has long been our practice, we continue to make bottom-up assessments across sectors of potential merger and acquisition activity, asset sales, and shifts in issuers' lines of business, as these events can offer attractive total return opportunities.
Market Outlook
We believe that the high yield market currently offers attractive yields and will continue to generate steady demand, driving spreads tighter. We expect a strong technical environment with moderating mutual fund outflows, limited new issuance and low default rates through at least the first half of 2019.
Barring any external events, we believe modest spread tightening and a catalyst in the energy sector could provide investment opportunities in 2019. We believe that these two factors could largely offset concerns about the domestic credit cycle, though we remain vigilant for an investor pivot toward higher-quality issuers within high yield.
5
Victory Variable Insurance Funds
Victory High Yield VIP Series (continued)
Average Annual Return
Year Ended December 31, 2018
| | Class I | |
INCEPTION DATE | | 9/13/99 | |
| | | |
Net Asset
Value | | | | Bloomberg
Barclays U.S. Corporate
High Yield Bond Index1 | | |
One Year | | | 0.29 | % | | | –2.08 | % | |
Three Year | | | 8.37 | % | | | 7.23 | % | |
Five Year | | | 3.79 | % | | | 3.83 | % | |
Ten Year | | | 9.21 | % | | | 11.12 | % | |
Since Inception | | | 5.57 | % | | | N/A | | |
Expense Ratios
Gross | | | 0.79 | % | |
With Applicable Waivers | | | 0.79 | % | |
Past performance is not indicative of future results. The performance data quoted represents past performance and current returns may be lower or higher. The investment return and principal value will fluctuate so that an investor's shares, when redeemed, may be worth more or less than the original cost. To obtain performance information current to the most recent month's end, please visit www.vcm.com.
The above expense ratios are from the Fund's prospectus dated May 1, 2018. Additional information pertaining to the Fund's expense ratios as of December 31, 2018 can be found in the financial highlights.
The total return figures set forth above include all waivers of fees for various periods since inception. Without such fee waivers, the total returns would have been lower. Some fee waivers are voluntary and may be modified or terminated at any time. The total returns do not include any insurance, sales or administrative charges of variable annuity or life insurance contracts. If these charges were included, the total returns would have been lower.
Victory High Yield VIP Series — Growth of $10,000

1The Bloomberg Barclays U.S. Corporate High-Yield Bond Index is generally considered to be representative of the investable universe of the U.S.-dominated high yield debt market. The Barclays U.S. Corporate High-Yield Bond Index is not available for direct investment. There are no expenses associated with the index, while there are expenses associated with the Fund. It is not possible to invest directly in an index.
The graph reflects investment of growth of a hypothetical $10,000 investment in the Fund. Past performance is no guarantee of future results.
The graph and table do not reflect the deduction of taxes that a shareholder would pay on Fund distributions or the redemption of Fund shares.
6
Victory Variable Insurance Funds
Victory High Yield VIP Series | | Schedule of Portfolio Investments
December 31, 2018 | |
Security Description | | Shares or
Principal
Amount | | Value | |
Common Stocks (2.1%) | |
Communication Services (1.5%): | |
AMC Networks, Inc., Class A (a) | | $ | 3,000 | | | $ | 164,640 | | |
Cinemark Holdings, Inc. | | | 2,500 | | | | 89,500 | | |
TEGNA, Inc. | | | 17,000 | | | | 184,790 | | |
| | | | 438,930 | | |
Consumer Discretionary (0.6%): | |
Wynn Resorts Ltd. | | | 2,000 | | | | 197,820 | | |
Total Common Stocks (Cost $731,222) | | | 636,750 | | |
Senior Secured Loans (29.5%) | |
Ai Ladder Luxembourg Subco Sarl, 1st Lien Term Loan B, 7.02%
(LIBOR06M+450bps), 5/4/25 (b) | | | 398,261 | | | | 392,785 | | |
Alphabet Holding Co., Inc., 2nd Lien Term Loan, 10.09% (LIBOR01M+775bps),
8/15/25, Callable 2/6/19 @ 101 (b) | | | 500,000 | | | | 410,000 | | |
Avaya, Inc., 1st Lien Term Loan B, 6.71% (LIBOR01M+425bps), 12/15/24,
Callable 2/6/19 @ 100 (b) | | | 346,500 | | | | 333,939 | | |
Bass Pro Group LLC, Term Loan B, 7.34% (LIBOR01M+500bps), 12/16/23,
Callable 2/6/19 @ 101 (b) | | | 491,256 | | | | 468,904 | | |
Caesars Resort Collection LLC, 1st Lien Term Loan B, 5.09% (LIBOR01M+275bps),
10/2/24, Callable 2/6/19 @ 100 (b) | | | 245,630 | | | | 235,453 | | |
CPM Holdings, Inc., 6.27% (LIBOR01M+375bps), 10/24/25 (b) | | | 200,000 | | | | 195,750 | | |
Crown Finance US, Inc., 1st Lien Term Loan B, 4.84% (LIBOR01M+250bps),
2/7/25, Callable 2/6/19 @ 100 (b) | | | 347,375 | | | | 327,689 | | |
Dayco Products LLC, 6.96% (LIBOR03M+425bps), 5/19/24,
Callable 2/6/19 @ 100 (b) | | | 489,737 | | | | 476,269 | | |
Hertz Corp., Term Loan B1, 5.09% (LIBOR01M+275bps), 6/30/23,
Callable 2/6/19 @ 100 (b) | | | 489,822 | | | | 469,881 | | |
Holley Purchaser, Inc., 1st Lien Term Loan, 7.51% (LIBOR03M+500bps),
10/24/25, Callable 2/6/19 @ 101 (b) | | | 200,000 | | | | 195,000 | | |
LifeScan Global Corp., 1st Lien Term Loan, 8.40% (LIBOR03M+600bps),
6/19/24, Callable 2/6/19 @ 101 (b) | | | 500,000 | | | | 471,250 | | |
Navistar, Inc., 1st Lien Term Loan B, 5.89% (LIBOR01M+350bps), 11/2/24,
Callable 2/6/19 @ 100 (b) | | | 246,250 | | | | 237,016 | | |
Packaging Coordinators Midco, Inc., 2nd Lien Term Loan,
11.14% (LIBOR03M+875bps), 7/1/24, Callable 2/6/19 @ 100 (b) | | | 400,000 | | | | 398,000 | | |
PetSmart, Inc., 5.38% (LIBOR01M+300bps), 3/10/22,
Callable 2/6/19 @ 100 (b) | | | 492,367 | | | | 387,739 | | |
Radiate Holdco LLC, 5.34% (LIBOR01M+300bps), 2/1/24,
Callable 2/6/19 @ 100 (b) | | | 494,962 | | | | 465,804 | | |
Regionalcare Hospital Partners Holdings, Inc., 7.13% (LIBOR03M+450bps),
11/16/25 (b) | | | 250,000 | | | | 236,563 | | |
Reynolds Group Holdings, Inc., 1st Lien Term Loan B, 5.09% (LIBOR01M+275bps),
2/5/23, Callable 2/6/19 @ 100 (b) | | | 654,959 | | | | 622,211 | | |
SIWF Holdings, Inc., 10.97% (LIBOR01M+850bps), 5/26/26 (b) | | | 500,000 | | | | 460,000 | | |
Specialty Building Products Holdings LLC, 1st Lien Term Loan,
8.09% (LIBOR01M+575bps), 10/1/25, Callable 2/6/19 @ 101 (b) | | | 500,000 | | | | 482,500 | | |
See notes to financial statements.
7
Victory Variable Insurance Funds
Victory High Yield VIP Series | | Schedule of Portfolio Investments — continued
December 31, 2018 | |
Security Description | | Principal
Amount | | Value | |
Sprint Communications, Inc., 1st Lien Term Loan B, 4.88% (LIBOR01M+250bps),
2/2/24, Callable 2/6/19 @ 100 (b) | | $ | 496,212 | | | $ | 470,990 | | |
Stars Group Holdings BV, 5.89% (LIBOR03M+350bps), 6/27/25 (b) | | | 497,500 | | | | 479,674 | | |
Tenneco, Inc., 1st Lien Term Loan B, 5.09% (LIBOR01M+275bps),
6/18/25, Callable 2/6/19 @ 101 (b) | | | 200,000 | | | | 187,400 | | |
Utz Quality Foods LLC, 2nd Lien Term Loan, 9.59% (LIBOR01M+725bps),
11/21/25, Callable 2/6/19 @ 101 (b) | | | 300,000 | | | | 282,000 | | |
Windstream Services LLC. 1st Lien Term Loan, 5.71% (LIBOR01M+325bps),
2/8/24, Callable 2/6/19 @ 100 (b) | | | 246,207 | | | | 207,121 | | |
Wynn Resorts Ltd., 1st Lien Term Loan B, 4.60% (LIBOR01M+225bps),
10/30/24, Callable 2/6/19 @ 101 (b) | | | 250,000 | | | | 235,783 | | |
Total Senior Secured Loans (Cost $9,565,296) | | | 9,129,721 | | |
Corporate Bonds (66.5%) | |
Communication Services (7.1%): | |
AMC Entertainment Holdings, Inc., 5.75%, 6/15/25, Callable 6/15/20 @ 102.88 | | | 500,000 | | | | 443,330 | | |
AMC Networks, Inc., 4.75%, 8/1/25, Callable 8/1/21 @ 102.38 | | | 400,000 | | | | 365,884 | | |
Cablevision Systems Corp., 5.88%, 9/15/22 | | | 500,000 | | | | 492,055 | | |
Hughes Satellite Systems Corp., 6.63%, 8/1/26 (c) | | | 500,000 | | | | 459,340 | | |
Telesat Canada/Telesat LLC, 8.88%, 11/15/24, Callable 11/15/19 @ 106.66 (d) | | | 300,000 | | | | 312,138 | | |
Windstream Services LLC / Windstream Finance Corp., 9.00%, 6/30/25,
Callable 6/30/21 @ 104.5 (d) | | | 178,000 | | | | 120,558 | | |
| | | | 2,193,305 | | |
Consumer Discretionary (10.5%): | |
AV Homes, Inc., 6.63%, 5/15/22, Callable 5/15/19 @ 103.31 | | | 175,000 | | | | 175,189 | | |
Beazer Homes USA, Inc., 5.88%, 10/15/27, Callable 10/15/22 @ 102.94 (c) | | | 400,000 | | | | 316,004 | | |
Boyd Gaming Corp., 6.38%, 4/1/26, Callable 4/1/21 @ 103.19 | | | 392,000 | | | | 378,429 | | |
Delta Merger Sub, Inc., 6.00%, 9/15/26, Callable 9/15/21 @ 104.5 (d) | | | 400,000 | | | | 377,952 | | |
Golden Nugget, Inc., 8.75%, 10/1/25, Callable 10/1/20 @ 104.38 (d) | | | 500,000 | | | | 479,939 | | |
Party City Holdings, Inc., 6.63%, 8/1/26, Callable 8/1/21 @ 103.31 (c) (d) | | | 500,000 | | | | 454,720 | | |
The Enterprise Development Authority, 12.00%, 7/15/24,
Callable 7/15/21 @ 109 (d) | | | 500,000 | | | | 457,910 | | |
Travelport Corporate Finance PLC, 6.00%, 3/15/26, Callable 3/15/21 @ 103 (d) | | | 160,000 | | | | 161,438 | | |
Yum! Brands, Inc., 5.35%, 11/1/43, Callable 5/1/43 @ 100 | | | 550,000 | | | | 459,420 | | |
| | | | 3,261,001 | | |
Consumer Staples (6.1%): | |
Albertsons Cos. LLC, 5.75%, 3/15/25, Callable 9/15/19 @ 104.31 | | | 500,000 | | | | 437,500 | | |
B&G Foods, Inc., 4.63%, 6/1/21, Callable 2/7/19 @ 101.16 | | | 200,000 | | | | 195,598 | | |
Cott Holdings, Inc., 5.50%, 4/1/25, Callable 4/1/20 @ 104.13 (d) | | | 500,000 | | | | 472,705 | | |
Dole Food Co., Inc., 7.25%, 6/15/25, Callable 6/15/20 @ 103.63 (d) | | | 500,000 | | | | 450,235 | | |
Simmons Foods, Inc., 7.75%, 1/15/24, Callable 1/15/21 @ 103.88 (c) (d) | | | 330,000 | | | | 332,521 | | |
| | | | 1,888,559 | | |
Energy (2.2%): | |
Diamond Offshore Drilling, Inc., 4.88%, 11/1/43, Callable 5/1/43 @ 100 | | | 618,000 | | | | 345,116 | | |
Endeavor Energy Resources LP/EER Finance, Inc., 5.50%, 1/30/26,
Callable 1/30/21 @ 104.13 (d) | | | 350,000 | | | | 355,324 | | |
| | | | 700,440 | | |
See notes to financial statements.
8
Victory Variable Insurance Funds
Victory High Yield VIP Series | | Schedule of Portfolio Investments — continued
December 31, 2018 | |
Security Description | | Principal
Amount | | Value | |
Financials (7.1%): | |
Compass Group Diversified Holdings LLC, 8.00%, 5/1/26,
Callable 5/1/21 @ 104 (d) | | $ | 500,000 | | | $ | 495,785 | | |
Downstream Development Authority of the Quapaw Tribe of Oklahoma, 10.50%,
2/15/23, Callable 2/15/20 @ 105.25 (d) | | | 500,000 | | | | 480,255 | | |
Gray Escrow, Inc., 7.00%, 5/15/27, Callable 5/15/22 @ 105.25 (d) | | | 120,000 | | | | 116,828 | | |
Intelsat Jackson Holdings SA, 5.50%, 8/1/23, Callable 2/7/19 @ 102.75 | | | 500,000 | | | | 439,490 | | |
Resideo Funding, Inc., 6.13%, 11/1/26, Callable 11/1/21 @ 104.59 (d) | | | 670,000 | | | | 661,638 | | |
| | | | 2,193,996 | | |
Health Care (13.0%): | |
Air Medical Group Holdings, Inc., 6.38%, 5/15/23, Callable 2/7/19 @ 103.19 (d) | | | 500,000 | | | | 422,505 | | |
Avantor, Inc., 9.00%, 10/1/25, Callable 10/1/20 @ 106.75 (d) | | | 500,000 | | | | 499,715 | | |
Change Health/Finance, Inc., 5.75%, 3/1/25, Callable 3/1/20 @ 102.88 (d) | | | 300,000 | | | | 280,164 | | |
Endo Finance LLC, 6.00%, 2/1/25, Callable 2/1/20 @ 103 (d) | | | 200,000 | | | | 143,500 | | |
Polaris Intermediate Corp., 8.50%, 12/1/22, Callable 6/1/19 @ 104 (d) | | | 500,000 | | | | 456,740 | | |
Sotera Health Topco, Inc., 8.13%, 11/1/21, Callable 2/7/19 @ 101 (d) | | | 500,000 | | | | 466,340 | | |
Surgery Center Holdings, 6.75%, 7/1/25, Callable 7/1/20 @ 103.38 (c) (d) | | | 500,000 | | | | 426,595 | | |
Tenet Healthcare Corp., 8.13%, 4/1/22 | | | 200,000 | | | | 200,256 | | |
Valeant Pharmaceuticals International, Inc., 5.88%, 5/15/23,
Callable 2/7/19 @ 102.94 (d) | | | 500,000 | | | | 461,241 | | |
Verscend Escrow Corp., 9.75%, 8/15/26, Callable 8/15/21 @ 104.88 (d) | | | 500,000 | | | | 469,915 | | |
Vizient, Inc., 10.38%, 3/1/24, Callable 3/1/19 @ 107.78 (d) | | | 200,000 | | | | 211,872 | | |
| | | | 4,038,843 | | |
Industrials (15.3%): | |
Ahern Rentals, Inc., 7.38%, 5/15/23, Callable 2/7/19 @ 105.53 (c) (d) | | | 500,000 | | | | 400,480 | | |
Algeco Global Finance 2 PLC, 10.00%, 8/15/23, Callable 2/15/20 @ 105 (c) (d) | | | 550,000 | | | | 512,974 | | |
Apex Tool Group LLC /BC Mountain Finance, Inc., 9.00%, 2/15/23,
Callable 2/15/19 @ 102 (c) (d) | | | 500,000 | | | | 426,115 | | |
Beacon Escrow Corp., 4.88%, 11/1/25, Callable 11/1/20 @ 102.44 (d) | | | 470,000 | | | | 413,492 | | |
Covanta Holding Corp., 5.88%, 7/1/25, Callable 7/1/20 @ 104.41 | | | 500,000 | | | | 459,960 | | |
Pisces Midco, Inc., 8.00%, 4/15/26, Callable 4/15/21 @ 104 (c) (d) | | | 500,000 | | | | 457,500 | | |
SRS Distribution, Inc., 8.25%, 7/1/26, Callable 7/1/21 @ 104.13 (c) (d) | | | 500,000 | | | | 459,540 | | |
Stevens Holding Co., Inc., 6.13%, 10/1/26, Callable 10/1/23 @ 101.53 (d) | | | 330,000 | | | | 325,482 | | |
TransDigm, Inc., 6.50%, 7/15/24, Callable 7/15/19 @ 103.25 | | | 200,000 | | | | 194,530 | | |
Triumph Group, Inc., 4.88%, 4/1/21, Callable 2/7/19 @ 101.22 | | | 500,000 | | | | 446,485 | | |
United Rentals, Inc., 6.50%, 12/15/26, Callable 12/15/21 @ 103.25 | | | 200,000 | | | | 197,000 | | |
W/S Packaging Holdings, Inc., 9.00%, 4/15/23, Callable 4/15/20 @ 104.5 (d) | | | 400,000 | | | | 398,000 | | |
| | | | 4,691,558 | | |
Materials (5.2%): | |
Intertape Polymer Group, Inc., 7.00%, 10/15/26, Callable 10/15/21 @ 103.5 (d) | | | 670,000 | | | | 661,625 | | |
Plastipak Holdings, Inc., 6.25%, 10/15/25, Callable 10/15/20 @ 103.13 (d) | | | 330,000 | | | | 295,155 | | |
Reynolds Group Issuer, Inc., 5.75%, 10/15/20, Callable 2/7/19 @ 100 | | | 193,822 | | | | 193,316 | | |
Titan Acquisition Ltd. / Titan Co-Borrower LLC, 7.75%, 4/15/26,
Callable 4/15/21 @ 103.88 (d) | | | 500,000 | | | | 430,550 | | |
| | | | 1,580,646 | | |
Total Corporate Bonds (Cost $22,012,235) | | | 20,548,348 | | |
See notes to financial statements.
9
Victory Variable Insurance Funds
Victory High Yield VIP Series | | Schedule of Portfolio Investments — continued
December 31, 2018 | |
Security Description | | Shares | | Value | |
Collateral for Securities Loaned^ (12.5%) | |
BlackRock Liquidity Funds TempFund Portfolio, Institutional Class, 2.49% (e) | | | 734,926 | | | $ | 734,926 | | |
Fidelity Investments Money Market Government Portfolio, Class I, 2.28% (e) | | | 1,061,934 | | | | 1,061,934 | | |
Fidelity Investments Prime Money Market Portfolio, Class I, 2.46% (e) | | | 32,793 | | | | 32,793 | | |
Goldman Sachs Financial Square Prime Obligations Fund,
Institutional Class, 2.55% (e) | | | 408,297 | | | | 408,297 | | |
JPMorgan Prime Money Market Fund, Capital Class, 2.49% (e) | | | 653,235 | | | | 653,235 | | |
Morgan Stanley Institutional Liquidity Prime Portfolio,
Institutional Class, 2.58% (e) | | | 979,913 | | | | 979,913 | | |
Total Collateral for Securities Loaned (Cost $3,871,098) | | | 3,871,098 | | |
Total Investments (Cost $36,179,851) — 110.6% | | | 34,185,917 | | |
Liabilities in excess of other assets — (10.6)% | | | (3,267,682 | ) | |
NET ASSETS — 100.00% | | $ | 30,918,235 | | |
^ Purchased with cash collateral from securities on loan.
(a) Non-income producing security.
(b) Variable or Floating-Rate Security. Rate disclosed is as of December 31, 2018.
(c) All or a portion of this security is on loan.
(d) Rule 144A security or other security that is restricted as to resale to institutional investors. The Fund's Adviser has deemed this security to be liquid based upon procedures approved by the Board of Trustees. As of December 31, 2018, the fair value of these securities was $14,349,445 and amounted to 46.6% of net assets.
(e) Rate disclosed is the daily yield on December 31, 2018.
bps — Basis points
LIBOR — London InterBank Offered Rate
LIBOR01M — 1 Month US Dollar LIBOR, rate disclosed as of December 31, 2018, based on the last reset date of the security
LIBOR03M — 3 Month US Dollar LIBOR, rate disclosed as of December 31, 2018, based on the last reset date of the security
LIBOR06M — 6 Month US Dollar LIBOR, rate disclosed as of December 31, 2018, based on the last reset date of the security
LLC — Limited Liability Company
LP — Limited Partnership
PLC — Public Limited Company
See notes to financial statements.
10
Victory Variable Insurance Funds | | Statement of Assets and Liabilities
December 31, 2018 | |
| | | Victory High Yield
VIP Series | |
ASSETS: | |
Investments, at value (Cost $36,179,851) | | $ | 34,185,917 | (a) | |
Cash and cash equivalents | | | 175,369 | | |
Interest and dividends receivable | | | 493,788 | | |
Receivable for capital shares issued | | | 36 | | |
Receivable for investments sold | | | 2,326 | | |
Total Assets | | | 34,857,436 | | |
LIABILITIES: | |
Payables: | |
Collateral received on loaned securities | | | 3,871,098 | | |
Capital shares redeemed | | | 19,952 | | |
Accrued expenses and other payables: | |
Investment advisory fees | | | 16,120 | | |
Administration fees | | | 1,647 | | |
Custodian fees | | | 2,781 | | |
Transfer agent fees | | | 3,700 | | |
Chief Compliance Officer fees | | | 62 | | |
Trustees' fees | | | 31 | | |
Other accrued expenses | | | 23,810 | | |
Total Liabilities | | | 3,939,201 | | |
NET ASSETS: | |
Capital | | | 34,354,997 | | |
Total distributable earnings/(loss) | | | (3,436,762 | ) | |
Net Assets | | $ | 30,918,235 | | |
Shares Outstanding (unlimited shares authorized, with a par value
of $0.001 per share): | | | 4,522,777 | | |
Net asset value: | | $ | 6.84 | | |
(a) Includes $3,699,274 of securities on loan.
See notes to financial statements.
11
Victory Variable Insurance Funds | | Statement of Operations
For the Year Ended December 31, 2018 | |
| | | Victory High Yield
VIP Series | |
Investment Income: | |
Dividend | | $ | 15,070 | | |
Interest | | | 2,450,163 | | |
Securities lending (net of fees) | | | 57,424 | | |
Total Income | | | 2,522,657 | | |
Expenses: | |
Investment advisory fees | | | 209,946 | | |
Administration fees | | | 20,931 | | |
Custodian fees | | | 10,163 | | |
Transfer agent fees | | | 7,566 | | |
Trustees' fees | | | 3,311 | | |
Chief Compliance Officer fees | | | 301 | | |
Legal and audit fees | | | 18,638 | | |
Other expenses | | | 19,330 | | |
Total Expenses | | | 290,186 | | |
Net Investment Income (Loss) | | | 2,232,471 | | |
Realized/Unrealized Gains (Losses) from Investment Transactions: | |
Net realized gains (losses) from investment transactions | | | 356,829 | | |
Net change in unrealized appreciation/depreciation on investments | | | (2,369,605 | ) | |
Net realized/unrealized losses on investments | | | (2,012,776 | ) | |
Change in net assets resulting from operations | | $ | 219,695 | | |
See notes to financial statements.
12
Victory Variable Insurance Funds | | Statements of Changes in Net Assets | |
| | | Victory High Yield VIP Series | |
| | | Year
Ended
December 31,
2018 | | Year
Ended
December 31,
2017 | |
From Investment Activities: | |
Operations: | |
Net investment income (loss) | | $ | 2,232,471 | | | $ | 2,315,794 | | |
Net realized gains (losses) from investment transactions | | | 356,829 | | | | 573,774 | | |
Net change in unrealized appreciation/depreciation
on investments | | | (2,369,605 | ) | | | 757,766 | | |
Change in net assets resulting from operations | | | 219,695 | | | | 3,647,334 | | |
Distributions to Shareholders: (a) | |
Change in net assets resulting from distributions to shareholders | | | (179,666 | ) | | | (2,204,964 | ) | |
Change in net assets resulting from capital transactions | | | (6,521,715 | ) | | | (2,884,746 | ) | |
Change in net assets | | | (6,481,686 | ) | | | (1,442,376 | ) | |
Net Assets: | |
Beginning of period | | | 37,399,921 | | | | 38,842,297 | | |
End of period | | $ | 30,918,235 | | | $ | 37,399,921 | | |
Capital Transactions: | |
Proceeds from shares issued | | $ | 1,232,848 | | | $ | 2,746,992 | | |
Distributions reinvested | | | 179,666 | | | | 2,204,964 | | |
Cost of shares redeemed | | | (7,934,229 | ) | | | (7,836,702 | ) | |
Change in net assets resulting from capital transactions | | $ | (6,521,715 | ) | | $ | (2,884,746 | ) | |
Share Transactions: | |
Issued | | | 176,340 | | | | 394,480 | | |
Reinvested | | | 26,344 | | | | 321,893 | | |
Redeemed | | | (1,133,739 | ) | | | (1,121,744 | ) | |
Change in Shares | | | (931,055 | ) | | | (405,371 | ) | |
(a) Current and prior year distributions to shareholders have been reclassified and conform to amended GAAP presentation under Regulation S-X (See Item 10 in the Notes to Financial Statements).
See notes to financial statements.
13
Victory Variable Insurance Funds | | Financial Highlights | |
For a Share Outstanding Throughout Each Period
| | | Victory High Yield VIP Series | |
| | | Year
Ended
December 31,
2018 | | Year
Ended
December 31,
2017 | | Year
Ended
December 31,
2016 | | Year
Ended
December 31,
2015 | | Year
Ended
December 31,
2014 | |
Net Asset Value, Beginning of Period | | $ | 6.86 | | | $ | 6.63 | | | $ | 6.13 | | | $ | 6.90 | | | $ | 7.70 | | |
Investment Activities: | |
Net investment income (loss) | | | 0.45 | (a) | | | 0.42 | (a) | | | 0.41 | (a) | | | 0.43 | (a) | | | 0.50 | | |
Net realized and unrealized gains
(losses) on investments | | | (0.43 | ) | | | 0.24 | | | | 0.53 | | | | (0.75 | ) | | | (0.56 | ) | |
Total from Investment Activities | | | 0.02 | | | | 0.66 | | | | 0.94 | | | | (0.32 | ) | | | (0.06 | ) | |
Distributions to Shareholders: | |
Net investment income | | | (0.04 | ) | | | (0.43 | ) | | | (0.45 | ) | | | (0.44 | ) | | | (0.53 | ) | |
Net realized gains from investments | | | — | | | | — | | | | — | | | | — | | | | (0.21 | ) | |
Return of Capital | | | — | | | | — | | | | — | | | | (0.01 | ) | | | — | | |
Total Distributions to
Shareholders | | | (0.04 | ) | | | (0.43 | ) | | | (0.45 | ) | | | (0.45 | ) | | | (0.74 | ) | |
Capital Contributions from Prior
Custodian, Net (See Note 8) | | | — | | | | — | | | | 0.01 | | | | — | | | | — | | |
Net Asset Value, End of Period | | $ | 6.84 | | | $ | 6.86 | | | $ | 6.63 | | | $ | 6.13 | | | $ | 6.90 | | |
Total Return (b) | | | 0.29 | % | | | 9.94 | % | | | 15.44 | %(c) | | | (4.58 | )% | | | (0.84 | )% | |
Ratios/Supplemental Data: | |
Net Assets at end of period (000) | | $ | 30,918 | | | $ | 37,411 | | | $ | 38,842 | | | $ | 38,503 | | | $ | 44,533 | | |
Ratio of net expenses to average net assets | | | 0.83 | % | | | 0.79 | % | | | 0.87 | % | | | 0.89 | % | | | 0.82 | % | |
Ratio of net investment income (loss) to
average net assets | | | 6.38 | % | | | 6.02 | % | | | 6.31 | % | | | 6.15 | % | | | 5.68 | % | |
Ratio of gross expenses to average net assets | | | 0.83 | % | | | 0.79 | % | | | 0.87 | %(d) | | | 0.89 | % | | | 0.82 | % | |
Portfolio turnover | | | 94 | % | | | 173 | % | | | 159 | % | | | 148 | % | | | 212 | % | |
(a) Per share net investment income (loss) has been calculated using the average daily shares method.
(b) Total returns do not reflect the effects of charges deducted pursuant to the terms of The Guardian Insurance & Annuity Company, Inc's variable contracts. Inclusion of such charges would reduce the total returns for all periods shown.
(c) The Fund received monies related to a nonrecurring refund from the prior Custodian. The corresponding impact to the total return was less than 0.15% for the period shown. (See Note 8)
(d) During the period, certain fees were reduced and/or reimbursed. If such fee reductions and/or reimbursements had not occurred, the ratios would have been as indicated.
See notes to financial statements.
14
Victory Variable Insurance Funds | | Notes to Financial Statements
December 31, 2018 | |
1. Organization:
Victory Variable Insurance Funds (the "Trust") was organized on February 11, 1998 as a Delaware statutory trust. The Trust is registered under the Investment Company Act of 1940, as amended (the "1940 Act"), as a diversified open-end investment company. The Trust is comprised of nine funds and is authorized to issue an unlimited number of shares, which are units of beneficial interest with a par value of $0.001 per share.
The accompanying financial statements are those of the Victory High Yield VIP Series (the "Fund"). The Fund offers a single class of shares: Class I Shares. Sales of shares of the Fund may only be made to certain separate accounts of The Guardian Insurance & Annuity Company, Inc. ("GIAC") that fund certain variable annuity and variable life insurance contracts issued by GIAC. GIAC is a wholly owned subsidiary of The Guardian Life Insurance Company of America ("Guardian Life").
Under the Trust's organizational documents, its officers and trustees are indemnified against certain liabilities arising out of the performance of their duties to the Fund. In addition, in the normal course of business, the Fund enters into contracts with its vendors and others that provide for general indemnifications. The Fund's maximum exposure under these arrangements is unknown, as this would involve future claims that may be made against the Fund. However, based on experience, the Fund expects that risk of loss to be remote.
2. Significant Accounting Policies:
The following is a summary of significant accounting policies followed by the Trust in the preparation of its financial statements. The policies are in conformity with accounting principles generally accepted in the United States of America ("GAAP"). The preparation of financial statements in accordance with GAAP requires management to make estimates and assumptions that affect the reported amounts of assets and liabilities and disclosure of contingent assets and liabilities at the date of the financial statements and the reported amounts of income and expenses for the period. Actual results could differ from those estimates. The Fund follows the specialized accounting and reporting requirements under GAAP that are applicable to investment companies.
Investment Valuation:
The Fund records investments at fair value. Fair value is defined as the price that would be received to sell an asset or paid to transfer a liability in an orderly transaction between market participants at the measurement date.
The valuation techniques described below maximize the use of observable inputs and minimize the use of unobservable inputs in determining fair value. The inputs used for valuing the Fund's investments are summarized in the three broad levels listed below:
• Level 1 — quoted prices in active markets for identical securities
• Level 2 — other significant observable inputs (including quoted prices for similar securities or interest rates applicable to those securities, etc.)
• Level 3 — significant unobservable inputs (including the Fund's own assumptions in determining the fair value of investments)
Changes in valuation techniques may result in transfers in or out of an assigned level within the disclosure hierarchy. The inputs or methodologies used for valuation techniques are not necessarily an indication of the risk associated with entering into those investments.
Portfolio securities listed or traded on securities exchanges, including American Depositary Receipts ("ADRs") and Rights, are valued at the closing price on the exchange or system where the security is principally traded, if available, or at the Nasdaq Official Closing Price. If there have been no sales for that day on the exchange or system, then a security is valued at the last available bid quotation on the exchange or system where the security is principally traded. In each of these situations, valuations are typically categorized as Level 1 in the fair value hierarchy.
15
Victory Variable Insurance Funds | | Notes to Financial Statements — continued
December 31, 2018 | |
Debt securities of United States ("U.S.") issuers (other than short-term investments maturing in 60 days or less), including corporate and municipal securities, are valued on the basis of bid valuations provided by dealers or an independent pricing service approved by the Trust's Board of Trustees (the "Board"). Short-term investments maturing in 60 days or less may be valued at amortized cost, which approximates market value. Under the amortized cost method, premium or discount, if any, is amortized or accreted, respectively, on a constant basis to the maturity of the security. In each of these situations, valuations are typically categorized as Level 2 in the fair value hierarchy.
Investments for which there are no such quotations, or for which quotations do not appear reliable, are valued at fair value in accordance with procedures established by and under the general supervision and responsibility of the Board. These valuations are typically categorized as Level 2 or Level 3 in the fair value hierarchy, based on the observability of inputs used to determine the fair value.
A summary of the valuations as of December 31, 2018, based upon the three levels defined above, is included in the table below while the breakdown, by category, of investments is disclosed in the Schedule of Portfolio Investments:
| | | LEVEL 1 —
Quoted Prices | | LEVEL 2 —
Other Significant
Observable Inputs | | Total | |
| | | Investments
in
Securities | | Investments
in
Securities | | Investments
in
Securities | |
Common Stocks | | $ | 636,750 | | | $ | — | | | $ | 636,750 | | |
Senior Secured Loans | | | — | | | | 9,129,721 | | | | 9,129,721 | | |
Corporate Bonds | | | — | | | | 20,548,348 | | | | 20,548,348 | | |
Collateral for Securities Loaned | | | 3,871,098 | | | | — | | | | 3,871,098 | | |
Total | | $ | 4,507,848 | | | $ | 29,678,069 | | | $ | 34,185,917 | | |
For the year ended December 31, 2018, there were no Level 3 investments for which significant unobservable inputs were used to determine fair value.
Securities Purchased on a When-Issued Basis:
The Fund may purchase securities on a when-issued basis. When-issued securities are securities purchased for delivery beyond normal settlement periods at a stated price and/or yield, thereby involving the risk that the price and/or yield obtained may be more or less than those available in the market when delivery takes place. At the time the Fund makes the commitment to purchase a security on a when-issued basis, the Fund records the transaction and reflects the value of the security in determining net asset value. No interest accrues to the Fund until the transaction settles and payment takes place. Normally, the settlement date occurs within one month of the purchase. A segregated account is established and the Fund maintains cash and/or marketable securities at least equal in value to commitments for when-issued securities. Values of when issued securities are included in "Payable for investments purchased" on the accompanying Statement of Assets and Liabilities. As of December 31, 2018, the Fund had no outstanding when-issued purchase commitments.
Loans:
Floating rate loans in which the Fund invests are primarily "senior" loans. Senior floating rate loans typically hold a senior position in the capital structure of the borrower, are typically secured by specific collateral, and have a claim on the assets and/or stock of the borrower that is senior to that held by subordinated debtholders and stockholders of the borrower. While these protections may reduce risk, these investments still present significant credit risk. A significant portion of the Fund's floating rate investments may be issued in connection with highly leveraged transactions such as leveraged buyouts, leveraged recapitalization loans, and other types of acquisition financing. Obligations in these types of transactions are subject to greater credit risk (including default and bankruptcy) than many other investments and may be, or become, illiquid. See the note below regarding below investment grade securities.
16
Victory Variable Insurance Funds | | Notes to Financial Statements — continued
December 31, 2018 | |
The Fund may purchase second lien loans (secured loans with a claim on collateral subordinate to a senior lender's claim on such collateral), fixed rate loans, unsecured loans, and other debt obligations.
Transactions in loans often settle on a delayed basis, and the Fund may not receive the proceeds from the sale of a loan or pay for a loan purchase for a substantial period of time after entering into the transactions.
Below Investment Grade Securities:
The Fund may invest in below investment grade securities (i.e. lower-quality, "junk" debt), which are subject to various risks. Lower-quality debt is considered to be speculative because it is less certain that the issuer will be able to pay interest or repay the principal than in the case of investment grade debt. These securities can involve a substantially greater risk of default than higher-rated securities, and their values can decline significantly over short periods of time. Lower-quality debt securities tend to be more sensitive to adverse news about their issuers, the market and the economy in general, than higher-quality debt securities. The market for these securities can be less liquid, especially during periods of recession or general market decline.
Investment Companies:
The Fund may invest in portfolios of open-end investment companies. These investment companies value securities in their portfolios for which market quotations are readily available at their market values (generally the last reported sale price) and all other securities and assets at their fair value by the methods established by the board of directors of the underlying fund.
Investment Transactions and Related Income:
Changes in holdings of investments are accounted for no later than one business day following the trade date. For financial reporting purposes, however, investment transactions are accounted for on trade date on the last business day of the reporting period. Interest income is recognized on an accrual basis and includes, where applicable, the amortization of premiums or accretion of discounts. Dividend income is recorded on the ex-dividend date. Gains or losses realized on sales of securities are determined by comparing the identified cost of the security lot sold with the net sales proceeds.
The Fund may receive other income from investment in loan assignments and/or unfunded commitments, including amendment fees, consent fees and commitment fees. These fees are recorded as income when received by the Fund. These amounts are included in Interest Income in the Statement of Operations.
Withholding taxes on interest, dividends and gains as a result of certain investments in ADRs by the Fund have been provided for in accordance with each investment's applicable country's tax rules and rates.
Securities Lending:
The Trust has entered into a Master Securities Lending Agreement ("MSLA") with Citibank, N.A. ("Citibank" or the "Agent"). Under the terms of the MSLA, the Fund may lend securities to certain broker-dealers and banks in exchange for collateral in the amount of at least 102% of the value of U.S. securities loaned or at least 105% of the value of non-U.S. securities loaned, marked-to-market daily. Any collateral shortfalls associated with increases in the valuation of the securities loaned are adjusted the next business day. The collateral can be received in the form of cash collateral and/or non-cash collateral. Non-cash collateral can include U.S. Government Securities, letters of credit and certificates of deposit. The cash collateral is invested in short-term instruments or cash equivalents as noted on the Fund's Schedule of Portfolio Investments. The Trust does not have effective control of the non-cash collateral and therefore it is not disclosed in the Fund's Schedule of Portfolio Investments. The Fund continues to benefit from interest or dividends on the securities loaned and may also earn a return from the collateral. The Fund pays various fees in connection with the investment of cash collateral. The Fund pays the Agent fees based on the investment income received from securities lending activities. Securities lending income is disclosed in the Fund's Statement of Operations. Although risk is mitigated by the collateral, the Fund could experience a delay in recovering its securities and possible loss of income or value if the borrower fails to return them.
17
Victory Variable Insurance Funds | | Notes to Financial Statements — continued
December 31, 2018 | |
Securities lending transactions are entered into by the Fund under the MSLA, which permits the Fund, under certain circumstances such as an event of default, to offset amounts payable by the Fund to the same counterparty against amounts receivable from the counterparty to create a net payment due to or from the Fund.
The following table is a summary of the Fund's securities lending transactions which are subject to offset under the MSLA as of December 31, 2018. These transactions are accounted for as secured borrowings with an overnight and continuous contractual maturity for cash collateral, and greater than overnight and continuous contractual maturity for non-cash collateral.
Gross
Amount of
Recognized
Assets
(Value of | | Value of
Cash | | Value of Non-cash Collateral
Received by Maturity | | | |
Securities on
Loan) | | Collateral
Received | | <30 Days | | Between 30 &
90 days | | >90 Days | | Net
Amount | |
| $ | 3,699,274 | | | $ | 3,871,098 | | | $ | — | | | $ | — | | | $ | — | | | $ | 171,824 | | |
Dividends to Shareholders:
Dividends from net investment income, if any, are declared and paid annually by the Fund. Distributable net realized gains, if any, are declared and distributed at least annually.
The amounts of dividends from net investment income and distributions from net realized gains are determined in accordance with federal income tax regulations, which may differ from GAAP. To the extent these "book/tax" differences are permanent in nature (e.g., net operating loss, distribution reclassification, and deemed distribution due to shareholder redemptions), such amounts are reclassified within the components of net assets based on their federal tax-basis treatment; temporary differences (e.g., wash sales) do not require reclassification. To the extent dividends and distributions exceed net investment income and net realized gains for tax purposes, they are reported as distributions of capital. Net investment losses incurred by the Fund may be reclassified as an offset to capital on the accompanying Statement of Assets and Liabilities.
As of December 31, 2018, on the Statement of Assets and Liabilities, there were no permanent book-to-tax differences, reclassification adjustments.
Federal Income Taxes:
It is the policy of the Fund to continue to qualify as a regulated investment company by complying with the provisions available to certain investment companies, as defined in applicable sections of the Internal Revenue Code, and to make distributions of net investment income and net realized gains sufficient to relieve it from all, or substantially all, federal income taxes. Accordingly, no provision for federal income taxes is required in the financial statements. The Fund has a tax year end of December 31.
Management of the Fund has reviewed tax positions taken in tax years that remain subject to examination by all major tax jurisdictions, including federal (i.e., the last four tax year ends and the interim tax period since then). Management believes that there is no tax liability resulting from unrecognized tax benefits related to uncertain tax positions taken.
Allocations:
Expenses directly attributable to the Fund are charged to the Fund, while expenses which are attributable to more than one fund in the Trust, or jointly with an affiliated trust, are allocated among the respective funds in the Trust and/or affiliated trust based upon net assets or another appropriate basis.
18
Victory Variable Insurance Funds | | Notes to Financial Statements — continued
December 31, 2018 | |
Affiliated Securities Transactions:
Pursuant to Rule 17a-7 under the 1940 Act, the Fund may engage in securities transactions with affiliated investment companies and advisory accounts managed by the Adviser and any applicable sub-adviser. Any such purchase or sale transaction must be effected without brokerage commission or other remuneration, except for customary transfer fees. The transaction must be effected at the current market price, which is either the security's last sale price on an exchange or, if there are no transactions in the security that day, at the average of the highest bid and lowest asked price. For the year ended December 31, 2018, the Fund did not engage in any Rule 17a-7 transactions under the 1940 Act.
3. Purchases and Sales of Securities:
Purchases and sales of securities (excluding securities maturing less than one year from acquisition) for the year ended December 31, 2018 were as follows for the Fund:
| Purchases | | Sales | |
| $ | 31,734,330 | | | $ | 34,779,665 | | |
For the year ended December 31, 2018, there were no purchases or sales of U.S. Government Securities.
4. Fees and Transactions with Affiliates and Related Parties:
Investment advisory services are provided to the Fund by Victory Capital Management Inc. ("VCM" or the "Adviser"), a New York corporation registered as an investment adviser with the Securities and Exchange Commission ("SEC"). The Adviser is a wholly-owned indirect subsidiary of Victory Capital Holdings Inc., a publicly traded Delaware corporation, and a wholly-owned direct subsidiary of Victory Capital Operating, LLC.
VCM has entered into a Sub-Advisory Agreement with Park Avenue Institutional Advisers LLC ("Park Avenue") with respect to the Fund. Park Avenue is responsible for providing day-to-day investment advisory services to the Fund, subject to the oversight of the Board of Trustees of the Trust. Sub-investment advisory fees, which are paid by VCM to Park Avenue, and do not represent a separate or additional expense to the Fund.
Under the terms of the Investment Advisory Agreement, the Adviser is entitled to receive 0.60% of the average daily net assets of the Fund. The Adviser may use its resources to assist with the Fund's distribution and marketing expenses.
VCM also serves as the Fund's administrator and fund accountant. Under an Administration and Fund Accounting Agreement, VCM is paid for its services an annual fee at a rate of 0.08% of the first $15 billion in average daily net assets of the Trust, Victory Portfolios and Victory Portfolios II (collectively, the "Trusts"), 0.05% of the average daily net assets above $15 billion to $30 billion of the Trusts and 0.04% of the average daily net assets over $30 billion of the Trusts.
Citi Fund Services Ohio, Inc. ("Citi"), an affiliate of Citibank, N.A., acts as sub-administrator and sub-fund accountant to the Fund pursuant to a Sub-Administration and Sub-Fund Accounting Services Agreement between VCM and Citi. VCM pays Citi a fee for providing these services. The Trust reimburses VCM and Citi for all of their reasonable out-of-pocket expenses incurred in providing these services.
FIS Investor Services, LLC ("FIS") serves as the Fund's transfer agent. Under the Transfer Agent Agreement, the Trust pays FIS a fee for its services and reimburses FIS for all of their reasonable out-of-pocket expenses incurred in providing these services.
The Chief Compliance Officer ("CCO") is an employee of the Adviser, which pays the compensation of the CCO and his support staff. The Trust has entered into an Agreement to provide compliance services with the Adviser, pursuant to which the Adviser furnishes its compliance personnel, including the services of the CCO, and other resources reasonably necessary to provide the Trust with compliance oversight services related to the design, administration and oversight of a compliance program for the Trust in accordance with Rule 38a-1 under the 1940 Act. Funds in the Trust, Victory Portfolios, Victory Institutional Funds, and Victory Portfolios II (collectively, the "Victory Funds Complex"), in the aggregate, compensate the Adviser for these services.
19
Victory Variable Insurance Funds | | Notes to Financial Statements — continued
December 31, 2018 | |
The Victory Funds Complex pays an annual retainer to each Independent Trustee, plus an additional annual retainer to the Chairman of the Board. The aggregate amount of the fees and expenses of the Independent Trustees are allocated amongst all the funds in the Victory Funds Complex and are presented in the Statement of Operations.
Shearman & Sterling LLP provides legal services to the Trust.
Victory Capital Advisers, Inc. (the "Distributor"), an affiliate of the Adviser, serves as distributor for the continuous offering of the shares of the Fund pursuant to a Distribution Agreement between the Distributor and the Trust.
The Adviser has entered into an expense limitation agreement with the Fund until at least April 30, 2019. Under the terms of the agreement, the Adviser has agreed to waive fees or reimburse certain expenses to the extent that ordinary operating expenses incurred by certain classes of the Fund in any fiscal year exceed the expense limit for such classes of the Fund. Such excess amounts will be the liability of the Adviser. Interest, taxes, brokerage commissions, other expenditures which are capitalized in accordance with GAAP, and other extraordinary expenses not incurred in the ordinary course of a Fund's business are excluded from the expense limits. For the year ended December 31, 2018, the expense limit (excluding voluntary waivers) is 0.89%.
The Fund has agreed to repay fees and expenses that were waived or reimbursed by the Adviser for a period up to three fiscal years after such waiver or reimbursement was made to the extent such payments or repayments would not cause the expenses of a class to exceed the original expense limitation in place at the time of the waiver or reimbursement or any expense limitation agreement in place at the time of repayment. As of December 31, 2018, the following amounts are available to be repaid to the Adviser. Amounts repaid to the Adviser during the year ended, if any, are reflected on the Statement of Operations as "Recoupment of prior expenses waived/reimbursed by Adviser".
The Adviser may voluntarily waive or reimburse additional fees to assist the Fund in maintaining a competitive expense ratio. Voluntary waivers and reimbursements applicable to the Fund are not available to be recouped at a future time. There were no voluntary waivers or reimbursements for the year ended December 31, 2018.
Certain officers and/or interested trustees of the Fund are also officers and/or employees of the Adviser, Administrator, Fund Accountant, Sub-Administrator, Sub-Fund Accountant, and Legal.
5. Risks:
The Fund may be subject to other risks in addition to these identified risks.
An investment in the Fund's shares represents an indirect investment in the securities owned by the Fund, some of which will be traded on a national securities exchange or in the over-the-counter markets. The value of the securities in which the Fund invests, like other market investments, may move up or down, sometimes rapidly and unpredictably. The value of the securities in which the Fund invests may affect the value of the Fund's shares. An investment in the Fund's shares at any point in time may be worth less than the original investment, even after taking into account the reinvestment of the Fund's distributions.
The Fund will be subject to credit risk with respect to the amount it expects to receive from counterparties for financial instruments entered into by the Fund. The Fund may be negatively impacted if a counterparty becomes bankrupt or otherwise fails to perform its obligations due to financial difficulties. The Fund may experience significant delays in obtaining any recovery in bankruptcy or other reorganization proceeding and the Fund may obtain only limited recovery or may obtain no recovery in such circumstances. The Fund typically enters into transactions with counterparties whose credit ratings are investment grade, as determined by a nationally recognized statistical rating organization or, if unrated, judged by the Adviser to be of comparable quality.
The Fund will be subject to credit and interest rate risk with respect to fixed income securities. Credit risk refers to the ability of an issuer to make timely payments of interest and principal. Interest rates
20
Victory Variable Insurance Funds | | Notes to Financial Statements — continued
December 31, 2018 | |
may rise or the rate of inflation may increase, impacting the value of investments in fixed income securities. A debt issuers' credit quality may be downgraded or an issuer may default. Interest rates may fluctuate due to changes in governmental fiscal policy initiatives and resulting market reaction to those initiatives.
6. Borrowing and Interfund Lending:
Line of Credit:
The Victory Funds Complex participates in a short-term, demand note "Line of Credit" agreement with Citibank. Under the agreement with Citibank, the Victory Funds Complex may borrow up to $250 million, of which $100 million is committed and $150 million is uncommitted. $40 million of the Line of Credit is reserved for use by the Victory Floating Rate Fund, another series of the Victory Funds Complex, with that Fund paying the related commitment fees for that amount. The purpose of the agreement is to meet temporary or emergency cash needs, including redemption requests that might otherwise require the untimely disposition of securities. The current agreement was amended on July 27, 2018 with a new termination date of July 26, 2019. Citibank receives an annual commitment fee of 0.15% on $100 million for providing the Line of Credit. For the year ended December 31, 2018, Citibank earned approximately $150,000 in commitment fees from the Victory Funds Complex. Each fund in the Victory Funds Complex pays a pro-rata portion of the commitment fees plus any interest on amounts borrowed. Interest accrued by the Fund during the period is presented on the Statement of Operations under Interest expense on line of credit.
The Fund did not utilize or participate in the Line of Credit during the year ended December 31, 2018.
Interfund Lending:
The Trust and Adviser rely on an exemptive order granted by the SEC in March 2017 (the "Order"), permitting the establishment and operation of an Interfund Lending Facility (the "Facility"). The Facility allows the Fund to directly lend and borrow money to or from any other Victory Fund relying upon the Order at rates beneficial to both the borrowing and lending funds. Advances under the Facility are allowed for temporary or emergency purposes, including the meeting of redemption requests that otherwise might require the untimely disposition of securities, and are subject to each Fund's borrowing restrictions. The interfund loan rate is determined, as specified in the Order, by averaging the current repurchase agreement rate and the current bank loan rate. Interest accrued by the Fund during the period is presented on the Statement of Operations under Interest expense on interfund lending.
The Fund did not utilize or participate in the Facility during the year ended December 31, 2018.
7. Federal Income Tax Information:
The tax character of distributions paid during the tax years ended, as noted below, were as follows (total distributions paid may differ from the Statements of Changes in Net Assets because, for tax purposes, dividends are recognized when actually paid).
| | | Year Ended December 31, 2018 | |
| | | Distributions paid from | |
| | |
Ordinary
Income | | Net
Long-Term
Capital Gains | | Total
Distributions
Paid | |
| | | | | $ | 179,666 | | | $ | — | | | $ | 179,666 | | |
| | | Year Ended December 31, 2017 | |
| | | Distributions paid from | |
| | |
Ordinary
Income | | Net
Long-Term
Capital Gains | | Total
Distributions
Paid | |
| | | | | $ | 2,204,964 | | | $ | — | | | $ | 2,204,964 | | |
21
Victory Variable Insurance Funds | | Notes to Financial Statements — continued
December 31, 2018 | |
As of the tax year ended December 31, 2018, the components of accumulated earnings (deficit) on a tax basis were as follows:
Undistributed
Ordinary
Income | | Undistributed
Long-Term
Capital
Gains | | Accumulated
Earnings | | Accumulated
Capital and
Other Losses | | Unrealized
Appreciation
(Depreciation)* | | Total
Accumulated
Earnings
(Deficit) | |
| $ | 2,209,103 | | | $ | — | | | $ | 2,209,103 | | | $ | (3,651,790 | ) | | $ | (1,994,075 | ) | | $ | (3,436,762 | ) | |
*The difference between the book-basis and tax-basis unrealized appreciation (depreciation) is attributable primarily to tax deferral of losses on wash sales.
As of the tax year ended December 31, 2018, the Fund has short term and long term capital loss carryforwards of $1,034,189 and $2,617,601 respectively that are not subject to expiration.
During the tax year ended December 31, 2018, the Fund utilized $349,395 of capital loss carryforwards.
As of December 31, 2018, the cost basis for federal income tax purposes, gross unrealized appreciation, gross unrealized depreciation and net unrealized appreciation (depreciation) for investments were as follows:
Cost of
Investments
for Federal
Tax Purposes | | Gross
Unrealized
Appreciation | | Gross
Unrealized
Depreciation | | Net
Unrealized
Appreciation
(Depreciation) | |
| $ | 36,179,992 | | | $ | 957,862 | | | $ | (2,951,937 | ) | | $ | (1,994,075 | ) | |
8. Capital Contribution from Prior Custodian:
During 2016, the Fund received notification from the Fund's prior custodian, State Street Bank and Trust ("State Street"), concerning issues related to billing on certain categories of expenses during the approximately 16-year period from 1998 through October 31, 2014. The over-billing primarily related to categories of expenses that involved an allocation of general costs among multiple clients.
State Street paid the refunded amounts during January 2017. Based on billing information received during 2016 from State Street and an analysis of any expense limitation agreements that were in place during the period of the activities in question, including the application of any recoupment provisions in such agreements, the Adviser received a portion of the refund.
The portion of the refund retained by the Fund was accounted for as a capital contribution and is reflected on the Financial Highlights as "Capital Contribution from Prior Custodian, Net".
9. Fund Ownership:
Ownership of more than 25% of the voting securities of a fund creates presumptions of control of the fund, under section 2(a)(9) of the 1940 Act. As of December 31, 2018, the shareholders listed below held more than 25% of the shares outstanding of the Fund and may be deemed to control the Fund.
| Shareholder | | Percent | |
| GIAC | | | 100.0 | % | |
10. Recent Accounting Pronouncements:
In October 2016, the SEC released its Final Rules on Investment Company Reporting Modernization (the "Rules"). The Rules introduced two new regulatory reporting forms for investment companies, Form N-PORT and Form N-CEN. The Fund's compliance date for Form N-PORT was June 1, 2018, and the Fund will make its initial filing with the SEC on Form N-PORT for the period ending March 31, 2019. Effective with the period ended June 30, 2018, the Fund was required to maintain, and make available to the SEC upon request, the information required to be included in Form N-PORT. Form N-PORT will replace Form N-Q filings effective with the requirement to file the Form N-PORT with the SEC for the period ending March 31, 2019. The Fund's compliance date for Form N-CEN was June 1, 2018, and the Fund will make its initial filing on Form N-CEN for the period ended December 31,
22
Victory Variable Insurance Funds | | Notes to Financial Statements — continued
December 31, 2018 | |
2018. Form N-CEN will replace Form N-SAR filings. The Fund's adoption of these amendments have no effect on the Fund's net assets or results of operations.
In March 2017, the Financial Accounting Standards Board ("FASB") issued Accounting Standards Update ("ASU") No. 2017-08 "Premium Amortization on Purchased Callable Debt Securities" ("ASU 2017-08"), which shortens the premium amortization period for purchased non-contingently callable debt securities. ASU 2017-08 specifies that the premium amortization period ends at the earliest call date, for purchased non-contingently callable debt securities. ASU 2017-08 is effective for fiscal years, and interim periods within those fiscal years, beginning after December 15, 2018. Management does not believe that adoption of ASU 2017-08 will materially impact the Fund's financial statements.
In August 2018, the FASB issued ASU No. 2018-13, "Fair Value Measurements" ("ASU 2018-13"). This update makes certain removals from, changes to and additions to existing disclosure requirements for fair value measurements. ASU 2018-13 does not change fair value measurements already required or permitted by existing standards. ASU 2018-13 is effective for financial statements issued for fiscal years beginning after December 15, 2019, and interim periods within those fiscal years. As permitted, the Fund has early adopted ASU 2018-13 with the financial statements prepared as of December 31, 2018.
In August 2018, the SEC adopted amendments to certain financial statement disclosure requirements to conform them to GAAP for investment companies. These amendments made certain disclosure requirements effective under Regulation S-X. The Fund's adoption of these amendments, effective with the financial statements prepared as of December 31, 2018 had no effect on the Fund's net assets or results of operations. As a result of adopting these amendments, the distributions to shareholders in the December 31, 2017 Statements of Changes in Net Assets presented herein have been reclassified to conform to the current year presentation, which includes all distributions to each class of shareholders, other than tax basis return of capital distributions, in one line item per share class. Distributions to shareholders for the year ended December 31, 2017 from net investment income and net realized gains in the Fund were as follows:
Distributions to Shareholders:
From net investment income: | | $ | (2,204,964 | ) | |
From net Realized Gains: | | | — | | |
11. Subsequent Events:
The Fund has evaluated the need for additional disclosures or adjustments resulting from subsequent events through the date these financial statements were issued. Based on this evaluation, there were no subsequent events to report that would have a material impact on the Fund's financial statements.
23
REPORT OF INDEPENDENT REGISTERED PUBLIC ACCOUNTING FIRM
To the Shareholders and the Board of Trustees of Victory High Yield VIP Series
Opinion on the Financial Statements
We have audited the accompanying statement of assets and liabilities of Victory High Yield VIP Series (the "Fund") (one of the funds constituting the Victory Variable Insurance Funds (the "Trust")), including the portfolio of investments, as of December 31, 2018, and the related statement of operations for the year then ended, the statements of changes in net assets for each of the two years in the period then ended, the financial highlights for each of the three years in the period then ended and the related notes (collectively referred to as the "financial statements"). In our opinion, the financial statements present fairly, in all material respects, the financial position of the Fund (one of the funds constituting the Trust) at December 31, 2018, and the results of its operations for the year then ended, the changes in its net assets for each of the two years in the period then ended and its financial highlights for each of the three years in the period then ended, in conformity with U.S. generally accepted accounting principles.
The financial highlights of the Fund for each of the periods presented through December 31, 2015 were audited by other auditors, whose report dated February 22, 2016 expressed an unqualified opinion on those financial highlights.
Basis for Opinion
These financial statements are the responsibility of the Trust's management. Our responsibility is to express an opinion on the Fund's financial statements based on our audits. We are a public accounting firm registered with the Public Company Accounting Oversight Board (United States) (PCAOB) and are required to be independent with respect to the Trust in accordance with the U.S. federal securities laws and the applicable rules and regulations of the Securities and Exchange Commission and the PCAOB.
We conducted our audits in accordance with the standards of the PCAOB. Those standards require that we plan and perform the audit to obtain reasonable assurance about whether the financial statements are free of material misstatement, whether due to error or fraud. The Trust is not required to have, nor were we engaged to perform, an audit of the Trust's internal control over financial reporting. As part of our audit we are required to obtain an understanding of internal control over financial reporting but not for the purpose of expressing an opinion on the effectiveness of the Trust's internal control over financial reporting. Accordingly, we express no such opinion.
Our audits included performing procedures to assess the risks of material misstatement of the financial statements, whether due to error or fraud, and performing procedures that respond to those risks. Such procedures included examining, on a test basis, evidence regarding the amounts and disclosures in the financial statements. Our procedures included confirmation of securities owned as of December 31, 2018, by correspondence with the custodian, transfer agent, and brokers or by other appropriate auditing procedures where replies from brokers were not received. Our audits also included evaluating the accounting principles used and significant estimates made by management, as well as evaluating the overall presentation of the financial statements. We believe that our audits provide a reasonable basis for our opinion.

We have served as the auditor of one or more Victory Capital's investment companies since 1995.
Cincinnati, Ohio
February 15, 2019
24
Victory Variable Insurance Funds | | Supplemental Information
December 31, 2018 | |
(Unaudited)
Trustee and Officer Information
Board of Trustees:
Overall responsibility for management of the Trust rests with the Board. The Trust is managed by the Board in accordance with the laws of the State of Delaware. There are currently ten Trustees, nine of whom are not "interested persons" of the Trust within the meaning of that term under the 1940 Act ("Independent Trustees") and one of whom is an "interested person" of the Trust within the meaning of that term under the 1940 Act ("Interested Trustee"). The Trustees, in turn, elect the officers of the Trust to actively supervise its day-to-day operations.
The following tables list the Trustees, their ages, position with the Trust, commencement of service, principal occupations during the past five years and any directorships of other investment companies or companies whose securities are registered under the Securities Exchange Act of 1934, as amended, or who file reports under that Act. Each Trustee oversees nine portfolios in the Trust, one portfolio in Victory Institutional Funds, 42 portfolios in Victory Portfolios and 20 portfolios in Victory Portfolios II, each a registered investment company that, together with the Trust, comprise the Victory Funds Complex. Each Trustee's address is c/o Victory Variable Insurance Funds, 4900 Tiedeman Road, 4th Floor, Brooklyn, Ohio 44144. Each Trustee has an indefinite term.
Name and Age | | Position
Held with
the Trust | | Date
Commenced
Service | | Principal Occupation
During Past 5 Years | | Other
Directorships
Held During
Past 5 Years | |
Independent Trustees. | |
David Brooks Adcock, 67 | | Trustee | | February 2005 | | Consultant (since 2006). | | Chair and Trustee, Turner Funds (December 2016-December 2017). | |
Nigel D.T. Andrews, 71 | | Vice Chair and Trustee | | August 2002 | | Retired. | | Director, TCG BDC II, Inc. (since 2017); Director, TCG BDC I, Inc. (formerly Carlyle GMS Finance, Inc.) (since 2012); Director, Old Mutual US Asset Management (2002-2014). | |
E. Lee Beard, 67* | | Trustee | | February 2005 | | Retired (since 2015); Consultant, The Henlee Group, LLC (consulting) (2005-2015). | | None. | |
Dennis M. Bushe, 75 | | Trustee | | July 2016 | | Retired. | | Trustee, RS Investment Trust and RS Variable Products Trust (November 2011-July 2016). | |
25
Victory Variable Insurance Funds | | Supplemental Information — continued
December 31, 2018 | |
(Unaudited)
Name and Age | | Position
Held with
the Trust | | Date
Commenced
Service | | Principal Occupation
During Past 5 Years | | Other
Directorships
Held During
Past 5 Years | |
Sally M. Dungan, 64 | | Trustee | | February 2011 | | Chief Investment Officer, Tufts University (since 2002). | | None. | |
John L. Kelly, 65 | | Trustee | | February 2015 | | Partner, McCarvill Capital Partners (September 2016-September 2017); Advisor(January 2016-April 2016) and Managing Partner (August 2014- January 2016), Endgate Commodities LLC; Chief Operating Officer, Liquidnet Holdings, Inc. (2011-2014). | | Director, Caledonia Mining Corporation (since May 2012). | |
David L. Meyer, 61* | | Trustee | | December 2008 | | Retired. | | None. | |
Gloria S. Nelund, 57 | | Trustee | | July 2016 | | Chair, CEO and Co-Founder of TriLinc Global, LLC, an investment firm. | | TriLinc Global Impact Fund, LLC (since 2012); Trustee, RS Investment Trust and RS Variable Products Trust (November 2007-July 2016). | |
Leigh A. Wilson, 74 | | Chair and Trustee | | February 1998 | | Private Investor. | | Chair (since 2013), Caledonia Mining Corporation. | |
Interested Trustee. | |
David C. Brown, 46** | | Trustee | | May 2008 | | Chairman and Chief Executive Officer (since 2013), Co-Chief Executive Officer (2011- 2013), the Adviser; Chairman and Chief Executive Officer, Victory Capital Holdings, Inc. (since 2013). | | None. | |
* The Board has designated Mr. Meyer and Ms. Beard as its Audit Committee Financial Experts.
** Mr. Brown is an "Interested Person" by reason of his relationship with the Adviser.
The Statement of Additional Information includes additional information about the Trustees of the Trust and is available, without charge, by calling 800-539-3863.
26
Victory Variable Insurance Funds | | Supplemental Information — continued
December 31, 2018 | |
(Unaudited)
Officers:
The officers of the Trust, their ages, commencement of service and their principal occupations during the past five years, are detailed in the following table. Each officer serves until the earlier of his or her resignation, removal, retirement, death, or the election of a successor. The mailing address of each officer of the Trust is 4900 Tiedeman Road, 4th Floor, Brooklyn, Ohio 44144. The officers of the Trust receive no compensation directly from the Trust for performing the duties of their offices.
Name and Age | | Position with
the Trust | | Date
Commenced
Service | | Principal Occupation During Past 5 Years | |
Christopher K. Dyer, 57 | | President | | February 2006* | | Director of Mutual Fund Administration, the Adviser. | |
Scott A. Stahorsky, 49 | | Vice President | | December 2014 | | Manager, Fund Administration, the Adviser (since 2015); Senior Analyst, Fund Administration, the Adviser (prior to 2015). | |
Erin G. Wagner, 45 | | Secretary | | December 2014 | | Associate General Counsel, the Adviser (since 2013). | |
Allan Shaer, 53 | | Treasurer | | May 2017 | | Senior Vice President, Financial Administration, Citi Fund Services Ohio, Inc. (since 2016); Vice President, Mutual Fund Administration, JP Morgan Chase (2011-2016). | |
Christopher A. Ponte, 34 | | Assistant Treasurer | | December 2017 | | Manager, Fund Administration, the Adviser (since 2017); Senior Analyst, Fund Administration, the Adviser (prior to 2017); Chief Financial Officer, Victory Capital Advisers, Inc. (since 2018). | |
Colin Kinney, 45 | | Chief Compliance Officer | | July 2017 | | Chief Compliance Officer (since 2013) and Chief Risk Officer (2009-2017), the Adviser. | |
Chuck Booth, 58 | | Anti-Money Laundering Compliance Officer and Identity Theft Officer | | May 2015 | | Director, Regulatory Administration and CCO Support Services, Citi Fund Services Ohio, Inc. | |
Jay G. Baris, 65 | | Assistant Secretary | | February 1998 | | Partner, Shearman & Sterling LLP (since 2018); Partner, Morrison & Foerster LLP (2011-2017). | |
* On December 3, 2014, Mr. Dyer resigned as Secretary of the Trust and accepted the position of President.
27
Victory Variable Insurance Funds | | Supplemental Information — continued
December 31, 2018 | |
(Unaudited)
Proxy Voting and Form N-Q Information
Proxy Voting:
Information regarding the policies and procedures that the Fund uses to determine how to vote proxies relating to portfolio securities is available without charge, upon request, by calling 800-539-3863. The information is also included in the Fund's Statement of Additional Information, which is available on the SEC's website at www.sec.gov.
Information relating to how the Fund voted proxies relating to portfolio securities held during the most recent twelve months ended June 30 is available on the SEC's website at www.sec.gov.
Availability of Schedules of Portfolio Investments:
The Trust expects to file a complete list of Schedules of Portfolio Investments with the SEC for the first and third quarter of each fiscal year on Form N-PORT beginning March 1, 2019. Prior to that date, the Trust has filed a complete list of Schedules of Portfolio Investments with the SEC for the first and third quarters of each fiscal year on Form N-Q. Forms N-PORT and Forms N-Q are available on the SEC's website at www.sec.gov.
Expense Examples
As a shareholder of the Fund, you may incur two types of costs: (1) transaction costs and (2) ongoing costs, including management fees, distribution and service (12b-1) fees, and other Fund expenses. These examples are intended to help you understand your ongoing costs (in dollars) of investing in the Fund and to compare these costs with the ongoing costs of investing in other mutual funds.
These examples are based on an investment of $1,000 invested at the beginning of the period and held for the entire period from July 1, 2018 through December 31, 2018.
The Actual Expense figures in the table below provide information about actual account values and actual expenses. You may use the information below, together with the amount you invested, to estimate the expenses that you paid over the period. Simply divide your account value by $1,000 (for example, an $8,600 account value divided by $1,000 = 8.6), then multiply the result by the number in the table under the heading entitled "Actual Expenses Paid During Period" to estimate the expenses you paid on your account during this period.
The Hypothetical Expense figures in the table below provide information about hypothetical account values and hypothetical expenses based on the Fund's actual expense ratio and an assumed rate of return of 5% per year before expenses, which is not the Fund's actual return. The hypothetical account values and expenses may not be used to estimate the actual ending account balance or expenses you paid for the period. You may use this information to compare this 5% hypothetical example with the 5% hypothetical examples that appear in shareholder reports of other funds.
Please note the expenses shown in the table are meant to highlight your ongoing costs only and do not reflect any transactional costs. Therefore, the table is useful in comparing ongoing costs only, and will not help you determine the relative total costs of owning different funds. In addition, if these transactional costs were included, your costs would have been higher.
Beginning
Account Value
7/1/18 | | Actual
Ending
Account Value
12/31/18 | | Hypothetical
Ending
Account Value
12/31/18 | | Actual
Expenses
Paid During
Period
7/1/18-12/31/18* | | Hypothetical
Expenses
Paid During
Period
7/1/18-12/31/18* | | Annualized
Expense Ratio
During Period
7/1/18-12/31/18 | |
$ | 1,000.00 | | | $ | 987.10 | | | $ | 1,020.92 | | | $ | 4.26 | | | $ | 4.33 | | | | 0.85 | % | |
* Expenses are equal to the average account value multiplied by the Fund's annualized expense ratio multiplied by 184/365 (the number of days in the most recent fiscal half-year divided by the number of days in the fiscal year).
28
Victory Variable Insurance Funds | | Supplemental Information — continued
December 31, 2018 | |
(Unaudited)
Additional Federal Income Tax Information
For the year ended December 31, 2018, the Fund paid qualified dividend income for purposes of reduced individual federal income tax rates of 1%.
Dividends qualifying for corporate dividends received a deduction of 1%.
29
Victory Variable Insurance Funds | | Supplemental Information — continued
December 31, 2018 | |
(Unaudited)
Considerations of the Board in Continuing the Investment Advisory Agreement (the "Agreement")
The Board approved the Agreement on behalf of the Series at a meeting, which was called for that purpose, on December 5, 2018. The Board also considered information relating to the Series and the Agreement provided throughout the year and, more specifically, at a meeting on October 23, 2018. The Board noted that prior to the Series' reorganization on July 29, 2016, the Series was managed by RS Investment Management Co. LLC, which was acquired by the Adviser on July 29, 2016. In considering whether to approve the Agreement, the Board requested, and the Adviser provided, information that the Board believed to be reasonably necessary to reach its conclusions. The Board, including the Independent Trustees, evaluated this information along with other information obtained throughout the year and was advised by legal counsel to the Series and by independent legal counsel to the Independent Trustees. In addition, in 2017 the Independent Trustees, through their counsel, retained an independent consultant to assist with a review of the overall process for conducting the annual review of these advisory arrangements. The Board considered the Series' advisory fee, expense ratio and investment performance as significant factors in determining whether the Agreement should be continued. In considering whether the compensation paid to the Adviser was fair and reasonable, the Board also evaluated, among other things, the following factors:
• The requirements of the Series for the services provided by the Adviser;
• The nature, quality and extent of the services provided and expected to be provided;
• The performance of the Series as compared to comparable funds;
• The fees payable for the services and whether the fee arrangements provided for economies of scale that would benefit Series shareholders as the Series grows;
• Whether the fee would be sufficient to enable the Adviser to attract and retain experienced personnel and continue to provide quality services to the Series;
• Fees paid by other clients of the Adviser whose accounts are managed in a similar investment style and any differences in the services provided to the other clients compared to those provided to the Series;
• Total expenses of the Series, taking into consideration any distribution or shareholder servicing fees;
• Management's commitment to operating the Series at competitive expense levels;
• The profitability of the Adviser (as reflected by comparing fees earned against an estimate of the Adviser's costs) with respect to the Adviser's relationship with the Series;
• Research and other service benefits received by the Adviser obtained through payment of client commissions for securities transactions;
• Other benefits received by the Adviser, and its affiliates, including revenues paid to the Adviser, or its affiliates, by the Series for administration and fund accounting services, and distribution;
• The capabilities and financial condition of the Adviser;
• Current economic and industry trends; and
• The historical relationship between the Series and the Adviser.
The Board reviewed the Series' current management fee, comprised of the advisory fee plus the administrative services fee paid to the Adviser, in the context of the Adviser's profitability of the Series. In addition, the Board compared the Series' total operating expense ratio on a net and gross basis, taking into consideration any distribution or shareholder servicing fees and management fees with a universe of comparable mutual funds compiled by an independent consultant, FUSE Research Network, LLC ("FUSE"), and a peer group of funds with similar investment strategies selected by FUSE from the universe. The Board reviewed the factors and methodology used by FUSE in the selection of the Series' peer group, including FUSE's selection of a broad universe of funds using the standard Retail Morningstar Categories, the more specific universe of comparable funds, and peer groups of funds with comparable investment strategies and asset levels, among other factors. The Board also reviewed any changes to FUSE's methodology as compared to the prior year, including as a result of input from the Adviser, if any. The Board also reviewed fees and other information related to the Adviser's management of similarly managed institutional or private accounts, and the differences in the services provided to the other accounts, to the extent applicable. The Board noted that the advisory fee arrangements for the Series do not include breakpoints, which are generally viewed as a method by which the investment
30
Victory Variable Insurance Funds | | Supplemental Information — continued
December 31, 2018 | |
(Unaudited)
adviser shares any economies of scale with a fund as a fund grows. The Board also considered the Adviser's commitment to limit expenses as discussed in more detail below.
The Board reviewed the Series' performance over one-, three-, five- and ten-year periods against the performance of the Series' selected peer group and benchmark index. The Board recognized that the performance of the Series and the peer group funds are net of expenses, while the performance of the benchmark index is gross returns. The Board considered the additional resources that the Adviser has committed to enhance portfolio analysis, compliance and trading systems. The Board noted that, following the Series' reorganization, the Series is managed by substantially the same investment management team that managed the comparable predecessor fund.
The Board considered the relative roles and responsibilities of the Adviser and the Series' sub-adviser and noted that, among other things: (1) the sub-advisory fees for the Series would be paid by the Adviser and, therefore, would not be a direct expense of the Series; and (2) the Adviser would supervise the sub-adviser.
The Board reviewed various other specific factors with respect to the Series, as described below. In their deliberations, the Trustees did not rank the importance of any particular information or factor considered and each Trustee may have attributed different weights to various factors.
The Board concluded that the Series' gross annual management fee was reasonable as compared to the median gross management fee charged to the funds in the Series' peer group. The Board noted that the Series' net annual expense ratio, taking into account any shareholder servicing or distribution fees, was reasonable as compared to the median expense ratio for the peer group. The Board considered the Adviser's contractual agreement to waive its fees and reimburse expenses for a specified period of time, as described in the Series' prospectus. The Board then compared the Series' performance for the one-, three-, five- and ten-year periods ended June 30, 2018, to that of the median performance of the peer group and benchmark index and considered the fact that the Series outperformed the benchmark index for the one- and three- year periods, underperformed the benchmark for the index five- and ten-year periods, and outperformed the peer group for all of the periods reviewed.
Having considered, among other things: (1) that the Series' management fee was within the ranges of advisory fees charged to comparable mutual funds; (2) that the Series' total expense ratio was reasonable; (3) the Adviser's willingness to limit the expenses for a period of time would provide stability to the Series' expenses during that period; and (4) the performance of the Series, the Board concluded that the Agreement continued to be in the best interests of the Series' shareholders.
Conclusion
Based on its review of the information requested and provided, and following extended discussions, the Board determined that the Agreement, on behalf of the Series, was consistent with the best interests of the Series and its shareholders, and the Board unanimously approved the Agreement, on behalf of the Series, for an additional annual period on the basis of the foregoing review and discussions and the following considerations, among others:
• The fairness and reasonableness of the investment advisory fee payable to the Adviser under the Agreement in light of the investment advisory services provided, the costs of these services, the profitability of the Adviser's relationship with the Series and the comparability of the fee paid to the fees paid by other investment companies;
• The nature, quality and extent of the investment advisory services provided by the Adviser;
• The Adviser's entrepreneurial commitment to the management of the Series and the creation of a broad-based family of funds, which could entail a substantial commitment of the Adviser's resources to the successful operation of the Series;
• The Adviser's representations regarding its staffing and capabilities to manage the Series, including the retention of personnel with relevant portfolio management experience;
• The Adviser's efforts to enhance investment results by, among other things, developing quality portfolio management teams; and
• The overall high quality of the personnel, operations, financial condition, investment management capabilities, methodologies and performance of the Adviser.
31
Victory Variable Insurance Funds | | Supplemental Information — continued
December 31, 2018 | |
(Unaudited)
Considerations of the Board in Continuing the Park Avenue Investment Sub-Advisory Agreement
The Board approved the investment sub-advisory agreement between the Adviser and Park Avenue Institutional Advisers LLC (the "Sub-Adviser") (the "Sub-Advisory Agreement") on behalf of the Series at a meeting, which was called for that purpose, on December 5, 2018. The Board also considered information relating to the Series and the Sub-Advisory Agreement provided throughout the year and, more specifically, at a meeting on October 23, 2018. The Board noted that prior to the Series' reorganization on July 29, 2016, the Series was managed by RS Investment Management Co. LLC, which was acquired by the Adviser on July 29, 2016, and sub-advised by the Sub-Adviser. In considering whether to approve the Sub-Advisory Agreement, the Board requested, and the Sub-Adviser provided, information that the Board believed to be reasonably necessary to reach its conclusions. The Board, including the Independent Trustees, evaluated this information along with other information obtained throughout the year and was advised by legal counsel to the Series and by independent legal counsel to the Independent Trustees. In addition, in 2017 the Independent Trustees, through their counsel, retained an independent consultant to assist with a review of the overall process for conducting the annual review of these advisory arrangements. The Board reviewed numerous factors with respect to the Series including the Sub-Adviser's history as sub-adviser for each predecessor fund and the services to be provided by the Sub-Adviser as the sub-adviser.
In considering whether the compensation paid to the Sub-Adviser was fair and reasonable, the Board also evaluated, among other things, the following factors:
• The requirements of the Series for the services provided by the Sub-Adviser;
• The nature, quality and extent of the services provided and expected to be provided;
• The fees payable for the services and whether the fee arrangements provided for economies of scale that could benefit Series shareholders as the Series grows;
• Representations by the Adviser that the sub-advisory fee for the Series is within the range of fees agreed to in the market for similar services;
• Whether the fee would be sufficient to enable the Sub-Adviser to attract and retain experienced personnel and continue to provide quality services to the Series;
• Management's commitment to operating the Series at competitive expense levels;
• Research and other service benefits received by the Sub-Adviser obtained through payment of client commissions for securities transactions;
• Other benefits received by the Sub-Adviser as a result of its sub-advisory relationship with the Series;
• The capabilities and financial condition of the Sub-Adviser;
• The nature, quality and extent of the oversight and compliance services provided by the Adviser;
• The historical relationship between the Series and the Sub-Adviser; and
• Current economic and industry trends.
The Board considered the Adviser's contractual agreement to waive its fees and reimburse expenses, excluding certain specified costs, so that the total annual operating expenses of the Series will not exceed the total net annual operating expenses of the comparable predecessor fund. The Board recognized that because the sub-advisory fees are paid by the Adviser, any arrangement by the Sub-Adviser to reduce its fee as the Series grow would have no direct impact on the Series or its shareholders. The Board considered the relative roles and responsibilities of the Adviser and the Sub-Adviser and the Adviser's representation that the fees to be paid to the Sub-Adviser are within the range of sub-advisory fees paid to other sub-advisers for similar services.
The Board considered the Series' total operating expense ratio on a net and gross basis as compared with a universe of comparable mutual funds compiled by an independent consultant, FUSE Research Network, LLC ("FUSE"), and a peer group of funds with similar investment strategies selected by FUSE from the universe. The Board reviewed the factors and methodology used by FUSE in the selection of the Series' peer group, including FUSE's selection of a broad universe of funds using the standard Retail Morningstar Categories, the more specific universe of comparable funds, and peer groups of funds with comparable investment strategies, assets or diversification, among other things. The Board also reviewed any changes to FUSE's methodology, including as a result of input from the Adviser, if any.
32
Victory Variable Insurance Funds | | Supplemental Information — continued
December 31, 2018 | |
(Unaudited)
The Board reviewed the Series' performance over one-, three-, five- and ten-year periods against the performance of the Series' selected peer group and benchmark index. The Board recognized that the Series' performance and the performance of the peer group funds are net of expenses, while the performance of the benchmark index is gross returns. The Board noted that, following the Series' reorganization, the Series is managed by substantially the same investment management team that managed the comparable predecessor fund.
The Board reviewed various other specific factors with respect to the Series. In their deliberations, the Trustees did not rank the importance of any particular information or factor considered and each Trustee may have attributed different weights to various factors.
The Board noted that the Series' gross annual management fee was reasonable as compared to the median gross management fee charged to the funds in the Fund's peer group. The Board concluded that the Series' net annual expense ratio was reasonable as compared to the median expense ratio for the peer group. The Board then compared the Series' performance for the one-, three-, five- and ten-year periods ended June 30, 2018, to that of the median performance of the peer group and benchmark index for the same periods and considered the fact that the Series outperformed the benchmark index for the one- and three-year periods and underperformed the benchmark index for the five- and ten-year periods and outperformed the peer group for all of the periods reviewed.
Based on its review of the information requested and provided, and following extended discussions, the Board concluded, among other things, that the Sub-Advisory Agreement, with respect to Series, was consistent with the best interests of the Series and its shareholders and unanimously approved the Sub-Advisory Agreement (including the fees to be charged for services thereunder), on the basis of the foregoing review and discussions and the following considerations, among others:
• The fairness and reasonableness of the investment advisory fee payable to the Sub-Adviser under the Sub-Advisory Agreement in light of the investment advisory services provided, the costs of these services and the estimated profitability of the Sub-Adviser's relationship with the Series;
• The nature, quality and extent of the investment advisory services provided by the portfolio management team of the Sub-Adviser which have resulted in each Fund achieving its stated investment objective;
• The Sub-Adviser's representations regarding its staffing and capabilities to manage the Series; and
• The overall high quality of the personnel, operations, financial condition, investment management capabilities, methodologies and performance of the Sub-Adviser.
33
Privacy Policy
Protecting the Privacy of Information
The Trust respects your right to privacy. We also know that you expect us to conduct and process your business in an accurate and efficient manner. To do so, we must collect and maintain certain personal information about you. This is the information we collect from you on applications or other forms, and from the transactions you make with us or third parties. It may include your name, address, social security number, account transactions and balances, and information about investment goals and risk tolerance.
We do not disclose any information about you or about former customers to anyone except as permitted or required by law. Specifically, we may disclose the information we collect to companies that perform services on our behalf, such as the transfer agent that processes shareholder accounts and printers and mailers that assist us in the distribution of investor materials. We may also disclose this information to companies that perform marketing services on our behalf. This allows us to continue to offer you Victory investment products and services that meet your investing needs, and to effect transactions that you request or authorize. These companies will use this information only in connection with the services for which we hired them. They are not permitted to use or share this information for any other purpose.
To protect your personal information internally, we permit access only by authorized employees and maintain physical, electronic and procedural safeguards to guard your personal information.*
* You may have received communications regarding information about privacy policies from other financial institutions which gave you the opportunity to "opt-out" of certain information sharing with companies which are not affiliated with that financial institution. The Trust does not share information with other companies for purposes of marketing solicitations for products other than the Trust. Therefore, the Trust does not provide opt-out options to their shareholders.
Victory Funds
P.O. Box 182593
Columbus, Ohio 43218-2593

Visit our website at: | | Call Victory at: | |
www.vcm.com | | 800-539-FUND (800-539-3863) | |

December 31, 2018
Annual Report
Victory Variable Insurance Funds
Victory INCORE Low Duration Bond VIP Series
Beginning on January 1, 2021, as permitted by regulations adopted by the Securities and Exchange Commission, paper copies of the Victory Funds' shareholder reports will no longer be sent by mail, unless you specifically request paper copies of the reports from the Victory Funds or from your financial intermediary, such as a broker-dealer or bank. Instead, the reports will be made available on www.VictoryFunds.com, and you will be notified by mail each time a report is posted and provided with a website link to access the report. If you already elected to receive shareholder reports electronically, you will not be affected by this change, and you need not take any action.
You may elect to receive shareholder reports and other communications from the Victory Funds or your financial intermediary electronically sooner than January 1, 2021 by notifying your financial intermediary directly or, if you are a direct investor, by calling 800-539-3863 or by sending an e-mail request to TA.Processing@FISGlobal.com.
You may elect to receive all future reports in paper free of charge. If you invest through a financial intermediary, you can contact your financial intermediary to request that you continue to receive paper copies of your reports. If you invest directly with the Victory Funds, you can call 800-539-3863 or send an e-mail request to TA.Processing@FISGlobal.com. Your election to receive reports in paper will apply to all Victory Funds you hold directly or through your financial intermediary.
www.vcm.com
News, Information And Education 24 Hours A Day, 7 Days A Week
The Victory Funds site gives fund shareholders, prospective shareholders, and investment professionals a convenient way to access fund information, get guidance, and track fund performance anywhere they can access the Internet. The site includes:
• Detailed performance records
• Daily share prices
• The latest fund news
• Investment resources to help you become a better investor
• A section dedicated to investment professionals
Whether you're a potential investor searching for the fund that matches your investment philosophy, a seasoned investor interested in planning tools, or an investment professional, www.vcm.com has what you seek. Visit us anytime. We're always open.
Victory Variable Insurance Funds
Table of Contents
Shareholder Letter (Unaudited) | | | 3 | | |
Fund Review and Commentary (Unaudited) | | | 4 | | |
Financial Statements | |
Schedule of Portfolio Investments | | | 7 | | |
Statement of Assets and Liabilities | | | 15 | | |
Statement of Operations | | | 16 | | |
Statements of Changes in Net Assets | | | 17 | | |
Financial Highlights | | | 18 | | |
Notes to Financial Statements | | | 19 | | |
Report of Ernst & Young LLP, Independent
Registered Public Accounting Firm | | | 31 | | |
Supplemental Information (Unaudited) | |
Trustee and Officer Information | | | 32 | | |
Proxy Voting and Form N-Q Information | | | 35 | | |
Expense Examples | | | 35 | | |
Advisory Contract Renewal | | | 36 | | |
Privacy Policy (inside back cover) | |
The Fund is distributed by Victory Capital Advisers, Inc. Victory Capital Management Inc. is the investment adviser to the Fund and receives fees from the Fund for performing services for the Fund.
This report is not authorized for distribution to prospective investors unless preceded or accompanied by a current prospectus of the Fund.
For additional information about any Victory Fund, including fees, expenses, and risks, view our prospectus online at www.vcm.com or call 800-539-3863. Read it carefully before you invest or send money.
The information in this annual report is based on data obtained from recognized services and sources and is believed to be reliable. Any opinions, projections, or recommendations in this report are subject to change without notice and are not intended as individual investment advice. Past investment performance of the Fund, markets or securities mentioned herein should not be considered to be indicative of future results.
• NOT FDIC INSURED • NO BANK GUARANTEE
• MAY LOSE VALUE

Call Victory at:
800-539-FUND (800-539-3863)
Visit our website at:
www.vcm.com
1
This page is intentionally left blank.
2
Victory Funds Letter to Shareholders
Dear Shareholder,
What a difference a year makes. The year ended December 31, 2018, was marked by an abrupt return of volatility, which had largely been missing in action for years. Consider the range of highs and lows we witnessed. For the S&P 500 Index, it was a year in which we celebrated an all-time high in late summer, only to be followed by the worst December since the 2008 financial crisis. And if that wasn't enough volatility, the Dow Jones Industrial Average also registered several of its worst-ever, single-day point declines during 2018.
Through all that the S&P 500 clocked in with its first negative annual return since 2008, falling by 4.4 percent. Given the risk-off sentiment that was obvious as the year drew to a close, it's no surprise that small-cap stocks, as measured by the Russell 2000 Index, fared even worse, falling approximately 11.0 percent for the year. The challenges for equity investors were also evident around the world as the MSCI ACWI and Emerging Markets indexes declined 8.9 and 14.3 percent, respectively.
So what ushered in the renewed era of volatility and these challenging times? There were multiple culprits. For starters, trade tensions ratcheted up throughout the year as anti-global rhetoric bloomed into a series of new tariffs, which sparked concerns of a prolonged trade war with China. The Federal Reserve remained persistent in its monetary tightening, raising the benchmark interest rate four times throughout the year to a range of 2.25 to 2.5 percent. And then the year ended with a partial shutdown of the federal government. These factors conspired to elevate concerns of a possible recession here and abroad.
Yet despite the headline risks, we think it's critically important to remain focused on the data. By all accounts, the U.S. economy continued chugging along in 2018 with a real gross domestic product (GDP) rising 3.4 percent in the third quarter of 2018, the latest figures available from the Bureau of Economic Analysis. Moreover, the labor picture continues to shine with consistent monthly job growth and an unemployment rate of 3.9 percent. All this comes against a backdrop of low inflation and solid corporate earnings.
The markets, it appears, have been vacillating between the dire headlines and higher perceived risks on one hand, and the continued positive economic data on the other. Of course, no one knows where the Fed will stop raising rates, nor is there any certainty on how the trade turmoil ultimately gets resolved. For now, however, we continue to embrace our solid economic fundamentals. Moreover, we believe all of Victory Capital's independent investment franchises are well positioned to take advantage of any short-term valuation dislocations resulting from the current era of heightened volatility.
On the following pages, you will find information relating to your Victory Funds investment. If you have any questions, we encourage you to contact your financial advisor. Or, if you invest with us directly, you may call (800) 539-3863, or visit our website at www.vcm.com.
My colleagues and I sincerely appreciate the confidence you have placed in the Victory Funds, and we value the opportunity to help meet your investment goals.

Christopher K. Dyer, CFA
President,
Victory Funds
3
Victory INCORE Low Duration Bond VIP Series
Victory Variable Insurance Funds

Commentary
Market Summary and Fund Attribution
The Victory INCORE Low Duration Bond VIP Series ("Fund") seeks to provide a high level of current income consistent with preservation of capital. The Fund underperformed the Bloomberg Barclays U.S. Government (1-3 Year) Bond Index ("Index") for the year ending December 31, 2018, 1.01% versus 1.58%. Sector allocation was the largest detractor from relative performance as the spread widening in corporate bonds negatively impacted the overweight allocations to both investment grade and high yield credit. This was most pronounced in the industrial sector. Allocations to agency mortgages and asset-backed securities were positive contributors to performance, but not enough to offset the credit underperformance. Additionally, both duration and yield curve positioning were additive to relative performance.
Coming into 2018, many expected negative absolute returns in fixed income given the likelihood of higher interest rates resulting from continued monetary policy tightening. This rang true for most of the year, but as volatility spiked in the fourth quarter and bond investors pushed back forcefully against the Fed's forecast by driving yields lower, many fixed income indices posted positive returns for the year. The Bloomberg Barclays US Aggregate Index generated a total return of 0.01% for 2018 after having been down 2.38% through October. Interest rates did continue to rise, but when the books closed on 2018, short term rates were up two to three times those of intermediate and long-term maturities flattening the yield curve further. The spread between 2-year and 10-year Treasury notes declined to 19 basis points (0.19%) while the 2-year to 5-year spread ended the year at 2 basis points (0.02%). The spread relationship between 1-year and 5-year notes witnessed an inversion of 9 basis points, underscoring the market's view of the Fed heading for a policy error if they continue tightening monetary policy via rates and quantitative tightening.
Within the Aggregate Index, corporate bonds were the glaring underperformer for both the quarter and the year with excess returns of -3.10% and -3.15%, respectively. Credit concerns at General Electric (GE) and the large California utilities resulting from the wild fires coupled with heavy outflows from high grade bond funds pressured spreads materially wider. Additionally, fears of rating downgrades and recession added to anxiety and exacerbated the underperformance. For the year, excess returns in utilities fared the worst (-3.94%), followed by industrials (-3.34%) then financials (-2.62%). In the structured sectors, agency mortgages were the weakest performer from an excess returns perspective (-0.59%), followed by commercial mortgage backed securities (-0.39%) while asset-backed securities posted positive excess returns (0.13%). Corporate bonds were the only sector to post negative absolute returns for the year, all other primary sectors were positive lead by asset-backed securities at 1.77%. Interestingly, asset-backed securities were also the only sector to post positive excess returns for the full year. High yield credit suffered a similar year as investment grade credit, only worse. This sector posted an absolute return of -2.08% for the year and underperformed U.S. Treasuries by -3.58%.
4
Victory Variable Insurance Funds
During the period, the Fund used both long and short positions in U.S. Treasury futures and U.S. Federal Funds Futures, as well as credit default swaps. The Fund entered into these transactions to more efficiently manage the Fund's total portfolio risks, in terms of duration, curve exposure and credit quality, which would be more costly and restrictive to manage by investing directly in a selection of cash bonds or ETFs. The derivatives strategy with regards to futures had a non-material impact on overall performance while the credit default swap strategy contributed approximately -20 basis points for the 12 months ended December 31, 2018.
Market Positioning
Our allocation to investment grade (IG) credit declined further in the fourth quarter. Additionally, our high yield exposure ended the year well below our maximum position. Our proprietary credit momentum signal continued to reduce exposure to IG credit as the option adjusted spread (OAS) of BBB-rated corporate bonds widened significantly over the trailing three months. Given this movement in OAS, valuations are now looking more compelling relative to fundamentals, yet we remain patient and ready to add risk when appropriate. Yield curve positioning and duration will be actively managed based upon our proprietary trading signals as well as changes in the shape of the yield curve. The market's assessment of the Fed's actions/communication, as reflected by changes in the shape of the curve, will be a focal point in the coming quarters.
5
Victory Variable Insurance Funds
Victory INCORE Low Duration Bond VIP Series (continued)
Average Annual Return
Year Ended December 31, 2018
| | Class I | |
INCEPTION DATE | | 8/28/03 | |
| | | Net Asset
Value | | Bloomberg
Barclays U.S.
Government
(1-3 Year) Bond Index1 | |
One Year | | | 1.01 | % | | | 1.58 | % | |
Three Year | | | 1.56 | % | | | 0.96 | % | |
Five Year | | | 1.22 | % | | | 0.82 | % | |
Ten Year | | | 2.22 | % | | | 1.03 | % | |
Since Inception | | | 2.50 | % | | | N/A | | |
Expense Ratios
Gross | | | 0.58 | % | |
With Applicable Waivers | | | 0.53 | % | |
Past performance is not indicative of future results. The performance data quoted represents past performance and current returns may be lower or higher. The investment return and principal value will fluctuate so that an investor's shares, when redeemed, may be worth more or less than the original cost. To obtain performance information current to the most recent month's end, please visit www.vcm.com.
The above expense ratios are from the Fund's prospectus dated May 1, 2018. Additional information pertaining to the Fund's expense ratios as of December 31, 2018 can be found in the financial highlights.
The total return figures set forth above include all waivers of fees for various periods since inception. Without such fee waivers, the total returns would have been lower. Some fee waivers are voluntary and may be modified or terminated at any time. The total returns do not include any insurance, sales or administrative charges of variable annuity or life insurance contracts. If these charges were included, the total returns would have been lower.
Victory INCORE Low Duration Bond VIP Series — Growth of $10,000

1The Bloomberg Barclays U.S. Government 1-3 Year Bond Index is generally considered to be representative of U.S. government bonds with maturities between one and three years. The Bloomberg Barclays U.S. Government 1-3 Year Bond Index is an unmanaged index that is not available for direct investment. There are no expenses associated with the index, while there are expenses associated with the Fund. It is not possible to invest directly in an index.
The graph reflects investment of growth of a hypothetical $10,000 investment in the Fund. Past performance is no guarantee of future results.
The graph and table do not reflect the deduction of taxes that a shareholder would pay on Fund distributions or the redemption of Fund shares.
6
Victory Variable Insurance Funds
Victory INCORE Low Duration Bond VIP Series | | Schedule of Portfolio Investments
December 31, 2018 | |
| Security Description | | Principal
Amount | | Value | |
Asset Backed Securities (12.6%) | |
American Express Credit Account Master Trust , Series 2014-1,
Class B, 2.96% (LIBOR01M+50bps), 12/15/21 (a) (b) | | $ | 2,100,000 | | | $ | 2,100,746 | | |
AmeriCredit Automobile Receivables Trust , Series 2016-3,
Class C, 2.24%, 4/8/22, Callable 12/8/20 @ 100 (b) | | | 1,635,000 | | | | 1,611,019 | | |
AmeriCredit Automobile Receivables Trust , Series 2017-2,
Class B, 2.40%, 5/18/22, Callable 2/18/21 @ 100 (b) | | | 1,385,000 | | | | 1,369,297 | | |
AmeriCredit Automobile Receivables Trust , Series 2015-3,
Class D, 3.34%, 8/8/21, Callable 1/8/20 @ 100 (b) | | | 1,675,000 | | | | 1,674,623 | | |
AmeriCredit Automobile Receivables Trust , Series 2018-1,
Class B, 3.26%, 1/18/24, Callable 1/18/22 @ 100 (b) | | | 2,800,000 | | | | 2,804,485 | | |
Avis Budget Rental Car Funding (AESOP) LLC , Series 2014-1,
Class A, 2.46%, 7/20/20 (b) (c) | | | 1,250,000 | | | | 1,246,766 | | |
Chrysler Capital Auto Receivables Trust , Series 2016-BA,
Class B, 2.22%, 5/16/22, Callable 4/15/21 @ 100 (b) (c) | | | 1,700,000 | | | | 1,673,531 | | |
Drive Auto Receivables Trust , Series 2018-2, Class B, 3.22%, 4/15/22,
Callable 1/15/21 @ 100 (b) | | | 3,600,000 | | | | 3,597,159 | | |
Drive Auto Receivables Trust , Series 2017-AA, Class C, 2.98%, 1/18/22,
Callable 8/15/20 @ 100 (b) (c) | | | 816,879 | | | | 816,195 | | |
Drive Auto Receivables Trust , Series 2017-1, Class B, 2.36%, 3/15/21,
Callable 7/15/20 @ 100 (b) | | | 156,021 | | | | 155,953 | | |
DT Auto Owner Trust , Series 2017-2A, Class B, 2.44%, 2/15/21,
Callable 9/15/20 @ 100 (b) (c) | | | 323,939 | | | | 323,737 | | |
DT Auto Owner Trust , Series 2017-3A, Class B, 2.40%, 5/17/21,
Callable 1/15/21 @ 100 (c) | | | 660,860 | | | | 659,658 | | |
GM Financing Automobile Leasing Trust , Series 2016-3, Class B, 1.97%,
5/20/20, Callable 5/20/19 @ 100 (b) | | | 2,000,000 | | | | 1,991,586 | | |
Nissan Auto Receivables Owner Trust , Series 2015-B, Class A3, 1.34%,
3/16/20, Callable 12/15/19 @ 100 | | | 148,827 | | | | 148,641 | | |
Santander Drive Auto Receivables Trust , Series 2016-3, Class C, 2.46%,
3/15/22, Callable 10/15/20 @ 100 (b) | | | 2,770,000 | | | | 2,753,181 | | |
Santander Drive Auto Receivables Trust , Series 2017-3, Class B, 2.19%,
3/15/22, Callable 12/15/20 @ 100 (b) | | | 1,375,000 | | | | 1,365,198 | | |
Santander Drive Auto Receivables Trust , Series 2018-2, Class B, 3.03%,
9/15/22, Callable 5/15/21 @ 100 (b) | | | 2,750,000 | | | | 2,744,836 | | |
Santander Drive Auto Receivables Trust , Series 2017-2, Class B, 2.21%,
10/15/21, Callable 6/15/20 @ 100 (b) | | | 1,600,000 | | | | 1,595,424 | | |
Santander Retail Auto Lease Trust , Series 2018-A, Class B, 3.20%,
4/20/22, Callable 3/20/21 @ 100 (b) (c) | | | 1,585,000 | | | | 1,580,384 | | |
Synchrony Credit Card Master Note Trust , Series 2016-1,
Class A, 2.04%, 3/15/22 | | | 1,150,000 | | | | 1,147,813 | | |
Toyota Auto Receivables Owner Trust , Series 2016-A, Class A3,
1.25%, 3/16/20, Callable 12/15/19 @ 100 | | | 295,382 | | | | 294,406 | | |
World Financial Network Credit Card Master Trust , Series 2017-A,
Class A, 2.12%, 3/15/24 (b) | | | 1,610,000 | | | | 1,588,241 | | |
Total Asset Backed Securities (Cost $33,407,086) | | | 33,242,879 | | |
See notes to financial statements.
7
Victory Variable Insurance Funds
Victory INCORE Low Duration Bond VIP Series | | Schedule of Portfolio Investments — continued
December 31, 2018 | |
| Security Description | | Principal
Amount | | Value | |
Collateralized Mortgage Obligations (4.3%) | |
BX Trust , Series 2017-SLCT, Class B, 3.66% (LIBOR01M+120bps),
7/15/34 (a) (b) (c) | | $ | 1,275,000 | | | $ | 1,272,109 | | |
BX Trust , Series 2017-APPL, Class A, 3.34% (LIBOR01M+88bps),
7/15/34 (a) (b) (c) | | | 1,342,105 | | | | 1,328,742 | | |
COMM Mortgage Trust , Series 2014-CR15, Class A2, 2.93%,
2/10/47 (b) | | | 1,354,171 | | | | 1,353,610 | | |
Galaxy CLO Ltd. , Series 2017-24A, Class A, 3.56% (LIBOR03M+112bps),
1/15/31, Callable 1/15/20 @ 100 (a) (b) (c) | | | 1,000,000 | | | | 985,850 | | |
Great Wolf Trust , Series 2017-WOLF, Class A, 3.46% (LIBOR01M+85bps),
9/15/34 (a) (b) (c) | | | 1,000,000 | | | | 989,684 | | |
GS Mortgage Securities Trust , Series 2012-GC6, Class B, 5.65%,
1/10/45 (b) (c) (d) | | | 2,000,000 | | | | 2,097,855 | | |
Morgan Stanley BAML Trust , Series 2013-C13, Class A2, 2.94%,
11/15/46 (b) | | | 150,825 | | | | 150,427 | | |
Steele Creek CLO Ltd. , Series 2017-1A, Class A, 3.69%
(LIBOR03M+125bps), 1/15/30, Callable 1/15/20 @ 100 (a) (b) (c) | | | 2,175,000 | | | | 2,148,862 | | |
Voya CLO Ltd. , Series 2017-4A, Class A1, 3.57% (LIBOR03M+113bps),
10/15/30, Callable 10/15/19 @ 100 (a) (b) (c) | | | 1,000,000 | | | | 993,900 | | |
Total Collateralized Mortgage Obligations (Cost $11,521,412) | | | 11,321,039 | | |
Residential Mortgage Backed Securities (4.4%) | |
Ameriquest Mortgage Securities, Inc. , Series 2003-5, Class A6, 4.16%,
4/25/33, Callable 1/25/19 @ 100 (b) (d) | | | 7,773 | | | | 7,757 | | |
Bear Stearns Alt-A Trust , Series 2003-3, Class 2A, 4.36%, 10/25/33,
Callable 1/25/19 @ 100 (b) (d) | | | 481,494 | | | | 480,110 | | |
Bear Stearns Alt-A Trust , Series 2004-6, Class 1A, 3.15%
(LIBOR01M+64bps), 7/25/34, Callable 1/25/19 @ 100 (a) (b) | | | 156,705 | | | | 155,220 | | |
Countrywide Home Loans, Inc. , Series 2002-19, Class 1A1, 6.25%,
11/25/32, Callable 1/25/19 @ 100 | | | 8,519 | | | | 8,519 | | |
Credit Suisse First Boston Mortgage Securities Corp. , Series 2003-23,
Class 2A8, 4.50%, 1/15/19 (b) | | | 2,424 | | | | 2,387 | | |
Credit Suisse First Boston Mortgage Securities Corp. , Series 2004-AR7,
Class 4A1, 4.26%, 11/25/34, Callable 1/25/19 @ 100 (b) (d) | | | 440,060 | | | | 437,130 | | |
Credit Suisse First Boston Mortgage Securities Corp. , Series 2004-5,
Class 5A1, 5.00%, 8/25/19, Callable 1/25/19 @ 100 (b) | | | 11,273 | | | | 11,273 | | |
JPMorgan Mortgage Trust , Series 2017-1, Class A5, 3.50%, 1/25/47,
Callable 1/25/41 @ 100 (b) (c) (d) | | | 950,544 | | | | 951,550 | | |
JPMorgan Mortgage Trust , Series 2016-4, Class A5, 3.50%, 10/25/46,
Callable 8/25/37 @ 100 (b) (c) (d) | | | 665,981 | | | | 661,837 | | |
JPMorgan Mortgage Trust , Series 2016-3, Class 1A3, 3.50%, 10/25/46,
Callable 3/25/39 @ 100 (b) (c) (d) | | | 1,415,648 | | | | 1,408,550 | | |
JPMorgan Mortgage Trust , Series 2017-3, Class 2A2, 2.50%, 8/25/47,
Callable 6/25/33 @ 100 (b) (c) (d) | | | 2,431,126 | | | | 2,338,348 | | |
JPMorgan Mortgage Trust , Series 2004-S2, Class 1A3, 4.75%, 11/25/19,
Callable 5/25/19 @ 100 (b) | | | 3,574 | | | | 3,566 | | |
JPMorgan Mortgage Trust , Series 2004-S1, Class 1A7, 5.00%, 9/25/34,
Callable 1/25/19 @ 100 (b) | | | 3,124 | | | | 3,091 | | |
JPMorgan Mortgage Trust , Series 2014-5, Class A11, 2.99%, 10/25/29,
Callable 9/25/26 @ 100 (b) (c) (d) | | | 2,068,934 | | | | 2,016,766 | | |
See notes to financial statements.
8
Victory Variable Insurance Funds
Victory INCORE Low Duration Bond VIP Series | | Schedule of Portfolio Investments — continued
December 31, 2018 | |
| Security Description | | Principal
Amount | | Value | |
Madison Park Funding Ltd. , Series 2017-26A, Class AR, 3.71%
(LIBOR03M+120bps), 7/29/30, Callable 10/29/19 @ 100 (a) (b) (c) | | $ | 1,750,000 | | | $ | 1,736,998 | | |
Morgan Stanley Mortgage Loan Trust , Series 2005-6AR, Class 1A1,
2.79% (LIBOR01M+28bps), 11/25/35, Callable 1/25/19 @ 100 (a) (b) | | | 78,668 | | | | 78,295 | | |
Prime Mortgage Trust , Series 2004-2, Class A2, 4.75%, 11/25/19,
Callable 1/25/19 @ 100 (b) | | | 8,449 | | | | 8,433 | | |
Residential Asset Securities Corp. , Series 2005-KS1, Class M1,
3.18% (LIBOR01M+68bps), 2/25/35, Callable 1/25/19 @ 100 (a) | | | 706,929 | | | | 697,288 | | |
Residential Funding Mortgage Securities I, Inc. , Series 2005-S3,
Class A1, 4.75%, 3/25/20, Callable 1/25/19 @ 100 (b) | | | 3,291 | | | | 3,291 | | |
Structured Asset Securities Corp. , Series 2003-34A, Class 3A2, 4.27%,
11/25/33, Callable 1/25/19 @ 100 (b) (d) | | | 298,159 | | | | 293,989 | | |
Structured Asset Securities Corp. , Series 2004-21XS, Class 2A6A, 5.24%,
12/25/34, Callable 1/25/19 @ 100 (b) (d) | | | 149 | | | | 149 | | |
Wells Fargo Mortgage Backed Securities Trust , Series 2003-J, Class 2A1,
4.59%, 10/25/33, Callable 1/25/19 @ 100 (b) (d) | | | 26,502 | | | | 26,502 | | |
Wells Fargo Mortgage Backed Securities Trust , Series 2004-O, Class A1,
4.68%, 8/25/34, Callable 1/25/19 @ 100 (b) (d) | | | 87,848 | | | | 87,848 | | |
Wells Fargo Mortgage Backed Securities Trust , Series 2004-M, Class A7,
4.61%, 8/25/34, Callable 1/25/19 @ 100 (b) (d) | | | 127,226 | | | | 127,226 | | |
Wells Fargo Mortgage Backed Securities Trust , Series 2004-Z, Class 2A2,
4.97%, 12/25/34, Callable 1/25/19 @ 100 (b) (d) | | | 51,292 | | | | 51,292 | | |
Total Residential Mortgage Backed Securities (Cost $11,860,949) | | | 11,597,415 | | |
Corporate Bonds (50.8%) | |
Communication Services (3.2%): | |
AT&T, Inc.
2.45%, 6/30/20, Callable 5/30/20 @ 100 (b) | | | 4,079,000 | | | | 4,030,500 | | |
3.96%, (LIBOR03M+118bps), 6/12/24 (a) | | | 688,000 | | | | 665,881 | | |
Electronic Arts, Inc., 3.70%, 3/1/21, Callable 2/1/21 @ 100 (b) | | | 2,255,000 | | | | 2,272,138 | | |
Verizon Communications Inc., 3.72%(LIBOR03M+110bps), 5/15/25,
Callable 3/15/25 @ 100 (a) (b) | | | 719,000 | | | | 697,344 | | |
Vodafone Group PLC, 3.43%(LIBOR03M+99bps), 1/16/24 (a) (b) | | | 682,000 | | | | 663,061 | | |
| | | | 8,328,924 | | |
Consumer Discretionary (5.2%): | |
Alibaba Group Holding Ltd., 2.50%, 11/28/19, Callable 10/28/19 @ 100 | | | 999,000 | | | | 994,215 | | |
Aptiv PLC, 3.15%, 11/19/20, Callable 10/19/20 @ 100 (b) | | | 1,730,000 | | | | 1,722,890 | | |
Best Buy Co., Inc., 5.50%, 3/15/21, Callable 12/15/20 @ 100 (b) | | | 2,115,000 | | | | 2,183,611 | | |
BorgWarner, Inc., 4.63%, 9/15/20 (b) | | | 859,000 | | | | 873,199 | | |
D.R Horton, Inc., 4.00%, 2/15/20 (b) | | | 2,133,000 | | | | 2,136,967 | | |
Hasbro, Inc., 3.15%, 5/15/21, Callable 3/15/21 @ 100 (b) | | | 2,622,000 | | | | 2,606,032 | | |
Lennar Corp., 4.50%, 6/15/19, Callable 4/16/19 @ 100 (b) | | | 640,000 | | | | 638,861 | | |
NVR, Inc., 3.95%, 9/15/22, Callable 6/15/22 @ 100 (b) | | | 2,635,000 | | | | 2,586,753 | | |
| | | | 13,742,528 | | |
Consumer Staples (3.8%): | |
BAT Capital Corp., 2.30%, 8/14/20 | | | 2,250,000 | | | | 2,197,035 | | |
Church & Dwight Co., Inc., 2.45%, 12/15/19,
Callable 11/15/19 @ 100 (b) | | | 1,515,000 | | | | 1,500,926 | | |
See notes to financial statements.
9
Victory Variable Insurance Funds
Victory INCORE Low Duration Bond VIP Series | | Schedule of Portfolio Investments — continued
December 31, 2018 | |
| Security Description | | Principal
Amount | | Value | |
Constellation Brands, Inc., 3.21%(LIBOR03M+70bps), 11/15/21,
Callable 10/30/19 @ 100 (a) | | $ | 2,500,000 | | | $ | 2,495,425 | | |
Ingredion, Inc., 4.63%, 11/1/20 | | | 900,000 | | | | 918,774 | | |
Molson Coors Brewing Co., 1.45%, 7/15/19 (b) | | | 1,250,000 | | | | 1,236,475 | | |
Pernod Ricard SA, 5.75%, 4/7/21 (b) (c) | | | 1,773,000 | | | | 1,858,583 | | |
| | | | 10,207,218 | | |
Energy (3.7%): | |
Enable Midstream Partner, 2.40%, 5/15/19, Callable 4/15/19 @ 100 (b) | | | 2,900,000 | | | | 2,883,875 | | |
LUKOIL International Finance BV, 6.13%, 11/9/20 (b) (c) | | | 2,815,000 | | | | 2,900,126 | | |
Marathon Petroleum Corp., 3.40%, 12/15/20, Callable 11/15/20 @ 100 (b) | | | 1,040,000 | | | | 1,039,210 | | |
Pioneer Natural Resource Co. | |
7.50%, 1/15/20 (b) | | | 1,135,000 | | | | 1,178,845 | | |
3.45%, 1/15/21, Callable 12/15/20 @ 100 (b) | | | 1,825,000 | | | | 1,818,540 | | |
| | | | 9,820,596 | | |
Financials (11.5%): | |
Alleghany Corp., 5.63%, 9/15/20 | | | 800,000 | | | | 827,496 | | |
Bank of America Corp. | |
2.25%, 4/21/20, MTN (b) | | | 1,300,000 | | | | 1,285,427 | | |
2.33%, (LIBOR03M+63bps), 10/1/21, Callable 10/1/20 @ 100 (a) | | | 754,000 | | | | 737,789 | | |
3.44%, (LIBOR03M+96bps), 7/23/24, Callable 7/23/23 @ 100 (a) (b) | | | 693,000 | | | | 677,414 | | |
Capital One Financial Corp. | |
2.45%, 4/24/19, Callable 3/24/19 @ 100 (b) | | | 500,000 | | | | 499,010 | | |
2.50%, 5/12/20, Callable 4/12/20 @ 100 | | | 590,000 | | | | 582,672 | | |
3.45%, 4/30/21, Callable 3/30/21 @ 100 (b) | | | 3,500,000 | | | | 3,491,320 | | |
Citigroup, Inc. | |
3.84%, (LIBOR03M+107bps), 12/8/21, Callable 11/8/21 @ 100 (a) (b) | | | 1,500,000 | | | | 1,498,320 | | |
3.44%, (LIBOR03M+95bps), 7/24/23, Callable 7/24/22 @ 100 (a) (b) | | | 703,000 | | | | 686,922 | | |
HSBC Holdings PLC, 3.64%(LIBOR03M+100bps), 5/18/24,
Callable 5/18/23 @ 100 (a) (b) | | | 675,000 | | | | 656,397 | | |
JPMorgan Chase & Co., 3.37%(LIBOR03M+89bps), 7/23/24,
Callable 7/23/23 @ 100 (a) (b) | | | 675,000 | | | | 657,882 | | |
KeyBank NA, 1.60%, 8/22/19 (b) | | | 3,000,000 | | | | 2,971,620 | | |
Level 3 Financing, Inc., 5.38%, 1/15/24, Callable 2/7/19 @ 102.69 | | | 325,000 | | | | 309,563 | | |
Marsh & McLennan Cos., Inc., 2.35%, 3/6/20, Callable 2/6/20 @ 100 | | | 335,000 | | | | 331,513 | | |
Morgan Stanley | |
2.45%, 2/1/19 (b) | | | 1,000,000 | | | | 999,420 | | |
2.65%, 1/27/20 (b) | | | 1,355,000 | | | | 1,345,474 | | |
3.81%, (LIBOR03M+122bps), 5/8/24, Callable 5/8/23 @ 100 (a) (b) | | | 675,000 | | | | 664,605 | | |
Newcrest Finance Pty Ltd., 4.20%, 10/1/22 (c) | | | 575,000 | | | | 578,617 | | |
Regions Financial Corp., 3.20%, 2/8/21, Callable 1/8/21 @ 100 (b) | | | 1,190,000 | | | | 1,182,539 | | |
SVB Financial Group, 5.38%, 9/15/20 (b) | | | 1,741,000 | | | | 1,796,381 | | |
The Goldman Sachs Group, Inc, 4.26%(LIBOR03M+175bps), 10/28/27,
Callable 10/28/26 @ 100 (a) (b) | | | 650,000 | | | | 631,313 | | |
The Goldman Sachs Group, Inc., 3.79%(LIBOR03M+117bps), 11/15/21,
Callable 11/15/20 @ 100 (a) (b) | | | 1,500,000 | | | | 1,496,745 | | |
UBS Group Funding Switzerland AG | |
2.95%, 9/24/20 (b) (c) | | | 2,075,000 | | | | 2,052,942 | | |
3.57%, (LIBOR03M+95bps), 8/15/23, Callable 8/15/22 @ 100 (a) (b) (c) | | | 686,000 | | | | 667,883 | | |
See notes to financial statements.
10
Victory Variable Insurance Funds
Victory INCORE Low Duration Bond VIP Series | | Schedule of Portfolio Investments — continued
December 31, 2018 | |
| Security Description | | Principal
Amount | | Value | |
Unum Group, 3.00%, 5/15/21, Callable 4/15/21 @ 100 (b) | | $ | 3,000,000 | | | $ | 2,957,490 | | |
ZB NA, 3.50%, 8/27/21 | | | 1,465,000 | | | | 1,462,246 | | |
| | | | 31,049,000 | | |
Health Care (4.9%): | |
Agilent Technologies, Inc., 5.00%, 7/15/20 (b) | | | 1,500,000 | | | | 1,534,950 | | |
Amgen, Inc., 2.20%, 5/11/20 (b) | | | 2,705,000 | | | | 2,671,701 | | |
Biogen, Inc., 2.90%, 9/15/20 (b) | | | 2,623,000 | | | | 2,606,239 | | |
Celgene Corp., 2.88%, 2/19/21 (b) | | | 3,020,000 | | | | 2,987,323 | | |
Express Scripts Holding Co., 2.25%, 6/15/19 (b) | | | 2,390,000 | | | | 2,379,531 | | |
Halfmoon Parent, Inc., 3.33%(LIBOR03M+89bps), 7/15/23,
Callable 6/15/23 @ 100 (a) (c) (e) | | | 702,000 | | | | 691,330 | | |
| | | | 12,871,074 | | |
Industrials (3.5%): | |
Acuity Brands Lighting, Inc., 6.00%, 12/15/19 (b) | | | 1,330,000 | | | | 1,360,457 | | |
Aercap Holdings NV, 4.63%, 10/30/20 (b) | | | 2,015,000 | | | | 2,029,186 | | |
Equifax, Inc., 3.60%, 8/15/21 | | | 1,000,000 | | | | 996,940 | | |
Honeywell International, Inc., 1.80%, 10/30/19 | | | 744,000 | | | | 736,716 | | |
IDEX Corp., 4.50%, 12/15/20, Callable 9/15/20 @ 100 (b) | | | 1,150,000 | | | | 1,170,988 | | |
Kansas City Southern, 2.35%, 5/15/20, Callable 4/15/20 @ 100 (b) | | | 1,756,000 | | | | 1,730,520 | | |
Spirit AeroSystems, Inc., 3.59%(LIBOR03M+80bps), 6/15/21,
Callable 5/31/19 @ 100 (a) | | | 1,000,000 | | | | 986,110 | | |
| | | | 9,010,917 | | |
Information Technology (5.5%): | |
Broadcom Corp., 3.00%, 1/15/22, Callable 12/15/21 @ 100 | | | 2,234,000 | | | | 2,148,125 | | |
FLIR Systems, Inc., 3.13%, 6/15/21, Callable 5/15/21 @ 100 | | | 2,050,000 | | | | 2,021,710 | | |
Juniper Networks, Inc., 3.13%, 2/26/19 (b) | | | 2,930,000 | | | | 2,930,879 | | |
Lam Research Group, 2.80%, 6/15/21, Callable 5/15/21 @ 100 | | | 2,928,000 | | | | 2,887,301 | | |
NetApp, Inc. | |
2.00%, 9/27/19 (b) | | | 1,025,000 | | | | 1,013,151 | | |
3.38%, 6/15/21, Callable 4/15/21 @ 100 | | | 1,310,000 | | | | 1,304,839 | | |
VMware, Inc., 2.30%, 8/21/20 (b) | | | 2,110,000 | | | | 2,066,429 | | |
| | | | 14,372,434 | | |
Materials (2.8%): | |
Anglo American Capital PLC, 4.13%, 4/15/21 (b) (c) | | | 3,275,000 | | | | 3,265,404 | | |
LyondellBasell Industries NV, 6.00%, 11/15/21, Callable 8/17/21 @ 100 | | | 800,000 | | | | 846,744 | | |
Newmont Mining Corp., 5.13%, 10/1/19 (b) | | | 3,285,000 | | | | 3,324,519 | | |
| | | | 7,436,667 | | |
Real Estate (3.9%): | |
CubeSmart, LP, 4.80%, 7/15/22, Callable 4/15/22 @ 100 | | | 2,731,000 | | | | 2,813,257 | | |
Healthcare Trust of America Holdings LP, 3.38%, 7/15/21,
Callable 5/15/21 @ 100 (b) | | | 1,000,000 | | | | 993,500 | | |
Highwoods Realty LP, 3.20%, 6/15/21, Callable 4/15/21 @ 100 (b) | | | 2,200,000 | | | | 2,180,860 | | |
Ventas Realty, LP, 4.25%, 3/1/22, Callable 12/1/21 @ 100 | | | 2,200,000 | | | | 2,242,767 | | |
Welltower, Inc., 6.13%, 4/15/20 (b) | | | 1,906,000 | | | | 1,967,507 | | |
| | | | 10,197,891 | | |
See notes to financial statements.
11
Victory Variable Insurance Funds
Victory INCORE Low Duration Bond VIP Series | | Schedule of Portfolio Investments — continued
December 31, 2018 | |
Security Description | | Shares or
Principal
Amount | | Value | |
Utilities (2.8%): | |
Eversource Energy, 2.50%, 3/15/21, Callable 2/15/21 @ 100 (b) | | $ | 1,950,000 | | | $ | 1,915,739 | | |
Exelon Corp., 3.50%, 6/1/22, Callable 5/1/22 @ 100 | | | 2,117,000 | | | | 2,068,711 | | |
Iberdrola Finance Ireland Ltd., 5.00%, 9/11/19 (b) (c) | | | 3,290,000 | | | | 3,325,136 | | |
| | | | 7,309,586 | | |
Total Corporate Bonds (Cost $135,820,982) | | | 134,346,835 | | |
U.S. Government Mortgage Backed Agencies (9.9%) | |
Federal Home Loan Mortgage Corp. | |
5.00%, 6/15/23 – 8/1/40 (b) | | | 1,012,412 | | | | 1,073,789 | | |
5.50%, 10/25/23 (b) | | | 6,711 | | | | 6,939 | | |
Series 4430, Class NG, 2.50%, 2/15/38 (b) | | | 1,970,830 | | | | 1,949,836 | | |
7.00%, 9/1/38 (b) | | | 6,605 | | | | 7,532 | | |
Series 4320, Class AP, 3.50%, 7/15/39 (b) | | | 984,683 | | | | 1,001,027 | | |
Series 3713, Class PA, 2.00%, 2/15/40 – 3/15/40 (b) | | | 7,054,704 | | | | 6,842,148 | | |
Series 4049, Class AB, 2.75%, 12/15/41 (b) | | | 621,614 | | | | 616,000 | | |
| | | | 11,497,271 | | |
Federal National Mortgage Association | |
Series 2010-156, Class DY, 3.50%, 1/25/26 – 3/25/40 (b) | | | 4,377,027 | | | | 4,420,666 | | |
6.00%, 2/1/37 (b) | | | 1,087,894 | | | | 1,204,897 | | |
Series 2013-33, Class UD, 2.50%, 4/25/39 (b) | | | 1,218,414 | | | | 1,193,795 | | |
Series 2011-21, Class PA, 4.50%, 5/25/40 (b) | | | 2,669,677 | | | | 2,756,698 | | |
Series 2011-101, Class LA, 3.00%, 10/25/40 (b) | | | 1,065,007 | | | | 1,059,783 | | |
5.00%, 2/1/41 – 10/1/41 (b) | | | 3,769,939 | | | | 4,000,285 | | |
| | | | 14,636,124 | | |
Total U.S. Government Mortgage Backed Agencies (Cost $26,701,504) | | | 26,133,395 | | |
U.S. Treasury Obligations (15.6%) | |
U.S. Treasury Bills, 2.09%, 1/24/19 (f) | | | 23,000,000 | | | | 22,967,982 | | |
U.S. Treasury Notes | |
1.13%, 1/31/19 (b) | | | 3,837,000 | | | | 3,832,550 | | |
1.63%, 8/31/19 (b) | | | 10,546,000 | | | | 10,476,815 | | |
2.25%, 3/31/20 (b) | | | 2,000,000 | | | | 1,991,995 | | |
2.88%, 10/15/21 | | | 2,000,000 | | | | 2,021,246 | | |
Total U.S. Treasury Obligations (Cost $41,329,928) | | | 41,290,588 | | |
Collateral for Securities Loaned^ (0.1%) | |
BlackRock Liquidity Funds TempFund Portfolio, Institutional Class,
2.49% (g) | | | 57,476 | | | | 57,476 | | |
Fidelity Investments Money Market Government Portfolio,
Class I, 2.28% (g) | | | 83,050 | | | | 83,050 | | |
Fidelity Investments Prime Money Market Portfolio, Class I, 2.46% (g) | | | 2,565 | | | | 2,565 | | |
Goldman Sachs Financial Square Prime Obligations Fund,
Institutional Class, 2.55% (g) | | | 31,931 | | | | 31,931 | | |
JPMorgan Prime Money Market Fund, Capital Class, 2.49% (g) | | | 51,087 | | | | 51,087 | | |
See notes to financial statements.
12
Victory Variable Insurance Funds
Victory INCORE Low Duration Bond VIP Series | | Schedule of Portfolio Investments — continued
December 31, 2018 | |
Security Description | | Shares or
Principal
Amount | | Value | |
Morgan Stanley Institutional Liquidity Prime Portfolio,
Institutional Class, 2.58% (g) | | $ | 76,635 | | | $ | 76,635 | | |
Total Collateral for Securities Loaned (Cost $302,744) | | | 302,744 | | |
Total Investments (Cost $260,944,605) — 97.7% | | | 258,234,895 | | |
Other assets in excess of liabilities — 2.3% | | | 6,213,845 | | |
NET ASSETS — 100.00% | | $ | 264,448,740 | | |
^ Purchased with cash collateral from securities on loan.
(a) Variable or Floating-Rate Security. Rate disclosed is as of December 31, 2018.
(b) All or a portion of this security has been segregated as collateral for derivative instruments.
(c) Rule 144A security or other security that is restricted as to resale to institutional investors. The Fund's Adviser has deemed this security to be liquid based upon procedures approved by the Board of Trustees. As of December 31, 2018, the fair value of these securities was $40,571,343 and amounted to 15.3% of net assets.
(d) The rate for certain asset backed and mortgage backed securities may vary based on factors relating to the pool of assets underlying the security. The rate disclosed is the rate in effect at December 31, 2018.
(e) All or a portion of this security is on loan.
(f) Rate represents the effective yield at December 31, 2018.
(g) Rate disclosed is the daily yield on December 31, 2018.
bps — Basis points
LIBOR — London InterBank Offered Rate
LIBOR01M — 1 Month US Dollar LIBOR, rate disclosed as of December 31, 2018, based on the last reset date of the security
LIBOR03M — 3 Month US Dollar LIBOR, rate disclosed as of December 31, 2018, based on the last reset date of the security
LLC — Limited Liability Company
LP — Limited Partnership
MTN — Medium Term Note
PLC — Public Limited Company
Futures Contracts Purchased
| | | Number of
Contracts | | Expiration
Date | | Notional
Amount | | Value | | Unrealized
Appreciation
(Depreciation) | |
2-Year U.S.Treasury Note Future | | | 229 | | | 3/29/19 | | $ | 48,294,734 | | | $ | 48,619,585 | | | $ | 324,851 | | |
5-Year U.S. Treasury Note Future | | | 201 | | | 3/29/19 | | | 22,683,508 | | | | 23,052,188 | | | | 368,680 | | |
| | | | | | | | | | | | | | | | | $ | 693,531 | | |
| | | Total unrealized appreciation | | | | | | | | $ | 693,531 | | |
| | | Total unrealized depreciation | | | | | | | | | — | | |
| | | Total net unrealized appreciation(depreciation) | | | | | | | | $ | 693,531 | | |
See notes to financial statements.
13
Victory Variable Insurance Funds
Victory INCORE Low Duration Bond VIP Series | | Schedule of Portfolio Investments — continued
December 31, 2018 | |
Credit Default Swap Agreements — Sell Protection (a)
Underlying
Instrument | | Fixed
Deal
Received
Rate | | Expiration
Date | | Payment
Frequency | | Implied
Credit
Spread at
December 31,
2018 (b) | | Notional
Amount (c) | | Value | | Premiums
Paid
(Received) | | Unrealized
Appreciation
(Depreciation) | |
CDX North
America High
Yield Index;
Series 31 | | | 5.00 | % | | 12/20/23 | | Daily | | | 4.46 | % | | $ | 25,000,000 | | | $ | 510,630 | | | $ | 1,810,600 | | | $ | (1,299,970 | ) | |
CDX North
America
Investment
Grade 5 Year
Index;
Series 31 | | | 1.00 | % | | 12/20/23 | | Daily | | | 4.46 | % | | | 14,000,000 | | | | 79,183 | | | | 261,707 | | | | (182,524 | ) | |
| | | $ | 589,813 | | | $ | 2,072,307 | | | $ | (1,482,494 | ) | |
(a) When a credit event occurs as defined under the terms of the swap agreement, the Fund as a seller of credit protection will either (i) pay to the buyer of protection an amount equal to the par value of the defaulted reference entity and take delivery of the reference entity or (ii) pay a net amount equal to the par value of the defaulted reference entity less its recovery value.
(b) Implied credit spread, represented in absolute terms, utilized in determining the value of the credit default swap agreements as of period end will serve as an indicator of the current status of the payment/performance risk and represent the likelihood or risk of default for the credit derivative. The implied credit spread of a referenced entity reflects the cost of buying/selling protection and may include payments required to be made to enter into the agreement. Generally, wider credit spreads represent a perceived deterioration of the referenced entity's credit soundness and a greater likelihood or risk of default or other credit event occurring as defined under the terms of the swap agreement.
(c) The notional amount represents the maximum potential amount the Fund could be required to pay as a seller of credit protection if a credit event occurs, as defined under the terms of the swap agreement, for each security included in the CDX North America High Yield Index or CDX North America Investment Grade 5 Year Index.
See notes to financial statements.
14
Victory Variable Insurance Funds | | Statement of Assets and Liabilities
December 31, 2018 | |
| | | Victory
INCORE
Low Duration
Bond VIP Series | |
ASSETS: | |
Investments, at value (Cost $260,944,605) | | $ | 258,234,895 | (a) | |
Cash and cash equivalents | | | 1,635,908 | | |
Deposits with brokers for futures contracts | | | 1,322,396 | | |
Deposits with brokers for swap agreements | | | 2,292,999 | | |
Interest and dividends receivable | | | 1,421,176 | | |
Receivable for investments sold | | | 3,402 | | |
Variation margin receivable on open futures contracts | | | 82,493 | | |
Variation margin receivable on open swap agreements | | | 34,614 | | |
Receivable from Adviser | | | 68,259 | | |
Total Assets | | | 265,096,142 | | |
LIABILITIES: | |
Payables: | |
Collateral received on loaned securities | | | 302,744 | | |
Capital shares redeemed | | | 137,258 | | |
Accrued expenses and other payables: | |
Investment advisory fees | | | 101,388 | | |
Administration fees | | | 13,820 | | |
Custodian fees | | | 4,233 | | |
Transfer agent fees | | | 29,966 | | |
Chief Compliance Officer fees | | | 499 | | |
Trustees' fees | | | 259 | | |
Other accrued expenses | | | 57,235 | | |
Total Liabilities | | | 647,402 | | |
NET ASSETS: | |
Capital | | | 267,399,730 | | |
Total distributable earnings/(loss) | | | (2,950,990 | ) | |
Net Assets | | $ | 264,448,740 | | |
Shares Outstanding (unlimited shares authorized, with a par
value of $0.001 per share): | | | 25,742,782 | | |
Net asset value: | | $ | 10.27 | | |
(a) Includes $294,455 of securities on loan.
See notes to financial statements.
15
Victory Variable Insurance Funds | | Statement of Operations
For the Year Ended December 31, 2018 | |
| | | Victory
INCORE
Low Duration
Bond VIP Series | |
Investment Income: | |
Interest | | $ | 6,774,685 | | |
Securities lending (net of fees) | | | 9,075 | | |
Total Income | | | 6,783,760 | | |
Expenses: | |
Investment advisory fees | | | 1,281,990 | | |
Administration fees | | | 170,506 | | |
Custodian fees | | | 17,266 | | |
Transfer agent fees | | | 60,269 | | |
Trustees' fees | | | 23,575 | | |
Chief Compliance Officer fees | | | 2,456 | | |
Legal and audit fees | | | 46,356 | | |
Other expenses | | | 62,755 | | |
Total Expenses | | | 1,665,173 | | |
Expenses waived/reimbursed by Adviser | | | (155,683 | ) | |
Net Expenses | | | 1,509,490 | | |
Net Investment Income (Loss) | | | 5,274,270 | | |
Realized/Unrealized Gains (Losses) from Investment Transactions: | |
Net realized gains (losses) from investment transactions | | | (426,202 | ) | |
Net realized gains (losses) from futures transactions | | | (765,169 | ) | |
Net realized gains (losses) from swap transactions | | | 1,036,524 | | |
Net change in unrealized appreciation/depreciation on investments | | | (1,435,538 | ) | |
Net change in unrealized appreciation/depreciation on futures transactions | | | 786,412 | | |
Net change in unrealized appreciation/depreciation on swap transactions | | | (1,619,834 | ) | |
Net realized/unrealized gains (losses) on investments | | | (2,423,807 | ) | |
Change in net assets resulting from operations | | $ | 2,850,463 | | |
See notes to financial statements.
16
Victory Variable Insurance Funds | | Statements of Changes in Net Assets | |
| | | Victory INCORE Low
Duration Bond VIP Series | |
| | | Year Ended
December 31,
2018 | | Year Ended
December 31,
2017 | |
From Investment Activities: | |
Operations: | |
Net investment income (loss) | | $ | 5,274,270 | | | $ | 4,149,385 | | |
Net realized gains (losses) from investment transactions | | | (154,847 | ) | | | 772,341 | | |
Net change in unrealized appreciation (depreciation)
on investments | | | (2,268,960 | ) | | | (357,681 | ) | |
Change in net assets resulting from operations | | | 2,850,463 | | | | 4,564,045 | | |
Distributions to Shareholders: (a) | |
Change in net assets resulting from distributions
to shareholders | | | (1,374,412 | ) | | | (4,147,757 | ) | |
Change in net assets resulting from capital transactions | | | (29,333,670 | ) | | | 18,738,983 | | |
Change in net assets | | | (27,857,619 | ) | | | 19,155,271 | | |
Net Assets: | |
Beginning of period | | | 292,306,359 | | | | 273,151,088 | | |
End of period | | $ | 264,448,740 | | | $ | 292,306,359 | | |
Capital Transactions: | |
Proceeds from shares issued | | | 20,030,792 | | | | 41,604,917 | | |
Distributions reinvested | | | 1,374,412 | | | | 4,147,757 | | |
Cost of shares redeemed | | | (50,738,874 | ) | | | (27,013,691 | ) | |
Change in net assets resulting from capital transactions | | | (29,333,670 | ) | | | 18,738,983 | | |
Share Transactions: | |
Issued | | | 1,955,580 | | | | 4,044,038 | | |
Reinvested | | | 134,219 | | | | 406,245 | | |
Redeemed | | | (4,949,055 | ) | | | (2,620,215 | ) | |
Change in Shares | | | (2,859,256 | ) | | | 1,830,068 | | |
(a) Current and prior year distributions to shareholders have been reclassified and conform to amended GAAP presentation under Regulation S-X (See Item 10 in the Notes to Financial Statements).
See notes to financial statements.
17
Victory Variable Insurance Funds | | Financial Highlights | |
For a Share Outstanding Throughout Each Period
| | | Victory INCORE Low Duration Bond VIP Series | |
| | | Year
Ended
December 31,
2018 | | Year
Ended
December 31,
2017 | | Year
Ended
December 31,
2016 | | Year
Ended
December 31,
2015 | | Year
Ended
December 31,
2014 | |
Net Asset Value, Beginning of Period | | $ | 10.22 | | | $ | 10.20 | | | $ | 10.13 | | | $ | 10.22 | | | $ | 10.30 | | |
Investment Activities: | |
Net investment income (loss) | | | 0.19 | (a) | | | 0.15 | (a) | | | 0.12 | (a) | | | 0.14 | (a) | | | 0.18 | | |
Net realized and unrealized gains
(losses) on investments | | | (0.09 | ) | | | 0.02 | | | | 0.09 | | | | (0.09 | ) | | | (0.08 | ) | |
Total from Investment Activities | | | 0.10 | | | | 0.17 | | | | 0.21 | | | | 0.05 | | | | 0.10 | | |
Distributions to Shareholders: | |
Net investment income | | | (0.05 | ) | | | (0.15 | ) | | | (0.14 | ) | | | (0.14 | ) | | | (0.18 | ) | |
Total Distributions to
Shareholders | | | (0.05 | ) | | | (0.15 | ) | | | (0.14 | ) | | | (0.14 | ) | | | (0.18 | ) | |
Capital Contributions from Prior Custodian,
Net (See Note 8) | | | — | | | | — | | | | — | (b) | | | — | | | | — | | |
Net Asset Value, End of Period | | $ | 10.27 | | | $ | 10.22 | | | $ | 10.20 | | | $ | 10.13 | | | $ | 10.22 | | |
Total Return (c) | | | 1.01 | % | | | 1.64 | % | | | 2.04 | %(d) | | | 0.47 | % | | | 0.92 | % | |
Ratios/Supplemental Data: | |
Net Assets at end of period (000) | | $ | 264,449 | | | $ | 292,306 | | | $ | 273,151 | | | $ | 276,164 | | | $ | 265,514 | | |
Ratio of net expenses to average net assets | | | 0.53 | % | | | 0.53 | % | | | 0.53 | % | | | 0.53 | % | | | 0.55 | % | |
Ratio of net investment income (loss)
to average net assets | | | 1.85 | % | | | 1.44 | % | | | 1.21 | % | | | 1.33 | % | | | 1.74 | % | |
Ratio of gross expenses to
average net assets | | | 0.58 | %(e) | | | 0.58 | %(e) | | | 0.53 | % | | | 0.53 | % | | | 0.55 | % | |
Portfolio turnover | | | 55 | % | | | 91 | %(f) | | | 55 | % | | | 38 | % | | | 39 | % | |
(a) Per share net investment income (loss) has been calculated using the average daily shares method.
(b) Amount is less than $0.005 per share.
(c) Total returns do not reflect the effects of charges deducted pursuant to the terms of The Guardian Insurance & Annuity Company, Inc's variable contracts. Inclusion of such charges would reduce the total returns for all periods shown.
(d) The Fund received monies related to a nonrecurring refund from the prior Custodian. The corresponding impact to the total return was less than 0.005% for the period shown. (See Note 8)
(e) During the period, certain fees were reduced and/or reimbursed. If such fee reductions and/or reimbursements had not occurred, the ratios would have been as indicated.
(f) Portfolio turnover increased due to a change within the portfolio holdings during the year.
See notes to financial statements.
18
Victory Variable Insurance Funds | | Notes to Financial Statements
December 31, 2018 | |
1. Organization:
Victory Variable Insurance Funds (the "Trust") was organized on February 11, 1998 as a Delaware statutory trust. The Trust is registered under the Investment Company Act of 1940, as amended (the "1940 Act"), as a diversified open-end investment company. The Trust is comprised of nine funds and is authorized to issue an unlimited number of shares, which are units of beneficial interest with a par value of $0.001 per share.
The accompanying financial statements are those of the Victory INCORE Low Duration Bond VIP Series (the "Fund"). The Fund offers a single class of shares: Class I Shares. Sales of shares of the Fund may only be made to certain separate accounts of The Guardian Insurance & Annuity Company, Inc. ("GIAC") that fund certain variable annuity and variable life insurance contracts issued by GIAC. GIAC is a wholly owned subsidiary of The Guardian Life Insurance Company of America ("Guardian Life").
Under the Trust's organizational documents, its officers and trustees are indemnified against certain liabilities arising out of the performance of their duties to the Fund. In addition, in the normal course of business, the Fund enters into contracts with its vendors and others that provide for general indemnifications. The Fund's maximum exposure under these arrangements is unknown, as this would involve future claims that may be made against the Fund. However, based on experience, the Fund expects that risk of loss to be remote.
2. Significant Accounting Policies:
The following is a summary of significant accounting policies followed by the Trust in the preparation of its financial statements. The policies are in conformity with accounting principles generally accepted in the United States of America ("GAAP"). The preparation of financial statements in accordance with GAAP requires management to make estimates and assumptions that affect the reported amounts of assets and liabilities and disclosure of contingent assets and liabilities at the date of the financial statements and the reported amounts of income and expenses for the period. Actual results could differ from those estimates. The Fund follows the specialized accounting and reporting requirements under GAAP that are applicable to investment companies.
Investment Valuation:
The Fund records investments at fair value. Fair value is defined as the price that would be received to sell an asset or paid to transfer a liability in an orderly transaction between market participants at the measurement date.
The valuation techniques described below maximize the use of observable inputs and minimize the use of unobservable inputs in determining fair value. The inputs used for valuing the Fund's investments are summarized in the three broad levels listed below:
• Level 1 — quoted prices in active markets for identical securities
• Level 2 — other significant observable inputs (including quoted prices for similar securities or interest rates applicable to those securities, etc.)
• Level 3 — significant unobservable inputs (including the Fund's own assumptions in determining the fair value of investments)
Changes in valuation techniques may result in transfers in or out of an assigned level within the disclosure hierarchy. The inputs or methodologies used for valuation techniques are not necessarily an indication of the risk associated with entering into those investments.
Portfolio securities listed or traded on securities exchanges, including American Depositary Receipts ("ADRs") and Rights, are valued at the closing price on the exchange or system where the security is principally traded, if available, or at the Nasdaq Official Closing Price. If there have been no sales for that day on the exchange or system, then a security is valued at the last available bid quotation on the exchange or system where the security is principally traded. In each of these situations, valuations are typically categorized as Level 1 in the fair value hierarchy.
19
Victory Variable Insurance Funds | | Notes to Financial Statements — continued
December 31, 2018 | |
Futures contracts are valued at the settlement price established each day by the board of trade or an exchange on which they are traded. These valuations are typically categorized as Level 1 in the fair value hierarchy.
Swap agreements are valued at the mean between the current bid and ask prices. These valuations are typically categorized as Level 2 in the fair value hierarchy.
Debt securities of United States ("U.S.") issuers (other than short-term investments maturing in 60 days or less), including corporate and municipal securities, are valued on the basis of bid valuations provided by dealers or an independent pricing service approved by the Trust's Board of Trustees (the "Board"). Short-term investments maturing in 60 days or less may be valued at amortized cost, which approximates market value. Under the amortized cost method, premium or discount, if any, is amortized or accreted, respectively, on a constant basis to the maturity of the security. In each of these situations, valuations are typically categorized as Level 2 in the fair value hierarchy.
Investments for which there are no such quotations, or for which quotations do not appear reliable, are valued at fair value in accordance with procedures established by and under the general supervision and responsibility of the Board. These valuations are typically categorized as Level 2 or Level 3 in the fair value hierarchy, based on the observability of inputs used to determine the fair value.
A summary of the valuations as of December 31, 2018, based upon the three levels defined above, is included in the table below while the breakdown, by category, of investments is disclosed in the Schedule of Portfolio Investments:
| | | LEVEL 1 —
Quoted Prices | | LEVEL 2 —
Other Significant
Observable Inputs | | Total | |
| | | Investments
in
Securities | | Other
Financial
Investments^ | | Investments
in
Securities | | Other
Financial
Investments^ | | Investments
in
Securities | | Other
Financial
Investments^ | |
Asset Backed Securities | | $ | — | | | $ | — | | | $ | 33,242,879 | | | $ | — | | | $ | 33,242,879 | | | $ | — | | |
Collateralized Mortgage
Obligations | | | — | | | | — | | | | 11,321,039 | | | | — | | | | 11,321,039 | | | | — | | |
Residential Mortgage Backed
Securities | | | — | | | | — | | | | 11,597,415 | | | | — | | | | 11,597,415 | | | | — | | |
Corporate Bonds | | | — | | | | — | | | | 134,346,835 | | | | — | | | | 134,346,835 | | | | — | | |
U.S. Government Mortgage Backed
Agencies | | | — | | | | — | | | | 26,133,395 | | | | — | | | | 26,133,395 | | | | — | | |
U.S. Treasury Obligations | | | — | | | | — | | | | 41,290,588 | | | | — | | | | 41,290,588 | | | | — | | |
Collateral for Securities Loaned | | | 302,744 | | | | — | | | | — | | | | — | | | | 302,744 | | | | — | | |
Futures Contracts | | | — | | | | 693,531 | | | | — | | | | — | | | | — | | | | 693,531 | | |
Credit Default Swap Agreements | | | — | | | | — | | | | — | | | | (1,482,494 | ) | | | — | | | | (1,482,494 | ) | |
Total | | $ | 302,744 | | | $ | 693,531 | | | $ | 257,932,151 | | | $ | (1,482,494 | ) | | $ | 258,234,895 | | | $ | (788,963 | ) | |
^ Other Financial instruments include any derivative instruments not reflected in the Schedule of Portfolio Investments as investment securities, such as futures contracts and swap agreements. These instruments are generally recorded in the financial statements at the unrealized gain or loss on the investment.
For the year ended December 31, 2018, there were no Level 3 investments for which significant unobservable inputs were used to determine fair value.
Securities Purchased on a When-Issued Basis:
The Fund may purchase securities on a when-issued basis. When-issued securities are securities purchased for delivery beyond normal settlement periods at a stated price and/or yield, thereby involving the risk that the price and/or yield obtained may be more or less than those available in the
20
Victory Variable Insurance Funds | | Notes to Financial Statements — continued
December 31, 2018 | |
market when delivery takes place. At the time the Fund makes the commitment to purchase a security on a when-issued basis, the Fund records the transaction and reflects the value of the security in determining net asset value. No interest accrues to the Fund until the transaction settles and payment takes place. Normally, the settlement date occurs within one month of the purchase. A segregated account is established and the Fund maintains cash and/or marketable securities at least equal in value to commitments for when-issued securities. If the Fund owns when-issued securities, these values are included in "Payable for investments purchased" on the accompanying Statements of Assets and Liabilities. As of December 31, 2018, the Fund had no outstanding when-issued purchase commitments.
Loans:
Floating rate loans in which the Fund invests are primarily "senior" loans. Senior floating rate loans typically hold a senior position in the capital structure of the borrower, are typically secured by specific collateral, and have a claim on the assets and/or stock of the borrower that is senior to that held by subordinated debtholders and stockholders of the borrower. While these protections may reduce risk, these investments still present significant credit risk. A significant portion of the Fund's floating rate investments may be issued in connection with highly leveraged transactions such as leveraged buyouts, leveraged recapitalization loans, and other types of acquisition financing. Obligations in these types of transactions are subject to greater credit risk (including default and bankruptcy) than many other investments and may be, or become, illiquid. See the note below regarding below investment grade securities.
The Fund may purchase second lien loans (secured loans with a claim on collateral subordinate to a senior lender's claim on such collateral), fixed rate loans, unsecured loans, and other debt obligations.
Transactions in loans often settle on a delayed basis, and the Fund may not receive the proceeds from the sale of a loan or pay for a loan purchase for a substantial period of time after entering into the transactions.
Below Investment Grade Securities:
The Fund may invest in below investment grade securities (i.e. lower-quality, "junk" debt), which are subject to various risks. Lower-quality debt is considered to be speculative because it is less certain that the issuer will be able to pay interest or repay the principal than in the case of investment grade debt. These securities can involve a substantially greater risk of default than higher-rated securities, and their values can decline significantly over short periods of time. Lower-quality debt securities tend to be more sensitive to adverse news about their issuers, the market and the economy in general, than higher-quality debt securities. The market for these securities can be less liquid, especially during periods of recession or general market decline.
Investment Companies:
The Fund may invest in portfolios of open-end investment companies. These investment companies value securities in their portfolios for which market quotations are readily available at their market values (generally the last reported sale price) and all other securities and assets at their fair value by the methods established by the board of directors of the underlying fund.
Derivative Instruments:
Futures Contracts:
The Fund may enter into contracts for the future delivery of securities or foreign currencies and futures contracts based on a specific security, class of securities, foreign currency or an index, and purchase or sell options on any such futures contracts. A futures contract on a securities index is an agreement obligating either party to pay, and entitling the other party to receive, while the contract is outstanding, cash payments based on the level of a specified securities index. No physical delivery of the underlying asset is made. The Fund may enter into futures contracts in an effort to hedge against market risks. The acquisition of put and call options on futures contracts will give the Fund the right (but not the obligation), for a specified price, to sell or to purchase the underlying futures contract, upon exercise of the option, at any time during the option period. Futures transactions involve brokerage costs and
21
Victory Variable Insurance Funds | | Notes to Financial Statements — continued
December 31, 2018 | |
require the Fund to segregate assets to cover contracts that would require it to purchase securities or currencies. A good faith margin deposit, known as initial margin, of cash or government securities with a broker or custodian is required to initiate and maintain open positions in futures contracts. Subsequent payments, known as variation margin, are made or received by the Fund based on the change in the market value of the position and are recorded as unrealized appreciation or depreciation until the contract is closed out, at which time the gain or loss is realized. The Fund may lose the expected benefit of futures transactions if interest rates, exchange rates or securities prices change in an unanticipated manner. Such unanticipated changes may also result in lower overall performance than if the Fund had not entered into any futures transactions. In addition, the value of the Fund's futures positions may not prove to be perfectly or even highly correlated with the value of its portfolio securities or foreign currencies, limiting the Fund's ability to hedge effectively against interest rate, exchange rate and/or market risk and giving rise to additional risks. There is no assurance of liquidity in the secondary market for purposes of closing out futures positions. The collateral held by the Fund is presented on the Statement of Assets and Liabilities under Deposits with brokers for futures contracts.
As of December 31, 2018, the Fund entered into Futures Contracts primarily for the strategy of hedging or other purposes, including but not limited to, providing liquidity and equitizing cash.
Credit Derivatives:
The Fund may enter into credit derivatives, including centrally-cleared credit default swaps on individual obligations or credit indices. The Fund may use these investments (i) as alternatives to direct long or short investment in a particular security or securities, (ii) to adjust the Fund's asset allocation or risk exposure, or (iii) for hedging purposes. The use by the Fund of credit default swaps may have the effect of creating a short position in a security. Credit derivatives can create investment leverage and may create additional investment risks that may subject the Fund to greater volatility than investments in more traditional securities, as described in the Fund's Statement of Additional Information.
Credit default swap ("CDS") agreements on credit indices involve one party making a stream of payments (referred to as the buyer of protection) to another party (the seller of protection) in exchange for the right to receive a specified return in the event of a write-down, principal shortfall, interest shortfall or default of all or part of the referenced entities comprising the credit index. A credit index is a basket of credit instruments or exposures designed to be representative of a specific sector of the credit market as a whole. These indices are made up of reference credits that are judged by a poll of dealers to be the most liquid entities in the CDS.
The counterparty risk for cleared swap agreements is generally lower than uncleared over-the-counter swap agreements because generally a clearing organization becomes substituted for each counterparty to a cleared swap agreement and, in effect, guarantees each party's performance under the contract as each party to a trade looks only to the clearing organization for performance of financial obligations. However, there can be no assurance that the clearing organization, or its members, will satisfy its obligations to the Fund.
The Fund may enter into CDS agreements either as a buyer or seller. The Fund may buy protection under a CDS to attempt to mitigate the risk of default or credit quality deterioration in one or more individual holdings or in a segment of the fixed income securities market. The Fund may sell protection under a CDS in an attempt to gain exposure to an underlying issuer's credit quality characteristics without investing directly in that issuer. For swaps entered with an individual counterparty, the Fund bears the risk of loss of the uncollateralized amount expected to be received under a CDS agreement in the event of the default or bankruptcy of the counterparty. CDS agreements are generally valued at a price at which the counterparty to such agreement would terminate the agreement. The Fund may also enter into cleared swaps.
Upon entering into a cleared CDS, the Fund may be required to deposit with the broker an amount of cash or cash equivalents in the range of approximately 3% to 6% of the notional amount for CDS on high yield debt issuers (this amount is subject to change by the clearing organization that clears the trade). This amount, known as "initial margin," is in the nature of a performance bond or good faith deposit on the CDS and is returned to a Fund upon termination of the CDS, assuming all contractual
22
Victory Variable Insurance Funds | | Notes to Financial Statements — continued
December 31, 2018 | |
obligations have been satisfied. Subsequent payments, known as "variation margin," to and from the broker will be made daily as the price of the CDS fluctuates, making the long and short positions in the CDS contract more or less valuable, a process known as "marking-to-market." The premium (discount) payments are built into the daily price of the CDS and thus are amortized through the variation margin. The variation margin payment also includes the daily portion of the periodic payment stream.
The maximum potential amount of future payments (undiscounted) that the Fund as a seller of protection could be required to make under a CDS agreement equals the notional amount of the agreement. Notional amounts of each individual CDS agreement outstanding as of period end for which the Fund is the seller of protection are disclosed on the Schedule of Portfolio Investments. These potential amounts would be partially offset by any recovery values of the respective referenced obligations, upfront payments received upon entering into the agreement, periodic interest payments, or net amounts received from the settlement of buy protection CDS agreements entered into by the Fund for the same referenced entity or entities.
As of December 31, 2018, the Fund entered into centrally cleared CDS agreements primarily for the strategy of asset allocation and risk exposure management.
Summary of Derivative Instruments:
The following table presents the effect of derivative instruments on the Statement of Assets and Liabilities, categorized by risk exposure, as of December 31, 2018.
| | | Assets | | Liabilities | |
| | | Variation
Margin
Receivable on
Open Futures
Contracts* | | Variation
Margin
Receivable on
Open Swap
Agreements* | | Variation
Margin
Payable on
Open Futures
Contracts* | | Variation
Margin
Payable on
Open Swap
Agreements* | |
Credit Risk Exposure | | $ | — | | | $ | — | | | $ | — | | | $ | 1,482,494 | | |
Interest Rate Risk Exposure | | | 693,531 | | | | — | | | | — | | | | — | | |
*Includes cumulative appreciation (depreciation) of futures contracts and centrally cleared swap agreements as reported in the Schedule of Investments. Only current day's variation margin is reported within the Statement of Assets and Liabilities.
The following table presents the effect of derivative instruments on the Statement of Operations, categorized by risk exposure, for the year ended December 31, 2018.
| | | Net Realized Gains (Losses)
on Derivatives Recognized
as a Result from Operations | | Net Change in Unrealized
Appreciation/Depreciation
on Derivatives Recognized
as a Result of Operations | |
| | | Net Realized
Gains (Losses)
from Futures
Transactions | | Net Realized
Gains (Losses)
from Swap
Transactions | | Net Change in
Unrealized
Appreciation/
Depreciation
on Futures
Transactions | | Change in
Net Unrealized
Appreciation/
Depreciation
on Swap
Transactions | |
Credit Risk Exposure | | $ | — | | | $ | 1,036,524 | | | $ | — | | | $ | (1,619,834 | ) | |
Interest Rate Risk Exposure | | | (765,169 | ) | | | — | | | | 786,412 | | | | — | | |
All open derivative positions at period end are reflected on the Fund's Schedule of Portfolio Investments. The associated volume of derivative positions in the Fund was 32% based on average monthly notional amounts in comparison to net assets during the year ended December 31, 2018.
Investment Transactions and Related Income:
Changes in holdings of investments are accounted for no later than one business day following the trade date. For financial reporting purposes, however, investment transactions are accounted for on trade date on the last business day of the reporting period. Interest income is recognized on an accrual
23
Victory Variable Insurance Funds | | Notes to Financial Statements — continued
December 31, 2018 | |
basis and includes, where applicable, the amortization of premiums or accretion of discounts. Dividend income is recorded on the ex-dividend date. Gains or losses realized on sales of securities are determined by comparing the identified cost of the security lot sold with the net sales proceeds.
The Fund may receive other income from investment in loan assignments and/or unfunded commitments, including amendment fees, consent fees and commitment fees. These fees are recorded as income when received by the Fund. These amounts are included in Interest Income in the Statement of Operations.
Withholding taxes on interest, dividends and gains as a result of certain investments in ADRs by the Fund have been provided for in accordance with each investment's applicable country's tax rules and rates.
Securities Lending:
The Trust has entered into a Master Securities Lending Agreement ("MSLA") with Citibank, N.A. ("Citibank" or the "Agent"). Under the terms of the MSLA, the Fund may lend securities to certain broker-dealers and banks in exchange for collateral in the amount of at least 102% of the value of U.S. securities loaned or at least 105% of the value of non-U.S. securities loaned, marked-to-market daily. Any collateral shortfalls associated with increases in the valuation of the securities loaned are adjusted the next business day. The collateral can be received in the form of cash collateral and/or non-cash collateral. Non-cash collateral can include U.S. Government Securities, letters of credit and certificates of deposit. The cash collateral is invested in short-term instruments or cash equivalents as noted on the Fund's Schedule of Portfolio Investments. The Trust does not have effective control of the non-cash collateral and therefore it is not disclosed in the Fund's Schedule of Portfolio Investments. The Fund continues to benefit from interest or dividends on the securities loaned and may also earn a return from the collateral. The Fund pays various fees in connection with the investment of cash collateral. The Fund pays the Agent fees based on the investment income received from securities lending activities. Securities lending income is disclosed in the Fund's Statement of Operations. Although risk is mitigated by the collateral, the Fund could experience a delay in recovering its securities and possible loss of income or value if the borrower fails to return them.
Securities lending transactions are entered into by the Fund under the MSLA, which permits the Fund, under certain circumstances such as an event of default, to offset amounts payable by the Fund to the same counterparty against amounts receivable from the counterparty to create a net payment due to or from the Fund.
The following table is a summary of the Fund's securities lending transactions which are subject to offset under the MSLA as of December 31, 2018. These transactions are accounted for as secured borrowings with an overnight and continuous contractual maturity for cash collateral, and greater than overnight and continuous contractual maturity for non-cash collateral.
Gross
Amount of
Recognized
Assets
(Value of | | Value of
Cash | | Value of Non-cash Collateral
Received by Maturity | | | |
Securities
on Loan) | | Collateral
Received | | <30 Days | | Between 30
& 90 Days | | >90 Days | | Net Amount | |
| $ | 294,455 | | | $ | 302,744 | | | $ | — | | | $ | — | | | $ | — | | | $ | 8,289 | | |
Dividends to Shareholders:
Dividends from net investment income, if any, are declared and paid annually by the Fund. Distributable net realized gains, if any, are declared and distributed at least annually.
The amounts of dividends from net investment income and distributions from net realized gains are determined in accordance with federal income tax regulations, which may differ from GAAP. To the extent these "book/tax" differences are permanent in nature (e.g., net operating loss, distributions
24
Victory Variable Insurance Funds | | Notes to Financial Statements — continued
December 31, 2018 | |
reclassification, and deemed distribution due to shareholder redemption), such amounts are reclassified within the components of net assets based on their federal tax-basis treatment; temporary differences (e.g., wash sales) do not require reclassification. To the extent dividends and distributions exceed net investment income and net realized gains for tax purposes, they are reported as distributions of capital. Net investment losses incurred by the Fund may be reclassified as an offset to capital on the accompanying Statement of Assets and Liabilities.
As of December 31, 2018, on the Statement of Assets and Liabilities, there were no permanent book-to-tax difference reclassification adjustments.
Federal Income Taxes:
It is the policy of the Fund to continue to qualify as a regulated investment company by complying with the provisions available to certain investment companies, as defined in applicable sections of the Internal Revenue Code, and to make distributions of net investment income and net realized gains sufficient to relieve it from all, or substantially all, federal income taxes. Accordingly, no provision for federal income taxes is required in the financial statements. The Fund has a tax year end of December 31.
Management of the Fund has reviewed tax positions taken in tax years that remain subject to examination by all major tax jurisdictions, including federal (i.e., the last four tax year ends and the interim tax period since then). Management believes that there is no tax liability resulting from unrecognized tax benefits related to uncertain tax positions taken.
Allocations:
Expenses directly attributable to the Fund are charged to the Fund, while expenses which are attributable to more than one fund in the Trust, or jointly with an affiliated trust, are allocated among the respective funds in the Trust and/or affiliated trust based upon net assets or another appropriate basis.
Affiliated Securities Transactions:
Pursuant to Rule 17a-7 under the 1940 Act, the Fund may engage in securities transactions with affiliated investment companies and advisory accounts managed by the Adviser and any applicable sub-adviser. Any such purchase or sale transaction must be effected without brokerage commission or other remuneration, except for customary transfer fees. The transaction must be effected at the current market price, which is either the security's last sale price on an exchange or, if there are no transactions in the security that day, at the average of the highest bid and lowest asked price. For the year ended December 31, 2018, the Fund did not engage in any Rule 17a-7 transactions under the 1940 Act.
3. Purchases and Sales of Securities:
Purchases and sales of securities (excluding securities maturing less than one year from acquisition) for the year ended December 31, 2018 were as follows for the Fund:
Purchases
(excluding U.S.
Government
Securities) | | Sales
(excluding U.S.
Government
Securities) | | Purchases
of U.S.
Government
Securities | | Sales
of U.S.
Government
Securities | |
| $ | 88,115,001 | | | $ | 114,247,624 | | | $ | 55,821,985 | | | $ | 67,013,504 | | |
4. Fees and Transactions with Affiliates and Related Parties:
Investment advisory services are provided to the Fund by Victory Capital Management Inc. ("VCM" or the "Adviser"), a New York corporation registered as an investment adviser with the Securities and Exchange Commission ("SEC"). The Adviser is a wholly-owned indirect subsidiary of Victory Capital Holdings Inc., a publicly traded Delaware corporation, and a wholly-owned direct subsidiary of Victory Capital Operating, LLC.
25
Victory Variable Insurance Funds | | Notes to Financial Statements — continued
December 31, 2018 | |
Under the terms of the Investment Advisory Agreement, the Adviser is entitled to receive 0.45% of the average daily net assets of the Fund. The Adviser may use its resources to assist with the Fund's distribution and marketing expenses.
VCM also serves as the Fund's administrator and fund accountant. Under an Administration and Fund Accounting Agreement, VCM is paid for its services an annual fee at a rate of 0.08% of the first $15 billion in average daily net assets of the Trust, Victory Portfolios and Victory Portfolios II (collectively, the "Trusts"), 0.05% of the average daily net assets above $15 billion to $30 billion of the Trusts and 0.04% of the average daily net assets over $30 billion of the Trusts.
Citi Fund Services Ohio, Inc. ("Citi"), an affiliate of Citibank N.A., acts as sub-administrator and sub-fund accountant to the Fund pursuant to a Sub-Administration and Sub-Fund Accounting Services Agreement between VCM and Citi. VCM pays Citi a fee for providing these services. The Trust reimburses VCM and Citi for all of their reasonable out-of-pocket expenses incurred in providing these services.
FIS Investor Services, LLC ("FIS") serves as the Fund's transfer agent. Under the Transfer Agent Agreement, the Trust pays FIS a fee for its services and reimburses FIS for all of their reasonable out-of-pocket expenses incurred in providing these services.
The Chief Compliance Officer ("CCO") is an employee of the Adviser, which pays the compensation of the CCO and his support staff. The Trust has entered into an Agreement to provide compliance services with the Adviser, pursuant to which the Adviser furnishes its compliance personnel, including the services of the CCO, and other resources reasonably necessary to provide the Trust with compliance oversight services related to the design, administration and oversight of a compliance program for the Trust in accordance with Rule 38a-1 under the 1940 Act. Funds in the Trust, Victory Portfolios, Victory Institutional Funds, and Victory Portfolios II (collectively, the "Victory Funds Complex"), in the aggregate, compensate the Adviser for these services.
The Victory Funds Complex pays an annual retainer to each Independent Trustee, plus an additional annual retainer to the Chairman of the Board. The aggregate amount of the fees and expenses of the Independent Trustees are allocated amongst all the funds in the Victory Funds Complex and are presented in the Statement of Operations.
Shearman & Sterling LLP provides legal services to the Trust.
Victory Capital Advisers, Inc. (the "Distributor"), an affiliate of the Adviser, serves as distributor for the continuous offering of the shares of the Fund pursuant to a Distribution Agreement between the Distributor and the Trust.
The Adviser has entered into an expense limitation agreement with the Fund until at least April 30, 2019. Under the terms of the agreement, the Adviser has agreed to waive fees or reimburse certain expenses to the extent that ordinary operating expenses incurred by certain classes of the Fund in any fiscal year exceed the expense limit for such classes of the Fund. Such excess amounts will be the liability of the Adviser. Interest, taxes, brokerage commissions, other expenditures which are capitalized in accordance with GAAP, and other extraordinary expenses not incurred in the ordinary course of a Fund's business are excluded from the expense limits. For the year ended December 31, 2018, the expense limit (excluding voluntary waivers) is 0.53%.
The Fund has agreed to repay fees and expenses that were waived or reimbursed by the Adviser for a period up to three fiscal years after such waiver or reimbursement was made to the extent such payments or repayments would not cause the expenses of a class to exceed the original expense limitation in place at the time of the waiver or reimbursement or any expense limitation agreement in place at the time of repayment. As of December 31, 2018, the following amounts are available to be repaid to the Adviser. Amounts repaid to the Adviser during the year ended, if any, are reflected on the Statement of Operations as "Recoupment of prior expenses waived/reimbursed by Adviser".
Expires
12/31/2019 | | Expires
12/31/2020 | | Expires
12/31/2021 | |
| $ | 1,866 | | | $ | 132,033 | | | $ | 155,683 | | |
26
Victory Variable Insurance Funds | | Notes to Financial Statements — continued
December 31, 2018 | |
The Adviser may voluntarily waive or reimburse additional fees to assist the Fund in maintaining a competitive expense ratio. Voluntary waivers and reimbursements applicable to the Fund are not available to be recouped at a future time. There were no voluntary waivers or reimbursements for the year ended December 31, 2018.
Certain officers and/or interested trustees of the Fund are also officers and/or employees of the Adviser, Administrator, Fund Accountant, Sub-Administrator, Sub-Fund Accountant, and Legal.
5. Risks:
The Fund may be subject to other risks in addition to these identified risks.
An investment in the Fund's shares represents an indirect investment in the securities owned by the Fund, some of which will be traded on a national securities exchange or in the over-the-counter markets. The value of the securities in which the Fund invests, like other market investments, may move up or down, sometimes rapidly and unpredictably. The value of the securities in which the Fund invests may affect the value of the Fund's shares. An investment in the Fund's shares at any point in time may be worth less than the original investment, even after taking into account the reinvestment of the Fund's distributions.
The Fund will be subject to credit risk with respect to the amount it expects to receive from counterparties for financial instruments entered into by the Fund. The Fund may be negatively impacted if a counterparty becomes bankrupt or otherwise fails to perform its obligations due to financial difficulties. The Fund may experience significant delays in obtaining any recovery in bankruptcy or other reorganization proceeding and the Fund may obtain only limited recovery or may obtain no recovery in such circumstances. The Fund typically enters into transactions with counterparties whose credit ratings are investment grade, as determined by a nationally recognized statistical rating organization or, if unrated, judged by the Adviser to be of comparable quality.
The Fund will be subject to credit and interest rate risk with respect to fixed income securities. Credit risk refers to the ability of an issuer to make timely payments of interest and principal. Interest rates may rise or the rate of inflation may increase, impacting the value of investments in fixed income securities. A debt issuers' credit quality may be downgraded or an issuer may default. Interest rates may fluctuate due to changes in governmental fiscal policy initiatives and resulting market reaction to those initiatives.
6. Borrowing and Interfund Lending:
Line of Credit:
The Victory Funds Complex participates in a short-term, demand note "Line of Credit" agreement with Citibank. Under the agreement with Citibank, the Victory Funds Complex may borrow up to $250 million, of which $100 million is committed and $150 million is uncommitted. $40 million of the Line of Credit is reserved for use by the Victory Floating Rate Fund, another series of the Victory Funds Complex, with that Fund paying the related commitment fees for that amount. The purpose of the agreement is to meet temporary or emergency cash needs, including redemption requests that might otherwise require the untimely disposition of securities. The current agreement was amended on July 27, 2018 with a new termination date of July 26, 2019. Citibank receives an annual commitment fee of 0.15% on $100 million for providing the Line of Credit. For the year ended December 31, 2018, Citibank earned approximately $150,000 in commitment fees from the Victory Funds Complex. Each fund in the Victory Funds Complex pays a pro-rata portion of the commitment fees plus any interest on amounts borrowed. Interest accrued by the Fund during the period is presented on the Statement of Operations under Interest expense on line of credit.
The Fund did not utilize or participate in the Line of Credit during the year ended December 31, 2018.
27
Victory Variable Insurance Funds | | Notes to Financial Statements — continued
December 31, 2018 | |
Interfund Lending:
The Trust and Adviser rely on an exemptive order granted by the SEC in March 2017 (the "Order"), permitting the establishment and operation of an Interfund Lending Facility (the "Facility"). The Facility allows the Fund to directly lend and borrow money to or from any other Victory Fund relying upon the Order at rates beneficial to both the borrowing and lending funds. Advances under the Facility are allowed for temporary or emergency purposes, including the meeting of redemption requests that otherwise might require the untimely disposition of securities, and are subject to each Fund's borrowing restrictions. The interfund loan rate is determined, as specified in the Order, by averaging the current repurchase agreement rate and the current bank loan rate. Interest accrued by the Fund during the period is presented on the Statement of Operations under Interest expense on interfund lending.
The Fund did not utilize or participate in the Facility during the year ended December 31, 2018.
7. Federal Income Tax Information:
The tax character of distributions paid during the tax years ended, as noted below, were as follows (total distributions paid may differ from the Statements of Changes in Net Assets because, for tax purposes, dividends are recognized when actually paid).
| | | Year Ended December 31, 2018 | |
| | | Distributions paid from | |
| | | Ordinary
Income | | Net
Long-Term
Capital Gains | | Total
Distributions
Paid | |
| | | | | $ | 1,374,411 | | | $ | — | | | $ | 1,374,411 | | |
| | | Year Ended December 31, 2017 | |
| | | Distributions paid from | |
| | | Ordinary
Income | | Net
Long-Term
Capital Gains | | Total
Distributions
Paid | |
| | | | | $ | 4,147,757 | | | $ | — | | | $ | 4,147,757 | | |
As of the tax year ended December 31, 2018, the components of accumulated earnings (deficit) on a tax basis were as follows:
Undistributed
Ordinary
Income | | Undistributed
Long-Term
Capital Gains | | Accumulated
Earnings | | Accumulated
Capital and
Other
Losses | | Unrealized
Appreciation
(Depreciation)* | | Total
Accumulated
Earnings
(Deficit) | |
| $ | 5,011,777 | | | $ | — | | | $ | 5,011,777 | | | $ | (5,226,542 | ) | | $ | (2,736,224 | ) | | $ | (2,950,989 | ) | |
*The difference between the book-basis and tax-basis unrealized appreciation (depreciation) is attributable primarily to tax deferral of losses on wash sales.
As of the tax year ended December 31, 2018, the Fund has short term and long term capital loss carryforwards of $1,492,605 and $3,733,937 respectively that are not subject to expiration.
During the tax year ended December 31, 2018, the Fund did not utilize capital loss carryforwards.
As of December 31, 2018, the cost basis for federal income tax purposes, gross unrealized appreciation, gross unrealized depreciation and net unrealized appreciation (depreciation) for investments were as follows:
Cost of
Investments
for Federal
Tax Purposes | | Gross
Unrealized
Appreciation | | Gross
Unrealized
Depreciation | | Net
Unrealized
Appreciation
(Depreciation) | |
| $ | 260,971,119 | | | $ | 495,019 | | | $ | (3,231,243 | ) | | $ | (2,736,224 | ) | |
28
Victory Variable Insurance Funds | | Notes to Financial Statements — continued
December 31, 2018 | |
8. Capital Contribution from Prior Custodian:
During 2016, the Fund received notification from the Fund's prior custodian, State Street Bank and Trust ("State Street"), concerning issues related to billing on certain categories of expenses during the approximately 16-year period from 1998 through October 31, 2014. The over-billing primarily related to categories of expenses that involved an allocation of general costs among multiple clients.
State Street paid the refunded amounts during January 2017. Based on billing information received during 2016 from State Street and an analysis of any expense limitation agreements that were in place during the period of the activities in question, including the application of any recoupment provisions in such agreements, the Adviser received a portion of the refund.
The portion of the refund retained by the Fund was accounted for as a capital contribution and is reflected on the Financial Highlights as "Capital Contribution from Prior Custodian, Net".
9. Fund Ownership:
Ownership of more than 25% of the voting securities of a fund creates presumptions of control of the fund under section 2(a)(9) of the 1940 Act. As of December 31, 2018, the shareholders listed below held more than 25% of the shares outstanding of the Fund and may be deemed to control the Fund.
| Shareholder | | Percent | |
| GIAC | | | 100.0 | % | |
10. Recent Accounting Pronouncements:
In October 2016, the SEC released its Final Rules on Investment Company Reporting Modernization (the "Rules"). The Rules introduced two new regulatory reporting forms for investment companies, Form N-PORT and Form N-CEN. The Fund's compliance date for Form N-PORT was June 1, 2018, and the Fund will make its initial filing with the SEC on Form N-PORT for the period ending March 31, 2019. Effective with the period ended June 30, 2018, the Fund was required to maintain, and make available to the SEC upon request, the information required to be included in Form N-PORT. Form N-PORT will replace Form N-Q filings effective with the requirement to file the Form N-PORT with the SEC for the period ending March 31, 2019. The Fund's compliance date for Form N-CEN was June 1, 2018, and the Fund will make its initial filing on Form N-CEN for the period ended December 31, 2018. Form N-CEN will replace Form N-SAR filings. The Fund's adoption of these amendments have no effect on the Fund's net assets or results of operations.
In March 2017, the Financial Accounting Standards Board ("FASB") issued Accounting Standards Update ("ASU") No. 2017-08 "Premium Amortization on Purchased Callable Debt Securities" ("ASU 2017-08"), which shortens the premium amortization period for purchased non-contingently callable debt securities. ASU 2017-08 specifies that the premium amortization period ends at the earliest call date, for purchased non-contingently callable debt securities. ASU 2017-08 is effective for fiscal years, and interim periods within those fiscal years, beginning after December 15, 2018. Management does not believe that adoption of ASU 2017-08 will materially impact the Fund's financial statements.
In August 2018, the FASB issued ASU No. 2018-13, "Fair Value Measurements" ("ASU 2018-13"). This update makes certain removals from, changes to and additions to existing disclosure requirements for fair value measurements. ASU 2018-13 does not change fair value measurements already required or permitted by existing standards. ASU 2018-13 is effective for financial statements issued for fiscal years beginning after December 15, 2019, and interim periods within those fiscal years. As permitted, the Fund has early adopted ASU 2018-13 with the financial statements prepared as of December 31, 2018.
In August 2018, the SEC adopted amendments to certain financial statement disclosure requirements to conform them to GAAP for investment companies. These amendments made certain disclosure requirements effective under Regulation S-X. The Fund's adoption of these amendments, effective with the financial statements prepared as of December 31, 2018 had no effect on the Fund's net assets or results of operations. As a result of adopting these amendments, the distributions to shareholders in
29
Victory Variable Insurance Funds | | Notes to Financial Statements — continued
December 31, 2018 | |
the December 31, 2017 Statements of Changes in Net Assets presented herein have been reclassified to conform to the current year presentation, which includes all distributions to each class of shareholders, other than tax basis return of capital distributions, in one line item per share class. Distributions to shareholders for the year ended December 31, 2017 from net investment income and net realized gains in the Fund were as follows:
Distributions to Shareholders:
From net investment income: | | $ | (4,147,757 | ) | |
From net Realized Gains: | | | — | | |
11. Subsequent Events:
The Fund has evaluated the need for additional disclosures or adjustments resulting from subsequent events through the date these financial statements were issued. Based on this evaluation, there were no subsequent events to report that would have a material impact on the Fund's financial statements.
30
REPORT OF INDEPENDENT REGISTERED PUBLIC ACCOUNTING FIRM
To the Shareholders and the Board of Trustees of Victory INCORE Low Duration Bond VIP Series
Opinion on the Financial Statements
We have audited the accompanying statement of assets and liabilities of Victory INCORE Low Duration Bond VIP Series (the "Fund") (one of the funds constituting the Victory Variable Insurance Funds (the "Trust")), including the portfolio of investments, as of December 31, 2018, and the related statement of operations for the year then ended, the statements of changes in net assets for each of the two years in the period then ended, the financial highlights for each of the three years in the period then ended and the related notes (collectively referred to as the "financial statements"). In our opinion, the financial statements present fairly, in all material respects, the financial position of the Fund (one of the funds constituting the Trust) at December 31, 2018, and the results of its operations for the year then ended, the changes in its net assets for each of the two years in the period then ended and its financial highlights for each of the three years in the period then ended, in conformity with U.S. generally accepted accounting principles.
The financial highlights of the Fund for each of the periods presented through December 31, 2015 were audited by other auditors, whose report dated February 22, 2016 expressed an unqualified opinion on those financial highlights.
Basis for Opinion
These financial statements are the responsibility of the Trust's management. Our responsibility is to express an opinion on the Fund's financial statements based on our audits. We are a public accounting firm registered with the Public Company Accounting Oversight Board (United States) (PCAOB) and are required to be independent with respect to the Trust in accordance with the U.S. federal securities laws and the applicable rules and regulations of the Securities and Exchange Commission and the PCAOB.
We conducted our audits in accordance with the standards of the PCAOB. Those standards require that we plan and perform the audit to obtain reasonable assurance about whether the financial statements are free of material misstatement, whether due to error or fraud. The Trust is not required to have, nor were we engaged to perform, an audit of the Trust's internal control over financial reporting. As part of our audit we are required to obtain an understanding of internal control over financial reporting but not for the purpose of expressing an opinion on the effectiveness of the Trust's internal control over financial reporting. Accordingly, we express no such opinion.
Our audits included performing procedures to assess the risks of material misstatement of the financial statements, whether due to error or fraud, and performing procedures that respond to those risks. Such procedures included examining, on a test basis, evidence regarding the amounts and disclosures in the financial statements. Our procedures included confirmation of securities owned as of December 31, 2018, by correspondence with the custodian, transfer agent, and brokers or by other appropriate auditing procedures where replies from brokers were not received. Our audits also included evaluating the accounting principles used and significant estimates made by management, as well as evaluating the overall presentation of the financial statements. We believe that our audits provide a reasonable basis for our opinion.

We have served as the auditor of one or more Victory Capital's investment companies since 1995.
Cincinnati, Ohio
February 15, 2019
31
Victory Variable Insurance Funds | | Supplemental Information
December 31, 2018 | |
(Unaudited)
Trustee and Officer Information
Board of Trustees:
Overall responsibility for management of the Trust rests with the Board. The Trust is managed by the Board in accordance with the laws of the State of Delaware. There are currently ten Trustees, nine of whom are not "interested persons" of the Trust within the meaning of that term under the 1940 Act ("Independent Trustees") and one of whom is an "interested person" of the Trust within the meaning of that term under the 1940 Act ("Interested Trustee"). The Trustees, in turn, elect the officers of the Trust to actively supervise its day-to-day operations.
The following tables list the Trustees, their ages, position with the Trust, commencement of service, principal occupations during the past five years and any directorships of other investment companies or companies whose securities are registered under the Securities Exchange Act of 1934, as amended, or who file reports under that Act. Each Trustee oversees nine portfolios in the Trust, one portfolio in Victory Institutional Funds, 42 portfolios in Victory Portfolios and 20 portfolios in Victory Portfolios II, each a registered investment company that, together with the Trust, comprise the Victory Funds Complex. Each Trustee's address is c/o Victory Variable Insurance Funds, 4900 Tiedeman Road, 4th Floor, Brooklyn, Ohio 44144. Each Trustee has an indefinite term.
Name and Age | | Position
Held with
the Trust | | Date
Commenced
Service | | Principal Occupation
During Past 5 Years | | Other
Directorships
Held During
Past 5 Years | |
Independent Trustees. | |
David Brooks Adcock, 67 | | Trustee | | February 2005 | | Consultant (since 2006). | | Chair and Trustee, Turner Funds (December 2016-December 2017). | |
Nigel D.T. Andrews, 71 | | Vice Chair and Trustee | | August 2002 | | Retired. | | Director, TCG BDC II, Inc. (since 2017);
Director, TCG BDC I, Inc. (formerly Carlyle GMS Finance, Inc.)
(since 2012); Director, Old Mutual US Asset Management (2002-2014). | |
E. Lee Beard, 67* | | Trustee | | February 2005 | | Retired (since 2015); Consultant, The Henlee Group, LLC (consulting) (2005-2015). | | None. | |
Dennis M. Bushe, 75 | | Trustee | | July 2016 | | Retired. | | Trustee, RS Investment Trust and RS Variable Products Trust (November 2011-July 2016). | |
32
Victory Variable Insurance Funds | | Supplemental Information — continued
December 31, 2018 | |
(Unaudited)
Name and Age | | Position
Held with
the Trust | | Date
Commenced
Service | | Principal Occupation
During Past 5 Years | | Other
Directorships
Held During
Past 5 Years | |
Sally M. Dungan, 64 | | Trustee | | February 2011 | | Chief Investment Officer, Tufts University (since 2002). | | None. | |
John L. Kelly, 65 | | Trustee | | February 2015 | | Partner, McCarvill Capital Partners (September 2016-September 2017); Advisor (January 2016-April 2016) and Managing
Partner (August 2014- January 2016), Endgate
Commodities LLC; Chief
Operating Officer, Liquidnet
Holdings, Inc. (2011-2014). | | Director, Caledonia Mining Corporation (since May 2012). | |
David L. Meyer, 61* | | Trustee | | December 2008 | | Retired. | | None. | |
Gloria S. Nelund, 57 | | Trustee | | July 2016 | | Chair, CEO and Co-Founder of TriLinc Global, LLC, an investment firm. | | TriLinc Global Impact Fund, LLC (since 2012); Trustee, RS Investment Trust and RS Variable Products Trust (November 2007-July 2016). | |
Leigh A. Wilson, 74 | | Chair and Trustee | | February 1998 | | Private Investor. | | Chair (since 2013), Caledonia Mining Corporation. | |
Interested Trustee. | |
David C. Brown, 46** | | Trustee | | May 2008 | | Chairman and Chief Executive Officer (since 2013), Co-Chief Executive Officer (2011-2013), the Adviser; Chairman and Chief Executive Officer, Victory Capital Holdings, Inc. (since 2013). | | None. | |
* The Board has designated Mr. Meyer and Ms. Beard as its Audit Committee Financial Experts.
** Mr. Brown is an "Interested Person" by reason of his relationship with the Adviser.
The Statement of Additional Information includes additional information about the Trustees of the Trust and is available, without charge, by calling 800-539-3863.
33
Victory Variable Insurance Funds | | Supplemental Information — continued
December 31, 2018 | |
(Unaudited)
Officers:
The officers of the Trust, their ages, commencement of service and their principal occupations during the past five years, are detailed in the following table. Each officer serves until the earlier of his or her resignation, removal, retirement, death, or the election of a successor. The mailing address of each officer of the Trust is 4900 Tiedeman Road, 4th Floor, Brooklyn, Ohio 44144. The officers of the Trust receive no compensation directly from the Trust for performing the duties of their offices.
Name and Age | | Position with
the Trust | | Date
Commenced
Service | | Principal Occupation During Past 5 Years | |
Christopher K. Dyer, 57 | | President | | February 2006* | | Director of Mutual Fund Administration, the Adviser. | |
Scott A. Stahorsky, 49 | | Vice President | | December 2014 | | Manager, Fund Administration, the Adviser (since 2015); Senior Analyst, Fund Administration, the Adviser (prior to 2015). | |
Erin G. Wagner, 45 | | Secretary | | December 2014 | | Associate General Counsel, the Adviser (since 2013). | |
Allan Shaer, 53 | | Treasurer | | May 2017 | | Senior Vice President, Financial Administration, Citi Fund Services Ohio, Inc. (since 2016); Vice President, Mutual Fund Administration, JP Morgan Chase (2011-2016). | |
Christopher A. Ponte, 34 | | Assistant Treasurer | | December 2017 | | Manager, Fund Administration, the Adviser (since 2017); Senior Analyst, Fund Administration, the Adviser (prior to 2017); Chief Financial Officer, Victory Capital Advisers, Inc. (since 2018). | |
Colin Kinney, 45 | | Chief Compliance Officer | | July 2017 | | Chief Compliance Officer (since 2013) and Chief Risk Officer (2009-2017), the Adviser. | |
Chuck Booth, 58 | | Anti-Money Laundering Compliance Officer and Identity Theft Officer | | May 2015 | | Director, Regulatory Administration and CCO Support Services, Citi Fund Services Ohio, Inc. | |
Jay G. Baris, 65 | | Assistant Secretary | | February 1998 | | Partner, Shearman & Sterling LLP (since 2018); Partner, Morrison & Foerster LLP (2011-2017). | |
* On December 3, 2014, Mr. Dyer resigned as Secretary of the Trust and accepted the position of President.
34
Victory Variable Insurance Funds | | Supplemental Information — continued
December 31, 2018 | |
(Unaudited)
Proxy Voting and Form N-Q Information
Proxy Voting:
Information regarding the policies and procedures that the Fund uses to determine how to vote proxies relating to portfolio securities is available without charge, upon request, by calling 800-539-3863. The information is also included in the Fund's Statement of Additional Information, which is available on the SEC's website at www.sec.gov.
Information relating to how the Fund voted proxies relating to portfolio securities held during the most recent twelve months ended June 30 is available on the SEC's website at www.sec.gov.
Availability of Schedules of Portfolio Investments:
The Trust expects to file a complete list of Schedules of Portfolio Investments with the SEC for the first and third quarter of each fiscal year on Form N-PORT beginning March 1, 2019. Prior to that date, the Trust has filed a complete list of Schedules of Portfolio Investments with the SEC for the first and third quarters of each fiscal year on Form N-Q. Forms N-PORT and Forms N-Q are available on the SEC's website at www.sec.gov.
Expense Examples
As a shareholder of the Fund, you may incur two types of costs: (1) transaction costs and (2) ongoing costs, including management fees, distribution and service (12b-1) fees, and other Fund expenses. These examples are intended to help you understand your ongoing costs (in dollars) of investing in the Fund and to compare these costs with the ongoing costs of investing in other mutual funds.
These examples are based on an investment of $1,000 invested at the beginning of the period and held for the entire period from July 1, 2018 through December 31, 2018.
The Actual Expense figures in the table below provide information about actual account values and actual expenses. You may use the information below, together with the amount you invested, to estimate the expenses that you paid over the period. Simply divide your account value by $1,000 (for example, an $8,600 account value divided by $1,000 = 8.6), then multiply the result by the number in the table under the heading entitled "Actual Expenses Paid During Period" to estimate the expenses you paid on your account during this period.
The Hypothetical Expense figures in the table below provide information about hypothetical account values and hypothetical expenses based on the Fund's actual expense ratio and an assumed rate of return of 5% per year before expenses, which is not the Fund's actual return. The hypothetical account values and expenses may not be used to estimate the actual ending account balance or expenses you paid for the period. You may use this information to compare this 5% hypothetical example with the 5% hypothetical examples that appear in shareholder reports of other funds.
Please note the expenses shown in the table are meant to highlight your ongoing costs only and do not reflect any transactional costs. Therefore, the table is useful in comparing ongoing costs only, and will not help you determine the relative total costs of owning different funds. In addition, if these transactional costs were included, your costs would have been higher.
Beginning
Account Value
7/1/18 | | Actual
Ending
Account Value
12/31/18 | | Hypothetical
Ending
Account Value
12/31/18 | | Actual
Expenses Paid
During Period
7/1/18-12/31/18* | | Hypothetical
Expenses Paid
During Period
7/1/18-12/31/18* | | Annualized
Expense Ratio
During Period
7/1/18-12/31/18 | |
| $ | 1,000.00 | | | $ | 1,007.20 | | | $ | 1,022.53 | | | $ | 2.68 | | | $ | 2.70 | | | | 0.53 | % | |
* Expenses are equal to the average account value multiplied by the Fund's annualized expense ratio multiplied by 184/365 (the number of days in the most recent fiscal half-year divided by the number of days in the fiscal year).
35
| Victory Variable Insurance Funds | | Supplemental Information — continued
December 31, 2018 | |
(Unaudited)
Considerations of the Board in Continuing the Investment Advisory Agreement (the "Agreement")
The Board approved the Agreement on behalf of the Series at a meeting, which was called for that purpose, on December 5, 2018. The Board also considered information relating to the Series and the Agreement provided throughout the year and, more specifically, at a meeting on October 23, 2018. The Board noted that prior to the Series' reorganization on July 29, 2016, the Series was managed by RS Investment Management Co. LLC, which was acquired by the Adviser on July 29, 2016. In considering whether to approve the Agreement, the Board requested, and the Adviser provided, information that the Board believed to be reasonably necessary to reach its conclusions. The Board, including the Independent Trustees, evaluated this information along with other information obtained throughout the year and was advised by legal counsel to the Series and by independent legal counsel to the Independent Trustees. In addition, in 2017 the Independent Trustees, through their counsel, retained an independent consultant to assist with a review of the overall process for conducting the annual review of these advisory arrangements. The Board considered the Series' advisory fee, expense ratio and investment performance as significant factors in determining whether the Agreement should be continued. In considering whether the compensation paid to the Adviser was fair and reasonable, the Board also evaluated, among other things, the following factors:
• The requirements of the Series for the services provided by the Adviser;
• The nature, quality and extent of the services provided and expected to be provided;
• The performance of the Series as compared to comparable funds;
• The fees payable for the services and whether the fee arrangements provided for economies of scale that would benefit Series shareholders as the Series grows;
• Whether the fee would be sufficient to enable the Adviser to attract and retain experienced personnel and continue to provide quality services to the Series;
• Fees paid by other clients of the Adviser whose accounts are managed in a similar investment style and any differences in the services provided to the other clients compared to those provided to the Series;
• Total expenses of the Series, taking into consideration any distribution or shareholder servicing fees;
• Management's commitment to operating the Series at competitive expense levels;
• The profitability of the Adviser (as reflected by comparing fees earned against an estimate of the Adviser's costs) with respect to the Adviser's relationship with the Series;
• Research and other service benefits received by the Adviser obtained through payment of client commissions for securities transactions;
• Other benefits received by the Adviser, and its affiliates, including revenues paid to the Adviser, or its affiliates, by the Series for administration and fund accounting services, and distribution;
• The capabilities and financial condition of the Adviser;
• Current economic and industry trends; and
• The historical relationship between the Series and the Adviser.
The Board reviewed the Series' current management fee, comprised of the advisory fee plus the administrative services fee paid to the Adviser, in the context of the Adviser's profitability of the Series. In addition, the Board compared the Series' total operating expense ratio on a net and gross basis, taking into consideration any distribution or shareholder servicing fees and management fees with a universe of comparable mutual funds compiled by an independent consultant, FUSE Research Network, LLC ("FUSE"), and a peer group of funds with similar investment strategies selected by FUSE from the universe. The Board reviewed the factors and methodology used by FUSE in the selection of the Series' peer group, including FUSE's selection of a broad universe of funds using the standard Retail Morningstar Categories, the more specific universe of comparable funds, and peer groups of funds with comparable investment strategies and asset levels, among other factors. The Board also reviewed any changes to FUSE's methodology as compared to the prior year, including as a result of input from the Adviser, if any. The Board also reviewed fees and other information related to the Adviser's management of similarly managed institutional or private accounts, and the differences in the services
36
Victory Variable Insurance Funds | | Supplemental Information — continued
December 31, 2018 | |
(Unaudited)
provided to the other accounts, to the extent applicable. The Board noted that the advisory fee arrangements for the Series do not include breakpoints, which are generally viewed as a method by which the investment adviser shares any economies of scale with a fund as a fund grows. The Board also considered the Adviser's commitment to limit expenses as discussed in more detail below.
The Board reviewed the Series' performance over one-, three-, five- and ten-year periods against the performance of the Series' selected peer group and benchmark index. The Board recognized that the performance of the Series and the peer group funds are net of expenses, while the performance of the benchmark index is gross returns. The Board considered the additional resources that the Adviser has committed to enhance portfolio analysis, compliance and trading systems.
The Board reviewed various other specific factors with respect to the Series, as described below. In their deliberations, the Trustees did not rank the importance of any particular information or factor considered and each Trustee may have attributed different weights to various factors.
The Board concluded that the Series' gross annual management fee was reasonable as compared to the median gross management fee charged to the funds in the Fund's peer group. The Board noted that the Series' net annual expense ratio, taking into account any shareholder servicing or distribution fees, was reasonable as compared to the median expense ratio for the peer group. The Board considered the Adviser's contractual agreement to waive its fees and reimburse expenses for a specified period of time, as described in the Series' prospectus. The Board then compared the Series' performance for the one-, three-, five- and ten-year periods ended June 30, 2018, to that of the median performance of the peer group and benchmark index for the same periods and considered the fact that the Series outperformed the benchmark index for all of the periods reviewed, underperformed the peer group for the three-year period, and outperformed the peer group for the one-, five- and ten-year periods.
Having considered, among other things: (1) that the Series' management fee was within the ranges of advisory fees charged to comparable mutual funds; (2) that the Series' total expense ratio was reasonable; (3) the Adviser's willingness to limit the expenses for a period of time would provide stability to the Series' expenses during that period; and (4) the performance of the Series, the Board concluded that the Agreement continued to be in the best interests of the Series' shareholders.
The Board noted that the Adviser's INCORE investment management team replaced the predecessor fund's investment sub-adviser as portfolio managers for the Series upon completion of the Series' reorganization.
Conclusion
Based on its review of the information requested and provided, and following extended discussions, the Board determined that the Agreement, on behalf of the Series, was consistent with the best interests of the Series and its shareholders, and the Board unanimously approved the Agreement, on behalf of the Series, for an additional annual period on the basis of the foregoing review and discussions and the following considerations, among others:
• The fairness and reasonableness of the investment advisory fee payable to the Adviser under the Agreement in light of the investment advisory services provided, the costs of these services, the profitability of the Adviser's relationship with the Series and the comparability of the fee paid to the fees paid by other investment companies;
• The nature, quality and extent of the investment advisory services provided by the Adviser;
• The Adviser's entrepreneurial commitment to the management of the Series and the creation of a broad-based family of funds, which could entail a substantial commitment of the Adviser's resources to the successful operation of the Series;
• The Adviser's representations regarding its staffing and capabilities to manage the Series, including the retention of personnel with relevant portfolio management experience;
• The Adviser's efforts to enhance investment results by, among other things, developing quality portfolio management teams; and
• The overall high quality of the personnel, operations, financial condition, investment management capabilities, methodologies and performance of the Adviser.
37
Privacy Policy
Protecting the Privacy of Information
The Trust respects your right to privacy. We also know that you expect us to conduct and process your business in an accurate and efficient manner. To do so, we must collect and maintain certain personal information about you. This is the information we collect from you on applications or other forms, and from the transactions you make with us or third parties. It may include your name, address, social security number, account transactions and balances, and information about investment goals and risk tolerance.
We do not disclose any information about you or about former customers to anyone except as permitted or required by law. Specifically, we may disclose the information we collect to companies that perform services on our behalf, such as the transfer agent that processes shareholder accounts and printers and mailers that assist us in the distribution of investor materials. We may also disclose this information to companies that perform marketing services on our behalf. This allows us to continue to offer you Victory investment products and services that meet your investing needs, and to effect transactions that you request or authorize. These companies will use this information only in connection with the services for which we hired them. They are not permitted to use or share this information for any other purpose.
To protect your personal information internally, we permit access only by authorized employees and maintain physical, electronic and procedural safeguards to guard your personal information.*
* You may have received communications regarding information about privacy policies from other financial institutions which gave you the opportunity to "opt-out" of certain information sharing with companies which are not affiliated with that financial institution. The Trust does not share information with other companies for purposes of marketing solicitations for products other than the Trust. Therefore, the Trust does not provide opt-out options to their shareholders.
Victory Funds
P.O. Box 182593
Columbus, Ohio 43218-2593

Visit our website at: | | Call Victory at: | |
www.vcm.com | | 800-539-FUND (800-539-3863) | |
VVIF-RS-ILDBVIP-AR (12/18)

December 31, 2018
Annual Report
Victory Variable Insurance Funds
Victory RS International VIP Series
Beginning on January 1, 2021, as permitted by regulations adopted by the Securities and Exchange Commission, paper copies of the Victory Funds' shareholder reports will no longer be sent by mail, unless you specifically request paper copies of the reports from the Victory Funds or from your financial intermediary, such as a broker-dealer or bank. Instead, the reports will be made available on www.VictoryFunds.com, and you will be notified by mail each time a report is posted and provided with a website link to access the report. If you already elected to receive shareholder reports electronically, you will not be affected by this change, and you need not take any action.
You may elect to receive shareholder reports and other communications from the Victory Funds or your financial intermediary electronically sooner than January 1, 2021 by notifying your financial intermediary directly or, if you are a direct investor, by calling 800-539-3863 or by sending an e-mail request to TA.Processing@FISGlobal.com.
You may elect to receive all future reports in paper free of charge. If you invest through a financial intermediary, you can contact your financial intermediary to request that you continue to receive paper copies of your reports. If you invest directly with the Victory Funds, you can call 800-539-3863 or send an e-mail request to TA.Processing@FISGlobal.com. Your election to receive reports in paper will apply to all Victory Funds you hold directly or through your financial intermediary.
www.vcm.com
News, Information And Education 24 Hours A Day, 7 Days A Week
The Victory Funds site gives fund shareholders, prospective shareholders, and investment professionals a convenient way to access fund information, get guidance, and track fund performance anywhere they can access the Internet. The site includes:
• Detailed performance records
• Daily share prices
• The latest fund news
• Investment resources to help you become a better investor
• A section dedicated to investment professionals
Whether you're a potential investor searching for the fund that matches your investment philosophy, a seasoned investor interested in planning tools, or an investment professional, www.vcm.com has what you seek. Visit us anytime. We're always open.
Victory Variable Insurance Funds
Table of Contents
Shareholder Letter (Unaudited) | | | 3 | | |
Fund Review and Commentary (Unaudited) | | | 4 | | |
Financial Statements | |
Schedule of Portfolio Investments | | | 8 | | |
Statement of Assets and Liabilities | | | 13 | | |
Statement of Operations | | | 14 | | |
Statements of Changes in Net Assets | | | 15 | | |
Financial Highlights | | | 16 | | |
Notes to Financial Statements | | | 17 | | |
Report of Ernst & Young LLP,
Independent Registered Public Accounting Firm | | | 26 | | |
Supplemental Information (Unaudited) | |
Trustee and Officer Information | | | 27 | | |
Proxy Voting and Form N-Q Information | | | 30 | | |
Expense Examples | | | 30 | | |
Additional Federal Income Tax Information | | | 31 | | |
Advisory Contract Renewal | | | 32 | | |
Privacy Policy (inside back cover) | | | |
The Fund is distributed by Victory Capital Advisers, Inc. Victory Capital Management Inc. is the investment adviser to the Fund and receives fees from the Fund for performing services for the Fund.
This report is not authorized for distribution to prospective investors unless preceded or accompanied by a current prospectus of the Fund.
For additional information about any Victory Fund, including fees, expenses, and risks, view our prospectus online at www.vcm.com or call 800-539-3863. Read it carefully before you invest or send money.
The information in this annual report is based on data obtained from recognized services and sources and is believed to be reliable. Any opinions, projections, or recommendations in this report are subject to change without notice and are not intended as individual investment advice. Past investment performance of the Fund, markets or securities mentioned herein should not be considered to be indicative of future results.
• NOT FDIC INSURED • NO BANK GUARANTEE
• MAY LOSE VALUE

Call Victory at:
800-539-FUND (800-539-3863)
Visit our website at:
www.vcm.com
1
This page is intentionally left blank.
2
Victory Funds Letter to Shareholders
Dear Shareholder,
What a difference a year makes. The year ended December 31, 2018, was marked by an abrupt return of volatility, which had largely been missing in action for years. Consider the range of highs and lows we witnessed. For the S&P 500 Index, it was a year in which we celebrated an all-time high in late summer, only to be followed by the worst December since the 2008 financial crisis. And if that wasn't enough volatility, the Dow Jones Industrial Average also registered several of its worst-ever, single-day point declines during 2018.
Through all that the S&P 500 clocked in with its first negative annual return since 2008, falling by 4.4 percent. Given the risk-off sentiment that was obvious as the year drew to a close, it's no surprise that small-cap stocks, as measured by the Russell 2000 Index, fared even worse, falling approximately 11.0 percent for the year. The challenges for equity investors were also evident around the world as the MSCI ACWI and Emerging Markets indexes declined 8.9 and 14.3 percent, respectively.
So what ushered in the renewed era of volatility and these challenging times? There were multiple culprits. For starters, trade tensions ratcheted up throughout the year as anti-global rhetoric bloomed into a series of new tariffs, which sparked concerns of a prolonged trade war with China. The Federal Reserve remained persistent in its monetary tightening, raising the benchmark interest rate four times throughout the year to a range of 2.25 to 2.5 percent. And then the year ended with a partial shutdown of the federal government. These factors conspired to elevate concerns of a possible recession here and abroad.
Yet despite the headline risks, we think it's critically important to remain focused on the data. By all accounts, the U.S. economy continued chugging along in 2018 with a real gross domestic product (GDP) rising 3.4 percent in the third quarter of 2018, the latest figures available from the Bureau of Economic Analysis. Moreover, the labor picture continues to shine with consistent monthly job growth and an unemployment rate of 3.9 percent. All this comes against a backdrop of low inflation and solid corporate earnings.
The markets, it appears, have been vacillating between the dire headlines and higher perceived risks on one hand, and the continued positive economic data on the other. Of course, no one knows where the Fed will stop raising rates, nor is there any certainty on how the trade turmoil ultimately gets resolved. For now, however, we continue to embrace our solid economic fundamentals. Moreover, we believe all of Victory Capital's independent investment franchises are well positioned to take advantage of any short-term valuation dislocations resulting from the current era of heightened volatility.
On the following pages, you will find information relating to your Victory Funds investment. If you have any questions, we encourage you to contact your financial advisor. Or, if you invest with us directly, you may call (800) 539-3863, or visit our website at www.vcm.com.
My colleagues and I sincerely appreciate the confidence you have placed in the Victory Funds, and we value the opportunity to help meet your investment goals.

Christopher K. Dyer, CFA
President,
Victory Funds
3
Victory Variable Insurance Funds
Victory RS International VIP Series
Portfolio Holdings
As a Percentage of Total Investments

Commentary
The Victory RS International VIP Series ("Fund") outperformed the MSCI EAFE Index (net) (the "Index") for the one-year period ended December 31, 2018. The Fund's positive relative performance was supported by many sectors, led by Consumer Staples, Materials and Health Care. The detracting sectors included Consumer Discretionary and Information Technology. The Fund seeks to provide long-term capital appreciation. The Fund's investment team employs both quantitative screening and fundamental analysis in seeking companies across the market capitalization spectrum that it believes can sustain long-term growth. Valuation is also an integral part of the investment process.
Market Overview
If ever the market lived up to its roller-coaster reputation, 2018 was the year. January saw an acceleration of prior year positive trends as international equities surged to post-recession highs, only to give it all back in February on the back of a spike in volatility not seen since August 2015. Trading hinted at weakness through the summer before plunging in the fall. All in, as measured by the Index, international equities finished the year down over 13%.
Identifying the precise catalyst for the market's change of heart is always difficult. The impact on the global economy from heightened tensions surrounding U.S./China trade negotiations have been mostly to blame. In the U.S., rising interest rates driven by a hawkish Federal Reserve, a tax cut hangover resulting in a larger fiscal deficit, and a partial federal government shutdown have raised investors' anxiety. The data itself has been mixed, if not supportive. However, the U.S. Treasury 2- to 5-year yield curve has inverted, suggesting the historically long current economic expansion may be coming to an end. At a minimum, investors are reminded that the recent era of easy money, low inflation, and steady growth, may be as good as it gets.
In China, domestic consumption has softened as seen by an unprecedented fifth straight month of negative passenger car sales. Investments are muted as well, driven by lack of funds in the public sector and extreme caution in the private sector. Exports appear most at risk having slowed dramatically in December with the potential to cause significant dislocations in the employment market should tariffs on goods into the U.S. rise to 25% as threatened by the current administration.
Adding to the dim view of global growth is Europe where a swath of concerns has bubbled to the surface. Chief among these are the status of Brexit and whether the Irish border remains open, rising populism in France due to a backlash against President Macron's tax policies, as well as Italy's budget crisis.
4
Victory Variable Insurance Funds
Victory RS International VIP Series (continued)
QVS Factor Performance
In this section, we offer insight into the factors driving market performance from a quantitative point of view. The team's proprietary QVS ("Quality, Value and Sentiment") Model scours the globe, screening over 10,000 companies looking for the best investment opportunities. It is designed to identify companies that have the potential to consistently create shareholder value, are reasonably valued and exhibit favorable market sentiment. We continually use this quantitative model to help us focus our resources and fundamental research on those companies with the highest probability of outperformance.
In 2018, all factors contributed positively to performance, though quality was the standout. We define quality companies as those able to demonstrate operating and management excellence, as well as superior capital allocation, so it came as no surprise to see this factor continue to perform. We continually use this quantitative model to help us focus our resources and fundamental research on those companies with the highest probability of outperformance.
Performance Update
The Fund was down -10.66%, for the twelve-month period ended December 31, 2018, outperforming its benchmark, the MSCI EAFE Index (net), which decreased -13.79%.
Portfolio Review
Strong results in the Consumer Staples sector were led by Royal Unibrew A/S. Royal Unibrew, a Scandinavian beverage distributor, as a continued and improving product mix led to market share gains in craft and specialty beers. In addition, revenue and earnings outlooks for Royal Unibrew got a boost due to the acquisition of Etablissements Geyer Frères, a French craft lemonade producer that focuses on organically sourced local products. The acquisition should establish a niche platform in France similar to their Italian operations.
Wolters Kluwer, an information and software solutions company based in the Netherlands, also positively contributed to the portfolio. The company's organic sales growth bested consensus estimates for the first half of the year, headlined by its Legal & Regulatory, Tax & Accounting, and Governance, Risk & Compliance segments. Wolters also declared stock buyback transactions in September, as part of the three-year buyback program originally announced in 2016. This program was subsequently expanded to include additional repurchases intended to mitigate dilution caused by non-core divestments made in 2017 and early 2018. The program also includes repurchases made to offset annual incentive share issuance and included similar events in both 2016 and 2017.
On the downside, both Wynn Macau and Melexis NV detracted from the portfolio's overall performance. Wynn Macau, a hotel and casino resort operator, grew gaming revenue 3% year-over-year, but that fell below most estimates of approximately 5% year-over-year. Moving forward, expectations for higher single digit growth should be aided by pent-up demand for the opening of several new VIP junket rooms in many of its casinos.
Melexis, which designs, develops, tests and markets advanced semiconductor devices, fell on fears of sector consolidation news, supply chain hiccups, and BMW's profit warning, which in combination, created the perfect storm for Melexis' share price. After the recent underperformance compared to its peers, the company's multiples are now in line with sector averages. Melexis used to trade at a premium as they are concentrating on the
5
Victory Variable Insurance Funds
Victory RS International VIP Series (continued)
fast-growing automotive semiconductor market which is expected to continue growing faster than both the automotive industry and the overall semiconductor market.
Outlook
We expect market volatility to continue in 2019 and will remain vigilant when constructing the portfolio, maintaining our sector and region neutrality. Making correct macro allocation calls can be immensely challenging, therefore, we do not forecast regional performance. In our view, stock selection and strong risk management protocols can be far more impactful to fund performance than allocation.
Investment Philosophy
The Victory RS International VIP Series is guided by our philosophy that positive investment outcomes can be attained through the use of a data-driven discipline in conjunction with a bottom-up approach to investing. Our proprietary research methodology, combined with a set of industry standard and team-generated global risk factors, seeks to capture information inefficiencies in the global equity markets. Our goal is to provide a consistent, diversified return stream over full market cycles while managing portfolio volatility.
6
Victory Variable Insurance Funds
Victory RS International VIP Series (continued)
Average Annual Return
Year Ended December 31, 2018
| | Class A | |
INCEPTION DATE | | 2/8/91 | |
| | | Net Asset
Value | | MSCI EAFE
Index (Net)1 | |
One Year | | | –10.66 | % | | | –13.79 | % | |
Three Year | | | 4.49 | % | | | 2.87 | % | |
Five Year | | | 1.73 | % | | | 0.53 | % | |
Ten Year | | | 8.06 | % | | | 6.32 | % | |
Since Inception | | | 6.66 | % | | | N/A | | |
Expense Ratios
Gross | | | 0.95 | % | |
With Applicable Waivers | | | 0.93 | % | |
Past performance is not indicative of future results. The performance data quoted represents past performance and current returns may be lower or higher. The investment return and principal value will fluctuate so that an investor's shares, when redeemed, may be worth more or less than the original cost. To obtain performance information current to the most recent month's end, please visit www.vcm.com.
The above expense ratios are from the Fund's prospectus dated May 1, 2018. Additional information pertaining to the Fund's expense ratios as of December 31, 2018 can be found in the financial highlights.
The total return figures set forth above include all waivers of fees for various periods since inception. Without such fee waivers, the total returns would have been lower. Some fee waivers are voluntary and may be modified or terminated at any time. The total returns do not include any insurance, sales or administrative charges of variable annuity or life insurance contracts. If these charges were included, the total returns would have been lower.
Victory RS International VIP Series — Growth of $10,000

1The MSCI EAFE Index (Europe, Australasia, and Far East) (Net) is a free float-adjusted market capitalization index that is designed to measure the equity market performance of developed markets, excluding the U.S. and Canada. The index reflects the reinvestment of dividends paid on the stocks constituting the index net of withholding taxes. You may not invest in the index and, unlike the Fund, the index does not incur fees or expenses. It is not possible to invest directly in an index.
The graph reflects investment of growth of a hypothetical $10,000 investment in the Fund. Past performance is no guarantee of future results.
The graph and table do not reflect the deduction of taxes that a shareholder would pay on Fund distributions or the redemption of Fund shares.
7
Victory Variable Insurance Funds
Victory RS International VIP Series | | Schedule of Portfolio Investments
December 31, 2018 | |
Security Description | | Shares | | Fair
Value(a) | |
Common Stocks (97.3%) | |
Australia (7.5%): | |
Financials (1.9%): | |
Macquarie Group Ltd. | | | 35,599 | | | $ | 2,726,163 | | |
Health Care (1.6%): | |
CSL Ltd. | | | 17,851 | | | | 2,331,166 | | |
Materials (2.0%): | |
BHP Billiton Ltd. | | | 116,215 | | | | 2,808,444 | | |
Real Estate (2.0%): | |
Scentre Group | | | 1,048,109 | | | | 2,880,819 | | |
| | | | 10,746,592 | | |
Belgium (0.5%): | |
Information Technology (0.5%): | |
Melexis NV | | | 12,965 | | | | 754,411 | | |
China (0.5%): | |
Communication Services (0.5%): | |
Tencent Holdings Ltd. | | | 18,000 | | | | 721,492 | | |
Denmark (1.0%): | |
Consumer Staples (1.0%): | |
Royal Unibrew A/S | | | 21,038 | | | | 1,453,869 | | |
France (7.9%): | |
Consumer Discretionary (2.9%): | |
Cie Generale des Etablissements Michelin | | | 17,871 | | | | 1,758,748 | | |
LVMH Moet Hennessy Louis Vuitton SA | | | 8,287 | | | | 2,425,903 | | |
| | | | 4,184,651 | | |
Energy (1.4%): | |
Total SA | | | 36,765 | | | | 1,938,910 | | |
Financials (1.6%): | |
AXA SA | | | 107,190 | | | | 2,313,049 | | |
Information Technology (1.5%): | |
Cap Gemini SA | | | 21,497 | | | | 2,137,908 | | |
Materials (0.5%): | |
Arkema SA | | | 8,428 | | | | 723,430 | | |
| | | | 11,297,948 | | |
Germany (7.7%): | |
Financials (2.2%): | |
Allianz SE | | | 15,668 | | | | 3,148,138 | | |
Health Care (0.6%): | |
Bayer AG | | | 13,016 | | | | 905,123 | | |
Industrials (2.0%): | |
Siemens AG | | | 15,039 | | | | 1,678,148 | | |
Washtec AG | | | 17,399 | | | | 1,203,935 | | |
| | | | 2,882,083 | | |
See notes to financial statements.
8
Victory Variable Insurance Funds
Victory RS International VIP Series | | Schedule of Portfolio Investments — continued
December 31, 2018 | |
Security Description | | Shares | | Fair
Value(a) | |
Information Technology (1.5%): | |
SAP SE | | | 21,161 | | | $ | 2,099,936 | | |
Real Estate (1.4%): | |
Vonovia SE | | | 44,261 | | | | 1,994,965 | | |
| | | | 11,030,245 | | |
Hong Kong (3.1%): | |
Financials (1.5%): | |
AIA Group Ltd. | | | 185,200 | | | | 1,538,520 | | |
BOC Hong Kong Holdings Ltd. | | | 149,500 | | | | 554,939 | | |
| | | | 2,093,459 | | |
Real Estate (1.3%): | |
CK Asset Holdings Ltd. | | | 243,000 | | | | 1,778,042 | | |
Utilities (0.3%): | |
HK Electric Investments & HK Electric Investments Ltd. | | | 470,000 | | | | 473,735 | | |
| | | | 4,345,236 | | |
Ireland (1.2%): | |
Industrials (1.2%): | |
Experian PLC | | | 71,774 | | | | 1,739,674 | | |
Italy (3.7%): | |
Financials (0.9%): | |
Banca Generali SpA | | | 63,196 | | | | 1,313,617 | | |
Health Care (0.7%): | |
Recordati SpA | | | 28,949 | | | | 1,002,374 | | |
Utilities (2.1%): | |
Enel SpA | | | 501,086 | | | | 2,904,522 | | |
| | | | 5,220,513 | | |
Japan (21.9%): | |
Communication Services (0.6%): | |
Nippon Telegraph & Telephone Corp. | | | 20,800 | | | | 848,742 | | |
Consumer Discretionary (4.4%): | |
Hikari Tsushin, Inc. | | | 6,800 | | | | 1,063,026 | | |
Toyota Motor Corp. | | | 70,200 | | | | 4,064,195 | | |
United Arrows Ltd. | | | 35,200 | | | | 1,121,764 | | |
| | | | 6,248,985 | | |
Consumer Staples (0.6%): | |
Matsumotokiyoshi Holdings Co. Ltd. | | | 30,100 | | | | 925,605 | | |
Financials (2.9%): | |
Jafco Co. Ltd. | | | 31,100 | | | | 985,331 | | |
Mitsubishi UFJ Financial Group, Inc. | | | 337,200 | | | | 1,655,088 | | |
Tokio Marine Holdings, Inc. | | | 32,300 | | | | 1,534,742 | | |
| | | | 4,175,161 | | |
See notes to financial statements.
9
Victory Variable Insurance Funds
Victory RS International VIP Series | | Schedule of Portfolio Investments — continued
December 31, 2018 | |
Security Description | | Shares | | Fair
Value(a) | |
Health Care (2.9%): | |
Hoya Corp. | | | 33,300 | | | $ | 2,008,266 | | |
Shionogi & Co. Ltd. | | | 36,400 | | | | 2,077,832 | | |
| | | | 4,086,098 | | |
Industrials (5.9%): | |
EN-Japan, Inc. | | | 33,600 | | | | 1,040,209 | | |
Fuji Electric Co. Ltd. | | | 57,500 | | | | 1,693,750 | | |
Hitachi Construction Machinery Co. Ltd. | | | 46,500 | | | | 1,088,306 | | |
ITOCHU Corp. | | | 52,700 | | | | 895,115 | | |
Kyowa Exeo Corp. | | | 61,900 | | | | 1,449,599 | | |
Okuma Corp. | | | 15,500 | | | | 737,896 | | |
Sanwa Holdings Corp. | | | 138,900 | | | | 1,577,274 | | |
| | | | 8,482,149 | | |
Information Technology (1.9%): | |
Fujitsu Ltd. | | | 15,500 | | | | 966,343 | | |
Oracle Corp. Japan | | | 20,100 | | | | 1,276,079 | | |
Ulvac, Inc. | | | 15,500 | | | | 447,545 | | |
| | | | 2,689,967 | | |
Materials (0.6%): | |
DIC Corp. (b) | | | 26,400 | | | | 807,775 | | |
Real Estate (0.9%): | |
Sumitomo Realty & Development | | | 33,200 | | | | 1,215,572 | | |
Utilities (1.2%): | |
Chubu Electric Power Co., Inc. | | | 119,800 | | | | 1,702,522 | | |
| | | | 31,182,576 | | |
Macau (0.9%): | |
Consumer Discretionary (0.9%): | |
Wynn Macau Ltd. | | | 553,600 | | | | 1,205,190 | | |
Netherlands (5.4%): | |
Communication Services (2.2%): | |
Koninklijke KPN NV | | | 1,041,171 | | | | 3,040,843 | | |
Financials (1.1%): | |
ING Groep NV | | | 147,003 | | | | 1,581,037 | | |
Industrials (2.1%): | |
Wolters Kluwer NV | | | 51,215 | | | | 3,011,399 | | |
| | | | 7,633,279 | | |
Norway (1.7%): | |
Energy (0.5%): | |
Aker BP ASA | | | 29,627 | | | | 747,496 | | |
Financials (1.2%): | |
SpareBank 1 SMN | | | 174,958 | | | | 1,707,598 | | |
| | | | 2,455,094 | | |
See notes to financial statements.
10
Victory Variable Insurance Funds
Victory RS International VIP Series | | Schedule of Portfolio Investments — continued
December 31, 2018 | |
Security Description | | Shares | | Fair
Value(a) | |
Russian Federation (0.5%): | |
Materials (0.5%): | |
Evraz PLC | | | 120,690 | | | $ | 738,930 | | |
Spain (2.4%): | |
Communication Services (1.5%): | |
Telefonica SA | | | 259,009 | | | | 2,179,885 | | |
Financials (0.9%): | |
Banco Santander SA | | | 271,236 | | | | 1,231,513 | | |
| | | | 3,411,398 | | |
Sweden (2.6%): | |
Industrials (2.6%): | |
Atlas Copco AB, Class B | | | 123,258 | | | | 2,702,281 | | |
Epiroc AB, Class B (c) | | | 119,405 | | | | 1,066,437 | | |
| | | | 3,768,718 | | |
Switzerland (9.8%): | |
Consumer Staples (3.1%): | |
Nestle SA, Registered Shares | | | 53,845 | | | | 4,371,990 | | |
Financials (0.9%): | |
UBS Group AG, Registered Shares | | | 102,843 | | | | 1,283,308 | | |
Health Care (5.8%): | |
Novartis AG | | | 45,148 | | | | 3,868,241 | | |
Roche Holding AG | | | 17,780 | | | | 4,415,840 | | |
| | | | 8,284,081 | | |
| | | | 13,939,379 | | |
United Kingdom (19.0%): | |
Consumer Discretionary (0.6%): | |
Next PLC | | | 16,760 | | | | 853,236 | | |
Consumer Staples (4.9%): | |
Britvic PLC | | | 174,837 | | | | 1,780,411 | | |
Diageo PLC | | | 66,959 | | | | 2,392,374 | | |
Unilever PLC | | | 52,832 | | | | 2,773,404 | | |
| | | | 6,946,189 | | |
Energy (3.4%): | |
| BP PLC | | | 340,111 | | | | 2,149,747 | | |
Royal Dutch Shell PLC, Class A | | | 90,350 | | | | 2,658,850 | | |
| | | | 4,808,597 | | |
Financials (4.1%): | |
Close Brothers Group PLC | | | 99,079 | | | | 1,818,027 | | |
HSBC Holdings PLC | | | 263,747 | | | | 2,175,511 | | |
Legal & General Group PLC | | | 610,032 | | | | 1,797,104 | | |
| | | | 5,790,642 | | |
Health Care (1.3%): | |
Smith & Nephew PLC | | | 103,452 | | | | 1,936,187 | | |
See notes to financial statements.
11
Victory Variable Insurance Funds
Victory RS International VIP Series | | Schedule of Portfolio Investments — continued
December 31, 2018 | |
Security Description | | Shares | | Fair
Value(a) | |
Industrials (1.5%): | |
RELX PLC | | | 103,081 | | | $ | 2,125,247 | | |
Materials (3.2%): | |
Croda International PLC | | | 26,605 | | | | 1,588,632 | | |
Rio Tinto PLC | | | 62,080 | | | | 2,972,706 | | |
| | | | 4,561,338 | | |
| | | | 27,021,436 | | |
Total Common Stocks (Cost $135,870,890) | | | 138,665,980 | | |
Preferred Stocks (1.6%) | |
Japan (1.6%): | |
Consumer Staples (1.6%): | |
Ito En Ltd. | | | 101,400 | | | | 2,226,636 | | |
Total Preferred Stocks (Cost $1,648,342) | | | 2,226,636 | | |
Total Investments (Cost $137,519,232) — 98.9% | | | 140,892,616 | | |
Other assets in excess of liabilities — 1.1% | | | 1,630,915 | | |
NET ASSETS — 100.00% | | $ | 142,523,531 | | |
(a) All securities were fair valued at December 31, 2018. See Note 2 for further information.
(b) All or a portion of this security is on loan.
(c) Non-income producing security.
PLC — Public Limited Company
See notes to financial statements.
12
Victory Variable Insurance Funds | | Statement of Assets and Liabilities
December 31, 2018 | |
| | | Victory RS International
VIP Series | |
ASSETS: | |
Investments, at value (Cost $137,519,232) | | $ | 140,892,616 | (a) | |
Cash and cash equivalents | | | 1,255,137 | | |
Interest and dividends receivable | | | 128,456 | | |
Receivable for capital shares issued | | | 2,216 | | |
Reclaims receivable | | | 497,913 | | |
Total Assets | | | 142,776,338 | | |
LIABILITIES: | |
Payable for capital shares redeemed | | | 103,170 | | |
Accrued expenses and other payables: | |
Investment advisory fees | | | 99,108 | | |
Administration fees | | | 7,554 | | |
Custodian fees | | | 7,334 | | |
Transfer agent fees | | | 59 | | |
Chief Compliance Officer fees | | | 298 | | |
Trustees' fees | | | 144 | | |
Other accrued expenses | | | 35,140 | | |
Total Liabilities | | | 252,807 | | |
NET ASSETS: | |
Capital | | | 129,850,883 | | |
Total distributable earnings/(loss) | | | 12,672,648 | | |
Net Assets | | $ | 142,523,531 | | |
Shares Outstanding (unlimited shares authorized, with a par value of
$0.001 per share): | | | 9,211,056 | | |
Net asset value: | | $ | 15.47 | | |
(a) Includes $799,697 of securities on loan.
See notes to financial statements.
13
Victory Variable Insurance Funds | | Statement of Operations
For the Year Ended December 31, 2018 | |
| | | Victory RS International
VIP Series | |
Investment Income: | |
Dividends | | $ | 5,753,945 | | |
Interest | | | 19,121 | | |
Securities lending (net of fees) | | | 24,927 | | |
Foreign tax withholding | | | (585,748 | ) | |
Total Income | | | 5,212,245 | | |
Expenses: | |
Investment advisory fees | | | 1,334,736 | | |
Administration fees | | | 99,924 | | |
Custodian fees | | | 31,250 | | |
Transfer agent fees | | | 438 | | |
Trustees' fees | | | 14,257 | | |
Chief Compliance Officer fees | | | 1,459 | | |
Legal and audit fees | | | 30,414 | | |
Other expenses | | | 53,340 | | |
Total Expenses | | | 1,565,818 | | |
Expenses waived/reimbursed by Adviser | | | (15,196 | ) | |
Net Expenses | | | 1,550,622 | | |
Net Investment Income (Loss) | | | 3,661,623 | | |
Realized/Unrealized Gains (Losses) from Investment Transactions: | |
Net realized gains (losses) from investment transactions and foreign
currency translations | | | 9,269,743 | | |
Net change in unrealized appreciation/depreciation on investments and
foreign currency translations | | | (30,264,562 | ) | |
Net realized/unrealized gains (losses) on investments | | | (20,994,819 | ) | |
Change in net assets resulting from operations | | $ | (17,333,196 | ) | |
See notes to financial statements.
14
Victory Variable Insurance Funds | | Statements of Changes in Net Assets | |
| | | Victory RS International VIP Series | |
| | | Year
Ended
December 31,
2018 | | Year
Ended
December 31,
2017 | |
From Investment Activities: | |
Operations: | |
Net investment income (loss) | | $ | 3,661,623 | | | $ | 3,483,803 | | |
Net realized gains (losses) from investment transactions | | | 9,269,743 | | | | 13,118,897 | | |
Net change in unrealized appreciation (depreciation) on
investments | | | (30,264,562 | ) | | | 24,614,558 | | |
Change in net assets resulting from operations | | | (17,333,196 | ) | | | 41,217,258 | | |
Distributions to Shareholders: (a) | |
Change in net assets resulting from distributions to shareholders | | | (2,621,141 | ) | | | (3,484,383 | ) | |
Change in net assets resulting from capital transactions | | | (19,040,351 | ) | | | (31,240,688 | ) | |
Change in net assets | | | (38,994,688 | ) | | | 6,492,187 | | |
Net Assets: | |
Beginning of period | | | 181,518,219 | | | | 175,026,032 | | |
End of period | | $ | 142,523,531 | | | $ | 181,518,219 | | |
Capital Transactions: | |
Proceeds from shares issued | | $ | 6,913,816 | | | $ | 3,665,763 | | |
Distributions reinvested | | | 2,621,141 | | | | 3,484,383 | | |
Cost of shares redeemed | | | (28,575,308 | ) | | | (38,390,834 | ) | |
Change in net assets resulting from capital transactions | | $ | (19,040,351 | ) | | $ | (31,240,688 | ) | |
Share Transactions: | |
Issued | | | 400,845 | | | | 220,823 | | |
Reinvested | | | 169,597 | | | | 198,427 | | |
Redeemed | | | (1,650,290 | ) | | | (2,356,133 | ) | |
Change in Shares | | | (1,079,848 | ) | | | (1,936,883 | ) | |
(a) Current and prior year distributions to shareholders have been reclassified and conform to amended GAAP presentation under Regulation S-X (See Item 10 in the Notes to Financial Statements).
See notes to financial statements.
15
Victory Variable Insurance Funds | | Financial Highlights | |
For a Share Outstanding Throughout Each Period
| | | Victory RS International VIP Series | |
| | | Year
Ended
December 31,
2018 | | Year
Ended
December 31,
2017 | | Year
Ended
December 31,
2016 | | Year
Ended
December 31,
2015 | | Year
Ended
December 31,
2014 | |
Net Asset Value, Beginning of Period | | $ | 17.64 | | | $ | 14.31 | | | $ | 14.39 | | | $ | 14.63 | | | $ | 17.26 | | |
Investment Activities: | |
Net investment income (loss) | | | 0.38 | (a) | | | 0.31 | (a) | | | 0.30 | (a) | | | 0.31 | (a) | | | 0.39 | | |
Net realized and unrealized gains
(losses) on investments | | | (2.26 | ) | | | 3.36 | | | | (0.10 | ) | | | (0.19 | ) | | | (1.30 | ) | |
Total from Investment Activities | | | (1.88 | ) | | | 3.67 | | | | 0.20 | | | | 0.12 | | | | (0.91 | ) | |
Distributions to Shareholders: | |
Net investment income | | | (0.15 | ) | | | (0.34 | ) | | | (0.31 | ) | | | (0.32 | ) | | | (0.35 | ) | |
Net realized gains from investments | | | (0.14 | ) | | | — | | | | — | | | | (0.04 | ) | | | (1.37 | ) | |
Total Distributions to Shareholders | | | (0.29 | ) | | | (0.34 | ) | | | (0.31 | ) | | | (0.36 | ) | | | (1.72 | ) | |
Capital Contributions from
Prior Custodian, Net (See Note 8) | | | — | | | | — | | | | 0.03 | | | | — | | | | — | | |
Net Asset Value, End of Period | | $ | 15.47 | | | $ | 17.64 | | | $ | 14.31 | | | $ | 14.39 | | | $ | 14.63 | | |
Total Return (b) | | | (10.66 | )% | | | 25.68 | % | | | 1.60 | %(c) | | | 0.84 | % | | | (5.30 | )% | |
Ratios/Supplemental Data: | |
Net Assets at end of period (000) | | $ | 142,524 | | | $ | 181,518 | | | $ | 175,026 | | | $ | 185,028 | | | $ | 203,530 | | |
Ratio of net expenses to average net assets | | | 0.93 | % | | | 0.93 | % | | | 0.90 | % | | | 0.92 | % | | | 0.92 | % | |
Ratio of net investment income (loss) to
average net assets | | | 2.20 | % | | | 1.93 | % | | | 2.13 | % | | | 2.00 | % | | | 2.23 | % | |
Ratio of gross expenses to average net assets | | | 0.94 | %(d) | | | 0.95 | %(d) | | | 0.90 | % | | | 0.92 | % | | | 0.92 | % | |
Portfolio turnover | | | 44 | % | | | 57 | % | | | 110 | % | | | 117 | % | | | 193 | % | |
(a) Per share net investment income (loss) has been calculated using the average daily shares method.
(b) Total returns do not reflect the effects of charges deducted pursuant to the terms of The Guardian Insurance & Annuity Company, Inc.'s variable contracts. Inclusion of such charges would reduce the total returns for all periods shown.
(c) The Fund received monies related to a nonrecurring refund from the prior Custodian. The corresponding impact to the total return was 0.23% for the period shown. (See Note 8)
(d) During the period, certain fees were reduced and/or reimbursed. If such fee reductions and/or reimbursements had not occurred, the ratios would have been as indicated.
See notes to financial statements.
16
Victory Variable Insurance Funds | | Notes to Financial Statements
December 31, 2018 | |
1. Organization:
Victory Variable Insurance Funds (the "Trust") was organized on February 11, 1998 as a Delaware statutory trust. The Trust is registered under the Investment Company Act of 1940, as amended (the "1940 Act"), as a diversified open-end investment company The Trust is comprised of nine funds and is authorized to issue an unlimited number of shares, which are units of beneficial interest with a par value of $0.001 per share.
The accompanying financial statements are those of the Victory RS International VIP Series (the "Fund"). The Fund offers a single class of shares: Class I Shares. Sales of shares of the Fund may only be made to certain separate accounts of The Guardian Insurance & Annuity Company, Inc. ("GIAC") that fund certain variable annuity and variable life insurance contracts issued by GIAC. GIAC is a wholly owned subsidiary of The Guardian Life Insurance Company of America ("Guardian Life").
Under the Trust's organizational documents, its officers and trustees are indemnified against certain liabilities arising out of the performance of their duties to the Fund. In addition, in the normal course of business, the Fund enters into contracts with its vendors and others that provide for general indemnifications. The Fund's maximum exposure under these arrangements is unknown, as this would involve future claims that may be made against the Fund. However, based on experience, the Fund expects that risk of loss to be remote.
2. Significant Accounting Policies:
The following is a summary of significant accounting policies followed by the Trust in the preparation of its financial statements. The policies are in conformity with accounting principles generally accepted in the United States of America ("GAAP"). The preparation of financial statements in accordance with GAAP requires management to make estimates and assumptions that affect the reported amounts of assets and liabilities and disclosure of contingent assets and liabilities at the date of the financial statements and the reported amounts of income and expenses for the period. Actual results could differ from those estimates. The Fund follows the specialized accounting and reporting requirements under GAAP that are applicable to investment companies.
Investment Valuation:
The Fund records investments at fair value. Fair value is defined as the price that would be received to sell an asset or paid to transfer a liability in an orderly transaction between market participants at the measurement date.
The valuation techniques described below maximize the use of observable inputs and minimize the use of unobservable inputs in determining fair value. The inputs used for valuing the Fund's investments are summarized in the three broad levels listed below:
• Level 1 — quoted prices in active markets for identical securities
• Level 2 — other significant observable inputs (including quoted prices for similar securities or interest rates applicable to those securities, etc.)
• Level 3 — significant unobservable inputs (including the Fund's own assumptions in determining the fair value of investments)
Changes in valuation techniques may result in transfers in or out of an assigned level within the disclosure hierarchy. The inputs or methodologies used for valuation techniques are not necessarily an indication of the risk associated with entering into those investments.
Portfolio securities listed or traded on securities exchanges, including American Depositary Receipts ("ADRs") and Rights, are valued at the closing price on the exchange or system where the security is principally traded, if available, or at the Nasdaq Official Closing Price. If there have been no sales for that day on the exchange or system, then a security is valued at the last available bid quotation on the exchange or system where the security is principally traded. In each of these situations, valuations are typically categorized as Level 1 in the fair value hierarchy.
17
Victory Variable Insurance Funds | | Notes to Financial Statements — continued
December 31, 2018 | |
Investments for which there are no such quotations, or for which quotations do not appear reliable, are valued at fair value in accordance with procedures established by and under the general supervision and responsibility of the Trust's Board of Trustees ("Board"). These valuations are typically categorized as Level 2 or Level 3 in the fair value hierarchy, based on the observability of inputs used to determine the fair value.
In accordance with procedures adopted by the Board, fair value pricing may be used if events materially affecting the value of foreign securities occur between the time the exchange on which they are traded closes and the time the Fund's net asset value is calculated. The Fund uses a systematic valuation model, provided daily by an independent third party to fair value their international equity securities. These valuations are considered as Level 2 in the fair value hierarchy.
A summary of the valuations as of December 31, 2018, based upon the three levels defined above, is included in the table below while the breakdown, by category, of investments is disclosed in the Schedule of Portfolio Investments:
| | | LEVEL 2 —
Other Significant
Observable Inputs | | Total | |
| | | Investments
in
Securities | | Investments
in
Securities | |
Common Stocks | | $ | 138,665,980 | | | $ | 138,665,980 | | |
Preferred Stocks | | | 2,226,636 | | | | 2,226,636 | | |
Total | | $ | 140,892,616 | | | $ | 140,892,616 | | |
For the year ended December 31, 2018, there were no Level 3 investments for which significant unobservable inputs were used to determine fair value.
Investment Companies:
The Fund may invest in portfolios of open-end investment companies. These investment companies value securities in their portfolios for which market quotations are readily available at their market values (generally the last reported sale price) and all other securities and assets at their fair value by the methods established by the board of directors of the underlying fund.
Foreign Exchange Currency Contracts:
The Fund may enter into foreign exchange currency contracts to convert U.S. dollars to and from various foreign currencies. A foreign exchange currency contract is an obligation by the Fund to purchase or sell a specific currency at a future date at a price (in U.S. dollars) set at the time of the contract. The Fund does not engage in "cross-currency" foreign exchange contracts (i.e., contracts to purchase or sell one foreign currency in exchange for another foreign currency). The Fund's foreign exchange currency contracts might be considered spot contracts (typically a contract of one week or less) or forward contracts (typically a contract term over one week). A spot contract is entered into for purposes of hedging against foreign currency fluctuations relating to a specific portfolio transaction, such as the delay between a security transaction trade date and settlement date. Forward contracts are entered into for purposes of hedging portfolio holdings or concentrations of such holdings. The Fund enters into foreign exchange currency contracts solely for spot or forward hedging purposes, and not for speculative purposes (i.e., the Fund does not enter into such contracts solely for the purpose of earning foreign currency gains). Each foreign exchange currency contract is adjusted daily by the prevailing spot or forward rate of the underlying currency, and any appreciation or depreciation is recorded for financial statement purposes as unrealized until the contract settlement date, at which time the Fund records realized gains or losses equal to the difference between the value of a contract at the time it was opened and the value at the time it was closed. The Fund could be exposed to risk if a counterparty is unable to meet the terms of a foreign exchange currency contract or if the value of the foreign currency changes unfavorably. In addition, the use of currency contracts does not eliminate
18
Victory Variable Insurance Funds | | Notes to Financial Statements — continued
December 31, 2018 | |
fluctuations in the underlying prices of the securities. As of December 31, 2018, the Fund had no open forward foreign exchange currency contracts.
Investment Transactions and Related Income:
Changes in holdings of investments are accounted for no later than one business day following the trade date. For financial reporting purposes, however, investment transactions are accounted for on trade date on the last business day of the reporting period. Interest income is recognized on an accrual basis and includes, where applicable, the amortization of premiums or accretion of discounts. Dividend income is recorded on the ex-dividend date. Gains or losses realized on sales of securities are determined by comparing the identified cost of the security lot sold with the net sales proceeds.
Withholding taxes on interest, dividends and gains as a result of certain investments in ADRs by the Fund have been provided for in accordance with each investment's applicable country's tax rules and rates.
Securities Lending:
The Trust has entered into a Master Securities Lending Agreement ("MSLA") with Citibank, N.A. ("Citibank" or the "Agent"). Under the terms of the MSLA, the Fund may lend securities to certain broker-dealers and banks in exchange for collateral in the amount of at least 102% of the value of U.S. securities loaned or at least 105% of the value of non-U.S. securities loaned, marked-to-market daily. Any collateral shortfalls associated with increases in the valuation of the securities loaned are adjusted the next business day. The collateral can be received in the form of cash collateral and/or non-cash collateral. Non-cash collateral can include U.S. Government Securities, letters of credit and certificates of deposit. The cash collateral is invested in short-term instruments or cash equivalents as noted on the Fund's Schedule of Portfolio Investments. The Trust does not have effective control of the non-cash collateral and therefore it is not disclosed in the Fund's Schedule of Portfolio Investments. The Fund continues to benefit from interest or dividends on the securities loaned and may also earn a return from the collateral. The Fund pays various fees in connection with the investment of cash collateral. The Fund pays the Agent fees based on the investment income received from securities lending activities. Securities lending income is disclosed in the Fund's Statement of Operations. Although risk is mitigated by the collateral, the Fund could experience a delay in recovering its securities and possible loss of income or value if the borrower fails to return them.
Securities lending transactions are entered into by the Fund under the MSLA, which permits the Fund, under certain circumstances such as an event of default, to offset amounts payable by the Fund to the same counterparty against amounts receivable from the counterparty to create a net payment due to or from the Fund.
The following table is a summary of the Fund's securities lending transactions which are subject to offset under the MSLA as of December 31, 2018. These transactions are accounted for as secured borrowings with an overnight and continuous contractual maturity for cash collateral, and greater than overnight and continuous contractual maturity for non-cash collateral.
Gross
Amount of
Recognized
Assets
(Value of | | Value of
Cash | | Value of Non-cash Collateral
Received by Maturity | | | |
Securities
on Loan) | | Collateral
Received | | <30 Days | | Between 30 &
90 days | | >90 Days | | Net Amount | |
| $ | 799,697 | | | $ | — | | | $ | — | | | $ | — | | | $ | 1,111,052 | | | $ | 311,355 | | |
Foreign Currency Translations:
The accounting records of the Fund are maintained in U.S. dollars. Investment securities and other assets and liabilities of the Fund denominated in a foreign currency are translated into U.S. dollars at current exchange rates. Purchases and sales of securities, income receipts and expense payments are
19
Victory Variable Insurance Funds | | Notes to Financial Statements — continued
December 31, 2018 | |
translated into U.S. dollars at the exchange rates on the date of the transactions. The Fund does not isolate the portion of the results of operations resulting from changes in foreign exchange rates on investments from fluctuations arising from changes in market prices of securities held. Such fluctuations are disclosed as net change in unrealized appreciation/depreciation on investments and foreign currency translations on the Statement of Operations. Any realized gains or losses from these fluctuations are disclosed as net realized gains or losses from investments and foreign currency translations on the Statement of Operations.
Foreign Taxes:
The Fund may be subject to foreign taxes related to foreign income received (a portion of which may be reclaimable), capital gains on the sale of securities, and certain foreign currency transactions. All foreign taxes are recorded in accordance with the applicable regulations and rates that exist in the foreign jurisdictions in which the Fund invests.
Dividends to Shareholders:
Dividends from net investment income, if any, are declared and paid annually by the Fund. Distributable net realized gains, if any, are declared and distributed at least annually.
The amounts of dividends from net investment income and distributions from net realized gains are determined in accordance with federal income tax regulations, which may differ from GAAP. To the extent these "book/tax" differences are permanent in nature (e.g., net operating loss, distribution reclassification, and deemed distribution due to shareholder redemptions), such amounts are reclassified within the components of net assets based on their federal tax-basis treatment; temporary differences (e.g., wash sales) do not require reclassification. To the extent dividends and distributions exceed net investment income and net realized gains for tax purposes, they are reported as distributions of capital. Net investment losses incurred by the Fund may be reclassified as an offset to capital on the accompanying Statement of Assets and Liabilities.
As of December 31, 2018, on the Statement of Assets and Liabilities, there are no permanent book-to-tax differences reclassification adjustments.
Federal Income Taxes:
It is the policy of the Fund to continue to qualify as a regulated investment company by complying with the provisions available to certain investment companies, as defined in applicable sections of the Internal Revenue Code, and to make distributions of net investment income and net realized gains sufficient to relieve it from all, or substantially all, federal income taxes. Accordingly, no provision for federal income taxes is required in the financial statements. The Fund has a tax year end of December 31.
Management of the Fund has reviewed tax positions taken in tax years that remain subject to examination by all major tax jurisdictions, including federal (i.e., the last four tax year ends and the interim tax period since then). Management believes that there is no tax liability resulting from unrecognized tax benefits related to uncertain tax positions taken.
Allocations:
Expenses directly attributable to the Fund are charged to the Fund, while expenses which are attributable to more than one fund in the Trust, or jointly with an affiliated trust, are allocated among the respective funds in the Trust and/or affiliated trust based upon net assets or another appropriate basis.
Affiliated Securities Transactions:
Pursuant to Rule 17a-7 under the 1940 Act, the Fund may engage in securities transactions with affiliated investment companies and advisory accounts managed by the Adviser and any applicable sub-adviser. Any such purchase or sale transaction must be effected without brokerage commission or other remuneration, except for customary transfer fees. The transaction must be effected at the current market price, which is either the security's last sale price on an exchange or, if there are no transactions
20
Victory Variable Insurance Funds | | Notes to Financial Statements — continued
December 31, 2018 | |
in the security that day, at the average of the highest bid and lowest asked price. For the year ended December 31, 2018, the Fund did not engage in any Rule 17a-7 transactions under the 1940 Act.
3. Purchases and Sales of Securities:
Purchases and sales of securities (excluding securities maturing less than one year from acquisition) for the year ended December 31, 2018 were as follows for the Fund:
| Purchases | | Sales | |
| $ | 72,652,199 | | | $ | 90,143,516 | | |
For the year ended December 31, 2018, there were no purchases or sales of U.S. Government Securities.
4. Fees and Transactions with Affiliates and Related Parties:
Investment advisory services are provided to the Fund by Victory Capital Management Inc. ("VCM" or the "Adviser"), a New York corporation registered as an investment adviser with the Securities and Exchange Commission ("SEC"). The Adviser is a wholly-owned indirect subsidiary of Victory Capital Holdings Inc., a publicly traded Delaware corporation, and a wholly-owned direct subsidiary of Victory Capital Operating, LLC.
Under the terms of the Investment Advisory Agreement, the Adviser is entitled to receive 0.80% of the average daily net assets of the Fund. The Adviser may use its resources to assist with the Fund's distribution and marketing expenses.
VCM also serves as the Fund's administrator and fund accountant. Under an Administration and Fund Accounting Agreement, VCM is paid for its services an annual fee at a rate of 0.08% of the first $15 billion in average daily net assets of the Trust, Victory Portfolios and Victory Portfolios II (collectively, the "Trusts"), 0.05% of the average daily net assets above $15 billion to $30 billion of the Trusts and 0.04% of the average daily net assets over $30 billion of the Trusts.
Citi Fund Services Ohio, Inc. ("Citi"), an affiliate of Citibank, N.A., acts as sub-administrator and sub-fund accountant to the Fund pursuant to a Sub-Administration and Sub-Fund Accounting Services Agreement between VCM and Citi. VCM pays Citi a fee for providing these services. The Trust reimburses VCM and Citi for all of their reasonable out-of-pocket expenses incurred in providing these services.
FIS Investor Services, LLC ("FIS") serves as the Fund's transfer agent. Under the Transfer Agent Agreement, the Trust pays FIS a fee for its services and reimburses FIS for all of their reasonable out-of-pocket expenses incurred in providing these services.
The Chief Compliance Officer ("CCO") is an employee of the Adviser, which pays the compensation of the CCO and his support staff. The Trust has entered into an Agreement to provide compliance services with the Adviser, pursuant to which the Adviser furnishes its compliance personnel, including the services of the CCO, and other resources reasonably necessary to provide the Trust with compliance oversight services related to the design, administration and oversight of a compliance program for the Trust in accordance with Rule 38a-1 under the 1940 Act. Funds in the Trust, Victory Portfolios, Victory Institutional Funds, and Victory Portfolios II (collectively, the "Victory Funds Complex"), in the aggregate, compensate the Adviser for these services.
The Victory Funds Complex pays an annual retainer to each Independent Trustee, plus an additional annual retainer to the Chairman of the Board. The aggregate amount of the fees and expenses of the Independent Trustees are allocated amongst all the funds in the Victory Funds Complex and are presented in the Statement of Operations.
Shearman & Sterling LLP provides legal services to the Trust.
Victory Capital Advisers, Inc. (the "Distributor"), an affiliate of the Adviser, serves as distributor for the continuous offering of the shares of the Fund pursuant to a Distribution Agreement between the Distributor and the Trust.
The Adviser has entered into an expense limitation agreement with the Fund until at least April 30, 2019. Under the terms of the agreement, the Adviser has agreed to waive fees or reimburse certain
21
Victory Variable Insurance Funds | | Notes to Financial Statements — continued
December 31, 2018 | |
expenses to the extent that ordinary operating expenses incurred by the Fund in any fiscal year exceed the expense limit for the Fund. Such excess amounts will be the liability of the Adviser. Interest, taxes, brokerage commissions, other expenditures which are capitalized in accordance with GAAP, and other extraordinary expenses not incurred in the ordinary course of a Fund's business are excluded from the expense limits. For the year ended December 31, 2018, the expense limit (excluding voluntary waivers) is 0.93%.
The Fund has agreed to repay fees and expenses that were waived or reimbursed by the Adviser for a period up to three fiscal years after such waiver or reimbursement was made to the extent such payments or repayments would not cause the expenses of a class to exceed the original expense limitation in place at the time of the waiver or reimbursement or any expense limitation agreement in place at the time of repayment. As of December 31, 2018, the following amounts are available to be repaid to the Adviser. Amounts repaid to the Adviser during the year ended December 31, 2018, if any, are reflected on the Statement of Operations as "Recoupment of prior expenses waived/reimbursed by Adviser".
| Expires 12/31/2020 | | Expires 12/31/2021 | |
| $ | 39,115 | | | $ | 15,196 | | |
The Adviser may voluntarily waive or reimburse additional fees to assist the Fund in maintaining a competitive expense ratio. Voluntary waivers and reimbursements applicable to the Fund are not available to be recouped at a future time. There were no voluntary waivers or reimbursements for the year ended December 31, 2018.
Certain officers and/or interested trustees of the Fund are also officers and/or employees of the Adviser, Administrator, Fund Accountant, Sub-Administrator, Sub-Fund Accountant, and Legal.
5. Risks:
The Fund may be subject to other risks in addition to these identified risks.
An investment in the Fund's shares represents an indirect investment in the securities owned by the Fund, some of which will be traded on a national securities exchange or in the over-the-counter markets. The value of the securities in which the Fund invests, like other market investments, may move up or down, sometimes rapidly and unpredictably. The value of the securities in which the Fund invests may affect the value of the Fund's shares. An investment in the Fund's shares at any point in time may be worth less than the original investment, even after taking into account the reinvestment of the Fund's distributions.
The Fund will be subject to foreign securities risk. Foreign securities (including ADRs and other depository receipts) are subject to political, regulatory, and economic risks not present in domestic investments. In addition, when the Fund buys securities denominated in a foreign currency, there are special risks such as changes in currency exchange rates and the risk that a foreign government could regulate foreign exchange transactions. In addition, to the extent investments are made in a limited number of countries, events in those countries will have a more significant impact on the Fund.
The Fund will be subject to emerging market risk. Risk of investment in emerging markets include greater political and economic instability, greater volatility in currency exchange rates, less developed securities markets, possible trade barriers, currency transfer restrictions, a more limited number of potential buyers and issuers, an emerging market country's dependence on revenue from particular commodities or international aid, less governmental supervision and regulation, unavailability of currency hedging techniques, differences in auditing and financial reporting standards and less developed legal systems.
The Fund will be subject to credit risk with respect to the amount it expects to receive from counterparties for financial instruments entered into by the Fund. The Fund may be negatively impacted if a counterparty becomes bankrupt or otherwise fails to perform its obligations due to financial difficulties. The Fund may experience significant delays in obtaining any recovery in bankruptcy or other reorganization proceeding and the Fund may obtain only limited recovery or may obtain no
22
Victory Variable Insurance Funds | | Notes to Financial Statements — continued
December 31, 2018 | |
recovery in such circumstances. The Fund typically enters into transactions with counterparties whose credit ratings are investment grade, as determined by a nationally recognized statistical rating organization or, if unrated, judged by the Adviser to be of comparable quality.
6. Borrowing and Interfund Lending:
Line of Credit:
The Victory Funds Complex participates in a short-term, demand note "Line of Credit" agreement with Citibank. Under the agreement with Citibank, the Victory Funds Complex may borrow up to $250 million, of which $100 million is committed and $150 million is uncommitted. $40 million of the Line of Credit is reserved for use by the Victory Floating Rate Fund, another series of the Victory Funds Complex, with that Fund paying the related commitment fees for that amount. The purpose of the agreement is to meet temporary or emergency cash needs, including redemption requests that might otherwise require the untimely disposition of securities. The current agreement was amended on July 27, 2018 with a new termination date of July 26, 2019. Citibank receives an annual commitment fee of 0.15% on $100 million for providing the Line of Credit. For the year ended December 31, 2018, Citibank earned approximately $150,000 in commitment fees from the Victory Funds Complex. Each fund in the Victory Funds Complex pays a pro-rata portion of the commitment fees plus any interest on amounts borrowed. Interest accrued by the Fund during the period is presented on the Statement of Operations under Interest expense on line of credit.
The Fund did not utilize or participate in the Line of Credit during the year ended December 31, 2018.
Interfund Lending:
The Trust and Adviser rely on an exemptive order granted by the SEC in March 2017 (the "Order"), permitting the establishment and operation of an Interfund Lending Facility (the "Facility"). The Facility allows the Fund to directly lend and borrow money to or from any other Victory Fund relying upon the Order at rates beneficial to both the borrowing and lending funds. Advances under the Facility are allowed for temporary or emergency purposes, including the meeting of redemption requests that otherwise might require the untimely disposition of securities, and are subject to each Fund's borrowing restrictions. The interfund loan rate is determined, as specified in the Order, by averaging the current repurchase agreement rate and the current bank loan rate. Interest accrued by the Fund during the period is presented on the Statement of Operations under Interest expense on interfund lending.
The Fund did not utilize or participate in the Facility during the year ended December 31, 2018.
7. Federal Income Tax Information:
The tax character of distributions paid during the tax years ended, as noted below, were as follows (total distributions paid may differ from the Statements of Changes in Net Assets because, for tax purposes, dividends are recognized when actually paid).
| | | Year Ended December 31, 2018 | |
| | | Distributions paid from | |
| | Ordinary
Income | | Net
Long-Term
Capital Gains | | Total
Distributions
Paid | |
| | | | | $ | 1,384,165 | | | $ | 1,236,976 | | | $ | 2,621,141 | | |
| | | Year Ended December 31, 2017 | |
| | | Distributions paid from | |
| | Ordinary
Income | | Net
Long-Term
Capital Gains | | Total
Distributions
Paid | |
| | | | | $ | 3,484,383 | | | $ | — | | | $ | 3,484,383 | | |
23
Victory Variable Insurance Funds | | Notes to Financial Statements — continued
December 31, 2018 | |
As of the tax year ended December 31, 2018, the components of accumulated earnings (deficit) on a tax basis were as follows:
Undistributed
Ordinary
Income | | Undistributed
Long-Term
Capital
Gains | |
Accumulated
Earnings | |
Unrealized
Appreciation
(Depreciation)* | | Total
Accumulated
Earnings
(Deficit) | |
| $ | 3,274,057 | | | $ | 8,853,691 | | | $ | 12,127,748 | | | $ | 544,900 | | | $ | 12,672,648 | | |
*The difference between the book-basis and tax-basis unrealized appreciation (depreciation) is attributable primarily to tax deferral of losses on wash sales.
During the tax year ended December 31, 2018, the Fund did not utilize capital loss carryforwards.
As of December 31, 2018, the cost basis for federal income tax purposes, gross unrealized appreciation, gross unrealized depreciation and net unrealized appreciation (depreciation) for investments were as follows:
Cost of
Investments
for Federal
Tax Purposes | | Gross
Unrealized
Appreciation | | Gross
Unrealized
Depreciation | | Net
Unrealized
Appreciation
(Depreciation) | |
| $ | 140,349,108 | | | $ | 34,055,350 | | | $ | (33,510,450 | ) | | $ | 544,900 | | |
8. Capital Contribution from Prior Custodian:
During 2016, the Fund received notification from the Fund's prior custodian, State Street Bank and Trust ("State Street"), concerning issues related to billing on certain categories of expenses during the approximately 16-year period from 1998 through October 31, 2014. The over-billing primarily related to categories of expenses that involved an allocation of general costs among multiple clients.
State Street paid the refunded amounts during January 2017. Based on billing information received during 2016 from State Street and an analysis of any expense limitation agreements that were in place during the period of the activities in question, including the application of any recoupment provisions in such agreements, the Adviser received a portion of the refund.
The portion of the refund retained by the Fund was accounted for as a capital contribution and is reflected on the Financial Highlights as "Capital Contribution from Prior Custodian, Net".
9. Fund Ownership:
Ownership of more than 25% of the voting securities of a fund creates presumptions of control of the fund, under section 2(a)(9) of the 1940 Act. As of December 31, 2018, the shareholders listed below held more than 25% of the shares outstanding of the Fund and may be deemed to control the Fund.
| Shareholder | | Percent | |
| GIAC | | | 99.8 | % | |
10. Recent Accounting Pronouncements:
In October 2016, the SEC released its Final Rules on Investment Company Reporting Modernization (the "Rules"). The Rules introduced two new regulatory reporting forms for investment companies, Form N-PORT and Form N-CEN. The Fund's compliance date for Form N-PORT was June 1, 2018, and the Fund will make its initial filing with the SEC on Form N-PORT for the period ending March 31, 2019. Effective with the period ended June 30, 2018, the Fund was required to maintain, and make available to the SEC upon request, the information required to be included in Form N-PORT. Form N-PORT will replace Form N-Q filings effective with the requirement to file the Form N-PORT with the SEC for the period ending March 31, 2019. The Fund's compliance date for Form N-CEN was June 1, 2018, and the Fund will make its initial filing on Form N-CEN for the period ended December 31, 2018. Form N-CEN will replace Form N-SAR filings. The Fund's adoption of these amendments have no effect on the Fund's net assets or results of operations.
24
Victory Variable Insurance Funds | | Notes to Financial Statements — continued
December 31, 2018 | |
In August 2018, the FASB issued ASU No. 2018-13, "Fair Value Measurements" ("ASU 2018-13"). This update makes certain removals from, changes to and additions to existing disclosure requirements for fair value measurements. ASU 2018-13 does not change fair value measurements already required or permitted by existing standards. ASU 2018-13 is effective for financial statements issued for fiscal years beginning after December 15, 2019, and interim periods within those fiscal years. As permitted, the Fund has early adopted ASU 2018-13 with the financial statements prepared as of December 31, 2018.
In August 2018, the SEC adopted amendments to certain financial statement disclosure requirements to conform them to GAAP for investment companies. These amendments made certain disclosure requirements effective under Regulation S-X. The Fund's adoption of these amendments, effective with the financial statements prepared as of December 31, 2018 had no effect on the Fund's net assets or results of operations. As a result of adopting these amendments, the distributions to shareholders in the December 31, 2017 Statements of Changes in Net Assets presented herein have been reclassified to conform to the current year presentation, which includes all distributions to each class of shareholders, other than tax basis return of capital distributions, in one line item per share class. Distributions to shareholders for the year ended December 31, 2017 from net investment income and net realized gains in the Fund were as follows:
Distributions to Shareholders:
From net investment income: | | $ | (3,484,383 | ) | |
From net Realized Gains: | | | — | | |
11. Subsequent Events:
The Fund has evaluated the need for additional disclosures or adjustments resulting from subsequent events through the date these financial statements were issued. Based on this evaluation, there were no subsequent events to report that would have a material impact on the Fund's financial statements.
25
REPORT OF INDEPENDENT REGISTERED PUBLIC ACCOUNTING FIRM
To the Shareholders and the Board of Trustees of Victory RS International VIP Series
Opinion on the Financial Statements
We have audited the accompanying statement of assets and liabilities of Victory RS International VIP Series (the "Fund") (one of the funds constituting the Victory Variable Insurance Funds (the "Trust")), including the portfolio of investments, as of December 31, 2018, and the related statement of operations for the year then ended, the statements of changes in net assets for each of the two years in the period then ended, the financial highlights for each of the three years in the period then ended and the related notes (collectively referred to as the "financial statements"). In our opinion, the financial statements present fairly, in all material respects, the financial position of the Fund (one of the funds constituting the Trust) at December 31, 2018, and the results of its operations for the year then ended, the changes in its net assets for each of the two years in the period then ended and its financial highlights for each of the three years in the period then ended, in conformity with U.S. generally accepted accounting principles.
The financial highlights of the Fund for each of the periods presented through December 31, 2015 were audited by other auditors, whose report dated February 22, 2016 expressed an unqualified opinion on those financial highlights.
Basis for Opinion
These financial statements are the responsibility of the Trust's management. Our responsibility is to express an opinion on the Fund's financial statements based on our audits. We are a public accounting firm registered with the Public Company Accounting Oversight Board (United States) (PCAOB) and are required to be independent with respect to the Trust in accordance with the U.S. federal securities laws and the applicable rules and regulations of the Securities and Exchange Commission and the PCAOB.
We conducted our audits in accordance with the standards of the PCAOB. Those standards require that we plan and perform the audit to obtain reasonable assurance about whether the financial statements are free of material misstatement, whether due to error or fraud. The Trust is not required to have, nor were we engaged to perform, an audit of the Trust's internal control over financial reporting. As part of our audit we are required to obtain an understanding of internal control over financial reporting but not for the purpose of expressing an opinion on the effectiveness of the Trust's internal control over financial reporting. Accordingly, we express no such opinion.
Our audits included performing procedures to assess the risks of material misstatement of the financial statements, whether due to error or fraud, and performing procedures that respond to those risks. Such procedures included examining, on a test basis, evidence regarding the amounts and disclosures in the financial statements. Our procedures included confirmation of securities owned as of December 31, 2018, by correspondence with the custodian, transfer agent, and brokers or by other appropriate auditing procedures where replies from brokers were not received. Our audits also included evaluating the accounting principles used and significant estimates made by management, as well as evaluating the overall presentation of the financial statements. We believe that our audits provide a reasonable basis for our opinion.

We have served as the auditor of one or more Victory Capital's investment companies since 1995.
Cincinnati, Ohio
February 15, 2019
26
Victory Variable Insurance Funds | | Supplemental Information
December 31, 2018 | |
(Unaudited)
Trustee and Officer Information
Board of Trustees:
Overall responsibility for management of the Trust rests with the Board. The Trust is managed by the Board in accordance with the laws of the State of Delaware. There are currently ten Trustees, nine of whom are not "interested persons" of the Trust within the meaning of that term under the 1940 Act ("Independent Trustees") and one of whom is an "interested person" of the Trust within the meaning of that term under the 1940 Act ("Interested Trustee"). The Trustees, in turn, elect the officers of the Trust to actively supervise its day-to-day operations.
The following tables list the Trustees, their ages, position with the Trust, commencement of service, principal occupations during the past five years and any directorships of other investment companies or companies whose securities are registered under the Securities Exchange Act of 1934, as amended, or who file reports under that Act. Each Trustee oversees nine portfolios in the Trust, one portfolio in Victory Institutional Funds, 42 portfolios in Victory Portfolios and 20 portfolios in Victory Portfolios II, each a registered investment company that, together with the Trust, comprise the Victory Funds Complex. Each Trustee's address is c/o Victory Variable Insurance Funds, 4900 Tiedeman Road, 4th Floor, Brooklyn, Ohio 44144. Each Trustee has an indefinite term.
Name and Age | | Position
Held with
the Trust | | Date
Commenced
Service | | Principal Occupation
During Past 5 Years | | Other
Directorships
Held During
Past 5 Years | |
Independent Trustees. | |
David Brooks Adcock, 67 | | Trustee | | February 2005 | | Consultant (since 2006). | | Chair and Trustee, Turner Funds (December 2016-December 2017). | |
Nigel D.T. Andrews, 71 | | Vice Chair and Trustee | | August 2002 | | Retired. | | Director, TCG BDC II, Inc. (since 2017); Director, TCG BDC I, Inc. (formerly Carlyle GMS Finance, Inc.) (since 2012); Director, Old Mutual US Asset Management (2002-2014). | |
E. Lee Beard, 67* | | Trustee | | February 2005 | | Retired (since 2015); Consultant, The Henlee Group, LLC (consulting) (2005-2015). | | None. | |
Dennis M. Bushe, 75 | | Trustee | | July 2016 | | Retired. | | Trustee, RS Investment Trust and RS Variable Products Trust (November 2011-July 2016). | |
27
Victory Variable Insurance Funds | | Supplemental Information — continued
December 31, 2018 | |
(Unaudited)
Name and Age | | Position
Held with
the Trust | | Date
Commenced
Service | | Principal Occupation
During Past 5 Years | | Other
Directorships
Held During
Past 5 Years | |
Sally M. Dungan, 64 | | Trustee | | February 2011 | | Chief Investment Officer, Tufts University (since 2002). | | None. | |
John L. Kelly, 65 | | Trustee | | February 2015 | | Partner, McCarvill Capital Partners (September 2016-September 2017); Advisor (January 2016-April 2016) and Managing Partner (August 2014-January 2016), Endgate Commodities LLC; Chief Operating Officer, Liquidnet Holdings, Inc. (2011-2014). | | Director, Caledonia Mining Corporation (since May 2012). | |
David L. Meyer, 61* | | Trustee | | December 2008 | | Retired. | | None. | |
Gloria S. Nelund, 57 | | Trustee | | July 2016 | | Chair, CEO and Co-Founder of TriLinc Global, LLC, an investment firm. | | TriLinc Global Impact Fund, LLC (since 2012); Trustee, RS Investment Trust and RS Variable Products Trust (November 2007-July 2016). | |
Leigh A. Wilson, 74 | | Chair and Trustee | | February 1998 | | Private Investor. | | Chair (since 2013), Caledonia Mining Corporation. | |
Interested Trustee. | |
David C. Brown, 46** | | Trustee | | May 2008 | | Chairman and Chief Executive Officer (since 2013), Co-Chief Executive Officer (2011-2013), the Adviser; Chairman and Chief Executive Officer, Victory Capital Holdings, Inc. (since 2013). | | None. | |
* The Board has designated Mr. Meyer and Ms. Beard as its Audit Committee Financial Experts.
** Mr. Brown is an "Interested Person" by reason of his relationship with the Adviser.
The Statement of Additional Information includes additional information about the Trustees of the Trust and is available, without charge, by calling 800-539-3863.
28
Victory Variable Insurance Funds | | Supplemental Information — continued
December 31, 2018 | |
(Unaudited)
Officers:
The officers of the Trust, their ages, commencement of service and their principal occupations during the past five years, are detailed in the following table. Each officer serves until the earlier of his or her resignation, removal, retirement, death, or the election of a successor. The mailing address of each officer of the Trust is 4900 Tiedeman Road, 4th Floor, Brooklyn, Ohio 44144. The officers of the Trust receive no compensation directly from the Trust for performing the duties of their offices.
Name and Age | | Position with
the Trust | | Date
Commenced
Service | | Principal Occupation During Past 5 Years | |
Christopher K. Dyer, 57 | | President | | February 2006* | | Director of Mutual Fund Administration, the Adviser. | |
Scott A. Stahorsky, 49 | | Vice President | | December 2014 | | Manager, Fund Administration, the Adviser (since 2015); Senior Analyst, Fund Administration, the Adviser (prior to 2015). | |
Erin G. Wagner, 45 | | Secretary | | December 2014 | | Associate General Counsel, the Adviser (since 2013). | |
Allan Shaer, 53 | | Treasurer | | May 2017 | | Senior Vice President, Financial Administration, Citi Fund Services Ohio, Inc. (since 2016); Vice President, Mutual Fund Administration, JP Morgan Chase (2011-2016). | |
Christopher A. Ponte, 34 | | Assistant Treasurer | | December 2017 | | Manager, Fund Administration, the Adviser (since 2017); Senior Analyst, Fund Administration, the Adviser (prior to 2017); Chief Financial Officer, Victory Capital Advisers, Inc. (since 2018). | |
Colin Kinney, 45 | | Chief Compliance Officer | | July 2017 | | Chief Compliance Officer (since 2013) and Chief Risk Officer (2009-2017), the Adviser. | |
Chuck Booth, 58 | | Anti-Money Laundering Compliance Officer and Identity Theft Officer | | May 2015 | | Director, Regulatory Administration and CCO Support Services, Citi Fund Services Ohio, Inc. | |
Jay G. Baris, 65 | | Assistant Secretary | | February 1998 | | Partner, Shearman & Sterling LLP (since 2018); Partner, Morrison & Foerster LLP (2011-2017). | |
* On December 3, 2014, Mr. Dyer resigned as Secretary of the Trust and accepted the position of President.
29
Victory Variable Insurance Funds | | Supplemental Information — continued
December 31, 2018 | |
(Unaudited)
Proxy Voting and Form N-Q Information
Proxy Voting:
Information regarding the policies and procedures that the Fund uses to determine how to vote proxies relating to portfolio securities is available without charge, upon request, by calling 800-539-3863. The information is also included in the Fund's Statement of Additional Information, which is available on the SEC's website at www.sec.gov.
Information relating to how the Fund voted proxies relating to portfolio securities held during the most recent twelve months ended June 30 is available on the SEC's website at www.sec.gov.
Availability of Schedules of Portfolio Investments:
The Trust expects to file a complete list of Schedules of Portfolio Investments with the SEC for the first and third quarter of each fiscal year on Form N-PORT beginning March 1, 2019. Prior to that date, the Trust has filed a complete list of Schedules of Portfolio Investments with the SEC for the first and third quarters of each fiscal year on Form N-Q. Forms N-PORT and Forms N-Q are available on the SEC's website at www.sec.gov.
Expense Examples
As a shareholder of the Fund, you may incur two types of costs: (1) transaction costs and (2) ongoing costs, including management fees, distribution and service (12b-1) fees, and other Fund expenses. These examples are intended to help you understand your ongoing costs (in dollars) of investing in the Fund and to compare these costs with the ongoing costs of investing in other mutual funds.
These examples are based on an investment of $1,000 invested at the beginning of the period and held for the entire period from July 1, 2018 through December 31, 2018.
The Actual Expense figures in the table below provide information about actual account values and actual expenses. You may use the information below, together with the amount you invested, to estimate the expenses that you paid over the period. Simply divide your account value by $1,000 (for example, an $8,600 account value divided by $1,000 = 8.6), then multiply the result by the number in the table under the heading entitled "Actual Expenses Paid During Period" to estimate the expenses you paid on your account during this period.
The Hypothetical Expense figures in the table below provide information about hypothetical account values and hypothetical expenses based on the Fund's actual expense ratio and an assumed rate of return of 5% per year before expenses, which is not the Fund's actual return. The hypothetical account values and expenses may not be used to estimate the actual ending account balance or expenses you paid for the period. You may use this information to compare this 5% hypothetical example with the 5% hypothetical examples that appear in shareholder reports of other funds.
Please note the expenses shown in the table are meant to highlight your ongoing costs only and do not reflect any transactional costs. Therefore, the table is useful in comparing ongoing costs only, and will not help you determine the relative total costs of owning different funds. In addition, if these transactional costs were included, your costs would have been higher.
Beginning
Account Value
7/1/18 | | Actual
Ending
Account Value
12/31/18 | | Hypothetical
Ending
Account Value
12/31/18 | | Actual
Expenses
Paid During
Period
7/1/18-12/31/18* | | Hypothetical
Expenses
Paid During
Period
7/1/18-12/31/18* | | Annualized
Expense Ratio
During Period
7/1/18-12/31/18 | |
| $ | 1,000.00 | | | $ | 906.70 | | | $ | 1,020.52 | | | $ | 4.47 | | | $ | 4.74 | | | | 0.93 | % | |
* Expenses are equal to the average account value multiplied by the Fund's annualized expense ratio multiplied by 184/365 (the number of days in the most recent fiscal half-year divided by the number of days in the fiscal year).
30
Victory Variable Insurance Funds | | Supplemental Information — continued
December 31, 2018 | |
(Unaudited)
Additional Federal Income Tax Information
For the year ended December 31, 2018, the Fund paid qualified dividend income for purposes of reduced individual federal income tax rates of 58%.
For the year ended December 31, 2018, the Fund designated long-term capital gain distributions in the amount of $1,236,976.
The Fund intends to elect to pass through to shareholders the income tax credit for taxes paid to foreign countries. Foreign source income and foreign tax expense per shares outstanding on December 31, 2018 were $0.49 and $0.15, respectively.
31
Victory Variable Insurance Funds | | Supplemental Information — continued
December 31, 2018 | |
(Unaudited)
Considerations of the Board in Continuing the Investment Advisory Agreement (the "Agreement")
The Board approved the Agreement on behalf of the Series at a meeting, which was called for that purpose, on December 5, 2018. The Board also considered information relating to the Series and the Agreement provided throughout the year and, more specifically, at a meeting on October 23, 2018. The Board noted that prior to the Series' reorganization on July 29, 2016, the Series was managed by RS Investment Management Co. LLC, which was acquired by the Adviser on July 29, 2016. In considering whether to approve the Agreement, the Board requested, and the Adviser provided, information that the Board believed to be reasonably necessary to reach its conclusions. The Board, including the Independent Trustees, evaluated this information along with other information obtained throughout the year and was advised by legal counsel to the Series and by independent legal counsel to the Independent Trustees. In addition, in 2017 the Independent Trustees, through their counsel, retained an independent consultant to assist with a review of the overall process for conducting the annual review of these advisory arrangements. The Board considered the Series' advisory fee, expense ratio and investment performance as significant factors in determining whether the Agreement should be continued. In considering whether the compensation paid to the Adviser was fair and reasonable, the Board also evaluated, among other things, the following factors:
• The requirements of the Series for the services provided by the Adviser;
• The nature, quality and extent of the services provided and expected to be provided;
• The performance of the Series as compared to comparable funds;
• The fees payable for the services and whether the fee arrangements provided for economies of scale that would benefit Series shareholders as the Series grows;
• Whether the fee would be sufficient to enable the Adviser to attract and retain experienced personnel and continue to provide quality services to the Series;
• Fees paid by other clients of the Adviser whose accounts are managed in a similar investment style and any differences in the services provided to the other clients compared to those provided to the Series;
• Total expenses of the Series, taking into consideration any distribution or shareholder servicing fees;
• Management's commitment to operating the Series at competitive expense levels;
• The profitability of the Adviser (as reflected by comparing fees earned against an estimate of the Adviser's costs) with respect to the Adviser's relationship with the Series;
• Research and other service benefits received by the Adviser obtained through payment of client commissions for securities transactions;
• Other benefits received by the Adviser, and its affiliates, including revenues paid to the Adviser, or its affiliates, by the Series for administration and fund accounting services, and distribution;
• The capabilities and financial condition of the Adviser;
• Current economic and industry trends; and
• The historical relationship between the Series and the Adviser.
The Board reviewed the Series' current management fee, comprised of the advisory fee plus the administrative services fee paid to the Adviser, in the context of the Adviser's profitability of the Series. In addition, the Board compared the Series' total operating expense ratio on a net and gross basis, taking into consideration any distribution or shareholder servicing fees and management fees with a universe of comparable mutual funds compiled by an independent consultant, FUSE Research Network, LLC ("FUSE"), and a peer group of funds with similar investment strategies selected by FUSE from the universe. The Board reviewed the factors and methodology used by FUSE in the selection of the Series' peer group, including FUSE's selection of a broad universe of funds using the standard Retail Morningstar Categories, the more specific universe of comparable funds, and peer groups of funds with comparable investment strategies and asset levels, among other factors. The Board also reviewed any changes to FUSE's methodology as compared to the prior year, including as a result of input from the Adviser, if any. The Board also reviewed fees and other information related to the Adviser's management of similarly managed institutional or private accounts, and the differences in the services
32
Victory Variable Insurance Funds | | Supplemental Information — continued
December 31, 2018 | |
(Unaudited)
provided to the other accounts, to the extent applicable. The Board noted that the advisory fee arrangements for the Series do not include breakpoints, which are generally viewed as a method by which the investment adviser shares any economies of scale with a fund as a fund grows. The Board also considered the Adviser's commitment to limit expenses as discussed in more detail below.
The Board reviewed the Series' performance over one-, three-, five- and ten-year periods against the performance of the Series' selected peer group and benchmark index. The Board recognized that the performance of the Series and the peer group funds are net of expenses, while the performance of the benchmark index is gross returns. The Board considered the additional resources that the Adviser has committed to enhance portfolio analysis, compliance and trading systems. The Board noted that, following the Series' reorganization, the Series is managed by substantially the same investment management team that managed the comparable predecessor fund.
The Board reviewed various other specific factors with respect to the Series, as described below. In their deliberations, the Trustees did not rank the importance of any particular information or factor considered and each Trustee may have attributed different weights to various factors.
The Board concluded that the Series' gross annual management fee was reasonable as compared to the median gross management fee charged to the funds in the Series' peer group. The Board noted that the Series' net annual expense ratio, taking into account any shareholder servicing or distribution fees, was reasonable as compared to the median expense ratio for the peer group. The Board considered the Adviser's contractual agreement to waive its fees and reimburse expenses for a specified period of time, as described in the Series' prospectus. The Board then compared the Series' performance for the one-, three-, five- and ten-year periods ended June 30, 2018, to that of the median performance of the peer group and benchmark index for the same periods and considered the fact that the Series outperformed both the benchmark index and the peer group for all of the periods reviewed.
Having considered, among other things: (1) that the Series' management fee was within the ranges of advisory fees charged to comparable mutual funds; (2) that the Series' total expense ratio was reasonable; (3) the Adviser's willingness to limit the expenses for a period of time would provide stability to the Series' expenses during that period; and (4) the performance of the Series, the Board concluded that the Agreement continued to be in the best interests of the Series' shareholders.
Conclusion
Based on its review of the information requested and provided, and following extended discussions, the Board determined that the Agreement, on behalf of the Series, was consistent with the best interests of the Series and its shareholders, and the Board unanimously approved the Agreement, on behalf of the Series, for an additional annual period on the basis of the foregoing review and discussions and the following considerations, among others:
• The fairness and reasonableness of the investment advisory fee payable to the Adviser under the Agreement in light of the investment advisory services provided, the costs of these services, the profitability of the Adviser's relationship with the Series and the comparability of the fee paid to the fees paid by other investment companies;
• The nature, quality and extent of the investment advisory services provided by the Adviser;
• The Adviser's entrepreneurial commitment to the management of the Series and the creation of a broad-based family of funds, which could entail a substantial commitment of the Adviser's resources to the successful operation of the Series;
• The Adviser's representations regarding its staffing and capabilities to manage the Series, including the retention of personnel with relevant portfolio management experience;
• The Adviser's efforts to enhance investment results by, among other things, developing quality portfolio management teams; and
• The overall high quality of the personnel, operations, financial condition, investment management capabilities, methodologies and performance of the Adviser.
33
Privacy Policy
Protecting the Privacy of Information
The Trust respects your right to privacy. We also know that you expect us to conduct and process your business in an accurate and efficient manner. To do so, we must collect and maintain certain personal information about you. This is the information we collect from you on applications or other forms, and from the transactions you make with us or third parties. It may include your name, address, social security number, account transactions and balances, and information about investment goals and risk tolerance.
We do not disclose any information about you or about former customers to anyone except as permitted or required by law. Specifically, we may disclose the information we collect to companies that perform services on our behalf, such as the transfer agent that processes shareholder accounts and printers and mailers that assist us in the distribution of investor materials. We may also disclose this information to companies that perform marketing services on our behalf. This allows us to continue to offer you Victory investment products and services that meet your investing needs, and to effect transactions that you request or authorize. These companies will use this information only in connection with the services for which we hired them. They are not permitted to use or share this information for any other purpose.
To protect your personal information internally, we permit access only by authorized employees and maintain physical, electronic and procedural safeguards to guard your personal information.*
* You may have received communications regarding information about privacy policies from other financial institutions which gave you the opportunity to "opt-out" of certain information sharing with companies which are not affiliated with that financial institution. The Trust does not share information with other companies for purposes of marketing solicitations for products other than the Trust. Therefore, the Trust does not provide opt-out options to their shareholders.
Victory Funds
P.O. Box 182593
Columbus, Ohio 43218-2593

Visit our website at: | | Call Victory at: | |
www.vcm.com | | 800-539-FUND (800-539-3863) | |

December 31, 2018
Annual Report
Victory Variable Insurance Funds
Victory RS Large Cap Alpha VIP Series
Beginning on January 1, 2021, as permitted by regulations adopted by the Securities and Exchange Commission, paper copies of the Victory Funds' shareholder reports will no longer be sent by mail, unless you specifically request paper copies of the reports from the Victory Funds or from your financial intermediary, such as a broker-dealer or bank. Instead, the reports will be made available on www.VictoryFunds.com, and you will be notified by mail each time a report is posted and provided with a website link to access the report. If you already elected to receive shareholder reports electronically, you will not be affected by this change, and you need not take any action.
You may elect to receive shareholder reports and other communications from the Victory Funds or your financial intermediary electronically sooner than January 1, 2021 by notifying your financial intermediary directly or, if you are a direct investor, by calling 800-539-3863 or by sending an e-mail request to TA.Processing@FISGlobal.com.
You may elect to receive all future reports in paper free of charge. If you invest through a financial intermediary, you can contact your financial intermediary to request that you continue to receive paper copies of your reports. If you invest directly with the Victory Funds, you can call 800-539-3863 or send an e-mail request to TA.Processing@FISGlobal.com. Your election to receive reports in paper will apply to all Victory Funds you hold directly or through your financial intermediary.
www.vcm.com
News, Information And Education 24 Hours A Day, 7 Days A Week
The Victory Funds site gives fund shareholders, prospective shareholders, and investment professionals a convenient way to access fund information, get guidance, and track fund performance anywhere they can access the Internet. The site includes:
• Detailed performance records
• Daily share prices
• The latest fund news
• Investment resources to help you become a better investor
• A section dedicated to investment professionals
Whether you're a potential investor searching for the fund that matches your investment philosophy, a seasoned investor interested in planning tools, or an investment professional, www.vcm.com has what you seek. Visit us anytime. We're always open.
Victory Variable Insurance Funds
Table of Contents
Shareholder Letter (Unaudited) | | | 3 | | |
Fund Review and Commentary (Unaudited) | | | 4 | | |
Financial Statements | |
Schedule of Portfolio Investments | | | 8 | | |
Statement of Assets and Liabilities | | | 11 | | |
Statement of Operations | | | 12 | | |
Statements of Changes in Net Assets | | | 13 | | |
Financial Highlights | | | 14 | | |
Notes to Financial Statements | | | 15 | | |
Report of Ernst & Young LLP, Independent
Registered Public Accounting Firm | | | 23 | | |
Supplemental Information (Unaudited) | |
Trustee and Officer Information | | | 24 | | |
Proxy Voting and Form N-Q Information | | | 27 | | |
Expense Examples | | | 27 | | |
Additional Federal Income Tax Information | | | 28 | | |
Advisory Contract Renewal | | | 29 | | |
Privacy Policy (inside back cover) | | | |
The Fund is distributed by Victory Capital Advisers, Inc. Victory Capital Management Inc. is the investment adviser to the Fund and receives fees from the Fund for performing services for the Fund.
This report is not authorized for distribution to prospective investors unless preceded or accompanied by a current prospectus of the Fund.
For additional information about any Victory Fund, including fees, expenses, and risks, view our prospectus online at www.vcm.com or call 800-539-3863. Read it carefully before you invest or send money.
The information in this annual report is based on data obtained from recognized services and sources and is believed to be reliable. Any opinions, projections, or recommendations in this report are subject to change without notice and are not intended as individual investment advice. Past investment performance of the Fund, markets or securities mentioned herein should not be considered to be indicative of future results.
• NOT FDIC INSURED • NO BANK GUARANTEE
• MAY LOSE VALUE

Call Victory at:
800-539-FUND (800-539-3863)
Visit our website at:
www.vcm.com
1
This page is intentionally left blank.
2
Victory Funds Letter to Shareholders
Dear Shareholder,
What a difference a year makes. The year ended December 31, 2018, was marked by an abrupt return of volatility, which had largely been missing in action for years. Consider the range of highs and lows we witnessed. For the S&P 500 Index, it was a year in which we celebrated an all-time high in late summer, only to be followed by the worst December since the 2008 financial crisis. And if that wasn't enough volatility, the Dow Jones Industrial Average also registered several of its worst-ever, single-day point declines during 2018.
Through all that the S&P 500 clocked in with its first negative annual return since 2008, falling by 4.4 percent. Given the risk-off sentiment that was obvious as the year drew to a close, it's no surprise that small-cap stocks, as measured by the Russell 2000 Index, fared even worse, falling approximately 11.0 percent for the year. The challenges for equity investors were also evident around the world as the MSCI ACWI and Emerging Markets indexes declined 8.9 and 14.3 percent, respectively.
So what ushered in the renewed era of volatility and these challenging times? There were multiple culprits. For starters, trade tensions ratcheted up throughout the year as anti-global rhetoric bloomed into a series of new tariffs, which sparked concerns of a prolonged trade war with China. The Federal Reserve remained persistent in its monetary tightening, raising the benchmark interest rate four times throughout the year to a range of 2.25 to 2.5 percent. And then the year ended with a partial shutdown of the federal government. These factors conspired to elevate concerns of a possible recession here and abroad.
Yet despite the headline risks, we think it's critically important to remain focused on the data. By all accounts, the U.S. economy continued chugging along in 2018 with a real gross domestic product (GDP) rising 3.4 percent in the third quarter of 2018, the latest figures available from the Bureau of Economic Analysis. Moreover, the labor picture continues to shine with consistent monthly job growth and an unemployment rate of 3.9 percent. All this comes against a backdrop of low inflation and solid corporate earnings.
The markets, it appears, have been vacillating between the dire headlines and higher perceived risks on one hand, and the continued positive economic data on the other. Of course, no one knows where the Fed will stop raising rates, nor is there any certainty on how the trade turmoil ultimately gets resolved. For now, however, we continue to embrace our solid economic fundamentals. Moreover, we believe all of Victory Capital's independent investment franchises are well positioned to take advantage of any short-term valuation dislocations resulting from the current era of heightened volatility.
On the following pages, you will find information relating to your Victory Funds investment. If you have any questions, we encourage you to contact your financial advisor. Or, if you invest with us directly, you may call (800) 539-3863, or visit our website at www.vcm.com.
My colleagues and I sincerely appreciate the confidence you have placed in the Victory Funds, and we value the opportunity to help meet your investment goals.

Christopher K. Dyer, CFA
President,
Victory Funds
3
Victory Variable Insurance Funds
Victory RS Large Cap Alpha VIP Series
Portfolio Holdings
As a Percentage of Total Investments

Commentary
It would be an understatement to characterize 2018 as a volatile year for the equity market. Consider the range of highs and lows we witnessed. For the S&P 500® Index, it was a year in which we enjoyed an all-time high but also suffered the worst December since the 2008 financial crisis. And if that wasn't enough, we also saw the worst single-day point decline in the history of the Dow Jones Industrial Average. Through all that volatility, the S&P 500 Index ultimately registered its first negative annual return (-4.4%) since the financial crisis. Small-caps performed worse than large-caps in a risk-off environment as the Russell 2000® Index fell approximately 11% for the year. A number of concerns, including trade tensions with China, rising interest rates, a government shutdown, and rising concerns of a possible recession, were all culprits that created a jittery market.
The year started off in a sharp contrast to how it ended. The S&P 500 Index returned nearly 6% in January, followed by a sharp spike in volatility in February that culminated with the biggest single-day decline (over 1100 points) in the Dow's history. In the second and third quarters, the equity market performed well thanks to modest inflation, strong GDP data, and robust corporate earnings growth, with the S&P 500 Index hitting an all-time high in late September. But as the trade tension rhetoric ratcheted up, investors' sentiment turned decidedly negative. Coupled with concerns of slowing global economic growth and continued Federal Reserve tightening, valuation multiples were compressed as investors assigned a higher discount rate to equities to account for increased risk on the horizon. This resulted in a dramatic 20% drawdown in the S&P 500 Index and a 26% drawdown in the Russell 2000 Index from peak to trough late in the year. The sell-off was broad-based, with nine out of 11 sectors posting negative returns, while Health Care and Utilities had slight positive returns for the year. In addition, almost every global asset class sold off. The MSCI Emerging Markets Index was down 9.7% and the MSCI World ex USA Index declined approximately 10%. Commodities were no exception, as WTI crude fell nearly 25% for the year. As investors rotated into safe havens, the 10-year Treasury yield declined by approximately 60 bps in the fourth quarter to approximately 2.6% at year-end. High-yield credit spreads also widened by nearly 200 bps in the fourth quarter.
While 2018 was a challenging year in the equity market, valuations have become more reasonable, and the equity risk premium has moved up to the upper end of the recent decade.
Performance Update and Review
The Victory RS Large Cap Alpha VIP Series ("Fund") seeks to provide long-term capital appreciation. For the twelve-month period ended December 31, 2018, the Fund delivered a -9.00% absolute return, modestly underperforming the Russell 1000® Value Index, which returned -8.27%.
4
Victory Variable Insurance Funds
Victory RS Large Cap Alpha VIP Series (continued)
Solid stock selection in the Materials, Technology, and Consumer Staples sectors contributed positively to the portfolio. In particular, can manufacturer Ball Corp. (ticker: BLL; +23%) began to show progress from their acquisition of Rexam. Also, Visa (V), a global payments network operator, returned 16% on the back of strong operational momentum and improving sales and profitability. Another notable performer in the Fund was Consumer Staples company Post Holdings (ticker: POST), which returned 13% as the company announced intentions to unlock value in two segments of their portfolio via announced spin-offs. We reduced our position sizes in both POST and BLL during the year as their stock prices increased.
Contributing negatively to the Fund was negative stock selection in the Health Care and Consumer Discretionary sectors. Within Health Care, the negative selection effect was in part because of stocks we owned, such as Allergan (AGN). A global specialty pharmaceutical company, AGN returned -17% as financial results and worries over competition from new generic drug entrants competing against one of its key products weighed on the shares' valuation. Not owning a number of large-capitalization, branded pharmaceutical and medical device companies also hurt our relative performance in the Health Care sector.
Selection also lagged in the Consumer Discretionary sector. The worst performer was LKQ Corp. (ticker: LKQ), a provider of refurbished collision replacement parts for the auto industry. The stock declined over 40% as slightly slower than expected earnings growth was met with a draconian contraction in the company's valuation.
We added to our Allergan and LKQ positions during the year as their valuations became more compelling.
Outlook
As we enter our tenth year of economic expansion, a period of consistent underlying factors for equity investing, conditions are beginning to shift. Interest rates and the regulatory cycles have reached an inflection point, placing countervailing forces on the economy and markets. As for now, the U.S. economy remains quite robust and continues to be a global leader.
Energy prices remain significantly below peak levels, despite declining inventories worldwide. Natural gas prices have materially lagged oil prices. This stimulates consumer spending and confidence in the long run for the U.S. and for non-oil-producing countries abroad. In the U.S. we enjoy the competitive advantage of a long-term supply of abundant cheap natural gas.
Interest rates have moved off of their historically low levels, and now the question is which direction they will move from here. Ultimately, higher rates are a reflection of better economic performance and some inflation; however, the continued improvement is much more questionable, as the benefits from corporate tax reform have already been embedded in the economy. As with most things, the pendulum rarely stops in the middle, and the risk of the Federal Reserve tightening too much or too fast is a possibility that is gaining greater interest. Although we believe we are late in the economic cycle, the odds of an imminent recession without an unlikely full-blown trade war or some anomalistic event seem low.
We remain watchful of corporations continuing to lever their balance sheets, although some of this has been offset by strong free cash flow generation. The corporate tax cuts and the inducement to repatriate foreign cash holdings are fueling optimism and should drive higher employment, M&A activity, and capital returns such as buybacks and dividends. However, the U.S. Treasury 10-year/2-year rate spread stands at a mere 16 bps. This is the lowest
5
Victory Variable Insurance Funds
Victory RS Large Cap Alpha VIP Series (continued)
level spread we have seen since August 2007 and well below the 10-year average of 176 bps. With the Federal Reserve seemingly motivated to raise rates further, we are mindful of the possibility of an inverted yield curve. Although not perfect, an inverted yield curve has proven a fairly reliable indicator of an economic slowdown in the past.
In our estimation equity valuations remain at historically high levels, in the eighth decile on trailing operating earnings. We feel we are in the later stages of a bull market, although nothing is certain. Equities look most reasonable when comparing earnings yields to U.S. Treasuries or even corporate bond yields. In any case, we believe the values inherent in the Fund's holdings as measured by our focus on improving return on invested capital (ROIC) and strong balance sheets should make them attractive to other investors and possibly acquirers over time. Meanwhile, we believe equities are the superior asset allocation alternative to bonds over the longer term.
6
Victory Variable Insurance Funds
Victory RS Large Cap Alpha VIP Series (continued)
Average Annual Total Return
Year Ended December 31, 2018
| | Class I | |
INCEPTION DATE | | 4/13/83 | |
| | | Net Asset
Value | | Russell 1000
Value Index1 | | S&P 500 Index2 | |
One Year | | | –9.00 | % | | | –8.27 | % | | | –4.38 | % | |
Three Year | | | 5.59 | % | | | 6.95 | % | | | 9.26 | % | |
Five Year | | | 5.56 | % | | | 5.95 | % | | | 8.49 | % | |
Ten Year | | | 10.90 | % | | | 11.18 | % | | | 13.12 | % | |
Since Inception | | | 10.21 | % | | | N/A | | | | N/A | | |
Expense Ratios
Gross | | | 0.60 | % | |
With Applicable Waivers | | | 0.55 | % | |
Past performance is not indicative of future results. The performance data quoted represents past performance and current returns may be lower or higher. The investment return and principal value will fluctuate so that an investor's shares, when redeemed, may be worth more or less than the original cost. To obtain performance information current to the most recent month's end, please visit www.vcm.com.
The above expense ratios are from the Fund's prospectus dated May 1, 2018. Additional information pertaining to the Fund's expense ratios as of December 31, 2018 can be found in the financial highlights.
The total return figures set forth above include all waivers of fees for various periods since inception. Without such fee waivers, the total returns would have been lower. Some fee waivers are voluntary and may be modified or terminated at any time. The total returns do not include any insurance, sales or administrative charges of variable annuity or life insurance contracts. If these charges were included, the total returns would have been lower.
Victory RS Large Cap Alpha VIP Series — Growth of $10,000
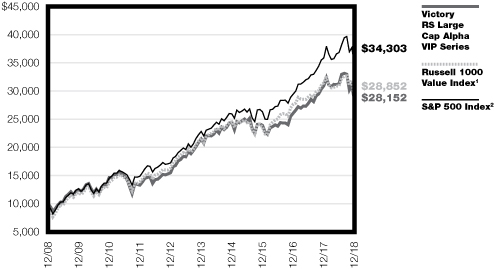
1The Russell 1000® Value Index is an unmanaged market-capitalization-weighted index that measures the performance of those companies in the Russell 1000® Index (which consists of the 1,000 largest U.S. companies based on total market capitalization) with lower price-to-book ratios and lower forecasted growth values. Index results assume the reinvestment of dividends paid on stocks constituting the index. You may not invest in the index, and, unlike the Fund, the index does not incur fees or expenses.
2The S&P 500® Index is an unmanaged index comprised of 500 domestically traded common stocks, is weighted according to the market value of each common stock in the index, and includes reinvestment of dividends. This index does not include effect of sales charges and is not representative of the Fund. It is not possible to invest directly in an index.
The graph reflects investment of growth of a hypothetical $10,000 investment in the Fund. Past performance is no guarantee of future results.
The graph and table do not reflect the deduction of taxes that a shareholder would pay on Fund distributions or the redemption of Fund shares.
7
Victory Variable Insurance Funds
Victory RS Large Cap Alpha VIP Series | | Schedule of Portfolio Investments
December 31, 2018 | |
Security Description | | Shares | | Value | |
Common Stocks (98.6%) | |
Communication Services (8.2%): | |
Alphabet, Inc., Class A (a) | | | 30,395 | | | $ | 31,761,559 | | |
Facebook, Inc., Class A (a) | | | 288,010 | | | | 37,755,231 | | |
| | | | 69,516,790 | | |
Consumer Discretionary (6.8%): | |
Aramark | | | 770,850 | | | | 22,331,525 | | |
Booking Holdings, Inc. (a) | | | 10,070 | | | | 17,344,769 | | |
LKQ Corp. (a) | | | 776,690 | | | | 18,430,854 | | |
| | | | 58,107,148 | | |
Consumer Staples (7.6%): | |
Keurig Dr Pepper, Inc. (b) | | | 201,030 | | | | 5,154,409 | | |
Mondelez International, Inc., Class A | | | 806,750 | | | | 32,294,202 | | |
Post Holdings, Inc. (a) | | | 41,904 | | | | 3,734,904 | | |
The Kraft Heinz Co. | | | 535,910 | | | | 23,065,566 | | |
| | | | 64,249,081 | | |
Energy (11.8%): | |
Chevron Corp. | | | 215,180 | | | | 23,409,432 | | |
Devon Energy Corp. | | | 437,821 | | | | 9,868,485 | | |
Diamondback Energy, Inc. | | | 124,250 | | | | 11,517,975 | | |
Enterprise Products Partners LP | | | 961,290 | | | | 23,638,122 | | |
EQT Corp. | | | 777,840 | | | | 14,693,398 | | |
Equitrans Midstream Corp. (a) | | | 307,853 | | | | 6,163,217 | | |
Helmerich & Payne, Inc. | | | 112,550 | | | | 5,395,647 | | |
Noble Energy, Inc. | | | 312,120 | | | | 5,855,371 | | |
| | | | 100,541,647 | | |
Financials (23.3%): | |
Aflac, Inc. | | | 494,750 | | | | 22,540,810 | | |
American International Group, Inc. | | | 230,430 | | | | 9,081,246 | | |
Brown & Brown, Inc. | | | 984,800 | | | | 27,141,087 | | |
Cincinnati Financial Corp. (b) | | | 283,430 | | | | 21,943,151 | | |
Citigroup, Inc. | | | 568,880 | | | | 29,615,892 | | |
E*TRADE Financial Corp. | | | 275,025 | | | | 12,068,097 | | |
Hartford Financial Services Group, Inc. | | | 435,330 | | | | 19,350,419 | | |
The PNC Financial Services Group, Inc. | | | 172,360 | | | | 20,150,608 | | |
U.S. Bancorp | | | 368,640 | | | | 16,846,848 | | |
Wells Fargo & Co. | | | 387,370 | | | | 17,850,010 | | |
| | | | 196,588,168 | | |
Health Care (13.8%): | |
Allergan PLC | | | 224,827 | | | | 30,050,377 | | |
AstraZeneca PLC, ADR | | | 261,210 | | | | 9,920,756 | | |
CVS Health Corp. | | | 449,765 | | | | 29,468,603 | | |
Quest Diagnostics, Inc. | | | 124,380 | | | | 10,357,123 | | |
UnitedHealth Group, Inc. | | | 69,295 | | | | 17,262,770 | | |
Zimmer Biomet Holdings, Inc. | | | 192,760 | | | | 19,993,067 | | |
| | | | 117,052,696 | | |
See notes to financial statements.
8
Victory Variable Insurance Funds
Victory RS Large Cap Alpha VIP Series | | Schedule of Portfolio Investments — continued
December 31, 2018 | |
Security Description | | Shares | | Value | |
Industrials (5.5%): | |
Eaton Corp. PLC, ADR | | | 253,240 | | | $ | 17,387,458 | | |
Sensata Technologies Holding PLC, ADR (a) | | | 363,150 | | | | 16,283,646 | | |
Union Pacific Corp. | | | 93,900 | | | | 12,979,797 | | |
| | | | 46,650,901 | | |
Information Technology (8.4%): | |
Cognizant Technology Solutions Corp., Class A | | | 263,767 | | | | 16,743,929 | | |
FleetCor Technologies, Inc. (a) | | | 101,040 | | | | 18,765,149 | | |
Visa, Inc., Class A | | | 267,920 | | | | 35,349,365 | | |
| | | | 70,858,443 | | |
Materials (4.7%): | |
Ball Corp. | | | 170,220 | | | | 7,826,716 | | |
Freeport-McMoRan, Inc. | | | 978,670 | | | | 10,090,088 | | |
Sealed Air Corp. (b) | | | 614,800 | | | | 21,419,632 | | |
| | | | 39,336,436 | | |
Real Estate (4.5%): | |
Equity Commonwealth | | | 649,800 | | | | 19,500,498 | | |
Invitation Homes, Inc. (b) | | | 934,280 | | | | 18,760,342 | | |
| | | | 38,260,840 | | |
Utilities (4.0%): | |
Duke Energy Corp. | | | 219,090 | | | | 18,907,467 | | |
Exelon Corp. | | | 328,260 | | | | 14,804,526 | | |
| | | | 33,711,993 | | |
Total Common Stocks (Cost $838,411,671) | | | 834,874,143 | | |
Collateral for Securities Loaned^ (1.0%) | |
BlackRock Liquidity Funds TempFund Portfolio,
Institutional Class, 2.49% (c) | | $ | 1,618,811 | | | | 1,618,811 | | |
Fidelity Investments Money Market Government Portfolio,
Class I, 2.28% (c) | | | 2,339,104 | | | | 2,339,104 | | |
Fidelity Investments Prime Money Market Portfolio,
Class I, 2.46% (c) | | | 72,232 | | | | 72,232 | | |
Goldman Sachs Financial Square Prime Obligations Fund,
Institutional Class, 2.55% (c) | | | 899,349 | | | | 899,349 | | |
JPMorgan Prime Money Market Fund, Capital Class, 2.49% (c) | | | 1,438,869 | | | | 1,438,869 | | |
Morgan Stanley Institutional Liquidity Prime Portfolio,
Institutional Class, 2.58% (c) | | | 2,158,438 | | | | 2,158,438 | | |
Total Collateral for Securities Loaned (Cost $8,526,803) | | | 8,526,803 | | |
Total Investments (Cost $846,938,474) — 99.6% | | | 843,400,946 | | |
Other assets in excess of liabilities — 0.4% | | | 3,589,255 | | |
NET ASSETS — 100.00% | | $ | 846,990,201 | | |
See notes to financial statements.
9
Victory Variable Insurance Funds
Victory RS Large Cap Alpha VIP Series | | Schedule of Portfolio Investments — continued
December 31, 2018 | |
^ Purchased with cash collateral from securities on loan.
(a) Non-income producing security.
(b) All or a portion of this security is on loan.
(c) Rate disclosed is the daily yield on December 31, 2018.
ADR — American Depositary Receipt
LP — Limited Partnership
PLC — Public Limited Company
See notes to financial statements.
10
Victory Variable Insurance Funds | | Statement of Assets and Liabilities
December 31, 2018 | |
| | | Victory
RS Large Cap
Alpha VIP
Series | |
ASSETS: | |
Investments, at value (Cost 846,938,474) | | $ | 843,400,946 | (a) | |
Cash and cash equivalents | | | 12,439,001 | | |
Interest and dividends receivable | | | 606,034 | | |
Receivable for capital shares issued | | | 714 | | |
Receivable for investments sold | | | 641,704 | | |
Receivable from Adviser | | | 280,727 | | |
Total Assets | | | 857,369,126 | | |
LIABILITIES: | |
Payables: | |
Collateral received on loaned securities | | | 8,526,803 | | |
Investments purchased | | | 895,698 | | |
Capital shares redeemed | | | 326,940 | | |
Accrued expenses and other payables: | |
Investment advisory fees | | | 371,985 | | |
Administration fees | | | 45,647 | | |
Custodian fees | | | 11,050 | | |
Transfer agent fees | | | 104,727 | | |
Chief Compliance Officer fees | | | 1,766 | | |
Trustees' fees | | | 880 | | |
Other accrued expenses | | | 93,429 | | |
Total Liabilities | | | 10,378,925 | | |
NET ASSETS: | |
Capital | | | 700,987,208 | | |
Total distributable earnings/(loss) | | | 146,002,993 | | |
Net Assets | | $ | 846,990,201 | | |
Shares Outstanding (unlimited shares authorized, with a par value of
$0.001 per share): | | | 19,494,720 | | |
Net asset value: | | $ | 43.45 | | |
(a) Includes $8,444,730 of securities on loan.
See notes to financial statements.
11
Victory Variable Insurance Funds | | Statement of Operations
For the Year Ended December 31, 2018 | |
| | | Victory
RS Large Cap
Alpha VIP
Series | |
Investment Income: | |
Dividends | | $ | 16,207,889 | | |
Interest | | | 319,062 | | |
Securities lending (net of fees) | | | 61,836 | | |
Total Income | | | 16,588,787 | | |
Expenses: | |
Investment advisory fees | | | 5,022,726 | | |
Administration fees | | | 600,519 | | |
Custodian fees | | | 45,478 | | |
Transfer agent fees | | | 210,161 | | |
Trustees' fees | | | 81,909 | | |
Chief Compliance Officer fees | | | 8,660 | | |
Legal and audit fees | | | 124,801 | | |
Other expenses | | | 118,151 | | |
Total Expenses | | | 6,212,405 | | |
Expenses waived/reimbursed by Adviser | | | (690,695 | ) | |
Net Expenses | | | 5,521,710 | | |
Net Investment Income (Loss) | | | 11,067,077 | | |
Realized/Unrealized Gains (Losses) from Investment Transactions: | |
Net realized gains (losses) from investment transactions | | | 137,400,719 | | |
Net change in unrealized appreciation/depreciation on investments | | | (229,244,068 | ) | |
Net realized/unrealized gains (losses) on investments | | | (91,843,349 | ) | |
Change in net assets resulting from operations | | $ | (80,776,272 | ) | |
See notes to financial statements.
12
Victory Variable Insurance Funds | | Statements of Changes in Net Assets | |
| | | Victory RS Large Cap Alpha VIP Series | |
| | | Year
Ended
December 31,
2018 | | Year
Ended
December 31,
2017 | |
From Investment Activities: | |
Operations: | |
Net investment income (loss) | | $ | 11,067,077 | | | $ | 10,474,413 | | |
Net realized gains (losses) from investment
transactions | | | 137,400,719 | | | | 103,673,960 | | |
Net change in unrealized appreciation (depreciation)
on investments | | | (229,244,068 | ) | | | 62,191,294 | | |
Change in net assets resulting from operations | | | (80,776,272 | ) | | | 176,339,667 | | |
Distributions to Shareholders: (a) | |
Change in net assets resulting from distributions to
shareholders | | | (99,131,571 | ) | | | (10,800,168 | ) | |
Change in net assets resulting from capital transactions | | | (33,842,009 | ) | | | (125,399,135 | ) | |
Change in net assets | | | (213,749,852 | ) | | | 40,140,364 | | |
Net Assets: | |
Beginning of period | | | 1,060,740,053 | | | | 1,020,599,689 | | |
End of period | | $ | 846,990,201 | | | $ | 1,060,740,053 | | |
Capital Transactions: | |
Proceeds from shares issued | | $ | 17,538,132 | | | $ | 8,905,556 | | |
Distributions reinvested | | | 99,131,571 | | | | 10,800,168 | | |
Cost of shares redeemed | | | (150,511,712 | ) | | | (145,104,859 | ) | |
Change in net assets resulting from capital transactions | | $ | (33,842,009 | ) | | $ | (125,399,135 | ) | |
Share Transactions: | |
Issued | | | 327,122 | | | | 181,681 | | |
Reinvested | | | 2,271,183 | | | | 199,449 | | |
Redeemed | | | (2,743,529 | ) | | | (2,937,643 | ) | |
Change in Shares | | | (145,224 | ) | | | (2,556,513 | ) | |
(a) Current and prior year distributions to shareholders have been reclassified and conform to amended GAAP presentation under Regulation S-X (See Item 10 in the Notes to Financial Statements).
See notes to financial statements.
13
Victory Variable Insurance Funds | | Financial Highlights | |
For a Share Outstanding Throughout Each Period
| | | Victory RS Large Cap Alpha VIP Series | |
| | | Year
Ended
December 31,
2018 | | Year
Ended
December 31,
2017 | | Year
Ended
December 31,
2016 | | Year
Ended
December 31,
2015 | | Year
Ended
December 31,
2014 | |
Net Asset Value, Beginning of Period | | $ | 54.01 | | | $ | 45.98 | | | $ | 44.26 | | | $ | 50.63 | | | $ | 51.52 | | |
Investment Activities: | |
Net investment income (loss) | | | 0.60 | (a) | | | 0.51 | (a) | | | 0.50 | (a) | | | 0.60 | (a) | | | 0.73 | | |
Net realized and unrealized gains
(losses) on investments | | | (5.44 | ) | | | 8.07 | | | | 3.50 | | | | (1.64 | ) | | | 6.21 | | |
Total from Investment Activities | | | (4.84 | ) | | | 8.58 | | | | 4.00 | | | | (1.04 | ) | | | 6.94 | | |
Distributions to Shareholders: | |
Net investment income | | | (0.02 | ) | | | (0.55 | ) | | | (0.52 | ) | | | (0.67 | ) | | | (0.71 | ) | |
Net realized gains from investments | | | (5.70 | ) | | | — | | | | (1.76 | ) | | | (4.66 | ) | | | (7.12 | ) | |
Total Distributions to
Shareholders | | | (5.72 | ) | | | (0.55 | ) | | | (2.28 | ) | | | (5.33 | ) | | | (7.83 | ) | |
Capital Contributions from Prior
Custodian, Net (See Note 8) | | | — | | | | — | | | | — | (b) | | | — | | | | — | | |
Net Asset Value, End of Period | | $ | 43.45 | | | $ | 54.01 | | | $ | 45.98 | | | $ | 44.26 | | | $ | 50.63 | | |
Total Return (c) | | | (9.00 | )% | | | 18.67 | % | | | 9.03 | %(d) | | | (2.01 | )% | | | 13.58 | % | |
Ratios/Supplemental Data: | |
Net Assets at end of period (000) | | $ | 846,990 | | | $ | 1,060,740 | | | $ | 1,020,600 | | | $ | 1,015,821 | | | $ | 1,148,698 | | |
Ratio of net expenses to average
net assets | | | 0.55 | % | | | 0.55 | % | | | 0.54 | % | | | 0.55 | % | | | 0.55 | % | |
Ratio of net investment income (loss) to
average net assets | | | 1.10 | % | | | 1.02 | % | | | 1.12 | % | | | 1.20 | % | | | 1.27 | % | |
Ratio of gross expenses to average
net assets | | | 0.62 | %(e) | | | 0.60 | %(e) | | | 0.54 | % | | | 0.55 | % | | | 0.55 | % | |
Portfolio turnover | | | 60 | % | | | 56 | % | | | 84 | % | | | 47 | % | | | 56 | % | |
(a) Per share net investment income (loss) has been calculated using the average daily shares method.
(b) Amount is less than $0.005 per share.
(c) Total returns do not reflect the effects of charges deducted pursuant to the terms of The Guardian Insurance & Annuity Company, Inc.'s variable contracts. Inclusion of such charges would reduce the total returns for all periods shown.
(d) The Fund received monies related to a nonrecurring refund from the prior Custodian. The corresponding impact to the total return was less than 0.01% for the period shown. (See Note 8)
(e) During the period, certain fees were reduced and/or reimbursed. If such fee reductions and/or reimbursements had not occurred, the ratios would have been as indicated.
See notes to financial statements.
14
Victory Variable Insurance Funds | | Notes to Financial Statements
December 31, 2018 | |
1. Organization:
Victory Variable Insurance Funds (the "Trust") was organized on February 11, 1998 as a Delaware statutory trust. The Trust is registered under the Investment Company Act of 1940, as amended (the "1940 Act"), as a diversified open-end investment company. The Trust is comprised of nine funds and is authorized to issue an unlimited number of shares, which are units of beneficial interest with a par value of $0.001 per share.
The accompanying financial statements are those of the Victory RS Large Cap Alpha VIP Series (the "Fund"). The Fund offers a single class of shares: Class I Shares. Sales of shares of the Fund may only be made to certain separate accounts of The Guardian Insurance & Annuity Company, Inc. ("GIAC") that fund certain variable annuity and variable life insurance contracts issued by GIAC. GIAC is a wholly owned subsidiary of The Guardian Life Insurance Company of America ("Guardian Life").
Under the Trust's organizational documents, its officers and trustees are indemnified against certain liabilities arising out of the performance of their duties to the Fund. In addition, in the normal course of business, the Fund enters into contracts with its vendors and others that provide for general indemnifications. The Fund's maximum exposure under these arrangements is unknown, as this would involve future claims that may be made against the Fund. However, based on experience, the Fund expects that risk of loss to be remote.
2. Significant Accounting Policies:
The following is a summary of significant accounting policies followed by the Trust in the preparation of its financial statements. The policies are in conformity with accounting principles generally accepted in the United States of America ("GAAP"). The preparation of financial statements in accordance with GAAP requires management to make estimates and assumptions that affect the reported amounts of assets and liabilities and disclosure of contingent assets and liabilities at the date of the financial statements and the reported amounts of income and expenses for the period. Actual results could differ from those estimates. The Fund follows the specialized accounting and reporting requirements under GAAP that are applicable to investment companies.
Investment Valuation:
The Fund records investments at fair value. Fair value is defined as the price that would be received to sell an asset or paid to transfer a liability in an orderly transaction between market participants at the measurement date.
The valuation techniques described below maximize the use of observable inputs and minimize the use of unobservable inputs in determining fair value. The inputs used for valuing the Fund's investments are summarized in the three broad levels listed below:
• Level 1 — quoted prices in active markets for identical securities
• Level 2 — other significant observable inputs (including quoted prices for similar securities or interest rates applicable to those securities, etc.)
• Level 3 — significant unobservable inputs (including the Fund's own assumptions in determining the fair value of investments)
Changes in valuation techniques may result in transfers in or out of an assigned level within the disclosure hierarchy. The inputs or methodologies used for valuation techniques are not necessarily an indication of the risk associated with entering into those investments.
Portfolio securities listed or traded on securities exchanges, including American Depositary Receipts ("ADRs") and Rights, are valued at the closing price on the exchange or system where the security is principally traded, if available, or at the Nasdaq Official Closing Price. If there have been no sales for that day on the exchange or system, then a security is valued at the last available bid quotation on the exchange or system where the security is principally traded. In each of these situations, valuations are typically categorized as Level 1 in the fair value hierarchy.
15
Victory Variable Insurance Funds | | Notes to Financial Statements — continued
December 31, 2018 | |
Investments for which there are no such quotations, or for which quotations do not appear reliable, are valued at fair value in accordance with procedures established by and under the general supervision and responsibility of the Trust's Board of Trustees (the "Board"). These valuations are typically categorized as Level 2 or Level 3 in the fair value hierarchy, based on the observability of inputs used to determine the fair value.
A summary of the valuations as of December 31, 2018, based upon the three levels defined above, is included in the table below while the breakdown, by category, of investments is disclosed in the Schedule of Portfolio Investments:
| | | LEVEL 1 —
Quoted Prices | | Total | |
| | | Investments
in
Securities | | Investments
in
Securities | |
Common Stocks | | $ | 834,874,143 | | | $ | 834,874,143 | | |
Collateral for Securities Loaned | | | 8,526,803 | | | | 8,526,803 | | |
Total | | $ | 843,400,946 | | | $ | 843,400,946 | | |
For the year ended December 31, 2018, there were no Level 3 investments for which significant unobservable inputs were used to determine fair value.
Investment Transactions and Related Income:
Changes in holdings of investments are accounted for no later than one business day following the trade date. For financial reporting purposes, however, investment transactions are accounted for on trade date on the last business day of the reporting period. Interest income is recognized on an accrual basis and includes, where applicable, the amortization of premiums or accretion of discounts. Dividend income is recorded on the ex-dividend date. Gains or losses realized on sales of securities are determined by comparing the identified cost of the security lot sold with the net sales proceeds.
Withholding taxes on interest, dividends and gains as a result of certain investments in ADRs by the Fund have been provided for in accordance with each investment's applicable country's tax rules and rates.
Securities Lending:
The Trust has entered into a Master Securities Lending Agreement ("MSLA") with Citibank, N.A. ("Citibank" or the "Agent"). Under the terms of the MSLA, the Fund may lend securities to certain broker-dealers and banks in exchange for collateral in the amount of at least 102% of the value of U.S. securities loaned or at least 105% of the value of non-U.S. securities loaned, marked-to-market daily. Any collateral shortfalls associated with increases in the valuation of the securities loaned are adjusted the next business day. The collateral can be received in the form of cash collateral and/or non-cash collateral. Non-cash collateral can include U.S. Government Securities, letters of credit and certificates of deposit. The cash collateral is invested in short-term instruments or cash equivalents as noted on the Fund's Schedule of Portfolio Investments. The Trust does not have effective control of the non-cash collateral and therefore it is not disclosed in the Fund's Schedule of Portfolio Investments. The Fund continues to benefit from interest or dividends on the securities loaned and may also earn a return from the collateral. The Fund pays various fees in connection with the investment of cash collateral. The Fund pays the Agent fees based on the investment income received from securities lending activities. Securities lending income is disclosed in the Fund's Statement of Operations. Although risk is mitigated by the collateral, the Fund could experience a delay in recovering its securities and possible loss of income or value if the borrower fails to return them.
Securities lending transactions are entered into by the Fund under the MSLA, which permits the Fund, under certain circumstances such as an event of default, to offset amounts payable by the Fund to the same counterparty against amounts receivable from the counterparty to create a net payment due to or from the Fund.
16
Victory Variable Insurance Funds | | Notes to Financial Statements — continued
December 31, 2018 | |
The following table is a summary of the Fund's securities lending transactions which are subject to offset under the MSLA as of December 31, 2018. These transactions are accounted for as secured borrowings with an overnight and continuous contractual maturity for cash collateral, and greater than overnight and continuous contractual maturity for non-cash collateral.
Gross
Amount of
Recognized
Assets
(Value of | | Value of
Cash | | Value of Non-cash Collateral
Received by Maturity | | | |
Securities
on Loan) | | Collateral
Received | | <30 Days | | Between 30
& 90 days | | >90 Days | | Net Amount | |
| $ | 8,444,730 | | | $ | 8,526,803 | | | $ | — | | | $ | — | | | $ | — | | | $ | 82,073 | | |
Dividends to Shareholders:
Dividends from net investment income, if any, are declared and paid annually by the Fund. Distributable net realized gains, if any, are declared and distributed at least annually.
The amounts of dividends from net investment income and distributions from net realized gains are determined in accordance with federal income tax regulations, which may differ from GAAP. To the extent these "book/tax" differences are permanent in nature (e.g., net operating loss, distribution reclassification, and deemed distribution due to shareholder redemptions), such amounts are reclassified within the components of net assets based on their federal tax-basis treatment; temporary differences (e.g., wash sales) do not require reclassification. To the extent dividends and distributions exceed net investment income and net realized gains for tax purposes, they are reported as distributions of capital. Net investment losses incurred by the Fund may be reclassified as an offset to capital on the accompanying Statement of Assets and Liabilities.
As of December 31, 2018, on the Statement of Assets and Liabilities, as a result of permanent book-to-tax differences, reclassification adjustments were $701 and $(701) for total distributable earnings/(loss) and Capital, respectively.
Federal Income Taxes:
It is the policy of the Fund to continue to qualify as a regulated investment company by complying with the provisions available to certain investment companies, as defined in applicable sections of the Internal Revenue Code, and to make distributions of net investment income and net realized gains sufficient to relieve it from all, or substantially all, federal income taxes. Accordingly, no provision for federal income taxes is required in the financial statements. The Fund has a tax year end of December 31.
Management of the Fund has reviewed tax positions taken in tax years that remain subject to examination by all major tax jurisdictions, including federal (i.e., the last four tax year ends and the interim tax period since then). Management believes that there is no tax liability resulting from unrecognized tax benefits related to uncertain tax positions taken.
Allocations:
Expenses directly attributable to the Fund are charged to the Fund, while expenses which are attributable to more than one fund in the Trust, or jointly with an affiliated trust, are allocated among the respective funds in the Trust and/or affiliated trust based upon net assets or another appropriate basis.
Affiliated Securities Transactions:
Pursuant to Rule 17a-7 under the 1940 Act, the Fund may engage in securities transactions with affiliated investment companies and advisory accounts managed by the Adviser and any applicable sub-adviser. Any such purchase or sale transaction must be effected without brokerage commission or
17
Victory Variable Insurance Funds | | Notes to Financial Statements — continued
December 31, 2018 | |
other remuneration, except for customary transfer fees. The transaction must be effected at the current market price, which is either the security's last sale price on an exchange or, if there are no transactions in the security that day, at the average of the highest bid and lowest asked price. For the year ended December 31, 2018, the Fund did not engage in any Rule 17a-7 transactions under the 1940 Act.
3. Purchases and Sales of Securities:
Purchases and sales of securities (excluding securities maturing less than one year from acquisition) for the year ended December 31, 2018 were as follows:
| Purchases | | Sales | |
| $ | 587,240,888 | | | $ | 706,599,413 | | |
For the year ended December 31, 2018, there were no purchases or sales of U.S. Government Securities.
4. Fees and Transactions with Affiliates and Related Parties:
Investment advisory services are provided to the Fund by Victory Capital Management Inc. ("VCM" or the "Adviser"), a New York corporation registered as an investment adviser with the Securities and Exchange Commission ("SEC"). The Adviser is a wholly-owned indirect subsidiary of Victory Capital Holdings Inc., a publicly traded Delaware corporation and a wholly-owned direct subsidiary of Victory Capital Operating, LLC.
Under the terms of the Investment Advisory Agreement, the Adviser is entitled to receive 0.50% of the average daily net assets of the Fund. The Adviser may use its resources to assist with the Fund's distribution and marketing expenses.
VCM also serves as the Fund's administrator and fund accountant. Under an Administration and Fund Accounting Agreement, VCM is paid for its services an annual fee at a rate of 0.08% of the first $15 billion in average daily net assets of the Trust, Victory Portfolios and Victory Portfolios II (collectively, the "Trusts"), 0.05% of the average daily net assets above $15 billion to $30 billion of the Trusts and 0.04% of the average daily net assets over $30 billion of the Trusts.
Citi Fund Services Ohio, Inc. ("Citi"), an affiliate of Citibank N.A., acts as sub-administrator and sub-fund accountant to the Fund pursuant to a Sub-Administration and Sub-Fund Accounting Services Agreement between VCM and Citi. VCM pays Citi a fee for providing these services. The Trust reimburses VCM and Citi for all of their reasonable out-of-pocket expenses incurred in providing these services.
FIS Investor Services, LLC ("FIS") serves as the Fund's transfer agent. Under the Transfer Agent Agreement, the Trust pays FIS a fee for its services and reimburses FIS for all of their reasonable out-of-pocket expenses incurred in providing these services.
The Chief Compliance Officer ("CCO") is an employee of the Adviser, which pays the compensation of the CCO and his support staff. The Trust has entered into an Agreement to provide compliance services with the Adviser, pursuant to which the Adviser furnishes its compliance personnel, including the services of the CCO, and other resources reasonably necessary to provide the Trust with compliance oversight services related to the design, administration and oversight of a compliance program for the Trust in accordance with Rule 38a-1 under the 1940 Act. Funds in the Trust, Victory Portfolios, Victory Institutional Funds, and Victory Portfolios II (collectively, the "Victory Funds Complex"), in the aggregate, compensate the Adviser for these services.
The Victory Funds Complex pays an annual retainer to each Independent Trustee, plus an additional annual retainer to the Chairman of the Board. The aggregate amount of the fees and expenses of the Independent Trustees are allocated amongst all the funds in the Victory Funds Complex and are presented in the Statement of Operations.
Shearman & Sterling LLP provides legal services to the Trust.
Victory Capital Advisers, Inc. (the "Distributor"), an affiliate of the Adviser, serves as distributor for the continuous offering of the shares of the Fund pursuant to a Distribution Agreement between the Distributor and the Trust.
18
Victory Variable Insurance Funds | | Notes to Financial Statements — continued
December 31, 2018 | |
The Adviser has entered into an expense limitation agreement with the Fund until at least April 30, 2019. Under the terms of the agreement, the Adviser has agreed to waive fees or reimburse certain expenses to the extent that ordinary operating expenses incurred by certain classes of the Fund in any fiscal year exceed the expense limit for such classes of the Fund. Such excess amounts will be the liability of the Adviser. Interest, taxes, brokerage commissions, other expenditures which are capitalized in accordance with GAAP, and other extraordinary expenses not incurred in the ordinary course of a Fund's business are excluded from the expense limits. For the year ended December 31, 2018, the expense limit (excluding voluntary waivers) is 0.55%.
The Fund has agreed to repay fees and expenses that were waived or reimbursed by the Adviser for a period up to three fiscal years after such waiver or reimbursement was made to the extent such payments or repayments would not cause the expenses of a class to exceed the original expense limitation in place at the time of the waiver or reimbursement or any expense limitation agreement in place at the time of repayment. As of December 31, 2018, the following amounts are available to be repaid to the Adviser. Amounts repaid to the Adviser during the year ended, if any, are reflected on the Statement of Operations as "Recoupment of prior expenses waived/reimbursed by Adviser".
| Expires 12/31/2020 | | Expires 12/31/2021 | |
| $ | 522,796 | | | $ | 690,695 | | |
The Adviser may voluntarily waive or reimburse additional fees to assist the Fund in maintaining a competitive expense ratio. Voluntary waivers and reimbursements applicable to the Fund are not available to be recouped at a future time. There were no voluntary waivers or reimbursements for the year ended December 31, 2018.
Certain officers and/or interested trustees of the Fund are also officers and/or employees of the Adviser, Administrator, Fund Accountant, Sub-Administrator, Sub-Fund Accountant, and Legal.
5. Risks:
The Fund may be subject to other risks in addition to these identified risks.
An investment in the Fund's shares represents an indirect investment in the securities owned by the Fund, some of which will be traded on a national securities exchange or in the over-the-counter markets. The value of the securities in which the Fund invests, like other market investments, may move up or down, sometimes rapidly and unpredictably. The value of the securities in which the Fund invests may affect the value of the Fund's shares. An investment in the Fund's shares at any point in time may be worth less than the original investment, even after taking into account the reinvestment of the Fund's distributions.
The Fund will be subject to credit risk with respect to the amount it expects to receive from counterparties for financial instruments entered into by the Fund. The Fund may be negatively impacted if a counterparty becomes bankrupt or otherwise fails to perform its obligations due to financial difficulties. The Fund may experience significant delays in obtaining any recovery in bankruptcy or other reorganization proceeding and the Fund may obtain only limited recovery or may obtain no recovery in such circumstances. The Fund typically enters into transactions with counterparties whose credit ratings are investment grade, as determined by a nationally recognized statistical rating organization or, if unrated, judged by the Adviser to be of comparable quality.
6. Borrowing and Interfund Lending:
Line of Credit:
The Victory Funds Complex participates in a short-term, demand note "Line of Credit" agreement with Citibank. Under the agreement with Citibank, the Victory Funds Complex may borrow up to $250 million, of which $100 million is committed and $150 million is uncommitted. $40 million of the Line of Credit is reserved for use by the Victory Floating Rate Fund, another series of the Victory Funds Complex, with that Fund paying the related commitment fees for that amount. The purpose of the agreement is to meet temporary or emergency cash needs, including redemption requests that might
19
Victory Variable Insurance Funds | | Notes to Financial Statements — continued
December 31, 2018 | |
otherwise require the untimely disposition of securities. The current agreement was amended on July 27, 2018 with a new termination date of July 26, 2019. Citibank receives an annual commitment fee of 0.15% on $100 million for providing the Line of Credit. For the year ended December 31, 2018, Citibank earned approximately $150,000 in commitment fees from the Victory Funds Complex. Each fund in the Victory Funds Complex pays a pro-rata portion of the commitment fees plus any interest on amounts borrowed. Interest accrued by the Fund during the period is presented on the Statement of Operations under Interest expense on line of credit.
The Fund did not utilize or participate in the Line of Credit during the year ended December 31, 2018.
Interfund Lending:
The Trust and Adviser rely on an exemptive order granted by the SEC in March 2017 (the "Order"), permitting the establishment and operation of an Interfund Lending Facility (the "Facility"). The Facility allows the Fund to directly lend and borrow money to or from any other Victory Fund relying upon the Order at rates beneficial to both the borrowing and lending funds. Advances under the Facility are allowed for temporary or emergency purposes, including the meeting of redemption requests that otherwise might require the untimely disposition of securities, and are subject to each Fund's borrowing restrictions. The interfund loan rate is determined, as specified in the Order, by averaging the current repurchase agreement rate and the current bank loan rate. Interest accrued by the Fund during the period is presented on the Statement of Operations under Interest expense on interfund lending.
The Fund did not utilize or participate in the Facility during the year ended December 31, 2018.
7. Federal Income Tax Information:
The tax character of distributions paid during the tax years ended, as noted below, were as follows (total distributions paid may differ from the Statements of Changes in Net Assets because, for tax purposes, dividends are recognized when actually paid).
Year Ended December 31, 2018 | |
Distributions paid from | |
Ordinary
Income | | Net
Long-Term
Capital Gains | | Total
Distributions
Paid | |
| $ | 11,515,218 | | | $ | 87,616,353 | | | $ | 99,131,571 | | |
Year Ended December 31, 2017 | |
Distributions paid from | |
Ordinary
Income | | Net
Long-Term
Capital Gains | | Total
Distributions
Paid | |
| $ | 10,800,168 | | | $ | — | | | $ | 10,800,168 | | |
As of the tax year ended December 31, 2018, the components of accumulated earnings (deficit) on a tax basis were as follows:
Undistributed
Ordinary
Income | | Undistributed
Long-Term
Capital Gains | | Accumulated
Earnings | | Unrealized
Appreciation
(Depreciation)* | | Total
Accumulated
Earnings
(Deficit) | |
| $ | 10,660,966 | | | $ | 137,576,831 | | | $ | 148,237,797 | | | $ | (2,234,804 | ) | | $ | 146,002,993 | | |
*The difference between the book-basis and tax-basis unrealized appreciation (depreciation) is attributable primarily to tax deferral of losses on wash sales.
During the tax year ended December 31, 2018, the Fund did not utilize capital loss carryforwards.
20
Victory Variable Insurance Funds | | Notes to Financial Statements — continued
December 31, 2018 | |
As of December 31, 2018, the cost basis for federal income tax purposes, gross unrealized appreciation, gross unrealized depreciation and net unrealized appreciation (depreciation) for investments were as follows:
Cost of
Investments
for Federal
Tax Purposes | | Gross
Unrealized
Appreciation | | Gross
Unrealized
Depreciation | | Net
Unrealized
Appreciation
(Depreciation) | |
| $ | 845,635,750 | | | $ | 238,118,674 | | | $ | (240,353,478 | ) | | $ | (2,234,804 | ) | |
8. Capital Contribution from Prior Custodian:
During 2016, the Fund received notification from the Fund's prior custodian, State Street Bank and Trust ("State Street"), concerning issues related to billing on certain categories of expenses during the approximately 16-year period from 1998 through October 31, 2014. The over-billing primarily related to categories of expenses that involved an allocation of general costs among multiple clients.
State Street paid the refunded amounts during January 2017. Based on billing information received during 2016 from State Street and an analysis of any expense limitation agreements that were in place during the period of the activities in question, including the application of any recoupment provisions in such agreements, the Adviser received a portion of the refund.
The portion of the refund retained by the Fund was accounted for as a capital contribution and is reflected on the Financial Highlights as "Capital Contribution from Prior Custodian, Net".
9. Fund Ownership:
Ownership of more than 25% of the voting securities of a fund creates presumptions of control of the fund, under section 2(a)(9) of the 1940 Act. As of December 31, 2018, the shareholders listed below held more than 25% of the shares outstanding of the Fund and may be deemed to control the Fund.
| Shareholder | | Percent | |
| GIAC | | | 99.8 | % | |
10. Recent Accounting Pronouncements:
In October 2016, the SEC released its Final Rules on Investment Company Reporting Modernization (the "Rules"). The Rules introduced two new regulatory reporting forms for investment companies, Form N-PORT and Form N-CEN. The Fund's compliance date for Form N-PORT was June 1, 2018, and the Fund will make its initial filing with the SEC on Form N-PORT for the period ending March 31, 2019. Effective with the period ended June 30, 2018, the Fund was required to maintain, and make available to the SEC upon request, the information required to be included in Form N-PORT. Form N-PORT will replace Form N-Q filings effective with the requirement to file the Form N-PORT with the SEC for the period ending March 31, 2019. The Fund's compliance date for Form N-CEN was June 1, 2018, and the Fund will make its initial filing on Form N-CEN for the period ended December 31, 2018. Form N-CEN will replace Form N-SAR filings. The Fund's adoption of these amendments have no effect on the Fund's net assets or results of operations.
In August 2018, the FASB issued ASU No. 2018-13, "Fair Value Measurements" ("ASU 2018-13"). This update makes certain removals from, changes to and additions to existing disclosure requirements for fair value measurements. ASU 2018-13 does not change fair value measurements already required or permitted by existing standards. ASU 2018-13 is effective for financial statements issued for fiscal years beginning after December 15, 2019, and interim periods within those fiscal years. As permitted, the Fund has early adopted ASU 2018-13 with the financial statements prepared as of December 31, 2018.
In August 2018, the SEC adopted amendments to certain financial statement disclosure requirements to conform them to GAAP for investment companies. These amendments made certain disclosure requirements effective under Regulation S-X. The Fund's adoption of these amendments, effective with
21
Victory Variable Insurance Funds | | Notes to Financial Statements — continued
December 31, 2018 | |
the financial statements prepared as of December 31, 2018 had no effect on the Fund's net assets or results of operations. As a result of adopting these amendments, the distributions to shareholders in the December 31, 2017 Statements of Changes in Net Assets presented herein have been reclassified to conform to the current year presentation, which includes all distributions to each class of shareholders, other than tax basis return of capital distributions, in one line item per share class. Distributions to shareholders for the year ended December 31, 2017 from net investment income and net realized gains in the Fund were as follows:
Distributions to Shareholders:
From net investment income: | | $ | (10,800,168 | ) | |
From net Realized Gains: | | | — | | |
11. Subsequent Events:
The Fund has evaluated the need for additional disclosures or adjustments resulting from subsequent events through the date these financial statements were issued. Based on this evaluation, there were no subsequent events to report that would have a material impact on the Fund's financial statements.
22
REPORT OF INDEPENDENT REGISTERED PUBLIC ACCOUNTING FIRM
To the Shareholders and the Board of Trustees of Victory RS Large Cap Alpha VIP Series
Opinion on the Financial Statements
We have audited the accompanying statement of assets and liabilities of Victory RS Large Cap Alpha VIP Series (the "Fund") (one of the funds constituting the Victory Variable Insurance Funds (the "Trust")), including the portfolio of investments, as of December 31, 2018, and the related statement of operations for the year then ended, the statements of changes in net assets for each of the two years in the period then ended, the financial highlights for each of the three years in the period then ended and the related notes (collectively referred to as the "financial statements"). In our opinion, the financial statements present fairly, in all material respects, the financial position of the Fund (one of the funds constituting the Trust) at December 31, 2018, and the results of its operations for the year then ended, the changes in its net assets for each of the two years in the period then ended and its financial highlights for each of the three years in the period then ended, in conformity with U.S. generally accepted accounting principles.
The financial highlights of the Fund for each of the periods presented through December 31, 2015 were audited by other auditors, whose report dated February 22, 2016 expressed an unqualified opinion on those financial highlights.
Basis for Opinion
These financial statements are the responsibility of the Trust's management. Our responsibility is to express an opinion on the Fund's financial statements based on our audits. We are a public accounting firm registered with the Public Company Accounting Oversight Board (United States) (PCAOB) and are required to be independent with respect to the Trust in accordance with the U.S. federal securities laws and the applicable rules and regulations of the Securities and Exchange Commission and the PCAOB.
We conducted our audits in accordance with the standards of the PCAOB. Those standards require that we plan and perform the audit to obtain reasonable assurance about whether the financial statements are free of material misstatement, whether due to error or fraud. The Trust is not required to have, nor were we engaged to perform, an audit of the Trust's internal control over financial reporting. As part of our audit we are required to obtain an understanding of internal control over financial reporting but not for the purpose of expressing an opinion on the effectiveness of the Trust's internal control over financial reporting. Accordingly, we express no such opinion.
Our audits included performing procedures to assess the risks of material misstatement of the financial statements, whether due to error or fraud, and performing procedures that respond to those risks. Such procedures included examining, on a test basis, evidence regarding the amounts and disclosures in the financial statements. Our procedures included confirmation of securities owned as of December 31, 2018, by correspondence with the custodian, transfer agent, and brokers or by other appropriate auditing procedures where replies from brokers were not received. Our audits also included evaluating the accounting principles used and significant estimates made by management, as well as evaluating the overall presentation of the financial statements. We believe that our audits provide a reasonable basis for our opinion.

We have served as the auditor of one or more Victory Capital's investment companies since 1995.
Cincinnati, Ohio
February 15, 2019
23
Victory Variable Insurance Funds | | Supplemental Information
December 31, 2018 | |
(Unaudited)
Trustee and Officer Information Board of Trustees:
Overall responsibility for management of the Trust rests with the Board. The Trust is managed by the Board in accordance with the laws of the State of Delaware. There are currently ten Trustees, nine of whom are not "interested persons" of the Trust within the meaning of that term under the 1940 Act ("Independent Trustees") and one of whom is an "interested person" of the Trust within the meaning of that term under the 1940 Act ("Interested Trustee"). The Trustees, in turn, elect the officers of the Trust to actively supervise its day-to-day operations.
The following tables list the Trustees, their ages, position with the Trust, commencement of service, principal occupations during the past five years and any directorships of other investment companies or companies whose securities are registered under the Securities Exchange Act of 1934, as amended, or who file reports under that Act. Each Trustee oversees nine portfolios in the Trust, one portfolio in Victory Institutional Funds, 42 portfolios in Victory Portfolios and 20 portfolios in Victory Portfolios II, each a registered investment company that, together with the Trust, comprise the Victory Funds Complex. Each Trustee's address is c/o Victory Variable Insurance Funds, 4900 Tiedeman Road, 4th Floor, Brooklyn, Ohio 44144. Each Trustee has an indefinite term.
Name and Age | | Position
Held with
the Trust | | Date
Commenced
Service | | Principal Occupation
During Past 5 Years | | Other
Directorships
Held During
Past 5 Years | |
Independent Trustees. | |
David Brooks Adcock, 67 | | Trustee | | February 2005 | | Consultant (since 2006). | | Chair and Trustee, Turner Funds (December 2016-December 2017). | |
Nigel D.T. Andrews, 71 | | Vice Chair and Trustee | | August 2002 | | Retired. | | Director, TCG BDC II, Inc. (since 2017); Director, TCG BDC I, Inc. (formerly Carlyle GMS Finance, Inc.) (since 2012); Director, Old Mutual US Asset Management (2002-2014). | |
E. Lee Beard, 67* | | Trustee | | February 2005 | | Retired (since 2015); Consultant, The Henlee Group, LLC (consulting) (2005-2015). | | None. | |
Dennis M. Bushe, 75 | | Trustee | | July 2016 | | Retired. | | Trustee, RS Investment Trust and RS Variable Products Trust (November 2011-July 2016). | |
24
Victory Variable Insurance Funds | | Supplemental Information — continued
December 31, 2018 | |
(Unaudited)
Name and Age | | Position
Held with
the Trust | | Date
Commenced
Service | | Principal Occupation
During Past 5 Years | | Other
Directorships
Held During
Past 5 Years | |
Sally M. Dungan, 64 | | Trustee | | February 2011 | | Chief Investment Officer, Tufts University (since 2002). | | None. | |
John L. Kelly, 65 | | Trustee | | February 2015 | | Partner, McCarvill Capital Partners (September 2016-September 2017); Advisor (January 2016-April 2016) and Managing Partner (August 2014-January 2016), Endgate Commodities LLC; Chief Operating Officer, Liquidnet Holdings, Inc. (2011-2014). | | Director, Caledonia Mining Corporation (since May 2012). | |
David L. Meyer, 61* | | Trustee | | December 2008 | | Retired. | | None. | |
Gloria S. Nelund, 57 | | Trustee | | July 2016 | | Chair, CEO and Co-Founder of TriLinc Global, LLC, an investment firm. | | TriLinc Global Impact Fund, LLC (since 2012); Trustee, RS Investment Trust and RS Variable Products Trust (November 2007-July 2016). | |
Leigh A. Wilson, 74 | | Chair and Trustee | | February 1998 | | Private Investor. | | Chair (since 2013), Caledonia Mining Corporation. | |
Interested Trustee. | |
David C. Brown, 46** | | Trustee | | May 2008 | | Chairman and Chief Executive Officer (since 2013), Co-Chief Executive Officer (2011-2013), the Adviser; Chairman and Chief Executive Officer, Victory Capital Holdings, Inc. (since 2013). | | None. | |
* The Board has designated Mr. Meyer and Ms. Beard as its Audit Committee Financial Experts.
** Mr. Brown is an "Interested Person" by reason of his relationship with the Adviser.
The Statement of Additional Information includes additional information about the Trustees of the Trust and is available, without charge, by calling 800-539-3863.
25
Victory Variable Insurance Funds | | Supplemental Information — continued
December 31, 2018 | |
(Unaudited)
Officers:
The officers of the Trust, their ages, commencement of service and their principal occupations during the past five years, are detailed in the following table. Each officer serves until the earlier of his or her resignation, removal, retirement, death, or the election of a successor. The mailing address of each officer of the Trust is 4900 Tiedeman Road, 4th Floor, Brooklyn, Ohio 44144. The officers of the Trust receive no compensation directly from the Trust for performing the duties of their offices.
Name and Age | | Position with
the Trust | | Date
Commenced
Service | | Principal Occupation During Past 5 Years | |
Christopher K. Dyer, 57 | | President | | February 2006* | | Director of Mutual Fund Administration, the Adviser. | |
Scott A. Stahorsky, 49 | | Vice President | | December 2014 | | Manager, Fund Administration, the Adviser (since 2015); Senior Analyst, Fund Administration, the Adviser (prior to 2015). | |
Erin G. Wagner, 45 | | Secretary | | December 2014 | | Associate General Counsel, the Adviser (since 2013). | |
Allan Shaer, 53 | | Treasurer | | May 2017 | | Senior Vice President, Financial Administration, Citi Fund Services Ohio, Inc. (since 2016); Vice President, Mutual Fund Administration, JP Morgan Chase (2011-2016). | |
Christopher A. Ponte, 34 | | Assistant Treasurer | | December 2017 | | Manager, Fund Administration, the Adviser (since 2017); Senior Analyst, Fund Administration, the Adviser (prior to 2017); Chief Financial Officer, Victory Capital Advisers, Inc. (since 2018). | |
Colin Kinney, 45 | | Chief Compliance Officer | | July 2017 | | Chief Compliance Officer (since 2013) and Chief Risk Officer (2009-2017), the Adviser. | |
Chuck Booth, 58 | | Anti-Money Laundering Compliance Officer and Identity Theft Officer | | May 2015 | | Director, Regulatory Administration and CCO Support Services, Citi Fund Services Ohio, Inc. | |
Jay G. Baris, 65 | | Assistant Secretary | | February 1998 | | Partner, Shearman & Sterling LLP (since 2018); Partner, Morrison & Foerster LLP (2011-2017). | |
* On December 3, 2014, Mr. Dyer resigned as Secretary of the Trust and accepted the position of President.
26
Victory Variable Insurance Funds | | Supplemental Information — continued
December 31, 2018 | |
(Unaudited)
Proxy Voting and Form N-Q Information
Proxy Voting:
Information regarding the policies and procedures that the Fund uses to determine how to vote proxies relating to portfolio securities is available without charge, upon request, by calling 800-539-3863. The information is also included in the Fund's Statement of Additional Information, which is available on the SEC's website at www.sec.gov.
Information relating to how the Fund voted proxies relating to portfolio securities held during the most recent twelve months ended June 30 is available on the SEC's website at www.sec.gov.
Availability of Schedules of Portfolio Investments:
The Trust expects to file a complete list of Schedules of Portfolio Investments with the SEC for the first and third quarter of each fiscal year on Form N-PORT beginning March 1, 2019. Prior to that date, the Trust has filed a complete list of Schedules of Portfolio Investments with the SEC for the first and third quarters of each fiscal year on Form N-Q. Forms N-PORT and Forms N-Q are available on the SEC's website at www.sec.gov.
Expense Examples
As a shareholder of the Fund, you may incur two types of costs: (1) transaction costs and (2) ongoing costs, including management fees, distribution and service (12b-1) fees, and other Fund expenses. These examples are intended to help you understand your ongoing costs (in dollars) of investing in the Fund and to compare these costs with the ongoing costs of investing in other mutual funds.
These examples are based on an investment of $1,000 invested at the beginning of the period and held for the entire period from July 1, 2018 through December 31, 2018.
The Actual Expense figures in the table below provide information about actual account values and actual expenses. You may use the information below, together with the amount you invested, to estimate the expenses that you paid over the period. Simply divide your account value by $1,000 (for example, an $8,600 account value divided by $1,000 = 8.6), then multiply the result by the number in the table under the heading entitled "Actual Expenses Paid During Period" to estimate the expenses you paid on your account during this period.
The Hypothetical Expense figures in the table below provide information about hypothetical account values and hypothetical expenses based on the Fund's actual expense ratio and an assumed rate of return of 5% per year before expenses, which is not the Fund's actual return. The hypothetical account values and expenses may not be used to estimate the actual ending account balance or expenses you paid for the period. You may use this information to compare this 5% hypothetical example with the 5% hypothetical examples that appear in shareholder reports of other funds.
Please note the expenses shown in the table are meant to highlight your ongoing costs only and do not reflect any transactional costs. Therefore, the table is useful in comparing ongoing costs only, and will not help you determine the relative total costs of owning different funds. In addition, if these transactional costs were included, your costs would have been higher.
Beginning
Account Value
7/1/18 | | Actual
Ending
Account Value
12/31/18 | | Hypothetical
Ending
Account Value
12/31/18 | | Actual
Expenses Paid
During Period
7/1/18-12/31/18* | | Hypothetical
Expenses Paid
During Period
7/1/18-12/31/18* | | Annualized
Expense Ratio
During Period
7/1/18-12/31/18 | |
| $ | 1,000.00 | | | $ | 899.80 | | | $ | 1,022.43 | | | $ | 2.63 | | | $ | 2.80 | | | | 0.55 | % | |
* Expenses are equal to the average account value multiplied by the Fund's annualized expense ratio multiplied by 184/365 (the number of days in the most recent fiscal half-year divided by the number of days in the fiscal year).
27
Victory Variable Insurance Funds | | Supplemental Information — continued
December 31, 2018 | |
(Unaudited)
Additional Federal Income Tax Information
For the year ended December 31, 2018, the Fund paid qualified dividend income for purposes of reduced individual federal income tax rates of 69%.
Dividends qualifying for corporate dividends received a deduction of 64%.
For the year ended December 31, 2018, the Fund designated short-term and long-term capital gain distributions in the amount of $11,109,108 and $87,616,353, respectively.
28
Victory Variable Insurance Funds | | Supplemental Information — continued
December 31, 2018 | |
(Unaudited)
Considerations of the Board in Continuing the Investment Advisory Agreement (the "Agreement")
The Board approved the Agreement on behalf of the Series at a meeting, which was called for that purpose, on December 5, 2018. The Board also considered information relating to the Series and the Agreement provided throughout the year and, more specifically, at a meeting on October 23, 2018. The Board noted that prior to the Series' reorganization on July 29, 2016, the Series was managed by RS Investment Management Co. LLC, which was acquired by the Adviser on July 29, 2016. In considering whether to approve the Agreement, the Board requested, and the Adviser provided, information that the Board believed to be reasonably necessary to reach its conclusions. The Board, including the Independent Trustees, evaluated this information along with other information obtained throughout the year and was advised by legal counsel to the Series and by independent legal counsel to the Independent Trustees. In addition, in 2017 the Independent Trustees, through their counsel, retained an independent consultant to assist with a review of the overall process for conducting the annual review of these advisory arrangements. The Board considered the Series' advisory fee, expense ratio and investment performance as significant factors in determining whether the Agreement should be continued. In considering whether the compensation paid to the Adviser was fair and reasonable, the Board also evaluated, among other things, the following factors:
• The requirements of the Series for the services provided by the Adviser;
• The nature, quality and extent of the services provided and expected to be provided;
• The performance of the Series as compared to comparable funds;
• The fees payable for the services and whether the fee arrangements provided for economies of scale that would benefit Series shareholders as the Series grows;
• Whether the fee would be sufficient to enable the Adviser to attract and retain experienced personnel and continue to provide quality services to the Series;
• Fees paid by other clients of the Adviser whose accounts are managed in a similar investment style and any differences in the services provided to the other clients compared to those provided to the Series;
• Total expenses of the Series, taking into consideration any distribution or shareholder servicing fees;
• Management's commitment to operating the Series at competitive expense levels;
• The profitability of the Adviser (as reflected by comparing fees earned against an estimate of the Adviser's costs) with respect to the Adviser's relationship with the Series;
• Research and other service benefits received by the Adviser obtained through payment of client commissions for securities transactions;
• Other benefits received by the Adviser, and its affiliates, including revenues paid to the Adviser, or its affiliates, by the Series for administration and fund accounting services, and distribution;
• The capabilities and financial condition of the Adviser;
• Current economic and industry trends; and
• The historical relationship between the Series and the Adviser.
The Board reviewed the Series' current management fee, comprised of the advisory fee plus the administrative services fee paid to the Adviser, in the context of the Adviser's profitability of the Series. In addition, the Board compared the Series' total operating expense ratio on a net and gross basis, taking into consideration any distribution or shareholder servicing fees and management fees with a universe of comparable mutual funds compiled by an independent consultant, FUSE Research Network, LLC ("FUSE"), and a peer group of funds with similar investment strategies selected by FUSE from the universe. The Board reviewed the factors and methodology used by FUSE in the selection of the Series' peer group, including FUSE's selection of a broad universe of funds using the standard Retail Morningstar Categories, the more specific universe of comparable funds, and peer groups of funds with comparable investment strategies and asset levels, among other factors. The Board also reviewed any changes to FUSE's methodology as compared to the prior year, including as a result of input from the Adviser, if any. The Board also reviewed fees and other information related to the Adviser's management of similarly managed institutional or private accounts, and the differences in the services provided to the other accounts, to the extent applicable. The Board noted that the advisory fee arrangements for the Series do not include breakpoints, which are generally viewed as a method by which the investment
29
Victory Variable Insurance Funds | | Supplemental Information — continued
December 31, 2018 | |
(Unaudited)
adviser shares any economies of scale with a fund as a fund grows. The Board also considered the Adviser's commitment to limit expenses as discussed in more detail below.
The Board reviewed the Series' performance over one-, three-, five- and ten-year periods against the performance of the Series' selected peer group and benchmark index. The Board recognized that the performance of the Series and the peer group funds are net of expenses, while the performance of the benchmark index is gross returns. The Board considered the additional resources that the Adviser has committed to enhance portfolio analysis, compliance and trading systems. The Board noted that, following the Series' reorganization, the Series is managed by substantially the same investment management team that managed the comparable predecessor fund.
The Board reviewed various other specific factors with respect to the Series, as described below. In their deliberations, the Trustees did not rank the importance of any particular information or factor considered and each Trustee may have attributed different weights to various factors.
The Board concluded that the Series' gross annual management fee was reasonable as compared to the median gross management fee charged to the funds in the Series' peer group. The Board noted that the Series' net annual expense ratio, taking into account any shareholder servicing or distribution fees, was reasonable as compared to the median expense ratio for the peer group. The Board considered the Adviser's contractual agreement to waive its fees and reimburse expenses for a specified period of time, as described in the Series' prospectus. The Board then compared the Series' performance for the one-, three-, five- and ten-year periods ended June 30, 2018, to that of the median performance of the peer group and benchmark index for the same periods and considered the fact that the Series outperformed the benchmark index for all of the periods reviewed, and outperformed the peer group for the one-year period and underperformed the peer group for the three-, five- and ten-year periods.
Having considered, among other things: (1) that the Series' management fee was within the ranges of advisory fees charged to comparable mutual funds; (2) that the Series' total expense ratio was reasonable; (3) the Adviser's willingness to limit the expenses for a period of time would provide stability to the Series' expenses during that period; and (4) the performance of the Series, the Board concluded that the Agreement continued to be in the best interests of the Series' shareholders.
Conclusion
Based on its review of the information requested and provided, and following extended discussions, the Board determined that the Agreement, on behalf of the Series, was consistent with the best interests of the Series and its shareholders, and the Board unanimously approved the Agreement, on behalf of the Series, for an additional annual period on the basis of the foregoing review and discussions and the following considerations, among others:
• The fairness and reasonableness of the investment advisory fee payable to the Adviser under the Agreement in light of the investment advisory services provided, the costs of these services, the profitability of the Adviser's relationship with the Series and the comparability of the fee paid to the fees paid by other investment companies;
• The nature, quality and extent of the investment advisory services provided by the Adviser;
• The Adviser's entrepreneurial commitment to the management of the Series and the creation of a broad-based family of funds, which could entail a substantial commitment of the Adviser's resources to the successful operation of the Series;
• The Adviser's representations regarding its staffing and capabilities to manage the Series, including the retention of personnel with relevant portfolio management experience;
• The Adviser's efforts to enhance investment results by, among other things, developing quality portfolio management teams; and
• The overall high quality of the personnel, operations, financial condition, investment management capabilities, methodologies and performance of the Adviser.
30
Privacy Policy
Protecting the Privacy of Information
The Trust respects your right to privacy. We also know that you expect us to conduct and process your business in an accurate and efficient manner. To do so, we must collect and maintain certain personal information about you. This is the information we collect from you on applications or other forms, and from the transactions you make with us or third parties. It may include your name, address, social security number, account transactions and balances, and information about investment goals and risk tolerance.
We do not disclose any information about you or about former customers to anyone except as permitted or required by law. Specifically, we may disclose the information we collect to companies that perform services on our behalf, such as the transfer agent that processes shareholder accounts and printers and mailers that assist us in the distribution of investor materials. We may also disclose this information to companies that perform marketing services on our behalf. This allows us to continue to offer you Victory investment products and services that meet your investing needs, and to effect transactions that you request or authorize. These companies will use this information only in connection with the services for which we hired them. They are not permitted to use or share this information for any other purpose.
To protect your personal information internally, we permit access only by authorized employees and maintain physical, electronic and procedural safeguards to guard your personal information.*
* You may have received communications regarding information about privacy policies from other financial institutions which gave you the opportunity to "opt-out" of certain information sharing with companies which are not affiliated with that financial institution. The Trust does not share information with other companies for purposes of marketing solicitations for products other than the Trust. Therefore, the Trust does not provide opt-out options to their shareholders.
Victory Funds
P.O. Box 182593
Columbus, Ohio 43218-2593

Visit our website at: | | Call Victory at: | |
www.vcm.com | | 800-539-FUND (800-539-3863) | |
VVIF-RS-LCAVIP-AR (12/18)

December 31, 2018
Annual Report
Victory Variable Insurance Funds
Victory RS Small Cap Growth Equity VIP Series
Beginning on January 1, 2021, as permitted by regulations adopted by the Securities and Exchange Commission, paper copies of the Victory Funds' shareholder reports will no longer be sent by mail, unless you specifically request paper copies of the reports from the Victory Funds or from your financial intermediary, such as a broker-dealer or bank. Instead, the reports will be made available on www.VictoryFunds.com, and you will be notified by mail each time a report is posted and provided with a website link to access the report. If you already elected to receive shareholder reports electronically, you will not be affected by this change, and you need not take any action.
You may elect to receive shareholder reports and other communications from the Victory Funds or your financial intermediary electronically sooner than January 1, 2021 by notifying your financial intermediary directly or, if you are a direct investor, by calling 800-539-3863 or by sending an e-mail request to TA.Processing@FISGlobal.com.
You may elect to receive all future reports in paper free of charge. If you invest through a financial intermediary, you can contact your financial intermediary to request that you continue to receive paper copies of your reports. If you invest directly with the Victory Funds, you can call 800-539-3863 or send an e-mail request to TA.Processing@FISGlobal.com. Your election to receive reports in paper will apply to all Victory Funds you hold directly or through your financial intermediary.
www.vcm.com
News, Information And Education 24 Hours A Day, 7 Days A Week
The Victory Funds site gives fund shareholders, prospective shareholders, and investment professionals a convenient way to access fund information, get guidance, and track fund performance anywhere they can access the Internet. The site includes:
• Detailed performance records
• Daily share prices
• The latest fund news
• Investment resources to help you become a better investor
• A section dedicated to investment professionals
Whether you're a potential investor searching for the fund that matches your investment philosophy, a seasoned investor interested in planning tools, or an investment professional, www.vcm.com has what you seek. Visit us anytime. We're always open.
Victory Variable Insurance Funds
Table of Contents
Shareholder Letter (Unaudited) | | | 3 | | |
Fund Review and Commentary (Unaudited) | | | 4 | | |
Financial Statements | |
Schedule of Portfolio Investments | | | 8 | | |
Statement of Assets and Liabilities | | | 11 | | |
Statement of Operations | | | 12 | | |
Statements of Changes in Net Assets | | | 13 | | |
Financial Highlights | | | 14 | | |
Notes to Financial Statements | | | 15 | | |
Report of Ernst & Young LLP,
Independent Registered Public Accounting Firm | | | 23 | | |
Supplemental Information (Unaudited) | |
Trustee and Officer Information | | | 24 | | |
Proxy Voting and Form N-Q Information | | | 27 | | |
Expense Examples | | | 27 | | |
Additional Federal Income Tax Information | | | 28 | | |
Advisory Contract Renewal | | | 29 | | |
Privacy Policy (inside back cover) | | | |
The Fund is distributed by Victory Capital Advisers, Inc. Victory Capital Management Inc. is the investment adviser to the Fund and receives fees from the Fund for performing services for the Fund.
This report is not authorized for distribution to prospective investors unless preceded or accompanied by a current prospectus of the Fund.
For additional information about any Victory Fund, including fees, expenses, and risks, view our prospectus online at www.vcm.com or call 800-539-3863. Read it carefully before you invest or send money.
The information in this annual report is based on data obtained from recognized services and sources and is believed to be reliable. Any opinions, projections, or recommendations in this report are subject to change without notice and are not intended as individual investment advice. Past investment performance of the Fund, markets or securities mentioned herein should not be considered to be indicative of future results.
• NOT FDIC INSURED • NO BANK GUARANTEE
• MAY LOSE VALUE

Call Victory at:
800-539-FUND (800-539-3863)
Visit our website at:
www.vcm.com
1
This page is intentionally left blank.
2
Victory Funds Letter to Shareholders
Dear Shareholder,
What a difference a year makes. The year ended December 31, 2018, was marked by an abrupt return of volatility, which had largely been missing in action for years. Consider the range of highs and lows we witnessed. For the S&P 500 Index, it was a year in which we celebrated an all-time high in late summer, only to be followed by the worst December since the 2008 financial crisis. And if that wasn't enough volatility, the Dow Jones Industrial Average also registered several of its worst-ever, single-day point declines during 2018.
Through all that the S&P 500 clocked in with its first negative annual return since 2008, falling by 4.4 percent. Given the risk-off sentiment that was obvious as the year drew to a close, it's no surprise that small-cap stocks, as measured by the Russell 2000 Index, fared even worse, falling approximately 11.0 percent for the year. The challenges for equity investors were also evident around the world as the MSCI ACWI and Emerging Markets indexes declined 8.9 and 14.3 percent, respectively.
So what ushered in the renewed era of volatility and these challenging times? There were multiple culprits. For starters, trade tensions ratcheted up throughout the year as anti-global rhetoric bloomed into a series of new tariffs, which sparked concerns of a prolonged trade war with China. The Federal Reserve remained persistent in its monetary tightening, raising the benchmark interest rate four times throughout the year to a range of 2.25 to 2.5 percent. And then the year ended with a partial shutdown of the federal government. These factors conspired to elevate concerns of a possible recession here and abroad.
Yet despite the headline risks, we think it's critically important to remain focused on the data. By all accounts, the U.S. economy continued chugging along in 2018 with a real gross domestic product (GDP) rising 3.4 percent in the third quarter of 2018, the latest figures available from the Bureau of Economic Analysis. Moreover, the labor picture continues to shine with consistent monthly job growth and an unemployment rate of 3.9 percent. All this comes against a backdrop of low inflation and solid corporate earnings.
The markets, it appears, have been vacillating between the dire headlines and higher perceived risks on one hand, and the continued positive economic data on the other. Of course, no one knows where the Fed will stop raising rates, nor is there any certainty on how the trade turmoil ultimately gets resolved. For now, however, we continue to embrace our solid economic fundamentals. Moreover, we believe all of Victory Capital's independent investment franchises are well positioned to take advantage of any short-term valuation dislocations resulting from the current era of heightened volatility.
On the following pages, you will find information relating to your Victory Funds investment. If you have any questions, we encourage you to contact your financial advisor. Or, if you invest with us directly, you may call (800) 539-3863, or visit our website at www.vcm.com.
My colleagues and I sincerely appreciate the confidence you have placed in the Victory Funds, and we value the opportunity to help meet your investment goals.

Christopher K. Dyer, CFA
President,
Victory Funds
3
Victory Variable Insurance Funds
Victory RS Small Cap Growth Equity VIP Series
Portfolio Holdings
As a Percentage of Total Investments
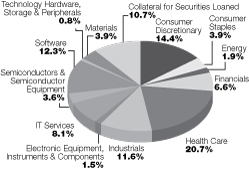
Commentary
In a challenging year for U.S. equity markets, the Russell 2000® Growth Index (the "Index") of small-cap growth stocks returned -9.31%, despite the strong underlying economic landscape and strong earnings growth reported by the majority of small-cap growth companies. The Victory RS Small Cap Growth Equity VIP Series ("Fund") seeks to provide long-term capital growth. The Fund outperformed the Index for the twelve-month period ended December 31, 2018. This outperformance was due to outperformance in the technology sector, as well as positive stock selection within the financial services and materials & processing sectors. Stock selection in Health Care and Consumer Discretionary provided an offset to the Fund's positive relative performance. The Fund seeks long-term capital growth by investing primarily in small-cap companies that we believe have the potential to produce sustainable earnings growth over a multi-year horizon.
Market Overview
U.S. equity markets delivered mixed performance throughout 2018, as the S&P 500® Index failed to deliver its tenth straight year of positive returns after a strong first nine months of the year. U.S. stocks underperformed despite continued resilience in the U.S. economy and record earnings, supported by a strong job market and the largest corporate tax reform in decades.
The year began on a positive note with strong performance in January before volatility emerged in February, dampening strong investor sentiment and ending the S&P 500's record run of 15 straight months of positive performance. The market rebounded in the second and third quarters, despite the continued uncertainty surrounding trade tariffs and a flattening yield curve, largely driven by fundamentals. Fundamentals continued to be supported by the strength of the U.S. economy (highlighted by 4.2% growth in the second quarter — the highest growth since Q3 2014, according to the Bureau of Economic Analysis). U.S. stocks declined sharply in the fourth quarter, as growth-oriented stocks in the Russell 3000® Growth Index returned -16.33%, the seventh largest quarterly decline since the 1979 inception of the index, ending the record run of twelve consecutive quarters of positive returns for the index.
Large-cap stocks outperformed mid- and small-cap stocks during the year, as measured by the Russell family of indices, a continued trend from 2017, while growth-oriented investments outperformed value as investors favored the strong fundamentals of growth stocks. Growth stocks as measured by the Russell 3000® Growth Index have now outperformed value stocks as measured by the Russell 3000® Value Index over 1, 3, 5, 10, and 15 years.
4
Victory Variable Insurance Funds
Victory RS Small Cap Growth Equity VIP Series (continued)
Performance Update
The Fund returned -8.25% for the twelve-month period ended December 31, 2018, outperforming the Index, which returned -9.31%.
Portfolio Review
Within the technology sector, contributors included RingCentral, a provider of software-as-a-service solutions for businesses to support modern communications. RingCentral's outperformance was driven by strong execution, as the company reported revenue up 32% year-over-year with improved gross margins, leading to earnings that grew 46% year-over-year in the most recent quarter and easily beat expectations. Our outlook for the company remains strong, driven by their continued march upmarket to the larger enterprise market and by the company's attractive anticipated growth rate.
Technology holding SendGrid, a cloud-based platform that provides various tools to businesses (including developers and marketers) to reach their customers using email, was also a strong contributor to performance. SendGrid has been a holding since the company's IPO, at which time RS Investments was a top three owner of the company. SendGrid rallied sharply after it was announced in mid-October that the company would be acquired by Twilio in an all-stock deal. The stock initially rallied approximately 15% on the announcement and we continued to hold the position given we already had a positive view of Twilio, owning it in our mid-cap growth strategy. This further benefitted performance as Twilio was a strong performer throughout the remainder of the quarter given the all-stock nature of the SendGrid acquisition.
Stock selection within the Financial Services sector was also additive to performance, due in large part to an investment in Euronet Worldwide, a payment and transaction processing company that provides distribution solutions to financial institutions, retailers, service providers, and individual consumers worldwide. Euronet owns and operates the largest ATM network in Europe and has a large presence in Asia, operating almost 20,000 ATMs in total. The stock performed well in 2018, driven by a 29% increase in operating income as the company continued to execute.
Within the Health Care sector, the largest detractor was biotechnology holding Vital Therapies, a biotechnology company that was initially developing a cell-based treatment for acute liver failure, a condition that affects 30,000 patients in the United States. We initially purchased the stock given the potential treatment of patients with a wide range of advanced liver disease, providing a more cost-effective and safer alternative to liver transplants. Unfortunately, in early September the company ran into its final roadblock — failing to meet primary or secondary endpoints in a trial to determine significant improvement in overall survival rates, leading the company to believe their ELAD system would not be approved in the United States and European Union.
Consumer Discretionary also proved to be a challenging sector in 2018, driven by underperforming holdings H&E Equipment Services, Inc. and Altra Industrial Motion Corp. H&E operates as an integrated equipment services company and rents, sells, and provides parts and support services for hi-lift or aerial work platform equipment, cranes, and earth moving equipment. Altra designs, produces, and markets mechanical power transmission components worldwide. Both companies were under significant pressure in the most recent quarter over concerns of a renewed industrial recession. H&E's underperformance was
5
Victory Variable Insurance Funds
Victory RS Small Cap Growth Equity VIP Series (continued)
driven by concerns that earnings represented a cyclical peak and was further impacted by the replacement of the company's CEO. We sold the position given the increased uncertainty and a lack of a clear path forward for the company. Altra, on the other hand, showed signs of life despite the underperformance, beating earnings expectations with non-GAAP income growth of more than 30% year-over-year. Given the company's attractive valuation and acquisition of Fortive's Automation and Specialty business, which we feel will be transformative, we continued to hold the position.
Outlook
The abrupt market sell-off at the end the year and strong earnings generated by U.S. corporations have driven valuations to among the cheapest levels seen in decades, as reflected by forward price-to-earnings ratios. Given our optimistic outlook for U.S. economic growth and corporate earnings against the expected backdrop of positive employment trends and moderate inflation, stocks appear very attractive to us. We acknowledge the potential headwinds from a less accommodative Federal Reserve (Fed), political turmoil that recently led to a government shutdown, and the impact of retaliatory tariffs from China and our other trade partners, but we would note that the U.S. economy is still expected to grow at a high rate, while U.S. interest rates are likely to remain low relative to history even with additional Fed tightening. As a result, we believe the current environment remains supportive of small-cap growth stocks, though we remain committed to careful stock selection and disciplined risk management as we seek to identify well-managed, well-capitalized small-cap growth companies that in our view will be able to grow their revenues and tap new market opportunities regardless of the economic backdrop.
6
Victory Variable Insurance Funds
Victory RS Small Cap Growth Equity VIP Series (continued)
Average Annual Return
Year Ended December 31, 2018
| | Class A | |
INCEPTION DATE | | 5/1/97 | |
| | | Net Asset
Value | | Russell 2000
Growth Index1 | | Russell 2000 Index2 | |
One Year | | | –8.25 | % | | | –9.31 | % | | | –11.01 | % | |
Three Year | | | 8.75 | % | | | 7.24 | % | | | 7.36 | % | |
Five Year | | | 7.34 | % | | | 5.13 | % | | | 4.41 | % | |
Ten Year | | | 15.50 | % | | | 13.52 | % | | | 11.97 | % | |
Since Inception | | | 9.54 | % | | | N/A | | | | N/A | | |
Expense Ratios
Gross | | | 0.87 | % | |
With Applicable Waivers | | | 0.87 | % | |
Past performance is not indicative of future results. The performance data quoted represents past performance and current returns may be lower or higher. The investment return and principal value will fluctuate so that an investor's shares, when redeemed, may be worth more or less than the original cost. To obtain performance information current to the most recent month's end, please visit www.vcm.com.
The above expense ratios are from the Fund's prospectus dated May 1, 2018. Additional information pertaining to the Fund's expense ratios as of December 31, 2018 can be found in the financial highlights.
The total return figures set forth above include all waivers of fees for various periods since inception. Without such fee waivers, the total returns would have been lower. Some fee waivers are voluntary and may be modified or terminated at any time. The total returns do not include any insurance, sales or administrative charges of variable annuity or life insurance contracts. If these charges were included, the total returns would have been lower.
Victory RS Small Cap Growth Equity VIP Series — Growth of $10,000
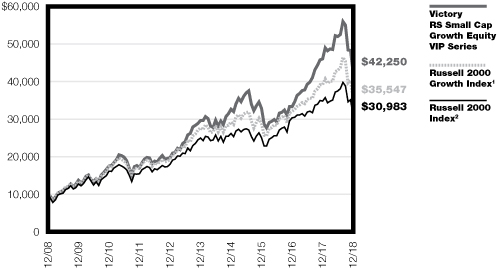
1The Russell 2000® Growth Index is an unmanaged market-capitalization-weighted index that measures the performance of those companies in the Russell 2000® Index with higher price-to-book ratios and higher forecasted growth values. Index results assume the reinvestment of dividends paid on the stocks constituting the index. You may not invest in the index, and, unlike the Fund, the index does not incur fees and expenses. It is not possible to invest directly in an index.
2The Russell 2000® Index is an unmanaged market-capitalization-weighted index that measures the performance of the 2,000 smallest companies in the Russell 3000® Index, which consists of the 3,000 largest U.S. companies based on total market capitalization. Index results assume the reinvestment of dividends paid on the stocks constituting the index. You may not invest in the index, and, unlike the Fund, the index does not incur fees or expenses. It is not possible to invest directly in an index.
The graph reflects investment of growth of a hypothetical $10,000 investment in the Fund. Past performance is no guarantee of future results.
The graph and table do not reflect the deduction of taxes that a shareholder would pay on Fund distributions or the redemption of Fund shares.
7
Victory Variable Insurance Funds
Victory RS Small Cap Growth Equity VIP Series | | Schedule of Portfolio Investments
December 31, 2018 | |
Security Description | | Shares | | Value | |
Common Stocks (98.4%) | |
Consumer Discretionary (15.9%): | |
Arco Platform Ltd., ADR, Class A (a) | | | 25,900 | | | $ | 572,908 | | |
At Home Group, Inc. (a) (b) | | | 36,170 | | | | 674,932 | | |
Dave & Buster's Entertainment, Inc. | | | 27,100 | | | | 1,207,576 | | |
Dineequity, Inc. (b) | | | 21,820 | | | | 1,469,358 | | |
Eldorado Resorts, Inc. (a) | | | 35,580 | | | | 1,288,352 | | |
Grand Canyon Education, Inc. (a) | | | 5,909 | | | | 568,091 | | |
Monro Muffler Brake, Inc. (b) | | | 18,350 | | | | 1,261,563 | | |
National Vision Holdings, Inc. (a) | | | 30,960 | | | | 872,143 | | |
Ollie's Bargain Outlet Holdings, Inc. (a) | | | 14,418 | | | | 958,941 | | |
Planet Fitness, Inc., Class A (a) | | | 31,990 | | | | 1,715,303 | | |
Red Rock Resorts, Inc., Class A (b) | | | 33,570 | | | | 681,807 | | |
Steven Madden Ltd. | | | 36,883 | | | | 1,116,080 | | |
Strategic Education, Inc. | | | 5,340 | | | | 605,663 | | |
Weight Watchers International, Inc. (a) | | | 13,320 | | | | 513,486 | | |
Wingstop, Inc. (b) | | | 9,450 | | | | 606,596 | | |
| | | | 14,112,799 | | |
Consumer Staples (4.3%): | |
Freshpet, Inc. (a) (b) | | | 29,226 | | | | 939,908 | | |
Nomad Foods Ltd., ADR (a) | | | 99,290 | | | | 1,660,129 | | |
Sprouts Farmers Markets, Inc. (a) | | | 48,580 | | | | 1,142,116 | | |
| | | | 3,742,153 | | |
Electronic Equipment, Instruments & Components (1.7%): | |
II-VI, Inc. (a) | | | 14,510 | | | | 470,995 | | |
Littelfuse, Inc. | | | 6,009 | | | | 1,030,423 | | |
| | | | 1,501,418 | | |
Energy (2.0%): | |
Matador Resources Co. (a) | | | 18,660 | | | | 289,790 | | |
Newpark Resources, Inc. (a) | | | 200,759 | | | | 1,379,214 | | |
SRC Energy, Inc. (a) | | | 39,650 | | | | 186,355 | | |
| | | | 1,855,359 | | |
Financials (7.3%): | |
eHealth, Inc. (a) | | | 25,070 | | | | 963,189 | | |
Firstcash, Inc. | | | 15,220 | | | | 1,101,167 | | |
Green Dot Corp. (a) | | | 18,090 | | | | 1,438,517 | | |
Kemper Corp. | | | 18,420 | | | | 1,222,720 | | |
LendingTree, Inc. (a) (b) | | | 3,260 | | | | 715,798 | | |
Primerica, Inc. | | | 5,550 | | | | 542,291 | | |
Webster Financial Corp. | | | 9,220 | | | | 454,454 | | |
| | | | 6,438,136 | | |
Health Care (22.8%): | |
Aimmune Therapeutics, Inc. (a) (b) | | | 27,370 | | | | 654,690 | | |
Amicus Therapeutics, Inc. (a) (b) | | | 85,569 | | | | 819,751 | | |
Apellis Pharmaceuticals, Inc. (a) | | | 37,550 | | | | 495,285 | | |
Aptinyx, Inc. (a) | | | 18,799 | | | | 310,935 | | |
See notes to financial statements.
8
Victory Variable Insurance Funds
Victory RS Small Cap Growth Equity VIP Series | | Schedule of Portfolio Investments — continued
December 31, 2018 | |
Security Description | | Shares | | Value | |
Assembly Biosciences, Inc. (a) | | | 13,750 | | | $ | 311,025 | | |
Audentes Therapeutics, Inc. (a) | | | 24,530 | | | | 522,980 | | |
Bluebird Bio, Inc. (a) (b) | | | 8,122 | | | | 805,702 | | |
Blueprint Medicines Corp. (a) | | | 13,946 | | | | 751,829 | | |
Celyad SA, ADR (a) (b) | | | 16,890 | | | | 306,722 | | |
Cytomx Therapeutics, Inc. (a) | | | 26,620 | | | | 401,962 | | |
Equillium, Inc. (a) | | | 34,527 | | | | 281,740 | | |
Exact Sciences Corp. (a) | | | 12,010 | | | | 757,831 | | |
Fate Therapeutics, Inc. (a) | | | 30,470 | | | | 390,930 | | |
Glaukos Corp. (a) (b) | | | 12,270 | | | | 689,206 | | |
Globus Medical, Inc., Class A (a) | | | 27,110 | | | | 1,173,321 | | |
GW Pharmaceuticals PLC, ADR (a) (b) | | | 6,380 | | | | 621,348 | | |
Hanger, Inc. (a) | | | 31,780 | | | | 602,231 | | |
HealthEquity, Inc. (a) | | | 13,750 | | | | 820,188 | | |
Immunomedics, Inc. (a) (b) | | | 53,220 | | | | 759,449 | | |
Insulet Corp. (a) (b) | | | 12,110 | | | | 960,565 | | |
Iovance Biotherapeutics, Inc. (a) (b) | | | 84,904 | | | | 751,400 | | |
Irhythm Technologies, Inc. (a) | | | 6,330 | | | | 439,808 | | |
Kura Oncology, Inc. (a) | | | 45,960 | | | | 645,278 | | |
Ligand Pharmaceuticals, Inc., Class B (a) (b) | | | 7,068 | | | | 959,128 | | |
Loxo Oncology, Inc. (a) | | | 7,756 | | | | 1,086,383 | | |
Masimo Corp. (a) | | | 16,440 | | | | 1,765,163 | | |
Penumbra, Inc. (a) (b) | | | 5,760 | | | | 703,872 | | |
Sage Therapeutics, Inc. (a) | | | 6,226 | | | | 596,389 | | |
Teladoc, Inc. (a) (b) | | | 21,410 | | | | 1,061,294 | | |
| | | | 20,446,405 | | |
Industrials (12.9%): | |
Advanced Disposal Services, Inc. (a) | | | 41,620 | | | | 996,383 | | |
Altra Industrial Motion Corp. | | | 35,720 | | | | 898,358 | | |
Axon Enterprise, Inc. (a) | | | 26,090 | | | | 1,141,438 | | |
Azul SA, ADR (a) | | | 47,950 | | | | 1,327,736 | | |
Harsco Corp. (a) | | | 67,770 | | | | 1,345,912 | | |
Kennametal, Inc. (b) | | | 48,300 | | | | 1,607,424 | | |
Proto Labs, Inc. (a) | | | 8,300 | | | | 936,157 | | |
Saia, Inc. (a) | | | 10,680 | | | | 596,158 | | |
Simpson Manufacturing Co., Inc. | | | 24,750 | | | | 1,339,718 | | |
Siteone Landscape Supply, Inc. (a) (b) | | | 21,810 | | | | 1,205,439 | | |
| | | | 11,394,723 | | |
IT Services (8.9%): | |
Euronet Worldwide, Inc. (a) | | | 22,283 | | | | 2,281,333 | | |
Evo Payments, Inc. (a) | | | 24,570 | | | | 606,142 | | |
InterXion Holding NV, ADR (a) | | | 29,140 | | | | 1,578,222 | | |
WEX, Inc. (a) | | | 3,200 | | | | 448,192 | | |
Wix.com Ltd., ADR (a) | | | 20,510 | | | | 1,852,873 | | |
WNS Holdings Ltd., ADR (a) | | | 28,206 | | | | 1,163,780 | | |
| | | | 7,930,542 | | |
See notes to financial statements.
9
Victory Variable Insurance Funds
Victory RS Small Cap Growth Equity VIP Series | | Schedule of Portfolio Investments — continued
December 31, 2018 | |
Security Description | | Shares | | Value | |
Materials (4.2%): | |
Allegheny Technologies, Inc. (a) (b) | | | 62,207 | | | $ | 1,354,246 | | |
Ashland Global Holdings, Inc. | | | 19,250 | | | | 1,365,980 | | |
Ferro Corp. (a) | | | 66,290 | | | | 1,039,427 | | |
| | | | 3,759,653 | | |
Semiconductors & Semiconductor Equipment (4.0%): | |
Cypress Semiconductor Corp. | | | 31,310 | | | | 398,263 | | |
MKS Instruments, Inc. | | | 11,690 | | | | 755,291 | | |
Monolithic Power Systems, Inc. | | | 6,147 | | | | 714,589 | | |
Silicon Laboratories, Inc. (a) | | | 9,310 | | | | 733,721 | | |
Versum Materials, Inc. | | | 35,150 | | | | 974,358 | | |
| | | | 3,576,222 | | |
Software (13.6%): | |
Cornerstone OnDemand, Inc. (a) | | | 38,430 | | | | 1,938,025 | | |
Coupa Software, Inc. (a) | | | 20,050 | | | | 1,260,343 | | |
Envestnet, Inc. (a) | | | 22,070 | | | | 1,085,623 | | |
Mindbody, Inc. (a) | | | 50,200 | | | | 1,827,280 | | |
Q2 Holdings, Inc. (a) | | | 24,380 | | | | 1,208,029 | | |
RingCentral, Inc., Class A (a) | | | 31,888 | | | | 2,628,846 | | |
SendGrid, Inc. (a) | | | 50,410 | | | | 2,176,200 | | |
| | | | 12,124,346 | | |
Technology Hardware, Storage & Peripherals (0.8%): | |
Pure Storage, Inc. (a) | | | 46,350 | | | | 745,308 | | |
Total Common Stocks (Cost $84,929,007) | | | 87,627,064 | | |
Collateral for Securities Loaned^ (11.7%) | |
BlackRock Liquidity Funds TempFund Portfolio, Institutional
Class, 2.49% (c) | | | 1,984,921 | | | | 1,984,921 | | |
Fidelity Investments Money Market Government Portfolio, Class I, 2.28% (c) | | | 2,868,117 | | | | 2,868,117 | | |
Fidelity Investments Prime Money Market Portfolio, Class I, 2.46% (c) | | | 88,568 | | | | 88,568 | | |
Goldman Sachs Financial Square Prime Obligations Fund, Institutional
Class, 2.55% (c) | | | 1,102,747 | | | | 1,102,747 | | |
JPMorgan Prime Money Market Fund, Capital Class, 2.49% (c) | | | 1,764,284 | | | | 1,764,284 | | |
Morgan Stanley Institutional Liquidity Prime Portfolio, Institutional
Class, 2.58% (c) | | | 2,646,592 | | | | 2,646,592 | | |
Total Collateral for Securities Loaned (Cost $10,455,229) | | | 10,455,229 | | |
Total Investments (Cost $95,384,236) — 110.1% | | | 98,082,293 | | |
Liabilities in excess of other assets — (10.1)% | | | (9,026,319 | ) | |
NET ASSETS — 100.00% | | $ | 89,055,974 | | |
^ Purchased with cash collateral from securities on loan.
(a) Non-income producing security.
(b) All or a portion of this security is on loan.
(c) Rate disclosed is the daily yield on December 31, 2018.
ADR — American Depositary Receipt
PLC — Public Limited Company
See notes to financial statements.
10
Victory Variable Insurance Funds | | Statement of Assets and Liabilities
December 31, 2018 | |
| | | Victory RS Small Cap
Growth Equity VIP Series | |
ASSETS: | |
Investments, at value (Cost $95,384,236) | | $ | 98,082,293 | (a) | |
Cash and cash equivalents | | | 1,713,689 | | |
Interest and dividends receivable | | | 37,882 | | |
Receivable for capital shares issued | | | 6,474 | | |
Receivable from Advisor | | | 5,628 | | |
Receivable for investments sold | | | 1,864 | | |
Total Assets | | | 99,847,830 | | |
LIABILITIES: | |
Payables: | |
Collateral received on loaned securities | | | 10,455,229 | | |
Investments purchased | | | 51,559 | | |
Capital shares redeemed | | | 186,412 | | |
Accrued expenses and other payables: | |
Investment advisory fees | | | 58,481 | | |
Administration fees | | | 4,784 | | |
Custodian fees | | | 1,622 | | |
Transfer agent fees | | | 11,585 | | |
Chief Compliance Officer fees | | | 186 | | |
Trustees' fees | | | 93 | | |
Other accrued expenses | | | 21,905 | | |
Total Liabilities | | | 10,791,856 | | |
NET ASSETS: | |
Capital | | | 65,268,691 | | |
Total distributable earnings/(loss) | | | 23,787,283 | | |
Net Assets | | $ | 89,055,974 | | |
Shares Outstanding (unlimited shares authorized, with a par value of
$0.001 per share): | | | 5,824,578 | | |
Net asset value: | | $ | 15.29 | | |
(a) Includes $10,274,441 of securities on loan.
See notes to financial statements.
11
Victory Variable Insurance Funds | | Statement of Operations
For the Year Ended December 31, 2018 | |
| | | Victory RS Small Cap
Growth Equity VIP Series | |
Investment Income: | |
Dividends | | $ | 389,949 | | |
Interest | | | 30,864 | | |
Securities lending (net of fees) | | | 74,486 | | |
Total Income | | | 495,299 | | |
Expenses: | |
Investment advisory fees | | | 849,068 | | |
Administration fees | | | 67,857 | | |
Custodian fees | | | 7,264 | | |
Transfer agent fees | | | 23,431 | | |
Trustees' fees | | | 9,534 | | |
Chief Compliance Officer fees | | | 964 | | |
Legal and audit fees | | | 23,016 | | |
Interest expense on interfund lending (See Note 6) | | | 72 | | |
Other expenses | | | 20,172 | | |
Total Expenses | | | 1,001,378 | | |
Expenses waived/reimbursed by Adviser | | | (5,628 | ) | |
Net Expenses | | | 995,750 | | |
Net Investment Income (Loss) | | | (500,451 | ) | |
Realized/Unrealized Gains (Losses) from Investment Transactions: | |
Net realized gains (losses) from investment transactions | | | 22,267,262 | | |
Net change in unrealized appreciation/depreciation on investments | | | (28,678,125 | ) | |
Net realized/unrealized losses on investments | | | (6,410,863 | ) | |
Change in net assets resulting from operations | | $ | (6,911,314 | ) | |
See notes to financial statements.
12
Victory Variable Insurance Funds | | Statements of Changes in Net Assets | |
| | | Victory RS Small Cap Growth
Equity VIP Series | |
| | | Year
Ended
December 31,
2018 | | Year
Ended
December 31,
2017 | |
From Investment Activities: | |
Operations: | |
Net investment income (loss) | | $ | (500,451 | ) | | $ | (476,134 | ) | |
Net realized gains (losses) from investment transactions | | | 22,267,262 | | | | 18,834,058 | | |
Net change in unrealized appreciation/depreciation on
investments | | | (28,678,125 | ) | | | 15,172,056 | | |
Change in net assets resulting from operations | | | (6,911,314 | ) | | | 33,529,980 | | |
Distributions to Shareholders: (a) | |
Change in net assets resulting from distributions to shareholders | | | (16,485,913 | ) | | | — | | |
Change in net assets resulting from capital transactions | | | 982,954 | | | | (19,301,445 | ) | |
Change in net assets | | | (22,414,273 | ) | | | 14,228,535 | | |
Net Assets: | |
Beginning of period | | | 111,470,247 | | | | 97,241,712 | | |
End of period | | $ | 89,055,974 | | | $ | 111,470,247 | | |
Capital Transactions: | |
Proceeds from shares issued | | $ | 6,277,058 | | | $ | 3,530,550 | | |
Distributions reinvested | | | 16,485,913 | | | | — | | |
Cost of shares redeemed | | | (21,780,017 | ) | | | (22,831,995 | ) | |
Change in net assets resulting from capital transactions | | $ | 982,954 | | | $ | (19,301,445 | ) | |
Share Transactions: | |
Issued | | | 284,919 | | | | 198,987 | | |
Reinvested | | | 1,088,898 | | | | — | | |
Redeemed | | | (991,856 | ) | | | (1,317,237 | ) | |
Change in Shares | | | 381,961 | | | | (1,118,250 | ) | |
(a) Current and prior year distributions to shareholders have been reclassified and conform to amended GAAP presentation under Regulation S-X (See Item 10 in the Notes to Financial Statements).
See notes to financial statements.
13
Victory Variable Insurance Funds | | Financial Highlights | |
For a Share Outstanding Throughout Each Period
| | | Victory RS Small Cap Growth Equity VIP Series | |
| | | Year
Ended
December 31,
2018 | | Year
Ended
December 31,
2017 | | Year
Ended
December 31,
2016 | | Year
Ended
December 31,
2015 | | Year
Ended
December 31,
2014 | |
Net Asset Value, Beginning of Period | | $ | 20.48 | | | $ | 14.82 | | | $ | 14.61 | | | $ | 17.47 | | | $ | 18.87 | | |
Investment Activities: | |
Net investment income (loss) | | | (0.10 | )(a) | | | (0.05 | )(a) | | | (0.05 | )(a) | | | (0.10 | )(a) | | | (0.10 | ) | |
Net realized and unrealized gains
(losses) on investments | | | (1.62 | ) | | | 5.71 | | | | 0.25 | | | | 0.24 | | | | 1.98 | | |
Total from Investment Activities | | | (1.72 | ) | | | 5.66 | | | | 0.20 | | | | 0.14 | | | | 1.88 | | |
Distributions to Shareholders: | |
Net investment income | | | — | | | | — | | | | — | | | | — | | | | — | | |
Net realized gains from investments | | | (3.47 | ) | | | — | | | | — | | | | (3.00 | ) | | | (3.28 | ) | |
Total Distributions to
Shareholders | | | (3.47 | ) | | | — | | | | — | | | | (3.00 | ) | | | (3.28 | ) | |
Capital Contributions from
Prior Custodian, Net (See Note 8) | | | — | | | | — | | | | 0.01 | | | | — | | | | — | | |
Net Asset Value, End of Period | | $ | 15.29 | | | $ | 20.48 | | | $ | 14.82 | | | $ | 14.61 | | | $ | 17.47 | | |
Total Return (b) | | | (8.25 | )% | | | 38.19 | % | | | 1.44 | %(c) | | | 0.62 | % | | | 10.13 | % | |
Ratios/Supplemental Data: | |
Net Assets at end of period (000) | | $ | 89,056 | | | $ | 111,470 | | | $ | 97,242 | | | $ | 106,962 | | | $ | 118,144 | | |
Ratio of net expenses to average net assets | | | 0.88 | % | | | 0.87 | % | | | 0.88 | % | | | 0.88 | % | | | 0.86 | % | |
Ratio of net investment income (loss) to
average net assets | | | (0.44 | )% | | | (0.30 | )% | | | (0.39 | )% | | | (0.54 | )% | | | (0.60 | )% | |
Ratio of gross expenses to average
net assets | | | 0.89 | %(d) | | | 0.87 | % | | | 0.88 | % | | | 0.88 | % | | | 0.86 | % | |
Portfolio turnover | | | 76 | % | | | 71 | % | | | 91 | % | | | 88 | % | | | 95 | % | |
(a) Per share net investment income (loss) has been calculated using the average daily shares method.
(b) Total returns do not reflect the effects of charges deducted pursuant to the terms of The Guardian Insurance & Annuity Company, Inc.'s variable contracts. Inclusion of such charges would reduce the total returns for all periods shown.
(c) The Fund received monies related to a nonrecurring refund from the prior Custodian. The corresponding impact to the total return was less than 0.01% for the period shown. (See Note 8)
(d) During the period, certain fees were reduced and/or reimbursed. If such fee reductions and/or reimbursements had not occurred, the ratios would have been as indicated.
See notes to financial statements.
14
Victory Variable Insurance Funds | | Notes to Financial Statements
December 31, 2018 | |
1. Organization:
Victory Variable Insurance Funds (the "Trust") was organized on February 11, 1998 as a Delaware statutory trust. The Trust is registered under the Investment Company Act of 1940, as amended (the "1940 Act"), as a diversified open-end investment company. The Trust is comprised of nine funds and is authorized to issue an unlimited number of shares, which are units of beneficial interest with a par value of $0.001 per share.
The accompanying financial statements are those of the Victory RS Small Cap Growth Equity VIP Series (the "Fund"). The Fund offers a single class of shares: Class I Shares. Sales of shares of the Fund may only be made to certain separate accounts of The Guardian Insurance & Annuity Company, Inc. ("GIAC") that fund certain variable annuity and variable life insurance contracts issued by GIAC. GIAC is a wholly owned subsidiary of The Guardian Life Insurance Company of America ("Guardian Life").
Under the Trust's organizational documents, its officers and trustees are indemnified against certain liabilities arising out of the performance of their duties to the Fund. In addition, in the normal course of business, the Fund enters into contracts with its vendors and others that provide for general indemnifications. The Fund's maximum exposure under these arrangements is unknown, as this would involve future claims that may be made against the Fund. However, based on experience, the Fund expects that risk of loss to be remote.
2. Significant Accounting Policies:
The following is a summary of significant accounting policies followed by the Trust in the preparation of its financial statements. The policies are in conformity with accounting principles generally accepted in the United States of America ("GAAP"). The preparation of financial statements in accordance with GAAP requires management to make estimates and assumptions that affect the reported amounts of assets and liabilities and disclosure of contingent assets and liabilities at the date of the financial statements and the reported amounts of income and expenses for the period. Actual results could differ from those estimates. The Fund follows the specialized accounting and reporting requirements under GAAP that are applicable to investment companies.
Investment Valuation:
The Fund records investments at fair value. Fair value is defined as the price that would be received to sell an asset or paid to transfer a liability in an orderly transaction between market participants at the measurement date.
The valuation techniques described below maximize the use of observable inputs and minimize the use of unobservable inputs in determining fair value. The inputs used for valuing the Fund's investments are summarized in the three broad levels listed below:
• Level 1 — quoted prices in active markets for identical securities
• Level 2 — other significant observable inputs (including quoted prices for similar securities or interest rates applicable to those securities, etc.)
• Level 3 — significant unobservable inputs (including the Fund's own assumptions in determining the fair value of investments)
Changes in valuation techniques may result in transfers in or out of an assigned level within the disclosure hierarchy. The inputs or methodologies used for valuation techniques are not necessarily an indication of the risk associated with entering into those investments.
Portfolio securities listed or traded on securities exchanges, including American Depositary Receipts ("ADRs") and Rights, are valued at the closing price on the exchange or system where the security is principally traded, if available, or at the Nasdaq Official Closing Price. If there have been no sales for that day on the exchange or system, then a security is valued at the last available bid quotation on the exchange or system where the security is principally traded. In each of these situations, valuations are typically categorized as Level 1 in the fair value hierarchy.
15
Victory Variable Insurance Funds | | Notes to Financial Statements — continued
December 31, 2018 | |
Investments for which there are no such quotations, or for which quotations do not appear reliable, are valued at fair value in accordance with procedures established by and under the general supervision and responsibility of the Trust's Board of Trustees (the "Board"). These valuations are typically categorized as Level 2 or Level 3 in the fair value hierarchy, based on the observability of inputs used to determine the fair value.
A summary of the valuations as of December 31, 2018, based upon the three levels defined above, is included in the table below while the breakdown, by category, of investments is disclosed in the Schedule of Portfolio Investments:
| | | LEVEL 1 —
Quoted Prices | | Total | |
| | | Investments
in
Securities | | Investments
in
Securities | |
Common Stocks | | $ | 87,627,064 | | | $ | 87,627,064 | | |
Collateral for Securities Loaned | | | 10,455,229 | | | | 10,455,229 | | |
Total | | $ | 98,082,293 | | | $ | 98,082,293 | | |
For the year ended December 31, 2018, there were no Level 3 investments for which significant unobservable inputs were used to determine fair value.
Investment Transactions and Related Income:
Changes in holdings of investments are accounted for no later than one business day following the trade date. For financial reporting purposes, however, investment transactions are accounted for on trade date on the last business day of the reporting period. Interest income is recognized on an accrual basis and includes, where applicable, the amortization of premiums or accretion of discounts. Dividend income is recorded on the ex-dividend date. Gains or losses realized on sales of securities are determined by comparing the identified cost of the security lot sold with the net sales proceeds.
Withholding taxes on interest, dividends and gains as a result of certain investments in ADRs by the Fund have been provided for in accordance with each investment's applicable country's tax rules and rates.
Securities Lending:
The Trust has entered into a Master Securities Lending Agreement ("MSLA") with Citibank, N.A. ("Citibank" or the "Agent"). Under the terms of the MSLA, the Fund may lend securities to certain broker-dealers and banks in exchange for collateral in the amount of at least 102% of the value of U.S. securities loaned or at least 105% of the value of non-U.S. securities loaned, marked-to-market daily. Any collateral shortfalls associated with increases in the valuation of the securities loaned are adjusted the next business day. The collateral can be received in the form of cash collateral and/or non-cash collateral. Non-cash collateral can include U.S. Government Securities, letters of credit and certificates of deposit. The cash collateral is invested in short-term instruments or cash equivalents as noted on the Fund's Schedule of Portfolio Investments. The Trust does not have effective control of the non-cash collateral and therefore it is not disclosed in the Fund's Schedule of Portfolio Investments. The Fund continues to benefit from interest or dividends on the securities loaned and may also earn a return from the collateral. The Fund pays various fees in connection with the investment of cash collateral. The Fund pays the Agent fees based on the investment income received from securities lending activities. Securities lending income is disclosed in the Fund's Statement of Operations. Although risk is mitigated by the collateral, the Fund could experience a delay in recovering its securities and possible loss of income or value if the borrower fails to return them.
Securities lending transactions are entered into by the Fund under the MSLA, which permits the Fund, under certain circumstances such as an event of default, to offset amounts payable by the Fund to the same counterparty against amounts receivable from the counterparty to create a net payment due to or from the Fund.
16
Victory Variable Insurance Funds | | Notes to Financial Statements — continued
December 31, 2018 | |
The following table is a summary of the Fund's securities lending transactions which are subject to offset under the MSLA as of December 31, 2018. These transactions are accounted for as secured borrowings with an overnight and continuous contractual maturity for cash collateral, and greater than overnight and continuous contractual maturity for non-cash collateral.
Gross
Amount of
Recognized
Assets
(Value of | | Value of
Cash | | Value of Non-cash Collateral
Received by Maturity | | | |
Securities on
Loan) | | Collateral
Received | | <30 Days | | Between 30 &
90 days | | >90 Days | | Net
Amount | |
| $ | 10,274,441 | | | $ | 10,455,229 | | | $ | — | | | $ | — | | | $ | — | | | $ | 180,788 | | |
Dividends to Shareholders:
Dividends from net investment income, if any, are declared and paid annually by the Fund. Distributable net realized gains, if any, are declared and distributed at least annually.
The amounts of dividends from net investment income and distributions from net realized gains are determined in accordance with federal income tax regulations, which may differ from GAAP. To the extent these "book/tax" differences are permanent in nature (e.g., net operating loss, distribution reclassification, and deemed distribution due to shareholder redemptions), such amounts are reclassified within the components of net assets based on their federal tax-basis treatment; temporary differences (e.g., wash sales) do not require reclassification. To the extent dividends and distributions exceed net investment income and net realized gains for tax purposes, they are reported as distributions of capital. Net investment losses incurred by the Fund may be reclassified as an offset to capital on the accompanying Statement of Assets and Liabilities.
As of December 31, 2018, on the Statement of Assets and Liabilities, there were no permanent book-to-tax differences reclassification adjustments.
Federal Income Taxes:
It is the policy of the Fund to continue to qualify as a regulated investment company by complying with the provisions available to certain investment companies, as defined in applicable sections of the Internal Revenue Code, and to make distributions of net investment income and net realized gains sufficient to relieve it from all, or substantially all, federal income taxes. Accordingly, no provision for federal income taxes is required in the financial statements. The Fund has a tax year end of December 31.
Management of the Fund has reviewed tax positions taken in tax years that remain subject to examination by all major tax jurisdictions, including federal (i.e., the last four tax year ends and the interim tax period since then). Management believes that there is no tax liability resulting from unrecognized tax benefits related to uncertain tax positions taken.
Allocations:
Expenses directly attributable to the Fund are charged to the Fund, while expenses which are attributable to more than one fund in the Trust, or jointly with an affiliated trust, are allocated among the respective funds in the Trust and/or affiliated trust based upon net assets or another appropriate basis.
Affiliated Securities Transactions:
Pursuant to Rule 17a-7 under the 1940 Act, the Fund may engage in securities transactions with affiliated investment companies and advisory accounts managed by the Adviser and any applicable sub-adviser. Any such purchase or sale transaction must be effected without brokerage commission or other remuneration, except for customary transfer fees. The transaction must be effected at the current market price, which is either the security's last sale price on an exchange or, if there are no transactions
17
Victory Variable Insurance Funds | | Notes to Financial Statements — continued
December 31, 2018 | |
in the security that day, at the average of the highest bid and lowest asked price. For the year ended December 31, 2018, the Fund did not engage in any Rule 17a-7 transactions under the 1940 Act.
3. Purchases and Sales of Securities:
Purchases and sales of securities (excluding securities maturing less than one year from acquisition) for the year ended December 31, 2018 were as follows:
| Purchases | | Sales | |
| $ | 84,191,661 | | | $ | 100,741,877 | | |
For the year ended December 31, 2018, there were no purchases or sales of U.S. Government Securities.
4. Fees and Transactions with Affiliates and Related Parties:
Investment advisory services are provided to the Fund by Victory Capital Management Inc. ("VCM" or the "Adviser"), a New York corporation registered as an investment adviser with the Securities and Exchange Commission ("SEC"). The Adviser is a wholly-owned indirect subsidiary of Victory Capital Holdings Inc., a publicly traded Delaware corporation and a wholly-owned direct subsidiary of Victory Capital Operating, LLC.
Under the terms of the Investment Advisory Agreement, the Adviser is entitled to receive 0.75% of the average daily net assets of the Fund. The Adviser may use its resources to assist with the Fund's distribution and marketing expenses.
VCM also serves as the Fund's administrator and fund accountant. Under an Administration and Fund Accounting Agreement, VCM is paid for its services an annual fee at a rate of 0.08% of the first $15 billion in average daily net assets of the Trust, Victory Portfolios and Victory Portfolios II (collectively, the "Trusts"), 0.05% of the average daily net assets above $15 billion to $30 billion of the Trusts and 0.04% of the average daily net assets over $30 billion of the Trusts.
Citi Fund Services Ohio, Inc. ("Citi"), an affiliate of Citibank, N.A., acts as sub-administrator and sub-fund accountant to the Fund pursuant to a Sub-Administration and Sub-Fund Accounting Services Agreement between VCM and Citi. VCM pays Citi a fee for providing these services. The Trust reimburses VCM and Citi for all of their reasonable out-of-pocket expenses incurred in providing these services.
FIS Investor Services, LLC ("FIS") serves as the Fund's transfer agent. Under the Transfer Agent Agreement, the Trust pays FIS a fee for its services and reimburses FIS for all of their reasonable out-of-pocket expenses incurred in providing these services.
The Chief Compliance Officer ("CCO") is an employee of the Adviser, which pays the compensation of the CCO and his support staff. The Trust has entered into an Agreement to provide compliance services with the Adviser, pursuant to which the Adviser furnishes its compliance personnel, including the services of the CCO, and other resources reasonably necessary to provide the Trust with compliance oversight services related to the design, administration and oversight of a compliance program for the Trust in accordance with Rule 38a-1 under the 1940 Act. Funds in the Trust, Victory Portfolios, Victory Institutional Funds and Victory Portfolios II (collectively, the "Victory Funds Complex"), in the aggregate, compensate the Adviser for these services.
The Victory Funds Complex pays an annual retainer to each Independent Trustee, plus an additional annual retainer to the Chairman of the Board. The aggregate amount of the fees and expenses of the Independent Trustees are allocated amongst all the funds in the Victory Funds Complex and are presented in the Statement of Operations.
Shearman & Sterling LLP provides legal services to the Trust.
Victory Capital Advisers, Inc. (the "Distributor"), an affiliate of the Adviser, serves as distributor for the continuous offering of the shares of the Fund pursuant to a Distribution Agreement between the Distributor and the Trust.
18
Victory Variable Insurance Funds | | Notes to Financial Statements — continued
December 31, 2018 | |
The Adviser has entered into an expense limitation agreement with the Fund until at least April 30, 2019. Under the terms of the agreement, the Adviser has agreed to waive fees or reimburse certain expenses to the extent that ordinary operating expenses incurred by certain classes of the Fund in any fiscal year exceed the expense limit for such classes of the Fund. Such excess amounts will be the liability of the Adviser. Interest, taxes, brokerage commissions, other expenditures which are capitalized in accordance with GAAP, and other extraordinary expenses not incurred in the ordinary course of a Fund's business are excluded from the expense limits. For the year ended December 31, 2018, the expense limit (excluding voluntary waivers) is 0.88%.
The Fund has agreed to repay fees and expenses that were waived or reimbursed by the Adviser for a period up to three fiscal years after such waiver or reimbursement was made to the extent such payments or repayments would not cause the expenses of a class to exceed the original expense limitation in place at the time of the waiver or reimbursement or any expense limitation agreement in place at the time of repayment. As of December 31, 2018, the following amounts are available to be repaid to the Adviser. Amounts repaid to the Adviser during the year ended, if any, are reflected on the Statement of Operations as "Recoupment of prior expenses waived/reimbursed by Adviser".
Expires
12/31/2019 | | Expires
12/31/2021 | |
| $ | 1,642 | | | $ | 5,628 | | |
The Adviser may voluntarily waive or reimburse additional fees to assist the Fund in maintaining a competitive expense ratio. Voluntary waivers and reimbursements applicable to the Fund are not available to be recouped at a future time. There were no voluntary waivers or reimbursements for the year ended December 31, 2018.
Certain officers and/or interested trustees of the Fund are also officers and/or employees of the Adviser, Administrator, Fund Accountant, Sub-Administrator, Sub-Fund Accountant, and Legal.
5. Risks:
The Fund may be subject to other risks in addition to these identified risks.
An investment in the Fund's shares represents an indirect investment in the securities owned by the Fund, some of which will be traded on a national securities exchange or in the over-the-counter markets. The value of the securities in which the Fund invests, like other market investments, may move up or down, sometimes rapidly and unpredictably. The value of the securities in which the Fund invests may affect the value of the Fund's shares. An investment in the Fund's shares at any point in time may be worth less than the original investment, even after taking into account the reinvestment of the Fund's distributions.
The Fund will be subject to credit risk with respect to the amount it expects to receive from counterparties for financial instruments entered into by the Fund. The Fund may be negatively impacted if a counterparty becomes bankrupt or otherwise fails to perform its obligations due to financial difficulties. The Fund may experience significant delays in obtaining any recovery in bankruptcy or other reorganization proceeding and the Fund may obtain only limited recovery or may obtain no recovery in such circumstances. The Fund typically enters into transactions with counterparties whose credit ratings are investment grade, as determined by a nationally recognized statistical rating organization or, if unrated, judged by the Adviser to be of comparable quality.
6. Borrowing and Interfund Lending:
Line of Credit:
The Victory Funds Complex participates in a short-term, demand note "Line of Credit" agreement with Citibank. Under the agreement with Citibank, the Victory Funds Complex may borrow up to $250 million, of which $100 million is committed and $150 million is uncommitted. $40 million of the Line of Credit is reserved for use by the Victory Floating Rate Fund, another series of the Victory Funds
19
Victory Variable Insurance Funds | | Notes to Financial Statements — continued
December 31, 2018 | |
Complex, with that Fund paying the related commitment fees for that amount. The purpose of the agreement is to meet temporary or emergency cash needs, including redemption requests that might otherwise require the untimely disposition of securities. The current agreement was amended on July 27, 2018 with a new termination date of July 26, 2019. Citibank receives an annual commitment fee of 0.15% on $100 million for providing the Line of Credit. For the year ended December 31, 2018, Citibank earned approximately $150,000 in commitment fees from the Victory Funds Complex. Each fund in the Victory Funds Complex pays a pro-rata portion of the commitment fees plus any interest on amounts borrowed. Interest accrued by the Fund during the period is presented on the Statement of Operations under Interest expense on line of credit.
The Fund did not utilize or participate in the Line of Credit during the year ended December 31, 2018.
Interfund Lending:
The Trust and Adviser rely on an exemptive order granted by the SEC in March 2017 (the "Order"), permitting the establishment and operation of an Interfund Lending Facility (the "Facility"). The Facility allows the Fund to directly lend and borrow money to or from any other Victory Fund relying upon the Order at rates beneficial to both the borrowing and lending funds. Advances under the Facility are allowed for temporary or emergency purposes, including the meeting of redemption requests that otherwise might require the untimely disposition of securities, and are subject to each Fund's borrowing restrictions. The interfund loan rate is determined, as specified in the Order, by averaging the current repurchase agreement rate and the current bank loan rate. Interest accrued by the Fund during the period is presented on the Statement of Operations under Interest expense on interfund lending.
The average loans for the days outstanding and average interest rate for the Fund during the year ended December 31, 2018 were as follows:
Borrower or
Lender | | Amount
Outstanding at
December 31, 2018 | | Average
Borrowing* | | Days
Borrowing
Outstanding | | Average
Interest
Rate* | | Maximum
Borrowing
During the
Period | |
| Borrower | | $ | — | | | $ | 654,500 | | | | 2 | | | | 1.98 | % | | $ | 827,000 | | |
* For the year ended December 31, 2018, based on the number of days borrowings were outstanding.
7. Federal Income Tax Information:
The tax character of distributions paid during the tax years ended, as noted below, were as follows (total distributions paid may differ from the Statements of Changes in Net Assets because, for tax purposes, dividends are recognized when actually paid).
Year Ended December 31, 2018 | |
Distributions paid from | |
Ordinary
Income | | Net
Long-Term
Capital Gains | | Total
Distributions
Paid | |
| $ | 411,847 | | | $ | 16,074,066 | | | $ | 16,485,913 | | |
Year Ended December 31, 2017 | |
Distributions paid from | |
Ordinary
Income | | Net
Long-Term
Capital Gains | | Total
Distributions
Paid | |
| $ | — | | | $ | — | | | $ | — | | |
20
Victory Variable Insurance Funds | | Notes to Financial Statements — continued
December 31, 2018 | |
As of the tax year ended December 31, 2018, the components of accumulated earnings (deficit) on a tax basis were as follows:
Undistributed
Ordinary
Income | | Undistributed
Long-Term
Capital Gains | | Accumulated
Earnings | | Unrealized
Appreciation
(Depreciation)* | | Total
Accumulated
Earnings
(Deficit) | |
| $ | 90,732 | | | $ | 21,803,368 | | | $ | 21,894,100 | | | $ | 1,893,183 | | | $ | 23,787,283 | | |
*The difference between the book-basis and tax-basis unrealized appreciation (depreciation) is attributable primarily to tax deferral of losses on wash sales.
During the tax year ended December 31, 2018, the Fund did not utilize capital loss carryforwards.
As of December 31, 2018, the cost basis for federal income tax purposes, gross unrealized appreciation, gross unrealized depreciation and net unrealized appreciation (depreciation) for investments were as follows:
Cost of
Investments
for Federal
Tax Purposes | | Gross
Unrealized
Appreciation | | Gross
Unrealized
Depreciation | | Net
Unrealized
Appreciation
(Depreciation) | |
| $ | 96,189,110 | | | $ | 32,863,311 | | | $ | (30,970,128 | ) | | $ | 1,893,183 | | |
8. Capital Contribution from Prior Custodian:
During 2016, the Fund received notification from the Fund's prior custodian, State Street Bank and Trust ("State Street"), concerning issues related to billing on certain categories of expenses during the approximately 16-year period from 1998 through October 31, 2014. The over-billing primarily related to categories of expenses that involved an allocation of general costs among multiple clients.
State Street paid the refunded amounts during January 2017. Based on billing information received during 2016 from State Street and an analysis of any expense limitation agreements that were in place during the period of the activities in question, including the application of any recoupment provisions in such agreements, the Adviser received a portion of the refund.
The portion of the refund retained by the Fund was accounted for as a capital contribution and is reflected on the Financial Highlights as "Capital Contribution from Prior Custodian, Net".
9. Fund Ownership:
Ownership of more than 25% of the voting securities of a fund creates presumptions of control of the fund, under section 2(a)(9) of the 1940 Act. As of December 31, 2018, the shareholders listed below held more than 25% of the shares outstanding of the Fund and may be deemed to control the Fund.
| Shareholder | | Percent | |
| GIAC | | | 100.0 | % | |
10. Recent Accounting Pronouncements:
In October 2016, the SEC released its Final Rules on Investment Company Reporting Modernization (the "Rules"). The Rules introduced two new regulatory reporting forms for investment companies, Form N-PORT and Form N-CEN. The Fund's compliance date for Form N-PORT was June 1, 2018, and the Fund will make its initial filing with the SEC on Form N-PORT for the period ending March 31, 2019. Effective with the period ended June 30, 2018, the Fund was required to maintain, and make available to the SEC upon request, the information required to be included in Form N-PORT. Form N-PORT will replace Form N-Q filings effective with the requirement to file the Form N-PORT with the SEC for the period ending March 31, 2019. The Fund's compliance date for Form N-CEN was June 1, 2018, and the Fund will make its initial filing on Form N-CEN for the period ended December 31, 2018. Form N-CEN will replace Form N-SAR filings. The Fund's adoption of these amendments have no effect on the Fund's net assets or results of operations.
21
Victory Variable Insurance Funds | | Notes to Financial Statements — continued
December 31, 2018 | |
In August 2018, the FASB issued ASU No. 2018-13, "Fair Value Measurements" ("ASU 2018-13"). This update makes certain removals from, changes to and additions to existing disclosure requirements for fair value measurements. ASU 2018-13 does not change fair value measurements already required or permitted by existing standards. ASU 2018-13 is effective for financial statements issued for fiscal years beginning after December 15, 2019, and interim periods within those fiscal years. As permitted, the Fund has early adopted ASU 2018-13 with the financial statements prepared as of December 31, 2018.
In August 2018, the SEC adopted amendments to certain financial statement disclosure requirements to conform them to GAAP for investment companies. These amendments made certain disclosure requirements effective under Regulation S-X. The Fund's adoption of these amendments, effective with the financial statements prepared as of December 31, 2018 had no effect on the Fund's net assets or results of operations.
11. Subsequent Events:
The Fund has evaluated the need for additional disclosures or adjustments resulting from subsequent events through the date these financial statements were issued. Based on this evaluation, there were no subsequent events to report that would have a material impact on the Fund's financial statements.
22
REPORT OF INDEPENDENT REGISTERED PUBLIC ACCOUNTING FIRM
To the Shareholders and the Board of Trustees of Victory RS Small Cap Growth Equity VIP Series
Opinion on the Financial Statements
We have audited the accompanying statement of assets and liabilities of Victory RS Small Cap Growth Equity VIP Series (the "Fund") (one of the funds constituting the Victory Variable Insurance Funds (the "Trust")), including the portfolio of investments, as of December 31, 2018, and the related statement of operations for the year then ended, the statements of changes in net assets for each of the two years in the period then ended, the financial highlights for each of the three years in the period then ended and the related notes (collectively referred to as the "financial statements"). In our opinion, the financial statements present fairly, in all material respects, the financial position of the Fund (one of the funds constituting the Trust) at December 31, 2018, and the results of its operations for the year then ended, the changes in its net assets for each of the two years in the period then ended and its financial highlights for each of the three years in the period then ended, in conformity with U.S. generally accepted accounting principles.
The financial highlights of the Fund for each of the periods presented through December 31, 2015 were audited by other auditors, whose report dated February 22, 2016 expressed an unqualified opinion on those financial highlights.
Basis for Opinion
These financial statements are the responsibility of the Trust's management. Our responsibility is to express an opinion on the Fund's financial statements based on our audits. We are a public accounting firm registered with the Public Company Accounting Oversight Board (United States) (PCAOB) and are required to be independent with respect to the Trust in accordance with the U.S. federal securities laws and the applicable rules and regulations of the Securities and Exchange Commission and the PCAOB.
We conducted our audits in accordance with the standards of the PCAOB. Those standards require that we plan and perform the audit to obtain reasonable assurance about whether the financial statements are free of material misstatement, whether due to error or fraud. The Trust is not required to have, nor were we engaged to perform, an audit of the Trust's internal control over financial reporting. As part of our audit we are required to obtain an understanding of internal control over financial reporting but not for the purpose of expressing an opinion on the effectiveness of the Trust's internal control over financial reporting. Accordingly, we express no such opinion.
Our audits included performing procedures to assess the risks of material misstatement of the financial statements, whether due to error or fraud, and performing procedures that respond to those risks. Such procedures included examining, on a test basis, evidence regarding the amounts and disclosures in the financial statements. Our procedures included confirmation of securities owned as of December 31, 2018, by correspondence with the custodian, transfer agent, and brokers or by other appropriate auditing procedures where replies from brokers were not received. Our audits also included evaluating the accounting principles used and significant estimates made by management, as well as evaluating the overall presentation of the financial statements. We believe that our audits provide a reasonable basis for our opinion.

We have served as the auditor of one or more Victory Capital's investment companies since 1995.
Cincinnati, Ohio
February 15, 2019
23
Victory Variable Insurance Funds | | Supplemental Information
December 31, 2018 | |
(Unaudited)
Trustee and Officer Information
Board of Trustees:
Overall responsibility for management of the Trust rests with the Board. The Trust is managed by the Board in accordance with the laws of the State of Delaware. There are currently ten Trustees, nine of whom are not "interested persons" of the Trust within the meaning of that term under the 1940 Act ("Independent Trustees") and one of whom is an "interested person" of the Trust within the meaning of that term under the 1940 Act ("Interested Trustee"). The Trustees, in turn, elect the officers of the Trust to actively supervise its day-to-day operations.
The following tables list the Trustees, their ages, position with the Trust, commencement of service, principal occupations during the past five years and any directorships of other investment companies or companies whose securities are registered under the Securities Exchange Act of 1934, as amended, or who file reports under that Act. Each Trustee oversees nine portfolios in the Trust, one portfolio in Victory Institutional Funds, 42 portfolios in Victory Portfolios and 20 portfolios in Victory Portfolios II, each a registered investment company that, together with the Trust, comprise the Victory Funds Complex. Each Trustee's address is c/o Victory Variable Insurance Funds, 4900 Tiedeman Road, 4th Floor, Brooklyn, Ohio 44144. Each Trustee has an indefinite term.
Name and Age | | Position
Held with
the Trust | | Date
Commenced
Service | | Principal Occupation
During Past 5 Years | | Other
Directorships
Held During
Past 5 Years | |
Independent Trustees. | |
David Brooks Adcock, 67 | | Trustee | | February 2005 | | Consultant (since 2006). | | Chair and Trustee, Turner Funds (December 2016-December 2017). | |
Nigel D.T. Andrews, 71 | | Vice Chair and Trustee | | August 2002 | | Retired. | | Director, TCG BDC II, Inc. (since 2017); Director, TCG BDC I, Inc. (formerly Carlyle GMS Finance, Inc.) (since 2012); Director, Old Mutual US Asset Management (2002-2014). | |
E. Lee Beard, 67* | | Trustee | | February 2005 | | Retired (since 2015); Consultant, The Henlee Group, LLC (consulting) (2005-2015). | | None. | |
Dennis M. Bushe, 75 | | Trustee | | July 2016 | | Retired. | | Trustee, RS Investment Trust and RS Variable Products Trust (November 2011-July 2016). | |
24
Victory Variable Insurance Funds | | Supplemental Information — continued
December 31, 2018 | |
(Unaudited)
Name and Age | | Position
Held with
the Trust | | Date
Commenced
Service | | Principal Occupation
During Past 5 Years | | Other
Directorships
Held During
Past 5 Years | |
Sally M. Dungan, 64 | | Trustee | | February 2011 | | Chief Investment Officer, Tufts University (since 2002). | | None. | |
John L. Kelly, 65 | | Trustee | | February 2015 | | Partner, McCarvill Capital Partners (September 2016-September 2017); Advisor (January 2016-April 2016) and Managing Partner (August 2014- January 2016), Endgate Commodities LLC; Chief Operating Officer, Liquidnet Holdings, Inc. (2011-2014). | | Director, Caledonia Mining Corporation (since May 2012). | |
David L. Meyer, 61* | | Trustee | | December 2008 | | Retired. | | None. | |
Gloria S. Nelund, 57 | | Trustee | | July 2016 | | Chair, CEO and Co-Founder of TriLinc Global, LLC, an investment firm. | | TriLinc Global Impact Fund, LLC (since 2012); Trustee, RS Investment Trust and RS Variable Products Trust (November 2007-July 2016). | |
Leigh A. Wilson, 74 | | Chair and Trustee | | February 1998 | | Private Investor. | | Chair (since 2013), Caledonia Mining Corporation. | |
Interested Trustee. | |
David C. Brown, 46** | | Trustee | | May 2008 | | Chairman and Chief Executive Officer (since 2013), Co-Chief Executive Officer (2011-2013), the Adviser; Chairman and Chief Executive Officer, Victory Capital Holdings, Inc. (since 2013). | | None. | |
* The Board has designated Mr. Meyer and Ms. Beard as its Audit Committee Financial Experts.
** Mr. Brown is an "Interested Person" by reason of his relationship with the Adviser.
The Statement of Additional Information includes additional information about the Trustees of the Trust and is available, without charge, by calling 800-539-3863.
25
Victory Variable Insurance Funds | | Supplemental Information — continued
December 31, 2018 | |
(Unaudited)
Officers:
The officers of the Trust, their ages, commencement of service and their principal occupations during the past five years, are detailed in the following table. Each officer serves until the earlier of his or her resignation, removal, retirement, death, or the election of a successor. The mailing address of each officer of the Trust is 4900 Tiedeman Road, 4th Floor, Brooklyn, Ohio 44144. The officers of the Trust receive no compensation directly from the Trust for performing the duties of their offices.
Name and Age | | Position with
the Trust | | Date
Commenced
Service | | Principal Occupation During Past 5 Years | |
Christopher K. Dyer, 57 | | President | | February 2006* | | Director of Mutual Fund Administration, the Adviser. | |
Scott A. Stahorsky, 49 | | Vice President | | December 2014 | | Manager, Fund Administration, the Adviser (since 2015); Senior Analyst, Fund Administration, the Adviser (prior to 2015). | |
Erin G. Wagner, 45 | | Secretary | | December 2014 | | Associate General Counsel, the Adviser (since 2013). | |
Allan Shaer, 53 | | Treasurer | | May 2017 | | Senior Vice President, Financial Administration, Citi Fund Services Ohio, Inc. (since 2016); Vice President, Mutual Fund Administration, JP Morgan Chase (2011-2016). | |
Christopher A. Ponte, 34 | | Assistant Treasurer | | December 2017 | | Manager, Fund Administration, the Adviser (since 2017); Senior Analyst, Fund Administration, the Adviser (prior to 2017); Chief Financial Officer, Victory Capital Advisers, Inc. (since 2018). | |
Colin Kinney, 45 | | Chief Compliance Officer | | July 2017 | | Chief Compliance Officer (since 2013) and Chief Risk Officer (2009-2017), the Adviser. | |
Chuck Booth, 58 | | Anti-Money Laundering Compliance Officer and Identity Theft Officer | | May 2015 | | Director, Regulatory Administration and CCO Support Services, Citi Fund Services Ohio, Inc. | |
Jay G. Baris, 65 | | Assistant Secretary | | February 1998 | | Partner, Shearman & Sterling LLP (since 2018); Partner, Morrison & Foerster LLP (2011-2017). | |
* On December 3, 2014, Mr. Dyer resigned as Secretary of the Trust and accepted the position of President.
26
Victory Variable Insurance Funds | | Supplemental Information — continued
December 31, 2018 | |
(Unaudited)
Proxy Voting and Form N-Q Information
Proxy Voting:
Information regarding the policies and procedures that the Fund uses to determine how to vote proxies relating to portfolio securities is available without charge, upon request, by calling 800-539-3863. The information is also included in the Fund's Statement of Additional Information, which is available on the SEC's website at www.sec.gov.
Information relating to how the Fund voted proxies relating to portfolio securities held during the most recent twelve months ended June 30 is available on the SEC's website at www.sec.gov.
Availability of Schedules of Portfolio Investments:
The Trust expects to file a complete list of Schedules of Portfolio Investments with the SEC for the first and third quarter of each fiscal year on Form N-PORT beginning March 1, 2019. Prior to that date, the Trust has filed a complete list of Schedules of Portfolio Investments with the SEC for the first and third quarters of each fiscal year on Form N-Q. Forms N-PORT and Forms N-Q are available on the SEC's website at www.sec.gov.
Expense Examples
As a shareholder of the Fund, you may incur two types of costs: (1) transaction costs and (2) ongoing costs, including management fees, distribution and service (12b-1) fees, and other Fund expenses. These examples are intended to help you understand your ongoing costs (in dollars) of investing in the Fund and to compare these costs with the ongoing costs of investing in other mutual funds.
These examples are based on an investment of $1,000 invested at the beginning of the period and held for the entire period from July 1, 2018 through December 31, 2018.
The Actual Expense figures in the table below provide information about actual account values and actual expenses. You may use the information below, together with the amount you invested, to estimate the expenses that you paid over the period. Simply divide your account value by $1,000 (for example, an $8,600 account value divided by $1,000 = 8.6), then multiply the result by the number in the table under the heading entitled "Actual Expenses Paid During Period" to estimate the expenses you paid on your account during this period.
The Hypothetical Expense figures in the table below provide information about hypothetical account values and hypothetical expenses based on the Fund's actual expense ratio and an assumed rate of return of 5% per year before expenses, which is not the Fund's actual return. The hypothetical account values and expenses may not be used to estimate the actual ending account balance or expenses you paid for the period. You may use this information to compare this 5% hypothetical example with the 5% hypothetical examples that appear in shareholder reports of other funds.
Please note the expenses shown in the table are meant to highlight your ongoing costs only and do not reflect any transactional costs. Therefore, the table is useful in comparing ongoing costs only, and will not help you determine the relative total costs of owning different funds. In addition, if these transactional costs were included, your costs would have been higher.
Beginning
Account Value
7/1/18 | | Actual
Ending
Account Value
12/31/18 | | Hypothetical
Ending
Account Value
12/31/18 | | Actual
Expenses
Paid During
Period
7/1/18-12/31/18* | | Hypothetical
Expenses
Paid During
Period
7/1/18-12/31/18* | | Annualized
Expense Ratio
During Period
7/1/18-12/31/18 | |
$ | 1,000.00 | | | $ | 812.40 | | | $ | 1,020.72 | | | $ | 4.07 | | | $ | 4.53 | | | | 0.89 | % | |
* Expenses are equal to the average account value multiplied by the Fund's annualized expense ratio multiplied by 184/365 (the number of days in the most recent fiscal half-year divided by the number of days in the fiscal year).
27
Victory Variable Insurance Funds | | Supplemental Information — continued
December 31, 2018 | |
(Unaudited)
Additional Federal Income Tax Information
For the year ended, December 31, 2018, the Fund designated short-term and long-term capital gain distributions of $411,847 and $16,074,066, respectively.
28
Victory Variable Insurance Funds | | Supplemental Information — continued
December 31, 2018 | |
(Unaudited)
Considerations of the Board in Continuing the Investment Advisory Agreement (the "Agreement")
The Board approved the Agreement on behalf of the Series at a meeting, which was called for that purpose, on December 5, 2018. The Board also considered information relating to the Series and the Agreement provided throughout the year and, more specifically, at a meeting on October 23, 2018. The Board noted that prior to the Series' reorganization on July 29, 2016, the Series was managed by RS Investment Management Co. LLC, which was acquired by the Adviser on July 29, 2016. In considering whether to approve the Agreement, the Board requested, and the Adviser provided, information that the Board believed to be reasonably necessary to reach its conclusions. The Board, including the Independent Trustees, evaluated this information along with other information obtained throughout the year and was advised by legal counsel to the Series and by independent legal counsel to the Independent Trustees. In addition, in 2017 the Independent Trustees, through their counsel, retained an independent consultant to assist with a review of the overall process for conducting the annual review of these advisory arrangements. The Board considered the Series' advisory fee, expense ratio and investment performance as significant factors in determining whether the Agreement should be continued. In considering whether the compensation paid to the Adviser was fair and reasonable, the Board also evaluated, among other things, the following factors:
• The requirements of the Series for the services provided by the Adviser;
• The nature, quality and extent of the services provided and expected to be provided;
• The performance of the Series as compared to comparable funds;
• The fees payable for the services and whether the fee arrangements provided for economies of scale that would benefit Series shareholders as the Series grows;
• Whether the fee would be sufficient to enable the Adviser to attract and retain experienced personnel and continue to provide quality services to the Series;
• Fees paid by other clients of the Adviser whose accounts are managed in a similar investment style and any differences in the services provided to the other clients compared to those provided to the Series;
• Total expenses of the Series, taking into consideration any distribution or shareholder servicing fees;
• Management's commitment to operating the Series at competitive expense levels;
• The profitability of the Adviser (as reflected by comparing fees earned against an estimate of the Adviser's costs) with respect to the Adviser's relationship with the Series;
• Research and other service benefits received by the Adviser obtained through payment of client commissions for securities transactions;
• Other benefits received by the Adviser, and its affiliates, including revenues paid to the Adviser, or its affiliates, by the Series for administration and fund accounting services, and distribution;
• The capabilities and financial condition of the Adviser;
• Current economic and industry trends; and
• The historical relationship between the Series and the Adviser.
The Board reviewed the Series' current management fee, comprised of the advisory fee plus the administrative services fee paid to the Adviser, in the context of the Adviser's profitability of the Series. In addition, the Board compared the Series' total operating expense ratio on a net and gross basis, taking into consideration any distribution or shareholder servicing fees and management fees with a universe of comparable mutual funds compiled by an independent consultant, FUSE Research Network, LLC ("FUSE"), and a peer group of funds with similar investment strategies selected by FUSE from the universe. The Board reviewed the factors and methodology used by FUSE in the selection of the Series' peer group, including FUSE's selection of a broad universe of funds using the standard Retail Morningstar Categories, the more specific universe of comparable funds, and peer groups of funds with comparable investment strategies and asset levels, among other factors. The Board also reviewed any changes to FUSE's methodology as compared to the prior year, including as a result of input from the Adviser, if any. The Board also reviewed fees and other information related to the Adviser's management of similarly managed institutional or private accounts, and the differences in the services
29
Victory Variable Insurance Funds | | Supplemental Information — continued
December 31, 2018 | |
(Unaudited)
provided to the other accounts, to the extent applicable. The Board noted that the advisory fee arrangements for the Series do not include breakpoints, which are generally viewed as a method by which the investment adviser shares any economies of scale with a fund as a fund grows. The Board also considered the Adviser's commitment to limit expenses as discussed in more detail below.
The Board reviewed the Series' performance over one-, three-, five- and ten-year periods against the performance of the Series' selected peer group and benchmark index. The Board recognized that the performance of the Series and the peer group funds are net of expenses, while the performance of the benchmark index is gross returns. The Board considered the additional resources that the Adviser has committed to enhance portfolio analysis, compliance and trading systems. The Board noted that, following the Series' reorganization, the Series is managed by substantially the same investment management team that managed the comparable predecessor fund.
The Board reviewed various other specific factors with respect to the Series, as described below. In their deliberations, the Trustees did not rank the importance of any particular information or factor considered and each Trustee may have attributed different weights to various factors.
The Board concluded that the Series' gross annual management fee was reasonable as compared to the median gross management fee charged to the funds in the Series' peer group. The Board noted that the Series' net annual expense ratio, taking into account any shareholder servicing or distribution fees, was reasonable as compared to the median expense ratio for the peer group. The Board considered the Adviser's contractual agreement to waive its fees and reimburse expenses for a specified period of time, as described in the Series' prospectus. The Board then compared the Series' performance for the one-, three-, five- and ten-year periods ended June 30, 2018, to that of the median performance of the peer group and benchmark index for the same periods and considered the fact that the Series outperformed both the benchmark index and the peer group for all of the periods reviewed.
Having considered, among other things: (1) that the Series' management fee was within the ranges of advisory fees charged to comparable mutual funds; (2) that the Series' total expense ratio was reasonable; (3) the Adviser's willingness to limit the expenses for a period of time would provide stability to the Series' expenses during that period; and (4) the performance of the Series, the Board concluded that the Agreement continued to be in the best interests of the Series' shareholders.
Conclusion
Based on its review of the information requested and provided, and following extended discussions, the Board determined that the Agreement, on behalf of the Series, was consistent with the best interests of the Series and its shareholders, and the Board unanimously approved the Agreement, on behalf of the Series, for an additional annual period on the basis of the foregoing review and discussions and the following considerations, among others:
• The fairness and reasonableness of the investment advisory fee payable to the Adviser under the Agreement in light of the investment advisory services provided, the costs of these services, the profitability of the Adviser's relationship with the Series and the comparability of the fee paid to the fees paid by other investment companies;
• The nature, quality and extent of the investment advisory services provided by the Adviser;
• The Adviser's entrepreneurial commitment to the management of the Series and the creation of a broad-based family of funds, which could entail a substantial commitment of the Adviser's resources to the successful operation of the Series;
• The Adviser's representations regarding its staffing and capabilities to manage the Series, including the retention of personnel with relevant portfolio management experience;
• The Adviser's efforts to enhance investment results by, among other things, developing quality portfolio management teams; and
• The overall high quality of the personnel, operations, financial condition, investment management capabilities, methodologies and performance of the Adviser.
30
Privacy Policy
Protecting the Privacy of Information
The Trust respects your right to privacy. We also know that you expect us to conduct and process your business in an accurate and efficient manner. To do so, we must collect and maintain certain personal information about you. This is the information we collect from you on applications or other forms, and from the transactions you make with us or third parties. It may include your name, address, social security number, account transactions and balances, and information about investment goals and risk tolerance.
We do not disclose any information about you or about former customers to anyone except as permitted or required by law. Specifically, we may disclose the information we collect to companies that perform services on our behalf, such as the transfer agent that processes shareholder accounts and printers and mailers that assist us in the distribution of investor materials. We may also disclose this information to companies that perform marketing services on our behalf. This allows us to continue to offer you Victory investment products and services that meet your investing needs, and to effect transactions that you request or authorize. These companies will use this information only in connection with the services for which we hired them. They are not permitted to use or share this information for any other purpose.
To protect your personal information internally, we permit access only by authorized employees and maintain physical, electronic and procedural safeguards to guard your personal information.*
* You may have received communications regarding information about privacy policies from other financial institutions which gave you the opportunity to "opt-out" of certain information sharing with companies which are not affiliated with that financial institution. The Trust does not share information with other companies for purposes of marketing solicitations for products other than the Trust. Therefore, the Trust does not provide opt-out options to their shareholders.
Victory Funds
P.O. Box 182593
Columbus, Ohio 43218-2593

Visit our website at: | | Call Victory at: | |
www.vcm.com | | 800-539-FUND (800-539-3863) | |
VVIF-RS-SCGEVIP-AR (12/18)

December 31, 2018
Annual Report
Victory Variable Insurance Funds
Victory S&P 500 Index VIP Series
Beginning on January 1, 2021, as permitted by regulations adopted by the Securities and Exchange Commission, paper copies of the Victory Funds' shareholder reports will no longer be sent by mail, unless you specifically request paper copies of the reports from the Victory Funds or from your financial intermediary, such as a broker-dealer or bank. Instead, the reports will be made available on www.VictoryFunds.com, and you will be notified by mail each time a report is posted and provided with a website link to access the report. If you already elected to receive shareholder reports electronically, you will not be affected by this change, and you need not take any action.
You may elect to receive shareholder reports and other communications from the Victory Funds or your financial intermediary electronically sooner than January 1, 2021 by notifying your financial intermediary directly or, if you are a direct investor, by calling 800-539-3863 or by sending an e-mail request to TA.Processing@FISGlobal.com.
You may elect to receive all future reports in paper free of charge. If you invest through a financial intermediary, you can contact your financial intermediary to request that you continue to receive paper copies of your reports. If you invest directly with the Victory Funds, you can call 800-539-3863 or send an e-mail request to TA.Processing@FISGlobal.com. Your election to receive reports in paper will apply to all Victory Funds you hold directly or through your financial intermediary.
www.vcm.com
News, Information And Education 24 Hours A Day, 7 Days A Week
The Victory Funds site gives fund shareholders, prospective shareholders, and investment professionals a convenient way to access fund information, get guidance, and track fund performance anywhere they can access the Internet. The site includes:
• Detailed performance records
• Daily share prices
• The latest fund news
• Investment resources to help you become a better investor
• A section dedicated to investment professionals
Whether you're a potential investor searching for the fund that matches your investment philosophy, a seasoned investor interested in planning tools, or an investment professional, www.vcm.com has what you seek. Visit us anytime. We're always open.
Victory Variable Insurance Funds
Table of Contents
Shareholder Letter (Unaudited) | | | 3 | | |
Fund Review and Commentary (Unaudited) | | | 4 | | |
Financial Statements | |
Schedule of Portfolio Investments | | | 6 | | |
Statement of Assets and Liabilities | | | 18 | | |
Statement of Operations | | | 19 | | |
Statements of Changes in Net Assets | | | 20 | | |
Financial Highlights | | | 21 | | |
Notes to Financial Statements | | | 22 | | |
Report of Ernst & Young LLP, Independent
Registered Public Accounting Firm | | | 31 | | |
Supplemental Information (Unaudited) | |
Trustee and Officer Information | | | 32 | | |
Proxy Voting and Form N-Q Information | | | 35 | | |
Expense Examples | | | 35 | | |
Additional Federal Income Tax Information | | | 36 | | |
Advisory Contract Renewal | | | 37 | | |
Privacy Policy (inside back cover) | | | |
The Fund is distributed by Victory Capital Advisers, Inc. Victory Capital Management Inc. is the investment adviser to the Fund and receives fees from the Fund for performing services for the Fund.
This report is not authorized for distribution to prospective investors unless preceded or accompanied by a current prospectus of the Fund.
For additional information about any Victory Fund, including fees, expenses, and risks, view our prospectus online at www.vcm.com or call 800-539-3863. Read it carefully before you invest or send money.
The information in this annual report is based on data obtained from recognized services and sources and is believed to be reliable. Any opinions, projections, or recommendations in this report are subject to change without notice and are not intended as individual investment advice. Past investment performance of the Fund, markets or securities mentioned herein should not be considered to be indicative of future results.
• NOT FDIC INSURED • NO BANK GUARANTEE
• MAY LOSE VALUE

Call Victory at:
800-539-FUND (800-539-3863)
Visit our website at:
www.vcm.com
1
This page is intentionally left blank.
2
Victory Funds Letter to Shareholders
Dear Shareholder,
What a difference a year makes. The year ended December 31, 2018, was marked by an abrupt return of volatility, which had largely been missing in action for years. Consider the range of highs and lows we witnessed. For the S&P 500 Index, it was a year in which we celebrated an all-time high in late summer, only to be followed by the worst December since the 2008 financial crisis. And if that wasn't enough volatility, the Dow Jones Industrial Average also registered several of its worst-ever, single-day point declines during 2018.
Through all that the S&P 500 clocked in with its first negative annual return since 2008, falling by 4.4 percent. Given the risk-off sentiment that was obvious as the year drew to a close, it's no surprise that small-cap stocks, as measured by the Russell 2000 Index, fared even worse, falling approximately 11.0 percent for the year. The challenges for equity investors were also evident around the world as the MSCI ACWI and Emerging Markets indexes declined 8.9 and 14.3 percent, respectively.
So what ushered in the renewed era of volatility and these challenging times? There were multiple culprits. For starters, trade tensions ratcheted up throughout the year as anti-global rhetoric bloomed into a series of new tariffs, which sparked concerns of a prolonged trade war with China. The Federal Reserve remained persistent in its monetary tightening, raising the benchmark interest rate four times throughout the year to a range of 2.25 to 2.5 percent. And then the year ended with a partial shutdown of the federal government. These factors conspired to elevate concerns of a possible recession here and abroad.
Yet despite the headline risks, we think it's critically important to remain focused on the data. By all accounts, the U.S. economy continued chugging along in 2018 with a real gross domestic product (GDP) rising 3.4 percent in the third quarter of 2018, the latest figures available from the Bureau of Economic Analysis. Moreover, the labor picture continues to shine with consistent monthly job growth and an unemployment rate of 3.9 percent. All this comes against a backdrop of low inflation and solid corporate earnings.
The markets, it appears, have been vacillating between the dire headlines and higher perceived risks on one hand, and the continued positive economic data on the other. Of course, no one knows where the Fed will stop raising rates, nor is there any certainty on how the trade turmoil ultimately gets resolved. For now, however, we continue to embrace our solid economic fundamentals. Moreover, we believe all of Victory Capital's independent investment franchises are well positioned to take advantage of any short-term valuation dislocations resulting from the current era of heightened volatility.
On the following pages, you will find information relating to your Victory Funds investment. If you have any questions, we encourage you to contact your financial advisor. Or, if you invest with us directly, you may call (800) 539-3863, or visit our website at www.vcm.com.
My colleagues and I sincerely appreciate the confidence you have placed in the Victory Funds, and we value the opportunity to help meet your investment goals.

Christopher K. Dyer, CFA
President,
Victory Funds
3
Victory Variable Insurance Funds
Victory S&P 500 Index VIP Series
Portfolio Holdings
As a Percentage of Total Investments

Commentary
The Victory S&P 500 Index VIP Series ("Fund") seeks to track the investment performance of the S&P 500 Index ("Index"). The Fund returned -4.65% for the 12 months ended December 31, 2018, slightly underperforming the Index, which returned -4.38%. The difference in performance of the Victory S&P 500 Index VIP Series and the Index was primarily due to internal fees and expenses to manage the Fund. The Index is not an investable product, therefore fees and expenses do not apply.
Health Care and Utilities were the highest performing sectors in the Index in 2018, returning 6.03% and 4.11%, respectively. Energy and materials ended the year with a negative impact to the overall performance with returns of -18.33% and -15.34%, respectively.
Overview
2018 was a volatile year for the market capitalization weighted S&P 500 Index as well as the broad stock market. The Index began the year with strong returns peaking on January 26th, followed by sharp declines of 10% by the first week in February. Above-average volatility persisted throughout the year by slowly increasing to new highs on September 21st. The Index began to decline sharply to a December 24th low of -19.30%, ending the year at -4.38%.
During the period, the Fund used both index futures to equitize the Fund's cash. The derivatives strategy with regards to futures had a non-material impact on the Fund's overall performance for the 12 months ended December 31, 2018.
4
Victory Variable Insurance Funds
Victory S&P 500 Index VIP Series (continued)
Average Annual Return
Year Ended December 31, 2018
| | | Class A | |
INCEPTION DATE | | 8/25/99 | |
| | | Net Asset
Value | | S&P 500
Index(1) | |
One Year | | | –4.65 | % | | | –4.38 | % | |
Three Year | | | 9.02 | % | | | 9.26 | % | |
Five Year | | | 8.23 | % | | | 8.49 | % | |
Ten Year | | | 12.85 | % | | | 13.12 | % | |
Since Inception | | | 4.89 | % | | | N/A | | |
Expense Ratios
Gross | | | 0.41 | % | |
With Applicable Waivers | | | 0.28 | % | |
Past performance is not indicative of future results. The performance data quoted represents past performance and current returns may be lower or higher. The investment return and principal value will fluctuate so that an investor's shares, when redeemed, may be worth more or less than the original cost. To obtain performance information current to the most recent month's end, please visit www.vcm.com.
The above expense ratios are from the Fund's prospectus dated May 1, 2018. Additional information pertaining to the Fund's expense ratios as of December 31, 2018 can be found in the financial highlights.
The total return figures set forth above include all waivers of fees for various periods since inception. Without such fee waivers, the total returns would have been lower. Some fee waivers are voluntary and may be modified or terminated at any time. The total returns do not include any insurance, sales or administrative charges of variable annuity or life insurance contracts. If these charges were included, the total returns would have been lower.
Victory S&P 500 Index VIP Series — Growth of $10,000

1The S&P 500 Index® is an unmanaged index comprised of 500 domestically traded common stocks, is weighted according to the market value of each common stock in the index, and includes reinvestment of dividends. This index does not include effect of sales charges and is not representative of the Fund. It is not possible to invest directly in an index.
The graph reflects investment of growth of a hypothetical $10,000 investment in the Fund. Past performance is no guarantee of future results.
The graph and table do not reflect the deduction of taxes that a shareholder would pay on Fund distributions or the redemption of Fund shares.
5
Victory Variable Insurance Funds
Victory S&P 500 Index VIP Series | | Schedule of Portfolio Investments
December 31, 2018 | |
Security Description | | Shares | | Value | |
Common Stocks (99.7%) | |
Communication Services (10.1%): | |
Activision Blizzard, Inc. | | | 3,833 | | | $ | 178,503 | | |
Alphabet, Inc., Class A (a) | | | 1,503 | | | | 1,570,575 | | |
Alphabet, Inc., Class C (a) | | | 1,548 | | | | 1,603,124 | | |
AT&T, Inc. | | | 36,513 | | | | 1,042,081 | | |
CBS Corp., Class B | | | 1,702 | | | | 74,411 | | |
CenturyLink, Inc. | | | 4,779 | | | | 72,402 | | |
Charter Communications, Inc., Class A (a) | | | 898 | | | | 255,903 | | |
Comcast Corp., Class A | | | 22,990 | | | | 782,809 | | |
Discovery Communications, Inc., Class A (a) (b) | | | 786 | | | | 19,446 | | |
Discovery Communications, Inc., Class C (a) | | | 1,808 | | | | 41,729 | | |
DISH Network Corp. (a) | | | 1,152 | | | | 28,765 | | |
Electronic Arts, Inc. (a) | | | 1,533 | | | | 120,969 | | |
Facebook, Inc., Class A (a) | | | 12,126 | | | | 1,589,597 | | |
Netflix, Inc. (a) | | | 2,189 | | | | 585,908 | | |
News Corp., Class A | | | 1,928 | | | | 21,883 | | |
News Corp., Class B | | | 622 | | | | 7,184 | | |
Omnicom Group, Inc. | | | 1,128 | | | | 82,615 | | |
Take-Two Interactive Software, Inc. (a) | | | 572 | | | | 58,882 | | |
The Interpublic Group of Co., Inc. | | | 1,930 | | | | 39,816 | | |
The Walt Disney Co. | | | 7,478 | | | | 819,962 | | |
TripAdvisor, Inc. (a) | | | 514 | | | | 27,725 | | |
Twenty-First Century Fox, Inc., Class A | | | 5,300 | | | | 255,036 | | |
Twenty-First Century Fox, Inc., Class B | | | 2,449 | | | | 117,013 | | |
Twitter, Inc. (a) | | | 3,620 | | | | 104,039 | | |
Verizon Communications, Inc. | | | 20,775 | | | | 1,167,970 | | |
Viacom, Inc., Class B | | | 1,777 | | | | 45,669 | | |
| | | | 10,714,016 | | |
Consumer Discretionary (10.0%): | |
Advance Auto Parts, Inc. | | | 372 | | | | 58,575 | | |
Amazon.com, Inc. (a) | | | 2,060 | | | | 3,094,059 | | |
Aptiv PLC | | | 1,331 | | | | 81,950 | | |
AutoZone, Inc. (a) | | | 133 | | | | 111,499 | | |
Best Buy Co., Inc. | | | 1,222 | | | | 64,717 | | |
Booking Holdings, Inc. (a) | | | 239 | | | | 411,658 | | |
BorgWarner, Inc. | | | 1,050 | | | | 36,477 | | |
CarMax, Inc. (a) (b) | | | 888 | | | | 55,704 | | |
Carnival Corp., Class A | | | 2,028 | | | | 99,980 | | |
Chipotle Mexican Grill, Inc. (a) | | | 123 | | | | 53,110 | | |
D.R. Horton, Inc. | | | 1,725 | | | | 59,789 | | |
Darden Restaurants, Inc. | | | 624 | | | | 62,313 | | |
Dollar General Corp. | | | 1,335 | | | | 144,287 | | |
Dollar Tree, Inc. (a) | | | 1,196 | | | | 108,023 | | |
eBay, Inc. (a) | | | 4,677 | | | | 131,283 | | |
Expedia, Inc. | | | 598 | | | | 67,365 | | |
Foot Locker, Inc. | | | 588 | | | | 31,282 | | |
Ford Motor Co. | | | 19,684 | | | | 150,583 | | |
See notes to financial statements.
6
Victory Variable Insurance Funds
Victory S&P 500 Index VIP Series | | Schedule of Portfolio Investments — continued
December 31, 2018 | |
Security Description | | Shares | | Value | |
Garmin Ltd. | | | 608 | | | $ | 38,499 | | |
General Motors Co. | | | 6,597 | | | | 220,670 | | |
Genuine Parts Co. | | | 738 | | | | 70,863 | | |
H&R Block, Inc. | | | 1,033 | | | | 26,207 | | |
Hanesbrands, Inc. | | | 1,813 | | | | 22,717 | | |
Harley-Davidson, Inc. | | | 837 | | | | 28,558 | | |
Hasbro, Inc. (b) | | | 587 | | | | 47,693 | | |
Hilton Worldwide Holdings, Inc. | | | 1,499 | | | | 107,628 | | |
Kohl's Corp. | | | 838 | | | | 55,593 | | |
L Brands, Inc. | | | 1,148 | | | | 29,469 | | |
Leggett & Platt, Inc. | | | 654 | | | | 23,439 | | |
Lennar Corp., Class A | | | 1,467 | | | | 57,433 | | |
LKQ Corp. (a) | | | 1,599 | | | | 37,944 | | |
Lowe's Co., Inc. | | | 4,078 | | | | 376,645 | | |
Macy's, Inc. | | | 1,543 | | | | 45,951 | | |
Marriott International, Inc., Class A | | | 1,448 | | | | 157,195 | | |
Mattel, Inc. (a) (b) | | | 1,730 | | | | 17,283 | | |
McDonald's Corp. | | | 3,901 | | | | 692,700 | | |
MGM Resorts International | | | 2,569 | | | | 62,324 | | |
Michael Kors Holdings Ltd. (a) | | | 751 | | | | 28,478 | | |
Mohawk Industries, Inc. (a) | | | 319 | | | | 37,310 | | |
Newell Brands, Inc. (b) | | | 2,186 | | | | 40,638 | | |
Nike, Inc., Class B | | | 6,438 | | | | 477,313 | | |
Nordstrom, Inc. (b) | | | 576 | | | | 26,847 | | |
Norwegian Cruise Line Holdings Ltd. (a) | | | 1,102 | | | | 46,714 | | |
O'Reilly Automotive, Inc. (a) | | | 405 | | | | 139,454 | | |
PulteGroup, Inc. | | | 1,314 | | | | 34,151 | | |
PVH Corp. | | | 386 | | | | 35,879 | | |
Ralph Lauren Corp. | | | 278 | | | | 28,762 | | |
Ross Stores, Inc. | | | 1,893 | | | | 157,498 | | |
Royal Caribbean Cruises Ltd. | | | 862 | | | | 84,295 | | |
Starbucks Corp. | | | 6,237 | | | | 401,663 | | |
Tapestry, Inc. | | | 1,448 | | | | 48,870 | | |
Target Corp. | | | 2,646 | | | | 174,873 | | |
The Gap, Inc. | | | 1,091 | | | | 28,104 | | |
The Goodyear Tire & Rubber Co. | | | 1,192 | | | | 24,329 | | |
The Home Depot, Inc. | | | 5,753 | | | | 988,481 | | |
The TJX Co., Inc. | | | 6,306 | | | | 282,130 | | |
Tiffany & Co. | | | 548 | | | | 44,119 | | |
Tractor Supply Co. | | | 612 | | | | 51,065 | | |
Ulta Salon, Cosmetics & Fragrance, Inc. (a) | | | 285 | | | | 69,779 | | |
Under Armour, Inc., Class A (a) (b) | | | 936 | | | | 16,539 | | |
Under Armour, Inc., Class C (a) | | | 959 | | | | 15,507 | | |
VF Corp. | | | 1,635 | | | | 116,641 | | |
Whirlpool Corp. | | | 325 | | | | 34,733 | | |
Wynn Resorts Ltd. | | | 492 | | | | 48,664 | | |
Yum! Brands, Inc. | | | 1,596 | | | | 146,704 | | |
| | | | 10,571,005 | | |
See notes to financial statements.
7
Victory Variable Insurance Funds
Victory S&P 500 Index VIP Series | | Schedule of Portfolio Investments — continued
December 31, 2018 | |
Security Description | | Shares | | Value | |
Consumer Staples (7.4%): | |
Altria Group, Inc. | | | 9,479 | | | $ | 468,168 | | |
Archer-Daniels-Midland Co. | | | 2,814 | | | | 115,290 | | |
Brown-Forman Corp., Class B | | | 847 | | | | 40,300 | | |
Campbell Soup Co. (b) | | | 967 | | | | 31,901 | | |
Church & Dwight Co., Inc. | | | 1,234 | | | | 81,148 | | |
Colgate-Palmolive Co. | | | 4,363 | | | | 259,686 | | |
Conagra Brands, Inc. | | | 2,358 | | | | 50,367 | | |
Constellation Brands, Inc., Class A | | | 844 | | | | 135,732 | | |
Costco Wholesale Corp. | | | 2,205 | | | | 449,181 | | |
Coty, Inc., Class A | | | 2,265 | | | | 14,858 | | |
General Mills, Inc. | | | 2,997 | | | | 116,703 | | |
Hormel Foods Corp. (b) | | | 1,367 | | | | 58,344 | | |
Kellogg Co. | | | 1,272 | | | | 72,517 | | |
Kimberly-Clark Corp. | | | 1,748 | | | | 199,167 | | |
Lamb Weston Holdings, Inc. | | | 735 | | | | 54,067 | | |
McCormick & Co., Inc. | | | 610 | | | | 84,936 | | |
Molson Coors Brewing Co., Class B | | | 941 | | | | 52,847 | | |
Mondelez International, Inc., Class A | | | 7,374 | | | | 295,181 | | |
Monster Beverage Corp. (a) | | | 2,000 | | | | 98,440 | | |
PepsiCo, Inc. | | | 7,111 | | | | 785,623 | | |
Philip Morris International, Inc. | | | 7,816 | | | | 521,796 | | |
Sysco Corp. | | | 2,404 | | | | 150,635 | | |
The Clorox Co. | | | 644 | | | | 99,266 | | |
The Coca-Cola Co. | | | 19,245 | | | | 911,251 | | |
The Estee Lauder Cos., Inc., Class A | | | 1,127 | | | | 146,623 | | |
The Hershey Co. | | | 703 | | | | 75,348 | | |
The J.M. Smucker Co. | | | 572 | | | | 53,476 | | |
The Kraft Heinz Co. | | | 3,126 | | | | 134,543 | | |
The Kroger Co. | | | 4,006 | | | | 110,165 | | |
The Procter & Gamble Co. | | | 12,515 | | | | 1,150,379 | | |
Tyson Foods, Inc., Class A | | | 1,488 | | | | 79,459 | | |
Walgreens Boots Alliance, Inc. | | | 4,241 | | | | 289,788 | | |
Wal-Mart Stores, Inc. | | | 7,216 | | | | 672,169 | | |
| | | | 7,859,354 | | |
Energy (5.2%): | |
Anadarko Petroleum Corp. | | | 2,575 | | | | 112,888 | | |
Apache Corp. | | | 1,923 | | | | 50,479 | | |
Baker Hughes, Inc. | | | 2,556 | | | | 54,954 | | |
Cabot Oil & Gas Corp. | | | 2,218 | | | | 49,572 | | |
Chevron Corp. | | | 9,634 | | | | 1,048,083 | | |
Cimarex Energy Co. | | | 479 | | | | 29,530 | | |
Concho Resources, Inc. (a) | | | 1,007 | | | | 103,510 | | |
ConocoPhillips | | | 5,843 | | | | 364,311 | | |
Devon Energy Corp. | | | 2,354 | | | | 53,059 | | |
Diamondback Energy, Inc. | | | 763 | | | | 70,730 | | |
EOG Resources, Inc. | | | 2,912 | | | | 253,956 | | |
Exxon Mobil Corp. | | | 21,288 | | | | 1,451,628 | | |
Halliburton Co. | | | 4,424 | | | | 117,590 | | |
Helmerich & Payne, Inc. | | | 548 | | | | 26,271 | | |
See notes to financial statements.
8
Victory Variable Insurance Funds
Victory S&P 500 Index VIP Series | | Schedule of Portfolio Investments — continued
December 31, 2018 | |
Security Description | | Shares | | Value | |
Hess Corp. | | | 1,266 | | | $ | 51,273 | | |
HollyFrontier Corp. | | | 815 | | | | 41,663 | | |
Kinder Morgan, Inc. | | | 9,542 | | | | 146,756 | | |
Marathon Oil Corp. | | | 4,295 | | | | 61,590 | | |
Marathon Petroleum Corp. | | | 3,371 | | | | 198,923 | | |
National Oilwell Varco, Inc. | | | 1,924 | | | | 49,447 | | |
Newfield Exploration Co. (a) | | | 1,005 | | | | 14,733 | | |
Noble Energy, Inc. | | | 2,429 | | | | 45,568 | | |
Occidental Petroleum Corp. | | | 3,845 | | | | 236,006 | | |
ONEOK, Inc. | | | 2,068 | | | | 111,569 | | |
Phillips 66 | | | 2,148 | | | | 185,050 | | |
Pioneer Natural Resources Co. | | | 857 | | | | 112,713 | | |
Schlumberger Ltd. | | | 6,959 | | | | 251,081 | | |
TechnipFMC PLC | | | 2,148 | | | | 42,058 | | |
The Williams Cos., Inc. | | | 6,081 | | | | 134,086 | | |
Valero Energy Corp. | | | 2,149 | | | | 161,111 | | |
| | | | 5,630,188 | | |
Financials (13.4%): | |
Affiliated Managers Group, Inc. | | | 269 | | | | 26,211 | | |
Aflac, Inc. | | | 3,860 | | | | 175,862 | | |
American Express Co. | | | 3,550 | | | | 338,385 | | |
American International Group, Inc. | | | 4,467 | | | | 176,044 | | |
Ameriprise Financial, Inc. | | | 713 | | | | 74,416 | | |
Aon PLC | | | 1,220 | | | | 177,339 | | |
Arthur J. Gallagher & Co. | | | 918 | | | | 67,657 | | |
Assurant, Inc. | | | 265 | | | | 23,702 | | |
Bank of America Corp. | | | 46,705 | | | | 1,150,811 | | |
BB&T Corp. | | | 3,894 | | | | 168,688 | | |
Berkshire Hathaway, Inc., Class B (a) | | | 9,802 | | | | 2,001,372 | | |
BlackRock, Inc., Class A | | | 618 | | | | 242,763 | | |
Brighthouse Financial, Inc. (a) (b) | | | 602 | | | | 18,349 | | |
Capital One Financial Corp. | | | 2,406 | | | | 181,870 | | |
CBOE Holdings, Inc. | | | 562 | | | | 54,980 | | |
Chubb Ltd. | | | 2,329 | | | | 300,860 | | |
Cincinnati Financial Corp. | | | 761 | | | | 58,917 | | |
Citigroup, Inc. | | | 12,653 | | | | 658,715 | | |
Citizens Financial Group, Inc. | | | 2,393 | | | | 71,144 | | |
CME Group, Inc. | | | 1,770 | | | | 332,973 | | |
Comerica, Inc. | | | 813 | | | | 55,845 | | |
Discover Financial Services | | | 1,723 | | | | 101,623 | | |
E*TRADE Financial Corp. | | | 1,306 | | | | 57,307 | | |
Everest Re Group Ltd. | | | 205 | | | | 44,641 | | |
Fifth Third BanCorp | | | 3,350 | | | | 78,826 | | |
Franklin Resources, Inc. | | | 1,537 | | | | 45,587 | | |
Hartford Financial Services Group, Inc. | | | 1,802 | | | | 80,099 | | |
Huntington Bancshares, Inc. | | | 5,552 | | | | 66,180 | | |
Intercontinental Exchange, Inc. | | | 2,883 | | | | 217,176 | | |
Invesco Ltd. | | | 2,066 | | | | 34,585 | | |
Jefferies Financial Group, Inc. | | | 1,458 | | | | 25,311 | | |
JPMorgan Chase & Co. | | | 16,899 | | | | 1,649,680 | | |
See notes to financial statements.
9
Victory Variable Insurance Funds
Victory S&P 500 Index VIP Series | | Schedule of Portfolio Investments — continued
December 31, 2018 | |
Security Description | | Shares | | Value | |
KeyCorp | | | 5,290 | | | $ | 78,186 | | |
Lincoln National Corp. | | | 1,089 | | | | 55,877 | | |
Loews Corp. | | | 1,398 | | | | 63,637 | | |
M&T Bank Corp. | | | 723 | | | | 103,483 | | |
Marsh & McLennan Co., Inc. | | | 2,539 | | | | 202,484 | | |
MetLife, Inc. | | | 5,002 | | | | 205,381 | | |
Moody's Corp. | | | 839 | | | | 117,494 | | |
Morgan Stanley | | | 6,667 | | | | 264,347 | | |
MSCI, Inc. | | | 447 | | | | 65,901 | | |
Nasdaq, Inc. | | | 579 | | | | 47,229 | | |
Northern Trust Corp. | | | 1,123 | | | | 93,872 | | |
People's United Financial, Inc. | | | 1,874 | | | | 27,042 | | |
Principal Financial Group, Inc. | | | 1,331 | | | | 58,790 | | |
Prudential Financial, Inc. | | | 2,097 | | | | 171,010 | | |
Raymond James Financial, Inc. | | | 660 | | | | 49,111 | | |
Regions Financial Corp. | | | 5,198 | | | | 69,549 | | |
S&P Global, Inc. | | | 1,265 | | | | 214,974 | | |
State Street Corp. | | | 1,908 | | | | 120,338 | | |
SunTrust Banks, Inc. | | | 2,317 | | | | 116,869 | | |
SVB Financial Group (a) | | | 268 | | | | 50,899 | | |
Synchrony Financial | | | 3,426 | | | | 80,374 | | |
T. Rowe Price Group, Inc. | | | 1,223 | | | | 112,907 | | |
The Allstate Corp. | | | 1,741 | | | | 143,859 | | |
The Bank of New York Mellon Corp. | | | 4,625 | | | | 217,699 | | |
The Charles Schwab Corp. | | | 6,046 | | | | 251,090 | | |
The Goldman Sachs Group, Inc. | | | 1,765 | | | | 294,843 | | |
The PNC Financial Services Group, Inc. | | | 2,335 | | | | 272,985 | | |
The Progressive Corp. | | | 2,932 | | | | 176,888 | | |
The Travelers Co., Inc. | | | 1,346 | | | | 161,184 | | |
Torchmark Corp. | | | 521 | | | | 38,830 | | |
U.S. Bancorp | | | 7,699 | | | | 351,844 | | |
Unum Group | | | 1,100 | | | | 32,318 | | |
Wells Fargo & Co. | | | 21,794 | | | | 1,004,268 | | |
Willis Towers Watson PLC | | | 658 | | | | 99,924 | | |
Zions BanCorp | | | 977 | | | | 39,803 | | |
| | | | 14,213,207 | | |
Health Care (15.5%): | |
Abbott Laboratories | | | 8,821 | | | | 638,022 | | |
AbbVie, Inc. | | | 7,614 | | | | 701,935 | | |
ABIOMED, Inc. (a) | | | 226 | | | | 73,459 | | |
Agilent Technologies, Inc. | | | 1,603 | | | | 108,138 | | |
Alexion Pharmaceuticals, Inc. (a) | | | 1,121 | | | | 109,141 | | |
Align Technology, Inc. (a) | | | 368 | | | | 77,070 | | |
Allergan PLC | | | 1,604 | | | | 214,391 | | |
AmerisourceBergen Corp. | | | 805 | | | | 59,892 | | |
Amgen, Inc. | | | 3,254 | | | | 633,456 | | |
Anthem, Inc. | | | 1,307 | | | | 343,257 | | |
Baxter International, Inc. | | | 2,498 | | | | 164,418 | | |
Becton, Dickinson & Co. | | | 1,345 | | | | 303,055 | | |
See notes to financial statements.
10
Victory Variable Insurance Funds
Victory S&P 500 Index VIP Series | | Schedule of Portfolio Investments — continued
December 31, 2018 | |
Security Description | | Shares | | Value | |
Biogen, Inc. (a) | | | 1,013 | | | $ | 304,832 | | |
Boston Scientific Corp. (a) | | | 6,953 | | | | 245,719 | | |
Bristol-Myers Squibb Co. | | | 8,205 | | | | 426,496 | | |
Cardinal Health, Inc. | | | 1,553 | | | | 69,264 | | |
Celgene Corp. (a) | | | 3,537 | | | | 226,686 | | |
Centene Corp. (a) | | | 1,032 | | | | 118,990 | | |
Cerner Corp. (a) | | | 1,654 | | | | 86,736 | | |
Cigna Corp. | | | 1,912 | | | | 363,127 | | |
CVS Health Corp. | | | 6,497 | | | | 425,683 | | |
Danaher Corp. | | | 3,096 | | | | 319,260 | | |
DaVita, Inc. (a) | | | 638 | | | | 32,831 | | |
Dentsply Sirona, Inc. | | | 1,118 | | | | 41,601 | | |
Edwards Lifesciences Corp. (a) | | | 1,053 | | | | 161,288 | | |
Eli Lilly & Co. | | | 4,806 | | | | 556,150 | | |
Gilead Sciences, Inc. | | | 6,518 | | | | 407,701 | | |
HCA Holdings, Inc. | | | 1,357 | | | | 168,879 | | |
Henry Schein, Inc. (a) | | | 770 | | | | 60,460 | | |
Hologic, Inc. (a) | | | 1,368 | | | | 56,225 | | |
Humana, Inc. | | | 693 | | | | 198,531 | | |
IDEXX Laboratories, Inc. (a) | | | 435 | | | | 80,919 | | |
Illumina, Inc. (a) | | | 739 | | | | 221,648 | | |
Incyte Pharmaceuticals, Inc. (a) | | | 887 | | | | 56,404 | | |
Intuitive Surgical, Inc. (a) | | | 572 | | | | 273,942 | | |
IQVIA Holdings, Inc. (a) | | | 815 | | | | 94,679 | | |
Johnson & Johnson | | | 13,489 | | | | 1,740,755 | | |
Laboratory Corp. of America Holdings (a) | | | 512 | | | | 64,696 | | |
McKesson Corp. | | | 1,004 | | | | 110,912 | | |
Medtronic PLC | | | 6,790 | | | | 617,618 | | |
Merck & Co., Inc. | | | 13,372 | | | | 1,021,755 | | |
Mettler-Toledo International, Inc. (a) | | | 127 | | | | 71,829 | | |
Mylan NV (a) | | | 2,592 | | | | 71,021 | | |
Nektar Therapeutics (a) | | | 867 | | | | 28,498 | | |
PerkinElmer, Inc. (b) | | | 557 | | | | 43,752 | | |
Perrigo Co. PLC | | | 633 | | | | 24,529 | | |
Pfizer, Inc. | | | 29,475 | | | | 1,286,584 | | |
Quest Diagnostics, Inc. | | | 687 | | | | 57,206 | | |
Regeneron Pharmaceuticals, Inc. (a) | | | 390 | | | | 145,665 | | |
ResMed, Inc. | | | 718 | | | | 81,759 | | |
Stryker Corp. | | | 1,561 | | | | 244,687 | | |
The Cooper Co., Inc. | | | 247 | | | | 62,862 | | |
Thermo Fisher Scientific, Inc. | | | 2,025 | | | | 453,175 | | |
UnitedHealth Group, Inc. | | | 4,839 | | | | 1,205,493 | | |
Universal Health Services, Inc., Class B | | | 433 | | | | 50,470 | | |
Varian Medical Systems, Inc. (a) | | | 460 | | | | 52,123 | | |
Vertex Pharmaceuticals, Inc. (a) | | | 1,285 | | | | 212,937 | | |
Waters Corp. (a) | | | 387 | | | | 73,008 | | |
WellCare Health Plans, Inc. (a) | | | 251 | | | | 59,259 | | |
Zimmer Biomet Holdings, Inc. | | | 1,023 | | | | 106,106 | | |
Zoetis, Inc. | | | 2,423 | | | | 207,263 | | |
| | | | 16,518,247 | | |
See notes to financial statements.
11
Victory Variable Insurance Funds
Victory S&P 500 Index VIP Series | | Schedule of Portfolio Investments — continued
December 31, 2018 | |
Security Description | | Shares | | Value | |
Industrials (9.2%): | |
3M Co. | | | 2,949 | | | $ | 561,903 | | |
A.O. Smith Corp. | | | 727 | | | | 31,043 | | |
Alaska Air Group, Inc. | | | 619 | | | | 37,666 | | |
Allegion PLC | | | 478 | | | | 38,101 | | |
American Airlines Group, Inc. | | | 2,061 | | | | 66,179 | | |
AMETEK, Inc. | | | 1,166 | | | | 78,938 | | |
Arconic, Inc. | | | 2,161 | | | | 36,434 | | |
C.H. Robinson Worldwide, Inc. | | | 697 | | | | 58,611 | | |
Caterpillar, Inc. | | | 2,988 | | | | 379,686 | | |
Cintas Corp. | | | 433 | | | | 72,740 | | |
Copart, Inc. (a) | | | 1,028 | | | | 49,118 | | |
CSX Corp. | | | 4,102 | | | | 254,857 | | |
Cummins, Inc. | | | 755 | | | | 100,898 | | |
Deere & Co. | | | 1,617 | | | | 241,208 | | |
Delta Air Lines, Inc. | | | 3,163 | | | | 157,833 | | |
Dover Corp. | | | 743 | | | | 52,716 | | |
Eaton Corp. PLC, ADR | | | 2,179 | | | | 149,610 | | |
Emerson Electric Co. | | | 3,160 | | | | 188,810 | | |
Equifax, Inc. | | | 605 | | | | 56,344 | | |
Expeditors International of Washington, Inc. | | | 877 | | | | 59,715 | | |
Fastenal Co. | | | 1,443 | | | | 75,455 | | |
FedEx Corp. | | | 1,223 | | | | 197,307 | | |
Flowserve Corp. | | | 658 | | | | 25,017 | | |
Fluor Corp. | | | 707 | | | | 22,765 | | |
Fortive Corp. | | | 1,546 | | | | 104,602 | | |
Fortune Brands Home & Security, Inc. | | | 716 | | | | 27,201 | | |
General Dynamics Corp. | | | 1,400 | | | | 220,094 | | |
General Electric Co. | | | 43,699 | | | | 330,801 | | |
Harris Corp. | | | 591 | | | | 79,578 | | |
Honeywell International, Inc. | | | 3,734 | | | | 493,336 | | |
Huntington Ingalls Industries, Inc. | | | 218 | | | | 41,488 | | |
IHS Markit Ltd. (a) | | | 1,794 | | | | 86,058 | | |
Illinois Tool Works, Inc. | | | 1,551 | | | | 196,496 | | |
Ingersoll-Rand PLC | | | 1,233 | | | | 112,486 | | |
J.B. Hunt Transport Services, Inc. | | | 440 | | | | 40,938 | | |
Jacobs Engineering Group, Inc. | | | 599 | | | | 35,018 | | |
Johnson Controls International PLC | | | 4,651 | | | | 137,902 | | |
Kansas City Southern | | | 514 | | | | 49,061 | | |
L3 Technologies, Inc. | | | 394 | | | | 68,422 | | |
Lockheed Martin Corp. | | | 1,246 | | | | 326,253 | | |
Masco Corp. | | | 1,546 | | | | 45,205 | | |
Nielsen Holdings PLC | | | 1,791 | | | | 41,784 | | |
Norfolk Southern Corp. | | | 1,408 | | | | 210,552 | | |
Northrop Grumman Corp. | | | 875 | | | | 214,288 | | |
PACCAR, Inc. | | | 1,763 | | | | 100,738 | | |
Parker-Hannifin Corp. | | | 666 | | | | 99,327 | | |
Pentair PLC | | | 811 | | | | 30,640 | | |
Quanta Services, Inc. | | | 748 | | | | 22,515 | | |
See notes to financial statements.
12
Victory Variable Insurance Funds
Victory S&P 500 Index VIP Series | | Schedule of Portfolio Investments — continued
December 31, 2018 | |
Security Description | | Shares | | Value | |
Raytheon Co. | | | 1,434 | | | $ | 219,904 | | |
Republic Services, Inc., Class A | | | 1,096 | | | | 79,011 | | |
Robert Half International, Inc. | | | 616 | | | | 35,235 | | |
Rockwell Automation, Inc. | | | 619 | | | | 93,147 | | |
Rollins, Inc. | | | 741 | | | | 26,750 | | |
Roper Technologies, Inc. | | | 520 | | | | 138,590 | | |
Snap-on, Inc. | | | 284 | | | | 41,262 | | |
Southwest Airlines Co. | | | 2,593 | | | | 120,523 | | |
Stanley Black & Decker, Inc. | | | 769 | | | | 92,080 | | |
Textron, Inc. | | | 1,249 | | | | 57,442 | | |
The Boeing Co. | | | 2,686 | | | | 866,234 | | |
TransDigm Group, Inc. (a) | | | 243 | | | | 82,635 | | |
Union Pacific Corp. | | | 3,718 | | | | 513,940 | | |
United Continental Holdings, Inc. (a) | | | 1,151 | | | | 96,373 | | |
United Parcel Service, Inc., Class B | | | 3,486 | | | | 339,989 | | |
United Rentals, Inc. (a) | | | 416 | | | | 42,652 | | |
United Technologies Corp. | | | 4,094 | | | | 435,928 | | |
Verisk Analytics, Inc., Class A (a) | | | 828 | | | | 90,285 | | |
W.W. Grainger, Inc. | | | 229 | | | | 64,660 | | |
Waste Management, Inc. | | | 1,983 | | | | 176,466 | | |
Xylem, Inc. | | | 903 | | | | 60,248 | | |
| | | | 9,781,091 | | |
Information Technology (20.1%): | |
Accenture PLC, Class A | | | 3,222 | | | | 454,335 | | |
Adobe Systems, Inc. (a) | | | 2,462 | | | | 557,003 | | |
Advanced Micro Devices, Inc. (a) | | | 4,313 | | | | 79,618 | | |
Akamai Technologies, Inc. (a) | | | 852 | | | | 52,040 | | |
Alliance Data Systems Corp. | | | 238 | | | | 35,719 | | |
Amphenol Corp., Class A | | | 1,510 | | | | 122,340 | | |
Analog Devices, Inc. | | | 1,869 | | | | 160,416 | | |
ANSYS, Inc. (a) | | | 424 | | | | 60,607 | | |
Apple, Inc. | | | 23,071 | | | | 3,639,219 | | |
Applied Materials, Inc. | | | 4,942 | | | | 161,801 | | |
Arista Networks, Inc. (a) | | | 260 | | | | 54,782 | | |
Autodesk, Inc. (a) | | | 1,099 | | | | 141,342 | | |
Automatic Data Processing, Inc. | | | 2,203 | | | | 288,857 | | |
Broadcom, Inc. | | | 2,170 | | | | 551,788 | | |
Broadridge Financial Solutions, Inc. | | | 585 | | | | 56,306 | | |
Cadence Design Systems, Inc. (a) | | | 1,422 | | | | 61,829 | | |
Cisco Systems, Inc. | | | 22,985 | | | | 995,940 | | |
Citrix Systems, Inc. | | | 648 | | | | 66,394 | | |
Cognizant Technology Solutions Corp., Class A | | | 2,917 | | | | 185,171 | | |
Corning, Inc. | | | 4,073 | | | | 123,046 | | |
DXC Technology Co. | | | 1,414 | | | | 75,182 | | |
F5 Networks, Inc. (a) | | | 306 | | | | 49,581 | | |
Fidelity National Information Services, Inc. | | | 1,653 | | | | 169,515 | | |
Fiserv, Inc. (a) | | | 2,036 | | | | 149,626 | | |
FleetCor Technologies, Inc. (a) | | | 444 | | | | 82,460 | | |
FLIR Systems, Inc. | | | 694 | | | | 30,217 | | |
See notes to financial statements.
13
Victory Variable Insurance Funds
Victory S&P 500 Index VIP Series | | Schedule of Portfolio Investments — continued
December 31, 2018 | |
Security Description | | Shares | | Value | |
Fortinet, Inc. (a) | | | 723 | | | $ | 50,921 | | |
Gartner, Inc. (a) | | | 457 | | | | 58,423 | | |
Global Payments, Inc. | | | 795 | | | | 81,988 | | |
Hewlett Packard Enterprises Co. | | | 7,399 | | | | 97,741 | | |
HP, Inc. | | | 7,956 | | | | 162,780 | | |
Intel Corp. | | | 23,184 | | | | 1,088,026 | | |
International Business Machines Corp. | | | 4,589 | | | | 521,632 | | |
Intuit, Inc. | | | 1,301 | | | | 256,102 | | |
IPG Photonics Corp. (a) (b) | | | 181 | | | | 20,505 | | |
Jack Henry & Associates, Inc. | | | 388 | | | | 49,090 | | |
Juniper Networks, Inc. | | | 1,734 | | | | 46,662 | | |
Keysight Technologies, Inc. (a) | | | 942 | | | | 58,479 | | |
KLA-Tencor Corp. | | | 785 | | | | 70,250 | | |
Lam Research Corp. | | | 792 | | | | 107,847 | | |
Mastercard, Inc., Class A | | | 4,587 | | | | 865,338 | | |
Maxim Integrated Products, Inc. | | | 1,397 | | | | 71,037 | | |
Microchip Technology, Inc. | | | 1,184 | | | | 85,153 | | |
Micron Technology, Inc. (a) | | | 5,832 | | | | 185,049 | | |
Microsoft Corp. | | | 38,556 | | | | 3,916,132 | | |
Motorola Solutions, Inc. | | | 816 | | | | 93,873 | | |
NetApp, Inc. | | | 1,304 | | | | 77,810 | | |
Nvidia Corp. | | | 3,057 | | | | 408,110 | | |
Oracle Corp. | | | 12,874 | | | | 581,260 | | |
Paychex, Inc. | | | 1,610 | | | | 104,892 | | |
PayPal Holdings, Inc. (a) | | | 5,951 | | | | 500,420 | | |
Qorvo, Inc. (a) | | | 632 | | | | 38,381 | | |
QUALCOMM, Inc. | | | 6,095 | | | | 346,866 | | |
Red Hat, Inc. (a) | | | 892 | | | | 156,671 | | |
Salesforce.com, Inc. (a) | | | 3,805 | | | | 521,171 | | |
Seagate Technology PLC | | | 1,314 | | | | 50,707 | | |
Skyworks Solutions, Inc. | | | 900 | | | | 60,318 | | |
Symantec Corp. | | | 3,125 | | | | 59,047 | | |
Synopsys, Inc. (a) | | | 747 | | | | 62,927 | | |
TE Connectivity Ltd. | | | 1,752 | | | | 132,504 | | |
Texas Instruments, Inc. | | | 4,888 | | | | 461,916 | | |
The Western Union Co. | | | 2,249 | | | | 38,368 | | |
Total System Services, Inc. | | | 844 | | | | 68,609 | | |
VeriSign, Inc. (a) | | | 539 | | | | 79,928 | | |
Visa, Inc., Class A | | | 8,933 | | | | 1,178,619 | | |
Western Digital Corp. | | | 1,465 | | | | 54,161 | | |
Xerox Corp. | | | 1,042 | | | | 20,590 | | |
Xilinx, Inc. | | | 1,272 | | | | 108,336 | | |
| | | | 21,403,773 | | |
Materials (2.6%): | |
Air Products & Chemicals, Inc. | | | 1,102 | | | | 176,375 | | |
Albemarle Corp. (b) | | | 545 | | | | 42,003 | | |
Avery Dennison Corp. | | | 440 | | | | 39,525 | | |
Ball Corp. | | | 1,729 | | | | 79,499 | | |
Celanese Corp., Series A | | | 675 | | | | 60,730 | | |
See notes to financial statements.
14
Victory Variable Insurance Funds
Victory S&P 500 Index VIP Series | | Schedule of Portfolio Investments — continued
December 31, 2018 | |
Security Description | | Shares | | Value | |
CF Industries Holdings, Inc. | | | 1,174 | | | $ | 51,081 | | |
DowDuPont, Inc. | | | 11,601 | | | | 620,422 | | |
Eastman Chemical Co. | | | 710 | | | | 51,908 | | |
Ecolab, Inc. | | | 1,278 | | | | 188,313 | | |
FMC Corp. | | | 677 | | | | 50,071 | | |
Freeport-McMoRan, Inc. | | | 7,286 | | | | 75,119 | | |
International Flavors & Fragrances, Inc. | | | 509 | | | | 68,343 | | |
International Paper Co. | | | 2,056 | | | | 82,981 | | |
Linde PLC | | | 2,769 | | | | 432,074 | | |
Lyondellbasell Industries NV, Class A | | | 1,605 | | | | 133,472 | | |
Martin Marietta Materials, Inc. | | | 317 | | | | 54,483 | | |
Newmont Mining Corp. | | | 2,682 | | | | 92,931 | | |
Nucor Corp. | | | 1,591 | | | | 82,430 | | |
Packaging Corp. of America | | | 475 | | | | 39,644 | | |
PPG Industries, Inc. | | | 1,217 | | | | 124,414 | | |
Sealed Air Corp. | | | 799 | | | | 27,837 | | |
The Mosaic Co. | | | 1,783 | | | | 52,081 | | |
The Sherwin-Williams Co. | | | 413 | | | | 162,499 | | |
Vulcan Materials Co. | | | 665 | | | | 65,702 | | |
WestRock Co. | | | 1,283 | | | | 48,446 | | |
| | | | 2,902,383 | | |
Real Estate (3.0%): | |
Alexandria Real Estate Equities, Inc. | | | 532 | | | | 61,308 | | |
American Tower Corp. | | | 2,217 | | | | 350,707 | | |
Apartment Investment & Management Co., Class A | | | 791 | | | | 34,709 | | |
AvalonBay Communities, Inc. | | | 695 | | | | 120,965 | | |
Boston Properties, Inc. | | | 776 | | | | 87,339 | | |
CBRE Group, Inc., Class A (a) | | | 1,589 | | | | 63,624 | | |
Crown Castle International Corp. | | | 2,086 | | | | 226,602 | | |
Digital Realty Trust, Inc. | | | 1,036 | | | | 110,386 | | |
Duke Realty Investments, Inc. | | | 1,796 | | | | 46,516 | | |
Equinix, Inc. | | | 400 | | | | 141,024 | | |
Equity Residential | | | 1,852 | | | | 122,251 | | |
Essex Property Trust, Inc. | | | 332 | | | | 81,410 | | |
Extra Space Storage, Inc. | | | 636 | | | | 57,545 | | |
Federal Realty Investment Trust | | | 370 | | | | 43,675 | | |
HCP, Inc. | | | 2,362 | | | | 65,971 | | |
Host Hotels & Resorts, Inc. | | | 3,729 | | | | 62,162 | | |
Iron Mountain, Inc. | | | 1,439 | | | | 46,638 | | |
Kimco Realty Corp. | | | 2,119 | | | | 31,043 | | |
Mid-America Apartment Communities, Inc. | | | 572 | | | | 54,740 | | |
Prologis, Inc. | | | 3,165 | | | | 185,849 | | |
Public Storage | | | 753 | | | | 152,415 | | |
Realty Income Corp. | | | 1,458 | | | | 91,912 | | |
Regency Centers Corp. | | | 852 | | | | 49,995 | | |
SBA Communications Corp. (a) | | | 577 | | | | 93,411 | | |
Simon Property Group, Inc. | | | 1,555 | | | | 261,224 | | |
SL Green Realty Corp. | | | 435 | | | | 34,400 | | |
The Macerich Co. | | | 532 | | | | 23,025 | | |
See notes to financial statements.
15
Victory Variable Insurance Funds
Victory S&P 500 Index VIP Series | | Schedule of Portfolio Investments — continued
December 31, 2018 | |
Security Description | | Shares | | Value | |
UDR, Inc. | | | 1,346 | | | $ | 53,329 | | |
Ventas, Inc. | | | 1,792 | | | | 104,993 | | |
Vornado Realty Trust | | | 870 | | | | 53,966 | | |
Welltower, Inc. | | | 1,871 | | | | 129,866 | | |
Weyerhaeuser Co. | | | 3,810 | | | | 83,287 | | |
| | | | 3,126,287 | | |
Utilities (3.2%): | |
AES Corp. | | | 3,327 | | | | 48,108 | | |
Alliant Energy Corp. | | | 1,175 | | | | 49,644 | | |
Ameren Corp. | | | 1,227 | | | | 80,037 | | |
American Electric Power Co., Inc. | | | 2,478 | | | | 185,206 | | |
American Water Works Co., Inc. | | | 908 | | | | 82,419 | | |
CenterPoint Energy, Inc. | | | 2,474 | | | | 69,841 | | |
CMS Energy Corp. | | | 1,424 | | | | 70,702 | | |
Consolidated Edison, Inc. | | | 1,564 | | | | 119,583 | | |
Dominion Resources, Inc. | | | 3,287 | | | | 234,890 | | |
DTE Energy Co. | | | 914 | | | | 100,814 | | |
Duke Energy Corp. | | | 3,582 | | | | 309,126 | | |
Edison International | | | 1,638 | | | | 92,989 | | |
Entergy Corp. | | | 909 | | | | 78,238 | | |
Evergy, Inc. | | | 1,366 | | | | 77,548 | | |
Eversource Energy | | | 1,593 | | | | 103,609 | | |
Exelon Corp. | | | 4,857 | | | | 219,051 | | |
FirstEnergy Corp. | | | 2,443 | | | | 91,735 | | |
NextEra Energy, Inc. | | | 2,371 | | | | 412,126 | | |
NiSource, Inc. | | | 1,825 | | | | 46,264 | | |
NRG Energy, Inc. | | | 1,526 | | | | 60,430 | | |
PG&E Corp. (a) | | | 2,600 | | | | 61,750 | | |
Pinnacle West Capital Corp. | | | 563 | | | | 47,968 | | |
PPL Corp. | | | 3,517 | | | | 99,637 | | |
Public Service Enterprise Group, Inc. | | | 2,541 | | | | 132,259 | | |
Sempra Energy | | | 1,375 | | | | 148,761 | | |
The Southern Co. | | | 5,099 | | | | 223,948 | | |
WEC Energy Group, Inc. | | | 1,586 | | | | 109,846 | | |
Xcel Energy, Inc. | | | 2,560 | | | | 126,130 | | |
| | | | 3,482,659 | | |
Total Common Stocks (Cost $39,338,876) | | | 106,202,210 | | |
See notes to financial statements.
16
Victory Variable Insurance Funds
Victory S&P 500 Index VIP Series | | Schedule of Portfolio Investments — continued
December 31, 2018 | |
Security Description | | Shares | | Value | |
Collateral for Securities Loaned^ (0.4%) | |
BlackRock Liquidity Funds TempFund Portfolio, Institutional Class, 2.49% (c) | | | 71,928 | | | $ | 71,928 | | |
Fidelity Investments Money Market Government Portfolio, Class I,
2.28% (c) | | | 103,933 | | | | 103,933 | | |
Fidelity Investments Prime Money Market Portfolio, Class I, 2.46% (c) | | | 3,209 | | | | 3,209 | | |
Goldman Sachs Financial Square Prime Obligations Fund,
Institutional Class, 2.55% (c) | | | 39,961 | | | | 39,961 | | |
JPMorgan Prime Money Market Fund, Capital Class, 2.49% (c) | | | 63,933 | | | | 63,933 | | |
Morgan Stanley Institutional Liquidity Prime Portfolio, Institutional Class,
2.58% (c) | | | 95,907 | | | | 95,907 | | |
Total Collateral for Securities Loaned (Cost $378,871) | | | 378,871 | | |
Total Investments (Cost $39,717,747) — 100.1% | | | 106,581,081 | | |
Liabilities in excess of other assets — (0.1)% | | | (149,367 | ) | |
NET ASSETS — 100.00% | | $ | 106,431,714 | | |
^ Purchased with cash collateral from securities on loan.
(a) Non-income producing security.
(b) All or a portion of this security is on loan.
(c) Rate disclosed is the daily yield on December 31, 2018.
ADR — American Depositary Receipt
PLC — Public Limited Company
Futures Contracts Purchased
| | | Number of
Contracts | | Expiration
Date | | Notional
Amount | | Value | | Unrealized
Appreciation
(Depreciation) | |
E-Mini S&P 500 Futures | | | 7 | | | 3/15/19 | | $ | 908,891 | | | $ | 876,820 | | | $ | (32,071 | ) | |
| | | Total unrealized appreciation | | | | | | | | $ | — | | |
| | | Total unrealized depreciation | | | | | | | | | (32,071 | ) | |
| | | Total net unrealized appreciation (depreciation) | | | | | | | | $ | (32,071 | ) | |
See notes to financial statements.
17
Victory Variable Insurance Funds | | Statement of Assets and Liabilities
December 31, 2018 | |
| | | Victory
S&P 500
Index VIP
Series | |
ASSETS: | |
Investments, at value (Cost $39,717,747) | | $ | 106,581,081 | (a) | |
Cash and cash equivalents | | | 629,840 | | |
Deposits with brokers for futures contracts | | | 140,849 | | |
Interest and dividends receivable | | | 125,330 | | |
Receivable for capital shares issued | | | 11,178 | | |
Receivable for investments sold | | | 94,805 | | |
Variation margin receivable on open futures contracts | | | 5,978 | | |
Receivable from Adviser | | | 33,493 | | |
Total Assets | | | 107,622,554 | | |
LIABILITIES: | |
Payables: | |
Collateral received on loaned securities | | | 378,871 | | |
Capital shares redeemed | | | 743,093 | | |
Accrued expenses and other payables: | |
Investment advisory fees | | | 23,448 | | |
Administration fees | | | 5,752 | | |
Custodian fees | | | 1,645 | | |
Transfer agent fees | | | 13,206 | | |
Chief Compliance Officer fees | | | 218 | | |
Trustees' fees | | | 112 | | |
Other accrued expenses | | | 24,495 | | |
Total Liabilities | | | 1,190,840 | | |
NET ASSETS: | |
Capital | | | 31,092,521 | | |
Total distributable earnings/(loss) | | | 75,339,193 | | |
Net Assets | | $ | 106,431,714 | | |
Shares Outstanding (unlimited shares authorized,
with a par value of $0.001 per share): | | | 6,290,917 | | |
Net asset value: | | $ | 16.92 | | |
(a) Includes $371,821 of securities on loan.
See notes to financial statements.
18
Victory Variable Insurance Funds | | Statement of Operations
For the Year Ended December 31, 2018 | |
| | | Victory
S&P 500
Index VIP
Series | |
Investment Income: | |
Dividends | | $ | 2,379,221 | | |
Interest | | | 13,454 | | |
Securities lending (net of fees) | | | 7,800 | | |
Total Income | | | 2,400,475 | | |
Expenses: | |
Investment advisory fees | | | 310,804 | | |
Administration fees | | | 74,293 | | |
Custodian fees | | | 6,228 | | |
Transfer agent fees | | | 26,676 | | |
Trustees' fees | | | 10,516 | | |
Chief Compliance Officer fees | | | 1,072 | | |
Legal and audit fees | | | 25,048 | | |
Interest expense on interfund lending | | | 19 | | |
Other expenses | | | 19,648 | | |
Total Expenses | | | 474,304 | | |
Expenses waived/reimbursed by Adviser | | | (126,360 | ) | |
Net Expenses | | | 347,944 | | |
Net Investment Income (Loss) | | | 2,052,531 | | |
Realized/Unrealized Gains (Losses) from Investment Transactions: | |
Net realized gains (losses) from investment transactions | | | 11,560,971 | | |
Net realized gains (losses) from futures transactions | | | (35,067 | ) | |
Net change in unrealized appreciation/depreciation on investments | | | (18,179,217 | ) | |
Net change in unrealized appreciation/depreciation on futures transactions | | | (49,613 | ) | |
Net realized/unrealized gains (losses) on investments | | | (6,702,926 | ) | |
Change in net assets resulting from operations | | $ | (4,650,395 | ) | |
See notes to financial statements.
19
Victory Variable Insurance Funds | | Statements of Changes in Net Assets | |
| | | Victory S&P 500 Index VIP Series | |
| | | Year
Ended
December 31,
2018 | | Year
Ended
December 31,
2017 | |
From Investment Activities: | |
Operations: | |
Net investment income (loss) | | $ | 2,052,531 | | | $ | 2,136,011 | | |
Net realized gains (losses) from investment transactions | | | 11,525,904 | | | | 8,589,741 | | |
Net change in unrealized appreciation (depreciation)
on investments | | | (18,228,830 | ) | | | 13,782,820 | | |
Change in net assets resulting from operations | | | (4,650,395 | ) | | | 24,508,572 | | |
Distributions to Shareholders: (a) | |
Change in net assets resulting from distributions to
shareholders | | | (7,462,566 | ) | | | (2,489,073 | ) | |
Change in net assets resulting from capital transactions | | | (10,536,165 | ) | | | (13,095,982 | ) | |
Change in net assets | | | (22,649,126 | ) | | | 8,923,517 | | |
Net Assets: | |
Beginning of period | | | 129,080,840 | | | | 120,157,323 | | |
End of period | | $ | 106,431,714 | | | $ | 129,080,840 | | |
Capital Transactions: | |
Proceeds from shares issued | | $ | 5,103,469 | | | $ | 7,683,257 | | |
Distributions reinvested | | | 7,462,566 | | | | 2,489,073 | | |
Cost of shares redeemed | | | (23,102,200 | ) | | | (23,268,312 | ) | |
Change in net assets resulting from capital transactions | | $ | (10,536,165 | ) | | $ | (13,095,982 | ) | |
Share Transactions: | |
Issued | | | 260,170 | | | | 440,557 | | |
Reinvested | | | 440,689 | | | | 130,083 | | |
Redeemed | | | (1,183,894 | ) | | | (1,316,648 | ) | |
Change in Shares | | | (483,035 | ) | | | (746,008 | ) | |
(a) Current and prior year distributions to shareholders have been reclassified and conform to amended GAAP presentation under Regulation S-X (See Item 10 in the Notes to Financial Statements).
See notes to financial statements.
20
Victory Variable Insurance Funds | | Financial Highlights | |
For a Share Outstanding Throughout Each Period
| | | Victory S&P 500 Index VIP Series | |
| | | Year
Ended
December 31,
2018 | | Year
Ended
December 31,
2017 | | Year
Ended
December 31,
2016 | | Year
Ended
December 31,
2015 | | Year
Ended
December 31,
2014 | |
Net Asset Value, Beginning of Period | | $ | 19.06 | | | $ | 15.98 | | | $ | 14.84 | | | $ | 14.97 | | | $ | 13.43 | | |
Investment Activities: | |
Net investment income (loss) (a) | | | 0.32 | | | | 0.30 | | | | 0.28 | | | | 0.27 | | | | 0.24 | | |
Net realized and unrealized gains
(losses) on investments | | | (1.21 | ) | | | 3.15 | | | | 1.46 | | | | (0.12 | ) | | | 1.56 | | |
Total from Investment Activities | | | (0.89 | ) | | | 3.45 | | | | 1.74 | | | | 0.15 | | | | 1.80 | | |
Distributions to Shareholders: | |
Net investment income | | | (0.02 | ) | | | (0.33 | ) | | | (0.32 | ) | | | (0.28 | ) | | | (0.26 | ) | |
Net realized gains from investments | | | (1.23 | ) | | | (0.04 | ) | | | (0.28 | ) | | | — | | | | — | | |
Total Distributions
to Shareholders | | | (1.25 | ) | | | (0.37 | ) | | | (0.60 | ) | | | (0.28 | ) | | | (0.26 | ) | |
Capital Contributions from Prior
Custodian, Net (See Note 8) | | | — | | | | — | | | | — | (b) | | | — | | | | — | | |
Net Asset Value, End of Period | | $ | 16.92 | | | $ | 19.06 | | | $ | 15.98 | | | $ | 14.84 | | | $ | 14.97 | | |
Total Return (c) | | | (4.65 | )% | | | 21.60 | % | | | 11.75 | %(d) | | | 1.03 | % | | | 13.42 | % | |
Ratios/Supplemental Data: | |
Net Assets at end of period (000) | | $ | 106,432 | | | $ | 129,081 | | | $ | 120,157 | | | $ | 118,752 | | | $ | 129,723 | | |
Ratio of net expenses to average net assets | | | 0.28 | % | | | 0.28 | % | | | 0.28 | % | | | 0.28 | % | | | 0.28 | % | |
Ratio of net investment income (loss)
to average net assets | | | 1.65 | % | | | 1.70 | % | | | 1.84 | % | | | 1.75 | % | | | 1.73 | % | |
Ratio of gross expenses to
average net assets (e) | | | 0.38 | % | | | 0.41 | % | | | 0.37 | % | | | 0.39 | % | | | 0.37 | % | |
Portfolio turnover | | | 3 | % | | | 3 | % | | | 4 | % | | | 3 | % | | | 3 | % | |
(a) Per share net investment income (loss) has been calculated using the average daily shares method.
(b) Amount is less than $0.005 per share.
(c) Total returns do not reflect the effects of charges deducted pursuant to the terms of The Guardian Insurance & Annuity Company, Inc.'s variable contracts. Inclusion of such charges would reduce the total returns for all periods shown.
(d) The Fund received monies related to a nonrecurring refund from the prior Custodian. The corresponding impact to the total return was less than 0.01% for the period shown. (See Note 8)
(e) During the period, certain fees were reduced and/or reimbursed. If such fee reductions and/or reimbursements had not occurred, the ratios would have been as indicated.
See notes to financial statements.
21
Victory Variable Insurance Funds | | Notes to Financial Statements
December 31, 2018 | |
1. Organization:
Victory Variable Insurance Funds (the "Trust") was organized on February 11, 1998 as a Delaware statutory trust. The Trust is registered under the Investment Company Act of 1940, as amended (the "1940 Act"), as a diversified open-end investment company. The Trust is comprised of nine funds and is authorized to issue an unlimited number of shares, which are units of beneficial interest with a par value of $0.001 per share.
The accompanying financial statements are those of the Victory S&P 500 Index VIP Series (the "Fund"). The Fund offers a single class of shares: Class I Shares. Sales of shares of the Fund may only be made to certain separate accounts of The Guardian Insurance & Annuity Company, Inc. ("GIAC") that fund certain variable annuity and variable life insurance contracts issued by GIAC. GIAC is a wholly owned subsidiary of The Guardian Life Insurance Company of America ("Guardian Life").
Under the Trust's organizational documents, its officers and trustees are indemnified against certain liabilities arising out of the performance of their duties to the Fund. In addition, in the normal course of business, the Fund enters into contracts with its vendors and others that provide for general indemnifications. The Fund's maximum exposure under these arrangements is unknown, as this would involve future claims that may be made against the Fund. However, based on experience, the Fund expects that risk of loss to be remote.
2. Significant Accounting Policies:
The following is a summary of significant accounting policies followed by the Trust in the preparation of its financial statements. The policies are in conformity with accounting principles generally accepted in the United States of America ("GAAP"). The preparation of financial statements in accordance with GAAP requires management to make estimates and assumptions that affect the reported amounts of assets and liabilities and disclosure of contingent assets and liabilities at the date of the financial statements and the reported amounts of income and expenses for the period. Actual results could differ from those estimates. The Fund follows the specialized accounting and reporting requirements under GAAP that are applicable to investment companies.
Investment Valuation:
The Fund records investments at fair value. Fair value is defined as the price that would be received to sell an asset or paid to transfer a liability in an orderly transaction between market participants at the measurement date.
The valuation techniques described below maximize the use of observable inputs and minimize the use of unobservable inputs in determining fair value. The inputs used for valuing the Fund's investments are summarized in the three broad levels listed below:
• Level 1 — quoted prices in active markets for identical securities
• Level 2 — other significant observable inputs (including quoted prices for similar securities or interest rates applicable to those securities, etc.)
• Level 3 — significant unobservable inputs (including the Fund's own assumptions in determining the fair value of investments)
Changes in valuation techniques may result in transfers in or out of an assigned level within the disclosure hierarchy. The inputs or methodologies used for valuation techniques are not necessarily an indication of the risk associated with entering into those investments.
Portfolio securities listed or traded on securities exchanges, including American Depositary Receipts ("ADRs") and Rights, are valued at the closing price on the exchange or system where the security is principally traded, if available, or at the Nasdaq Official Closing Price. If there have been no sales for that day on the exchange or system, then a security is valued at the last available bid quotation on the exchange or system where the security is principally traded. In each of these situations, valuations are typically categorized as Level 1 in the fair value hierarchy.
22
Victory Variable Insurance Funds | | Notes to Financial Statements — continued
December 31, 2018 | |
Futures contracts are valued at the settlement price established each day by the board of trade or an exchange on which they are traded. These valuations are typically categorized as Level 1 in the fair value hierarchy.
Investments for which there are no such quotations, or for which quotations do not appear reliable, are valued at fair value in accordance with procedures established by and under the general supervision and responsibility of the Trust's Board of Trustees (the "Board"). These valuations are typically categorized as Level 2 or Level 3 in the fair value hierarchy, based on the observability of inputs used to determine the fair value.
A summary of the valuations as of December 31, 2018, based upon the three levels defined above, is included in the table below while the breakdown, by category, of investments is disclosed in the Schedule of Portfolio Investments:
| | | LEVEL 1 —
Quoted Prices | | Total | |
| | | Investments
in
Securities | | Other
Financial
Investments^ | | Investments
in
Securities | | Other
Financial
Investments^ | |
Common Stocks | | $ | 106,202,210 | | | $ | — | | | $ | 106,202,210 | | | $ | — | | |
Collateral for Securities Loaned | | | 378,871 | | | | — | | | | 378,871 | | | | — | | |
Futures Contracts | | | — | | | | (32,071 | ) | | | — | | | | (32,071 | ) | |
Total | | $ | 106,581,081 | | | $ | (32,071 | ) | | $ | 106,581,081 | | | $ | (32,071 | ) | |
^ Other Financial instruments include any derivative instruments not reflected in the Schedule of Portfolio Investments as Investment Securities, such as futures contracts. These instruments are generally recorded in the financial statements at the unrealized gain or loss on the investment.
For the year ended December 31, 2018, there were no Level 3 investments for which significant unobservable inputs were used to determine fair value.
Derivative Instruments:
Futures Contracts:
The Fund may enter into contracts for the future delivery of securities or foreign currencies and futures contracts based on a specific security, class of securities, foreign currency or an index, and purchase or sell options on any such futures contracts. A futures contract on a securities index is an agreement obligating either party to pay, and entitling the other party to receive, while the contract is outstanding, cash payments based on the level of a specified securities index. No physical delivery of the underlying asset is made. The Fund may enter into futures contracts in an effort to hedge against market risks. The acquisition of put and call options on futures contracts will give the Fund the right (but not the obligation), for a specified price, to sell or to purchase the underlying futures contract, upon exercise of the option, at any time during the option period. Futures transactions involve brokerage costs and require the Fund to segregate assets to cover contracts that would require it to purchase securities or currencies. A good faith margin deposit, known as initial margin, of cash or government securities with a broker or custodian is required to initiate and maintain open positions in futures contracts. Subsequent payments, known as variation margin, are made or received by the Fund based on the change in the market value of the position and are recorded as unrealized appreciation or depreciation until the contract is closed out, at which time the gain or loss is realized. The Fund may lose the expected benefit of futures transactions if interest rates, exchange rates or securities prices change in an unanticipated manner. Such unanticipated changes may also result in lower overall performance than if the Fund had not entered into any futures transactions. In addition, the value of the Fund's futures positions may not prove to be perfectly or even highly correlated with the value of its portfolio securities or foreign currencies, limiting the Fund's ability to hedge effectively against interest rate, exchange rate and/or market risk and giving rise to additional risks. There is no assurance of liquidity in the secondary market for purposes of closing out futures positions. The collateral held by the Fund is presented on the Statement of Assets and Liabilities under Deposit with broker for futures contracts. As of December 31, 2018, the Fund entered into Futures Contracts primarily for the strategy of hedging or other purposes, including but not limited to, providing liquidity and equitizing cash.
23
Victory Variable Insurance Funds | | Notes to Financial Statements — continued
December 31, 2018 | |
Summary of Derivative Instruments:
The following table presents the effect of derivative instruments on the Statement of Assets and Liabilities, categorized by risk exposure, as of December 31, 2018.
| | | Liabilities | |
| | | Variation Margin
Payable on Open
Futures Contracts* | |
Equity Risk Exposure | | $ | (32,071 | ) | |
* Includes cumulative appreciation/depreciation of futures contracts as reported in the Schedule of Investments. Only current day's variation margin is reported within the Statement of Assets and Liabilities.
The following table presents the effect of derivative instruments on the Statement of Operations, categorized by risk exposure, for the year ended December 31, 2018.
| | | Net Realized Gains (Losses) on
Derivative Recognized as
a Result from Operations | | Net Change in Unrealized
Appreciation/Depreciation
on Derivatives Recognized
as a Result of Operations | |
| | | Net Realized
Gains (Losses) from
Futures Transactions | | Net Change in Unrealized
Appreciation/Depreciation
on Futures Transactions | |
Equity Risk Exposure | | $ | (35,067 | ) | | $ | (49,613 | ) | |
All open derivative positions at period end are reflected on the Fund's Schedule of Portfolio Investments. The underlying face value of open derivative positions relative to the Fund's net assets at period end is generally representative of the notional amount of open positions to net assets throughout the period.
Investment Transactions and Related Income:
Changes in holdings of investments are accounted for no later than one business day following the trade date. For financial reporting purposes, however, investment transactions are accounted for on trade date on the last business day of the reporting period. Interest income is recognized on an accrual basis and includes, where applicable, the amortization of premiums or accretion of discounts. Dividend income is recorded on the ex-dividend date. Gains or losses realized on sales of securities are determined by comparing the identified cost of the security lot sold with the net sales proceeds.
Withholding taxes on interest, dividends and gains as a result of certain investments in ADRs by the Fund have been provided for in accordance with each investment's applicable country's tax rules and rates.
Securities Lending:
The Trust has entered into a Master Securities Lending Agreement ("MSLA") with Citibank, N.A. ("Citibank" or the "Agent"). Under the terms of the MSLA, the Fund may lend securities to certain broker-dealers and banks in exchange for collateral in the amount of at least 102% of the value of U.S. securities loaned or at least 105% of the value of non-U.S. securities loaned, marked-to-market daily. Any collateral shortfalls associated with increases in the valuation of the securities loaned are adjusted the next business day. The collateral can be received in the form of cash collateral and/or non-cash collateral. Non-cash collateral can include U.S. Government Securities, letters of credit and certificates of deposit. The cash collateral is invested in short-term instruments or cash equivalents as noted on the Fund's Schedule of Portfolio Investments. The Trust does not have effective control of the non-cash collateral and therefore it is not disclosed in the Fund's Schedule of Portfolio Investments. The Fund continues to benefit from interest or dividends on the securities loaned and may also earn a return from the collateral. The Fund pays various fees in connection with the investment of cash collateral.
24
Victory Variable Insurance Funds | | Notes to Financial Statements — continued
December 31, 2018 | |
The Fund pays the Agent fees based on the investment income received from securities lending activities. Securities lending income is disclosed in the Fund's Statement of Operations. Although risk is mitigated by the collateral, the Fund could experience a delay in recovering its securities and possible loss of income or value if the borrower fails to return them.
Securities lending transactions are entered into by the Fund under the MSLA, which permits the Fund, under certain circumstances such as an event of default, to offset amounts payable by the Fund to the same counterparty against amounts receivable from the counterparty to create a net payment due to or from the Fund.
The following table is a summary of the Fund's securities lending transactions which are subject to offset under the MSLA as of December 31, 2018. These transactions are accounted for as secured borrowings with an overnight and continuous contractual maturity for cash collateral, and greater than overnight and continuous contractual maturity for non-cash collateral.
Gross
Amount of
Recognized
Assets
(Value of | | Value of
Cash | | Value of Non-cash Collateral
Received by Maturity | | | |
Securities
on Loan) | | Collateral
Received | | <30 Days | | Between 30
& 90 days | | >90 Days | | Net Amount | |
| $ | 371,821 | | | $ | 378,871 | | | $ | — | | | $ | — | | | $ | — | | | $ | 7,050 | | |
Dividends to Shareholders:
Dividends from net investment income, if any, are declared and paid annually by the Fund. Distributable net realized gains, if any, are declared and distributed at least annually.
The amounts of dividends from net investment income and distributions from net realized gains are determined in accordance with federal income tax regulations, which may differ from GAAP. To the extent these "book/tax" differences are permanent in nature (e.g., net operating loss, distribution reclassification, and deemed distribution due to shareholder redemptions), such amounts are reclassified within the components of net assets based on their federal tax-basis treatment; temporary differences (e.g., wash sales) do not require reclassification. To the extent dividends and distributions exceed net investment income and net realized gains for tax purposes, they are reported as distributions of capital. Net investment losses incurred by the Fund may be reclassified as an offset to capital on the accompanying Statement of Assets and Liabilities.
As of December 31, 2018, on the Statement of Assets and Liabilities, there were no permanent book-to-tax differences reclassification adjustments.
Federal Income Taxes:
It is the policy of the Fund to continue to qualify as a regulated investment company by complying with the provisions available to certain investment companies, as defined in applicable sections of the Internal Revenue Code, and to make distributions of net investment income and net realized gains sufficient to relieve it from all, or substantially all, federal income taxes. Accordingly, no provision for federal income taxes is required in the financial statements. The Fund has a tax year end of December 31.
Management of the Fund has reviewed tax positions taken in tax years that remain subject to examination by all major tax jurisdictions, including federal (i.e., the last four tax year ends and the interim tax period since then). Management believes that there is no tax liability resulting from unrecognized tax benefits related to uncertain tax positions taken.
Allocations:
Expenses directly attributable to the Fund are charged to the Fund, while expenses which are attributable to more than one fund, or jointly with an affiliated trust, are allocated among the Fund
25
Victory Variable Insurance Funds | | Notes to Financial Statements — continued
December 31, 2018 | |
and respective funds in the Trust and/or affiliated trust based upon net assets or another appropriate basis.
Affiliated Securities Transactions:
Pursuant to Rule 17a-7 under the 1940 Act, the Fund may engage in securities transactions with affiliated investment companies and advisory accounts managed by the Adviser and any applicable sub-adviser. Any such purchase or sale transaction must be effected without brokerage commission or other remuneration, except for customary transfer fees. The transaction must be effected at the current market price, which is either the security's last sale price on an exchange or, if there are no transactions in the security that day, at the average of the highest bid and lowest asked price. For the year ended December 31, 2018, the Fund did not engage in any Rule 17a-7 transactions under the 1940 Act.
3. Purchases and Sales of Securities:
Purchases and sales of securities (excluding securities maturing less than one year from acquisition) for the year ended December 31, 2018 were as follows for the Fund:
| Purchases | | Sales | |
| $ | 3,397,358 | | | $ | 17,739,950 | | |
For the year ended December 31, 2018, there were no purchases or sales of U.S. Government Securities.
4. Fees and Transactions with Affiliates and Related Parties:
Investment advisory services are provided to the Fund by Victory Capital Management Inc. ("VCM" or the "Adviser"), a New York corporation registered as an investment adviser with the Securities and Exchange Commission ("SEC"). The Adviser is a wholly-owned indirect subsidiary of Victory Capital Holdings Inc., a publicly traded Delaware corporation and a wholly-owned direct subsidiary of Victory Capital Operating, LLC.
Under the terms of the Investment Advisory Agreement, the Adviser is entitled to receive 0.25% of the average daily net assets of the Fund. The Adviser may use its resources to assist with the Fund's distribution and marketing expenses.
VCM also serves as the Fund's administrator and fund accountant. Under an Administration and Fund Accounting Agreement, VCM is paid for its services an annual fee at a rate of 0.08% of the first $15 billion in average daily net assets of the Trust, Victory Portfolios and Victory Portfolios II (collectively, the "Trusts"), 0.05% of the average daily net assets above $15 billion to $30 billion of the Trusts and 0.04% of the average daily net assets over $30 billion of the Trusts.
Citi Fund Services Ohio, Inc. ("Citi"), an affiliate of Citibank, N.A., acts as sub-administrator and sub-fund accountant to the Fund pursuant to a Sub-Administration and Sub-Fund Accounting Services Agreement between VCM and Citi. VCM pays Citi a fee for providing these services. The Trust reimburses VCM and Citi for all of their reasonable out-of-pocket expenses incurred in providing these services.
FIS Investor Services, LLC ("FIS") serves as the Fund's transfer agent. Under the Transfer Agent Agreement, the Trust pays FIS a fee for its services and reimburses FIS for all of their reasonable out-of-pocket expenses incurred in providing these services.
The Chief Compliance Officer ("CCO") is an employee of the Adviser, which pays the compensation of the CCO and his support staff. The Trust has entered into an Agreement to provide compliance services with the Adviser, pursuant to which the Adviser furnishes its compliance personnel, including the services of the CCO, and other resources reasonably necessary to provide the Trust with compliance oversight services related to the design, administration and oversight of a compliance program for the Trust in accordance with Rule 38a-1 under the 1940 Act. Funds in the Trust, Victory Portfolios, Victory Institutional Funds, and Victory Portfolios II (collectively, the "Victory Funds Complex"), in the aggregate, compensate the Adviser for these services.
26
Victory Variable Insurance Funds | | Notes to Financial Statements — continued
December 31, 2018 | |
The Victory Funds Complex pays an annual retainer to each Independent Trustee, plus an additional annual retainer to the Chairman of the Board. The aggregate amount of the fees and expenses of the Independent Trustees are allocated amongst all the funds in the Victory Funds Complex and are presented in the Statement of Operations.
Shearman & Sterling LLP provides legal services to the Trust.
Victory Capital Advisers, Inc. (the "Distributor"), an affiliate of the Adviser, serves as distributor for the continuous offering of the shares of the Fund pursuant to a Distribution Agreement between the Distributor and the Trust.
The Adviser has entered into an expense limitation agreement with the Fund until at least April 30, 2019. Under the terms of the agreement, the Adviser has agreed to waive fees or reimburse certain expenses to the extent that ordinary operating expenses incurred by certain classes of the Fund in any fiscal year exceed the expense limit for such classes of the Fund. Such excess amounts will be the liability of the Adviser. Interest, taxes, brokerage commissions, other expenditures which are capitalized in accordance with GAAP, and other extraordinary expenses not incurred in the ordinary course of a Fund's business are excluded from the expense limits. For the year ended December 31, 2018, the expense limit (excluding voluntary waivers) is 0.28%.
The Fund has agreed to repay fees and expenses that were waived or reimbursed by the Adviser for a period up to three fiscal years after such waiver or reimbursement was made to the extent such payments or repayments would not cause the expenses of a class to exceed the original expense limitation in place at the time of the waiver or reimbursement or any expense limitation agreement in place at the time of repayment. As of December 31, 2018, the following amounts are available to be repaid to the Adviser. Amounts repaid to the Adviser during the year ended, if any, are reflected on the Statement of Operations as "Recoupment of prior expenses waived/reimbursed by Adviser".
Expires
12/31/2019 | | Expires
12/31/2020 | | Expires
12/31/2021 | |
| $ | 36,542 | | | $ | 167,384 | | | $ | 126,360 | | |
The Adviser may voluntarily waive or reimburse additional fees to assist the Fund in maintaining a competitive expense ratio. Voluntary waivers and reimbursements applicable to the Fund are not available to be recouped at a future time. There were no voluntary waivers or reimbursements for the year ended December 31, 2018.
Certain officers and/or interested trustees of the Fund are also officers and/or employees of the Adviser, Administrator, Fund Accountant, Sub-Administrator, Sub-Fund Accountant, and Legal.
5. Risks:
The Fund may be subject to other risks in addition to these identified risks.
An investment in the Fund's shares represents an indirect investment in the securities owned by the Fund, some of which will be traded on a national securities exchange or in the over-the-counter markets. The value of the securities in which the Fund invests, like other market investments, may move up or down, sometimes rapidly and unpredictably. The value of the securities in which the Fund invests may affect the value of the Fund's shares. An investment in the Fund's shares at any point in time may be worth less than the original investment, even after taking into account the reinvestment of the Fund's distributions.
The Fund will be subject to credit risk with respect to the amount it expects to receive from counterparties for financial instruments entered into by the Fund. The Fund may be negatively impacted if a counterparty becomes bankrupt or otherwise fails to perform its obligations due to financial difficulties. The Fund may experience significant delays in obtaining any recovery in bankruptcy or other reorganization proceeding and the Fund may obtain only limited recovery or may obtain no recovery in such circumstances. The Fund typically enters into transactions with counterparties whose credit ratings are investment grade, as determined by a nationally recognized statistical rating organization or, if unrated, judged by the Adviser to be of comparable quality.
27
Victory Variable Insurance Funds | | Notes to Financial Statements — continued
December 31, 2018 | |
6. Borrowing and Interfund Lending:
Line of Credit:
The Victory Funds Complex participates in a short-term, demand note "Line of Credit" agreement with Citibank. Under the agreement with Citibank, the Victory Funds Complex may borrow up to $250 million, of which $100 million is committed and $150 million is uncommitted. $40 million of the Line of Credit is reserved for use by the Victory Floating Rate Fund, another series of the Victory Funds Complex, with that Fund paying the related commitment fees for that amount. The purpose of the agreement is to meet temporary or emergency cash needs, including redemption requests that might otherwise require the untimely disposition of securities. The current agreement was amended on July 27, 2018 with a new termination date of July 26, 2019. Citibank receives an annual commitment fee of 0.15% on $100 million for providing the Line of Credit. For the year ended December 31, 2018, Citibank earned approximately $150,000 in commitment fees from the Victory Funds Complex. Each fund in the Victory Funds Complex pays a pro-rata portion of the commitment fees plus any interest on amounts borrowed. Interest accrued by the Fund during the period is presented on the Statement of Operations under Interest expense on line of credit.
The Fund did not utilize or participate in the Line of Credit during the year ended December 31, 2018.
Interfund Lending:
The Trust and Adviser rely on an exemptive order granted by the SEC in March 2017 (the "Order"), permitting the establishment and operation of an Interfund Lending Facility (the "Facility"). The Facility allows the Fund to directly lend and borrow money to or from any other Victory Fund relying upon the Order at rates beneficial to both the borrowing and lending funds. Advances under the Facility are allowed for temporary or emergency purposes, including the meeting of redemption requests that otherwise might require the untimely disposition of securities, and are subject to each Fund's borrowing restrictions. The interfund loan rate is determined, as specified in the Order, by averaging the current repurchase agreement rate and the current bank loan rate. Interest accrued by the Fund during the period is presented on the Statement of Operations under Interest expense on interfund lending.
The average loans for the days outstanding and average interest rate for the Fund during the year ended December 31, 2018 were as follows:
Borrower or
Lender | | Amount
Outstanding
at
December 31,
2018 | | Average
Borrowing* | | Days
Borrowing
Outstanding | | Average
Interest
Rate* | | Maximum
Borrowing
During the
Period | |
| Borrower | | | — | | | $ | 341,000 | | | | 1 | | | | 2.00 | % | | $ | 341,000 | | |
* For the year ended December 31, 2018, based on the number of days borrowings were outstanding.
7. Federal Income Tax Information:
The tax character of distributions paid during the tax years ended, as noted below, were as follows (total distributions paid may differ from the Statements of Changes in Net Assets because, for tax purposes, dividends are recognized when actually paid).
Year Ended December 31, 2018 | |
Distributions paid from | |
Ordinary
Income | | Net
Long-Term
Capital Gains | | Total
Distributions
Paid | |
| $ | 349,417 | | | $ | 7,113,149 | | | $ | 7,462,566 | | |
28
Victory Variable Insurance Funds | | Notes to Financial Statements — continued
December 31, 2018 | |
Year Ended December 31, 2017 | |
Distributions paid from | |
Ordinary
Income | | Net
Long-Term
Capital Gains | | Total
Distributions
Paid | |
| $ | 2,216,230 | | | $ | 272,843 | | | $ | 2,489,073 | | |
As of the tax year ended December 31, 2018, the components of accumulated earnings (deficit) on a tax basis were as follows:
Undistributed
Ordinary
Income | | Undistributed
Long-Term
Capital Gains | | Accumulated
Earnings | | Unrealized
Appreciation
(Depreciation)* | | Total
Accumulated
Earnings
(Deficit) | |
| $ | 1,897,408 | | | $ | 11,013,973 | | | $ | 12,911,381 | | | $ | 62,427,812 | | | $ | 75,339,193 | | |
*The difference between the book-basis and tax-basis unrealized appreciation (depreciation) is attributable primarily to tax deferral of losses on wash sales.
During the tax year ended December 31, 2018, the Fund did not utilize capital loss carryforwards.
As of December 31, 2018, the cost basis for federal income tax purposes, gross unrealized appreciation, gross unrealized depreciation and net unrealized appreciation (depreciation) for investments were as follows:
Cost of
Investments
for Federal
Tax Purposes | | Gross
Unrealized
Appreciation | | Gross
Unrealized
Depreciation | | Net
Unrealized
Appreciation
(Depreciation) | |
| $ | 44,153,269 | | | $ | 85,974,126 | | | $ | (23,546,314 | ) | | $ | 62,427,812 | | |
8. Capital Contribution from Prior Custodian:
During 2016, the Fund received notification from the Fund's prior custodian, State Street Bank and Trust ("State Street"), concerning issues related to billing on certain categories of expenses during the approximately 16-year period from 1998 through October 31, 2014. The over-billing primarily related to categories of expenses that involved an allocation of general costs among multiple clients.
State Street paid the refunded amounts during January 2017. Based on billing information received during 2016 from State Street and an analysis of any expense limitation agreements that were in place during the period of the activities in question, including the application of any recoupment provisions in such agreements, the Adviser received a portion of the refund.
The portion of the refund retained by the Fund was accounted for as a capital contribution and is reflected on the Financial Highlights as "Capital Contribution from Prior Custodian, Net".
9. Fund Ownership:
Ownership of more than 25% of the voting securities of a fund creates presumptions of control of the fund, under section 2(a)(9) of the 1940 Act. As of December 31, 2018, the shareholders listed below held more than 25% of the shares outstanding of the Fund and may be deemed to control the Fund.
| Shareholder | | Percent | |
| GIAC | | | 100.0 | % | |
10. Recent Accounting Pronouncements:
In October 2016, the SEC released its Final Rules on Investment Company Reporting Modernization (the "Rules"). The Rules introduced two new regulatory reporting forms for investment companies,
29
Victory Variable Insurance Funds | | Notes to Financial Statements — continued
December 31, 2018 | |
Form N-PORT and Form N-CEN. The Fund's compliance date for Form N-PORT was June 1, 2018, and the Fund will make its initial filing with the SEC on Form N-PORT for the period ending March 31, 2019. Effective with the period ended June 30, 2018, the Fund was required to maintain, and make available to the SEC upon request, the information required to be included in Form N-PORT. Form N-PORT will replace Form N-Q filings effective with the requirement to file the Form N-PORT with the SEC for the period ending March 31, 2019. The Fund's compliance date for Form N-CEN was June 1, 2018, and the Fund will make its initial filing on Form N-CEN for the period ended December 31, 2018. Form N-CEN will replace Form N-SAR filings. The Fund's adoption of these amendments have no effect on the Fund's net assets or results of operations.
In August 2018, the FASB issued ASU No. 2018-13, "Fair Value Measurements" ("ASU 2018-13"). This update makes certain removals from, changes to and additions to existing disclosure requirements for fair value measurements. ASU 2018-13 does not change fair value measurements already required or permitted by existing standards. ASU 2018-13 is effective for financial statements issued for fiscal years beginning after December 15, 2019, and interim periods within those fiscal years. As permitted, the Fund has early adopted ASU 2018-13 with the financial statements prepared as of December 31, 2018.
In August 2018, the SEC adopted amendments to certain financial statement disclosure requirements to conform them to GAAP for investment companies. These amendments made certain disclosure requirements effective under Regulation S-X. The Fund's adoption of these amendments, effective with the financial statements prepared as of December 31, 2018 had no effect on the Fund's net assets or results of operations. As a result of adopting these amendments, the distributions to shareholders in the December 31, 2017 Statements of Changes in Net Assets presented herein have been reclassified to conform to the current year presentation, which includes all distributions to each class of shareholders, other than tax basis return of capital distributions, in one line item per share class. Distributions to shareholders for the year ended December 31, 2017 from net investment income and net realized gains in the Fund were as follows:
Distributions to Shareholders:
From net investment income: | | $ | (2,216,230 | ) | |
From net Realized Gains: | | | (272,843 | ) | |
11. Subsequent Events:
The Fund has evaluated the need for additional disclosures or adjustments resulting from subsequent events through the date these financial statements were issued. Based on this evaluation, there were no subsequent events to report that would have a material impact on the Fund's financial statements.
30
REPORT OF INDEPENDENT REGISTERED PUBLIC ACCOUNTING FIRM
To the Shareholders and the Board of Trustees of Victory S&P 500 Index VIP Series
Opinion on the Financial Statements
We have audited the accompanying statement of assets and liabilities of Victory S&P 500 Index VIP Series (the "Fund") (one of the funds constituting the Victory Variable Insurance Funds (the "Trust")), including the portfolio of investments, as of December 31, 2018, and the related statement of operations for the year then ended, the statements of changes in net assets for each of the two years in the period then ended, the financial highlights for each of the three years in the period then ended and the related notes (collectively referred to as the "financial statements"). In our opinion, the financial statements present fairly, in all material respects, the financial position of the Fund (one of the funds constituting the Trust) at December 31, 2018, and the results of its operations for the year then ended, the changes in its net assets for each of the two years in the period then ended and its financial highlights for each of the three years in the period then ended, in conformity with U.S. generally accepted accounting principles.
The financial highlights of the Fund for each of the periods presented through December 31, 2015 were audited by other auditors, whose report dated February 22, 2016 expressed an unqualified opinion on those financial highlights.
Basis for Opinion
These financial statements are the responsibility of the Trust's management. Our responsibility is to express an opinion on the Fund's financial statements based on our audits. We are a public accounting firm registered with the Public Company Accounting Oversight Board (United States) (PCAOB) and are required to be independent with respect to the Trust in accordance with the U.S. federal securities laws and the applicable rules and regulations of the Securities and Exchange Commission and the PCAOB.
We conducted our audits in accordance with the standards of the PCAOB. Those standards require that we plan and perform the audit to obtain reasonable assurance about whether the financial statements are free of material misstatement, whether due to error or fraud. The Trust is not required to have, nor were we engaged to perform, an audit of the Trust's internal control over financial reporting. As part of our audit we are required to obtain an understanding of internal control over financial reporting but not for the purpose of expressing an opinion on the effectiveness of the Trust's internal control over financial reporting. Accordingly, we express no such opinion.
Our audits included performing procedures to assess the risks of material misstatement of the financial statements, whether due to error or fraud, and performing procedures that respond to those risks. Such procedures included examining, on a test basis, evidence regarding the amounts and disclosures in the financial statements. Our procedures included confirmation of securities owned as of December 31, 2018, by correspondence with the custodian, transfer agent, and brokers or by other appropriate auditing procedures where replies from brokers were not received. Our audits also included evaluating the accounting principles used and significant estimates made by management, as well as evaluating the overall presentation of the financial statements. We believe that our audits provide a reasonable basis for our opinion.

We have served as the auditor of one or more Victory Capital's investment companies since 1995.
Cincinnati, Ohio
February 15, 2019
31
Victory Variable Insurance Funds | | Supplemental Information
December 31, 2018 | |
(Unaudited)
Trustee and Officer Information
Board of Trustees:
Overall responsibility for management of the Trust rests with the Board. The Trust is managed by the Board in accordance with the laws of the State of Delaware. There are currently ten Trustees, nine of whom are not "interested persons" of the Trust within the meaning of that term under the 1940 Act ("Independent Trustees") and one of whom is an "interested person" of the Trust within the meaning of that term under the 1940 Act ("Interested Trustee"). The Trustees, in turn, elect the officers of the Trust to actively supervise its day-to-day operations.
The following tables list the Trustees, their ages, position with the Trust, commencement of service, principal occupations during the past five years and any directorships of other investment companies or companies whose securities are registered under the Securities Exchange Act of 1934, as amended, or who file reports under that Act. Each Trustee oversees nine portfolios in the Trust, one portfolio in Victory Institutional Funds, 42 portfolios in Victory Portfolios and 20 portfolios in Victory Portfolios II, each a registered investment company that, together with the Trust, comprise the Victory Funds Complex. Each Trustee's address is c/o Victory Variable Insurance Funds, 4900 Tiedeman Road, 4th Floor, Brooklyn, Ohio 44144. Each Trustee has an indefinite term.
Name and Age | | Position
Held with
the Trust | | Date
Commenced
Service | | Principal Occupation
During Past 5 Years | | Other
Directorships
Held During
Past 5 Years | |
Independent Trustees. | |
David Brooks Adcock, 67 | | Trustee | | February 2005 | | Consultant (since 2006). | | Chair and Trustee, Turner Funds (December 2016-December 2017). | |
Nigel D.T. Andrews, 71 | | Vice Chair and Trustee | | August 2002 | | Retired. | | Director, TCG BDC II, Inc. (since 2017); Director, TCG BDC I, Inc. (formerly Carlyle GMS Finance, Inc.) (since 2012); Director, Old Mutual US Asset Management (2002-2014). | |
E. Lee Beard, 67* | | Trustee | | February 2005 | | Retired (since 2015); Consultant, The Henlee Group, LLC (consulting) (2005-2015). | | None. | |
Dennis M. Bushe, 75 | | Trustee | | July 2016 | | Retired. | | Trustee, RS Investment Trust and RS Variable Products Trust (November 2011-July 2016). | |
32
Victory Variable Insurance Funds | | Supplemental Information — continued
December 31, 2018 | |
(Unaudited)
Name and Age | | Position
Held with
the Trust | | Date
Commenced
Service | | Principal Occupation
During Past 5 Years | | Other
Directorships
Held During
Past 5 Years | |
Sally M. Dungan, 64 | | Trustee | | February 2011 | | Chief Investment Officer, Tufts University (since 2002). | | None. | |
John L. Kelly, 65 | | Trustee | | February 2015 | | Partner, McCarvill Capital Partners (September 2016-September 2017); Advisor (January 2016-April 2016) and Managing Partner (August 2014-January 2016), Endgate Commodities LLC; Chief Operating Officer, Liquidnet Holdings, Inc. (2011-2014). | | Director, Caledonia Mining Corporation (since May 2012). | |
David L. Meyer, 61* | | Trustee | | December
2008 | | Retired. | | None. | |
Gloria S. Nelund, 57 | | Trustee | | July 2016 | | Chair, CEO and Co-Founder of TriLinc Global, LLC, an investment firm. | | TriLinc Global Impact Fund, LLC (since 2012); Trustee, RS Investment Trust and RS Variable Products Trust (November 2007-July 2016). | |
Leigh A. Wilson, 74 | | Chair and Trustee | | February 1998 | | Private Investor. | | Chair (since 2013), Caledonia Mining Corporation. | |
Interested Trustee. | |
David C. Brown, 46** | | Trustee | | May 2008 | | Chairman and Chief Executive Officer (since 2013), Co-Chief Executive Officer (2011-2013), the Adviser; Chairman and Chief Executive Officer, Victory Capital Holdings, Inc. (since 2013). | | None. | |
* The Board has designated Mr. Meyer and Ms. Beard as its Audit Committee Financial Experts.
** Mr. Brown is an "Interested Person" by reason of his relationship with the Adviser.
The Statement of Additional Information includes additional information about the Trustees of the Trust and is available, without charge, by calling 800-539-3863.
33
Victory Variable Insurance Funds | | Supplemental Information — continued
December 31, 2018 | |
(Unaudited)
Officers:
The officers of the Trust, their ages, commencement of service and their principal occupations during the past five years, are detailed in the following table. Each officer serves until the earlier of his or her resignation, removal, retirement, death, or the election of a successor. The mailing address of each officer of the Trust is 4900 Tiedeman Road, 4th Floor, Brooklyn, Ohio 44144. The officers of the Trust receive no compensation directly from the Trust for performing the duties of their offices.
Name and Age | | Position with
the Trust | | Date
Commenced
Service | | Principal Occupation During Past 5 Years | |
Christopher K. Dyer, 57 | | President | | February 2006* | | Director of Mutual Fund Administration, the Adviser. | |
Scott A. Stahorsky, 49 | | Vice President | | December 2014 | | Manager, Fund Administration, the Adviser (since 2015); Senior Analyst, Fund Administration, the Adviser (prior to 2015). | |
Erin G. Wagner, 45 | | Secretary | | December 2014 | | Associate General Counsel, the Adviser (since 2013). | |
Allan Shaer, 53 | | Treasurer | | May 2017 | | Senior Vice President, Financial Administration, Citi Fund Services Ohio, Inc. (since 2016); Vice President, Mutual Fund Administration, JP Morgan Chase (2011-2016). | |
Christopher A. Ponte, 34 | | Assistant Treasurer | | December 2017 | | Manager, Fund Administration, the Adviser (since 2017); Senior Analyst, Fund Administration, the Adviser (prior to 2017); Chief Financial Officer, Victory Capital Advisers, Inc. (since 2018). | |
Colin Kinney, 45 | | Chief Compliance Officer | | July 2017 | | Chief Compliance Officer (since 2013) and Chief Risk Officer (2009-2017), the Adviser. | |
Chuck Booth, 58 | | Anti-Money Laundering Compliance Officer and Identity Theft Officer | | May 2015 | | Director, Regulatory Administration and CCO Support Services, Citi Fund Services Ohio, Inc. | |
Jay G. Baris, 65 | | Assistant Secretary | | February 1998 | | Partner, Shearman & Sterling LLP (since 2018); Partner, Morrison & Foerster LLP (2011-2017). | |
* On December 3, 2014, Mr. Dyer resigned as Secretary of the Trust and accepted the position of President.
34
Victory Variable Insurance Funds | | Supplemental Information — continued
December 31, 2018 | |
(Unaudited)
Proxy Voting and Form N-Q Information
Proxy Voting:
Information regarding the policies and procedures that the Fund uses to determine how to vote proxies relating to portfolio securities is available without charge, upon request, by calling 800-539-3863. The information is also included in the Fund's Statement of Additional Information, which is available on the SEC's website at www.sec.gov.
Information relating to how the Fund voted proxies relating to portfolio securities held during the most recent twelve months ended June 30 is available on the SEC's website at www.sec.gov.
Availability of Schedules of Portfolio Investments:
The Trust expects to file a complete list of Schedules of Portfolio Investments with the SEC for the first and third quarter of each fiscal year on Form N-PORT beginning March 1, 2019. Prior to that date, the Trust has filed a complete list of Schedules of Portfolio Investments with the SEC for the first and third quarters of each fiscal year on Form N-Q. Forms N-PORT and Forms N-Q are available on the SEC's website at www.sec.gov.
Expense Examples
As a shareholder of the Fund, you may incur two types of costs: (1) transaction costs and (2) ongoing costs, including management fees, distribution and service (12b-1) fees, and other Fund expenses. These examples are intended to help you understand your ongoing costs (in dollars) of investing in the Fund and to compare these costs with the ongoing costs of investing in other mutual funds.
These examples are based on an investment of $1,000 invested at the beginning of the period and held for the entire period from July 1, 2018 through December 31, 2018.
The Actual Expense figures in the table below provide information about actual account values and actual expenses. You may use the information below, together with the amount you invested, to estimate the expenses that you paid over the period. Simply divide your account value by $1,000 (for example, an $8,600 account value divided by $1,000 = 8.6), then multiply the result by the number in the table under the heading entitled "Actual Expenses Paid During Period" to estimate the expenses you paid on your account during this period.
The Hypothetical Expense figures in the table below provide information about hypothetical account values and hypothetical expenses based on the Fund's actual expense ratio and an assumed rate of return of 5% per year before expenses, which is not the Fund's actual return. The hypothetical account values and expenses may not be used to estimate the actual ending account balance or expenses you paid for the period. You may use this information to compare this 5% hypothetical example with the 5% hypothetical examples that appear in shareholder reports of other funds.
Please note the expenses shown in the table are meant to highlight your ongoing costs only and do not reflect any transactional costs. Therefore, the table is useful in comparing ongoing costs only, and will not help you determine the relative total costs of owning different funds. In addition, if these transactional costs were included, your costs would have been higher.
Beginning
Account Value
7/1/18 | | Actual
Ending
Account Value
12/31/18 | | Hypothetical
Ending
Account Value
12/31/18 | | Actual
Expenses Paid
During Period
7/1/18-12/31/18* | | Hypothetical
Expenses Paid
During Period
7/1/18-12/31/18* | | Annualized
Expense Ratio
During Period
7/1/18-12/31/18 | |
| $ | 1,000.00 | | | $ | 930.60 | | | $ | 1,023.79 | | | $ | 1.36 | | | $ | 1.43 | | | | 0.28 | % | |
* Expenses are equal to the average account value multiplied by the Fund's annualized expense ratio multiplied by 184/365 (the number of days in the most recent fiscal half-year divided by the number of days in the fiscal year).
35
Victory Variable Insurance Funds | | Supplemental Information — continued
December 31, 2018 | |
(Unaudited)
Additional Federal Income Tax Information
For the year ended December 31, 2018, the Fund paid qualified dividend income for purposes of reduced individual federal income tax rates of 99%.
Dividends qualifying for corporate dividends received a deduction of 98%.
For the year ended December 31, 2018, the Fund designated short-term and long-term capital gain distributions in the amount of $194,292 and $7,113,149, respectively.
36
Victory Variable Insurance Funds | | Supplemental Information — continued
December 31, 2018 | |
(Unaudited)
Considerations of the Board in Continuing the Investment Advisory Agreement (the "Agreement")
The Board approved the Agreement on behalf of the Series at a meeting, which was called for that purpose, on December 5, 2018. The Board also considered information relating to the Series and the Agreement provided throughout the year and, more specifically, at a meeting on October 23, 2018. The Board noted that prior to the Series' reorganization on July 29, 2016, the Series was managed by RS Investment Management Co. LLC, which was acquired by the Adviser on July 29, 2016. In considering whether to approve the Agreement, the Board requested, and the Adviser provided, information that the Board believed to be reasonably necessary to reach its conclusions. The Board, including the Independent Trustees, evaluated this information along with other information obtained throughout the year and was advised by legal counsel to the Series and by independent legal counsel to the Independent Trustees. In addition, in 2017 the Independent Trustees, through their counsel, retained an independent consultant to assist with a review of the overall process for conducting the annual review of these advisory arrangements. The Board considered the Series' advisory fee, expense ratio and investment performance as significant factors in determining whether the Agreement should be continued. In considering whether the compensation paid to the Adviser was fair and reasonable, the Board also evaluated, among other things, the following factors:
• The requirements of the Series for the services provided by the Adviser;
• The nature, quality and extent of the services provided and expected to be provided;
• The performance of the Series as compared to comparable funds;
• The fees payable for the services and whether the fee arrangements provided for economies of scale that would benefit Series shareholders as the Series grows;
• Whether the fee would be sufficient to enable the Adviser to attract and retain experienced personnel and continue to provide quality services to the Series;
• Fees paid by other clients of the Adviser whose accounts are managed in a similar investment style and any differences in the services provided to the other clients compared to those provided to the Series;
• Total expenses of the Series, taking into consideration any distribution or shareholder servicing fees;
• Management's commitment to operating the Series at competitive expense levels;
• The profitability of the Adviser (as reflected by comparing fees earned against an estimate of the Adviser's costs) with respect to the Adviser's relationship with the Series;
• Research and other service benefits received by the Adviser obtained through payment of client commissions for securities transactions;
• Other benefits received by the Adviser, and its affiliates, including revenues paid to the Adviser, or its affiliates, by the Series for administration and fund accounting services, and distribution;
• The capabilities and financial condition of the Adviser;
• Current economic and industry trends; and
• The historical relationship between the Series and the Adviser.
The Board reviewed the Series' current management fee, comprised of the advisory fee plus the administrative services fee paid to the Adviser, in the context of the Adviser's profitability of the Series. In addition, the Board compared the Series' total operating expense ratio on a net and gross basis, taking into consideration any distribution or shareholder servicing fees and management fees with a universe of comparable mutual funds compiled by an independent consultant, FUSE Research Network, LLC ("FUSE"), and a peer group of funds with similar investment strategies selected by FUSE from the universe. The Board reviewed the factors and methodology used by FUSE in the selection of the Series' peer group, including FUSE's selection of a broad universe of funds using the standard Retail Morningstar Categories, the more specific universe of comparable funds, and peer groups of funds with comparable investment strategies and asset levels, among other factors. The Board also reviewed any changes to FUSE's methodology as compared to the prior year, including as a result of input from the Adviser, if any. The Board also reviewed fees and other information related to the Adviser's management of similarly managed institutional or private accounts, and the differences in the services provided to the other accounts, to the extent applicable. The Board noted that the advisory fee arrangements
37
Victory Variable Insurance Funds | | Supplemental Information — continued
December 31, 2018 | |
(Unaudited)
for the Series do not include breakpoints, which are generally viewed as a method by which the investment adviser shares any economies of scale with a fund as a fund grows. The Board also considered the Adviser's commitment to limit expenses as discussed in more detail below.
The Board reviewed the Series' performance over one-, three-, five- and ten-year periods against the performance of the Series' selected peer group and benchmark index, noting that the Series' investment objective is to track its benchmark index before fees and expenses. The Board recognized that the performance of the Series is net of expenses, while the performance of the benchmark index is gross returns and as a result, the Series generally will underperform its benchmark index due to fees and expenses. The Board considered the Series' tracking error as a factor in evaluating performance. The Board also considered the additional resources that the Adviser has committed to enhance portfolio analysis, compliance and trading systems.
The Board reviewed various other specific factors with respect to the Series, as described below. In their deliberations, the Trustees did not rank the importance of any particular information or factor considered and each Trustee may have attributed different weights to various factors.
The Board concluded that the Series' gross annual management fee was reasonable as compared to the median gross management fee charged to the funds in the Series' peer group. The Board noted that the Series' net annual expense ratio, taking into account any shareholder servicing or distribution fees, was reasonable as compared to the median expense ratio for the peer group. The Board considered the Adviser's contractual agreement to waive its fees and reimburse expenses for a specified period of time, as described in the Series' prospectus. The Board then compared the Series' performance for the one-, three-, five- and ten-year periods ended June 30, 2018, to that of the median performance of the peer group and benchmark index for the same periods and considered the fact that the Series underperformed the benchmark index for all of the periods reviewed, and outperformed the peer group for all of the periods reviewed.
Having considered, among other things: (1) that the Series' management fee was within the ranges of advisory fees charged to comparable mutual funds; (2) that the Series' total expense ratio was reasonable; (3) the Adviser's willingness to limit the expenses for a period of time would provide stability to the Series' expenses during that period; and (4) the performance of the Series, the Board concluded that the Agreement continued to be in the best interests of the Series' shareholders.
The Board noted that the Adviser's investment management team replaced the predecessor fund's investment sub-adviser as portfolio managers for the Series upon completion of the Series' reorganization.
Conclusion
Based on its review of the information requested and provided, and following extended discussions, the Board determined that the Agreement, on behalf of the Series, was consistent with the best interests of the Series and its shareholders, and the Board unanimously approved the Agreement, on behalf of the Series, for an additional annual period on the basis of the foregoing review and discussions and the following considerations, among others:
• The fairness and reasonableness of the investment advisory fee payable to the Adviser under the Agreement in light of the investment advisory services provided, the costs of these services, the profitability of the Adviser's relationship with the Series and the comparability of the fee paid to the fees paid by other investment companies;
• The nature, quality and extent of the investment advisory services provided by the Adviser;
• The Adviser's entrepreneurial commitment to the management of the Series and the creation of a broad-based family of funds, which could entail a substantial commitment of the Adviser's resources to the successful operation of the Series;
• The Adviser's representations regarding its staffing and capabilities to manage the Series, including the retention of personnel with relevant portfolio management experience;
• The Adviser's efforts to enhance investment results by, among other things, developing quality portfolio management teams; and
• The overall high quality of the personnel, operations, financial condition, investment management capabilities, methodologies and performance of the Adviser.
38
Privacy Policy
Protecting the Privacy of Information
The Trust respects your right to privacy. We also know that you expect us to conduct and process your business in an accurate and efficient manner. To do so, we must collect and maintain certain personal information about you. This is the information we collect from you on applications or other forms, and from the transactions you make with us or third parties. It may include your name, address, social security number, account transactions and balances, and information about investment goals and risk tolerance.
We do not disclose any information about you or about former customers to anyone except as permitted or required by law. Specifically, we may disclose the information we collect to companies that perform services on our behalf, such as the transfer agent that processes shareholder accounts and printers and mailers that assist us in the distribution of investor materials. We may also disclose this information to companies that perform marketing services on our behalf. This allows us to continue to offer you Victory investment products and services that meet your investing needs, and to effect transactions that you request or authorize. These companies will use this information only in connection with the services for which we hired them. They are not permitted to use or share this information for any other purpose.
To protect your personal information internally, we permit access only by authorized employees and maintain physical, electronic and procedural safeguards to guard your personal information.*
* You may have received communications regarding information about privacy policies from other financial institutions which gave you the opportunity to "opt-out" of certain information sharing with companies which are not affiliated with that financial institution. The Trust does not share information with other companies for purposes of marketing solicitations for products other than the Trust. Therefore, the Trust does not provide opt-out options to their shareholders.
Victory Funds
P.O. Box 182593
Columbus, Ohio 43218-2593

Visit our website at: | | Call Victory at: | |
www.vcm.com | | 800-539-FUND (800-539-3863) | |
VVIF-RS-SPIVIP-AR (12/18)

December 31, 2018
Annual Report
Victory Variable Insurance Funds
Victory Sophus Emerging Markets VIP Series
Beginning on January 1, 2021, as permitted by regulations adopted by the Securities and Exchange Commission, paper copies of the Victory Funds' shareholder reports will no longer be sent by mail, unless you specifically request paper copies of the reports from the Victory Funds or from your financial intermediary, such as a broker-dealer or bank. Instead, the reports will be made available on www.VictoryFunds.com, and you will be notified by mail each time a report is posted and provided with a website link to access the report. If you already elected to receive shareholder reports electronically, you will not be affected by this change, and you need not take any action.
You may elect to receive shareholder reports and other communications from the Victory Funds or your financial intermediary electronically sooner than January 1, 2021 by notifying your financial intermediary directly or, if you are a direct investor, by calling 800-539-3863 or by sending an e-mail request to TA.Processing@FISGlobal.com.
You may elect to receive all future reports in paper free of charge. If you invest through a financial intermediary, you can contact your financial intermediary to request that you continue to receive paper copies of your reports. If you invest directly with the Victory Funds, you can call 800-539-3863 or send an e-mail request to TA.Processing@FISGlobal.com. Your election to receive reports in paper will apply to all Victory Funds you hold directly or through your financial intermediary.
www.vcm.com
News, Information And Education 24 Hours A Day, 7 Days A Week
The Victory Funds site gives fund shareholders, prospective shareholders, and investment professionals a convenient way to access fund information, get guidance, and track fund performance anywhere they can access the Internet. The site includes:
• Detailed performance records
• Daily share prices
• The latest fund news
• Investment resources to help you become a better investor
• A section dedicated to investment professionals
Whether you're a potential investor searching for the fund that matches your investment philosophy, a seasoned investor interested in planning tools, or an investment professional, www.vcm.com has what you seek. Visit us anytime. We're always open.
Victory Variable Insurance Funds
Table of Contents
Shareholder Letter (Unaudited) | | | 3 | | |
Fund Review and Commentary (Unaudited) | | | 4 | | |
Financial Statements | |
Schedule of Portfolio Investments | | | 7 | | |
Statement of Assets and Liabilities | | | 14 | | |
Statement of Operations | | | 15 | | |
Statements of Changes in Net Assets | | | 16 | | |
Financial Highlights | | | 17 | | |
Notes to Financial Statements | | | 18 | | |
Report of Ernst & Young LLP,
Independent Registered Public Accounting Firm | | | 27 | | |
Supplemental Information (Unaudited) | |
Trustee and Officer Information | | | 28 | | |
Proxy Voting and Form N-Q Information | | | 31 | | |
Expense Examples | | | 31 | | |
Additional Federal Income Tax Information | | | 32 | | |
Advisory Contract Renewal | | | 33 | | |
Privacy Policy (inside back cover) | | | |
The Fund is distributed by Victory Capital Advisers, Inc. Victory Capital Management Inc. is the investment adviser to the Fund and receives fees from the Fund for performing services for the Fund.
This report is not authorized for distribution to prospective investors unless preceded or accompanied by a current prospectus of the Fund.
For additional information about any Victory Fund, including fees, expenses, and risks, view our prospectus online at www.vcm.com or call 800-539-3863. Read it carefully before you invest or send money.
The information in this annual report is based on data obtained from recognized services and sources and is believed to be reliable. Any opinions, projections, or recommendations in this report are subject to change without notice and are not intended as individual investment advice. Past investment performance of the Fund, markets or securities mentioned herein should not be considered to be indicative of future results.
• NOT FDIC INSURED • NO BANK GUARANTEE
• MAY LOSE VALUE

Call Victory at:
800-539-FUND (800-539-3863)
Visit our website at:
www.vcm.com
1
This page is intentionally left blank.
2
Victory Funds Letter to Shareholders
Dear Shareholder,
What a difference a year makes. The year ended December 31, 2018, was marked by an abrupt return of volatility, which had largely been missing in action for years. Consider the range of highs and lows we witnessed. For the S&P 500 Index, it was a year in which we celebrated an all-time high in late summer, only to be followed by the worst December since the 2008 financial crisis. And if that wasn't enough volatility, the Dow Jones Industrial Average also registered several of its worst-ever, single-day point declines during 2018.
Through all that the S&P 500 clocked in with its first negative annual return since 2008, falling by 4.4 percent. Given the risk-off sentiment that was obvious as the year drew to a close, it's no surprise that small-cap stocks, as measured by the Russell 2000 Index, fared even worse, falling approximately 11.0 percent for the year. The challenges for equity investors were also evident around the world as the MSCI ACWI and Emerging Markets indexes declined 8.9 and 14.3 percent, respectively.
So what ushered in the renewed era of volatility and these challenging times? There were multiple culprits. For starters, trade tensions ratcheted up throughout the year as anti-global rhetoric bloomed into a series of new tariffs, which sparked concerns of a prolonged trade war with China. The Federal Reserve remained persistent in its monetary tightening, raising the benchmark interest rate four times throughout the year to a range of 2.25 to 2.5 percent. And then the year ended with a partial shutdown of the federal government. These factors conspired to elevate concerns of a possible recession here and abroad.
Yet despite the headline risks, we think it's critically important to remain focused on the data. By all accounts, the U.S. economy continued chugging along in 2018 with a real gross domestic product (GDP) rising 3.4 percent in the third quarter of 2018, the latest figures available from the Bureau of Economic Analysis. Moreover, the labor picture continues to shine with consistent monthly job growth and an unemployment rate of 3.9 percent. All this comes against a backdrop of low inflation and solid corporate earnings.
The markets, it appears, have been vacillating between the dire headlines and higher perceived risks on one hand, and the continued positive economic data on the other. Of course, no one knows where the Fed will stop raising rates, nor is there any certainty on how the trade turmoil ultimately gets resolved. For now, however, we continue to embrace our solid economic fundamentals. Moreover, we believe all of Victory Capital's independent investment franchises are well positioned to take advantage of any short-term valuation dislocations resulting from the current era of heightened volatility.
On the following pages, you will find information relating to your Victory Funds investment. If you have any questions, we encourage you to contact your financial advisor. Or, if you invest with us directly, you may call (800) 539-3863, or visit our website at www.vcm.com.
My colleagues and I sincerely appreciate the confidence you have placed in the Victory Funds, and we value the opportunity to help meet your investment goals.

Christopher K. Dyer, CFA
President,
Victory Funds
3
Victory Variable Insurance Funds
Victory Sophus Emerging Markets VIP Series
Portfolio Holdings
As a Percentage of Total Investments
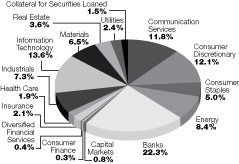
Commentary
The Victory Sophus Emerging Markets VIP Series ("Fund") seeks to provide long-term capital appreciation. The Fund underperformed the MSCI Emerging Markets Index (Net) for the twelve-month period ended December 31, 2018. Emerging markets equities were under pressure for the better part of the year, as the strengthening U.S. dollar, global trade tensions, and tightening financial conditions created significant headwinds for the asset class. Sophus Capital employs a disciplined, bottom-up approach utilizing both quantitative and fundamental processes to invest in businesses that we believe have superior and sustainable earnings growth at attractive valuations, with revisions as the catalyst. By investing in companies with these characteristics, coupled with our risk-managed approach, we seek to provide a more consistent return pattern over time.
Market Overview
The year opened up strong with persistent and pervasive growth around the globe pushing equities higher and contributing to a strong risk on mode. However, as we got further into the year, a stronger U.S. dollar, a more hawkish Federal Reserve with the yield on the U.S. 10-year Treasury bond eclipsing 3%, the U.S./China trade war escalation, the Turkish and Argentinian currency crises causing fear of contagion across emerging markets, and concerns of slowing growth in China all contributed to a rapid and deep sell-off in emerging markets equities in the middle of the year. Slowing global growth fears grew as it became apparent that the economic growth in the U.S. was not translating globally. These fears escalated with the heightening of the U.S./China trade war mid-year. Global equities experienced a major risk-off episode in October with the worst sell-off since 2012, with emerging markets underperforming. China was among the biggest influencers of the direction of emerging markets for the month as soft macro data, including lower manufacturing and GDP numbers, appeared to confirm fears of an economic slowdown there. Supportive measures announced by the Chinese government and central bank officials, such as a cut in the reserve requirement ratio and the proposal of personal tax cuts, did very little to alleviate these concerns. Rising interest rates, with the yield on the 10-year U.S. Treasury bond hitting the highest point since 2011, and the continued strength in the U.S. dollar also continued to weigh on the asset class. A rally in late November and in to December on growing optimism of a trade deal, and a more dovish Fed helped emerging markets equities recover some, but not all, of their losses.
Performance Update
The Fund was down 18.97% versus the MSCI Emerging Market Index (net), which was down 14.58%.
4
Victory Variable Insurance Funds
Victory Sophus Emerging Markets VIP Series (continued)
Portfolio Review
By sectors, the largest detractor from performance was stock selection in financials. The largest contributor to relative performance was stock selection in consumer staples. By country, the largest detractor was stock selection in South Korea. The largest contributor was stock selection in Brazil.
Outlook
2018 was a difficult year in emerging markets, to say the least. There was no shortage of headwinds for the asset class, including a stronger dollar. However, there is much to be optimistic about emerging markets for 2019. For starters, we expect the U.S. dollar to weaken, after rising 4.40% in 2018. We see the issues that boosted the dollar last year, namely stronger economic growth in the U.S. and higher interest rates, moderating in 2019 as fiscal stimulus measures have essentially played themselves out. Yet, a weaker dollar is not the only reason for our optimism. We believe the media attention about China's growth declining and the "loss of confidence" by the consumer is overblown. While recent retail sales figures are down, excluding autos, retail sales have been stable, while growth in the consumption of services is skyrocketing. Regarding the U.S./China trade dispute, as of this writing the trade truce that was agreed upon at the G20 meetings in December is ongoing (until March 1, 2019), and it appears the negotiations are moving in a favorable direction. While it is difficult to predict the ultimate outcome of the negotiations, even a partial resolution, or at least a stabilization of tariffs, would be viewed favorably by the markets.
Fundamentals continue to be positive across emerging markets, with country balance sheets still in relatively good shape. Corporate earnings growth continues to be healthy, as we are looking for 10%-12% for 2019 and is expected to eclipse earnings growth in the U.S. where the favorable impacts of the tax changes are rolling off. The emerging markets economic growth premium over developed markets contracted in 2018, but we expect that to widen again in 2019. Furthermore, valuations across emerging markets are attractive and roughly 15% below the mean, with the cyclically adjusted price to earnings ratio at roughly 30% below its historical average — a level last seen in late 2016. Finally, the secular trends in emerging markets remain intact with improving demographics and a rising middle class. All of this makes for a compelling reason to own emerging markets as part of a well-diversified portfolio. We continue to find attractive opportunities with the characteristics we seek — superior earnings growth at attractive valuations with revisions as the catalyst.
5
Victory Variable Insurance Funds
Victory Sophus Emerging Markets VIP Series (continued)
Average Annual Return
Year Ended December 31, 2018
| | Class I | |
Inception Date | | 10/17/94 | |
| | | Net Asset
Value | | MSCI Emerging Markets
Index (Net)1 | |
One Year | | | –18.97 | % | | | –14.58 | % | |
Three Year | | | 8.91 | % | | | 9.25 | % | |
Five Year | | | 1.65 | % | | | 1.65 | % | |
Ten Year | | | 8.20 | % | | | 8.02 | % | |
Since Inception | | | 6.95 | % | | | N/A | | |
Expense Ratios
Gross | | | 1.33 | % | |
With Applicable Waivers | | | 1.33 | % | |
Past performance is not indicative of future results. The performance data quoted represents past performance and current returns may be lower or higher. The investment return and principal value will fluctuate so that an investor's shares, when redeemed, may be worth more or less than the original cost. To obtain performance information current to the most recent month's end, please visit www.vcm.com.
The above expense ratios are from the Fund's prospectus dated May 1, 2018 (supplemented on June 29, 2018). Additional information pertaining to the Fund's expense ratios as of December 31, 2018 can be found in the financial highlights.
The total return figures set forth above include all waivers of fees for various periods since inception. Without such fee waivers, the total returns would have been lower. Some fee waivers are voluntary and may be modified or terminated at any time. The total returns do not include any insurance, sales or administrative charges of variable annuity or life insurance contracts. If these charges were included, the total returns would have been lower.
Victory Sophus Emerging Markets VIP Series — Growth of $10,000

1The MSCI Emerging Markets Index (Net) is a free float-adjusted market capitalization index that is designed to measure equity performance of emerging markets. The index reflects the reinvestment of dividends paid on the stocks constituting the index net of withholding taxes. You may not invest in the index and, unlike the Fund, the index does not incur fees or expenses. It is not possible to invest directly in an index.
The graph reflects investment of growth of a hypothetical $10,000 investment in the Fund. Past performance is no guarantee of future results.
The graph and table do not reflect the deduction of taxes that a shareholder would pay on Fund distributions or the redemption of Fund shares.
6
Victory Variable Insurance Funds
Victory Sophus Emerging Markets VIP Series | | Schedule of Portfolio Investments
December 31, 2018 | |
Security Description | | Shares | | Fair
Value(a) | |
Common Stocks (96.9%) | |
Australia (0.6%): | |
Materials (0.6%): | |
BHP Billiton Ltd., ADR (b) | | | 5,212 | | | $ | 251,688 | | |
Brazil (7.6%): | |
Communication Services (0.5%): | |
TIM Participacoes SA | | | 74,200 | | | | 226,682 | | |
Consumer Discretionary (2.0%): | |
Construtora Tenda SA | | | 30,200 | | | | 249,759 | | |
Lojas Renner SA | | | 33,600 | | | | 366,609 | | |
Tupy SA | | | 44,300 | | | | 229,827 | | |
| | | | 846,195 | | |
Energy (1.4%): | |
Petroleo Brasileiro SA, ADR | | | 44,471 | | | | 578,568 | | |
Financials (1.5%): | |
Banco Bradesco SA, ADR | | | 63,342 | | | | 626,452 | | |
Health Care (0.6%): | |
Odontoprev SA | | | 77,000 | | | | 272,829 | | |
Materials (0.9%): | |
Vale SA, ADR | | | 28,995 | | | | 382,444 | | |
Real Estate (0.7%): | |
Multiplan Empreendimentos Imobiliarios SA | | | 43,800 | | | | 274,486 | | |
| | | | 3,207,656 | | |
Chile (0.4%): | |
Energy (0.4%): | |
Empresas COPEC SA | | | 13,055 | | | | 157,219 | | |
China (23.9%): | |
Communication Services (7.5%): | |
Autohome, Inc., ADR | | | 2,065 | | | | 161,545 | | |
Baidu, Inc., ADR (c) | | | 2,279 | | | | 361,449 | | |
NetEase, Inc., ADR | | | 1,093 | | | | 257,260 | | |
Tencent Holdings Ltd. | | | 59,730 | | | | 2,394,152 | | |
| | | | 3,174,406 | | |
Consumer Discretionary (3.7%): | |
Alibaba Group Holding Ltd., ADR (c) | | | 10,031 | | | | 1,374,949 | | |
JNBY Design Ltd. | | | 138,500 | | | | 194,127 | | |
| | | | 1,569,076 | | |
Consumer Staples (1.7%): | |
Ausnutria Dairy Corp. Ltd. (b) | | | 184,000 | | | | 206,614 | | |
Chlitina Holding Ltd. | | | 25,000 | | | | 209,255 | | |
Want China Holdings Ltd. | | | 441,000 | | | | 308,574 | | |
| | | | 724,443 | | |
See notes to financial statements.
7
Victory Variable Insurance Funds
Victory Sophus Emerging Markets VIP Series | | Schedule of Portfolio Investments — continued
December 31, 2018 | |
Security Description | | Shares | | Fair
Value(a) | |
Energy (0.7%): | |
PetroChina Co. Ltd. | | | 506,000 | | | $ | 313,991 | | |
Financials (6.7%): | |
China Construction Bank Corp. | | | 1,366,638 | | | | 1,119,148 | | |
Industrial & Commercial Bank of China Ltd. | | | 1,147,000 | | | | 815,867 | | |
Ping An Insurance Group Co. of China Ltd. | | | 101,000 | | | | 891,080 | | |
| | | | 2,826,095 | | |
Health Care (0.3%): | |
3SBio, Inc. (d) | | | 94,000 | | | | 120,179 | | |
Industrials (1.4%): | |
China Railway Construction Corp. Ltd. | | | 429,000 | | | | 595,905 | | |
Materials (1.0%): | |
Anhui Conch Cement Co. Ltd. | | | 92,500 | | | | 447,338 | | |
Utilities (0.9%): | |
ENN Energy Holdings Ltd. | | | 41,000 | | | | 364,422 | | |
| | | | 10,135,855 | | |
Greece (0.8%): | |
Communication Services (0.5%): | |
Hellenic Telecommunications Organization SA | | | 19,292 | | | | 210,465 | | |
Industrials (0.3%): | |
Mytilineos Holdings SA | | | 14,765 | | | | 123,013 | | |
| | | | 333,478 | | |
Hong Kong (7.6%): | |
Communication Services (1.3%): | |
China Mobile Ltd. | | | 55,000 | | | | 532,247 | | |
Consumer Discretionary (1.1%): | |
Pacific Textiles Holdings | | | 259,000 | | | | 230,190 | | |
Xinyi Glass Holdings Ltd. | | | 198,000 | | | | 218,735 | | |
| | | | 448,925 | | |
Energy (1.0%): | |
CNOOC Ltd. | | | 281,000 | | | | 432,858 | | |
Health Care (0.4%): | |
CSPC Pharmaceutical Group Ltd. (b) | | | 132,000 | | | | 189,494 | | |
Industrials (1.1%): | |
NWS Holdings Ltd. | | | 236,000 | | | | 484,627 | | |
Information Technology (0.3%): | |
Kingboard Laminates Holdings Ltd. | | | 174,000 | | | | 143,741 | | |
Real Estate (2.4%): | |
China Resources Land Ltd. | | | 88,000 | | | | 338,529 | | |
Shimao Property Holdings Ltd. | | | 248,500 | | | | 661,900 | | |
| | | | 1,000,429 | | |
| | | | 3,232,321 | | |
See notes to financial statements.
8
Victory Variable Insurance Funds
Victory Sophus Emerging Markets VIP Series | | Schedule of Portfolio Investments — continued
December 31, 2018 | |
Security Description | | Shares | | Fair
Value(a) | |
Hungary (0.6%): | |
Financials (0.6%): | |
OTP Bank Public Co. Ltd. | | | 6,451 | | | $ | 260,918 | | |
India (8.3%): | |
Consumer Discretionary (0.7%): | |
Mahindra & Mahindra Ltd. | | | 25,274 | | | | 290,836 | | |
Consumer Staples (0.9%): | |
Nestle India Ltd. | | | 2,299 | | | | 364,817 | | |
Energy (1.6%): | |
Reliance Industries Ltd. | | | 41,784 | | | | 670,666 | | �� |
Financials (0.7%): | |
Cholamandalam Investment and Finance Co. Ltd. | | | 7,463 | | | | 134,582 | | |
Indusind Bank Ltd. | | | 7,578 | | | | 173,538 | | |
| | | | 308,120 | | |
Industrials (1.3%): | |
Larsen & Toubro Ltd. | | | 26,698 | | | | 549,459 | | |
Information Technology (1.7%): | |
HCL Technologies Ltd. | | | 22,701 | | | | 313,725 | | |
Infosys Technologies, ADR | | | 44,512 | | | | 423,754 | | |
| | | | 737,479 | | |
Materials (0.6%): | |
Tata Steel Ltd. | | | 34,121 | | | | 254,448 | | |
Utilities (0.8%): | |
Mahanagar Gas Ltd. | | | 25,199 | | | | 326,133 | | |
| | | | 3,501,958 | | |
Indonesia (3.0%): | |
Consumer Discretionary (1.1%): | |
PT Astra International TBK | | | 415,300 | | | | 238,005 | | |
PT Sri Rejeki Isman TBK | | | 8,956,900 | | | | 223,798 | | |
| | | | 461,803 | | |
Consumer Staples (0.7%): | |
PT Indofood CBP Sukses Makmur TBK | | | 370,900 | | | | 269,964 | | |
Financials (1.2%): | |
PT Bank Negara Indonesia Persero TBK | | | 842,100 | | | | 516,711 | | |
| | | | 1,248,478 | | |
Korea, Republic Of (13.7%): | |
Communication Services (0.5%): | |
LG Uplus Corp. | | | 14,160 | | | | 223,807 | | |
See notes to financial statements.
9
Victory Variable Insurance Funds
Victory Sophus Emerging Markets VIP Series | | Schedule of Portfolio Investments — continued
December 31, 2018 | |
Security Description | | Shares | | Fair
Value(a) | |
Consumer Discretionary (3.0%): | |
Fila Korea Ltd. | | | 8,246 | | | $ | 398,334 | | |
Hotel Shilla Co. Ltd. (b) | | | 3,998 | | | | 274,256 | | |
LG Electronics, Inc. | | | 6,008 | | | | 336,918 | | |
Youngone Corp. | | | 6,803 | | | | 234,315 | | |
| | | | 1,243,823 | | |
Consumer Staples (0.4%): | |
Neopharm Co. Ltd. (c) | | | 4,500 | | | | 181,851 | | |
Energy (0.6%): | |
SK Innovation Co. Ltd. | | | 1,558 | | | | 250,104 | | |
Financials (2.1%): | |
Hana Financial Group, Inc. | | | 9,983 | | | | 324,705 | | |
KB Financial Group, Inc. | | | 13,745 | | | | 573,449 | | |
| | | | 898,154 | | |
Industrials (1.6%): | |
Doosan Infracore Co. Ltd. (c) | | | 41,587 | | | | 283,351 | | |
Samsung Engineering Co., Ltd. (c) | | | 25,416 | | | | 401,418 | | |
| | | | 684,769 | | |
Information Technology (5.5%): | |
Samsung Electro-Mechanics Co. Ltd. | | | 2,139 | | | | 199,419 | | |
Samsung Electronics Co. Ltd. | | | 61,523 | | | | 2,141,913 | | |
| | | | 2,341,332 | | |
| | | | 5,823,840 | | |
Malaysia (1.1%): | |
Financials (0.6%): | |
Ammb Holdings Berhad | | | 246,900 | | | | 258,990 | | |
Industrials (0.5%): | |
Malaysia Airports Holdings Berhad | | | 108,700 | | | | 220,323 | | |
| | | | 479,313 | | |
Mexico (1.9%): | |
Consumer Discretionary (0.2%): | |
El Puerto de Liverpool Sab de CV | | | 12,278 | | | | 78,844 | | |
Financials (1.3%): | |
Banco del Bajio SA (d) | | | 60,464 | | | | 118,080 | | |
Grupo Financiero Banorte SAB de CV | | | 87,645 | | | | 427,256 | | |
| | | | 545,336 | | |
Materials (0.4%): | |
Alpek SAB de CV (c) | | | 158,998 | | | | 194,622 | | |
| | | | 818,802 | | |
Philippines (0.4%): | |
Financials (0.4%): | |
Metro Pacific Investments Co. | | | 2,004,000 | | | | 176,387 | | |
See notes to financial statements.
10
Victory Variable Insurance Funds
Victory Sophus Emerging Markets VIP Series | | Schedule of Portfolio Investments — continued
December 31, 2018 | |
Security Description | | Shares | | Fair
Value(a) | |
Poland (0.5%): | |
Financials (0.5%): | |
Bank Pekao SA | | | 6,473 | | | $ | 188,839 | | |
Russian Federation (3.7%): | |
Energy (1.9%): | |
LUKOIL PJSC, ADR | | | 11,183 | | | | 797,977 | | |
| | | | 797,977 | | |
Financials (0.6%): | |
Sberbank of Russia PJSC, ADR | | | 25,244 | | | | 276,451 | | |
Materials (0.5%): | |
ALROSA AO | | | 150,400 | | | | 212,448 | | |
Utilities (0.7%): | |
Inter RAO UES PJSC | | | 5,304,000 | | | | 295,232 | | |
| | | | 1,582,108 | | |
Saudi Arabia (0.8%): | |
Financials (0.8%): | |
Al Rajhi Bank | | | 13,757 | | | | 320,615 | | |
South Africa (6.8%): | |
Communication Services (1.5%): | |
Naspers Ltd. | | | 3,168 | | | | 635,894 | | |
Consumer Discretionary (0.5%): | |
The Foschini Group Ltd. | | | 19,873 | | | | 230,078 | | |
Consumer Staples (0.7%): | |
The SPAR Group Ltd. | | | 19,924 | | | | 287,767 | | |
Financials (2.9%): | |
Absa Group Ltd. | | | 49,515 | | | | 557,150 | | |
Capitec Bank Holdings Ltd. | | | 4,629 | | | | 359,628 | | |
Nedbank Group Ltd. | | | 16,437 | | | | 314,290 | | |
| | | | 1,231,068 | | |
Materials (0.6%): | |
AngloGold Ashanti, Ltd. | | | 18,466 | | | | 235,182 | | |
Real Estate (0.6%): | |
Growthpoint Properties, Ltd. | | | 162,339 | | | | 264,545 | | |
| | | | 2,884,534 | | |
Taiwan (10.6%): | |
Consumer Staples (0.7%): | |
TCI Co. Ltd. | | | 17,843 | | | | 300,259 | | |
Financials (2.3%): | |
CTBC Financial Holding Co. Ltd. | | | 941,000 | | | | 618,948 | | |
Yuanta Financial Holding Co. Ltd. | | | 702,000 | | | | 352,928 | | |
| | | | 971,876 | | |
See notes to financial statements.
11
Victory Variable Insurance Funds
Victory Sophus Emerging Markets VIP Series | | Schedule of Portfolio Investments — continued
December 31, 2018 | |
Security Description | | Shares | | Fair
Value(a) | |
Industrials (0.6%): | |
Far Eastern New Century Corp. | | | 264,000 | | | $ | 239,761 | | |
Information Technology (6.2%): | |
Chipbond Technology Corp. | | | 124,000 | | | | 248,996 | | |
Elite Material Co. Ltd. | | | 52,000 | | | | 111,232 | | |
Largan Precision Co. Ltd. | | | 3,000 | | | | 313,045 | | |
Taiwan Semiconductor Manufacturing Co. Ltd. | | | 270,259 | | | | 1,962,477 | | |
| | | | 2,635,750 | | |
Materials (0.8%): | |
Formosa Plastics Corp. | | | 102,000 | | | | 335,284 | | |
| | | | 4,482,930 | | |
Thailand (3.3%): | |
Energy (0.8%): | |
PTT Exploration & Production | | | 104,200 | | | | 361,641 | | |
Financials (1.3%): | |
Bangkok Bank PCL | | | 60,600 | | | | 378,238 | | |
TMB Bank Public Corp. | | | 2,469,200 | | | | 166,989 | | |
| | | | 545,227 | | |
Health Care (0.6%): | |
Bumrungrad Hospital PCL | | | 45,400 | | | | 261,349 | | |
Materials (0.6%): | |
Indorama Ventures | | | 140,800 | | | | 234,986 | | |
| | | | 1,403,203 | | |
United Arab Emirates (0.8%): | |
Financials (0.8%): | |
National Bank of Abu Dhabi PJSC | | | 92,527 | | | | 355,206 | | |
United Kingdom (0.5%): | |
Materials (0.5%): | |
Anglo American PLC | | | 9,922 | | | | 221,829 | | |
Total Common Stocks (Cost $39,094,657) | | | 41,067,177 | | |
Preferred Stocks (2.4%) | |
Brazil (2.4%): | |
Financials (2.0%): | |
Itau Unibanco Holding S.A. | | | 93,250 | | | | 853,535 | | |
Industrials (0.4%): | |
Randon SA Implementos e Participacoes | | | 79,800 | | | | 190,554 | | |
| | | | 1,044,089 | | |
Total Preferred Stocks (Cost $922,901) | | | 1,044,089 | | |
See notes to financial statements.
12
Victory Variable Insurance Funds
Victory Sophus Emerging Markets VIP Series | | Schedule of Portfolio Investments — continued
December 31, 2018 | |
Security Description | | Shares | | Fair
Value(a) | |
Collateral for Securities Loaned^ (1.5%) | |
United States (1.5%): | |
BlackRock Liquidity Funds TempFund Portfolio, Institutional Class, 2.49% (e) | | | 118,380 | | | $ | 118,380 | | |
Fidelity Investments Money Market Government Portfolio, Class I, 2.28% (e) | | | 171,053 | | | | 171,053 | | |
Fidelity Investments Prime Money Market Portfolio, Class I, 2.46% (e) | | | 5,282 | | | | 5,282 | | |
Goldman Sachs Financial Square Prime Obligations Fund,
Institutional Class, 2.55% (e) | | | 65,767 | | | | 65,767 | | |
JPMorgan Prime Money Market Fund, Capital Class, 2.49% (e) | | | 105,221 | | | | 105,221 | | |
Morgan Stanley Institutional Liquidity Prime Portfolio,
Institutional Class, 2.58% (e) | | | 157,841 | | | | 157,841 | | |
Total Collateral for Securities Loaned (Cost $623,544) | | | 623,544 | | |
Total Investments (Cost $40,641,102) — 100.8% | | | 42,734,810 | | |
Liabilities in excess of other assets — (0.8)% | | | (350,015 | ) | |
NET ASSETS — 100.00% | | $ | 42,384,795 | | |
^ Purchased with cash collateral from securities on loan.
(a) All securities, except those traded on exchanges in the United States (including ADRs) and Mexico were fair valued at December 31, 2018. See Note 2 for further information.
(b) All or a portion of this security is on loan.
(c) Non-income producing security.
(d) Rule 144A security or other security that is restricted as to resale to institutional investors. The Fund's Adviser has deemed this security to be liquid based upon procedures approved by the Board of Trustees. As of December 31, 2018, the fair value of these securities was $238,259 and amounted to 0.6% of net assets.
(e) Rate disclosed is the daily yield on December 31, 2018.
ADR — American Depositary Receipt
PCL — Public Company Limited
PLC — Public Limited Company
See notes to financial statements.
13
Victory Variable Insurance Funds | | Statement of Assets and Liabilities
December 31, 2018 | |
| | | Victory
Sophus Emerging
Markets VIP
Series | |
ASSETS: | |
Investments, at value (Cost $40,641,102) | | $ | 42,734,810 | (a) | |
Foreign currency, at value (Cost $7,671) | | | 7,655 | | |
Cash and cash equivalents | | | 225,865 | | |
Interest and dividends receivable | | | 167,857 | | |
Receivable for capital shares issued | | | 2,676 | | |
Receivable for investments sold | | | 231,273 | | |
Reclaims receivable | | | 532 | | |
Total Assets | | | 43,370,668 | | |
LIABILITIES: | |
Payables: | |
Collateral received on loaned securities | | | 623,544 | | |
Accrued foreign capital gains taxes | | | 2,432 | | |
Investments purchased | | | 119,842 | | |
Capital shares redeemed | | | 141,811 | | |
Accrued expenses and other payables: | |
Investment advisory fees | | | 44,556 | | |
Administration fees | | | 2,239 | | |
Custodian fees | | | 17,478 | | |
Transfer agent fees | | | 49 | | |
Chief Compliance Officer fees | | | 98 | | |
Trustees' fees | | | 43 | | |
Other accrued expenses | | | 33,781 | | |
Total Liabilities | | | 985,873 | | |
NET ASSETS: | |
Capital | | | 37,815,860 | | |
Total distributable earnings/(loss) | | | 4,568,935 | | |
Net Assets | | $ | 42,384,795 | | |
Shares Outstanding (unlimited shares authorized, with a par value
of $0.001 per share): | | | 3,118,711 | | |
Net asset value: | | $ | 13.59 | | |
(a) Includes $596,120 of securities on loan.
See notes to financial statements.
14
Victory Variable Insurance Funds | | Statement of Operations
For the Year Ended December 31, 2018 | |
| | | Victory
Sophus Emerging
Markets VIP
Series | |
Investment Income: | |
Dividends | | $ | 1,499,545 | | |
Interest | | | 3,383 | | |
Securities lending (net of fees) | | | 11,560 | | |
Foreign tax withholding | | | (153,588 | ) | |
Total Income | | | 1,360,900 | | |
Expenses: | |
Investment advisory fees | | | 553,678 | | |
Administration fees | | | 33,115 | | |
Custodian fees | | | 70,340 | | |
Transfer agent fees | | | 317 | | |
Trustees' fees | | | 5,205 | | |
Chief Compliance Officer fees | | | 495 | | |
Legal and audit fees | | | 36,448 | | |
Interest expense on line of credit | | | 278 | | |
Interest expense on interfund lending | | | 377 | | |
Other expenses | | | 34,731 | | |
Recoupment of prior expenses waived/reimbursed by Adviser | | | 8,198 | | |
Total Expenses | | | 743,182 | | |
Net Investment Income (Loss) | | | 617,718 | | |
Realized/Unrealized Gains (Losses) from Investment Transactions: | |
Net realized gains (losses) from investment transactions and foreign
currency translations | | | 2,023,055 | | |
Foreign taxes on realized gains | | | (65,888 | ) | |
Net change in unrealized appreciation/depreciation on investments and
foreign currency translations | | | (12,889,962 | ) | |
Net change in accrued foreign taxes on unrealized gains | | | (32,019 | ) | |
Net realized/unrealized gains (losses) on investments | | | (10,964,814 | ) | |
Change in net assets resulting from operations | | $ | (10,347,096 | ) | |
See notes to financial statements.
15
Victory Variable Insurance Funds | | Statements of Changes in Net Assets | |
| | | Victory Sophus Emerging
Markets VIP Series | |
| | | Year
Ended
December 31,
2018 | | Year
Ended
December 31,
2017 | |
From Investment Activities: | |
Operations: | |
Net investment income (loss) | | $ | 617,718 | | | $ | 589,559 | | |
Net realized gains (losses) from investment transactions | | | 1,957,167 | | | | 9,014,684 | | |
Net change in unrealized appreciation (depreciation)
on investments | | | (12,921,981 | ) | | | 10,215,009 | | |
Change in net assets resulting from operations | | | (10,347,096 | ) | | | 19,819,252 | | |
Distributions to Shareholders: (a) | |
Change in net assets resulting from distributions to shareholders | | | (4,578,069 | ) | | | (505,562 | ) | |
Change in net assets resulting from capital transactions | | | (5,239,557 | ) | | | (5,398,302 | ) | |
Change in net assets | | | (20,164,722 | ) | | | 13,915,388 | | |
Net Assets: | |
Beginning of period | | | 62,549,517 | | | | 48,634,129 | | |
End of period | | $ | 42,384,795 | | | $ | 62,549,517 | | |
Capital Transactions: | |
Proceeds from shares issued | | $ | 3,506,148 | | | $ | 4,463,681 | | |
Distributions reinvested | | | 4,578,069 | | | | 505,562 | | |
Cost of shares redeemed | | | (13,323,774 | ) | | | (10,367,545 | ) | |
Change in net assets resulting from capital transactions | | $ | (5,239,557 | ) | | $ | (5,398,302 | ) | |
Share Transactions: | |
Issued | | | 186,585 | | | | 271,586 | | |
Reinvested | | | 338,686 | | | | 27,283 | | |
Redeemed | | | (735,217 | ) | | | (637,452 | ) | |
Change in Shares | | | (209,946 | ) | | | (338,583 | ) | |
(a) Current and prior year distributions to shareholders have been reclassified and conform to amended GAAP presentation under Regulation S-X (See Item 10 in the Notes to Financial Statements).
See notes to financial statements.
16
Victory Variable Insurance Funds | | Financial Highlights | |
For a Share Outstanding Throughout Each Period
| | | Victory Sophus Emerging Markets VIP Series | |
| | | Year
Ended
December 31,
2018 | | Year
Ended
December 31,
2017 | | Year
Ended
December 31,
2016 | | Year
Ended
December 31,
2015 | | Year
Ended
December 31,
2014 | |
Net Asset Value, Beginning of Period | | $ | 18.79 | | | $ | 13.26 | | | $ | 11.99 | | | $ | 13.81 | | | $ | 14.79 | | |
Investment Activities: | |
Net investment income (loss) | | | 0.20 | (a) | | | 0.17 | (a) | | | 0.12 | (a) | | | 0.13 | (a) | | | 0.14 | | |
Net realized and unrealized gains
(losses) on investments | | | (3.79 | ) | | | 5.51 | | | | 1.14 | | | | (1.89 | ) | | | (0.70 | ) | |
Total from Investment Activities | | | (3.59 | ) | | | 5.68 | | | | 1.26 | | | | (1.76 | ) | | | (0.56 | ) | |
Distributions to Shareholders: | |
Net investment income | | | (0.14 | ) | | | (0.15 | ) | | | (0.12 | ) | | | (0.06 | ) | | | (0.15 | ) | |
Net realized gains from investments | | | (1.47 | ) | | | — | | | | — | | | | — | | | | (0.27 | ) | |
Total Distributions to
Shareholders | | | (1.61 | ) | | | (0.15 | ) | | | (0.12 | ) | | | (0.06 | ) | | | (0.42 | ) | |
Capital Contributions from Prior
Custodian, Net (See Note 8) | | | — | | | | — | | | | 0.13 | | | | — | | | | — | | |
Net Asset Value, End of Period | | $ | 13.59 | | | $ | 18.79 | | | $ | 13.26 | | | $ | 11.99 | | | $ | 13.81 | | |
Total Return (b) | | | (18.97 | )% | | | 42.88 | % | | | 11.57 | %(c) | | | (12.74 | )% | | | (3.71 | )% | |
Ratios/Supplemental Data: | |
Net Assets at end of period (000) | | $ | 42,385 | | | $ | 62,550 | | | $ | 48,634 | | | $ | 48,426 | | | $ | 62,782 | | |
Ratio of net expenses to average net assets | | | 1.34 | % | | | 1.33 | % | | | 1.34 | % | | | 1.35 | % | | | 1.35 | % | |
Ratio of net investment income (loss)
to average net assets | | | 1.12 | % | | | 1.03 | % | | | 0.98 | % | | | 0.92 | % | | | 0.94 | % | |
Ratio of gross expenses to average net assets | | | 1.34 | % | | | 1.33 | % | | | 1.35 | %(d) | | | 1.35 | % | | | 1.35 | % | |
Portfolio turnover | | | 105 | % | | | 99 | % | | | 102 | % | | | 123 | % | | | 135 | % | |
(a) Per share net investment income (loss) has been calculated using the average daily shares method.
(b) Total returns do not reflect the effects of charges deducted pursuant to the terms of The Guardian Insurance & Annuity Company, Inc.'s variable contracts. Inclusion of such charges would reduce the total returns for all periods shown.
(c) The Fund received monies related to a nonrecurring refund from the prior Custodian. The corresponding impact to the total return was less than 0.95% for the period shown. (See Note 8)
(d) During the period, certain fees were reduced and/or reimbursed. If such fee reductions and/or reimbursements had not occurred, the ratios would have been as indicated.
See notes to financial statements.
17
Victory Variable Insurance Funds | | Notes to Financial Statements
December 31, 2018 | |
1. Organization:
Victory Variable Insurance Funds (the "Trust") was organized on February 11, 1998 as a Delaware statutory trust. The Trust is registered under the Investment Company Act of 1940, as amended (the "1940 Act"), as a diversified open-end investment company. The Trust is comprised of nine funds and is authorized to issue an unlimited number of shares, which are units of beneficial interest with a par value of $0.001 per share.
The accompanying financial statements are those of the Victory Sophus Emerging Markets VIP Series (the "Fund"). The Fund offers a single class of shares: Class I Shares. Sales of shares of the Fund may only be made to certain separate accounts of The Guardian Insurance & Annuity Company, Inc. ("GIAC") that fund certain variable annuity and variable life insurance contracts issued by GIAC. GIAC is a wholly owned subsidiary of The Guardian Life Insurance Company of America ("Guardian Life").
Under the Trust's organizational documents, its officers and trustees are indemnified against certain liabilities arising out of the performance of their duties to the Fund. In addition, in the normal course of business, the Fund enters into contracts with its vendors and others that provide for general indemnifications. The Fund's maximum exposure under these arrangements is unknown, as this would involve future claims that may be made against the Fund. However, based on experience, the Fund expects that risk of loss to be remote.
2. Significant Accounting Policies:
The following is a summary of significant accounting policies followed by the Trust in the preparation of its financial statements. The policies are in conformity with accounting principles generally accepted in the United States of America ("GAAP"). The preparation of financial statements in accordance with GAAP requires management to make estimates and assumptions that affect the reported amounts of assets and liabilities and disclosure of contingent assets and liabilities at the date of the financial statements and the reported amounts of income and expenses for the period. Actual results could differ from those estimates. The Fund follows the specialized accounting and reporting requirements under GAAP that are applicable to investment companies.
Investment Valuation:
The Fund records investments at fair value. Fair value is defined as the price that would be received to sell an asset or paid to transfer a liability in an orderly transaction between market participants at the measurement date.
The valuation techniques described below maximize the use of observable inputs and minimize the use of unobservable inputs in determining fair value. The inputs used for valuing the Fund's investments are summarized in the three broad levels listed below:
• Level 1 — quoted prices in active markets for identical securities
• Level 2 — other significant observable inputs (including quoted prices for similar securities or interest rates applicable to those securities, etc.)
• Level 3 — significant unobservable inputs (including the Fund's own assumptions in determining the fair value of investments)
Changes in valuation techniques may result in transfers in or out of an assigned level within the disclosure hierarchy. The inputs or methodologies used for valuation techniques are not necessarily an indication of the risk associated with entering into those investments.
Portfolio securities listed or traded on securities exchanges, American Depositary Receipts ("ADRs") and Rights, are valued at the closing price on the exchange or system where the security is principally traded, if available, or at the Nasdaq Official Closing Price. If there have been no sales for that day on the exchange or system, then a security is valued at the last available bid quotation on the exchange or system where the security is principally traded. In each of these situations, valuations are typically categorized as Level 1 in the fair value hierarchy.
18
Victory Variable Insurance Funds | | Notes to Financial Statements — continued
December 31, 2018 | |
Investments for which there are no such quotations, or for which quotations do not appear reliable, are valued at fair value in accordance with procedures established by and under the general supervision and responsibility of the Trust's Board of Trustees (the "Board"). These valuations are typically categorized as Level 2 or Level 3 in the fair value hierarchy, based on the observability of inputs used to determine the fair value.
In accordance with procedures adopted by the Board, fair value pricing may be used if events materially affecting the value of foreign securities occur between the time the exchange on which they are traded closes and the time the Fund's net asset value is calculated. The Fund uses a systematic valuation model, provided daily by an independent third party to fair value their international equity securities. These valuations are considered as Level 2 in the fair value hierarchy.
A summary of the valuations as of December 31, 2018, based upon the three levels defined above, is included in the table below while the breakdown, by category, of investments is disclosed in the Schedule of Portfolio Investments:
| | | LEVEL 1 —
Quoted Prices | | LEVEL 2 —
Other Significant
Observable Inputs | | Total | |
| | | Investments
in
Securities | | Other
Financial
Investments | | Investments
in
Securities | | Investments
in
Securities | | Other
Financial
Investments | |
Common Stocks | | $ | 5,987,550 | (a) | | $ | — | | | $ | 35,079,627 | | | $ | 41,067,177 | | | $ | — | | |
Preferred Stocks | | | — | | | | — | | | | 1,044,089 | | | | 1,044,089 | | | | — | | |
Collateral for Securities Loaned | | | 623,544 | | | | — | | | | — | | | | 623,544 | | | | — | | |
Total | | $ | 6,611,094 | | | $ | — | | | $ | 36,123,716 | | | $ | 42,734,810 | | | $ | — | | |
(a) All securities categorized as Mexico and all ADRs.
For the year ended December 31, 2018, there were no Level 3 investments for which significant unobservable inputs were used to determine fair value.
Investment Transactions and Related Income:
Changes in holdings of investments are accounted for no later than one business day following the trade date. For financial reporting purposes, however, investment transactions are accounted for on trade date on the last business day of the reporting period. Interest income is recognized on an accrual basis and includes, where applicable, the amortization of premiums or accretion of discounts. Dividend income is recorded on the ex-dividend date. Gains or losses realized on sales of securities are determined by comparing the identified cost of the security lot sold with the net sales proceeds.
Withholding taxes on interest, dividends and gains as a result of certain investments in ADRs by the Fund have been provided for in accordance with each investment's applicable country's tax rules and rates.
Securities Lending:
The Trust has entered into a Master Securities Lending Agreement ("MSLA") with Citibank, N.A. ("Citibank" or the "Agent"). Under the terms of the MSLA, the Fund may lend securities to certain broker-dealers and banks in exchange for collateral in the amount of at least 102% of the value of U.S. securities loaned or at least 105% of the value of non-U.S. securities loaned, marked-to-market daily. Any collateral shortfalls associated with increases in the valuation of the securities loaned are adjusted the next business day. The collateral can be received in the form of cash collateral and/or non-cash collateral. Non-cash collateral can include U.S. Government Securities, letters of credit and certificates of deposit. The cash collateral is invested in short-term instruments or cash equivalents as noted on the Fund's Schedule of Portfolio Investments. The Trust does not have effective control of the non-cash collateral and therefore it is not disclosed in the Fund's Schedule of Portfolio Investments. The Fund continues to benefit from interest or dividends on the securities loaned and may also earn a return from the collateral. The Fund pays various fees in connection with the investment of cash collateral.
19
Victory Variable Insurance Funds | | Notes to Financial Statements — continued
December 31, 2018 | |
The Fund pays the Agent fees based on the investment income received from securities lending activities. Securities lending income is disclosed in the Fund's Statement of Operations. Although risk is mitigated by the collateral, the Fund could experience a delay in recovering its securities and possible loss of income or value if the borrower fails to return them.
Securities lending transactions are entered into by the Fund under the MSLA, which permits the Fund, under certain circumstances such as an event of default, to offset amounts payable by the Fund to the same counterparty against amounts receivable from the counterparty to create a net payment due to or from the Fund.
The following table is a summary of the Fund's securities lending transactions which are subject to offset under the MSLA as of December 31, 2018. These transactions are accounted for as secured borrowings with an overnight and continuous contractual maturity for cash collateral, and greater than overnight and continuous contractual maturity for non-cash collateral.
Gross
Amount of
Recognized
Assets
(Value of | | Value of
Cash | | Value of Non-cash Collateral
Received by Maturity | | | |
Securities
on Loan) | | Collateral
Received | | <30 Days | | Between 30 &
90 Days | | >90 Days | | Net Amount | |
| $ | 596,120 | | | $ | 623,544 | | | $ | — | | | $ | 1,232 | | | $ | — | | | $ | 28,656 | | |
Foreign Currency Translations:
The accounting records of the Fund are maintained in U.S. dollars. Investment securities and other assets and liabilities of the Fund denominated in a foreign currency are translated into U.S. dollars at current exchange rates. Purchases and sales of securities, income receipts and expense payments are translated into U.S. dollars at the exchange rates on the date of the transactions. The Fund does not isolate the portion of the results of operations resulting from changes in foreign exchange rates on investments from fluctuations arising from changes in market prices of securities held. Such fluctuations are disclosed as net change in unrealized appreciation/depreciation on investments and foreign currency translations on the Statement of Operations. Any realized gains or losses from these fluctuations are disclosed as net realized gains or losses from investments and foreign currency translations on the Statement of Operations.
Foreign Taxes:
The Fund may be subject to foreign taxes related to foreign income received (a portion of which may be reclaimable), capital gains on the sale of securities, and certain foreign currency transactions. All foreign taxes are recorded in accordance with the applicable regulations and rates that exist in the foreign jurisdictions in which the Fund invests.
Dividends to Shareholders:
Dividends from net investment income, if any, are declared and paid annually by the Fund. Distributable net realized gains, if any, are declared and distributed at least annually.
The amounts of dividends from net investment income and distributions from net realized gains are determined in accordance with federal income tax regulations, which may differ from GAAP. To the extent these "book/tax" differences are permanent in nature (e.g., net operating loss, distribution reclassification, and deemed distribution due to shareholder redemptions), such amounts are reclassified within the components of net assets based on their federal tax-basis treatment; temporary differences (e.g., wash sales) do not require reclassification. To the extent dividends and distributions exceed net investment income and net realized gains for tax purposes, they are reported as distributions of capital. Net investment losses incurred by the Fund may be reclassified as an offset to capital on the accompanying Statement of Assets and Liabilities.
20
Victory Variable Insurance Funds | | Notes to Financial Statements — continued
December 31, 2018 | |
As of December 31, 2018, on the Statement of Assets and Liabilities, there are no permanent book-to-tax differences reclassification adjustments.
Federal Income Taxes:
It is the policy of the Fund to continue to qualify as a regulated investment company by complying with the provisions available to certain investment companies, as defined in applicable sections of the Internal Revenue Code, and to make distributions of net investment income and net realized gains sufficient to relieve it from all, or substantially all, federal income taxes. Accordingly, no provision for federal income taxes is required in the financial statements. The Fund has a tax year end of December 31.
Management of the Fund has reviewed tax positions taken in tax years that remain subject to examination by all major tax jurisdictions, including federal (i.e., the last four tax year ends and the interim tax period since then). Management believes that there is no tax liability resulting from unrecognized tax benefits related to uncertain tax positions taken.
Allocations:
Expenses directly attributable to the Fund are charged to the Fund, while expenses which are attributable to more than one fund in the Trust, or jointly with an affiliated trust, are allocated among the respective funds in the Trust and/or affiliated trust based upon net assets or another appropriate basis.
Affiliated Securities Transactions:
Pursuant to Rule 17a-7 under the 1940 Act, the Fund may engage in securities transactions with affiliated investment companies and advisory accounts managed by the Adviser and any applicable sub-adviser. Any such purchase or sale transaction must be effected without brokerage commission or other remuneration, except for customary transfer fees. The transaction must be effected at the current market price, which is either the security's last sale price on an exchange or, if there are no transactions in the security that day, at the average of the highest bid and lowest asked price. For the year ended December 31, 2018, the Fund did not engage in any Rule 17a-7 transactions under the 1940 Act.
3. Purchases and Sales of Securities:
Purchases and sales of securities (excluding securities maturing less than one year from acquisition) for the year ended December 31, 2018 were as follows for the Fund:
| Purchases | | Sales | |
| $ | 57,301,898 | | | $ | 66,277,818 | | |
For the year ended December 31, 2018, there were no purchases or sales of U.S. Government Securities.
4. Fees and Transactions with Affiliates and Related Parties:
Investment advisory services are provided to the Fund by Victory Capital Management Inc. ("VCM" or the "Adviser"), a New York corporation registered as an investment adviser with the Securities and Exchange Commission ("SEC"). The Adviser is a wholly-owned indirect subsidiary of Victory Capital Holdings Inc., a publicly traded Delaware corporation, and a wholly-owned direct subsidiary of Victory Capital Operating, LLC.
Under the terms of the Investment Advisory Agreement, the Adviser is entitled to receive 1.00% of the average daily net assets of the Fund. The Adviser may use its resources to assist with the Fund's distribution and marketing expenses.
VCM also serves as the Fund's administrator and fund accountant. Under an Administration and Fund Accounting Agreement, VCM is paid for its services an annual fee at a rate of 0.08% of the first $15 billion in average daily net assets of the Trust, Victory Portfolios and Victory Portfolios II
21
Victory Variable Insurance Funds | | Notes to Financial Statements — continued
December 31, 2018 | |
(collectively, the "Trusts"), 0.05% of the average daily net assets above $15 billion to $30 billion of the Trusts and 0.04% of the average daily net assets over $30 billion of the Trusts.
Citi Fund Services Ohio, Inc. ("Citi"), an affiliate of Citibank, N.A., acts as sub-administrator and sub-fund accountant to the Fund pursuant to a Sub-Administration and Sub-Fund Accounting Services Agreement between VCM and Citi. VCM pays Citi a fee for providing these services. The Trust reimburses VCM and Citi for all of their reasonable out-of-pocket expenses incurred in providing these services.
FIS Investor Services, LLC ("FIS") serves as the Fund's transfer agent. Under the Transfer Agent Agreement, the Trust pays FIS a fee for its services and reimburses FIS for all of their reasonable out-of-pocket expenses incurred in providing these services.
The Chief Compliance Officer ("CCO") is an employee of the Adviser, which pays the compensation of the CCO and his support staff. The Trust has entered into an Agreement to provide compliance services with the Adviser, pursuant to which the Adviser furnishes its compliance personnel, including the services of the CCO, and other resources reasonably necessary to provide the Trust with compliance oversight services related to the design, administration and oversight of a compliance program for the Trust in accordance with Rule 38a-1 under the 1940 Act. Funds in the Trust, Victory Portfolios, Victory Institutional Funds and Victory Portfolios II (collectively, the "Victory Funds Complex"), in the aggregate, compensate the Adviser for these services.
The Victory Funds Complex pays an annual retainer to each Independent Trustee, plus an additional annual retainer to the Chairman of the Board. The aggregate amount of the fees and expenses of the Independent Trustees are allocated amongst all the funds in the Victory Funds Complex and are presented in the Statement of Operations.
Shearman & Sterling LLP provides legal services to the Trust.
Victory Capital Advisers, Inc. (the "Distributor"), an affiliate of the Adviser, serves as distributor for the continuous offering of the shares of the Fund pursuant to a Distribution Agreement between the Distributor and the Trust.
The Adviser has entered into an expense limitation agreement with the Fund until at least April 30, 2019. Under the terms of the agreement, to the extent that ordinary operating expenses incurred by the Fund in any fiscal year exceed the expense limit for the Fund, such excess amounts will be the liability of the Adviser. Interest, taxes, brokerage commissions, other expenditures which are capitalized in accordance with GAAP, and other extraordinary expenses not incurred in the ordinary course of a Fund's business are excluded from the expense limitation agreement. For the year ended December 31, 2018, the expense limit (excluding voluntary waivers) is 1.35%.
The Fund has agreed to repay fees and expenses that were waived or reimbursed by the Adviser for a period up to three fiscal years after such waiver or reimbursement was made to the extent such payments or repayments would not cause the expenses of a class to exceed the original expense limitation in place at the time of the waiver or reimbursement or any expense limitation agreement in place at the time of repayment. Amounts repaid to the Adviser during the year ended December 31, 2018, if any, are reflected on the Statement of Operations as "Recoupment of prior expenses waived/reimbursed by Adviser". As of December 31, 2018, there are no amounts available to be repaid to the Adviser.
The Adviser may voluntarily waive or reimburse additional fees to assist the Fund in maintaining a competitive expense ratio. Voluntary waivers and reimbursements applicable to the Fund are not available to be recouped at a future time. There were no voluntary waivers or reimbursements for the year ended December 31, 2018.
Certain officers and/or interested trustees of the Fund are also officers and/or employees of the Adviser, Administrator, Fund Accountant, Sub-Administrator, Sub-Fund Accountant, and Legal.
22
Victory Variable Insurance Funds | | Notes to Financial Statements — continued
December 31, 2018 | |
5. Risks:
The Fund may be subject to other risks in addition to these identified risks.
An investment in the Fund's shares represents an indirect investment in the securities owned by the Fund, some of which will be traded on a national securities exchange or in the over-the-counter markets. The value of the securities in which the Fund invests, like other market investments, may move up or down, sometimes rapidly and unpredictably. The value of the securities in which the Fund invests may affect the value of the Fund's shares. An investment in the Fund's shares at any point in time may be worth less than the original investment, even after taking into account the reinvestment of the Fund's distributions.
The Fund will be subject to foreign securities risk. Foreign securities (including ADRs and other depository receipts) are subject to political, regulatory, and economic risks not present in domestic investments. In addition, when the Fund buys securities denominated in a foreign currency, there are special risks such as changes in currency exchange rates and the risk that a foreign government could regulate foreign exchange transactions. In addition, to the extent investments are made in a limited number of countries, events in those countries will have a more significant impact on the Fund.
The Fund will be subject to emerging market risk. Risk of investment in emerging markets include greater political and economic instability, greater volatility in currency exchange rates, less developed securities markets, possible trade barriers, currency transfer restrictions, a more limited number of potential buyers and issuers, an emerging market country's dependence on revenue from particular commodities or international aid, less governmental supervision and regulation, unavailability of currency hedging techniques, differences in auditing and financial reporting standards and less developed legal systems.
The Fund will be subject to credit risk with respect to the amount it expects to receive from counterparties for financial instruments entered into by the Fund. The Fund may be negatively impacted if a counterparty becomes bankrupt or otherwise fails to perform its obligations due to financial difficulties. The Fund may experience significant delays in obtaining any recovery in bankruptcy or other reorganization proceeding and the Fund may obtain only limited recovery or may obtain no recovery in such circumstances. The Fund typically enters into transactions with counterparties whose credit ratings are investment grade, as determined by a nationally recognized statistical rating organization or, if unrated, judged by the Adviser to be of comparable quality.
6. Borrowing and Interfund Lending:
Line of Credit:
The Victory Funds Complex participates in a short-term, demand note "Line of Credit" agreement with Citibank. Under the agreement with Citibank, the Victory Funds Complex may borrow up to $250 million, of which $100 million is committed and $150 million is uncommitted. $40 million of the Line of Credit is reserved for use by the Victory Floating Rate Fund, another series of the Victory Funds Complex, with that Fund paying the related commitment fees for that amount. The purpose of the agreement is to meet temporary or emergency cash needs, including redemption requests that might otherwise require the untimely disposition of securities. The current agreement was amended on July 27, 2018 with a new termination date of July 26, 2019. Citibank receives an annual commitment fee of 0.15% on $100 million for providing the Line of Credit. For the year ended December 31, 2018, Citibank earned approximately $150,000 in commitment fees from the Victory Funds Complex. Each fund in the Victory Funds Complex pays a pro-rata portion of the commitment fees plus any interest on amounts borrowed. Interest accrued by the Fund during the period is presented on the Statement of Operations under Interest expense on line of credit.
23
Victory Variable Insurance Funds | | Notes to Financial Statements — continued
December 31, 2018 | |
The average loans for the days outstanding and average interest rate for the Fund during the year ended December 31, 2018 were as follows:
Amount
Outstanding at
December 31, 2018 | | Average
Borrowing* | | Days
Borrowing
Outstanding | | Average
Interest
Rate* | | Maximum
Borrowing During
the Period | |
| $ | — | | | $ | 1,100,000 | | | | 3 | | | | 3.08 | % | | $ | 1,600,000 | | |
* For the year ended December 31, 2018, based on the number of days borrowings were outstanding.
Interfund Lending:
The Trust and Adviser rely on an exemptive order granted by the SEC in March 2017 (the "Order"), permitting the establishment and operation of an Interfund Lending Facility (the "Facility"). The Facility allows the Fund to directly lend and borrow money to or from any other Victory Fund relying upon the Order at rates beneficial to both the borrowing and lending funds. Advances under the Facility are allowed for temporary or emergency purposes, including the meeting of redemption requests that otherwise might require the untimely disposition of securities, and are subject to each Fund's borrowing restrictions. The interfund loan rate is determined, as specified in the Order, by averaging the current repurchase agreement rate and the current bank loan rate. Interest accrued by the Fund during the period is presented on the Statement of Operations under Interest expense on interfund lending.
The average loans for the days outstanding and average interest rate for the Fund during the year ended December 31, 2018 were as follows:
| Borrower or Lender | | Amount
Outstanding
at
December 31, 2018 | | Average
Borrowing* | | Days
Borrowing
Outstanding | | Average
Interest
Rate* | | Maximum
Borrowing During
the Period | |
| Borrower | | $ | — | | | $ | 221,391 | | | | 23 | | | | 2.70 | % | | $ | 391,000 | | |
* For the year ended December 31, 2018, based on the number of days borrowings were outstanding.
7. Federal Income Tax Information:
The tax character of distributions paid during the tax years ended, as noted below, were as follows (total distributions paid may differ from the Statements of Changes in Net Assets because, for tax purposes, dividends are recognized when actually paid).
Year Ended December 31, 2018 | |
Distributions paid from | |
Ordinary
Income | | Net
Long-Term
Capital Gains | | Total
Distributions
Paid | |
| $ | 437,091 | | | $ | 4,140,978 | | | $ | 4,578,069 | | |
Year Ended December 31, 2017 | |
Distributions paid from | |
Ordinary
Income | | Net
Long-Term
Capital Gains | | Total
Distributions
Paid | |
| $ | 505,562 | | | $ | — | | | $ | 505,562 | | |
24
Victory Variable Insurance Funds | | Notes to Financial Statements — continued
December 31, 2018 | |
As of the tax year ended December 31, 2018, the components of accumulated earnings (deficit) on a tax basis were as follows:
Undistributed
Ordinary
Income | | Undistributed
Long-Term
Capital
Gains | | Accumulated
Earnings | | Unrealized
Appreciation
(Depreciation)* | | Total
Accumulated
Earnings
(Deficit) | |
| $ | 457,781 | | | $ | 2,248,688 | | | $ | 2,706,469 | | | $ | 1,862,466 | | | $ | 4,568,935 | | |
* The difference between the book-basis and tax-basis unrealized appreciation (depreciation) is attributable primarily to tax deferral of losses on wash sales.
During the tax year ended December 31, 2018, the Fund did not utilize capital loss carryforwards.
As of December 31, 2018, the cost basis for federal income tax purposes, gross unrealized appreciation, gross unrealized depreciation and net unrealized appreciation (depreciation) for investments were as follows:
Cost of
Investments
for Federal
Tax Purposes | | Gross
Unrealized
Appreciation | | Gross
Unrealized
Depreciation | | Net
Unrealized
Appreciation
(Depreciation) | |
| $ | 40,870,239 | | | $ | 15,670,554 | | | $ | (13,805,983 | ) | | $ | 1,864,571 | | |
8. Capital Contribution from Prior Custodian:
During 2016, the Fund received notification from the Fund's prior custodian, State Street Bank and Trust ("State Street"), related to over-billing on certain categories of expenses during the approximately 16-year period from 1998 through October 31, 2014. The over-billing primarily related to categories of expenses that involved an allocation of general costs among multiple clients.
State Street paid the refunded amounts during January 2017. Based on billing information received during 2016 from State Street and an analysis of any expense limitation agreements that were in place during the period of the over-billing, including the application of any recoupment provisions in such agreements, the Adviser received a portion of the refund.
The portion of the refund retained by the Fund was accounted for as a capital contribution and is reflected on the Financial Highlights as "Capital Contribution from Prior Custodian, Net".
9. Fund Ownership:
Ownership of more than 25% of the voting securities of a fund creates presumptions of control of the fund, under section 2(a)(9) of the 1940 Act. As of December 31, 2018, the shareholders listed below held more than 25% of the shares outstanding of the Fund and may be deemed to control the Fund.
| Shareholder | | Percent | |
| GIAC | | | 99.5 | % | |
10. Recent Accounting Pronouncements:
In October 2016, the SEC released its Final Rules on Investment Company Reporting Modernization (the "Rules"). The Rules introduced two new regulatory reporting forms for investment companies, Form N-PORT and Form N-CEN. The Fund's compliance date for Form N-PORT was June 1, 2018, and the Fund will make its initial filing with the SEC on Form N-PORT for the period ending March 31, 2019. Effective with the period ended June 30, 2018, the Fund was required to maintain, and make available to the SEC upon request, the information required to be included in Form N-PORT. Form N-PORT will replace Form N-Q filings effective with the requirement to file the Form N-PORT with the SEC for the period ending March 31, 2019. The Fund's compliance date for Form N-CEN was June 1, 2018, and the Fund will make its initial filing on Form N-CEN for the period ended December 31, 2018. Form N-CEN
25
Victory Variable Insurance Funds | | Notes to Financial Statements — continued
December 31, 2018 | |
will replace Form N-SAR filings. The Fund's adoption of these amendments have no effect on the Fund's net assets or results of operations.
In August 2018, the FASB issued ASU No. 2018-13, "Fair Value Measurements" ("ASU 2018-13"). This update makes certain removals from, changes to and additions to existing disclosure requirements for fair value measurements. ASU 2018-13 does not change fair value measurements already required or permitted by existing standards. ASU 2018-13 is effective for financial statements issued for fiscal years beginning after December 15, 2019, and interim periods within those fiscal years. As permitted, the Fund has early adopted ASU 2018-13 with the financial statements prepared as of December 31, 2018.
In August 2018, the SEC adopted amendments to certain financial statement disclosure requirements to conform them to GAAP for investment companies. These amendments made certain disclosure requirements effective under Regulation S-X. The Fund's adoption of these amendments, effective with the financial statements prepared as of December 31, 2018 had no effect on the Fund's net assets or results of operations. As a result of adopting these amendments, the distributions to shareholders in the December 31, 2017 Statements of Changes in Net Assets presented herein have been reclassified to conform to the current year presentation, which includes all distributions to each class of shareholders, other than tax basis return of capital distributions, in one line item per share class. Distributions to shareholders for the year ended December 31, 2017 from net investment income and net realized gains in the Fund were as follows:
Distributions to Shareholders:
From net investment income: | | $ | (505,562 | ) | |
From net Realized Gains: | | | — | | |
11. Subsequent Events:
The Fund has evaluated the need for additional disclosures or adjustments resulting from subsequent events through the date these financial statements were issued. Based on this evaluation, there were no subsequent events to report that would have a material impact on the Fund's financial statements.
26
REPORT OF INDEPENDENT REGISTERED PUBLIC ACCOUNTING FIRM
To the Shareholders and the Board of Trustees of Victory Sophus Emerging Markets VIP Series
Opinion on the Financial Statements
We have audited the accompanying statement of assets and liabilities of Victory Sophus Emerging Markets VIP Series (the "Fund") (one of the funds constituting the Victory Variable Insurance Funds (the "Trust")), including the portfolio of investments, as of December 31, 2018, and the related statement of operations for the year then ended, the statements of changes in net assets for each of the two years in the period then ended, the financial highlights for each of the three years in the period then ended and the related notes (collectively referred to as the "financial statements"). In our opinion, the financial statements present fairly, in all material respects, the financial position of the Fund (one of the funds constituting the Trust) at December 31, 2018, and the results of its operations for the year then ended, the changes in its net assets for each of the two years in the period then ended and its financial highlights for each of the three years in the period then ended, in conformity with U.S. generally accepted accounting principles.
The financial highlights of the Fund for each of the periods presented through December 31, 2015 were audited by other auditors, whose report dated February 22, 2016 expressed an unqualified opinion on those financial highlights.
Basis for Opinion
These financial statements are the responsibility of the Trust's management. Our responsibility is to express an opinion on the Fund's financial statements based on our audits. We are a public accounting firm registered with the Public Company Accounting Oversight Board (United States) (PCAOB) and are required to be independent with respect to the Trust in accordance with the U.S. federal securities laws and the applicable rules and regulations of the Securities and Exchange Commission and the PCAOB.
We conducted our audits in accordance with the standards of the PCAOB. Those standards require that we plan and perform the audit to obtain reasonable assurance about whether the financial statements are free of material misstatement, whether due to error or fraud. The Trust is not required to have, nor were we engaged to perform, an audit of the Trust's internal control over financial reporting. As part of our audit we are required to obtain an understanding of internal control over financial reporting but not for the purpose of expressing an opinion on the effectiveness of the Trust's internal control over financial reporting. Accordingly, we express no such opinion.
Our audits included performing procedures to assess the risks of material misstatement of the financial statements, whether due to error or fraud, and performing procedures that respond to those risks. Such procedures included examining, on a test basis, evidence regarding the amounts and disclosures in the financial statements. Our procedures included confirmation of securities owned as of December 31, 2018, by correspondence with the custodian, transfer agent, and brokers or by other appropriate auditing procedures where replies from brokers were not received. Our audits also included evaluating the accounting principles used and significant estimates made by management, as well as evaluating the overall presentation of the financial statements. We believe that our audits provide a reasonable basis for our opinion.

We have served as the auditor of one or more Victory Capital's investment companies since 1995.
Cincinnati, Ohio
February 15, 2019
27
Victory Variable Insurance Funds | | Supplemental Information
December 31, 2018 | |
(Unaudited)
Trustee and Officer Information
Board of Trustees:
Overall responsibility for management of the Trust rests with the Board. The Trust is managed by the Board in accordance with the laws of the State of Delaware. There are currently ten Trustees, nine of whom are not "interested persons" of the Trust within the meaning of that term under the 1940 Act ("Independent Trustees") and one of whom is an "interested person" of the Trust within the meaning of that term under the 1940 Act ("Interested Trustee"). The Trustees, in turn, elect the officers of the Trust to actively supervise its day-to-day operations.
The following tables list the Trustees, their ages, position with the Trust, commencement of service, principal occupations during the past five years and any directorships of other investment companies or companies whose securities are registered under the Securities Exchange Act of 1934, as amended, or who file reports under that Act. Each Trustee oversees nine portfolios in the Trust, one portfolio in Victory Institutional Funds, 42 portfolios in Victory Portfolios and 20 portfolios in Victory Portfolios II, each a registered investment company that, together with the Trust, comprise the Victory Funds Complex. Each Trustee's address is c/o Victory Variable Insurance Funds, 4900 Tiedeman Road, 4th Floor, Brooklyn, Ohio 44144. Each Trustee has an indefinite term.
Name and Age | | Position
Held with
the Trust | | Date
Commenced
Service | | Principal Occupation
During Past 5 Years | | Other
Directorships
Held During
Past 5 Years | |
Independent Trustees. | |
David Brooks Adcock, 67 | | Trustee | | February 2005 | | Consultant (since 2006). | | Chair and Trustee, Turner Funds (December 2016-December 2017). | |
Nigel D.T. Andrews, 71 | | Vice Chair and Trustee | | August 2002 | | Retired. | | Director, TCG BDC II, Inc. (since 2017); Director, TCG BDC I, Inc. (formerly Carlyle GMS Finance, Inc.) (since 2012); Director, Old Mutual US Asset Management (2002-2014). | |
E. Lee Beard, 67* | | Trustee | | February 2005 | | Retired (since 2015); Consultant, The Henlee Group, LLC (consulting) (2005-2015). | | None. | |
Dennis M. Bushe, 75 | | Trustee | | July 2016 | | Retired. | | Trustee, RS Investment Trust and RS Variable Products Trust (November 2011-July 2016). | |
28
Victory Variable Insurance Funds | | Supplemental Information — continued
December 31, 2018 | |
(Unaudited)
Name and Age | | Position
Held with
the Trust | | Date
Commenced
Service | | Principal Occupation
During Past 5 Years | | Other
Directorships
Held During
Past 5 Years | |
Sally M. Dungan, 64 | | Trustee | | February 2011 | | Chief Investment Officer, Tufts University (since 2002). | | None. | |
John L. Kelly, 65 | | Trustee | | February 2015 | | Partner, McCarvill Capital Partners (September 2016-September 2017); Advisor (January 2016-April 2016) and Managing Partner (August 2014-January 2016), Endgate Commodities LLC; Chief Operating Officer, Liquidnet Holdings, Inc. (2011-2014). | | Director, Caledonia Mining Corporation (since May 2012). | |
David L. Meyer, 61* | | Trustee | | December 2008 | | Retired. | | None. | |
Gloria S. Nelund, 57 | | Trustee | | July 2016 | | Chair, CEO and Co-Founder of TriLinc Global, LLC, an investment firm. | | TriLinc Global Impact Fund, LLC (since 2012); Trustee, RS Investment Trust and RS Variable Products Trust (November 2007-July 2016). | |
Leigh A. Wilson, 74 | | Chair and Trustee | | February 1998 | | Private Investor. | | Chair (since 2013), Caledonia Mining Corporation. | |
Interested Trustee. | |
David C. Brown, 46** | | Trustee | | May 2008 | | Chairman and Chief Executive Officer (since 2013), Co-Chief Executive Officer (2011-2013), the Adviser; Chairman and Chief Executive Officer, Victory Capital Holdings, Inc. (since 2013). | | None. | |
* The Board has designated Mr. Meyer and Ms. Beard as its Audit Committee Financial Experts.
** Mr. Brown is an "Interested Person" by reason of his relationship with the Adviser.
The Statement of Additional Information includes additional information about the Trustees of the Trust and is available, without charge, by calling 800-539-3863.
29
Victory Variable Insurance Funds | | Supplemental Information — continued
December 31, 2018 | |
(Unaudited)
Officers:
The officers of the Trust, their ages, commencement of service and their principal occupations during the past five years, are detailed in the following table. Each officer serves until the earlier of his or her resignation, removal, retirement, death, or the election of a successor. The mailing address of each officer of the Trust is 4900 Tiedeman Road, 4th Floor, Brooklyn, Ohio 44144. The officers of the Trust receive no compensation directly from the Trust for performing the duties of their offices.
Name and Age | | Position with
the Trust | | Date
Commenced
Service | | Principal Occupation During Past 5 Years | |
Christopher K. Dyer, 57 | | President | | February 2006* | | Director of Mutual Fund Administration, the Adviser. | |
Scott A. Stahorsky, 49 | | Vice President | | December 2014 | | Manager, Fund Administration, the Adviser (since 2015); Senior Analyst, Fund Administration, the Adviser (prior to 2015). | |
Erin G. Wagner, 45 | | Secretary | | December 2014 | | Associate General Counsel, the Adviser (since 2013). | |
Allan Shaer, 53 | | Treasurer | | May 2017 | | Senior Vice President, Financial Administration, Citi Fund Services Ohio, Inc. (since 2016); Vice President, Mutual Fund Administration, JP Morgan Chase (2011-2016). | |
Christopher A. Ponte, 34 | | Assistant Treasurer | | December 2017 | | Manager, Fund Administration, the Adviser (since 2017); Senior Analyst, Fund Administration, the Adviser (prior to 2017); Chief Financial Officer, Victory Capital Advisers, Inc. (since 2018). | |
Colin Kinney, 45 | | Chief Compliance Officer | | July 2017 | | Chief Compliance Officer (since 2013) and Chief Risk Officer (2009-2017), the Adviser. | |
Chuck Booth, 58 | | Anti-Money Laundering Compliance Officer and Identity Theft Officer | | May 2015 | | Director, Regulatory Administration and CCO Support Services, Citi Fund Services Ohio, Inc. | |
Jay G. Baris, 65 | | Assistant Secretary | | February 1998 | | Partner, Shearman & Sterling LLP (since 2018); Partner, Morrison & Foerster LLP (2011-2017). | |
* On December 3, 2014, Mr. Dyer resigned as Secretary of the Trust and accepted the position of President.
30
Victory Variable Insurance Funds | | Supplemental Information — continued
December 31, 2018 | |
(Unaudited)
Proxy Voting and Form N-Q Information
Proxy Voting:
Information regarding the policies and procedures that the Fund uses to determine how to vote proxies relating to portfolio securities is available without charge, upon request, by calling 800-539-3863. The information is also included in the Fund's Statement of Additional Information, which is available on the SEC's website at www.sec.gov.
Information relating to how the Fund voted proxies relating to portfolio securities held during the most recent twelve months ended June 30 is available on the SEC's website at www.sec.gov.
Availability of Schedules of Portfolio Investments:
The Trust expects to file a complete list of Schedules of Portfolio Investments with the SEC for the first and third quarter of each fiscal year on Form N-PORT beginning March 1, 2019. Prior to that date, the Trust has filed a complete list of Schedules of Portfolio Investments with the SEC for the first and third quarters of each fiscal year on Form N-Q. Forms N-PORT and Forms N-Q are available on the SEC's website at www.sec.gov.
Expense Examples
As a shareholder of the Fund, you may incur two types of costs: (1) transaction costs and (2) ongoing costs, including management fees, distribution and service (12b-1) fees, and other Fund expenses. These examples are intended to help you understand your ongoing costs (in dollars) of investing in the Fund and to compare these costs with the ongoing costs of investing in other mutual funds.
These examples are based on an investment of $1,000 invested at the beginning of the period and held for the entire period from July 1, 2018 through December 31, 2018.
The Actual Expense figures in the table below provide information about actual account values and actual expenses. You may use the information below, together with the amount you invested, to estimate the expenses that you paid over the period. Simply divide your account value by $1,000 (for example, an $8,600 account value divided by $1,000 = 8.6), then multiply the result by the number in the table under the heading entitled "Actual Expenses Paid During Period" to estimate the expenses you paid on your account during this period.
The Hypothetical Expense figures in the table below provide information about hypothetical account values and hypothetical expenses based on the Fund's actual expense ratio and an assumed rate of return of 5% per year before expenses, which is not the Fund's actual return. The hypothetical account values and expenses may not be used to estimate the actual ending account balance or expenses you paid for the period. You may use this information to compare this 5% hypothetical example with the 5% hypothetical examples that appear in shareholder reports of other funds.
Please note the expenses shown in the table are meant to highlight your ongoing costs only and do not reflect any transactional costs. Therefore, the table is useful in comparing ongoing costs only, and will not help you determine the relative total costs of owning different funds. In addition, if these transactional costs were included, your costs would have been higher.
Beginning
Account Value
7/1/18 | | Actual
Ending
Account Value
12/31/18 | | Hypothetical
Ending
Account Value
12/31/18 | | Actual
Expenses
Paid During
Period
7/1/18-12/31/18* | | Hypothetical
Expenses
Paid During
Period
7/1/18-12/31/18* | | Annualized
Expense Ratio
During Period
7/1/18-12/31/18 | |
$ | 1,000.00 | | | $ | 849.20 | | | $ | 1,017.95 | | | $ | 6.71 | | | $ | 7.32 | | | | 1.44 | % | |
* Expenses are equal to the average account value multiplied by the Fund's annualized expense ratio multiplied by 184/365 (the number of days in the most recent fiscal half-year divided by the number of days in the fiscal year).
31
Victory Variable Insurance Funds | | Supplemental Information — continued
December 31, 2018 | |
(Unaudited)
Additional Federal Income Tax Information
For the year ended December 31, 2018, the Fund paid qualified dividend income for purposes of reduced individual federal income tax rates of 83%.
For the year ended December 31, 2018, the Fund designated long-term capital gain distributions in the amount of $4,140,978.
The Fund intends to elect to pass through to shareholders the income tax credit for taxes paid to foreign countries. Foreign source income and foreign tax expense per shares outstanding on December 31, 2018 were $0.42 and $0.20, respectively.
32
Victory Variable Insurance Funds | | Supplemental Information — continued
December 31, 2018 | |
(Unaudited)
Considerations of the Board in Continuing the Investment Advisory Agreement (the "Agreement")
The Board approved the Agreement on behalf of the Series at a meeting, which was called for that purpose, on December 5, 2018. The Board also considered information relating to the Series and the Agreement provided throughout the year and, more specifically, at a meeting on October 23, 2018. The Board noted that prior to the Series' reorganization on July 29, 2016, the Series was managed by RS Investment Management Co. LLC, which was acquired by the Adviser on July 29, 2016. In considering whether to approve the Agreement, the Board requested, and the Adviser provided, information that the Board believed to be reasonably necessary to reach its conclusions. The Board, including the Independent Trustees, evaluated this information along with other information obtained throughout the year and was advised by legal counsel to the Series and by independent legal counsel to the Independent Trustees. In addition, in 2017 the Independent Trustees, through their counsel, retained an independent consultant to assist with a review of the overall process for conducting the annual review of these advisory arrangements. The Board considered the Series' advisory fee, expense ratio and investment performance as significant factors in determining whether the Agreement should be continued. In considering whether the compensation paid to the Adviser was fair and reasonable, the Board also evaluated, among other things, the following factors:
• The requirements of the Series for the services provided by the Adviser;
• The nature, quality and extent of the services provided and expected to be provided;
• The performance of the Series as compared to comparable funds;
• The fees payable for the services and whether the fee arrangements provided for economies of scale that would benefit Series shareholders as the Series grows;
• Whether the fee would be sufficient to enable the Adviser to attract and retain experienced personnel and continue to provide quality services to the Series;
• Fees paid by other clients of the Adviser whose accounts are managed in a similar investment style and any differences in the services provided to the other clients compared to those provided to the Series;
• Total expenses of the Series, taking into consideration any distribution or shareholder servicing fees;
• Management's commitment to operating the Series at competitive expense levels;
• The profitability of the Adviser (as reflected by comparing fees earned against an estimate of the Adviser's costs) with respect to the Adviser's relationship with the Series;
• Research and other service benefits received by the Adviser obtained through payment of client commissions for securities transactions;
• Other benefits received by the Adviser, and its affiliates, including revenues paid to the Adviser, or its affiliates, by the Series for administration and fund accounting services, and distribution;
• The capabilities and financial condition of the Adviser;
• Current economic and industry trends; and
• The historical relationship between the Series and the Adviser.
The Board reviewed the Series' current management fee, comprised of the advisory fee plus the administrative services fee paid to the Adviser, in the context of the Adviser's profitability of the Series. In addition, the Board compared the Series' total operating expense ratio on a net and gross basis, taking into consideration any distribution or shareholder servicing fees and management fees with a universe of comparable mutual funds compiled by an independent consultant, FUSE Research Network, LLC ("FUSE"), and a peer group of funds with similar investment strategies selected by FUSE from the universe. The Board reviewed the factors and methodology used by FUSE in the selection of the Series' peer group, including FUSE's selection of a broad universe of funds using the standard Retail Morningstar Categories, the more specific universe of comparable funds, and peer groups of funds with comparable investment strategies and asset levels, among other factors. The Board also reviewed any changes to FUSE's methodology as compared to the prior year, including as a result of input from the Adviser, if any. The Board also reviewed fees and other information related to the Adviser's management of similarly managed institutional or private accounts, and the differences in the services
33
Victory Variable Insurance Funds | | Supplemental Information — continued
December 31, 2018 | |
(Unaudited)
provided to the other accounts, to the extent applicable. The Board noted that the advisory fee arrangements for the Series do not include breakpoints, which are generally viewed as a method by which the investment adviser shares any economies of scale with a fund as a fund grows. The Board also considered the Adviser's commitment to limit expenses as discussed in more detail below.
The Board reviewed the Series' performance over one-, three-, five- and ten-year periods against the performance of the Series' selected peer group and benchmark index. The Board recognized that the performance of the Series and the peer group funds are net of expenses, while the performance of the benchmark index is gross returns. The Board considered the additional resources that the Adviser has committed to enhance portfolio analysis, compliance and trading systems. The Board noted that, following the Series' reorganization, the Series is managed by substantially the same investment management team that managed the comparable predecessor fund.
The Board reviewed various other specific factors with respect to the Series, as described below. In their deliberations, the Trustees did not rank the importance of any particular information or factor considered and each Trustee may have attributed different weights to various factors.
The Board concluded that the Series' gross annual management fee was reasonable as compared to the median gross management fee charged to the funds in the Series' peer group. The Board noted that the Series' net annual expense ratio, taking into account any shareholder servicing or distribution fees, was reasonable as compared to the median expense ratio for the peer group. The Board considered the Adviser's contractual agreement to waive its fees and reimburse expenses for a specified period of time, as described in the Series' prospectus. The Board then compared the Series' performance for the one-, three-, five- and ten-year periods ended June 30, 2018, to that of the median performance of the peer group and benchmark index for the same periods and considered the fact that the Series outperformed both the benchmark index and the peer group for all of the periods reviewed.
Having considered, among other things: (1) that the Series' management fee was within the ranges of advisory fees charged to comparable mutual funds; (2) that the Series' total expense ratio was reasonable; (3) the Adviser's willingness to limit the expenses for a period of time would provide stability to the Series' expenses during that period; and (4) the performance of the Series, the Board concluded that the Agreement continued to be in the best interests of the Series' shareholders.
Conclusion
Based on its review of the information requested and provided, and following extended discussions, the Board determined that the Agreement, on behalf of the Series, was consistent with the best interests of the Series and its shareholders, and the Board unanimously approved the Agreement, on behalf of the Series, for an additional annual period on the basis of the foregoing review and discussions and the following considerations, among others:
• The fairness and reasonableness of the investment advisory fee payable to the Adviser under the Agreement in light of the investment advisory services provided, the costs of these services, the profitability of the Adviser's relationship with the Series and the comparability of the fee paid to the fees paid by other investment companies;
• The nature, quality and extent of the investment advisory services provided by the Adviser;
• The Adviser's entrepreneurial commitment to the management of the Series and the creation of a broad-based family of funds, which could entail a substantial commitment of the Adviser's resources to the successful operation of the Series;
• The Adviser's representations regarding its staffing and capabilities to manage the Series, including the retention of personnel with relevant portfolio management experience;
• The Adviser's efforts to enhance investment results by, among other things, developing quality portfolio management teams; and
• The overall high quality of the personnel, operations, financial condition, investment management capabilities, methodologies and performance of the Adviser.
34
Privacy Policy
Protecting the Privacy of Information
The Trust respects your right to privacy. We also know that you expect us to conduct and process your business in an accurate and efficient manner. To do so, we must collect and maintain certain personal information about you. This is the information we collect from you on applications or other forms, and from the transactions you make with us or third parties. It may include your name, address, social security number, account transactions and balances, and information about investment goals and risk tolerance.
We do not disclose any information about you or about former customers to anyone except as permitted or required by law. Specifically, we may disclose the information we collect to companies that perform services on our behalf, such as the transfer agent that processes shareholder accounts and printers and mailers that assist us in the distribution of investor materials. We may also disclose this information to companies that perform marketing services on our behalf. This allows us to continue to offer you Victory investment products and services that meet your investing needs, and to effect transactions that you request or authorize. These companies will use this information only in connection with the services for which we hired them. They are not permitted to use or share this information for any other purpose.
To protect your personal information internally, we permit access only by authorized employees and maintain physical, electronic and procedural safeguards to guard your personal information.*
* You may have received communications regarding information about privacy policies from other financial institutions which gave you the opportunity to "opt-out" of certain information sharing with companies which are not affiliated with that financial institution. The Trust does not share information with other companies for purposes of marketing solicitations for products other than the Trust. Therefore, the Trust does not provide opt-out options to their shareholders.
Victory Funds
P.O. Box 182593
Columbus, Ohio 43218-2593

Visit our website at: | | Call Victory at: | |
www.vcm.com | | 800-539-FUND (800-539-3863) | |
VVIF-RS-SEMVIP-AR (12/18)

December 31, 2018
Annual Report
Victory Variable Insurance Funds
Diversified Stock Fund
Beginning on January 1, 2021, as permitted by regulations adopted by the Securities and Exchange Commission, paper copies of the Victory Funds' shareholder reports will no longer be sent by mail, unless you specifically request paper copies of the reports from the Victory Funds or from your financial intermediary, such as a broker-dealer or bank. Instead, the reports will be made available on www.VictoryFunds.com, and you will be notified by mail each time a report is posted and provided with a website link to access the report. If you already elected to receive shareholder reports electronically, you will not be affected by this change, and you need not take any action.
You may elect to receive shareholder reports and other communications from the Victory Funds or your financial intermediary electronically sooner than January 1, 2021 by notifying your financial intermediary directly or, if you are a direct investor, by calling 800-539-3863 or by sending an e-mail request to TA.Processing@FISGlobal.com.
You may elect to receive all future reports in paper free of charge. If you invest through a financial intermediary, you can contact your financial intermediary to request that you continue to receive paper copies of your reports. If you invest directly with the Victory Funds, you can call 800-539-3863 or send an e-mail request to TA.Processing@FISGlobal.com. Your election to receive reports in paper will apply to all Victory Funds you hold directly or through your financial intermediary.
www.vcm.com
News, Information And Education 24 Hours A Day, 7 Days A Week
The Victory Funds site gives fund shareholders, prospective shareholders, and investment professionals a convenient way to access fund information, get guidance, and track fund performance anywhere they can access the Internet. The site includes:
• Detailed performance records
• Daily share prices
• The latest fund news
• Investment resources to help you become a better investor
• A section dedicated to investment professionals
Whether you're a potential investor searching for the fund that matches your investment philosophy, a seasoned investor interested in planning tools, or an investment professional, www.vcm.com has what you seek. Visit us anytime. We're always open.
Victory Variable Insurance Funds
Table of Contents
Shareholder Letter (Unaudited) | | | 2 | | |
Fund Review and Commentary (Unaudited) | | | 3 | | |
Financial Statements | |
Schedule of Portfolio Investments | | | 5 | | |
Statement of Assets and Liabilities | | | 7 | | |
Statement of Operations | | | 8 | | |
Statements of Changes in Net Assets | | | 9 | | |
Financial Highlights | | | 10 | | |
Notes to Financial Statements | | | 11 | | |
Report of Ernst & Young LLP, Independent
Registered Public Accounting Firm | | | 17 | | |
Supplemental Information (Unaudited) | |
Trustee and Officer Information | | | 18 | | |
Proxy Voting and Form N-Q Information | | | 20 | | |
Expense Examples | | | 20 | | |
Additional Federal Income Tax Information | | | 21 | | |
Advisory Contract Renewal | | | 22 | | |
Privacy Policy (inside back cover) | | | |
The Fund is distributed by Victory Capital Advisers, Inc. Victory Capital Management Inc. is the investment adviser to the Fund and receives fees from the Fund for performing services for the Fund.
This report is not authorized for distribution to prospective investors unless preceded or accompanied by a current prospectus of the Victory Variable Insurance Diversified Stock Fund.
The information in this annual report is based on data obtained from recognized services and sources and is believed to be reliable. Any opinions, projections, or recommendations in this report are subject to change without notice and are not intended as individual investment advice. Past investment performance of the Fund, markets or securities mentioned herein should not be considered to be indicative of future results.
• NOT FDIC INSURED • NO BANK GUARANTEE • MAY LOSE VALUE

Call Victory at:
800-539-FUND (800-539-3863)
Visit our website at:
www.vcm.com
1
Victory Funds Letter to Shareholders
Dear Shareholder,
What a difference a year makes. The year ended December 31, 2018, was marked by an abrupt return of volatility, which had largely been missing in action for years. Consider the range of highs and lows we witnessed. For the S&P 500 Index, it was a year in which we celebrated an all-time high in late summer, only to be followed by the worst December since the 2008 financial crisis. And if that wasn't enough volatility, the Dow Jones Industrial Average also registered several of its worst-ever, single-day point declines during 2018.
Through all that the S&P 500 clocked in with its first negative annual return since 2008, falling by 4.4 percent. Given the risk-off sentiment that was obvious as the year drew to a close, it's no surprise that small-cap stocks, as measured by the Russell 2000 Index, fared even worse, falling approximately 11.0 percent for the year. The challenges for equity investors were also evident around the world as the MSCI ACWI and Emerging Markets indexes declined 8.9 and 14.3 percent, respectively.
So what ushered in the renewed era of volatility and these challenging times? There were multiple culprits. For starters, trade tensions ratcheted up throughout the year as anti-global rhetoric bloomed into a series of new tariffs, which sparked concerns of a prolonged trade war with China. The Federal Reserve remained persistent in its monetary tightening, raising the benchmark interest rate four times throughout the year to a range of 2.25 to 2.5 percent. And then the year ended with a partial shutdown of the federal government. These factors conspired to elevate concerns of a possible recession here and abroad.
Yet despite the headline risks, we think it's critically important to remain focused on the data. By all accounts, the U.S. economy continued chugging along in 2018 with a real gross domestic product (GDP) rising 3.4 percent in the third quarter of 2018, the latest figures available from the Bureau of Economic Analysis. Moreover, the labor picture continues to shine with consistent monthly job growth and an unemployment rate of 3.9 percent. All this comes against a backdrop of low inflation and solid corporate earnings.
The markets, it appears, have been vacillating between the dire headlines and higher perceived risks on one hand, and the continued positive economic data on the other. Of course, no one knows where the Fed will stop raising rates, nor is there any certainty on how the trade turmoil ultimately gets resolved. For now, however, we continue to embrace our solid economic fundamentals. Moreover, we believe all of Victory Capital's independent investment franchises are well positioned to take advantage of any short-term valuation dislocations resulting from the current era of heightened volatility.
On the following pages, you will find information relating to your Victory Funds investment. If you have any questions, we encourage you to contact your financial advisor. Or, if you invest with us directly, you may call (800) 539-3863, or visit our website at www.vcm.com.
My colleagues and I sincerely appreciate the confidence you have placed in the Victory Funds, and we value the opportunity to help meet your investment goals.

Christopher K. Dyer, CFA
President,
Victory Funds
2
Portfolio Commentary (Unaudited)
Diversified Stock Fund
Portfolio Holdings
As a Percentage of Total Investments

Commentary
The Victory Variable Insurance Diversified Stock Fund ("Fund") seeks to provide long-term growth of capital. The Fund returned -13.30% while the S&P 500® Index benchmark (the "Index") returned -4.38% for the year ended December 31, 2018. Performance has lagged the S&P 500® Index as of late in large part due to sector allocation (overweight cyclical sectors Financials/Energy, underweight defensive & secular growth sectors like Utilities/Staples/Health Care/Technology) and more granularly our positive exposure to value, volatility, and market sensitivity style factors, given the market's strong preference for high growth/high valuation stocks earlier in the year and the recent rotation into defensive names. Stock selection has also been challenged this year, though this is notwithstanding 4Q, which encouraging saw good performance in sectors that we have historically generated excess returns, i.e. Technology, Health Care and Consumer Discretionary.
Consumer Services was our top performing sector this year on a relative basis as good stock selection offset negative industry positioning. Our top performer was Nexstar Media Group, which owns 171 television stations reaching 100 markets and 39% of US households, while we also avoided weaker names like Facebook and Activision Blizzard. Nexstar was a position we entered in the fourth quarter, with our thesis centered on industry consolidation, solid recent trends in advertising revenue and free cash flow generation, and a much improved balance sheet. Shares materially outperformed in December after it was announced that Nexstar would be acquiring Tribune Media for $46.50/share, a deal that is expected to be highly accretive to free cash flow as well as position the company as the dominant player in the broadcast space.
Consumer Discretionary and Industrials were our worst performing sectors on a relative basis. The headwind we experienced from our value tilt was most acute in these sectors, while we also experienced some challenges from industry positioning and stock selection. Within Consumer Discretionary, it was our overexposure to homebuilders, which were pressured by rising rates, and underweight to Amazon and Netflix. Within Industrials, our overweight to machinery and building products dragged on results, while Patrick Industries was our most challenged position, with shares pressured by declining RV industry shipments as dealers continue to destock excess inventory. We exited our positions.
The Fund maintains material overweight allocations to the Industrial, Finance and Energy sectors, though within the sectors we raised industry exposures to aerospace & defense, investment banking and O&G refining, and reduced exposures to asset managers, E&Ps, and building products. We maintain underweight allocations to the Real Estate, Consumer Staples, Utilities, and Health Care sectors. For Materials, we've gone from a modest overweight to a more material underweight, while we've materially reduced our underweight allocation to Technology. Overall, the style currently has positive exposure to growth, earnings yield, and highly profitable companies with a smaller-cap bias.
The Fund continues to focus on companies that we believe have superior earnings growth, return on invested capital, and positive earnings/price momentum combined with a reasonable valuation over a wide spectrum of market capitalizations. We are confident that this combination of characteristics positions the Fund for strong competitive performance. These are the characteristics that have historically contributed to Munder's strong long-term record, and we firmly believe they will continue to serve our investors well.
3
Portfolio Commentary (Unaudited)
Diversified Stock Fund (continued)
Average Annual Total Return
Year Ended December 31, 2018
Inception Date | | 7/1/99 | | | |
| | | Net Asset
Value | | S&P 500
Index1 | |
One Year | | | –13.30 | % | | | –4.38 | % | |
Three Year | | | 4.44 | % | | | 9.26 | % | |
Five Year | | | 3.99 | % | | | 8.49 | % | |
Ten Year | | | 9.68 | % | | | 13.12 | % | |
Since Inception | | | 4.63 | % | | | N/A | | |
Expense Ratios | |
Gross | | | 0.94 | % | | | |
With Applicable Waivers | | | 0.94 | % | | | |
Past performance is not indicative of future results. The performance data quoted represents past performance and current returns may be lower or higher. The investment return and principal value will fluctuate so that an investor's shares, when redeemed, may be worth more or less than the original cost. To obtain performance information current to the most recent month's end, please visit www.vcm.com.
The above expense ratio is from the Fund's prospectus dated April 17, 2018. Additional information pertaining to the Fund's expense ratio as of December 31, 2018 can be found in the financial highlights.
The total return figures set forth above include all waivers of fees for various periods since inception. Without such fee waivers, the total returns would have been lower. Some fee waivers are voluntary and may be modified or terminated at any time. The total returns do not include any insurance, sales or administrative charges of variable annuity or life insurance contracts. If these charges were included, the total returns would have been lower.
Diversified Stock Fund — Growth of $10,000

1 The S&P 500 Index is an unmanaged index comprised of 500 domestically traded common stocks, is weighted according to the market value of each common stock in the index, and includes reinvestment of dividends. This index does not include effect of sales charges and is not representative of the Fund. It is not possible to invest directly in an index.
The graph reflects investment of growth of a hypothetical $10,000 investment in the Fund. Past performance is no guarantee of future results.
The graph and table do not reflect the deduction of taxes that a shareholder would pay on Fund distributions or the redemption of Fund shares.
4
Victory Variable Insurance Funds Schedule of Portfolio Investments
Diversified Stock Fund December 31, 2018
(Amounts in Thousands, Except for Shares)
Security Description | | Shares | | Value | |
Common Stocks (92.5%): | |
Communication Services (10.2%): | |
Alphabet, Inc., Class C (a) | | | 816 | | | $ | 845 | | |
Comcast Corp., Class A | | | 15,784 | | | | 538 | | |
Netflix, Inc. (a) | | | 414 | | | | 111 | | |
Nexstar Broadcasting Group, Inc., Class A | | | 5,097 | | | | 401 | | |
The Walt Disney Co. | | | 2,578 | | | | 282 | | |
T-Mobile US, Inc. (a) | | | 5,948 | | | | 378 | | |
Verizon Communications, Inc. | | | 5,640 | | | | 317 | | |
| | | | 2,872 | | |
Consumer Discretionary (10.2%): | |
Amazon.com, Inc. (a) | | | 509 | | | | 765 | | |
Asbury Automotive Group, Inc. (a) | | | 4,307 | | | | 287 | | |
Burlington Stores, Inc. (a) | | | 2,134 | | | | 347 | | |
Dollar General Corp. | | | 3,507 | | | | 379 | | |
O'Reilly Automotive, Inc. (a) | | | 833 | | | | 287 | | |
Penske Automotive Group, Inc. | | | 5,929 | | | | 239 | | |
Ross Stores, Inc. | | | 2,331 | | | | 194 | | |
The Home Depot, Inc. | | | 2,243 | | | | 385 | | |
| | | | 2,883 | | |
Consumer Staples (4.1%): | |
PepsiCo, Inc. | | | 2,808 | | | | 310 | | |
The Procter & Gamble Co. | | | 3,350 | | | | 308 | | |
Wal-Mart Stores, Inc. | | | 5,675 | | | | 529 | | |
| | | | 1,147 | | |
Energy (6.6%): | |
Chevron Corp. | | | 5,092 | | | | 555 | | |
EOG Resources, Inc. | | | 2,663 | | | | 232 | | |
Exxon Mobil Corp. | | | 3,510 | | | | 239 | | |
Occidental Petroleum Corp. | | | 3,467 | | | | 213 | | |
Phillips 66 | | | 4,293 | | | | 370 | | |
Valero Energy Corp. | | | 3,246 | | | | 243 | | |
| | | | 1,852 | | |
Financials (15.0%): | |
Ally Financial, Inc. | | | 15,795 | | | | 358 | | |
Athene Holding Ltd., Class A (a) | | | 8,255 | | | | 329 | | |
Bank of America Corp. | | | 12,347 | | | | 304 | | |
Berkshire Hathaway, Inc., Class B (a) | | | 3,181 | | | | 649 | | |
Cathay General Bancorp | | | 9,898 | | | | 332 | | |
E*TRADE Financial Corp. | | | 5,898 | | | | 259 | | |
Essent Group Ltd. (a) | | | 9,919 | | | | 339 | | |
FCB Financial Holdings, Inc. (a) | | | 5,645 | | | | 190 | | |
JPMorgan Chase & Co. | | | 4,145 | | | | 404 | | |
Regions Financial Corp. | | | 15,448 | | | | 207 | | |
ServisFirst Bancshares, Inc. | | | 4,620 | | | | 147 | | |
SVB Financial Group (a) | | | 1,656 | | | | 315 | | |
TD Ameritrade Holding Corp. | | | 8,069 | | | | 395 | | |
| | | | 4,228 | | |
See notes to financial statements.
5
Victory Variable Insurance Funds Schedule of Portfolio Investments — continued
Diversified Stock Fund December 31, 2018
(Amounts in Thousands, Except for Shares)
Security Description | | Shares | | Value | |
Health Care (13.3%): | |
AbbVie, Inc. | | | 6,115 | | | $ | 564 | | |
Biogen, Inc. (a) | | | 1,550 | | | | 466 | | |
Cigna Corp. | | | 1,337 | | | | 254 | | |
CVS Health Corp. | | | 1,865 | | | | 122 | | |
HCA Holdings, Inc. | | | 3,199 | | | | 399 | | |
Innoviva, Inc. (a) | | | 13,798 | | | | 241 | | |
Johnson & Johnson | | | 2,183 | | | | 282 | | |
Medtronic PLC | | | 1,553 | | | | 141 | | |
Merck & Co., Inc. | | | 2,687 | | | | 205 | | |
Pfizer, Inc. | | | 6,388 | | | | 279 | | |
UnitedHealth Group, Inc. | | | 1,579 | | | | 393 | | |
Universal Health Services, Inc., Class B | | | 3,380 | | | | 394 | | |
| | | | 3,740 | | |
Industrials (13.4%): | |
Air Lease Corp. | | | 7,785 | | | | 235 | | |
Allison Transmission Holdings, Inc. | | | 9,512 | | | | 418 | | |
Comfort Systems USA, Inc. | | | 5,295 | | | | 231 | | |
J.B. Hunt Transport Services, Inc. | | | 3,534 | | | | 329 | | |
Marten Transport Ltd. | | | 6,811 | | | | 110 | | |
Norfolk Southern Corp. | | | 2,446 | | | | 366 | | |
PACCAR, Inc. | | | 6,116 | | | | 349 | | |
SkyWest, Inc. | | | 4,593 | | | | 204 | | |
The Boeing Co. | | | 1,478 | | | | 477 | | |
Union Pacific Corp. | | | 3,607 | | | | 499 | | |
United Rentals, Inc. (a) | | | 2,685 | | | | 275 | | |
United Technologies Corp. | | | 2,659 | | | | 283 | | |
| | | | 3,776 | | |
Information Technology (19.0%): | |
Apple, Inc. | | | 4,440 | | | | 700 | | |
Broadcom, Inc. | | | 2,057 | | | | 523 | | |
Cisco Systems, Inc. | | | 13,425 | | | | 582 | | |
Intel Corp. | | | 13,306 | | | | 625 | | |
KEMET Corp. | | | 11,821 | | | | 207 | | |
Mastercard, Inc., Class A | | | 1,008 | | | | 190 | | |
Microsoft Corp. | | | 13,295 | | | | 1,350 | | |
ON Semiconductor Corp. (a) | | | 17,272 | | | | 285 | | |
PayPal Holdings, Inc. (a) | | | 1,707 | | | | 144 | | |
Visa, Inc., Class A | | | 1,484 | | | | 195 | | |
Vishay Intertechnology, Inc. | | | 8,068 | | | | 145 | | |
Zebra Technologies Corp., Class A (a) | | | 2,426 | | | | 387 | | |
| | | | 5,333 | | |
Materials (0.7%): | |
Packaging Corp. of America | | | 2,301 | | | | 192 | | |
Total Common Stocks (Cost $25,228) | | | 26,023 | | |
Exchange-Traded Funds (5.8%): | |
SPDR S&P 500 ETF Trust, 2.04% (b) | | | 6,534 | | | | 1,633 | | |
Total Exchange-Traded Fund (Cost $1,706) | | | 1,633 | | |
Total Investments (Cost $26,934) — 98.3% | | | 27,656 | | |
Other assets in excess of liabilities — 1.7% | | | | | 474 | | |
NET ASSETS — 100.0% | | $ | 28,130 | | |
(a) Non-income producing security.
(b) All or a portion of this security is on loan.
PLC — Public Liability Company
ETF — Exchange Traded Fund
See notes to financial statements.
6
Statement of Assets and Liabilities
Victory Variable Insurance Funds December 31, 2018
(Amounts in Thousands, Except Per Share Amounts)
| | | Victory
Variable
Insurance
Diversified
Stock Fund | |
ASSETS: | |
Investments, at value (Cost $26,934) | | $ | 27,656 | (a) | |
Cash and cash equivalents | | | 644 | | |
Dividends receivable | | | 47 | | |
Total Assets | | | 28,347 | | |
LIABILITIES: | |
Payables: | |
Investments purchased | | | 110 | | |
Capital shares redeemed | | | 64 | | |
Accrued expenses and other payables: | |
Investment advisory fees | | | 7 | | |
Administration fees | | | 2 | | |
Contract owner fees | | | 14 | | |
Custodian fees | | | 1 | | |
Transfer agent fees | | | — | (b) | |
Chief Compliance Officer fees | | | — | (b) | |
Trustees' fees | | | — | (b) | |
| 12b-1 fees | | | 3 | | |
Other accrued expenses | | | 16 | | |
Total Liabilities | | | 217 | | |
NET ASSETS: | |
Capital | | | 25,789 | | |
Total distributable earnings/(loss) | | | 2,341 | | |
Net Assets | | $ | 28,130 | | |
Shares Outstanding (unlimited number of shares authorized, with a par value of $0.001 per share): | | | 2,753 | | |
Net asset value, offering price & redemption price per share (c): | | $ | 10.22 | | |
(a) Includes $150 of securities on loan.
(b) Rounds to less than $1
(c) Per share amount may not recalculate due to rounding of net assets and/or shares outstanding.
See notes to financial statements.
7
Statement of Operations
Victory Variable Insurance Funds For the Year Ended December 31, 2018
(Amounts in Thousands)
| | | Victory
Variable
Insurance
Diversified
Stock Fund | |
Investment Income: | |
Dividends | | $ | 501 | | |
Interest | | | 7 | | |
Securities lending (net of fees) | | | 1 | | |
Foreign tax withholding | | | (1 | ) | |
Total Income | | | 508 | | |
Expenses: | |
Investment advisory fees | | | 105 | | |
Administration fees | | | 21 | | |
Contract owner fees | | | 85 | | |
| 12b-1 fees | | | 87 | | |
Custodian fees | | | 2 | | |
Transfer agent fees | | | — | (a) | |
Trustees' fees | | | 3 | | |
Chief Compliance Officer fees | | | — | (a) | |
Legal and audit fees | | | 14 | | |
Interest expense on interfund lending | | | — | (a) | |
Other expenses | | | 17 | | |
Total Expenses | | | 334 | | |
Net Investment Income (Loss) | | | 174 | | |
Realized/Unrealized Gains (Losses) from Investment Transactions: | |
Net realized gains (losses) from investment transactions | | | 1,594 | | |
Net change in unrealized appreciation/depreciation on investments | | | (6,154 | ) | |
Net realized/unrealized gains (losses) on investments | | | (4,560 | ) | |
Change in net assets resulting from operations | | $ | (4,386 | ) | |
(a) Rounds to less than $1.
See notes to financial statements.
8
Victory Variable Insurance Funds Statements of Changes in Net Assets
(Amounts in Thousands)
| | | Victory Variable Insurance
Diversified Stock Fund | |
| | | Year
Ended
December 31,
2018 | | Year
Ended
December 31,
2017 | |
From Investment Activities: | |
Operations: | |
Net investment income (loss) | | $ | 174 | | | $ | 242 | | |
Net realized gains (losses) from investment transactions | | | 1,594 | | | | 5,822 | | |
Net change in unrealized appreciation/depreciation on investments | | | (6,154 | ) | | | 2,410 | | |
Change in net assets resulting from operations | | | (4,386 | ) | | | 8,474 | | |
Distributions to Shareholders: (a) | |
Change in net assets resulting from distributions to shareholders | | | (5,921 | ) | | | (759 | ) | |
Change in net assets resulting from capital transactions | | | (440 | ) | | | (2,825 | ) | |
Change in net assets | | | (10,747 | ) | | | 4,890 | | |
Net Assets: | |
Beginning of period | | | 38,877 | | | | 33,987 | | |
End of period | | $ | 28,130 | | | $ | 38,877 | | |
Capital Transactions: | |
Proceeds from shares issued | | $ | 235 | | | $ | 2,575 | | |
Dividends reinvested | | | 5,921 | | | | 759 | | |
Cost of shares redeemed | | | (6,596 | ) | | | (6,159 | ) | |
Change in net assets resulting from capital transactions | | $ | (440 | ) | | $ | (2,825 | ) | |
Share Transactions: | |
Issued | | | 17 | | | | 189 | | |
Reinvested | | | 580 | | | | 53 | | |
Redeemed | | | (451 | ) | | | (460 | ) | |
Change in Shares | | | 146 | | | | (218 | ) | |
(a) Current and prior year distributions to shareholders have been reclassified and conform to amended GAAP presentation under Regulation S-X (See Item 9 in the Notes to Financial Statements).
See notes to financial statements.
9
Victory Variable Insurance Funds Financial Highlights
For a Share Outstanding Throughout Each Period
| | | Victory Variable Insurance Diversified Stock Fund | |
| | | Year
Ended
December 31,
2018 | | Year
Ended
December 31,
2017 | | Year
Ended
December 31,
2016 | | Year
Ended
December 31,
2015 | | Year
Ended
December 31,
2014 | |
Net Asset Value, Beginning of Period | | $ | 14.91 | | | $ | 12.03 | | | $ | 12.75 | | | $ | 15.15 | | | $ | 13.87 | | |
Investment Activities: | |
Net investment income (loss) | | | 0.07 | (a) | | | 0.09 | (a) | | | 0.13 | (a) | | | 0.09 | | | | 0.13 | | |
Net realized and unrealized gains (losses) on investments | | | (2.07 | ) | | | 3.08 | | | | 0.37 | | | | (0.53 | ) | | | 1.28 | | |
Total from Investment Activities | | | (2.00 | ) | | | 3.17 | | | | 0.50 | | | | (0.44 | ) | | | 1.41 | | |
Distributions to Shareholders: | |
Net investment income | | | (0.06 | ) | | | (0.09 | ) | | | (0.13 | ) | | | (0.09 | ) | | | (0.13 | ) | |
Net realized gains from investments | | | (2.63 | ) | | | (0.20 | ) | | | (0.09 | ) | | | (1.87 | ) | | | — | | |
Total Distributions to Shareholders | | | (2.69 | ) | | | (0.29 | ) | | | (1.22 | ) | | | (1.96 | ) | | | (0.13 | ) | |
Net Asset Value, End of Period | | $ | 10.22 | | | $ | 14.91 | | | $ | 12.03 | | | $ | 12.75 | | | $ | 15.15 | | |
Total Return (b) | | | (13.30 | )% | | | 26.45 | % | | | 3.90 | % | | | (3.11 | )% | | | 10.20 | % | |
Ratios/Supplemental Data: | |
Net Assets at end of period (000) | | $ | 28,130 | | | $ | 38,877 | | | $ | 33,987 | | | $ | 38,441 | | | $ | 48,524 | | |
Ratio of net expenses to average net assets | | | 0.96 | % | | | 0.94 | % | | | 1.08 | % | | | 1.14 | % | | | 1.16 | % | |
Ratio of net investment income (loss) to average net assets | | | 0.50 | % | | | 0.68 | % | | | 1.06 | % | | | 0.56 | % | | | 0.89 | % | |
Portfolio turnover | | | 114 | % | | | 138 | % | | | 86 | % | | | 78 | % | | | 70 | % | |
(a) Per share net investment income (loss) has been calculated using the average daily shares method.
(b) Total returns do not include any insurance, sales or administrative charges of variable annuity or life insurance contracts. If these charges were included, the returns would be lower.
See notes to financial statements.
10
Notes to Financial Statements
Victory Variable Insurance Funds December 31, 2018
1. Organization:
Victory Variable Insurance Funds (the "Trust") was organized on February 11, 1998 as a Delaware statutory trust. The Trust is registered under the Investment Company Act of 1940, as amended (the "1940 Act"), as a diversified open-end investment company. The Trust is comprised of nine funds and is authorized to issue an unlimited number of shares, which are units of beneficial interest with a par value of $0.001 per share.
The accompanying financial statements are those of the Victory Variable Insurance Diversified Stock Fund (the "Fund"). The Fund offers a single class of shares: Class A Shares. Sales of shares of the Fund may only be made to separate accounts of various life insurance companies.
Under the Trust's organizational documents, its officers and trustees are indemnified against certain liabilities arising out of the performance of their duties to the Fund. In addition, in the normal course of business, the Fund enters into contracts with its vendors and others that provide for general indemnifications. The Fund's maximum exposure under these arrangements is unknown, as this would involve future claims that may be made against the Fund. However, based on experience, the Fund expects that risk of loss to be remote.
2. Significant Accounting Policies:
The following is a summary of significant accounting policies followed by the Trust in the preparation of its financial statements. The policies are in conformity with accounting principles generally accepted in the United States of America ("GAAP"). The preparation of financial statements in accordance with GAAP requires management to make estimates and assumptions that affect the reported amounts of assets and liabilities and disclosure of contingent assets and liabilities at the date of the financial statements and the reported amounts of income and expenses for the period. Actual results could differ from those estimates. The Fund follows the specialized accounting and reporting requirements under GAAP that are applicable to investment companies.
Investment Valuation:
The Fund records investments at fair value. Fair value is defined as the price that would be received to sell an asset or paid to transfer a liability in an orderly transaction between market participants at the measurement date.
The valuation techniques described below maximize the use of observable inputs and minimize the use of unobservable inputs in determining fair value. The inputs used for valuing the Fund's investments are summarized in the three broad levels listed below:
• Level 1 — quoted prices in active markets for identical securities
• Level 2 — other significant observable inputs (including quoted prices for similar securities or interest rates applicable to those securities, etc.)
• Level 3 — significant unobservable inputs (including the Fund's own assumptions in determining the fair value of investments)
Changes in valuation techniques may result in transfers in or out of an assigned level within the disclosure hierarchy. The inputs or methodologies used for valuation techniques are not necessarily an indication of the risk associated with entering into those investments.
Portfolio securities listed or traded on securities exchanges, including exchange-traded funds ("ETFs"), American Depositary Receipts ("ADRs") and Rights, are valued at the closing price on the exchange or system where the security is principally traded, if available, or at the Nasdaq Official Closing Price. If there have been no sales for that day on the exchange or system, then a security is valued at the last available bid quotation on the exchange or system where the security is principally traded. In each of these situations, valuations are typically categorized as Level 1 in the fair value hierarchy.
Investments for which there are no such quotations, or for which quotations do not appear reliable, are valued at fair value in accordance with procedures established by and under the general supervision and responsibility of the Trust's Board of Trustees ("Board"). These valuations are typically categorized as Level 2 or Level 3 in the fair value hierarchy, based on the observability of inputs used to determine the fair value.
A summary of the valuations as of December 31, 2018, based upon the three levels defined above, is included in the table below while the breakdown, by category, of investments is disclosed in the Schedule of Portfolio Investments (in thousands):
Investment | | LEVEL 1 —
Quoted Prices | | Total | |
Common Stocks | | $ | 26,023 | | | $ | 26,023 | | |
Exchange-Traded Funds | | | 1,633 | | | | 1,633 | | |
Total | | $ | 27,656 | | | $ | 27,656 | | |
For the year ended December 31, 2018, there were no Level 3 investments for which significant unobservable inputs were used to determine fair value.
Continued
11
Notes to Financial Statements — continued
Victory Variable Insurance Funds December 31, 2018
Investment Companies:
Exchange-Traded Funds:
The Fund may invest in ETFs. ETFs are a type of index fund, the shares of which are bought and sold on a securities exchange. An ETF trades like common stock and represents a fixed portfolio of securities designed to track the performance and dividend yield of a particular domestic or foreign market index. The Fund may purchase shares of an ETF to temporarily gain exposure to a portion of the U.S. or a foreign market while awaiting purchase of underlying securities. The risks of owning an ETF generally reflect the risks of owning the underlying securities they are designed to track, although the lack of liquidity of an ETF could result in it being more volatile. Additionally, ETFs have fees and expenses that reduce their value.
Investment Transactions and Related Income:
Changes in holdings of investments are accounted for no later than one business day following the trade date. For financial reporting purposes, however, investment transactions are accounted for on trade date on the last business day of the reporting period. Interest income is recognized on an accrual basis and includes, where applicable, the amortization of premiums or accretion of discounts. Dividend income is recorded on the ex-dividend date. Gains or losses realized on sales of securities are determined by comparing the identified cost of the security lot sold with the net sales proceeds.
Withholding taxes on interest, dividends and gains as a result of certain investments in ADRs by the Fund have been provided for in accordance with each investment's applicable country's tax rules and rates.
Securities Lending:
The Trust has entered into a Master Securities Lending Agreement ("MSLA") with Citibank, N.A. ("Citibank" or the "Agent"). Under the terms of the MSLA, the Fund may lend securities to certain broker-dealers and banks in exchange for collateral in the amount of at least 102% of the value of U.S. securities loaned or at least 105% of the value of non-U.S. securities loaned, marked-to-market daily. Any collateral shortfalls associated with increases in the valuation of the securities loaned are adjusted the next business day. The collateral can be received in the form of cash collateral and/or non-cash collateral. Non-cash collateral can include U.S. Government Securities, letters of credit and certificates of deposit. The cash collateral is invested in short-term instruments or cash equivalents as noted on the Fund's Schedule of Portfolio Investments. The Trust does not have effective control of the non-cash collateral and therefore it is not disclosed in the Fund's Schedule of Portfolio Investments. The Fund continues to benefit from interest or dividends on the securities loaned and may also earn a return from the collateral. The Fund pays various fees in connection with the investment of cash collateral. The Fund pays the Agent fees based on the investment income received from securities lending activities. Securities lending income is disclosed in the Fund's Statement of Operations. Although risk is mitigated by the collateral, the Fund could experience a delay in recovering its securities and possible loss of income or value if the borrower fails to return them.
Securities lending transactions are entered into by the Fund under the MSLA, which permits the Fund, under certain circumstances such as an event of default, to offset amounts payable by the Fund to the same counterparty against amounts receivable from the counterparty to create a net payment due to or from the Fund.
The following table (in thousands) is a summary of the Fund's securities lending transactions which are subject to offset under the MSLA as of December 31, 2018. These transactions are accounted for as secured borrowings with an overnight and continuous contractual maturity for cash collateral, and greater than overnight and continuous contractual maturity for non-cash collateral.
Gross
Amount of
Recognized
Assets
(Value of | | Value of
Cash | | Value of Non-cash Collateral
Received by Maturity | | | |
Securities
on Loan) | | Collateral
Received | | <30 Days | | Between 30
& 90 Days | | >90 Days | | Net Amount | |
| $ | 150 | | | $ | — | | | $ | — | | | $ | — | | | $ | 158 | | | $ | 8 | | |
Dividends to Shareholders:
Dividends from net investment income, if any, are declared and paid quarterly by the Fund. Distributable net realized gains, if any, are declared and distributed at least annually.
The amounts of dividends from net investment income and distributions from net realized gains are determined in accordance with federal income tax regulations, which may differ from GAAP. To the extent these "book/tax" differences are permanent in nature (e.g., net operating loss, distribution reclassification, and deemed distribution due to shareholder redemptions), such amounts are reclassified within the components of net assets based on their federal tax-basis treatment; temporary differences (e.g., wash sales) do not require reclassification. To the extent dividends and distributions exceed net investment income and net realized gains for tax purposes, they are reported as distributions of capital. Net investment losses incurred by the Fund may be reclassified as an offset to capital on the accompanying Statement of Assets and Liabilities.
Continued
12
Notes to Financial Statements — continued
Victory Variable Insurance Funds December 31, 2018
As of December 31, 2018, on the Statement of Assets and Liabilities, there were no permanent book-to-tax differences reclassification adjustments.
Federal Income Taxes:
It is the policy of the Fund to continue to qualify as a regulated investment company by complying with the provisions available to certain investment companies, as defined in applicable sections of the Internal Revenue Code, and to make distributions of net investment income and net realized gains sufficient to relieve it from all, or substantially all, federal income taxes. Accordingly, no provision for federal income taxes is required in the financial statements. The Fund has a tax year end of December 31.
Management of the Fund has reviewed tax positions taken in tax years that remain subject to examination by all major tax jurisdictions, including federal (i.e., the last four tax year ends and the interim tax period since then). Management believes that there is no tax liability resulting from unrecognized tax benefits related to uncertain tax positions taken.
Allocations:
Expenses directly attributable to the Fund are charged to the Fund, while expenses which are attributable to more than one fund in the Trust, or jointly with an affiliated trust, are allocated among the respective funds in the Trust and/or affiliated trust based upon net assets or another appropriate basis.
Affiliated Securities Transactions:
Pursuant to Rule 17a-7 under the 1940 Act, the Fund may engage in securities transactions with affiliated investment companies and advisory accounts managed by the Adviser and any applicable sub-adviser. Any such purchase or sale transaction must be effected without brokerage commission or other remuneration, except for customary transfer fees. The transaction must be effected at the current market price, which is either the security's last sale price on an exchange or, if there are no transactions in the security that day, at the average of the highest bid and lowest asked price. For the year ended December 31, 2018, the Fund did not engage in any Rule 17a-7 transactions under the 1940 Act.
3. Purchases and Sales of Securities:
Purchases and sales of securities (excluding securities maturing less than one year from acquisition) for the year ended December 31, 2018 were as follows for the Fund (in thousands):
| Purchases | | Sales | |
| $ | 39,137 | | | $ | 45,801 | | |
For the year ended December 31, 2018, there were no purchases or sales of U.S. Government Securities.
4. Fees and Transactions with Affiliates and Related Parties:
Investment advisory services are provided to the Fund by Victory Capital Management Inc. ("VCM" or the "Adviser"), a New York corporation registered as an investment adviser with the Securities and Exchange Commission ("SEC"). The Adviser is a wholly-owned indirect subsidiary of Victory Capital Holdings Inc., a publicly traded Delaware corporation and a wholly-owned direct subsidiary of Victory Capital Operating, LLC.
Under the terms of the Investment Advisory Agreement, the Adviser is entitled to receive 0.30% of the average daily net assets of the Fund. The Adviser may use its resources to assist with the Fund's distribution and marketing expenses.
VCM also serves as the Fund's administrator and fund accountant. Under an Administration and Fund Accounting Agreement, VCM is paid for its services an annual fee at a rate of 0.08% of the first $15 billion in average daily net assets of the Trust, Victory Portfolios and Victory Portfolios II (collectively, the "Trusts"), 0.05% of the average daily net assets above $15 billion to $30 billion of the Trusts and 0.04% of the average daily net assets over $30 billion of the Trusts.
Citi Fund Services Ohio, Inc. ("Citi"), an affiliate of Citibank, N.A., acts as sub-administrator and sub-fund accountant to the Fund pursuant to a Sub-Administration and Sub-Fund Accounting Services Agreement between VCM and Citi. VCM pays Citi a fee for providing these services. The Trust reimburses VCM and Citi for all of their reasonable out-of-pocket expenses incurred in providing these services.
FIS Investor Services, LLC ("FIS") serves as the Fund's transfer agent. Under the Transfer Agent Agreement, the Trust pays FIS a fee for its services and reimburses FIS for all of their reasonable out-of-pocket expenses incurred in providing these services.
The Chief Compliance Officer ("CCO") is an employee of the Adviser, which pays the compensation of the CCO and his support staff. The Trust has entered into an Agreement to provide compliance services with the Adviser, pursuant to which the Adviser furnishes its compliance personnel, including the services of the CCO, and other resources reasonably necessary to provide the Trust with compliance oversight services related to the design, administration and oversight of a compliance program for the Trust in accordance with
Continued
13
Notes to Financial Statements — continued
Victory Variable Insurance Funds December 31, 2018
Rule 38a-1 under the 1940 Act. Funds in the Trust, Victory Portfolios, Victory Institutional Funds, and Victory Portfolios II (collectively, the "Victory Funds Complex"), in the aggregate, compensate the Adviser for these services.
The Victory Funds Complex pays an annual retainer to each Independent Trustee, plus an additional annual retainer to the Chairman of the Board. The aggregate amount of the fees and expenses of the Independent Trustees are allocated amongst all the funds in the Victory Funds Complex and are presented in the Statement of Operations.
Shearman & Sterling LLP provides legal services to the Trust.
Victory Capital Advisers, Inc. (the "Distributor"), an affiliate of the Adviser, serves as distributor for the continuous offering of the shares of the Fund pursuant to a Distribution Agreement between the Distributor and the Trust. Pursuant to the Trust's Distribution and Service Plans adopted in accordance with Rule 12b-1 under the 1940 Act, the Distributor may receive a monthly distribution and service fee, at an annual rate of 0.25% of the average daily net assets of the Fund. The Distributor may pay a 12b-1 fee to life insurance companies for activities primarily intended to result in the sale of Fund shares to life insurance companies for the purpose of funding variable annuity contracts and variable life insurance policies or to provide services to owners of variable annuity contracts and variable life insurance policies whose contracts or policies are funded with shares of the Fund, which services are not otherwise provided by life insurance companies and paid for with fees charged by life insurance companies. The Distributor re-allowed all except for approximately $1 thousand to life insurance companies to provide these services.
The Fund has entered into Contract Owner Administrative Services Agreements with certain contract owner servicing agents. A contract owner servicing agent performs a number of services for its customers who hold contracts offered by separate accounts that invest in the Fund, such as establishing and maintaining accounts and records, processing additional contract units attributable to Fund dividend payments, arranging for bank wires, assisting in transactions, and changing account information. For these services, Class A Shares of the Fund pay a fee at an annual rate of up to 0.25% of its average daily net assets serviced by the agent. The Fund may enter into these agreements with financial institutions that provide such services. Contract owner servicing agents may waive all or a portion of their fee. (Not all agents may provide all services listed above.)
The Adviser may voluntarily waive or reimburse additional fees to assist the Fund in maintaining a competitive expense ratio. Voluntary waivers and reimbursements applicable to the Fund are not available to be recouped at a future time. There were no voluntary waivers or reimbursements for the year ended December 31, 2018.
Certain officers and/or interested trustees of the Fund are also officers and/or employees of the Adviser, Administrator, Fund Accountant, Sub-Administrator, Sub-Fund Accountant, and Legal.
5. Risks:
The Fund may be subject to other risks in addition to these identified risks.
An investment in the Fund's shares represents an indirect investment in the securities owned by the Fund, some of which will be traded on a national securities exchange or in the over-the-counter markets. The value of the securities in which the Fund invests, like other market investments, may move up or down, sometimes rapidly and unpredictably. The value of the securities in which the Fund invests may affect the value of the Fund's shares. An investment in the Fund's shares at any point in time may be worth less than the original investment, even after taking into account the reinvestment of the Fund's distributions.
The Fund will be subject to credit risk with respect to the amount it expects to receive from counterparties for financial instruments entered into by the Fund. The Fund may be negatively impacted if a counterparty becomes bankrupt or otherwise fails to perform its obligations due to financial difficulties. The Fund may experience significant delays in obtaining any recovery in bankruptcy or other reorganization proceeding and the Fund may obtain only limited recovery or may obtain no recovery in such circumstances. The Fund typically enters into transactions with counterparties whose credit ratings are investment grade, as determined by a nationally recognized statistical rating organization or, if unrated, judged by the Adviser to be of comparable quality.
6. Borrowing and Interfund Lending:
Line of Credit:
The Victory Funds Complex participates in a short-term, demand note "Line of Credit" agreement with Citibank. Under the agreement with Citibank, the Victory Trusts may borrow up to $250 million, of which $100 million is committed and $150 million is uncommitted. $40 million of the Line of Credit is reserved for use by the Victory Floating Rate Fund, another series of the Victory Funds Complex, with that Fund paying the related commitment fees for that amount. The purpose of the agreement is to meet temporary or emergency cash needs, including redemption requests that might otherwise require the untimely disposition of securities. The current agreement was amended on July 27, 2018 with a new termination date of July 26, 2019. Citibank receives an annual commitment fee of 0.15% on $100 million for providing the Line of Credit. For the year ended December 31, 2018, Citibank earned approximately $150,000 in commitment fees from the Victory Funds Complex. Each fund in the Victory Funds Complex pays a pro-rata portion of the commitment
Continued
14
Notes to Financial Statements — continued
Victory Variable Insurance Funds December 31, 2018
fees plus any interest on amounts borrowed. Interest accrued by the Fund during the period is presented on the Statement of Operations under Interest expense on line of credit.
The Fund did not utilize or participate in the Line of Credit during the year ended December 31, 2018.
Interfund Lending:
The Trust and Adviser rely on an exemptive order granted by the SEC in March 2017 (the "Order"), permitting the establishment and operation of an Interfund Lending Facility (the "Facility"). The Facility allows the Fund to directly lend and borrow money to or from any other Victory Fund relying upon the Order at rates beneficial to both the borrowing and lending funds. Advances under the Facility are allowed for temporary or emergency purposes, including the meeting of redemption requests that otherwise might require the untimely disposition of securities, and are subject to each Fund's borrowing restrictions. The interfund loan rate is determined, as specified in the Order, by averaging the current repurchase agreement rate and the current bank loan rate. Interest accrued by the Fund during the period is presented on the Statement of Operations under Interest expense on interfund lending.
The average loans for the days outstanding and average interest rate for the Fund during the year ended December 31, 2018 were as follows (in thousands):
Borrower or
Lender | | Amount
Outstanding at
December 31, 2018 | | Average
Borrowing* | | Days
Borrowing
Outstanding | | Average
Interest
Rate* | | Maximum
Borrowing
During the
Period | |
| Borrower | | $ | — | | | $ | 137 | | | | 1 | | | | 2.09 | % | | $ | 137 | | |
* For the year ended December 31, 2018, based on the number of days borrowings were outstanding.
7. Federal Income Tax Information:
The tax character of distributions paid during the tax years ended, as noted below, were as follows (total distributions paid may differ from the Statements of Changes in Net Assets because, for tax purposes, dividends are recognized when actually paid) (in thousands):
| | | Year Ended December 31, 2018
Distributions paid from | |
| | | Ordinary
Income | | Net
Long-Term
Capital
Gains | | Total
Distributions
Paid | |
| | | | | $ | 2,582 | | | $ | 3,339 | | | $ | 5,921 | | |
| | | Year Ended December 31, 2017
Distributions paid from | |
| | | Ordinary
Income | | Net
Long-Term
Capital
Gains | | Total
Distributions
Paid | |
| | | | | $ | 242 | | | $ | 517 | | | $ | 759 | | |
As of the tax year ended December 31, 2018, the components of accumulated earnings (deficit) on a tax basis were as follows (in thousands):
Undistributed
Ordinary
Income | | Undistributed
Long-Term
Capital Gains | | Accumulated
Earnings | | Unrealized
Appreciation/
(Depreciation)* | | Total
Accumulated
Earnings/
(Deficit) | |
| $ | 264 | | | $ | 1,443 | | | $ | 1,707 | | | $ | 634 | | | $ | 2,341 | | |
* The difference between the book-basis and tax-basis unrealized appreciation (depreciation) is attributable primarily to tax deferral of losses on wash sales.
Continued
15
Notes to Financial Statements — continued
Victory Variable Insurance Funds December 31, 2018
During the tax year ended December 31, 2018, the Fund did not utilize capital loss carryforwards.
As of December 31, 2018, the cost basis for federal income tax purposes, gross unrealized appreciation, gross unrealized depreciation and net unrealized appreciation (depreciation) for investments were as follows (in thousands):
Cost of
Investments
for Federal
Tax Purposes | | Gross
Unrealized
Appreciation | | Gross
Unrealized
Depreciation | | Net
Unrealized
Appreciation
(Depreciation) | |
| $ | 27,022 | | | $ | 7,018 | | | $ | (6,384 | ) | | $ | 634 | | |
8. Fund Ownership:
Ownership of more than 25% of the voting securities of a fund creates presumptions of control of the fund, under section 2(a)(9) of the 1940 Act. As of December 31, 2018, the shareholders listed below held more than 25% of the shares outstanding of the Fund and may be deemed to control the Fund.
| Shareholder | | Percent | |
| New York Life Insurance and Annuity Corporation | | | 90.2 | % | |
9. Recent Accounting Pronouncements:
In October 2016, the SEC released its Final Rules on Investment Company Reporting Modernization (the "Rules"). The Rules introduced two new regulatory reporting forms for investment companies, Form N-PORT and Form N-CEN. The Fund's compliance date for Form N-PORT was June 1, 2018, and the Fund will make its initial filing with the SEC on Form N-PORT for the period ending March 31, 2019. Effective with the period ended June 30, 2018, the Fund was required to maintain, and make available to the SEC upon request, the information required to be included in Form N-PORT. Form N-PORT will replace Form N-Q filings effective with the requirement to file the Form N-PORT with the SEC for the period ending March 31, 2019. The Fund's compliance date for Form N-CEN was June 1, 2018, and the Fund will make its initial filing on Form N-CEN for the period ended December 31, 2018. Form N-CEN will replace Form N-SAR filings. The Fund's adoption of these amendments have no effect on the Fund's net assets or results of operations.
In August 2018, the FASB issued ASU No. 2018-13, "Fair Value Measurements" ("ASU 2018-13"). This update makes certain removals from, changes to and additions to existing disclosure requirements for fair value measurements. ASU 2018-13 does not change fair value measurements already required or permitted by existing standards. ASU 2018-13 is effective for financial statements issued for fiscal years beginning after December 15, 2019, and interim periods within those fiscal years. As permitted, the Fund has early adopted ASU 2018-13 with the financial statements prepared as of December 31, 2018.
In August 2018, the SEC adopted amendments to certain financial statement disclosure requirements to conform them to GAAP for investment companies. These amendments made certain disclosure requirements effective under Regulation S-X. The Fund's adoption of these amendments, effective with the financial statements prepared as of December 31, 2018 had no effect on the Fund's net assets or results of operations. As a result of adopting these amendments, the distributions to shareholders in the December 31, 2017 Statements of Changes in Net Assets presented herein have been reclassified to conform to the current year presentation, which includes all distributions to each class of shareholders, other than tax basis return of capital distributions, in one line item per share class. Distributions to shareholders for the year ended December 31, 2017 from net investment income and net realized gains in the Fund were as follows (in thousands):
Distributions to Shareholders:
From net investment income: | | $ | (242 | ) | |
From net Realized Gains: | | | (517 | ) | |
10. Subsequent Events:
The Fund has evaluated the need for additional disclosures or adjustments resulting from subsequent events through the date these financial statements were issued. Based on this evaluation, there were no subsequent events to report that would have a material impact on the Fund's financial statements.
16
REPORT OF INDEPENDENT REGISTERED PUBLIC ACCOUNTING FIRM
To the Shareholders and the Board of Trustees of Diversified Stock Fund
Opinion on the Financial Statements
We have audited the accompanying statement of assets and liabilities of Diversified Stock Fund (the "Fund") (one of the funds constituting the Victory Variable Insurance Funds (the "Trust")), including the portfolio of investments, as of December 31, 2018, and the related statement of operations for the year then ended, the statements of changes in net assets for each of the two years in the period then ended, the financial highlights for each of the three years in the period then ended and the related notes (collectively referred to as the "financial statements"). In our opinion, the financial statements present fairly, in all material respects, the financial position of the Fund (one of the funds constituting the Trust) at December 31, 2018, and the results of its operations for the year then ended, the changes in its net assets for each of the two years in the period then ended and its financial highlights for each of the three years in the period then ended, in conformity with U.S. generally accepted accounting principles.
The financial highlights of the Fund for each of the periods presented through December 31, 2015 were audited by other auditors, whose report dated February 22, 2016 expressed an unqualified opinion on those financial highlights.
Basis for Opinion
These financial statements are the responsibility of the Trust's management. Our responsibility is to express an opinion on the Fund's financial statements based on our audits. We are a public accounting firm registered with the Public Company Accounting Oversight Board (United States) (PCAOB) and are required to be independent with respect to the Trust in accordance with the U.S. federal securities laws and the applicable rules and regulations of the Securities and Exchange Commission and the PCAOB.
We conducted our audits in accordance with the standards of the PCAOB. Those standards require that we plan and perform the audit to obtain reasonable assurance about whether the financial statements are free of material misstatement, whether due to error or fraud. The Trust is not required to have, nor were we engaged to perform, an audit of the Trust's internal control over financial reporting. As part of our audit we are required to obtain an understanding of internal control over financial reporting but not for the purpose of expressing an opinion on the effectiveness of the Trust's internal control over financial reporting. Accordingly, we express no such opinion.
Our audits included performing procedures to assess the risks of material misstatement of the financial statements, whether due to error or fraud, and performing procedures that respond to those risks. Such procedures included examining, on a test basis, evidence regarding the amounts and disclosures in the financial statements. Our procedures included confirmation of securities owned as of December 31, 2018, by correspondence with the custodian, transfer agent, and brokers or by other appropriate auditing procedures where replies from brokers were not received. Our audits also included evaluating the accounting principles used and significant estimates made by management, as well as evaluating the overall presentation of the financial statements. We believe that our audits provide a reasonable basis for our opinion.

We have served as the auditor of one or more Victory Capital's investment companies since 1995.
Cincinnati, Ohio
February 15, 2019
17
Supplemental Information
Victory Variable Insurance Funds December 31, 2018
(Unaudited)
Trustee and Officer Information
Board of Trustees:
Overall responsibility for management of the Trust rests with the Board. The Trust is managed by the Board in accordance with the laws of the State of Delaware. There are currently ten Trustees, nine of whom are not "interested persons" of the Trust within the meaning of that term under the 1940 Act ("Independent Trustees") and one of whom is an "interested person" of the Trust within the meaning of that term under the 1940 Act ("Interested Trustee"). The Trustees, in turn, elect the officers of the Trust to actively supervise its day-to-day operations.
The following tables list the Trustees, their ages, position with the Trust, commencement of service, principal occupations during the past five years and any directorships of other investment companies or companies whose securities are registered under the Securities Exchange Act of 1934, as amended, or who file reports under that Act. Each Trustee oversees nine portfolios in the Trust, one portfolio in Victory Institutional Funds, 42 portfolios in Victory Portfolios and 20 portfolios in Victory Portfolios II, each a registered investment company that, together with the Trust, comprise the Victory Funds Complex. Each Trustee's address is c/o Victory Variable Insurance Funds, 4900 Tiedeman Road, 4th Floor, Brooklyn, Ohio 44144. Each Trustee has an indefinite term.
Name and Age | | Position Held
with the Trust | | Date
Commenced
Service | | Principal Occupation
During Past 5 Years | | Other Directorships
Held
During Past 5 Years | |
Independent Trustees. | | | | | | | | | |
David Brooks Adcock, 67 | | Trustee | | February 2005 | | Consultant (since 2006). | | Chair and Trustee, Turner Funds (December 2016-December 2017). | |
Nigel D.T. Andrews, 71 | | Vice Chair and Trustee | | August 2002 | | Retired. | | Director, TCG BDC II, Inc. (since 2017); Director, TCG BDC I, Inc. (formerly Carlyle GMS Finance, Inc.) (since 2012); Director, Old Mutual US Asset Management (2002-2014). | |
E. Lee Beard, 67* | | Trustee | | February 2005 | | Retired (since 2015); Consultant, The Henlee Group, LLC (consulting) (2005-2015). | | None. | |
Dennis M. Bushe, 75 | | Trustee | | July 2016 | | Retired. | | Trustee, RS Investment Trust and RS Variable Products Trust (November 2011-July 2016). | |
Sally M. Dungan, 64 | | Trustee | | February 2011 | | Chief Investment Officer, Tufts University (since 2002). | | None. | |
John L. Kelly, 65 | | Trustee | | February 2015 | | Partner, McCarvill Capital Partners (September 2016-September 2017); Advisor (January 2016-April 2016) and Managing Partner (August 2014-January 2016), Endgate Commodities LLC; Chief Operating Officer, Liquidnet Holdings, Inc. (2011-2014). | | Director, Caledonia Mining Corporation (since May 2012). | |
David L. Meyer, 61* | | Trustee | | December 2008 | | Retired. | | None. | |
Gloria S. Nelund, 57 | | Trustee | | July 2016 | | Chair, CEO and Co-Founder of TriLinc Global, LLC, an investment firm. | | TriLinc Global Impact Fund, LLC (since 2012); Trustee, RS Investment Trust and RS Variable Products Trust (November 2007-July 2016). | |
Leigh A. Wilson, 74 | | Chair and Trustee | | February 1998 | | Private Investor. | | Chair (since 2013), Caledonia Mining Corporation. | |
Interested Trustee. | | | | | | | | | |
David C. Brown, 46** | | Trustee | | May 2008 | | Chairman and Chief Executive Officer (since 2013), Co-Chief Executive Officer (2011-2013), the Adviser; Chairman and Chief Executive Officer, Victory Capital Holdings, Inc. (since 2013). | | None. | |
* The Board has designated Mr. Meyer and Ms. Beard as its Audit Committee Financial Experts.
** Mr. Brown is an "Interested Person" by reason of his relationship with the Adviser.
The Statement of Additional Information includes additional information about the Trustees of the Trust and is available, without charge, by calling 800-539-3863.
Continued
18
Supplemental Information — continued
Victory Variable Insurance Funds December 31, 2018
(Unaudited)
Officers:
The officers of the Trust, their ages, commencement of service and their principal occupations during the past five years, are detailed in the following table. Each officer serves until the earlier of his or her resignation, removal, retirement, death, or the election of a successor. The mailing address of each officer of the Trust is 4900 Tiedeman Road, 4th Floor, Brooklyn, Ohio 44144. The officers of the Trust receive no compensation directly from the Trust for performing the duties of their offices.
Name and Age | | Position with
the Trust | | Date Commenced
Service | | Principal Occupation During Past 5 Years | |
Christopher K. Dyer, 57 | | President | | February 2006* | | Director of Mutual Fund Administration, the Adviser. | |
Scott A. Stahorsky, 49 | | Vice President | | December 2014 | | Manager, Fund Administration, the Adviser (since 2015); Senior Analyst, Fund Administration, the Adviser (prior to 2015). | |
Erin G. Wagner, 45 | | Secretary | | December 2014 | | Associate General Counsel, the Adviser (since 2013). | |
Allan Shaer, 53 | | Treasurer | | May 2017 | | Senior Vice President, Financial Administration, Citi Fund Services Ohio, Inc. (since 2016); Vice President, Mutual Fund Administration, JP Morgan Chase (2011-2016). | |
Christopher A. Ponte, 34 | | Assistant Treasurer | | December 2017 | | Manager, Fund Administration, the Adviser (since 2017); Senior Analyst, Fund Administration, the Adviser (prior to 2017), Chief Financial Officer, Victory Capital Advisers, Inc. (since 2018). | |
Colin Kinney, 45 | | Chief Compliance Officer | | July 2017 | | Chief Compliance Officer (since 2013) and Chief Risk Officer (2009-2017), the Adviser. | |
Chuck Booth, 58 | | Anti-Money Laundering Compliance Officer and Identity Theft Officer | | May 2015 | | Director, Regulatory Administration and CCO Support Services, Citi Fund Services Ohio, Inc. | |
Jay G. Baris, 65 | | Assistant Secretary | | February 1998 | | Partner, Shearman & Sterling LLP (since 2018); Partner, Morrison & Foerster LLP (2011-2017). | |
* On December 3, 2014, Mr. Dyer resigned as Secretary of the Trust and accepted the position of President.
Continued
19
Supplemental Information — continued
Victory Variable Insurance Funds December 31, 2018
(Unaudited)
Proxy Voting and Form N-Q Information
Proxy Voting:
Information regarding the policies and procedures that the Fund uses to determine how to vote proxies relating to portfolio securities is available without charge, upon request, by calling 800-539-3863. The information is also included in the Fund's Statement of Additional Information, which is available on the SEC's website at www.sec.gov.
Information relating to how the Fund voted proxies relating to portfolio securities held during the most recent twelve months ended June 30 is available on the SEC's website at www.sec.gov.
Availability of Schedules of Portfolio Investments:
The Trust expects to file a complete list of Schedules of Portfolio Investments with the SEC for the first and third quarter of each fiscal year on Form N-PORT beginning March 1, 2019. Prior to that date, the Trust has filed a complete list of Schedules of Portfolio Investments with the SEC for the first and third quarters of each fiscal year on Form N-Q. Forms N-PORT and Forms N-Q are available on the SEC's website at www.sec.gov.
Expense Examples
As a shareholder of the Fund, you may incur two types of costs: (1) transaction costs and (2) ongoing costs, including management fees, distribution and service (12b-1) fees, and other Fund expenses. These examples are intended to help you understand your ongoing costs (in dollars) of investing in the Fund and to compare these costs with the ongoing costs of investing in other mutual funds.
These examples are based on an investment of $1,000 invested at the beginning of the period and held for the entire period from July 1, 2018 through December 31, 2018.
The Actual Expense figures in the table below provide information about actual account values and actual expenses. You may use the information below, together with the amount you invested, to estimate the expenses that you paid over the period. Simply divide your account value by $1,000 (for example, an $8,600 account value divided by $1,000 = 8.6), then multiply the result by the number in the table under the heading entitled "Actual Expenses Paid During Period" to estimate the expenses you paid on your account during this period.
The Hypothetical Expense figures in the table below provide information about hypothetical account values and hypothetical expenses based on the Fund's actual expense ratio and an assumed rate of return of 5% per year before expenses, which is not the Fund's actual return. The hypothetical account values and expenses may not be used to estimate the actual ending account balance or expenses you paid for the period. You may use this information to compare this 5% hypothetical example with the 5% hypothetical examples that appear in shareholder reports of other funds.
Please note the expenses shown in the table are meant to highlight your ongoing costs only and do not reflect any transactional costs. Therefore, the table is useful in comparing ongoing costs only, and will not help you determine the relative total costs of owning different funds. In addition, if these transactional costs were included, your costs would have been higher.
| | | Beginning
Account Value
7/1/18 | | Actual Ending
Account Value
12/31/18 | | Hypothetical
Ending
Account Value
12/31/18 | | Actual
Expenses Paid
During Period
7/1/18-12/31/18* | | Hypothetical
Expenses Paid
During Period
7/1/18-12/31/18* | | Annualized
Expense Ratio
During Period
7/1/18-12/31/18 | |
| | | | | $ | 1,000.00 | | | $ | 894.40 | | | $ | 1,020.37 | | | $ | 4.58 | | | $ | 4.89 | | | | 0.96 | % | |
* Expenses are equal to the average account value multiplied by the Fund's annualized expense ratio multiplied by 184/365 (the number of days in the most recent fiscal half-year divided by the number of days in the fiscal year).
Continued
20
Supplemental Information — continued
Victory Variable Insurance Funds December 31, 2018
(Unaudited)
Additional Federal Income Tax Information
For the year ended December 31, 2018, the Fund paid qualified dividend income for purposes of reduced individual federal income tax rates of 5%.
Dividends qualifying for corporate dividends received a deduction of 5%.
For the year ended December 31, 2018, the Fund designated short-term and long-term capital gain distributions in the amount of $2,435 and $3,339, respectively.
Continued
21
Supplemental Information — continued
Victory Variable Insurance Funds December 31, 2018
(Unaudited)
Considerations of the Board in Continuing the Investment Advisory Agreement (the "Agreement")
The Board approved the Agreement on behalf of the Fund at a meeting, which was called for that purpose, on December 5, 2018. The Board also considered information relating to the Fund and the Agreement provided throughout the year and, more specifically, at a meeting on October 23, 2018. In considering whether to approve the Agreement, the Board requested, and the Adviser provided, information that the Board believed to be reasonably necessary to reach its conclusions. The Board, including the Independent Trustees, evaluated this information along with other information obtained throughout the year and was advised by legal counsel to the Fund and by independent legal counsel to the Independent Trustees. In addition, in 2017 the Independent Trustees, through their counsel, retained an independent consultant to assist with a review of the overall process for conducting the annual review of these advisory arrangements. The Board considered the Fund's advisory fee, expense ratio and investment performance as significant factors in determining whether the Agreement should be continued. In considering whether the compensation paid to the Adviser was fair and reasonable, the Board also evaluated, among other things, the following factors:
• The requirements of the Fund for the services provided by the Adviser;
• The nature, quality and extent of the services provided and expected to be provided;
• The performance of the Fund as compared to comparable funds;
• The fees payable for the services and whether the fee arrangements provided for economies of scale that would benefit Fund shareholders as the Fund grows;
• Whether the fee would be sufficient to enable the Adviser to attract and retain experienced personnel and continue to provide quality services to the Fund;
• Fees paid by other clients of the Adviser whose accounts are managed in a similar investment style and any differences in the services provided to the other clients compared to those provided to the Fund;
• Total expenses of the Fund, taking into consideration any distribution or shareholder servicing fees;
• Management's commitment to operating the Fund at competitive expense levels;
• The profitability of the Adviser (as reflected by comparing fees earned against an estimate of the Adviser's costs) with respect to the Adviser's relationship with the Fund;
• Research and other service benefits received by the Adviser obtained through payment of client commissions for securities transactions;
• Other benefits received by the Adviser, and its affiliates, including revenues paid to the Adviser, or its affiliates, by the Fund for administration and fund accounting services, and distribution;
• The capabilities and financial condition of the Adviser;
• Current economic and industry trends; and
• The historical relationship between the Fund and the Adviser.
The Board reviewed the Fund's current management fee, comprised of the advisory fee plus the administrative services fee paid to the Adviser, in the context of the Adviser's profitability of the Fund. In addition, the Board compared the Fund's total operating expense ratio on a net and gross basis, taking into consideration any distribution or shareholder servicing fees and management fees with a universe of comparable mutual funds compiled by an independent consultant, FUSE Research Network, LLC ("FUSE"), and a peer group of funds with similar investment strategies selected by FUSE from the universe. The Board reviewed the factors and methodology used by FUSE in the selection of the Fund's peer group, including FUSE's selection of a broad universe of funds using the standard Retail Morningstar Categories, the more specific universe of comparable funds, and peer groups of funds with comparable investment strategies and asset levels, among other factors. The Board also reviewed any changes to FUSE's methodology as compared to the prior year, including as a result of input from the Adviser, if any. With respect to the Fund, the Board also reviewed fees and other information related to the Adviser's management of similarly managed institutional or private accounts, and the differences in the services provided to the other accounts. The Board noted that the advisory fee arrangements for the Fund do not include breakpoints, which are generally viewed as a method by which the investment adviser shares any economies of scale with a fund as a fund grows.
The Board reviewed the Fund's performance over one-, three-, five- and ten-year periods against the performance of the Fund's selected peer group and benchmark index. The Board recognized that the performance of the Fund and the peer group funds are net of expenses, while the performance of the benchmark index is gross returns. The Board considered the additional resources that the Adviser has committed to enhance portfolio analysis, compliance and trading systems.
The Board reviewed various other specific factors with respect to the Fund, as described below. In their deliberations, the Trustees did not rank the importance of any particular information or factor considered and each Trustee may have attributed different weights to various factors.
The Board concluded that the Fund's gross annual management fee was reasonable as compared to the median gross management fee charged to the funds in the Fund's peer group. The Board noted that the Fund's Class A net annual expense ratio, taking into account any shareholder servicing or distribution fees, was reasonable as compared to the median expense ratio for the peer group. The Board then compared the Fund's Class A performance for the one-, three-, five- and ten-year periods ended June 30, 2018, to that of the median performance of the peer group and benchmark index for the same periods and considered the fact that the Fund underperformed the benchmark index for all of the periods reviewed, underperformed the peer group for the three-, five- and ten-year periods, and outperformed the peer group for the one-year period. The Board brought the Fund's underperformance to management's attention and discussed with the Adviser any steps that had been or could be taken to enhance performance in the future.
Having considered, among other things: (1) that the Fund's management fee was within the ranges of advisory fees charged to comparable mutual funds; (2) that the Fund's total expense ratio was reasonable; and (3) the performance of the Fund, the Board concluded that the Agreement continued to be in the best interests of the Series' shareholders.
Conclusion
Based on its review of the information requested and provided, and following extended discussions, the Board determined that the Agreement, on behalf of the Fund, was consistent with the best interests of the Fund and its shareholders, and the Board unanimously approved the Agreement, on behalf of the Fund, for an additional annual period on the basis of the foregoing review and discussions and the following considerations, among others:
• The fairness and reasonableness of the investment advisory fee payable to the Adviser under the Agreement in light of the investment advisory services provided, the costs of these services, the profitability of the Adviser's relationship with the Fund and the comparability of the fee paid to the fees paid by other investment companies;
• The nature, quality and extent of the investment advisory services provided by the Adviser;
Continued
22
Supplemental Information — continued
Victory Variable Insurance Funds December 31, 2018
(Unaudited)
• The Adviser's entrepreneurial commitment to the management of the Fund and the creation of a broad-based family of funds, which could entail a substantial commitment of the Adviser's resources to the successful operation of the Fund;
• The Adviser's representations regarding its staffing and capabilities to manage the Fund, including the retention of personnel with relevant portfolio management experience;
• The Adviser's efforts to enhance investment results by, among other things, developing quality portfolio management teams; and
• The overall high quality of the personnel, operations, financial condition, investment management capabilities, methodologies and performance of the Adviser.
23
Privacy Policy
Protecting the Privacy of Information
The Trust respects your right to privacy. We also know that you expect us to conduct and process your business in an accurate and efficient manner. To do so, we must collect and maintain certain personal information about you. This is the information we collect from you on applications or other forms, and from the transactions you make with us or third parties. It may include your name, address, social security number, account transactions and balances, and information about investment goals and risk tolerance.
We do not disclose any information about you or about former customers to anyone except as permitted or required by law. Specifically, we may disclose the information we collect to companies that perform services on our behalf, such as the transfer agent that processes shareholder accounts and printers and mailers that assist us in the distribution of investor materials. We may also disclose this information to companies that perform marketing services on our behalf. This allows us to continue to offer you Victory investment products and services that meet your investing needs, and to effect transactions that you request or authorize. These companies will use this information only in connection with the services for which we hired them. They are not permitted to use or share this information for any other purpose.
To protect your personal information internally, we permit access only by authorized employees and maintain physical, electronic and procedural safeguards to guard your personal information.*
* You may have received communications regarding information about privacy policies from other financial institutions which gave you the opportunity to "opt-out" of certain information sharing with companies which are not affiliated with that financial institution. The Trust does not share information with other companies for purposes of marketing solicitations for products other than the Trust. Therefore, the Trust does not provide opt-out options to their shareholders.

Visit our web site at:
www.vcm.com | | Call Victory at:
800-539-FUND (800-539-3863) | |
VF-VIDS-AR (12/18)
Item 2. Code of Ethics.
(a) The registrant has adopted a code of ethics that applies to the registrant’s principal executive officer, principal financial officer, principal accounting officer or controller, or persons performing similar functions. This code of ethics is included as an Exhibit.
(b) During the period covered by the report, with respect to the registrant’s code of ethics that applies to its principal executive officer, principal financial officer, principal accounting officer or controller, or persons performing similar functions; there have been no amendments to, not any waivers granted from, a provision that relates to any element of the code of ethics definition enumerated in paragraph (b) of this Item 2.
Item 3. Audit Committee Financial Experts.
(a)(1) The registrant’s board of directors has determined that the registrant has at least one audit committee financial expert serving on its audit committee.
(a)(2) The audit committee financial experts are David L. Meyer and E. Lee Beard, who are “independent” for purposes of this Item 3 of Form N-CSR.
Item 4. Principal Accountant Fees and Services.
| | 2018 | | 2017 | |
Audit Fees(1) | | $ | 164,970 | | $ | 160,165 | |
Audit-Related Fees(2) | | 0 | | 0 | |
Tax Fees(3) | | 42,937 | | 41,684 | |
All Other Fees(4) | | 0 | | 0 | |
| | | | | | | |
(1) Audit fees include amounts related to the audit of the Registrant’s annual financial statements, security counts and services normally provided by the accountant in connection with statutory and regulatory filings. Audit fees billed were for professional services provided by Ernst & Young LLP for audit compliance, audit advice and audit planning.
(2) Represents the fee for assurance and related services by Ernst & Young LLP reasonably related to the performance of the audit of the Registrant’s financial statements that was not reported under (a) of this item.
(3) Represents the aggregate tax fee billed for professional services rendered by Ernst & Young LLP for tax compliance, tax advice and tax planning. Such tax services included the review of income and excise tax returns for the Registrant.
(4) For fiscal years ended December 31, 2018 and December 31, 2017, there were no fees billed for professional services rendered by Ernst & Young LLP to the Registrant, other than the services reported in (a) through (c) of this item.
Tax fees for 2018 and 2017 are for recurring tax fees for the preparation of the federal and state tax returns.
(e)(1) The Registrant’s Audit Committee must pre-approve non-audit services to be provided by the principal accountant and the fees charged for these services. The Committee may delegate authority to one or more Committee members to pre-approve these services, subject to subsequent review and approval by the Committee.
(e)(2) There were no services performed under Rule 2.01 (c)(7)(i)(C)
(f) Not applicable.
(g)
2018 | | $ | 133,280 | |
2017 | | $ | 273,979 | |
(h) The Registrant’s Audit Committee has evaluated the non-audit services that the principal accountant provided to the registrant’s investment adviser (and the adviser’s relevant affiliates), which services the Committee did not pre-approve, and has concluded that the provision of those services was compatible with maintaining the accountant’s independence.
Item 5. Audit Committee of Listed Registrants.
Not applicable.
Item 6. Investments.
(a) Not applicable.
(b) Not applicable.
Item 7. Disclosure of Proxy Voting Policies and Procedures for Closed-End Management Investment Companies.
Not applicable.
Item 8. Portfolio Managers of Closed-End Management Investment Companies.
Not applicable.
Item 9. Purchases of Equity Securities by Closed-End Management Investment Company and Affiliated Purchasers.
Not applicable.
Item 10. Submission of Matters to a Vote of Security Holders.
Not applicable.
Item 11. Controls and Procedures.
(a) The registrant’s principal executive officer and principal financial officer have concluded, based on their evaluation of the registrant’s disclosure controls and procedures as conducted within 90 days of the filing date of this report, that these disclosure controls and procedures are adequately designed and are operating effectively to ensure that information required to be disclosed by the registrant on Form N-CSR is recorded, processed, summarized and reported within the time periods specified in the Securities and Exchange Commission’s rules and forms.
(b) There were no changes in the registrant’s internal control over financial reporting (as defined in Rule 30a-3(d) under the Investment Company Act of 1940 (17 CFR 270.30a-3(d)) that occurred during the period covered by this report that have materially affected or are reasonably likely to materially affect, the registrant’s internal control over financial reporting.
Item 12. Disclosure of Securities Lending Activities for Closed-End Management Investment Companies.
(a)(1) Not applicable.
(a)(2) Not applicable.
(a)(3) Not applicable.
(a)(4) Not applicable.
(b) Not applicable.
Item 13. Exhibits.
(a)(1) The code of ethics that is the subject of the disclosure required by Item 2 is attached hereto.
(a)(2) Certifications pursuant to Rule 30a-2(a) are attached hereto.
(a)(3) Not applicable.
(a)(4) Change in the registrant’s independent public accountant is attached hereto.
(b) Certifications pursuant to Rule 30a-2(b) are furnished herewith.
SIGNATURES
Pursuant to the requirements of the Securities Exchange Act of 1934 and the Investment Company Act of 1940, the registrant has duly caused this report to be signed on its behalf by the undersigned, thereunto duly authorized.
(Registrant) | Victory Variable Insurance Funds | | |
| | |
By (Signature and Title)* | /s/ Allan Shaer | |
| Allan Shaer, Principal Financial Officer |
Date | February 28, 2019 | | | | |
| | | | | | | | |
Pursuant to the requirements of the Securities Exchange Act of 1934 and the Investment Company Act of 1940, this report has been signed below by the following persons on behalf of the registrant and in the capacities and on the dates indicated.
By (Signature and Title)* | /s/ Christopher K. Dyer | |
| Christopher K. Dyer, Principal Executive Officer |
Date | February 28, 2019 | | |
| | | | |
| | |
By (Signature and Title)* | /s/ Allan Shaer | |
| Allan Shaer, Principal Financial Officer |
Date | February 28, 2019 | | | |
| | | | | |