UNITED STATES
SECURITIES AND EXCHANGE COMMISSION
Washington, D.C. 20549
FORM N-CSR
CERTIFIED SHAREHOLDER REPORT OF REGISTERED
MANAGEMENT INVESTMENT COMPANIES
Investment Company Act file number | 811-08979 |
|
Victory Variable Insurance Funds |
(Exact name of registrant as specified in charter) |
|
4900 Tiedeman Road, 4th Floor, Brooklyn, Ohio | | 44144 |
(Address of principal executive offices) | | (Zip code) |
|
Citi Fund Services Ohio, Inc., 4400 Easton Commons, Suite 200, Columbus, OH 43219 |
(Name and address of agent for service) |
|
Registrant’s telephone number, including area code: | 800-539-3863 | |
|
Date of fiscal year end: | December 31 | |
|
Date of reporting period: | December 31, 2019 | |
| | | | | | | | |
Item 1. Reports to Stockholders.

December 31, 2019
Annual Report
Victory Variable Insurance Funds
Victory INCORE Investment Quality Bond VIP Series
Beginning January 1, 2021, as permitted by regulations adopted by the Securities and Exchange Commission, paper copies of the Fund's shareholder reports may no longer be sent by mail from the insurance company that issued your variable annuity and variable life insurance contract, unless you specifically request paper copies of the reports from your insurance company. Instead, the reports will be made available on www.victoryfunds.com. The insurance company that offers your contract may also make these reports available on a website, and such insurance company will notify you by mail each time a report is posted and provide you with a website link to access the report.
If you already elected to receive shareholder reports electronically, you will not be affected by this change and you need not take any action. You may elect to receive shareholder reports and other communications from the insurance company electronically by following the instructions provided by the insurance company.
If offered by your insurance company, you may elect to receive all future reports in paper and free of charge from the insurance company. You can inform your insurance company that you wish to continue receiving paper copies of your reports. Your election to receive reports in paper will apply to all funds available under your contract.
www.vcm.com
News, Information And Education 24 Hours A Day, 7 Days A Week
The Victory Funds site gives fund shareholders, prospective shareholders, and investment professionals a convenient way to access fund information, get guidance, and track fund performance anywhere they can access the Internet. The site includes:
• Detailed performance records
• Daily share prices
• The latest fund news
• Investment resources to help you become a better investor
• A section dedicated to investment professionals
Whether you're a potential investor searching for the fund that matches your investment philosophy, a seasoned investor interested in planning tools, or an investment professional, www.vcm.com has what you seek. Visit us anytime. We're always open.
Victory Variable Insurance Funds
Table of Contents
Shareholder Letter (Unaudited) | | | 3 | | |
Fund Review and Commentary (Unaudited) | | | 5 | | |
Financial Statements | |
Schedule of Portfolio Investments | | | 8 | | |
Statement of Assets and Liabilities | | | 16 | | |
Statement of Operations | | | 17 | | |
Statements of Changes in Net Assets | | | 18 | | |
Financial Highlights | | | 20 | | |
Notes to Financial Statements | | | 22 | | |
Report of Independent Registered
Public Accounting Firm | | | 34 | | |
Supplemental Information (Unaudited) | |
Trustee and Officer Information | | | 35 | | |
Proxy Voting and Portfolio Holdings Information | | | 38 | | |
Expense Examples | | | 38 | | |
Advisory Contract Renewal | | | 39 | | |
Privacy Policy (inside back cover) | | | |
The Fund is distributed by Victory Capital Advisers, Inc. Victory Capital Management Inc. is the investment adviser to the Fund and receives fees from the Fund for performing services for the Fund.
This report is not authorized for distribution to prospective investors unless preceded or accompanied by a current prospectus of the Fund.
For additional information about any Victory Fund, including fees, expenses, and risks, view our prospectus online at www.vcm.com or call 800-539-3863. Read it carefully before you invest or send money.
The information in this annual report is based on data obtained from recognized services and sources and is believed to be reliable. Any opinions, projections, or recommendations in this report are subject to change without notice and are not intended as individual investment advice. Past investment performance of the Fund, markets or securities mentioned herein should not be considered to be indicative of future results.
• NOT FDIC INSURED • NO BANK GUARANTEE
• MAY LOSE VALUE

Call Victory at:
800-539-FUND (800-539-3863)
Visit our website at:
www.vcm.com
1
This page is intentionally left blank.
2
Victory Funds Letter to Shareholders
(Unaudited)
Dear Shareholder,
As we turn the page into a new decade, it's hard not to reflect on the fact that we have been enjoying the longest-ever bull market in U.S. equities. The run has been impressive, and despite periods of tumult and plenty of negative news, the bull market endured throughout 2019.
For the annual reporting period ended December 31, 2019, the S&P 500® Index posted impressive gains of 31.49%. This represents the greatest one-year gain since 2013 and also illustrates a swift bounce-back after a precipitous drop late in 2018. The move higher supports the notion that underlying fundamentals of U.S. companies drive performance, rather than the political rancor and headline fears that often capture the attention of investors.
Perhaps we shouldn't be surprised at the impressive performance of equities. The U.S. economy — the world's largest — remains on solid footing and has been a key driver of both domestic and international stocks. Robust job creation, near-record low unemployment, and steady consumer spending continue and offer reasons for further optimism. Meanwhile, inflation remains muted, and the Federal Reserve (the Fed) and other major global central banks have taken an accommodative stance. In fact, the Fed has cut interest rates by a total of 0.75% over three meetings last July, September and October.
The risk-on attitudes of investors, coupled with the accommodative monetary policy, had an expected impact on U.S. Treasury yields. The 10-year Treasury yield declined significantly over the course of 2019, falling from 2.66% to 1.92% at year-end. More interesting, however, was the fact that, the yield on 10-year Treasurys fell below shorter-term yields for the first time since before the 2007-2008 Global Financial Crisis. This inverted yield curve spooked investors for a spell, only to revert back to a traditional upward sloping yield curve by the end of the year.
The robust domestic economy, low interest rates, and ample liquidity from central banks provided a potent tonic for the stock market in 2019. In fact, at year-end 2019, the S&P 500® Index was approaching its highest valuation level since 1999. This reminds all of us to retain some historical context on the bull market. Many of us remember the Global Financial Crisis and, before that, the collapse of the dot-com bubble. Although those are now but a distant memory (and we are not forecasting such tumult), we should not forget that stocks don't always go up and cycles don't last forever. In other words, valuations still matter.
The key point is not to discount the risks. In addition to lofty valuations, investors need to keep apprised of trade disputes, geopolitical hotspots, a contentious U.S. election, and a host of other potential headwinds. Yet it is these very risks — these cross-currents — that may create pricing dislocations. This is an environment in which we believe our Victory Capital independent investment franchises can thrive.
On the following pages, you will find information relating to your Victory Funds investment. If you have any questions, we encourage you to contact your financial
3
advisor. Or, if you invest with us directly, you may call (800) 539-3863, or visit our website at www.vcm.com.
My colleagues and I sincerely appreciate the confidence you have placed in the Victory Funds, and we value the opportunity to help meet your investment goals.

Christopher K. Dyer, CFA
President,
Victory Funds
4
Victory Variable Insurance Funds (Unaudited)
Victory INCORE Investment Quality Bond VIP Series
Portfolio Holdings
As a Percentage of Total Investments
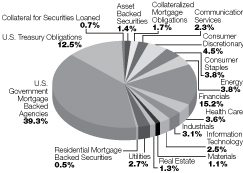
Following a small dip in early October, interest rates and stocks both took a steep trip higher in Q4 concluding an impressive year for both stocks and bonds. Themes driving 2019 returns included an about face on monetary policy by the U.S. Federal Reserve, a global reach for yield driven by negative interest rate policies in Japan and Europe, a resilient U.S. consumer, and easing trade tensions.
Taking its cues from market volatility in late 2018 and early 2019, the Federal Reserve quickly changed course from their December 2018 stance of "auto-pilot" on quantitative tightening, and the need for more interest rate increases in 2019. As the yield curve inverted in Q3, the Federal Reserve responded by lowering the Federal Funds Target Rate by .75% over three meetings. In late Q3 and Q4 repurchase rate volatility inspired the Federal Reserve to end quantitative tightening and instead expand their balance sheet by purchasing $173 billion in U.S. Treasury securities, the bulk of the purchases being in U.S. Treasury bills. Chairman Powell convinced board members to cut rates enough to un-invert the yield curve, and moved them to a low-inflation, rates-lower-for-longer outlook. This policy reversal moved longer term yields lower by nearly 1% for the year, providing the bond market with strong absolute returns in 2019. Negative interest rate policies in Japan and Europe also drove international investors to the U.S. bond market in search of positive yields, and lower rates domestically inspired U.S. investors to reach for yield, providing an even greater boost to corporate bond returns relative to U.S. Treasuries.
The U.S. consumer, not surprisingly, remained confident and seemingly willing to spend. U3 (U.S. official) unemployment rate is at 3.5%, and U6 (broader measure) unemployment rate is at 6.7% and trending lower, are both at generational lows. The percentage of U.S. workers who perceive jobs as plentiful versus those who perceive jobs as hard to get are at levels not seen since the records set in the late 1990s, and personal income grew 3.9% over the year. This confidence reflected in retail sales which grew at a 5.8% annual rate, ending the year with strong holiday sales and counterbalancing lackluster business investment due to trade tensions, and driving U.S. GDP to grow at 2.3% with inflation running at a benign 1.6%.
Progress in trade negotiations late in the year brightened the outlook for business and investment, moving markets higher at the end of the year. After months of negotiations to modify the USMCA trade deal with Canada and Mexico, the treaty was passed by the House of Representatives in December, and may be ratified by the Senate soon. Progress was also made with China as a Phase 1 trade deal was scheduled to be signed on January 15.
5
Victory Variable Insurance Funds (Unaudited)
Victory INCORE Investment Quality Bond VIP Series (continued)
The Victory INCORE Investment Quality Bond VIP Series (the "Fund") seeks to provide a high level of current income and capital appreciation without undue risk to principal. For the year, the Fund returned 7.72%, trailing the Bloomberg Barclays US Aggregate Bond Index which returned 8.72%. The bulk of underperformance came from sector allocation in Q1, as we took a cautious stance and entered the year underweight corporate bond exposure and overweight mortgage-backed securities. Interest rate and yield curve positioning were small detractors for the year, as was credit selection.
6
Victory Variable Insurance Funds (Unaudited)
Victory INCORE Investment Quality Bond VIP Series (continued)
Average Annual Total Return
Year Ended December 31, 2019
| | Class I | | | |
INCEPTION DATE | | 5/1/83 | | | | | |
| | Net Asset
Value | | Bloomberg
Barclays U.S.
Aggregate
Bond Index1 | |
One Year | | | 7.72 | % | | | 8.72 | % | |
Three Year | | | 3.77 | % | | | 4.03 | % | |
Five Year | | | 3.02 | % | | | 3.05 | % | |
Ten Year | | | 3.99 | % | | | 3.75 | % | |
Since Inception | | | 6.67 | % | | | N/A | | |
Expense Ratios
Gross | | | 0.62 | % | |
With Applicable Waivers | | | 0.56 | % | |
Past performance is not indicative of future results. The performance data quoted represents past performance and current returns may be lower or higher. The investment return and principal value will fluctuate so that an investor's shares, when redeemed, may be worth more or less than the original cost. To obtain performance information current to the most recent month's end, please visit www.vcm.com.
The above expense ratios are from the Fund's prospectus dated May 1, 2019. Additional information pertaining to the Fund's expense ratios as of December 31, 2019 can be found in the financial highlights.
The total return figures set forth above include all waivers of fees for various periods since inception. Without such fee waivers, the total returns would have been lower. Some fee waivers are voluntary and may be modified or terminated at any time. The total returns do not include any insurance, sales or administrative charges of variable annuity or life insurance contracts. If these charges were included, the total returns would have been lower.
Victory INCORE Investment Quality Bond VIP Series — Growth of $10,000

1The Bloomberg Barclays U.S. Aggregate Bond Index is generally considered to be representative of U.S. bond market activity. The Bloomberg Barclays U.S. Aggregate Bond Index is an unmanaged index that is not available for direct investment. There are no expenses associated with the index while there are expenses associated with the Fund. It is not possible to invest directly in an index.
The graph reflects investment of growth of a hypothetical $10,000 investment in the Fund. Past performance is no guarantee of future results.
The graph and table do not reflect the deduction of taxes that a shareholder would pay on Fund distributions or the redemption of Fund shares.
7
Victory Variable Insurance Funds
Victory INCORE Investment Quality Bond VIP Series | | Schedule of Portfolio Investments
December 31, 2019 | |
Security Description | | Principal
Amount | | Value | |
Asset Backed Securities (1.4%) | |
AmeriCredit Automobile Receivables Trust, Series 2018-1, Class B,
3.26%, 1/18/24, Callable 9/18/22 @ 100 (a) | | $ | 1,000,000 | | | $ | 1,014,769 | | |
Popular ABS Mortgage Pass-Through Trust, Series 2005-2, Class AV1B,
2.05% (LIBOR01M+26bps), 4/25/35, Callable 1/25/20 @ 100 (b) | | | 189,051 | | | | 188,978 | | |
Santander Drive Auto Receivables Trust, Series 2017-3, Class B,
2.19%, 3/15/22, Callable 8/15/21 @ 100 (a) | | | 201,491 | | | | 201,472 | | |
Santander Drive Auto Receivables Trust, Series 2018-2, Class B,
3.03%, 9/15/22, Callable 10/15/21 @ 100 (a) | | | 3,033,815 | | | | 3,039,518 | | |
Santander Retail Auto Lease Trust, Series 2018-A, Class B,
3.20%, 4/20/22, Callable 2/20/21 @ 100 (a) (c) | | | 3,825,000 | | | | 3,854,403 | | |
Total Asset Backed Securities (Cost $8,244,180) | | | 8,299,140 | | |
Collateralized Mortgage Obligations (1.6%) | |
DBUBS Mortgage Trust, Series 2011-LC1A, Class A3,
5.00%, 11/10/46 (a) (c) | | | 2,995,089 | | | | 3,043,410 | | |
GS Mortgage Securities Trust, Series 2012-GC6, Class B,
5.65%, 1/10/45 (a) (c) (d) | | | 3,250,000 | | | | 3,430,589 | | |
Morgan Stanley BAML Trust, Series 2013-C13, Class A2,
2.94%, 11/15/46 (a) | | | 58,763 | | | | 59,020 | | |
WF-RBS Commercial Mortgage Trust, Series 2012-C6, Class B,
4.70%, 4/15/45 | | | 3,275,000 | | | | 3,411,242 | | |
Total Collateralized Mortgage Obligations (Cost $10,842,227) | | | 9,944,261 | | |
Corporate Bonds (43.2%) | |
Communication Services (2.3%): | |
Activision Blizzard, Inc., 2.60%, 6/15/22, Callable 5/15/22 @ 100 (e) | | | 1,000,000 | | | | 1,012,240 | | |
AT&T, Inc.
3.20%, 3/1/22, Callable 2/1/22 @ 100 (a) | | | 1,429,000 | | | | 1,463,296 | | |
4.25%, 3/1/27, Callable 12/1/26 @ 100 (a) | | | 2,030,000 | | | | 2,228,108 | | |
5.15%, 11/15/46, Callable 5/15/46 @ 100 (a) (e) | | | 2,433,000 | | | | 2,906,437 | | |
Comcast Corp., 3.45%, 2/1/50, Callable 8/1/49 @ 100 | | | 1,346,000 | | | | 1,382,006 | | |
Verizon Communications, Inc.
5.15%, 9/15/23 (a) | | | 1,323,000 | | | | 1,469,258 | | |
3.38%, 2/15/25 (a) | | | 1,404,000 | | | | 1,486,288 | | |
Vodafone Group PLC, 5.25%, 5/30/48 (e) | | | 1,718,000 | | | | 2,066,634 | | |
| | | | 14,014,267 | | |
Consumer Discretionary (4.5%): | |
Best Buy Co., Inc., 4.45%, 10/1/28, Callable 7/1/28 @ 100 (a) (e) | | | 1,747,000 | | | | 1,916,407 | | |
DR Horton, Inc., 2.50%, 10/15/24, Callable 9/15/24 @ 100 | | | 5,960,000 | | | | 5,960,477 | | |
General Motors Co., 4.88%, 10/2/23 (a) | | | 2,072,000 | | | | 2,231,150 | | |
Hasbro, Inc., 6.35%, 3/15/40 (e) | | | 1,596,000 | | | | 1,853,483 | | |
Lear Corp., 5.25%, 5/15/49, Callable 11/15/48 @ 100 | | | 1,377,000 | | | | 1,433,939 | | |
Magna International, Inc., 3.63%, 6/15/24, Callable 3/15/24 @ 100 | | | 4,305,000 | | | | 4,546,296 | | |
NIKE, Inc., 3.88%, 11/1/45, Callable 5/1/45 @ 100 | | | 2,624,000 | | | | 2,991,806 | | |
NVR, Inc., 3.95%, 9/15/22, Callable 6/15/22 @ 100 (a) | | | 2,375,000 | | | | 2,477,766 | | |
See notes to financial statements.
8
Victory Variable Insurance Funds
Victory INCORE Investment Quality Bond VIP Series | | Schedule of Portfolio Investments — continued
December 31, 2019 | |
Security Description | | Principal
Amount | | Value | |
Ross Stores, Inc., 3.38%, 9/15/24, Callable 6/15/24 @ 100 | | $ | 1,220,000 | | | $ | 1,269,239 | | |
Starbucks Corp., 3.80%, 8/15/25, Callable 6/15/25 @ 100 | | | 2,256,000 | | | | 2,435,442 | | |
| | | | 27,116,005 | | |
Consumer Staples (3.8%): | |
Altria Group, Inc., 4.40%, 2/14/26, Callable 12/14/25 @ 100 (a) | | | 2,388,000 | | | | 2,592,986 | | |
Constellation Brands, Inc., 4.65%, 11/15/28, Callable 8/15/28 @ 100 (a) | | | 1,474,000 | | | | 1,657,823 | | |
Estee Lauder Cos., Inc., 4.15%, 3/15/47, Callable 9/15/46 @ 100 | | | 1,000,000 | | | | 1,167,290 | | |
Kerry Group Financial Services Unlimited Co.,
3.20%, 4/9/23, Callable 1/9/23 @ 100 (c) | | | 2,500,000 | | | | 2,544,575 | | |
Keurig Dr Pepper, Inc.
4.06%, 5/25/23, Callable 4/25/23 @ 100 (e) | | | 3,070,000 | | | | 3,243,086 | | |
5.09%, 5/25/48, Callable 11/25/47 @ 100 (e) | | | 559,000 | | | | 675,596 | | |
Mead Johnson Nutrition Co.
3.00%, 11/15/20 | | | 3,000,000 | | | | 3,026,040 | | |
4.60%, 6/1/44, Callable 12/1/43 @ 100 (a) | | | 2,091,000 | | | | 2,492,744 | | |
Reynolds American, Inc., 5.70%, 8/15/35, Callable 2/15/35 @ 100 | | | 1,835,000 | | | | 2,123,792 | | |
Suntory Holdings, Ltd., 2.25%, 10/16/24, Callable 9/16/24 @ 100 (c) (e) | | | 1,600,000 | | | | 1,590,336 | | |
Tyson Foods, Inc., 5.10%, 9/28/48, Callable 3/28/48 @ 100 | | | 1,285,000 | | | | 1,615,785 | | |
| | | | 22,730,053 | | |
Energy (3.7%): | |
Canadian Natural Resources Ltd.,
2.95%, 1/15/23, Callable 12/15/22 @ 100 | | | 1,255,000 | | | | 1,279,824 | | |
Continental Resources, 4.50%, 4/15/23, Callable 1/15/23 @ 100 (a) | | | 2,084,000 | | | | 2,183,761 | | |
Ecopetrol SA, 5.88%, 9/18/23 (a) | | | 2,914,000 | | | | 3,234,948 | | |
EQM Midstream Partners LP, 4.75%, 7/15/23, Callable 6/15/23 @ 100 | | | 2,186,000 | | | | 2,192,667 | | |
Exxon Mobil Corp., 4.11%, 3/1/46, Callable 9/1/45 @ 100 | | | 657,000 | | | | 769,472 | | |
Marathon Petroleum Corp.
6.50%, 3/1/41, Callable 9/1/40 @ 100 | | | 1,285,000 | | | | 1,668,997 | | |
5.85%, 12/15/45, Callable 6/15/45 @ 100 | | | 850,000 | | | | 969,680 | | |
Occidental Petroleum Corp., 2.90%, 8/15/24, Callable 7/15/24 @ 100 | | | 2,422,000 | | | | 2,460,340 | | |
Plains All American Pipeline LP/PAA Finance Corp.,
2.85%, 1/31/23, Callable 10/31/22 @ 100 | | | 2,215,000 | | | | 2,233,052 | | |
Statoil ASA, 3.95%, 5/15/43 | | | 930,000 | | | | 1,036,327 | | |
Valero Energy Corp.
4.00%, 4/1/29, Callable 1/1/29 @ 100 (a) | | | 1,622,000 | | | | 1,749,116 | | |
6.63%, 6/15/37 (e) | | | 2,520,000 | | | | 3,345,830 | | |
| | | | 23,124,014 | | |
Financials (14.6%): | |
Aflac, Inc.
2.88%, 10/15/26, Callable 7/15/26 @ 100 | | | 2,450,000 | | | | 2,523,255 | | |
4.75%, 1/15/49, Callable 7/15/48 @ 100 | | | 341,000 | | | | 415,901 | | |
Alleghany Corp., 4.90%, 9/15/44, Callable 3/15/44 @ 100 | | | 1,648,000 | | | | 1,904,890 | | |
Bank of America Corp.
2.33%(LIBOR03M+63bps), 10/1/21, Callable 10/1/20 @ 100 (a) (b) | | | 1,875,000 | | | | 1,878,825 | | |
2.50%, 10/21/22, Callable 10/21/21 @ 100, MTN | | | 3,500,000 | | | | 3,535,035 | | |
4.20%, 8/26/24, MTN (a) | | | 1,931,000 | | | | 2,074,551 | | |
3.25%, 10/21/27, Callable 10/21/26 @ 100, MTN | | | 1,775,000 | | | | 1,853,011 | | |
Capital One Financial Corp., 3.30%, 10/30/24, Callable 9/30/24 @ 100 (a) | | | 2,669,000 | | | | 2,778,990 | | |
See notes to financial statements.
9
Victory Variable Insurance Funds
Victory INCORE Investment Quality Bond VIP Series | | Schedule of Portfolio Investments — continued
December 31, 2019 | |
Security Description | | Principal
Amount | | Value | |
Cincinnati Financial Corp., 6.13%, 11/1/34 | | $ | 2,170,000 | | | $ | 2,968,147 | | |
Citigroup, Inc.
2.75%, 4/25/22, Callable 3/25/22 @ 100 | | | 3,443,000 | | | | 3,497,434 | | |
3.88%, 3/26/25 | | | 1,282,000 | | | | 1,357,382 | | |
4.60%, 3/9/26 (a) | | | 873,000 | | | | 960,614 | | |
4.45%, 9/29/27 (a) | | | 1,781,000 | | | | 1,962,644 | | |
3.88%(LIBOR03M+117bps), 1/24/39, Callable 1/24/38 @ 100 (b) | | | 813,000 | | | | 896,568 | | |
Enel Finance International NV, 2.88%, 5/25/22 (c) | | | 3,685,000 | | | | 3,730,583 | | |
Fifth Third Bancorp, 3.65%, 1/25/24, Callable 12/25/23 @ 100 (a) | | | 3,105,000 | | | | 3,275,744 | | |
Ford Motor Credit Co. LLC, 4.06%, 11/1/24, Callable 10/1/24 @ 100 | | | 2,510,000 | | | | 2,563,061 | | |
General Motors Financial Co, Inc., 4.15%, 6/19/23, Callable 5/19/23 @ 100 | | | 966,000 | | | | 1,015,411 | | |
HSBC Holdings PLC, 5.10%, 4/5/21 (a) | | | 5,000,000 | | | | 5,184,400 | | |
JPMorgan Chase & Co.
2.95%, 10/1/26, Callable 7/1/26 @ 100 | | | 3,400,000 | | | | 3,507,304 | | |
5.60%, 7/15/41 | | | 980,000 | | | | 1,346,530 | | |
KeyBank NA, 2.25%, 3/16/20 | | | 6,523,000 | | | | 6,526,978 | | |
Morgan Stanley
4.88%, 11/1/22 (a) | | | 2,718,000 | | | | 2,915,164 | | |
3.75%, 2/25/23 (a) | | | 3,000,000 | | | | 3,141,030 | | |
3.13%, 7/27/26, MTN | | | 5,500,000 | | | | 5,684,744 | | |
Newcrest Finance Pty Ltd., 5.75%, 11/15/41 (c) | | | 1,720,000 | | | | 2,032,214 | | |
The Goldman Sachs Group, Inc.
2.35%, 11/15/21, Callable 11/15/20 @ 100 | | | 4,540,000 | | | | 4,555,300 | | |
5.75%, 1/24/22 (a) | | | 2,750,000 | | | | 2,950,503 | | |
Truist Financial Corp., 2.75%, 4/1/22, MTN, Callable 3/1/22 @ 100 (e) | | | 3,550,000 | | | | 3,611,699 | | |
Unum Group, 4.00%, 6/15/29, Callable 3/15/29 @ 100 | | | 1,713,000 | | | | 1,806,787 | | |
Wells Fargo & Co.
4.30%, 7/22/27, MTN | | | 3,553,000 | | | | 3,890,996 | | |
4.90%, 11/17/45 (a) | | | 1,450,000 | | | | 1,776,555 | | |
Zions Bancorp NA, 3.25%, 10/29/29, Callable 7/29/29 @ 100 | | | 2,000,000 | | | | 1,966,100 | | |
| | | | 90,088,350 | | |
Health Care (3.6%): | |
AbbVie, Inc.
2.30%, 5/14/21, Callable 4/14/21 @ 100 (a) | | | 2,905,000 | | | | 2,915,516 | | |
3.20%, 11/21/29, Callable 8/21/29 @ 100 (c) | | | 2,580,000 | | | | 2,632,890 | | |
Amgen, Inc., 4.40%, 5/1/45, Callable 11/1/44 @ 100 | | | 1,825,000 | | | | 2,046,573 | | |
Bristol-Myers Squibb Co., 3.40%, 7/26/29, Callable 4/26/29 @ 100 (c) | | | 4,325,000 | | | | 4,633,027 | | |
Gilead Sciences, Inc., 4.40%, 12/1/21, Callable 9/1/21 @ 100 (a) | | | 6,150,000 | | | | 6,413,958 | | |
HCA, Inc., 4.13%, 6/15/29, Callable 3/15/29 @ 100 | | | 1,716,000 | | | | 1,822,753 | | |
Humana, Inc., 2.90%, 12/15/22, Callable 11/15/22 @ 100 | | | 1,234,000 | | | | 1,258,396 | | |
| | | | 21,723,113 | | |
Industrials (3.1%): | |
Canadian National Railway Co., 3.20%, 8/2/46, Callable 2/2/46 @ 100 | | | 825,000 | | | | 851,804 | | |
Delta Air Lines, Inc., 3.80%, 4/19/23, Callable 3/19/23 @ 100 | | | 2,465,000 | | | | 2,558,571 | | |
Fortive Corp., 3.15%, 6/15/26, Callable 3/15/26 @ 100 (a) | | | 1,839,000 | | | | 1,883,136 | | |
Hillenbrand, Inc., 4.50%, 9/15/26, Callable 7/15/26 @ 100 | | | 3,720,000 | | | | 3,895,435 | | |
Kansas City Southern, 4.95%, 8/15/45, Callable 2/15/45 @ 100 | | | 1,440,000 | | | | 1,708,416 | | |
See notes to financial statements.
10
Victory Variable Insurance Funds
Victory INCORE Investment Quality Bond VIP Series | | Schedule of Portfolio Investments — continued
December 31, 2019 | |
Security Description | | Principal
Amount | | Value | |
Rockwell Automation, Inc.
3.50%, 3/1/29, Callable 12/1/28 @ 100 (e) | | $ | 1,270,000 | | | $ | 1,367,942 | | |
6.25%, 12/1/37 | | | 1,151,000 | | | | 1,576,974 | | |
Roper Technologies, Inc., 2.95%, 9/15/29, Callable 6/15/29 @ 100 | | | 923,000 | | | | 932,350 | | |
Snap-on, Inc., 4.10%, 3/1/48, Callable 9/1/47 @ 100 (e) | | | 1,100,000 | | | | 1,244,298 | | |
Valmont Industries, Inc., 5.00%, 10/1/44, Callable 4/1/44 @ 100 (a) | | | 2,603,000 | | | | 2,662,921 | | |
| | | | 18,681,847 | | |
Information Technology (2.5%): | |
Apple, Inc., 4.65%, 2/23/46, Callable 8/23/45 @ 100 | | | 974,000 | | | | 1,222,652 | | |
Broadcom Corp., 3.00%, 1/15/22, Callable 12/15/21 @ 100 (a) | | | 1,448,000 | | | | 1,469,619 | | |
Lam Research Corp., 4.00%, 3/15/29, Callable 12/15/28 @ 100 (a) | | | 1,571,000 | | | | 1,729,451 | | |
Micron Technology, Inc., 4.19%, 2/15/27, Callable 12/15/26 @ 100 | | | 2,105,000 | | | | 2,253,697 | | |
NetApp, Inc., 3.25%, 12/15/22, Callable 9/15/22 @ 100 | | | 1,345,000 | | | | 1,383,763 | | |
NVIDIA Corp., 2.20%, 9/16/21, Callable 8/16/21 @ 100 | | | 1,230,000 | | | | 1,235,670 | | |
Texas Instruments, Inc., 4.15%, 5/15/48, Callable 11/15/47 @ 100 | | | 1,512,000 | | | | 1,806,069 | | |
Tyco Electronics Group SA, 7.13%, 10/1/37 (e) | | | 650,000 | | | | 955,370 | | |
VMware, Inc., 2.95%, 8/21/22, Callable 7/21/22 @ 100 (e) | | | 3,174,000 | | | | 3,234,846 | | |
| | | | 15,291,137 | | |
Materials (1.1%): | |
Celanese US Holdings LLC, 4.63%, 11/15/22 | | | 1,870,000 | | | | 1,977,207 | | |
LYB International Finance II BV,
3.50%, 3/2/27, Callable 12/2/26 @ 100 (a) | | | 2,179,000 | | | | 2,286,904 | | |
Rio Tinto Finance USA Ltd.
3.75%, 6/15/25, Callable 3/15/25 @ 100 | | | 1,415,000 | | | | 1,521,649 | | |
5.20%, 11/2/40 | | | 723,000 | | | | 947,723 | | |
| | | | 6,733,483 | | |
Real Estate (1.3%): | |
Highwoods Realty LP, 3.63%, 1/15/23, Callable 10/15/22 @ 100 | | | 1,482,000 | | | | 1,529,913 | | |
Retail Properties of America, Inc.,
4.00%, 3/15/25, Callable 12/15/24 @ 100 | | | 3,006,000 | | | | 3,062,393 | | |
Service Properties Trust, 4.35%, 10/1/24, Callable 9/1/24 @ 100 | | | 3,000,000 | | | | 3,088,560 | | |
| | | | 7,680,866 | | |
Utilities (2.7%): | |
Arizona Public Service Co., 2.95%, 9/15/27, Callable 6/15/27 @ 100 | | | 1,800,000 | | | | 1,841,418 | | |
Consolidated Edison, Inc., 6.30%, 8/15/37 | | | 1,870,000 | | | | 2,575,962 | | |
Iberdrola International BV
6.75%, 9/15/33 | | | 373,000 | | | | 482,945 | | |
6.75%, 7/15/36 | | | 783,000 | | | | 1,093,429 | | |
Nevada Power Co., 6.65%, 4/1/36 (a) | | | 600,000 | | | | 834,546 | | |
NextEra Energy Capital Holdings, Inc.,
2.80%, 1/15/23, Callable 12/15/22 @ 100 | | | 2,765,000 | | | | 2,810,843 | | |
Oklahoma G&E Co., 5.25%, 5/15/41, Callable 11/15/40 @ 100 | | | 1,546,000 | | | | 1,854,412 | | |
Public Service Electric & Gas Co.,
4.00%, 6/1/44, Callable 12/1/43 @ 100 | | | 1,289,000 | | | | 1,406,763 | | |
Union Electric Co., 3.25%, 10/1/49, Callable 4/1/49 @ 100 | | | 725,000 | | | | 719,889 | | |
See notes to financial statements.
11
Victory Variable Insurance Funds
Victory INCORE Investment Quality Bond VIP Series | | Schedule of Portfolio Investments — continued
December 31, 2019 | |
Security Description | | Principal
Amount | | Value | |
Vistra Operations Co. LLC,
3.70%, 1/30/27, Callable 11/30/26 @ 100 (c) | | $ | 2,579,000 | | | $ | 2,564,016 | | |
| | | | 16,184,223 | | |
Total Corporate Bonds (Cost $253,934,689) | | | 263,367,358 | | |
Residential Mortgage Backed Securities (0.5%) | |
Bear Stearns Alt-A Trust, Series 2003-3, Class 2A,
4.34%, 10/25/33, Callable 1/25/20 @ 100 (a) (d) | | | 955,972 | | | | 955,972 | | |
Credit Suisse First Boston Mortgage Securities Corp.,
Series 2002-HE16, Class M1, 3.11% (LIBOR01M+132bps), 10/25/32,
Callable 1/25/20 @ 100 (b) | | | 800,802 | | | | 802,443 | | |
JPMorgan Mortgage Trust, Series 2004-S2, Class 1A3, 4.75%, 2/25/20,
Callable 1/25/20 @ 100 (a) | | | 29,030 | | | | 29,154 | | |
JPMorgan Mortgage Trust, Series 2016-4, Class A5, 3.50%, 10/25/46,
Callable 9/25/29 @ 100 (a) (c) (d) | | | 1,292,318 | | | | 1,310,760 | | |
Residential Funding Mortgage Securities I, Inc., Series 2005-S3,
Class A1, 4.75%, 3/25/20, Callable 1/25/20 @ 100 (a) | | | 3,273 | | | | 3,271 | | |
Total Residential Mortgage Backed Securities (Cost $3,096,843) | | | 3,101,600 | | |
U.S. Government Mortgage Backed Agencies (38.6%) | |
Federal Home Loan Mortgage Corp.
5.00%, 6/15/23 – 7/1/39 (a) | | | 1,811,341 | | | | 1,995,735 | | |
Series 4139, Class DA, 1.25%, 12/15/27 (a) | | | 6,227,264 | | | | 6,046,465 | | |
Series: 4763, Class: VC, 4.00%, 4/15/29 | | | 562,023 | | | | 591,262 | | |
Series 4395, Class PA, 2.50%, 4/15/37 (a) | | | 2,526,201 | | | | 2,542,805 | | |
7.00%, 9/1/38 (a) | | | 45,937 | | | | 55,243 | | |
Series 4290, Class CA, 3.50%, 12/15/38 – 3/1/49 (a) | | | 53,370,449 | | | | 55,542,231 | | |
Series 3713, Class PA, 2.00%, 2/15/40 – 3/15/40 (a) | | | 7,307,443 | | | | 7,213,695 | | |
4.50%, 1/1/41 – 12/1/45 (a) | | | 11,956,528 | | | | 12,981,077 | | |
Series 4444, Class CH, 3.00%, 1/15/41 | | | 224,063 | | | | 228,098 | | |
Series 4049, Class AB, 2.75%, 12/15/41 (a) | | | 1,172,796 | | | | 1,184,843 | | |
Series 4494, Class JA, 3.75%, 5/15/42 (a) | | | 4,803,267 | | | | 4,949,649 | | |
| | | | 93,331,103 | | |
Federal National Mortgage Association
6.00%, 8/1/21 – 2/1/37 (a) | | | 2,476,612 | | | | 2,836,998 | | |
5.00%, 4/1/23 – 12/1/39 (a) | | | 1,165,413 | | | | 1,285,971 | | |
7.50%, 12/1/29 (a) | | | 39,219 | | | | 45,737 | | |
8.00%, 1/1/30 – 9/1/30 (a) | | | 21,269 | | | | 25,092 | | |
7.00%, 2/1/32 – 6/1/32 (a) | | | 34,005 | | | | 40,055 | | |
3.75%(LIBOR12M+166bps), 12/1/36 (a) (b) | | | 133,109 | | | | 136,757 | | |
5.50%, 1/1/38 – 2/1/39 (a) | | | 759,038 | | | | 849,057 | | |
4.50%, 12/1/38 – 6/1/40 (a) | | | 7,347,574 | | | | 7,756,747 | | |
Series 2013-33, Class UD, 2.50%, 4/25/39 – 12/25/47 (a) | | | 7,401,446 | | | | 7,433,742 | | |
Series 2013-137, Class A, 3.50%, 3/25/40 – 12/25/50 (a) | | | 18,420,479 | | | | 19,066,847 | | |
Series 2011-101, Class LA, 3.00%, 10/25/40 – 2/25/49 (a) | | | 47,923,011 | | | | 49,065,937 | | |
Series 2013-81, Class KA, 2.75%, 9/25/42 (a) | | | 5,041,299 | | | | 5,104,535 | | |
See notes to financial statements.
12
Victory Variable Insurance Funds
Victory INCORE Investment Quality Bond VIP Series | | Schedule of Portfolio Investments — continued
December 31, 2019 | |
Security Description | | Shares or
Principal
Amount | | Value | |
Series 2013-44, Class PB, 1.75%, 1/25/43 (a) | | $ | 5,492,439 | | | $ | 5,356,319 | | |
4.00%, 11/1/43 – 6/1/49 (a) | | | 34,436,881 | | | | 36,488,146 | | |
| | | | 135,491,940 | | |
Government National Mortgage Association
6.00%, 10/15/32 (a) | | | 79,125 | | | | 88,797 | | |
Series 2014-42, Class AD, 2.50%, 7/16/41 | | | 414,554 | | | | 418,953 | | |
Series 2019-85, Class KG, 3.00%, 6/20/43 | | | 5,108,263 | | | | 5,200,345 | | |
4.50%, 10/20/49 | | | 1,129,408 | | | | 1,187,102 | | |
| | | | 6,895,197 | | |
Multi-family (0.0%): (f) | |
Collateralized Mortgage Obligations (0.0%): (f) | |
Government National Mortgage Association
6.00%, 12/15/33 (a) | | | 31,416 | | | | 35,590 | | |
Total U.S. Government Mortgage Backed Agencies (Cost $232,119,634) | | | 235,753,830 | | |
U.S. Treasury Obligations (12.3%) | |
U.S. Treasury Bills,
1.47%, 3/26/20 (g) | | | 38,300,000 | | | | 38,165,897 | | |
U.S. Treasury Bonds
3.00%, 2/15/48 | | | 3,300,000 | | | | 3,720,234 | | |
3.00%, 2/15/49 | | | 28,500,000 | | | | 32,236,172 | | |
U.S. Treasury Notes, 1.25%, 8/31/24 | | | 911,000 | | | | 893,634 | | |
Total U.S. Treasury Obligations (Cost $73,077,553) | | | 75,015,937 | | |
Collateral for Securities Loaned^ (0.7%) | |
BlackRock Liquidity Funds TempFund Portfolio, Institutional
Class, 1.75% (h) | | | 205,692 | | | | 205,692 | | |
Fidelity Investments Money Market Government Portfolio,
Class I, 1.54% (h) | | | 1,133,218 | | | | 1,133,218 | | |
Fidelity Investments Prime Money Market Portfolio,
Class I, 1.75% (h) | | | 34,356 | | | | 34,356 | | |
Goldman Sachs Financial Square Prime Obligations Fund, Institutional
Class, 1.80% (h) | | | 684,581 | | | | 684,581 | | |
JPMorgan Prime Money Market Fund, Capital Class, 1.73% (h) | | | 753,092 | | | | 753,092 | | |
Morgan Stanley Institutional Liquidity Prime Portfolio, Institutional
Class, 1.76% (h) | | | 1,506,134 | | | | 1,506,134 | | |
Total Collateral for Securities Loaned (Cost $4,317,073) | | | 4,317,073 | | |
| Total Investments (Cost $585,632,199) — 98.3% | | | 599,799,199 | | |
Other assets in excess of liabilities — 1.7% | | | 10,639,945 | | |
NET ASSETS — 100.00% | | $ | 610,439,144 | | |
^ Purchased with cash collateral from securities on loan.
(a) All or a portion of this security has been segregated as collateral for derivative instrument.
(b) Variable or Floating-Rate Security. Rate disclosed is as of December 31, 2019.
See notes to financial statements.
13
Victory Variable Insurance Funds
Victory INCORE Investment Quality Bond VIP Series | | Schedule of Portfolio Investments — continued
December 31, 2019 | |
(c) Rule 144A security or other security that is restricted as to resale to institutional investors. The Fund's Adviser has deemed this security to be liquid based upon procedures approved by the Board of Trustees. As of December 31, 2019, the fair value of these securities was $31,366,803 and amounted to 5.1% of net assets.
(d) The rate for certain asset-backed and mortgage backed securities may vary based on factors relating to the pool of assets underlying the security. The rate disclosed is the rate in effect at December 31, 2019.
(e) All or a portion of this security is on loan.
(f) Amount represents less than 0.05% of net assets.
(g) Rate represents the effective yield at December 31, 2019.
(h) Rate disclosed is the daily yield on December 31, 2019.
bps — Basis points
LIBOR — London InterBank Offered Rate
LIBOR01M — 1 Month US Dollar LIBOR, rate disclosed as of December 31, 2019, based on the last reset date of the security
LIBOR03M — 3 Month US Dollar LIBOR, rate disclosed as of December 31, 2019, based on the last reset date of the security
LIBOR12M — 12 Month US Dollar LIBOR, rate disclosed as of December 31, 2019, based on the last reset date of the security
LLC — Limited Liability Company
LP — Limited Partnership
MTN — Medium Term Note
PLC — Public Limited Company
Futures Contracts Purchased
| | | Number of
Contracts | | Expiration
Date | | Notional
Amount | | Value | | Unrealized
Appreciation
(Depreciation) | |
10-Year U.S. Treasury Note Future | | | 55 | | | 3/20/20 | | $ | 7,114,956 | | | $ | 7,063,203 | | | $ | (51,753 | ) | |
2-Year U.S. Treasury Note Future | | | 30 | | | 3/31/20 | | | 6,465,945 | | | | 6,465,000 | | | | (945 | ) | |
5-Year U.S. Treasury Note Future | | | 290 | | | 3/31/20 | | | 34,507,612 | | | | 34,396,719 | | | | (110,893 | ) | |
| | | | | | | | | | | $ | (163,591 | ) | |
| | | Total unrealized appreciation | | | | | | | | $ | — | | |
| | | Total unrealized depreciation | | | | | | | | | (163,591 | ) | |
| | | Total net unrealized appreciation(depreciation) | | | | | | | | $ | (163,591 | ) | |
See notes to financial statements.
14
Victory Variable Insurance Funds
Victory INCORE Investment Quality Bond VIP Series | | Schedule of Portfolio Investments — continued
December 31, 2019 | |
Centrally Cleared
Credit Default Swap Agreements — Sell Protection (a)
Underlying
Instruments* | | Fixed
Deal
Received
Rate | | Maturity
Date | | Payment
Frequency | | Implied
Credit
Spread at
December 31,
2019 (b) | | Notional
Amount (c) | | Value | | Premiums
Paid/
(Received) | | Unrealized
Appreciation
(Depreciation) | |
CDX North
America
High Yield
Index;
Series 33 | | | 5.00 | % | | 12/20/24 | | Quarterly | | | 2.79 | % | | $ | 13,860,000 | | | $ | 1,338,029 | | | $ | 1,056,132 | | | $ | 281,897 | | |
| | | $ | 1,338,029 | | | $ | 1,056,132 | | | $ | 281,897 | | |
* As of December 31, 2019, the CDX North America High Yield Index (the "Index") included securities which had defaulted and represented 1% of the Index. Reflects the notional amount after the default of securities.
(a) When a credit event occurs as defined under the terms of the swap agreement, the Fund as a seller of credit protection will either (i) pay to the buyer of protection an amount equal to the par value of the defaulted reference entity and take delivery of the reference entity or (ii) pay a net amount equal to the par value of the defaulted reference entity less its recovery value.
(b) Implied credit spread, represented in absolute terms, utilized in determining the value of the credit default swap agreements as of period end will serve as an indicator of the current status of the payment/performance risk and represent the likelihood or risk of default for the credit derivative. The implied credit spread of a referenced entity reflects the cost of buying/selling protection and may include payments required to be made to enter into the agreement. Generally, wider credit spreads represent a perceived deterioration of the referenced entity's credit soundness and a greater likelihood or risk of default or other credit event occurring as defined under the terms of the swap agreement.
(c) The notional amount represents the maximum potential amount the Fund could be required to pay as a seller of credit protection if a credit event occurs, as defined under the terms of the swap agreement, for each security included in the Index.
See notes to financial statements.
15
Victory Variable Insurance Funds | | Statement of Assets and Liabilities
December 31, 2019 | |
| | | Victory INCORE
Investment Quality
Bond VIP Series | |
ASSETS: | |
Investments, at value (Cost $585,632,199) | | $ | 599,799,199 | (a) | |
Cash and cash equivalents | | | 6,490,847 | | |
Deposits with brokers for futures contracts | | | 2,096,169 | | |
Deposits with brokers for swap agreements | | | 3,503,362 | | |
Interest and dividends receivable | | | 3,455,117 | | |
Receivable for capital shares issued | | | 11,001 | | |
Receivable from Adviser | | | 174,431 | | |
Prepaid expenses | | | 39,387 | | |
Total Assets | | | 615,569,513 | | |
LIABILITIES: | |
Payables: | |
Collateral received on loaned securities | | | 4,317,073 | | |
Investments purchased | | | 282,461 | | |
Capital shares redeemed | | | 91,015 | | |
Variation margin on open futures contracts | | | 11,407 | | |
Variation margin on open swap agreements | | | 6,211 | | |
Accrued expenses and other payables: | |
Investment advisory fees | | | 260,311 | | |
Administration fees | | | 29,284 | | |
Custodian fees | | | 4,663 | | |
Transfer agent fees | | | 71,644 | | |
Compliance fees | | | 393 | | |
Trustees' fees | | | 1,257 | | |
Other accrued expenses | | | 54,650 | | |
Total Liabilities | | | 5,130,369 | | |
NET ASSETS: | |
Capital | | | 584,582,121 | | |
Total distributable earnings/(loss) | | | 25,857,023 | | |
Net Assets | | $ | 610,439,144 | | |
Shares (unlimited shares authorized with a par value
of $0.001 per share): | | | 48,810,830 | | |
Net asset value: | | $ | 12.51 | | |
(a) Includes $4,188,743 of securities on loan.
See notes to financial statements.
16
Victory Variable Insurance Funds | | Statement of Operations
For the Year Ended December 31, 2019 | |
| | | Victory INCORE
Investment Quality
Bond VIP Series | |
Investment Income: | |
Interest | | $ | 19,025,900 | | |
Securities lending (net of fees) | | | 4,655 | | |
Total Income | | | 19,030,555 | | |
Expenses: | |
Investment advisory fees | | | 3,156,265 | | |
Administration fees | | | 386,041 | | |
Custodian fees | | | 33,149 | | |
Transfer agent fees | | | 860,793 | | |
Trustees' fees | | | 54,673 | | |
Compliance fees | | | 4,278 | | |
Legal and audit fees | | | 71,388 | | |
Interfund lending fees | | | 313 | | |
Other expenses | | | 116,857 | | |
Total Expenses | | | 4,683,757 | | |
Expenses waived/reimbursed by Adviser | | | (1,148,942 | ) | |
Net Expenses | | | 3,534,815 | | |
Net Investment Income (Loss) | | | 15,495,740 | | |
Realized/Unrealized Gains (Losses) from Investments: | |
Net realized gains (losses) from investment securities | | | 14,792,883 | | |
Net realized gains (losses) from futures contracts | | | (1,407,778 | ) | |
Net realized gains (losses) from swap agreements | | | (4,912,240 | ) | |
Net change in unrealized appreciation/depreciation on investment securities | | | 18,571,365 | | |
Net change in unrealized appreciation/depreciation on futures contracts | | | 1,160,672 | | |
Net change in unrealized appreciation/depreciation on swap agreements | | | 3,447,306 | | |
Net realized/unrealized gains on investments | | | 31,652,208 | | |
Change in net assets resulting from operations | | $ | 47,147,948 | | |
See notes to financial statements.
17
Victory Variable Insurance Funds | | Statements of Changes in Net Assets | |
| | | Victory INCORE Investment
Quality Bond VIP Series | |
| | | Year
Ended
December 31,
2019 | | Year
Ended
December 31,
2018 | |
From Investment Activities: | |
Operations: | |
Net investment income (loss) | | $ | 15,495,740 | | | $ | 17,481,631 | | |
Net realized gains (losses) from investments | | | 8,472,865 | | | | (11,008,512 | ) | |
Net change in unrealized appreciation/depreciation
on investments | | | 23,179,343 | | | | (10,833,615 | ) | |
Change in net assets resulting from operations | | | 47,147,948 | | | | (4,360,496 | ) | |
Change in net assets resulting from distributions to shareholders | | | (17,229,625 | ) | | | (4,289,680 | ) | |
Change in net assets resulting from capital transactions | | | (64,480,616 | ) | | | (73,069,861 | ) | |
Change in net assets | | | (34,562,293 | ) | | | (81,720,037 | ) | |
Net Assets: | |
Beginning of period | | | 645,001,437 | | | | 726,721,474 | | |
End of period | | $ | 610,439,144 | | | $ | 645,001,437 | | |
Capital Transactions: | |
Proceeds from shares issued | | $ | 37,119,834 | | | $ | 47,220,231 | | |
Distributions reinvested | | | 17,229,625 | | | | 4,289,680 | | |
Cost of shares redeemed | | | (118,830,075 | ) | | | (124,579,772 | ) | |
Change in net assets resulting from capital transactions | | $ | (64,480,616 | ) | | $ | (73,069,861 | ) | |
Share Transactions: | |
Issued | | | 2,998,867 | | | | 3,953,299 | | |
Reinvested | | | 1,380,579 | | | | 360,968 | | |
Redeemed | | | (9,535,445 | ) | | | (10,495,215 | ) | |
Change in Shares | | | (5,155,999 | ) | | | (6,180,948 | ) | |
See notes to financial statements.
18
This page is intentionally left blank.
19
Victory Variable Insurance Funds | | Financial Highlights | |
For a Share Outstanding Throughout Each Period
| | | | Investment Activities | | Distributions to
Shareholders From | |
| | | Net Asset
Value,
Beginning of
Period | | Net
Investment
Income
(Loss)(a) | | Net Realized
and Unrealized
Gains (Losses)
on Investments | | Total from
Investment
Activities | | Net
Investment
Income | | Net Realized
Gains from
Investments | |
Victory INCORE Investment Quality Bond VIP Series | |
Year Ended 12/31/19 | | $ | 11.95 | | | | 0.31 | | | | 0.61 | | | | 0.92 | | | | (0.36 | ) | | | — | | |
Year Ended 12/31/18 | | $ | 12.08 | | | | 0.30 | | | | (0.35 | ) | | | (0.05 | ) | | | (0.08 | ) | | | — | (c) | |
Year Ended 12/31/17 | | $ | 11.88 | | | | 0.28 | | | | 0.21 | | | | 0.49 | | | | (0.29 | ) | | | — | | |
Year Ended 12/31/16 | | $ | 11.98 | | | | 0.27 | | | | 0.15 | | | | 0.42 | | | | (0.30 | ) | | | (0.22 | ) | |
Year Ended 12/31/15 | | $ | 12.38 | | | | 0.31 | | | | (0.27 | ) | | | 0.04 | | | | (0.32 | ) | | | (0.12 | ) | |
(a) Per share net investment income (loss) has been calculated using the average daily shares method.
(b) Total returns do not reflect the effects of charges deducted pursuant to the terms of The Guardian Insurance & Annuity Company, Inc.'s variable contracts. Inclusion of such charges would reduce the total returns for all periods shown.
(c) Amount is less than $0.005 per share.
(d) The Fund received monies related to a nonrecurring refund from the prior Custodian. The corresponding impact to the total return was less than 0.01% for the period shown. (See Note 8)
See notes to financial statements.
20
Victory Variable Insurance Funds | | Financial Highlights — continued | |
For a Share Outstanding Throughout Each Period
| | | | | Ratios to Average Net Assets | | Supplemental Data | |
| | | Total
Distributions | | Capital
Contribution
From Prior
Custodian,
Net (See
Note 8) | | Net
Asset
Value,
End of
Period | | Total
Return(b) | | Net
Expenses | | Net
Investment
Income
(Loss) | | Gross
Expenses | | Net
Assets,
End of
Period
(000's) | | Portfolio
Turnover | |
Victory INCORE Investment Quality Bond VIP Series | |
Year Ended 12/31/19 | | | (0.36 | ) | | | — | | | $ | 12.51 | | | | 7.72 | % | | | 0.56 | % | | | 2.46 | % | | | 0.74 | % | | $ | 610,439 | | | | 96 | % | |
Year Ended 12/31/18 | | | (0.08 | ) | | | — | | | $ | 11.95 | | | | (0.41 | )% | | | 0.56 | % | | | 2.52 | % | | | 0.62 | % | | $ | 645,001 | | | | 109 | % | |
Year Ended 12/31/17 | | | (0.29 | ) | | | — | | | $ | 12.08 | | | | 4.15 | % | | | 0.56 | % | | | 2.28 | % | | | 0.61 | % | | $ | 726,721 | | | | 83 | % | |
Year Ended 12/31/16 | | | (0.52 | ) | | | — | (c) | | $ | 11.88 | | | | 3.53 | %(d) | | | 0.55 | % | | | 2.17 | % | | | 0.55 | % | | $ | 716,292 | | | | 142 | % | |
Year Ended 12/31/15 | | | (0.44 | ) | | | — | | | $ | 11.98 | | | | 0.33 | % | | | 0.56 | % | | | 2.47 | % | | | 0.56 | % | | $ | 755,696 | | | | 41 | % | |
See notes to financial statements.
21
Victory Variable Insurance Funds | | Notes to Financial Statements
December 31, 2019 | |
1. Organization:
Victory Variable Insurance Funds (the "Trust") was organized on February 11, 1998 as a Delaware statutory trust. The Trust is registered under the Investment Company Act of 1940, as amended (the "1940 Act"), as a diversified open-end investment company. The Trust is comprised of nine funds and is authorized to issue an unlimited number of shares, which are units of beneficial interest with a par value of $0.001 per share.
The accompanying financial statements are those of the Victory INCORE Investment Quality Bond VIP Series (the "Fund"). The Fund offers a single class of shares: Class I Shares. Sales of shares of the Fund may only be made to certain separate accounts of The Guardian Insurance & Annuity Company, Inc. ("GIAC") that fund certain variable annuity and variable life insurance contracts issued by GIAC. GIAC is a wholly owned subsidiary of The Guardian Life Insurance Company of America ("Guardian Life").
Under the Trust's organizational documents, its officers and trustees are indemnified against certain liabilities arising out of the performance of their duties to the Fund. In addition, in the normal course of business, the Fund enters into contracts with its vendors and others that provide for general indemnifications. The Fund's maximum exposure under these arrangements is unknown, as this would involve future claims that may be made against the Fund. However, based on experience, the Fund expects that risk of loss to be remote.
2. Significant Accounting Policies:
The following is a summary of significant accounting policies followed by the Trust in the preparation of its financial statements. The policies are in conformity with accounting principles generally accepted in the United States of America ("GAAP"). The preparation of financial statements in accordance with GAAP requires management to make estimates and assumptions that affect the reported amounts of assets and liabilities and disclosure of contingent assets and liabilities at the date of the financial statements and the reported amounts of income and expenses for the period. Actual results could differ from those estimates. The Fund follows the specialized accounting and reporting requirements under GAAP that are applicable to investment companies.
Investment Valuation:
The Fund records investments at fair value. Fair value is defined as the price that would be received to sell an asset or paid to transfer a liability in an orderly transaction between market participants at the measurement date.
The valuation techniques described below maximize the use of observable inputs and minimize the use of unobservable inputs in determining fair value. The inputs used for valuing the Fund's investments are summarized in the three broad levels listed below:
• Level 1 — quoted prices in active markets for identical securities
• Level 2 — other significant observable inputs (including quoted prices for similar securities or interest rates applicable to those securities, etc.)
• Level 3 — significant unobservable inputs (including the Fund's own assumptions in determining the fair value of investments)
Changes in valuation techniques may result in transfers in or out of an assigned level within the disclosure hierarchy. The inputs or methodologies used for valuation techniques are not necessarily an indication of the risk associated with entering into those investments.
Portfolio securities listed or traded on securities exchanges, including American Depositary Receipts ("ADRs") and Rights, are valued at the closing price on the exchange or system where the security is principally traded, if available, or at the Nasdaq Official Closing Price. If there have been no sales for that day on the exchange or system, then a security is valued at the last available bid quotation on the exchange or system where the security is principally traded. In each of these situations, valuations are typically categorized as Level 1 in the fair value hierarchy.
22
Victory Variable Insurance Funds | | Notes to Financial Statements — continued
December 31, 2019 | |
Futures contracts are valued at the settlement price established each day by the board of trade or an exchange on which they are traded. These valuations are typically categorized as Level 1 in the fair value hierarchy.
Swap agreements are valued at the mean between the current bid and ask prices. These valuations are typically categorized as Level 2 in the fair value hierarchy.
Debt securities of United States ("U.S.") issuers (other than short-term investments maturing in 60 days or less), including corporate and municipal securities, are valued on the basis of bid valuations provided by dealers or an independent pricing service approved by the Trust's Board of Trustees (the "Board"). Short-term investments maturing in 60 days or less may be valued at amortized cost, which approximates market value. Under the amortized cost method, premium or discount, if any, is amortized or accreted, respectively, on a constant basis to the maturity of the security. In each of these situations, valuations are typically categorized as Level 2 in the fair value hierarchy.
Investments for which there are no such quotations, or for which quotations do not appear reliable, are valued at fair value in accordance with procedures established by and under the general supervision and responsibility of the Board. These valuations are typically categorized as Level 2 or Level 3 in the fair value hierarchy, based on the observability of inputs used to determine the fair value.
A summary of the valuations as of December 31, 2019, based upon the three levels defined above, is included in the table below while the breakdown, by category, of investments is disclosed in the Schedule of Portfolio Investments.
| | | LEVEL 1 | | LEVEL 2 | | Total | |
Asset Backed Securities | | $ | — | | | $ | 8,299,140 | | | $ | 8,299,140 | | |
Collateralized Mortgage Obligations | | | — | | | | 9,944,261 | | | | 9,944,261 | | |
Corporate Bonds | | | — | | | | 263,367,358 | | | | 263,367,358 | | |
Residential Mortgage Backed Securities | | | — | | | | 3,101,600 | | | | 3,101,600 | | |
U.S. Government Mortgage Backed Agencies | | | — | | | | 235,753,830 | | | | 235,753,830 | | |
U.S. Treasury Obligations | | | — | | | | 75,015,937 | | | | 75,015,937 | | |
Collateral for Securities Loaned | | | 4,317,073 | | | | — | | | | 4,317,073 | | |
Total | | $ | 4,317,073 | | | $ | 595,482,126 | | | $ | 599,799,199 | | |
Other Financial Instruments^: | |
Assets: | |
Credit Default Swap Agreements | | | — | | | | 281,897 | | | | 281,897 | | |
Liabilities: | |
Futures Contracts | | | (163,591 | ) | | | — | | | | (163,591 | ) | |
Total | | $ | (163,591 | ) | | $ | 281,897 | | | $ | 118,306 | | |
^ Futures Contracts and Credit Default Swap Agreements are valued at the unrealized appreciation (depreciation) on the investment.
For the year ended December 31, 2019, there were no Level 3 investments for which significant unobservable inputs were used to determine fair value.
Securities Purchased on a When-Issued Basis:
The Fund may purchase securities on a when-issued basis. When-issued securities are securities purchased for delivery beyond normal settlement periods at a stated price and/or yield, thereby involving the risk that the price and/or yield obtained may be more or less than those available in the market when delivery takes place. At the time the Fund makes the commitment to purchase a security on a when-issued basis, the Fund records the transaction and reflects the value of the security in determining net asset value. No interest accrues to the Fund until the transaction settles and payment takes place. Normally, the settlement date occurs within one month of the purchase. A segregated account is established and the Fund maintains cash and/or marketable securities at least equal in value to commitments for when-issued securities. If the Fund owns when-issued securities, these values are
23
Victory Variable Insurance Funds | | Notes to Financial Statements — continued
December 31, 2019 | |
included in "Payable for investments purchased" on the accompanying Statement of Assets and Liabilities and the segregated assets as identified in the Schedule of Portfolio Investments.
Loans:
Floating rate loans in which the Fund invests are primarily "senior" loans. Senior floating rate loans typically hold a senior position in the capital structure of the borrower, are typically secured by specific collateral, and have a claim on the assets and/or stock of the borrower that is senior to that held by subordinated debtholders and stockholders of the borrower. While these protections may reduce risk, these investments still present significant credit risk. A significant portion of the Fund's floating rate investments may be issued in connection with highly leveraged transactions such as leveraged buyouts, leveraged recapitalization loans, and other types of acquisition financing. Obligations in these types of transactions are subject to greater credit risk (including default and bankruptcy) than many other investments and may be, or become, illiquid. See note regarding below investment grade securities.
The Fund may purchase second lien loans (secured loans with a claim on collateral subordinate to a senior lender's claim on such collateral), fixed rate loans, unsecured loans, and other debt obligations.
Transactions in loans often settle on a delayed basis, and the Fund may not receive the proceeds from the sale of a loan or pay for a loan purchase for a substantial period of time after entering into the transactions.
Below Investment Grade Securities:
The Fund may invest in below investment grade securities (i.e. lower-quality, "junk" debt), which are subject to various risks. Lower-quality debt is considered to be speculative because it is less certain that the issuer will be able to pay interest or repay the principal than in the case of investment grade debt. These securities can involve a substantially greater risk of default than higher-rated securities, and their values can decline significantly over short periods of time. Lower-quality debt securities tend to be more sensitive to adverse news about their issuers, the market and the economy in general, than higher-quality debt securities. The market for these securities can be less liquid, especially during periods of recession or general market decline.
Investment Companies:
The Fund may invest in portfolios of open-end investment companies. These investment companies value securities in their portfolios for which market quotations are readily available at their market values (generally the last reported sale price) and all other securities and assets at their fair value by the methods established by the board of directors of the underlying funds.
Derivatives Instruments:
Futures Contracts:
The Fund may enter into contracts for the future delivery of securities or foreign currencies and futures contracts based on a specific security, class of securities, foreign currency or an index, and purchase or sell options on any such futures contracts. A futures contract on a securities index is an agreement obligating either party to pay, and entitling the other party to receive, while the contract is outstanding, cash payments based on the level of a specified securities index. No physical delivery of the underlying asset is made. The Fund may enter into futures contracts in an effort to hedge against market risks. The acquisition of put and call options on futures contracts will give the Fund the right (but not the obligation), for a specified price, to sell or to purchase the underlying futures contract, upon exercise of the option, at any time during the option period. Futures transactions involve brokerage costs and require the Fund to segregate assets to cover contracts that would require it to purchase securities or currencies. A good faith margin deposit, known as initial margin, of cash or government securities with a broker or custodian is required to initiate and maintain open positions in futures contracts. Subsequent payments, known as variation margin, are made or received by the Fund based on the change in the
24
Victory Variable Insurance Funds | | Notes to Financial Statements — continued
December 31, 2019 | |
market value of the position and are recorded as unrealized appreciation or depreciation until the contract is closed out, at which time the gain or loss is realized. The Fund may lose the expected benefit of futures transactions if interest rates, exchange rates or securities prices change in an unanticipated manner. Such unanticipated changes may also result in lower overall performance than if the Fund had not entered into any futures transactions. In addition, the value of the Fund's futures positions may not prove to be perfectly or even highly correlated with the value of its portfolio securities or foreign currencies, limiting the Fund's ability to hedge effectively against interest rate, exchange rate and/or market risk and giving rise to additional risks. There is no assurance of liquidity in the secondary market for purposes of closing out futures positions. The collateral held by the Fund is presented on the Statement of Assets and Liabilities under Deposits with broker for futures contracts. As of December 31, 2019, the Fund entered into Futures Contracts primarily for the strategy of hedging or other purposes, including but not limited to, providing liquidity and equitizing cash.
Credit Derivatives:
The Fund may enter into credit derivatives, including centrally cleared credit default swaps on individual obligations or credit indices. The Fund may use these investments (i) as alternatives to direct long or short investment in a particular security or securities, (ii) to adjust the Fund's asset allocation or risk exposure, or (iii) for hedging purposes. The use by the Fund of credit default swaps may have the effect of creating a short position in a security. Credit derivatives can create investment leverage and may create additional investment risks that may subject the Fund to greater volatility than investments in more traditional securities, as described in the Fund's Statement of Additional Information.
Centrally cleared credit default swap ("CDS") agreements on credit indices involve one party making a stream of payments (referred to as the buyer of protection) to another party (the seller of protection) in exchange for the right to receive a specified return in the event of a write-down, principal shortfall, interest shortfall or default of all or part of the referenced entities comprising the credit index. A credit index is a basket of credit instruments or exposures designed to be representative of a specific sector of the credit market as a whole. These indices are made up of reference credits that are judged by a poll of dealers to be the most liquid entities in the CDS.
The counterparty risk for cleared swap agreements is generally lower than uncleared over-the-counter swap agreements because generally a clearing organization becomes substituted for each counterparty to a centrally cleared swap agreement and, in effect, guarantees each party's performance under the contract as each party to a trade looks only to the clearing organization for performance of financial obligations. However, there can be no assurance that the clearing organization, or its members, will satisfy its obligations to the Fund.
The Fund may enter into CDS agreements either as a buyer or seller. The Fund may buy protection under a CDS to attempt to mitigate the risk of default or credit quality deterioration in one or more individual holdings or in a segment of the fixed income securities market. The Fund may sell protection under a CDS in an attempt to gain exposure to an underlying issuer's credit quality characteristics without investing directly in that issuer. For swaps entered with an individual counterparty, the Fund bears the risk of loss of the uncollateralized amount expected to be received under a CDS agreement in the event of the default or bankruptcy of the counterparty. CDS agreements are generally valued at a price at which the counterparty to such agreement would terminate the agreement. The Fund may also enter into cleared swaps.
Upon entering into a cleared CDS, the Fund may be required to deposit with the broker an amount of cash or cash equivalents in the range of approximately 3% to 6% of the notional amount for CDS on high yield debt issuers (this amount is subject to change by the clearing organization that clears the trade). This amount, known as "initial margin," is in the nature of a performance bond or good faith deposit on the CDS and is returned to a Fund upon termination of the CDS, assuming all contractual obligations have been satisfied. Subsequent payments, known as "variation margin," to and from the broker will be made daily as the price of the CDS fluctuates, making the long and short positions in the CDS contract more or less valuable, a process known as "marking-to-market." The premium (discount)
25
Victory Variable Insurance Funds | | Notes to Financial Statements — continued
December 31, 2019 | |
payments are built into the daily price of the CDS and thus are amortized through the variation margin. The variation margin payment also includes the daily portion of the periodic payment stream.
The maximum potential amount of future payments (undiscounted) that the Fund as a seller of protection could be required to make under a CDS agreement equals the notional amount of the agreement. Notional amounts of each individual CDS agreement outstanding as of period end for which the Fund is the seller of protection are disclosed on the Schedule of Portfolio Investments. These potential amounts would be partially offset by any recovery values of the respective referenced obligations, upfront payments received upon entering into the agreement, periodic interest payments, or net amounts received from the settlement of buy protection CDS agreements entered into by the Fund for the same referenced entity or entities.
As of December 31, 2019, the Fund entered into centrally cleared CDS agreements primarily for the strategy of asset allocation and risk exposure management.
Offsetting of Financial Assets and Derivatives Assets:
The Fund is subject to various Master Netting Arrangements, which govern the terms of certain transactions with select counterparties. The Master Netting Arrangements allow the Fund to close out and net total exposure to a counterparty in the event of a default with respect to all the transactions governed under a single agreement with a counterparty. The Master Netting Arrangements also specify collateral posting arrangements at pre-arranged exposure levels. Under the Master Netting Arrangements, collateral is routinely transferred if the total net exposure to certain transactions (net of existing collateral already in place) governed under the relevant Master Netting Arrangement with a counterparty in a given account exceeds a specified threshold depending on the counterparty and the type of Master Netting Arrangement.
The table below, as of December 31, 2019, discloses both gross information and net information about instruments and transactions eligible for offset in the Statement of Assets and Liabilities and instruments and transactions that are subject to an agreement similar to a master netting agreement as well as amounts related to collateral held at clearing brokers and counterparties.
| | Gross
Amounts of
Recognized
Assets | | Gross
Amounts
Available
for Offset | | Net Amount
Presented in the
Statement of
Assets and
Liabilities | | Cash
Collateral
Received | | Net Amount | |
Futures Contracts-Goldman
Sachs & Co. | | $ | 1,406 | | | $ | (1,406 | ) | | $ | — | | | $ | — | | | $ | — | | |
| | Gross
Amounts of
Recognized
Liabilities | | Gross
Amounts
Available
for Offset | | Net Amount
Presented in the
Statement of
Assets and
Liabilities | | Cash
Collateral
Pledged* | | Net Amount | |
Futures Contracts-Goldman
Sachs & Co. | | $ | 12,813 | | | $ | (1,406 | ) | | $ | 11,407 | | | $ | 11,407 | | | $ | — | | |
* Cash collateral pledged may be in excess of the amounts shown in the table. The total cash collateral pledged by the Fund is disclosed in the Statements of Asset and Liabilities.
26
Victory Variable Insurance Funds | | Notes to Financial Statements — continued
December 31, 2019 | |
Summary of Derivative Instruments:
The following table presents the effect of derivative instruments on the Statement of Assets and Liabilities, categorized by risk exposure, as of December 31, 2019.
| | | Assets | | Liabilities | |
| | | Variation
Margin
Receivable on
Open Futures
Contracts* | | Variation
Margin
Receivable on
Open Swap
Agreements* | | Variation
Margin
Payable on
Open Futures
Contracts* | | Variation
Margin
Payable on
Open Swap
Agreements* | |
Credit Risk Exposure | | $ | — | | | $ | 281,897 | | | $ | — | | | $ | — | | |
Interest Rate Risk Exposure | | | — | | | | — | | | | 163,591 | | | | — | | |
* Includes cumulative appreciation/depreciation of futures contracts and credit default swap agreements as reported on the Schedule of Portfolio Investments. Only current day's variation margin for both futures contracts and credit default swap agreements are reported within the Statement of Assets and Liabilities.
The following table presents the effect of derivative instruments on the Statement of Operations, categorized by risk exposure, for the year ended December 31, 2019.
| | Net Realized Gains (Losses) on
Derivatives Recognized as
a Result from Operations | | Net Change in Unrealized
Appreciation/Depreciation
on Derivatives Recognized
as a Result of Operations | |
| | Net Realized
Gains (Losses)
from Futures
Contracts | | Net Realized
Gains (Losses)
from Swap
Agreements | | Net Change in
Unrealized
Appreciation/
Depreciation
on Futures
Contracts | | Net Change in
Unrealized
Appreciation/
Depreciation
on Swap
Agreements | |
Credit Risk Exposure | | $ | — | | | $ | (4,912,240 | ) | | $ | — | | | $ | 3,447,306 | | |
Interest Rate Risk Exposure | | | (1,407,778 | ) | | | — | | | | 1,160,672 | | | | — | | |
All open derivative positions at year end are reflected on the Fund's Schedule of Portfolio Investments. The underlying face value of open derivative positions relative to the Fund's net assets at year end is generally representative of the notional amount of open positions to net assets throughout the year.
Investment Transactions and Related Income:
Changes in holdings of investments are accounted for no later than one business day following the trade date. For financial reporting purposes, however, investment transactions are accounted for on trade date on the last business day of the reporting period. Interest income is determined on the basis of coupon interest accrued using the effective interest method which adjusts, where applicable, the amortization of premiums or accretion of discounts. Dividend income is recorded on the ex-dividend date. Gains or losses realized on sales of securities are determined by comparing the identified cost of the security lot sold with the net sales proceeds. Paydown gains or losses on applicable securities, if any, are recorded as components of interest income on the Statement of Operations.
Withholding taxes on interest, dividends and gains as a result of certain investments in ADRs by the Fund have been provided for in accordance with each investment's applicable country's tax rules and rates.
Securities Lending:
The Trust has entered into a Master Securities Lending Agreement ("MSLA") with Citibank, N.A. ("Citibank" or the "Agent"). Under the terms of the MSLA, the Fund may lend securities to certain broker-dealers and banks in exchange for collateral in the amount of at least 102% of the value of U.S.
27
Victory Variable Insurance Funds | | Notes to Financial Statements — continued
December 31, 2019 | |
securities loaned or at least 105% of the value of non-U.S. securities loaned, marked-to-market daily. Any collateral shortfalls associated with increases in the valuation of the securities loaned are adjusted the next business day. The collateral can be received in the form of cash collateral and/or non-cash collateral. Non-cash collateral can include U.S. Government Securities, letters of credit and certificates of deposit. The cash collateral is invested in short-term instruments or cash equivalents as noted on the Fund's Schedule of Portfolio Investments. The Trust does not have effective control of the non-cash collateral and therefore it is not disclosed in the Fund's Schedule of Portfolio Investments. The Fund continues to benefit from interest or dividends on the securities loaned and may also earn a return from the collateral. The Fund pays various fees in connection with the investment of cash collateral. The Fund pays the Agent fees based on the investment income received from securities lending activities. Securities lending income is disclosed in the Fund's Statement of Operations. Although risk is mitigated by the collateral, the Fund could experience a delay in recovering its securities and possible loss of income or value if the borrower fails to return them.
Securities lending transactions are entered into by the Fund under the MSLA, which permits the Fund, under certain circumstances such as an event of default, to offset amounts payable by the Fund to the same counterparty against amounts receivable from the counterparty to create a net payment due to or from the Fund.
The following table is a summary of the Fund's securities lending transactions which are subject to offset under the MSLA as of December 31, 2019. These transactions are accounted for as secured borrowings with an overnight and continuous contractual maturity for cash collateral, and greater than overnight and continuous contractual maturity for non-cash collateral.
Gross
Amount of
Recognized
Assets
(Value of | | Value of
Cash | | Value of Non-cash Collateral
Received by Maturity | | | |
Securities on
Loan) | | Collateral
Received* | | <30 Days | | Between 30 &
90 days | | >90 Days | | Net
Amount | |
| $ | 4,188,743 | | | $ | 4,188,743 | | | $ | — | | | $ | — | | | $ | — | | | $ | — | | |
* Collateral received in excess of the market value of securities on loan is not presented in this table. The total cash collateral received by the Fund is disclosed in the Statement of Assets and Liabilities.
Distributions to Shareholders:
Dividends from net investment income, if any, are declared and paid annually by the Fund. Distributable net realized gains, if any, are declared and distributed at least annually.
The amounts of dividends from net investment income and distributions from net realized gains are determined in accordance with federal income tax regulations, which may differ from GAAP. To the extent these "book/tax" differences are permanent in nature (e.g., net operating loss and distributions reclassification), such amounts are reclassified within the components of net assets based on their federal tax-basis treatment; temporary differences (e.g., wash sales) do not require reclassification. To the extent dividends and distributions exceed net investment income and net realized gains for tax purposes, they are reported as distributions of capital. Net investment losses incurred by the Fund may be reclassified as an offset to capital on the accompanying Statement of Assets and Liabilities.
As of December 31, 2019 on the Statement of Assets and Liabilities, as a result of permanent book-to-tax differences, reclassification adjustments were as follows:
| | Total
Distributable
Earnings/(Loss) | | Capital | |
| | | | | $ | (3 | ) | | $ | 3 | | |
28
Victory Variable Insurance Funds | | Notes to Financial Statements — continued
December 31, 2019 | |
Federal Income Taxes:
It is the policy of the Fund to continue to qualify as a regulated investment company by complying with the provisions available to certain investment companies, as defined in applicable sections of the Internal Revenue Code, and to make distributions of net investment income and net realized gains sufficient to relieve it from all, or substantially all, federal income taxes. Accordingly, no provision for federal income taxes is required in the financial statements. The Fund has a tax year end of December 31.
Management of the Fund has reviewed tax positions taken in tax years that remain subject to examination by all major tax jurisdictions, including federal (i.e., all open tax years and the interim tax period since then). Management believes that there is no tax liability resulting from unrecognized tax benefits related to uncertain tax positions taken.
Allocations:
Expenses directly attributable to the Fund are charged to the Fund, while expenses which are attributable to more than one fund in the Trust, or jointly with an affiliated trust, are allocated among the respective funds in the Trust and/or affiliated trust based upon net assets or another appropriate basis.
Cross-Trade Transactions:
Pursuant to Rule 17a-7 under the 1940 Act, the Fund may engage in cross-trades which are securities transactions with affiliated investment companies and advisory accounts managed by the Adviser and any applicable sub-adviser. Any such purchase or sale transaction must be effected without brokerage commission or other remuneration, except for customary transfer fees. The transaction must be effected at the current market price, which is either the security's last sale price on an exchange or, if there are no transactions in the security that day, at the average of the highest bid and lowest asked price. For the year ended December 31, 2019, the Fund did not engage in any Rule 17a-7 transactions under the 1940 Act.
3. Purchases and Sales of Securities:
Purchases and sales of securities (excluding securities maturing less than one year from acquisition) for the year ended December 31, 2019 were as follows for the Fund:
Purchases
(excluding U.S.
Government
Securities) | | Sales
(excluding U.S.
Government
Securities) | | Purchases
of U.S.
Government
Securities | | Sales
of U.S.
Government
Securities | |
| $ | 284,531,945 | | | $ | 202,451,830 | | | $ | 277,753,886 | | | $ | 457,106,924 | | |
4. Fees and Transactions with Affiliates and Related Parties:
Investment advisory services are provided to the Fund by Victory Capital Management Inc. ("VCM" or the "Adviser"), a New York corporation registered as an investment adviser with the Securities and Exchange Commission ("SEC"). The Adviser is a wholly owned indirect subsidiary of Victory Capital Holdings, Inc., a publicly traded Delaware corporation, and a wholly owned direct subsidiary of Victory Capital Operating, LLC.
Under the terms of the Investment Advisory Agreement, the Adviser is entitled to receive 0.50% of the average daily net assets of the Fund. The Adviser may use its resources to assist with the Fund's distribution and marketing expenses.
29
Victory Variable Insurance Funds | | Notes to Financial Statements — continued
December 31, 2019 | |
VCM also serves as the Fund's administrator and fund accountant. Under an Administration and Fund Accounting Agreement, VCM is paid for its services an annual fee at a rate of 0.08% of the first $15 billion in average daily net assets of the Trust, Victory Portfolios and Victory Portfolios II (collectively, the "Victory Funds Complex"), 0.05% of the average daily net assets above $15 billion to $30 billion of the Victory Funds Complex and 0.04% of the average daily net assets over $30 billion of the Victory Funds Complex.
Citi Fund Services Ohio, Inc. ("Citi"), an affiliate of Citibank, acts as sub-administrator and sub-fund accountant to the Fund pursuant to a Sub-Administration and Sub-Fund Accounting Services Agreement between VCM and Citi. VCM pays Citi a fee for providing these services. The Trust reimburses VCM and Citi for all of their reasonable out-of-pocket expenses incurred in providing these services.
FIS Investor Services, LLC ("FIS") serves as the Fund's transfer agent. Under the Transfer Agent Agreement, the Trust pays FIS a fee for its services and reimburses FIS for all of their reasonable out-of-pocket expenses incurred in providing these services.
The Chief Compliance Officer ("CCO") is an employee of the Adviser, which pays the compensation of the CCO and his support staff. The Trust has entered into an Agreement to provide compliance services with the Adviser, pursuant to which the Adviser furnishes its compliance personnel, including the services of the CCO, and other resources reasonably necessary to provide the Trust with compliance oversight services related to the design, administration and oversight of a compliance program for the Trust in accordance with Rule 38a-1 under the 1940 Act. The Funds in the Victory Funds Complex, in aggregate, compensate the Adviser for these services.
The Victory Funds Complex pays an annual retainer to each Independent Trustee, plus an additional annual retainer to the Chairman of the Board. The aggregate amount of the fees and expenses of the Independent Trustees are allocated amongst all the funds in the Victory Funds Complex and are presented in the Statement of Operations.
Shearman & Sterling LLP provides legal services to the Trust.
Victory Capital Advisers, Inc. (the "Distributor"), an affiliate of the Adviser, serves as distributor for the continuous offering of the shares of the Fund pursuant to a Distribution Agreement between the Distributor and the Trust.
The Adviser has entered into an expense limitation agreement with the Fund until at least April 30, 2020. Under the terms of the agreement, the Adviser has agreed to waive fees or reimburse certain expenses to the extent that ordinary operating expenses incurred by the Fund in any fiscal year exceed the expense limit for the Fund. Such excess amounts will be the liability of the Adviser. Interest, taxes, brokerage commissions, other expenditures which are capitalized in accordance with GAAP, and other extraordinary expenses not incurred in the ordinary course of a Fund's business are excluded from the expense limits. As of December 31, 2019, the expense limit (excluding voluntary waivers) is 0.56%.
The Fund has agreed to repay fees and expenses that were waived or reimbursed by the Adviser for a period up to three fiscal years after such waiver or reimbursement was made to the extent such payments or repayments would not cause the expenses to exceed the original expense limitation in place at time of the waiver or reimbursement or any expense limitation agreement in place at the time of repayment. As of December 31, 2019, the following amounts are available to be repaid to the Adviser. Amounts repaid to the Adviser during the year ended, if any, are reflected on the Statement of Operations as "Recoupment of prior expenses waived/reimbursed by Adviser".
Expires
December 31,
2020 | | Expires
December 31,
2021 | | Expires
December 31,
2022 | | Total | |
| $ | 362,552 | | | $ | 441,458 | | | $ | 1,148,942 | | | $ | 1,952,952 | | |
The Adviser may voluntarily waive or reimburse additional fees to assist the Fund in maintaining a competitive expense ratio. Voluntary waivers and reimbursements applicable to the Fund are not available to be recouped at a future time. There were no voluntary waivers or reimbursements for the year ended December 31, 2019.
Certain officers and/or interested trustees of the Fund are also officers and/or employees of the Adviser, Administrator, Fund Accountant, Sub-Administrator, Sub-Fund Accountant and Legal Counsel.
30
Victory Variable Insurance Funds | | Notes to Financial Statements — continued
December 31, 2019 | |
5. Risks:
The Fund may be subject to other risks in addition to these identified risks.
An investment in the Fund's shares represents an indirect investment in the securities owned by the Fund, some of which will be traded on a national securities exchange or in the over-the-counter markets. The value of the securities in which the Fund invests, like other market investments, may move up or down, sometimes rapidly and unpredictably. The value of the securities in which the Fund invests may affect the value of the Fund's shares. An investment in the Fund's shares at any point in time may be worth less than the original investment, even after taking into account the reinvestment of the Fund's distributions.
The Fund will be subject to credit risk with respect to the amount it expects to receive from counterparties for financial instruments entered into by the Fund. The Fund may be negatively impacted if a counterparty becomes bankrupt or otherwise fails to perform its obligations due to financial difficulties. The Fund may experience significant delays in obtaining any recovery in bankruptcy or other reorganization proceeding and the Fund may obtain only limited recovery or may obtain no recovery in such circumstances. The Fund typically enters into transactions with counterparties whose credit ratings are investment grade, as determined by a nationally recognized statistical rating organization or, if unrated, judged by the Adviser to be of comparable quality.
6. Borrowing and Interfund Lending:
Line of Credit:
For the year ended December 31, 2019, the Victory Funds Complex participated in a short-term, demand note "Line of Credit" with Citibank. Under the agreement with Citibank, for the period January 1, 2019 to June 30, 2019, the Victory Funds Complex could borrow up to $250 million, of which $100 million was committed and $150 million was uncommitted. Effective July 1, 2019, the agreement was amended to include the USAA Mutual Funds Complex (another series of mutual funds managed by the Adviser) and has a new termination date of June 29, 2020. Under this amended agreement, the Victory Funds Complex and USAA Mutual Funds Complex, combined, may borrow up to $600 million, of which $300 million is committed and $300 million is uncommitted. $40 million of the Line of Credit is reserved for use by the Victory Floating Rate Fund (herein, the "Fund"), another series of the Victory Funds Complex, with that Fund paying the related commitment fees for that amount. The purpose of the agreement is to meet temporary or emergency cash needs, including redemption requests that might otherwise require the untimely disposition of securities. With the agreement in effect for the period January 1, 2019 to June 30, 2019, Citibank received an annual commitment fee of 0.15% on $100 million for providing the Line of Credit. For the period July 1, 2019 to December 31, 2019, Citibank received an annual commitment fee of 0.15% on $300 million for providing the Line of Credit. For the year ended December 31, 2019, Citibank earned approximately $300 thousand in commitment fees from the combined Victory Funds Complex and USAA Mutual Funds Complex. Each fund in the Victory Funds Complex and the USAA Mutual Funds Complex pays a pro-rata portion of the commitment fees plus any interest (one month LIBOR plus one percent) on amounts borrowed. Interest charged to the Fund during the period, if applicable, is presented on the Statement of Operations under Line of credit fees.
The Fund did not utilize the Line of Credit during the year ended December 31, 2019.
Interfund Lending:
The Trust and Adviser rely on an exemptive order granted by the SEC in March 2017 (the "Order"), permitting the establishment and operation of an Interfund Lending Facility (the "Facility"). The Facility allows the Fund to directly lend and borrow money to or from any other Victory Fund relying upon the Order at rates beneficial to both the borrowing and lending funds. Advances under the Facility are allowed for temporary or emergency purposes, including the meeting of redemption requests that otherwise might require the untimely disposition of securities, and are subject to each fund's borrowing restrictions. The interfund loan rate is determined, as specified in the Order, by averaging the current repurchase agreement rate and the current bank loan rate. As a Borrower, interest charged to the
31
Victory Variable Insurance Funds | | Notes to Financial Statements — continued
December 31, 2019 | |
Fund during the period, if applicable, is presented on the Statement of Operations under Interfund lending fees. As a Lender, interest earned by the Fund during the period, if applicable, is presented on the Statement of Operations under Income on interfund lending.
| | | Borrower or
Lender | | Amount
Outstanding
at
December 31,
2019 | | Average
Borrowing* | | Days
Borrowing
Outstanding | | Average
Interest
Rate* | | Maximum
Borrowing
During the
Period | |
| | | | | Borrower | | $ | — | | | $ | 1,909,500 | | | | 2 | | | | 2.99 | % | | $ | 2,009,000 | | |
* For the year ended December 31, 2019, based on the number of days borrowings were outstanding.
7. Federal Income Tax Information:
The tax character of distributions paid during the most recent tax years ended, as noted below, were as follows (total distributions paid may differ from the Statements of Changes in Net Assets because, for tax purposes, dividends are recognized when actually paid).
| | Year Ended December 31, 2019 | |
| | | Distributions paid from | |
| | Ordinary
Income | | Net
Long-Term
Capital Gains | | Total
Distributions
Paid | |
| | | | | $ | 17,229,625 | | | $ | — | | | $ | 17,229,625 | | |
| | | Year Ended December 31, 2018 | |
| | | Distributions paid from | |
| | | Ordinary
Income | | Net
Long-Term
Capital Gains | | Total
Distributions
Paid | |
| | | | | $ | 4,289,680 | | | $ | — | | | $ | 4,289,680 | | |
As of the tax year ended December 31, 2019, the components of distributable earnings/accumulated deficit on a tax basis were as follows:
Undistributed
Ordinary
Income | | Undistributed
Long-Term
Capital Gains | | Accumulated
Earnings | | Accumulated
Capital and
Other
Losses | | Unrealized
Appreciation
(Depreciation)* | | Total
Accumulated
Earnings
(Deficit) | |
$ | 17,475,401 | | | $ | — | | | $ | 17,475,401 | | | $ | (5,435,442 | ) | | $ | 13,817,064 | | | $ | 25,857,023 | | |
* The difference between the book-basis and tax-basis unrealized appreciation (depreciation) is attributable primarily to tax deferral of losses on wash sales.
As of the tax year ended December 31, 2019, the Fund had long-term capital loss carryforwards of $5,435,442 that are not subject to expiration.
During the tax year ended December 31, 2019, the Fund utilized $7,852,573 of capital loss carryforwards.
As of December 31, 2019, the cost basis for federal income tax purposes, gross unrealized appreciation, gross unrealized depreciation and net unrealized appreciation (depreciation) for investments and derivatives were as follows:
Cost of
Investments
for Federal
Tax Purposes | | Gross
Unrealized
Appreciation | | Gross
Unrealized
Depreciation | | Net
Unrealized
Appreciation
(Depreciation) | |
| $ | 585,823,924 | | | $ | 16,145,670 | | | $ | (2,170,395 | ) | | $ | 13,975,275 | | |
32
Victory Variable Insurance Funds | | Notes to Financial Statements — continued
December 31, 2019 | |
8. Capital Contribution from Prior Custodian:
During 2016, the Fund received notification from the Fund's prior custodian, State Street Bank and Trust ("State Street"), concerning issues related to billing on certain categories of expenses during the approximately 16-year period from 1998 through October 31, 2014. The over-billing primarily related to categories of expenses that involved an allocation of general costs among multiple clients.
State Street paid the refunded amounts during January 2017. Based on billing information received during 2016 from State Street and an analysis of any expense limitation agreements that were in place during the period of the activities in question, including the application of any recoupment provisions in such agreements, the Adviser received a portion of the refund.
The portion of the refund retained by the Fund was accounted for as a capital contribution and is reflected on the Financial Highlights as "Capital Contribution from Prior Custodian, Net".
9. Fund Ownership:
Ownership of more than 25% of the voting securities of a fund creates presumptions of control of the Fund, under section 2(a)(9) of the 1940 Act. As of December 31, 2019, the shareholder listed below held more than 25% of the shares outstanding of the Fund and may be deemed to control the Fund.
| Shareholder | | Percent | |
| GIAC | | | 100.0 | % | |
10. Recent Accounting Pronouncements:
In March 2017, the Financial Accounting Standards Board ("FASB") issued Accounting Standards ("ASU") Update No. 2017-08 "Premium Amortization on Purchased Callable Debt Securities" ("ASU 2017-08"), which shortens the premium amortization period for purchased non-contingently callable debt securities. ASU 2017-08 specifies that the premium amortization period ends at the earliest call date, for purchased non-contingently callable debt securities. The Fund has adopted and applied ASU 2017-08 on a modified retrospective basis through a cumulative-effect adjustment as of the beginning of the period of adoption. The adoption of ASU 2017-08 had no material impact on information presented in the financial statements.
11. Subsequent Events:
The Fund has evaluated the need for additional disclosures or adjustments resulting from subsequent events through the date these financial statements were issued. Based on this evaluation, there were no subsequent events to report that would have a material impact on the Fund's financial statements.
33
REPORT OF INDEPENDENT REGISTERED PUBLIC ACCOUNTING FIRM
To the Shareholders and Board of Trustees of Victory Variable Insurance Funds
Opinion on the Financial Statements
We have audited the accompanying statement of assets and liabilities, including the schedule of portfolio investments, of Victory INCORE Investment Quality Bond VIP Series (the "Fund"), a series of Victory Variable Insurance Funds, as of December 31, 2019, the related statements of operations and changes in net assets, including the related notes, and the financial highlights for the year then ended (collectively referred to as the "financial statements"). In our opinion, the financial statements present fairly, in all material respects, the financial position of the Fund as of December 31, 2019, the results of its operations, the changes in its net assets, and the financial highlights for the year then ended, in conformity with accounting principles generally accepted in the United States of America.
The Fund's financial statements and financial highlights for the three years ended December 31, 2018, were audited by other auditors whose report dated February 15, 2019 and the Fund's financial highlights for the year ended December 31, 2015, were audited by other auditors whose report dated February 22, 2016, expressed unqualified opinions on those financial statements and financial highlights.
Basis for Opinion
These financial statements are the responsibility of the Fund's management. Our responsibility is to express an opinion on the Fund's financial statements based on our audit. We are a public accounting firm registered with the Public Company Accounting Oversight Board (United States) ("PCAOB") and are required to be independent with respect to the Fund in accordance with the U.S. federal securities laws and the applicable rules and regulations of the Securities and Exchange Commission and the PCAOB.
We conducted our audit in accordance with the standards of the PCAOB. Those standards require that we plan and perform the audit to obtain reasonable assurance about whether the financial statements are free of material misstatement whether due to error or fraud.
Our audit included performing procedures to assess the risks of material misstatement of the financial statements, whether due to error or fraud, and performing procedures that respond to those risks. Such procedures included examining, on a test basis, evidence regarding the amounts and disclosures in the financial statements. Our procedures included confirmation of securities owned as of December 31, 2019, by correspondence with the custodian and brokers or by other appropriate auditing procedures where replies from brokers were not received. Our audit also included evaluating the accounting principles used and significant estimates made by management, as well as evaluating the overall presentation of the financial statements. We believe that our audit provides a reasonable basis for our opinion.
We have served as the auditor of one or more of the investment companies advised by Victory Capital Management, Inc. since 2015.

COHEN & COMPANY, LTD.
Cleveland, Ohio
February 18, 2020
34
Victory Variable Insurance Funds | | Supplemental Information
December 31, 2019 | |
(Unaudited)
Trustee and Officer Information
Board of Trustees:
Overall responsibility for management of the Trust rests with the Board. The Trust is managed by the Board in accordance with the laws of the State of Delaware. There are currently ten Trustees, nine of whom are not "interested persons" of the Trust within the meaning of that term under the 1940 Act ("Independent Trustees") and one of whom is an "interested person" of the Trust within the meaning of that term under the 1940 Act ("Interested Trustee"). The Trustees, in turn, elect the officers of the Trust to actively supervise its day-to-day operations. The following tables list the Trustees, their ages, position with the Trust, commencement of service, principal occupations during the past five years and any directorships of other investment companies or companies whose securities are registered under the Securities Exchange Act of 1934, as amended, or who file reports under that Act. Each Trustee oversees nine portfolios in the Trust, 42 portfolios in Victory Portfolios and 26 portfolios in Victory Portfolios II, each a registered investment company that, together with the Trust, comprise the Victory Funds Complex. Each Trustee's address is c/o Victory Variable Insurance Funds, 4900 Tiedeman Road, 4th Floor, Brooklyn, Ohio 44144. Each Trustee has an indefinite term.
Name and Age | | Position
Held with
the Trust | | Date
Commenced
Service | | Principal Occupation
During Past 5 Years | | Other
Directorships
Held During
Past 5 Years | |
Independent Trustees. | |
David Brooks Adcock, 68 | | Trustee | | February 2005 | | Consultant (since 2006). | | Chair and Trustee, Turner Funds (December 2016-December 2017). | |
Nigel D.T. Andrews, 72 | | Vice Chair and Trustee | | August 2002 | | Retired. | | Director, TCG BDC II, Inc. (since 2017);
Director, TCG BDC I, Inc. (formerly Carlyle GMS Finance, Inc.) (since 2012); Director, Old Mutual US Asset Management (2002-2014). | |
E. Lee Beard, 68* | | Trustee | | February 2005 | | Retired (since 2015); Consultant, The Henlee Group, LLC (consulting) (2005-2015). | | None. | |
Dennis M. Bushe, 76 | | Trustee | | July 2016 | | Retired. | | Trustee, RS Investment Trust and RS Variable Products Trust (November 2011-July 2016). | |
35
Victory Variable Insurance Funds | | Supplemental Information — continued
December 31, 2019 | |
(Unaudited)
Name and Age | | Position
Held with
the Trust | | Date
Commenced
Service | | Principal Occupation
During Past 5 Years | | Other
Directorships
Held During
Past 5 Years | |
Sally M. Dungan, 65 | | Trustee | | February 2011 | | Chief Investment Officer, Tufts University (since 2002). | | None. | |
John L. Kelly, 66 | | Trustee | | February 2015 | | Partner, McCarvill Capital Partners (September 2016-September 2017); Advisor, Endgate Commodities LLC (January 2016-April 2016); Managing Partner, Endgate Commodities LLC (August 2014-January 2016); Chief Operating Officer, Liquidnet Holdings, Inc. (December 2011-July 2014). | | Director, Caledonia Mining Corporation (since May 2012). | |
David L. Meyer, 62* | | Trustee | | December 2008 | | Retired. | | None. | |
Gloria S. Nelund, 58 | | Trustee | | July 2016 | | Chair, CEO and Co-Founder of TriLinc Global, LLC, an investment firm. | | TriLinc Global Impact Fund, LLC (since 2012); Trustee, RS Investment Trust and RS Variable Products Trust (November 2007-July 2016). | |
Leigh A. Wilson, 75 | | Chair and Trustee | | February 1998 | | Private Investor. | | Chair (since 2013), Caledonia Mining Corporation. | |
Interested Trustee. | |
David C. Brown, 47** | | Trustee | | May 2008 | | Chairman and Chief Executive Officer (since 2013), Co-Chief Executive Officer (2011-2013), the Adviser; Chairman and Chief Executive Officer, Victory Capital Holdings, Inc. (since 2013). | | USAA Mutual Funds Trust. | |
* The Board has designated Mr. Meyer and Ms. Beard as its Audit Committee Financial Experts.
** Mr. Brown is an "Interested Person" by reason of his relationship with the Adviser.
The Statement of Additional Information includes additional information about the Trustees of the Trust and is available, without charge, by calling 800-539-3863.
36
Victory Variable Insurance Funds | | Supplemental Information — continued
December 31, 2019 | |
(Unaudited)
Officers:
The officers of the Trust, their ages, commencement of service and their principal occupations during the past five years, are detailed in the following table. Each officer serves until the earlier of his or her resignation, removal, retirement, death, or the election of a successor. The mailing address of each officer of the Trust is 4900 Tiedeman Road, 4th Floor, Brooklyn, Ohio 44144. The officers of the Trust receive no compensation directly from the Trust for performing the duties of their offices.
Name and Age | | Position with
the Trust | | Date
Commenced
Service | | Principal Occupation During Past 5 Years | |
Christopher K. Dyer, 58 | | President | | February 2006* | | Director of Fund Administration, the Adviser. | |
Scott A. Stahorsky, 50 | | Vice President | | December 2014 | | Manager, Fund Administration, the Adviser (since 2015); Senior Analyst, Fund Administration, the Adviser (prior to 2015). | |
Erin G. Wagner, 46 | | Secretary | | December 2014 | | Associate General Counsel, the Adviser (since 2013). | |
Allan Shaer, 54 | | Treasurer | | May 2017 | | Senior Vice President, Financial Administration, Citi Fund Services Ohio, Inc. (since 2016); Vice President, Mutual Fund Administration, JP Morgan Chase (2011-2016). | |
Christopher A. Ponte, 35 | | Assistant Treasurer | | December 2017 | | Manager, Fund Administration, the Adviser (since 2017); Senior Analyst, Fund Administration, the Adviser (prior to 2017); Chief Financial Officer, Victory Capital Advisers, Inc. (since 2018). | |
Colin Kinney, 46 | | Chief Compliance Officer | | July 2017 | | Chief Compliance Officer (since 2013) and Chief Risk Officer (2009-2017), the Adviser. | |
Chuck Booth, 59 | | Anti-Money Laundering Compliance Officer and Identity Theft Officer | | May 2015 | | Director, Regulatory Administration and CCO Support Services, Citi Fund Services Ohio, Inc. | |
Jay G. Baris, 66 | | Assistant Secretary | | February 1998 | | Partner, Shearman & Sterling LLP (since 2018); Partner, Morrison & Foerster LLP (2011-January 2018). | |
* On December 3, 2014, Mr. Dyer resigned as Secretary of the Trust and accepted the position of President.
37
Victory Variable Insurance Funds | | Supplemental Information — continued
December 31, 2019 | |
(Unaudited)
Proxy Voting and Portfolio Holdings Information
Proxy Voting:
Information regarding the policies and procedures the Fund uses to determine how to vote proxies relating to portfolio securities is available without charge, upon request, by calling 800-539-3863. The information is also included in the Fund's Statement of Additional Information, which is available on the SEC's website at www.sec.gov.
Information relating to how the Fund voted proxies relating to portfolio securities held during the most recent twelve months ended June 30 is available on the SEC's website at www.sec.gov.
Availability of Schedules of Portfolio Investments:
The Trust files a complete list of Schedules of Portfolio Investments with the SEC for the first and third quarters of each fiscal year on Form N-PORT. Prior to the implementation of Form N-PORT, the Trust filed a complete list of Schedules of Portfolio Investments with the SEC for the first and third quarters of each fiscal year on Form N-Q. Forms N-PORT and Forms N-Q are available on the SEC's website at www.sec.gov.
Expense Examples
As a shareholder of the Fund, you may incur two types of costs: (1) transaction costs and (2) ongoing costs, including management fees, distribution and service (12b-1) fees, and other Fund expenses. These examples are intended to help you understand your ongoing costs (in dollars) of investing in the Fund and to compare these costs with the ongoing costs of investing in other mutual funds.
These examples are based on an investment of $1,000 invested at the beginning of the period and held for the entire period from July 1, 2019 through December 31, 2019.
The Actual Expense figures in the table below provide information about actual account values and actual expenses. You may use the information below, together with the amount you invested, to estimate the expenses that you paid over the period. Simply divide your account value by $1,000 (for example, an $8,600 account value divided by $1,000 = 8.6), then multiply the result by the number in the table under the heading entitled "Actual Expenses Paid During Period" to estimate the expenses you paid on your account during this period.
The Hypothetical Expense figures in the table below provide information about hypothetical account values and hypothetical expenses based on the Fund's actual expense ratio and an assumed rate of return of 5% per year before expenses, which is not the Fund's actual return. The hypothetical account values and expenses may not be used to estimate the actual ending account balance or expenses you paid for the period. You may use this information to compare this 5% hypothetical example with the 5% hypothetical examples that appear in shareholder reports of other funds.
Please note the expenses shown in the table are meant to highlight your ongoing costs only and do not reflect any transactional costs. Therefore, the table is useful in comparing ongoing costs only, and will not help you determine the relative total costs of owning different funds. In addition, if these transactional costs were included, your costs would have been higher.
Beginning
Account Value
7/1/19 | | Actual
Ending
Account Value
12/31/19 | | Hypothetical
Ending
Account Value
12/31/19 | | Actual
Expenses
Paid During
Period
7/1/19-12/31/19* | | Hypothetical
Expenses
Paid During
Period
7/1/19-12/31/19* | | Annualized
Expense Ratio
During Period
7/1/19-12/31/19 | |
| $ | 1,000.00 | | | $ | 1,025.70 | | | $ | 1,022.38 | | | $ | 2.86 | | | $ | 2.85 | | | | 0.56 | % | |
* Expenses are equal to the average account value multiplied by the Fund's annualized expense ratio multiplied by 184/365 (the number of days in the most recent fiscal half-year divided by the number of days in the fiscal year).
38
Victory Variable Insurance Funds | | Supplemental Information — continued
December 31, 2019 | |
(Unaudited)
Considerations of the Board in Continuing the Investment Advisory Agreement (the "Agreement")
The Board approved the Agreement on behalf of the Fund at an in-person meeting, which was called for that purpose, on December 4, 2019. The Board also considered information relating to the Fund and the Agreement provided throughout the year and, more specifically, at a meeting on October 22, 2019. The Board noted that prior to the Fund's reorganization on July 29, 2016, the Fund was managed by RS Investment Management Co. LLC, which was acquired by the Adviser on July 29, 2016. In considering whether to approve the Agreement, the Board requested, and the Adviser provided, information that the Board believed to be reasonably necessary to reach its conclusions.
The Board, including the Independent Trustees, evaluated this information along with other information obtained throughout the year and was advised by legal counsel to the Fund, which also serves as independent legal counsel to the Independent Trustees. In addition, in 2017 the Independent Trustees, through their counsel, retained an independent consultant to assist with a review of the overall process for conducting the annual review of these advisory arrangements.
The Board considered the Fund's advisory fee, expense ratio and investment performance as significant factors in determining whether the Agreement should be continued. In considering whether the compensation paid to the Adviser was fair and reasonable, the Board also evaluated, among other things, the following factors:
• The requirements of the Fund for the services provided by the Adviser;
• The nature, quality and extent of the services provided and expected to be provided;
• The performance of the Fund as compared to comparable funds;
• The fees payable for the services and whether the fee arrangements provided for economies of scale that would benefit Fund shareholders as the Fund grows;
• Whether the fee would be sufficient to enable the Adviser to attract and retain experienced personnel and continue to provide quality services to the Fund;
• The fees paid by other clients of the Adviser whose accounts are managed in a similar investment style and any differences in the services provided to the other clients compared to those provided to the Fund;
• The total expenses of the Fund, taking into consideration any distribution or shareholder servicing fees;
• Management's commitment to operating the Fund at competitive expense levels;
• The profitability of the Adviser (as reflected by comparing fees earned against an estimate of the Adviser's costs) with respect to the Adviser's relationship with the Fund;
• Research and other service benefits received by the Adviser obtained through payment of client commissions for securities transactions;
• Other benefits received by the Adviser, and its affiliates, including revenues paid to the Adviser, or its affiliates, by the Fund for administration and fund accounting services, and distribution;
• The capabilities and financial condition of the Adviser;
• Current economic and industry trends; and
• The historical relationship between the Fund and the Adviser.
The Board reviewed the Fund's current management fee, comprised of the advisory fee plus the administrative services fee paid to the Adviser, in the context of the Adviser's profitability with respect to the Fund. In addition, the Board compared the Fund's total operating expense ratio on a net and gross basis, taking into consideration any distribution or shareholder servicing fees and management fees with a universe of comparable mutual funds compiled by an independent consultant and a peer group of funds with similar investment strategies selected by that independent consultant from the universe. The Board reviewed the factors and methodology used by the independent consultant in the selection of the Fund's peer group, including that independent consultant's selection of a broad universe of funds, the more specific universe of comparable funds, and peer groups of funds with comparable investment strategies and asset levels, among other factors. The Board also reviewed any changes to that independent consultant's methodology as compared to the prior year, including those resulting from the Adviser's input, if any. The Board also reviewed fees and other information related to the Adviser's management of similarly managed institutional or private accounts, and the differences in the
39
Victory Variable Insurance Funds | | Supplemental Information — continued
December 31, 2019 | |
(Unaudited)
services provided to the other accounts, to the extent applicable. The Board noted that the advisory fee arrangements for the Fund do not include breakpoints, which are generally viewed as a method by which the investment adviser shares any economies of scale with a fund as a fund grows. The Board also considered the Adviser's commitment to limit expenses as discussed in more detail below, and would consider breakpoints at a future time if the Fund's assets were to grow significantly.
The Board reviewed the Fund's performance over one-, three-, five- and ten-year periods against the performance of the Fund's selected peer group and benchmark index. The Board recognized that the performance of the Fund and the peer group funds are net of expenses, while the performance of the benchmark index reflects gross returns. The Board considered the additional resources that the Adviser has committed to enhance portfolio analysis, compliance and trading systems.
The Board reviewed various other specific factors with respect to the Fund, as described below. In their deliberations, the Trustees did not rank the importance of any particular information or factor considered and each Trustee may have attributed different weights to various factors.
The Board concluded that the Fund's gross annual management fee was reasonable as compared to the median gross management fee charged to the funds in the Fund's peer group. The Board noted that the Fund's net annual expense ratio, taking into account any shareholder servicing or distribution fees, was reasonable as compared to the median expense ratio for the peer group. The Board considered the Adviser's contractual agreement to waive its fees and reimburse expenses for a specified period of time, as described in the Fund's prospectus.
The Board then compared the Fund's performance for the one-, three-, five- and ten-year periods ended June 30, 2019, to that of the median performance of the peer group and benchmark index for the same periods and considered the fact that the Fund underperformed both the benchmark index and the peer group median for the one-, three- and five-year periods, outperformed the benchmark index for the ten-year period, and underperformed the peer group median for the ten-year period. The Board discussed with the Adviser how market conditions affected the Fund during periods of underperformance given the Fund's investment strategy and fee and expense profile.
Having considered, among other things: (1) that the Fund's management fee was within the ranges of advisory fees charged to comparable mutual funds; (2) that the Fund's total expense ratio was reasonable; (3) the Adviser's willingness to limit the expenses for a period of time would provide stability to the Fund's expenses during that period; (4) the transition of the investment team following the reorganization; and (5) the performance of the Fund, the Board concluded that the Agreement continued to be in the best interests of the Fund's shareholders.
Conclusion
Based on its review of the information requested and provided, and following extended discussions, the Board determined that the Agreement, on behalf of the Fund, was consistent with the best interests of the Fund and its shareholders, and the Board unanimously approved the Agreement, on behalf of the Fund, for an additional annual period on the basis of the foregoing review and discussions and the following considerations, among others:
• The fairness and reasonableness of the investment advisory fee payable to the Adviser under the Agreement in light of the investment advisory services provided, the costs of these services, the profitability of the Adviser's relationship with the Fund and the comparability of the fee paid to the fees paid by other investment companies;
• The nature, quality and extent of the investment advisory services provided by the Adviser;
• The Adviser's entrepreneurial commitment to the management of the Fund and the creation of a broad-based family of funds, which could entail a substantial commitment of the Adviser's resources to the successful operation of the Fund;
• The Adviser's representations regarding its staffing and capabilities to manage the Fund, including the retention of personnel with relevant portfolio management experience;
• The Adviser's efforts to enhance investment results by, among other things, developing quality portfolio management teams; and
• The overall high quality of the personnel, operations, financial condition, investment management capabilities, methodologies and performance of the Adviser.
40
Privacy Policy
Protecting the Privacy of Information
The Trust respects your right to privacy. We also know that you expect us to conduct and process your business in an accurate and efficient manner. To do so, we must collect and maintain certain personal information about you. This is the information we collect from you on applications or other forms, and from the transactions you make with us or third parties. It may include your name, address, social security number, account transactions and balances, and information about investment goals and risk tolerance.
We do not disclose any information about you or about former customers to anyone except as permitted or required by law. Specifically, we may disclose the information we collect to companies that perform services on our behalf, such as the transfer agent that processes shareholder accounts and printers and mailers that assist us in the distribution of investor materials. We may also disclose this information to companies that perform marketing services on our behalf. This allows us to continue to offer you Victory investment products and services that meet your investing needs, and to effect transactions that you request or authorize. These companies will use this information only in connection with the services for which we hired them. They are not permitted to use or share this information for any other purpose.
To protect your personal information internally, we permit access only by authorized employees and maintain physical, electronic and procedural safeguards to guard your personal information.*
* You may have received communications regarding information about privacy policies from other financial institutions which gave you the opportunity to "opt-out" of certain information sharing with companies which are not affiliated with that financial institution. The Trust does not share information with other companies for purposes of marketing solicitations for products other than the Trust. Therefore, the Trust does not provide opt-out options to their shareholders.
Victory Funds
P.O. Box 182593
Columbus, Ohio 43218-2593

Visit our website at: | | Call Victory at: | |
www.vcm.com | | 800-539-FUND (800-539-3863) | |
VVIF-RS-IIQBVIP-AR (12/19)

December 31, 2019
Annual Report
Victory Variable Insurance Funds
Victory High Yield VIP Series
Beginning January 1, 2021, as permitted by regulations adopted by the Securities and Exchange Commission, paper copies of the Fund's shareholder reports may no longer be sent by mail from the insurance company that issued your variable annuity and variable life insurance contract, unless you specifically request paper copies of the reports from your insurance company. Instead, the reports will be made available on www.victoryfunds.com. The insurance company that offers your contract may also make these reports available on a website, and such insurance company will notify you by mail each time a report is posted and provide you with a website link to access the report.
If you already elected to receive shareholder reports electronically, you will not be affected by this change and you need not take any action. You may elect to receive shareholder reports and other communications from the insurance company electronically by following the instructions provided by the insurance company.
If offered by your insurance company, you may elect to receive all future reports in paper and free of charge from the insurance company. You can inform your insurance company that you wish to continue receiving paper copies of your reports. Your election to receive reports in paper will apply to all funds available under your contract.
www.vcm.com
News, Information And Education 24 Hours A Day, 7 Days A Week
The Victory Funds site gives fund shareholders, prospective shareholders, and investment professionals a convenient way to access fund information, get guidance, and track fund performance anywhere they can access the Internet. The site includes:
• Detailed performance records
• Daily share prices
• The latest fund news
• Investment resources to help you become a better investor
• A section dedicated to investment professionals
Whether you're a potential investor searching for the fund that matches your investment philosophy, a seasoned investor interested in planning tools, or an investment professional, www.vcm.com has what you seek. Visit us anytime. We're always open.
Victory Variable Insurance Funds
Table of Contents
Shareholder Letter (Unaudited) | | | 3 | | |
Fund Review and Commentary (Unaudited) | | | 5 | | |
Financial Statements | |
Schedule of Portfolio Investments | | | 9 | | |
Statement of Assets and Liabilities | | | 13 | | |
Statement of Operations | | | 14 | | |
Statements of Changes in Net Assets | | | 15 | | |
Financial Highlights | | | 16 | | |
Notes to Financial Statements | | | 18 | | |
Report of Independent Registered Public
Accounting Firm | | | 27 | | |
Supplemental Information (Unaudited) | |
Trustee and Officer Information | | | 28 | | |
Proxy Voting and Portfolio Holdings Information | | | 31 | | |
Expense Examples | | | 31 | | |
Additional Federal Income Tax Information | | | 32 | | |
Advisory Contract Renewal | | | 33 | | |
Privacy Policy (inside back cover) | | | |
The Fund is distributed by Victory Capital Advisers, Inc. Victory Capital Management Inc. is the investment adviser to the Fund and receives fees from the Fund for performing services for the Fund.
This report is not authorized for distribution to prospective investors unless preceded or accompanied by a current prospectus of the Fund.
For additional information about any Victory Fund, including fees, expenses, and risks, view our prospectus online at www.vcm.com or call 800-539-3863. Read it carefully before you invest or send money.
The information in this annual report is based on data obtained from recognized services and sources and is believed to be reliable. Any opinions, projections, or recommendations in this report are subject to change without notice and are not intended as individual investment advice. Past investment performance of the Fund, markets or securities mentioned herein should not be considered to be indicative of future results.
• NOT FDIC INSURED • NO BANK GUARANTEE
• MAY LOSE VALUE

Call Victory at:
800-539-FUND (800-539-3863)
Visit our website at:
www.vcm.com
1
This page is intentionally left blank.
2
Victory Funds Letter to Shareholders
(Unaudited)
Dear Shareholder,
As we turn the page into a new decade, it's hard not to reflect on the fact that we have been enjoying the longest-ever bull market in U.S. equities. The run has been impressive, and despite periods of tumult and plenty of negative news, the bull market endured throughout 2019.
For the annual reporting period ended December 31, 2019, the S&P 500® Index posted impressive gains of 31.49%. This represents the greatest one-year gain since 2013 and also illustrates a swift bounce-back after a precipitous drop late in 2018. The move higher supports the notion that underlying fundamentals of U.S. companies drive performance, rather than the political rancor and headline fears that often capture the attention of investors.
Perhaps we shouldn't be surprised at the impressive performance of equities. The U.S. economy — the world's largest — remains on solid footing and has been a key driver of both domestic and international stocks. Robust job creation, near-record low unemployment, and steady consumer spending continue and offer reasons for further optimism. Meanwhile, inflation remains muted, and the Federal Reserve (the Fed) and other major global central banks have taken an accommodative stance. In fact, the Fed has cut interest rates by a total of 0.75% over three meetings last July, September and October.
The risk-on attitudes of investors, coupled with the accommodative monetary policy, had an expected impact on U.S. Treasury yields. The 10-year Treasury yield declined significantly over the course of 2019, falling from 2.66% to 1.92% at year-end. More interesting, however, was the fact that, the yield on 10-year Treasurys fell below shorter-term yields for the first time since before the 2007-2008 Global Financial Crisis. This inverted yield curve spooked investors for a spell, only to revert back to a traditional upward sloping yield curve by the end of the year.
The robust domestic economy, low interest rates, and ample liquidity from central banks provided a potent tonic for the stock market in 2019. In fact, at year-end 2019, the S&P 500® Index was approaching its highest valuation level since 1999. This reminds all of us to retain some historical context on the bull market. Many of us remember the Global Financial Crisis and, before that, the collapse of the dot-com bubble. Although those are now but a distant memory (and we are not forecasting such tumult), we should not forget that stocks don't always go up and cycles don't last forever. In other words, valuations still matter.
The key point is not to discount the risks. In addition to lofty valuations, investors need to keep apprised of trade disputes, geopolitical hotspots, a contentious U.S. election, and a host of other potential headwinds. Yet it is these very risks — these cross-currents — that may create pricing dislocations. This is an environment in which we believe our Victory Capital independent investment franchises can thrive.
On the following pages, you will find information relating to your Victory Funds investment. If you have any questions, we encourage you to contact your financial
3
advisor. Or, if you invest with us directly, you may call (800) 539-3863, or visit our website at www.vcm.com.
My colleagues and I sincerely appreciate the confidence you have placed in the Victory Funds, and we value the opportunity to help meet your investment goals.

Christopher K. Dyer, CFA
President,
Victory Funds
4
Victory Variable Insurance Funds (Unaudited)
Victory High Yield VIP Series
Portfolio Holdings
As a Percentage of Total Investments
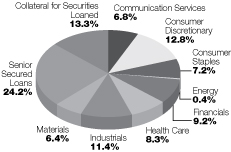
Performance Discussion
The Victory High Yield VIP Series (the "Fund") seeks to provide current income. For the year ended December 31, 2019, the Bloomberg Barclays U.S. Corporate High Yield Index (the "Index") rose 14.32% while the Fund outperformed the benchmark Index, returning 15.89% respectively.
Security selection, particularly at the lower end of the ratings scale and in gaming and pharmaceuticals, was the source of the Fund's outperformance. The Fund's underweight position in the volatile energy sector also was a key contributor to its relative performance.
Asset allocation, specifically the Fund's out-of-Index allocation to floating rate bank loans, detracted from its performance relative to the Index, as did the Fund's underweight position in BB-rated bonds and security selection in manufacturing.
Portfolio Review
We slightly decreased our exposure to floating rate loans in the second half of the year, sometimes swapping out loans to add to existing high yield bond positions from the same issuer. Our exposure to loans remained substantial; however, their underperformance relative to high yield bonds created some compelling relative value opportunities.
Despite the possibility of idiosyncratic rallies in energy, particularly in response to geopolitical events, we continued to anticipate further deterioration in what we believe is an unfavorable supply and demand dynamic for oil, and thus we remained cautious about the sector.
We continued to view valuations in the higher-quality segment of the market as unattractive. We increased the Fund's CCC-rated exposure over the course of the year given our desire to capture excess return from company-specific opportunities while remaining nimble enough to reduce exposure quickly if necessary.
Overall Market Review
After a woeful 2018, securities markets roared back in 2019. Returns of 25% or more were commonplace among major equity indexes and returns for traditionally riskier fixed-income asset classes also broke into the double digits as the U.S. Federal Reserve (the "Fed") and other central banks around the world reassured investors and encouraged risk taking by cutting interest rates.
The rally defied a daunting array of real and potential threats at home and abroad: cooling economies and heated politics; trade disputes; volatile energy prices; Brexit drama; the impeachment of President Trump; high valuations for many asset classes; and potential early warning signs of recession in the U.S. Treasury market. While these concerns caused bursts of anxiety, investors mostly took comfort from central bank support, steady (if lackluster) economic growth, extremely low unemployment, and strong consumer spending.
5
Victory Variable Insurance Funds (Unaudited)
Victory High Yield VIP Series (continued)
The S&P 500® Index returned 31.5% for the year, its best showing since 1997. In fixed income, the 10-year Treasury returned 8.9%.
High Yield Market Review
What a difference 12 months made. At the end of 2018, the high-yield market was unloved, with yields approaching 8.0%. It seemed unthinkable that all would be forgiven another year into one of the longest positive credit cycles in memory, but that's what happened.
The Index advanced in bursts during the year with strong rallies in January, June, and December. The January 2019 advance was a Fed-fueled rebound from a sharply oversold December 2018; the June rally was triggered by both the Fed and an improvement in the trade outlook; and December brought a potent surge for riskier assets.
Quality led the way in 2019 with each successive rating category outperforming the one below it. At a time when riskier assets generally outperformed, the underperformance of CCC-rated bonds may seem like something of an enigma. The explanation was that this category contained a high percentage of distressed and defaulting energy companies. Excluding energy and commodities, CCC-rated bonds posted a respectable 12.0% annual return.
High Yield Market Outlook
The end of 2019 presented a mirror image of the high-yield market at the end of 2018. The year's rebound brought low absolute yields, tight credit spreads, lower coupon income, and increased sensitivity to increases in interest rates. Given these Index characteristics, investors could be forgiven for wondering what could possibly go...right?
With the Index as a whole, possibly not much. But with a highly selective, deeply researched, and focused portfolio, we believe there's still plenty that could go right.
The Index ended 2019 with rich valuations. Fully two-thirds of bonds in it were trading with yields below the 5.4% mean and 41% traded to a yield below 4.0%. Contrast this with year-end 2018 when only 3.6% of the Index traded to a yield below 4.0%. We believe that selectiveness is now more important than ever, and employing a concentrated, high-conviction strategy could potentially avoid the risk of owning low-yielding "passengers" that contribute little and dilute returns.
Sector risks also underscore the importance of research and selection. The high-yield market has experienced an increase in stressed companies in energy, health care, retail, and telecommunication, which together accounted for over 36% of the Index at year-end. Skillfully navigating or avoiding these industries could significantly distinguish portfolio returns from Index returns.
New issues are likely to present their own risks in 2020. Issuance is expected to decline from 2019 levels and a scarcity of deals could continue to produce overly generous terms for borrowers, including some unrealistic valuations at levels not seen since near the end of the previous credit cycle in 2007.
Throughout the year, our strategy continued to focus on mid- to lower-rated issues that we believed had clear catalysts for improvement. At the same time, we continued to choose
6
Victory Variable Insurance Funds (Unaudited)
Victory High Yield VIP Series (continued)
certain high-quality secured loans over bonds, often from the same issuer, given loans' more attractive valuations and minimal duration risk.
Overall Market Outlook
We believe that while the Fed's renewed focus on supporting economic growth may bear fruit slowly for the U.S. economy, it had a meaningful impact on securities markets throughout 2019. We believe that much will continue to depend on whether investors view the Fed and its peers around the world as both committed to supporting growth and capable of doing so. We would note that a market leaning too heavily on central bank support could be fragile if the Fed proves unwilling or unable to prevent a downturn. We continue to view global growth concerns, domestic politics, trade tensions, and energy prices as key potential catalysts for shifts in risk.
As we attempt to balance the genuine benefit of current Fed policy and the minimal risk of imminent recession with the fact that the economy is decelerating and there are few obvious catalysts to boost returns, we believe it is important to take a highly selective approach rather than counting on broad-based spread tightening.
7
Victory Variable Insurance Funds (Unaudited)
Victory High Yield VIP Series (continued)
Average Annual Total Return
Year Ended December 31, 2019
| | Class I | |
INCEPTION DATE | | 9/13/99 | |
| | | Net Asset
Value | | Bloomberg
Barclays U.S. Corporate
High Yield Index1 | |
One Year | | | 15.89 | % | | | 14.32 | % | |
Three Year | | | 8.52 | % | | | 6.37 | % | |
Five Year | | | 7.08 | % | | | 6.13 | % | |
Ten Year | | | 7.32 | % | | | 7.57 | % | |
Since Inception | | | 6.05 | % | | | N/A | | |
Expense Ratios
Gross | | | 0.83 | % | |
With Applicable Waivers | | | 0.83 | % | |
Past performance is not indicative of future results. The performance data quoted represents past performance and current returns may be lower or higher. The investment return and principal value will fluctuate so that an investor's shares, when redeemed, may be worth more or less than the original cost. To obtain performance information current to the most recent month's end, please visit www.vcm.com.
The above expense ratios are from the Fund's prospectus dated May 1, 2019. Additional information pertaining to the Fund's expense ratios as of December 31, 2019 can be found in the financial highlights.
The total return figures set forth above include all waivers of fees for various periods since inception. Without such fee waivers, the total returns would have been lower. Some fee waivers are voluntary and may be modified or terminated at any time. The total returns do not include any insurance, sales or administrative charges of variable annuity or life insurance contracts. If these charges were included, the total returns would have been lower.
Victory High Yield VIP Series — Growth of $10,000

1The Bloomberg Barclays U.S. Corporate High Yield Index is generally considered to be representative of the investable universe of the U.S.-dominated high yield debt market. The Barclays U.S. Corporate High Yield Index is not available for direct investment. There are no expenses associated with the index, while there are expenses associated with the Fund. It is not possible to invest directly in an index.
The graph reflects investment of growth of a hypothetical $10,000 investment in the Fund. Past performance is no guarantee of future results.
The graph and table do not reflect the deduction of taxes that a shareholder would pay on Fund distributions or the redemption of Fund shares.
8
Victory Variable Insurance Funds
Victory High Yield VIP Series | | Schedule of Portfolio Investments
December 31, 2019 | |
Security Description | | Shares or
Principal
Amount | | Value | |
Common Stocks (1.6%) | |
Communication Services (1.6%): | |
AMC Networks, Inc., Class A (a) | | | 3,000 | | | $ | 118,500 | | |
Cinemark Holdings, Inc. | | | 2,500 | | | | 84,625 | | |
TEGNA, Inc. | | | 17,000 | | | | 283,730 | | |
| | | | 486,855 | | |
Total Common Stocks (Cost $455,583) | | | 486,855 | | |
Senior Secured Loans (27.0%) | |
1199169 BC ULC, 6.10% (LIBOR03M+400bps), 4/6/26 (b) | | $ | 87,194 | | | | 87,725 | | |
Ai Ladder Luxembourg Subco Sarl, 1st Lien Term Loan B, 6.60%
(LIBOR03M+450bps), 5/4/25 (b) | | | 391,425 | | | | 390,446 | | |
Alphabet Holding Co., Inc., 2nd Lien Term Loan, 9.45% (LIBOR01M+775bps),
8/15/25 (b) | | | 500,000 | | | | 437,915 | | |
Avaya, Inc., 1st Lien Term Loan B, 5.99% (LIBOR01M+425bps), 12/15/24 (b) | | | 313,960 | | | | 307,524 | | |
Bass Pro Group LLC, Term Loan B, 6.70% (LIBOR01M+500bps), 12/16/23 (b) | | | 486,282 | | | | 484,458 | | |
Clear Channel Outdoor Holdings, Inc., 5.20% (LIBOR01M+350bps),
11/25/26 (b) | | | 249,375 | | | | 250,532 | | |
CPM Holdings, Inc., 1st Lien Term Loan, 5.45% (LIBOR01M+375bps),
11/17/25 (b) | | | 198,000 | | | | 195,624 | | |
Crown Finance U.S., Inc., 1st Lien Term Loan B, 3.95% (LIBOR01M+225bps),
2/7/25 (b) | | | 285,980 | | | | 285,589 | | |
Dayco Products LLC , 6.16% (LIBOR03M+425bps), 5/19/24 (b) | | | 487,500 | | | | 424,125 | | |
Diamond Sports Group LLC, 5.03% (LIBOR01M+325bps), 8/24/26 (b) | | | 249,375 | | | | 248,856 | | |
Dynasty Acquisition Co., Inc., 6.10% (LIBOR03M+400bps), 4/6/26 (b) | | | 162,181 | | | | 163,169 | | |
GTT Communications, Inc., 1st Lien Term Loan B,
4.45% (LIBOR01M+275bps), 5/31/25 (b) | | | 124,369 | | | | 103,526 | | |
Hertz Corp., Term Loan B1, 4.46% (LIBOR01M+275bps), 6/30/23 (b) | | | 479,644 | | | | 482,143 | | |
Holley Purchaser, Inc., 1st Lien Term Loan, 6.93% (LIBOR03M+500bps),
10/24/25 (b) | | | 198,000 | | | | 185,130 | | |
II-VI, Inc., 5.21% (LIBOR01M+350bps), 9/24/26 (b) | | | 249,375 | | | | 250,310 | | |
LifeScan Global Corp., 1st Lien Term Loan, 8.06% (LIBOR06M+600bps),
6/19/24 (b) | | | 465,000 | | | | 441,555 | | |
Navistar, Inc., 1st Lien Term Loan B, 5.24% (LIBOR01M+350bps),
11/2/24 (b) | | | 243,769 | | | | 242,752 | | |
Nexstar Broadcasting, Inc., 1st Lien Term Loan, 4.45% (LIBOR01M+275bps),
6/20/26 (b) | | | 250,000 | | | | 251,165 | | |
Packaging Coordinators Midco, Inc., 2nd Lien Term Loan, 10.86%
(LIBOR03M+875bps), 7/1/24 (b) | | | 250,000 | | | | 248,750 | | |
Radiate Holdco LLC, 4.70% (LIBOR01M+300bps), 2/1/24 (b) | | | 241,203 | | | | 241,927 | | |
Reynolds Group Holdings, Inc., 1st Lien Term Loan B, 4.45%
(LIBOR01M+275bps), 2/5/23 (b) | | | 252,357 | | | | 252,950 | | |
SIWF Holdings, Inc., 10.20% (LIBOR01M+850bps), 5/26/26 (b) | | | 500,000 | | | | 471,250 | | |
Specialty Building Products Holdings LLC, 1st Lien Term Loan, 7.45%
(LIBOR01M+575bps), 10/1/25 (b) | | | 497,500 | | | | 494,600 | | |
Spectacle Gary Holdings LLC, 10.80% (LIBOR01M+900bps), 10/17/24 (b) (c) | | | 233,108 | | | | 235,439 | | |
Spectacle Gary Holdings LLC 10/17/25 (c) (d) | | | 16,892 | | | | 17,061 | | |
Sprint Communications, Inc., 1st Lien Term Loan B, 4.25%
(LIBOR01M+250bps), 2/2/24 (b) | | | 491,162 | | | | 486,372 | | |
See notes to financial statements.
9
Victory Variable Insurance Funds
Victory High Yield VIP Series | | Schedule of Portfolio Investments — continued
December 31, 2019 | |
Security Description | | Principal
Amount | | Value | |
Stars Group Holdings BV, 5.60% (LIBOR03M+350bps), 6/27/25 (b) | | $ | 429,563 | | | $ | 432,948 | | |
Tenneco, Inc., 1st Lien Term Loan B, 4.70% (LIBOR01M+300bps),
6/18/25 (b) | | | 198,000 | | | | 193,256 | | |
Total Senior Secured Loans (Cost $8,399,694) | | | 8,307,097 | | |
Corporate Bonds (68.3%) | |
Communication Services (6.0%): | |
AMC Entertainment Holdings, Inc., 6.13%, 5/15/27, Callable 5/15/22 @ 103.06 (e) | | | 500,000 | | | | 457,200 | | |
AMC Networks, Inc., 4.75%, 8/1/25, Callable 8/1/21 @ 102.38 (e) | | | 400,000 | | | | 402,452 | | |
Consolidated Communications, Inc., 6.50%, 10/1/22, Callable 2/10/20 @ 101.63 (e) | | | 250,000 | | | | 228,358 | | |
Hughes Satellite Systems Corp., 6.63%, 8/1/26 (e) | | | 500,000 | | | | 553,995 | | |
Telesat Canada/Telesat LLC, 6.50%, 10/15/27, Callable 10/15/22 @ 103.25 (f) | | | 200,000 | | | | 208,174 | | |
| | | | 1,850,179 | | |
Consumer Discretionary (14.5%): | |
1011778 BC ULC / New Red Finance, Inc., 4.38%, 1/15/28,
Callable 11/15/22 @ 102.19 (f) | | | 220,000 | | | | 221,663 | | |
Beazer Homes USA, Inc., 5.88%, 10/15/27, Callable 10/15/22 @ 102.94 (e) | | | 400,000 | | | | 403,576 | | |
Boyd Gaming Corp., 6.38%, 4/1/26, Callable 4/1/21 @ 103.19 | | | 392,000 | | | | 422,396 | | |
Eldorado Resorts, Inc., 6.00%, 9/15/26, Callable 9/15/21 @ 104.5 | | | 400,000 | | | | 441,712 | | |
Golden Nugget, Inc., 8.75%, 10/1/25, Callable 10/1/20 @ 104.38 (f) | | | 500,000 | | | | 535,425 | | |
Installed Building Products, Inc., 5.75%, 2/1/28, Callable 2/1/23 @ 102.88 (f) | | | 200,000 | | | | 213,742 | | |
Mattel, Inc., 5.45%, 11/1/41, Callable 5/1/41 @ 100 | | | 250,000 | | | | 210,925 | | |
MGM Resorts International, 5.50%, 4/15/27, Callable 1/15/27 @ 100 | | | 250,000 | | | | 277,650 | | |
Panther BF Aggregator 2 LP/Panther Finance Co., Inc., 8.50%, 5/15/27,
Callable 5/15/22 @ 104.25 (f) | | | 250,000 | | | | 265,640 | | |
Scientific Games International, Inc., 8.25%, 3/15/26, Callable 3/15/22 @ 104.13 (f) | | | 300,000 | | | | 330,684 | | |
The Enterprise Development Authority, 12.00%, 7/15/24, Callable 7/15/21 @ 109 (f) | | | 500,000 | | | | 573,289 | | |
Yum! Brands, Inc., 5.35%, 11/1/43, Callable 5/1/43 @ 100 | | | 550,000 | | | | 550,049 | | |
| | | | 4,446,751 | | |
Consumer Staples (8.1%): | |
Albertsons Cos. LLC, 5.75%, 3/15/25, Callable 2/10/20 @ 104.31 | | | 500,000 | | | | 518,715 | | |
Albertsons Cos., Inc./Safeway, Inc./New Albertsons LP/Albertsons LLC,
5.88%, 2/15/28, Callable 8/15/22 @ 104.41 (f) | | | 125,000 | | | | 132,963 | | |
B&G Foods, Inc., 5.25%, 4/1/25, Callable 4/1/20 @ 103.94 | | | 200,000 | | | | 206,136 | | |
Cott Holdings, Inc., 5.50%, 4/1/25, Callable 4/1/20 @ 104.13 (f) (g) | | | 500,000 | | | | 522,720 | | |
Dole Food Co., Inc., 7.25%, 6/15/25, Callable 6/15/20 @ 103.63 (f) | | | 500,000 | | | | 483,929 | | |
Post Holdings, Inc., 5.00%, 8/15/26, Callable 8/15/21 @ 102.5 (f) | | | 250,000 | | | | 264,938 | | |
Simmons Foods, Inc., 7.75%, 1/15/24, Callable 1/15/21 @ 103.88 (f) | | | 330,000 | | | | 354,829 | | |
| | | | 2,484,230 | | |
See notes to financial statements.
10
Victory Variable Insurance Funds
Victory High Yield VIP Series | | Schedule of Portfolio Investments — continued
December 31, 2019 | |
Security Description | | Principal
Amount | | Value | |
Energy (0.4%): | |
Citgo Holding, Inc., 9.25%, 8/1/24, Callable 8/1/21 @ 104.63 (f) | | $ | 125,000 | | | $ | 134,251 | | |
Financials (10.4%): | |
Acrisure LLC/Acrisure Finance, Inc., 8.13%, 2/15/24, Callable 2/15/21 @ 104.06 (f) | | | 225,000 | | | | 244,548 | | |
BCPE Cycle Merger Sub II, Inc., 10.63%, 7/15/27, Callable 7/15/22 @ 105.31 (f) | | | 200,000 | | | | 204,314 | | |
Capitol Investment Merger Sub 2 LLC, 10.00%, 8/1/24, Callable 8/1/21 @ 105 (f) | | | 250,000 | | | | 260,145 | | |
Compass Group Diversified Holdings LLC, 8.00%, 5/1/26,
Callable 5/1/21 @ 104 (f) (g) | | | 500,000 | | | | 542,039 | | |
Downstream Development Authority of the Quapaw Tribe of Oklahoma,
10.50%, 2/15/23, Callable 2/15/20 @ 107.25 (f) | | | 500,000 | | | | 525,015 | | |
Eagle Holding Co. II LLC, 7.75%, 5/15/22, Callable 2/10/20 @ 101 (e) (f) | | | 250,000 | | | | 253,675 | | |
Gray Escrow, Inc., 7.00%, 5/15/27, Callable 5/15/22 @ 105.25 (f) | | | 120,000 | | | | 133,702 | | |
Intelsat Jackson Holdings SA, 5.50%, 8/1/23, Callable 2/10/20 @ 101.83 | | | 250,000 | | | | 214,575 | | |
LABL Escrow Issuer LLC, 10.50%, 7/15/27, Callable 7/15/22 @ 105.25 (f) | | | 250,000 | | | | 255,943 | | |
Resideo Funding, Inc., 6.13%, 11/1/26, Callable 11/1/21 @ 104.59 (e) (f) | | | 300,000 | | | | 299,976 | | |
Wolverine Escrow LLC, 13.13%, 11/15/27, Callable 11/15/22 @ 109.84 (f) | | | 250,000 | | | | 257,215 | | |
| | | | 3,191,147 | | |
Health Care (9.2%): | |
Air Medical Group Holdings, Inc., 6.38%, 5/15/23, Callable 2/10/20 @ 101.59 (f) | | | 500,000 | | | | 445,169 | | |
Avantor, Inc., 9.00%, 10/1/25, Callable 10/1/20 @ 106.75 (f) (g) | | | 250,000 | | | | 279,788 | | |
Bausch Health Cos., Inc., 6.13%, 4/15/25, Callable 4/15/20 @ 103.06 (f) | | | 500,000 | | | | 517,395 | | |
Endo Finance LLC, 6.00%, 2/1/25, Callable 2/10/20 @ 103 (f) | | | 200,000 | | | | 135,398 | | |
Ortho-Clinical Diagnostics, Inc., 6.63%, 5/15/22, Callable 2/10/20 @ 100 (e) (f) (g) | | | 300,000 | | | | 298,614 | | |
Regional Care Hospital Partners Holdings, Inc./LifePoint Health, Inc., 9.75%,
12/1/26, Callable 12/1/21 @ 104.88 (f) | | | 300,000 | | | | 339,534 | | |
Surgery Center Holdings, Inc., 10.00%, 4/15/27, Callable 4/15/22 @ 105 (e) (f) | | | 250,000 | | | | 273,983 | | |
Verscend Escrow Corp., 9.75%, 8/15/26, Callable 8/15/21 @ 104.88 (f) | | | 500,000 | | | | 548,075 | | |
| | | | 2,837,956 | | |
Industrials (12.7%): | |
Ahern Rentals, Inc., 7.38%, 5/15/23, Callable 2/10/20 @ 103.69 (f) | | | 500,000 | | | | 396,875 | | |
Algeco Global Finance 2 PLC, 10.00%, 8/15/23, Callable 2/15/20 @ 105 (e) (f) (g) | | | 300,000 | | | | 297,261 | | |
Apex Tool Group LLC/BC Mountain Finance, Inc., 9.00%, 2/15/23,
Callable 2/10/20 @ 102 (f) | | | 250,000 | | | | 224,088 | | |
Beacon Escrow Corp., 4.88%, 11/1/25, Callable 11/1/20 @ 102.44 (e) (f) | | | 470,000 | | | | 472,109 | | |
Bombardier, Inc., 7.88%, 4/15/27, Callable 4/15/22 @ 103.94 (f) | | | 400,000 | | | | 412,128 | | |
Covanta Holding Corp., 5.88%, 7/1/25, Callable 7/1/20 @ 104.41 | | | 500,000 | | | | 527,640 | | |
Pisces Midco, Inc., 8.00%, 4/15/26, Callable 4/15/21 @ 104 (e) (f) | | | 500,000 | | | | 521,830 | | |
SRS Distribution, Inc., 8.25%, 7/1/26, Callable 7/1/21 @ 104.13 (e) (f) (g) | | | 250,000 | | | | 258,158 | | |
TransDigm, Inc., 6.50%, 7/15/24, Callable 2/10/20 @ 103.25 | | | 400,000 | | | | 413,504 | | |
Triumph Group, Inc., 6.25%, 9/15/24, Callable 9/15/20 @ 103.13 (f) | | | 150,000 | | | | 157,821 | | |
United Rentals North America, Inc., 6.50%, 12/15/26, Callable 12/15/21 @ 103.25 | | | 200,000 | | | | 220,098 | | |
| | | | 3,901,512 | | |
Materials (7.0%): | |
Ardagh Packaging Finance PLC/Holdings USA, Inc., 6.00%, 2/15/25,
Callable 2/15/20 @ 104.5 (f) | | | 450,000 | | | | 472,010 | | |
Greif, Inc., 6.50%, 3/1/27, Callable 3/1/22 @ 103.25 (e) (f) | | | 400,000 | | | | 432,996 | | |
Intertape Polymer Group, Inc., 7.00%, 10/15/26, Callable 10/15/21 @ 103.5 (f) | | | 670,000 | | | | 706,609 | | |
Plastipak Holdings, Inc., 6.25%, 10/15/25, Callable 10/15/20 @ 103.13 (e) (f) | | | 330,000 | | | | 284,236 | | |
See notes to financial statements.
11
Victory Variable Insurance Funds
Victory High Yield VIP Series | | Schedule of Portfolio Investments — continued
December 31, 2019 | |
Security Description | | Shares or
Principal
Amount | | Value | |
Titan Acquisition Ltd./Titan Co-Borrower LLC, 7.75%, 4/15/26,
Callable 4/15/21 @ 103.88 (e) (f) (g) | | $ | 250,000 | | | $ | 247,958 | | |
| | | | 2,143,809 | | |
Total Corporate Bonds (Cost $20,224,695) | | | 20,989,835 | | |
Collateral for Securities Loaned^ (14.8%) | |
BlackRock Liquidity Funds TempFund Portfolio, Institutional Class, 1.75% (h) | | | 217,410 | | | | 217,410 | | |
Fidelity Investments Money Market Government Portfolio, Class I, 1.54% (h) | | | 1,197,776 | | | | 1,197,776 | | |
Fidelity Investments Prime Money Market Portfolio, Class I, 1.75% (h) | | | 36,313 | | | | 36,313 | | |
Goldman Sachs Financial Square Prime Obligations Fund, Institutional
Class, 1.80% (h) | | | 723,580 | | | | 723,580 | | |
JPMorgan Prime Money Market Fund, Capital Class, 1.73% (h) | | | 795,995 | | | | 795,995 | | |
Morgan Stanley Institutional Liquidity Prime Portfolio, Institutional
Class, 1.76% (h) | | | 1,591,935 | | | | 1,591,935 | | |
Total Collateral for Securities Loaned (Cost $4,563,009) | | | 4,563,009 | | |
Total Investments (Cost $33,642,981) — 111.7% | | | 34,346,796 | | |
Liabilities in excess of other assets — (11.7)% | | | (3,607,258 | ) | |
NET ASSETS — 100.00% | | $ | 30,739,538 | | |
^ Purchased with cash collateral from securities on loan.
(a) Non-income producing security.
(b) Variable or Floating-Rate Security. Rate disclosed is as of December 31, 2019.
(c) Security purchased on a when-issued basis.
(d) The rates for this senior secured loan will be known on settlement date of the loan, subsequent to this report date. Senior secured loans have rates that will fluctuate over time in line with prevailing interest rates.
(e) All or a portion of this security is on loan.
(f) Rule 144A security or other security that is restricted as to resale to institutional investors. The Fund's Adviser has deemed this security to be liquid based upon procedures approved by the Board of Trustees. As of December 31, 2019, the fair value of these securities was $14,940,854 and amounted to 48.6% of net assets.
(g) All or a portion of this security has been segregated as collateral for securities purchased on a when-issued basis.
(h) Rate disclosed is the daily yield on December 31, 2019.
bps — Basis points
LIBOR — London InterBank Offered Rate
LIBOR01M — 1 Month US Dollar LIBOR, rate disclosed as of December 31, 2019, based on the last reset date of the security
LIBOR03M — 3 Month US Dollar LIBOR, rate disclosed as of December 31, 2019, based on the last reset date of the security
LIBOR06M — 6 Month US Dollar LIBOR, rate disclosed as of December 31, 2019, based on the last reset date of the security
LLC — Limited Liability Company
LP — Limited Partnership
PLC — Public Limited Company
ULC — Unlimited Liability Co.
See notes to financial statements.
12
Victory Variable Insurance Funds | | Statement of Assets and Liabilities
December 31, 2019 | |
| | | Victory High Yield
VIP Series | |
ASSETS: | |
Investments, at value (Cost $33,642,981) | | $ | 34,346,796 | (a) | |
Cash and cash equivalents | | | 794,142 | | |
Interest and dividends receivable | | | 440,242 | | |
Receivable for capital shares issued | | | 4,939 | | |
Receivable for investments sold | | | 9,994 | | |
Receivable from Adviser | | | 8,472 | | |
Prepaid expenses | | | 1,987 | | |
Total Assets | | | 35,606,572 | | |
LIABILITIES: | |
Payables: | |
Collateral received on loaned securities | | | 4,563,009 | | |
Investments purchased | | | 242,500 | | |
Capital shares redeemed | | | 18,593 | | |
Accrued expenses and other payables: | |
Investment advisory fees | | | 15,698 | | |
Administration fees | | | 1,474 | | |
Custodian fees | | | 2,560 | | |
Transfer agent fees | | | 3,588 | | |
Compliance fees | | | 20 | | |
Trustees' fees | | | 63 | | |
Other accrued expenses | | | 19,529 | | |
Total Liabilities | | | 4,867,034 | | |
NET ASSETS: | |
Capital | | | 31,704,358 | | |
Total distributable earnings/(loss) | | | (964,820 | ) | |
Net Assets | | $ | 30,739,538 | | |
Shares (unlimited shares authorized with a par value of $0.001 per share): | | | 4,177,521 | | |
Net asset value: | | $ | 7.36 | | |
(a) Includes $4,395,413 of securities on loan.
See notes to financial statements.
13
Victory Variable Insurance Funds | | Statement of Operations
For the Year Ended December 31, 2019 | |
| | | Victory High Yield
VIP Series | |
Investment Income: | |
Dividends | | $ | 16,135 | | |
Interest | | | 2,216,389 | | |
Securities lending (net of fees) | | | 21,154 | | |
Total Income | | | 2,253,678 | | |
Expenses: | |
Investment advisory fees | | | 190,287 | | |
Administration fees | | | 19,396 | | |
Custodian fees | | | 12,878 | | |
Transfer agent fees | | | 43,321 | | |
Trustees' fees | | | 3,986 | | |
Compliance fees | | | 214 | | |
Legal and audit fees | | | 14,571 | | |
Other expenses | | | 29,949 | | |
Total Expenses | | | 314,602 | | |
Expenses waived/reimbursed by Adviser | | | (32,348 | ) | |
Net Expenses | | | 282,254 | | |
Net Investment Income (Loss) | | | 1,971,424 | | |
Realized/Unrealized Gains (Losses) from Investments: | |
Net realized gains (losses) from investment securities | | | 11,875 | | |
Net change in unrealized appreciation/depreciation on investment securities | | | 2,697,750 | | |
Net realized/unrealized gains on investments | | | 2,709,625 | | |
Change in net assets resulting from operations | | $ | 4,681,049 | | |
See notes to financial statements.
14
Victory Variable Insurance Funds | | Statements of Changes in Net Assets | |
| | | Victory High Yield VIP Series | |
| | | Year
Ended
December 31,
2019 | | Year
Ended
December 31,
2018 | |
From Investment Activities: | |
Operations: | |
Net investment income (loss) | | $ | 1,971,424 | | | $ | 2,232,471 | | |
Net realized gains (losses) from investments | | | 11,875 | | | | 356,829 | | |
Net change in unrealized appreciation/depreciation
on investments | | | 2,697,750 | | | | (2,369,605 | ) | |
Change in net assets resulting from operations | | | 4,681,049 | | | | 219,695 | | |
Change in net assets resulting from distributions to shareholders | | | (2,209,102 | ) | | | (179,666 | ) | |
Change in net assets resulting from capital transactions | | | (2,650,644 | ) | | | (6,521,715 | ) | |
Change in net assets | | | (178,697 | ) | | | (6,481,686 | ) | |
Net Assets: | |
Beginning of period | | | 30,918,235 | | | | 37,399,921 | | |
End of period | | $ | 30,739,538 | | | $ | 30,918,235 | | |
Capital Transactions: | |
Proceeds from shares issued | | $ | 1,334,140 | | | $ | 1,232,848 | | |
Distributions reinvested | | | 2,209,102 | | | | 179,666 | | |
Cost of shares redeemed | | | (6,193,886 | ) | | | (7,934,229 | ) | |
Change in net assets resulting from capital transactions | | $ | (2,650,644 | ) | | $ | (6,521,715 | ) | |
Share Transactions: | |
Issued | | | 176,852 | | | | 176,340 | | |
Reinvested | | | 300,558 | | | | 26,344 | | |
Redeemed | | | (822,666 | ) | | | (1,133,739 | ) | |
Change in Shares | | | (345,256 | ) | | | (931,055 | ) | |
See notes to financial statements.
15
Victory Variable Insurance Funds | | Financial Highlights | |
For a Share Outstanding Throughout Each Period
| | | | Investment Activities | | Distributions to
Shareholders From | |
| | | Net Asset
Value,
Beginning of
Period | | Net
Investment
Income
(Loss)(a) | | Net
Realized and
Unrealized
Gains
(Losses) on
Investments | | Total from
Investment
Activities | | Net
Investment
Income | |
Return of
Capital | | Total
Distributions | |
Victory High Yield VIP Series | |
Year Ended
12/31/19 | | $ | 6.84 | | | | 0.47 | | | | 0.62 | | | | 1.09 | | | | (0.57 | ) | | | — | | | | (0.57 | ) | |
Year Ended
12/31/18 | | $ | 6.86 | | | | 0.45 | | | | (0.43 | ) | | | 0.02 | | | | (0.04 | ) | | | — | | | | (0.04 | ) | |
Year Ended
12/31/17 | | $ | 6.63 | | | | 0.42 | | | | 0.24 | | | | 0.66 | | | | (0.43 | ) | | | — | | | | (0.43 | ) | |
Year Ended
12/31/16 | | $ | 6.13 | | | | 0.41 | | | | 0.53 | | | | 0.94 | | | | (0.45 | ) | | | — | | | | (0.45 | ) | |
Year Ended
12/31/15 | | $ | 6.90 | | | | 0.43 | | | | (0.75 | ) | | | (0.32 | ) | | | (0.44 | ) | | | (0.01 | ) | | | (0.45 | ) | |
* Includes adjustments in accordance with U.S. generally accepted accounting principals.
(a) Per share net investment income (loss) has been calculated using the average daily shares method.
(b) Total returns do not reflect the effects of charges deducted pursuant to the terms of The Guardian Insurance & Annuity Company, Inc.'s variable contracts. Inclusion of such charges would reduce the total returns for all periods shown.
(c) The Fund received monies related to a nonrecurring refund from the prior Custodian. The corresponding impact to the total return was less than 0.15% for the period shown. (See Note 8)
See notes to financial statements.
16
Victory Variable Insurance Funds | | Financial Highlights — continued | |
For a Share Outstanding Throughout Each Period
| | | | | Ratios to Average Net Assets | | Supplemental Data | |
| | | Capital
Contribution
from Prior
Custodian,
Net (See
Note 8) | | Net Asset
Value,
End of
Period | | Total
Return(b)* | | Net
Expenses | | Net
Investment
Income
(Loss) | | Gross
Expenses | | Net Assets,
End of
Period
(000's) | | Portfolio
Turnover | |
Victory High Yield VIP Series | |
Year Ended
12/31/19 | | | — | | | $ | 7.36 | | | | 15.89 | % | | | 0.89 | % | | | 6.22 | % | | | 0.99 | % | | $ | 30,739 | | | | 60 | % | |
Year Ended
12/31/18 | | | — | | | $ | 6.84 | | | | 0.29 | % | | | 0.83 | % | | | 6.38 | % | | | 0.83 | % | | $ | 30,918 | | | | 94 | % | |
Year Ended
12/31/17 | | | — | | | $ | 6.86 | | | | 9.94 | % | | | 0.79 | % | | | 6.02 | % | | | 0.79 | % | | $ | 37,411 | | | | 173 | % | |
Year Ended
12/31/16 | | | 0.01 | | | $ | 6.63 | | | | 15.44 | %(c) | | | 0.87 | % | | | 6.31 | % | | | 0.87 | % | | $ | 38,842 | | | | 159 | % | |
Year Ended
12/31/15 | | | — | | | $ | 6.13 | | | | (4.58 | )% | | | 0.89 | % | | | 6.15 | % | | | 0.89 | % | | $ | 38,503 | | | | 148 | % | |
See notes to financial statements.
17
Victory Variable Insurance Funds | | Notes to Financial Statements
December 31, 2019 | |
1. Organization:
Victory Variable Insurance Funds (the "Trust") was organized on February 11, 1998 as a Delaware statutory trust. The Trust is registered under the Investment Company Act of 1940, as amended (the "1940 Act"), as a diversified open-end investment company. The Trust is comprised of nine funds and is authorized to issue an unlimited number of shares, which are units of beneficial interest with a par value of $0.001 per share.
The accompanying financial statements are those of the Victory High Yield VIP Series (the "Fund"). The Fund offers a single class of shares: Class I Shares. Sales of shares of the Fund may only be made to certain separate accounts of The Guardian Insurance & Annuity Company, Inc. ("GIAC") that fund certain variable annuity and variable life insurance contracts issued by GIAC. GIAC is a wholly owned subsidiary of The Guardian Life Insurance Company of America ("Guardian Life"). The Fund seeks to provide long-term capital appreciation.
Under the Trust's organizational documents, its officers and trustees are indemnified against certain liabilities arising out of the performance of their duties to the Fund. In addition, in the normal course of business, the Fund enters into contracts with its vendors and others that provide for general indemnifications. The Fund's maximum exposure under these arrangements is unknown, as this would involve future claims that may be made against the Fund. However, based on experience, the Fund expects that risk of loss to be remote.
2. Significant Accounting Policies:
The following is a summary of significant accounting policies followed by the Trust in the preparation of its financial statements. The policies are in conformity with accounting principles generally accepted in the United States of America ("GAAP"). The preparation of financial statements in accordance with GAAP requires management to make estimates and assumptions that affect the reported amounts of assets and liabilities and disclosure of contingent assets and liabilities at the date of the financial statements and the reported amounts of income and expenses for the period. Actual results could differ from those estimates. The Fund follows the specialized accounting and reporting requirements under GAAP that are applicable to investment companies.
Investment Valuation:
The Fund records investments at fair value. Fair value is defined as the price that would be received to sell an asset or paid to transfer a liability in an orderly transaction between market participants at the measurement date.
The valuation techniques described below maximize the use of observable inputs and minimize the use of unobservable inputs in determining fair value. The inputs used for valuing the Fund's investments are summarized in the three broad levels listed below:
• Level 1 — quoted prices in active markets for identical securities
• Level 2 — other significant observable inputs (including quoted prices for similar securities or interest rates applicable to those securities, etc.)
• Level 3 — significant unobservable inputs (including the Fund's own assumptions in determining the fair value of investments)
Changes in valuation techniques may result in transfers in or out of an assigned level within the disclosure hierarchy. The inputs or methodologies used for valuation techniques are not necessarily an indication of the risk associated with entering into those investments.
Portfolio securities listed or traded on securities exchanges, including American Depositary Receipts ("ADRs") and Rights, are valued at the closing price on the exchange or system where the security is principally traded, if available, or at the Nasdaq Official Closing Price. If there have been no sales for that day on the exchange or system, then a security is valued at the last available bid quotation on the exchange or system where the security is principally traded. In each of these situations, valuations are typically categorized as Level 1 in the fair value hierarchy.
18
Victory Variable Insurance Funds | | Notes to Financial Statements — continued
December 31, 2019 | |
Investments in open-end investment companies are valued at net asset value. These valuations are typically categorized as Level 1 in the fair value hierarchy.
Debt securities of United States ("U.S.") issuers (other than short-term investments maturing in 60 days or less), including corporate and municipal securities, are valued on the basis of bid valuations provided by dealers or an independent pricing service approved by the Trust's Board of Trustees (the "Board"). Short-term investments maturing in 60 days or less may be valued at amortized cost, which approximates market value. Under the amortized cost method, premium or discount, if any, is amortized or accreted, respectively, on a constant basis to the maturity of the security. In each of these situations, valuations are typically categorized as Level 2 in the fair value hierarchy.
Investments for which there are no such quotations, or for which quotations do not appear reliable, are valued at fair value in accordance with procedures established by and under the general supervision and responsibility of the Board. These valuations are typically categorized as Level 2 or Level 3 in the fair value hierarchy, based on the observability of inputs used to determine the fair value.
A summary of the valuations as of December 31, 2019, based upon the three levels defined above, is included in the table below while the breakdown, by category, of investments is disclosed in the Schedule of Portfolio Investments:
| | | LEVEL 1 | | LEVEL 2 | | Total | |
Common Stocks | | $ | 486,855 | | | $ | — | | | $ | 486,855 | | |
Senior Secured Loans | | | — | | | | 8,307,097 | | | | 8,307,097 | | |
Corporate Bonds | | | — | | | | 20,989,835 | | | | 20,989,835 | | |
Collateral for Securities Loaned | | | 4,563,009 | | | | — | | | | 4,563,009 | | |
Total | | $ | 5,049,864 | | | $ | 29,296,932 | | | $ | 34,346,796 | | |
For the year ended December 31, 2019, there were no Level 3 investments for which significant unobservable inputs were used to determine fair value.
Securities Purchased on a When-Issued Basis:
The Fund may purchase securities on a when-issued basis. When-issued securities are securities purchased for delivery beyond normal settlement periods at a stated price and/or yield, thereby involving the risk that the price and/or yield obtained may be more or less than those available in the market when delivery takes place. At the time the Fund makes the commitment to purchase a security on a when-issued basis, the Fund records the transaction and reflects the value of the security in determining net asset value. No interest accrues to the Fund until the transaction settles and payment takes place. Normally, the settlement date occurs within one month of the purchase. A segregated account is established and the Fund maintains cash and/or marketable securities at least equal in value to commitments for when-issued securities. If the Fund owns when-issued securities, these values are included in "Payable for investments purchased" on the accompanying Statement of Assets and Liabilities and the segregated assets as identified in the Schedule of Portfolio Investments.
Loans:
Floating rate loans in which the Fund invests are primarily "senior" loans. Senior floating rate loans typically hold a senior position in the capital structure of the borrower, are typically secured by specific collateral, and have a claim on the assets and/or stock of the borrower that is senior to that held by subordinated debtholders and stockholders of the borrower. While these protections may reduce risk, these investments still present significant credit risk. A significant portion of the Fund's floating rate investments may be issued in connection with highly leveraged transactions such as leveraged buyouts, leveraged recapitalization loans, and other types of acquisition financing. Obligations in these types of transactions are subject to greater credit risk (including default and bankruptcy) than many other investments and may be, or become, illiquid. See note regarding below investment grade securities.
The Fund may purchase second lien loans (secured loans with a claim on collateral subordinate to a senior lender's claim on such collateral), fixed rate loans, unsecured loans, and other debt obligations.
19
Victory Variable Insurance Funds | | Notes to Financial Statements — continued
December 31, 2019 | |
Transactions in loans often settle on a delayed basis, and the Fund may not receive the proceeds from the sale of a loan or pay for a loan purchase for a substantial period of time after entering into the transactions.
Below Investment Grade Securities:
The Fund may invest in below investment grade securities (i.e. lower-quality, "junk" debt), which are subject to various risks. Lower-quality debt is considered to be speculative because it is less certain that the issuer will be able to pay interest or repay the principal than in the case of investment grade debt. These securities can involve a substantially greater risk of default than higher-rated securities, and their values can decline significantly over short periods of time. Lower-quality debt securities tend to be more sensitive to adverse news about their issuers, the market and the economy in general, than higher-quality debt securities. The market for these securities can be less liquid, especially during periods of recession or general market decline.
Investment Companies:
The Fund may invest in portfolios of open-end investment companies. These investment companies value securities in their portfolios for which market quotations are readily available at their market values (generally the last reported sale price) and all other securities and assets at their fair value by the methods established by the board of directors of the underlying funds.
Investment Transactions and Related Income:
Changes in holdings of investments are accounted for no later than one business day following the trade date. For financial reporting purposes, however, investment transactions are accounted for on trade date on the last business day of the reporting period. Interest income is determined on the basis of coupon interest accrued using the effective interest method which adjusts, where applicable, the amortization of premiums or accretion of discounts. Dividend income is recorded on the ex-dividend date. Gains or losses realized on sales of securities are determined by comparing the identified cost of the security lot sold with the net sales proceeds. Paydown gains or losses on applicable securities, if any, are recorded as components of interest income on the Statement of Operations.
The Fund may receive other income from investment in loan assignments and/or unfunded commitments, including amendment fees, consent fees and commitment fees. These fees are recorded as income when received by the Fund. These amounts are included in Interest Income in the Statement of Operations.
Withholding taxes on interest, dividends and gains as a result of certain investments in ADRs by the Fund have been provided for in accordance with each investment's applicable country's tax rules and rates.
Securities Lending:
The Trust has entered into a Master Securities Lending Agreement ("MSLA") with Citibank, N.A. ("Citibank" or the "Agent"). Under the terms of the MSLA, the Fund may lend securities to certain broker-dealers and banks in exchange for collateral in the amount of at least 102% of the value of U.S. securities loaned or at least 105% of the value of non-U.S. securities loaned, marked-to-market daily. Any collateral shortfalls associated with increases in the valuation of the securities loaned are adjusted the next business day. The collateral can be received in the form of cash collateral and/or non-cash collateral. Non-cash collateral can include U.S. Government Securities, letters of credit and certificates of deposit. The cash collateral is invested in short-term instruments or cash equivalents as noted on the Fund's Schedule of Portfolio Investments. The Trust does not have effective control of the non-cash collateral and therefore it is not disclosed in the Fund's Schedule of Portfolio Investments. The Fund continues to benefit from interest or dividends on the securities loaned and may also earn a return from the collateral. The Fund pays various fees in connection with the investment of cash collateral. The Fund pays the Agent fees based on the investment income received from securities lending activities. Securities lending income is disclosed in the Fund's Statement of Operations. Although risk is mitigated by the collateral, the Fund could experience a delay in recovering its securities and possible loss of income or value if the borrower fails to return them.
20
Victory Variable Insurance Funds | | Notes to Financial Statements — continued
December 31, 2019 | |
Securities lending transactions are entered into by the Fund under the MSLA, which permits the Fund, under certain circumstances such as an event of default, to offset amounts payable by the Fund to the same counterparty against amounts receivable from the counterparty to create a net payment due to or from the Fund.
The following table is a summary of the Fund's securities lending transactions which are subject to offset under the MSLA as of December 31, 2019. These transactions are accounted for as secured borrowings with an overnight and continuous contractual maturity for cash collateral, and greater than overnight and continuous contractual maturity for non-cash collateral.
Gross
Amount of
Recognized
Assets
(Value of | | Value of
Cash | | Value of Non-cash Collateral
Received by Maturity | | | |
Securities on
Loan) | | Collateral
Received* | | <30 Days | | Between 30 &
90 days | | >90 Days | | Net
Amount | |
| $ | 4,395,413 | | | $ | 4,395,413 | | | $ | — | | | $ | — | | | $ | — | | | $ | — | | |
* Collateral received in excess of the market value of securities on loan is not presented in this table. The total cash collateral received by the Fund is disclosed in the Statement of Assets and Liabilities.
Distributions to Shareholders:
Dividends from net investment income, if any, are declared and paid annually by the Fund. Distributable net realized gains, if any, are declared and distributed at least annually.
The amounts of dividends from net investment income and distributions from net realized gains are determined in accordance with federal income tax regulations, which may differ from GAAP. To the extent these "book/tax" differences are permanent in nature (e.g., net operating loss and distribution reclassification), such amounts are reclassified within the components of net assets based on their federal tax-basis treatment; temporary differences (e.g., wash sales) do not require reclassification. To the extent dividends and distributions exceed net investment income and net realized gains for tax purposes, they are reported as distributions of capital. Net investment losses incurred by the Fund may be reclassified as an offset to capital on the accompanying Statement of Assets and Liabilities.
As of December 31, 2019 on the Statement of Assets and Liabilities, as a result of permanent book-to-tax differences, reclassification adjustments were as follows:
Total
Distributable
Earnings/(Loss) | | Capital | |
| $ | (5 | ) | | $ | 5 | | |
Federal Income Taxes:
It is the policy of the Fund to continue to qualify as a regulated investment company by complying with the provisions available to certain investment companies, as defined in applicable sections of the Internal Revenue Code, and to make distributions of net investment income and net realized gains sufficient to relieve it from all, or substantially all, federal income taxes. Accordingly, no provision for federal income taxes is required in the financial statements. The Fund has a tax year end of December 31.
Management of the Fund has reviewed tax positions taken in tax years that remain subject to examination by all major tax jurisdictions, including federal (i.e., all open tax years and the interim tax period since then). Management believes that there is no tax liability resulting from unrecognized tax benefits related to uncertain tax positions taken.
Allocations:
Expenses directly attributable to the Fund are charged to the Fund, while expenses which are attributable to more than one fund in the Trust, or jointly with an affiliated trust, are allocated among
21
Victory Variable Insurance Funds | | Notes to Financial Statements — continued
December 31, 2019 | |
the respective funds in the Trust and/or affiliated trust based upon net assets or another appropriate basis.
Cross-Trade Transactions:
Pursuant to Rule 17a-7 under the 1940 Act, the Fund may engage in cross-trades which are securities transactions with affiliated investment companies and advisory accounts managed by the Adviser and any applicable sub-adviser. Any such purchase or sale transaction must be effected without brokerage commission or other remuneration, except for customary transfer fees. The transaction must be effected at the current market price, which is either the security's last sale price on an exchange or, if there are no transactions in the security that day, at the average of the highest bid and lowest asked price. For the year ended December 31, 2019, the Fund did not engage in any Rule 17a-7 transactions under the 1940 Act.
3. Purchases and Sales of Securities:
Purchases and sales of securities (excluding securities maturing less than one year from acquisition) for the fiscal year ended December 31, 2019 were as follows for the Fund:
| Purchases | | Sales | |
| $ | 18,423,180 | | | $ | 21,719,334 | | |
For the year ended December 31, 2019, there were no purchases or sales of U.S. Government Securities.
4. Fees and Transactions with Affiliates and Related Parties:
Investment advisory services are provided to the Fund by Victory Capital Management Inc. ("VCM" or the "Adviser"), a New York corporation registered as an investment adviser with the Securities and Exchange Commission ("SEC"). The Adviser is a wholly owned indirect subsidiary of Victory Capital Holdings, Inc., a publicly traded Delaware corporation, and a wholly owned direct subsidiary of Victory Capital Operating, LLC.
VCM has entered into a Sub-Advisory Agreement with Park Avenue Institutional Advisers LLC ("Park Avenue") with respect to the Fund. Park Avenue is responsible for providing day-to-day investment advisory services to the Fund, subject to the oversight of the Board of Trustees of the Trust. Sub-investment advisory fees, which are paid by VCM to Park Avenue, do not represent a separate or additional expense to the Fund.
Under the terms of the Investment Advisory Agreement, the Adviser is entitled to receive 0.60% of the average daily net assets of the Fund. The Adviser may use its resources to assist with the Fund's distribution and marketing expenses.
VCM also serves as the Fund's administrator and fund accountant. Under an Administration and Fund Accounting Agreement, VCM is paid for its services an annual fee at a rate of 0.08% of the first $15 billion in average daily net assets of the Trust, Victory Portfolios and Victory Portfolios II (collectively, the "Victory Funds Complex"), 0.05% of the average daily net assets above $15 billion to $30 billion of the Victory Funds Complex and 0.04% of the average daily net assets over $30 billion of the Victory Funds Complex.
Citi Fund Services Ohio, Inc. ("Citi"), an affiliate of Citibank, acts as sub-administrator and sub-fund accountant to the Fund pursuant to a Sub-Administration and Sub-Fund Accounting Services Agreement between VCM and Citi. VCM pays Citi a fee for providing these services. The Trust reimburses VCM and Citi for all of their reasonable out-of-pocket expenses incurred in providing these services.
FIS Investor Services, LLC ("FIS") serves as the Fund's transfer agent. Under the Transfer Agent Agreement, the Trust pays FIS a fee for its services and reimburses FIS for all of their reasonable out-of-pocket expenses incurred in providing these services.
The Chief Compliance Officer ("CCO") is an employee of the Adviser, which pays the compensation of the CCO and his support staff. The Trust has entered into an Agreement to provide compliance services with the Adviser, pursuant to which the Adviser furnishes its compliance personnel, including the
22
Victory Variable Insurance Funds | | Notes to Financial Statements — continued
December 31, 2019 | |
services of the CCO, and other resources reasonably necessary to provide the Trust with compliance oversight services related to the design, administration and oversight of a compliance program for the Trust in accordance with Rule 38a-1 under the 1940 Act. The Funds in the Victory Funds Complex, in aggregate, compensate the Adviser for these services.
The Victory Funds Complex pays an annual retainer to each Independent Trustee, plus an additional annual retainer to the Chairman of the Board. The aggregate amount of the fees and expenses of the Independent Trustees are allocated amongst all the funds in the Victory Funds Complex and are presented in the Statement of Operations.
Shearman & Sterling LLP provides legal services to the Trust.
Victory Capital Advisers, Inc. (the "Distributor"), an affiliate of the Adviser, serves as distributor for the continuous offering of the shares of the Fund pursuant to a Distribution Agreement between the Distributor and the Trust.
The Adviser has entered into an expense limitation agreement with the Fund until at least April 30, 2020. Under the terms of the agreement, the Adviser has agreed to waive fees or reimburse certain expenses to the extent that ordinary operating expenses incurred by the Fund in any fiscal year exceed the expense limit for the Fund. Such excess amounts will be the liability of the Adviser. Interest, taxes, brokerage commissions, other expenditures which are capitalized in accordance with GAAP, and other extraordinary expenses not incurred in the ordinary course of a Fund's business are excluded from the expense limits. As of December 31, 2019, the expense limit (excluding voluntary waivers) is 0.89%.
The Fund has agreed to repay fees and expenses that were waived or reimbursed by the Adviser for a period up to three fiscal years after such waiver or reimbursement was made to the extent such payments or repayments would not cause the expenses to exceed the original expense limitation in place at time of the waiver or reimbursement or any expense limitation agreement in place at the time of repayment. As of December 31, 2019, the following amounts are available to be repaid to the Adviser. Amounts repaid to the Adviser during the year ended, if any, are reflected on the Statement of Operations as "Recoupment of prior expenses waived/reimbursed by Adviser".
Expires
December 31,
2022 | | Total | |
| $ | 32,348 | | | $ | 32,348 | | |
The Adviser may voluntarily waive or reimburse additional fees to assist the Fund in maintaining a competitive expense ratio. Voluntary waivers and reimbursements applicable to the Fund are not available to be recouped at a future time. There were no voluntary waivers or reimbursements for the year ended December 31, 2019.
Certain officers and/or interested trustees of the Fund are also officers and/or employees of the Adviser, Administrator, Fund Accountant, Sub-Administrator, Sub-Fund Accountant and Legal Counsel.
5. Risks:
The Fund may be subject to other risks in addition to these identified risks.
An investment in the Fund's shares represents an indirect investment in the securities owned by the Fund, some of which will be traded on a national securities exchange or in the over-the-counter markets. The value of the securities in which the Fund invests, like other market investments, may move up or down, sometimes rapidly and unpredictably. The value of the securities in which the Fund invests may affect the value of the Fund's shares. An investment in the Fund's shares at any point in time may be worth less than the original investment, even after taking into account the reinvestment of the Fund's distributions.
The Fund will be subject to credit risk with respect to the amount it expects to receive from counterparties for financial instruments entered into by the Fund. The Fund may be negatively impacted if a counterparty becomes bankrupt or otherwise fails to perform its obligations due to financial difficulties. The Fund may experience significant delays in obtaining any recovery in bankruptcy or other reorganization proceeding and the Fund may obtain only limited recovery or may obtain no
23
Victory Variable Insurance Funds | | Notes to Financial Statements — continued
December 31, 2019 | |
recovery in such circumstances. The Fund typically enters into transactions with counterparties whose credit ratings are investment grade, as determined by a nationally recognized statistical rating organization or, if unrated, judged by the Adviser to be of comparable quality.
6. Borrowing and Interfund Lending:
Line of Credit:
For the year ended December 31, 2019, the Victory Funds Complex participated in a short-term, demand note "Line of Credit" with Citibank. Under the agreement with Citibank, for the period January 1, 2019 to June 30, 2019, the Victory Funds Complex could borrow up to $250 million, of which $100 million was committed and $150 million was uncommitted. Effective July 1, 2019, the agreement was amended to include the USAA Mutual Funds Complex (another series of mutual funds managed by the Adviser) and has a new termination date of June 29, 2020. Under this amended agreement, the Victory Funds Complex and USAA Mutual Funds Complex, combined, may borrow up to $600 million, of which $300 million is committed and $300 million is uncommitted. $40 million of the Line of Credit is reserved for use by the Victory Floating Rate Fund (herein, the "Fund"), another series of the Victory Funds Complex, with that Fund paying the related commitment fees for that amount. The purpose of the agreement is to meet temporary or emergency cash needs, including redemption requests that might otherwise require the untimely disposition of securities. With the agreement in effect for the period January 1, 2019 to June 30, 2019, Citibank received an annual commitment fee of 0.15% on $100 million for providing the Line of Credit. For the period July 1, 2019 to December 31, 2019, Citibank received an annual commitment fee of 0.15% on $300 million for providing the Line of Credit. For the year ended December 31, 2019, Citibank earned approximately $300 thousand in commitment fees from the combined Victory Funds Complex and USAA Mutual Funds Complex. Each fund in the Victory Funds Complex and the USAA Mutual Funds Complex pays a pro-rata portion of the commitment fees plus any interest (one month LIBOR plus one percent) on amounts borrowed. Interest charged to the Fund during the period, if applicable, is presented on the Statement of Operations under Line of credit fees.
The Fund did not utilize the Line of Credit during the year ended December 31, 2019.
Interfund Lending:
The Trust and Adviser rely on an exemptive order granted by the SEC in March 2017 (the "Order"), permitting the establishment and operation of an Interfund Lending Facility (the "Facility"). The Facility allows the Fund to directly lend and borrow money to or from any other Victory Fund relying upon the Order at rates beneficial to both the borrowing and lending funds. Advances under the Facility are allowed for temporary or emergency purposes, including the meeting of redemption requests that otherwise might require the untimely disposition of securities, and are subject to each fund's borrowing restrictions. The interfund loan rate is determined, as specified in the Order, by averaging the current repurchase agreement rate and the current bank loan rate. As a Borrower, interest charged to the Fund during the period, if applicable, is presented on the Statement of Operations under Interfund lending fees. As a Lender, interest earned by the Fund during the period, if applicable, is presented on the Statement of Operations under Income on interfund lending.
The Fund did not utilize the Facility during the year ended December 31, 2019.
7. Federal Income Tax Information:
The tax character of distributions paid during the most recent tax years ended, as noted below, were as follows (total distributions paid may differ from the Statements of Changes in Net Assets because, for tax purposes, dividends are recognized when actually paid).
24
Victory Variable Insurance Funds | | Notes to Financial Statements — continued
December 31, 2019 | |
| | | Year Ended December 31, 2019 | |
| | | Distributions paid from | |
| | Ordinary
Income | | Net
Long-Term
Capital Gains | | Total
Distributions
Paid | |
| | | | | $ | 2,209,102 | | | $ | — | | | $ | 2,209,102 | | |
| | | Year Ended December 31, 2018 | |
| | | Distributions paid from | |
| | | Ordinary
Income | | Net
Long-Term
Capital Gains | | Total
Distributions
Paid | |
| | | | | $ | 179,666 | | | $ | — | | | $ | 179,666 | | |
As of the tax year ended December 31, 2019, the components of distributable earnings/accumulated deficit on a tax basis were as follows:
Undistributed
Ordinary
Income | | Undistributed
Long-Term
Capital Gains | | Accumulated
Earnings | | Accumulated
Capital and
Other
Losses | | Unrealized
Appreciation
(Depreciation) | | Total
Accumulated
Earnings
(Deficit) | |
| $ | 1,971,684 | | | $ | — | | | $ | 1,971,684 | | | $ | (3,640,076 | ) | | $ | 703,572 | | | $ | (964,820 | ) | |
As of the tax year ended December 31, 2019, the Fund has short-term and long-term capital loss carryforwards of $949,620 and $2,690,456, respectively, that are not subject to expiration.
During the tax year ended December 31, 2019, the Fund utilized $11,713 of capital loss carryforwards.
As of December 31, 2019, the cost basis for federal income tax purposes, gross unrealized appreciation, gross unrealized depreciation and net unrealized appreciation (depreciation) for investments and derivatives were as follows:
Cost of
Investments
for Federal
Tax Purposes | | Gross
Unrealized
Appreciation | | Gross
Unrealized
Depreciation | | Net
Unrealized
Appreciation
(Depreciation) | |
| $ | 33,643,224 | | | $ | 1,212,145 | | | $ | (508,573 | ) | | $ | 703,572 | | |
8. Capital Contribution from Prior Custodian:
During 2016, the Fund received notification from the Fund's prior custodian, State Street Bank and Trust ("State Street"), concerning issues related to billing on certain categories of expenses during the approximately 16-year period from 1998 through October 31, 2014. The over-billing primarily related to categories of expenses that involved an allocation of general costs among multiple clients.
State Street paid the refunded amounts during January 2017. Based on billing information received during 2016 from State Street and an analysis of any expense limitation agreements that were in place during the period of the activities in question, including the application of any recoupment provisions in such agreements, the Adviser received a portion of the refund.
The portion of the refund retained by the Fund was accounted for as a capital contribution and is reflected on the Financial Highlights as "Capital Contribution from Prior Custodian, Net".
9. Fund Ownership:
Ownership of more than 25% of the voting securities of a fund creates presumptions of control of the Fund, under section 2(a)(9) of the 1940 Act. As of December 31, 2019, the shareholder listed below held more than 25% of the shares outstanding of the Fund and may be deemed to control the Fund.
| Shareholder | | Percent | |
| GIAC | | | 100.0 | % | |
25
Victory Variable Insurance Funds | | Notes to Financial Statements — continued
December 31, 2019 | |
10. Recent Accounting Pronouncements:
In March 2017, the Financial Accounting Standards Board ("FASB") issued Accounting Standards ("ASU") Update No. 2017-08 "Premium Amortization on Purchased Callable Debt Securities" ("ASU 2017-08"), which shortens the premium amortization period for purchased non-contingently callable debt securities. ASU 2017-08 specifies that the premium amortization period ends at the earliest call date, for purchased non-contingently callable debt securities. The Fund has adopted and applied ASU 2017-08 on a modified retrospective basis through a cumulative-effect adjustment as of the beginning of the period of adoption. The adoption of ASU 2017-08 had no material impact on information presented in the financial statements
11. Subsequent Events:
The Fund has evaluated the need for additional disclosures or adjustments resulting from subsequent events through the date these financial statements were issued. Based on this evaluation, there were no subsequent events to report that would have a material impact on the Fund's financial statements.
26
REPORT OF INDEPENDENT REGISTERED PUBLIC ACCOUNTING FIRM
To the Shareholders and Board of Trustees of Victory Variable Insurance Funds
Opinion on the Financial Statements
We have audited the accompanying statement of assets and liabilities, including the schedule of portfolio investments, of Victory High Yield VIP Series (the "Fund"), a series of Victory Variable Insurance Funds, as of December 31, 2019, the related statements of operations and changes in net assets, including the related notes, and the financial highlights for the year then ended (collectively referred to as the "financial statements"). In our opinion, the financial statements present fairly, in all material respects, the financial position of the Fund as of December 31, 2019, the results of its operations, the changes in its net assets, and the financial highlights for the year then ended, in conformity with accounting principles generally accepted in the United States of America.
The Fund's financial statements and financial highlights for the three years ended December 31, 2018, were audited by other auditors whose report dated February 15, 2019 and the Fund's financial highlights for the year ended December 31, 2015, were audited by other auditors whose report dated February 22, 2016, expressed unqualified opinions on those financial statements and financial highlights.
Basis for Opinion
These financial statements are the responsibility of the Fund's management. Our responsibility is to express an opinion on the Fund's financial statements based on our audit. We are a public accounting firm registered with the Public Company Accounting Oversight Board (United States) ("PCAOB") and are required to be independent with respect to the Fund in accordance with the U.S. federal securities laws and the applicable rules and regulations of the Securities and Exchange Commission and the PCAOB.
We conducted our audit in accordance with the standards of the PCAOB. Those standards require that we plan and perform the audit to obtain reasonable assurance about whether the financial statements are free of material misstatement whether due to error or fraud.
Our audit included performing procedures to assess the risks of material misstatement of the financial statements, whether due to error or fraud, and performing procedures that respond to those risks. Such procedures included examining, on a test basis, evidence regarding the amounts and disclosures in the financial statements. Our procedures included confirmation of securities owned as of December 31, 2019, by correspondence with the custodian and brokers or by other appropriate auditing procedures where replies from brokers or counterparties were not received. Our audit also included evaluating the accounting principles used and significant estimates made by management, as well as evaluating the overall presentation of the financial statements. We believe that our audit provides a reasonable basis for our opinion.
We have served as the auditor of one or more of the investment companies advised by Victory Capital Management, Inc. since 2015.

COHEN & COMPANY, LTD.
Cleveland, Ohio
February 18, 2020
27
Victory Variable Insurance Funds | | Supplemental Information
December 31, 2019 | |
(Unaudited)
Trustee and Officer Information
Board of Trustees:
Overall responsibility for management of the Trust rests with the Board. The Trust is managed by the Board in accordance with the laws of the State of Delaware. There are currently ten Trustees, nine of whom are not "interested persons" of the Trust within the meaning of that term under the 1940 Act ("Independent Trustees") and one of whom is an "interested person" of the Trust within the meaning of that term under the 1940 Act ("Interested Trustee"). The Trustees, in turn, elect the officers of the Trust to actively supervise its day-to-day operations. The following tables list the Trustees, their ages, position with the Trust, commencement of service, principal occupations during the past five years and any directorships of other investment companies or companies whose securities are registered under the Securities Exchange Act of 1934, as amended, or who file reports under that Act. Each Trustee oversees nine portfolios in the Trust, 42 portfolios in Victory Portfolios and 26 portfolios in Victory Portfolios II, each a registered investment company that, together with the Trust, comprise the Victory Funds Complex. Each Trustee's address is c/o Victory Variable Insurance Funds, 4900 Tiedeman Road, 4th Floor, Brooklyn, Ohio 44144. Each Trustee has an indefinite term.
Name and Age | | Position
Held with
the Trust | | Date
Commenced
Service | | Principal Occupation
During Past 5 Years | | Other
Directorships
Held During
Past 5 Years | |
Independent Trustees. | |
David Brooks Adcock, 68 | | Trustee | | February 2005 | | Consultant (since 2006). | | Chair and Trustee, Turner Funds (December 2016-December 2017). | |
Nigel D.T. Andrews, 72 | | Vice Chair and Trustee | | August 2002 | | Retired. | | Director, TCG BDC II, Inc. (since 2017);
Director, TCG BDC I, Inc. (formerly Carlyle GMS Finance, Inc.) (since 2012); Director, Old Mutual US Asset Management (2002-2014). | |
E. Lee Beard, 68* | | Trustee | | February 2005 | | Retired (since 2015); Consultant, The Henlee Group, LLC (consulting) (2005-2015). | | None. | |
Dennis M. Bushe, 76 | | Trustee | | July 2016 | | Retired. | | Trustee, RS Investment Trust and RS Variable Products Trust (November 2011-July 2016). | |
28
Victory Variable Insurance Funds | | Supplemental Information — continued
December 31, 2019 | |
(Unaudited)
Name and Age | | Position
Held with
the Trust | | Date
Commenced
Service | | Principal Occupation
During Past 5 Years | | Other
Directorships
Held During
Past 5 Years | |
Sally M. Dungan, 65 | | Trustee | | February 2011 | | Chief Investment Officer, Tufts University (since 2002). | | None. | |
John L. Kelly, 66 | | Trustee | | February 2015 | | Partner, McCarvill Capital Partners (September 2016-September 2017); Advisor, Endgate Commodities LLC (January 2016-April 2016); Managing Partner, Endgate Commodities LLC (August 2014-January 2016); Chief Operating Officer, Liquidnet Holdings, Inc. (December 2011-July 2014). | | Director, Caledonia Mining Corporation (since May 2012). | |
David L. Meyer, 62* | | Trustee | | December 2008 | | Retired. | | None. | |
Gloria S. Nelund, 58 | | Trustee | | July 2016 | | Chair, CEO and Co-Founder of TriLinc Global, LLC, an investment firm. | | TriLinc Global Impact Fund, LLC (since 2012); Trustee, RS Investment Trust and RS Variable Products Trust (November 2007-July 2016). | |
Leigh A. Wilson, 75 | | Chair and Trustee | | February 1998 | | Private Investor. | | Chair (since 2013), Caledonia Mining Corporation. | |
Interested Trustee. | |
David C. Brown, 47** | | Trustee | | May 2008 | | Chairman and Chief Executive Officer (since 2013), Co-Chief Executive Officer (2011- 2013), the Adviser; Chairman and Chief Executive Officer, Victory Capital Holdings, Inc. (since 2013). | | USAA Mutual Funds Trust. | |
* The Board has designated Mr. Meyer and Ms. Beard as its Audit Committee Financial Experts.
** Mr. Brown is an "Interested Person" by reason of his relationship with the Adviser.
The Statement of Additional Information includes additional information about the Trustees of the Trust and is available, without charge, by calling 800-539-3863.
29
Victory Variable Insurance Funds | | Supplemental Information — continued
December 31, 2019 | |
(Unaudited)
Officers:
The officers of the Trust, their ages, commencement of service and their principal occupations during the past five years, are detailed in the following table. Each officer serves until the earlier of his or her resignation, removal, retirement, death, or the election of a successor. The mailing address of each officer of the Trust is 4900 Tiedeman Road, 4th Floor, Brooklyn, Ohio 44144. The officers of the Trust receive no compensation directly from the Trust for performing the duties of their offices.
Name and Age | | Position with
the Trust | | Date
Commenced
Service | | Principal Occupation During Past 5 Years | |
Christopher K. Dyer, 58 | | President | | February 2006* | | Director of Fund Administration, the Adviser. | |
Scott A. Stahorsky, 50 | | Vice President | | December 2014 | | Manager, Fund Administration, the Adviser (since 2015); Senior Analyst, Fund Administration, the Adviser (prior to 2015). | |
Erin G. Wagner, 46 | | Secretary | | December 2014 | | Associate General Counsel, the Adviser (since 2013). | |
Allan Shaer, 54 | | Treasurer | | May 2017 | | Senior Vice President, Financial Administration, Citi Fund Services Ohio, Inc. (since 2016); Vice President, Mutual Fund Administration, JP Morgan Chase (2011-2016). | |
Christopher A. Ponte, 35 | | Assistant Treasurer | | December 2017 | | Manager, Fund Administration, the Adviser (since 2017); Senior Analyst, Fund Administration, the Adviser (prior to 2017); Chief Financial Officer, Victory Capital Advisers, Inc. (since 2018). | |
Colin Kinney, 46 | | Chief Compliance Officer | | July 2017 | | Chief Compliance Officer (since 2013) and Chief Risk Officer (2009-2017), the Adviser. | |
Chuck Booth, 59 | | Anti-Money Laundering Compliance Officer and Identity Theft Officer | | May 2015 | | Director, Regulatory Administration and CCO Support Services, Citi Fund Services Ohio, Inc. | |
Jay G. Baris, 66 | | Assistant Secretary | | February 1998 | | Partner, Shearman & Sterling LLP (since 2018); Partner, Morrison & Foerster LLP (2011-January 2018). | |
* On December 3, 2014, Mr. Dyer resigned as Secretary of the Trust and accepted the position of President.
30
Victory Variable Insurance Funds | | Supplemental Information — continued
December 31, 2019 | |
(Unaudited)
Proxy Voting and Portfolio Holdings Information
Proxy Voting:
Information regarding the policies and procedures that the Fund uses to determine how to vote proxies relating to portfolio securities is available without charge, upon request, by calling 800-539-3863. The information is also included in the Fund's Statement of Additional Information, which is available on the SEC's website at www.sec.gov.
Information relating to how the Fund voted proxies relating to portfolio securities held during the most recent twelve months ended June 30 is available on the SEC's website at www.sec.gov.
Availability of Schedules of Portfolio Investments:
The Trust files a complete list of Schedules of Portfolio Investments with the SEC for the first and third quarters of each fiscal year on Form N-PORT. Prior to the implementation of Form N-PORT, the Trust filed a complete list of Schedules of Portfolio Investments with the SEC for the first and third quarters of each fiscal year on Form N-Q. Forms N-PORT and Forms N-Q are available on the SEC's website at www.sec.gov.
Expense Examples
As a shareholder of the Fund, you may incur two types of costs: (1) transaction costs and (2) ongoing costs, including management fees, distribution and service (12b-1) fees, and other Fund expenses. These examples are intended to help you understand your ongoing costs (in dollars) of investing in the Fund and to compare these costs with the ongoing costs of investing in other mutual funds.
These examples are based on an investment of $1,000 invested at the beginning of the period and held for the entire period from July 1, 2019 through December 31, 2019.
The Actual Expense figures in the table below provide information about actual account values and actual expenses. You may use the information below, together with the amount you invested, to estimate the expenses that you paid over the period. Simply divide your account value by $1,000 (for example, an $8,600 account value divided by $1,000 = 8.6), then multiply the result by the number in the table under the heading entitled "Actual Expenses Paid During Period" to estimate the expenses you paid on your account during this period.
The Hypothetical Expense figures in the table below provide information about hypothetical account values and hypothetical expenses based on the Fund's actual expense ratio and an assumed rate of return of 5% per year before expenses, which is not the Fund's actual return. The hypothetical account values and expenses may not be used to estimate the actual ending account balance or expenses you paid for the period. You may use this information to compare this 5% hypothetical example with the 5% hypothetical examples that appear in shareholder reports of other funds.
Please note the expenses shown in the table are meant to highlight your ongoing costs only and do not reflect any transactional costs. Therefore, the table is useful in comparing ongoing costs only, and will not help you determine the relative total costs of owning different funds. In addition, if these transactional costs were included, your costs would have been higher.
Beginning
Account Value
7/1/19 | | Actual
Ending
Account Value
12/31/19 | | Hypothetical
Ending
Account Value
12/31/19 | | Actual
Expenses
Paid During
Period
7/1/19-12/31/19* | | Hypothetical
Expenses
Paid During
Period
7/1/19-12/31/19* | | Annualized
Expense Ratio
During Period
7/1/19-12/31/19 | |
$ | 1,000.00 | | | $ | 1,051.30 | | | $ | 1,020.72 | | | $ | 4.60 | | | $ | 4.53 | | | | 0.89 | % | |
* Expenses are equal to the average account value multiplied by the Fund's annualized expense ratio multiplied by 184/365 (the number of days in the most recent fiscal half-year divided by the number of days in the fiscal year).
31
Victory Variable Insurance Funds | | Supplemental Information — continued
December 31, 2019 | |
(Unaudited)
Additional Federal Income Tax Information
For the year ended December 31, 2019, the Fund paid qualified dividend income for the purposes of reduced individual federal income tax rates of 1%.
Dividends qualified for corporate dividends received deductions of 1%.
32
Victory Variable Insurance Funds | | Supplemental Information
December 31, 2019 | |
(Unaudited)
Considerations of the Board in Continuing the Investment Advisory Agreements
The Board approved the advisory agreement with the Adviser, on behalf of the Fund (the "Agreement"), and the sub-advisory agreement between the Adviser and Park Avenue Institutional Advisers LLC (the "Sub-Adviser"), on behalf of the Fund (the "Sub-Advisory Agreement"), at an in-person meeting, which was called for that purpose, on December 4, 2019. The Board also considered information relating to the Fund and both the Agreement and the Sub-Advisory Agreement provided throughout the year and, more specifically, at a meeting on October 22, 2019. The Board noted that prior to the Fund's reorganization on July 29, 2016, the Fund was managed by RS Investment Management Co. LLC, which was acquired by the Adviser on July 29, 2016, and sub-advised by the Sub-Adviser. In considering whether to approve the Agreement, the Board requested, and the Adviser or the Sub-Adviser provided, information that the Board believed to be reasonably necessary to reach its conclusions.
The Board, including the Independent Trustees, evaluated this information along with other information obtained throughout the year and was advised by legal counsel to the Fund, which also serves as independent legal counsel to the Independent Trustees. In addition, in 2017 the Independent Trustees, through their counsel, retained an independent consultant to assist with a review of the overall process for conducting the annual review of these advisory arrangements.
The Board considered the Fund's advisory fee, expense ratio and investment performance as significant factors in determining whether the Agreement and the Sub-Advisory Agreement should be continued. The Board reviewed numerous factors with respect to the Fund, including the Sub-Adviser's history as sub-adviser for the predecessor fund and the services to be provided by the Sub-Adviser. In considering whether the compensation paid to the Adviser was fair and reasonable, the Board also evaluated, among other things, the following factors:
• The requirements of the Fund for the services provided by the Adviser;
• The nature, quality and extent of the services provided and expected to be provided;
• The performance of the Fund as compared to comparable funds;
• The fees payable for the services and whether the fee arrangements provided for economies of scale that would benefit Fund shareholders as the Fund grows;
• Whether the fee would be sufficient to enable the Adviser to attract and retain experienced personnel and continue to provide quality services to the Fund;
• The fees paid by other clients of the Adviser whose accounts are managed in a similar investment style and any differences in the services provided to the other clients compared to those provided to the Fund;
• The total expenses of the Fund, taking into consideration any distribution or shareholder servicing fees;
• Management's commitment to operating the Fund at competitive expense levels;
• The profitability of the Adviser (as reflected by comparing fees earned against an estimate of the Adviser's costs) with respect to the Adviser's relationship with the Fund;
• Research and other service benefits received by the Adviser obtained through payment of client commissions for securities transactions;
• Other benefits received by the Adviser, and its affiliates, including revenues paid to the Adviser, or its affiliates, by the Fund for administration and fund accounting services, and distribution;
• The capabilities and financial condition of the Adviser;
• Current economic and industry trends; and
• The historical relationship between the Fund and the Adviser.
In considering whether the compensation paid to the Sub-Adviser was fair and reasonable, the Board also evaluated, among other things, the following factors:
• The requirements of the Fund for the services provided by the Sub-Adviser;
• The nature, quality and extent of the services provided and expected to be provided;
33
Victory Variable Insurance Funds | | Supplemental Information — continued
December 31, 2019 | |
(Unaudited)
• The fees payable for the services;
• Representations by the Adviser that the sub-advisory fee for the Fund is within the range of fees agreed to in the market for similar services;
• Whether the fee would be sufficient to enable the Sub-Adviser to attract and retain experienced personnel and continue to provide quality services to the Fund;
• Management's commitment to operating the Fund at competitive expense levels;
• Research and other service benefits received by the Sub-Adviser obtained through payment of client commissions for securities transactions;
• Other benefits received by the Sub-Adviser as a result of its sub-advisory relationship with the Fund;
• The capabilities and financial condition of the Sub-Adviser;
• The nature, quality and extent of the oversight and compliance services provided by the Adviser;
• The historical relationship between the Fund and the Sub-Adviser; and
• Current economic and industry trends.
The Board reviewed the Fund's current management fee, comprised of the advisory fee plus the administrative services fee paid to the Adviser, in the context of the Adviser's profitability with respect to the Fund. In addition, the Board compared the Fund's total operating expense ratio on a net and gross basis, taking into consideration any distribution or shareholder servicing fees and management fees with a universe of comparable mutual funds compiled by an independent consultant and a peer group of funds with similar investment strategies selected by that independent consultant from the universe. The Board reviewed the factors and methodology used by the independent consultant in the selection of the Fund's peer group, including the independent consultant's selection of a broad universe of funds, the more specific universe of comparable funds, and peer groups of funds with comparable investment strategies and asset levels, among other factors. The Board also reviewed any changes to the independent consultant's methodology as compared to the prior year, including those resulting from the Adviser's input, if any. The Board also reviewed fees and other information related to the Adviser's management of similarly managed institutional or private accounts, and the differences in the services provided to the other accounts, to the extent applicable. The Board noted that the advisory fee arrangements for the Fund do not include breakpoints, which are generally viewed as a method by which the investment adviser shares any economies of scale with a fund as a fund grows. The Board recognized that because the sub-advisory fees are paid by the Adviser, any arrangement by the Sub-Adviser to reduce its fee as the Fund grows would have no direct impact on the Fund or its shareholders. The Board also considered the Adviser's commitment to limit expenses as discussed in more detail below.
The Board reviewed the Fund's performance over one-, three-, five- and ten-year periods against the performance of the Fund's selected peer group and benchmark index. The Board recognized that the performance of the Fund and the peer group funds are net of expenses, while the performance of the benchmark index reflects gross returns. The Board considered the additional resources that the Adviser has committed to enhance portfolio analysis, compliance and trading systems. The Board noted that, following the Fund's reorganization, the Fund is managed by substantially the same investment management team that managed the comparable predecessor fund.
The Board considered the relative roles and responsibilities of the Adviser and the Sub-Adviser and noted that, among other things: (1) the sub-advisory fees for the Fund would be paid by the Adviser and, therefore, would not be a direct expense of the Fund; and (2) the Adviser would supervise the Sub-Adviser. The Board also considered the Adviser's representation that the fees to be paid to the Sub-Adviser are within the range of sub-advisory fees paid to other sub-advisers for similar services.
The Board reviewed various other specific factors with respect to the Fund, as described below. In their deliberations, the Trustees did not rank the importance of any particular information or factor considered and each Trustee may have attributed different weights to various factors.
The Board concluded that the Fund's gross annual management fee was reasonable as compared to the median gross management fee charged to the funds in the Fund's peer group. The Board noted that the Fund's net
34
Victory Variable Insurance Funds | | Supplemental Information — continued
December 31, 2019 | |
(Unaudited)
annual expense ratio, taking into account any shareholder servicing or distribution fees, was reasonable as compared to the median expense ratio for the peer group. The Board considered the Adviser's contractual agreement to waive its fees and reimburse expenses for a specified period of time, as described in the Fund's prospectus.
The Board then compared the Fund's performance for the one-, three-, five- and ten-year periods ended June 30, 2019, to that of the median performance of the peer group and benchmark index and considered the fact that the Fund outperformed both the benchmark index and the peer group median for the one- and three-year periods, underperformed the benchmark index for the five- and ten-year periods, outperformed the peer group median for the five-year period, and matched the peer group median for the ten-year period.
Having considered, among other things: (1) that the Fund's management fee was within the ranges of advisory fees charged to comparable mutual funds; (2) that the Fund's total expense ratio was reasonable; (3) the Adviser's willingness to limit the expenses for a period of time would provide stability to the Fund's expenses during that period; and (4) the performance of the Fund, the Board concluded that the Agreement continued to be in the best interests of the Fund's shareholders.
Conclusion
Based on its review of the information requested and provided, and following extended discussions, the Board determined that the Agreement, on behalf of the Fund, was consistent with the best interests of the Fund and its shareholders, and the Board unanimously approved the Agreement, on behalf of the Fund, for an additional annual period on the basis of the foregoing review and discussions and the following considerations, among others:
• The fairness and reasonableness of the investment advisory fee payable to the Adviser under the Agreement in light of the investment advisory services provided, the costs of these services, the profitability of the Adviser's relationship with the Fund and the comparability of the fee paid to the fees paid by other investment companies;
• The nature, quality and extent of the investment advisory services provided by the Adviser;
• The Adviser's entrepreneurial commitment to the management of the Fund and the creation of a broad-based family of funds, which could entail a substantial commitment of the Adviser's resources to the successful operation of the Fund;
• The Adviser's representations regarding its staffing and capabilities to manage the Fund, including the retention of personnel with relevant portfolio management experience;
• The Adviser's efforts to enhance investment results by, among other things, developing quality portfolio management teams; and
• The overall high quality of the personnel, operations, financial condition, investment management capabilities, methodologies and performance of the Adviser.
Based on its review of the information requested and provided, and following extended discussions, the Board concluded, among other things, that the Sub-Advisory Agreement, with respect to the Fund, was consistent with the best interests of the Fund and its shareholders and unanimously approved the Sub-Advisory Agreement (including the fees to be charged for services thereunder), on the basis of the foregoing review and discussions and the following considerations, among others:
• The fairness and reasonableness of the investment advisory fee payable to the Sub-Adviser under the Sub-Advisory Agreement in light of the investment advisory services provided, the costs of these services and the estimated profitability of the Sub-Adviser's relationship with the Fund;
• The nature, quality and extent of the investment advisory services provided by the portfolio management team of the Sub-Adviser which have resulted in each Fund achieving its stated investment objective;
• The Sub-Adviser's representations regarding its staffing and capabilities to manage the Fund; and
• The overall high quality of the personnel, operations, financial condition, investment management capabilities, methodologies and performance of the Sub-Adviser.
35
Privacy Policy
Protecting the Privacy of Information
The Trust respects your right to privacy. We also know that you expect us to conduct and process your business in an accurate and efficient manner. To do so, we must collect and maintain certain personal information about you. This is the information we collect from you on applications or other forms, and from the transactions you make with us or third parties. It may include your name, address, social security number, account transactions and balances, and information about investment goals and risk tolerance.
We do not disclose any information about you or about former customers to anyone except as permitted or required by law. Specifically, we may disclose the information we collect to companies that perform services on our behalf, such as the transfer agent that processes shareholder accounts and printers and mailers that assist us in the distribution of investor materials. We may also disclose this information to companies that perform marketing services on our behalf. This allows us to continue to offer you Victory investment products and services that meet your investing needs, and to effect transactions that you request or authorize. These companies will use this information only in connection with the services for which we hired them. They are not permitted to use or share this information for any other purpose.
To protect your personal information internally, we permit access only by authorized employees and maintain physical, electronic and procedural safeguards to guard your personal information.*
* You may have received communications regarding information about privacy policies from other financial institutions which gave you the opportunity to "opt-out" of certain information sharing with companies which are not affiliated with that financial institution. The Trust does not share information with other companies for purposes of marketing solicitations for products other than the Trust. Therefore, the Trust does not provide opt-out options to their shareholders.
Victory Funds
P.O. Box 182593
Columbus, Ohio 43218-2593

Visit our website at: | | Call Victory at: | |
www.vcm.com | | 800-539-FUND (800-539-3863) | |

December 31, 2019
Annual Report
Victory Variable Insurance Funds
Victory INCORE Low Duration Bond VIP Series
Beginning January 1, 2021, as permitted by regulations adopted by the Securities and Exchange Commission, paper copies of the Fund's shareholder reports may no longer be sent by mail from the insurance company that issued your variable annuity and variable life insurance contract, unless you specifically request paper copies of the reports from your insurance company. Instead, the reports will be made available on www.victoryfunds.com. The insurance company that offers your contract may also make these reports available on a website, and such insurance company will notify you by mail each time a report is posted and provide you with a website link to access the report.
If you already elected to receive shareholder reports electronically, you will not be affected by this change and you need not take any action. You may elect to receive shareholder reports and other communications from the insurance company electronically by following the instructions provided by the insurance company.
If offered by your insurance company, you may elect to receive all future reports in paper and free of charge from the insurance company. You can inform your insurance company that you wish to continue receiving paper copies of your reports. Your election to receive reports in paper will apply to all funds available under your contract.
www.vcm.com
News, Information And Education 24 Hours A Day, 7 Days A Week
The Victory Funds site gives fund shareholders, prospective shareholders, and investment professionals a convenient way to access fund information, get guidance, and track fund performance anywhere they can access the Internet. The site includes:
• Detailed performance records
• Daily share prices
• The latest fund news
• Investment resources to help you become a better investor
• A section dedicated to investment professionals
Whether you're a potential investor searching for the fund that matches your investment philosophy, a seasoned investor interested in planning tools, or an investment professional, www.vcm.com has what you seek. Visit us anytime. We're always open.
Victory Variable Insurance Funds
Table of Contents
Shareholder Letter (Unaudited) | | | 3 | | |
Fund Review and Commentary (Unaudited) | | | 5 | | |
Financial Statements | |
Schedule of Portfolio Investments | | | 7 | | |
Statement of Assets and Liabilities | | | 14 | | |
Statement of Operations | | | 15 | | |
Statements of Changes in Net Assets | | | 16 | | |
Financial Highlights | | | 18 | | |
Notes to Financial Statements | | | 20 | | |
Report of Independent
Registered Public Accounting Firm | | | 32 | | |
Supplemental Information (Unaudited) | |
Trustee and Officer Information | | | 33 | | |
Proxy Voting and Portfolio Holdings Information | | | 36 | | |
Expense Examples | | | 36 | | |
Advisory Contract Renewal | | | 37 | | |
Privacy Policy (inside back cover) | |
The Fund is distributed by Victory Capital Advisers, Inc. Victory Capital Management Inc. is the investment adviser to the Fund and receives fees from the Fund for performing services for the Fund.
This report is not authorized for distribution to prospective investors unless preceded or accompanied by a current prospectus of the Fund.
For additional information about any Victory Fund, including fees, expenses, and risks, view our prospectus online at www.vcm.com or call 800-539-3863. Read it carefully before you invest or send money.
The information in this annual report is based on data obtained from recognized services and sources and is believed to be reliable. Any opinions, projections, or recommendations in this report are subject to change without notice and are not intended as individual investment advice. Past investment performance of the Fund, markets or securities mentioned herein should not be considered to be indicative of future results.
• NOT FDIC INSURED • NO BANK GUARANTEE
• MAY LOSE VALUE

Call Victory at:
800-539-FUND (800-539-3863)
Visit our website at:
www.vcm.com
1
This page is intentionally left blank.
2
Victory Funds Letter to Shareholders
(Unaudited)
Dear Shareholder,
As we turn the page into a new decade, it's hard not to reflect on the fact that we have been enjoying the longest-ever bull market in U.S. equities. The run has been impressive, and despite periods of tumult and plenty of negative news, the bull market endured throughout 2019.
For the annual reporting period ended December 31, 2019, the S&P 500® Index posted impressive gains of 31.49%. This represents the greatest one-year gain since 2013 and also illustrates a swift bounce-back after a precipitous drop late in 2018. The move higher supports the notion that underlying fundamentals of U.S. companies drive performance, rather than the political rancor and headline fears that often capture the attention of investors.
Perhaps we shouldn't be surprised at the impressive performance of equities. The U.S. economy — the world's largest — remains on solid footing and has been a key driver of both domestic and international stocks. Robust job creation, near-record low unemployment, and steady consumer spending continue and offer reasons for further optimism. Meanwhile, inflation remains muted, and the Federal Reserve (the Fed) and other major global central banks have taken an accommodative stance. In fact, the Fed has cut interest rates by a total of 0.75% over three meetings last July, September and October.
The risk-on attitudes of investors, coupled with the accommodative monetary policy, had an expected impact on U.S. Treasury yields. The 10-year Treasury yield declined significantly over the course of 2019, falling from 2.66% to 1.92% at year-end. More interesting, however, was the fact that, the yield on 10-year Treasurys fell below shorter-term yields for the first time since before the 2007-2008 Global Financial Crisis. This inverted yield curve spooked investors for a spell, only to revert back to a traditional upward sloping yield curve by the end of the year.
The robust domestic economy, low interest rates, and ample liquidity from central banks provided a potent tonic for the stock market in 2019. In fact, at year-end 2019, the S&P 500® Index was approaching its highest valuation level since 1999. This reminds all of us to retain some historical context on the bull market. Many of us remember the Global Financial Crisis and, before that, the collapse of the dot-com bubble. Although those are now but a distant memory (and we are not forecasting such tumult), we should not forget that stocks don't always go up and cycles don't last forever. In other words, valuations still matter.
The key point is not to discount the risks. In addition to lofty valuations, investors need to keep apprised of trade disputes, geopolitical hotspots, a contentious U.S. election, and a host of other potential headwinds. Yet it is these very risks — these cross-currents — that may create pricing dislocations. This is an environment in which we believe our Victory Capital independent investment franchises can thrive.
On the following pages, you will find information relating to your Victory Funds investment. If you have any questions, we encourage you to contact your financial
3
advisor. Or, if you invest with us directly, you may call (800) 539-3863, or visit our website at www.vcm.com.
My colleagues and I sincerely appreciate the confidence you have placed in the Victory Funds, and we value the opportunity to help meet your investment goals.

Christopher K. Dyer, CFA
President,
Victory Funds
4
Victory INCORE Low Duration Bond VIP Series
Victory Variable Insurance Funds (Unaudited)

Following a small dip in early October, interest rates and stocks both took a steep trip higher in Q4 concluding an impressive year for both stocks and bonds. Themes driving 2019 returns included an about face on monetary policy by the U.S. Federal Reserve, a global reach for yield driven by negative interest rate policies in Japan and Europe, a resilient U.S. consumer, and easing trade tensions.
Taking its cues from market volatility in late 2018 and early 2019, the Federal Reserve quickly changed course from their December 2018 stance of "auto-pilot" on quantitative tightening, and the need for more interest rate increases in 2019. As the yield curve inverted in Q3, the Federal Reserve responded by lowering the Federal Funds Target Rate by .75% over three meetings. In late Q3 and Q4 repurchase rate volatility inspired the Federal Reserve to end quantitative tightening and instead expand their balance sheet by purchasing $173 billion in U.S. Treasury securities, the bulk of the purchases being in U.S. Treasury bills. Chairman Powell convinced board members to cut rates enough to un-invert the yield curve, and moved them to a low-inflation, rates-lower-for-longer outlook. This policy reversal moved longer term yields lower by nearly 1% for the year, providing the bond market with strong absolute returns in 2019. Negative interest rate policies in Japan and Europe also drove international investors to the U.S. bond market in search of positive yields, and lower rates domestically inspired U.S. investors to reach for yield, providing an even greater boost to corporate bond returns relative to U.S. Treasuries.
The U.S. consumer, not surprisingly, remained confident and seemingly willing to spend. U3 (U.S. official) unemployment rate is at 3.5%, and U6 (broader measure) unemployment rate is at 6.7% and trending lower, are both at generational lows. The percentage of U.S. workers who perceive jobs as plentiful versus those who perceive jobs as hard to get are at levels not seen since the records set in the late 1990s, and personal income grew 3.9% over the year. This confidence reflected in retail sales which grew at a 5.8% annual rate, ending the year with strong holiday sales and counterbalancing lackluster business investment due to trade tensions, and driving U.S. GDP to grow at 2.3% with inflation running at a benign 1.6%.
Progress in trade negotiations late in the year brightened the outlook for business and investment, moving markets higher at the end of the year. After months of negotiations to modify the USMCA trade deal with Canada and Mexico, the treaty was passed by the House of Representatives in December, and may be ratified by the Senate soon. Progress was also made with China as a Phase 1 trade deal was scheduled to be signed on January 15.
The Victory INCORE Low Duration Bond VIP Series (the "Fund") seeks to provide a high level of current income consistent with preservation of capital. For the year, the Fund returned 3.79%, ahead of the Bloomberg Barclays U.S. Government 1-3 Year Bond Index which returned 3.59%. While the Fund was positioned relatively defensively early in the year, overweight to high yield and corporate bonds boosted returns, while duration and yield curve positioning detracted from returns.
5
Victory Variable Insurance Funds (Unaudited)
Victory INCORE Low Duration Bond VIP Series (continued)
Average Annual Total Return
Year Ended December 31, 2019
| | | Class I | | | |
INCEPTION DATE | | 8/28/03 | | | |
| | | Net Asset
Value | | Bloomberg
Barclays U.S.
Government 1-3 Year
Bond Index1 | |
One Year | | | 3.79 | % | | | 3.59 | % | |
Three Year | | | 2.14 | % | | | 1.86 | % | |
Five Year | | | 1.78 | % | | | 1.40 | % | |
Ten Year | | | 1.97 | % | | | 1.25 | % | |
Since Inception | | | 2.58 | % | | | N/A | | |
Expense Ratios
Gross | | | 0.58 | % | |
With Applicable Waivers | | | 0.53 | % | |
Past performance is not indicative of future results. The performance data quoted represents past performance and current returns may be lower or higher. The investment return and principal value will fluctuate so that an investor's shares, when redeemed, may be worth more or less than the original cost. To obtain performance information current to the most recent month's end, please visit www.vcm.com.
The above expense ratios are from the Fund's prospectus dated May 1, 2019. Additional information pertaining to the Fund's expense ratios as of December 31, 2019 can be found in the financial highlights.
The total return figures set forth above include all waivers of fees for various periods since inception. Without such fee waivers, the total returns would have been lower. Some fee waivers are voluntary and may be modified or terminated at any time. The total returns do not include any insurance, sales or administrative charges of variable annuity or life insurance contracts. If these charges were included, the total returns would have been lower.
Victory INCORE Low Duration Bond VIP Series — Growth of $10,000
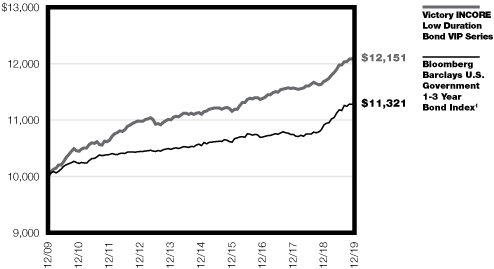
1The Bloomberg Barclays U.S. Government 1-3 Year Bond Index is generally considered to be representative of U.S. government bonds with maturities between one and three years. The Bloomberg Barclays U.S. Government 1-3 Year Bond Index is an unmanaged index that is not available for direct investment. There are no expenses associated with the index, while there are expenses associated with the Fund. It is not possible to invest directly in an index.
The graph reflects investment of growth of a hypothetical $10,000 investment in the Fund. Past performance is no guarantee of future results.
The graph and table do not reflect the deduction of taxes that a shareholder would pay on Fund distributions or the redemption of Fund shares.
6
Victory Variable Insurance Funds
Victory INCORE Low Duration Bond VIP Series | | Schedule of Portfolio Investments
December 31, 2019 | |
Security Description | | Principal
Amount | | Value | |
Asset Backed Securities (6.2%) | |
AmeriCredit Automobile Receivables Trust, Series 2016-3,
Class C, 2.24%, 4/8/22, Callable 3/8/21 @ 100 (a) | | $ | 1,635,000 | | | $ | 1,635,419 | | |
AmeriCredit Automobile Receivables Trust, Series 2015-3,
Class D, 3.34%, 8/8/21, Callable 2/8/20 @ 100 (a) | | | 1,617,211 | | | | 1,618,878 | | |
AmeriCredit Automobile Receivables Trust, Series 2017-2,
Class B, 2.40%, 5/18/22, Callable 11/18/21 @ 100 (a) | | | 1,385,000 | | | | 1,386,888 | | |
AmeriCredit Automobile Receivables Trust, Series 2018-1,
Class B, 3.26%, 1/18/24, Callable 9/18/22 @ 100 (a) | | | 2,800,000 | | | | 2,841,352 | | |
Chrysler Capital Auto Receivables Trust, Series 2016-BA,
Class B, 2.22%, 5/16/22, Callable 7/15/21 @ 100 (a) (b) | | | 1,700,000 | | | | 1,701,076 | | |
Drive Auto Receivables Trust, Series 2017-AA,
Class C, 2.98%, 1/18/22, Callable 3/15/21 @ 100 (a) (b) | | | 55,940 | | | | 55,953 | | |
Santander Drive Auto Receivables Trust, Series 2016-3,
Class C, 2.46%, 3/15/22, Callable 1/15/21 @ 100 (a) | | | 1,271,112 | | | | 1,272,409 | | |
Santander Drive Auto Receivables Trust, Series 2017-3,
Class B, 2.19%, 3/15/22, Callable 8/15/21 @ 100 (a) | | | 79,271 | | | | 79,263 | | |
Santander Drive Auto Receivables Trust, Series 2018-2,
Class B, 3.03%, 9/15/22, Callable 10/15/21 @ 100 (a) | | | 1,963,057 | | | | 1,966,747 | | |
Santander Retail Auto Lease Trust, Series 2018-A,
Class B, 3.20%, 4/20/22, Callable 2/20/21 @ 100 (a) (b) | | | 1,585,000 | | | | 1,597,184 | | |
World Financial Network Credit Card Master Trust, Series 2017-A,
Class A, 2.12%, 3/15/24 (a) | | | 1,610,000 | | | | 1,609,986 | | |
Total Asset Backed Securities (Cost $15,716,082) | | | 15,765,155 | | |
Collateralized Mortgage Obligations (2.5%) | |
Galaxy CLO Ltd., Series 2017-24A, Class A, 3.12% (LIBOR03M+112bps),
1/15/31, Callable 1/15/20 @ 100 (a) (b) (c) | | | 1,000,000 | | | | 992,750 | | |
GS Mortgage Securities Trust, Series 2012-GC6, Class B,
5.65%, 1/10/45 (a) (b) (d) | | | 2,000,000 | | | | 2,111,132 | | |
Morgan Stanley BAML Trust, Series 2013-C13, Class A2,
2.94%, 11/15/46 (a) | | | 14,691 | | | | 14,755 | | |
Steele Creek CLO Ltd., Series 2017-1A, Class A, 3.25%
(LIBOR03M+125bps), 1/15/30, Callable 1/15/20 @ 100 (a) (b) (c) | | | 2,175,000 | | | | 2,167,918 | | |
Voya CLO Ltd., Series 2017-4A, Class A1, 3.13% (LIBOR03M+113bps),
10/15/30, Callable 1/15/20 @ 100 (a) (b) (c) | | | 1,000,000 | | | | 996,862 | | |
Total Collateralized Mortgage Obligations (Cost $6,369,260) | | | 6,283,417 | | |
Corporate Bonds (41.9%) | |
Communication Services (3.6%): | |
Activision Blizzard, Inc., 2.60%, 6/15/22, Callable 5/15/22 @ 100 | | | 420,000 | | | | 425,141 | | |
AT&T, Inc.
2.45%, 6/30/20, Callable 5/30/20 @ 100 (a) | | | 4,079,000 | | | | 4,090,095 | | |
3.20%, 3/1/22, Callable 2/1/22 @ 100 (a) | | | 468,000 | | | | 479,232 | | |
4.25%, 3/1/27, Callable 12/1/26 @ 100 (a) | | | 471,000 | | | | 516,965 | | |
Electronic Arts, Inc., 3.70%, 3/1/21, Callable 2/1/21 @ 100 (a) | | | 2,255,000 | | | | 2,296,424 | | |
See notes to financial statements.
7
Victory Variable Insurance Funds
Victory INCORE Low Duration Bond VIP Series | | Schedule of Portfolio Investments — continued
December 31, 2019 | |
Security Description | | Principal
Amount | | Value | |
Verizon Communications, Inc.
5.15%, 9/15/23 (a) | | $ | 200,000 | | | $ | 222,110 | | |
3.38%, 2/15/25 (a) | | | 325,000 | | | | 344,048 | | |
3.01% (LIBOR03M+110bps), 5/15/25, Callable 3/15/25 @ 100 (a) (c) | | | 719,000 | | | | 735,127 | | |
| | | | 9,109,142 | | |
Consumer Discretionary (5.2%): | |
Best Buy Co., Inc.
5.50%, 3/15/21, Callable 12/15/20 @ 100 (a) (e) | | | 2,115,000 | | | | 2,181,432 | | |
4.45%, 10/1/28, Callable 7/1/28 @ 100 (a) | | | 375,000 | | | | 411,364 | | |
BorgWarner, Inc., 4.63%, 9/15/20 (a) | | | 859,000 | | | | 872,675 | | |
D. R. Horton, Inc., 4.75%, 2/15/23, Callable 11/15/22 @ 100 | | | 1,506,000 | | | | 1,606,315 | | |
D. R. Horton, Inc., 4.00%, 2/15/20 (a) | | | 2,133,000 | | | | 2,137,244 | | |
General Motors Co., 4.88%, 10/2/23 (a) | | | 473,000 | | | | 509,331 | | |
Hasbro, Inc., 3.15%, 5/15/21, Callable 3/15/21 @ 100 (a) | | | 2,622,000 | | | | 2,652,992 | | |
NVR, Inc., 3.95%, 9/15/22, Callable 6/15/22 @ 100 (a) | | | 2,985,000 | | | | 3,114,160 | | |
| | | | 13,485,513 | | |
Consumer Staples (3.0%): | |
Altria Group, Inc., 4.40%, 2/14/26, Callable 12/14/25 @ 100 (a) | | | 568,000 | | | | 616,757 | | |
Constellation Brands, Inc.
2.61% (LIBOR03M+70bps), 11/15/21, Callable 2/10/20 @ 100 (a) (c) | | | 2,500,000 | | | | 2,503,674 | | |
4.65%, 11/15/28, Callable 8/15/28 @ 100 (a) | | | 343,000 | | | | 385,776 | | |
Ingredion, Inc., 4.63%, 11/1/20 (a) | | | 900,000 | | | | 918,153 | | |
Kerry Group Financial Services Unlimited Co., 3.20%, 4/9/23,
Callable 1/9/23 @ 100 (b) | | | 1,000,000 | | | | 1,017,830 | | |
Keurig Dr Pepper, Inc., 4.06%, 5/25/23, Callable 4/25/23 @ 100 | | | 1,270,000 | | | | 1,341,603 | | |
Pernod Ricard SA, 4.25%, 7/15/22 (b) | | | 767,000 | | | | 806,608 | | |
| | | | 7,590,401 | | |
Energy (4.2%): | |
Continental Resources, 4.50%, 4/15/23, Callable 1/15/23 @ 100 (a) | | | 732,000 | | | | 767,041 | | |
Ecopetrol SA, 5.88%, 9/18/23 (a) | | | 454,000 | | | | 504,004 | | |
EQM Midstream Partners LP, 4.75%, 7/15/23, Callable 6/15/23 @ 100 | | | 918,000 | | | | 920,800 | | |
LUKOIL International Finance BV, 6.13%, 11/9/20 (a) (b) | | | 2,815,000 | | | | 2,907,614 | | |
Marathon Petroleum Corp., 3.40%, 12/15/20,
Callable 11/15/20 @ 100 (a) | | | 1,040,000 | | | | 1,052,032 | | |
Pioneer Natural Resource Co.
7.50%, 1/15/20 (a) | | | 1,135,000 | | | | 1,136,997 | | |
3.45%, 1/15/21, Callable 12/15/20 @ 100 (a) | | | 1,825,000 | | | | 1,849,126 | | |
Plains All American Pipeline LP/PAA Finance Corp., 2.85%, 1/31/23,
Callable 10/31/22 @ 100 | | | 925,000 | | | | 932,539 | | |
Valero Energy Corp., 4.00%, 4/1/29, Callable 1/1/29 @ 100 (a) | | | 350,000 | | | | 377,430 | | |
| | | | 10,447,583 | | |
Financials (9.1%): | |
Alleghany Corp., 5.63%, 9/15/20 (a) | | | 800,000 | | | | 818,952 | | |
Bank of America Corp.
2.25%, 4/21/20, MTN (a) | | | 1,300,000 | | | | 1,301,183 | | |
2.33% (LIBOR03M+63bps), 10/1/21, Callable 10/1/20 @ 100 (a) (c) | | | 754,000 | | | | 755,538 | | |
4.20%, 8/26/24, MTN (a) | | | 421,000 | | | | 452,297 | | |
See notes to financial statements.
8
Victory Variable Insurance Funds
Victory INCORE Low Duration Bond VIP Series | | Schedule of Portfolio Investments — continued
December 31, 2019 | |
Security Description | | Principal
Amount | | Value | |
Capital One Financial Corp.
2.50%, 5/12/20, Callable 4/12/20 @ 100 (a) | | $ | 590,000 | | | $ | 590,761 | | |
3.45%, 4/30/21, Callable 3/30/21 @ 100 (a) | | | 3,500,000 | | | | 3,562,825 | | |
3.30%, 10/30/24, Callable 9/30/24 @ 100 (a) | | | 627,000 | | | | 652,839 | | |
Citigroup, Inc.
2.95% (LIBOR03M+107bps), 12/8/21, Callable 11/8/21 @ 100 (a) (c) | | | 1,500,000 | | | | 1,519,079 | | |
4.45%, 9/29/27 (a) | | | 371,000 | | | | 408,838 | | |
Enel Finance International NV, 2.88%, 5/25/22 (b) | | | 1,525,000 | | | | 1,543,864 | | |
Fifth Third Bancorp, 3.65%, 1/25/24, Callable 12/25/23 @ 100 (a) | | | 731,000 | | | | 771,198 | | |
Level 3 Financing, Inc., 5.38%, 1/15/24, Callable 2/10/20 @ 101.34 (a) | | | 325,000 | | | | 330,034 | | |
Marsh & McLennan Cos., Inc., 2.35%, 3/6/20, Callable 2/10/20 @ 100 (a) | | | 335,000 | | | | 335,107 | | |
Morgan Stanley
2.65%, 1/27/20 (a) | | | 1,355,000 | | | | 1,355,488 | | |
4.88%, 11/1/22 (a) | | | 918,000 | | | | 984,592 | | |
Newcrest Finance Pty Ltd.
4.45%, 11/15/21 (a) (b) | | | 1,569,000 | | | | 1,626,127 | | |
4.20%, 10/1/22 (a) (b) | | | 1,756,000 | | | | 1,832,439 | | |
The Goldman Sachs Group, Inc., 3.08% (LIBOR03M+117bps),
11/15/21, Callable 11/15/20 @ 100 (a) (c) | | | 1,500,000 | | | | 1,511,595 | | |
ZB NA, 3.50%, 8/27/21 (a) | | | 1,465,000 | | | | 1,498,212 | | |
Zions Bancorp NA, 3.35%, 3/4/22, Callable 2/4/22 @ 100 (a) (e) | | | 910,000 | | | | 932,723 | | |
| | | | 22,783,691 | | |
Health Care (3.9%): | |
AbbVie, Inc., 2.30%, 5/14/21, Callable 4/14/21 @ 100 (a) | | | 1,094,000 | | | | 1,097,960 | | |
Amgen, Inc., 2.20%, 5/11/20 (a) | | | 2,705,000 | | | | 2,706,759 | | |
Biogen, Inc., 2.90%, 9/15/20 (a) | | | 2,623,000 | | | | 2,639,761 | | |
Bristol-Myers Squibb Co., 2.88%, 2/19/21 (b) | | | 3,020,000 | | | | 3,055,062 | | |
Humana, Inc., 2.90%, 12/15/22, Callable 11/15/22 @ 100 | | | 515,000 | | | | 525,182 | | |
| | | | 10,024,724 | | |
Industrials (2.2%): | |
AerCap Ireland Capital DAC / AerCap Global Aviation Trust,
4.63%, 10/30/20 (a) | | | 2,015,000 | | | | 2,055,945 | | |
Delta Air Lines, Inc., 3.80%, 4/19/23, Callable 3/19/23 @ 100 (e) | | | 1,025,000 | | | | 1,063,909 | | |
Fortive Corp., 3.15%, 6/15/26, Callable 3/15/26 @ 100 (a) | | | 176,000 | | | | 180,224 | | |
IDEX Corp., 4.50%, 12/15/20, Callable 9/15/20 @ 100 (a) | | | 1,150,000 | | | | 1,168,124 | | |
Roper Technologies, Inc., 2.95%, 9/15/29, Callable 6/15/29 @ 100 | | | 358,000 | | | | 361,627 | | |
Spirit AeroSystems, Inc., 2.69% (LIBOR03M+80bps), 6/15/21,
Callable 2/10/20 @ 100 (a) (c) | | | 1,000,000 | | | | 996,420 | | |
| | | | 5,826,249 | | |
Information Technology (3.8%): | |
Broadcom Corp., 3.00%, 1/15/22, Callable 12/15/21 @ 100 (a) | | | 861,000 | | | | 873,855 | | |
FLIR Systems, Inc., 3.13%, 6/15/21, Callable 5/15/21 @ 100 (a) (e) | | | 2,050,000 | | | | 2,064,617 | | |
Lam Research Corp., 4.00%, 3/15/29, Callable 12/15/28 @ 100 (a) | | | 459,000 | | | | 505,295 | | |
Lam Research Group, 2.80%, 6/15/21, Callable 5/15/21 @ 100 (a) | | | 2,928,000 | | | | 2,963,048 | | |
NetApp, Inc., 3.38%, 6/15/21, Callable 4/15/21 @ 100 (a) | | | 1,310,000 | | | | 1,332,375 | | |
VMware, Inc., 2.30%, 8/21/20 (a) | | | 2,110,000 | | | | 2,113,524 | | |
| | | | 9,852,714 | | |
See notes to financial statements.
9
Victory Variable Insurance Funds
Victory INCORE Low Duration Bond VIP Series | | Schedule of Portfolio Investments — continued
December 31, 2019 | |
Security Description | | Principal
Amount | | Value | |
Materials (2.1%): | |
Anglo American Capital PLC, 4.13%, 4/15/21 (a) (b) | | $ | 3,275,000 | | | $ | 3,344,004 | | |
Celanese US Holdings LLC, 4.63%, 11/15/22 | | | 780,000 | | | | 824,717 | | |
LYB International Finance II BV, 3.50%, 3/2/27, Callable 12/2/26 @ 100 (a) | | | 502,000 | | | | 526,859 | | |
Lyondellbasell Industries NV, 6.00%, 11/15/21, Callable 8/17/21 @ 100 (a) | | | 800,000 | | | | 849,704 | | |
| | | | 5,545,284 | | |
Real Estate (2.4%): | |
CubeSmart, LP, 4.80%, 7/15/22, Callable 4/15/22 @ 100 (a) | | | 2,731,000 | | | | 2,885,656 | | |
Highwoods Realty LP, 3.20%, 6/15/21, Callable 4/15/21 @ 100 (a) | | | 2,200,000 | | | | 2,228,754 | | |
Piedmont Operating Partnership LP, 3.40%, 6/1/23, Callable 3/1/23 @ 100 | | | 967,000 | | | | 991,852 | | |
| | | | 6,106,262 | | |
Utilities (2.4%): | |
Eversource Energy, 2.50%, 3/15/21, Callable 2/15/21 @ 100 (a) | | | 1,950,000 | | | | 1,959,945 | | |
Exelon Corp.
3.50%, 6/1/22, Callable 5/1/22 @ 100 (a) | | | 2,117,000 | | | | 2,173,121 | | |
3.95%, 6/15/25, Callable 3/15/25 @ 100 (a) | | | 541,000 | | | | 581,402 | | |
NextEra Energy Capital Holdings, Inc., 2.80%, 1/15/23,
Callable 12/15/22 @ 100 | | | 1,345,000 | | | | 1,367,300 | | |
| | | | 6,081,768 | | |
Total Corporate Bonds (Cost $105,706,734) | | | 106,853,331 | | |
Residential Mortgage Backed Securities (3.6%) | |
Bear Stearns Alt-A Trust, Series 2003-3, Class 2A, 4.34%, 10/25/33,
Callable 1/25/20 @ 100 (a) (d) | | | 405,124 | | | | 405,124 | | |
Bear Stearns Alt-A Trust, Series 2004-6, Class 1A, 2.43%
(LIBOR01M+64bps), 7/25/34, Callable 1/25/20 @ 100 (a) (c) | | | 61,911 | | | | 61,696 | | |
Credit Suisse First Boston Mortgage Securities Corp., Series 2003-23,
Class 2A8, 4.50%, 12/31/49 (a) | | | 2,385 | | | | 2,474 | | |
Credit Suisse First Boston Mortgage Securities Corp., Series 2004-AR7,
Class 4A1, 4.09%, 11/25/34, Callable 1/25/20 @ 100 (a) (d) | | | 301,135 | | | | 301,135 | | |
JPMorgan Mortgage Trust, Series 2004-S2, Class 1A3, 4.75%, 2/25/20,
Callable 1/25/20 @ 100 (a) | | | 1,906 | | | | 1,914 | | |
JPMorgan Mortgage Trust, Series 2016-4, Class A5, 3.50%, 10/25/46,
Callable 9/25/29 @ 100 (a) (b) (d) | | | 516,927 | | | | 524,304 | | |
JPMorgan Mortgage Trust, Series 2004-S1, Class 1A7, 5.00%, 9/25/34,
Callable 1/25/20 @ 100 (a) | | | 1,564 | | | | 1,504 | | |
JPMorgan Mortgage Trust, Series 2016-3, Class 1A3, 3.50%, 10/25/46,
Callable 6/25/25 @ 100 (a) (b) (d) | | | 1,103,133 | | | | 1,118,855 | | |
JPMorgan Mortgage Trust, Series 2014-5, Class A11, 2.98%, 10/25/29,
Callable 7/25/23 @ 100 (a) (b) (d) | | | 1,680,325 | | | | 1,699,721 | | |
JPMorgan Mortgage Trust, Series 2017-1, Class A5, 3.50%, 1/25/47,
Callable 1/25/28 @ 100 (a) (b) (d) | | | 744,476 | | | | 755,030 | | |
JPMorgan Mortgage Trust, Series 2017-3, Class 2A2, 2.50%, 8/25/47,
Callable 11/25/24 @ 100 (a) (b) (d) | | | 2,084,535 | | | | 2,079,951 | | |
Madison Park Funding Ltd., Series 2007-4A, Class AR, 3.13%
(LIBOR03M+120bps), 7/29/30, Callable 1/29/20 @ 100 (a) (b) (c) | | | 1,750,000 | | | | 1,749,061 | | |
Residential Asset Securities Corp., Series 2005-KS1, Class M1, 2.47%
(LIBOR01M+68bps), 2/25/35, Callable 1/25/20 @ 100 (a) (c) | | | 519,942 | | | | 517,390 | | |
See notes to financial statements.
10
Victory Variable Insurance Funds
Victory INCORE Low Duration Bond VIP Series | | Schedule of Portfolio Investments — continued
December 31, 2019 | |
Security Description | | Shares or
Principal
Amount | | Value | |
Residential Funding Mortgage Securities I, Inc., Series 2005-S3,
Class A1, 4.75%, 3/25/20, Callable 1/25/20 @ 100 (a) | | $ | 186 | | | $ | 186 | | |
Total Residential Mortgage Backed Securities (Cost $9,230,107) | | | 9,218,345 | | |
U.S. Government Mortgage Backed Agencies (14.4%) | |
Federal Home Loan Mortgage Corp.
5.00%, 6/15/23 – 8/1/40 (a) | | | 814,580 | | | | 898,121 | | |
5.50%, 10/25/23 (a) | | | 4,502 | | | | 4,694 | | |
Series 4207, Class JD, 1.50%, 5/15/28 (a) | | | 2,066,398 | | | | 2,020,908 | | |
Series 4430, Class NG, 2.50%, 2/15/38 (a) | | | 1,387,932 | | | | 1,392,604 | | |
7.00%, 9/1/38 (a) | | | 3,907 | | | | 4,699 | | |
Series 4320, Class AP, 3.50%, 7/15/39 (a) | | | 804,205 | | | | 832,428 | | |
Series 3713, Class PA, 2.00%, 2/15/40 – 4/15/44 (a) | | | 8,443,616 | | | | 8,366,554 | | |
Series 4444, Class CH, 3.00%, 1/15/41 | | | 2,285,442 | | | | 2,326,596 | | |
Series 4049, Class AB, 2.75%, 12/15/41 (a) | | | 478,248 | | | | 483,161 | | |
| | | | 16,329,765 | | |
Federal National Mortgage Association
Series 2012-63, Class VG, 4.00%, 8/25/23 (a) | | | 340,694 | | | | 349,053 | | |
Series 2010-156, Class DY, 3.50%, 1/25/26 – 3/25/44 (a) | | | 4,934,371 | | | | 5,030,591 | | |
6.00%, 2/1/37 (a) | | | 941,638 | | | | 1,079,555 | | |
Series 2013-33, Class UD, 2.50%, 4/25/39 – 5/25/40 (a) | | | 2,612,286 | | | | 2,627,779 | | |
Series 2011-21, Class PA, 4.50%, 5/25/40 (a) | | | 1,940,620 | | | | 2,020,653 | | |
Series 2011-101, Class LA, 3.00%, 10/25/40 (a) | | | 764,980 | | | | 775,003 | | |
5.00%, 2/1/41 – 10/1/41 (a) | | | 3,082,198 | | | | 3,398,515 | | |
| | | | 15,281,149 | | |
Government National Mortgage Association
Series 2016-156, Class AP, 2.25%, 12/20/42 (a) | | | 3,430,661 | | | | 3,427,288 | | |
Series 2018-22, Class JA, 3.00%, 1/20/44 (a) | | | 1,560,209 | | | | 1,579,605 | | |
| | | | 5,006,893 | | |
Total U.S. Government Mortgage Backed Agencies (Cost $36,458,434) | | | 36,617,807 | | |
U.S. Treasury Obligations (28.9%) | |
U.S. Treasury Bills
1.23%, 1/2/20 (a) (f) | | | 3,301,000 | | | | 3,300,774 | | |
1.47%, 3/26/20 (f) | | | 11,655,000 | | | | 11,614,191 | | |
U.S. Treasury Notes
1.50%, 8/31/21 | | | 55,000,000 | | | | 54,911,914 | | |
1.50%, 8/15/22 | | | 4,000,000 | | | | 3,991,563 | | |
Total U.S. Treasury Obligations (Cost $73,740,080) | | | 73,818,442 | | |
Collateral for Securities Loaned^ (0.3%) | |
BlackRock Liquidity Funds TempFund Portfolio,
Institutional Class, 1.75% (g) | | | 31,361 | | | | 31,361 | | |
Fidelity Investments Money Market Government Portfolio,
Class I, 1.54% (g) | | | 172,778 | | | | 172,778 | | |
Fidelity Investments Prime Money Market Portfolio, Class I, 1.75% (g) | | | 5,238 | | | | 5,238 | | |
Goldman Sachs Financial Square Prime Obligations Fund,
Institutional Class, 1.80% (g) | | | 104,376 | | | | 104,376 | | |
See notes to financial statements.
11
Victory Variable Insurance Funds
Victory INCORE Low Duration Bond VIP Series | | Schedule of Portfolio Investments — continued
December 31, 2019 | |
Security Description | | Shares | | Value | |
JPMorgan Prime Money Market Fund, Capital Class, 1.73% (g) | | | 114,821 | | | $ | 114,821 | | |
Morgan Stanley Institutional Liquidity Prime Portfolio,
Institutional Class, 1.76% (g) | | | 229,635 | | | | 229,635 | | |
Total Collateral for Securities Loaned (Cost $658,209) | | | 658,209 | | |
Total Investments (Cost $247,878,906) — 97.8% | | | 249,214,706 | | |
Other assets in excess of liabilities — 2.2% | | | 5,482,898 | | |
NET ASSETS — 100.00% | | $ | 254,697,604 | | |
^ Purchased with cash collateral from securities on loan.
(a) All or a portion of this security has been segregated as collateral for derivative instruments.
(b) Rule 144A security or other security that is restricted as to resale to institutional investors. The Fund's Adviser has deemed this security to be liquid based upon procedures approved by the Board of Trustees. As of December 31, 2019, the fair value of these securities was $33,683,345 and amounted to 13.2% of net assets.
(c) Variable or Floating-Rate Security. Rate disclosed is as of December 31, 2019.
(d) The rate for certain asset-backed and mortgage backed securities may vary based on factors relating to the pool of assets underlying the security. The rate disclosed is the rate in effect at December 31, 2019.
(e) All or a portion of this security is on loan.
(f) Rate represents the effective yield at December 31, 2019.
(g) Rate disclosed is the daily yield on December 31, 2019.
bps — Basis points
LIBOR — London InterBank Offered Rate
LIBOR01M — 1 Month US Dollar LIBOR, rate disclosed as of December 31, 2019, based on the last reset date of the security
LIBOR03M — 3 Month US Dollar LIBOR, rate disclosed as of December 31, 2019, based on the last reset date of the security
LLC — Limited Liability Company
LP — Limited Partnership
MTN — Medium Term Note
PLC — Public Limited Company
Futures Contracts Purchased
| | | Number of
Contracts | | Expiration
Date | | Notional
Amount | | Value | | Unrealized
Appreciation
(Depreciation) | |
2-Year U.S. Treasury Note Future | | | 390 | | | 3/31/20 | | $ | 84,115,757 | | | $ | 84,045,000 | | | $ | (70,757 | ) | |
See notes to financial statements.
12
Victory Variable Insurance Funds
Victory INCORE Low Duration Bond VIP Series | | Schedule of Portfolio Investments — continued
December 31, 2019 | |
Futures Contracts Sold
| | | Number of
Contracts | | Expiration
Date | | Notional
Amount | | Value | | Unrealized
Appreciation
(Depreciation) | |
5-Year U.S. Treasury Note Future | | | 263 | | | 3/31/20 | | $ | 31,268,427 | | | $ | 31,194,266 | | | $ | 74,161 | | |
| | | Total unrealized appreciation | | | | | | | | $ | 74,161 | | |
| | | Total unrealized depreciation | | | | | | | | | (70,757 | ) | |
| | | Total net unrealized appreciation(depreciation) | | | | | | | | $ | 3,404 | | |
Centrally Cleared
Credit Default Swap Agreements — Sell Protection (a)
Underlying
Instrument* | | Fixed
Deal
Received
Rate | | Maturity
Date | | Payment
Frequency | | Implied
Credit
Spread at
December 31,
2019 (b) | | Notional
Amount (c) | | Value | | Premiums
Paid
(Received) | | Unrealized
Appreciation
(Depreciation) | |
CDX North
America High
Yield Index;
Series 33 | | | 5.00 | % | | 12/20/24 | | Quarterly | | | 2.79 | % | | $ | 5,643,000 | | | $ | 544,769 | | | $ | 429,997 | | | $ | 114,772 | | |
| | | $ | 544,769 | | | $ | 429,997 | | | $ | 114,772 | | |
* As of December 31, 2019, the CDX North America High Yield Index (the "Index") included securities which had defaulted and represented 1% of the Index. Reflects the notional amount after the default of securities.
(a) When a credit event occurs as defined under the terms of the swap agreement, the Fund as a seller of credit protection will either (i) pay to the buyer of protection an amount equal to the par value of the defaulted reference entity and take delivery of the reference entity or (ii) pay a net amount equal to the par value of the defaulted reference entity less its recovery value.
(b) Implied credit spread, represented in absolute terms, utilized in determining the value of the credit default swap agreements as of period end will serve as an indicator of the current status of the payment/performance risk and represent the likelihood or risk of default for the credit derivative. The implied credit spread of a referenced entity reflects the cost of buying/selling protection and may include payments required to be made to enter into the agreement. Generally, wider credit spreads represent a perceived deterioration of the referenced entity's credit soundness and a greater likelihood or risk of default or other credit event occurring as defined under the terms of the swap agreement.
(c) The notional amount represents the maximum potential amount the Fund could be required to pay as a seller of credit protection if a credit event occurs, as defined under the terms of the swap agreement, for each security included in the Index.
See notes to financial statements.
13
Victory Variable Insurance Funds | | Statement of Assets and Liabilities
December 31, 2019 | |
| | | Victory
INCORE
Low Duration
Bond VIP Series | |
ASSETS: | |
Investments, at value (Cost $247,878,906) | | $ | 249,214,706 | (a) | |
Cash and cash equivalents | | | 1,763,711 | | |
Deposits with brokers for futures contracts | | | 1,092,675 | | |
Deposits with brokers for swap agreements | | | 2,040,757 | | |
Interest and dividends receivable | | | 1,363,068 | | |
Receivable for capital shares issued | | | 2,000 | | |
Variation margin receivable on open futures contracts | | | 24,445 | | |
Receivable from Adviser | | | 68,244 | | |
Prepaid expenses | | | 16,525 | | |
Total Assets | | | 255,586,131 | | |
LIABILITIES: | |
Payables: | |
Collateral received on loaned securities | | | 658,209 | | |
Capital shares redeemed | | | 48,657 | | |
Variation margin on open swap agreements | | | 2,529 | | |
Accrued expenses and other payables: | |
Investment advisory fees | | | 97,818 | | |
Administration fees | | | 12,234 | | |
Custodian fees | | | 2,444 | | |
Transfer agent fees | | | 29,463 | | |
Compliance fees | | | 166 | | |
Trustees' fees | | | 527 | | |
Other accrued expenses | | | 36,480 | | |
Total Liabilities | | | 888,527 | | |
NET ASSETS: | |
Capital | | | 253,054,781 | | |
Total distributable earnings/(loss) | | | 1,642,823 | | |
Net Assets | | $ | 254,697,604 | | |
Shares (unlimited shares authorized with a par value of $0.001 per share): | | | 24,383,992 | | |
Net asset value: | | $ | 10.45 | | |
(a) Includes $639,947 of securities on loan.
See notes to financial statements.
14
Victory Variable Insurance Funds | | Statement of Operations
For the Year Ended December 31, 2019 | |
| | | Victory
INCORE
Low Duration
Bond VIP Series | |
Investment Income: | |
Interest | | $ | 7,031,732 | | |
Securities lending (net of fees) | | | 1,947 | | |
Total Income | | | 7,033,679 | | |
Expenses: | |
Investment advisory fees | | | 1,178,472 | | |
Administration fees | | | 160,142 | | |
Custodian fees | | | 17,689 | | |
Transfer agent fees | | | 356,966 | | |
Trustees' fees | | | 23,426 | | |
Compliance fees | | | 1,782 | | |
Legal and audit fees | | | 35,801 | | |
Other expenses | | | 73,220 | | |
Total Expenses | | | 1,847,498 | | |
Expenses waived/reimbursed by Adviser | | | (459,668 | ) | |
Net Expenses | | | 1,387,830 | | |
Net Investment Income (Loss) | | | 5,645,849 | | |
Realized/Unrealized Gains (Losses) from Investments: | |
Net realized gains (losses) from investment securities | | | 483,983 | | |
Net realized gains (losses) from futures contracts | | | 382,956 | | |
Net realized gains (losses) from swap agreements | | | (1,859,807 | ) | |
Net change in unrealized appreciation/depreciation on investment securities | | | 4,045,486 | | |
Net change in unrealized appreciation/depreciation on futures contracts | | | (690,127 | ) | |
Net change in unrealized appreciation/depreciation on swap agreements | | | 1,597,266 | | |
Net realized/unrealized gains on investments | | | 3,959,757 | | |
Change in net assets resulting from operations | | $ | 9,605,606 | | |
See notes to financial statements.
15
Victory Variable Insurance Funds | | Statements of Changes in Net Assets | |
| | | Victory INCORE Low
Duration Bond VIP Series | |
| | | Year Ended
December 31,
2019 | | Year Ended
December 31,
2018 | |
From Investment Activities: | |
Operations: | |
Net investment income (loss) | | $ | 5,645,849 | | | $ | 5,274,270 | | |
Net realized gains (losses) from investments | | | (992,868 | ) | | | (154,847 | ) | |
Net change in unrealized appreciation/depreciation
on investments | | | 4,952,625 | | | | (2,268,960 | ) | |
Change in net assets resulting from operations | | | 9,605,606 | | | | 2,850,463 | | |
Change in net assets resulting from distributions to shareholders | | | (5,011,793 | ) | | | (1,374,412 | ) | |
Change in net assets resulting from capital transactions | | | (14,344,949 | ) | | | (29,333,670 | ) | |
Change in net assets | | | (9,751,136 | ) | | | (27,857,619 | ) | |
Net Assets: | |
Beginning of period | | | 264,448,740 | | | | 292,306,359 | | |
End of period | | $ | 254,697,604 | | | $ | 264,448,740 | | |
Capital Transactions: | |
Proceeds from shares issued | | $ | 20,029,224 | | | $ | 20,030,792 | | |
Distributions reinvested | | | 5,011,793 | | | | 1,374,412 | | |
Cost of shares redeemed | | | (39,385,966 | ) | | | (50,738,874 | ) | |
Change in net assets resulting from capital transactions | | $ | (14,344,949 | ) | | $ | (29,333,670 | ) | |
Share Transactions: | |
Issued | | | 1,914,121 | | | | 1,955,580 | | |
Reinvested | | | 480,517 | | | | 134,219 | | |
Redeemed | | | (3,753,428 | ) | | | (4,949,055 | ) | |
Change in Shares | | | (1,358,790 | ) | | | (2,859,256 | ) | |
See notes to financial statements.
16
This page is intentionally left blank.
17
Victory Variable Insurance Funds | | Financial Highlights | |
For a Share Outstanding Throughout Each Period
| | | | Investment Activities | | Distributions to
Shareholders From | |
| | | Net Asset
Value,
Beginning of
Period | | Net
Investment
Income
(Loss)(a) | | Net
Realized and
Unrealized
Gains
(Losses) on
Investments | | Total from
Investment
Activities | | Net
Investment
Income | | Net Realized
Gains From
Investments | | Total
Distributions | |
Victory INCORE Low Duration Bond VIP Series | |
Year Ended
12/31/19 | | $ | 10.27 | | | | 0.23 | | | | 0.16 | | | | 0.39 | | | | (0.21 | ) | | | — | | | | (0.21 | ) | |
Year Ended
12/31/18 | | $ | 10.22 | | | | 0.19 | | | | (0.09 | ) | | | 0.10 | | | | (0.05 | ) | | | — | | | | (0.05 | ) | |
Year Ended
12/31/17 | | $ | 10.20 | | | | 0.15 | | | | 0.02 | | | | 0.17 | | | | (0.15 | ) | | | — | | | | (0.15 | ) | |
Year Ended
12/31/16 | | $ | 10.13 | | | | 0.12 | | | | 0.09 | | | | 0.21 | | | | (0.14 | ) | | | — | | | | (0.14 | ) | |
Year Ended
12/31/15 | | $ | 10.22 | | | | 0.14 | | | | (0.09 | ) | | | 0.05 | | | | (0.14 | ) | | | — | | | | (0.14 | ) | |
(a) Per share net investment income (loss) has been calculated using the average daily shares method.
(b) Total returns do not reflect the effects of charges deducted pursuant to the terms of The Guardian Insurance & Annuity Company, Inc.'s variable contracts. Inclusion of such charges would reduce the total returns for all periods shown.
(c) Portfolio turnover increased due to a change within the portfolio holdings during the year.
(d) Amount is less than $0.005 per share.
(e) The Fund received monies related to a nonrecurring refund from the prior Custodian. The corresponding impact to the total return was less than 0.005% for the period shown. (See Note 8)
See notes to financial statements.
18
Victory Variable Insurance Funds | | Financial Highlights — continued | |
For a Share Outstanding Throughout Each Period
| | | | | Ratios to Average Net Assets | | Supplemental Data | |
| | | Capital
Contribution
from Prior
Custodian,
Net (See
Note 8) | | Net Asset
Value,
End of
Period | | Total
Return(b) | | Net
Expenses | | Net
Investment
Income
(Loss) | | Gross
Expenses | | Net Assets,
End of
Period
(000's) | | Portfolio
Turnover | |
Victory INCORE Low Duration Bond VIP Series | |
Year Ended
12/31/19 | | | — | | | $ | 10.45 | | | | 3.79 | % | | | 0.53 | % | | | 2.16 | % | | | 0.71 | % | | $ | 254,698 | | | | 75 | % | |
Year Ended
12/31/18 | | | — | | | $ | 10.27 | | | | 1.01 | % | | | 0.53 | % | | | 1.85 | % | | | 0.58 | % | | $ | 264,449 | | | | 55 | % | |
Year Ended
12/31/17 | | | — | | | $ | 10.22 | | | | 1.64 | % | | | 0.53 | % | | | 1.44 | % | | | 0.58 | % | | $ | 292,306 | | | | 91 | %(c) | |
Year Ended
12/31/16 | | | — | (d) | | $ | 10.20 | | | | 2.04 | %(e) | | | 0.53 | % | | | 1.21 | % | | | 0.53 | % | | $ | 273,151 | | | | 55 | % | |
Year Ended
12/31/15 | | | — | | | $ | 10.13 | | | | 0.47 | % | | | 0.53 | % | | | 1.33 | % | | | 0.53 | % | | $ | 276,164 | | | | 38 | % | |
See notes to financial statements.
19
Victory Variable Insurance Funds | | Notes to Financial Statements
December 31, 2019 | |
1. Organization:
Victory Variable Insurance Funds (the "Trust") was organized on February 11, 1998 as a Delaware statutory trust. The Trust is registered under the Investment Company Act of 1940, as amended (the "1940 Act"), as a diversified open-end investment company. The Trust is comprised of nine funds and is authorized to issue an unlimited number of shares, which are units of beneficial interest with a par value of $0.001 per share.
The accompanying financial statements are those of the Victory INCORE Low Duration Bond VIP Series (the "Fund"). The Fund offers a single class of shares: Class I Shares. Sales of shares of the Fund may only be made to certain separate accounts of The Guardian Insurance & Annuity Company, Inc. ("GIAC") that fund certain variable annuity and variable life insurance contracts issued by GIAC. GIAC is a wholly owned subsidiary of The Guardian Life Insurance Company of America ("Guardian Life").
Under the Trust's organizational documents, its officers and trustees are indemnified against certain liabilities arising out of the performance of their duties to the Fund. In addition, in the normal course of business, the Fund enters into contracts with its vendors and others that provide for general indemnifications. The Fund's maximum exposure under these arrangements is unknown, as this would involve future claims that may be made against the Fund. However, based on experience, the Fund expects that risk of loss to be remote.
2. Significant Accounting Policies:
The following is a summary of significant accounting policies followed by the Trust in the preparation of its financial statements. The policies are in conformity with accounting principles generally accepted in the United States of America ("GAAP"). The preparation of financial statements in accordance with GAAP requires management to make estimates and assumptions that affect the reported amounts of assets and liabilities and disclosure of contingent assets and liabilities at the date of the financial statements and the reported amounts of income and expenses for the period. Actual results could differ from those estimates. The Fund follows the specialized accounting and reporting requirements under GAAP that are applicable to investment companies.
Investment Valuation:
The Fund records investments at fair value. Fair value is defined as the price that would be received to sell an asset or paid to transfer a liability in an orderly transaction between market participants at the measurement date.
The valuation techniques described below maximize the use of observable inputs and minimize the use of unobservable inputs in determining fair value. The inputs used for valuing the Fund's investments are summarized in the three broad levels listed below:
• Level 1 — quoted prices in active markets for identical securities
• Level 2 — other significant observable inputs (including quoted prices for similar securities or interest rates applicable to those securities, etc.)
• Level 3 — significant unobservable inputs (including the Fund's own assumptions in determining the fair value of investments)
Changes in valuation techniques may result in transfers in or out of an assigned level within the disclosure hierarchy. The inputs or methodologies used for valuation techniques are not necessarily an indication of the risk associated with entering into those investments.
Portfolio securities listed or traded on securities exchanges, including American Depositary Receipts ("ADRs") and Rights, are valued at the closing price on the exchange or system where the security is principally traded, if available, or at the Nasdaq Official Closing Price. If there have been no sales for that day on the exchange or system, then a security is valued at the last available bid quotation on the exchange or system where the security is principally traded. In each of these situations, valuations are typically categorized as Level 1 in the fair value hierarchy.
20
Victory Variable Insurance Funds | | Notes to Financial Statements — continued
December 31, 2019 | |
Futures contracts are valued at the settlement price established each day by the board of trade or an exchange on which they are traded. These valuations are typically categorized as Level 1 in the fair value hierarchy.
Swap agreements are valued at the mean between the current bid and ask prices. These valuations are typically categorized as Level 2 in the fair value hierarchy.
Debt securities of United States ("U.S.") issuers (other than short-term investments maturing in 60 days or less), including corporate and municipal securities, are valued on the basis of bid valuations provided by dealers or an independent pricing service approved by the Trust's Board of Trustees (the "Board"). Short-term investments maturing in 60 days or less may be valued at amortized cost, which approximates market value. Under the amortized cost method, premium or discount, if any, is amortized or accreted, respectively, on a constant basis to the maturity of the security. In each of these situations, valuations are typically categorized as Level 2 in the fair value hierarchy.
Investments for which there are no such quotations, or for which quotations do not appear reliable, are valued at fair value in accordance with procedures established by and under the general supervision and responsibility of the Board. These valuations are typically categorized as Level 2 or Level 3 in the fair value hierarchy, based on the observability of inputs used to determine the fair value.
A summary of the valuations as of December 31, 2019, based upon the three levels defined above, is included in the table below while the breakdown, by category, of investments is disclosed in the Schedule of Portfolio Investments.
| | | LEVEL 1 | | LEVEL 2 | | Total | |
Asset Backed Securities | | $ | — | | | $ | 15,765,155 | | | $ | 15,765,155 | | |
Collateralized Mortgage Obligations | | | — | | | | 6,283,417 | | | | 6,283,417 | | |
Corporate Bonds | | | — | | | | 106,853,331 | | | | 106,853,331 | | |
Residential Mortgage Backed Securities | | | — | | | | 9,218,345 | | | | 9,218,345 | | |
U.S. Government Mortgage Backed Agencies | | | — | | | | 36,617,807 | | | | 36,617,807 | | |
U.S. Treasury Obligations | | | — | | | | 73,818,442 | | | | 73,818,442 | | |
Collateral for Securities Loaned | | | 658,209 | | | | — | | | | 658,209 | | |
Total | | $ | 658,209 | | | $ | 248,556,497 | | | $ | 249,214,706 | | |
Other Financial Instruments^: | |
Assets: | |
Futures Contracts | | | 74,161 | | | | — | | | | 74,161 | | |
Credit Default Swap Agreements | | | — | | | | 114,772 | | | | 114,772 | | |
Liabilities: | |
Futures Contracts | | | (70,757 | ) | | | — | | | | (70,757 | ) | |
Total | | $ | 3,404 | | | $ | 114,772 | | | $ | 118,176 | | |
^ Futures Contracts and Credit Default Swap Agreements are valued at the unrealized appreciation (depreciation) on the investment.
For the year ended December 31, 2019, there were no Level 3 investments for which significant unobservable inputs were used to determine fair value.
Securities Purchased on a When-Issued Basis:
The Fund may purchase securities on a when-issued basis. When-issued securities are securities purchased for delivery beyond normal settlement periods at a stated price and/or yield, thereby involving the risk that the price and/or yield obtained may be more or less than those available in the market when delivery takes place. At the time the Fund makes the commitment to purchase a security on a when-issued basis, the Fund records the transaction and reflects the value of the security in determining net asset value. No interest accrues to the Fund until the transaction settles and payment takes place. Normally, the settlement date occurs within one month of the purchase. A segregated account is established and the Fund maintains cash and/or marketable securities at least equal in value to
21
Victory Variable Insurance Funds | | Notes to Financial Statements — continued
December 31, 2019 | |
commitments for when-issued securities. If the Fund owns when-issued securities, these values are included in "Payable for investments purchased" on the accompanying Statement of Assets and Liabilities and the segregated assets as identified in the Schedule of Portfolio Investments.
Loans:
Floating rate loans in which the Fund invests are primarily "senior" loans. Senior floating rate loans typically hold a senior position in the capital structure of the borrower, are typically secured by specific collateral, and have a claim on the assets and/or stock of the borrower that is senior to that held by subordinated debtholders and stockholders of the borrower. While these protections may reduce risk, these investments still present significant credit risk. A significant portion of the Fund's floating rate investments may be issued in connection with highly leveraged transactions such as leveraged buyouts, leveraged recapitalization loans, and other types of acquisition financing. Obligations in these types of transactions are subject to greater credit risk (including default and bankruptcy) than many other investments and may be, or become, illiquid. See note regarding below investment grade securities.
The Fund may purchase second lien loans (secured loans with a claim on collateral subordinate to a senior lender's claim on such collateral), fixed rate loans, unsecured loans, and other debt obligations.
Transactions in loans often settle on a delayed basis, and the Fund may not receive the proceeds from the sale of a loan or pay for a loan purchase for a substantial period of time after entering into the transactions.
Below Investment Grade Securities:
The Fund may invest in below investment grade securities (i.e. lower-quality, "junk" debt), which are subject to various risks. Lower-quality debt is considered to be speculative because it is less certain that the issuer will be able to pay interest or repay the principal than in the case of investment grade debt. These securities can involve a substantially greater risk of default than higher-rated securities, and their values can decline significantly over short periods of time. Lower-quality debt securities tend to be more sensitive to adverse news about their issuers, the market and the economy in general, than higher-quality debt securities. The market for these securities can be less liquid, especially during periods of recession or general market decline.
Investment Companies:
The Fund may invest in portfolios of open-end investment companies. These investment companies value securities in their portfolios for which market quotations are readily available at their market values (generally the last reported sale price) and all other securities and assets at their fair value by the methods established by the board of directors of the underlying funds.
Derivative Instruments:
Futures Contracts:
The Fund may enter into contracts for the future delivery of securities or foreign currencies and futures contracts based on a specific security, class of securities, foreign currency or an index, and purchase or sell options on any such futures contracts. A futures contract on a securities index is an agreement obligating either party to pay, and entitling the other party to receive, while the contract is outstanding, cash payments based on the level of a specified securities index. No physical delivery of the underlying asset is made. The Fund may enter into futures contracts in an effort to hedge against market risks. The acquisition of put and call options on futures contracts will give the Fund the right (but not the obligation), for a specified price, to sell or to purchase the underlying futures contract, upon exercise of the option, at any time during the option period. Futures transactions involve brokerage costs and require the Fund to segregate assets to cover contracts that would require it to purchase securities or currencies. A good faith margin deposit, known as initial margin, of cash or government securities with a broker or custodian is required to initiate and maintain open positions in futures contracts. Subsequent
22
Victory Variable Insurance Funds | | Notes to Financial Statements — continued
December 31, 2019 | |
payments, known as variation margin, are made or received by the Fund based on the change in the market value of the position and are recorded as unrealized appreciation or depreciation until the contract is closed out, at which time the gain or loss is realized. The Fund may lose the expected benefit of futures transactions if interest rates, exchange rates or securities prices change in an unanticipated manner. Such unanticipated changes may also result in lower overall performance than if the Fund had not entered into any futures transactions. In addition, the value of the Fund's futures positions may not prove to be perfectly or even highly correlated with the value of its portfolio securities or foreign currencies, limiting the Fund's ability to hedge effectively against interest rate, exchange rate and/or market risk and giving rise to additional risks. There is no assurance of liquidity in the secondary market for purposes of closing out futures positions. The collateral held by the Fund is presented on the Statement of Assets and Liabilities under Deposits with broker for futures contracts. As of December 31, 2019, the Fund entered into Futures Contracts primarily for the strategy of hedging or other purposes, including but not limited to, providing liquidity and equitizing cash.
Credit Derivatives:
The Fund may enter into credit derivatives, including centrally cleared credit default swaps on individual obligations or credit indices. The Fund may use these investments (i) as alternatives to direct long or short investment in a particular security or securities, (ii) to adjust the Fund's asset allocation or risk exposure, or (iii) for hedging purposes. The use by the Fund of credit default swaps may have the effect of creating a short position in a security. Credit derivatives can create investment leverage and may create additional investment risks that may subject the Fund to greater volatility than investments in more traditional securities, as described in the Fund's Statement of Additional Information.
Centrally cleared credit default swap ("CDS") agreements on credit indices involve one party making a stream of payments (referred to as the buyer of protection) to another party (the seller of protection) in exchange for the right to receive a specified return in the event of a write-down, principal shortfall, interest shortfall or default of all or part of the referenced entities comprising the credit index. A credit index is a basket of credit instruments or exposures designed to be representative of a specific sector of the credit market as a whole. These indices are made up of reference credits that are judged by a poll of dealers to be the most liquid entities in the CDS.
The counterparty risk for cleared swap agreements is generally lower than uncleared over-the-counter swap agreements because generally a clearing organization becomes substituted for each counterparty to a centrally cleared swap agreement and, in effect, guarantees each party's performance under the contract as each party to a trade looks only to the clearing organization for performance of financial obligations. However, there can be no assurance that the clearing organization, or its members, will satisfy its obligations to the Fund.
The Fund may enter into CDS agreements either as a buyer or seller. The Fund may buy protection under a CDS to attempt to mitigate the risk of default or credit quality deterioration in one or more individual holdings or in a segment of the fixed income securities market. The Fund may sell protection under a CDS in an attempt to gain exposure to an underlying issuer's credit quality characteristics without investing directly in that issuer. For swaps entered with an individual counterparty, the Fund bears the risk of loss of the uncollateralized amount expected to be received under a CDS agreement in the event of the default or bankruptcy of the counterparty. CDS agreements are generally valued at a price at which the counterparty to such agreement would terminate the agreement. The Fund may also enter into cleared swaps.
Upon entering into a cleared CDS, the Fund may be required to deposit with the broker an amount of cash or cash equivalents in the range of approximately 3% to 6% of the notional amount for CDS on high yield debt issuers (this amount is subject to change by the clearing organization that clears the trade). This amount, known as "initial margin," is in the nature of a performance bond or good faith deposit on the CDS and is returned to a Fund upon termination of the CDS, assuming all contractual obligations have been satisfied. Subsequent payments, known as "variation margin," to and from the broker will be made daily as the price of the CDS fluctuates, making the long and short positions in the
23
Victory Variable Insurance Funds | | Notes to Financial Statements — continued
December 31, 2019 | |
CDS contract more or less valuable, a process known as "marking-to-market." The premium (discount) payments are built into the daily price of the CDS and thus are amortized through the variation margin. The variation margin payment also includes the daily portion of the periodic payment stream.
The maximum potential amount of future payments (undiscounted) that the Fund as a seller of protection could be required to make under a CDS agreement equals the notional amount of the agreement. Notional amounts of each individual CDS agreement outstanding as of period end for which the Fund is the seller of protection are disclosed on the Schedule of Portfolio Investments. These potential amounts would be partially offset by any recovery values of the respective referenced obligations, upfront payments received upon entering into the agreement, periodic interest payments, or net amounts received from the settlement of buy protection CDS agreements entered into by the Fund for the same referenced entity or entities.
As of December 31, 2019, the Fund entered into centrally cleared CDS agreements primarily for the strategy of asset allocation and risk exposure management.
Offsetting of Financial Assets and Derivatives Assets:
The Fund is subject to various Master Netting Arrangements, which govern the terms of certain transactions with select counterparties. The Master Netting Arrangements allow the Fund to close out and net total exposure to a counterparty in the event of a default with respect to all the transactions governed under a single agreement with a counterparty. The Master Netting Arrangements also specify collateral posting arrangements at pre-arranged exposure levels. Under the Master Netting Arrangements, collateral is routinely transferred if the total net exposure to certain transactions (net of existing collateral already in place) governed under the relevant Master Netting Arrangement with a counterparty in a given account exceeds a specified threshold depending on the counterparty and the type of Master Netting Arrangement.
The table below, as of December 31, 2019, discloses both gross information and net information about instruments and transactions eligible for offset in the Statement of Assets and Liabilities and instruments and transactions that are subject to an agreement similar to a master netting agreement as well as amounts related to collateral held at clearing brokers and counterparties.
| | | Gross
Amounts of
Recognized
Assets | | Gross
Amounts
Available
for Offset | | Net Amount
Presented in the
Statement of
Assets and
Liabilities | | Cash
Collateral
Received | | Net Amount | |
Futures Contracts-Goldman
Sachs & Co. | | $ | 24,445 | | | $ | — | | | $ | 24,445 | | | $ | — | | | $ | 24,445 | | |
Summary of Derivative Instruments:
The following table presents the effect of derivative instruments on the Statement of Assets and Liabilities, categorized by risk exposure, as of December 31, 2019.
| | | Assets | | Liabilities | |
| | | Variation
Margin
Receivable on
Open Futures
Contracts* | | Variation
Margin
Receivable on
Open Swap
Agreements* | | Variation
Margin
Payable on
Open Futures
Contracts* | | Variation
Margin
Payable on
Open Swap
Agreements* | |
Credit Risk Exposure | | $ | — | | | $ | 114,772 | | | $ | — | | | $ | — | | |
Interest Rate Risk Exposure | | | 74,161 | | | | — | | | | 70,757 | | | | — | | |
*Includes cumulative appreciation/depreciation of futures contracts and credit default swap agreements as reported on the Schedule of Portfolio Investments. Only current day's variation margin for both futures contracts and credit default swap agreements are reported within the Statement of Assets and Liabilities.
24
Victory Variable Insurance Funds | | Notes to Financial Statements — continued
December 31, 2019 | |
The following table presents the effect of derivative instruments on the Statement of Operations, categorized by risk exposure, for the year ended December 31, 2019.
| | Net Realized Gains (Losses) on
Derivatives Recognized as
a Result from Operations | | Net Change in Unrealized
Appreciation/Depreciation
on Derivatives Recognized
as a Result of Operations | |
| | Net Realized
Gains (Losses)
from Futures
Contracts | | Net Realized
Gains (Losses)
from Swap
Agreements | | Net Change in
Unrealized
Appreciation/
Depreciation
on Futures
Contracts | | Net Change in
Unrealized
Appreciation/
Depreciation
on Swap
Agreements | |
Credit Risk Exposure | | $ | — | | | $ | (1,859,807 | ) | | $ | — | | | $ | 1,597,266 | | |
Interest Rate Risk Exposure | | | 382,956 | | | | — | | | | (690,127 | ) | | | — | | |
All open derivative positions at period end are reflected on the Fund's Schedule of Portfolio Investments. The volume associated with derivative positions in the Fund was 36% based on average monthly notional amounts in comparison to net assets during the year ended December 31, 2019.
Investment Transactions and Related Income:
Changes in holdings of investments are accounted for no later than one business day following the trade date. For financial reporting purposes, however, investment transactions are accounted for on trade date on the last business day of the reporting period. Interest income is determined on the basis of coupon interest accrued using the effective interest method which adjusts, where applicable, the amortization of premiums or accretion of discounts. Dividend income is recorded on the ex-dividend date. Gains or losses realized on sales of securities are determined by comparing the identified cost of the security lot sold with the net sales proceeds. Paydown gains or losses on applicable securities, if any, are recorded as components of interest income on the Statement of Operations.
The Fund may receive other income from investment in loan assignments and/or unfunded commitments, including amendment fees, consent fees and commitment fees. These fees are recorded as income when received by the Fund. These amounts are included in Interest Income in the Statement of Operations.
Withholding taxes on interest, dividends and gains as a result of certain investments in ADRs by the Fund have been provided for in accordance with each investment's applicable country's tax rules and rates.
Securities Lending:
The Trust has entered into a Master Securities Lending Agreement ("MSLA") with Citibank, N.A. ("Citibank" or the "Agent"). Under the terms of the MSLA, the Fund may lend securities to certain broker-dealers and banks in exchange for collateral in the amount of at least 102% of the value of U.S. securities loaned or at least 105% of the value of non-U.S. securities loaned, marked-to-market daily. Any collateral shortfalls associated with increases in the valuation of the securities loaned are adjusted the next business day. The collateral can be received in the form of cash collateral and/or non-cash collateral. Non-cash collateral can include U.S. Government Securities, letters of credit and certificates of deposit. The cash collateral is invested in short-term instruments or cash equivalents as noted on the Fund's Schedule of Portfolio Investments. The Trust does not have effective control of the non-cash collateral and therefore it is not disclosed in the Fund's Schedule of Portfolio Investments. The Fund continues to benefit from interest or dividends on the securities loaned and may also earn a return from the collateral. The Fund pays various fees in connection with the investment of cash collateral. The Fund pays the Agent fees based on the investment income received from securities lending activities. Securities lending income is disclosed in the Fund's Statement of Operations. Although risk is mitigated by the collateral, the Fund could experience a delay in recovering its securities and possible loss of income or value if the borrower fails to return them.
25
Victory Variable Insurance Funds | | Notes to Financial Statements — continued
December 31, 2019 | |
Securities lending transactions are entered into by the Fund under the MSLA, which permits the Fund, under certain circumstances such as an event of default, to offset amounts payable by the Fund to the same counterparty against amounts receivable from the counterparty to create a net payment due to or from the Fund.
The following table is a summary of the Fund's securities lending transactions which are subject to offset under the MSLA as of December 31, 2019. These transactions are accounted for as secured borrowings with an overnight and continuous contractual maturity for cash collateral, and greater than overnight and continuous contractual maturity for non-cash collateral.
Gross
Amount of
Recognized
Assets
(Value of | | Value of
Cash | | Value of Non-cash Collateral
Received by Maturity | | | |
Securities
on Loan) | | Collateral
Received* | | <30 Days | | Between 30 &
90 days | | >90 Days | | Net Amount | |
| $ | 639,947 | | | $ | 639,947 | | | $ | — | | | $ | — | | | $ | — | | | $ | — | | |
* Collateral received in excess of the market value of securities on loan is not presented in this table. The total cash collateral received by the Fund is disclosed in the Statement of Assets and Liabilities.
Distributions to Shareholders:
Dividends from net investment income, if any, are declared and paid annually by the Fund. Distributable net realized gains, if any, are declared and distributed at least annually.
The amounts of dividends from net investment income and distributions from net realized gains are determined in accordance with federal income tax regulations, which may differ from GAAP. To the extent these "book/tax" differences are permanent in nature (e.g., net operating loss and distributions reclassification), such amounts are reclassified within the components of net assets based on their federal tax-basis treatment; temporary differences (e.g., wash sales) do not require reclassification. To the extent dividends and distributions exceed net investment income and net realized gains for tax purposes, they are reported as distributions of capital. Net investment losses incurred by the Fund may be reclassified as an offset to capital on the accompanying Statement of Assets and Liabilities.
As of December 31, 2019 on the Statement of Assets and Liabilities, there were no permanent book-to-tax difference reclassification adjustments.
Federal Income Taxes:
It is the policy of the Fund to continue to qualify as a regulated investment company by complying with the provisions available to certain investment companies, as defined in applicable sections of the Internal Revenue Code, and to make distributions of net investment income and net realized gains sufficient to relieve it from all, or substantially all, federal income taxes. Accordingly, no provision for federal income taxes is required in the financial statements. The Fund has a tax year end of December 31.
Management of the Fund has reviewed tax positions taken in tax years that remain subject to examination by all major tax jurisdictions, including federal (i.e., all open tax years and the interim tax period since then). Management believes that there is no tax liability resulting from unrecognized tax benefits related to uncertain tax positions taken.
Allocations:
Expenses directly attributable to the Fund are charged to the Fund, while expenses which are attributable to more than one fund in the Trust, or jointly with an affiliated trust, are allocated among the respective funds in the Trust and/or affiliated trust based upon net assets or another appropriate basis.
26
Victory Variable Insurance Funds | | Notes to Financial Statements — continued
December 31, 2019 | |
Cross-Trade Transactions:
Pursuant to Rule 17a-7 under the 1940 Act, the Fund may engage in cross-trades which are securities transactions with affiliated investment companies and advisory accounts managed by the Adviser and any applicable sub-adviser. Any such purchase or sale transaction must be effected without brokerage commission or other remuneration, except for customary transfer fees. The transaction must be effected at the current market price, which is either the security's last sale price on an exchange or, if there are no transactions in the security that day, at the average of the highest bid and lowest asked price. For the year ended December 31, 2019, the Fund did not engage in any Rule 17a-7 transactions under the 1940 Act.
3. Purchases and Sales of Securities:
Purchases and sales of securities (excluding securities maturing less than one year from acquisition) for the year ended December 31, 2019 were as follows for the Fund:
Purchases
(excluding U.S.
Government
Securities) | | Sales
(excluding U.S.
Government
Securities) | | Purchases
of U.S.
Government
Securities | | Sales
of U.S.
Government
Securities | |
| $ | 53,686,786 | | | $ | 108,766,726 | | | $ | 109,621,132 | | | $ | 59,364,623 | | |
4. Fees and Transactions with Affiliates and Related Parties:
Investment advisory services are provided to the Fund by Victory Capital Management Inc. ("VCM" or the "Adviser"), a New York corporation registered as an investment adviser with the Securities and Exchange Commission ("SEC"). The Adviser is a wholly owned indirect subsidiary of Victory Capital Holdings, Inc., a publicly traded Delaware corporation, and a wholly owned direct subsidiary of Victory Capital Operating, LLC.
Under the terms of the Investment Advisory Agreement, the Adviser is entitled to receive 0.45% of the average daily net assets of the Fund. The Adviser may use its resources to assist with the Fund's distribution and marketing expenses.
VCM also serves as the Fund's administrator and fund accountant. Under an Administration and Fund Accounting Agreement, VCM is paid for its services an annual fee at a rate of 0.08% of the first $15 billion in average daily net assets of the Trust, Victory Portfolios and Victory Portfolios II (collectively, the "Victory Funds Complex"), 0.05% of the average daily net assets above $15 billion to $30 billion of the Victory Funds Complex and 0.04% of the average daily net assets over $30 billion of the Victory Funds Complex.
Citi Fund Services Ohio, Inc. ("Citi"), an affiliate of Citibank, acts as sub-administrator and sub-fund accountant to the Fund pursuant to a Sub-Administration and Sub-Fund Accounting Services Agreement between VCM and Citi. VCM pays Citi a fee for providing these services. The Trust reimburses VCM and Citi for all of their reasonable out-of-pocket expenses incurred in providing these services.
FIS Investor Services, LLC ("FIS") serves as the Fund's transfer agent. Under the Transfer Agent Agreement, the Trust pays FIS a fee for its services and reimburses FIS for all of their reasonable out-of-pocket expenses incurred in providing these services.
The Chief Compliance Officer ("CCO") is an employee of the Adviser, which pays the compensation of the CCO and his support staff. The Trust has entered into an Agreement to provide compliance services with the Adviser, pursuant to which the Adviser furnishes its compliance personnel, including the services of the CCO, and other resources reasonably necessary to provide the Trust with compliance oversight services related to the design, administration and oversight of a compliance program for the Trust in accordance with Rule 38a-1 under the 1940 Act. The Funds in the Victory Funds Complex, in aggregate, compensate the Adviser for these services.
The Victory Funds Complex pays an annual retainer to each Independent Trustee, plus an additional annual retainer to the Chairman of the Board. The aggregate amount of the fees and expenses of the
27
Victory Variable Insurance Funds | | Notes to Financial Statements — continued
December 31, 2019 | |
Independent Trustees are allocated amongst all the funds in the Victory Funds Complex and are presented in the Statement of Operations.
Shearman & Sterling LLP provides legal services to the Trust.
Victory Capital Advisers, Inc. (the "Distributor"), an affiliate of the Adviser, serves as distributor for the continuous offering of the shares of the Fund pursuant to a Distribution Agreement between the Distributor and the Trust.
The Adviser has entered into an expense limitation agreement with the Fund until at least April 30, 2020. Under the terms of the agreement, the Adviser has agreed to waive fees or reimburse certain expenses to the extent that ordinary operating expenses incurred by the Fund in any fiscal year exceed the expense limit for the Fund. Such excess amounts will be the liability of the Adviser. Interest, taxes, brokerage commissions, other expenditures which are capitalized in accordance with GAAP, and other extraordinary expenses not incurred in the ordinary course of a Fund's business are excluded from the expense limits. As of December 31, 2019, the expense limit (excluding voluntary waivers) is 0.53%.
The Fund has agreed to repay fees and expenses that were waived or reimbursed by the Adviser for a period up to three fiscal years after such waiver or reimbursement was made to the extent such payments or repayments would not cause the expenses to exceed the original expense limitation in place at time of the waiver or reimbursement or any expense limitation agreement in place at the time of repayment. As of December 31, 2019, the following amounts are available to be repaid to the Adviser. Amounts repaid to the Adviser during the year ended, if any, are reflected on the Statement of Operations as "Recoupment of prior expenses waived/reimbursed by Adviser".
Expires
December 31,
2020 | | Expires
December 31,
2021 | | Expires
December 31,
2022 | | Total | |
| $ | 132,033 | | | $ | 155,683 | | | $ | 459,668 | | | $ | 747,384 | | |
The Adviser may voluntarily waive or reimburse additional fees to assist the Fund in maintaining a competitive expense ratio. Voluntary waivers and reimbursements applicable to the Fund are not available to be recouped at a future time. There were no voluntary waivers or reimbursements for the year ended December 31, 2019.
Certain officers and/or interested trustees of the Fund are also officers and/or employees of the Adviser, Administrator, Fund Accountant, Sub-Administrator, Sub-Fund Accountant and Legal Counsel.
5. Risks:
The Fund may be subject to other risks in addition to these identified risks.
An investment in the Fund's shares represents an indirect investment in the securities owned by the Fund, some of which will be traded on a national securities exchange or in the over-the-counter markets. The value of the securities in which the Fund invests, like other market investments, may move up or down, sometimes rapidly and unpredictably. The value of the securities in which the Fund invests may affect the value of the Fund's shares. An investment in the Fund's shares at any point in time may be worth less than the original investment, even after taking into account the reinvestment of the Fund's distributions.
The Fund will be subject to credit risk with respect to the amount it expects to receive from counterparties for financial instruments entered into by the Fund. The Fund may be negatively impacted if a counterparty becomes bankrupt or otherwise fails to perform its obligations due to financial difficulties. The Fund may experience significant delays in obtaining any recovery in bankruptcy or other reorganization proceeding and the Fund may obtain only limited recovery or may obtain no recovery in such circumstances. The Fund typically enters into transactions with counterparties whose credit ratings are investment grade, as determined by a nationally recognized statistical rating organization or, if unrated, judged by the Adviser to be of comparable quality.
28
Victory Variable Insurance Funds | | Notes to Financial Statements — continued
December 31, 2019 | |
6. Borrowing and Interfund Lending:
Line of Credit:
For the year ended December 31, 2019, the Victory Funds Complex participated in a short-term, demand note "Line of Credit" with Citibank. Under the agreement with Citibank, for the period January 1, 2019 to June 30, 2019, the Victory Funds Complex could borrow up to $250 million, of which $100 million was committed and $150 million was uncommitted. Effective July 1, 2019, the agreement was amended to include the USAA Mutual Funds Complex (another series of mutual funds managed by the Adviser) and has a new termination date of June 29, 2020. Under this amended agreement, the Victory Funds Complex and USAA Mutual Funds Complex, combined, may borrow up to $600 million, of which $300 million is committed and $300 million is uncommitted. $40 million of the Line of Credit is reserved for use by the Victory Floating Rate Fund (herein, the "Fund"), another series of the Victory Funds Complex, with that Fund paying the related commitment fees for that amount. The purpose of the agreement is to meet temporary or emergency cash needs, including redemption requests that might otherwise require the untimely disposition of securities. With the agreement in effect for the period January 1, 2019 to June 30, 2019, Citibank received an annual commitment fee of 0.15% on $100 million for providing the Line of Credit. For the period July 1, 2019 to December 31, 2019, Citibank received an annual commitment fee of 0.15% on $300 million for providing the Line of Credit. For the year ended December 31, 2019, Citibank earned approximately $300 thousand in commitment fees from the combined Victory Funds Complex and USAA Mutual Funds Complex. Each fund in the Victory Funds Complex and the USAA Mutual Funds Complex pays a pro-rata portion of the commitment fees plus any interest (one month LIBOR plus one percent) on amounts borrowed. Interest charged to the Fund during the period, if applicable, is presented on the Statement of Operations under Line of credit fees.
The Fund did not utilize the Line of Credit during the year ended December 31, 2019.
Interfund Lending:
The Trust and Adviser rely on an exemptive order granted by the SEC in March 2017 (the "Order"), permitting the establishment and operation of an Interfund Lending Facility (the "Facility"). The Facility allows the Fund to directly lend and borrow money to or from any other Victory Fund relying upon the Order at rates beneficial to both the borrowing and lending funds. Advances under the Facility are allowed for temporary or emergency purposes, including the meeting of redemption requests that otherwise might require the untimely disposition of securities, and are subject to each fund's borrowing restrictions. The interfund loan rate is determined, as specified in the Order, by averaging the current repurchase agreement rate and the current bank loan rate. As a Borrower, interest charged to the Fund during the period, if applicable, is presented on the Statement of Operations under Interfund lending fees. As a Lender, interest earned by the Fund during the period, if applicable, is presented on the Statement of Operations under Income on interfund lending.
The Fund did not utilize the Facility during the year ended December 31, 2019.
7. Federal Income Tax Information:
The tax character of distributions paid during the most recent tax years ended, as noted below, were as follows (total distributions paid may differ from the Statements of Changes in Net Assets because, for tax purposes, dividends are recognized when actually paid).
| | | Year Ended December 31, 2019 | |
| | | Distributions paid from | |
| | Ordinary
Income | | Net
Long-Term
Capital Gains | | Total
Distributions
Paid | |
| | | | | $ | 5,011,793 | | | $ | — | | | $ | 5,011,793 | | |
29
Victory Variable Insurance Funds | | Notes to Financial Statements — continued
December 31, 2019 | |
| | | Year Ended December 31, 2018 | |
| | | Distributions paid from | |
| | | Ordinary
Income | | Net
Long-Term
Capital Gains | | Total
Distributions
Paid | |
| | | | | $ | 1,374,412 | | | $ | — | | | $ | 1,374,412 | | |
As of the tax year ended December 31, 2019, the components of distributable earnings/accumulated deficit on a tax basis were as follows:
Undistributed
Ordinary
Income | | Undistributed
Long-Term
Capital Gains | | Accumulated
Earnings | | Accumulated
Capital and
Other
Losses | | Unrealized
Appreciation
(Depreciation) | | Total
Accumulated
Earnings
(Deficit) | |
| $ | 6,215,649 | | | $ | — | | | $ | 6,215,649 | | | $ | (5,898,311 | ) | | $ | 1,325,485 | | | $ | 1,642,823 | | |
As of the tax year ended December 31, 2019, the Fund had short-term and long-term capital loss carryforwards of $1,664,163 and $4,234,148, respectively, that are not subject to expiration.
During the tax year ended December 31, 2019, the Fund did not utilize capital loss carryforwards.
As of December 31, 2019, the cost basis for federal income tax purposes, gross unrealized appreciation, gross unrealized depreciation and net unrealized appreciation (depreciation) for investments and derivatives were as follows:
Cost of
Investments
for Federal
Tax Purposes | | Gross
Unrealized
Appreciation | | Gross
Unrealized
Depreciation | | Net
Unrealized
Appreciation
(Depreciation) | |
| $ | 247,889,221 | | | $ | 1,742,694 | | | $ | (417,209 | ) | | $ | 1,325,485 | | |
8. Capital Contribution from Prior Custodian:
During 2016, the Fund received notification from the Fund's prior custodian, State Street Bank and Trust ("State Street"), concerning issues related to billing on certain categories of expenses during the approximately 16-year period from 1998 through October 31, 2014. The over-billing primarily related to categories of expenses that involved an allocation of general costs among multiple clients.
State Street paid the refunded amounts during January 2017. Based on billing information received during 2016 from State Street and an analysis of any expense limitation agreements that were in place during the period of the activities in question, including the application of any recoupment provisions in such agreements, the Adviser received a portion of the refund.
The portion of the refund retained by the Fund was accounted for as a capital contribution and is reflected on the Financial Highlights as "Capital Contribution from Prior Custodian, Net".
9. Fund Ownership:
Ownership of more than 25% of the voting securities of a fund creates presumptions of control of the Fund, under section 2(a)(9) of the 1940 Act. As of December 31, 2019, the shareholder listed below held more than 25% of the shares outstanding of the Fund and may be deemed to control the Fund.
| Shareholder | | Percent | |
| GIAC | | | 100.0 | % | |
30
Victory Variable Insurance Funds | | Notes to Financial Statements — continued
December 31, 2019 | |
10. Recent Accounting Pronouncements:
In March 2017, the Financial Accounting Standards Board ("FASB") issued Accounting Standards ("ASU") Update No. 2017-08 "Premium Amortization on Purchased Callable Debt Securities" ("ASU 2017-08"), which shortens the premium amortization period for purchased non-contingently callable debt securities. ASU 2017-08 specifies that the premium amortization period ends at the earliest call date, for purchased non-contingently callable debt securities. The Fund has adopted and applied ASU 2017-08 on a modified retrospective basis through a cumulative-effect adjustment as of the beginning of the period of adoption. The adoption of ASU 2017-08 had no material impact on information presented in the financial statements.
11. Subsequent Events:
The Fund has evaluated the need for additional disclosures or adjustments resulting from subsequent events through the date these financial statements were issued. Based on this evaluation, there were no subsequent events to report that would have a material impact on the Fund's financial statements.
31
REPORT OF INDEPENDENT REGISTERED PUBLIC ACCOUNTING FIRM
To the Shareholders and Board of Trustees of Victory Variable Insurance Funds
Opinion on the Financial Statements
We have audited the accompanying statement of assets and liabilities, including the schedule of portfolio investments, of Victory INCORE Low Duration Bond VIP Series (the "Fund"), a series of Victory Variable Insurance Funds, as of December 31, 2019, the related statements of operations and changes in net assets, including the related notes, and the financial highlights for the year then ended (collectively referred to as the "financial statements"). In our opinion, the financial statements present fairly, in all material respects, the financial position of the Fund as of December 31, 2019, the results of its operations, the changes in its net assets, and the financial highlights for the year then ended, in conformity with accounting principles generally accepted in the United States of America.
The Fund's financial statements and financial highlights for the three years ended December 31, 2018, were audited by other auditors whose report dated February 15, 2019 and the Fund's financial highlights for the year ended December 31, 2015, were audited by other auditors whose report dated February 22, 2016, expressed unqualified opinions on those financial statements and financial highlights.
Basis for Opinion
These financial statements are the responsibility of the Fund's management. Our responsibility is to express an opinion on the Fund's financial statements based on our audit. We are a public accounting firm registered with the Public Company Accounting Oversight Board (United States) ("PCAOB") and are required to be independent with respect to the Fund in accordance with the U.S. federal securities laws and the applicable rules and regulations of the Securities and Exchange Commission and the PCAOB.
We conducted our audit in accordance with the standards of the PCAOB. Those standards require that we plan and perform the audit to obtain reasonable assurance about whether the financial statements are free of material misstatement whether due to error or fraud.
Our audit included performing procedures to assess the risks of material misstatement of the financial statements, whether due to error or fraud, and performing procedures that respond to those risks. Such procedures included examining, on a test basis, evidence regarding the amounts and disclosures in the financial statements. Our procedures included confirmation of securities owned as of December 31, 2019, by correspondence with the custodian and brokers. Our audit also included evaluating the accounting principles used and significant estimates made by management, as well as evaluating the overall presentation of the financial statements. We believe that our audit provides a reasonable basis for our opinion.
We have served as the auditor of one or more of the investment companies advised by Victory Capital Management, Inc. since 2015.

COHEN & COMPANY, LTD.
Cleveland, Ohio
February 18, 2020
32
Victory Variable Insurance Funds | | Supplemental Information
December 31, 2019 | |
(Unaudited)
Trustee and Officer Information
Board of Trustees:
Overall responsibility for management of the Trust rests with the Board. The Trust is managed by the Board in accordance with the laws of the State of Delaware. There are currently ten Trustees, nine of whom are not "interested persons" of the Trust within the meaning of that term under the 1940 Act ("Independent Trustees") and one of whom is an "interested person" of the Trust within the meaning of that term under the 1940 Act ("Interested Trustee"). The Trustees, in turn, elect the officers of the Trust to actively supervise its day-to-day operations.
The following tables list the Trustees, their ages, position with the Trust, commencement of service, principal occupations during the past five years and any directorships of other investment companies or companies whose securities are registered under the Securities Exchange Act of 1934, as amended, or who file reports under that Act. Each Trustee oversees nine portfolios in the Trust, 42 portfolios in Victory Portfolios and 26 portfolios in Victory Portfolios II, each a registered investment company that, together with the Trust, comprise the Victory Funds Complex. Each Trustee's address is c/o Victory Variable Insurance Funds, 4900 Tiedeman Road, 4th Floor, Brooklyn, Ohio 44144. Each Trustee has an indefinite term.
Name and Age | | Position
Held with
the Trust | | Date
Commenced
Service | | Principal Occupation
During Past 5 Years | | Other
Directorships
Held During
Past 5 Years | |
Independent Trustees. | |
David Brooks Adcock, 68 | | Trustee | | February 2005 | | Consultant (since 2006). | | Chair and Trustee, Turner Funds (December 2016-December 2017). | |
Nigel D.T. Andrews, 72 | | Vice Chair and Trustee | | August 2002 | | Retired. | | Director, TCG BDC II, Inc. (since 2017);
Director, TCG BDC I, Inc. (formerly Carlyle GMS Finance, Inc.) (since 2012); Director, Old Mutual US Asset Management (2002-2014). | |
E. Lee Beard, 68* | | Trustee | | February 2005 | | Retired (since 2015); Consultant, The Henlee Group, LLC (consulting) (2005-2015). | | None. | |
Dennis M. Bushe, 76 | | Trustee | | July 2016 | | Retired. | | Trustee, RS Investment Trust and RS Variable Products Trust (November 2011-July 2016). | |
33
Victory Variable Insurance Funds | | Supplemental Information — continued
December 31, 2019 | |
(Unaudited)
Name and Age | | Position
Held with
the Trust | | Date
Commenced
Service | | Principal Occupation
During Past 5 Years | | Other
Directorships
Held During
Past 5 Years | |
Sally M. Dungan, 65 | | Trustee | | February 2011 | | Chief Investment Officer, Tufts University (since 2002). | | None. | |
John L. Kelly, 66 | | Trustee | | February 2015 | | Partner, McCarvill Capital Partners (September 2016-September 2017); Advisor, Endgate Commodities LLC (January 2016-April 2016); Managing Partner, Endgate Commodities LLC (August 2014-January 2016); Chief Operating Officer, Liquidnet Holdings, Inc. (December 2011-July 2014). | | Director, Caledonia Mining Corporation (since May 2012). | |
David L. Meyer, 62* | | Trustee | | December 2008 | | Retired. | | None. | |
Gloria S. Nelund, 58 | | Trustee | | July 2016 | | Chair, CEO and Co-Founder of TriLinc Global, LLC, an investment firm. | | TriLinc Global Impact Fund, LLC (since 2012); Trustee, RS Investment Trust and RS Variable Products Trust (November 2007-July 2016). | |
Leigh A. Wilson, 75 | | Chair and Trustee | | February 1998 | | Private Investor. | | Chair (since 2013), Caledonia Mining Corporation. | |
Interested Trustee. | |
David C. Brown, 47** | | Trustee | | May 2008 | | Chairman and Chief Executive Officer (since 2013), Co-Chief Executive Officer (2011- 2013), the Adviser; Chairman and Chief Executive Officer, Victory Capital Holdings, Inc. (since 2013). | | USAA Mutual Funds Trust. | |
* The Board has designated Mr. Meyer and Ms. Beard as its Audit Committee Financial Experts.
** Mr. Brown is an "Interested Person" by reason of his relationship with the Adviser.
The Statement of Additional Information includes additional information about the Trustees of the Trust and is available, without charge, by calling 800-539-3863.
34
Victory Variable Insurance Funds | | Supplemental Information — continued
December 31, 2019 | |
(Unaudited)
Officers:
The officers of the Trust, their ages, commencement of service and their principal occupations during the past five years, are detailed in the following table. Each officer serves until the earlier of his or her resignation, removal, retirement, death, or the election of a successor. The mailing address of each officer of the Trust is 4900 Tiedeman Road, 4th Floor, Brooklyn, Ohio 44144. The officers of the Trust receive no compensation directly from the Trust for performing the duties of their offices.
Name and Age | | Position with
the Trust | | Date
Commenced
Service | | Principal Occupation During Past 5 Years | |
Christopher K. Dyer, 58 | | President | | February 2006* | | Director of Fund Administration, the Adviser. | |
Scott A. Stahorsky, 50 | | Vice President | | December 2014 | | Manager, Fund Administration, the Adviser (since 2015); Senior Analyst, Fund Administration, the Adviser (prior to 2015). | |
Erin G. Wagner, 46 | | Secretary | | December 2014 | | Associate General Counsel, the Adviser (since 2013). | |
Allan Shaer, 54 | | Treasurer | | May 2017 | | Senior Vice President, Financial Administration, Citi Fund Services Ohio, Inc. (since 2016); Vice President, Mutual Fund Administration, JP Morgan Chase (2011-2016). | |
Christopher A. Ponte, 35 | | Assistant Treasurer | | December 2017 | | Manager, Fund Administration, the Adviser (since 2017); Senior Analyst, Fund Administration, the Adviser (prior to 2017); Chief Financial Officer, Victory Capital Advisers, Inc. (since 2018). | |
Colin Kinney, 46 | | Chief Compliance Officer | | July 2017 | | Chief Compliance Officer (since 2013) and Chief Risk Officer (2009-2017), the Adviser. | |
Chuck Booth, 59 | | Anti-Money Laundering Compliance Officer and Identity Theft Officer | | May 2015 | | Director, Regulatory Administration and CCO Support Services, Citi Fund Services Ohio, Inc. | |
Jay G. Baris, 66 | | Assistant Secretary | | February 1998 | | Partner, Shearman & Sterling LLP (since 2018); Partner, Morrison & Foerster LLP (2011-January 2018). | |
* On December 3, 2014, Mr. Dyer resigned as Secretary of the Trust and accepted the position of President.
35
Victory Variable Insurance Funds | | Supplemental Information — continued
December 31, 2019 | |
(Unaudited)
Proxy Voting and Portfolio Holdings Information
Proxy Voting:
Information regarding the policies and procedures the Fund uses to determine how to vote proxies relating to portfolio securities is available without charge, upon request, by calling 800-539-3863. The information is also included in the Fund's Statement of Additional Information, which is available on the SEC's website at www.sec.gov.
Information relating to how the Fund voted proxies relating to portfolio securities held during the most recent twelve months ended June 30 is available on the SEC's website at www.sec.gov.
Availability of Schedules of Portfolio Investments:
The Trust files a complete list of Schedules of Portfolio Investments with the SEC for the first and third quarters of each fiscal year on Form N-PORT. Prior to the implementation of Form N-PORT, the Trust filed a complete list of Schedules of Portfolio Investments with the SEC for the first and third quarters of each fiscal year on Form N-Q. Forms N-PORT and Forms N-Q are available on the SEC's website at www.sec.gov.
Expense Examples
As a shareholder of the Fund, you may incur two types of costs: (1) transaction costs and (2) ongoing costs, including management fees, distribution and service (12b-1) fees, and other Fund expenses. These examples are intended to help you understand your ongoing costs (in dollars) of investing in the Fund and to compare these costs with the ongoing costs of investing in other mutual funds.
These examples are based on an investment of $1,000 invested at the beginning of the period and held for the entire period from July 1, 2019 through December 31, 2019.
The Actual Expense figures in the table below provide information about actual account values and actual expenses. You may use the information below, together with the amount you invested, to estimate the expenses that you paid over the period. Simply divide your account value by $1,000 (for example, an $8,600 account value divided by $1,000 = 8.6), then multiply the result by the number in the table under the heading entitled "Actual Expenses Paid During Period" to estimate the expenses you paid on your account during this period.
The Hypothetical Expense figures in the table below provide information about hypothetical account values and hypothetical expenses based on the Fund's actual expense ratio and an assumed rate of return of 5% per year before expenses, which is not the Fund's actual return. The hypothetical account values and expenses may not be used to estimate the actual ending account balance or expenses you paid for the period. You may use this information to compare this 5% hypothetical example with the 5% hypothetical examples that appear in shareholder reports of other funds.
Please note the expenses shown in the table are meant to highlight your ongoing costs only and do not reflect any transactional costs. Therefore, the table is useful in comparing ongoing costs only, and will not help you determine the relative total costs of owning different funds. In addition, if these transactional costs were included, your costs would have been higher.
Beginning
Account Value
7/1/19 | | Actual
Ending
Account Value
12/31/19 | | Hypothetical
Ending
Account Value
12/31/19 | | Actual
Expenses Paid
During Period
7/1/19-12/31/19* | | Hypothetical
Expenses Paid
During Period
7/1/19-12/31/19* | | Annualized
Expense Ratio
During Period
7/1/19-12/31/19 | |
$ | 1,000.00 | | | $ | 1,012.30 | | | $ | 1,022.53 | | | $ | 2.69 | | | $ | 2.70 | | | | 0.53 | % | |
* Expenses are equal to the average account value multiplied by the Fund's annualized expense ratio multiplied by 184/365 (the number of days in the most recent fiscal half-year divided by the number of days in the fiscal year).
36
Victory Variable Insurance Funds | | Supplemental Information — continued
December 31, 2019 | |
(Unaudited)
Considerations of the Board in Continuing the Investment Advisory Agreement (the "Agreement")
The Board approved the Agreement on behalf of the Fund at an in-person meeting, which was called for that purpose, on December 4, 2019. The Board also considered information relating to the Fund and the Agreement provided throughout the year and, more specifically, at a meeting on October 22, 2019. The Board noted that prior to the Fund's reorganization on July 29, 2016, the Fund was managed by RS Investment Management Co. LLC, which was acquired by the Adviser on July 29, 2016. In considering whether to approve the Agreement, the Board requested, and the Adviser provided, information that the Board believed to be reasonably necessary to reach its conclusions.
The Board, including the Independent Trustees, evaluated this information along with other information obtained throughout the year and was advised by legal counsel to the Fund, which also serves as independent legal counsel to the Independent Trustees. In addition, in 2017 the Independent Trustees, through their counsel, retained an independent consultant to assist with a review of the overall process for conducting the annual review of these advisory arrangements.
The Board considered the Fund's advisory fee, expense ratio and investment performance as significant factors in determining whether the Agreement should be continued. In considering whether the compensation paid to the Adviser was fair and reasonable, the Board also evaluated, among other things, the following factors:
• The requirements of the Fund for the services provided by the Adviser;
• The nature, quality and extent of the services provided and expected to be provided;
• The performance of the Fund as compared to comparable funds;
• The fees payable for the services and whether the fee arrangements provided for economies of scale that would benefit Fund shareholders as the Fund grows;
• Whether the fee would be sufficient to enable the Adviser to attract and retain experienced personnel and continue to provide quality services to the Fund;
• The fees paid by other clients of the Adviser whose accounts are managed in a similar investment style and any differences in the services provided to the other clients compared to those provided to the Fund;
• The total expenses of the Fund, taking into consideration any distribution or shareholder servicing fees;
• Management's commitment to operating the Fund at competitive expense levels;
• The profitability of the Adviser (as reflected by comparing fees earned against an estimate of the Adviser's costs) with respect to the Adviser's relationship with the Fund;
• Research and other service benefits received by the Adviser obtained through payment of client commissions for securities transactions;
• Other benefits received by the Adviser, and its affiliates, including revenues paid to the Adviser, or its affiliates, by the Fund for administration and fund accounting services, and distribution;
• The capabilities and financial condition of the Adviser;
• Current economic and industry trends; and
• The historical relationship between the Fund and the Adviser.
The Board reviewed the Fund's current management fee, comprised of the advisory fee plus the administrative services fee paid to the Adviser, in the context of the Adviser's profitability with respect to the Fund. In addition, the Board compared the Fund's total operating expense ratio on a net and gross basis, taking into consideration any distribution or shareholder servicing fees and management fees with a universe of comparable mutual funds compiled by an independent consultant and a peer group of funds with similar investment strategies selected by that independent consultant from the universe. The Board reviewed the factors and methodology used by the independent consultant in the selection of the Fund's peer group, including the independent consultant's selection of a broad universe of funds, the more specific universe of comparable funds, and peer groups of funds with comparable investment strategies and asset levels, among other factors. The Board also reviewed any changes to the independent consultant's methodology as compared to the prior year, including
37
Victory Variable Insurance Funds | | Supplemental Information — continued
December 31, 2019 | |
(Unaudited)
those resulting from the Adviser's input, if any. The Board also reviewed fees and other information related to the Adviser's management of similarly managed institutional or private accounts, and the differences in the services provided to the other accounts, to the extent applicable. The Board noted that the advisory fee arrangements for the Fund do not include breakpoints, which are generally viewed as a method by which the investment adviser shares any economies of scale with a fund as a fund grows. The Board also considered the Adviser's commitment to limit expenses as discussed in more detail below, and would consider breakpoints at a future time if the Fund's assets were to grow significantly.
The Board reviewed the Fund's performance over one-, three-, five- and ten-year periods against the performance of the Fund's selected peer group and benchmark index. The Board recognized that the performance of the Fund and the peer group funds are net of expenses, while the performance of the benchmark index is gross returns. The Board considered the additional resources that the Adviser has committed to enhance portfolio analysis, compliance and trading systems.
The Board reviewed various other specific factors with respect to the Fund, as described below. In their deliberations, the Trustees did not rank the importance of any particular information or factor considered and each Trustee may have attributed different weights to various factors.
The Board concluded that the Fund's gross annual management fee was reasonable as compared to the median gross management fee charged to the funds in the Fund's peer group. The Board noted that the Fund's net annual expense ratio, taking into account any shareholder servicing or distribution fees, was reasonable as compared to the median expense ratio for the peer group. The Board considered the Adviser's contractual agreement to waive its fees and reimburse expenses for a specified period of time, as described in the Fund's prospectus.
The Board then compared the Fund's performance for the one-, three-, five- and ten-year periods ended June 30, 2019, to that of the median performance of the peer group and benchmark index for the same periods and considered the fact that the Fund outperformed the benchmark index for all of the periods reviewed, with the exception of the one-year period, and underperformed the peer group median for all of the periods reviewed, with the exception of the ten-year period.
Having considered, among other things: (1) that the Fund's management fee was within the ranges of advisory fees charged to comparable mutual funds; (2) that the Fund's total expense ratio was reasonable; (3) the Adviser's willingness to limit the expenses for a period of time would provide stability to the Fund's expenses during that period; (4) the transition of the investment team following the reorganization; and (5) the performance of the Fund, the Board concluded that the Agreement continued to be in the best interests of the Fund's shareholders.
Conclusion
Based on its review of the information requested and provided, and following extended discussions, the Board determined that the Agreement, on behalf of the Fund, was consistent with the best interests of the Fund and its shareholders, and the Board unanimously approved the Agreement, on behalf of the Fund, for an additional annual period on the basis of the foregoing review and discussions and the following considerations, among others:
• The fairness and reasonableness of the investment advisory fee payable to the Adviser under the Agreement in light of the investment advisory services provided, the costs of these services, the profitability of the Adviser's relationship with the Fund and the comparability of the fee paid to the fees paid by other investment companies;
• The nature, quality and extent of the investment advisory services provided by the Adviser;
• The Adviser's entrepreneurial commitment to the management of the Fund and the creation of a broad-based family of funds, which could entail a substantial commitment of the Adviser's resources to the successful operation of the Fund;
• The Adviser's representations regarding its staffing and capabilities to manage the Fund, including the retention of personnel with relevant portfolio management experience;
• The Adviser's efforts to enhance investment results by, among other things, developing quality portfolio management teams; and
• The overall high quality of the personnel, operations, financial condition, investment management capabilities, methodologies and performance of the Adviser.
38
Privacy Policy
Protecting the Privacy of Information
The Trust respects your right to privacy. We also know that you expect us to conduct and process your business in an accurate and efficient manner. To do so, we must collect and maintain certain personal information about you. This is the information we collect from you on applications or other forms, and from the transactions you make with us or third parties. It may include your name, address, social security number, account transactions and balances, and information about investment goals and risk tolerance.
We do not disclose any information about you or about former customers to anyone except as permitted or required by law. Specifically, we may disclose the information we collect to companies that perform services on our behalf, such as the transfer agent that processes shareholder accounts and printers and mailers that assist us in the distribution of investor materials. We may also disclose this information to companies that perform marketing services on our behalf. This allows us to continue to offer you Victory investment products and services that meet your investing needs, and to effect transactions that you request or authorize. These companies will use this information only in connection with the services for which we hired them. They are not permitted to use or share this information for any other purpose.
To protect your personal information internally, we permit access only by authorized employees and maintain physical, electronic and procedural safeguards to guard your personal information.*
* You may have received communications regarding information about privacy policies from other financial institutions which gave you the opportunity to "opt-out" of certain information sharing with companies which are not affiliated with that financial institution. The Trust does not share information with other companies for purposes of marketing solicitations for products other than the Trust. Therefore, the Trust does not provide opt-out options to their shareholders.
Victory Funds
P.O. Box 182593
Columbus, Ohio 43218-2593

Visit our website at: | | Call Victory at: | |
www.vcm.com | | 800-539-FUND (800-539-3863) | |
VVIF-RS-ILDBVIP-AR (12/19)

December 31, 2019
Annual Report
Victory Variable Insurance Funds
Victory RS International VIP Series
Beginning January 1, 2021, as permitted by regulations adopted by the Securities and Exchange Commission, paper copies of the Fund's shareholder reports may no longer be sent by mail from the insurance company that issued your variable annuity and variable life insurance contract, unless you specifically request paper copies of the reports from your insurance company. Instead, the reports will be made available on www.victoryfunds.com. The insurance company that offers your contract may also make these reports available on a website, and such insurance company will notify you by mail each time a report is posted and provide you with a website link to access the report.
If you already elected to receive shareholder reports electronically, you will not be affected by this change and you need not take any action. You may elect to receive shareholder reports and other communications from the insurance company electronically by following the instructions provided by the insurance company.
If offered by your insurance company, you may elect to receive all future reports in paper and free of charge from the insurance company. You can inform your insurance company that you wish to continue receiving paper copies of your reports. Your election to receive reports in paper will apply to all funds available under your contract.
www.vcm.com
News, Information And Education 24 Hours A Day, 7 Days A Week
The Victory Funds site gives fund shareholders, prospective shareholders, and investment professionals a convenient way to access fund information, get guidance, and track fund performance anywhere they can access the Internet. The site includes:
• Detailed performance records
• Daily share prices
• The latest fund news
• Investment resources to help you become a better investor
• A section dedicated to investment professionals
Whether you're a potential investor searching for the fund that matches your investment philosophy, a seasoned investor interested in planning tools, or an investment professional, www.vcm.com has what you seek. Visit us anytime. We're always open.
Victory Variable Insurance Funds
Table of Contents
Shareholder Letter (Unaudited) | | | 3 | | |
Fund Review and Commentary (Unaudited) | | | 5 | | |
Financial Statements | |
Schedule of Portfolio Investments | | | 8 | | |
Statement of Assets and Liabilities | | | 13 | | |
Statement of Operations | | | 14 | | |
Statements of Changes in Net Assets | | | 15 | | |
Financial Highlights | | | 16 | | |
Notes to Financial Statements | | | 18 | | |
Report of Independent Registered Public
Accounting Firm | | | 27 | | |
Supplemental Information (Unaudited) | |
Trustee and Officer Information | | | 28 | | |
Proxy Voting and Portfolio Holdings Information | | | 31 | | |
Expense Examples | | | 31 | | |
Additional Federal Income Tax Information | | | 32 | | |
Advisory Contract Renewal | | | 33 | | |
Privacy Policy (inside back cover) | | | |
The Fund is distributed by Victory Capital Advisers, Inc. Victory Capital Management Inc. is the investment adviser to the Fund and receives fees from the Fund for performing services for the Fund.
This report is not authorized for distribution to prospective investors unless preceded or accompanied by a current prospectus of the Fund.
For additional information about any Victory Fund, including fees, expenses, and risks, view our prospectus online at www.vcm.com or call 800-539-3863. Read it carefully before you invest or send money.
The information in this annual report is based on data obtained from recognized services and sources and is believed to be reliable. Any opinions, projections, or recommendations in this report are subject to change without notice and are not intended as individual investment advice. Past investment performance of the Fund, markets or securities mentioned herein should not be considered to be indicative of future results.
• NOT FDIC INSURED • NO BANK GUARANTEE
• MAY LOSE VALUE

Call Victory at:
800-539-FUND (800-539-3863)
Visit our website at:
www.vcm.com
1
This page is intentionally left blank.
2
Victory Funds Letter to Shareholders
(Unaudited)
Dear Shareholder,
As we turn the page into a new decade, it's hard not to reflect on the fact that we have been enjoying the longest-ever bull market in U.S. equities. The run has been impressive, and despite periods of tumult and plenty of negative news, the bull market endured throughout 2019.
For the annual reporting period ended December 31, 2019, the S&P 500® Index posted impressive gains of 31.49%. This represents the greatest one-year gain since 2013 and also illustrates a swift bounce-back after a precipitous drop late in 2018. The move higher supports the notion that underlying fundamentals of U.S. companies drive performance, rather than the political rancor and headline fears that often capture the attention of investors.
Perhaps we shouldn't be surprised at the impressive performance of equities. The U.S. economy — the world's largest — remains on solid footing and has been a key driver of both domestic and international stocks. Robust job creation, near-record low unemployment, and steady consumer spending continue and offer reasons for further optimism. Meanwhile, inflation remains muted, and the Federal Reserve (the Fed) and other major global central banks have taken an accommodative stance. In fact, the Fed has cut interest rates by a total of 0.75% over three meetings last July, September and October.
The risk-on attitudes of investors, coupled with the accommodative monetary policy, had an expected impact on U.S. Treasury yields. The 10-year Treasury yield declined significantly over the course of 2019, falling from 2.66% to 1.92% at year-end. More interesting, however, was the fact that, the yield on 10-year Treasurys fell below shorter-term yields for the first time since before the 2007-2008 Global Financial Crisis. This inverted yield curve spooked investors for a spell, only to revert back to a traditional upward sloping yield curve by the end of the year.
The robust domestic economy, low interest rates, and ample liquidity from central banks provided a potent tonic for the stock market in 2019. In fact, at year-end 2019, the S&P 500® Index was approaching its highest valuation level since 1999. This reminds all of us to retain some historical context on the bull market. Many of us remember the Global Financial Crisis and, before that, the collapse of the dot-com bubble. Although those are now but a distant memory (and we are not forecasting such tumult), we should not forget that stocks don't always go up and cycles don't last forever. In other words, valuations still matter.
The key point is not to discount the risks. In addition to lofty valuations, investors need to keep apprised of trade disputes, geopolitical hotspots, a contentious U.S. election, and a host of other potential headwinds. Yet it is these very risks — these cross-currents — that may create pricing dislocations. This is an environment in which we believe our Victory Capital independent investment franchises can thrive.
On the following pages, you will find information relating to your Victory Funds investment. If you have any questions, we encourage you to contact your financial
3
advisor. Or, if you invest with us directly, you may call (800) 539-3863, or visit our website at www.vcm.com.
My colleagues and I sincerely appreciate the confidence you have placed in the Victory Funds, and we value the opportunity to help meet your investment goals.

Christopher K. Dyer, CFA
President,
Victory Funds
4
Victory Variable Insurance Funds (Unaudited)
Victory RS International VIP Series
Portfolio Holdings
As a Percentage of Total Investments

Portfolio Review
The Victory RS International VIP Series (the "Fund") seeks to provide long-term capital appreciation. For the year ended December 31, 2019, the MSCI EAFE Index (the "Index") rose 22.01% while the Fund outperformed the Index, returning 22.79%.
The Fund's performance relative to the Index was aided by positive stock selection in a number of economic sectors, including Financials, Consumer discretionary, and Utilities. Negative stock selection in the Real Estate, and Communication Services sectors detracted from relative performance. From a regional perspective, Fund investments in Sweden, Japan, Italy, and the United Kingdom benefitted relative results, while stock selection was negative in Spain and the Netherlands.
Key individual contributors for the period included Atlas Copco AB, a Swedish supplier of industrial equipment, and Next PLC, a multinational retailer of clothing and home wares based in the United Kingdom. Enel SpA, an Italian distributor of gas and electricity, also aided relative returns.
Telefonica, S.A., a telecommunications provider based in Spain, was the largest detractor from relative performance for the period. Australian shopping center developer and operator, Scentre Group, also detracted from relative results, as did United Arrows Ltd., a clothing and accessories retailer based in Japan.
Market Review
Fears of an end to the historic bull run were once again proven overdone as international markets, as measured by the Index, soared 22% during 2019 and posted a financial crisis high in late December. Despite a steady drumbeat of negative news flow, the Index recorded one of its best performances of the decade. However, you would have struggled to reach that conclusion based on the macroeconomic picture alone.
Starting in the United Kingdom, with the decisive election of Prime Minister Boris Johnson in December, the country finally may achieve some resolution three years on from its initial vote to leave the European Union. However, much of the year was spent under a shroud of uncertainty making the local market performance, +21%, and currency strength, +4% against the U.S. dollar, all the more surprising.
Meanwhile, on the Continent, the European Manufacturing PMI continued to grind lower finishing December at a dismal 46.3, driven by Germany where exports continued to slow. France and Spain were less of a drag but not enough to keep the Eurozone from heading towards its lowest growth rate since 2012. But like the United Kingdom, European equity securities not only shook it off but managed to thrive by soaring almost 25%.
China appears to have taken the brunt of the trade war impact. Both imports and exports are likely to finish the year in the red as consumer confidence waned and tariffs took their
5
Victory Variable Insurance Funds (Unaudited)
Victory RS International VIP Series (continued)
toll. Market observers had expected a recovery in the second half but were left disappointed as the growth in auto sales remained negative despite easy comparisons to 2018. Asia ex-Japan, where exports to China are important, took collateral damage. Notably, GDP in South Korea and Taiwan slowed for the third consecutive year. As for Japan, exports plunged over 2%, but the domestic economy remained resilient. When it comes to equity securities though, the story was positive with stocks in most Asian countries posting high-teen returns.
One common thread, which may explain at least some of the disconnect between the stellar performance of equity securities and the more decidedly mixed economic outlook, is global monetary policy. From the U.S. Federal Reserve cutting rates by 75 basis points to the European Central Bank cutting the deposit rate to -.5% to the Bank of China slashing the reserve requirement ratio, central banks with few exceptions were in easing mode. The extent to which global easing buoyed stock prices is up for debate, but it does appear it had some positive impact.
QVS Factor Performance
In this section, we offer insight into the factors driving market performance from a quantitative point of view. The RS Global Markets team's proprietary QVS (Quality, Value, and Sentiment) (the "Model") scours the globe, screening over 10,000 companies while looking for the best investment opportunities. It is designed to identify companies that have the potential to consistently create shareholder value, are reasonably valued, and exhibit favorable market sentiment. We continually use this quantitative model to help us focus our resources and fundamental research on those companies with the highest probability of outperformance.
Last year, all factors contributed positively to composite Model performance led by Quality and Sentiment. By region, the Model performed best in Asia ex. Japan and had negative performance only in Japan. Within Japan, negative Value and Sentiment factor performance both contributed to negative overall Model performance.
Out of favor for the better part of the decade, Value as a factor was a hot topic in 2019, showing signs of leadership at different points during the year. Alas, it was not to be, as our Value factor, though positive in absolute terms, underperformed the Quality and Sentiment components of the overall Model. That said, Value was the strongest factor in Emerging Markets, and had negative performance only in Japan.
Outlook
We expect market volatility to increase and will continue to be vigilant when constructing the Fund's portfolio, remaining sector- and region-neutral, as we believe that strong risk management should be at the forefront of any strategy. Making correct macro allocation calls can be immensely challenging; therefore, we do not forecast regional performance. In our view, stock selection can be far more impactful to fund performance than allocation.
6
Victory Variable Insurance Funds (Unaudited)
Victory RS International VIP Series (continued)
Average Annual Total Return
Year Ended December 31, 2019
| | Class I | | | |
INCEPTION DATE | | 2/8/91 | | | |
| | Net Asset
Value | | MSCI EAFE
Index1 | |
One Year | | | 22.79 | % | | | 22.01 | % | |
Three Year | | | 11.30 | % | | | 9.56 | % | |
Five Year | | | 7.15 | % | | | 5.67 | % | |
Ten Year | | | 6.73 | % | | | 5.50 | % | |
Since Inception | | | 7.18 | % | | | N/A | | |
Expense Ratios
Gross | | | 0.94 | % | |
With Applicable Waivers | | | 0.93 | % | |
Past performance is not indicative of future results. The performance data quoted represents past performance and current returns may be lower or higher. The investment return and principal value will fluctuate so that an investor's shares, when redeemed, may be worth more or less than the original cost. To obtain performance information current to the most recent month's end, please visit www.vcm.com.
The above expense ratios are from the Fund's prospectus dated May 1, 2019. Additional information pertaining to the Fund's expense ratios as of December 31, 2019 can be found in the financial highlights.
The total return figures set forth above include all waivers of fees for various periods since inception. Without such fee waivers, the total returns would have been lower. Some fee waivers are voluntary and may be modified or terminated at any time. The total returns do not include any insurance, sales or administrative charges of variable annuity or life insurance contracts. If these charges were included, the total returns would have been lower.
Victory RS International VIP Series — Growth of $10,000
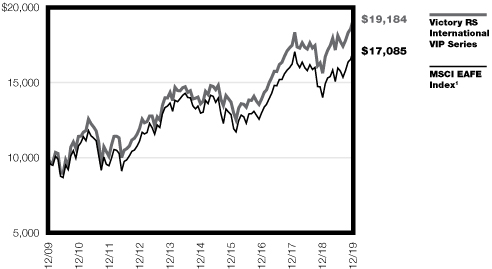
1The MSCI EAFE Index (Europe, Australasia, and Far East) is a free float-adjusted market capitalization index that is designed to measure the equity market performance of developed markets, excluding the U.S. and Canada. The index reflects the reinvestment of dividends paid on the stocks constituting the index net of withholding taxes. You may not invest in the index, and, unlike the Fund, the index does not incur fees or expenses.
The graph reflects investment of growth of a hypothetical $10,000 investment in the Fund. Past performance is no guarantee of future results.
The graph and table do not reflect the deduction of taxes that a shareholder would pay on Fund distributions or the redemption of Fund shares.
7
Victory Variable Insurance Funds
Victory RS International VIP Series | | Schedule of Portfolio Investments
December 31, 2019 | |
Security Description | | Shares | | Value | |
Common Stocks (97.3%) | |
Australia (5.9%): | |
Financials (1.4%): | |
Macquarie Group Ltd. | | | 21,562 | | | $ | 2,087,715 | | |
Health Care (1.7%): | |
CSL Ltd. | | | 12,937 | | | | 2,507,723 | | |
Materials (1.7%): | |
BHP Group Ltd. | | | 96,556 | | | | 2,643,368 | | |
Real Estate (1.1%): | |
Scentre Group | | | 596,529 | | | | 1,605,073 | | |
| | | | 8,843,879 | | |
Belgium (0.5%): | |
Information Technology (0.5%): | |
Melexis NV | | | 10,114 | | | | 762,862 | | |
China (2.1%): | |
Communication Services (1.1%): | |
Tencent Holdings Ltd. | | | 35,500 | | | | 1,710,363 | | |
Financials (1.0%): | |
China Merchants Bank Co. Ltd., Class H | | | 281,500 | | | | 1,447,321 | | |
| | | | 3,157,684 | | |
Denmark (1.3%): | |
Consumer Staples (1.3%): | |
Royal Unibrew A/S | | | 21,519 | | | | 1,971,395 | | |
France (9.7%): | |
Consumer Discretionary (4.2%): | |
Cie Generale des Etablissements Michelin SCA | | | 9,087 | | | | 1,118,143 | | |
Faurecia SE | | | 27,845 | | | | 1,511,510 | | |
LVMH Moet Hennessy Louis Vuitton SE | | | 7,836 | | | | 3,650,904 | | |
| | | | 6,280,557 | | |
Energy (1.8%): | |
Total SA | | | 49,501 | | | | 2,746,602 | | |
Financials (1.1%): | |
AXA SA | | | 59,675 | | | | 1,686,048 | | |
Information Technology (1.4%): | |
Capgemini SE | | | 16,554 | | | | 2,024,462 | | |
Materials (1.2%): | |
Arkema SA | | | 16,071 | | | | 1,718,286 | | |
| | | | 14,455,955 | | |
Germany (7.8%): | |
Financials (1.9%): | |
Allianz SE | | | 11,292 | | | | 2,766,618 | | |
See notes to financial statements.
8
Victory Variable Insurance Funds
Victory RS International VIP Series | | Schedule of Portfolio Investments — continued
December 31, 2019 | |
Security Description | | Shares | | Value | |
Health Care (0.6%): | |
Bayer AG, Registered Shares | | | 11,957 | | | $ | 971,981 | | |
Industrials (2.1%): | |
Siemens AG | | | 17,743 | | | | 2,316,889 | | |
Washtec AG | | | 13,291 | | | | 799,335 | | |
| | | | 3,116,224 | | |
Information Technology (2.0%): | |
SAP SE | | | 21,654 | | | | 2,914,342 | | |
Real Estate (1.2%): | |
Vonovia SE | | | 32,939 | | | | 1,768,982 | | |
| | | | 11,538,147 | | |
Hong Kong (2.0%): | |
Financials (0.9%): | |
AIA Group Ltd. | | | 132,400 | | | | 1,392,668 | | |
Real Estate (1.1%): | |
CK Asset Holdings Ltd. | | | 226,500 | | | | 1,634,580 | | |
| | | | 3,027,248 | | |
Ireland (1.1%): | |
Industrials (1.1%): | |
Experian PLC | | | 45,843 | | | | 1,553,817 | | |
Italy (4.1%): | |
Financials (0.8%): | |
Banca Generali SpA | | | 39,006 | | | | 1,267,930 | | |
Health Care (0.9%): | |
Recordati SpA | | | 31,083 | | | | 1,310,184 | | |
Utilities (2.4%): | |
Enel SpA | | | 447,003 | | | | 3,550,611 | | |
| | | | 6,128,725 | | |
Japan (23.8%): | |
Communication Services (1.2%): | |
Nippon Telegraph & Telephone Corp. | | | 73,000 | | | | 1,845,234 | | |
Consumer Discretionary (4.6%): | |
Hikari Tsushin, Inc. | | | 5,100 | | | | 1,281,796 | | |
Toyota Motor Corp. | | | 61,900 | | | | 4,362,170 | | |
United Arrows Ltd. | | | 40,100 | | | | 1,135,783 | | |
| | | | 6,779,749 | | |
Consumer Staples (1.4%): | |
Ito En Ltd. | | | 33,600 | | | | 719,490 | | |
Matsumotokiyoshi Holdings Co. Ltd. | | | 34,500 | | | | 1,335,850 | | |
| | | | 2,055,340 | | |
See notes to financial statements.
9
Victory Variable Insurance Funds
Victory RS International VIP Series | | Schedule of Portfolio Investments — continued
December 31, 2019 | |
Security Description | | Shares | | Value | |
Financials (3.1%): | |
Jafco Co. Ltd. | | | 19,200 | | | $ | 752,741 | | |
Mitsubishi UFJ Financial Group, Inc. | | | 405,000 | | | | 2,189,869 | | |
Tokio Marine Holdings, Inc. | | | 29,600 | | | | 1,657,498 | | |
| | | | 4,600,108 | | |
Health Care (2.7%): | |
Hoya Corp. | | | 23,700 | | | | 2,262,763 | | |
Shionogi & Co. Ltd. | | | 28,600 | | | | 1,769,484 | | |
| | | | 4,032,247 | | |
Industrials (6.6%): | |
en-japan, Inc. | | | 41,000 | | | | 1,782,259 | | |
Fuji Electric Co. Ltd. | | | 60,900 | | | | 1,850,233 | | |
Hitachi Construction Machinery Co. Ltd. | | | 65,900 | | | | 1,963,256 | | |
ITOCHU Corp. | | | 59,600 | | | | 1,381,521 | | |
Kyowa Exeo Corp. | | | 15,000 | | | | 379,498 | | |
OKUMA Corp. | | | 21,900 | | | | 1,151,981 | | |
Sanwa Holdings Corp. | | | 118,100 | | | | 1,323,581 | | |
| | | | 9,832,329 | | |
Information Technology (2.4%): | |
Fujitsu Ltd. | | | 14,800 | | | | 1,392,218 | | |
Oracle Corp. Japan | | | 13,400 | | | | 1,216,336 | | |
Ulvac, Inc. | | | 22,700 | | | | 895,959 | | |
| | | | 3,504,513 | | |
Materials (0.1%): | |
DIC Corp. | | | 7,600 | | | | 209,777 | | |
Real Estate (0.6%): | |
Sumitomo Realty & Development Co. Ltd. | | | 27,300 | | | | 952,615 | | |
Utilities (1.1%): | |
Chubu Electric Power Co., Inc. | | | 111,800 | | | | 1,580,606 | | |
| | | | 35,392,518 | | |
Macau (1.2%): | |
Consumer Discretionary (1.2%): | |
Wynn Macau Ltd. (a) | | | 737,200 | | | | 1,816,670 | | |
Netherlands (4.1%): | |
Communication Services (1.0%): | |
Koninklijke KPN NV | | | 516,611 | | | | 1,528,716 | | |
Financials (1.5%): | |
ING Groep NV | | | 189,051 | | | | 2,272,655 | | |
Industrials (1.6%): | |
Wolters Kluwer NV | | | 31,665 | | | | 2,311,839 | | |
| | | | 6,113,210 | | |
See notes to financial statements.
10
Victory Variable Insurance Funds
Victory RS International VIP Series | | Schedule of Portfolio Investments — continued
December 31, 2019 | |
Security Description | | Shares | | Value | |
Norway (1.5%): | |
Energy (0.7%): | |
Aker BP ASA | | | 29,745 | | | $ | 976,577 | | |
Financials (0.8%): | |
SpareBank 1 SMN | | | 111,387 | | | | 1,272,571 | | |
| | | | 2,249,148 | | |
Russian Federation (0.5%): | |
Materials (0.5%): | |
Evraz PLC | | | 147,945 | | | | 792,098 | | |
Spain (2.7%): | |
Communication Services (1.6%): | |
Telefonica SA | | | 341,633 | | | | 2,388,872 | | |
Financials (1.1%): | |
Banco Santander SA | | | 403,367 | | | | 1,691,072 | | |
| | | | 4,079,944 | | |
Sweden (3.0%): | |
Industrials (3.0%): | |
Atlas Copco AB, Class B | | | 101,402 | | | | 3,521,892 | | |
Epiroc AB, Class B | | | 72,930 | | | | 867,025 | | |
| | | | 4,388,917 | | |
Switzerland (11.0%): | |
Consumer Staples (3.4%): | |
Nestle SA, Registered Shares | | | 46,332 | | | | 5,017,183 | | |
Financials (2.0%): | |
Cembra Money Bank AG | | | 11,690 | | | | 1,279,256 | | |
UBS Group AG, Registered Shares | | | 136,445 | | | | 1,722,208 | | |
| | | | 3,001,464 | | |
Health Care (5.6%): | |
Novartis AG | | | 39,909 | | | | 3,779,749 | | |
Roche Holding AG | | | 14,234 | | | | 4,627,046 | | |
| | | | 8,406,795 | | |
| | | | 16,425,442 | | |
United Kingdom (15.0%): | |
Consumer Discretionary (1.2%): | |
Next PLC | | | 19,111 | | | | 1,780,544 | | |
Consumer Staples (3.7%): | |
Britvic PLC | | | 118,534 | | | | 1,420,367 | | |
Diageo PLC | | | 57,723 | | | | 2,431,886 | | |
Unilever PLC | | | 29,136 | | | | 1,667,568 | | |
| | | | 5,519,821 | | |
Energy (2.7%): | |
| BP PLC | | | 220,479 | | | | 1,386,779 | | |
Royal Dutch Shell PLC, Class A | | | 89,899 | | | | 2,661,884 | | |
| | | | 4,048,663 | | |
See notes to financial statements.
11
Victory Variable Insurance Funds
Victory RS International VIP Series | | Schedule of Portfolio Investments — continued
December 31, 2019 | |
Security Description | | Shares | | Value | |
Financials (3.3%): | |
Close Brothers Group PLC | | | 37,047 | | | $ | 784,537 | | |
HSBC Holdings PLC | | | 248,219 | | | | 1,942,872 | | |
Legal & General Group PLC | | | 547,451 | | | | 2,198,807 | | |
| | | | 4,926,216 | | |
Health Care (0.8%): | |
Smith & Nephew PLC | | | 49,964 | | | | 1,203,986 | | |
Industrials (1.0%): | |
RELX PLC | | | 57,167 | | | | 1,442,867 | | |
Materials (2.3%): | |
Croda International PLC | | | 14,303 | | | | 971,435 | | |
Rio Tinto PLC | | | 40,292 | | | | 2,384,721 | | |
| | | | 3,356,156 | | |
| | | | 22,278,253 | | |
Total Common Stocks (Cost $117,795,994) | | | 144,975,912 | | |
Exchange-Traded Funds (0.3%) | |
United States (0.3%): | |
iShares MSCI EAFE ETF | | | 5,375 | | | | 373,240 | | |
Total Exchange-Traded Funds (Cost $351,793) | | | 373,240 | | |
Collateral for Securities Loaned^ (0.0%) | |
United States (0.0%): (b) | |
BlackRock Liquidity Funds TempFund Portfolio, Institutional Class, 1.75% (c) | | | 5,593 | | | | 5,593 | | |
Fidelity Investments Money Market Government Portfolio, Class I, 1.54% (c) | | | 30,811 | | | | 30,811 | | |
Fidelity Investments Prime Money Market Portfolio, Class I, 1.75% (c) | | | 934 | | | | 934 | | |
Goldman Sachs Financial Square Prime Obligations Fund,
Institutional Class, 1.80% (c) | | | 18,614 | | | | 18,614 | | |
JPMorgan Prime Money Market Fund, Capital Class, 1.73% (c) | | | 20,477 | | | | 20,477 | | |
Morgan Stanley Institutional Liquidity Prime Portfolio,
Institutional Class, 1.76% (c) | | | 40,952 | | | | 40,952 | | |
Total Collateral for Securities Loaned (Cost $117,381) | | | 117,381 | | |
Total Investments (Cost $118,265,168) — 97.6% | | | 145,466,533 | | |
Other assets in excess of liabilities — 2.4% | | | 3,567,612 | | |
NET ASSETS — 100.00% | | $ | 149,034,145 | | |
^ Purchased with cash collateral from securities on loan.
(a) All or a portion of this security is on loan.
(b) Amount represents less than 0.05% of net assets.
(c) Rate disclosed is the daily yield on December 31, 2019.
ETF — Exchange-Traded Fund
PLC — Public Limited Company
See notes to financial statements.
12
Victory Variable Insurance Funds | | Statement of Assets and Liabilities
December 31, 2019 | |
| | | Victory RS International
VIP Series | |
ASSETS: | |
Investments, at value (Cost $118,265,168) | | $ | 145,466,533 | (a) | |
Cash and cash equivalents | | | 3,183,194 | | |
Interest and dividends receivable | | | 66,223 | | |
Receivable for capital shares issued | | | 1,647 | | |
Reclaims receivable | | | 619,608 | | |
Receivable from Adviser | | | 11,212 | | |
Prepaid expenses | | | 9,468 | | |
Total Assets | | | 149,357,885 | | |
LIABILITIES: | |
Payables | |
Collateral received on loaned securities | | | 117,381 | | |
Capital shares redeemed | | | 62,617 | | |
Accrued expenses and other payables: | |
Investment advisory fees | | | 100,560 | | |
Administration fees | | | 7,109 | | |
Custodian fees | | | 7,335 | | |
Transfer agent fees | | | 51 | | |
Compliance fees | | | 97 | | |
Trustees' fees | | | 303 | | |
Other accrued expenses | | | 28,287 | | |
Total Liabilities | | | 323,740 | | |
NET ASSETS: | |
Capital | | | 118,109,293 | | |
Total distributable earnings/(loss) | | | 30,924,852 | | |
Net Assets | | $ | 149,034,145 | | |
Shares (unlimited shares authorized with a par value of
$0.001 per share): | | | 8,527,717 | | |
Net asset value: | | $ | 17.48 | | |
(a) Includes $111,669 of securities on loan.
See notes to financial statements.
13
Victory Variable Insurance Funds | | Statement of Operations
For the Year Ended December 31, 2019 | |
| | | Victory RS International
VIP Series | |
Investment Income: | |
Dividends | | $ | 5,676,474 | | |
Interest | | | 26,256 | | |
Securities lending (net of fees) | | | 23,503 | | |
Foreign tax withholding | | | (630,337 | ) | |
Total Income | | | 5,095,896 | | |
Expenses: | |
Investment advisory fees | | | 1,190,847 | | |
Administration fees | | | 91,041 | | |
Custodian fees | | | 38,766 | | |
Transfer agent fees | | | 349 | | |
Trustees' fees | | | 13,723 | | |
Compliance fees | | | 994 | | |
Legal and audit fees | | | 22,845 | | |
Other expenses | | | 63,486 | | |
Total Expenses | | | 1,422,051 | | |
Expenses waived/reimbursed by Adviser | | | (37,537 | ) | |
Net Expenses | | | 1,384,514 | | |
Net Investment Income (Loss) | | | 3,711,382 | | |
Realized/Unrealized Gains (Losses) from Investments: | |
Net realized gains (losses) from investment securities and foreign
currency translations | | | 2,838,117 | | |
Net change in unrealized appreciation/depreciation on investment
securities and foreign currency translations | | | 23,830,462 | | |
Net realized/unrealized gains on investments | | | 26,668,579 | | |
Change in net assets resulting from operations | | $ | 30,379,961 | | |
See notes to financial statements.
14
Victory Variable Insurance Funds | | Statements of Changes in Net Assets | |
| | | Victory RS International VIP Series | |
| | | Year
Ended
December 31,
2019 | | Year
Ended
December 31,
2018 | |
From Investment Activities: | |
Operations: | |
Net investment income (loss) | | $ | 3,711,382 | | | $ | 3,661,623 | | |
Net realized gains (losses) from investments | | | 2,838,117 | | | | 9,269,743 | | |
Net change in unrealized appreciation/depreciation on
investments | | | 23,830,462 | | | | (30,264,562 | ) | |
Change in net assets resulting from operations | | | 30,379,961 | | | | (17,333,196 | ) | |
Change in net assets resulting from distributions to shareholders | | | (12,127,758 | ) | | | (2,621,141 | ) | |
Change in net assets resulting from capital transactions | | | (11,741,589 | ) | | | (19,040,351 | ) | |
Change in net assets | | | 6,510,614 | | | | (38,994,688 | ) | |
Net Assets: | |
Beginning of period | | | 142,523,531 | | | | 181,518,219 | | |
End of period | | $ | 149,034,145 | | | $ | 142,523,531 | | |
Capital Transactions: | |
Proceeds from shares issued | | $ | 2,897,082 | | | $ | 6,913,816 | | |
Distributions reinvested | | | 12,127,758 | | | | 2,621,141 | | |
Cost of shares redeemed | | | (26,766,429 | ) | | | (28,575,308 | ) | |
Change in net assets resulting from capital transactions | | $ | (11,741,589 | ) | | $ | (19,040,351 | ) | |
Share Transactions: | |
Issued | | | 165,264 | | | | 400,845 | | |
Reinvested | | | 684,295 | | | | 169,597 | | |
Redeemed | | | (1,532,898 | ) | | | (1,650,290 | ) | |
Change in Shares | | | (683,339 | ) | | | (1,079,848 | ) | |
See notes to financial statements.
15
Victory Variable Insurance Funds | | Financial Highlights | |
For a Share Outstanding Throughout Each Period
| | | | Investment Activities | | Distributions to
Shareholders From | |
| | | Net Asset
Value,
Beginning of
Period | | Net
Investment
Income
(Loss)(a) | | Net
Realized and
Unrealized
Gains
(Losses) on
Investments | | Total from
Investment
Activities | | Net
Investment
Income | | Net Realized
Gains From
Investments | | Total
Distributions | |
Victory RS International VIP Series | |
Year Ended
12/31/19 | | $ | 15.47 | | | | 0.43 | | | | 3.09 | | | | 3.52 | | | | (0.39 | ) | | | (1.12 | ) | | | (1.51 | ) | |
Year Ended
12/31/18 | | $ | 17.64 | | | | 0.38 | | | | (2.26 | ) | | | (1.88 | ) | | | (0.15 | ) | | | (0.14 | ) | | | (0.29 | ) | |
Year Ended
12/31/17 | | $ | 14.31 | | | | 0.31 | | | | 3.36 | | | | 3.67 | | | | (0.34 | ) | | | — | | | | (0.34 | ) | |
Year Ended
12/31/16 | | $ | 14.39 | | | | 0.30 | | | | (0.10 | ) | | | 0.20 | | | | (0.31 | ) | | | — | | | | (0.31 | ) | |
Year Ended
12/31/15 | | $ | 14.63 | | | | 0.31 | | | | (0.19 | ) | | | 0.12 | | | | (0.32 | ) | | | (0.04 | ) | | | (0.36 | ) | |
(a) Per share net investment income (loss) has been calculated using the average daily shares method.
(b) Total returns do not reflect the effects of charges deducted pursuant to the terms of The Guardian Insurance & Annuity Company, Inc.'s variable contracts. Inclusion of such charges would reduce the total returns for all periods shown.
(c) The Fund received monies related to a nonrecurring refund from the prior Custodian. The corresponding impact to the total return was less than 0.23% for the period shown. (See Note 8)
See notes to financial statements.
16
Victory Variable Insurance Funds | | Financial Highlights — continued | |
For a Share Outstanding Throughout Each Period
| | | | | Ratios to Average Net Assets | | Supplemental Data | |
| | | Capital
Contribution
from Prior
Custodian,
Net (See
Note 8) | | Net Asset
Value,
End of
Period | | Total
Return(b) | | Net
Expenses | | Net
Investment
Income
(Loss) | | Gross
Expenses | | Net Assets,
End of
Period
(000's) | | Portfolio
Turnover | |
Victory RS International VIP Series | |
Year Ended
12/31/19 | | | — | | | $ | 17.48 | | | | 22.79 | % | | | 0.93 | % | | | 2.49 | % | | | 0.96 | % | | $ | 149,034 | | | | 32 | % | |
Year Ended
12/31/18 | | | — | | | $ | 15.47 | | | | (10.66 | )% | | | 0.93 | % | | | 2.20 | % | | | 0.94 | % | | $ | 142,524 | | | | 44 | % | |
Year Ended
12/31/17 | | | — | | | $ | 17.64 | | | | 25.68 | % | | | 0.93 | % | | | 1.93 | % | | | 0.95 | % | | $ | 181,518 | | | | 57 | % | |
Year Ended
12/31/16 | | | 0.03 | | | $ | 14.31 | | | | 1.60 | %(c) | | | 0.90 | % | | | 2.13 | % | | | 0.90 | % | | $ | 175,026 | | | | 110 | % | |
Year Ended
12/31/15 | | | — | | | $ | 14.39 | | | | 0.84 | % | | | 0.92 | % | | | 2.00 | % | | | 0.92 | % | | $ | 185,028 | | | | 117 | % | |
See notes to financial statements.
17
Victory Variable Insurance Funds | | Notes to Financial Statements
December 31, 2019 | |
1. Organization:
Victory Variable Insurance Funds (the "Trust") was organized on February 11, 1998 as a Delaware statutory trust. The Trust is registered under the Investment Company Act of 1940, as amended (the "1940 Act"), as a diversified open-end investment company. The Trust is comprised of nine funds and is authorized to issue an unlimited number of shares, which are units of beneficial interest with a par value of $0.001 per share.
The accompanying financial statements are those of the Victory RS International VIP Series (the "Fund"). The Fund offers a single class of shares: Class I Shares. Sales of shares of the Fund may only be made to certain separate accounts of The Guardian Insurance & Annuity Company, Inc. ("GIAC") that fund certain variable annuity and variable life insurance contracts issued by GIAC. GIAC is a wholly owned subsidiary of The Guardian Life Insurance Company of America ("Guardian Life").
Under the Trust's organizational documents, its officers and trustees are indemnified against certain liabilities arising out of the performance of their duties to the Fund. In addition, in the normal course of business, the Fund enters into contracts with its vendors and others that provide for general indemnifications. The Fund's maximum exposure under these arrangements is unknown, as this would involve future claims that may be made against the Fund. However, based on experience, the Fund expects that risk of loss to be remote.
2. Significant Accounting Policies:
The following is a summary of significant accounting policies followed by the Trust in the preparation of its financial statements. The policies are in conformity with accounting principles generally accepted in the United States of America ("GAAP"). The preparation of financial statements in accordance with GAAP requires management to make estimates and assumptions that affect the reported amounts of assets and liabilities and disclosure of contingent assets and liabilities at the date of the financial statements and the reported amounts of income and expenses for the period. Actual results could differ from those estimates. The Fund follows the specialized accounting and reporting requirements under GAAP that are applicable to investment companies.
Investment Valuation:
The Fund records investments at fair value. Fair value is defined as the price that would be received to sell an asset or paid to transfer a liability in an orderly transaction between market participants at the measurement date.
The valuation techniques described below maximize the use of observable inputs and minimize the use of unobservable inputs in determining fair value. The inputs used for valuing the Fund's investments are summarized in the three broad levels listed below:
• Level 1 — quoted prices in active markets for identical securities
• Level 2 — other significant observable inputs (including quoted prices for similar securities or interest rates applicable to those securities, etc.)
• Level 3 — significant unobservable inputs (including the Fund's own assumptions in determining the fair value of investments)
Changes in valuation techniques may result in transfers in or out of an assigned level within the disclosure hierarchy. The inputs or methodologies used for valuation techniques are not necessarily an indication of the risk associated with entering into those investments.
Portfolio securities listed or traded on securities exchanges, including exchange-traded funds ("ETF"), American Depositary Receipts ("ADRs") and Rights, are valued at the closing price on the exchange or system where the security is principally traded, if available, or at the Nasdaq Official Closing Price. If there have been no sales for that day on the exchange or system, then a security is valued at the last available bid quotation on the exchange or system where the security is principally traded. In each of these situations, valuations are typically categorized as Level 1 in the fair value hierarchy.
18
Victory Variable Insurance Funds | | Notes to Financial Statements — continued
December 31, 2019 | |
Investments in open-end investment companies are valued at net asset value. These valuations are typically categorized as Level 1 in the fair value hierarchy.
Investments for which there are no such quotations, or for which quotations do not appear reliable, are valued at fair value in accordance with procedures established by and under the general supervision and responsibility of the Trust's Board of Trustees (the "Board"). These valuations are typically categorized as Level 2 or Level 3 in the fair value hierarchy, based on the observability of inputs used to determine the fair value.
In accordance with procedures adopted by the Board, fair value pricing may be used if events materially affecting the value of foreign securities occur between the time the exchange on which they are traded closes and the time the Fund's net asset value is calculated. The Fund uses a systematic valuation model, provided daily by an independent third party to fair value their international equity securities. To the extent this model is utilized, these valuations are considered as a Level 2 in the fair value hierarchy.
A summary of the valuations as of December 31, 2019, based upon the three levels defined above, is included in the table below while the breakdown, by category, of investments is disclosed in the Schedule of Portfolio Investments.
| | | LEVEL 1 | | LEVEL 2 | | Total | |
Common Stocks | | $ | — | | | $ | 144,975,912 | | | $ | 144,975,912 | | |
Exchange-Traded Funds | | | 373,240 | | | | — | | | | 373,240 | | |
Collateral for Securities Loaned | | | 117,381 | | | | — | | | | 117,381 | | |
Total | | $ | 490,621 | | | $ | 144,975,912 | | | $ | 145,466,533 | | |
For the year ended December 31, 2019, there were no Level 3 investments for which significant unobservable inputs were used to determine fair value.
Investment Companies:
The Fund may invest in ETFs. Shares of an ETF are bought and sold on a securities exchange. An ETF trades like common stock and represents a fixed portfolio of securities designed to track the performance and dividend yield of a particular domestic or foreign market index. The Fund may purchase shares of an ETF to temporarily gain exposure to a portion of the U.S. or a foreign market while awaiting purchase of underlying securities. The risks of owning an ETF generally reflect the risks of owning the underlying securities they are designed to track, although the lack of liquidity of an ETF could result in it being more volatile. Additionally, ETFs have fees and expenses that reduce their value.
Foreign Exchange Currency Contracts:
The Fund may enter into foreign exchange currency contracts to convert U.S. dollars to and from various foreign currencies. A foreign exchange currency contract is an obligation by the Fund to purchase or sell a specific currency at a future date at a price (in U.S. dollars) set at the time of the contract. The Fund does not engage in "cross-currency" foreign exchange contracts (i.e., contracts to purchase or sell one foreign currency in exchange for another foreign currency). The Fund's foreign exchange currency contracts might be considered spot contracts (typically a contract of one week or less) or forward contracts (typically a contract term over one week). A spot contract is entered into for purposes of hedging against foreign currency fluctuations relating to a specific portfolio transaction, such as the delay between a security transaction trade date and settlement date. Forward contracts are entered into for purposes of hedging portfolio holdings or concentrations of such holdings. The Fund enters into foreign exchange currency contracts solely for spot or forward hedging purposes, and not for speculative purposes (i.e., the Fund does not enter into such contracts solely for the purpose of earning foreign currency gains). Each foreign exchange currency contract is adjusted daily by the prevailing spot or forward rate of the underlying currency, and any appreciation or depreciation is recorded for financial statement purposes as unrealized until the contract settlement date, at which time the Fund records realized gains or losses equal to the difference between the value of a contract at the time it was opened and the value at the time it was closed. The Fund could be exposed to risk if a counterparty is unable to meet the terms of a foreign exchange currency contract or if the value of
19
Victory Variable Insurance Funds | | Notes to Financial Statements — continued
December 31, 2019 | |
the foreign currency changes unfavorably. In addition, the use of foreign exchange currency contracts does not eliminate fluctuations in the underlying prices of the securities. During the year ended December 31, 2019, the Fund had no open forward foreign exchange currency contracts.
Investment Transactions and Related Income:
Changes in holdings of investments are accounted for no later than one business day following the trade date. For financial reporting purposes, however, investment transactions are accounted for on trade date on the last business day of the reporting period. Interest income is determined on the basis of coupon interest accrued using the effective interest method which adjusts, where applicable, the amortization of premiums or accretion of discounts. Dividend income is recorded on the ex-dividend date. Gains or losses realized on sales of securities are determined by comparing the identified cost of the security lot sold with the net sales proceeds.
Withholding taxes on interest, dividends and gains as a result of certain investments in ADRs by the Fund have been provided for in accordance with each investment's applicable country's tax rules and rates.
Securities Lending:
The Trust has entered into a Master Securities Lending Agreement ("MSLA") with Citibank, N.A. ("Citibank" or the "Agent"). Under the terms of the MSLA, the Fund may lend securities to certain broker-dealers and banks in exchange for collateral in the amount of at least 102% of the value of U.S. securities loaned or at least 105% of the value of non-U.S. securities loaned, marked-to-market daily. Any collateral shortfalls associated with increases in the valuation of the securities loaned are adjusted the next business day. The collateral can be received in the form of cash collateral and/or non-cash collateral. Non-cash collateral can include U.S. Government Securities, letters of credit and certificates of deposit. The cash collateral is invested in short-term instruments or cash equivalents as noted on the Fund's Schedule of Portfolio Investments. The Trust does not have effective control of the non-cash collateral and therefore it is not disclosed in the Fund's Schedule of Portfolio Investments. The Fund continues to benefit from interest or dividends on the securities loaned and may also earn a return from the collateral. The Fund pays various fees in connection with the investment of cash collateral. The Fund pays the Agent fees based on the investment income received from securities lending activities. Securities lending income is disclosed in the Fund's Statement of Operations. Although risk is mitigated by the collateral, the Fund could experience a delay in recovering its securities and possible loss of income or value if the borrower fails to return them.
Securities lending transactions are entered into by the Fund under the MSLA, which permits the Fund, under certain circumstances such as an event of default, to offset amounts payable by the Fund to the same counterparty against amounts receivable from the counterparty to create a net payment due to or from the Fund.
The following table is a summary of the Fund's securities lending transactions which are subject to offset under the MSLA as of December 31, 2019. These transactions are accounted for as secured borrowings with an overnight and continuous contractual maturity for cash collateral, and greater than overnight and continuous contractual maturity for non-cash collateral.
Gross
Amount of
Recognized
Assets
(Value of | | Value of
Cash | | Value of Non-cash Collateral
Received by Maturity | | | |
Securities on
Loan) | | Collateral
Received* | | <30 Days | | Between 30 &
90 days | | >90 Days | | Net
Amount | |
| $ | 111,669 | | | $ | 111,669 | | | $ | — | | | $ | — | | | $ | — | | | $ | — | | |
* Collateral received in excess of the market value of securities on loan is not presented in this table. The total cash collateral received by the Fund is disclosed in the Statement of Assets and Liabilities.
20
Victory Variable Insurance Funds | | Notes to Financial Statements — continued
December 31, 2019 | |
Foreign Currency Translations:
The accounting records of the Fund are maintained in U.S. dollars. Investment securities and other assets and liabilities of the Fund denominated in a foreign currency are translated into U.S. dollars at current exchange rates. Purchases and sales of securities, income receipts and expense payments are translated into U.S. dollars at the exchange rates on the date of the transactions. The Fund does not isolate the portion of the results of operations resulting from changes in foreign exchange rates on investments from fluctuations arising from changes in market prices of securities held. Such fluctuations are disclosed as Net change in unrealized appreciation/depreciation on investment securities and foreign currency translations on the Statement of Operations. Any realized gains or losses from these fluctuations are disclosed as Net realized gains (losses) from investments and foreign currency translations on the Statement of Operations.
Foreign Taxes:
The Fund may be subject to foreign taxes related to foreign income received (a portion of which may be reclaimable), capital gains on the sale of securities, and certain foreign currency transactions. All foreign taxes are recorded in accordance with the applicable regulations and rates that exist in the foreign jurisdictions in which the Fund invests.
Distributions to Shareholders:
Dividends from net investment income, if any, are declared and paid annually by the Fund. Distributable net realized gains, if any, are declared and distributed at least annually.
The amounts of dividends from net investment income and distributions from net realized gains are determined in accordance with federal income tax regulations, which may differ from GAAP. To the extent these "book/tax" differences are permanent in nature (e.g., net operating loss and distribution reclassification), such amounts are reclassified within the components of net assets based on their federal tax-basis treatment; temporary differences (e.g., wash sales) do not require reclassification. To the extent dividends and distributions exceed net investment income and net realized gains for tax purposes, they are reported as distributions of capital. Net investment losses incurred by the Fund may be reclassified as an offset to capital on the accompanying Statement of Assets and Liabilities.
Total
Distributable
Earnings/(Loss) | | Capital | |
| $ | 1 | | | $ | (1 | ) | |
Federal Income Taxes:
It is the policy of the Fund to continue to qualify as a regulated investment company by complying with the provisions available to certain investment companies, as defined in applicable sections of the Internal Revenue Code, and to make distributions of net investment income and net realized gains sufficient to relieve it from all, or substantially all, federal income taxes. Accordingly, no provision for federal income taxes is required in the financial statements. The Fund has a tax year end of December 31.
Management of the Fund has reviewed tax positions taken in tax years that remain subject to examination by all major tax jurisdictions, including federal (i.e., all open tax years and the interim tax period since then). Management believes that there is no tax liability resulting from unrecognized tax benefits related to uncertain tax positions taken.
Allocations:
Expenses directly attributable to the Fund are charged to the Fund, while expenses which are attributable to more than one fund in the Trust, or jointly with an affiliated trust, are allocated among the respective funds in the Trust and/or affiliated trust based upon net assets or another appropriate basis.
21
Victory Variable Insurance Funds | | Notes to Financial Statements — continued
December 31, 2019 | |
Cross-Trade Transactions:
Pursuant to Rule 17a-7 under the 1940 Act, the Fund may engage in cross-trades which are securities transactions with affiliated investment companies and advisory accounts managed by the Adviser and any applicable sub-adviser. Any such purchase or sale transaction must be effected without brokerage commission or other remuneration, except for customary transfer fees. The transaction must be effected at the current market price, which is either the security's last sale price on an exchange or, if there are no transactions in the security that day, at the average of the highest bid and lowest asked price. For the year ended December 31, 2019, the Fund did not engage in any Rule 17a-7 transactions under the 1940 Act.
3. Purchases and Sales of Securities:
Purchases and sales of securities (excluding securities maturing less than one year from acquisition) for the year ended December 31, 2019 were as follows for the Fund:
| Purchases | | Sales | |
| $ | 47,203,055 | | | $ | 69,437,460 | | |
For the year ended December 31, 2019, there were no purchases or sales of U.S. Government Securities.
4. Fees and Transactions with Affiliates and Related Parties:
Investment advisory services are provided to the Fund by Victory Capital Management Inc. ("VCM" or the "Adviser"), a New York corporation registered as an investment adviser with the Securities and Exchange Commission ("SEC"). The Adviser is a wholly owned indirect subsidiary of Victory Capital Holdings, Inc., a publicly traded Delaware corporation, and a wholly owned direct subsidiary of Victory Capital Operating, LLC.
Under the terms of the Investment Advisory Agreement, the Adviser is entitled to receive 0.80% of the average daily net assets of the Fund. The Adviser may use its resources to assist with the Fund's distribution and marketing expenses.
VCM also serves as the Fund's administrator and fund accountant. Under an Administration and Fund Accounting Agreement, VCM is paid for its services an annual fee at a rate of 0.08% of the first $15 billion in average daily net assets of the Trust, Victory Portfolios and Victory Portfolios II (collectively, the "Victory Funds Complex"), 0.05% of the average daily net assets above $15 billion to $30 billion of the Victory Funds Complex and 0.04% of the average daily net assets over $30 billion of the Victory Funds Complex.
Citi Fund Services Ohio, Inc. ("Citi"), an affiliate of Citibank, acts as sub-administrator and sub-fund accountant to the Fund pursuant to a Sub-Administration and Sub-Fund Accounting Services Agreement between VCM and Citi. VCM pays Citi a fee for providing these services. The Trust reimburses VCM and Citi for all of their reasonable out-of-pocket expenses incurred in providing these services.
FIS Investor Services, LLC ("FIS") serves as the Fund's transfer agent. Under the Transfer Agent Agreement, the Trust pays FIS a fee for its services and reimburses FIS for all of their reasonable out-of-pocket expenses incurred in providing these services.
The Chief Compliance Officer ("CCO") is an employee of the Adviser, which pays the compensation of the CCO and his support staff. The Trust has entered into an Agreement to provide compliance services with the Adviser, pursuant to which the Adviser furnishes its compliance personnel, including the services of the CCO, and other resources reasonably necessary to provide the Trust with compliance oversight services related to the design, administration and oversight of a compliance program for the Trust in accordance with Rule 38a-1 under the 1940 Act. The Funds in the Victory Funds Complex, in aggregate, compensate the Adviser for these services.
The Victory Funds Complex pays an annual retainer to each Independent Trustee, plus an additional annual retainer to the Chairman of the Board. The aggregate amount of the fees and expenses of the Independent Trustees are allocated amongst all the funds in the Victory Funds Complex and are presented in the Statement of Operations.
22
Victory Variable Insurance Funds | | Notes to Financial Statements — continued
December 31, 2019 | |
Shearman & Sterling LLP provides legal services to the Trust.
Victory Capital Advisers, Inc. (the "Distributor"), an affiliate of the Adviser, serves as distributor for the continuous offering of the shares of the Fund pursuant to a Distribution Agreement between the Distributor and the Trust.
The Adviser has entered into an expense limitation agreement with the Fund until at least April 30, 2020. Under the terms of the agreement, the Adviser has agreed to waive fees or reimburse certain expenses to the extent that ordinary operating expenses incurred by the Fund in any fiscal year exceed the expense limit for the Fund. Such excess amounts will be the liability of the Adviser. Interest, taxes, brokerage commissions, other expenditures which are capitalized in accordance with GAAP, and other extraordinary expenses not incurred in the ordinary course of a Fund's business are excluded from the expense limits. As of December 31, 2019, the expense limit (excluding voluntary waivers) is 0.93%.
The Fund has agreed to repay fees and expenses that were waived or reimbursed by the Adviser for a period up to three fiscal years after such waiver or reimbursement was made to the extent such payments or repayments would not cause the expenses to exceed the original expense limitation in place at time of the waiver or reimbursement or any expense limitation agreement in place at the time of repayment. As of December 31, 2019, the following amounts are available to be repaid to the Adviser. Amounts repaid to the Adviser during the year ended, if any, are reflected on the Statement of Operations as "Recoupment of prior expenses waived/reimbursed by Adviser".
Expires
December 31,
2020 | | Expires
December 31,
2021 | | Expires
December 31,
2022 | | Total | |
| $ | 39,115 | | | $ | 15,196 | | | $ | 37,537 | | | $ | 91,848 | | |
The Adviser may voluntarily waive or reimburse additional fees to assist the Fund in maintaining a competitive expense ratio. Voluntary waivers and reimbursements applicable to the Fund are not available to be recouped at a future time. There were no voluntary waivers or reimbursements for the year ended December 31, 2019.
Certain officers and/or interested trustees of the Fund are also officers and/or employees of the Adviser, Administrator, Fund Accountant, Sub-Administrator, Sub-Fund Accountant and Legal Counsel.
5. Risks:
The Fund may be subject to other risks in addition to these identified risks.
An investment in the Fund's shares represents an indirect investment in the securities owned by the Fund, some of which will be traded on a national securities exchange or in the over-the-counter markets. The value of the securities in which the Fund invests, like other market investments, may move up or down, sometimes rapidly and unpredictably. The value of the securities in which the Fund invests may affect the value of the Fund's shares. An investment in the Fund's shares at any point in time may be worth less than the original investment, even after taking into account the reinvestment of the Fund's distributions.
The Fund will be subject to foreign securities risk. Foreign securities are (including ADRs and other depository receipts) are subject to political, regulatory, and economic risks not present in domestic investments. In addition, when the Fund buys securities denominated in a foreign currency, there are special risks such as changes in currency exchange rates and the risk that a foreign government could regulate foreign exchange transactions. In addition, to the extent investments are made in a limited number of countries, events in those countries will have a more significant impact on the Fund.
The Fund will be subject to emerging market risk. Risk of investment in emerging markets include greater political and economic instability, greater volatility in currency exchange rates, less developed securities markets, possible trade barriers, currency transfer restrictions, a more limited number of potential buyers and issuers, an emerging market country's dependence on revenue from particular commodities or international aid, less governmental supervision and regulation, unavailability of currency hedging techniques, differences in auditing and financial reporting standards and less developed legal systems.
The Fund will be subject to credit risk with respect to the amount it expects to receive from counterparties for financial instruments entered into by the Fund. The Fund may be negatively impacted
23
Victory Variable Insurance Funds | | Notes to Financial Statements — continued
December 31, 2019 | |
if a counterparty becomes bankrupt or otherwise fails to perform its obligations due to financial difficulties. The Fund may experience significant delays in obtaining any recovery in bankruptcy or other reorganization proceeding and the Fund may obtain only limited recovery or may obtain no recovery in such circumstances. The Fund typically enters into transactions with counterparties whose credit ratings are investment grade, as determined by a nationally recognized statistical rating organization or, if unrated, judged by the Adviser to be of comparable quality.
6. Borrowing and Interfund Lending:
Line of Credit:
For the year ended December 31, 2019, the Victory Funds Complex participated in a short-term, demand note "Line of Credit" with Citibank. Under the agreement with Citibank, for the period January 1, 2019 to June 30, 2019, the Victory Funds Complex could borrow up to $250 million, of which $100 million was committed and $150 million was uncommitted. Effective July 1, 2019, the agreement was amended to include the USAA Mutual Funds Complex (another series of mutual funds managed by the Adviser) and has a new termination date of June 29, 2020. Under this amended agreement, the Victory Funds Complex and USAA Mutual Funds Complex, combined, may borrow up to $600 million, of which $300 million is committed and $300 million is uncommitted. $40 million of the Line of Credit is reserved for use by the Victory Floating Rate Fund (herein, the "Fund"), another series of the Victory Funds Complex, with that Fund paying the related commitment fees for that amount. The purpose of the agreement is to meet temporary or emergency cash needs, including redemption requests that might otherwise require the untimely disposition of securities. With the agreement in effect for the period January 1, 2019 to June 30, 2019, Citibank received an annual commitment fee of 0.15% on $100 million for providing the Line of Credit. For the period July 1, 2019 to December 31, 2019, Citibank received an annual commitment fee of 0.15% on $300 million for providing the Line of Credit. For the year ended December 31, 2019, Citibank earned approximately $300 thousand in commitment fees from the combined Victory Funds Complex and USAA Mutual Funds Complex. Each fund in the Victory Funds Complex and the USAA Mutual Funds Complex pays a pro-rata portion of the commitment fees plus any interest (one month LIBOR plus one percent) on amounts borrowed. Interest charged to the Fund during the period, if applicable, is presented on the Statement of Operations under Line of credit fees.
The Fund did not utilize the Line of Credit during the year ended December 31, 2019.
Interfund Lending:
The Trust and Adviser rely on an exemptive order granted by the SEC in March 2017 (the "Order"), permitting the establishment and operation of an Interfund Lending Facility (the "Facility"). The Facility allows the Fund to directly lend and borrow money to or from any other Victory Fund relying upon the Order at rates beneficial to both the borrowing and lending funds. Advances under the Facility are allowed for temporary or emergency purposes, including the meeting of redemption requests that otherwise might require the untimely disposition of securities, and are subject to each fund's borrowing restrictions. The interfund loan rate is determined, as specified in the Order, by averaging the current repurchase agreement rate and the current bank loan rate. As a Borrower, interest charged to the Fund during the period, if applicable, is presented on the Statement of Operations under Interfund lending fees. As a Lender, interest earned by the Fund during the period, if applicable, is presented on the Statement of Operations under Income on interfund lending.
The Fund did not utilize the Facility during the year ended December 31, 2019.
7. Federal Income Tax Information:
The tax character of distributions paid during the most recent tax years ended, as noted below, were as follows (total distributions paid may differ from the Statements of Changes in Net Assets because, for tax purposes, dividends are recognized when actually paid).
24
Victory Variable Insurance Funds | | Notes to Financial Statements — continued
December 31, 2019 | |
| | Year Ended December 31, 2019 | |
| | | Distributions paid from | |
| | | Ordinary
Income | | Net
Long-Term
Capital Gains | | Total
Distributions
Paid | |
| | | $ | 3,274,066 | | | $ | 8,853,692 | | | $ | 12,127,758 | | |
| | | Year Ended December 31, 2018 | |
| | | Distributions paid from | |
| | | Ordinary
Income | | Net
Long-Term
Capital Gains | | Total
Distributions
Paid | |
| | | | | $ | 1,384,165 | | | $ | 1,236,976 | | | $ | 2,621,141 | | |
As of the tax year ended December 31, 2019, the components of distributable earnings/accumulated deficit on a tax basis were as follows:
Undistributed
Ordinary
Income | | Undistributed
Long-Term
Capital
Gains | | Accumulated
Earnings | | Accumulated
Capital and
Other
Losses | | Unrealized
Appreciation
(Depreciation)* | | Total
Accumulated
Earnings
(Deficit) | |
| $ | 3,686,531 | | | $ | 4,006,642 | | | $ | 7,693,173 | | | $ | — | | | $ | 23,231,679 | | | $ | 30,924,852 | | |
*The difference between the book-basis and tax-basis unrealized appreciation (depreciation) is attributable primarily to tax deferral of losses on wash sales.
During the tax year ended December 31, 2019, the Fund did not utilize capital loss carryforwards.
As of December 31, 2019, the cost basis for federal income tax purposes, gross unrealized appreciation, gross unrealized depreciation and net unrealized appreciation (depreciation) for investments and derivatives were as follows:
Cost of
Investments
for Federal
Tax Purposes | | Gross
Unrealized
Appreciation | | Gross
Unrealized
Depreciation | | Net
Unrealized
Appreciation
(Depreciation) | |
| $ | 122,238,727 | | | $ | 29,526,916 | | | $ | (6,299,110 | ) | | $ | 23,227,806 | | |
8. Capital Contribution from Prior Custodian:
During 2016, the Fund received notification from the Fund's prior custodian, State Street Bank and Trust ("State Street"), concerning issues related to billing on certain categories of expenses during the approximately 16-year period from 1998 through October 31, 2014. The over-billing primarily related to categories of expenses that involved an allocation of general costs among multiple clients.
State Street paid the refunded amounts during January 2017. Based on billing information received during 2016 from State Street and an analysis of any expense limitation agreements that were in place during the period of the activities in question, including the application of any recoupment provisions in such agreements, the Adviser received a portion of the refund.
The portion of the refund retained by the Fund was accounted for as a capital contribution and is reflected on the Financial Highlights as "Capital Contribution from Prior Custodian, Net".
25
Victory Variable Insurance Funds | | Notes to Financial Statements — continued
December 31, 2019 | |
9. Fund Ownership:
Ownership of more than 25% of the voting securities of a fund creates presumptions of control of the Fund, under section 2(a)(9) of the 1940 Act. As of December 31, 2019, the shareholder listed below held more than 25% of the shares outstanding of the Fund and may be deemed to control the Fund.
| Shareholder | | Percent | |
| GIAC | | | 99.8 | % | |
10. Subsequent Events:
The Fund has evaluated the need for additional disclosures or adjustments resulting from subsequent events through the date these financial statements were issued. Based on this evaluation, there were no subsequent events to report that would have a material impact on the Fund's financial statements.
26
REPORT OF INDEPENDENT REGISTERED PUBLIC ACCOUNTING FIRM
To the Shareholders and Board of Trustees of Victory Variable Insurance Funds
Opinion on the Financial Statements
We have audited the accompanying statement of assets and liabilities, including the schedule of portfolio investments, of Victory RS International VIP Series (the "Fund"), a series of Victory Variable Insurance Funds, as of December 31, 2019, the related statements of operations and changes in net assets, including the related notes, and the financial highlights for the year then ended (collectively referred to as the "financial statements"). In our opinion, the financial statements present fairly, in all material respects, the financial position of the Fund as of December 31, 2019, the results of its operations, the changes in its net assets, and the financial highlights for the year then ended, in conformity with accounting principles generally accepted in the United States of America.
The Fund's financial statements and financial highlights for the three years ended December 31, 2018, were audited by other auditors whose report dated February 15, 2019 and the Fund's financial highlights for the year ended December 31, 2015, were audited by other auditors whose report dated February 22, 2016, expressed unqualified opinions on those financial statements and financial highlights.
Basis for Opinion
These financial statements are the responsibility of the Fund's management. Our responsibility is to express an opinion on the Fund's financial statements based on our audit. We are a public accounting firm registered with the Public Company Accounting Oversight Board (United States) ("PCAOB") and are required to be independent with respect to the Fund in accordance with the U.S. federal securities laws and the applicable rules and regulations of the Securities and Exchange Commission and the PCAOB.
We conducted our audit in accordance with the standards of the PCAOB. Those standards require that we plan and perform the audit to obtain reasonable assurance about whether the financial statements are free of material misstatement whether due to error or fraud.
Our audit included performing procedures to assess the risks of material misstatement of the financial statements, whether due to error or fraud, and performing procedures that respond to those risks. Such procedures included examining, on a test basis, evidence regarding the amounts and disclosures in the financial statements. Our procedures included confirmation of securities owned as of December 31, 2019, by correspondence with the custodian. Our audit also included evaluating the accounting principles used and significant estimates made by management, as well as evaluating the overall presentation of the financial statements. We believe that our audit provides a reasonable basis for our opinion.
We have served as the auditor of one or more of the investment companies advised by Victory Capital Management, Inc. since 2015.

COHEN & COMPANY, LTD.
Cleveland, Ohio
February 18, 2020
27
Victory Variable Insurance Funds | | Supplemental Information
December 31, 2019 | |
(Unaudited)
Trustee and Officer Information
Board of Trustees:
Overall responsibility for management of the Trust rests with the Board. The Trust is managed by the Board in accordance with the laws of the State of Delaware. There are currently ten Trustees, nine of whom are not "interested persons" of the Trust within the meaning of that term under the 1940 Act ("Independent Trustees") and one of whom is an "interested person" of the Trust within the meaning of that term under the 1940 Act ("Interested Trustee"). The Trustees, in turn, elect the officers of the Trust to actively supervise its day-to-day operations. The following tables list the Trustees, their ages, position with the Trust, commencement of service, principal occupations during the past five years and any directorships of other investment companies or companies whose securities are registered under the Securities Exchange Act of 1934, as amended, or who file reports under that Act. Each Trustee oversees nine portfolios in the Trust, 42 portfolios in Victory Portfolios and 26 portfolios in Victory Portfolios II, each a registered investment company that, together with the Trust, comprise the Victory Funds Complex. Each Trustee's address is c/o Victory Variable Insurance Funds, 4900 Tiedeman Road, 4th Floor, Brooklyn, Ohio 44144. Each Trustee has an indefinite term.
Name and Age | | Position
Held with
the Trust | | Date
Commenced
Service | | Principal Occupation
During Past 5 Years | | Other
Directorships
Held During
Past 5 Years | |
Independent Trustees. | |
David Brooks Adcock, 68 | | Trustee | | February 2005 | | Consultant (since 2006). | | Chair and Trustee, Turner Funds (December 2016-December 2017). | |
Nigel D.T. Andrews, 72 | | Vice Chair and Trustee | | August 2002 | | Retired. | | Director, TCG BDC II, Inc. (since 2017);
Director, TCG BDC I, Inc. (formerly Carlyle GMS Finance, Inc.) (since 2012); Director, Old Mutual US Asset Management (2002-2014). | |
E. Lee Beard, 68* | | Trustee | | February 2005 | | Retired (since 2015); Consultant, The Henlee Group, LLC (consulting) (2005-2015). | | None. | |
Dennis M. Bushe, 76 | | Trustee | | July 2016 | | Retired. | | Trustee, RS Investment Trust and RS Variable Products Trust (November 2011-July 2016). | |
28
Victory Variable Insurance Funds | | Supplemental Information — continued
December 31, 2019 | |
(Unaudited)
Name and Age | | Position
Held with
the Trust | | Date
Commenced
Service | | Principal Occupation
During Past 5 Years | | Other
Directorships
Held During
Past 5 Years | |
Sally M. Dungan, 65 | | Trustee | | February 2011 | | Chief Investment Officer, Tufts University (since 2002). | | None. | |
John L. Kelly, 66 | | Trustee | | February 2015 | | Partner, McCarvill Capital Partners (September 2016-September 2017); Advisor, Endgate Commodities LLC (January 2016-April 2016); Managing Partner, Endgate Commodities LLC (August 2014-January 2016); Chief Operating Officer, Liquidnet Holdings, Inc. (December 2011-July 2014). | | Director, Caledonia Mining Corporation (since May 2012). | |
David L. Meyer, 62* | | Trustee | | December 2008 | | Retired. | | None. | |
Gloria S. Nelund, 58 | | Trustee | | July 2016 | | Chair, CEO and Co-Founder of TriLinc Global, LLC, an investment firm. | | TriLinc Global Impact Fund, LLC (since 2012); Trustee, RS Investment Trust and RS Variable Products Trust (November 2007-July 2016). | |
Leigh A. Wilson, 75 | | Chair and Trustee | | February 1998 | | Private Investor. | | Chair (since 2013), Caledonia Mining Corporation. | |
Interested Trustee. | |
David C. Brown, 47** | | Trustee | | May 2008 | | Chairman and Chief Executive Officer (since 2013), Co-Chief Executive Officer (2011-2013), the Adviser; Chairman and Chief Executive Officer, Victory Capital Holdings, Inc. (since 2013). | | USAA Mutual Funds Trust. | |
* The Board has designated Mr. Meyer and Ms. Beard as its Audit Committee Financial Experts.
** Mr. Brown is an "Interested Person" by reason of his relationship with the Adviser.
The Statement of Additional Information includes additional information about the Trustees of the Trust and is available, without charge, by calling 800-539-3863.
29
Victory Variable Insurance Funds | | Supplemental Information — continued
December 31, 2019 | |
(Unaudited)
Officers:
The officers of the Trust, their ages, commencement of service and their principal occupations during the past five years, are detailed in the following table. Each officer serves until the earlier of his or her resignation, removal, retirement, death, or the election of a successor. The mailing address of each officer of the Trust is 4900 Tiedeman Road, 4th Floor, Brooklyn, Ohio 44144. The officers of the Trust receive no compensation directly from the Trust for performing the duties of their offices.
Name and Age | | Position with
the Trust | | Date
Commenced
Service | | Principal Occupation During Past 5 Years | |
Christopher K. Dyer, 58 | | President | | February 2006* | | Director of Fund Administration, the Adviser. | |
Scott A. Stahorsky, 50 | | Vice President | | December 2014 | | Manager, Fund Administration, the Adviser (since 2015); Senior Analyst, Fund Administration, the Adviser (prior to 2015). | |
Erin G. Wagner, 46 | | Secretary | | December 2014 | | Associate General Counsel, the Adviser (since 2013). | |
Allan Shaer, 54 | | Treasurer | | May 2017 | | Senior Vice President, Financial Administration, Citi Fund Services Ohio, Inc. (since 2016); Vice President, Mutual Fund Administration, JP Morgan Chase (2011-2016). | |
Christopher A. Ponte, 35 | | Assistant Treasurer | | December 2017 | | Manager, Fund Administration, the Adviser (since 2017); Senior Analyst, Fund Administration, the Adviser (prior to 2017); Chief Financial Officer, Victory Capital Advisers, Inc. (since 2018). | |
Colin Kinney, 46 | | Chief Compliance Officer | | July 2017 | | Chief Compliance Officer (since 2013) and Chief Risk Officer (2009-2017), the Adviser. | |
Chuck Booth, 59 | | Anti-Money Laundering Compliance Officer and Identity Theft Officer | | May 2015 | | Director, Regulatory Administration and CCO Support Services, Citi Fund Services Ohio, Inc. | |
Jay G. Baris, 66 | | Assistant Secretary | | February 1998 | | Partner, Shearman & Sterling LLP (since 2018); Partner, Morrison & Foerster LLP (2011-January 2018). | |
* On December 3, 2014, Mr. Dyer resigned as Secretary of the Trust and accepted the position of President.
30
Victory Variable Insurance Funds | | Supplemental Information — continued
December 31, 2019 | |
(Unaudited)
Proxy Voting and Portfolio Holdings Information
Proxy Voting:
Information regarding the policies and procedures the Fund uses to determine how to vote proxies relating to portfolio securities is available without charge, upon request, by calling 800-539-3863. The information is also included in the Fund's Statement of Additional Information, which is available on the SEC's website at www.sec.gov.
Information relating to how the Fund voted proxies relating to portfolio securities held during the most recent twelve months ended June 30 is available on the SEC's website at www.sec.gov.
Availability of Schedules of Portfolio Investments:
The Trust files a complete list of Schedules of Portfolio Investments with the SEC for the first and third quarters of each fiscal year on Form N-PORT. Prior to the implementation of Form N-PORT, the Trust filed a complete list of Schedules of Portfolio Investments with the SEC for the first and third quarters of each fiscal year on Form N-Q. Forms N-PORT and Forms N-Q are available on the SEC's website at www.sec.gov.
Expense Examples
As a shareholder of the Fund, you may incur two types of costs: (1) transaction costs and (2) ongoing costs, including management fees, distribution and service (12b-1) fees, and other Fund expenses. These examples are intended to help you understand your ongoing costs (in dollars) of investing in the Fund and to compare these costs with the ongoing costs of investing in other mutual funds.
These examples are based on an investment of $1,000 invested at the beginning of the period and held for the entire period from July 1, 2019 through December 31, 2019.
The Actual Expense figures in the table below provide information about actual account values and actual expenses. You may use the information below, together with the amount you invested, to estimate the expenses that you paid over the period. Simply divide your account value by $1,000 (for example, an $8,600 account value divided by $1,000 = 8.6), then multiply the result by the number in the table under the heading entitled "Actual Expenses Paid During Period" to estimate the expenses you paid on your account during this period.
The Hypothetical Expense figures in the table below provide information about hypothetical account values and hypothetical expenses based on the Fund's actual expense ratio and an assumed rate of return of 5% per year before expenses, which is not the Fund's actual return. The hypothetical account values and expenses may not be used to estimate the actual ending account balance or expenses you paid for the period. You may use this information to compare this 5% hypothetical example with the 5% hypothetical examples that appear in shareholder reports of other funds.
Please note the expenses shown in the table are meant to highlight your ongoing costs only and do not reflect any transactional costs. Therefore, the table is useful in comparing ongoing costs only, and will not help you determine the relative total costs of owning different funds. In addition, if these transactional costs were included, your costs would have been higher.
Beginning
Account Value
7/1/19 | | Actual
Ending
Account Value
12/31/19 | | Hypothetical
Ending
Account Value
12/31/19 | | Actual
Expenses
Paid During
Period
7/1/19-12/31/19* | | Hypothetical
Expenses
Paid During
Period
7/1/19-12/31/19* | | Annualized
Expense Ratio
During Period
7/1/19-12/31/19 | |
$ | 1,000.00 | | | $ | 1,058.20 | | | $ | 1,020.52 | | | $ | 4.82 | | | $ | 4.74 | | | | 0.93 | % | |
* Expenses are equal to the average account value multiplied by the Fund's annualized expense ratio multiplied by 184/365 (the number of days in the most recent fiscal half-year divided by the number of days in the fiscal year).
31
Victory Variable Insurance Funds | | Supplemental Information — continued
December 31, 2019 | |
(Unaudited)
Additional Federal Income Tax Information
For the year ended December 31, 2019, the Fund paid qualified dividend income for the purposes of reduced individual federal income tax rates of 64%.
For the year ended December 31, 2019, the Fund designated long-term capital gain distributions in the amount of $8,853,692.
The Fund intends to elect to pass through to shareholders the income tax credit for taxes paid to foreign countries. Foreign source income and foreign tax expense per shares outstanding on December 31, 2019 were $0.58 and $0.06, respectively.
32
Victory Variable Insurance Funds | | Supplemental Information — continued
December 31, 2019 | |
(Unaudited)
Considerations of the Board in Continuing the Investment Advisory Agreement (the "Agreement")
The Board approved the Agreement on behalf of the Fund at an in-person meeting, which was called for that purpose, on December 4, 2019. The Board also considered information relating to the Fund and the Agreement provided throughout the year and, more specifically, at a meeting on October 22, 2019. The Board noted that prior to the Fund's reorganization on July 29, 2016, the Fund was managed by RS Investment Management Co. LLC, which was acquired by the Adviser on July 29, 2016. In considering whether to approve the Agreement, the Board requested, and the Adviser provided, information that the Board believed to be reasonably necessary to reach its conclusions.
The Board, including the Independent Trustees, evaluated this information along with other information obtained throughout the year and was advised by legal counsel to the Fund, which also serves as independent legal counsel to the Independent Trustees. In addition, in 2017 the Independent Trustees, through their counsel, retained an independent consultant to assist with a review of the overall process for conducting the annual review of these advisory arrangements.
The Board considered the Fund's advisory fee, expense ratio and investment performance as significant factors in determining whether the Agreement should be continued. In considering whether the compensation paid to the Adviser was fair and reasonable, the Board also evaluated, among other things, the following factors:
• The requirements of the Fund for the services provided by the Adviser;
• The nature, quality and extent of the services provided and expected to be provided;
• The performance of the Fund as compared to comparable funds;
• The fees payable for the services and whether the fee arrangements provided for economies of scale that would benefit Fund shareholders as the Fund grows;
• Whether the fee would be sufficient to enable the Adviser to attract and retain experienced personnel and continue to provide quality services to the Fund;
• The fees paid by other clients of the Adviser whose accounts are managed in a similar investment style and any differences in the services provided to the other clients compared to those provided to the Fund;
• The total expenses of the Fund, taking into consideration any distribution or shareholder servicing fees;
• Management's commitment to operating the Fund at competitive expense levels;
• The profitability of the Adviser (as reflected by comparing fees earned against an estimate of the Adviser's costs) with respect to the Adviser's relationship with the Fund;
• Research and other service benefits received by the Adviser obtained through payment of client commissions for securities transactions;
• Other benefits received by the Adviser, and its affiliates, including revenues paid to the Adviser, or its affiliates, by the Fund for administration and fund accounting services, and distribution;
• The capabilities and financial condition of the Adviser;
• Current economic and industry trends; and
• The historical relationship between the Fund and the Adviser.
The Board reviewed the Fund's current management fee, comprised of the advisory fee plus the administrative services fee paid to the Adviser, in the context of the Adviser's profitability with respect to the Fund. In addition, the Board compared the Fund's total operating expense ratio on a net and gross basis, taking into consideration any distribution or shareholder servicing fees and management fees with a universe of comparable mutual funds compiled by an independent consultant and a peer group of funds with similar investment strategies selected by that independent consultant from the universe. The Board reviewed the factors and methodology used by the independent consultant in the selection of the Fund's peer group, including the independent consultant's selection of a broad universe of funds, the more specific universe of comparable funds, and peer groups of funds with comparable investment strategies and asset levels, among other factors. The Board also reviewed any changes to the independent consultant's methodology as compared to the prior year, including those resulting from the Adviser's input, if any. The Board also reviewed fees and other information related to
33
Victory Variable Insurance Funds | | Supplemental Information — continued
December 31, 2019 | |
(Unaudited)
the Adviser's management of similarly managed institutional or private accounts, and the differences in the services provided to the other accounts, to the extent applicable. The Board noted that the advisory fee arrangements for the Fund do not include breakpoints, which are generally viewed as a method by which the investment adviser shares any economies of scale with a fund as a fund grows. The Board also considered the Adviser's commitment to limit expenses as discussed in more detail below, and would consider breakpoints at a future time if the Fund's assets were to grow significantly.
The Board reviewed the Fund's performance over one-, three-, five- and ten-year periods against the performance of the Fund's selected peer group and benchmark index. The Board recognized that the performance of the Fund and the peer group funds are net of expenses, while the performance of the benchmark index reflects gross returns. The Board considered the additional resources that the Adviser has committed to enhance portfolio analysis, compliance and trading systems. The Board noted that, following the Fund's reorganization, the Fund is managed by substantially the same investment management team that managed the comparable predecessor fund.
The Board reviewed various other specific factors with respect to the Fund, as described below. In their deliberations, the Trustees did not rank the importance of any particular information or factor considered and each Trustee may have attributed different weights to various factors.
The Board concluded that the Fund's gross annual management fee was reasonable as compared to the median gross management fee charged to the funds in the Fund's peer group. The Board noted that the Fund's net annual expense ratio, taking into account any shareholder servicing or distribution fees, was reasonable as compared to the median expense ratio for the peer group. The Board considered the Adviser's contractual agreement to waive its fees and reimburse expenses for a specified period of time, as described in the Fund's prospectus. The Board then compared the Fund's performance for the one-, three-, five- and ten-year periods ended June 30, 2019, to that of the median performance of the peer group and benchmark index for the same periods and considered the fact that the Fund outperformed both the benchmark index and the peer group median for all of the periods reviewed.
Having considered, among other things: (1) that the Fund's management fee was within the ranges of advisory fees charged to comparable mutual funds; (2) that the Fund's total expense ratio was reasonable; (3) the Adviser's willingness to limit the expenses for a period of time would provide stability to the Fund's expenses during that period; and (4) the performance of the Fund, the Board concluded that the Agreement continued to be in the best interests of the Fund's shareholders.
Conclusion
Based on its review of the information requested and provided, and following extended discussions, the Board determined that the Agreement, on behalf of the Fund, was consistent with the best interests of the Fund and its shareholders, and the Board unanimously approved the Agreement, on behalf of the Fund, for an additional annual period on the basis of the foregoing review and discussions and the following considerations, among others:
• The fairness and reasonableness of the investment advisory fee payable to the Adviser under the Agreement in light of the investment advisory services provided, the costs of these services, the profitability of the Adviser's relationship with the Fund and the comparability of the fee paid to the fees paid by other investment companies;
• The nature, quality and extent of the investment advisory services provided by the Adviser;
• The Adviser's entrepreneurial commitment to the management of the Fund and the creation of a broad-based family of funds, which could entail a substantial commitment of the Adviser's resources to the successful operation of the Fund;
• The Adviser's representations regarding its staffing and capabilities to manage the Fund, including the retention of personnel with relevant portfolio management experience;
• The Adviser's efforts to enhance investment results by, among other things, developing quality portfolio management teams; and
• The overall high quality of the personnel, operations, financial condition, investment management capabilities, methodologies and performance of the Adviser.
34
Privacy Policy
Protecting the Privacy of Information
The Trust respects your right to privacy. We also know that you expect us to conduct and process your business in an accurate and efficient manner. To do so, we must collect and maintain certain personal information about you. This is the information we collect from you on applications or other forms, and from the transactions you make with us or third parties. It may include your name, address, social security number, account transactions and balances, and information about investment goals and risk tolerance.
We do not disclose any information about you or about former customers to anyone except as permitted or required by law. Specifically, we may disclose the information we collect to companies that perform services on our behalf, such as the transfer agent that processes shareholder accounts and printers and mailers that assist us in the distribution of investor materials. We may also disclose this information to companies that perform marketing services on our behalf. This allows us to continue to offer you Victory investment products and services that meet your investing needs, and to effect transactions that you request or authorize. These companies will use this information only in connection with the services for which we hired them. They are not permitted to use or share this information for any other purpose.
To protect your personal information internally, we permit access only by authorized employees and maintain physical, electronic and procedural safeguards to guard your personal information.*
* You may have received communications regarding information about privacy policies from other financial institutions which gave you the opportunity to "opt-out" of certain information sharing with companies which are not affiliated with that financial institution. The Trust does not share information with other companies for purposes of marketing solicitations for products other than the Trust. Therefore, the Trust does not provide opt-out options to their shareholders.
Victory Funds
P.O. Box 182593
Columbus, Ohio 43218-2593

Visit our website at: | | Call Victory at: | |
www.vcm.com | | 800-539-FUND (800-539-3863) | |

December 31, 2019
Annual Report
Victory Variable Insurance Funds
Victory RS Large Cap Alpha VIP Series
Beginning January 1, 2021, as permitted by regulations adopted by the Securities and Exchange Commission, paper copies of the Fund's shareholder reports may no longer be sent by mail from the insurance company that issued your variable annuity and variable life insurance contract, unless you specifically request paper copies of the reports from your insurance company. Instead, the reports will be made available on www.victoryfunds.com. The insurance company that offers your contract may also make these reports available on a website, and such insurance company will notify you by mail each time a report is posted and provide you with a website link to access the report.
If you already elected to receive shareholder reports electronically, you will not be affected by this change and you need not take any action. You may elect to receive shareholder reports and other communications from the insurance company electronically by following the instructions provided by the insurance company.
If offered by your insurance company, you may elect to receive all future reports in paper and free of charge from the insurance company. You can inform your insurance company that you wish to continue receiving paper copies of your reports. Your election to receive reports in paper will apply to all funds available under your contract.
www.vcm.com
News, Information And Education 24 Hours A Day, 7 Days A Week
The Victory Funds site gives fund shareholders, prospective shareholders, and investment professionals a convenient way to access fund information, get guidance, and track fund performance anywhere they can access the Internet. The site includes:
• Detailed performance records
• Daily share prices
• The latest fund news
• Investment resources to help you become a better investor
• A section dedicated to investment professionals
Whether you're a potential investor searching for the fund that matches your investment philosophy, a seasoned investor interested in planning tools, or an investment professional, www.vcm.com has what you seek. Visit us anytime. We're always open.
Victory Variable Insurance Funds
Table of Contents
Shareholder Letter (Unaudited) | | | 3 | | |
Fund Review and Commentary (Unaudited) | | | 5 | | |
Financial Statements | |
Schedule of Portfolio Investments | | | 9 | | |
Statement of Assets and Liabilities | | | 12 | | |
Statement of Operations | | | 13 | | |
Statements of Changes in Net Assets | | | 14 | | |
Financial Highlights | | | 16 | | |
Notes to Financial Statements | | | 18 | | |
Report of Independent Registered Public
Accounting Firm | | | 25 | | |
Supplemental Information (Unaudited) | |
Trustee and Officer Information | | | 26 | | |
Proxy Voting and Portfolio Holdings Information | | | 29 | | |
Expense Examples | | | 29 | | |
Additional Federal Income Tax Information | | | 30 | | |
Advisory Contract Renewal | | | 31 | | |
Privacy Policy (inside back cover) | | | |
The Fund is distributed by Victory Capital Advisers, Inc. Victory Capital Management Inc. is the investment adviser to the Fund and receives fees from the Fund for performing services for the Fund.
This report is not authorized for distribution to prospective investors unless preceded or accompanied by a current prospectus of the Fund.
For additional information about any Victory Fund, including fees, expenses, and risks, view our prospectus online at www.vcm.com or call 800-539-3863. Read it carefully before you invest or send money.
The information in this annual report is based on data obtained from recognized services and sources and is believed to be reliable. Any opinions, projections, or recommendations in this report are subject to change without notice and are not intended as individual investment advice. Past investment performance of the Fund, markets or securities mentioned herein should not be considered to be indicative of future results.
• NOT FDIC INSURED • NO BANK GUARANTEE
• MAY LOSE VALUE

Call Victory at:
800-539-FUND (800-539-3863)
Visit our website at:
www.vcm.com
1
This page is intentionally left blank.
2
Victory Funds Letter to Shareholders
(Unaudited)
Dear Shareholder,
As we turn the page into a new decade, it's hard not to reflect on the fact that we have been enjoying the longest-ever bull market in U.S. equities. The run has been impressive, and despite periods of tumult and plenty of negative news, the bull market endured throughout 2019.
For the annual reporting period ended December 31, 2019, the S&P 500® Index posted impressive gains of 31.49%. This represents the greatest one-year gain since 2013 and also illustrates a swift bounce-back after a precipitous drop late in 2018. The move higher supports the notion that underlying fundamentals of U.S. companies drive performance, rather than the political rancor and headline fears that often capture the attention of investors.
Perhaps we shouldn't be surprised at the impressive performance of equities. The U.S. economy — the world's largest — remains on solid footing and has been a key driver of both domestic and international stocks. Robust job creation, near-record low unemployment, and steady consumer spending continue and offer reasons for further optimism. Meanwhile, inflation remains muted, and the Federal Reserve (the Fed) and other major global central banks have taken an accommodative stance. In fact, the Fed has cut interest rates by a total of 0.75% over three meetings last July, September and October.
The risk-on attitudes of investors, coupled with the accommodative monetary policy, had an expected impact on U.S. Treasury yields. The 10-year Treasury yield declined significantly over the course of 2019, falling from 2.66% to 1.92% at year-end. More interesting, however, was the fact that, the yield on 10-year Treasurys fell below shorter-term yields for the first time since before the 2007-2008 Global Financial Crisis. This inverted yield curve spooked investors for a spell, only to revert back to a traditional upward sloping yield curve by the end of the year.
The robust domestic economy, low interest rates, and ample liquidity from central banks provided a potent tonic for the stock market in 2019. In fact, at year-end 2019, the S&P 500® Index was approaching its highest valuation level since 1999. This reminds all of us to retain some historical context on the bull market. Many of us remember the Global Financial Crisis and, before that, the collapse of the dot-com bubble. Although those are now but a distant memory (and we are not forecasting such tumult), we should not forget that stocks don't always go up and cycles don't last forever. In other words, valuations still matter.
The key point is not to discount the risks. In addition to lofty valuations, investors need to keep apprised of trade disputes, geopolitical hotspots, a contentious U.S. election, and a host of other potential headwinds. Yet it is these very risks — these cross-currents — that may create pricing dislocations. This is an environment in which we believe our Victory Capital independent investment franchises can thrive.
On the following pages, you will find information relating to your Victory Funds investment. If you have any questions, we encourage you to contact your financial
3
advisor. Or, if you invest with us directly, you may call (800) 539-3863, or visit our website at www.vcm.com.
My colleagues and I sincerely appreciate the confidence you have placed in the Victory Funds, and we value the opportunity to help meet your investment goals.

Christopher K. Dyer, CFA
President,
Victory Funds
4
Victory Variable Insurance Funds (Unaudited)
Victory RS Large Cap Alpha VIP Series
Portfolio Holdings
As a Percentage of Total Investments
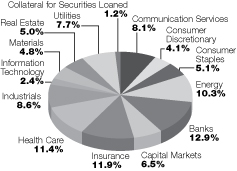
Performance Update and Review
The Victory RS Large Cap Alpha VIP Series (the "Fund") seeks to provide long-term capital appreciation. For the 12-month period ended December 31, 2019, the Fund delivered a 31.16% absolute return, outperforming the Fund's benchmark, the Russell 1000® Value Index (the "Index"), which returned 26.54%. Stock selection drove all of the outperformance, with the allocation effect being largely neutral. The largest positive sector contributors to performance in 2019 were Financials and Communication Services. Within Communication Services, social media company Facebook, Inc. continued to generate exceptional returns and recover some lost valuation after media criticism of the company earlier in the year. In Financials, Citigroup Inc. continued to execute despite a slowing global economic environment, proving to some skeptics the resilience of its business model. On a less positive note, the Utilities and Energy sectors were a drag on Fund performance. Stock-specific negative contributions for the year were EQT Corporation, a natural gas business that experienced a hostile takeover, and the online travel business Expedia Group, Inc., which faced additional competitive pressures. In the end, the Fund outperformed its Index in 2019.
Market Overview
The U.S. equity market's performance was impressive in 2019, with the broad-based Russell 3000® Index registering a gain of 31.02%. The move higher after last year's decline was driven by a significant reversal in monetary policy at global central banks. The United States went from tightening in December 2018, to easing by 75 bps in 2019. Other major central banks around the world took aggressive action during 2019, flooding the markets with liquidity. Value-oriented stocks, as measured by the Russell 3000® Value Index, increased 26.26% during the year.
Although gains were broad across the capitalization spectrum, small-cap value stocks underperformed their mid- and large-cap counterparts during 2019, as measured by the Russell family of indices. This is the third year in a row that small-cap value stocks have underperformed their mid- and large-cap peers. Small-cap stocks, as measured by the Russell 2000® Value Index, returned 22.39%, while the Russell Midcap® Value Index and Russell 1000® Value Index returned 27.06% and 26.54%, respectively. However, since the end of August (the month that saw a full inversion in the yield curve), small-cap value stocks have started to outperform.
5
Victory Variable Insurance Funds (Unaudited)
Victory RS Large Cap Alpha VIP Series (continued)
Perhaps this reflects a shift in leadership of smaller-cap value companies. It also may indicate that investors are repositioning to take advantage of the attractive relative valuations of small versus large companies. Even after the strong year-end performance of small-cap stocks, their relative attractiveness continues as the new year begins with near-decade-wide valuation spreads relative to large-cap stocks, as measured by forward price-to-earnings. Moreover, consensus expectations for small-cap stocks are for higher earnings-per-share growth versus large-cap stocks over the next three to five years.
Overall, we expect the market to continue to benefit from a dovish monetary policy, a very strong consumer, and negative real interest rates across the globe. However, we do not believe there will be any material trade deal with China prior to the presidential election. The relative strength in both the U.S. economy and labor market, as well as a U.S. Federal Reserve (the "Fed") that seems content allowing the economy to run hot, should continue to be positive for asset prices. It is our view that the U.S. equity market can continue to rise given steady U.S. economic growth and may even see higher nominal growth and a continued recovery in cyclical businesses. Looking ahead to 2020, economic growth looks to continue and, coupled with the continuation of the longest job growth streak in history, supports our constructive outlook for domestic stocks and value-oriented strategies in particular.
Outlook
As we enter our 11th year of economic expansion, a period of consistent underlying factors for equity investing, conditions have shifted. Interest rate policy in 2019 changed course dramatically, with the Fed cutting rates 75 bps as a covert quantitative easing was initiated as an "insurance policy" against any fallout from the trade war and overall global economic slowing. The rate reduction provided further liquidity to the global economy after major central banks from around the world had already instituted similar policies and has flooded the global economy with liquidity yet again, helping to boost asset prices. In addition, it appears that many of the larger developed economies have either started or are now looking to start fiscal stimulus to boost economic growth. With negative real interest rates across the globe, this is a very positive environment for equity securities.
Energy prices remain significantly below peak levels, despite declining inventories worldwide. Natural gas prices have materially lagged oil prices. This stimulates consumer spending and confidence in the long run for the United States and for non-oil-producing countries abroad. In the United States we enjoy the competitive advantage of a long-term supply of abundant cheap natural gas. However, we are watchful of rising commodity prices and how this may affect the economy.
Interest rates have fallen materially, but it is now more questionable as to where they move from here. Based on the Fed's commentary and the fact that it is a presidential election year, we wouldn't expect the Fed to take any action in 2020 unless some sort of exogenous event occurs. In fact, based on the Fed's language, we would need to see a material increase in inflation before we might see the Fed increase interest rates again. This is somewhat perplexing, as the Fed lowered interest rates 75 bps largely in response to the U.S.-China trade war, and with the trade war seeming to de-escalate, one would think those rate increases might come back.
6
Victory Variable Insurance Funds (Unaudited)
Victory RS Large Cap Alpha VIP Series (continued)
We remain watchful of corporations continuing to lever their balance sheets, although some of this has been offset by strong free cash flow generation. The decline in interest rates and tightening credit spreads will help to offset some of this growth but may very well fuel even further growth. The U.S. Treasury 10-year/2-year rate spread has widened from 16 bps 12 months ago to 30 bps today but remains well below the 10-year average of 176 bps. With the world awash with liquidity and a dovish Fed, it seems like there is a low probability of an inverted yield curve in the near term, but this situation remains very data dependent.
Despite all of the media coverage surrounding the 2020 presidential election, it is still very early in the election cycle, and much can change. No matter what your political preference may be, it's important to understand how each candidate is viewed by the market, what likelihood the market is assigning to each candidate's chance of winning, and how changes to that likelihood may impact equity markets. We are somewhat concerned that the market is already factoring in the winner of the presidential election when it is still 10 months away.
In our estimation, equity valuations remain at historically high levels (at a level not seen since the dot-com era on trailing operating earnings). We believe we are in the later stages of a bull market, although nothing is certain. Equity securities look most reasonable compared to U.S. Treasury and corporate bond yields. In any case, we believe equity securities are the superior asset allocation alternative to bonds over the longer term.
7
Victory Variable Insurance Funds (Unaudited)
Victory RS Large Cap Alpha VIP Series (continued)
Average Annual Total Return
Year Ended December 31, 2019
| | Class I | | | | | |
INCEPTION DATE | | 4/13/83 | | | | | |
| | Net Asset
Value | | Russell 1000®
Value Index1 | | S&P 500® Index2 | |
One Year | | | 31.16 | % | | | 26.54 | % | | | 31.49 | % | |
Three Year | | | 12.30 | % | | | 9.68 | % | | | 15.27 | % | |
Five Year | | | 8.64 | % | | | 8.29 | % | | | 11.70 | % | |
Ten Year | | | 11.43 | % | | | 11.80 | % | | | 13.56 | % | |
Since Inception | | | 10.73 | % | | | N/A | | | | N/A | | |
Expense Ratios
Gross | | | 0.62 | % | |
With Applicable Waivers | | | 0.55 | % | |
Past performance is not indicative of future results. The performance data quoted represents past performance and current returns may be lower or higher. The investment return and principal value will fluctuate so that an investor's shares, when redeemed, may be worth more or less than the original cost. To obtain performance information current to the most recent month's end, please visit www.vcm.com.
The above expense ratios are from the Fund's prospectus dated May 1, 2019. Additional information pertaining to the Fund's expense ratios as of December 31, 2019 can be found in the financial highlights.
The total return figures set forth above include all waivers of fees for various periods since inception. Without such fee waivers, the total returns would have been lower. Some fee waivers are voluntary and may be modified or terminated at any time. The total returns do not include any insurance, sales or administrative charges of variable annuity or life insurance contracts. If these charges were included, the total returns would have been lower.
Victory RS Large Cap Alpha VIP Series — Growth of $10,000

1The Russell 1000® Value Index is an unmanaged market-capitalization-weighted index that measures the performance of those companies in the Russell 1000® Index (which consists of the 1,000 largest U.S. companies based on total market capitalization) with lower price-to-book ratios and lower forecasted growth values. Index results assume the reinvestment of dividends paid on stocks constituting the index. You may not invest in the index, and, unlike the Fund, the index does not incur fees or expenses.
2The S&P 500® Index is an unmanaged index comprised of 500 domestically traded common stocks, is weighted according to the market value of each common stock in the index, and includes reinvestment of dividends. This index does not include effect of sales charges and is not representative of the Fund. It is not possible to invest directly in an index.
The graph reflects investment of growth of a hypothetical $10,000 investment in the Fund. Past performance is no guarantee of future results.
The graph and table do not reflect the deduction of taxes that a shareholder would pay on Fund distributions or the redemption of Fund shares.
8
Victory Variable Insurance Funds
Victory RS Large Cap Alpha VIP Series | | Schedule of Portfolio Investments
December 31, 2019 | |
Security Description | | Shares | | Value | |
Common Stocks (96.4%) | |
Banks (12.4%): | |
Citigroup, Inc. | | | 372,720 | | | $ | 29,776,600 | | |
JPMorgan Chase & Co. | | | 174,770 | | | | 24,362,938 | | |
The PNC Financial Services Group, Inc. | | | 150,070 | | | | 23,955,674 | | |
U.S. Bancorp | | | 392,610 | | | | 23,277,847 | | |
Wells Fargo & Co. | | | 341,050 | | | | 18,348,490 | | |
| | | | 119,721,549 | | |
Capital Markets (6.3%): | |
Cboe Global Markets, Inc. | | | 346,620 | | | | 41,594,400 | | |
E*TRADE Financial Corp. | | | 415,950 | | | | 18,871,652 | | |
| | | | 60,466,052 | | |
Communication Services (7.9%): | |
Alphabet, Inc., Class A (a) | | | 26,175 | | | | 35,058,533 | | |
Facebook, Inc., Class A (a) | | | 197,650 | | | | 40,567,663 | | |
| | | | 75,626,196 | | |
Consumer Discretionary (4.1%): | |
Aramark | | | 269,140 | | | | 11,680,676 | | |
LKQ Corp. (a) | | | 524,350 | | | | 18,719,295 | | |
McDonald's Corp. | | | 41,040 | | | | 8,109,914 | | |
| | | | 38,509,885 | | |
Consumer Staples (5.0%): | |
Keurig Dr Pepper, Inc. (b) | | | 383,650 | | | | 11,106,668 | | |
Mondelez International, Inc., Class A | | | 561,030 | | | | 30,901,532 | | |
Post Holdings, Inc. (a) (b) | | | 53,670 | | | | 5,855,397 | | |
| | | | 47,863,597 | | |
Energy (10.1%): | |
Chevron Corp. | | | 182,460 | | | | 21,988,255 | | |
Diamondback Energy, Inc. | | | 242,990 | | | | 22,564,051 | | |
Enterprise Products Partners LP | | | 812,970 | | | | 22,893,234 | | |
Noble Energy, Inc. | | | 805,670 | | | | 20,012,843 | | |
Suncor Energy, Inc. | | | 297,090 | | | | 9,744,552 | | |
| | | | 97,202,935 | | |
Health Care (11.1%): | |
Cigna Corp. | | | 41,950 | | | | 8,578,356 | | |
CVS Health Corp. | | | 188,455 | | | | 14,000,322 | | |
Humana, Inc. (b) | | | 39,020 | | | | 14,301,610 | | |
Johnson & Johnson | | | 133,330 | | | | 19,448,847 | | |
Pfizer, Inc. | | | 344,590 | | | | 13,501,036 | | |
UnitedHealth Group, Inc. | | | 45,905 | | | | 13,495,152 | | |
Zimmer Biomet Holdings, Inc. | | | 156,910 | | | | 23,486,289 | | |
| | | | 106,811,612 | | |
See notes to financial statements.
9
Victory Variable Insurance Funds
Victory RS Large Cap Alpha VIP Series | | Schedule of Portfolio Investments — continued
December 31, 2019 | |
Security Description | | Shares | | Value | |
Industrials (8.4%): | |
Air Canada (a) | | | 398,550 | | | $ | 14,890,373 | | |
Eaton Corp. PLC, ADR | | | 272,680 | | | | 25,828,250 | | |
Parker-Hannifin Corp. | | | 87,490 | | | | 18,007,192 | | |
Raytheon Co. | | | 66,190 | | | | 14,544,591 | | |
Union Pacific Corp. | | | 38,310 | | | | 6,926,065 | | |
| | | | 80,196,471 | | |
Information Technology (2.4%): | |
Visa, Inc., Class A | | | 119,920 | | | | 22,532,968 | | |
Insurance (11.4%): | |
Aflac, Inc. | | | 720,440 | | | | 38,111,275 | | |
Brown & Brown, Inc. | | | 731,150 | | | | 28,865,802 | | |
RenaissanceRe Holdings Ltd. | | | 69,690 | | | | 13,660,634 | | |
The Progressive Corp. | | | 406,440 | | | | 29,422,192 | | |
| | | | 110,059,903 | | |
Materials (4.8%): | |
Freeport-McMoRan, Inc. | | | 1,599,470 | | | | 20,985,046 | | |
Sealed Air Corp. | | | 618,200 | | | | 24,622,906 | | |
| | | | 45,607,952 | | |
Real Estate (4.9%): | |
Equity Commonwealth | | | 618,160 | | | | 20,294,193 | | |
Invitation Homes, Inc. | | | 878,470 | | | | 26,327,746 | | |
| | | | 46,621,939 | | |
Utilities (7.6%): | |
Exelon Corp. | | | 399,430 | | | | 18,210,014 | | |
FirstEnergy Corp. | | | 460,820 | | | | 22,395,852 | | |
Vistra Energy Corp. | | | 1,397,330 | | | | 32,124,617 | | |
| | | | 72,730,483 | | |
Total Common Stocks (Cost $746,152,717) | | | 923,951,542 | | |
Collateral for Securities Loaned^ (1.2%) | |
BlackRock Liquidity Funds TempFund Portfolio,
Institutional Class, 1.75% (c) | | | 548,648 | | | | 548,648 | | |
Fidelity Investments Money Market Government Portfolio,
Class I, 1.54% (c) | | | 3,022,658 | | | | 3,022,658 | | |
Fidelity Investments Prime Money Market Portfolio, Class I, 1.75% (c) | | | 91,638 | | | | 91,638 | | |
Goldman Sachs Financial Square Prime Obligations Fund,
Institutional Class, 1.80% (c) | | | 1,825,998 | | | | 1,825,998 | | |
JPMorgan Prime Money Market Fund, Capital Class, 1.73% (c) | | | 2,008,739 | | | | 2,008,739 | | |
Morgan Stanley Institutional Liquidity Prime Portfolio,
Institutional Class, 1.76% (c) | | | 4,017,341 | | | | 4,017,341 | | |
Total Collateral for Securities Loaned (Cost $11,515,022) | | | 11,515,022 | | |
Total Investments (Cost $757,667,739) — 97.6% | | | 935,466,564 | | |
Other assets in excess of liabilities — 2.4% | | | 23,228,364 | | |
NET ASSETS — 100.00% | | $ | 958,694,928 | | |
See notes to financial statements.
10
Victory Variable Insurance Funds
Victory RS Large Cap Alpha VIP Series | | Schedule of Portfolio Investments — continued
December 31, 2019 | |
^ Purchased with cash collateral from securities on loan.
(a) Non-income producing security.
(b) All or a portion of this security is on loan.
(c) Rate disclosed is the daily yield on December 31, 2019.
ADR — American Depositary Receipt
LP — Limited Partnership
PLC — Public Limited Company
See notes to financial statements.
11
Victory Variable Insurance Funds | | Statement of Assets and Liabilities
December 31, 2019 | |
| | | Victory
RS Large Cap
Alpha VIP
Series | |
ASSETS: | |
Investments, at value (Cost $757,667,739) | | $ | 935,466,564 | (a) | |
Cash and cash equivalents | | | 34,825,775 | | |
Interest and dividends receivable | | | 425,607 | | |
Receivable for capital shares issued | | | 105 | | |
Receivable from Adviser | | | 273,176 | | |
Prepaid expenses | | | 60,167 | | |
Total Assets | | | 971,051,394 | | |
LIABILITIES: | |
Payables: | |
Collateral received on loaned securities | | | 11,515,022 | | |
Capital shares redeemed | | | 220,796 | | |
Accrued expenses and other payables: | |
Investment advisory fees | | | 401,654 | | |
Administration fees | | | 45,496 | | |
Custodian fees | | | 6,639 | | |
Transfer agent fees | | | 104,473 | | |
Compliance fees | | | 622 | | |
Trustees' fees | | | 1,934 | | |
Other accrued expenses | | | 59,830 | | |
Total Liabilities | | | 12,356,466 | | |
NET ASSETS: | |
Capital | | | 710,570,962 | | |
Total distributable earnings/(loss) | | | 248,123,966 | | |
Net Assets | | $ | 958,694,928 | | |
Shares (unlimited shares authorized with a par value of $0.001 per share): | | | 19,859,621 | | |
Net asset value: | | $ | 48.27 | | |
(a) Includes $11,290,461 of securities on loan.
See notes to financial statements.
12
Victory Variable Insurance Funds | | Statement of Operations
For the Year Ended December 31, 2019 | |
| | | Victory
RS Large Cap
Alpha VIP
Series | |
Investment Income: | |
Dividends | | $ | 17,291,671 | | |
Interest | | | 590,218 | | |
Securities lending (net of fees) | | | 21,967 | | |
Total Income | | | 17,903,856 | | |
Expenses: | |
Investment advisory fees | | | 4,652,311 | | |
Administration fees | | | 568,692 | | |
Custodian fees | | | 41,878 | | |
Transfer agent fees | | | 1,257,108 | | |
Trustees' fees | | | 78,855 | | |
Compliance fees | | | 6,268 | | |
Legal and audit fees | | | 100,606 | | |
Other expenses | | | 112,268 | | |
Total Expenses | | | 6,817,986 | | |
Expenses waived/reimbursed by Adviser | | | (1,698,805 | ) | |
Net Expenses | | | 5,119,181 | | |
Net Investment Income (Loss) | | | 12,784,675 | | |
Realized/Unrealized Gains (Losses) from Investments: | |
Net realized gains (losses) from investment securities and foreign
currency translations | | | 55,134,556 | | |
Net change in unrealized appreciation/depreciation on investment securities | | | 181,336,352 | | |
Net realized/unrealized gains on investments | | | 236,470,908 | | |
Change in net assets resulting from operations | | $ | 249,255,583 | | |
See notes to financial statements.
13
Victory Variable Insurance Funds | | Statements of Changes in Net Assets | |
| | | Victory RS Large Cap Alpha VIP Series | |
| | | Year
Ended
December 31,
2019 | | Year
Ended
December 31,
2018 | |
From Investment Activities: | |
Operations: | |
Net investment income (loss) | | $ | 12,784,675 | | | $ | 11,067,077 | | |
Net realized gains (losses) from investments | | | 55,134,556 | | | | 137,400,719 | | |
Net change in unrealized appreciation/depreciation
on investments | | | 181,336,352 | | | | (229,244,068 | ) | |
Change in net assets resulting from operations | | | 249,255,583 | | | | (80,776,272 | ) | |
Change in net assets resulting from distributions to
shareholders | | | (147,135,028 | ) | | | (99,131,571 | ) | |
Change in net assets resulting from capital transactions | | | 9,584,172 | | | | (33,842,009 | ) | |
Change in net assets | | | 111,704,727 | | | | (213,749,852 | ) | |
Net Assets: | |
Beginning of period | | | 846,990,201 | | | | 1,060,740,053 | | |
End of period | | $ | 958,694,928 | | | $ | 846,990,201 | | |
Capital Transactions: | |
Proceeds from shares issued | | $ | 4,367,525 | | | $ | 17,538,132 | | |
Distributions reinvested | | | 147,135,028 | | | | 99,131,571 | | |
Cost of shares redeemed | | | (141,918,381 | ) | | | (150,511,712 | ) | |
Change in net assets resulting from capital transactions | | $ | 9,584,172 | | | $ | (33,842,009 | ) | |
Share Transactions: | |
Issued | | | 85,475 | | | | 327,122 | | |
Reinvested | | | 3,050,512 | | | | 2,271,183 | | |
Redeemed | | | (2,771,086 | ) | | | (2,743,529 | ) | |
Change in Shares | | | 364,901 | | | | (145,224 | ) | |
See notes to financial statements.
14
This page is intentionally left blank.
15
Victory Variable Insurance Funds | | Financial Highlights | |
For a Share Outstanding Throughout Each Period
| | | | | Investment Activities | | Distributions to
Shareholders From | |
| | | Net Asset
Value,
Beginning of
Period | | Net
Investment
Income
(Loss)(a) | | Net
Realized and
Unrealized
Gains
(Losses) on
Investments | | Total from
Investment
Activities | | Net
Investment
Income | | Net Realized
Gains From
Investments | | Total
Distributions | |
Victory RS Large Cap Alpha VIP Series | |
Year Ended
12/31/19 | | $ | 43.45 | | | | 0.70 | | | | 12.75 | | | | 13.45 | | | | (0.48 | ) | | | (8.15 | ) | | | (8.63 | ) | |
Year Ended
12/31/18 | | $ | 54.01 | | | | 0.60 | | | | (5.44 | ) | | | (4.84 | ) | | | (0.02 | ) | | | (5.70 | ) | | | (5.72 | ) | |
Year Ended
12/31/17 | | $ | 45.98 | | | | 0.51 | | | | 8.07 | | | | 8.58 | | | | (0.55 | ) | | | — | | | | (0.55 | ) | |
Year Ended
12/31/16 | | $ | 44.26 | | | | 0.50 | | | | 3.50 | | | | 4.00 | | | | (0.52 | ) | | | (1.76 | ) | | | (2.28 | ) | |
Year Ended
12/31/15 | | $ | 50.63 | | | | 0.60 | | | | (1.64 | ) | | | (1.04 | ) | | | (0.67 | ) | | | (4.66 | ) | | | (5.33 | ) | |
(a) Per share net investment income (loss) has been calculated using the average daily shares method.
(b) Total returns do not reflect the effects of charges deducted pursuant to the terms of The Guardian Insurance & Annuity Company, Inc.'s variable contracts. Inclusion of such charges would reduce the total returns for all periods shown.
(c) Amount is less than $0.005 per share.
(d) The Fund received monies related to a nonrecurring refund from the prior Custodian. The corresponding impact to the total return was less than 0.01% for the period shown. (See Note 8)
See notes to financial statements.
16
Victory Variable Insurance Funds | | Financial Highlights — continued | |
For a Share Outstanding Throughout Each Period
| | | | | Ratios to Average Net Assets | | Supplemental Data | |
| | | Capital
Contribution
from Prior
Custodian,
Net (See
Note 8) | | Net Asset
Value,
End of
Period | | Total
Return(b) | | Net
Expenses | | Net
Investment
Income
(Loss) | | Gross
Expenses | | Net Assets,
End of
Period
(000's) | | Portfolio
Turnover | |
Victory RS Large Cap Alpha VIP Series | |
Year Ended
12/31/19 | | | — | | | $ | 48.27 | | | | 31.16 | % | | | 0.55 | % | | | 1.37 | % | | | 0.73 | % | | $ | 958,695 | | | | 50 | % | |
Year Ended
12/31/18 | | | — | | | $ | 43.45 | | | | (9.00 | )% | | | 0.55 | % | | | 1.10 | % | | | 0.62 | % | | $ | 846,990 | | | | 60 | % | |
Year Ended
12/31/17 | | | — | | | $ | 54.01 | | | | 18.67 | % | | | 0.55 | % | | | 1.02 | % | | | 0.60 | % | | $ | 1,060,740 | | | | 56 | % | |
Year Ended
12/31/16 | | | — | (c) | | $ | 45.98 | | | | 9.03 | %(d) | | | 0.54 | % | | | 1.12 | % | | | 0.54 | % | | $ | 1,020,600 | | | | 84 | % | |
Year Ended
12/31/15 | | | — | | | $ | 44.26 | | | | (2.01 | )% | | | 0.55 | % | | | 1.20 | % | | | 0.55 | % | | $ | 1,015,821 | | | | 47 | % | |
See notes to financial statements.
17
Victory Variable Insurance Funds | | Notes to Financial Statements
December 31, 2019 | |
1. Organization:
Victory Variable Insurance Funds (the "Trust") was organized on February 11, 1998 as a Delaware statutory trust. The Trust is registered under the Investment Company Act of 1940, as amended (the "1940 Act"), as a diversified open-end investment company. The Trust is comprised of nine funds and is authorized to issue an unlimited number of shares, which are units of beneficial interest with a par value of $0.001 per share.
The accompanying financial statements are those of the Victory RS Large Cap Alpha VIP Series (the "Fund"). The Fund offers a single class of shares: Class I Shares. Sales of shares of the Fund may only be made to certain separate accounts of The Guardian Insurance & Annuity Company, Inc. ("GIAC") that fund certain variable annuity and variable life insurance contracts issued by GIAC. GIAC is a wholly owned subsidiary of The Guardian Life Insurance Company of America ("Guardian Life").
Under the Trust's organizational documents, its officers and trustees are indemnified against certain liabilities arising out of the performance of their duties to the Fund. In addition, in the normal course of business, the Fund enters into contracts with its vendors and others that provide for general indemnifications. The Fund's maximum exposure under these arrangements is unknown, as this would involve future claims that may be made against the Fund. However, based on experience, the Fund expects that risk of loss to be remote.
2. Significant Accounting Policies:
The following is a summary of significant accounting policies followed by the Trust in the preparation of its financial statements. The policies are in conformity with accounting principles generally accepted in the United States of America ("GAAP"). The preparation of financial statements in accordance with GAAP requires management to make estimates and assumptions that affect the reported amounts of assets and liabilities and disclosure of contingent assets and liabilities at the date of the financial statements and the reported amounts of income and expenses for the period. Actual results could differ from those estimates.
The Fund follows the specialized accounting and reporting requirements under GAAP that are applicable to investment companies.
Investment Valuation:
The Fund records investments at fair value. Fair value is defined as the price that would be received to sell an asset or paid to transfer a liability in an orderly transaction between market participants at the measurement date.
The valuation techniques described below maximize the use of observable inputs and minimize the use of unobservable inputs in determining fair value. The inputs used for valuing the Fund's investments are summarized in the three broad levels listed below:
• Level 1 — quoted prices in active markets for identical securities
• Level 2 — other significant observable inputs (including quoted prices for similar securities or interest rates applicable to those securities, etc.)
• Level 3 — significant unobservable inputs (including the Fund's own assumptions in determining the fair value of investments)
Changes in valuation techniques may result in transfers in or out of an assigned level within the disclosure hierarchy. The inputs or methodologies used for valuation techniques are not necessarily an indication of the risk associated with entering into those investments.
Portfolio securities listed or traded on securities exchanges, including American Depositary Receipts ("ADRs") and Rights, are valued at the closing price on the exchange or system where the security is principally traded, if available, or at the Nasdaq Official Closing Price. If there have been no sales for that day on the exchange or system, then a security is valued at the last available bid quotation on the
18
Victory Variable Insurance Funds | | Notes to Financial Statements — continued
December 31, 2019 | |
exchange or system where the security is principally traded. In each of these situations, valuations are typically categorized as Level 1 in the fair value hierarchy.
Investments for which there are no such quotations, or for which quotations do not appear reliable, are valued at fair value in accordance with procedures established by and under the general supervision and responsibility of the Trust's Board of Trustees (the "Board"). These valuations are typically categorized as Level 2 or Level 3 in the fair value hierarchy, based on the observability of inputs used to determine the fair value.
A summary of the valuations as of December 31, 2019, based upon the three levels defined above, is included in the table below while the breakdown, by category, of investments is disclosed in the Schedule of Portfolio Investments.
| | | LEVEL 1 | | Total | |
Common Stocks | | $ | 923,951,542 | | | $ | 923,951,542 | | |
Collateral for Securities Loaned | | | 11,515,022 | | | | 11,515,022 | | |
Total | | $ | 935,466,564 | | | $ | 935,466,564 | | |
For the year ended December 31, 2019, there were no Level 3 investments for which significant unobservable inputs were used to determine fair value.
Investment Transactions and Related Income:
Changes in holdings of investments are accounted for no later than one business day following the trade date. For financial reporting purposes, however, investment transactions are accounted for on trade date on the last business day of the reporting period. Interest income is determined on the basis of coupon interest accrued using the effective interest method which adjusts, where applicable, the amortization of premiums or accretion of discounts. Dividend income is recorded on the ex-dividend date. Gains or losses realized on sales of securities are determined by comparing the identified cost of the security lot sold with the net sales proceeds.
Withholding taxes on interest, dividends and gains as a result of certain investments in ADRs by the Fund have been provided for in accordance with each investment's applicable country's tax rules and rates.
Securities Lending:
The Trust has entered into a Master Securities Lending Agreement ("MSLA") with Citibank, N.A. ("Citibank" or the "Agent"). Under the terms of the MSLA, the Fund may lend securities to certain broker-dealers and banks in exchange for collateral in the amount of at least 102% of the value of U.S. securities loaned or at least 105% of the value of non-U.S. securities loaned, marked-to-market daily. Any collateral shortfalls associated with increases in the valuation of the securities loaned are adjusted the next business day. The collateral can be received in the form of cash collateral and/or non-cash collateral. Non-cash collateral can include U.S. Government Securities, letters of credit and certificates of deposit. The cash collateral is invested in short-term instruments or cash equivalents as noted on the Fund's Schedule of Portfolio Investments. The Trust does not have effective control of the non-cash collateral and therefore it is not disclosed in the Fund's Schedule of Portfolio Investments. The Fund continues to benefit from interest or dividends on the securities loaned and may also earn a return from the collateral. The Fund pays various fees in connection with the investment of cash collateral. The Fund pays the Agent fees based on the investment income received from securities lending activities. Securities lending income is disclosed in the Fund's Statement of Operations. Although risk is mitigated by the collateral, the Fund could experience a delay in recovering its securities and possible loss of income or value if the borrower fails to return them.
Securities lending transactions are entered into by the Fund under the MSLA, which permits the Fund, under certain circumstances such as an event of default, to offset amounts payable by the Fund to the same counterparty against amounts receivable from the counterparty to create a net payment due to or from the Fund.
19
Victory Variable Insurance Funds | | Notes to Financial Statements — continued
December 31, 2019 | |
The following table is a summary of the Fund's securities lending transactions which are subject to offset under the MSLA as of December 31, 2019. These transactions are accounted for as secured borrowings with an overnight and continuous contractual maturity for cash collateral, and greater than overnight and continuous contractual maturity for non-cash collateral.
Gross
Amount of
Recognized
Assets
(Value of | | Value of
Cash | | Value of Non-cash Collateral
Received by Maturity | | | |
Securities on
Loan) | | Collateral
Received* | | <30 Days | | Between 30 &
90 days | | >90 Days | | Net
Amount | |
| $ | 11,290,461 | | | $ | 11,290,461 | | | $ | — | | | $ | — | | | $ | — | | | $ | — | | |
* Collateral received in excess of the market value of securities on loan is not presented in this table. The total cash collateral received by the Fund is disclosed in the Statement of Assets and Liabilities.
Distributions to Shareholders:
Dividends from net investment income, if any, are declared and paid annually by the Fund. Distributable net realized gains, if any, are declared and distributed at least annually.
The amounts of dividends from net investment income and distributions from net realized gains are determined in accordance with federal income tax regulations, which may differ from GAAP. To the extent these "book/tax" differences are permanent in nature (e.g., net operating loss and distributions reclassification), such amounts are reclassified within the components of net assets based on their federal tax-basis treatment; temporary differences (e.g., wash sales) do not require reclassification. To the extent dividends and distributions exceed net investment income and net realized gains for tax purposes, they are reported as distributions of capital. Net investment losses incurred by the Fund may be reclassified as an offset to capital on the accompanying Statement of Assets and Liabilities.
As of December 31, 2019 on the Statement of Assets and Liabilities, as a result of permanent book-to-tax differences, reclassification adjustments were as follows:
Total
distributable
earnings/(loss) | | Capital | |
| $ | 418 | | | $ | (418 | ) | |
Federal Income Taxes:
It is the policy of the Fund to continue to qualify as a regulated investment company by complying with the provisions available to certain investment companies, as defined in applicable sections of the Internal Revenue Code, and to make distributions of net investment income and net realized gains sufficient to relieve it from all, or substantially all, federal income taxes. Accordingly, no provision for federal income taxes is required in the financial statements. The Fund has a tax year end of December 31.
Management of the Fund has reviewed tax positions taken in tax years that remain subject to examination by all major tax jurisdictions, including federal (i.e., all open tax years and the interim tax period since then). Management believes that there is no tax liability resulting from unrecognized tax benefits related to uncertain tax positions taken.
Allocations:
Expenses directly attributable to the Fund are charged to the Fund, while expenses which are attributable to more than one fund in the Trust, or jointly with an affiliated trust, are allocated among the respective funds in the Trust and/or affiliated trust based upon net assets or another appropriate basis.
20
Victory Variable Insurance Funds | | Notes to Financial Statements — continued
December 31, 2019 | |
Cross-Trade Transactions:
Pursuant to Rule 17a-7 under the 1940 Act, the Fund may engage in cross-trades which are securities transactions with affiliated investment companies and advisory accounts managed by the Adviser and any applicable sub-adviser. Any such purchase or sale transaction must be effected without brokerage commission or other remuneration, except for customary transfer fees. The transaction must be effected at the current market price, which is either the security's last sale price on an exchange or, if there are no transactions in the security that day, at the average of the highest bid and lowest asked price. For the year ended December 31, 2019, the Fund did not engage in any Rule 17a-7 transactions under the 1940 Act.
3. Purchases and Sales of Securities:
Purchases and sales of securities (excluding securities maturing less than one year from acquisition) for the year ended December 31, 2019 were as follows for the Fund:
| Purchases | | Sales | |
| $ | 449,039,189 | | | $ | 594,755,806 | | |
For the year ended December 31, 2019, there were no purchases or sales of U.S. Government Securities.
4. Fees and Transactions with Affiliates and Related Parties:
Investment advisory services are provided to the Fund by Victory Capital Management Inc. ("VCM" or the "Adviser"), a New York corporation registered as an investment adviser with the Securities and Exchange Commission ("SEC"). The Adviser is a wholly owned indirect subsidiary of Victory Capital Holdings, Inc., a publicly traded Delaware corporation, and a wholly owned direct subsidiary of Victory Capital Operating, LLC.
Under the terms of the Investment Advisory Agreement, the Adviser is entitled to receive 0.50% of the average daily net assets of the Fund. The Adviser may use its resources to assist with the Fund's distribution and marketing expenses.
VCM also serves as the Fund's administrator and fund accountant. Under an Administration and Fund Accounting Agreement, VCM is paid for its services an annual fee at a rate of 0.08% of the first $15 billion in average daily net assets of the Trust, Victory Portfolios and Victory Portfolios II (collectively, the "Victory Funds Complex"), 0.05% of the average daily net assets above $15 billion to $30 billion of the Victory Funds Complex and 0.04% of the average daily net assets over $30 billion of the Victory Funds Complex.
Citi Fund Services Ohio, Inc. ("Citi"), an affiliate of Citibank, acts as sub-administrator and sub-fund accountant to the Fund pursuant to a Sub-Administration and Sub-Fund Accounting Services Agreement between VCM and Citi. VCM pays Citi a fee for providing these services. The Trust reimburses VCM and Citi for all of their reasonable out-of-pocket expenses incurred in providing these services.
FIS Investor Services, LLC ("FIS") serves as the Fund's transfer agent. Under the Transfer Agent Agreement, the Trust pays FIS a fee for its services and reimburses FIS for all of their reasonable out-of-pocket expenses incurred in providing these services.
The Chief Compliance Officer ("CCO") is an employee of the Adviser, which pays the compensation of the CCO and his support staff. The Trust has entered into an Agreement to provide compliance services with the Adviser, pursuant to which the Adviser furnishes its compliance personnel, including the services of the CCO, and other resources reasonably necessary to provide the Trust with compliance oversight services related to the design, administration and oversight of a compliance program for the Trust in accordance with Rule 38a-1 under the 1940 Act. The Funds in the Victory Funds Complex, in aggregate, compensate the Adviser for these services.
The Victory Funds Complex pays an annual retainer to each Independent Trustee, plus an additional annual retainer to the Chairman of the Board. The aggregate amount of the fees and expenses of the
21
Victory Variable Insurance Funds | | Notes to Financial Statements — continued
December 31, 2019 | |
Independent Trustees are allocated amongst all the funds in the Victory Funds Complex and are presented in the Statement of Operations.
Shearman & Sterling LLP provides legal services to the Trust.
Victory Capital Advisers, Inc. (the "Distributor"), an affiliate of the Adviser, serves as distributor for the continuous offering of the shares of the Fund pursuant to a Distribution Agreement between the Distributor and the Trust.
The Adviser has entered into an expense limitation agreement with the Fund until at least April 30, 2020. Under the terms of the agreement, the Adviser has agreed to waive fees or reimburse certain expenses to the extent that ordinary operating expenses incurred by the Fund in any fiscal year exceed the expense limit for the Fund. Such excess amounts will be the liability of the Adviser. Interest, taxes, brokerage commissions, other expenditures which are capitalized in accordance with GAAP, and other extraordinary expenses not incurred in the ordinary course of a Fund's business are excluded from the expense limits. As of December 31, 2019, the expense limit (excluding voluntary waivers) is 0.55%.
The Fund has agreed to repay fees and expenses that were waived or reimbursed by the Adviser for a period up to three fiscal years after such waiver or reimbursement was made to the extent such payments or repayments would not cause the expenses to exceed the original expense limitation in place at time of the waiver or reimbursement or any expense limitation agreement in place at the time of repayment. As of December 31, 2019, the following amounts are available to be repaid to the Adviser. Amounts repaid to the Adviser during the year ended, if any, are reflected on the Statement of Operations as "Recoupment of prior expenses waived/reimbursed by Adviser".
Expires
December 31,
2020 | | Expires
December 31,
2021 | | Expires
December 31,
2022 | | Total | |
| $ | 522,796 | | | $ | 690,695 | | | $ | 1,698,805 | | | $ | 2,912,296 | | |
The Adviser may voluntarily waive or reimburse additional fees to assist the Fund in maintaining a competitive expense ratio. Voluntary waivers and reimbursements applicable to the Fund are not available to be recouped at a future time. There were no voluntary waivers or reimbursements for the year ended December 31, 2019.
Certain officers and/or interested trustees of the Fund are also officers and/or employees of the Adviser, Administrator, Fund Accountant, Sub-Administrator, Sub-Fund Accountant and Legal Counsel.
5. Risks:
The Fund may be subject to other risks in addition to these identified risks.
An investment in the Fund's shares represents an indirect investment in the securities owned by the Fund, some of which will be traded on a national securities exchange or in the over-the-counter markets. The value of the securities in which the Fund invests, like other market investments, may move up or down, sometimes rapidly and unpredictably. The value of the securities in which the Fund invests may affect the value of the Fund's shares. An investment in the Fund's shares at any point in time may be worth less than the original investment, even after taking into account the reinvestment of the Fund's distributions.
The Fund will be subject to credit risk with respect to the amount it expects to receive from counterparties for financial instruments entered into by the Fund. The Fund may be negatively impacted if a counterparty becomes bankrupt or otherwise fails to perform its obligations due to financial difficulties. The Fund may experience significant delays in obtaining any recovery in bankruptcy or other reorganization proceeding and the Fund may obtain only limited recovery or may obtain no recovery in such circumstances. The Fund typically enters into transactions with counterparties whose credit ratings are investment grade, as determined by a nationally recognized statistical rating organization or, if unrated, judged by the Adviser to be of comparable quality.
22
Victory Variable Insurance Funds | | Notes to Financial Statements — continued
December 31, 2019 | |
6. Borrowing and Interfund Lending:
Line of Credit:
For the year ended December 31, 2019, the Victory Funds Complex participated in a short-term, demand note "Line of Credit" with Citibank. Under the agreement with Citibank, for the period January 1, 2019 to June 30, 2019, the Victory Funds Complex could borrow up to $250 million, of which $100 million was committed and $150 million was uncommitted. Effective July 1, 2019, the agreement was amended to include the USAA Mutual Funds Complex (another series of mutual funds managed by the Adviser) and has a new termination date of June 29, 2020. Under this amended agreement, the Victory Funds Complex and USAA Mutual Funds Complex, combined, may borrow up to $600 million, of which $300 million is committed and $300 million is uncommitted. $40 million of the Line of Credit is reserved for use by the Victory Floating Rate Fund (herein, the "Fund"), another series of the Victory Funds Complex, with that Fund paying the related commitment fees for that amount. The purpose of the agreement is to meet temporary or emergency cash needs, including redemption requests that might otherwise require the untimely disposition of securities. With the agreement in effect for the period January 1, 2019 to June 30, 2019, Citibank received an annual commitment fee of 0.15% on $100 million for providing the Line of Credit. For the period July 1, 2019 to December 31, 2019, Citibank received an annual commitment fee of 0.15% on $300 million for providing the Line of Credit. For the year ended December 31, 2019, Citibank earned approximately $300 thousand in commitment fees from the combined Victory Funds Complex and USAA Mutual Funds Complex. Each fund in the Victory Funds Complex and the USAA Mutual Funds Complex pays a pro-rata portion of the commitment fees plus any interest (one month LIBOR plus one percent) on amounts borrowed. Interest charged to the Fund during the period, if applicable, is presented on the Statement of Operations under Line of credit fees.
The Fund did not utilize the Line of Credit during the year ended December 31, 2019.
Interfund Lending:
The Trust and Adviser rely on an exemptive order granted by the SEC in March 2017 (the "Order"), permitting the establishment and operation of an Interfund Lending Facility (the "Facility"). The Facility allows the Fund to directly lend and borrow money to or from any other Victory Fund relying upon the Order at rates beneficial to both the borrowing and lending funds. Advances under the Facility are allowed for temporary or emergency purposes, including the meeting of redemption requests that otherwise might require the untimely disposition of securities, and are subject to each fund's borrowing restrictions. The interfund loan rate is determined, as specified in the Order, by averaging the current repurchase agreement rate and the current bank loan rate. As a Borrower, interest charged to the Fund during the period, if applicable, is presented on the Statement of Operations under Interfund lending fees. As a Lender, interest earned by the Fund during the period, if applicable, is presented on the Statement of Operations under Income on interfund lending.
The Fund did not utilize the Facility during the year ended December 31, 2019.
7. Federal Income Tax Information:
The tax character of distributions paid during the most recent tax years ended, as noted below, were as follows (total distributions paid may differ from the Statements of Changes in Net Assets because, for tax purposes, dividends are recognized when actually paid).
| | | Year Ended December 31, 2019 | |
| | | Distributions paid from | |
| | | Ordinary
Income | | Net
Long-Term
Capital Gains | | Total
Distributions
Paid | |
| | | | | $ | 9,475,017 | | | $ | 137,660,011 | | | $ | 147,135,028 | | |
23
Victory Variable Insurance Funds | | Notes to Financial Statements — continued
December 31, 2019 | |
| | | Year Ended December 31, 2018 | |
| | | Distributions paid from | |
| | | Ordinary
Income | | Net
Long-Term
Capital Gains | | Total
Distributions
Paid | |
| | | | | $ | 11,515,218 | | | $ | 87,616,353 | | | $ | 99,131,571 | | |
As of the tax year ended December 31, 2019, the components of distributable earnings/accumulated deficit on a tax basis were as follows:
Undistributed
Ordinary
Income | | Undistributed
Long-Term
Capital Gains | | Accumulated
Earnings | | Accumulated
Capital and
Other
Losses | | Unrealized
Appreciation
(Depreciation) | | Total
Accumulated
Earnings
(Deficit) | |
| $ | 12,770,407 | | | $ | 55,064,815 | | | $ | 67,835,222 | | | $ | — | | | $ | 180,288,744 | | | $ | 248,123,966 | | |
During the tax year ended December 31, 2019, the Fund did not utilize capital loss carryforwards.
As of December 31, 2019, the cost basis for federal income tax purposes, gross unrealized appreciation, gross unrealized depreciation and net unrealized appreciation (depreciation) for investments and derivatives were as follows:
Cost of
Investments
for Federal
Tax Purposes | | Gross
Unrealized
Appreciation | | Gross
Unrealized
Depreciation | | Net
Unrealized
Appreciation
(Depreciation) | |
| $ | 755,177,820 | | | $ | 181,128,293 | | | $ | (839,549 | ) | | $ | 180,288,744 | | |
8. Capital Contribution from Prior Custodian:
During 2016, the Fund received notification from the Fund's prior custodian, State Street Bank and Trust ("State Street"), concerning issues related to billing on certain categories of expenses during the approximately 16-year period from 1998 through October 31, 2014. The over-billing primarily related to categories of expenses that involved an allocation of general costs among multiple clients.
State Street paid the refunded amounts during January 2017. Based on billing information received during 2016 from State Street and an analysis of any expense limitation agreements that were in place during the period of the activities in question, including the application of any recoupment provisions in such agreements, the Adviser received a portion of the refund.
The portion of the refund retained by the Fund was accounted for as a capital contribution and is reflected on the Financial Highlights as "Capital Contribution from Prior Custodian, Net".
9. Fund Ownership:
Ownership of more than 25% of the voting securities of a fund creates presumptions of control of the Fund, under section 2(a)(9) of the 1940 Act. As of December 31, 2019, the shareholder listed below held more than 25% of the shares outstanding of the Fund and may be deemed to control the Fund.
| Shareholder | | Percent | |
| GIAC | | | 99.9 | % | |
10. Subsequent Events:
The Fund has evaluated the need for additional disclosures or adjustments resulting from subsequent events through the date these financial statements were issued. Based on this evaluation, there were no subsequent events to report that would have a material impact on the Fund's financial statements.
24
REPORT OF INDEPENDENT REGISTERED PUBLIC ACCOUNTING FIRM
To the Shareholders and Board of Trustees of Victory Variable Insurance Funds
Opinion on the Financial Statements
We have audited the accompanying statement of assets and liabilities, including the schedule of portfolio investments, of Victory RS Large Cap Alpha VIP Series (the "Fund"), a series of Victory Variable Insurance Funds, as of December 31, 2019, the related statements of operations and changes in net assets, including the related notes, and the financial highlights for the year then ended (collectively referred to as the "financial statements"). In our opinion, the financial statements present fairly, in all material respects, the financial position of the Fund as of December 31, 2019, the results of its operations, the changes in its net assets, and the financial highlights for the year then ended, in conformity with accounting principles generally accepted in the United States of America.
The Fund's financial statements and financial highlights for the three years ended December 31, 2018, were audited by other auditors whose report dated February 15, 2019 and the Fund's financial highlights for the year ended December 31, 2015, were audited by other auditors whose report dated February 22, 2016, expressed unqualified opinions on those financial statements and financial highlights.
Basis for Opinion
These financial statements are the responsibility of the Fund's management. Our responsibility is to express an opinion on the Fund's financial statements based on our audit. We are a public accounting firm registered with the Public Company Accounting Oversight Board (United States) ("PCAOB") and are required to be independent with respect to the Fund in accordance with the U.S. federal securities laws and the applicable rules and regulations of the Securities and Exchange Commission and the PCAOB.
We conducted our audit in accordance with the standards of the PCAOB. Those standards require that we plan and perform the audit to obtain reasonable assurance about whether the financial statements are free of material misstatement whether due to error or fraud.
Our audit included performing procedures to assess the risks of material misstatement of the financial statements, whether due to error or fraud, and performing procedures that respond to those risks. Such procedures included examining, on a test basis, evidence regarding the amounts and disclosures in the financial statements. Our procedures included confirmation of securities owned as of December 31, 2019, by correspondence with the custodian. Our audit also included evaluating the accounting principles used and significant estimates made by management, as well as evaluating the overall presentation of the financial statements. We believe that our audit provides a reasonable basis for our opinion.
We have served as the auditor of one or more of the investment companies advised by Victory Capital Management, Inc. since 2015.

COHEN & COMPANY, LTD.
Cleveland, Ohio
February 18, 2020
25
Victory Variable Insurance Funds | | Supplemental Information
December 31, 2019 | |
(Unaudited)
Trustee and Officer Information
Board of Trustees:
Overall responsibility for management of the Trust rests with the Board. The Trust is managed by the Board in accordance with the laws of the State of Delaware. There are currently ten Trustees, nine of whom are not "interested persons" of the Trust within the meaning of that term under the 1940 Act ("Independent Trustees") and one of whom is an "interested person" of the Trust within the meaning of that term under the 1940 Act ("Interested Trustee"). The Trustees, in turn, elect the officers of the Trust to actively supervise its day-to-day operations. The following tables list the Trustees, their ages, position with the Trust, commencement of service, principal occupations during the past five years and any directorships of other investment companies or companies whose securities are registered under the Securities Exchange Act of 1934, as amended, or who file reports under that Act. Each Trustee oversees nine portfolios in the Trust, 42 portfolios in Victory Portfolios and 26 portfolios in Victory Portfolios II, each a registered investment company that, together with the Trust, comprise the Victory Funds Complex. Each Trustee's address is c/o Victory Variable Insurance Funds, 4900 Tiedeman Road, 4th Floor, Brooklyn, Ohio 44144. Each Trustee has an indefinite term.
Name and Age | | Position
Held with
the Trust | | Date
Commenced
Service | | Principal Occupation
During Past 5 Years | | Other
Directorships
Held During
Past 5 Years | |
Independent Trustees. | |
David Brooks Adcock, 68 | | Trustee | | February 2005 | | Consultant (since 2006). | | Chair and Trustee, Turner Funds (December 2016-December 2017). | |
Nigel D.T. Andrews, 72 | | Vice Chair and Trustee | | August 2002 | | Retired. | | Director, TCG BDC II, Inc. (since 2017);
Director, TCG BDC I, Inc. (formerly Carlyle GMS Finance, Inc.) (since 2012); Director, Old Mutual US Asset Management (2002-2014). | |
E. Lee Beard, 68* | | Trustee | | February 2005 | | Retired (since 2015); Consultant, The Henlee Group, LLC (consulting) (2005-2015). | | None. | |
Dennis M. Bushe, 76 | | Trustee | | July 2016 | | Retired. | | Trustee, RS Investment Trust and RS Variable Products Trust (November 2011-July 2016). | |
26
Victory Variable Insurance Funds | | Supplemental Information — continued
December 31, 2019 | |
(Unaudited)
Name and Age | | Position
Held with
the Trust | | Date
Commenced
Service | | Principal Occupation
During Past 5 Years | | Other
Directorships
Held During
Past 5 Years | |
Sally M. Dungan, 65 | | Trustee | | February 2011 | | Chief Investment Officer, Tufts University (since 2002). | | None. | |
John L. Kelly, 66 | | Trustee | | February 2015 | | Partner, McCarvill Capital Partners (September 2016-September 2017); Advisor, Endgate Commodities LLC (January 2016-April 2016); Managing Partner, Endgate Commodities LLC (August 2014-January 2016); Chief Operating Officer, Liquidnet Holdings, Inc. (December 2011-July 2014). | | Director, Caledonia Mining Corporation (since May 2012). | |
David L. Meyer, 62* | | Trustee | | December 2008 | | Retired. | | None. | |
Gloria S. Nelund, 58 | | Trustee | | July 2016 | | Chair, CEO and Co-Founder of TriLinc Global, LLC, an investment firm. | | TriLinc Global Impact Fund, LLC (since 2012); Trustee, RS Investment Trust and RS Variable Products Trust (November 2007-July 2016). | |
Leigh A. Wilson, 75 | | Chair and Trustee | | February 1998 | | Private Investor. | | Chair (since 2013), Caledonia Mining Corporation. | |
Interested Trustee. | |
David C. Brown, 47** | | Trustee | | May 2008 | | Chairman and Chief Executive Officer (since 2013), Co-Chief Executive Officer (2011-2013), the Adviser; Chairman and Chief Executive Officer, Victory Capital Holdings, Inc. (since 2013). | | USAA Mutual Funds Trust. | |
* The Board has designated Mr. Meyer and Ms. Beard as its Audit Committee Financial Experts.
** Mr. Brown is an "Interested Person" by reason of his relationship with the Adviser.
The Statement of Additional Information includes additional information about the Trustees of the Trust and is available, without charge, by calling 800-539-3863.
27
Victory Variable Insurance Funds | | Supplemental Information — continued
December 31, 2019 | |
(Unaudited)
Officers:
The officers of the Trust, their ages, commencement of service and their principal occupations during the past five years, are detailed in the following table. Each officer serves until the earlier of his or her resignation, removal, retirement, death, or the election of a successor. The mailing address of each officer of the Trust is 4900 Tiedeman Road, 4th Floor, Brooklyn, Ohio 44144. The officers of the Trust receive no compensation directly from the Trust for performing the duties of their offices.
Name and Age | | Position with
the Trust | | Date
Commenced
Service | | Principal Occupation During Past 5 Years | |
Christopher K. Dyer, 58 | | President | | February 2006* | | Director of Fund Administration, the Adviser. | |
Scott A. Stahorsky, 50 | | Vice President | | December 2014 | | Manager, Fund Administration, the Adviser (since 2015); Senior Analyst, Fund Administration, the Adviser (prior to 2015). | |
Erin G. Wagner, 46 | | Secretary | | December 2014 | | Associate General Counsel, the Adviser (since 2013). | |
Allan Shaer, 54 | | Treasurer | | May 2017 | | Senior Vice President, Financial Administration, Citi Fund Services Ohio, Inc. (since 2016); Vice President, Mutual Fund Administration, JP Morgan Chase (2011-2016). | |
Christopher A. Ponte, 35 | | Assistant Treasurer | | December 2017 | | Manager, Fund Administration, the Adviser (since 2017); Senior Analyst, Fund Administration, the Adviser (prior to 2017); Chief Financial Officer, Victory Capital Advisers, Inc. (since 2018). | |
Colin Kinney, 46 | | Chief Compliance Officer | | July 2017 | | Chief Compliance Officer (since 2013) and Chief Risk Officer (2009-2017), the Adviser. | |
Chuck Booth, 59 | | Anti-Money Laundering Compliance Officer and Identity Theft Officer | | May 2015 | | Director, Regulatory Administration and CCO Support Services, Citi Fund Services Ohio, Inc. | |
Jay G. Baris, 66 | | Assistant Secretary | | February 1998 | | Partner, Shearman & Sterling LLP (since 2018); Partner, Morrison & Foerster LLP (2011-January 2018). | |
* On December 3, 2014, Mr. Dyer resigned as Secretary of the Trust and accepted the position of President.
28
Victory Variable Insurance Funds | | Supplemental Information — continued
December 31, 2019 | |
(Unaudited)
Proxy Voting and Portfolio Holdings Information
Proxy Voting:
Information regarding the policies and procedures the Fund uses to determine how to vote proxies relating to portfolio securities is available without charge, upon request, by calling 800-539-3863. The information is also included in the Fund's Statement of Additional Information, which is available on the SEC's website at www.sec.gov.
Information relating to how the Fund voted proxies relating to portfolio securities held during the most recent twelve months ended June 30 is available on the SEC's website at www.sec.gov.
Availability of Schedules of Portfolio Investments:
The Trust files a complete list of Schedules of Portfolio Investments with the SEC for the first and third quarters of each fiscal year on Form N-PORT. Prior to the implementation of Form N-PORT, the Trust filed a complete list of Schedules of Portfolio Investments with the SEC for the first and third quarters of each fiscal year on Form N-Q. Forms N-PORT and Forms N-Q are available on the SEC's website at www.sec.gov.
Expense Examples
As a shareholder of the Fund, you may incur two types of costs: (1) transaction costs and (2) ongoing costs, including management fees, distribution and service (12b-1) fees, and other Fund expenses. These examples are intended to help you understand your ongoing costs (in dollars) of investing in the Fund and to compare these costs with the ongoing costs of investing in other mutual funds.
These examples are based on an investment of $1,000 invested at the beginning of the period and held for the entire period from July 1, 2019 through December 31, 2019.
The Actual Expense figures in the table below provide information about actual account values and actual expenses. You may use the information below, together with the amount you invested, to estimate the expenses that you paid over the period. Simply divide your account value by $1,000 (for example, an $8,600 account value divided by $1,000 = 8.6), then multiply the result by the number in the table under the heading entitled "Actual Expenses Paid During Period" to estimate the expenses you paid on your account during this period.
The Hypothetical Expense figures in the table below provide information about hypothetical account values and hypothetical expenses based on the Fund's actual expense ratio and an assumed rate of return of 5% per year before expenses, which is not the Fund's actual return. The hypothetical account values and expenses may not be used to estimate the actual ending account balance or expenses you paid for the period. You may use this information to compare this 5% hypothetical example with the 5% hypothetical examples that appear in shareholder reports of other funds.
Please note the expenses shown in the table are meant to highlight your ongoing costs only and do not reflect any transactional costs. Therefore, the table is useful in comparing ongoing costs only, and will not help you determine the relative total costs of owning different funds. In addition, if these transactional costs were included, your costs would have been higher.
Beginning
Account Value
7/1/19 | | Actual
Ending
Account Value
12/31/19 | | Hypothetical
Ending
Account Value
12/31/19 | | Actual
Expenses
Paid During
Period
7/1/19-12/31/19* | | Hypothetical
Expenses
Paid During
Period
7/1/19-12/31/19* | | Annualized
Expense Ratio
During Period
7/1/19-12/31/19 | |
$ | 1,000.00 | | | $ | 1,103.20 | | | $ | 1,022.43 | | | $ | 2.92 | | | $ | 2.80 | | | | 0.55 | % | |
* Expenses are equal to the average account value multiplied by the Fund's annualized expense ratio multiplied by 184/365 (the number of days in the most recent fiscal half-year divided by the number of days in the fiscal year).
29
Victory Variable Insurance Funds | | Supplemental Information — continued
December 31, 2019 | |
(Unaudited)
Additional Federal Income Tax Information
For the year ended December 31, 2019, the Fund paid qualified dividend income for the purposes of reduced individual federal income tax rates of 100%.
Dividends qualified for corporate dividends received deductions of 100%.
For the year ended December 31, 2019, the Fund designated long-term capital gain distributions in the amount of $137,660,011.
30
Victory Variable Insurance Funds | | Supplemental Information — continued
December 31, 2019 | |
(Unaudited)
Considerations of the Board in Continuing the Investment Advisory Agreement (the "Agreement")
The Board approved the Agreement on behalf of the Fund at an in-person meeting, which was called for that purpose, on December 4, 2019. The Board also considered information relating to the Fund and the Agreement provided throughout the year and, more specifically, at a meeting on October 22, 2019. The Board noted that prior to the Fund's reorganization on July 29, 2016, the Fund was managed by RS Investment Management Co. LLC, which was acquired by the Adviser on July 29, 2016. In considering whether to approve the Agreement, the Board requested, and the Adviser provided, information that the Board believed to be reasonably necessary to reach its conclusions.
The Board, including the Independent Trustees, evaluated this information along with other information obtained throughout the year and was advised by legal counsel to the Fund, which also serves as independent legal counsel to the Independent Trustees. In addition, in 2017 the Independent Trustees, through their counsel, retained an independent consultant to assist with a review of the overall process for conducting the annual review of these advisory arrangements.
The Board considered the Fund's advisory fee, expense ratio and investment performance as significant factors in determining whether the Agreement should be continued. In considering whether the compensation paid to the Adviser was fair and reasonable, the Board also evaluated, among other things, the following factors:
• The requirements of the Fund for the services provided by the Adviser;
• The nature, quality and extent of the services provided and expected to be provided;
• The performance of the Fund as compared to comparable funds;
• The fees payable for the services and whether the fee arrangements provided for economies of scale that would benefit Fund shareholders as the Fund grows;
• Whether the fee would be sufficient to enable the Adviser to attract and retain experienced personnel and continue to provide quality services to the Fund;
• The fees paid by other clients of the Adviser whose accounts are managed in a similar investment style and any differences in the services provided to the other clients compared to those provided to the Fund;
• The total expenses of the Fund, taking into consideration any distribution or shareholder servicing fees;
• Management's commitment to operating the Fund at competitive expense levels;
• The profitability of the Adviser (as reflected by comparing fees earned against an estimate of the Adviser's costs) with respect to the Adviser's relationship with the Fund;
• Research and other service benefits received by the Adviser obtained through payment of client commissions for securities transactions;
• Other benefits received by the Adviser, and its affiliates, including revenues paid to the Adviser, or its affiliates, by the Fund for administration and fund accounting services, and distribution;
• The capabilities and financial condition of the Adviser;
• Current economic and industry trends; and
• The historical relationship between the Fund and the Adviser.
The Board reviewed the Fund's current management fee, comprised of the advisory fee plus the administrative services fee paid to the Adviser, in the context of the Adviser's profitability with respect to the Fund. In addition, the Board compared the Fund's total operating expense ratio on a net and gross basis, taking into consideration any distribution or shareholder servicing fees and management fees with a universe of comparable mutual funds compiled by an independent consultant and a peer group of funds with similar investment strategies selected by that independent consultant from the universe. The Board reviewed the factors and methodology used by the independent consultant in the selection of the Fund's peer group, including the independent consultant's selection of a broad universe of funds, the more specific universe of comparable funds, and peer groups of funds with comparable investment strategies and asset levels, among other factors. The Board also reviewed any changes to the independent consultant's methodology as compared to the prior year, including those resulting from the Adviser's input, if any. The Board also reviewed fees and other information related to the Adviser's management of similarly managed institutional or private accounts, and the differences in the
31
Victory Variable Insurance Funds | | Supplemental Information — continued
December 31, 2019 | |
(Unaudited)
services provided to the other accounts, to the extent applicable. The Board noted that the advisory fee arrangements for the Fund do not include breakpoints, which are generally viewed as a method by which the investment adviser shares any economies of scale with a fund as a fund grows. The Board also considered the Adviser's commitment to limit expenses as discussed in more detail below, and would consider breakpoints at a future time if the Fund's assets were to grow significantly.
The Board reviewed the Fund's performance over one-, three-, five- and ten-year periods against the performance of the Fund's selected peer group and benchmark index. The Board recognized that the performance of the Fund and the peer group funds are net of expenses, while the performance of the benchmark index reflects gross returns. The Board considered the additional resources that the Adviser has committed to enhance portfolio analysis, compliance and trading systems.
The Board reviewed various other specific factors with respect to the Fund, as described below. In their deliberations, the Trustees did not rank the importance of any particular information or factor considered and each Trustee may have attributed different weights to various factors.
The Board concluded that the Fund's gross annual management fee was reasonable as compared to the median gross management fee charged to the funds in the Fund's peer group. The Board noted that the Fund's net annual expense ratio, taking into account any shareholder servicing or distribution fees, was reasonable as compared to the median expense ratio for the peer group. The Board considered the Adviser's contractual agreement to waive its fees and reimburse expenses for a specified period of time, as described in the Fund's prospectus. The Board then compared the Fund's performance for the one-, three-, five- and ten-year periods ended June 30, 2019, to that of the median performance of the peer group and benchmark index for the same periods and considered the fact that the Fund underperformed the benchmark index for the one- and ten-year periods, outperformed the benchmark index for the three- and five-year periods, and underperformed the peer group median for all of the periods reviewed. The Board brought the Fund's underperformance to management's attention and discussed with the Adviser any steps that had been or could be taken to enhance performance in the future.
Having considered, among other things: (1) that the Fund's management fee was within the ranges of advisory fees charged to comparable mutual funds; (2) that the Fund's total expense ratio was reasonable; (3) the Adviser's willingness to limit the expenses for a period of time would provide stability to the Fund's expenses during that period; and (4) the performance of the Fund, the Board concluded that the Agreement continued to be in the best interests of the Fund's shareholders.
Conclusion
Based on its review of the information requested and provided, and following extended discussions, the Board determined that the Agreement, on behalf of the Fund, was consistent with the best interests of the Fund and its shareholders, and the Board unanimously approved the Agreement, on behalf of the Fund, for an additional annual period on the basis of the foregoing review and discussions and the following considerations, among others:
• The fairness and reasonableness of the investment advisory fee payable to the Adviser under the Agreement in light of the investment advisory services provided, the costs of these services, the profitability of the Adviser's relationship with the Fund and the comparability of the fee paid to the fees paid by other investment companies;
• The nature, quality and extent of the investment advisory services provided by the Adviser;
• The Adviser's entrepreneurial commitment to the management of the Fund and the creation of a broad-based family of funds, which could entail a substantial commitment of the Adviser's resources to the successful operation of the Fund;
• The Adviser's representations regarding its staffing and capabilities to manage the Fund, including the retention of personnel with relevant portfolio management experience;
• The Adviser's efforts to enhance investment results by, among other things, developing quality portfolio management teams; and
• The overall high quality of the personnel, operations, financial condition, investment management capabilities, methodologies and performance of the Adviser.
32
Privacy Policy
Protecting the Privacy of Information
The Trust respects your right to privacy. We also know that you expect us to conduct and process your business in an accurate and efficient manner. To do so, we must collect and maintain certain personal information about you. This is the information we collect from you on applications or other forms, and from the transactions you make with us or third parties. It may include your name, address, social security number, account transactions and balances, and information about investment goals and risk tolerance.
We do not disclose any information about you or about former customers to anyone except as permitted or required by law. Specifically, we may disclose the information we collect to companies that perform services on our behalf, such as the transfer agent that processes shareholder accounts and printers and mailers that assist us in the distribution of investor materials. We may also disclose this information to companies that perform marketing services on our behalf. This allows us to continue to offer you Victory investment products and services that meet your investing needs, and to effect transactions that you request or authorize. These companies will use this information only in connection with the services for which we hired them. They are not permitted to use or share this information for any other purpose.
To protect your personal information internally, we permit access only by authorized employees and maintain physical, electronic and procedural safeguards to guard your personal information.*
* You may have received communications regarding information about privacy policies from other financial institutions which gave you the opportunity to "opt-out" of certain information sharing with companies which are not affiliated with that financial institution. The Trust does not share information with other companies for purposes of marketing solicitations for products other than the Trust. Therefore, the Trust does not provide opt-out options to their shareholders.
Victory Funds
P.O. Box 182593
Columbus, Ohio 43218-2593

Visit our website at: | | Call Victory at: | |
www.vcm.com | | 800-539-FUND (800-539-3863) | |
VVIF-RS-LCAVIP-AR (12/19)

December 31, 2019
Annual Report
Victory Variable Insurance Funds
Victory RS Small Cap Growth Equity VIP Series
Beginning January 1, 2021, as permitted by regulations adopted by the Securities and Exchange Commission, paper copies of the Fund's shareholder reports may no longer be sent by mail from the insurance company that issued your variable annuity and variable life insurance contract, unless you specifically request paper copies of the reports from your insurance company. Instead, the reports will be made available on www.victoryfunds.com. The insurance company that offers your contract may also make these reports available on a website, and such insurance company will notify you by mail each time a report is posted and provide you with a website link to access the report.
If you already elected to receive shareholder reports electronically, you will not be affected by this change and you need not take any action. You may elect to receive shareholder reports and other communications from the insurance company electronically by following the instructions provided by the insurance company.
If offered by your insurance company, you may elect to receive all future reports in paper and free of charge from the insurance company. You can inform your insurance company that you wish to continue receiving paper copies of your reports. Your election to receive reports in paper will apply to all funds available under your contract.
www.vcm.com
News, Information And Education 24 Hours A Day, 7 Days A Week
The Victory Funds site gives fund shareholders, prospective shareholders, and investment professionals a convenient way to access fund information, get guidance, and track fund performance anywhere they can access the Internet. The site includes:
• Detailed performance records
• Daily share prices
• The latest fund news
• Investment resources to help you become a better investor
• A section dedicated to investment professionals
Whether you're a potential investor searching for the fund that matches your investment philosophy, a seasoned investor interested in planning tools, or an investment professional, www.vcm.com has what you seek. Visit us anytime. We're always open.
Victory Variable Insurance Funds
Table of Contents
Shareholder Letter (Unaudited) | | | 3 | | |
Fund Review and Commentary (Unaudited) | | | 5 | | |
Financial Statements | |
Schedule of Portfolio Investments | | | 9 | | |
Statement of Assets and Liabilities | | | 12 | | |
Statement of Operations | | | 13 | | |
Statements of Changes in Net Assets | | | 14 | | |
Financial Highlights | | | 16 | | |
Notes to Financial Statements | | | 18 | | |
Report of Independent
Registered Public Accounting Firm | | | 25 | | |
Supplemental Information (Unaudited) | |
Trustee and Officer Information | | | 26 | | |
Proxy Voting and Portfolio Holdings Information | | | 29 | | |
Expense Examples | | | 29 | | |
Additional Federal Income Tax Information | | | 30 | | |
Advisory Contract Renewal | | | 31 | | |
Privacy Policy (inside back cover) | | | |
The Fund is distributed by Victory Capital Advisers, Inc. Victory Capital Management Inc. is the investment adviser to the Fund and receives fees from the Fund for performing services for the Fund.
This report is not authorized for distribution to prospective investors unless preceded or accompanied by a current prospectus of the Fund.
For additional information about any Victory Fund, including fees, expenses, and risks, view our prospectus online at www.vcm.com or call 800-539-3863. Read it carefully before you invest or send money.
The information in this annual report is based on data obtained from recognized services and sources and is believed to be reliable. Any opinions, projections, or recommendations in this report are subject to change without notice and are not intended as individual investment advice. Past investment performance of the Fund, markets or securities mentioned herein should not be considered to be indicative of future results.
• NOT FDIC INSURED • NO BANK GUARANTEE
• MAY LOSE VALUE

Call Victory at:
800-539-FUND (800-539-3863)
Visit our website at:
www.vcm.com
1
This page is intentionally left blank.
2
Victory Funds Letter to Shareholders
(Unaudited)
Dear Shareholder,
As we turn the page into a new decade, it's hard not to reflect on the fact that we have been enjoying the longest-ever bull market in U.S. equities. The run has been impressive, and despite periods of tumult and plenty of negative news, the bull market endured throughout 2019.
For the annual reporting period ended December 31, 2019, the S&P 500® Index posted impressive gains of 31.49%. This represents the greatest one-year gain since 2013 and also illustrates a swift bounce-back after a precipitous drop late in 2018. The move higher supports the notion that underlying fundamentals of U.S. companies drive performance, rather than the political rancor and headline fears that often capture the attention of investors.
Perhaps we shouldn't be surprised at the impressive performance of equities. The U.S. economy — the world's largest — remains on solid footing and has been a key driver of both domestic and international stocks. Robust job creation, near-record low unemployment, and steady consumer spending continue and offer reasons for further optimism. Meanwhile, inflation remains muted, and the Federal Reserve (the Fed) and other major global central banks have taken an accommodative stance. In fact, the Fed has cut interest rates by a total of 0.75% over three meetings last July, September and October.
The risk-on attitudes of investors, coupled with the accommodative monetary policy, had an expected impact on U.S. Treasury yields. The 10-year Treasury yield declined significantly over the course of 2019, falling from 2.66% to 1.92% at year-end. More interesting, however, was the fact that, the yield on 10-year Treasurys fell below shorter-term yields for the first time since before the 2007-2008 Global Financial Crisis. This inverted yield curve spooked investors for a spell, only to revert back to a traditional upward sloping yield curve by the end of the year.
The robust domestic economy, low interest rates, and ample liquidity from central banks provided a potent tonic for the stock market in 2019. In fact, at year-end 2019, the S&P 500® Index was approaching its highest valuation level since 1999. This reminds all of us to retain some historical context on the bull market. Many of us remember the Global Financial Crisis and, before that, the collapse of the dot-com bubble. Although those are now but a distant memory (and we are not forecasting such tumult), we should not forget that stocks don't always go up and cycles don't last forever. In other words, valuations still matter.
The key point is not to discount the risks. In addition to lofty valuations, investors need to keep apprised of trade disputes, geopolitical hotspots, a contentious U.S. election, and a host of other potential headwinds. Yet it is these very risks — these cross-currents — that may create pricing dislocations. This is an environment in which we believe our Victory Capital independent investment franchises can thrive.
On the following pages, you will find information relating to your Victory Funds investment. If you have any questions, we encourage you to contact your financial
3
advisor. Or, if you invest with us directly, you may call (800) 539-3863, or visit our website at www.vcm.com.
My colleagues and I sincerely appreciate the confidence you have placed in the Victory Funds, and we value the opportunity to help meet your investment goals.

Christopher K. Dyer, CFA
President,
Victory Funds
4
Victory Variable Insurance Funds (Unaudited)
Victory RS Small Cap Growth Equity VIP Series
Portfolio Holdings
As a Percentage of Total Investments

Performance Update
The Victory RS Small Cap Growth Equity VIP Series (the "Fund") seeks to provide long-term capital appreciation. The Fund returned 38.78% in 2019, outperforming its benchmark, the Russell 2000® Growth Index (the "Index"), which returned 28.48%.
Market Overview
U.S. equity markets delivered solid performance across styles throughout 2019, as the S&P 500® Index delivered its 10th year of positive returns in the last 11 years. U.S. stocks rebounded from a challenging 2018, driven by resilience in the U.S. economy and renewed risk-taking among investors and supported by a strong job market and more accommodative monetary policy.
The year began on a positive note, with strong performance in the first half of the year before volatility emerged in the third quarter, dampening the strong investor sentiment and causing some investors to wonder whether 2018's challenging second half of the year would repeat. The market rebounded sharply in the fourth quarter (despite a challenging environment for corporate earnings, given higher input costs) on improved prospects for global growth in 2020. Top-line sales growth continued to be supported by the strength of the U.S. economy, which helped fuel the best annual performance for U.S. stocks (as represented by the Russell 3000® Index) since 2013.
Large-cap stocks outperformed mid- and small-cap stocks during the year, as measured by the Russell family of indices, a continued trend experienced in both 2017 and 2018, while growth-oriented investments outperformed value as investors favored the strong fundamentals of growth stocks. Growth stocks, as measured by the Russell 3000® Growth Index, have now outperformed value stocks as measured by the Russell 3000® Value Index over 1, 3, 5, 10, 15, and even 30 years.
Portfolio Review
Within the Technology sector, contributors to the Fund's performance included RingCentral, Inc. (RingCentral), a provider of software-as-a-service solutions for businesses to support modern communications. We initially purchased the stock in early 2014 given the thesis that RingCentral operates in a huge, approximately $50 billion global market (with approximately $15 billion in the United States alone) that was only 10% penetrated by cloud offerings. The company has executed very well due to their industry-leading technology driven by a large research and development budget which, combined with aggressive marketing, has allowed the company to take market share. In the most recent quarter, RingCentral announced a commercial agreement with Avaya Holdings Corp. (Avaya), a global leader in communications, where RingCentral would become the exclusive provider of unified communications as a service (UCaaS) solutions to Avaya in a strategic partnership that would provide RingCentral access to Avaya's installed base of 100 million customers for a new RingCentral product on
5
Victory Variable Insurance Funds (Unaudited)
Victory RS Small Cap Growth Equity VIP Series (continued)
Avaya's Cloud Office. We expect this deal to accelerate RingCentral's global expansion, as well as to become an important channel for RingCentral for years to come.
Technology holding Coupa Software Incorporated (Coupa) was another strong contributor to the Fund's performance in 2019. Coupa is a cloud-based platform that allows organizations to automate purchase, invoice, and expense management. We originally purchased the stock given the tailwinds associated with the shift by corporations toward solutions that can be easily scaled, the company's intuitive consumer-friendly interface that leads to greater adoption, and pricing that allows for better targeting. Coupa performed exceptionally well in 2019, driven by the company's ability to move up market, which has driven improved unit economics and strong demand for the company's Coupa pay modules that allow customers to directly pay invoices. Given the success of the holding, we did sell the position from the Fund for market cap reasons.
Stock selection within the Financial Services sector also added to the Fund's performance, due in large part to an investment in eHealth, Inc. (eHealth), a private health insurance exchange for individuals, families, and small businesses. We originally purchased eHealth given its leadership in a growing marketplace that we felt was protected by high barriers given the rigorous approval process required in the healthcare insurance marketplace. eHealth performed exceptionally well throughout the year, easily beating expectations for agent count and sponsor commission revenue, which helped drive market expectations higher.
Within the Health Care sector, the largest detractor to Fund performance was biotechnology holding Ligand Pharmaceuticals Incorporated (Ligand), a biotechnology company with a unique business approach that provides diversified exposure to a range of promising drugs under development by other biotech and pharmaceutical companies. Ligand was dragged lower in part by a bearish report by short-seller Citron, Inc. (published in January) that made the case that Ligand's pipeline of drugs was not as robust as investors thought. We reviewed their analysis and came away unimpressed. In fact, less than two months after the report that put a $35 price target on the company, Ligand sold their Promacta assets (one of their many drugs) to Royalty Pharma for $827 million, which provided cash of $40 per share (higher than the short seller price target alone). Following this news of the asset sale (which Ligand outlined would be used to acquire new assets and repurchase shares), we were surprised that the stock did not respond positively, but we believe in the fundamentals of the company and business model; thus, we continue to hold the position at a more attractive valuation.
Financial Services holding Green Dot Corporation (Green Dot) also detracted from Fund performance in 2019. Green Dot is a bank and financial technology company that provides prepaid cards, debit cards, checking accounts, and consumer cash processing services. We initially purchased the stock given the strong leadership team, market leadership position within several channels, strong cash flows, and merger and acquisition opportunities. In the most recent calendar year, the company was weighed down by poor execution and the unexpected announcement during the first quarter that technology and marketing investment would be much higher than anticipated. We were fortunate to use that as an opportunity to exit the position, as the company continued to disappoint the remainder of the year, falling another 35% following their second quarter results.
6
Victory Variable Insurance Funds (Unaudited)
Victory RS Small Cap Growth Equity VIP Series (continued)
Technology holding Mercury Systems, Inc. (Mercury) also proved to be disappointing in 2019. Mercury is a leading provider of secure and mission-critical processing subsystems across several defense platforms for the U.S. Department of Defense and prime contractors. We initially purchased the stock given the strong commercial model the company applies to the defense electronic industry, wherein they fund research and development themselves rather than being funded directly by the government, which leads to higher margins for finished goods. Despite solid execution in recent quarters, the stock has been weighed down by their heavy investment in manufacturing, as capital expenditure was expected to be up 90% year-over-year to modernize their West Coast facilities, pushing expected earnings below Street forecasts. We believe the decision to invest in their business makes sense; thus, we continued to hold the position.
Outlook
We view the outsized outperformance of the market over the past year, which followed a tumultuous 2018 calendar year, as noise, preferring to focus on how our investments perform relative to the fundamental anchor points that track the progress of our long-term growth stories. Instead of fearing these periods, we prefer to use this heightened volatility to take gains in investments where we believe price action has exceeded fundamentals, to initiate new investments at attractive prices, and add to some of our favorite investments. We believe that this environment works to our strength as stock pickers as we work to uncover companies with high-quality growth stories at valuations that are attractive relative to the broader market.
Overall, we expect the market to benefit from an accommodative U.S. Federal Reserve that is once again in easing mode, and our continued base case is that there will be a constructive resolution to ongoing trade disputes. The relative strength in both the U.S. economy and labor market, the impact of lower projected inflation, and expectations of future monetary policy, have reinforced our view that earnings for growth stocks will remain attractive. It is our view that the U.S. equity market can continue to rise given strong U.S. growth, as reflected in gross domestic product increasing 2.1% year-over-year in the most recent quarter, the 12th consecutive quarterly period of greater than 2% year-over-year growth. All this supports our constructive outlook for U.S. small-cap growth stocks.
7
Victory Variable Insurance Funds (Unaudited)
Victory RS Small Cap Growth Equity VIP Series (continued)
Average Annual Total Return
Year Ended December 31, 2019
| | Class I | | | | | |
INCEPTION DATE | | 5/1/97 | | | | | |
| | | Net Asset
Value | | Russell 2000®
Growth Index1 | | Russell 2000® Index2 | |
One Year | | | 38.78 | % | | | 28.48 | % | | | 25.52 | % | |
Three Year | | | 20.73 | % | | | 12.49 | % | | | 8.59 | % | |
Five Year | | | 12.42 | % | | | 9.34 | % | | | 8.23 | % | |
Ten Year | | | 15.64 | % | | | 13.01 | % | | | 11.83 | % | |
Since Inception | | | 10.69 | % | | | N/A | | | | N/A | | |
Expense Ratios
Gross | | | 0.89 | % | |
With Applicable Waivers | | | 0.88 | % | |
Past performance is not indicative of future results. The performance data quoted represents past performance and current returns may be lower or higher. The investment return and principal value will fluctuate so that an investor's shares, when redeemed, may be worth more or less than the original cost. To obtain performance information current to the most recent month's end, please visit www.vcm.com.
The above expense ratios are from the Fund's prospectus dated May 1, 2019. Additional information pertaining to the Fund's expense ratios as of December 31, 2019 can be found in the financial highlights.
The total return figures set forth above include all waivers of fees for various periods since inception. Without such fee waivers, the total returns would have been lower. Some fee waivers are voluntary and may be modified or terminated at any time. The total returns do not include any insurance, sales or administrative charges of variable annuity or life insurance contracts. If these charges were included, the total returns would have been lower.
Victory RS Small Cap Growth Equity VIP Series — Growth of $10,000

1The Russell 2000® Growth Index is an unmanaged market-capitalization-weighted index that measures the performance of those companies in the Russell 2000® Index with higher price-to-book ratios and higher forecasted growth values. Index results assume the reinvestment of dividends paid on the stocks constituting the index. You may not invest in the index, and, unlike the Fund, the index does not incur fees and expenses. It is not possible to invest directly in an index.
2The Russell 2000® Index is an unmanaged market-capitalization-weighted index that measures the performance of the 2,000 smallest companies in the Russell 3000® Index, which consists of the 3,000 largest U.S. companies based on total market capitalization. Index results assume the reinvestment of dividends paid on the stocks constituting the index. You may not invest in the index, and, unlike the Fund, the index does not incur fees or expenses. It is not possible to invest directly in an index.
The graph reflects investment of growth of a hypothetical $10,000 investment in the Fund. Past performance is no guarantee of future results.
The graph and table do not reflect the deduction of taxes that a shareholder would pay on Fund distributions or the redemption of Fund shares.
8
Victory Variable Insurance Funds
Victory RS Small Cap Growth Equity VIP Series | | Schedule of Portfolio Investments
December 31, 2019 | |
Security Description | | Shares | | Value | |
Common Stocks (97.8%) | |
Biotechnology (17.8%): | |
Aimmune Therapeutics, Inc. (a) (b) | | | 44,500 | | | $ | 1,489,415 | | |
Amicus Therapeutics, Inc. (a) | | | 97,699 | | | | 951,588 | | |
Apellis Pharmaceuticals, Inc. (a) (b) | | | 42,310 | | | | 1,295,532 | | |
Arena Pharmaceuticals, Inc. (a) | | | 17,220 | | | | 782,132 | | |
Ascendis Pharma A/S, ADR (a) | | | 9,670 | | | | 1,345,290 | | |
Bluebird Bio, Inc. (a) (b) | | | 17,452 | | | | 1,531,413 | | |
Blueprint Medicines Corp. (a) | | | 11,996 | | | | 961,000 | | |
Celyad SA, ADR (a) | | | 18,150 | | | | 189,123 | | |
CytomX Therapeutics, Inc., Class A (a) | | | 56,740 | | | | 471,509 | | |
Epizyme, Inc. (a) | | | 60,420 | | | | 1,486,332 | | |
Equillium, Inc. (a) (c) | | | 40,127 | | | | 135,629 | | |
Fate Therapeutics, Inc. (a) | | | 83,040 | | | | 1,625,094 | | |
Gossamer Bio, Inc. (a) | | | 30,060 | | | | 469,838 | | |
Immunomedics, Inc. (a) | | | 44,020 | | | | 931,463 | | |
Invitae Corp. (a) (b) | | | 55,760 | | | | 899,409 | | |
Iovance Biotherapeutics, Inc. (a) (b) | | | 52,754 | | | | 1,460,231 | | |
Kura Oncology, Inc. (a) | | | 43,620 | | | | 599,775 | | |
Mirati Therapeutics, Inc. (a) (b) | | | 9,270 | | | | 1,194,532 | | |
Myovant Sciences Ltd. (a) | | | 53,493 | | | | 830,211 | | |
| | | | 18,649,516 | | |
Communication Services (2.4%): | |
Bandwidth, Inc., Class A (a) (b) | | | 19,630 | | | | 1,257,302 | | |
Cardlytics, Inc. (a) | | | 8,650 | | | | 543,739 | | |
QuinStreet, Inc. (a) | | | 45,554 | | | | 697,432 | | |
| | | | 2,498,473 | | |
Consumer Discretionary (11.7%): | |
Aaron's, Inc. (b) | | | 12,190 | | | | 696,171 | | |
Arco Platform Ltd., ADR, Class A (a) | | | 32,830 | | | | 1,451,086 | | |
Dine Brands Global, Inc. (b) | | | 14,500 | | | | 1,211,040 | | |
Eldorado Resorts, Inc. (a) (b) | | | 26,310 | | | | 1,569,128 | | |
Frontdoor, Inc. (a) | | | 19,460 | | | | 922,793 | | |
Monro, Inc | | | 16,540 | | | | 1,293,428 | | |
Planet Fitness, Inc., Class A (a) | | | 17,550 | | | | 1,310,634 | | |
Regis Corp. (a) (b) | | | 36,360 | | | | 649,753 | | |
Skyline Champion Corp. (a) (b) | | | 17,560 | | | | 556,652 | | |
Steven Madden Ltd. | | | 17,613 | | | | 757,535 | | |
Strategic Education, Inc. | | | 12,260 | | | | 1,948,114 | | |
| | | | 12,366,334 | | |
Consumer Staples (4.8%): | |
BellRing Brands, Inc., Class A (a) | | | 27,630 | | | | 588,243 | | |
BJ's Wholesale Club Holdings, Inc. (a) (b) | | | 44,560 | | | | 1,013,294 | | |
Freshpet, Inc. (a) | | | 13,096 | | | | 773,843 | | |
Hostess Brands, Inc. (a) | | | 94,550 | | | | 1,374,757 | | |
Nomad Foods Ltd., ADR (a) | | | 59,070 | | | | 1,321,396 | | |
| | | | 5,071,533 | | |
See notes to financial statements.
9
Victory Variable Insurance Funds
Victory RS Small Cap Growth Equity VIP Series | | Schedule of Portfolio Investments — continued
December 31, 2019 | |
Security Description | | Shares | | Value | |
Energy (0.7%): | |
Newpark Resources, Inc. (a) (b) | | | 120,219 | | | $ | 753,773 | | |
Financials (6.2%): | |
eHealth, Inc. (a) (b) | | | 10,070 | | | | 967,526 | | |
Essent Group Ltd. | | | 32,110 | | | | 1,669,399 | | |
FirstCash, Inc., Class A | | | 23,580 | | | | 1,901,255 | | |
LendingTree, Inc. (a) (b) | | | 3,620 | | | | 1,098,453 | | |
Western Alliance Bancorp | | | 16,190 | | | | 922,830 | | |
| | | | 6,559,463 | | |
Health Care Equipment & Supplies (4.7%): | |
Cryoport, Inc. (a) (b) | | | 43,650 | | | | 718,479 | | |
Irhythm Technologies, Inc. (a) (b) | | | 13,510 | | | | 919,896 | | |
Masimo Corp. (a) | | | 7,650 | | | | 1,209,159 | | |
Nevro Corp. (a) | | | 10,730 | | | | 1,261,204 | | |
Silk Road Medical, Inc. (a) (b) | | | 20,160 | | | | 814,061 | | |
| | | | 4,922,799 | | |
Health Care Providers & Services (4.0%): | |
Hanger, Inc. (a) | | | 41,350 | | | | 1,141,674 | | |
HealthEquity, Inc. (a) | | | 15,460 | | | | 1,145,122 | | |
LHC Group, Inc. (a) (b) | | | 13,720 | | | | 1,890,067 | | |
| | | | 4,176,863 | | |
Health Care Technology (2.0%): | |
Health Catalyst, Inc. (a) (b) | | | 23,930 | | | | 830,371 | | |
Inspire Medical System, Inc. (a) (b) | | | 16,870 | | | | 1,251,923 | | |
| | | | 2,082,294 | | |
Industrials (16.3%): | |
Albany International Corp. | | | 18,710 | | | | 1,420,463 | | |
Armstrong World Industries, Inc. | | | 9,770 | | | | 918,087 | | |
Axon Enterprise, Inc. (a) | | | 19,360 | | | | 1,418,701 | | |
Azul SA, ADR (a) (b) | | | 41,830 | | | | 1,790,324 | | |
ESCO Technologies, Inc. | | | 16,430 | | | | 1,519,775 | | |
FTI Consulting, Inc. (a) | | | 8,880 | | | | 982,661 | | |
Generac Holdings, Inc. (a) | | | 14,310 | | | | 1,439,443 | | |
Mercury Systems, Inc. (a) | | | 24,010 | | | | 1,659,331 | | |
Simpson Manufacturing Co., Inc. | | | 10,340 | | | | 829,578 | | |
Siteone Landscape Supply, Inc. (a) | | | 22,170 | | | | 2,009,711 | | |
SPX Corp. (a) | | | 9,160 | | | | 466,061 | | |
Trex Co., Inc. (a) | | | 12,110 | | | | 1,088,447 | | |
Watts Water Technologies, Inc., Class A (b) | | | 16,920 | | | | 1,687,939 | | |
| | | | 17,230,521 | | |
Information Technology (24.7%): | |
ACI Worldwide, Inc. (a) | | | 57,910 | | | | 2,193,920 | | |
Advanced Energy Industries, Inc. (a) | | | 26,960 | | | | 1,919,551 | | |
Cabot Microelectronics Corp. | | | 10,780 | | | | 1,555,770 | | |
Cornerstone OnDemand, Inc. (a) | | | 32,120 | | | | 1,880,626 | | |
Envestnet, Inc. (a) | | | 13,150 | | | | 915,635 | | |
Everbridge, Inc. (a) (b) | | | 20,970 | | | | 1,637,338 | | |
See notes to financial statements.
10
Victory Variable Insurance Funds
Victory RS Small Cap Growth Equity VIP Series | | Schedule of Portfolio Investments — continued
December 31, 2019 | |
Security Description | | Shares | | Value | |
Evo Payments, Inc. (a) | | | 57,610 | | | $ | 1,521,480 | | |
Inphi Corp. (a) | | | 4,510 | | | | 333,830 | | |
Itron, Inc. (a) | | | 19,700 | | | | 1,653,815 | | |
Lattice Semiconductor Corp. (a) | | | 48,340 | | | | 925,228 | | |
Littelfuse, Inc. (b) | | | 4,379 | | | | 837,703 | | |
Liveramp Holdings, Inc. (a) | | | 22,290 | | | | 1,071,480 | | |
MACOM Technology Solutions Holdings, Inc. (a) | | | 21,420 | | | | 569,772 | | |
Monolithic Power Systems, Inc. | | | 2,597 | | | | 462,318 | | |
Q2 Holdings, Inc. (a) | | | 10,350 | | | | 839,178 | | |
Silicon Laboratories, Inc. (a) | | | 14,750 | | | | 1,710,705 | | |
Varonis Systems, Inc. (a) | | | 30,930 | | | | 2,403,570 | | |
Wix.com Ltd., ADR (a) | | | 16,010 | | | | 1,959,304 | | |
WNS Holdings Ltd., ADR (a) | | | 22,936 | | | | 1,517,216 | | |
| | | | 25,908,439 | | |
Materials (1.1%): | |
Ingevity Corp. (a) | | | 12,700 | | | | 1,109,726 | | |
Pharmaceuticals (1.4%): | |
Assembly Biosciences, Inc. (a) | | | 21,540 | | | | 440,708 | | |
GW Pharmaceuticals PLC, ADR (a) (b) | | | 9,970 | | | | 1,042,463 | | |
| | | | 1,483,171 | | |
Total Common Stocks (Cost $86,754,584) | | | 102,812,905 | | |
Collateral for Securities Loaned^ (13.7%) | |
BlackRock Liquidity Funds TempFund Portfolio, Institutional Class, 1.75% (d) | | | 684,688 | | | | 684,688 | | |
Fidelity Investments Money Market Government Portfolio, Class I, 1.54% (d) | | | 3,772,143 | | | | 3,772,143 | | |
Fidelity Investments Prime Money Market Portfolio, Class I, 1.75% (d) | | | 114,360 | | | | 114,360 | | |
Goldman Sachs Financial Square Prime Obligations Fund, Institutional
Class, 1.80% (d) | | | 2,278,764 | | | | 2,278,764 | | |
JPMorgan Prime Money Market Fund, Capital Class, 1.73% (d) | | | 2,506,817 | | | | 2,506,817 | | |
Morgan Stanley Institutional Liquidity Prime Portfolio, Institutional
Class, 1.76% (d) | | | 5,013,464 | | | | 5,013,464 | | |
Total Collateral for Securities Loaned (Cost $14,370,236) | | | 14,370,236 | | |
Total Investments (Cost $101,124,820) — 111.5% | | | 117,183,141 | | |
Liabilities in excess of other assets — (11.5)% | | | (12,070,806 | ) | |
NET ASSETS — 100.00% | | $ | 105,112,335 | | |
^ Purchased with cash collateral from securities on loan.
(a) Non-income producing security.
(b) All or a portion of this security is on loan.
(c) The Fund's Adviser has deemed this security to be illiquid based upon procedures approved by the Board of Trustees. As of December 31, 2019, illiquid securities were 0.1% of the Fund's net assets.
(d) Rate disclosed is the daily yield on December 31, 2019.
ADR — American Depositary Receipt
PLC — Public Limited Company
See notes to financial statements.
11
Victory Variable Insurance Funds | | Statement of Assets and Liabilities
December 31, 2019 | |
| | | Victory RS Small Cap
Growth Equity VIP Series | |
ASSETS: | |
Investments, at value (Cost $101,124,820) | | $ | 117,183,141 | (a) | |
Cash and cash equivalents | | | 2,626,645 | | |
Interest and dividends receivable | | | 28,583 | | |
Receivable for capital shares issued | | | 165,456 | | |
Receivable for investments sold | | | 546,331 | | |
Receivable from Adviser | | | 21,096 | | |
Prepaid expenses | | | 6,457 | | |
Total Assets | | | 120,577,709 | | |
LIABILITIES: | |
Payables: | |
Collateral received on loaned securities | | | 14,370,236 | | |
Investments purchased | | | 924,618 | | |
Capital shares redeemed | | | 69,914 | | |
Accrued expenses and other payables: | |
Investment advisory fees | | | 65,895 | | |
Administration fees | | | 4,984 | | |
Custodian fees | | | 1,118 | | |
Transfer agent fees | | | 10,440 | | |
Compliance fees | | | 71 | | |
Trustees' fees | | | 212 | | |
Other accrued expenses | | | 17,886 | | |
Total Liabilities | | | 15,465,374 | | |
NET ASSETS: | |
Capital | | | 70,326,063 | | |
Total distributable earnings/(loss) | | | 34,786,272 | | |
Net Assets | | $ | 105,112,335 | | |
Shares (unlimited shares authorized with a par value of
$0.001 per share): | | | 6,272,033 | | |
Net asset value: | | $ | 16.76 | | |
(a) Includes $14,109,950 of securities on loan.
See notes to financial statements.
12
Victory Variable Insurance Funds | | Statement of Operations
For the Year Ended December 31, 2019 | |
| | | Victory RS Small Cap
Growth Equity VIP Series | |
Investment Income: | |
Dividends | | $ | 275,014 | | |
Interest | | | 44,697 | | |
Securities lending (net of fees) | | | 27,737 | | |
Total Income | | | 347,448 | | |
Expenses: | |
Investment advisory fees | | | 774,501 | | |
Administration fees | | | 63,140 | | |
Custodian fees | | | 6,716 | | |
Transfer agent fees | | | 137,690 | | |
Trustees' fees | | | 9,991 | | |
Compliance fees | | | 706 | | |
Legal and audit fees | | | 18,012 | | |
Other expenses | | | 31,844 | | |
Total Expenses | | | 1,042,600 | | |
Expenses waived/reimbursed by Adviser | | | (133,480 | ) | |
Net Expenses | | | 909,120 | | |
Net Investment Income (Loss) | | | (561,672 | ) | |
Realized/Unrealized Gains (Losses) from Investments: | |
Net realized gains (losses) from investment securities | | | 20,085,016 | | |
Net change in unrealized appreciation/depreciation on investment securities | | | 13,360,263 | | |
Net realized/unrealized gains on investments | | | 33,445,279 | | |
Change in net assets resulting from operations | | $ | 32,883,607 | | |
See notes to financial statements.
13
Victory Variable Insurance Funds | | Statements of Changes in Net Assets | |
| | | Victory RS Small Cap Growth
Equity VIP Series | |
| | | Year Ended
December 31,
2019 | | Year Ended
December 31,
2018 | |
From Investment Activities: | |
Operations: | |
Net investment income (loss) | | $ | (561,672 | ) | | $ | (500,451 | ) | |
Net realized gains (losses) from investments | | | 20,085,016 | | | | 22,267,262 | | |
Net change in unrealized appreciation/depreciation
on investments | | | 13,360,263 | | | | (28,678,125 | ) | |
Change in net assets resulting from operations | | | 32,883,607 | | | | (6,911,314 | ) | |
Change in net assets resulting from distributions to shareholders | | | (21,884,620 | ) | | | (16,485,913 | ) | |
Change in net assets resulting from capital transactions | | | 5,057,374 | | | | 982,954 | | |
Change in net assets | | | 16,056,361 | | | | (22,414,273 | ) | |
Net Assets: | |
Beginning of period | | | 89,055,974 | | | | 111,470,247 | | |
End of period | | $ | 105,112,335 | | | $ | 89,055,974 | | |
Capital Transactions: | |
Proceeds from shares issued | | $ | 5,861,988 | | | $ | 6,277,058 | | |
Distributions reinvested | | | 21,884,620 | | | | 16,485,913 | | |
Cost of shares redeemed | | | (22,689,234 | ) | | | (21,780,017 | ) | |
Change in net assets resulting from capital transactions | | $ | 5,057,374 | | | $ | 982,954 | | |
Share Transactions: | |
Issued | | | 305,660 | | | | 284,919 | | |
Reinvested | | | 1,330,372 | | | | 1,088,898 | | |
Redeemed | | | (1,188,577 | ) | | | (991,856 | ) | |
Change in Shares | | | 447,455 | | | | 381,961 | | |
See notes to financial statements.
14
This page is intentionally left blank.
15
Victory Variable Insurance Funds | | Financial Highlights | |
For a Share Outstanding Throughout Each Period
| | | | Investment Activities | | Distributions to
Shareholders From | |
| | | Net Asset
Value,
Beginning of
Period | | Net
Investment
Income
(Loss)(a) | | Net
Realized and
Unrealized
Gains
(Losses) on
Investments | | Total from
Investment
Activities | | Net Realized
Gains From
Investments | | Total
Distributions | |
Victory RS Small Cap Growth Equity VIP Series | |
Year Ended
12/31/19 | | $ | 15.29 | | | | (0.10 | ) | | | 5.95 | | | | 5.85 | | | | (4.38 | ) | | | (4.38 | ) | |
Year Ended
12/31/18 | | $ | 20.48 | | | | (0.10 | ) | | | (1.62 | ) | | | (1.72 | ) | | | (3.47 | ) | | | (3.47 | ) | |
Year Ended
12/31/17 | | $ | 14.82 | | | | (0.05 | ) | | | 5.71 | | | | 5.66 | | | | — | | | | — | | |
Year Ended
12/31/16 | | $ | 14.61 | | | | (0.05 | ) | | | 0.25 | | | | 0.20 | | | | — | | | | — | | |
Year Ended
12/31/15 | | $ | 17.47 | | | | (0.10 | ) | | | 0.24 | | | | 0.14 | | | | (3.00 | ) | | | (3.00 | ) | |
(a) Per share net investment income (loss) has been calculated using the average daily shares method.
(b) Total returns do not reflect the effects of charges deducted pursuant to the terms of The Guardian Insurance & Annuity Company, Inc.'s variable contracts. Inclusion of such charges would reduce the total returns for all periods shown.
(c) The Fund received monies related to a nonrecurring refund from the prior Custodian. The corresponding impact to the total return was less than 0.01% for the period shown. (See Note 8)
See notes to financial statements.
16
Victory Variable Insurance Funds | | Financial Highlights — continued | |
For a Share Outstanding Throughout Each Period
| | | | | Ratios to Average Net Assets | | Supplemental Data | |
| | | Capital
Contribution
from Prior
Custodian,
Net (See
Note 8) | | Net Asset
Value,
End of
Period | | Total
Return(b) | | Net
Expenses | | Net
Investment
Income
(Loss) | | Gross
Expenses | | Net Assets,
End of
Period
(000's) | | Portfolio
Turnover | |
Victory RS Small Cap Growth Equity VIP Series | |
Year Ended
12/31/19 | | | — | | | $ | 16.76 | | | | 38.78 | % | | | 0.88 | % | | | (0.54 | )% | | | 1.01 | % | | $ | 105,112 | | | | 90 | % | |
Year Ended
12/31/18 | | | — | | | $ | 15.29 | | | | (8.25 | )% | | | 0.88 | % | | | (0.44 | )% | | | 0.89 | % | | $ | 89,056 | | | | 76 | % | |
Year Ended
12/31/17 | | | — | | | $ | 20.48 | | | | 38.19 | % | | | 0.87 | % | | | (0.30 | )% | | | 0.87 | % | | $ | 111,470 | | | | 71 | % | |
Year Ended
12/31/16 | | | 0.01 | | | $ | 14.82 | | | | 1.44 | %(c) | | | 0.88 | % | | | (0.39 | )% | | | 0.88 | % | | $ | 97,242 | | | | 91 | % | |
Year Ended
12/31/15 | | | — | | | $ | 14.61 | | | | 0.62 | % | | | 0.88 | % | | | (0.54 | )% | | | 0.88 | % | | $ | 106,962 | | | | 88 | % | |
See notes to financial statements.
17
Victory Variable Insurance Funds | | Notes to Financial Statements
December 31, 2019 | |
1. Organization:
Victory Variable Insurance Funds (the "Trust") was organized on February 11, 1998 as a Delaware statutory trust. The Trust is registered under the Investment Company Act of 1940, as amended (the "1940 Act"), as a diversified open-end investment company. The Trust is comprised of nine funds and is authorized to issue an unlimited number of shares, which are units of beneficial interest with a par value of $0.001 per share.
The accompanying financial statements are those of the Victory RS Small Cap Growth Equity VIP Series (the "Fund"). The Fund offers a single class of shares: Class I Shares. Sales of shares of the Fund may only be made to certain separate accounts of The Guardian Insurance & Annuity Company, Inc. ("GIAC") that fund certain variable annuity and variable life insurance contracts issued by GIAC. GIAC is a wholly owned subsidiary of The Guardian Life Insurance Company of America ("Guardian Life").
Under the Trust's organizational documents, its officers and trustees are indemnified against certain liabilities arising out of the performance of their duties to the Fund. In addition, in the normal course of business, the Fund enters into contracts with its vendors and others that provide for general indemnifications. The Fund's maximum exposure under these arrangements is unknown, as this would involve future claims that may be made against the Fund. However, based on experience, the Fund expects that risk of loss to be remote.
2. Significant Accounting Policies:
The following is a summary of significant accounting policies followed by the Trust in the preparation of its financial statements. The policies are in conformity with accounting principles generally accepted in the United States of America ("GAAP"). The preparation of financial statements in accordance with GAAP requires management to make estimates and assumptions that affect the reported amounts of assets and liabilities and disclosure of contingent assets and liabilities at the date of the financial statements and the reported amounts of income and expenses for the period. Actual results could differ from those estimates.
The Fund follows the specialized accounting and reporting requirements under GAAP that are applicable to investment companies.
Investment Valuation:
The Fund records investments at fair value. Fair value is defined as the price that would be received to sell an asset or paid to transfer a liability in an orderly transaction between market participants at the measurement date.
The valuation techniques described below maximize the use of observable inputs and minimize the use of unobservable inputs in determining fair value. The inputs used for valuing the Fund's investments are summarized in the three broad levels listed below:
• Level 1 — quoted prices in active markets for identical securities
• Level 2 — other significant observable inputs (including quoted prices for similar securities or interest rates applicable to those securities, etc.)
• Level 3 — significant unobservable inputs (including the Fund's own assumptions in determining the fair value of investments)
Changes in valuation techniques may result in transfers in or out of an assigned level within the disclosure hierarchy. The inputs or methodologies used for valuation techniques are not necessarily an indication of the risk associated with entering into those investments.
Portfolio securities listed or traded on securities exchanges, including American Depositary Receipts ("ADRs") and Rights, are valued at the closing price on the exchange or system where the security is principally traded, if available, or at the Nasdaq Official Closing Price. If there have been no sales for that day on the exchange or system, then a security is valued at the last available bid quotation on the
18
Victory Variable Insurance Funds | | Notes to Financial Statements — continued
December 31, 2019 | |
exchange or system where the security is principally traded. In each of these situations, valuations are typically categorized as Level 1 in the fair value hierarchy.
Investments for which there are no such quotations, or for which quotations do not appear reliable, are valued at fair value in accordance with procedures established by and under the general supervision and responsibility of the Trust's Board of Trustees (the "Board"). These valuations are typically categorized as Level 2 or Level 3 in the fair value hierarchy, based on the observability of inputs used to determine the fair value.
A summary of the valuations as of December 31, 2019, based upon the three levels defined above, is included in the table below while the breakdown, by category, of investments is disclosed in the Schedule of Portfolio Investments.
| | | LEVEL 1 | | Total | |
Common Stocks | | $ | 102,812,905 | | | $ | 102,812,905 | | |
Collateral for Securities Loaned | | | 14,370,236 | | | | 14,370,236 | | |
Total | | $ | 117,183,141 | | | $ | 117,183,141 | | |
For the year ended December 31, 2019, there were no Level 3 investments for which significant unobservable inputs were used to determine fair value.
Investment Transactions and Related Income:
Changes in holdings of investments are accounted for no later than one business day following the trade date. For financial reporting purposes, however, investment transactions are accounted for on trade date on the last business day of the reporting period. Interest income is determined on the basis of coupon interest accrued using the effective interest method which adjusts, where applicable, the amortization of premiums or accretion of discounts. Dividend income is recorded on the ex-dividend date. Gains or losses realized on sales of securities are determined by comparing the identified cost of the security lot sold with the net sales proceeds.
Withholding taxes on interest, dividends and gains as a result of certain investments in ADRs by the Fund have been provided for in accordance with each investment's applicable country's tax rules and rates.
Securities Lending:
The Trust has entered into a Master Securities Lending Agreement ("MSLA") with Citibank, N.A. ("Citibank" or the "Agent"). Under the terms of the MSLA, the Fund may lend securities to certain broker-dealers and banks in exchange for collateral in the amount of at least 102% of the value of U.S. securities loaned or at least 105% of the value of non-U.S. securities loaned, marked-to-market daily. Any collateral shortfalls associated with increases in the valuation of the securities loaned are adjusted the next business day. The collateral can be received in the form of cash collateral and/or non-cash collateral. Non-cash collateral can include U.S. Government Securities, letters of credit and certificates of deposit. The cash collateral is invested in short-term instruments or cash equivalents as noted on the Fund's Schedule of Portfolio Investments. The Trust does not have effective control of the non-cash collateral and therefore it is not disclosed in the Fund's Schedule of Portfolio Investments. The Fund continues to benefit from interest or dividends on the securities loaned and may also earn a return from the collateral. The Fund pays various fees in connection with the investment of cash collateral. The Fund pays the Agent fees based on the investment income received from securities lending activities. Securities lending income is disclosed in the Fund's Statement of Operations. Although risk is mitigated by the collateral, the Fund could experience a delay in recovering its securities and possible loss of income or value if the borrower fails to return them.
Securities lending transactions are entered into by the Fund under the MSLA, which permits the Fund, under certain circumstances such as an event of default, to offset amounts payable by the Fund to the same counterparty against amounts receivable from the counterparty to create a net payment due to or from the Fund.
19
Victory Variable Insurance Funds | | Notes to Financial Statements — continued
December 31, 2019 | |
The following table is a summary of the Fund's securities lending transactions which are subject to offset under the MSLA as of December 31, 2019. These transactions are accounted for as secured borrowings with an overnight and continuous contractual maturity for cash collateral, and greater than overnight and continuous contractual maturity for non-cash collateral.
Gross
Amount of
Recognized
Assets
(Value of | | Value of
Cash | | Value of Non-cash Collateral
Received by Maturity | | | |
Securities on
Loan) | | Collateral
Received* | | <30 Days | | Between 30 &
90 days | | >90 Days | | Net
Amount | |
| $ | 14,109,950 | | | $ | 14,109,950 | | | $ | — | | | $ | — | | | $ | — | | | $ | — | | |
* Collateral received in excess of the market value of securities on loan is not presented in this table. The total cash collateral received by the Fund is disclosed in the Statement of Assets and Liabilities.
Distributions to Shareholders:
Dividends from net investment income, if any, are declared and paid annually by the Fund. Distributable net realized gains, if any, are declared and distributed at least annually.
The amounts of dividends from net investment income and distributions from net realized gains are determined in accordance with federal income tax regulations, which may differ from GAAP. To the extent these "book/tax" differences are permanent in nature (e.g., net operating loss and distributions reclassification), such amounts are reclassified within the components of net assets based on their federal tax-basis treatment; temporary differences (e.g., wash sales) do not require reclassification. To the extent dividends and distributions exceed net investment income and net realized gains for tax purposes, they are reported as distributions of capital. Net investment losses incurred by the Fund may be reclassified as an offset to capital on the accompanying Statement of Assets and Liabilities.
As of December 31, 2019 on the Statement of Assets and Liabilities, as a result of permanent book-to-tax differences, reclassification adjustments were as follows:
Total
Distributable
Earnings/(Loss) | | Capital | |
| $ | 2 | | | $ | (2 | ) | |
Federal Income Taxes:
It is the policy of the Fund to continue to qualify as a regulated investment company by complying with the provisions available to certain investment companies, as defined in applicable sections of the Internal Revenue Code, and to make distributions of net investment income and net realized gains sufficient to relieve it from all, or substantially all, federal income taxes. Accordingly, no provision for federal income taxes is required in the financial statements. The Fund has a tax year end of December 31.
Management of the Fund has reviewed tax positions taken in tax years that remain subject to examination by all major tax jurisdictions, including federal (i.e., all open tax years and the interim tax period since then). Management believes that there is no tax liability resulting from unrecognized tax benefits related to uncertain tax positions taken.
Allocations:
Expenses directly attributable to the Fund are charged to the Fund, while expenses which are attributable to more than one fund in the Trust, or jointly with an affiliated trust, are allocated among the respective funds in the Trust and/or affiliated trust based upon net assets or another appropriate basis.
20
Victory Variable Insurance Funds | | Notes to Financial Statements — continued
December 31, 2019 | |
Cross-Trade Transactions:
Pursuant to Rule 17a-7 under the 1940 Act, the Fund may engage in cross-trades which are securities transactions with affiliated investment companies and advisory accounts managed by the Adviser and any applicable sub-adviser. Any such purchase or sale transaction must be effected without brokerage commission or other remuneration, except for customary transfer fees. The transaction must be effected at the current market price, which is either the security's last sale price on an exchange or, if there are no transactions in the security that day, at the average of the highest bid and lowest asked price. For the year ended December 31, 2019, the Fund did not engage in any Rule 17a-7 transactions under the 1940 Act.
3. Purchases and Sales of Securities:
Purchases and sales of securities (excluding securities maturing less than one year from acquisition) for the year ended December 31, 2019 were as follows for the Fund:
| Purchases | | Sales | |
| $ | 90,466,760 | | | $ | 108,699,242 | | |
For the year ended December 31, 2019, there were no purchases or sales of U.S. Government Securities.
4. Fees and Transactions with Affiliates and Related Parties:
Investment advisory services are provided to the Fund by Victory Capital Management Inc. ("VCM" or the "Adviser"), a New York corporation registered as an investment adviser with the Securities and Exchange Commission ("SEC"). The Adviser is a wholly owned indirect subsidiary of Victory Capital Holdings, Inc., a publicly traded Delaware corporation, and a wholly owned direct subsidiary of Victory Capital Operating, LLC.
Under the terms of the Investment Advisory Agreement, the Adviser is entitled to receive 0.75% of the average daily net assets of the Fund. The Adviser may use its resources to assist with the Fund's distribution and marketing expenses.
VCM also serves as the Fund's administrator and fund accountant. Under an Administration and Fund Accounting Agreement, VCM is paid for its services an annual fee at a rate of 0.08% of the first $15 billion in average daily net assets of the Trust, Victory Portfolios and Victory Portfolios II (collectively, the "Victory Funds Complex"), 0.05% of the average daily net assets above $15 billion to $30 billion of the Victory Funds Complex and 0.04% of the average daily net assets over $30 billion of the Victory Funds Complex.
Citi Fund Services Ohio, Inc. ("Citi"), an affiliate of Citibank, acts as sub-administrator and sub-fund accountant to the Fund pursuant to a Sub-Administration and Sub-Fund Accounting Services Agreement between VCM and Citi. VCM pays Citi a fee for providing these services. The Trust reimburses VCM and Citi for all of their reasonable out-of-pocket expenses incurred in providing these services.
FIS Investor Services, LLC ("FIS") serves as the Fund's transfer agent. Under the Transfer Agent Agreement, the Trust pays FIS a fee for its services and reimburses FIS for all of their reasonable out-of-pocket expenses incurred in providing these services.
The Chief Compliance Officer ("CCO") is an employee of the Adviser, which pays the compensation of the CCO and his support staff. The Trust has entered into an Agreement to provide compliance services with the Adviser, pursuant to which the Adviser furnishes its compliance personnel, including the services of the CCO, and other resources reasonably necessary to provide the Trust with compliance oversight services related to the design, administration and oversight of a compliance program for the Trust in accordance with Rule 38a-1 under the 1940 Act. The Funds in the Victory Funds Complex, in aggregate, compensate the Adviser for these services.
The Victory Funds Complex pays an annual retainer to each Independent Trustee, plus an additional annual retainer to the Chairman of the Board. The aggregate amount of the fees and expenses of the
21
Victory Variable Insurance Funds | | Notes to Financial Statements — continued
December 31, 2019 | |
Independent Trustees are allocated amongst all the funds in the Victory Funds Complex and are presented in the Statement of Operations.
Shearman & Sterling LLP provides legal services to the Trust.
Victory Capital Advisers, Inc. (the "Distributor"), an affiliate of the Adviser, serves as distributor for the continuous offering of the shares of the Fund pursuant to a Distribution Agreement between the Distributor and the Trust.
The Adviser has entered into an expense limitation agreement with the Fund until at least April 30, 2020. Under the terms of the agreement, the Adviser has agreed to waive fees or reimburse certain expenses to the extent that ordinary operating expenses incurred by the Fund in any fiscal year exceed the expense limit for the Fund. Such excess amounts will be the liability of the Adviser. Interest, taxes, brokerage commissions, other expenditures which are capitalized in accordance with GAAP, and other extraordinary expenses not incurred in the ordinary course of a Fund's business are excluded from the expense limits. As of December 31, 2019, the expense limit (excluding voluntary waivers) is 0.88%.
The Fund has agreed to repay fees and expenses that were waived or reimbursed by the Adviser for a period up to three fiscal years after such waiver or reimbursement was made to the extent such payments or repayments would not cause the expenses to exceed the original expense limitation in place at time of the waiver or reimbursement or any expense limitation agreement in place at the time of repayment. As of December 31, 2019, the following amounts are available to be repaid to the Adviser. Amounts repaid to the Adviser during the year ended, if any, are reflected on the Statement of Operations as "Recoupment of prior expenses waived/reimbursed by Adviser".
Expires
December 31,
2021 | | Expires
December 31,
2022 | | Total | |
| $ | 5,628 | | | $ | 133,480 | | | $ | 139,108 | | |
The Adviser may voluntarily waive or reimburse additional fees to assist the Fund in maintaining a competitive expense ratio. Voluntary waivers and reimbursements applicable to the Fund are not available to be recouped at a future time. There were no voluntary waivers or reimbursements for the year ended December 31, 2019.
Certain officers and/or interested trustees of the Fund are also officers and/or employees of the Adviser, Administrator, Fund Accountant, Sub-Administrator, Sub-Fund Accountant and Legal Counsel.
5. Risks:
The Fund may be subject to other risks in addition to these identified risks.
An investment in the Fund's shares represents an indirect investment in the securities owned by the Fund, some of which will be traded on a national securities exchange or in the over-the-counter markets. The value of the securities in which the Fund invests, like other market investments, may move up or down, sometimes rapidly and unpredictably. The value of the securities in which the Fund invests may affect the value of the Fund's shares. An investment in the Fund's shares at any point in time may be worth less than the original investment, even after taking into account the reinvestment of the Fund's distributions.
The Fund will be subject to credit risk with respect to the amount it expects to receive from counterparties for financial instruments entered into by the Fund. The Fund may be negatively impacted if a counterparty becomes bankrupt or otherwise fails to perform its obligations due to financial difficulties. The Fund may experience significant delays in obtaining any recovery in bankruptcy or other reorganization proceeding and the Fund may obtain only limited recovery or may obtain no recovery in such circumstances. The Fund typically enters into transactions with counterparties whose credit ratings are investment grade, as determined by a nationally recognized statistical rating organization or, if unrated, judged by the Adviser to be of comparable quality.
22
Victory Variable Insurance Funds | | Notes to Financial Statements — continued
December 31, 2019 | |
6. Borrowing and Interfund Lending:
Line of Credit:
For the year ended December 31, 2019, the Victory Funds Complex participated in a short-term, demand note "Line of Credit" with Citibank. Under the agreement with Citibank, for the period January 1, 2019 to June 30, 2019, the Victory Funds Complex could borrow up to $250 million, of which $100 million was committed and $150 million was uncommitted. Effective July 1, 2019, the agreement was amended to include the USAA Mutual Funds Complex (another series of mutual funds managed by the Adviser) and has a new termination date of June 29, 2020. Under this amended agreement, the Victory Funds Complex and USAA Mutual Funds Complex, combined, may borrow up to $600 million, of which $300 million is committed and $300 million is uncommitted. $40 million of the Line of Credit is reserved for use by the Victory Floating Rate Fund (herein, the "Fund"), another series of the Victory Funds Complex, with that Fund paying the related commitment fees for that amount. The purpose of the agreement is to meet temporary or emergency cash needs, including redemption requests that might otherwise require the untimely disposition of securities. With the agreement in effect for the period January 1, 2019 to June 30, 2019, Citibank received an annual commitment fee of 0.15% on $100 million for providing the Line of Credit. For the period July 1, 2019 to December 31, 2019, Citibank received an annual commitment fee of 0.15% on $300 million for providing the Line of Credit. For the year ended December 31, 2019, Citibank earned approximately $300 thousand in commitment fees from the combined Victory Funds Complex and USAA Mutual Funds Complex. Each fund in the Victory Funds Complex and the USAA Mutual Funds Complex pays a pro-rata portion of the commitment fees plus any interest (one month LIBOR plus one percent) on amounts borrowed. Interest charged to the Fund during the period, if applicable, is presented on the Statement of Operations under Line of credit fees.
The Fund did not utilize the Line of Credit during the year ended December 31, 2019.
Interfund Lending:
The Trust and Adviser rely on an exemptive order granted by the SEC in March 2017 (the "Order"), permitting the establishment and operation of an Interfund Lending Facility (the "Facility"). The Facility allows the Fund to directly lend and borrow money to or from any other Victory Fund relying upon the Order at rates beneficial to both the borrowing and lending funds. Advances under the Facility are allowed for temporary or emergency purposes, including the meeting of redemption requests that otherwise might require the untimely disposition of securities, and are subject to each fund's borrowing restrictions. The interfund loan rate is determined, as specified in the Order, by averaging the current repurchase agreement rate and the current bank loan rate. As a Borrower, interest charged to the Fund during the period, if applicable, is presented on the Statement of Operations under Interfund lending fees. As a Lender, interest earned by the Fund during the period, if applicable, is presented on the Statement of Operations under Income on interfund lending.
The Fund did not utilize the Facility during the year ended December 31, 2019.
7. Federal Income Tax Information:
The tax character of distributions paid during the most recent tax years ended, as noted below, were as follows (total distributions paid may differ from the Statements of Changes in Net Assets because, for tax purposes, dividends are recognized when actually paid).
| | | Year Ended December 31, 2019 | |
| | | Distributions paid from | |
| | | Ordinary
Income | | Net
Long-Term
Capital Gains | | Total
Distributions
Paid | |
| | | | | $ | 77,122 | | | $ | 21,807,498 | | | $ | 21,884,620 | | |
23
Victory Variable Insurance Funds | | Notes to Financial Statements — continued
December 31, 2019 | |
| | | Year Ended December 31, 2018 | |
| | | Distributions paid from | |
| | | Ordinary
Income | | Net
Long-Term
Capital Gains | | Total
Distributions
Paid | |
| | | | | $ | 411,847 | | | $ | 16,074,066 | | | $ | 16,485,913 | | |
As of the tax year ended December 31, 2019, the components of distributable earnings/accumulated deficit on a tax basis were as follows:
Undistributed
Ordinary
Income | | Undistributed
Long-Term
Capital Gains | | Accumulated
Earnings | | Accumulated
Capital and
Other
Losses | | Unrealized
Appreciation
(Depreciation) | | Total
Accumulated
Earnings
(Deficit) | |
| $ | 990,940 | | | $ | 18,467,020 | | | $ | 19,457,960 | | | $ | — | | | $ | 15,328,312 | | | $ | 34,786,272 | | |
During the tax year ended December 31, 2019, the Fund did not utilize capital loss carryforwards.
As of December 31, 2019, the cost basis for federal income tax purposes, gross unrealized appreciation, gross unrealized depreciation and net unrealized appreciation (depreciation) for investments and derivatives were as follows:
Cost of
Investments
for Federal
Tax Purposes | | Gross
Unrealized
Appreciation | | Gross
Unrealized
Depreciation | | Net
Unrealized
Appreciation
(Depreciation) | |
| $ | 101,854,829 | | | $ | 19,368,943 | | | $ | (4,040,631 | ) | | $ | 15,328,312 | | |
8. Capital Contribution from Prior Custodian:
During 2016, the Fund received notification from the Fund's prior custodian, State Street Bank and Trust ("State Street"), concerning issues related to billing on certain categories of expenses during the approximately 16-year period from 1998 through October 31, 2014. The over-billing primarily related to categories of expenses that involved an allocation of general costs among multiple clients.
State Street paid the refunded amounts during January 2017. Based on billing information received during 2016 from State Street and an analysis of any expense limitation agreements that were in place during the period of the activities in question, including the application of any recoupment provisions in such agreements, the Adviser received a portion of the refund.
The portion of the refund retained by the Fund was accounted for as a capital contribution and is reflected on the Financial Highlights as "Capital Contribution from Prior Custodian, Net".
9. Fund Ownership:
Ownership of more than 25% of the voting securities of a fund creates presumptions of control of the Fund, under section 2(a)(9) of the 1940 Act. As of December 31, 2019, the shareholder listed below held more than 25% of the shares outstanding of the Fund and may be deemed to control the Fund.
| Shareholder | | Percent | |
| GIAC | | | 98.4 | % | |
10. Subsequent Events:
The Fund has evaluated the need for additional disclosures or adjustments resulting from subsequent events through the date these financial statements were issued. Based on this evaluation, there were no subsequent events to report that would have a material impact on the Fund's financial statements.
24
REPORT OF INDEPENDENT REGISTERED PUBLIC ACCOUNTING FIRM
To the Shareholders and Board of Trustees of Victory Variable Insurance Funds
Opinion on the Financial Statements
We have audited the accompanying statement of assets and liabilities, including the schedule of portfolio investments, of Victory RS Small Cap Growth Equity VIP Series (the "Fund"), a series of Victory Variable Insurance Funds, as of December 31, 2019, the related statements of operations and changes in net assets, including the related notes, and the financial highlights for the year then ended (collectively referred to as the "financial statements"). In our opinion, the financial statements present fairly, in all material respects, the financial position of the Fund as of December 31, 2019, the results of its operations, the changes in its net assets, and the financial highlights for the year then ended, in conformity with accounting principles generally accepted in the United States of America.
The Fund's financial statements and financial highlights for the three years ended December 31, 2018, were audited by other auditors whose report dated February 15, 2019 and the Fund's financial highlights for the year ended December 31, 2015, were audited by other auditors whose report dated February 22, 2016, expressed unqualified opinions on those financial statements and financial highlights.
Basis for Opinion
These financial statements are the responsibility of the Fund's management. Our responsibility is to express an opinion on the Fund's financial statements based on our audit. We are a public accounting firm registered with the Public Company Accounting Oversight Board (United States) ("PCAOB") and are required to be independent with respect to the Fund in accordance with the U.S. federal securities laws and the applicable rules and regulations of the Securities and Exchange Commission and the PCAOB.
We conducted our audit in accordance with the standards of the PCAOB. Those standards require that we plan and perform the audit to obtain reasonable assurance about whether the financial statements are free of material misstatement whether due to error or fraud.
Our audit included performing procedures to assess the risks of material misstatement of the financial statements, whether due to error or fraud, and performing procedures that respond to those risks. Such procedures included examining, on a test basis, evidence regarding the amounts and disclosures in the financial statements. Our procedures included confirmation of securities owned as of December 31, 2019, by correspondence with the custodian and brokers or by other appropriate auditing procedures where replies from brokers were not received. Our audit also included evaluating the accounting principles used and significant estimates made by management, as well as evaluating the overall presentation of the financial statements. We believe that our audit provides a reasonable basis for our opinion.
We have served as the auditor of one or more of the investment companies advised by Victory Capital Management, Inc. since 2015.

COHEN & COMPANY, LTD.
Cleveland, Ohio
February 18, 2020
25
Victory Variable Insurance Funds | | Supplemental Information
December 31, 2019 | |
(Unaudited)
Trustee and Officer Information
Board of Trustees:
Overall responsibility for management of the Trust rests with the Board. The Trust is managed by the Board in accordance with the laws of the State of Delaware. There are currently ten Trustees, nine of whom are not "interested persons" of the Trust within the meaning of that term under the 1940 Act ("Independent Trustees") and one of whom is an "interested person" of the Trust within the meaning of that term under the 1940 Act ("Interested Trustee"). The Trustees, in turn, elect the officers of the Trust to actively supervise its day-to-day operations.
The following tables list the Trustees, their ages, position with the Trust, commencement of service, principal occupations during the past five years and any directorships of other investment companies or companies whose securities are registered under the Securities Exchange Act of 1934, as amended, or who file reports under that Act. Each Trustee oversees nine portfolios in the Trust, 42 portfolios in Victory Portfolios and 26 portfolios in Victory Portfolios II, each a registered investment company that, together with the Trust, comprise the Victory Funds Complex. Each Trustee's address is c/o Victory Variable Insurance Funds, 4900 Tiedeman Road, 4th Floor, Brooklyn, Ohio 44144. Each Trustee has an indefinite term.
Name and Age | | Position
Held with
the Trust | | Date
Commenced
Service | | Principal Occupation
During Past 5 Years | | Other
Directorships
Held During
Past 5 Years | |
Independent Trustees. | |
David Brooks Adcock, 68 | | Trustee | | February 2005 | | Consultant (since 2006). | | Chair and Trustee, Turner Funds (December 2016-December 2017). | |
Nigel D.T. Andrews, 72 | | Vice Chair and Trustee | | August 2002 | | Retired. | | Director, TCG BDC II, Inc. (since 2017); Director, TCG BDC I, Inc. (formerly Carlyle GMS Finance, Inc.) (since 2012); Director, Old Mutual US Asset Management (2002-2014). | |
E. Lee Beard, 68* | | Trustee | | February 2005 | | Retired (since 2015); Consultant, The Henlee Group, LLC (consulting) (2005-2015). | | None. | |
Dennis M. Bushe, 76 | | Trustee | | July 2016 | | Retired. | | Trustee, RS Investment Trust and RS Variable Products Trust (November 2011-July 2016). | |
26
Victory Variable Insurance Funds | | Supplemental Information — continued
December 31, 2019 | |
(Unaudited)
Name and Age | | Position
Held with
the Trust | | Date
Commenced
Service | | Principal Occupation
During Past 5 Years | | Other
Directorships
Held During
Past 5 Years | |
Sally M. Dungan, 65 | | Trustee | | February 2011 | | Chief Investment Officer, Tufts University (since 2002). | | None. | |
John L. Kelly, 66 | | Trustee | | February 2015 | | Partner, McCarvill Capital Partners (September 2016-September 2017); Advisor, Endgate Commodities LLC (January 2016-April 2016); Managing Partner, Endgate Commodities LLC (August 2014-January 2016); Chief Operating Officer, Liquidnet Holdings, Inc. (December 2011-July 2014). | | Director, Caledonia Mining Corporation (since May 2012). | |
David L. Meyer, 62* | | Trustee | | December 2008 | | Retired. | | None. | |
Gloria S. Nelund, 58 | | Trustee | | July 2016 | | Chair, CEO and Co-Founder of TriLinc Global, LLC, an investment firm. | | TriLinc Global Impact Fund, LLC (since 2012); Trustee, RS Investment Trust and RS Variable Products Trust (November 2007-July 2016). | |
Leigh A. Wilson, 75 | | Chair and Trustee | | February 1998 | | Private Investor. | | Chair (since 2013), Caledonia Mining Corporation. | |
Interested Trustee. | |
David C. Brown, 47** | | Trustee | | May 2008 | | Chairman and Chief Executive Officer (since 2013), Co-Chief Executive Officer (2011-2013), the Adviser; Chairman and Chief Executive Officer, Victory Capital Holdings, Inc. (since 2013). | | USAA Mutual Funds Trust. | |
* The Board has designated Mr. Meyer and Ms. Beard as its Audit Committee Financial Experts.
** Mr. Brown is an "Interested Person" by reason of his relationship with the Adviser.
The Statement of Additional Information includes additional information about the Trustees of the Trust and is available, without charge, by calling 800-539-3863.
27
Victory Variable Insurance Funds | | Supplemental Information — continued
December 31, 2019 | |
(Unaudited)
Officers:
The officers of the Trust, their ages, commencement of service and their principal occupations during the past five years, are detailed in the following table. Each officer serves until the earlier of his or her resignation, removal, retirement, death, or the election of a successor. The mailing address of each officer of the Trust is 4900 Tiedeman Road, 4th Floor, Brooklyn, Ohio 44144. The officers of the Trust receive no compensation directly from the Trust for performing the duties of their offices.
Name and Age | | Position with
the Trust | | Date
Commenced
Service | | Principal Occupation During Past 5 Years | |
Christopher K. Dyer, 58 | | President | | February 2006* | | Director of Fund Administration, the Adviser. | |
Scott A. Stahorsky, 50 | | Vice President | | December 2014 | | Manager, Fund Administration, the Adviser (since 2015); Senior Analyst, Fund Administration, the Adviser (prior to 2015). | |
Erin G. Wagner, 46 | | Secretary | | December 2014 | | Associate General Counsel, the Adviser (since 2013). | |
Allan Shaer, 54 | | Treasurer | | May 2017 | | Senior Vice President, Financial Administration, Citi Fund Services Ohio, Inc. (since 2016); Vice President, Mutual Fund Administration, JP Morgan Chase (2011-2016). | |
Christopher A. Ponte, 35 | | Assistant Treasurer | | December 2017 | | Manager, Fund Administration, the Adviser (since 2017); Senior Analyst, Fund Administration, the Adviser (prior to 2017); Chief Financial Officer, Victory Capital Advisers, Inc. (since 2018). | |
Colin Kinney, 46 | | Chief Compliance Officer | | July 2017 | | Chief Compliance Officer (since 2013) and Chief Risk Officer (2009-2017), the Adviser. | |
Chuck Booth, 59 | | Anti-Money Laundering Compliance Officer and Identity Theft Officer | | May 2015 | | Director, Regulatory Administration and CCO Support Services, Citi Fund Services Ohio, Inc. | |
Jay G. Baris, 66 | | Assistant Secretary | | February 1998 | | Partner, Shearman & Sterling LLP (since 2018); Partner, Morrison & Foerster LLP (2011-January 2018). | |
* On December 3, 2014, Mr. Dyer resigned as Secretary of the Trust and accepted the position of President.
28
Victory Variable Insurance Funds | | Supplemental Information — continued
December 31, 2019 | |
(Unaudited)
Proxy Voting and Portfolio Holdings Information
Proxy Voting:
Information regarding the policies and procedures the Fund uses to determine how to vote proxies relating to portfolio securities is available without charge, upon request, by calling 800-539-3863. The information is also included in the Fund's Statement of Additional Information, which is available on the SEC's website at www.sec.gov.
Information relating to how the Fund voted proxies relating to portfolio securities held during the most recent twelve months ended June 30 is available on the SEC's website at www.sec.gov.
Availability of Schedules of Portfolio Investments:
The Trust files a complete list of Schedules of Portfolio Investments with the SEC for the first and third quarters of each fiscal year on Form N-PORT. Prior to the implementation of Form N-PORT, the Trust filed a complete list of Schedules of Portfolio Investments with the SEC for the first and third quarters of each fiscal year on Form N-Q. Forms N-PORT and Forms N-Q are available on the SEC's website at www.sec.gov.
Expense Examples
As a shareholder of the Fund, you may incur two types of costs: (1) transaction costs and (2) ongoing costs, including management fees, distribution and service (12b-1) fees, and other Fund expenses. These examples are intended to help you understand your ongoing costs (in dollars) of investing in the Fund and to compare these costs with the ongoing costs of investing in other mutual funds.
These examples are based on an investment of $1,000 invested at the beginning of the period and held for the entire period from July 1, 2019 through December 31, 2019.
The Actual Expense figures in the table below provide information about actual account values and actual expenses. You may use the information below, together with the amount you invested, to estimate the expenses that you paid over the period. Simply divide your account value by $1,000 (for example, an $8,600 account value divided by $1,000 = 8.6), then multiply the result by the number in the table under the heading entitled "Actual Expenses Paid During Period" to estimate the expenses you paid on your account during this period.
The Hypothetical Expense figures in the table below provide information about hypothetical account values and hypothetical expenses based on the Fund's actual expense ratio and an assumed rate of return of 5% per year before expenses, which is not the Fund's actual return. The hypothetical account values and expenses may not be used to estimate the actual ending account balance or expenses you paid for the period. You may use this information to compare this 5% hypothetical example with the 5% hypothetical examples that appear in shareholder reports of other funds.
Please note the expenses shown in the table are meant to highlight your ongoing costs only and do not reflect any transactional costs. Therefore, the table is useful in comparing ongoing costs only, and will not help you determine the relative total costs of owning different funds. In addition, if these transactional costs were included, your costs would have been higher.
Beginning
Account Value
7/1/19 | | Actual
Ending
Account Value
12/31/19 | | Hypothetical
Ending
Account Value
12/31/19 | | Actual
Expenses
Paid During
Period
7/1/19-12/31/19* | | Hypothetical
Expenses
Paid During
Period
7/1/19-12/31/19* | | Annualized
Expense Ratio
During Period
7/1/19-12/31/19 | |
$ | 1,000.00 | | | $ | 1,052.60 | | | $ | 1,020.77 | | | $ | 4.55 | | | $ | 4.48 | | | | 0.88 | % | |
* Expenses are equal to the average account value multiplied by the Fund's annualized expense ratio multiplied by 184/365 (the number of days in the most recent fiscal half-year divided by the number of days in the fiscal year).
29
Victory Variable Insurance Funds | | Supplemental Information — continued
December 31, 2019 | |
(Unaudited)
Additional Federal Income Tax Information
For the year ended December 31, 2019, the Fund paid qualified dividend income for the purposes of reduced individual federal income tax rates of 100%.
Dividends qualified for corporate dividends received deductions of 100%.
For the year ended December 31, 2019, the Fund designated short-term and long-term capital gain distributions in the amount of $77,122 and $21,807,498, respectively.
30
Victory Variable Insurance Funds | | Supplemental Information — continued
December 31, 2019 | |
(Unaudited)
Considerations of the Board in Continuing the Investment Advisory Agreement (the "Agreement")
The Board approved the Agreement on behalf of the Fund at an in-person meeting, which was called for that purpose, on December 4, 2019. The Board also considered information relating to the Fund and the Agreement provided throughout the year and, more specifically, at a meeting on October 22, 2019. The Board noted that prior to the Fund's reorganization on July 29, 2016, the Fund was managed by RS Investment Management Co. LLC, which was acquired by the Adviser on July 29, 2016. In considering whether to approve the Agreement, the Board requested, and the Adviser provided, information that the Board believed to be reasonably necessary to reach its conclusions.
The Board, including the Independent Trustees, evaluated this information along with other information obtained throughout the year and was advised by legal counsel to the Fund, which also serves as independent legal counsel to the Independent Trustees. In addition, in 2017 the Independent Trustees, through their counsel, retained an independent consultant to assist with a review of the overall process for conducting the annual review of these advisory arrangements.
The Board considered the Fund's advisory fee, expense ratio and investment performance as significant factors in determining whether the Agreement should be continued. In considering whether the compensation paid to the Adviser was fair and reasonable, the Board also evaluated, among other things, the following factors:
• The requirements of the Fund for the services provided by the Adviser;
• The nature, quality and extent of the services provided and expected to be provided;
• The performance of the Fund as compared to comparable funds;
• The fees payable for the services and whether the fee arrangements provided for economies of scale that would benefit Fund shareholders as the Fund grows;
• Whether the fee would be sufficient to enable the Adviser to attract and retain experienced personnel and continue to provide quality services to the Fund;
• The fees paid by other clients of the Adviser whose accounts are managed in a similar investment style and any differences in the services provided to the other clients compared to those provided to the Fund;
• The total expenses of the Fund, taking into consideration any distribution or shareholder servicing fees;
• Management's commitment to operating the Fund at competitive expense levels;
• The profitability of the Adviser (as reflected by comparing fees earned against an estimate of the Adviser's costs) with respect to the Adviser's relationship with the Fund;
• Research and other service benefits received by the Adviser obtained through payment of client commissions for securities transactions;
• Other benefits received by the Adviser, and its affiliates, including revenues paid to the Adviser, or its affiliates, by the Fund for administration and fund accounting services, and distribution;
• The capabilities and financial condition of the Adviser;
• Current economic and industry trends; and
• The historical relationship between the Fund and the Adviser.
The Board reviewed the Fund's current management fee, comprised of the advisory fee plus the administrative services fee paid to the Adviser, in the context of the Adviser's profitability with respect to the Fund. In addition, the Board compared the Fund's total operating expense ratio on a net and gross basis, taking into consideration any distribution or shareholder servicing fees and management fees with a universe of comparable mutual funds compiled by an independent consultant and a peer group of funds with similar investment strategies selected by that independent consultant from the universe. The Board reviewed the factors and methodology used by the independent consultant in the selection of the Fund's peer group, including the independent consultant's selection of a broad universe of funds, the more specific universe of comparable funds, and peer groups of funds with comparable investment strategies and asset levels, among other factors. The Board also reviewed any changes to the independent consultant's methodology as compared to the prior year, including those resulting from the Adviser's input, if any. The Board also reviewed fees and other information related to the Adviser's management of similarly managed institutional or private accounts, and the differences in the
31
Victory Variable Insurance Funds | | Supplemental Information — continued
December 31, 2019 | |
(Unaudited)
services provided to the other accounts, to the extent applicable. The Board noted that the advisory fee arrangements for the Fund do not include breakpoints, which are generally viewed as a method by which the investment adviser shares any economies of scale with a fund as a fund grows. The Board also considered the Adviser's commitment to limit expenses as discussed in more detail below, and would consider breakpoints at a future time if the Fund's assets were to grow significantly.
The Board reviewed the Fund's performance over one-, three-, five- and ten-year periods against the performance of the Fund's selected peer group and benchmark index. The Board recognized that the performance of the Fund and the peer group funds are net of expenses, while the performance of the benchmark index reflects gross returns. The Board considered the additional resources that the Adviser has committed to enhance portfolio analysis, compliance and trading systems. The Board noted that, following the Fund's reorganization, the Fund is managed by substantially the same investment management team that managed the comparable predecessor fund.
The Board reviewed various other specific factors with respect to the Fund, as described below. In their deliberations, the Trustees did not rank the importance of any particular information or factor considered and each Trustee may have attributed different weights to various factors.
The Board concluded that the Fund's gross annual management fee was reasonable as compared to the median gross management fee charged to the funds in the Fund's peer group. The Board noted that the Fund's net annual expense ratio, taking into account any shareholder servicing or distribution fees, was reasonable as compared to the median expense ratio for the peer group. The Board considered the Adviser's contractual agreement to waive its fees and reimburse expenses for a specified period of time, as described in the Fund's prospectus.
The Board then compared the Fund's performance for the one-, three-, five- and ten-year periods ended June 30, 2019, to that of the median performance of the peer group and benchmark index for the same periods and considered the fact that the Fund outperformed the benchmark index for all of the periods reviewed, and outperformed the peer group median for all of the periods reviewed, with the exception of the one-year period.
Having considered, among other things: (1) that the Fund's management fee was within the ranges of advisory fees charged to comparable mutual funds; (2) that the Fund's total expense ratio was reasonable; (3) the Adviser's willingness to limit the expenses for a period of time would provide stability to the Fund's expenses during that period; and (4) the performance of the Fund, the Board concluded that the Agreement continued to be in the best interests of the Fund's shareholders.
Conclusion
Based on its review of the information requested and provided, and following extended discussions, the Board determined that the Agreement, on behalf of the Fund, was consistent with the best interests of the Fund and its shareholders, and the Board unanimously approved the Agreement, on behalf of the Fund, for an additional annual period on the basis of the foregoing review and discussions and the following considerations, among others:
• The fairness and reasonableness of the investment advisory fee payable to the Adviser under the Agreement in light of the investment advisory services provided, the costs of these services, the profitability of the Adviser's relationship with the Fund and the comparability of the fee paid to the fees paid by other investment companies;
• The nature, quality and extent of the investment advisory services provided by the Adviser;
• The Adviser's entrepreneurial commitment to the management of the Fund and the creation of a broad-based family of funds, which could entail a substantial commitment of the Adviser's resources to the successful operation of the Fund;
• The Adviser's representations regarding its staffing and capabilities to manage the Fund, including the retention of personnel with relevant portfolio management experience;
• The Adviser's efforts to enhance investment results by, among other things, developing quality portfolio management teams; and
• The overall high quality of the personnel, operations, financial condition, investment management capabilities, methodologies and performance of the Adviser.
32
Privacy Policy
Protecting the Privacy of Information
The Trust respects your right to privacy. We also know that you expect us to conduct and process your business in an accurate and efficient manner. To do so, we must collect and maintain certain personal information about you. This is the information we collect from you on applications or other forms, and from the transactions you make with us or third parties. It may include your name, address, social security number, account transactions and balances, and information about investment goals and risk tolerance.
We do not disclose any information about you or about former customers to anyone except as permitted or required by law. Specifically, we may disclose the information we collect to companies that perform services on our behalf, such as the transfer agent that processes shareholder accounts and printers and mailers that assist us in the distribution of investor materials. We may also disclose this information to companies that perform marketing services on our behalf. This allows us to continue to offer you Victory investment products and services that meet your investing needs, and to effect transactions that you request or authorize. These companies will use this information only in connection with the services for which we hired them. They are not permitted to use or share this information for any other purpose.
To protect your personal information internally, we permit access only by authorized employees and maintain physical, electronic and procedural safeguards to guard your personal information.*
* You may have received communications regarding information about privacy policies from other financial institutions which gave you the opportunity to "opt-out" of certain information sharing with companies which are not affiliated with that financial institution. The Trust does not share information with other companies for purposes of marketing solicitations for products other than the Trust. Therefore, the Trust does not provide opt-out options to their shareholders.
Victory Funds
P.O. Box 182593
Columbus, Ohio 43218-2593

Visit our website at: | | Call Victory at: | |
www.vcm.com | | 800-539-FUND (800-539-3863) | |
VVIF-RS-SCGEVIP-AR (12/19)

December 31, 2019
Annual Report
Victory Variable Insurance Funds
Victory S&P 500 Index VIP Series
Beginning January 1, 2021, as permitted by regulations adopted by the Securities and Exchange Commission, paper copies of the Fund's shareholder reports may no longer be sent by mail from the insurance company that issued your variable annuity and variable life insurance contract, unless you specifically request paper copies of the reports from your insurance company. Instead, the reports will be made available on www.victoryfunds.com. The insurance company that offers your contract may also make these reports available on a website, and such insurance company will notify you by mail each time a report is posted and provide you with a website link to access the report.
If you already elected to receive shareholder reports electronically, you will not be affected by this change and you need not take any action. You may elect to receive shareholder reports and other communications from the insurance company electronically by following the instructions provided by the insurance company.
If offered by your insurance company, you may elect to receive all future reports in paper and free of charge from the insurance company. You can inform your insurance company that you wish to continue receiving paper copies of your reports. Your election to receive reports in paper will apply to all funds available under your contract.
www.vcm.com
News, Information And Education 24 Hours A Day, 7 Days A Week
The Victory Funds site gives fund shareholders, prospective shareholders, and investment professionals a convenient way to access fund information, get guidance, and track fund performance anywhere they can access the Internet. The site includes:
• Detailed performance records
• Daily share prices
• The latest fund news
• Investment resources to help you become a better investor
• A section dedicated to investment professionals
Whether you're a potential investor searching for the fund that matches your investment philosophy, a seasoned investor interested in planning tools, or an investment professional, www.vcm.com has what you seek. Visit us anytime. We're always open.
Victory Variable Insurance Funds
Table of Contents
Shareholder Letter (Unaudited) | | | 3 | | |
Fund Review and Commentary (Unaudited) | | | 5 | | |
Financial Statements | |
Schedule of Portfolio Investments | | | 7 | | |
Statement of Assets and Liabilities | | | 19 | | |
Statement of Operations | | | 20 | | |
Statements of Changes in Net Assets | | | 21 | | |
Financial Highlights | | | 22 | | |
Notes to Financial Statements | | | 24 | | |
Report of Independent
Registered Public Accounting Firm | | | 33 | | |
Supplemental Information (Unaudited) | |
Trustee and Officer Information | | | 34 | | |
Proxy Voting and Portfolio Holdings Information | | | 37 | | |
Expense Examples | | | 37 | | |
Additional Federal Income Tax Information | | | 38 | | |
Advisory Contract Renewal | | | 39 | | |
Privacy Policy (inside back cover) | | | |
The Fund is distributed by Victory Capital Advisers, Inc. Victory Capital Management Inc. is the investment adviser to the Fund and receives fees from the Fund for performing services for the Fund.
This report is not authorized for distribution to prospective investors unless preceded or accompanied by a current prospectus of the Fund.
For additional information about any Victory Fund, including fees, expenses, and risks, view our prospectus online at www.vcm.com or call 800-539-3863. Read it carefully before you invest or send money.
The information in this annual report is based on data obtained from recognized services and sources and is believed to be reliable. Any opinions, projections, or recommendations in this report are subject to change without notice and are not intended as individual investment advice. Past investment performance of the Fund, markets or securities mentioned herein should not be considered to be indicative of future results.
• NOT FDIC INSURED • NO BANK GUARANTEE
• MAY LOSE VALUE

Call Victory at:
800-539-FUND (800-539-3863)
Visit our website at:
www.vcm.com
1
This page is intentionally left blank.
2
Victory Funds Letter to Shareholders
(Unaudited)
Dear Shareholder,
As we turn the page into a new decade, it's hard not to reflect on the fact that we have been enjoying the longest-ever bull market in U.S. equities. The run has been impressive, and despite periods of tumult and plenty of negative news, the bull market endured throughout 2019.
For the annual reporting period ended December 31, 2019, the S&P 500® Index posted impressive gains of 31.49%. This represents the greatest one-year gain since 2013 and also illustrates a swift bounce-back after a precipitous drop late in 2018. The move higher supports the notion that underlying fundamentals of U.S. companies drive performance, rather than the political rancor and headline fears that often capture the attention of investors.
Perhaps we shouldn't be surprised at the impressive performance of equities. The U.S. economy — the world's largest — remains on solid footing and has been a key driver of both domestic and international stocks. Robust job creation, near-record low unemployment, and steady consumer spending continue and offer reasons for further optimism. Meanwhile, inflation remains muted, and the Federal Reserve (the Fed) and other major global central banks have taken an accommodative stance. In fact, the Fed has cut interest rates by a total of 0.75% over three meetings last July, September and October.
The risk-on attitudes of investors, coupled with the accommodative monetary policy, had an expected impact on U.S. Treasury yields. The 10-year Treasury yield declined significantly over the course of 2019, falling from 2.66% to 1.92% at year-end. More interesting, however, was the fact that, the yield on 10-year Treasurys fell below shorter-term yields for the first time since before the 2007-2008 Global Financial Crisis. This inverted yield curve spooked investors for a spell, only to revert back to a traditional upward sloping yield curve by the end of the year.
The robust domestic economy, low interest rates, and ample liquidity from central banks provided a potent tonic for the stock market in 2019. In fact, at year-end 2019, the S&P 500® Index was approaching its highest valuation level since 1999. This reminds all of us to retain some historical context on the bull market. Many of us remember the Global Financial Crisis and, before that, the collapse of the dot-com bubble. Although those are now but a distant memory (and we are not forecasting such tumult), we should not forget that stocks don't always go up and cycles don't last forever. In other words, valuations still matter.
The key point is not to discount the risks. In addition to lofty valuations, investors need to keep apprised of trade disputes, geopolitical hotspots, a contentious U.S. election, and a host of other potential headwinds. Yet it is these very risks — these cross-currents — that may create pricing dislocations. This is an environment in which we believe our Victory Capital independent investment franchises can thrive.
On the following pages, you will find information relating to your Victory Funds investment. If you have any questions, we encourage you to contact your financial
3
advisor. Or, if you invest with us directly, you may call (800) 539-3863, or visit our website at www.vcm.com.
My colleagues and I sincerely appreciate the confidence you have placed in the Victory Funds, and we value the opportunity to help meet your investment goals.

Christopher K. Dyer, CFA
President,
Victory Funds
4
Victory Variable Insurance Funds (Unaudited)
Victory S&P 500 Index VIP Series
Portfolio Holdings
As a Percentage of Total Investments

Commentary
The Victory S&P 500 Index VIP Series (the "Fund") seeks to track the investment performance of the S&P 500® Index (the "Index"). The Fund returned 31.04% for the 12-months ended December 31, 2019, slightly underperforming the Index, which returned 31.49%. The difference in performance between the Fund and the Index was primarily due to fees and expenses to manage the Fund. The Index is not an investable product; therefore, fees and expenses do not apply. All sectors within the Index finished the year in positive territory with Information Technology and Communication Services leading the way.
Overview
On the heels of a volatile fourth quarter of 2018 in which the Index was down -13.52%, it rebounded with a strong 2019, returning 31.49%, despite the ongoing U.S.-China trade war and recession fears sparked by the inversion of the yield curve. The Index bounced back in the first quarter of 2019 returning 13.65% as optimism grew with support from an accommodative U.S. Federal Reserve (the "Fed") and progress in trade talks. Volatility returned in May when trade talks broke down and the United States increased tariffs on Chinese imports, but central banks were able to calm the markets through further stimulus with the Fed cutting interest rates in July, September, and October. The Fund ended the year with strong returns as well, up 9.07% in the fourth quarter with the aid of positive economic data along with the promise of a phase one trade deal between the United States and China.
5
Victory Variable Insurance Funds (Unaudited)
Victory S&P 500 Index VIP Series (continued)
Average Annual Total Return
Year Ended December 31, 2019
| | Class A | | | |
INCEPTION DATE | | 8/25/99 | | | |
| | Net Asset
Value | | S&P 500®
Index1 | |
One Year | | | 31.04 | % | | | 31.49 | % | |
Three Year | | | 14.96 | % | | | 15.27 | % | |
Five Year | | | 11.40 | % | | | 11.70 | % | |
Ten Year | | | 13.27 | % | | | 13.56 | % | |
Since Inception | | | 6.04 | % | | | N/A | | |
Expense Ratios
Gross | | | 0.38 | % | |
With Applicable Waivers | | | 0.28 | % | |
Past performance is not indicative of future results. The performance data quoted represents past performance and current returns may be lower or higher. The investment return and principal value will fluctuate so that an investor's shares, when redeemed, may be worth more or less than the original cost. To obtain performance information current to the most recent month's end, please visit www.vcm.com.
The above expense ratios are from the Fund's prospectus dated May 1, 2019. Additional information pertaining to the Fund's expense ratios as of December 31, 2019 can be found in the financial highlights.
The total return figures set forth above include all waivers of fees for various periods since inception. Without such fee waivers, the total returns would have been lower. Some fee waivers are voluntary and may be modified or terminated at any time. The total returns do not include any insurance, sales or administrative charges of variable annuity or life insurance contracts. If these charges were included, the total returns would have been lower.
Victory S&P 500 Index VIP Series — Growth of $10,000
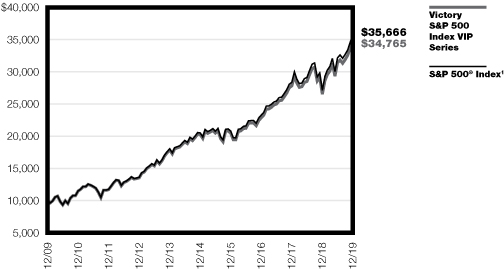
1The S&P 500® Index is an unmanaged index comprised of 500 domestically traded common stocks, is weighted according to the market value of each common stock in the index, and includes reinvestment of dividends. This index does not include effect of sales charges and is not representative of the Fund. It is not possible to invest directly in an index.
The graph reflects investment of growth of a hypothetical $10,000 investment in the Fund. Past performance is no guarantee of future results.
The graph and table do not reflect the deduction of taxes that a shareholder would pay on Fund distributions or the redemption of Fund shares.
6
Victory Variable Insurance Funds
Victory S&P 500 Index VIP Series | | Schedule of Portfolio Investments
December 31, 2019 | |
Security Description | | Shares | | Value | |
Common Stocks (99.5%) | |
Communication Services (10.5%): | |
Activision Blizzard, Inc. | | | 2,860 | | | $ | 169,941 | | |
Alphabet, Inc., Class C (a) | | | 1,113 | | | | 1,488,103 | | |
Alphabet, Inc., Class A (a) | | | 1,115 | | | | 1,493,420 | | |
AT&T, Inc. | | | 27,194 | | | | 1,062,742 | | |
CenturyLink, Inc. | | | 3,653 | | | | 48,256 | | |
Charter Communications, Inc., Class A (a) | | | 584 | | | | 283,287 | | |
Comcast Corp., Class A | | | 16,900 | | | | 759,993 | | |
Discovery, Inc., Class A (a) | | | 589 | | | | 19,284 | | |
Discovery, Inc., Class C (a) | | | 1,249 | | | | 38,082 | | |
DISH Network Corp., Class A (a) | | | 949 | | | | 33,661 | | |
Electronic Arts, Inc. (a) | | | 1,087 | | | | 116,863 | | |
Facebook, Inc., Class A (a) | | | 8,958 | | | | 1,838,629 | | |
Fox Corp., Class A | | | 1,320 | | | | 48,932 | | |
Fox Corp., Class B | | | 604 | | | | 21,986 | | |
Live Nation Entertainment, Inc. (a) | | | 521 | | | | 37,236 | | |
Netflix, Inc. (a) | | | 1,631 | | | | 527,743 | | |
News Corp., Class A | | | 1,446 | | | | 20,446 | | |
News Corp., Class B | | | 453 | | | | 6,573 | | |
Omnicom Group, Inc. | | | 811 | | | | 65,707 | | |
Take-Two Interactive Software, Inc. (a) | | | 421 | | | | 51,543 | | |
The Interpublic Group of Co., Inc. | | | 1,443 | | | | 33,333 | | |
The Walt Disney Co. | | | 6,710 | | | | 970,467 | | |
T-Mobile US, Inc. (a) | | | 1,178 | | | | 92,379 | | |
Twitter, Inc. (a) | | | 2,890 | | | | 92,625 | | |
Verizon Communications, Inc. | | | 15,396 | | | | 945,314 | | |
ViacomCBS, Inc., Class B | | | 2,012 | | | | 84,444 | | |
| | | | 10,350,989 | | |
Consumer Discretionary (9.5%): | |
Advance Auto Parts, Inc. | | | 258 | | | | 41,321 | | |
Amazon.com, Inc. (a) | | | 1,550 | | | | 2,864,152 | | |
Aptiv PLC | | | 950 | | | | 90,222 | | |
AutoZone, Inc. (a) | | | 89 | | | | 106,027 | | |
Best Buy Co., Inc. | | | 848 | | | | 74,454 | | |
Booking Holdings, Inc. (a) | | | 156 | | | | 320,382 | | |
BorgWarner, Inc. | | | 769 | | | | 33,359 | | |
Capri Holdings Ltd. (a) | | | 564 | | | | 21,517 | | |
CarMax, Inc. (a) | | | 612 | | | | 53,654 | | |
Carnival Corp. | | | 1,491 | | | | 75,788 | | |
Chipotle Mexican Grill, Inc. (a) | | | 95 | | | | 79,525 | | |
Darden Restaurants, Inc. | | | 456 | | | | 49,709 | | |
Dollar General Corp. | | | 948 | | | | 147,869 | | |
Dollar Tree, Inc. (a) | | | 881 | | | | 82,858 | | |
DR Horton, Inc. | | | 1,248 | | | | 65,832 | | |
eBay, Inc. | | | 2,847 | | | | 102,805 | | |
Expedia Group, Inc. | | | 520 | | | | 56,233 | | |
Ford Motor Co. | | | 14,496 | | | | 134,813 | | |
Garmin Ltd. | | | 538 | | | | 52,487 | | |
See notes to financial statements.
7
Victory Variable Insurance Funds
Victory S&P 500 Index VIP Series | | Schedule of Portfolio Investments — continued
December 31, 2019 | |
Security Description | | Shares | | Value | |
General Motors Co., Class C | | | 4,681 | | | $ | 171,324 | | |
Genuine Parts Co. | | | 541 | | | | 57,470 | | |
H&R Block, Inc. | | | 727 | | | | 17,070 | | |
Hanesbrands, Inc. | | | 1,346 | | | | 19,988 | | |
Harley-Davidson, Inc. | | | 574 | | | | 21,347 | | |
Hasbro, Inc. | | | 474 | | | | 50,059 | | |
Hilton Worldwide Holdings, Inc. | | | 1,050 | | | | 116,456 | | |
Kohl's Corp. | | | 583 | | | | 29,704 | | |
L Brands, Inc. | | | 865 | | | | 15,674 | | |
Las Vegas Sands Corp. (b) | | | 1,258 | | | | 86,852 | | |
Leggett & Platt, Inc. | | | 490 | | | | 24,907 | | |
Lennar Corp., Class A | | | 1,042 | | | | 58,133 | | |
LKQ Corp. (a) | | | 1,141 | | | | 40,734 | | |
Lowe's Cos., Inc. | | | 2,853 | | | | 341,675 | | |
Macy's, Inc. | | | 1,150 | | | | 19,550 | | |
Marriott International, Inc., Class A | | | 1,010 | | | | 152,944 | | |
McDonald's Corp. | | | 2,804 | | | | 554,099 | | |
MGM Resorts International | | | 1,917 | | | | 63,779 | | |
Mohawk Industries, Inc. (a) | | | 221 | | | | 30,140 | | |
Newell Brands, Inc. | | | 1,419 | | | | 27,273 | | |
Nike, Inc., Class B | | | 4,639 | | | | 469,977 | | |
Nordstrom, Inc. | | | 399 | | | | 16,331 | | |
Norwegian Cruise Line Holdings Ltd. (a) | | | 792 | | | | 46,261 | | |
NVR, Inc. (a) | | | 13 | | | | 49,509 | | |
O'Reilly Automotive, Inc. (a) | | | 282 | | | | 123,589 | | |
PulteGroup, Inc. | | | 948 | | | | 36,782 | | |
PVH Corp. | | | 276 | | | | 29,021 | | |
Ralph Lauren Corp. | | | 185 | | | | 21,686 | | |
Ross Stores, Inc. | | | 1,347 | | | | 156,818 | | |
Royal Caribbean Cruises Ltd. | | | 640 | | | | 85,446 | | |
Starbucks Corp. | | | 4,397 | | | | 386,584 | | |
Tapestry, Inc. | | | 1,027 | | | | 27,698 | | |
Target Corp. | | | 1,886 | | | | 241,804 | | |
The Gap, Inc. | | | 792 | | | | 14,003 | | |
The Home Depot, Inc. | | | 4,061 | | | | 886,841 | | |
The TJX Cos., Inc. | | | 4,514 | | | | 275,625 | | |
Tiffany & Co. | | | 402 | | | | 53,727 | | |
Tractor Supply Co. | | | 441 | | | | 41,207 | | |
Ulta Beauty, Inc. (a) | | | 213 | | | | 53,919 | | |
Under Armour, Inc., Class A (a) | | | 701 | | | | 15,142 | | |
Under Armour, Inc., Class C (a) | | | 724 | | | | 13,886 | | |
VF Corp. | | | 1,219 | | | | 121,486 | | |
Whirlpool Corp. | | | 235 | | | | 34,670 | | |
Wynn Resorts Ltd. | | | 360 | | | | 49,993 | | |
Yum! Brands, Inc. | | | 1,126 | | | | 113,422 | | |
| | | | 9,717,612 | | |
Consumer Staples (7.1%): | |
Altria Group, Inc. | | | 6,954 | | | | 347,074 | | |
Archer-Daniels-Midland Co. | | | 2,072 | | | | 96,037 | | |
Brown-Forman Corp., Class B | | | 678 | | | | 45,833 | | |
See notes to financial statements.
8
Victory Variable Insurance Funds
Victory S&P 500 Index VIP Series | | Schedule of Portfolio Investments — continued
December 31, 2019 | |
Security Description | | Shares | | Value | |
Campbell Soup Co. | | | 629 | | | $ | 31,085 | | |
Church & Dwight Co., Inc. | | | 914 | | | | 64,291 | | |
Colgate-Palmolive Co. | | | 3,191 | | | | 219,668 | | |
Conagra Brands, Inc. | | | 1,812 | | | | 62,043 | | |
Constellation Brands, Inc., Class A | | | 624 | | | | 118,404 | | |
Costco Wholesale Corp. | | | 1,645 | | | | 483,498 | | |
Coty, Inc., Class A (b) | | | 1,100 | | | | 12,375 | | |
General Mills, Inc. | | | 2,250 | | | | 120,510 | | |
Hormel Foods Corp. | | | 1,035 | | | | 46,689 | | |
Kellogg Co. | | | 927 | | | | 64,111 | | |
Kimberly-Clark Corp. | | | 1,276 | | | | 175,514 | | |
Lamb Weston Holdings, Inc. | | | 544 | | | | 46,800 | | |
McCormick & Co., Inc. | | | 460 | | | | 78,076 | | |
Molson Coors Beverage Co., Class B | | | 699 | | | | 37,676 | | |
Mondelez International, Inc., Class A | | | 5,360 | | | | 295,230 | | |
Monster Beverage Corp. (a) | | | 1,421 | | | | 90,305 | | |
PepsiCo, Inc. | | | 5,191 | | | | 709,454 | | |
Philip Morris International, Inc. | | | 5,792 | | | | 492,841 | | |
Sysco Corp. | | | 1,899 | | | | 162,440 | | |
The Clorox Co. | | | 467 | | | | 71,703 | | |
The Coca-Cola Co. | | | 14,355 | | | | 794,549 | | |
The Estee Lauder Cos., Inc., Class A | | | 828 | | | | 171,015 | | |
The Hershey Co. | | | 552 | | | | 81,133 | | |
The J.M. Smucker Co. | | | 425 | | | | 44,255 | | |
The Kraft Heinz Co. | | | 2,318 | | | | 74,477 | | |
The Kroger Co. | | | 2,985 | | | | 86,535 | | |
The Procter & Gamble Co. | | | 9,284 | | | | 1,159,572 | | |
Tyson Foods, Inc., Class A | | | 1,099 | | | | 100,053 | | |
Walgreens Boots Alliance, Inc. | | | 2,791 | | | | 164,557 | | |
Walmart, Inc. | | | 5,281 | | | | 627,595 | | |
| | | | 7,175,398 | | |
Energy (4.3%): | |
Apache Corp. | | | 1,400 | | | | 35,826 | | |
Baker Hughes Co. | | | 2,419 | | | | 61,999 | | |
Cabot Oil & Gas Corp. | | | 1,519 | | | | 26,446 | | |
Chevron Corp. | | | 7,039 | | | | 848,270 | | |
Cimarex Energy Co. | | | 379 | | | | 19,894 | | |
Concho Resources, Inc. | | | 748 | | | | 65,502 | | |
ConocoPhillips | | | 4,085 | | | | 265,648 | | |
Devon Energy Corp. | | | 1,441 | | | | 37,423 | | |
Diamondback Energy, Inc. | | | 600 | | | | 55,716 | | |
EOG Resources, Inc. | | | 2,166 | | | | 181,424 | | |
Exxon Mobil Corp. | | | 15,751 | | | | 1,099,105 | | |
Halliburton Co. | | | 3,268 | | | | 79,967 | | |
Helmerich & Payne, Inc. | | | 404 | | | | 18,354 | | |
Hess Corp. | | | 964 | | | | 64,405 | | |
HollyFrontier Corp. | | | 553 | | | | 28,043 | | |
Kinder Morgan, Inc. | | | 7,251 | | | | 153,504 | | |
Marathon Oil Corp. | | | 2,978 | | | | 40,441 | | |
Marathon Petroleum Corp. | | | 2,417 | | | | 145,624 | | |
See notes to financial statements.
9
Victory Variable Insurance Funds
Victory S&P 500 Index VIP Series | | Schedule of Portfolio Investments — continued
December 31, 2019 | |
Security Description | | Shares | | Value | |
National Oilwell Varco, Inc. | | | 1,436 | | | $ | 35,972 | | |
Noble Energy, Inc. | | | 1,781 | | | | 44,240 | | |
Occidental Petroleum Corp. | | | 3,326 | | | | 137,064 | | |
ONEOK, Inc. | | | 1,538 | | | | 116,380 | | |
Phillips 66 | | | 1,654 | | | | 184,272 | | |
Pioneer Natural Resources Co. | | | 617 | | | | 93,395 | | |
Schlumberger Ltd. | | | 5,154 | | | | 207,191 | | |
TechnipFMC PLC | | | 1,564 | | | | 33,532 | | |
The Williams Cos., Inc. | | | 4,512 | | | | 107,025 | | |
Valero Energy Corp. | | | 1,529 | | | | 143,191 | | |
| | | | 4,329,853 | | |
Financials (12.8%): | |
Aflac, Inc. | | | 2,733 | | | | 144,576 | | |
American Express Co. | | | 2,498 | | | | 310,976 | | |
American International Group, Inc. | | | 3,239 | | | | 166,258 | | |
Ameriprise Financial, Inc. | | | 472 | | | | 78,626 | | |
Aon PLC | | | 872 | | | | 181,629 | | |
Arthur J. Gallagher & Co. | | | 694 | | | | 66,090 | | |
Assurant, Inc. | | | 226 | | | | 29,624 | | |
Bank of America Corp. | | | 30,138 | | | | 1,061,460 | | |
Berkshire Hathaway, Inc., Class B (a) | | | 7,282 | | | | 1,649,373 | | |
BlackRock, Inc., Class A | | | 439 | | | | 220,685 | | |
Capital One Financial Corp. | | | 1,734 | | | | 178,446 | | |
Cboe Global Markets, Inc. | | | 413 | | | | 49,560 | | |
Chubb Ltd. | | | 1,687 | | | | 262,599 | | |
Cincinnati Financial Corp. | | | 566 | | | | 59,515 | | |
Citigroup, Inc. | | | 8,127 | | | | 649,266 | | |
Citizens Financial Group, Inc. | | | 1,618 | | | | 65,707 | | |
CME Group, Inc. | | | 1,334 | | | | 267,760 | | |
Comerica, Inc. | | | 537 | | | | 38,530 | | |
Discover Financial Services | | | 1,167 | | | | 98,985 | | |
E*TRADE Financial Corp. | | | 841 | | | | 38,156 | | |
Everest Re Group Ltd. | | | 152 | | | | 42,080 | | |
Fifth Third BanCorp. | | | 2,642 | | | | 81,215 | | |
First Republic Bank | | | 627 | | | | 73,641 | | |
Franklin Resources, Inc. | | | 1,038 | | | | 26,967 | | |
Globe Life, Inc. | | | 371 | | | | 39,048 | | |
Huntington Bancshares, Inc. | | | 3,845 | | | | 57,983 | | |
Intercontinental Exchange, Inc. | | | 2,073 | | | | 191,856 | | |
Invesco Ltd. | | | 1,386 | | | | 24,920 | | |
JPMorgan Chase & Co. | | | 11,676 | | | | 1,627,635 | | |
KeyCorp | | | 3,667 | | | | 74,220 | | |
Lincoln National Corp. | | | 738 | | | | 43,549 | | |
Loews Corp. | | | 952 | | | | 49,970 | | |
M&T Bank Corp. | | | 491 | | | | 83,347 | | |
MarketAxess Holdings, Inc. | | | 141 | | | | 53,455 | | |
Marsh & McLennan Cos., Inc. | | | 1,879 | | | | 209,338 | | |
MetLife, Inc. | | | 2,910 | | | | 148,323 | | |
Moody's Corp. | | | 604 | | | | 143,396 | | |
Morgan Stanley | | | 4,579 | | | | 234,078 | | |
See notes to financial statements.
10
Victory Variable Insurance Funds
Victory S&P 500 Index VIP Series | | Schedule of Portfolio Investments — continued
December 31, 2019 | |
Security Description | | Shares | | Value | |
MSCI, Inc. | | | 315 | | | $ | 81,327 | | |
Nasdaq, Inc. | | | 427 | | | | 45,732 | | |
Northern Trust Corp. | | | 789 | | | | 83,823 | | |
People's United Financial, Inc. | | | 1,653 | | | | 27,936 | | |
Principal Financial Group, Inc. | | | 961 | | | | 52,855 | | |
Prudential Financial, Inc. | | | 1,497 | | | | 140,329 | | |
Raymond James Financial, Inc. | | | 460 | | | | 41,152 | | |
Regions Financial Corp. | | | 3,591 | | | | 61,622 | | |
S&P Global, Inc. | | | 910 | | | | 248,476 | | |
State Street Corp. | | | 1,354 | | | | 107,101 | | |
SVB Financial Group (a) | | | 192 | | | | 48,200 | | |
Synchrony Financial | | | 2,213 | | | | 79,690 | | |
T. Rowe Price Group, Inc. | | | 870 | | | | 106,001 | | |
The Allstate Corp. | | | 1,206 | | | | 135,615 | | |
The Bank of New York Mellon Corp. | | | 3,124 | | | | 157,231 | | |
The Charles Schwab Corp. | | | 4,256 | | | | 202,415 | | |
The Goldman Sachs Group, Inc. | | | 1,186 | | | | 272,697 | | |
The Hartford Financial Services Group, Inc. | | | 1,342 | | | | 81,553 | | |
The PNC Financial Services Group, Inc. | | | 1,631 | | | | 260,357 | | |
The Progressive Corp. | | | 2,176 | | | | 157,521 | | |
The Travelers Cos., Inc. | | | 961 | | | | 131,609 | | |
Truist Financial Corp. | | | 4,992 | | | | 281,149 | | |
U.S. Bancorp | | | 5,291 | | | | 313,703 | | |
Unum Group | | | 768 | | | | 22,395 | | |
Wells Fargo & Co. | | | 14,328 | | | | 770,846 | | |
Willis Towers Watson PLC | | | 479 | | | | 96,729 | | |
WR Berkley Corp. | | | 540 | | | | 37,314 | | |
Zions Bancorp NA | | | 635 | | | | 32,969 | | |
| | | | 12,901,189 | | |
Health Care (14.1%): | |
Abbott Laboratories | | | 6,579 | | | | 571,451 | | |
AbbVie, Inc. | | | 5,505 | | | | 487,412 | | |
ABIOMED, Inc. (a) | | | 168 | | | | 28,659 | | |
Agilent Technologies, Inc. | | | 1,152 | | | | 98,277 | | |
Alexion Pharmaceuticals, Inc. (a) | | | 824 | | | | 89,116 | | |
Align Technology, Inc. (a) | | | 267 | | | | 74,504 | | |
Allergan PLC | | | 1,222 | | | | 233,610 | | |
AmerisourceBergen Corp. | | | 560 | | | | 47,611 | | |
Amgen, Inc. | | | 2,212 | | | | 533,246 | | |
Anthem, Inc. | | | 944 | | | | 285,116 | | |
Baxter International, Inc. | | | 1,901 | | | | 158,962 | | |
Becton, Dickinson & Co. | | | 1,007 | | | | 273,874 | | |
Biogen, Inc. (a) | | | 672 | | | | 199,403 | | |
Boston Scientific Corp. (a) | | | 5,189 | | | | 234,647 | | |
Bristol-Myers Squibb Co. | | | 8,727 | | | | 560,186 | | |
Cardinal Health, Inc. | | | 1,089 | | | | 55,082 | | |
Centene Corp. (a) | | | 1,540 | | | | 96,820 | | |
Cerner Corp. | | | 1,169 | | | | 85,793 | | |
Cigna Corp. | | | 1,390 | | | | 284,241 | | |
CVS Health Corp. | | | 4,843 | | | | 359,786 | | |
See notes to financial statements.
11
Victory Variable Insurance Funds
Victory S&P 500 Index VIP Series | | Schedule of Portfolio Investments — continued
December 31, 2019 | |
Security Description | | Shares | | Value | |
Danaher Corp. | | | 2,380 | | | $ | 365,281 | | |
DaVita, Inc. (a) | | | 334 | | | | 25,060 | | |
DENTSPLY SIRONA, Inc. | | | 828 | | | | 46,857 | | |
Edwards Lifesciences Corp. (a) | | | 776 | | | | 181,033 | | |
Eli Lilly & Co. | | | 3,145 | | | | 413,347 | | |
Gilead Sciences, Inc. | | | 4,710 | | | | 306,056 | | |
HCA Healthcare, Inc. | | | 985 | | | | 145,593 | | |
Henry Schein, Inc. (a) | | | 546 | | | | 36,429 | | |
Hologic, Inc. (a) | | | 998 | | | | 52,106 | | |
Humana, Inc. | | | 493 | | | | 180,694 | | |
IDEXX Laboratories, Inc. (a) | | | 319 | | | | 83,300 | | |
Illumina, Inc. (a) | | | 547 | | | | 181,462 | | |
Incyte Pharmaceuticals, Inc. (a) | | | 666 | | | | 58,155 | | |
Intuitive Surgical, Inc. (a) | | | 430 | | | | 254,195 | | |
IQVIA Holdings, Inc. (a) | | | 672 | | | | 103,831 | | |
Johnson & Johnson | | | 9,798 | | | | 1,429,234 | | |
Laboratory Corp. of America Holdings (a) | | | 361 | | | | 61,070 | | |
McKesson Corp. | | | 671 | | | | 92,813 | | |
Medtronic PLC | | | 4,990 | | | | 566,115 | | |
Merck & Co., Inc. | | | 9,478 | | | | 862,024 | | |
Mettler-Toledo International, Inc. (a) | | | 91 | | | | 72,188 | | |
Mylan NV (a) | | | 1,921 | | | | 38,612 | | |
PerkinElmer, Inc. | | | 414 | | | | 40,199 | | |
Perrigo Co. PLC | | | 507 | | | | 26,192 | | |
Pfizer, Inc. | | | 20,602 | | | | 807,186 | | |
Quest Diagnostics, Inc. | | | 501 | | | | 53,502 | | |
Regeneron Pharmaceuticals, Inc. (a) | | | 297 | | | | 111,518 | | |
ResMed, Inc. | | | 535 | | | | 82,909 | | |
STERIS PLC | | | 313 | | | | 47,707 | | |
Stryker Corp. | | | 1,199 | | | | 251,718 | | |
Teleflex, Inc. | | | 172 | | | | 64,748 | | |
The Cooper Co., Inc. | | | 185 | | | | 59,439 | | |
Thermo Fisher Scientific, Inc. | | | 1,493 | | | | 485,031 | | |
UnitedHealth Group, Inc. | | | 3,527 | | | | 1,036,868 | | |
Universal Health Services, Inc., Class B | | | 299 | | | | 42,895 | | |
Varian Medical Systems, Inc. (a) | | | 338 | | | | 47,999 | | |
Vertex Pharmaceuticals, Inc. (a) | | | 957 | | | | 209,535 | | |
Waters Corp. (a) | | | 240 | | | | 56,076 | | |
WellCare Health Plans, Inc. (a) | | | 187 | | | | 61,749 | | |
Zimmer Biomet Holdings, Inc. | | | 766 | | | | 114,655 | | |
Zoetis, Inc. | | | 1,773 | | | | 234,657 | | |
| | | | 14,147,834 | | |
Industrials (8.9%): | |
3M Co. | | | 2,141 | | | | 377,715 | | |
Alaska Air Group, Inc. | | | 459 | | | | 31,097 | | |
Allegion PLC | | | 346 | | | | 43,091 | | |
American Airlines Group, Inc. | | | 1,451 | | | | 41,615 | | |
AMETEK, Inc. | | | 851 | | | | 84,879 | | |
AO Smith Corp. | | | 510 | | | | 24,296 | | |
Arconic, Inc. | | | 1,442 | | | | 44,370 | | |
See notes to financial statements.
12
Victory Variable Insurance Funds
Victory S&P 500 Index VIP Series | | Schedule of Portfolio Investments — continued
December 31, 2019 | |
Security Description | | Shares | | Value | |
C.H. Robinson Worldwide, Inc. | | | 503 | | | $ | 39,335 | | |
Caterpillar, Inc. | | | 2,057 | | | | 303,777 | | |
Cintas Corp. | | | 312 | | | | 83,953 | | |
Copart, Inc. (a) | | | 761 | | | | 69,205 | | |
CSX Corp. | | | 2,895 | | | | 209,482 | | |
Cummins, Inc. | | | 570 | | | | 102,007 | | |
Deere & Co. | | | 1,172 | | | | 203,061 | | |
Delta Air Lines, Inc. | | | 2,143 | | | | 125,322 | | |
Dover Corp. | | | 541 | | | | 62,356 | | |
Eaton Corp. PLC, ADR | | | 1,539 | | | | 145,774 | | |
Emerson Electric Co. | | | 2,268 | | | | 172,958 | | |
Equifax, Inc. | | | 451 | | | | 63,194 | | |
Expeditors International of Washington, Inc. | | | 634 | | | | 49,465 | | |
Fastenal Co. | | | 2,135 | | | | 78,888 | | |
FedEx Corp. | | | 894 | | | | 135,182 | | |
Flowserve Corp. | | | 487 | | | | 24,238 | | |
Fortive Corp. | | | 1,100 | | | | 84,029 | | |
Fortune Brands Home & Security, Inc. | | | 518 | | | | 33,846 | | |
General Dynamics Corp. | | | 872 | | | | 153,777 | | |
General Electric Co. | | | 32,512 | | | | 362,834 | | |
Honeywell International, Inc. | | | 2,660 | | | | 470,820 | | |
Huntington Ingalls Industries, Inc. | | | 152 | | | | 38,134 | | |
IDEX Corp. | | | 283 | | | | 48,676 | | |
IHS Markit Ltd. (a) | | | 1,493 | | | | 112,498 | | |
Illinois Tool Works, Inc. | | | 1,089 | | | | 195,617 | | |
Ingersoll-Rand PLC | | | 892 | | | | 118,564 | | |
J.B. Hunt Transport Services, Inc. | | | 317 | | | | 37,019 | | |
Jacobs Engineering Group, Inc. | | | 504 | | | | 45,275 | | |
Johnson Controls International PLC | | | 2,872 | | | | 116,920 | | |
Kansas City Southern | | | 369 | | | | 56,516 | | |
L3Harris Technologies, Inc. | | | 823 | | | | 162,847 | | |
Lockheed Martin Corp. | | | 924 | | | | 359,787 | | |
Masco Corp. | | | 1,058 | | | | 50,773 | | |
Nielsen Holdings PLC | | | 1,325 | | | | 26,898 | | |
Norfolk Southern Corp. | | | 971 | | | | 188,500 | | |
Northrop Grumman Corp. | | | 583 | | | | 200,535 | | |
Old Dominion Freight Line, Inc. | | | 238 | | | | 45,168 | | |
PACCAR, Inc. | | | 1,288 | | | | 101,881 | | |
Parker-Hannifin Corp. | | | 478 | | | | 98,382 | | |
Pentair PLC | | | 626 | | | | 28,715 | | |
Quanta Services, Inc. | | | 530 | | | | 21,576 | | |
Raytheon Co. | | | 1,037 | | | | 227,870 | | |
Republic Services, Inc., Class A | | | 784 | | | | 70,270 | | |
Robert Half International, Inc. | | | 438 | | | | 27,660 | | |
Rockwell Automation, Inc. | | | 430 | | | | 87,148 | | |
Rollins, Inc. | | | 524 | | | | 17,376 | | |
Roper Technologies, Inc. | | | 387 | | | | 137,087 | | |
Snap-on, Inc. | | | 204 | | | | 34,558 | | |
Southwest Airlines Co. | | | 1,763 | | | | 95,167 | | |
Stanley Black & Decker, Inc. | | | 566 | | | | 93,809 | | |
See notes to financial statements.
13
Victory Variable Insurance Funds
Victory S&P 500 Index VIP Series | | Schedule of Portfolio Investments — continued
December 31, 2019 | |
Security Description | | Shares | | Value | |
Textron, Inc. | | | 850 | | | $ | 37,910 | | |
The Boeing Co. | | | 1,990 | | | | 648,263 | | |
TransDigm Group, Inc. | | | 185 | | | | 103,600 | | |
Union Pacific Corp. | | | 2,584 | | | | 467,162 | | |
United Airlines Holdings, Inc. (a) | | | 810 | | | | 71,353 | | |
United Parcel Service, Inc., Class B | | | 2,609 | | | | 305,409 | | |
United Rentals, Inc. (a) | | | 280 | | | | 46,696 | | |
United Technologies Corp. | | | 3,020 | | | | 452,275 | | |
Verisk Analytics, Inc., Class A | | | 610 | | | | 91,097 | | |
W.W. Grainger, Inc. | | | 162 | | | | 54,840 | | |
Wabtec Corp. | | | 678 | | | | 52,748 | | |
Waste Management, Inc. | | | 1,453 | | | | 165,584 | | |
Xylem, Inc. | | | 670 | | | | 52,789 | | |
| | | | 9,015,518 | | |
Information Technology (23.4%): | |
Accenture PLC, Class A | | | 2,364 | | | | 497,787 | | |
Adobe, Inc. (a) | | | 1,802 | | | | 594,318 | | |
Advanced Micro Devices, Inc. (a) | | | 4,145 | | | | 190,090 | | |
Akamai Technologies, Inc. (a) | | | 602 | | | | 52,001 | | |
Alliance Data Systems Corp. | | | 153 | | | | 17,167 | | |
Amphenol Corp., Class A | | | 1,104 | | | | 119,486 | | |
Analog Devices, Inc. | | | 1,371 | | | | 162,930 | | |
ANSYS, Inc. (a) | | | 319 | | | | 82,114 | | |
Apple, Inc. | | | 15,549 | | | | 4,565,964 | | |
Applied Materials, Inc. | | | 3,439 | | | | 209,917 | | |
Arista Networks, Inc. (a) | | | 202 | | | | 41,087 | | |
Autodesk, Inc. (a) | | | 819 | | | | 150,254 | | |
Automatic Data Processing, Inc. | | | 1,611 | | | | 274,676 | | |
Broadcom, Inc. | | | 1,477 | | | | 466,762 | | |
Broadridge Financial Solutions, Inc. | | | 427 | | | | 52,752 | | |
Cadence Design Systems, Inc. (a) | | | 1,045 | | | | 72,481 | | |
CDW Corp. | | | 535 | | | | 76,419 | | |
Cisco Systems, Inc. | | | 15,793 | | | | 757,432 | | |
Citrix Systems, Inc. | | | 456 | | | | 50,570 | | |
Cognizant Technology Solutions Corp., Class A | | | 2,038 | | | | 126,397 | | |
Corning, Inc. | | | 2,863 | | | | 83,342 | | |
DXC Technology Co. | | | 953 | | | | 35,823 | | |
F5 Networks, Inc. (a) | | | 226 | | | | 31,561 | | |
Fidelity National Information Services, Inc. | | | 2,288 | | | | 318,238 | | |
Fiserv, Inc. (a) | | | 2,126 | | | | 245,829 | | |
FleetCor Technologies, Inc. (a) | | | 323 | | | | 92,934 | | |
FLIR Systems, Inc. | | | 499 | | | | 25,983 | | |
Fortinet, Inc. (a) | | | 528 | | | | 56,369 | | |
Gartner, Inc. (a) | | | 333 | | | | 51,315 | | |
Global Payments, Inc. | | | 1,119 | | | | 204,285 | | |
Hewlett Packard Enterprises Co. | | | 4,817 | | | | 76,398 | | |
HP, Inc. | | | 5,517 | | | | 113,374 | | |
Intel Corp. | | | 16,194 | | | | 969,210 | | |
International Business Machines Corp. | | | 3,297 | | | | 441,930 | | |
Intuit, Inc. | | | 969 | | | | 253,810 | | |
See notes to financial statements.
14
Victory Variable Insurance Funds
Victory S&P 500 Index VIP Series | | Schedule of Portfolio Investments — continued
December 31, 2019 | |
Security Description | | Shares | | Value | |
IPG Photonics Corp. (a) | | | 132 | | | $ | 19,129 | | |
Jack Henry & Associates, Inc. | | | 286 | | | | 41,662 | | |
Juniper Networks, Inc. | | | 1,246 | | | | 30,689 | | |
Keysight Technologies, Inc. (a) | | | 698 | | | | 71,636 | | |
KLA Corp. | | | 587 | | | | 104,586 | | |
Lam Research Corp. | | | 540 | | | | 157,896 | | |
Leidos Holdings, Inc. | | | 495 | | | | 48,456 | | |
Mastercard, Inc., Class A | | | 3,305 | | | | 986,839 | | |
Maxim Integrated Products, Inc. | | | 1,007 | | | | 61,941 | | |
Microchip Technology, Inc. | | | 890 | | | | 93,201 | | |
Micron Technology, Inc. (a) | | | 4,121 | | | | 221,627 | | |
Microsoft Corp. (b) | | | 28,400 | | | | 4,478,680 | | |
Motorola Solutions, Inc. | | | 638 | | | | 102,807 | | |
NetApp, Inc. | | | 850 | | | | 52,913 | | |
NortonLifeLock, Inc. | | | 2,134 | | | | 54,460 | | |
NVIDIA Corp. | | | 2,278 | | | | 536,012 | | |
Oracle Corp. | | | 8,065 | | | | 427,284 | | |
Paychex, Inc. | | | 1,186 | | | | 100,881 | | |
PayPal Holdings, Inc. (a) | | | 4,371 | | | | 472,810 | | |
Qorvo, Inc. (a) | | | 432 | | | | 50,211 | | |
QUALCOMM, Inc. | | | 4,251 | | | | 375,066 | | |
Salesforce.com, Inc. (a) | | | 3,302 | | | | 537,037 | | |
Seagate Technology PLC | | | 861 | | | | 51,230 | | |
ServiceNow, Inc. (a) (b) | | | 702 | | | | 198,189 | | |
Skyworks Solutions, Inc. | | | 634 | | | | 76,638 | | |
Synopsys, Inc. (a) | | | 560 | | | | 77,952 | | |
TE Connectivity Ltd. | | | 1,245 | | | | 119,321 | | |
Texas Instruments, Inc. | | | 3,480 | | | | 446,449 | | |
The Western Union Co. | | | 1,561 | | | | 41,804 | | |
VeriSign, Inc. (a) | | | 385 | | | | 74,182 | | |
Visa, Inc., Class A | | | 6,373 | | | | 1,197,486 | | |
Western Digital Corp. | | | 1,107 | | | | 70,261 | | |
Xerox Holdings Corp. | | | 692 | | | | 25,514 | | |
Xilinx, Inc. | | | 936 | | | | 91,513 | | |
Zebra Technologies Corp. (a) | | | 199 | | | | 50,833 | | |
| | | | 23,108,200 | | |
Materials (2.7%): | |
Air Products & Chemicals, Inc. | | | 821 | | | | 192,926 | | |
Albemarle Corp. | | | 395 | | | | 28,851 | | |
Amcor PLC | | | 6,031 | | | | 65,376 | | |
Avery Dennison Corp. | | | 311 | | | | 40,685 | | |
Ball Corp. | | | 1,218 | | | | 78,768 | | |
Celanese Corp., Series A | | | 450 | | | | 55,404 | | |
CF Industries Holdings, Inc. | | | 809 | | | | 38,622 | | |
Corteva, Inc. | | | 2,786 | | | | 82,354 | | |
Dow, Inc. | | | 2,760 | | | | 151,055 | | |
DuPont de Nemours, Inc. | | | 2,758 | | | | 177,064 | | |
Eastman Chemical Co. | | | 506 | | | | 40,106 | | |
Ecolab, Inc. | | | 934 | | | | 180,253 | | |
FMC Corp. | | | 483 | | | | 48,213 | | |
See notes to financial statements.
15
Victory Variable Insurance Funds
Victory S&P 500 Index VIP Series | | Schedule of Portfolio Investments — continued
December 31, 2019 | |
Security Description | | Shares | | Value | |
Freeport-McMoRan, Inc. | | | 5,401 | | | $ | 70,861 | | |
International Flavors & Fragrances, Inc. | | | 397 | | | | 51,221 | | |
International Paper Co. | | | 1,460 | | | | 67,233 | | |
Linde PLC | | | 2,000 | | | | 425,799 | | |
Lyondellbasell Industries NV, Class A | | | 956 | | | | 90,323 | | |
Martin Marietta Materials, Inc. | | | 233 | | | | 65,156 | | |
Newmont Goldcorp Corp. | | | 3,052 | | | | 132,610 | | |
Nucor Corp. | | | 1,129 | | | | 63,540 | | |
Packaging Corp. of America | | | 352 | | | | 39,420 | | |
PPG Industries, Inc. | | | 880 | | | | 117,471 | | |
Sealed Air Corp. | | | 575 | | | | 22,902 | | |
The Mosaic Co. | | | 1,302 | | | | 28,175 | | |
The Sherwin-Williams Co. | | | 306 | | | | 178,563 | | |
Vulcan Materials Co. | | | 493 | | | | 70,987 | | |
Westrock Co. | | | 960 | | | | 41,194 | | |
| | | | 2,645,132 | | |
Real Estate (2.9%): | |
Alexandria Real Estate Equities, Inc. | | | 429 | | | | 69,318 | | |
American Tower Corp. | | | 1,649 | | | | 378,972 | | |
Apartment Investment & Management Co. | | | 554 | | | | 28,614 | | |
AvalonBay Communities, Inc. | | | 520 | | | | 109,044 | | |
Boston Properties, Inc. | | | 535 | | | | 73,755 | | |
CBRE Group, Inc., Class A (a) | | | 1,246 | | | | 76,367 | | |
Crown Castle International Corp. | | | 1,548 | | | | 220,047 | | |
Digital Realty Trust, Inc. | | | 777 | | | | 93,038 | | |
Duke Realty Investments, Inc. | | | 1,368 | | | | 47,429 | | |
Equinix, Inc. | | | 317 | | | | 185,033 | | |
Equity Residential | | | 1,299 | | | | 105,115 | | |
Essex Property Trust, Inc. | | | 246 | | | | 74,012 | | |
Extra Space Storage, Inc. | | | 482 | | | | 50,909 | | |
Federal Realty Investment Trust | | | 261 | | | | 33,599 | | |
Healthpeak Properties, Inc. | | | 1,842 | | | | 63,494 | | |
Host Hotels & Resorts, Inc. | | | 2,670 | | | | 49,529 | | |
Iron Mountain, Inc. | | | 1,069 | | | | 34,069 | | |
Kimco Realty Corp. | | | 1,572 | | | | 32,556 | | |
Mid-America Apartment Communities, Inc. | | | 425 | | | | 56,041 | | |
Prologis, Inc. | | | 2,352 | | | | 209,656 | | |
Public Storage | | | 559 | | | | 119,045 | | |
Realty Income Corp. | | | 1,213 | | | | 89,313 | | |
Regency Centers Corp. | | | 624 | | | | 39,368 | | |
SBA Communications Corp. | | | 419 | | | | 100,975 | | |
Simon Property Group, Inc. | | | 1,142 | | | | 170,112 | | |
SL Green Realty Corp. | | | 303 | | | | 27,840 | | |
UDR, Inc. | | | 1,091 | | | | 50,950 | | |
Ventas, Inc. | | | 1,388 | | | | 80,143 | | |
Vornado Realty Trust | | | 590 | | | | 39,235 | | |
Welltower, Inc. | | | 1,510 | | | | 123,488 | | |
Weyerhaeuser Co. | | | 2,774 | | | | 83,775 | | |
| | | | 2,914,841 | | |
See notes to financial statements.
16
Victory Variable Insurance Funds
Victory S&P 500 Index VIP Series | | Schedule of Portfolio Investments — continued
December 31, 2019 | |
Security Description | | Shares | | Value | |
Utilities (3.3%): | |
AES Corp. | | | 2,471 | | | $ | 49,173 | | |
Alliant Energy Corp. | | | 895 | | | | 48,974 | | |
Ameren Corp. | | | 916 | | | | 70,349 | | |
American Electric Power Co., Inc. | | | 1,839 | | | | 173,804 | | |
American Water Works Co., Inc. | | | 673 | | | | 82,678 | | |
Atmos Energy Corp. | | | 444 | | | | 49,666 | | |
CenterPoint Energy, Inc. | | | 1,870 | | | | 50,995 | | |
CMS Energy Corp. | | | 1,057 | | | | 66,422 | | |
Consolidated Edison, Inc. | | | 1,238 | | | | 112,002 | | |
Dominion Energy, Inc. | | | 3,064 | | | | 253,760 | | |
DTE Energy Co. | | | 715 | | | | 92,857 | | |
Duke Energy Corp. | | | 2,714 | | | | 247,544 | | |
Edison International | | | 1,335 | | | | 100,672 | | |
Entergy Corp. | | | 741 | | | | 88,772 | | |
Evergy, Inc. | | | 848 | | | | 55,196 | | |
Eversource Energy | | | 1,205 | | | | 102,509 | | |
Exelon Corp. | | | 3,619 | | | | 164,990 | | |
FirstEnergy Corp. | | | 2,011 | | | | 97,735 | | |
NextEra Energy, Inc. | | | 1,820 | | | | 440,732 | | |
NiSource, Inc. | | | 1,391 | | | | 38,725 | | |
NRG Energy, Inc. | | | 937 | | | | 37,246 | | |
Pinnacle West Capital Corp. | | | 418 | | | | 37,591 | | |
PPL Corp. | | | 2,692 | | | | 96,589 | | |
Public Service Enterprise Group, Inc. | | | 1,883 | | | | 111,191 | | |
Sempra Energy | | | 1,049 | | | | 158,903 | | |
The Southern Co. | | | 3,904 | | | | 248,685 | | |
WEC Energy Group, Inc. | | | 1,174 | | | | 108,278 | | |
Xcel Energy, Inc. | | | 1,952 | | | | 123,932 | | |
| | | | 3,309,970 | | |
Total Common Stocks (Cost $29,229,876) | | | 99,616,536 | | |
Total Investments (Cost $29,229,876) — 99.5% | | | 99,616,536 | | |
Other assets in excess of liabilities — 0.5% | | | 522,613 | | |
NET ASSETS — 100.00% | | $ | 100,139,149 | | |
(a) Non-income producing security.
(b) All or a portion of this security has been segregated as collateral for derivative instruments.
ADR — American Depositary Receipt
PLC — Public Limited Company
See notes to financial statements.
17
Victory Variable Insurance Funds
Victory S&P 500 Index VIP Series | | Schedule of Portfolio Investments — continued
December 31, 2019 | |
Futures Contracts Purchased
| | | Number of
Contracts | | Expiration
Date | | Notional
Amount | | Value | | Unrealized
Appreciation
(Depreciation) | |
E-Mini S&P 500 Future | | | 3 | | | 3/20/20 | | $ | 471,905 | | | $ | 484,665 | | | $ | 12,760 | | |
| | | Total unrealized appreciation | | | | | | | | $ | 12,760 | | |
| | | Total unrealized depreciation | | | | | | | | | — | | |
| | | Total net unrealized appreciation(depreciation) | | | | | | | | $ | 12,760 | | |
See notes to financial statements.
18
Victory Variable Insurance Funds | | Statement of Assets and Liabilities
December 31, 2019 | |
| | | Victory
S&P 500
Index VIP
Series | |
ASSETS: | |
Investments, at value (Cost $29,229,876) | | $ | 99,616,536 | | |
Cash and cash equivalents | | | 385,678 | | |
Deposits with brokers for futures contracts | | | 76,749 | | |
Interest and dividends receivable | | | 105,639 | | |
Variation margin receivable on open futures contracts | | | 781 | | |
Receivable from Adviser | | | 32,819 | | |
Prepaid expenses | | | 6,304 | | |
Total Assets | | | 100,224,506 | | |
LIABILITIES: | |
Payables: | |
Capital shares redeemed | | | 19,957 | | |
Accrued expenses and other payables: | |
Investment advisory fees | | | 21,036 | | |
Administration fees | | | 4,729 | | |
Custodian fees | | | 1,062 | | |
Transfer agent fees | | | 10,622 | | |
Compliance fees | | | 66 | | |
Trustees' fees | | | 203 | | |
Other accrued expenses | | | 27,682 | | |
Total Liabilities | | | 85,357 | | |
NET ASSETS: | |
Capital | | | 7,905,170 | | |
Total distributable earnings/(loss) | | | 92,233,979 | | |
Net Assets | | $ | 100,139,149 | | |
Shares (unlimited shares authorized
with a par value of $0.001 per shares): | | | 5,175,358 | | |
Net asset value: | | $ | 19.35 | | |
See notes to financial statements.
19
Victory Variable Insurance Funds | | Statement of Operations
For the Year Ended December 31, 2019 | |
| | | Victory
S&P 500
Index VIP
Series | |
Investment Income: | |
Dividends | | $ | 2,145,557 | | |
Interest | | | 14,278 | | |
Securities lending (net of fees) | | | 329 | | |
Total Income | | | 2,160,164 | | |
Expenses: | |
Investment advisory fees | | | 271,564 | | |
Administration fees | | | 66,564 | | |
Custodian fees | | | 6,431 | | |
Transfer agent fees | | | 146,607 | | |
Trustees' fees | | | 10,585 | | |
Compliance fees | | | 741 | | |
Legal and audit fees | | | 18,909 | | |
Other expenses | | | 43,130 | | |
Total Expenses | | | 564,531 | | |
Expenses waived/reimbursed by Adviser | | | (260,434 | ) | |
Net Expenses | | | 304,097 | | |
Net Investment Income (Loss) | | | 1,856,067 | | |
Realized/Unrealized Gains (Losses) from Investments: | |
Net realized gains (losses) from investment securities | | | 24,187,474 | | |
Net realized gains (losses) from futures contracts | | | 188,869 | | |
Net change in unrealized appreciation/depreciation on investment securities | | | 3,523,327 | | |
Net change in unrealized appreciation/depreciation on futures contracts | | | 44,831 | | |
Net realized/unrealized gains on investments | | | 27,944,501 | | |
Change in net assets resulting from operations | | $ | 29,800,568 | | |
See notes to financial statements.
20
Victory Variable Insurance Funds | | Statements of Changes in Net Assets | |
| | | Victory S&P 500 Index VIP Series | |
| | | Year
Ended
December 31,
2019 | | Year
Ended
December 31,
2018 | |
From Investment Activities: | |
Operations: | |
Net investment income (loss) | | $ | 1,856,067 | | | $ | 2,052,531 | | |
Net realized gains (losses) from investments | | | 24,376,343 | | | | 11,525,904 | | |
Net change in unrealized appreciation/depreciation
on investments | | | 3,568,158 | | | | (18,228,830 | ) | |
Change in net assets resulting from operations | | | 29,800,568 | | | | (4,650,395 | ) | |
Change in net assets resulting from distributions to
shareholders | | | (12,905,780 | ) | | | (7,462,566 | ) | |
Change in net assets resulting from capital transactions | | | (23,187,353 | ) | | | (10,536,165 | ) | |
Change in net assets | | | (6,292,565 | ) | | | (22,649,126 | ) | |
Net Assets: | |
Beginning of period | | | 106,431,714 | | | | 129,080,840 | | |
End of period | | $ | 100,139,149 | | | $ | 106,431,714 | | |
Capital Transactions: | |
Proceeds from shares issued | | $ | 4,642,884 | | | $ | 5,103,469 | | |
Distributions reinvested | | | 12,905,780 | | | | 7,462,566 | | |
Cost of shares redeemed | | | (40,736,017 | ) | | | (23,102,200 | ) | |
Change in net assets resulting from capital transactions | | $ | (23,187,353 | ) | | $ | (10,536,165 | ) | |
Share Transactions: | |
Issued | | | 240,425 | | | | 260,170 | | |
Reinvested | | | 663,420 | | | | 440,689 | | |
Redeemed | | | (2,019,404 | ) | | | (1,183,894 | ) | |
Change in Shares | | | (1,115,559 | ) | | | (483,035 | ) | |
See notes to financial statements.
21
Victory Variable Insurance Funds | | Financial Highlights | |
For a Share Outstanding Throughout Each Period
| | | | Investment Activities | | Distributions to
Shareholders From | |
| | | Net Asset
Value,
Beginning of
Period | | Net
Investment
Income
(Loss)(a) | | Net
Realized and
Unrealized
Gains
(Losses) on
Investments | | Total from
Investment
Activities | | Net
Investment
Income | | Net Realized
Gains from
Investments | | Total
Distributions | |
Victory S&P 500 Index VIP Series | |
Year Ended
12/31/19 | | $ | 16.92 | | | | 0.34 | | | | 4.88 | | | | 5.22 | | | | (0.37 | ) | | | (2.42 | ) | | | (2.79 | ) | |
Year Ended
12/31/18 | | $ | 19.06 | | | | 0.32 | | | | (1.21 | ) | | | (0.89 | ) | | | (0.02 | ) | | | (1.23 | ) | | | (1.25 | ) | |
Year Ended
12/31/17 | | $ | 15.98 | | | | 0.30 | | | | 3.15 | | | | 3.45 | | | | (0.33 | ) | | | (0.04 | ) | | | (0.37 | ) | |
Year Ended
12/31/16 | | $ | 14.84 | | | | 0.28 | | | | 1.46 | | | | 1.74 | | | | (0.32 | ) | | | (0.28 | ) | | | (0.60 | ) | |
Year Ended
12/31/15 | | $ | 14.97 | | | | 0.27 | | | | (0.12 | ) | | | 0.15 | | | | (0.28 | ) | | | — | | | | (0.28 | ) | |
(a) Per share net investment income (loss) has been calculated using the average daily shares method.
(b) Total returns do not reflect the effects of charges deducted pursuant to the terms of The Guardian Insurance & Annuity Company, Inc.'s variable contracts. Inclusion of such charges would reduce the total returns for all periods shown.
(c) Amount is less than $0.005 per share.
(d) The Fund received monies related to a nonrecurring refund from the prior Custodian. The corresponding impact to the total return was less than 0.01% for the period shown. (See Note 8)
See notes to financial statements.
22
Victory Variable Insurance Funds | | Financial Highlights — continued | |
For a Share Outstanding Throughout Each Period
| | | | | Ratios to Average Net Assets | | Supplemental Data | |
| | | Capital
Contribution
from Prior
Custodian,
Net (See
Note 8) | | Net Asset
Value,
End of
Period | | Total
Return(b) | | Net
Expenses | | Net
Investment
Income
(Loss) | | Gross
Expenses | | Net Assets,
End of
Period
(000's) | | Portfolio
Turnover | |
Victory S&P 500 Index VIP Series | |
Year Ended
12/31/19 | | | — | | | $ | 19.35 | | | | 31.04 | % | | | 0.28 | % | | | 1.71 | % | | | 0.52 | % | | $ | 100,139 | | | | 3 | % | |
Year Ended
12/31/18 | | | — | | | $ | 16.92 | | | | (4.65 | )% | | | 0.28 | % | | | 1.65 | % | | | 0.38 | % | | $ | 106,432 | | | | 3 | % | |
Year Ended
12/31/17 | | | — | | | $ | 19.06 | | | | 21.60 | % | | | 0.28 | % | | | 1.70 | % | | | 0.41 | % | | $ | 129,081 | | | | 3 | % | |
Year Ended
12/31/16 | | | — | (c) | | $ | 15.98 | | | | 11.75 | %(d) | | | 0.28 | % | | | 1.84 | % | | | 0.37 | % | | $ | 120,157 | | | | 4 | % | |
Year Ended
12/31/15 | | | — | | | $ | 14.84 | | | | 1.03 | % | | | 0.28 | % | | | 1.75 | % | | | 0.39 | % | | $ | 118,752 | | | | 3 | % | |
See notes to financial statements.
23
Victory Variable Insurance Funds | | Notes to Financial Statements
December 31, 2019 | |
1. Organization:
Victory Variable Insurance Funds (the "Trust") was organized on February 11, 1998 as a Delaware statutory trust. The Trust is registered under the Investment Company Act of 1940, as amended (the "1940 Act"), as a diversified open-end investment company. The Trust is comprised of nine funds and is authorized to issue an unlimited number of shares, which are units of beneficial interest with a par value of $0.001 per share.
The accompanying financial statements are those of the Victory S&P 500 Index VIP Series (the "Fund"). The Fund offers a single class of shares: Class I Shares. Sales of shares of the Fund may only be made to certain separate accounts of The Guardian Insurance & Annuity Company, Inc. ("GIAC") that fund certain variable annuity and variable life insurance contracts issued by GIAC. GIAC is a wholly owned subsidiary of The Guardian Life Insurance Company of America ("Guardian Life").
Under the Trust's organizational documents, its officers and trustees are indemnified against certain liabilities arising out of the performance of their duties to the Fund. In addition, in the normal course of business, the Fund enters into contracts with its vendors and others that provide for general indemnifications. The Fund's maximum exposure under these arrangements is unknown, as this would involve future claims that may be made against the Fund. However, based on experience, the Fund expects that risk of loss to be remote.
2. Significant Accounting Policies:
The following is a summary of significant accounting policies followed by the Trust in the preparation of its financial statements. The policies are in conformity with accounting principles generally accepted in the United States of America ("GAAP"). The preparation of financial statements in accordance with GAAP requires management to make estimates and assumptions that affect the reported amounts of assets and liabilities and disclosure of contingent assets and liabilities at the date of the financial statements and the reported amounts of income and expenses for the period. Actual results could differ from those estimates. The Fund follows the specialized accounting and reporting requirements under GAAP that are applicable to investment companies.
Investment Valuation:
The Fund records investments at fair value. Fair value is defined as the price that would be received to sell an asset or paid to transfer a liability in an orderly transaction between market participants at the measurement date.
The valuation techniques described below maximize the use of observable inputs and minimize the use of unobservable inputs in determining fair value. The inputs used for valuing the Funds' investments are summarized in the three broad levels listed below:
• Level 1 — quoted prices in active markets for identical securities
• Level 2 — other significant observable inputs (including quoted prices for similar securities or interest rates applicable to those securities, etc.)
• Level 3 — significant unobservable inputs (including the Funds' own assumptions in determining the fair value of investments)
Changes in valuation techniques may result in transfers in or out of an assigned level within the disclosure hierarchy. The inputs or methodologies used for valuation techniques are not necessarily an indication of the risk associated with entering into those investments.
Portfolio securities listed or traded on securities exchanges, including American Depositary Receipts ("ADRs") and Rights, are valued at the closing price on the exchange or system where the security is principally traded, if available, or at the Nasdaq Official Closing Price. If there have been no sales for that day on the exchange or system, then a security is valued at the last available bid quotation on the exchange or system where the security is principally traded. In each of these situations, valuations are typically categorized as Level 1 in the fair value hierarchy.
24
Victory Variable Insurance Funds | | Notes to Financial Statements — continued
December 31, 2019 | |
Futures contracts are valued at the settlement price established each day by the board of trade or an exchange on which they are traded. These valuations are typically categorized as Level 1 in the fair value hierarchy.
Investments for which there are no such quotations, or for which quotations do not appear reliable, are valued at fair value in accordance with procedures established by and under the general supervision and responsibility of the Trust's Board of Trustees (the "Board"). These valuations are typically categorized as Level 2 or Level 3 in the fair value hierarchy, based on the observability of inputs used to determine the fair value.
A summary of the valuations as of December 31, 2019, based upon the three levels defined above, is included in the table below while the breakdown, by category, of investments is disclosed in the Schedule of Portfolio Investments.
| | | LEVEL 1 | | Total | |
Common Stocks | | $ | 99,616,536 | | | $ | 99,616,536 | | |
Total | | | 99,616,536 | | | | 99,616,536 | | |
Other Financial Instruments^: | |
Assets: | |
Futures Contracts | | | 12,760 | | | | 12,760 | | |
Total | | $ | 12,760 | | | $ | 12,760 | | |
^ Futures Contracts are valued at the unrealized appreciation (depreciation) on the investment.
For the year ended December 31, 2019, there were no Level 3 investments for which significant unobservable inputs were used to determine fair value.
Derivative Instruments:
Futures Contracts:
The Fund may enter into contracts for the future delivery of securities or foreign currencies and futures contracts based on a specific security, class of securities, foreign currency or an index, and purchase or sell options on any such futures contracts. A futures contract on a securities index is an agreement obligating either party to pay, and entitling the other party to receive, while the contract is outstanding, cash payments based on the level of a specified securities index. No physical delivery of the underlying asset is made. The Fund may enter into futures contracts in an effort to hedge against market risks. The acquisition of put and call options on futures contracts will give the Fund the right (but not the obligation), for a specified price, to sell or to purchase the underlying futures contract, upon exercise of the option, at any time during the option period. Futures transactions involve brokerage costs and require the Fund to segregate assets to cover contracts that would require it to purchase securities or currencies. A good faith margin deposit, known as initial margin, of cash or government securities with a broker or custodian is required to initiate and maintain open positions in futures contracts. Subsequent payments, known as variation margin, are made or received by the Fund based on the change in the market value of the position and are recorded as unrealized appreciation or depreciation until the contract is closed out, at which time the gain or loss is realized. The Fund may lose the expected benefit of futures transactions if interest rates, exchange rates or securities prices change in an unanticipated manner. Such unanticipated changes may also result in lower overall performance than if the Fund had not entered into any futures transactions. In addition, the value of the Fund's futures positions may not prove to be perfectly or even highly correlated with the value of its portfolio securities or foreign currencies, limiting the Fund's ability to hedge effectively against interest rate, exchange rate and/or market risk and giving rise to additional risks. There is no assurance of liquidity in the secondary market for purposes of closing out futures positions. The collateral held by the Fund is presented on the Statement of Assets and Liabilities under Deposits with broker for futures contracts. As of December 31, 2019, the Fund entered into futures contracts primarily for the strategy of hedging or other purposes, including but not limited to, providing liquidity and equitizing cash.
25
Victory Variable Insurance Funds | | Notes to Financial Statements — continued
December 31, 2019 | |
Offsetting of Financial Assets and Derivatives Assets:
The Fund is subject to various Master Netting Arrangements, which govern the terms of certain transactions with select counterparties. The Master Netting Arrangements allow the Fund to close out and net total exposure to a counterparty in the event of a default with respect to all the transactions governed under a single agreement with a counterparty. The Master Netting Arrangements also specify collateral posting arrangements at pre-arranged exposure levels. Under the Master Netting Arrangements, collateral is routinely transferred if the total net exposure to certain transactions (net of existing collateral already in place) governed under the relevant Master Netting Arrangement with a counterparty in a given account exceeds a specified threshold depending on the counterparty and the type of Master Netting Arrangement.
The table below, as of December 31, 2019, discloses both gross information and net information about instruments and transactions eligible for offset in the Statement of Assets and Liabilities and instruments and transactions that are subject to an agreement similar to a master netting agreement as well as amounts related to collateral held at clearing brokers and counterparties.
| | Gross
Amounts of
Recognized
Assets | | Gross
Amounts
Available
for Offset | | Net Amount
Presented in the
Statement of
Assets and
Liabilities | | Cash
Collateral
Received | | Net Amount | |
Futures Contracts-Goldman
Sachs & Co. | | $ | 1,155 | | | $ | (374 | ) | | $ | 781 | | | $ | — | | | $ | 781 | | |
| | Gross
Amounts of
Recognized
Liabilities | | Gross
Amounts
Available
for Offset | | Net Amount
Presented in the
Statement of
Assets and
Liabilities | | Cash
Collateral
Pledged* | | Net Amount | |
Futures Contracts-Goldman
Sachs & Co. | | $ | 374 | | | $ | (374 | ) | | $ | — | | | $ | — | | | $ | — | | |
* Cash collateral pledged may be in excess of the amounts shown in the table. The total cash collateral pledged by the Fund is disclosed in the Statement of Assets and Liabilities.
Summary of Derivative Instruments:
The following table presents the effect of derivative instruments on the Statement of Assets and Liabilities, categorized by risk exposure, as of December 31, 2019.
| | | Assets | |
| | | Variation Margin
Receivable on Open
Futures Contracts* | |
Equity Risk Exposure: | | $ | 12,760 | | |
* Includes cumulative appreciation (depreciation) of futures contracts as reported in the Schedule of Portfolio Investments. Only current day's variation margin is reported within the Statement of Assets and Liabilities.
The following table presents the effect of derivative instruments on the Statement of Operations, categorized by risk exposure, for the year ended December 31, 2019.
| | Net Realized Gains (Losses) on
Derivatives Recognized as
a Result from Operations | | Net Change in Unrealized
Appreciation/Depreciation
on Derivatives Recognized
as a Result of Operations | |
| | Net Realized
Gains (Losses) on
Futures Contracts | | Net Change in Unrealized
Appreciation/Depreciation
on Futures Contracts | |
Equity Risk Exposure | | $ | 188,869 | | | $ | 44,831 | | |
26
Victory Variable Insurance Funds | | Notes to Financial Statements — continued
December 31, 2019 | |
All open derivative positions at year end are reflected on the Fund's Schedule of Portfolio Investments. The underlying face value of open derivative positions relative to the Fund's net assets at year end is generally representative of the notional amount of open positions to net assets throughout the year.
Investment Transactions and Related Income:
Changes in holdings of investments are accounted for no later than one business day following the trade date. For financial reporting purposes, however, investment transactions are accounted for on trade date on the last business day of the reporting period. Interest income is determined on the basis of coupon interest accrued using the effective interest method which adjusts, where applicable, the amortization of premiums or accretion of discounts. Dividend income is recorded on the ex-dividend date. Gains or losses realized on sales of securities are determined by comparing the identified cost of the security lot sold with the net sales proceeds.
Withholding taxes on interest, dividends and gains as a result of certain investments in ADRs by the Fund have been provided for in accordance with each investment's applicable country's tax rules and rates.
Securities Lending:
The Trust has entered into a Master Securities Lending Agreement ("MSLA") with Citibank, N.A. ("Citibank" or the "Agent"). Under the terms of the MSLA, the Fund may lend securities to certain broker-dealers and banks in exchange for collateral in the amount of at least 102% of the value of U.S. securities loaned or at least 105% of the value of non-U.S. securities loaned, marked-to-market daily. Any collateral shortfalls associated with increases in the valuation of the securities loaned are adjusted the next business day. The collateral can be received in the form of cash collateral and/or non-cash collateral. Non-cash collateral can include U.S. Government Securities, letters of credit and certificates of deposit. The cash collateral is invested in short-term instruments or cash equivalents as noted on the Fund's Schedule of Portfolio Investments. The Trust does not have effective control of the non-cash collateral and therefore it is not disclosed in the Fund's Schedule of Portfolio Investments. The Fund continues to benefit from interest or dividends on the securities loaned and may also earn a return from the collateral. The Fund pays various fees in connection with the investment of cash collateral. The Fund pays the Agent fees based on the investment income received from securities lending activities. Securities lending income is disclosed in the Fund's Statement of Operations. Although risk is mitigated by the collateral, the Fund could experience a delay in recovering its securities and possible loss of income or value if the borrower fails to return them.
Securities lending transactions are entered into by the Fund under the MSLA, which permits the Fund, under certain circumstances such as an event of default, to offset amounts payable by the Fund to the same counterparty against amounts receivable from the counterparty to create a net payment due to or from the Fund.
As of December 31, 2019, the Fund had no securities on loan.
Dividends to Shareholders:
Dividends from net investment income, if any, are declared and paid annually by the Fund. Distributable net realized gains, if any, are declared and distributed at least annually.
The amounts of dividends from net investment income and distributions from net realized gains are determined in accordance with federal income tax regulations, which may differ from GAAP. To the extent these "book/tax" differences are permanent in nature (e.g., net operating loss and distribution reclassification), such amounts are reclassified within the components of net assets based on their federal tax-basis treatment; temporary differences (e.g., wash sales) do not require reclassification. To the extent dividends and distributions exceed net investment income and net realized gains for tax purposes, they are reported as distributions of capital. Net investment losses incurred by the Fund may be reclassified as an offset to capital on the accompanying Statement of Assets and Liabilities.
27
Victory Variable Insurance Funds | | Notes to Financial Statements — continued
December 31, 2019 | |
As of December 31, 2019 on the Statement of Assets and Liabilities, as a result of permanent book-to-tax differences, reclassification adjustments were as follows:
Total
Distributable
Earnings/(Loss) | | Capital | |
| $ | (2 | ) | | $ | 2 | | |
Federal Income Taxes:
It is the policy of the Fund to continue to qualify as a regulated investment company by complying with the provisions available to certain investment companies, as defined in applicable sections of the Internal Revenue Code, and to make distributions of net investment income and net realized gains sufficient to relieve it from all, or substantially all, federal income taxes. Accordingly, no provision for federal income taxes is required in the financial statements. The Fund has a tax year end of December 31.
Management of the Fund has reviewed tax positions taken in tax years that remain subject to examination by all major tax jurisdictions, including federal (i.e., all open tax years and the interim tax period since then). Management believes that there is no tax liability resulting from unrecognized tax benefits related to uncertain tax positions taken.
Allocations:
Expenses directly attributable to the Fund are charged to the Fund, while expenses which are attributable to more than one fund in the Trust, or jointly with an affiliated trust, are allocated among the respective funds in the Trust and/or affiliated trust based upon net assets or another appropriate basis.
Cross-Trade Transactions:
Pursuant to Rule 17a-7 under the 1940 Act, the Fund may engage in cross-trades which are securities transactions with affiliated investment companies and advisory accounts managed by the Adviser and any applicable sub-adviser. Any such purchase or sale transaction must be effected without brokerage commission or other remuneration, except for customary transfer fees. The transaction must be effected at the current market price, which is either the security's last sale price on an exchange or, if there are no transactions in the security that day, at the average of the highest bid and lowest asked price. For the year ended December 31, 2019, the Fund did not engage in any Rule 17a-7 transactions under the 1940 Act.
3. Purchases and Sales of Securities:
Purchases and sales of securities (excluding securities maturing less than one year from acquisition) for the year ended December 31, 2019 were as follows for the Fund:
| Purchases | | Sales | |
| $ | 2,895,100 | | | $ | 36,906,337 | | |
For the year ended December 31, 2019, there were no purchases or sales of U.S. Government Securities.
4. Fees and Transactions with Affiliates and Related Parties:
Investment advisory services are provided to the Fund by Victory Capital Management Inc. ("VCM" or the "Adviser"), a New York corporation registered as an investment adviser with the Securities and Exchange Commission ("SEC"). The Adviser is a wholly owned indirect subsidiary of Victory Capital Holdings, Inc., a publicly traded Delaware corporation, and a wholly owned direct subsidiary of Victory Capital Operating, LLC.
28
Victory Variable Insurance Funds | | Notes to Financial Statements — continued
December 31, 2019 | |
Under the terms of the Investment Advisory Agreement, the Adviser is entitled to receive 0.25% of the average daily net assets of the Fund. The Adviser may use its resources to assist with the Fund's distribution and marketing expenses.
VCM also serves as the Fund's administrator and fund accountant. Under an Administration and Fund Accounting Agreement, VCM is paid for its services an annual fee at a rate of 0.08% of the first $15 billion in average daily net assets of the Trust, Victory Portfolios and Victory Portfolios II (collectively, the "Victory Funds Complex"), 0.05% of the average daily net assets above $15 billion to $30 billion of the Victory Funds Complex and 0.04% of the average daily net assets over $30 billion of the Victory Funds Complex.
Citi Fund Services Ohio, Inc. ("Citi"), an affiliate of Citibank, acts as sub-administrator and sub-fund accountant to the Fund pursuant to a Sub-Administration and Sub-Fund Accounting Services Agreement between VCM and Citi. VCM pays Citi a fee for providing these services. The Trust reimburses VCM and Citi for all of their reasonable out-of-pocket expenses incurred in providing these services.
FIS Investor Services, LLC ("FIS") serves as the Fund's transfer agent. Under the Transfer Agent Agreement, the Trust pays FIS a fee for its services and reimburses FIS for all of their reasonable out-of-pocket expenses incurred in providing these services.
The Chief Compliance Officer ("CCO") is an employee of the Adviser, which pays the compensation of the CCO and his support staff. The Trust has entered into an Agreement to provide compliance services with the Adviser, pursuant to which the Adviser furnishes its compliance personnel, including the services of the CCO, and other resources reasonably necessary to provide the Trust with compliance oversight services related to the design, administration and oversight of a compliance program for the Trust in accordance with Rule 38a-1 under the 1940 Act. The Funds in the Victory Funds Complex, in aggregate, compensate the Adviser for these services.
The Victory Funds Complex pays an annual retainer to each Independent Trustee, plus an additional annual retainer to the Chairman of the Board. The aggregate amount of the fees and expenses of the Independent Trustees are allocated amongst all the funds in the Victory Funds Complex and are presented in the Statement of Operations.
Shearman & Sterling LLP provides legal services to the Trust.
Victory Capital Advisers, Inc. (the "Distributor"), an affiliate of the Adviser, serves as distributor for the continuous offering of the shares of the Fund pursuant to a Distribution Agreement between the Distributor and the Trust.
The Adviser has entered into an expense limitation agreement with the Fund until at least April 30, 2020. Under the terms of the agreement, the Adviser has agreed to waive fees or reimburse certain expenses to the extent that ordinary operating expenses incurred by the Fund in any fiscal year exceed the expense limit for the Fund. Such excess amounts will be the liability of the Adviser. Interest, taxes, brokerage commissions, other expenditures which are capitalized in accordance with GAAP, and other extraordinary expenses not incurred in the ordinary course of a Fund's business are excluded from the expense limits. As of December 31, 2019, the expense limit (excluding voluntary waivers) is 0.28%.
The Fund has agreed to repay fees and expenses that were waived or reimbursed by the Adviser for a period up to three fiscal years after such waiver or reimbursement was made to the extent such payments or repayments would not cause the expenses to exceed the original expense limitation in place at time of the waiver or reimbursement or any expense limitation agreement in place at the time of repayment. As of December 31, 2019, the following amounts are available to be repaid to the Adviser. Amounts repaid to the Adviser during the year ended, if any, are reflected on the Statement of Operations as "Recoupment of prior expenses waived/reimbursed by Adviser".
Expires
12/31/2020 | | Expires
12/31/2021 | | Expires
12/31/2022 | | Total | |
| $ | 167,384 | | | $ | 126,360 | | | $ | 260,434 | | | $ | 554,178 | | |
The Adviser may voluntarily waive or reimburse additional fees to assist the Fund in maintaining a competitive expense ratio. Voluntary waivers and reimbursements applicable to the Fund are not
29
Victory Variable Insurance Funds | | Notes to Financial Statements — continued
December 31, 2019 | |
available to be recouped at a future time. There were no voluntary waivers or reimbursements for the year ended December 31, 2019.
Certain officers and/or interested trustees of the Fund are also officers and/or employees of the Adviser, Administrator, Fund Accountant, Sub-Administrator, Sub-Fund Accountant and Legal Counsel.
5. Risks:
The Fund may be subject to other risks in addition to these identified risks.
An investment in the Fund's shares represents an indirect investment in the securities owned by the Fund, some of which will be traded on a national securities exchange or in the over-the-counter markets. The value of the securities in which the Fund invests, like other market investments, may move up or down, sometimes rapidly and unpredictably. The value of the securities in which the Fund invests may affect the value of the Fund's shares. An investment in the Fund's shares at any point in time may be worth less than the original investment, even after taking into account the reinvestment of the Fund's distributions.
The Fund will be subject to credit risk with respect to the amount it expects to receive from counterparties for financial instruments entered into by the Fund. The Fund may be negatively impacted if a counterparty becomes bankrupt or otherwise fails to perform its obligations due to financial difficulties. The Fund may experience significant delays in obtaining any recovery in bankruptcy or other reorganization proceeding and the Fund may obtain only limited recovery or may obtain no recovery in such circumstances. The Fund typically enters into transactions with counterparties whose credit ratings are investment grade, as determined by a nationally recognized statistical rating organization or, if unrated, judged by the Adviser to be of comparable quality.
6. Borrowing and Interfund Lending:
Line of Credit:
For the year ended December 31, 2019, the Victory Funds Complex participated in a short-term, demand note "Line of Credit" with Citibank. Under the agreement with Citibank, for the period January 1, 2019 to June 30, 2019, the Victory Funds Complex could borrow up to $250 million, of which $100 million was committed and $150 million was uncommitted. Effective July 1, 2019, the agreement was amended to include the USAA Mutual Funds Complex (another series of mutual funds managed by the Adviser) and has a new termination date of June 29, 2020. Under this amended agreement, the Victory Funds Complex and USAA Mutual Funds Complex, combined, may borrow up to $600 million, of which $300 million is committed and $300 million is uncommitted. $40 million of the Line of Credit is reserved for use by the Victory Floating Rate Fund (herein, the "Fund"), another series of the Victory Funds Complex, with that Fund paying the related commitment fees for that amount. The purpose of the agreement is to meet temporary or emergency cash needs, including redemption requests that might otherwise require the untimely disposition of securities. With the agreement in effect for the period January 1, 2019 to June 30, 2019, Citibank received an annual commitment fee of 0.15% on $100 million for providing the Line of Credit. For the period July 1, 2019 to December 31, 2019, Citibank received an annual commitment fee of 0.15% on $300 million for providing the Line of Credit. For the year ended December 31, 2019, Citibank earned approximately $300 thousand in commitment fees from the combined Victory Funds Complex and USAA Mutual Funds Complex. Each fund in the Victory Funds Complex and the USAA Mutual Funds Complex pays a pro-rata portion of the commitment fees plus any interest (one month LIBOR plus one percent) on amounts borrowed. Interest charged to the Fund during the period, if applicable, is presented on the Statement of Operations under Line of credit fees.
The Fund did not utilize the Line of Credit during the year ended December 31, 2019.
Interfund Lending:
The Trust and Adviser rely on an exemptive order granted by the SEC in March 2017 (the "Order"), permitting the establishment and operation of an Interfund Lending Facility (the "Facility"). The Facility
30
Victory Variable Insurance Funds | | Notes to Financial Statements — continued
December 31, 2019 | |
allows the Fund to directly lend and borrow money to or from any other Victory Fund relying upon the Order at rates beneficial to both the borrowing and lending funds. Advances under the Facility are allowed for temporary or emergency purposes, including the meeting of redemption requests that otherwise might require the untimely disposition of securities, and are subject to each fund's borrowing restrictions. The interfund loan rate is determined, as specified in the Order, by averaging the current repurchase agreement rate and the current bank loan rate. As a Borrower, interest charged to the Fund during the period, if applicable, is presented on the Statement of Operations under Interfund lending fees. As a Lender, interest earned by the Fund during the period, if applicable, is presented on the Statement of Operations under Income on interfund lending.
The Fund did not utilize the Facility during the year ended December 31, 2019.
7. Federal Income Tax Information:
The tax character of distributions paid during the most recent tax years ended, as noted below, were as follows (total distributions paid may differ from the Statements of Changes in Net Assets because, for tax purposes, dividends are recognized when actually paid).
Year Ended December 31, 2019 | |
Distributions paid from | |
Ordinary
Income | | Net
Long-Term
Capital Gains | | Total
Distributions
Paid | |
| $ | 1,891,446 | | | $ | 11,014,334 | | | $ | 12,905,780 | | |
Year Ended December 31, 2018 | |
Distributions paid from | |
Ordinary
Income | | Net
Long-Term
Capital Gains | | Total
Distributions
Paid | |
| $ | 349,417 | | | $ | 7,113,149 | | | $ | 7,462,566 | | |
As of the tax year ended December 31, 2019, the components of distributable earnings/accumulated deficit on a tax basis were as follows:
Undistributed
Ordinary
Income | | Undistributed
Long-Term
Capital Gains | | Accumulated
Earnings | | Accumulated
Capital and
Other
Losses | | Unrealized
Appreciation
(Depreciation) | | Total
Accumulated
Earnings
(Deficit) | |
| $ | 2,003,389 | | | $ | 22,828,416 | | | $ | 24,831,805 | | | $ | — | | | $ | 67,402,174 | | | $ | 92,233,979 | | |
During the tax year ended December 31, 2019, the Fund did not utilize capital loss carryforwards.
As of December 31, 2019, the cost basis for federal income tax purposes, gross unrealized appreciation, gross unrealized depreciation and net unrealized appreciation (depreciation) for investments and derivatives were as follows:
Cost of
Investments
for Federal
Tax Purposes | | Gross
Unrealized
Appreciation | | Gross
Unrealized
Depreciation | | Net
Unrealized
Appreciation
(Depreciation) | |
| $ | 32,214,362 | | | $ | 71,223,720 | | | $ | (3,821,546 | ) | | $ | 67,402,174 | | |
8. Capital Contribution from Prior Custodian:
During 2016, the Fund received notification from the Fund's prior custodian, State Street Bank and Trust ("State Street"), concerning issues related to billing on certain categories of expenses during the approximately 16-year period from 1998 through October 31, 2014. The over-billing primarily related to categories of expenses that involved an allocation of general costs among multiple clients.
31
Victory Variable Insurance Funds | | Notes to Financial Statements — continued
December 31, 2019 | |
State Street paid the refunded amounts during January 2017. Based on billing information received during 2016 from State Street and an analysis of any expense limitation agreements that were in place during the period of the activities in question, including the application of any recoupment provisions in such agreements, the Adviser received a portion of the refund.
The portion of the refund retained by the Fund was accounted for as a capital contribution and is reflected on the Financial Highlights as "Capital Contribution from Prior Custodian, Net".
9. Fund Ownership:
Ownership of more than 25% of the voting securities of a fund creates presumptions of control of the Fund, under section 2(a)(9) of the 1940 Act. As of December 31, 2019, the shareholder listed below held more than 25% of the shares outstanding of the Fund and may be deemed to control the Fund.
| Shareholder | | Percent | |
| GIAC | | | 100.0 | % | |
10. Subsequent Events:
The Fund has evaluated the need for additional disclosures or adjustments resulting from subsequent events through the date these financial statements were issued. Based on this evaluation, there were no subsequent events to report that would have a material impact on the Fund's financial statements.
32
REPORT OF INDEPENDENT REGISTERED PUBLIC ACCOUNTING FIRM
To the Shareholders and Board of Trustees of Victory Variable Insurance Funds
Opinion on the Financial Statements
We have audited the accompanying statement of assets and liabilities, including the schedule of portfolio investments, of Victory S&P 500 Index VIP Series (the "Fund"), a series of Victory Variable Insurance Funds, as of December 31, 2019, the related statements of operations and changes in net assets, including the related notes, and the financial highlights for the year then ended (collectively referred to as the "financial statements"). In our opinion, the financial statements present fairly, in all material respects, the financial position of the Fund as of December 31, 2019, the results of its operations, the changes in its net assets, and the financial highlights for the year then ended, in conformity with accounting principles generally accepted in the United States of America.
The Fund's financial statements and financial highlights for the three years ended December 31, 2018, were audited by other auditors whose report dated February 15, 2019 and the Fund's financial highlights for the year ended December 31, 2015, were audited by other auditors whose report dated February 22, 2016, expressed unqualified opinions on those financial statements and financial highlights.
Basis for Opinion
These financial statements are the responsibility of the Fund's management. Our responsibility is to express an opinion on the Fund's financial statements based on our audit. We are a public accounting firm registered with the Public Company Accounting Oversight Board (United States) ("PCAOB") and are required to be independent with respect to the Fund in accordance with the U.S. federal securities laws and the applicable rules and regulations of the Securities and Exchange Commission and the PCAOB.
We conducted our audit in accordance with the standards of the PCAOB. Those standards require that we plan and perform the audit to obtain reasonable assurance about whether the financial statements are free of material misstatement whether due to error or fraud.
Our audit included performing procedures to assess the risks of material misstatement of the financial statements, whether due to error or fraud, and performing procedures that respond to those risks. Such procedures included examining, on a test basis, evidence regarding the amounts and disclosures in the financial statements. Our procedures included confirmation of securities owned as of December 31, 2019, by correspondence with the custodian and brokers. Our audit also included evaluating the accounting principles used and significant estimates made by management, as well as evaluating the overall presentation of the financial statements. We believe that our audit provides a reasonable basis for our opinion.
We have served as the auditor of one or more of the investment companies advised by Victory Capital Management, Inc. since 2015.
COHEN & COMPANY, LTD.
Cleveland, Ohio
February 18, 2020
33
Victory Variable Insurance Funds | | Supplemental Information
December 31, 2019 | |
(Unaudited)
Trustee and Officer Information
Board of Trustees:
Overall responsibility for management of the Trust rests with the Board. The Trust is managed by the Board in accordance with the laws of the State of Delaware. There are currently ten Trustees, nine of whom are not "interested persons" of the Trust within the meaning of that term under the 1940 Act ("Independent Trustees") and one of whom is an "interested person" of the Trust within the meaning of that term under the 1940 Act ("Interested Trustee"). The Trustees, in turn, elect the officers of the Trust to actively supervise its day-to-day operations. The following tables list the Trustees, their ages, position with the Trust, commencement of service, principal occupations during the past five years and any directorships of other investment companies or companies whose securities are registered under the Securities Exchange Act of 1934, as amended, or who file reports under that Act. Each Trustee oversees nine portfolios in the Trust, 42 portfolios in Victory Portfolios and 26 portfolios in Victory Portfolios II, each a registered investment company that, together with the Trust, comprise the Victory Funds Complex. Each Trustee's address is c/o Victory Variable Insurance Funds, 4900 Tiedeman Road, 4th Floor, Brooklyn, Ohio 44144. Each Trustee has an indefinite term.
Name and Age | | Position
Held with
the Trust | | Date
Commenced
Service | | Principal Occupation
During Past 5 Years | | Other
Directorships
Held During
Past 5 Years | |
Independent Trustees. | |
David Brooks Adcock, 68 | | Trustee | | February 2005 | | Consultant (since 2006). | | Chair and Trustee, Turner Funds (December 2016-December 2017). | |
Nigel D.T. Andrews, 72 | | Vice Chair and Trustee | | August 2002 | | Retired. | | Director, TCG BDC II, Inc. (since 2017);
Director, TCG BDC I, Inc. (formerly Carlyle GMS Finance, Inc.)
(since 2012); Director, Old Mutual US Asset Management (2002-2014). | |
E. Lee Beard, 68* | | Trustee | | February 2005 | | Retired (since 2015); Consultant, The Henlee Group, LLC (consulting) (2005-2015). | | None. | |
Dennis M. Bushe, 76 | | Trustee | | July 2016 | | Retired. | | Trustee, RS Investment Trust and RS Variable Products Trust (November 2011-July 2016). | |
34
Victory Variable Insurance Funds | | Supplemental Information — continued
December 31, 2019 | |
(Unaudited)
Name and Age | | Position
Held with
the Trust | | Date
Commenced
Service | | Principal Occupation
During Past 5 Years | | Other
Directorships
Held During
Past 5 Years | |
Sally M. Dungan, 65 | | Trustee | | February 2011 | | Chief Investment Officer, Tufts University (since 2002). | | None. | |
John L. Kelly, 66 | | Trustee | | February 2015 | | Partner, McCarvill Capital
Partners (September 2016-
September 2017); Advisor,
Endgate Commodities LLC
(January 2016-April 2016);
Managing Partner, Endgate
Commodities LLC
(August 2014-January 2016);
Chief Operating Officer,
Liquidnet Holdings, Inc.
(December 2011-July 2014). | | Director, Caledonia Mining Corporation (since May 2012). | |
David L. Meyer, 62* | | Trustee | | December 2008 | | Retired. | | None. | |
Gloria S. Nelund, 58 | | Trustee | | July 2016 | | Chair, CEO and Co-Founder of TriLinc Global, LLC, an investment firm. | | TriLinc Global Impact Fund, LLC (since 2012); Trustee, RS Investment Trust and RS Variable Products Trust (November 2007-July 2016). | |
Leigh A. Wilson, 75 | | Chair and Trustee | | February 1998 | | Private Investor. | | Chair (since 2013), Caledonia Mining Corporation. | |
Interested Trustee. | |
David C. Brown, 47** | | Trustee | | May 2008 | | Chairman and Chief Executive Officer (since 2013), Co-Chief Executive Officer (2011-2013), the Adviser; Chairman and Chief Executive Officer, Victory Capital Holdings, Inc. (since 2013). | | USAA Mutual Funds Trust. | |
* The Board has designated Mr. Meyer and Ms. Beard as its Audit Committee Financial Experts.
** Mr. Brown is an "Interested Person" by reason of his relationship with the Adviser.
The Statement of Additional Information includes additional information about the Trustees of the Trust and is available, without charge, by calling 800-539-3863.
35
Victory Variable Insurance Funds | | Supplemental Information — continued
December 31, 2019 | |
(Unaudited)
Officers:
The officers of the Trust, their ages, commencement of service and their principal occupations during the past five years, are detailed in the following table. Each officer serves until the earlier of his or her resignation, removal, retirement, death, or the election of a successor. The mailing address of each officer of the Trust is 4900 Tiedeman Road, 4th Floor, Brooklyn, Ohio 44144. The officers of the Trust receive no compensation directly from the Trust for performing the duties of their offices.
Name and Age | | Position with
the Trust | | Date
Commenced
Service | | Principal Occupation During Past 5 Years | |
Christopher K. Dyer, 58 | | President | | February 2006* | | Director of Fund Administration, the Adviser. | |
Scott A. Stahorsky, 50 | | Vice President | | December 2014 | | Manager, Fund Administration, the Adviser (since 2015); Senior Analyst, Fund Administration, the Adviser (prior to 2015). | |
Erin G. Wagner, 46 | | Secretary | | December 2014 | | Associate General Counsel, the Adviser (since 2013). | |
Allan Shaer, 54 | | Treasurer | | May 2017 | | Senior Vice President, Financial Administration, Citi Fund Services Ohio, Inc. (since 2016); Vice President, Mutual Fund Administration, JP Morgan Chase (2011-2016). | |
Christopher A. Ponte, 35 | | Assistant Treasurer | | December 2017 | | Manager, Fund Administration, the Adviser (since 2017); Senior Analyst, Fund Administration, the Adviser (prior to 2017); Chief Financial Officer, Victory Capital Advisers, Inc. (since 2018). | |
Colin Kinney, 46 | | Chief Compliance Officer | | July 2017 | | Chief Compliance Officer (since 2013) and Chief Risk Officer (2009-2017), the Adviser. | |
Chuck Booth, 59 | | Anti-Money Laundering Compliance Officer and Identity Theft Officer | | May 2015 | | Director, Regulatory Administration and CCO Support Services, Citi Fund Services Ohio, Inc. | |
Jay G. Baris, 66 | | Assistant Secretary | | February 1998 | | Partner, Shearman & Sterling LLP (since 2018); Partner, Morrison & Foerster LLP (2011-January 2018). | |
* On December 3, 2014, Mr. Dyer resigned as Secretary of the Trust and accepted the position of President.
36
Victory Variable Insurance Funds | | Supplemental Information — continued
December 31, 2019 | |
(Unaudited)
Proxy Voting and Portfolio Holdings Information
Proxy Voting:
Information regarding the policies and procedures the Fund uses to determine how to vote proxies relating to portfolio securities is available without charge, upon request, by calling 800-539-3863. The information is also included in the Fund's Statement of Additional Information, which is available on the SEC's website at www.sec.gov.
Information relating to how the Fund voted proxies relating to portfolio securities held during the most recent twelve months ended June 30 is available on the SEC's website at www.sec.gov.
Availability of Schedules of Portfolio Investments:
The Trust files a complete list of Schedules of Portfolio Investments with the SEC for the first and third quarters of each fiscal year on Form N-PORT. Prior to the implementation of Form N-PORT, the Trust filed a complete list of Schedules of Portfolio Investments with the SEC for the first and third quarters of each fiscal year on Form N-Q. Forms N-PORT and Forms N-Q are available on the SEC's website at www.sec.gov.
Expense Examples
As a shareholder of the Fund, you may incur two types of costs: (1) transaction costs and (2) ongoing costs, including management fees, distribution and service (12b-1) fees, and other Fund expenses. These examples are intended to help you understand your ongoing costs (in dollars) of investing in the Fund and to compare these costs with the ongoing costs of investing in other mutual funds.
These examples are based on an investment of $1,000 invested at the beginning of the period and held for the entire period from July 1, 2019 through December 31, 2019.
The Actual Expense figures in the table below provide information about actual account values and actual expenses. You may use the information below, together with the amount you invested, to estimate the expenses that you paid over the period. Simply divide your account value by $1,000 (for example, an $8,600 account value divided by $1,000 = 8.6), then multiply the result by the number in the table under the heading entitled "Actual Expenses Paid During Period" to estimate the expenses you paid on your account during this period.
The Hypothetical Expense figures in the table below provide information about hypothetical account values and hypothetical expenses based on the Fund's actual expense ratio and an assumed rate of return of 5% per year before expenses, which is not the Fund's actual return. The hypothetical account values and expenses may not be used to estimate the actual ending account balance or expenses you paid for the period. You may use this information to compare this 5% hypothetical example with the 5% hypothetical examples that appear in shareholder reports of other funds.
Please note the expenses shown in the table are meant to highlight your ongoing costs only and do not reflect any transactional costs. Therefore, the table is useful in comparing ongoing costs only, and will not help you determine the relative total costs of owning different funds. In addition, if these transactional costs were included, your costs would have been higher.
Beginning
Account Value
7/1/19 | | Actual
Ending
Account Value
12/31/19 | | Hypothetical
Ending
Account Value
12/31/19 | | Actual
Expenses Paid
During Period
7/1/19-12/31/19* | | Hypothetical
Expenses Paid
During Period
7/1/19-12/31/19* | | Annualized
Expense Ratio
During Period
7/1/19-12/31/19 | |
| $ | 1,000.00 | | | $ | 1,107.50 | | | $ | 1,023.79 | | | $ | 1.49 | | | $ | 1.43 | | | | 0.28 | % | |
* Expenses are equal to the average account value multiplied by the Fund's annualized expense ratio multiplied by 184/365 (the number of days in the most recent fiscal half-year divided by the number of days in the fiscal year).
37
Victory Variable Insurance Funds | | Supplemental Information — continued
December 31, 2019 | |
(Unaudited)
Additional Federal Income Tax Information
For the year ended December 31, 2019, the Fund paid qualified dividend income for the purposes of reduced individual federal income tax rates of 99%.
Dividends qualified for corporate dividends received deductions of 98%.
For the year ended December 31, 2019, the Fund designated long-term capital gain distributions in the amount of $11,014,334.
38
Victory Variable Insurance Funds | | Supplemental Information — continued
December 31, 2019 | |
(Unaudited)
Considerations of the Board in Continuing the Investment Advisory Agreement (the "Agreement")
The Board approved the Agreement on behalf of the Fund at an in-person meeting, which was called for that purpose, on December 4, 2019. The Board also considered information relating to the Fund and the Agreement provided throughout the year and, more specifically, at a meeting on October 22, 2019. The Board noted that prior to the Fund's reorganization on July 29, 2016, the Fund was managed by RS Investment Management Co. LLC, which was acquired by the Adviser on July 29, 2016. In considering whether to approve the Agreement, the Board requested, and the Adviser provided, information that the Board believed to be reasonably necessary to reach its conclusions.
The Board, including the Independent Trustees, evaluated this information along with other information obtained throughout the year and was advised by legal counsel to the Fund and by independent legal counsel to the Independent Trustees. In addition, in 2017 the Independent Trustees, through their counsel, retained an independent consultant to assist with a review of the overall process for conducting the annual review of these advisory arrangements.
The Board considered the Fund's advisory fee, expense ratio and investment performance as significant factors in determining whether the Agreement should be continued. In considering whether the compensation paid to the Adviser was fair and reasonable, the Board also evaluated, among other things, the following factors:
• The requirements of the Fund for the services provided by the Adviser;
• The nature, quality and extent of the services provided and expected to be provided;
• The performance of the Fund as compared to comparable funds;
• The fees payable for the services and whether the fee arrangements provided for economies of scale that would benefit Fund shareholders as the Fund grows;
• Whether the fee would be sufficient to enable the Adviser to attract and retain experienced personnel and continue to provide quality services to the Fund;
• The fees paid by other clients of the Adviser whose accounts are managed in a similar investment style and any differences in the services provided to the other clients compared to those provided to the Fund;
• The total expenses of the Fund, taking into consideration any distribution or shareholder servicing fees;
• Management's commitment to operating the Fund at competitive expense levels;
• The profitability of the Adviser (as reflected by comparing fees earned against an estimate of the Adviser's costs) with respect to the Adviser's relationship with the Fund;
• Research and other service benefits received by the Adviser obtained through payment of client commissions for securities transactions;
• Other benefits received by the Adviser, and its affiliates, including revenues paid to the Adviser, or its affiliates, by the Fund for administration and fund accounting services, and distribution;
• The capabilities and financial condition of the Adviser;
• Current economic and industry trends; and
• The historical relationship between the Fund and the Adviser.
The Board reviewed the Fund's current management fee, comprised of the advisory fee plus the administrative services fee paid to the Adviser, in the context of the Adviser's profitability with respect to the Fund. In addition, the Board compared the Fund's total operating expense ratio on a net and gross basis, taking into consideration any distribution or shareholder servicing fees and management fees with a universe of comparable mutual funds compiled by an independent consultant and a peer group of funds with similar investment strategies selected by that independent consultant from the universe. The Board reviewed the factors and methodology used by the independent consultant in the selection of the Fund's peer group, including the independent consultant's selection of a broad universe of funds, the more specific universe of comparable funds, and peer groups of funds with comparable investment strategies and asset levels, among other factors. The Board also
39
Victory Variable Insurance Funds | | Supplemental Information — continued
December 31, 2019 | |
(Unaudited)
reviewed any changes to the independent consultant's methodology as compared to the prior year, including those resulting from the Adviser's input, if any. The Board also reviewed fees and other information related to the Adviser's management of similarly managed institutional or private accounts, and the differences in the services provided to the other accounts, to the extent applicable. The Board noted that the advisory fee arrangements for the Fund do not include breakpoints, which are generally viewed as a method by which the investment adviser shares any economies of scale with a fund as a fund grows. The Board also considered the Adviser's commitment to limit expenses as discussed in more detail below, and would consider breakpoints at a future time if the Fund's assets were to grow significantly.
The Board reviewed the Fund's performance over one-, three-, five- and ten-year periods against the performance of the Fund's selected peer group and benchmark index, noting that the Fund's investment objective is to track its benchmark index before fees and expenses. The Board recognized that the performance of the Fund is net of expenses, while the performance of the benchmark index reflects gross returns and as a result, the Fund generally will underperform its benchmark index due to fees and expenses. The Board considered the Fund's tracking error as a factor in evaluating performance. The Board also considered the additional resources that the Adviser has committed to enhance portfolio analysis, compliance and trading systems.
The Board reviewed various other specific factors with respect to the Fund, as described below. In their deliberations, the Trustees did not rank the importance of any particular information or factor considered and each Trustee may have attributed different weights to various factors.
The Board concluded that the Fund's gross annual management fee was reasonable as compared to the median gross management fee charged to the funds in the Fund's peer group. The Board noted that the Fund's net annual expense ratio, taking into account any shareholder servicing or distribution fees, was reasonable as compared to the median expense ratio for the peer group. The Board considered the Adviser's contractual agreement to waive its fees and reimburse expenses for a specified period of time, as described in the Fund's prospectus.
The Board then compared the Fund's performance for the one-, three-, five- and ten-year periods ended June 30, 2019, to that of the median performance of the peer group and benchmark index for the same periods and considered the fact that the Fund underperformed the benchmark index for all of the periods reviewed, and outperformed the peer group median for all of the periods reviewed.
Having considered, among other things: (1) that the Fund's management fee was within the ranges of advisory fees charged to comparable mutual funds; (2) that the Fund's total expense ratio was reasonable; (3) the Adviser's willingness to limit the expenses for a period of time would provide stability to the Fund's expenses during that period; and (4) the performance of the Fund, the Board concluded that the Agreement continued to be in the best interests of the Fund's shareholders.
The Board noted that the Adviser's investment management team replaced the predecessor fund's investment sub-adviser as portfolio managers for the Fund upon completion of the Fund's reorganization.
Conclusion
Based on its review of the information requested and provided, and following extended discussions, the Board determined that the Agreement, on behalf of the Fund, was consistent with the best interests of the Fund and its shareholders, and the Board unanimously approved the Agreement, on behalf of the Fund, for an additional annual period on the basis of the foregoing review and discussions and the following considerations, among others:
• The fairness and reasonableness of the investment advisory fee payable to the Adviser under the Agreement in light of the investment advisory services provided, the costs of these services, the profitability of the Adviser's relationship with the Fund and the comparability of the fee paid to the fees paid by other investment companies;
• The nature, quality and extent of the investment advisory services provided by the Adviser;
40
Victory Variable Insurance Funds | | Supplemental Information — continued
December 31, 2019 | |
(Unaudited)
• The Adviser's entrepreneurial commitment to the management of the Fund and the creation of a broad-based family of funds, which could entail a substantial commitment of the Adviser's resources to the successful operation of the Fund;
• The Adviser's representations regarding its staffing and capabilities to manage the Fund, including the retention of personnel with relevant portfolio management experience;
• The Adviser's efforts to enhance investment results by, among other things, developing quality portfolio management teams; and
• The overall high quality of the personnel, operations, financial condition, investment management capabilities, methodologies and performance of the Adviser.
41
Privacy Policy
Protecting the Privacy of Information
The Trust respects your right to privacy. We also know that you expect us to conduct and process your business in an accurate and efficient manner. To do so, we must collect and maintain certain personal information about you. This is the information we collect from you on applications or other forms, and from the transactions you make with us or third parties. It may include your name, address, social security number, account transactions and balances, and information about investment goals and risk tolerance.
We do not disclose any information about you or about former customers to anyone except as permitted or required by law. Specifically, we may disclose the information we collect to companies that perform services on our behalf, such as the transfer agent that processes shareholder accounts and printers and mailers that assist us in the distribution of investor materials. We may also disclose this information to companies that perform marketing services on our behalf. This allows us to continue to offer you Victory investment products and services that meet your investing needs, and to effect transactions that you request or authorize. These companies will use this information only in connection with the services for which we hired them. They are not permitted to use or share this information for any other purpose.
To protect your personal information internally, we permit access only by authorized employees and maintain physical, electronic and procedural safeguards to guard your personal information.*
* You may have received communications regarding information about privacy policies from other financial institutions which gave you the opportunity to "opt-out" of certain information sharing with companies which are not affiliated with that financial institution. The Trust does not share information with other companies for purposes of marketing solicitations for products other than the Trust. Therefore, the Trust does not provide opt-out options to their shareholders.
Victory Funds
P.O. Box 182593
Columbus, Ohio 43218-2593

Visit our website at: | | Call Victory at: | |
www.vcm.com | | 800-539-FUND (800-539-3863) | |
VVIF-RS-SPIVIP-AR (12/19)

December 31, 2019
Annual Report
Victory Variable Insurance Funds
Victory Sophus Emerging Markets VIP Series
Beginning January 1, 2021, as permitted by regulations adopted by the Securities and Exchange Commission, paper copies of the Fund's shareholder reports may no longer be sent by mail from the insurance company that issued your variable annuity and variable life insurance contract, unless you specifically request paper copies of the reports from your insurance company. Instead, the reports will be made available on www.victoryfunds.com. The insurance company that offers your contract may also make these reports available on a website, and such insurance company will notify you by mail each time a report is posted and provide you with a website link to access the report.
If you already elected to receive shareholder reports electronically, you will not be affected by this change and you need not take any action. You may elect to receive shareholder reports and other communications from the insurance company electronically by following the instructions provided by the insurance company.
If offered by your insurance company, you may elect to receive all future reports in paper and free of charge from the insurance company. You can inform your insurance company that you wish to continue receiving paper copies of your reports. Your election to receive reports in paper will apply to all funds available under your contract.
www.vcm.com
News, Information And Education 24 Hours A Day, 7 Days A Week
The Victory Funds site gives fund shareholders, prospective shareholders, and investment professionals a convenient way to access fund information, get guidance, and track fund performance anywhere they can access the Internet. The site includes:
• Detailed performance records
• Daily share prices
• The latest fund news
• Investment resources to help you become a better investor
• A section dedicated to investment professionals
Whether you're a potential investor searching for the fund that matches your investment philosophy, a seasoned investor interested in planning tools, or an investment professional, www.vcm.com has what you seek. Visit us anytime. We're always open.
Victory Variable Insurance Funds
Table of Contents
Shareholder Letter (Unaudited) | | | 3 | | |
Fund Review and Commentary (Unaudited) | | | 5 | | |
Financial Statements | |
Schedule of Portfolio Investments | | | 9 | | |
Statement of Assets and Liabilities | | | 16 | | |
Statement of Operations | | | 17 | | |
Statements of Changes in Net Assets | | | 18 | | |
Financial Highlights | | | 20 | | |
Notes to Financial Statements | | | 22 | | |
Report of Independent Registered Public
Accounting Firm | | | 31 | | |
Supplemental Information (Unaudited) | |
Trustee and Officer Information | | | 32 | | |
Proxy Voting and Portfolio Holdings Information | | | 35 | | |
Expense Examples | | | 35 | | |
Additional Federal Income Tax Information | | | 36 | | |
Advisory Contract Renewal | | | 37 | | |
Privacy Policy (inside back cover) | | | |
The Fund is distributed by Victory Capital Advisers, Inc. Victory Capital Management Inc. is the investment adviser to the Fund and receives fees from the Fund for performing services for the Fund.
This report is not authorized for distribution to prospective investors unless preceded or accompanied by a current prospectus of the Fund.
For additional information about any Victory Fund, including fees, expenses, and risks, view our prospectus online at www.vcm.com or call 800-539-3863. Read it carefully before you invest or send money.
The information in this annual report is based on data obtained from recognized services and sources and is believed to be reliable. Any opinions, projections, or recommendations in this report are subject to change without notice and are not intended as individual investment advice. Past investment performance of the Fund, markets or securities mentioned herein should not be considered to be indicative of future results.
• NOT FDIC INSURED • NO BANK GUARANTEE
• MAY LOSE VALUE

Call Victory at:
800-539-FUND (800-539-3863)
Visit our website at:
www.vcm.com
1
This page is intentionally left blank.
2
Victory Funds Letter to Shareholders
(Unaudited)
Dear Shareholder,
As we turn the page into a new decade, it's hard not to reflect on the fact that we have been enjoying the longest-ever bull market in U.S. equities. The run has been impressive, and despite periods of tumult and plenty of negative news, the bull market endured throughout 2019.
For the annual reporting period ended December 31, 2019, the S&P 500® Index posted impressive gains of 31.49%. This represents the greatest one-year gain since 2013 and also illustrates a swift bounce-back after a precipitous drop late in 2018. The move higher supports the notion that underlying fundamentals of U.S. companies drive performance, rather than the political rancor and headline fears that often capture the attention of investors.
Perhaps we shouldn't be surprised at the impressive performance of equities. The U.S. economy — the world's largest — remains on solid footing and has been a key driver of both domestic and international stocks. Robust job creation, near-record low unemployment, and steady consumer spending continue and offer reasons for further optimism. Meanwhile, inflation remains muted, and the Federal Reserve (the Fed) and other major global central banks have taken an accommodative stance. In fact, the Fed has cut interest rates by a total of 0.75% over three meetings last July, September and October.
The risk-on attitudes of investors, coupled with the accommodative monetary policy, had an expected impact on U.S. Treasury yields. The 10-year Treasury yield declined significantly over the course of 2019, falling from 2.66% to 1.92% at year-end. More interesting, however, was the fact that, the yield on 10-year Treasurys fell below shorter-term yields for the first time since before the 2007-2008 Global Financial Crisis. This inverted yield curve spooked investors for a spell, only to revert back to a traditional upward sloping yield curve by the end of the year.
The robust domestic economy, low interest rates, and ample liquidity from central banks provided a potent tonic for the stock market in 2019. In fact, at year-end 2019, the S&P 500® Index was approaching its highest valuation level since 1999. This reminds all of us to retain some historical context on the bull market. Many of us remember the Global Financial Crisis and, before that, the collapse of the dot-com bubble. Although those are now but a distant memory (and we are not forecasting such tumult), we should not forget that stocks don't always go up and cycles don't last forever. In other words, valuations still matter.
The key point is not to discount the risks. In addition to lofty valuations, investors need to keep apprised of trade disputes, geopolitical hotspots, a contentious U.S. election, and a host of other potential headwinds. Yet it is these very risks — these cross-currents — that may create pricing dislocations. This is an environment in which we believe our Victory Capital independent investment franchises can thrive.
On the following pages, you will find information relating to your Victory Funds investment. If you have any questions, we encourage you to contact your financial
3
advisor. Or, if you invest with us directly, you may call (800) 539-3863, or visit our website at www.vcm.com.
My colleagues and I sincerely appreciate the confidence you have placed in the Victory Funds, and we value the opportunity to help meet your investment goals.

Christopher K. Dyer, CFA
President,
Victory Funds
4
Victory Variable Insurance Funds (Unaudited)
Victory Sophus Emerging Markets VIP Series
Portfolio Holdings
As a Percentage of Total Investments
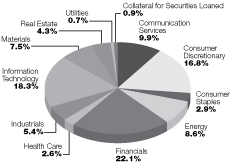
Performance Update
For the year ended December 31, 2019, Victory Sophus Emerging Market VIP Series (the "Fund") had a total return of 23.13% versus the MSCI Emerging Market Index (the "Index"), the Fund's benchmark, which had a return of 18.42%.
Commentary
The Fund seeks to provide long-term capital appreciation. The Fund outperformed the Index for the year ended December 31, 2019. Sophus Capital employs a disciplined, bottom-up approach utilizing both quantitative and fundamental processes to invest in businesses that we believe have superior and sustainable earnings growth at attractive valuations, with revisions as the catalyst. By investing in companies with these characteristics, coupled with our risk-managed approach, we seek to provide a more consistent return pattern over time.
Market Overview
Emerging markets rose strongly in the first quarter, scaling 9.6%, but lost track subsequently, declining over the next two quarters as investor risk appetite was marred by the escalation of trade tensions. However, emerging markets sprung back to life in the last quarter over positive developments on the trade front along with global monetary easing. In a risk-on sentiment fueled by a more dovish U.S. Federal Reserve (the "Fed"), emerging markets rallied 8.76% in January 2019. The rally was similar to that seen a year prior in January of 2018, but the reasons were quite dissimilar as markets were giddy last year from a synchronized growth narrative. At the beginning of the second quarter, investor sentiment remained upbeat on signs of a global growth recovery, building on the momentum seen in the first quarter. The U.S. dollar rose against all the major currencies, encouraged by renewed economic divergence. Commodities saw strong gains, led by a rally on oil as supply concerns intensified following the United States' decision to end waivers on Iranian oil imports. However, the re-escalation of the U.S./China trade war put investors in a risk-off mode which, along with soft economic data in both China and the United States, heightened concerns of a global growth slowdown, raising uncertainty across global markets. Adding to the skittishness of the markets, mid-quarter, President Trump threatened to raise tariffs on Mexico as the administration sought Mexico's attention to help constrain the flood of illegal migrants into the United States. Fortunately, this was short-lived as an agreement between Mexico and the United States was reached shortly thereafter. Emerging markets ended the second quarter on a strong note, led by a more dovish Fed and optimism for fresh trade talks between the United States and China. The interest rate cut expectations in the United States pushed the U.S. dollar lower and the yield on the 10-year U.S. Treasury bond to 2.00%, its lowest level since November of 2016.
At mid-year, the situation would soon change as these conditions could not quell investor fears of a slowdown in global growth, helping to push the U.S. dollar higher and weighing on
5
Victory Variable Insurance Funds (Unaudited)
Victory Sophus Emerging Markets VIP Series (continued)
emerging markets equity securities. During the third quarter of 2019, emerging markets declined as markets responded to a re-escalation of the trade war. Furthermore. the United States designated China as a currency manipulator. This back-and-forth between the United States and China fueled global growth concerns leading to a risk-off sentiment in the markets. Mid-quarter, sentiment improved a bit as the United States agreed to delay tariffs on certain products and both countries agreed to go back to the table.
Emerging markets continued to advance during the beginning of the fourth quarter, and on October 11, 2019, it was announced that "Phase 1" of a trade deal was agreed to in principle. Mid-October, the Fed cut rates by 25 basis points, as expected, and announced they would expand their balance sheet. This all helped push the U.S. dollar down. A growing optimism on the Phase 1 trade deal and steepening U.S. yield curve provided fuel to the risk-on trade and pushed out fears of a recession. The year finished on a high note with market "giddiness" fueled by the "finalization" of a Phase 1 U.S./China trade agreement, and the United States indefinitely delaying new tariffs that were set to go into effect on December 15, 2019. Furthermore, elections in the United Kingdom appeared to put Brexit on a more certain path, while global macro indicators provided a rosier outlook for global growth.
Portfolio Review
By sectors, the largest contributor to performance was stock selection in communication services. The largest detractor from relative performance was stock selection in consumer staples. By country, the largest contributor was stock selection in China. The largest detractor was stock selection in Russia.
Outlook
The continued strength of the mighty dollar is now in question, thanks to the regionalization of trade, economic growth, and in all likelihood political influence. We believe that the weaker dollar will benefit emerging markets economies and markets in 2020. Further, we see the growth differential between emerging markets and the developed markets widening again, and we believe emerging markets earnings likely will grow at twice the rate of developed markets earnings.
The global economy is expected to grow by 3.4%, according to the World Bank. Emerging economies are forecast to grow by 4.6% versus 1.7% for developed economies — the main contributors being China, India, and Brazil. Trade volume is expected to pick up again to 3.2% globally (from 1.2% in 2019), led by emerging market economies. Emerging markets have suffered from a perception that its growth is mostly commodity driven. While this has been true at times in the past, the emerging markets today is more technology and communication services driven, as it was at the turn of the century. Consumption and financial intermediation (credit growth) also are poorly understood elements, but are expected to be major contributors to growth.
Consensus estimates are for 15-17% earnings growth in emerging markets in 2020, driven by 1) Technology, 2) Financials, and 3) Consumer Discretionary sectors. Within technology, the memory cycle has turned, and we see DRAM or dynamic random-access memory and NAND flash memory prices recouping lost ground. Processing capacity — thanks to the Internet of Things, artificial intelligence, and machine learning — is expected to push the hardware cycle to new heights. While interest rates remain low and bank appetite for lending
6
Victory Variable Insurance Funds (Unaudited)
has been subdued, the extended growth cycle requires capital investment, in lagging economies like Brazil, Poland, Turkey, and parts of the Persian Gulf. Consumption is now a global theme, and the combination of cheap credit, worldwide campaigns, and coordinated technological shifts (5G, for example) are pushing ever more activity into services and purchasing across the emerging markets space.
Growth and quality investment styles outperformed in 2019, while value styles lagged. We do not see any changes in 2020, as the world remains starved for growth in the post-financial-crisis economy. We look to capture sustainable growth with positive catalysts. The emerging markets universe is dynamic, exciting, and differentiated. We invest across all market caps, knowing that the inefficiencies, which are inherent in this asset class, are most powerful in smaller countries, companies, or out-of-favor segments.
In anticipation of a weaker U.S. dollar, accelerating emerging markets growth, rising earnings, and attractive valuations, we expect another positive year for emerging markets equity securities.
7
Victory Variable Insurance Funds (Unaudited)
Victory Sophus Emerging Markets VIP Series (continued)
Average Annual Total Return
Year Ended December 31, 2019
| | Class I | | | |
Inception Date | | 10/17/94 | | | |
| | Net Asset
Value | | MSCI Emerging Markets
Index1 | |
One Year | | | 23.13 | % | | | 18.42 | % | |
Three Year | | | 12.55 | % | | | 11.57 | % | |
Five Year | | | 6.78 | % | | | 5.61 | % | |
Ten Year | | | 3.27 | % | | | 3.68 | % | |
Since Inception | | | 7.55 | % | | | N/A | | |
Expense Ratios
Gross | | | 1.33 | % | |
With Applicable Waivers | | | 1.33 | % | |
Past performance is not indicative of future results. The performance data quoted represents past performance and current returns may be lower or higher. The investment return and principal value will fluctuate so that an investor's shares, when redeemed, may be worth more or less than the original cost. To obtain performance information current to the most recent month's end, please visit www.vcm.com.
The above expense ratios are from the Fund's prospectus dated May 1, 2019. Additional information pertaining to the Fund's expense ratios as of December 31, 2019 can be found in the financial highlights.
The total return figures set forth above include all waivers of fees for various periods since inception. Without such fee waivers, the total returns would have been lower. Some fee waivers are voluntary and may be modified or terminated at any time. The total returns do not include any insurance, sales or administrative charges of variable annuity or life insurance contracts. If these charges were included, the total returns would have been lower.
Victory Sophus Emerging Markets VIP Series — Growth of $10,000
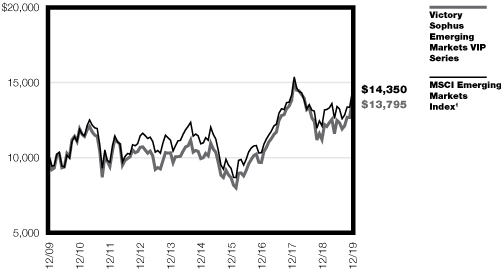
1The MSCI Emerging Markets Index is a free float-adjusted market capitalization index that is designed to measure equity performance of emerging markets. The index reflects the reinvestment of dividends paid on the stocks constituting the index net of withholding taxes. You may not invest in the index and, unlike the Fund, the index does not incur fees or expenses. It is not possible to invest directly in an index.
The graph reflects investment of growth of a hypothetical $10,000 investment in the Fund. Past performance is no guarantee of future results.
The graph and table do not reflect the deduction of taxes that a shareholder would pay on Fund distributions or the redemption of Fund shares.
8
Victory Variable Insurance Funds
Victory Sophus Emerging Markets VIP Series | | Schedule of Portfolio Investments
December 31, 2019 | |
Security Description | | Shares | | Value | |
Common Stocks (97.9%) | |
Brazil (8.9%): | |
Consumer Discretionary (1.5%): | |
Cyrela Brazil Realty SA Empreendimentos e Participacoes | | | 39,300 | | | $ | 292,273 | | |
Grupo SBF SA (a) | | | 42,300 | | | | 371,610 | | |
| | | | 663,883 | | |
Energy (1.2%): | |
Petroleo Brasileiro SA, ADR | | | 32,369 | | | | 515,962 | | |
Financials (2.7%): | |
Banco Bradesco SA, ADR | | | 67,797 | | | | 606,783 | | |
Banco do Brasil SA | | | 46,100 | | | | 608,558 | | |
| | | | 1,215,341 | | |
Health Care (0.9%): | |
Qualicorp Consultoria e Corretora de Seguros SA | | | 42,300 | | | | 391,621 | | |
Industrials (0.9%): | |
Companhia de Locacao das Americas | | | 61,200 | | | | 346,729 | | |
JSL SA | | | 7,800 | | | | 52,146 | | |
| | | | 398,875 | | |
Real Estate (1.0%): | |
Aliansce Sonae Shopping Centers SA (a) | | | 37,592 | | | | 469,781 | | |
Utilities (0.7%): | |
Neoenergia SA | | | 53,300 | | | | 330,779 | | |
| | | | 3,986,242 | | |
Chile (0.1%): | |
Financials (0.1%): | |
Banco de Credito e Inversiones SA | | | 1,208 | | | | 54,791 | | |
China (30.3%): | |
Communication Services (6.2%): | |
Momo, Inc., ADR | | | 5,626 | | | | 188,471 | | |
Tencent Holdings Ltd. | | | 48,330 | | | | 2,328,503 | | |
Wuhu Sanqi Interactive Entertainment Network Technology Group
Co. Ltd., Class A | | | 60,000 | | | | 232,298 | | |
| | | | 2,749,272 | | |
Consumer Discretionary (10.3%): | |
Alibaba Group Holding Ltd., ADR (a) | | | 13,675 | | | | 2,900,467 | | |
Gree Electric Appliances, Inc. of Zhuhai, Class A | | | 28,700 | | | | 270,662 | | |
Huayu Automotive Systems Co. Ltd., Class A | | | 61,300 | | | | 228,923 | | |
JD.com, Inc., ADR (a) | | | 12,311 | | | | 433,717 | | |
New Oriental Education & Technology Group, Inc., ADR (a) | | | 2,476 | | | | 300,215 | | |
Tongcheng-Elong Holdings Ltd. (a) | | | 130,400 | | | | 234,066 | | |
Topsports International Holdings Ltd. (b) | | | 167,829 | | | | 202,899 | | |
| | | | 4,570,949 | | |
See notes to financial statements.
9
Victory Variable Insurance Funds
Victory Sophus Emerging Markets VIP Series | | Schedule of Portfolio Investments — continued
December 31, 2019 | |
Security Description | | Shares | | Value | |
Consumer Staples (1.4%): | |
China Mengniu Dairy Co. Ltd. | | | 94,000 | | | $ | 380,263 | | |
Wuliangye Yibin Co. Ltd., Class A | | | 13,900 | | | | 266,011 | | |
| | | | 646,274 | | |
Energy (1.1%): | |
China Oilfield Services Ltd., Class H | | | 312,000 | | | | 489,877 | | |
Financials (5.8%): | |
China Construction Bank Corp., Class H | | | 1,005,638 | | | | 871,987 | | |
China Galaxy Securities Co. Ltd. (c) | | | 672,000 | | | | 395,901 | | |
China Merchants Bank Co. Ltd., Class H | | | 76,000 | | | | 390,751 | | |
Ping An Insurance Group Co. of China Ltd. | | | 76,500 | | | | 905,318 | | |
| | | | 2,563,957 | | |
Industrials (0.8%): | |
Zoomlion Heavy Industry Science and Technology Co. Ltd., Class H | | | 447,000 | | | | 374,719 | | |
Information Technology (1.7%): | |
Beijing Sinnet Technology Co. Ltd., Class A | | | 107,900 | | | | 311,200 | | |
Kingdee International Software Group Co. Ltd. | | | 166,000 | | | | 166,084 | | |
Venustech Group, Inc., Class A | | | 57,000 | | | | 276,926 | | |
| | | | 754,210 | | |
Materials (1.6%): | |
Anhui Conch Cement Co. Ltd., Class H | | | 62,500 | | | | 455,412 | | |
Hengli Petrochemical Co. Ltd., Class A | | | 122,100 | | | | 282,507 | | |
| | | | 737,919 | | |
Real Estate (1.4%): | |
China SCE Group Holdings Ltd. | | | 454,000 | | | | 264,465 | | |
Sunac China Holdings Ltd. | | | 58,000 | | | | 346,284 | | |
| | | | 610,749 | | |
| | | | 13,497,926 | | |
Cyprus (0.7%): | |
Financials (0.7%): | |
TCS Group Holding PLC, GDR | | | 13,960 | | | | 300,553 | | |
Greece (1.0%): | |
Communication Services (0.7%): | |
Hellenic Telecommunications Organization SA | | | 19,292 | | | | 308,774 | | |
Industrials (0.3%): | |
Mytilineos Holdings SA | | | 14,765 | | | | 162,151 | | |
| | | | 470,925 | | |
Hong Kong (3.7%): | |
Energy (0.8%): | |
Kunlun Energy Co. Ltd. | | | 388,000 | | | | 342,797 | | |
Health Care (1.0%): | |
CSPC Pharmaceutical Group Ltd. | | | 188,000 | | | | 448,672 | | |
See notes to financial statements.
10
Victory Variable Insurance Funds
Victory Sophus Emerging Markets VIP Series | | Schedule of Portfolio Investments — continued
December 31, 2019 | |
Security Description | | Shares | | Value | |
Information Technology (0.7%): | |
Kingboard Laminates Holdings Ltd. | | | 252,000 | | | $ | 312,390 | | |
Real Estate (1.2%): | |
Shimao Property Holdings Ltd. | | | 136,000 | | | | 527,086 | | |
| | | | 1,630,945 | | |
India (7.8%): | |
Consumer Discretionary (0.7%): | |
Aditya Birla Fashion And Retail Ltd. (a) | | | 54,722 | | | | 177,739 | | |
The Indian Hotels Co. Ltd. | | | 70,068 | | | | 142,393 | | |
| | | | 320,132 | | |
Energy (2.1%): | |
Petronet LNG Ltd. | | | 62,053 | | | | 233,047 | | |
Reliance Industries Ltd. | | | 31,982 | | | | 678,478 | | |
| | | | 911,525 | | |
Financials (2.6%): | |
Axis Bank Ltd. | | | 32,820 | | | | 346,973 | | |
Cholamandalam Investment and Finance Co. Ltd. | | | 59,750 | | | | 255,796 | | |
Housing Development Finance Corp. Ltd. | | | 16,484 | | | | 557,424 | | |
| | | | 1,160,193 | | |
Information Technology (1.0%): | |
HCL Technologies Ltd. | | | 27,070 | | | | 215,517 | | |
Infosys Technologies Ltd., ADR | | | 23,445 | | | | 241,952 | | |
| | | | 457,469 | | |
Materials (1.4%): | |
Berger Paints India Ltd. | | | 27,028 | | | | 195,282 | | |
UltraTech Cement Ltd. | | | 4,444 | | | | 252,022 | | |
UPL Ltd. | | | 23,544 | | | | 192,790 | | |
| | | | 640,094 | | |
| | | | 3,489,413 | | |
Indonesia (1.8%): | |
Financials (0.8%): | |
PT Bank Negara Indonesia (Persero) Tbk | | | 587,100 | | | | 331,487 | | |
Industrials (0.5%): | |
PT Wijaya Karya (Persero) Tbk | | | 1,589,800 | | | | 227,366 | | |
Materials (0.5%): | |
PT Indocement Tunggal Prakarsa Tbk | | | 169,100 | | | | 231,325 | | |
| | | | 790,178 | | |
Korea, Republic Of (13.8%): | |
Communication Services (0.4%): | |
Innocean Worldwide, Inc. | | | 2,846 | | | | 174,635 | | |
See notes to financial statements.
11
Victory Variable Insurance Funds
Victory Sophus Emerging Markets VIP Series | | Schedule of Portfolio Investments — continued
December 31, 2019 | |
Security Description | | Shares | | Value | |
Consumer Discretionary (1.7%): | |
Fila Korea Ltd. | | | 3,633 | | | $ | 166,027 | | |
Hyundai Mobis Co. Ltd. | | | 1,843 | | | | 407,799 | | |
Kia Motors Corp. | | | 4,530 | | | | 173,026 | | |
| | | | 746,852 | | |
Consumer Staples (0.4%): | |
NeoPharm Co. Ltd. | | | 4,500 | | | | 188,013 | | |
Energy (0.8%): | |
SK Innovation Co. Ltd. | | | 2,613 | | | | 338,211 | | |
Financials (0.6%): | |
Hana Financial Group, Inc. | | | 8,687 | | | | 276,352 | | |
Health Care (0.7%): | |
Hanmi Pharm Co. Ltd. (a) | | | 1,271 | | | | 324,903 | | |
Industrials (0.6%): | |
Samsung Engineering Co. Ltd. (a) | | | 16,175 | | | | 267,346 | | |
Information Technology (8.0%): | |
Douzone Bizon Co. Ltd. | | | 3,769 | | | | 263,509 | | |
Samsung Electro-Mechanics Co. Ltd. | | | 5,967 | | | | 641,901 | | |
Samsung Electronics Co. Ltd. | | | 38,680 | | | | 1,864,110 | | |
SK Hynix, Inc. | | | 9,770 | | | | 794,773 | | |
| | | | 3,564,293 | | |
Materials (0.6%): | |
Ssangyong Cement Industrial Co. Ltd. | | | 54,997 | | | | 269,434 | | |
| | | | 6,150,039 | | |
Mexico (1.9%): | |
Consumer Discretionary (0.5%): | |
Alsea SAB de CV (a) | | | 78,887 | | | | 207,951 | | |
Financials (0.4%): | |
Gentera SAB de CV | | | 188,644 | | | | 194,300 | | |
Industrials (0.4%): | |
Controladora Vuela Cia de Aviacion SAB de CV, ADR (a) | | | 18,743 | | | | 195,302 | | |
Real Estate (0.6%): | |
Corp Inmobiliaria Vesta SAB de CV | | | 140,165 | | | | 252,106 | | |
| | | | 849,659 | | |
Peru (0.9%): | |
Financials (0.9%): | |
Credicorp Ltd. | | | 1,960 | | | | 417,735 | | |
Philippines (1.4%): | |
Financials (1.4%): | |
BDO Unibank, Inc. | | | 125,670 | | | | 391,827 | | |
Metropolitan Bank & Trust Co. | | | 165,000 | | | | 215,924 | | |
| | | | 607,751 | | |
See notes to financial statements.
12
Victory Variable Insurance Funds
Victory Sophus Emerging Markets VIP Series | | Schedule of Portfolio Investments — continued
December 31, 2019 | |
Security Description | | Shares | | Value | |
Poland (1.3%): | |
Communication Services (0.8%): | |
CD Projekt SA | | | 4,934 | | | $ | 363,976 | | |
Energy (0.5%): | |
Grupa Lotos SA | | | 9,573 | | | | 211,251 | | |
| | | | 575,227 | | |
Russian Federation (3.4%): | |
Energy (1.7%): | |
LUKOIL PJSC, ADR | | | 7,577 | | | | 754,719 | | |
Financials (0.9%): | |
Sberbank of Russia PJSC | | | 25,259 | | | | 416,129 | | |
Materials (0.8%): | |
MMC Norilsk Nickel PJSC, ADR | | | 10,906 | | | | 332,524 | | |
| | | | 1,503,372 | | |
Saudi Arabia (1.4%): | |
Consumer Discretionary (0.7%): | |
Jarir Marketing Co. | | | 4,009 | | | | 177,011 | | |
Leejam Sports Co. JSC | | | 6,521 | | | | 140,917 | | |
| | | | 317,928 | | |
Financials (0.7%): | |
Arab National Bank | | | 40,056 | | | | 292,441 | | |
| | | | 610,369 | | |
South Africa (4.0%): | |
Communication Services (0.9%): | |
Naspers Ltd. | | | 2,492 | | | | 408,027 | | |
Consumer Staples (0.7%): | |
The SPAR Group Ltd. | | | 21,040 | | | | 297,392 | | |
Financials (1.5%): | |
Liberty Holdings Ltd. | | | 50,222 | | | | 397,282 | | |
Nedbank Group Ltd. | | | 18,875 | | | | 289,165 | | |
| | | | 686,447 | | |
Materials (0.9%): | |
AngloGold Ashanti Ltd. | | | 17,669 | | | | 401,581 | | |
| | | | 1,793,447 | | |
Taiwan (10.4%): | |
Consumer Discretionary (0.6%): | |
Giant Manufacturing Co. Ltd. | | | 36,000 | | | | 256,290 | | |
Financials (2.3%): | |
Chailease Holding Co. Ltd. | | | 64,890 | | | | 299,152 | | |
Fubon Financial Holding Co. Ltd. | | | 199,000 | | | | 308,199 | | |
Yuanta Financial Holding Co. Ltd. | | | 649,000 | | | | 437,551 | | |
| | | | 1,044,902 | | |
See notes to financial statements.
13
Victory Variable Insurance Funds
Victory Sophus Emerging Markets VIP Series | | Schedule of Portfolio Investments — continued
December 31, 2019 | |
Security Description | | Shares | | Value | |
Industrials (0.6%): | |
Far Eastern New Century Corp. | | | 283,000 | | | $ | 281,876 | | |
Information Technology (6.9%): | |
Globalwafers Co. Ltd. | | | 50,000 | | | | 640,363 | | |
Taiwan Semiconductor Manufacturing Co. Ltd. | | | 177,259 | | | | 1,962,003 | | |
Walsin Technology Corp. | | | 56,000 | | | | 447,031 | | |
| | | | 3,049,397 | | |
| | | | 4,632,465 | | |
Thailand (3.2%): | |
Communication Services (0.9%): | |
Advanced Info Service PCL | | | 28,500 | | | | 202,397 | | |
Plan B Media Public Co. Ltd. | | | 817,300 | | | | 207,147 | | |
| | | | 409,544 | | |
Consumer Discretionary (0.3%): | |
Com7 PCL (c) | | | 132,800 | | | | 117,366 | | |
Consumer Staples (0.3%): | |
| CP ALL PCL | | | 59,600 | | | | 143,627 | | |
Financials (0.6%): | |
Siam Commercial Bank PCL | | | 64,600 | | | | 262,723 | | |
Industrials (0.5%): | |
Gunkul Engineering PCL | | | 2,209,800 | | | | 219,700 | | |
Materials (0.6%): | |
Tipco Asphalt PCL | | | 367,300 | | | | 259,658 | | |
| | | | 1,412,618 | | |
Turkey (0.9%): | |
Consumer Discretionary (0.5%): | |
Tofas Turk Otomobil Fabrikasi AS | | | 49,435 | | | | 223,417 | | |
Yatas Yatak ve Yorgan Sanayi ve Ticaret AS (a) | | | — | | | | 1 | | |
| | | | 223,418 | | |
Energy (0.4%): | |
Tupras Turkiye Petrol Rafinerileri AS | | | 7,743 | | | | 165,259 | | |
| | | | 388,677 | | |
United Kingdom (1.1%): | |
Materials (1.1%): | |
Anglo American PLC | | | 7,082 | | | | 203,420 | | |
Antofagasta PLC | | | 22,814 | | | | 276,184 | | |
| | | | 479,604 | | |
Total Common Stocks (Cost $33,827,065) | | | 43,641,936 | | |
See notes to financial statements.
14
Victory Variable Insurance Funds
Victory Sophus Emerging Markets VIP Series | | Schedule of Portfolio Investments — continued
December 31, 2019 | |
Security Description | | Shares | | Value | |
Preferred Stocks (0.7%) | |
Brazil (0.7%): | |
Industrials (0.7%): | |
Randon SA Implementos e Participacoes | | | 97,600 | | | $ | 326,339 | | |
Total Preferred Stocks (Cost $196,696) | | | 326,339 | | |
Collateral for Securities Loaned^ (0.9%) | |
United States (0.9%): | |
BlackRock Liquidity Funds TempFund Portfolio, Institutional Class, 1.75% (d) | | | 18,522 | | | | 18,522 | | |
Fidelity Investments Money Market Government Portfolio, Class I, 1.54% (d) | | | 102,041 | | | | 102,041 | | |
Fidelity Investments Prime Money Market Portfolio, Class I, 1.75% (d) | | | 3,094 | | | | 3,094 | | |
Goldman Sachs Financial Square Prime Obligations Fund,
Institutional Class, 1.80% (d) | | | 61,643 | | | | 61,643 | | |
JPMorgan Prime Money Market Fund, Capital Class, 1.73% (d) | | | 67,812 | | | | 67,812 | | |
Morgan Stanley Institutional Liquidity Prime Portfolio,
Institutional Class, 1.76% (d) | | | 135,620 | | | | 135,620 | | |
Total Collateral for Securities Loaned (Cost $388,732) | | | 388,732 | | |
Total Investments (Cost $34,412,493) — 99.5% | | | 44,357,007 | | |
Other assets in excess of liabilities — 0.5% | | | 213,945 | | |
NET ASSETS — 100.00% | | $ | 44,570,952 | | |
^ Purchased with cash collateral from securities on loan.
(a) Non-income producing security.
(b) Rule 144A security or other security that is restricted as to resale to institutional investors. The Fund's Adviser has deemed this security to be liquid based upon procedures approved by the Board of Trustees. As of December 31, 2019, the fair value of these securities was $202,899 and amounted to 0.5% of net assets.
(c) All or a portion of this security is on loan.
(d) Rate disclosed is the daily yield on December 31, 2019.
ADR — American Depositary Receipt
GDR — Global Depositary Receipt
PCL — Public Company Limited
PLC — Public Limited Company
See notes to financial statements.
15
Victory Variable Insurance Funds | | Statement of Assets and Liabilities
December 31, 2019 | |
| | | Victory
Sophus Emerging
Markets VIP
Series | |
ASSETS: | |
Investments, at value (Cost $34,412,493) | | $ | 44,357,007 | (a) | |
Foreign currency, at value (Cost $70,484) | | | 70,561 | | |
Cash and cash equivalents | | | 453,193 | | |
Interest and dividends receivable | | | 144,795 | | |
Receivable for capital shares issued | | | 20,779 | | |
Receivable for investments sold | | | 56,607 | | |
Reclaims receivable | | | 521 | | |
Receivable from Adviser | | | 12,056 | | |
Prepaid expenses | | | 2,728 | | |
Total Assets | | | 45,118,247 | | |
LIABILITIES: | |
Payables: | |
Collateral received on loaned securities | | | 388,732 | | |
Investments purchased | | | 18,890 | | |
Capital shares redeemed | | | 50,019 | | |
Accrued foreign capital gains taxes | | | 13,213 | | |
Accrued expenses and other payables: | |
Investment advisory fees | | | 36,512 | | |
Administration fees | | | 2,073 | | |
Custodian fees | | | 11,782 | | |
Transfer agent fees | | | 44 | | |
Compliance fees | | | 28 | | |
Trustees' fees | | | 87 | | |
Other accrued expenses | | | 25,915 | | |
Total Liabilities | | | 547,295 | | |
NET ASSETS: | |
Capital | | | 33,674,227 | | |
Total distributable earnings/(loss) | | | 10,896,725 | | |
Net Assets | | $ | 44,570,952 | | |
Shares (unlimited shares authorized with a par value of
$0.001 per share): | | | 2,833,404 | | |
Net asset value: | | $ | 15.73 | | |
(a) Includes $369,336 of securities on loan.
See notes to financial statements.
16
Victory Variable Insurance Funds | | Statement of Operations
For the Year Ended December 31, 2019 | |
| | | Victory
Sophus Emerging
Markets VIP
Series | |
Investment Income: | |
Cash dividends | | $ | 1,257,581 | | |
Non-cash dividends | | | 258,010 | | |
Interest | | | 5,711 | | |
Securities lending (net of fees) | | | 15,673 | | |
Foreign tax withholding | | | (119,604 | ) | |
Total Income | | | 1,417,371 | | |
Expenses: | |
Investment advisory fees | | | 432,613 | | |
Administration fees | | | 26,468 | | |
Custodian fees | | | 71,754 | | |
Transfer agent fees | | | 282 | | |
Trustees' fees | | | 4,906 | | |
Compliance fees | | | 279 | | |
Legal and audit fees | | | 25,824 | | |
Interfund lending fees | | | 12 | | |
Other expenses | | | 44,884 | | |
Total Expenses | | | 607,022 | | |
Expenses waived/reimbursed by Adviser | | | (22,632 | ) | |
Net Expenses | | | 584,390 | | |
Net Investment Income (Loss) | | | 832,981 | | |
Realized/Unrealized Gains (Losses) from Investments: | |
Net realized gains (losses) from investment securities and foreign
currency translations | | | 361,239 | | |
Foreign taxes on realized gains | | | (6,290 | ) | |
Net change in unrealized appreciation/depreciation on investment securities and
foreign currency translations | | | 7,850,865 | | |
Net change in accrued foreign taxes on unrealized gains | | | (4,529 | ) | |
Net realized/unrealized gains on investments | | | 8,201,285 | | |
Change in net assets resulting from operations | | $ | 9,034,266 | | |
See notes to financial statements.
17
Victory Variable Insurance Funds | | Statements of Changes in Net Assets | |
| | | Victory Sophus Emerging
Markets VIP Series | |
| | | Year
Ended
December 31,
2019 | | Year
Ended
December 31,
2018 | |
From Investment Activities: | |
Operations: | |
Net investment income (loss) | | $ | 832,981 | | | $ | 617,718 | | |
Net realized gains (losses) from investments | | | 354,949 | | | | 1,957,167 | | |
Net change in unrealized appreciation/depreciation
on investments | | | 7,846,336 | | | | (12,921,981 | ) | |
Change in net assets resulting from operations | | | 9,034,266 | | | | (10,347,096 | ) | |
Change in net assets resulting from distributions to shareholders | | | (2,706,474 | ) | | | (4,578,069 | ) | |
Change in net assets resulting from capital transactions | | | (4,141,635 | ) | | | (5,239,557 | ) | |
Change in net assets | | | 2,186,157 | | | | (20,164,722 | ) | |
Net Assets: | |
Beginning of period | | | 42,384,795 | | | | 62,549,517 | | |
End of period | | $ | 44,570,952 | | | $ | 42,384,795 | | |
Capital Transactions: | |
Proceeds from shares issued | | $ | 1,667,106 | | | $ | 3,506,148 | | |
Distributions reinvested | | | 2,706,474 | | | | 4,578,069 | | |
Cost of shares redeemed | | | (8,515,215 | ) | | | (13,323,774 | ) | |
Change in net assets resulting from capital transactions | | $ | (4,141,635 | ) | | $ | (5,239,557 | ) | |
Share Transactions: | |
Issued | | | 111,672 | | | | 186,585 | | |
Reinvested | | | 174,181 | | | | 338,686 | | |
Redeemed | | | (571,160 | ) | | | (735,217 | ) | |
Change in Shares | | | (285,307 | ) | | | (209,946 | ) | |
See notes to financial statements.
18
This page is intentionally left blank.
19
Victory Variable Insurance Funds | | Financial Highlights | |
For a Share Outstanding Throughout Each Period
| | | | Investment Activities | | Distributions to
Shareholders From | |
| | | Net Asset
Value,
Beginning of
Period | | Net
Investment
Income
(Loss)(a) | | Net
Realized and
Unrealized
Gains
(Losses) on
Investments | | Total from
Investment
Activities | | Net
Investment
Income | | Net Realized
Gains From
Investments | | Total
Distributions | |
Victory Sophus Emerging Markets VIP Series | |
Year Ended
12/31/19 | | $ | 13.59 | | | | 0.29 | | | | 2.85 | | | | 3.14 | | | | (0.16 | ) | | | (0.84 | ) | | | (1.00 | ) | |
Year Ended
12/31/18 | | $ | 18.79 | | | | 0.20 | | | | (3.79 | ) | | | (3.59 | ) | | | (0.14 | ) | | | (1.47 | ) | | | (1.61 | ) | |
Year Ended
12/31/17 | | $ | 13.26 | | | | 0.17 | | | | 5.51 | | | | 5.68 | | | | (0.15 | ) | | | — | | | | (0.15 | ) | |
Year Ended
12/31/16 | | $ | 11.99 | | | | 0.12 | | | | 1.14 | | | | 1.26 | | | | (0.12 | ) | | | — | | | | (0.12 | ) | |
Year Ended
12/31/15 | | $ | 13.81 | | | | 0.13 | | | | (1.89 | ) | | | (1.76 | ) | | | (0.06 | ) | | | — | | | | (0.06 | ) | |
* Includes adjustments in accordance with U.S. generally accepted accounting principals.
(a) Per share net investment income (loss) has been calculated using the average daily shares method.
(b) Total returns do not reflect the effects of charges deducted pursuant to the terms of The Guardian Insurance & Annuity Company, Inc.'s variable contracts. Inclusion of such charges would reduce the total returns for all periods shown.
(c) The Fund received monies related to a nonrecurring refund from the prior Custodian. The corresponding impact to the total return was less than 0.95% for the period shown. (See Note 8)
See notes to financial statements.
20
Victory Variable Insurance Funds | | Financial Highlights — continued | |
For a Share Outstanding Throughout Each Period (continued)
| | | | | Ratios to Average Net Assets | | Supplemental Data | |
| | | Capital
Contribution
from Prior
Custodian,
Net (See
Note 8) | | Net Asset
Value,
End of
Period | | Total
Return(b)* | | Net
Expenses | | Net
Investment
Income
(Loss) | | Gross
Expenses | | Net Assets,
End of
Period
(000's) | | Portfolio
Turnover | |
Victory Sophus Emerging Markets VIP Series | |
Year Ended
12/31/19 | | | — | | | $ | 15.73 | | | | 23.28 | % | | | 1.35 | % | | | 1.93 | % | | | 1.40 | % | | $ | 44,571 | | | | 91 | % | |
Year Ended
12/31/18 | | | — | | | $ | 13.59 | | | | (18.97 | )% | | | 1.34 | % | | | 1.12 | % | | | 1.34 | % | | $ | 42,385 | | | | 105 | % | |
Year Ended
12/31/17 | | | — | | | $ | 18.79 | | | | 42.88 | % | | | 1.33 | % | | | 1.03 | % | | | 1.33 | % | | $ | 62,550 | | | | 99 | % | |
Year Ended
12/31/16 | | | 0.13 | | | $ | 13.26 | | | | 11.57 | %(c) | | | 1.34 | % | | | 0.98 | % | | | 1.35 | % | | $ | 48,634 | | | | 102 | % | |
Year Ended
12/31/15 | | | — | | | $ | 11.99 | | | | (12.74 | )% | | | 1.35 | % | | | 0.92 | % | | | 1.35 | % | | $ | 48,426 | | | | 123 | % | |
See notes to financial statements.
21
Victory Variable Insurance Funds | | Notes to Financial Statements
December 31, 2019 | |
1. Organization:
Victory Variable Insurance Funds (the "Trust") was organized on February 11, 1998 as a Delaware statutory trust. The Trust is registered under the Investment Company Act of 1940, as amended (the "1940 Act"), as a diversified open-end investment company. The Trust is comprised of nine funds and is authorized to issue an unlimited number of shares, which are units of beneficial interest with a par value of $0.001 per share. The accompanying financial statements are those of the Victory Sophus Emerging Markets VIP Series (the "Fund").
The Fund offers a single class of shares: Class I Shares. Sales of shares of the Fund may only be made to certain separate accounts of The Guardian Insurance & Annuity Company, Inc. ("GIAC") that fund certain variable annuity and variable life insurance contracts issued by GIAC. GIAC is a wholly owned subsidiary of The Guardian Life Insurance Company of America ("Guardian Life").
Under the Trust's organizational documents, its officers and trustees are indemnified against certain liabilities arising out of the performance of their duties to the Fund. In addition, in the normal course of business, the Fund enters into contracts with its vendors and others that provide for general indemnifications. The Fund's maximum exposure under these arrangements is unknown, as this would involve future claims that may be made against the Fund. However, based on experience, the Fund expects that risk of loss to be remote.
2. Significant Accounting Policies:
The following is a summary of significant accounting policies followed by the Trust in the preparation of its financial statements. The policies are in conformity with accounting principles generally accepted in the United States of America ("GAAP"). The preparation of financial statements in accordance with GAAP requires management to make estimates and assumptions that affect the reported amounts of assets and liabilities and disclosure of contingent assets and liabilities at the date of the financial statements and the reported amounts of income and expenses for the period. Actual results could differ from those estimates.
The Fund follows the specialized accounting and reporting requirements under GAAP that are applicable to investment companies.
Investment Valuation:
The Fund records investments at fair value. Fair value is defined as the price that would be received to sell an asset or paid to transfer a liability in an orderly transaction between market participants at the measurement date.
The valuation techniques described below maximize the use of observable inputs and minimize the use of unobservable inputs in determining fair value. The inputs used for valuing the Fund's investments are summarized in the three broad levels listed below:
• Level 1 — quoted prices in active markets for identical securities
• Level 2 — other significant observable inputs (including quoted prices for similar securities or interest rates applicable to those securities, etc.)
• Level 3 — significant unobservable inputs (including the Fund's own assumptions in determining the fair value of investments)
Changes in valuation techniques may result in transfers in or out of an assigned level within the disclosure hierarchy. The inputs or methodologies used for valuation techniques are not necessarily an indication of the risk associated with entering into those investments.
Portfolio securities listed or traded on securities exchanges, including American Depositary Receipts ("ADRs") and Rights, are valued at the closing price on the exchange or system where the security is principally traded, if available, or at the Nasdaq Official Closing Price. If there have been no sales for that day on the exchange or system, then a security is valued at the last available bid quotation on the exchange or system where the security is principally traded. In each of these situations, valuations are typically categorized as Level 1 in the fair value hierarchy.
22
Victory Variable Insurance Funds | | Notes to Financial Statements — continued
December 31, 2019 | |
Investments in open-end investment companies are valued at net asset value. These valuations are typically categorized as Level 1 in the fair value hierarchy.
Investments for which there are no such quotations, or for which quotations do not appear reliable, are valued at fair value in accordance with procedures established by and under the general supervision and responsibility of the Trust's Board of Trustees (the "Board"). These valuations are typically categorized as Level 2 or Level 3 in the fair value hierarchy, based on the observability of inputs used to determine the fair value.
In accordance with procedures adopted by the Board, fair value pricing may be used if events materially affecting the value of foreign securities occur between the time the exchange on which they are traded closes and the time the Fund's net asset value is calculated. The Fund uses a systematic valuation model, provided daily by an independent third party to fair value their international equity securities. To the extent this model is utilized, these valuations are categorized as a Level 2 in the fair value hierarchy.
A summary of the valuations as of December 31, 2019, based upon the three levels defined above, is included in the table below while the breakdown, by category, of investments is disclosed in the Schedule of Portfolio Investments.
| | | LEVEL 1 | | LEVEL 2 | | Total | |
Common Stocks | | $ | 6,990,385 | | | $ | 36,651,551 | | | $ | 43,641,936 | | |
| Preferred Stocks | | | — | | | | 326,339 | | | | 326,339 | | |
Collateral for Securities Loaned | | | 388,732 | | | | — | | | | 388,732 | | |
Total | | $ | 7,379,117 | | | $ | 36,977,890 | | | $ | 44,357,007 | | |
For the year ended December 31, 2019, there were no Level 3 investments for which significant unobservable inputs were used to determine fair value.
Foreign Exchange Currency Contracts:
The Fund may enter into foreign exchange currency contracts to convert U.S. dollars to and from various foreign currencies. A foreign exchange currency contract is an obligation by the Fund to purchase or sell a specific currency at a future date at a price (in U.S. dollars) set at the time of the contract. The Fund does not engage in "cross-currency" foreign exchange contracts (i.e., contracts to purchase or sell one foreign currency in exchange for another foreign currency). The Fund's foreign exchange currency contracts might be considered spot contracts (typically a contract of one week or less) or forward contracts (typically a contract term over one week). A spot contract is entered into for purposes of hedging against foreign currency fluctuations relating to a specific portfolio transaction, such as the delay between a security transaction trade date and settlement date. Forward contracts are entered into for purposes of hedging portfolio holdings or concentrations of such holdings. The Fund enters into foreign exchange currency contracts solely for spot or forward hedging purposes, and not for speculative purposes (i.e., the Fund does not enter into such contracts solely for the purpose of earning foreign currency gains). Each foreign exchange currency contract is adjusted daily by the prevailing spot or forward rate of the underlying currency, and any appreciation or depreciation is recorded for financial statement purposes as unrealized until the contract settlement date, at which time the Fund records realized gains or losses equal to the difference between the value of a contract at the time it was opened and the value at the time it was closed. The Fund could be exposed to risk if a counterparty is unable to meet the terms of a foreign exchange currency contract or if the value of the foreign currency changes unfavorably. In addition, the use of foreign exchange currency contracts does not eliminate fluctuations in the underlying prices of the securities. During the year ended December 31, 2019, the Fund had no open forward foreign exchange currency contracts.
Investment Transactions and Related Income:
Changes in holdings of investments are accounted for no later than one business day following the trade date. For financial reporting purposes, however, investment transactions are accounted for on trade date on the last business day of the reporting period. Interest income is determined on the basis of coupon interest accrued using the effective interest method which adjusts, where applicable, the
23
Victory Variable Insurance Funds | | Notes to Financial Statements — continued
December 31, 2019 | |
amortization of premiums or accretion of discounts. Dividend income is recorded on the ex-dividend date. Non-cash dividends included in dividend income, if any, are recorded at the fair market value of the securities received. Gains or losses realized on sales of securities are determined by comparing the identified cost of the security lot sold with the net sales proceeds.
Withholding taxes on interest, dividends and gains as a result of certain investments in ADRs by the Fund have been provided for in accordance with each investment's applicable country's tax rules and rates.
Securities Lending:
The Trust has entered into a Master Securities Lending Agreement ("MSLA") with Citibank, N.A. ("Citibank" or the "Agent"). Under the terms of the MSLA, the Fund may lend securities to certain broker-dealers and banks in exchange for collateral in the amount of at least 102% of the value of U.S. securities loaned or at least 105% of the value of non-U.S. securities loaned, marked-to-market daily. Any collateral shortfalls associated with increases in the valuation of the securities loaned are adjusted the next business day. The collateral can be received in the form of cash collateral and/or non-cash collateral. Non-cash collateral can include U.S. Government Securities, letters of credit and certificates of deposit. The cash collateral is invested in short-term instruments or cash equivalents as noted on the Fund's Schedule of Portfolio Investments. The Trust does not have effective control of the non-cash collateral and therefore it is not disclosed in the Fund's Schedule of Portfolio Investments. The Fund continues to benefit from interest or dividends on the securities loaned and may also earn a return from the collateral. The Fund pays various fees in connection with the investment of cash collateral. The Fund pays the Agent fees based on the investment income received from securities lending activities. Securities lending income is disclosed in the Fund's Statement of Operations. Although risk is mitigated by the collateral, the Fund could experience a delay in recovering its securities and possible loss of income or value if the borrower fails to return them.
Securities lending transactions are entered into by the Fund under the MSLA, which permits the Fund, under certain circumstances such as an event of default, to offset amounts payable by the Fund to the same counterparty against amounts receivable from the counterparty to create a net payment due to or from the Fund.
The following table is a summary of the Fund's securities lending transactions which are subject to offset under the MSLA as of December 31, 2019. These transactions are accounted for as secured borrowings with an overnight and continuous contractual maturity for cash collateral, and greater than overnight and continuous contractual maturity for non-cash collateral.
Gross
Amount of
Recognized
Assets
(Value of | | Value of
Cash | | Value of Non-cash Collateral
Received by Maturity | | | |
Securities on
Loan) | | Collateral
Received* | | <30 Days | | Between 30 &
90 days | | >90 Days | | Net
Amount | |
| $ | 369,336 | | | $ | 369,336 | | | $ | — | | | $ | — | | | $ | — | | | $ | — | | |
* Collateral received in excess of the market value of securities on loan is not presented in this table. The total cash collateral received by the Fund is disclosed in the Statement of Assets and Liabilities.
Foreign Currency Translations:
The accounting records of the Fund are maintained in U.S. dollars. Investment securities and other assets and liabilities of the Fund denominated in a foreign currency are translated into U.S. dollars at current exchange rates. Purchases and sales of securities, income receipts and expense payments are translated into U.S. dollars at the exchange rates on the date of the transactions. The Fund does not isolate the portion of the results of operations resulting from changes in foreign exchange rates on investments from fluctuations arising from changes in market prices of securities held. Such fluctuations are disclosed as Net change in unrealized appreciation/depreciation on investment securities and
24
Victory Variable Insurance Funds | | Notes to Financial Statements — continued
December 31, 2019 | |
foreign currency translations on the Statement of Operations. Any realized gains or losses from these fluctuations are disclosed as Net realized gains (losses) from investments and foreign currency translations on the Statement of Operations.
Foreign Taxes:
The Fund may be subject to foreign taxes related to foreign income received (a portion of which may be reclaimable), capital gains on the sale of securities, and certain foreign currency transactions. All foreign taxes are recorded in accordance with the applicable regulations and rates that exist in the foreign jurisdictions in which the Fund invests.
Distributions to Shareholders:
Dividends from net investment income, if any, are declared and paid annually by the Fund. Distributable net realized gains, if any, are declared and distributed at least annually.
The amounts of dividends from net investment income and distributions from net realized gains are determined in accordance with federal income tax regulations, which may differ from GAAP. To the extent these "book/tax" differences are permanent in nature (e.g., net operating loss and distribution reclassification), such amounts are reclassified within the components of net assets based on their federal tax-basis treatment; temporary differences (e.g., wash sales) do not require reclassification. To the extent dividends and distributions exceed net investment income and net realized gains for tax purposes, they are reported as distributions of capital. Net investment losses incurred by the Fund may be reclassified as an offset to capital on the accompanying Statement of Assets and Liabilities.
As of December 31, 2019 on the Statement of Assets and Liabilities, as a result of permanent book-to-tax differences, reclassification adjustments were as follows:
Total
Distributable
Earnings/(Loss) | | Capital | |
| $ | (2 | ) | | $ | 2 | | |
Federal Income Taxes:
It is the policy of the Fund to continue to qualify as a regulated investment company by complying with the provisions available to certain investment companies, as defined in applicable sections of the Internal Revenue Code, and to make distributions of net investment income and net realized gains sufficient to relieve it from all, or substantially all, federal income taxes. Accordingly, no provision for federal income taxes is required in the financial statements. The Fund has a tax year end of December 31.
Management of the Fund has reviewed tax positions taken in tax years that remain subject to examination by all major tax jurisdictions, including federal (i.e., all open tax years and the interim tax period since then). Management believes that there is no tax liability resulting from unrecognized tax benefits related to uncertain tax positions taken.
Allocations:
Expenses directly attributable to the Fund are charged to the Fund, while expenses which are attributable to more than one fund in the Trust, or jointly with an affiliated trust, are allocated among the respective funds in the Trust and/or affiliated trust based upon net assets or another appropriate basis.
Cross-Trade Transactions:
Pursuant to Rule 17a-7 under the 1940 Act, the Fund may engage in cross-trades which are securities transactions with affiliated investment companies and advisory accounts managed by the Adviser and any applicable sub-adviser. Any such purchase or sale transaction must be effected without brokerage commission or other remuneration, except for customary transfer fees. The transaction must be effected
25
Victory Variable Insurance Funds | | Notes to Financial Statements — continued
December 31, 2019 | |
at the current market price, which is either the security's last sale price on an exchange or, if there are no transactions in the security that day, at the average of the highest bid and lowest asked price. For the year ended December 31, 2019, the Fund did not engage in any Rule 17a-7 transactions under the 1940 Act.
3. Purchases and Sales of Securities:
Purchases and sales of securities (excluding securities maturing less than one year from acquisition) for the year ended December 31, 2019 were as follows for the Fund:
| Purchases | | Sales | |
| $ | 38,837,268 | | | $ | 45,382,744 | | |
For the year ended December 31, 2019, there were no purchases or sales of U.S. Government Securities.
4. Fees and Transactions with Affiliates and Related Parties:
Investment advisory services are provided to the Fund by Victory Capital Management Inc. ("VCM" or the "Adviser"), a New York corporation registered as an investment adviser with the Securities and Exchange Commission ("SEC"). The Adviser is a wholly owned indirect subsidiary of Victory Capital Holdings, Inc., a publicly traded Delaware corporation, and a wholly owned direct subsidiary of Victory Capital Operating, LLC.
Under the terms of the Investment Advisory Agreement, the Adviser is entitled to receive 1.00% of the average daily net assets of the Fund. The Adviser may use its resources to assist with the Fund's distribution and marketing expenses.
VCM also serves as the Fund's administrator and fund accountant. Under an Administration and Fund Accounting Agreement, VCM is paid for its services an annual fee at a rate of 0.08% of the first $15 billion in average daily net assets of the Trust, Victory Portfolios and Victory Portfolios II (collectively, the "Victory Funds Complex"), 0.05% of the average daily net assets above $15 billion to $30 billion of the Victory Funds Complex and 0.04% of the average daily net assets over $30 billion of the Victory Funds Complex.
Citi Fund Services Ohio, Inc. ("Citi"), an affiliate of Citibank, N.A., acts as sub-administrator and sub-fund accountant to the Fund pursuant to a Sub-Administration and Sub-Fund Accounting Services Agreement between VCM and Citi. VCM pays Citi a fee for providing these services. The Trust reimburses VCM and Citi for all of their reasonable out-of-pocket expenses incurred in providing these services.
FIS Investor Services, LLC ("FIS") serves as the Fund's transfer agent. Under the Transfer Agent Agreement, the Trust pays FIS a fee for its services and reimburses FIS for all of their reasonable out-of-pocket expenses incurred in providing these services.
The Chief Compliance Officer ("CCO") is an employee of the Adviser, which pays the compensation of the CCO and his support staff. The Trust has entered into an Agreement to provide compliance services with the Adviser, pursuant to which the Adviser furnishes its compliance personnel, including the services of the CCO, and other resources reasonably necessary to provide the Trust with compliance oversight services related to the design, administration and oversight of a compliance program for the Trust in accordance with Rule 38a-1 under the 1940 Act. The funds in the Victory Funds Complex, in the aggregate, compensate the Adviser for these services.
The Victory Funds Complex pays an annual retainer to each Independent Trustee, plus an additional annual retainer to the Chairman of the Board. The aggregate amount of the fees and expenses of the Independent Trustees are allocated amongst all the funds in the Victory Funds Complex and are presented in the Statement of Operations.
Shearman & Sterling LLP provides legal services to the Trust.
Victory Capital Advisers, Inc. (the "Distributor"), an affiliate of the Adviser, serves as distributor for the continuous offering of the shares of the Fund pursuant to a Distribution Agreement between the Distributor and the Trust.
26
Victory Variable Insurance Funds | | Notes to Financial Statements — continued
December 31, 2019 | |
The Adviser has entered into an expense limitation agreement with the Fund until at least April 30, 2020. Under the terms of the agreement, the Adviser has agreed to waive fees or reimburse certain expenses to the extent that ordinary operating expenses incurred by the Fund in any fiscal year exceed the expense limit for the Fund. Such excess amounts will be the liability of the Adviser. Interest, taxes, brokerage commissions, other expenditures which are capitalized in accordance with GAAP, and other extraordinary expenses not incurred in the ordinary course of a Fund's business are excluded from the expense limits. As of December 31, 2019, the expense limit (excluding voluntary waivers) is 1.35%.
The Fund has agreed to repay fees and expenses that were waived or reimbursed by the Adviser for a period up to three fiscal years after such waiver or reimbursement was made to the extent such payments or repayments would not cause the expenses to exceed the original expense limitation in place at time of the waiver or reimbursement or any expense limitation agreement in place at the time of repayment. As of December 31, 2019, the following amounts are available to be repaid to the Adviser. Amounts repaid to the Adviser during the year ended, if any, are reflected on the Statement of Operations as "Recoupment of prior expenses waived/reimbursed by Adviser".
Expires
December 31,
2022 | | Total | |
| $ | 22,632 | | | $ | 22,632 | | |
The Adviser may voluntarily waive or reimburse additional fees to assist the Fund in maintaining a competitive expense ratio. Voluntary waivers and reimbursements applicable to the Fund are not available to be recouped at a future time. There were no voluntary waivers or reimbursements for the year ended December 31, 2019.
Certain officers and/or interested trustees of the Fund are also officers and/or employees of the Adviser, Administrator, Fund Accountant, Sub-Administrator, Sub-Fund Accountant and Legal Counsel.
5. Risks:
The Fund may be subject to other risks in addition to these identified risks.
An investment in the Fund's shares represents an indirect investment in the securities owned by the Fund, some of which will be traded on a national securities exchange or in the over-the-counter markets. The value of the securities in which the Fund invests, like other market investments, may move up or down, sometimes rapidly and unpredictably. The value of the securities in which the Fund invests may affect the value of the Fund's shares. An investment in the Fund's shares at any point in time may be worth less than the original investment, even after taking into account the reinvestment of the Fund's distributions.
The Fund will be subject to foreign securities risk. Foreign securities are (including ADRs and other depository receipts) are subject to political, regulatory, and economic risks not present in domestic investments. In addition, when the Fund buys securities denominated in a foreign currency, there are special risks such as changes in currency exchange rates and the risk that a foreign government could regulate foreign exchange transactions. In addition, to the extent investments are made in a limited number of countries, events in those countries will have a more significant impact on the Fund.
The Fund will be subject to emerging market risk. Risk of investment in emerging markets include greater political and economic instability, greater volatility in currency exchange rates, less developed securities markets, possible trade barriers, currency transfer restrictions, a more limited number of potential buyers and issuers, an emerging market country's dependence on revenue from particular commodities or international aid, less governmental supervision and regulation, unavailability of currency hedging techniques, differences in auditing and financial reporting standards and less developed legal systems.
The Fund will be subject to credit risk with respect to the amount it expects to receive from counterparties for financial instruments entered into by the Fund. The Fund may be negatively impacted if a counterparty becomes bankrupt or otherwise fails to perform its obligations due to financial
27
Victory Variable Insurance Funds | | Notes to Financial Statements — continued
December 31, 2019 | |
difficulties. The Fund may experience significant delays in obtaining any recovery in bankruptcy or other reorganization proceeding and the Fund may obtain only limited recovery or may obtain no recovery in such circumstances. The Fund typically enters into transactions with counterparties whose credit ratings are investment grade, as determined by a nationally recognized statistical rating organization or, if unrated, judged by the Adviser to be of comparable quality.
6. Borrowing and Interfund Lending:
Line of Credit:
For the year ended December 31, 2019, the Victory Funds Complex participated in a short-term, demand note "Line of Credit" with Citibank. Under the agreement with Citibank, for the period January 1, 2019 to June 30, 2019, the Victory Funds Complex could borrow up to $250 million, of which $100 million was committed and $150 million was uncommitted. Effective July 1, 2019, the agreement was amended to include the USAA Mutual Funds Complex (another series of mutual funds managed by the Adviser) and has a new termination date of June 29, 2020. Under this amended agreement, the Victory Funds Complex and USAA Mutual Funds Complex, combined, may borrow up to $600 million, of which $300 million is committed and $300 million is uncommitted. $40 million of the Line of Credit is reserved for use by the Victory Floating Rate Fund (herein, the "Fund"), another series of the Victory Funds Complex, with that Fund paying the related commitment fees for that amount. The purpose of the agreement is to meet temporary or emergency cash needs, including redemption requests that might otherwise require the untimely disposition of securities. With the agreement in effect for the period January 1, 2019 to June 30, 2019, Citibank received an annual commitment fee of 0.15% on $100 million for providing the Line of Credit. For the period July 1, 2019 to December 31, 2019, Citibank received an annual commitment fee of 0.15% on $300 million for providing the Line of Credit. For the year ended December 31, 2019, Citibank earned approximately $300 thousand in commitment fees from the combined Victory Funds Complex and USAA Mutual Funds Complex. Each fund in the Victory Funds Complex and the USAA Mutual Funds Complex pays a pro-rata portion of the commitment fees plus any interest (one month LIBOR plus one percent) on amounts borrowed. Interest charged to the Fund during the period, if applicable, is presented on the Statement of Operations under Line of credit fees.
The Fund did not utilize the line of credit during the year ended December 31, 2019.
Interfund Lending:
The Trust and Adviser rely on an exemptive order granted by the SEC in March 2017 (the "Order"), permitting the establishment and operation of an Interfund Lending Facility (the "Facility"). The Facility allows the Fund to directly lend and borrow money to or from any other Victory Fund relying upon the Order at rates beneficial to both the borrowing and lending funds. Advances under the Facility are allowed for temporary or emergency purposes, including the meeting of redemption requests that otherwise might require the untimely disposition of securities, and are subject to each fund's borrowing restrictions. The interfund loan rate is determined, as specified in the Order, by averaging the current repurchase agreement rate and the current bank loan rate. As a Borrower, interest charged to the Fund during the period, if applicable, is presented on the Statement of Operations under Interfund lending fees. As a Lender, interest earned by the Fund during the period, if applicable, is presented on the Statement of Operations under Income on interfund lending.
| Borrower or Lender | | Amount
Outstanding
at
December 31, 2019 | | Average
Borrowing* | | Days
Borrowing
Outstanding | | Average
Interest
Rate* | | Maximum
Borrowing During
the Period | |
| Borrower | | $ | — | | | $ | 143,000 | | | | 1 | | | | 2.99 | % | | $ | 143,000 | | |
* For the year ended December 31, 2019, based on the number of days borrowings were outstanding.
28
Victory Variable Insurance Funds | | Notes to Financial Statements — continued
December 31, 2019 | |
7. Federal Income Tax Information:
The tax character of distributions paid during the most recent tax years ended, as noted below, were as follows (total distributions paid may differ from the Statements of Changes in Net Assets because, for tax purposes, dividends are recognized when actually paid).
| | | Year Ended December 31, 2019 | |
| | | Distributions paid from | |
| | | Ordinary
Income | | Net
Long-Term
Capital Gains | | Total
Distributions
Paid | |
| | | | | $ | 457,783 | | | $ | 2,248,691 | | | $ | 2,706,474 | | |
| | | Year Ended December 31, 2018 | |
| | | Distributions paid from | |
| | | Ordinary
Income | | Net
Long-Term
Capital Gains | | Total
Distributions
Paid | |
| | | | | $ | 437,091 | | | $ | 4,140,978 | | | $ | 4,578,069 | | |
As of the tax year ended December 31, 2019, the components of distributable earnings/accumulated deficit on a tax basis were as follows:
Undistributed
Ordinary
Income | | Undistributed
Long-Term
Capital
Gains | | Accumulated
Earnings | | Unrealized
Appreciation
(Depreciation)* | | Total
Accumulated
Earnings
(Deficit) | |
| $ | 793,134 | | | $ | 359,357 | | | $ | 1,152,491 | | | $ | 9,744,234 | | | $ | 10,896,725 | | |
* The difference between the book-basis and tax-basis unrealized appreciation (depreciation) is attributable primarily to tax deferral of losses on wash sales.
During the tax year ended December 31, 2019, the Fund did not utilize capital loss carryforwards.
As of December 31, 2019, the cost basis for federal income tax purposes, gross unrealized appreciation, gross unrealized depreciation and net unrealized appreciation (depreciation) for investments and derivatives were as follows:
Cost of
Investments
for Federal
Tax Purposes | | Gross
Unrealized
Appreciation | | Gross
Unrealized
Depreciation | | Net
Unrealized
Appreciation
(Depreciation) | |
| $ | 34,606,198 | | | $ | 10,547,796 | | | $ | (796,987 | ) | | $ | 9,750,809 | | |
8. Capital Contribution from Prior Custodian:
During 2016, the Fund received notification from the Fund's prior custodian, State Street Bank and Trust ("State Street"), concerning issues related to billing on certain categories of expenses during the approximately 16-year period from 1998 through October 31, 2014. The over-billing primarily related to categories of expenses that involved an allocation of general costs among multiple clients.
State Street paid the refunded amounts during January 2017. Based on billing information received during 2016 from State Street and an analysis of any expense limitation agreements that were in place during the period of the activities in question, including the application of any recoupment provisions in such agreements, the Adviser received a portion of the refund.
The portion of the refund retained by the Fund was accounted for as a capital contribution and is reflected on the Financial Highlights as "Capital Contribution from Prior Custodian, Net".
29
Victory Variable Insurance Funds | | Notes to Financial Statements — continued
December 31, 2019 | |
9. Fund Ownership:
Ownership of more than 25% of the voting securities of a fund creates presumptions of control of the fund, under section 2(a)(9) of the 1940 Act. As of December 31, 2019, the shareholder listed below held more than 25% of the shares outstanding of the Fund and may be deemed to control the Fund.
| Shareholder | | Percent | |
| GIAC | | | 99.5 | % | |
10. Subsequent Events:
The Fund has evaluated the need for additional disclosures or adjustments resulting from subsequent events through the date these financial statements were issued. Based on this evaluation, there were no subsequent events to report that would have a material impact on the Fund's financial statements.
30
REPORT OF INDEPENDENT REGISTERED PUBLIC ACCOUNTING FIRM
To the Shareholders and Board of Trustees of Victory Variable Insurance Funds
Opinion on the Financial Statements
We have audited the accompanying statement of assets and liabilities, including the schedule of portfolio investments, of Victory Sophus Emerging Markets VIP Series (the "Fund"), a series of Victory Variable Insurance Funds, as of December 31, 2019, the related statements of operations and changes in net assets, including the related notes, and the financial highlights for the year then ended (collectively referred to as the "financial statements"). In our opinion, the financial statements present fairly, in all material respects, the financial position of the Fund as of December 31, 2019, the results of its operations, the changes in its net assets, and the financial highlights for the year then ended, in conformity with accounting principles generally accepted in the United States of America.
The Fund's financial statements and financial highlights for the three years ended December 31, 2018, were audited by other auditors whose report dated February 15, 2019 and the Fund's financial highlights for the year ended December 31, 2015, were audited by other auditors whose report dated February 22, 2016, expressed unqualified opinions on those financial statements and financial highlights.
Basis for Opinion
These financial statements are the responsibility of the Fund's management. Our responsibility is to express an opinion on the Fund's financial statements based on our audit. We are a public accounting firm registered with the Public Company Accounting Oversight Board (United States) ("PCAOB") and are required to be independent with respect to the Fund in accordance with the U.S. federal securities laws and the applicable rules and regulations of the Securities and Exchange Commission and the PCAOB.
We conducted our audit in accordance with the standards of the PCAOB. Those standards require that we plan and perform the audit to obtain reasonable assurance about whether the financial statements are free of material misstatement whether due to error or fraud.
Our audit included performing procedures to assess the risks of material misstatement of the financial statements, whether due to error or fraud, and performing procedures that respond to those risks. Such procedures included examining, on a test basis, evidence regarding the amounts and disclosures in the financial statements. Our procedures included confirmation of securities owned as of December 31, 2019, by correspondence with the custodian and brokers or by other appropriate auditing procedures where replies from brokers were not received. Our audit also included evaluating the accounting principles used and significant estimates made by management, as well as evaluating the overall presentation of the financial statements. We believe that our audit provides a reasonable basis for our opinion.
We have served as the auditor of one or more of the investment companies advised by Victory Capital Management, Inc. since 2015.

COHEN & COMPANY, LTD.
Cleveland, Ohio
February 18, 2020
31
Victory Variable Insurance Funds | | Supplemental Information
December 31, 2019 | |
(Unaudited)
Trustee and Officer Information
Board of Trustees:
Overall responsibility for management of the Trust rests with the Board. The Trust is managed by the Board in accordance with the laws of the State of Delaware. There are currently ten Trustees, nine of whom are not "interested persons" of the Trust within the meaning of that term under the 1940 Act ("Independent Trustees") and one of whom is an "interested person" of the Trust within the meaning of that term under the 1940 Act ("Interested Trustee"). The Trustees, in turn, elect the officers of the Trust to actively supervise its day-to-day operations.
The following tables list the Trustees, their ages, position with the Trust, commencement of service, principal occupations during the past five years and any directorships of other investment companies or companies whose securities are registered under the Securities Exchange Act of 1934, as amended, or who file reports under that Act. Each Trustee oversees nine portfolios in the Trust, 42 portfolios in Victory Portfolios and 26 portfolios in Victory Portfolios II, each a registered investment company that, together with the Trust, comprise the Victory Funds Complex. Each Trustee's address is c/o Victory Variable Insurance Funds, 4900 Tiedeman Road, 4th Floor, Brooklyn, Ohio 44144. Each Trustee has an indefinite term.
Name and Age | | Position
Held with
the Trust | | Date
Commenced
Service | | Principal Occupation
During Past 5 Years | | Other
Directorships
Held During
Past 5 Years | |
Independent Trustees. | |
David Brooks Adcock, 68 | | Trustee | | February 2005 | | Consultant (since 2006). | | Chair and Trustee, Turner Funds (December 2016-December 2017). | |
Nigel D.T. Andrews, 72 | | Vice Chair and Trustee | | August 2002 | | Retired. | | Director, TCG BDC II, Inc. (since 2017); Director, TCG BDC I, Inc. (formerly Carlyle GMS Finance, Inc.) (since 2012); Director, Old Mutual US Asset Management (2002-2014). | |
E. Lee Beard, 68* | | Trustee | | February 2005 | | Retired (since 2015); Consultant, The Henlee Group, LLC (consulting) (2005-2015). | | None. | |
Dennis M. Bushe, 76 | | Trustee | | July 2016 | | Retired. | | Trustee, RS Investment Trust and RS Variable Products Trust (November 2011-July 2016). | |
32
Victory Variable Insurance Funds | | Supplemental Information — continued
December 31, 2019 | |
(Unaudited)
Name and Age | | Position
Held with
the Trust | | Date
Commenced
Service | | Principal Occupation
During Past 5 Years | | Other
Directorships
Held During
Past 5 Years | |
Sally M. Dungan, 65 | | Trustee | | February 2011 | | Chief Investment Officer, Tufts University (since 2002). | | None. | |
John L. Kelly, 66 | | Trustee | | February 2015 | | Partner, McCarvill Capital Partners (September 2016-September 2017); Advisor, Endgate Commodities LLC (January 2016-April 2016); Managing Partner, Endgate Commodities LLC (August 2014-January 2016); Chief Operating Officer, Liquidnet Holdings, Inc. (December 2011-July 2014). | | Director, Caledonia Mining Corporation (since May 2012). | |
David L. Meyer, 62* | | Trustee | | December 2008 | | Retired. | | None. | |
Gloria S. Nelund, 58 | | Trustee | | July 2016 | | Chair, CEO and Co-Founder of TriLinc Global, LLC, an investment firm. | | TriLinc Global Impact Fund, LLC (since 2012); Trustee, RS Investment Trust and RS Variable Products Trust (November 2007-July 2016). | |
Leigh A. Wilson, 75 | | Chair and Trustee | | February 1998 | | Private Investor. | | Chair (since 2013), Caledonia Mining Corporation. | |
Interested Trustee. | |
David C. Brown, 47** | | Trustee | | May 2008 | | Chairman and Chief Executive Officer (since 2013), Co-Chief Executive Officer (2011-2013), the Adviser; Chairman and Chief Executive Officer, Victory Capital Holdings, Inc. (since 2013). | | USAA Mutual Funds Trust. | |
* The Board has designated Mr. Meyer and Ms. Beard as its Audit Committee Financial Experts.
** Mr. Brown is an "Interested Person" by reason of his relationship with the Adviser.
The Statement of Additional Information includes additional information about the Trustees of the Trust and is available, without charge, by calling 800-539-3863.
33
Victory Variable Insurance Funds | | Supplemental Information — continued
December 31, 2019 | |
(Unaudited)
Officers:
The officers of the Trust, their ages, commencement of service and their principal occupations during the past five years, are detailed in the following table. Each officer serves until the earlier of his or her resignation, removal, retirement, death, or the election of a successor. The mailing address of each officer of the Trust is 4900 Tiedeman Road, 4th Floor, Brooklyn, Ohio 44144. The officers of the Trust receive no compensation directly from the Trust for performing the duties of their offices.
Name and Age | | Position with
the Trust | | Date
Commenced
Service | | Principal Occupation During Past 5 Years | |
Christopher K. Dyer, 58 | | President | | February 2006* | | Director of Fund Administration, the Adviser. | |
Scott A. Stahorsky, 50 | | Vice President | | December 2014 | | Manager, Fund Administration, the Adviser (since 2015); Senior Analyst, Fund Administration, the Adviser (prior to 2015). | |
Erin G. Wagner, 46 | | Secretary | | December 2014 | | Associate General Counsel, the Adviser (since 2013). | |
Allan Shaer, 54 | | Treasurer | | May 2017 | | Senior Vice President, Financial Administration, Citi Fund Services Ohio, Inc. (since 2016); Vice President, Mutual Fund Administration, JP Morgan Chase (2011-2016). | |
Christopher A. Ponte, 35 | | Assistant Treasurer | | December 2017 | | Manager, Fund Administration, the Adviser (since 2017); Senior Analyst, Fund Administration, the Adviser (prior to 2017); Chief Financial Officer, Victory Capital Advisers, Inc. (since 2018). | |
Colin Kinney, 46 | | Chief Compliance Officer | | July 2017 | | Chief Compliance Officer (since 2013) and Chief Risk Officer (2009-2017), the Adviser. | |
Chuck Booth, 59 | | Anti-Money Laundering Compliance Officer and Identity Theft Officer | | May 2015 | | Director, Regulatory Administration and CCO Support Services, Citi Fund Services Ohio, Inc. | |
Jay G. Baris, 66 | | Assistant Secretary | | February 1998 | | Partner, Shearman & Sterling LLP (since 2018); Partner, Morrison & Foerster LLP (2011-January 2018). | |
* On December 3, 2014, Mr. Dyer resigned as Secretary of the Trust and accepted the position of President.
34
Victory Variable Insurance Funds | | Supplemental Information — continued
December 31, 2019 | |
(Unaudited)
Proxy Voting and Portfolio Holdings Information
Proxy Voting:
Information regarding the policies and procedures the Fund uses to determine how to vote proxies relating to portfolio securities is available without charge, upon request, by calling 800-539-3863. The information is also included in the Fund's Statement of Additional Information, which is available on the SEC's website at www.sec.gov.
Information relating to how the Fund voted proxies relating to portfolio securities held during the most recent twelve months ended June 30 is available on the SEC's website at www.sec.gov.
Availability of Schedules of Portfolio Investments:
The Trust files a complete list of Schedules of Portfolio Investments with the SEC for the first and third quarters of each fiscal year on Form N-PORT. Prior to the implementation of Form N-PORT, the Trust filed a complete list of Schedules of Portfolio Investments with the SEC for the first and third quarters of each fiscal year on Form N-Q. Forms N-PORT and Forms N-Q are available on the SEC's website at www.sec.gov.
Expense Examples
As a shareholder of the Fund, you may incur two types of costs: (1) transaction costs and (2) ongoing costs, including management fees, distribution and service (12b-1) fees, and other Fund expenses. These examples are intended to help you understand your ongoing costs (in dollars) of investing in the Fund and to compare these costs with the ongoing costs of investing in other mutual funds.
These examples are based on an investment of $1,000 invested at the beginning of the period and held for the entire period from July 1, 2019 through December 31, 2019.
The Actual Expense figures in the table below provide information about actual account values and actual expenses. You may use the information below, together with the amount you invested, to estimate the expenses that you paid over the period. Simply divide your account value by $1,000 (for example, an $8,600 account value divided by $1,000 = 8.6), then multiply the result by the number in the table under the heading entitled "Actual Expenses Paid During Period" to estimate the expenses you paid on your account during this period.
The Hypothetical Expense figures in the table below provide information about hypothetical account values and hypothetical expenses based on the Fund's actual expense ratio and an assumed rate of return of 5% per year before expenses, which is not the Fund's actual return. The hypothetical account values and expenses may not be used to estimate the actual ending account balance or expenses you paid for the period. You may use this information to compare this 5% hypothetical example with the 5% hypothetical examples that appear in shareholder reports of other funds.
Please note the expenses shown in the table are meant to highlight your ongoing costs only and do not reflect any transactional costs. Therefore, the table is useful in comparing ongoing costs only, and will not help you determine the relative total costs of owning different funds. In addition, if these transactional costs were included, your costs would have been higher.
Beginning
Account Value
7/1/19 | | Actual
Ending
Account Value
12/31/19 | | Hypothetical
Ending
Account Value
12/31/19 | | Actual
Expenses
Paid During
Period
7/1/19-12/31/19* | | Hypothetical
Expenses
Paid During
Period
7/1/19-12/31/19* | | Annualized
Expense Ratio
During Period
7/1/19-12/31/19 | |
$ | 1,000.00 | | | $ | 1,106.60 | | | $ | 1,018.30 | | | $ | 7.27 | | | $ | 6.97 | | | | 1.37 | % | |
* Expenses are equal to the average account value multiplied by the Fund's annualized expense ratio multiplied by 184/365 (the number of days in the most recent fiscal half-year divided by the number of days in the fiscal year).
35
Victory Variable Insurance Funds | | Supplemental Information — continued
December 31, 2019 | |
(Unaudited)
Additional Federal Income Tax Information
For the year ended December 31, 2019, the Fund paid qualified dividend income for the purposes of reduced individual federal income tax rates of 87%.
For the year ended December 31, 2019, the Fund designated long-term capital gain distributions in the amount of $2,248,691.
The Fund intends to elect to pass through to shareholders the income tax credit for taxes paid to foreign countries. Foreign source income and foreign tax expense per shares outstanding on December 31, 2019 were $0.53 and $0.04, respectively.
36
Victory Variable Insurance Funds | | Supplemental Information — continued
December 31, 2019 | |
(Unaudited)
Considerations of the Board in Continuing the Investment Advisory Agreement (the "Agreement")
The Board approved the Agreement on behalf of the Fund at an in-person meeting, which was called for that purpose, on December 4, 2019. The Board also considered information relating to the Fund and the Agreement provided throughout the year and, more specifically, at a meeting on October 22, 2019. The Board noted that prior to the Fund's reorganization on July 29, 2016, the Fund was managed by RS Investment Management Co. LLC, which was acquired by the Adviser on July 29, 2016. In considering whether to approve the Agreement, the Board requested, and the Adviser provided, information that the Board believed to be reasonably necessary to reach its conclusions.
The Board, including the Independent Trustees, evaluated this information along with other information obtained throughout the year and was advised by legal counsel to the Fund, which also serves as independent legal counsel to the Independent Trustees. In addition, in 2017 the Independent Trustees, through their counsel, retained an independent consultant to assist with a review of the overall process for conducting the annual review of these advisory arrangements.
The Board considered the Fund's advisory fee, expense ratio and investment performance as significant factors in determining whether the Agreement should be continued. In considering whether the compensation paid to the Adviser was fair and reasonable, the Board also evaluated, among other things, the following factors:
• The requirements of the Fund for the services provided by the Adviser;
• The nature, quality and extent of the services provided and expected to be provided;
• The performance of the Fund as compared to comparable funds;
• The fees payable for the services and whether the fee arrangements provided for economies of scale that would benefit Fund shareholders as the Fund grows;
• Whether the fee would be sufficient to enable the Adviser to attract and retain experienced personnel and continue to provide quality services to the Fund;
• The fees paid by other clients of the Adviser whose accounts are managed in a similar investment style and any differences in the services provided to the other clients compared to those provided to the Fund;
• The total expenses of the Fund, taking into consideration any distribution or shareholder servicing fees;
• Management's commitment to operating the Fund at competitive expense levels;
• The profitability of the Adviser (as reflected by comparing fees earned against an estimate of the Adviser's costs) with respect to the Adviser's relationship with the Fund;
• Research and other service benefits received by the Adviser obtained through payment of client commissions for securities transactions;
• Other benefits received by the Adviser, and its affiliates, including revenues paid to the Adviser, or its affiliates, by the Fund for administration and fund accounting services, and distribution;
• The capabilities and financial condition of the Adviser;
• Current economic and industry trends; and
• The historical relationship between the Fund and the Adviser.
The Board reviewed the Fund's current management fee, comprised of the advisory fee plus the administrative services fee paid to the Adviser, in the context of the Adviser's profitability with respect to the Fund. In addition, the Board compared the Fund's total operating expense ratio on a net and gross basis, taking into consideration any distribution or shareholder servicing fees and management fees with a universe of comparable mutual funds compiled by an independent consultant and a peer group of funds with similar investment strategies selected by that independent consultant from the universe. The Board reviewed the factors and methodology used by the independent consultant in the selection of the Fund's peer group, including the independent consultant's selection of a broad universe of funds, the more specific universe of comparable funds, and peer groups of funds with comparable investment strategies and asset levels, among other factors. The Board also reviewed any changes to the independent consultant's methodology as compared to the prior year, including those resulting from the Adviser's input, if any. The Board also reviewed fees and other information related to the Adviser's management of similarly managed institutional or private accounts, and the differences in the services provided to the other accounts, to the extent applicable. The Board noted that the advisory fee
37
Victory Variable Insurance Funds | | Supplemental Information — continued
December 31, 2019 | |
(Unaudited)
arrangements for the Fund do not include breakpoints, which are generally viewed as a method by which the investment adviser shares any economies of scale with a fund as a fund grows. The Board also considered the Adviser's commitment to limit expenses as discussed in more detail below, and would consider breakpoints at a future time if the Fund's assets were to grow significantly.
The Board reviewed the Fund's performance over one-, three-, five- and ten-year periods against the performance of the Fund's selected peer group and benchmark index. The Board recognized that the performance of the Fund and the peer group funds are net of expenses, while the performance of the benchmark index reflects gross returns. The Board considered the additional resources that the Adviser has committed to enhance portfolio analysis, compliance and trading systems. The Board noted that, following the Fund's reorganization, the Fund is managed by substantially the same investment management team that managed the comparable predecessor fund.
The Board reviewed various other specific factors with respect to the Fund, as described below. In their deliberations, the Trustees did not rank the importance of any particular information or factor considered and each Trustee may have attributed different weights to various factors.
The Board concluded that the Fund's gross annual management fee was reasonable as compared to the median gross management fee charged to the funds in the Fund's peer group. The Board noted that the Fund's net annual expense ratio, taking into account any shareholder servicing or distribution fees, was reasonable as compared to the median expense ratio for the peer group. The Board considered the Adviser's contractual agreement to waive its fees and reimburse expenses for a specified period of time, as described in the Fund's prospectus.
The Board then compared the Fund's performance for the one-, three-, five- and ten-year periods ended June 30, 2019, to that of the median performance of the peer group and benchmark index for the same periods and considered the fact that the Fund underperformed the benchmark index for all of the periods reviewed, with the exception of the three-year and five-year periods, underperformed the peer group median for the one- and ten-year periods, matched the peer group median for the three-year period, and outperformed the peer group median for the five-year period.
Having considered, among other things: (1) that the Fund's management fee was within the ranges of advisory fees charged to comparable mutual funds; (2) that the Fund's total expense ratio was reasonable; (3) the Adviser's willingness to limit the expenses for a period of time would provide stability to the Fund's expenses during that period; and (4) the performance of the Fund, the Board concluded that the Agreement continued to be in the best interests of the Fund's shareholders.
Conclusion
Based on its review of the information requested and provided, and following extended discussions, the Board determined that the Agreement, on behalf of the Fund, was consistent with the best interests of the Fund and its shareholders, and the Board unanimously approved the Agreement, on behalf of the Fund, for an additional annual period on the basis of the foregoing review and discussions and the following considerations, among others:
• The fairness and reasonableness of the investment advisory fee payable to the Adviser under the Agreement in light of the investment advisory services provided, the costs of these services, the profitability of the Adviser's relationship with the Fund and the comparability of the fee paid to the fees paid by other investment companies;
• The nature, quality and extent of the investment advisory services provided by the Adviser;
• The Adviser's entrepreneurial commitment to the management of the Fund and the creation of a broad-based family of funds, which could entail a substantial commitment of the Adviser's resources to the successful operation of the Fund;
• The Adviser's representations regarding its staffing and capabilities to manage the Fund, including the retention of personnel with relevant portfolio management experience;
• The Adviser's efforts to enhance investment results by, among other things, developing quality portfolio management teams; and
• The overall high quality of the personnel, operations, financial condition, investment management capabilities, methodologies and performance of the Adviser.
38
Privacy Policy
Protecting the Privacy of Information
The Trust respects your right to privacy. We also know that you expect us to conduct and process your business in an accurate and efficient manner. To do so, we must collect and maintain certain personal information about you. This is the information we collect from you on applications or other forms, and from the transactions you make with us or third parties. It may include your name, address, social security number, account transactions and balances, and information about investment goals and risk tolerance.
We do not disclose any information about you or about former customers to anyone except as permitted or required by law. Specifically, we may disclose the information we collect to companies that perform services on our behalf, such as the transfer agent that processes shareholder accounts and printers and mailers that assist us in the distribution of investor materials. We may also disclose this information to companies that perform marketing services on our behalf. This allows us to continue to offer you Victory investment products and services that meet your investing needs, and to effect transactions that you request or authorize. These companies will use this information only in connection with the services for which we hired them. They are not permitted to use or share this information for any other purpose.
To protect your personal information internally, we permit access only by authorized employees and maintain physical, electronic and procedural safeguards to guard your personal information.*
* You may have received communications regarding information about privacy policies from other financial institutions which gave you the opportunity to "opt-out" of certain information sharing with companies which are not affiliated with that financial institution. The Trust does not share information with other companies for purposes of marketing solicitations for products other than the Trust. Therefore, the Trust does not provide opt-out options to their shareholders.
Victory Funds
P.O. Box 182593
Columbus, Ohio 43218-2593

Visit our website at: | | Call Victory at: | |
www.vcm.com | | 800-539-FUND (800-539-3863) | |
VVIF-RS-SEMVIP-AR (12/19)

December 31, 2019
Annual Report
Victory Variable Insurance Funds
Diversified Stock Fund
Beginning January 1, 2021, as permitted by regulations adopted by the Securities and Exchange Commission, paper copies of the Fund's shareholder reports may no longer be sent by mail from the insurance company that issued your variable annuity and variable life insurance contract, unless you specifically request paper copies of the reports from your insurance company. Instead, the reports will be made available on www.victoryfunds.com. The insurance company that offers your contract may also make these reports available on a website, and such insurance company will notify you by mail each time a report is posted and provide you with a website link to access the report.
If you already elected to receive shareholder reports electronically, you will not be affected by this change and you need not take any action. You may elect to receive shareholder reports and other communications from the insurance company electronically by following the instructions provided by the insurance company.
If offered by your insurance company, you may elect to receive all future reports in paper and free of charge from the insurance company. You can inform your insurance company that you wish to continue receiving paper copies of your reports. Your election to receive reports in paper will apply to all funds available under your contract.
www.vcm.com
News, Information And Education 24 Hours A Day, 7 Days A Week
The Victory Funds site gives fund shareholders, prospective shareholders, and investment professionals a convenient way to access fund information, get guidance, and track fund performance anywhere they can access the Internet. The site includes:
• Detailed performance records
• Daily share prices
• The latest fund news
• Investment resources to help you become a better investor
• A section dedicated to investment professionals
Whether you're a potential investor searching for the fund that matches your investment philosophy, a seasoned investor interested in planning tools, or an investment professional, www.vcm.com has what you seek. Visit us anytime. We're always open.
Victory Variable Insurance Funds
Table of Contents
Shareholder Letter (Unaudited) | | | 2 | | |
Fund Review and Commentary (Unaudited) | | | 3 | | |
Financial Statements | |
Schedule of Portfolio Investments | | | 5 | | |
Statement of Assets and Liabilities | | | 7 | | |
Statement of Operations | | | 8 | | |
Statements of Changes in Net Assets | | | 9 | | |
Financial Highlights | | | 10 | | |
Notes to Financial Statements | | | 12 | | |
Report of Independent Registered Public
Accounting Firm | | | 18 | | |
Supplemental Information (Unaudited) | |
Trustee and Officer Information | | | 19 | | |
Proxy Voting and Portfolio Holdings Information | | | 21 | | |
Expense Examples | | | 21 | | |
Additional Federal Income Tax Information | | | 22 | | |
Advisory Contract Renewal | | | 23 | | |
Privacy Policy (inside back cover) | | | |
The Fund is distributed by Victory Capital Advisers, Inc. Victory Capital Management Inc. is the investment adviser to the Fund and receives fees from the Fund for performing services for the Fund.
This report is not authorized for distribution to prospective investors unless preceded or accompanied by a current prospectus of the Victory Variable Insurance Diversified Stock Fund.
The information in this annual report is based on data obtained from recognized services and sources and is believed to be reliable. Any opinions, projections, or recommendations in this report are subject to change without notice and are not intended as individual investment advice. Past investment performance of the Fund, markets or securities mentioned herein should not be considered to be indicative of future results.
• NOT FDIC INSURED • NO BANK GUARANTEE • MAY LOSE VALUE

Call Victory at:
800-539-FUND (800-539-3863)
Visit our website at:
www.vcm.com
1
Victory Funds Letter to Shareholders
(Unaudited)
Dear Shareholder,
As we turn the page into a new decade, it's hard not to reflect on the fact that we have been enjoying the longest-ever bull market in U.S. equities. The run has been impressive, and despite periods of tumult and plenty of negative news, the bull market endured throughout 2019.
For the annual reporting period ended December 31, 2019, the S&P 500® Index posted impressive gains of 31.49%. This represents the greatest one-year gain since 2013 and also illustrates a swift bounce-back after a precipitous drop late in 2018. The move higher supports the notion that underlying fundamentals of U.S. companies drive performance, rather than the political rancor and headline fears that often capture the attention of investors.
Perhaps we shouldn't be surprised at the impressive performance of equities. The U.S. economy — the world's largest — remains on solid footing and has been a key driver of both domestic and international stocks. Robust job creation, near-record low unemployment, and steady consumer spending continue and offer reasons for further optimism. Meanwhile, inflation remains muted, and the Federal Reserve (the Fed) and other major global central banks have taken an accommodative stance. In fact, the Fed has cut interest rates by a total of 0.75% over three meetings last July, September and October.
The risk-on attitudes of investors, coupled with the accommodative monetary policy, had an expected impact on U.S. Treasury yields. The 10-year Treasury yield declined significantly over the course of 2019, falling from 2.66% to 1.92% at year-end. More interesting, however, was the fact that, the yield on 10-year Treasurys fell below shorter-term yields for the first time since before the 2007-2008 Global Financial Crisis. This inverted yield curve spooked investors for a spell, only to revert back to a traditional upward sloping yield curve by the end of the year.
The robust domestic economy, low interest rates, and ample liquidity from central banks provided a potent tonic for the stock market in 2019. In fact, at year-end 2019, the S&P 500® Index was approaching its highest valuation level since 1999. This reminds all of us to retain some historical context on the bull market. Many of us remember the Global Financial Crisis and, before that, the collapse of the dot-com bubble. Although those are now but a distant memory (and we are not forecasting such tumult), we should not forget that stocks don't always go up and cycles don't last forever. In other words, valuations still matter.
The key point is not to discount the risks. In addition to lofty valuations, investors need to keep apprised of trade disputes, geopolitical hotspots, a contentious U.S. election, and a host of other potential headwinds. Yet it is these very risks — these cross-currents — that may create pricing dislocations. This is an environment in which we believe our Victory Capital independent investment franchises can thrive.
On the following pages, you will find information relating to your Victory Funds investment. If you have any questions, we encourage you to contact your financial advisor. Or, if you invest with us directly, you may call (800) 539-3863, or visit our website at www.vcm.com.
My colleagues and I sincerely appreciate the confidence you have placed in the Victory Funds, and we value the opportunity to help meet your investment goals.

Christopher K. Dyer, CFA
President,
Victory Funds
2
Portfolio Commentary (Unaudited)
Diversified Stock Fund
Portfolio Holdings
As a Percentage of Total Investments
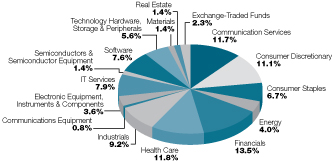
Victory Variable Insurance Diversified Stock Fund Commentary
The Victory Variable Insurance Diversified Stock Fund (the "Fund") seeks to provide long-term growth of capital. The Fund generated a 28.39% total return for the fiscal year ended December 31, 2019, as compared to its benchmark, the S&P 500® Index, which returned 31.49%. It was a banner year for stocks, driven by resilient U.S. economic growth and job creation, dovish global monetary policy, and improving U.S./China trade relations. Technology stocks, including many large-cap Tech/Communication Services giants with durable growth and reasonable valuations, led the indices higher. Higher rates and an improved economic outlook benefited Financials and Industrials, while pressuring defensive/bond proxy sectors (Consumer Discretionary, Real Estate, and Consumer Staples). Energy was the worst performing sector during the fiscal year.
Relative to the benchmark, the Fund's smaller size, value-tilt, and positive beta/volatility exposure detracted from results, as did sector allocation (cash drag, overweight Financials). Good stock selection in Industrials and Consumer Discretionary was offset by challenges in Health Care and Consumer Staples.
In Industrials, Universal Forest Products, Inc., a supplier of wood, wood composite, and other products to the retail, construction, and industrial markets, was a top performer. Since taking our initial position in April, the stock has been propelled higher by a string of better-than-expected results, highlighted by accelerating organic volume growth, and solid margin expansion.
In Consumer Discretionary, our outperformance was mostly driven by our retail holdings, with Target Corporation, the U.S.-based general merchandise retailer with approximately 1,800 stores nationally, one of our top performers. The company is one of the few winners in an otherwise tough retail environment, posting robust same-store-sales and double-digit earnings per share growth.
In Health Care, we had some industry headwinds, mostly from our overweight positioning in managed care and facilities names due to ongoing regulatory concerns heading into the 2020 election (i.e., "Medicare for All"). Importantly, these names have started to show positive relative strength recently, and contributed strongly to relative performance in the fourth quarter. UnitedHealth Group, one of the largest health benefits providers in the United States, is a prime example. The company recently reported strong third quarter results and raised its 2019 full-year adjusted earnings guidance range, driven by strength in its Medicare and commercial health benefits businesses, as well as broad-based strength within its OptumHealth segment. Despite the strong fourth quarter performance, shares remain inexpensive as investors discount Democratic presidential candidates' proposals to remake the American health care system, something we view as unlikely.
In Consumer Staples, Medifast, Inc., a manufacturer and distributor of health products and programs including weight loss / weight management plan OPTAVIA, was our weakest holding. The company cited three sources of business disruption: (1) fraudulent e-commerce credit card transactions, (2) issues with a technology platform migration, and (3) supply chain problems resulting from the 40% increase in manufacturing capacity. We exited our position.
At year end, the Fund had overweight allocations to the Technology Hardware, Storage & Peripherals, Consumer Discretionary, and Communication Services sectors. Within Technology, our largest active industry weightings are in data processing services, system software, distributors, and electronic manufacturing services. In Consumer Discretionary, our biggest active weightings are in housing and general merchandise retail. In Communication Services we have large overweight positions in broadcasting, interactive media, and cable. We maintained underweight allocations to the Consumer Discretionary, Health Care, Real Estate, and Materials sectors. Overall, the style had positive exposure to price momentum, growth, earnings yield, and highly profitable companies, with a smaller size bias.
The Fund continues to focus on companies that we believe have superior earnings growth, return on invested capital, and positive earnings/price momentum combined with a reasonable valuation over a wide spectrum of market capitalizations. We are confident that this combination of characteristics positions the Fund for strong competitive performance in the future.
3
Portfolio Commentary (Unaudited)
Diversified Stock Fund (continued)
Average Annual Total Return
Year Ended December 31, 2019
| | | Class A
Shares | |
| |
Inception Date | | | 7/1/99 | | | | | | |
| | | Net Asset
Value | | S&P 500®
Index1 | |
One Year | | | 28.39 | % | | | 31.49 | % | |
Three Year | | | 12.07 | % | | | 15.27 | % | |
Five Year | | | 7.22 | % | | | 11.70 | % | |
Ten Year | | | 9.79 | % | | | 13.56 | % | |
Since Inception | | | 5.68 | % | | | N/A | | |
Expense Ratios | |
Gross | | | | | 0.96 | % | |
With Applicable Waivers | | | | | 0.96 | % | |
Past performance is not indicative of future results. The performance data quoted represents past performance and current returns may be lower or higher. The investment return and principal value will fluctuate so that an investor's shares, when redeemed, may be worth more or less than the original cost. To obtain performance information current to the most recent month's end, please visit www.vcm.com.
The above expense ratio is from the Fund's prospectus dated April 16, 2019. Additional information pertaining to the Fund's expense ratio as of December 31, 2019 can be found in the financial highlights.
The total return figures set forth above include all waivers of fees for various periods since inception. Without such fee waivers, the total returns would have been lower. Some fee waivers are voluntary and may be modified or terminated at any time. The total returns do not include any insurance, sales or administrative charges of variable annuity or life insurance contracts. If these charges were included, the total returns would have been lower.
Diversified Stock Fund — Growth of $10,000
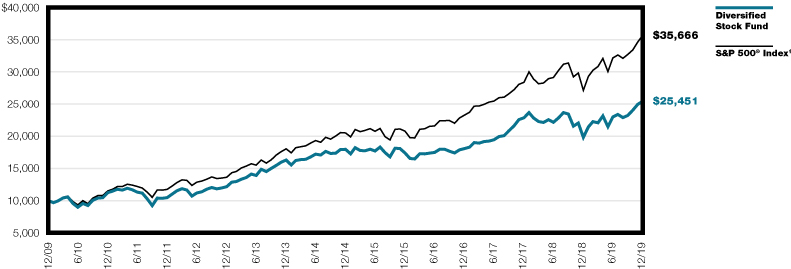
1 The S&P 500® Index is an unmanaged index comprised of 500 domestically traded common stocks, is weighted according to the market value of each common stock in the index, and includes reinvestment of dividends. This index does not include effect of sales charges and is not representative of the Fund. It is not possible to invest directly in an index.
The graph reflects investment of growth of a hypothetical $10,000 investment in the Fund. Past performance is no guarantee of future results.
The graph and table do not reflect the deduction of taxes that a shareholder would pay on Fund distributions or the redemption of Fund shares.
4
Victory Variable Insurance Funds Schedule of Portfolio Investments
Diversified Stock Fund December 31, 2019
(Amounts in Thousands, Except for Shares)
Security Description | | Shares | | Value | |
Common Stocks (97.6%): | |
Communication Services (11.7%): | |
Alphabet, Inc., Class C (a) | | | 866 | | | $ | 1,158 | | |
Comcast Corp., Class A | | | 14,084 | | | | 634 | | |
Facebook, Inc., Class A (a) | | | 3,416 | | | | 701 | | |
Nexstar Media Group, Inc., Class A | | | 3,934 | | | | 461 | | |
The Walt Disney Co. | | | 1,924 | | | | 278 | | |
T-Mobile US, Inc. (a) | | | 2,867 | | | | 225 | | |
| | | | 3,457 | | |
Consumer Discretionary (11.1%): | |
Aaron's, Inc. | | | 3,029 | | | | 173 | | |
Amazon.com, Inc. (a) | | | 425 | | | | 785 | | |
Dollar General Corp. | | | 997 | | | | 156 | | |
DR Horton, Inc. | | | 7,490 | | | | 396 | | |
Group 1 Automotive, Inc. | | | 1,926 | | | | 193 | | |
LCI Industries | | | 1,674 | | | | 179 | | |
LGI Homes, Inc. (a) | | | 2,532 | | | | 179 | | |
Marriott Vacations Worldwide Corp. | | | 1,385 | | | | 178 | | |
Meritage Homes Corp. (a) | | | 4,736 | | | | 289 | | |
Skechers U.S.A., Inc., Class A (a) | | | 7,306 | | | | 316 | | |
Target Corp. | | | 3,461 | | | | 443 | | |
| | | | 3,287 | | |
Consumer Staples (6.7%): | |
PepsiCo, Inc. | | | 2,842 | | | | 388 | | |
The Coca-Cola Co. | | | 7,693 | | | | 426 | | |
The Procter & Gamble Co. | | | 4,617 | | | | 577 | | |
US Foods Holding Corp. (a) | | | 9,885 | | | | 414 | | |
Walmart, Inc. | | | 1,404 | | | | 167 | | |
| | | | 1,972 | | |
Energy (4.0%): | |
Chevron Corp. | | | 2,372 | | | | 286 | | |
Exxon Mobil Corp. | | | 5,934 | | | | 413 | | |
Phillips 66 | | | 2,223 | | | | 248 | | |
Valero Energy Corp. | | | 2,440 | | | | 229 | | |
| | | | 1,176 | | |
Financials (13.5%): | |
Ally Financial, Inc. | | | 12,502 | | | | 382 | | |
Ameriprise Financial, Inc. | | | 2,597 | | | | 433 | | |
Citigroup, Inc. | | | 7,632 | | | | 610 | | |
Discover Financial Services | | | 4,683 | | | | 397 | | |
Essent Group Ltd. | | | 7,443 | | | | 387 | | |
LPL Financial Holdings, Inc. | | | 4,783 | | | | 441 | | |
Meta Financial Group, Inc. | | | 5,032 | | | | 184 | | |
NMI Holdings, Inc., Class A (a) | | | 9,473 | | | | 314 | | |
Primerica, Inc. | | | 3,101 | | | | 405 | | |
Western Alliance Bancorp | | | 7,951 | | | | 453 | | |
| | | | 4,006 | | |
See notes to financial statements.
5
Victory Variable Insurance Funds Schedule of Portfolio Investments — continued
Diversified Stock Fund December 31, 2019
(Amounts in Thousands, Except for Shares)
Security Description | | Shares | | Value | |
Health Care (11.8%): | |
AbbVie, Inc. | | | 6,452 | | | $ | 572 | | |
Anthem, Inc. | | | 1,382 | | | | 416 | | |
Biogen, Inc. (a) | | | 1,164 | | | | 345 | | |
Bristol-Myers Squibb Co. | | | 9,768 | | | | 627 | | |
CVS Health Corp. | | | 3,415 | | | | 254 | | |
HCA Healthcare, Inc. | | | 2,407 | | | | 356 | | |
Jazz Pharmaceuticals PLC (a) | | | 1,859 | | | | 278 | | |
Medtronic PLC | | | 1,169 | | | | 133 | | |
Regeneron Pharmaceuticals, Inc. (a) | | | 773 | | | | 290 | | |
UnitedHealth Group, Inc. | | | 736 | | | | 216 | | |
| | | | 3,487 | | |
Industrials (9.2%): | |
Air Lease Corp. | | | 9,439 | | | | 449 | | |
EMCOR Group, Inc. | | | 4,454 | | | | 384 | | |
Federal Signal Corp. | | | 11,504 | | | | 371 | | |
Kansas City Southern | | | 1,124 | | | | 172 | | |
L3Harris Technologies, Inc. | | | 1,752 | | | | 347 | | |
Lockheed Martin Corp. | | | 1,234 | | | | 480 | | |
SkyWest, Inc. | | | 5,151 | | | | 333 | | |
Universal Forest Products, Inc. | | | 4,053 | | | | 193 | | |
| | | | 2,729 | | |
Information Technology (26.8%): | |
Adobe, Inc. (a) | | | 694 | | | | 229 | | |
Apple, Inc. | | | 5,636 | | | | 1,655 | | |
Booz Allen Hamilton Holdings Corp. | | | 3,833 | | | | 273 | | |
Broadcom, Inc. | | | 1,265 | | | | 400 | | |
CDW Corp. | | | 3,004 | | | | 429 | | |
Cisco Systems, Inc. | | | 4,732 | | | | 227 | | |
EPAM Systems, Inc. (a) | | | 1,383 | | | | 293 | | |
Euronet Worldwide, Inc. (a) | | | 2,575 | | | | 406 | | |
Fiserv, Inc. (a) | | | 3,593 | | | | 415 | | |
Jabil, Inc. | | | 10,686 | | | | 442 | | |
Mastercard, Inc., Class A | | | 757 | | | | 226 | | |
Microsoft Corp. | | | 10,749 | | | | 1,695 | | |
Oracle Corp. | | | 6,082 | | | | 322 | | |
Visa, Inc., Class A | | | 1,718 | | | | 323 | | |
WNS Holdings Ltd., ADR (a) | | | 6,445 | | | | 427 | | |
Zebra Technologies Corp. (a) | | | 730 | | | | 186 | | |
| | | | 7,948 | | |
Materials (1.4%): | |
Vulcan Materials Co. | | | 2,896 | | | | 417 | | |
Real Estate (1.4%): | |
CBRE Group, Inc., Class A (a) | | | 6,868 | | | | 421 | | |
Total Common Stocks (Cost $22,528) | | | 28,900 | | |
Exchange-Traded Fund (2.3%): | |
SPDR S&P 500 ETF Trust | | | 2,129 | | | | 685 | | |
Total Exchange-Traded Fund (Cost $665) | | | 685 | | |
Total Investments (Cost $23,193) — 99.9% | | | 29,585 | | |
Other assets in excess of liabilities — 0.1% | | | | | 33 | | |
NET ASSETS — 100.0% | | $ | 29,618 | | |
(a) Non-income producing security.
ADR — American Depositary Receipt
PLC — Public Liability Company
ETF — Exchange-Traded Fund
See notes to financial statements.
6
Statement of Assets and Liabilities
Victory Variable Insurance Funds December 31, 2019
(Amounts in Thousands, Except for Per Share Amounts)
| | | Victory
Variable
Insurance
Diversified
Stock Fund | |
ASSETS: | |
Investments, at value (Cost $23,193) | | $ | 29,585 | | |
Cash and cash equivalents | | | 86 | | |
Dividends receivable | | | 15 | | |
Prepaid expenses | | | 2 | | |
Total Assets | | | 29,688 | | |
LIABILITIES: | |
Payables: | |
Capital shares redeemed | | | 13 | | |
Accrued expenses and other payables: | |
Investment advisory fees | | | 8 | | |
Administration fees | | | 1 | | |
Contract owner fees | | | 30 | | |
Transfer agent fees | | | — | (a) | |
Compliance fees | | | — | (a) | |
Trustees' fees | | | — | (a) | |
| 12b-1 fees | | | 3 | | |
Other accrued expenses | | | 15 | | |
Total Liabilities | | | 70 | | |
NET ASSETS: | |
Capital | | | 21,685 | | |
Total distributable earnings/(loss) | | | 7,933 | | |
Net Assets | | $ | 29,618 | | |
Shares (unlimited number of shares authorized with a par value of $0.001 per share) | | | 2,403 | | |
Net asset value, offering price & redemption price per share (b) | | $ | 12.32 | | |
(a) Rounds to less than $1.
(b) Per share amount may not recalculate due to rounding of net assets and/or shares outstanding.
See notes to financial statements.
7
Statement of Operations
Victory Variable Insurance Funds For the Year Ended December 31, 2019
(Amounts in Thousands)
| | | Victory
Variable
Insurance
Diversified
Stock Fund | |
Investment Income: | |
Interest | | $ | 7 | | |
Dividends | | | 440 | | |
Securities lending (net of fees) | | | — | (a) | |
Total Income | | | 447 | | |
Expenses: | |
Investment advisory fees | | | 90 | | |
Administration fees | | | 18 | | |
Contract owner fees | | | 73 | | |
| 12b-1 fees | | | 75 | | |
Custodian fees | | | 2 | | |
Transfer agent fees | | | — | (a) | |
Trustees' fees | | | 2 | | |
Compliance fees | | | — | (a) | |
Legal and audit fees | | | 11 | | |
Other expenses | | | 27 | | |
Total Expenses | | | 298 | | |
Net Investment Income (Loss) | | | 149 | | |
Realized/Unrealized Gains (Losses) from Investments: | |
Net realized gains (losses) from investment securities | | | 1,600 | | |
Net change in unrealized appreciation/depreciation on investment securities | | | 5,670 | | |
Net realized/unrealized gains on investments | | | 7,270 | | |
Change in net assets resulting from operations | | $ | 7,419 | | |
(a) Rounds to less than $1.
See notes to financial statements.
8
Victory Variable Insurance Funds Statements of Changes in Net Assets
(Amounts in Thousands)
| | | Victory Variable Insurance
Diversified Stock Fund | |
| | | Year
Ended
December 31,
2019 | | Year
Ended
December 31,
2018 | |
From Investment Activities: | |
Operations: | |
Net investment income (loss) | | $ | 149 | | | $ | 174 | | |
Net realized gains (losses) from investments | | | 1,600 | | | | 1,594 | | |
Net change in unrealized appreciation/depreciation on investments | | | 5,670 | | | | (6,154 | ) | |
Change in net assets resulting from operations | | | 7,419 | | | | (4,386 | ) | |
Change in net assets resulting from distributions to shareholders | | | (1,827 | ) | | | (5,921 | ) | |
Change in net assets resulting from capital transactions | | | (4,104 | ) | | | (440 | ) | |
Change in net assets | | | 1,488 | | | | (10,747 | ) | |
Net Assets: | |
Beginning of period | | | 28,130 | | | | 38,877 | | |
End of period | | $ | 29,618 | | | $ | 28,130 | | |
Capital Transactions: | |
Proceeds from shares issued | | $ | 275 | | | $ | 235 | | |
Dividends reinvested | | | 1,827 | | | | 5,921 | | |
Cost of shares redeemed | | | (6,206 | ) | | | (6,596 | ) | |
Change in net assets resulting from capital transactions | | $ | (4,104 | ) | | $ | (440 | ) | |
Share Transactions: | |
Issued | | | 23 | | | | 17 | | |
Reinvested | | | 150 | | | | 580 | | |
Redeemed | | | (523 | ) | | | (451 | ) | |
Change in Shares | | | (350 | ) | | | 146 | | |
See notes to financial statements.
9
Victory Variable Insurance Funds Financial Highlights
For a Share Outstanding Throughout Each Period
| | | | | Investment Activities | | Distributions to
Shareholders From | |
| | | Net Asset
Value,
Beginning of
Period | | Net
Investment
Income (Loss) | | Net Realized
and Unrealized
Gains (Losses)
on Investments | | Total from
Investment
Activities | | Net
Investment
Income | | Net Realized
Gains from
Investments | |
Victory Variable Insurance Diversified Stock Fund | |
Year Ended December 31, 2019 | | $ | 10.22 | | | | 0.06 | (b) | | | 2.82 | | | | 2.88 | | | | (0.06 | ) | | | (0.72 | ) | |
Year Ended December 31, 2018 | | $ | 14.91 | | | | 0.07 | (b) | | | (2.07 | ) | | | (2.00 | ) | | | (0.06 | ) | | | (2.63 | ) | |
Year Ended December 31, 2017 | | $ | 12.03 | | | | 0.09 | (b) | | | 3.08 | | | | 3.17 | | | | (0.09 | ) | | | (0.20 | ) | |
Year Ended December 31, 2016 | | $ | 12.75 | | | | 0.13 | (b) | | | 0.37 | | | | 0.50 | | | | (0.13 | ) | | | (1.09 | ) | |
Year Ended December 31, 2015 | | $ | 15.15 | | | | 0.09 | | | | (0.53 | ) | | | (0.44 | ) | | | (0.09 | ) | | | (1.87 | ) | |
(a) Total returns do not include any insurance, sales, or administrative charges of variable annuity or life insurance contracts. If these charges were included,
the returns would be lower.
(b) Per share net investment income (loss) has been calculated using the average daily shares method.
See notes to financial statements.
10
Victory Variable Insurance Funds Financial Highlights — continued
For a Share Outstanding Throughout Each Period
| | | | | Ratios to Average Net Assets | | Supplemental Data | |
| | | Total
Distributions | | Net Asset
Value,
End of
Period | | Total
Return(a) | | Net
Expenses | | Net
Investment
Income
(Loss) | | Gross
Expenses | | Net Assets,
End of
Period
(000's) | | Portfolio
Turnover | |
Victory Variable Insurance Diversified Stock Fund | |
Year Ended December 31, 2019 | | | (0.78 | ) | | $ | 12.32 | | | | 28.39 | % | | | 0.99 | % | | | 0.50 | % | | | 0.99 | % | | $ | 29,618 | | | | 113 | % | |
Year Ended December 31, 2018 | | | (2.69 | ) | | $ | 10.22 | | | | (13.30 | )% | | | 0.96 | % | | | 0.50 | % | | | 0.96 | % | | $ | 28,130 | | | | 114 | % | |
Year Ended December 31, 2017 | | | (0.29 | ) | | $ | 14.91 | | | | 26.45 | % | | | 0.94 | % | | | 0.68 | % | | | 0.94 | % | | $ | 38,877 | | | | 138 | % | |
Year Ended December 31, 2016 | | | (1.22 | ) | | $ | 12.03 | | | | 3.90 | % | | | 1.08 | % | | | 1.06 | % | | | 1.08 | % | | $ | 33,987 | | | | 86 | % | |
Year Ended December 31, 2015 | | | (1.96 | ) | | $ | 12.75 | | | | (3.11 | )% | | | 1.14 | % | | | 0.56 | % | | | 1.14 | % | | $ | 38,441 | | | | 78 | % | |
See notes to financial statements.
11
Notes to Financial Statements
Victory Variable Insurance Funds December 31, 2019
1. Organization:
Victory Variable Insurance Funds (the "Trust") was organized on February 11, 1998 as a Delaware statutory trust. The Trust is registered under the Investment Company Act of 1940, as amended (the "1940 Act"), as a diversified open-end investment company. The Trust is comprised of nine funds and is authorized to issue an unlimited number of shares, which are units of beneficial interest with a par value of $0.001 per share.
The accompanying financial statements are those of the Victory Variable Insurance Diversified Stock Fund (the "Fund"). The Fund offers a single class of shares: Class A Shares. Sales of shares of the Fund may only be made to separate accounts of various life insurance companies. The Fund seeks to provide long-term growth of capital.
Under the Trust's organizational documents, its officers and trustees are indemnified against certain liabilities arising out of the performance of their duties to the Fund. In addition, in the normal course of business, the Fund enters into contracts with its vendors and others that provide for general indemnifications. The Fund's maximum exposure under these arrangements is unknown, as this would involve future claims that may be made against the Fund. However, based on experience, the Fund expects that risk of loss to be remote.
2. Significant Accounting Policies:
The following is a summary of significant accounting policies followed by the Trust in the preparation of its financial statements. The policies are in conformity with accounting principles generally accepted in the United States of America ("GAAP"). The preparation of financial statements in accordance with GAAP requires management to make estimates and assumptions that affect the reported amounts of assets and liabilities and disclosure of contingent assets and liabilities at the date of the financial statements and the reported amounts of income and expenses for the period. Actual results could differ from those estimates. The Fund follows the specialized accounting and reporting requirements under GAAP that are applicable to investment companies.
Investment Valuation:
The Fund records investments at fair value. Fair value is defined as the price that would be received to sell an asset or paid to transfer a liability in an orderly transaction between market participants at the measurement date.
The valuation techniques described below maximize the use of observable inputs and minimize the use of unobservable inputs in determining fair value. The inputs used for valuing the Fund's investments are summarized in the three broad levels listed below:
• Level 1 — quoted prices in active markets for identical securities
• Level 2 — other significant observable inputs (including quoted prices for similar securities or interest rates applicable to those securities, etc.)
• Level 3 — significant unobservable inputs (including the Fund's own assumptions in determining the fair value of investments)
Changes in valuation techniques may result in transfers in or out of an assigned level within the disclosure hierarchy. The inputs or methodologies used for valuation techniques are not necessarily an indication of the risk associated with entering into those investments.
Portfolio securities listed or traded on securities exchanges, including exchange-traded funds ("ETF") American Depositary Receipts ("ADRs") and Rights, are valued at the closing price on the exchange or system where the security is principally traded, if available, or at the Nasdaq Official Closing Price. If there have been no sales for that day on the exchange or system, then a security is valued at the last available bid quotation on the exchange or system where the security is principally traded. In each of these situations, valuations are typically categorized as Level 1 in the fair value hierarchy.
Investments for which there are no such quotations, or for which quotations do not appear reliable, are valued at fair value in accordance with procedures established by and under the general supervision and responsibility of the Trust's Board of Trustees (the "Board"). These valuations are typically categorized as Level 2 or Level 3 in the fair value hierarchy, based on the observability of inputs used to determine the fair value.
A summary of the valuations as of December 31, 2019, based upon the three levels defined above, is included in the table below while the breakdown, by category, of investments is disclosed in the Schedule of Portfolio Investments (amounts in thousands).
| | | LEVEL 1 | | Total | |
Common Stocks | | $ | 28,900 | | | $ | 28,900 | | |
Exchange-Traded Funds | | | 685 | | | | 685 | | |
Total | | $ | 29,585 | | | $ | 29,585 | | |
For the year ended December 31, 2019, there were no Level 3 investments for which significant unobservable inputs were used to determine fair value.
12
Notes to Financial Statements — continued
Victory Variable Insurance Funds December 31, 2019
Investment Companies:
The Fund may invest in ETFs. Shares of an ETF are bought and sold on a securities exchange. An ETF trades like common stock and represents a fixed portfolio of securities designed to track the performance and dividend yield of a particular domestic or foreign market index. The Fund may purchase shares of an ETF to temporarily gain exposure to a portion of the U.S. or a foreign market while awaiting purchase of underlying securities. The risks of owning an ETF generally reflect the risks of owning the underlying securities they are designed to track, although the lack of liquidity of an ETF could result in it being more volatile. Additionally, ETFs have fees and expenses that reduce their value.
Investment Transactions and Related Income:
Changes in holdings of investments are accounted for no later than one business day following the trade date. For financial reporting purposes, however, investment transactions are accounted for on trade date on the last business day of the reporting period. Interest income is determined on the basis of coupon interest accrued using the effective interest method which adjusts, where applicable, the amortization of premiums or accretion of discounts. Dividend income is recorded on the ex-dividend date. Gains or losses realized on sales of securities are determined by comparing the identified cost of the security lot sold with the net sales proceeds.
Withholding taxes on interest, dividends and gains as a result of certain investments in ADRs by the Fund have been provided for in accordance with each investment's applicable country's tax rules and rates.
Securities Lending:
The Trust has entered into a Master Securities Lending Agreement ("MSLA") with Citibank, N.A. ("Citibank" or the "Agent"). Under the terms of the MSLA, the Fund may lend securities to certain broker-dealers and banks in exchange for collateral in the amount of at least 102% of the value of U.S. securities loaned or at least 105% of the value of non-U.S. securities loaned, marked-to-market daily. Any collateral shortfalls associated with increases in the valuation of the securities loaned are adjusted the next business day. The collateral can be received in the form of cash collateral and/or non-cash collateral. Non-cash collateral can include U.S. Government Securities, letters of credit and certificates of deposit. The cash collateral is invested in short-term instruments or cash equivalents as noted on the Fund's Schedule of Portfolio Investments. The Trust does not have effective control of the non-cash collateral and therefore it is not disclosed in the Fund's Schedule of Portfolio Investments. The Fund continues to benefit from interest or dividends on the securities loaned and may also earn a return from the collateral. The Fund pays various fees in connection with the investment of cash collateral. The Fund pays the Agent fees based on the investment income received from securities lending activities. Securities lending income is disclosed in the Fund's Statement of Operations. Although risk is mitigated by the collateral, the Fund could experience a delay in recovering its securities and possible loss of income or value if the borrower fails to return them.
Securities lending transactions are entered into by the Fund under the MSLA, which permits the Fund, under certain circumstances such as an event of default, to offset amounts payable by the Fund to the same counterparty against amounts receivable from the counterparty to create a net payment due to or from the Fund.
As of December 31, 2019, the Fund did not have any securities on loan.
Distributions to Shareholders:
Dividends from net investment income, if any, are declared and paid quarterly by the Fund. Distributable net realized gains, if any, are declared and distributed at least annually.
The amounts of dividends from net investment income and distributions from net realized gains are determined in accordance with federal income tax regulations, which may differ from GAAP. To the extent these "book/tax" differences are permanent in nature (e.g., net operating loss and distribution reclassification), such amounts are reclassified within the components of net assets based on their federal tax-basis treatment; temporary differences (e.g., wash sales) do not require reclassification. To the extent dividends and distributions exceed net investment income and net realized gains for tax purposes, they are reported as distributions of capital. Net investment losses incurred by the Fund may be reclassified as an offset to capital on the accompanying Statement of Assets and Liabilities.
As of December 31, 2019, on the Statement of Assets and Liabilities, there were no permanent book-to-tax difference reclassification adjustments.
Federal Income Taxes:
It is the policy of the Fund to continue to qualify as a regulated investment company by complying with the provisions available to certain investment companies, as defined in applicable sections of the Internal Revenue Code, and to make distributions of net investment income and net realized gains sufficient to relieve it from all, or substantially all, federal income taxes. Accordingly, no provision for federal income taxes is required in the financial statements. The Fund has a tax year end of December 31.
Management of the Fund has reviewed tax positions taken in tax years that remain subject to examination by all major tax jurisdictions, including federal (i.e., all open tax years and the interim tax period since then). Management believes that there is no tax liability resulting from unrecognized tax benefits related to uncertain tax positions taken.
13
Notes to Financial Statements — continued
Victory Variable Insurance Funds December 31, 2019
Allocations:
Expenses directly attributable to the Fund are charged to the Fund, while expenses which are attributable to more than one fund in the Trust, or jointly with an affiliated trust, are allocated among the respective funds in the Trust and/or affiliated trust based upon net assets or another appropriate basis.
Cross-Trade Transactions:
Pursuant to Rule 17a-7 under the 1940 Act, the Fund may engage in cross-trades which are securities transactions with affiliated investment companies and advisory accounts managed by the Adviser and any applicable sub-adviser. Any such purchase or sale transaction must be effected without brokerage commission or other remuneration, except for customary transfer fees. The transaction must be effected at the current market price, which is either the security's last sale price on an exchange or, if there are no transactions in the security that day, at the average of the highest bid and lowest asked price. For the year ended December 31, 2019, the Fund did not engage in any Rule 17a-7 transactions under the 1940 Act.
3. Purchases and Sales of Securities:
Purchases and sales of securities (excluding securities maturing less than one year from acquisition) for the year ended December 31, 2019 were as follows for the Fund (amounts in thousands):
| Purchases | | Sales | |
| $ | 33,385 | | | $ | 38,728 | | |
For the year ended December 31, 2019, there were no purchases or sales of U.S. government securities.
4. Fees and Transactions with Affiliates and Related Parties:
Investment advisory services are provided to the Fund by Victory Capital Management Inc. ("VCM" or the "Adviser"), a New York corporation registered as an investment adviser with the Securities and Exchange Commission ("SEC"). The Adviser is a wholly owned indirect subsidiary of Victory Capital Holdings, Inc., a publicly traded Delaware corporation, and a wholly owned direct subsidiary of Victory Capital Operating, LLC.
Under the terms of the Investment Advisory Agreements, the Adviser is entitled to receive 0.30% of the average daily net assets of the Fund. The Adviser may use its resources to assist with the Fund's distribution and marketing expenses.
VCM also serves as the Fund's administrator and fund accountant. Under an Administration and Fund Accounting Agreement, VCM is paid for its services an annual fee at a rate of 0.08% of the first $15 billion in average daily net assets of the Trust, Victory Portfolios and Victory Portfolios II (collectively, the "Victory Funds Complex"), 0.05% of the average daily net assets above $15 billion to $30 billion of the Victory Funds Complex and 0.04% of the average daily net assets over $30 billion of the Victory Funds Complex.
Citi Fund Services Ohio, Inc. ("Citi"), an affiliate of Citibank, acts as sub-administrator and sub-fund accountant to the Fund pursuant to a Sub-Administration and Sub-Fund Accounting Services Agreement between VCM and Citi. VCM pays Citi a fee for providing these services. The Trust reimburses VCM and Citi for all of their reasonable out-of-pocket expenses incurred in providing these services.
FIS Investor Services, LLC ("FIS") serves as the Fund's transfer agent. Under the Transfer Agent Agreement, the Trust pays FIS a fee for its services and reimburses FIS for all of their reasonable out-of-pocket expenses incurred in providing these services.
The Chief Compliance Officer ("CCO") is an employee of the Adviser, which pays the compensation of the CCO and his support staff. The Trust has entered into an Agreement to provide compliance services with the Adviser, pursuant to which the Adviser furnishes its compliance personnel, including the services of the CCO, and other resources reasonably necessary to provide the Trust with compliance oversight services related to the design, administration and oversight of a compliance program for the Trust in accordance with Rule 38a-1 under the 1940 Act. The Funds in the Victory Funds Complex, in aggregate, compensate the Adviser for these services.
The Victory Funds Complex pays an annual retainer to each Independent Trustee, plus an additional annual retainer to the Chairman of the Board. The aggregate amount of the fees and expenses of the Independent Trustees are allocated amongst all the funds in the Victory Funds Complex and are presented in the Statement of Operations.
Shearman & Sterling LLP provides legal services to the Trust.
Victory Capital Advisers, Inc. (the "Distributor"), an affiliate of the Adviser, serves as distributor for the continuous offering of the shares of the Fund pursuant to a Distribution Agreement between the Distributor and the Trust.
Pursuant to the Trust's Distribution and Service Plans adopted in accordance with Rule 12b-1 under the 1940 Act, the Distributor may receive a monthly distribution and service fee, at an annual rate of 0.25% of the average daily net assets of the Fund. The Distributor may pay a 12b-1 fee to life insurance companies for activities primarily intended to result in the sale of Fund shares to life insurance companies for the purpose of funding variable annuity contracts and variable life insurance policies or to provide services to owners
14
Notes to Financial Statements — continued
Victory Variable Insurance Funds December 31, 2019
of variable annuity contracts and variable life insurance policies whose contracts or policies are funded with shares of the Fund, which services are not otherwise provided by life insurance companies and paid for with fees charged by life insurance companies. The Distributor re-allowed all except for approximately $1 thousand to life insurance companies to provide these services.
The Fund has entered into Contract Owner Administrative Services Agreements with certain contract owner servicing agents. A contract owner servicing agent performs a number of services for its customers who hold contracts offered by separate accounts that invest in the Fund, such as establishing and maintaining accounts and records, processing additional contract units attributable to Fund dividend payments, arranging for bank wires, assisting in transactions, and changing account information. For these services, Class A Shares of the Fund pay a fee at an annual rate of up to 0.25% of its average daily net assets serviced by the agent. The Fund may enter into these agreements with financial institutions that provide such services. Contract owner servicing agents may waive all or a portion of their fee. (Not all agents may provide all services listed above.)
The Adviser may voluntarily waive or reimburse additional fees to assist the Fund in maintaining a competitive expense ratio. Voluntary waivers and reimbursements applicable to the Fund are not available to be recouped at a future time. There were no voluntary waivers or reimbursements for the year ended December 31, 2019.
Certain officers and/or interested trustees of the Fund are also officers and/or employees of the Adviser, Administrator, Fund Accountant, Sub-Administrator, Sub-Fund Accountant and Legal Counsel.
5. Risks:
The Fund may be subject to other risks in addition to these identified risks.
An investment in the Fund's shares represents an indirect investment in the securities owned by the Fund, some of which will be traded on a national securities exchange or in the over-the-counter markets. The value of the securities in which the Fund invests, like other market investments, may move up or down, sometimes rapidly and unpredictably. The value of the securities in which the Fund invests may affect the value of the Fund's shares. An investment in the Fund's shares at any point in time may be worth less than the original investment, even after taking into account the reinvestment of the Fund's distributions.
The Fund will be subject to credit risk with respect to the amount it expects to receive from counterparties for financial instruments entered into by the Fund. The Fund may be negatively impacted if a counterparty becomes bankrupt or otherwise fails to perform its obligations due to financial difficulties. The Fund may experience significant delays in obtaining any recovery in bankruptcy or other reorganization proceeding and the Fund may obtain only limited recovery or may obtain no recovery in such circumstances. The Fund typically enters into transactions with counterparties whose credit ratings are investment grade, as determined by a nationally recognized statistical rating organization or, if unrated, judged by the Adviser to be of comparable quality.
6. Borrowing and Interfund Lending:
Line of Credit:
For the year ended December 31, 2019, the Victory Funds Complex participated in a short-term, demand note "Line of Credit" with Citibank. Under the agreement with Citibank, for the period January 1, 2019 to June 30, 2019, the Victory Funds Complex could borrow up to $250 million, of which $100 million was committed and $150 million was uncommitted. Effective July 1, 2019, the agreement was amended to include the USAA Mutual Funds Complex (another series of mutual funds managed by the Adviser) and has a new termination date of June 29, 2020. Under this amended agreement, the Victory Funds Complex and USAA Mutual Funds Complex, combined, may borrow up to $600 million, of which $300 million is committed and $300 million is uncommitted. $40 million of the Line of Credit is reserved for use by the Victory Floating Rate Fund (herein, the "Fund"), another series of the Victory Funds Complex, with that Fund paying the related commitment fees for that amount. The purpose of the agreement is to meet temporary or emergency cash needs, including redemption requests that might otherwise require the untimely disposition of securities. With the agreement in effect for the period January 1, 2019 to June 30, 2019, Citibank received an annual commitment fee of 0.15% on $100 million for providing the Line of Credit. For the period July 1, 2019 to December 31, 2019, Citibank received an annual commitment fee of 0.15% on $300 million for providing the Line of Credit. For the year ended December 31, 2019, Citibank earned approximately $300 thousand in commitment fees from the combined Victory Funds Complex and USAA Mutual Funds Complex. Each fund in the Victory Funds Complex and the USAA Mutual Funds Complex pays a pro-rata portion of the commitment fees plus any interest (one month LIBOR plus one percent) on amounts borrowed. Interest charged to the Fund during the period, if applicable, is presented on the Statement of Operations under Line of credit fees.
The Fund did not utilize the Line of Credit during the year ended December 31, 2019.
Interfund Lending:
The Trust and Adviser rely on an exemptive order granted by the SEC in March 2017 (the "Order"), permitting the establishment and operation of an Interfund Lending Facility (the "Facility"). The Facility allows the Fund to directly lend and borrow money to or from any other Victory Fund relying upon the Order at rates beneficial to both the borrowing and lending funds. Advances under the Facility
15
Notes to Financial Statements — continued
Victory Variable Insurance Funds December 31, 2019
are allowed for temporary or emergency purposes, including the meeting of redemption requests that otherwise might require the untimely disposition of securities, and are subject to each fund's borrowing restrictions. The interfund loan rate is determined, as specified in the Order, by averaging the current repurchase agreement rate and the current bank loan rate. As a Borrower, interest charged to the Fund during the period, if applicable, is presented on the Statement of Operations under Interfund lending fees. As a Lender, interest earned by the Fund during the period, if applicable, is presented on the Statement of Operations under Income on interfund lending.
The Fund did not utilize the Facility during the year ended December 31, 2019.
7. Federal Income Tax Information:
The tax character of distributions paid during the most recent tax years ended, as noted below, were as follows (total distributions paid may differ from the Statements of Changes in Net Assets because, for tax purposes, dividends are recognized when actually paid) (amounts in thousands):
| | | Year Ended December 31, 2019
Distributions paid from | |
| | | Ordinary
Income | | Net
Long-Term
Capital
Gains | | Total
Distributions
Paid | |
| | | | | $ | 384 | | | $ | 1,443 | | | $ | 1,827 | | |
| | | Year Ended December 31, 2018
Distributions paid from | |
| | | Ordinary
Income | | Net
Long-Term
Capital
Gains | | Total
Distributions
Paid | |
| | | | | $ | 2,582 | | | $ | 3,339 | | | $ | 5,921 | | |
As of December 31, 2019, the components of accumulated earnings/(deficit) on a tax basis were as follows (amounts in thousands):
Undistributed
Ordinary
Income | | Undistributed
Long-Term
Capital Gains | | Accumulated
Earnings | | Accumulated
Capital and
Other
Losses | | Unrealized
Appreciation/
(Depreciation) | | Total
Accumulated
Earnings
(Deficit) | |
| $ | 518 | | | $ | 1,056 | | | $ | 1,574 | | | | — | | | $ | 6,359 | | | $ | 7,933 | | |
During the most recent tax year ended December 31, 2019, the Fund did not utilize capital loss carryforwards.
At December 31, 2019, the cost basis for federal income tax purposes, gross unrealized appreciation, gross unrealized depreciation and net unrealized appreciation (depreciation) for investments and derivatives were as follows (amounts in thousands):
Cost of
Investments
for Federal
Tax Purposes | | Gross
Unrealized
Appreciation | | Gross
Unrealized
Depreciation | | Net
Unrealized
Appreciation
(Depreciation) | |
| $ | 23,226 | | | $ | 6,549 | | | $ | (190 | ) | | $ | 6,359 | | |
16
Notes to Financial Statements — continued
Victory Variable Insurance Funds December 31, 2019
8. Fund Ownership:
Ownership of more than 25% of the voting securities of a fund creates presumptions of control of the Fund, under section 2(a)(9) of the 1940 Act. As of December 31, 2019, the shareholder listed below held more than 25% of the shares outstanding of the Fund and may be deemed to control the Fund.
| Shareholder | | Percent | |
| NYLIAC | | | 89.6 | % | |
9. Subsequent Events:
The Fund has evaluated the need for additional disclosures or adjustments resulting from subsequent events through the date these financial statements were issued. Based on this evaluation, there were no subsequent events to report that would have a material impact on the Fund's financial statements.
17
REPORT OF INDEPENDENT REGISTERED PUBLIC ACCOUNTING FIRM
To the Shareholders and Board of Trustees of Victory Variable Insurance Funds
Opinion on the Financial Statements
We have audited the accompanying statement of assets and liabilities, including the schedule of portfolio investments, of Victory Variable Insurance Diversified Stock Fund (the "Fund"), a series of Victory Variable Insurance Funds, as of December 31, 2019, the related statements of operations and changes in net assets, including the related notes, and the financial highlights for the year then ended (collectively referred to as the "financial statements"). In our opinion, the financial statements present fairly, in all material respects, the financial position of the Fund as of December 31, 2019, the results of its operations, the changes in its net assets, and the financial highlights for the year then ended, in conformity with accounting principles generally accepted in the United States of America.
The Fund's financial statements and financial highlights for the years ended December 31, 2018 and prior, were audited by other auditors whose report dated February 15, 2019, expressed an unqualified opinion on those financial statements and financial highlights.
Basis for Opinion
These financial statements are the responsibility of the Fund's management. Our responsibility is to express an opinion on the Fund's financial statements based on our audit. We are a public accounting firm registered with the Public Company Accounting Oversight Board (United States) ("PCAOB") and are required to be independent with respect to the Fund in accordance with the U.S. federal securities laws and the applicable rules and regulations of the Securities and Exchange Commission and the PCAOB.
We conducted our audit in accordance with the standards of the PCAOB. Those standards require that we plan and perform the audit to obtain reasonable assurance about whether the financial statements are free of material misstatement whether due to error or fraud.
Our audit included performing procedures to assess the risks of material misstatement of the financial statements, whether due to error or fraud, and performing procedures that respond to those risks. Such procedures included examining, on a test basis, evidence regarding the amounts and disclosures in the financial statements. Our procedures included confirmation of securities owned as of December 31, 2019, by correspondence with the custodian. Our audit also included evaluating the accounting principles used and significant estimates made by management, as well as evaluating the overall presentation of the financial statements. We believe that our audit provides a reasonable basis for our opinion.
We have served as the auditor of one or more of the investment companies advised by Victory Capital Management, Inc. since 2015.

COHEN & COMPANY, LTD.
Cleveland, Ohio
February 18, 2020
18
Supplemental Information
Victory Variable Insurance Funds December 31, 2019
(Unaudited)
Trustee and Officer Information
Board of Trustees:
Overall responsibility for management of the Trust rests with the Board. The Trust is managed by the Board in accordance with the laws of the State of Delaware. There are currently ten Trustees, nine of whom are not "interested persons" of the Trust within the meaning of that term under the 1940 Act ("Independent Trustees") and one of whom is an "interested person" of the Trust within the meaning of that term under the 1940 Act ("Interested Trustee"). The Trustees, in turn, elect the officers of the Trust to actively supervise its day-to-day operations. The following tables list the Trustees, their ages, position with the Trust, commencement of service, principal occupations during the past five years and any directorships of other investment companies or companies whose securities are registered under the Securities Exchange Act of 1934, as amended, or who file reports under that Act. Each Trustee oversees nine portfolios in the Trust, 42 portfolios in Victory Portfolios and 26 portfolios in Victory Portfolios II, each a registered investment company that, together with the Trust, comprise the Victory Funds Complex. Each Trustee's address is c/o Victory Variable Insurance Funds, 4900 Tiedeman Road, 4th Floor, Brooklyn, Ohio 44144. Each Trustee has an indefinite term.
Name and Age | | Position Held
with the Trust | | Date
Commenced
Service | | Principal Occupation
During Past 5 Years | | Other Directorships
Held
During Past 5 Years | |
Independent Trustees. | | | | | | | | | |
David Brooks Adcock, 68 | | Trustee | | February 2005 | | Consultant (since 2006). | | Chair and Trustee, Turner Funds (December 2016-December 2017). | |
Nigel D.T. Andrews, 72 | | Vice Chair and Trustee | | August 2002 | | Retired. | | Director, TCG BDC II, Inc. (since 2017); Director, TCG BDC I, Inc. (formerly Carlyle GMS Finance, Inc.) (since 2012); Director, Old Mutual US Asset Management (2002-2014). | |
E. Lee Beard, 68* | | Trustee | | February 2005 | | Retired (since 2015); Consultant, The Henlee Group, LLC (consulting) (2005-2015). | | None. | |
Dennis M. Bushe, 76 | | Trustee | | July 2016 | | Retired. | | Trustee, RS Investment Trust and RS Variable Products Trust (November 2011-July 2016). | |
Sally M. Dungan, 65 | | Trustee | | February 2011 | | Chief Investment Officer, Tufts University (since 2002). | | None. | |
John L. Kelly, 66 | | Trustee | | February 2015 | | Partner, McCarvill Capital Partners (September 2016-September 2017); Advisor, Endgate Commodities LLC (January 2016-April 2016); Managing Partner, Endgate Commodities LLC (August 2014-January 2016); Chief Operating Officer, Liquidnet Holdings, Inc. (December 2011-July 2014). | | Director, Caledonia Mining Corporation (since May 2012). | |
David L. Meyer, 62* | | Trustee | | December 2008 | | Retired. | | None. | |
Gloria S. Nelund, 58 | | Trustee | | July 2016 | | Chair, CEO and Co-Founder of TriLinc Global, LLC, an investment firm. | | TriLinc Global Impact Fund, LLC (since 2012); Trustee, RS Investment Trust and RS Variable Products Trust (November 2007-July 2016). | |
Leigh A. Wilson, 75 | | Chair and Trustee | | February 1998 | | Private Investor. | | Chair (since 2013), Caledonia Mining Corporation. | |
Interested Trustee. | | | | | | | | | |
David C. Brown, 47** | | Trustee | | May 2008 | | Chairman and Chief Executive Officer (since 2013), Co-Chief Executive Officer (2011-2013), the Adviser; Chairman and Chief Executive Officer, Victory Capital Holdings, Inc. (since 2013). | | USAA Mutual Funds Trust. | |
* The Board has designated Mr. Meyer and Ms. Beard as its Audit Committee Financial Experts.
** Mr. Brown is an "Interested Person" by reason of his relationship with the Adviser.
The Statement of Additional Information includes additional information about the Trustees of the Trust and is available, without charge, by calling 800-539-3863.
19
Supplemental Information — continued
Victory Variable Insurance Funds December 31, 2019
(Unaudited)
Officers:
The officers of the Trust, their ages, commencement of service and their principal occupations during the past five years, are detailed in the following table. Each officer serves until the earlier of his or her resignation, removal, retirement, death, or the election of a successor. The mailing address of each officer of the Trust is 4900 Tiedeman Road, 4th Floor, Brooklyn, Ohio 44144. The officers of the Trust receive no compensation directly from the Trust for performing the duties of their offices.
Name and Age | | Position with
the Trust | | Date Commenced
Service | | Principal Occupation During Past 5 Years | |
Christopher K. Dyer, 58 | | President | | February 2006* | | Director of Fund Administration, the Adviser. | |
Scott A. Stahorsky, 50 | | Vice President | | December 2014 | | Manager, Fund Administration, the Adviser (since 2015); Senior Analyst, Fund Administration, the Adviser (prior to 2015). | |
Erin G. Wagner, 46 | | Secretary | | December 2014 | | Associate General Counsel, the Adviser (since 2013). | |
Allan Shaer, 54 | | Treasurer | | May 2017 | | Senior Vice President, Financial Administration, Citi Fund Services Ohio, Inc. (since 2016); Vice President, Mutual Fund Administration, JP Morgan Chase (2011-2016). | |
Christopher A. Ponte, 35 | | Assistant Treasurer | | December 2017 | | Manager, Fund Administration, the Adviser (since 2017); Senior Analyst, Fund Administration, the Adviser (prior to 2017); Chief Financial Officer, Victory Capital Advisers, Inc. (since 2018). | |
Colin Kinney, 46 | | Chief Compliance Officer | | July 2017 | | Chief Compliance Officer (since 2013) and Chief Risk Officer (2009-2017), the Adviser. | |
Chuck Booth, 59 | | Anti-Money Laundering Compliance Officer and Identity Theft Officer | | May 2015 | | Director, Regulatory Administration and CCO Support Services, Citi Fund Services Ohio, Inc. | |
Jay G. Baris, 66 | | Assistant Secretary | | February 1998 | | Partner, Shearman & Sterling LLP (since 2018); Partner, Morrison & Foerster LLP (2011-January 2018). | |
* On December 3, 2014, Mr. Dyer resigned as Secretary of the Trust and accepted the position of President.
20
Supplemental Information — continued
Victory Variable Insurance Funds December 31, 2019
(Unaudited)
Proxy Voting and Portfolio Holdings Information
Proxy Voting:
Information regarding the policies and procedures that the Fund uses to determine how to vote proxies relating to portfolio securities is available without charge, upon request, by calling 800-539-3863. The information is also included in the Fund's Statement of Additional Information, which is available on the SEC's website at www.sec.gov.
Information relating to how the Fund voted proxies relating to portfolio securities held during the most recent twelve months ended June 30 is available on the SEC's website at www.sec.gov.
Availability of Schedules of Portfolio Investments:
The Trust files a complete list of Schedules of Portfolio Investments with the SEC for the first and third quarters of each fiscal year on Form N-PORT. Prior to the implementation of Form N-PORT, the Trust filed a complete list of Schedules of Portfolio Investments with the SEC for the first and third quarters of each fiscal year on Form N-Q. Forms N-PORT and Forms N-Q are available on the SEC's website at www.sec.gov.
Expense Examples
As a shareholder of the Fund, you may incur two types of costs: (1) transaction costs and (2) ongoing costs, including management fees, distribution and service (12b-1) fees, and other Fund expenses. These examples are intended to help you understand your ongoing costs (in dollars) of investing in the Fund and to compare these costs with the ongoing costs of investing in other mutual funds.
These examples are based on an investment of $1,000 invested at the beginning of the period and held for the entire period from July 1, 2019 through December 31, 2019.
The Actual Expense figures in the table below provide information about actual account values and actual expenses. You may use the information below, together with the amount you invested, to estimate the expenses that you paid over the period. Simply divide your account value by $1,000 (for example, an $8,600 account value divided by $1,000 = 8.6), then multiply the result by the number in the table under the heading entitled "Actual Expenses Paid During Period" to estimate the expenses you paid on your account during this period.
The Hypothetical Expense figures in the table below provide information about hypothetical account values and hypothetical expenses based on the Fund's actual expense ratio and an assumed rate of return of 5% per year before expenses, which is not the Fund's actual return. The hypothetical account values and expenses may not be used to estimate the actual ending account balance or expenses you paid for the period. You may use this information to compare this 5% hypothetical example with the 5% hypothetical examples that appear in shareholder reports of other funds.
Please note the expenses shown in the table are meant to highlight your ongoing costs only and do not reflect any transactional costs. Therefore, the table is useful in comparing ongoing costs only, and will not help you determine the relative total costs of owning different funds. In addition, if these transactional costs were included, your costs would have been higher.
Beginning
Account Value
7/1/19 | | Actual Ending
Account Value
12/31/19 | | Hypothetical
Ending
Account Value
12/31/19 | | Actual
Expenses Paid
During Period
7/1/19-12/31/19* | | Hypothetical
Expenses Paid
During Period
7/1/19-12/31/19* | | Annualized
Expense Ratio
During Period
7/1/19-12/31/19 | |
| $ | 1,000.00 | | | $ | 1,107.10 | | | $ | 1,020.01 | | | $ | 5.47 | | | $ | 5.24 | | | | 1.03 | % | |
* Expenses are equal to the average account value multiplied by the Fund's annualized expense ratio multiplied by 184/365 (the number of days in the most recent fiscal half-year divided by the number of days in the fiscal year).
21
Supplemental Information — continued
Victory Variable Insurance Funds December 31, 2019
(Unaudited)
Additional Federal Income Tax Information
For the year ended December 31, 2019, the Fund paid qualified dividend income for the purposes of reduced individual federal income tax rates of 24%.
Dividends qualified for corporate dividends received deductions of 24%.
For the year ended December 31, 2019, the Fund designated short-term and long-term capital gain distributions in the amount of $219 and $1,443, respectively.
22
Supplemental Information — continued
Victory Variable Insurance Funds December 31, 2019
(Unaudited)
Considerations of the Board in Continuing the Investment Advisory Agreement (the "Agreement")
The Board approved the Agreement on behalf of the Fund at an in-person meeting, which was called for that purpose, on December 4, 2019. The Board also considered information relating to the Fund and the Agreement provided throughout the year and, more specifically, at a meeting on October 22, 2019. In considering whether to approve the Agreement, the Board requested, and the Adviser provided, information that the Board believed to be reasonably necessary to reach its conclusions.
The Board, including the Independent Trustees, evaluated this information along with other information obtained throughout the year and was advised by legal counsel to the Fund, which also serves as independent legal counsel to the Independent Trustees. In addition, in 2017 the Independent Trustees, through their counsel, retained an independent consultant to assist with a review of the overall process for conducting the annual review of these advisory arrangements.
The Board considered the Fund's advisory fee, expense ratio and investment performance as significant factors in determining whether the Agreement should be continued. In considering whether the compensation paid to the Adviser was fair and reasonable, the Board also evaluated, among other things, the following factors:
• The requirements of the Fund for the services provided by the Adviser;
• The nature, quality and extent of the services provided and expected to be provided;
• The performance of the Fund as compared to comparable funds;
• The fees payable for the services and whether the fee arrangements provided for economies of scale that would benefit Fund shareholders as the Fund grows;
• Whether the fee would be sufficient to enable the Adviser to attract and retain experienced personnel and continue to provide quality services to the Fund;
• The fees paid by other clients of the Adviser whose accounts are managed in a similar investment style and any differences in the services provided to the other clients compared to those provided to the Fund;
• The total expenses of the Fund, taking into consideration any distribution or shareholder servicing fees;
• Management's commitment to operating the Fund at competitive expense levels;
• The profitability of the Adviser (as reflected by comparing fees earned against an estimate of the Adviser's costs) with respect to the Adviser's relationship with the Fund;
• Research and other service benefits received by the Adviser obtained through payment of client commissions for securities transactions;
• Other benefits received by the Adviser, and its affiliates, including revenues paid to the Adviser, or its affiliates, by the Fund for administration and fund accounting services, and distribution;
• The capabilities and financial condition of the Adviser;
• Current economic and industry trends; and
• The historical relationship between the Fund and the Adviser.
The Board reviewed the Fund's current management fee, comprised of the advisory fee plus the administrative services fee paid to the Adviser, in the context of the Adviser's profitability with respect to the Fund. In addition, the Board compared the Fund's total operating expense ratio on a net and gross basis, taking into consideration any distribution or shareholder servicing fees and management fees with a universe of comparable mutual funds compiled by an independent consultant and a peer group of funds with similar investment strategies selected by that independent consultant from the universe. The Board reviewed the factors and methodology used by the independent consultant in the selection of the Fund's peer group, including the independent consultant's selection of a broad universe of funds, the more specific universe of comparable funds, and peer groups of funds with comparable investment strategies and asset levels, among other factors. The Board also reviewed any changes to the independent consultant's methodology as compared to the prior year, including resulting from the Adviser's input, if any. With respect to the Fund, the Board also reviewed fees and other information related to the Adviser's management of similarly managed institutional or private accounts, and the differences in the services provided to the other accounts. The Board noted that the advisory fee arrangements for the Fund do not include breakpoints, which are generally viewed as a method by which the investment adviser shares any economies of scale with a fund as a fund grows.
The Board reviewed the Fund's performance over one-, three-, five- and ten-year periods against the performance of the Fund's selected peer group and benchmark index. The Board recognized that the performance of the Fund and the peer group funds are net of expenses, while the performance of the benchmark index reflects gross returns. The Board considered the additional resources that the Adviser has committed to enhance portfolio analysis, compliance and trading systems.
The Board reviewed various other specific factors with respect to the Fund, as described below. In their deliberations, the Trustees did not rank the importance of any particular information or factor considered and each Trustee may have attributed different weights to various factors.
The Board concluded that the Fund's gross annual management fee was reasonable as compared to the median gross management fee charged to the funds in the Fund's peer group. The Board noted that the Fund's Class A net annual expense ratio, taking into account any shareholder servicing or distribution fees, was reasonable as compared to the median expense ratio for the peer group. The Board then compared the Fund's Class A performance for the one-, three-, five- and ten-year periods ended June 30, 2019, to that of the median performance of the peer group and benchmark index for the same periods and considered the fact that the Fund underperformed both the benchmark index and the peer group median for all of the periods reviewed. The Board discussed the Fund's investment strategy, the Adviser's implementation of the strategy, and related market conditions, together with relevant fee and expense considerations. The Board also discussed the steps that had been or could be taken by the Adviser to enhance performance in the future, and the Board's continued monitoring of the Fund's performance.
Having considered, among other things: (1) that the Fund's management fee was within the ranges of advisory fees charged to comparable mutual funds; (2) that the Fund's total expense ratio was reasonable; and (3) the performance of the Fund, the Board concluded that the Agreement continued to be in the best interests of the Series' shareholders.
23
Supplemental Information — continued
Victory Variable Insurance Funds December 31, 2019
(Unaudited)
Conclusion
Based on its review of the information requested and provided, and following extended discussions, the Board determined that the Agreement, on behalf of the Fund, was consistent with the best interests of the Fund and its shareholders, and the Board unanimously approved the Agreement, on behalf of the Fund, for an additional annual period on the basis of the foregoing review and discussions and the following considerations, among others:
• The fairness and reasonableness of the investment advisory fee payable to the Adviser under the Agreement in light of the investment advisory services provided, the costs of these services, the profitability of the Adviser's relationship with the Fund and the comparability of the fee paid to the fees paid by other investment companies;
• The nature, quality and extent of the investment advisory services provided by the Adviser;
• The Adviser's entrepreneurial commitment to the management of the Fund and the creation of a broad-based family of funds, which could entail a substantial commitment of the Adviser's resources to the successful operation of the Fund;
• The Adviser's representations regarding its staffing and capabilities to manage the Fund, including the retention of personnel with relevant portfolio management experience;
• The Adviser's efforts to enhance investment results by, among other things, developing quality portfolio management teams; and
• The overall high quality of the personnel, operations, financial condition, investment management capabilities, methodologies and performance of the Adviser.
24
Privacy Policy
Protecting the Privacy of Information
The Trust respects your right to privacy. We also know that you expect us to conduct and process your business in an accurate and efficient manner. To do so, we must collect and maintain certain personal information about you. This is the information we collect from you on applications or other forms, and from the transactions you make with us or third parties. It may include your name, address, social security number, account transactions and balances, and information about investment goals and risk tolerance.
We do not disclose any information about you or about former customers to anyone except as permitted or required by law. Specifically, we may disclose the information we collect to companies that perform services on our behalf, such as the transfer agent that processes shareholder accounts and printers and mailers that assist us in the distribution of investor materials. We may also disclose this information to companies that perform marketing services on our behalf. This allows us to continue to offer you Victory investment products and services that meet your investing needs, and to effect transactions that you request or authorize. These companies will use this information only in connection with the services for which we hired them. They are not permitted to use or share this information for any other purpose.
To protect your personal information internally, we permit access only by authorized employees and maintain physical, electronic and procedural safeguards to guard your personal information.*
* You may have received communications regarding information about privacy policies from other financial institutions which gave you the opportunity to "opt-out" of certain information sharing with companies which are not affiliated with that financial institution. The Trust does not share information with other companies for purposes of marketing solicitations for products other than the Trust. Therefore, the Trust does not provide opt-out options to their shareholders.

Visit our web site at:
www.vcm.com | | Call Victory at:
800-539-FUND (800-539-3863) | |
VF-VIDS-AR (12/19)
Item 2. Code of Ethics.
(a) The registrant has adopted a code of ethics that applies to the registrant’s principal executive officer, principal financial officer, principal accounting officer or controller, or persons performing similar functions. This code of ethics is included as an Exhibit.
(b) During the period covered by the report, with respect to the registrant’s code of ethics that applies to its principal executive officer, principal financial officer, principal accounting officer or controller, or persons performing similar functions; there have been no amendments to, not any waivers granted from, a provision that relates to any element of the code of ethics definition enumerated in paragraph (b) of this Item 2.
Item 3. Audit Committee Financial Experts.
(a)(1) The registrant’s board of directors has determined that the registrant has at least one audit committee financial expert serving on its audit committee.
(a)(2) The audit committee financial experts are David L. Meyer and E. Lee Beard, who are “independent” for purposes of this Item 3 of Form N-CSR.
Item 4. Principal Accountant Fees and Services.
| | 2019 | | 2018 | |
Audit Fees(1) | | $ | 123,000 | | $ | 164,970 | |
Audit-Related Fees(2) | | 0 | | 0 | |
Tax Fees(3) | | 37,000 | | 42,937 | |
All Other Fees(4) | | 0 | | 0 | |
| | | | | | | |
(1) Audit fees include amounts related to the audit of the Registrant’s annual financial statements, security counts and services normally provided by the accountant in connection with statutory and regulatory filings. Audit fees billed were for professional services provided by the Funds’ independent registered public accounting firm for audit compliance, audit advice and audit planning.
(2) Represents the fee for assurance and related services by the Funds’ independent registered public accounting firm reasonably related to the performance of the audit of the Registrant’s financial statements that was not reported under (a) of this item.
(3) Represents the aggregate tax fee billed for professional services rendered by the Funds’ independent registered public accounting firm for tax compliance, tax advice and tax planning. Such tax services included the review of income and excise tax returns for the Registrant.
(4) For fiscal years ended December 31, 2019 and December 31, 2018, there were no fees billed for professional services rendered by the Funds’ independent registered public accounting firm to the Registrant, other than the services reported in (a) through (c) of this item.
Tax fees for 2019 and 2018 are for recurring tax fees for the preparation of the federal and state tax returns.
(e)(1) The Registrant’s Audit Committee must pre-approve non-audit services to be provided by the principal accountant and the fees charged for these services. The Committee may delegate authority to one or more Committee members to pre-approve these services, subject to subsequent review and approval by the Committee.
(e)(2) There were no services performed under Rule 2.01 (c)(7)(i)(C)
(f) Not applicable.
(g)
(h) The Registrant’s Audit Committee has evaluated the non-audit services that the principal accountant provided to the registrant’s investment adviser (and the adviser’s relevant affiliates), which services the Committee did not pre-approve, and has concluded that the provision of those services was compatible with maintaining the accountant’s independence.
Item 5. Audit Committee of Listed Registrants.
Not applicable.
Item 6. Investments.
(a) Not applicable.
(b) Not applicable.
Item 7. Disclosure of Proxy Voting Policies and Procedures for Closed-End Management Investment Companies.
Not applicable.
Item 8. Portfolio Managers of Closed-End Management Investment Companies.
Not applicable.
Item 9. Purchases of Equity Securities by Closed-End Management Investment Company and Affiliated Purchasers.
Not applicable.
Item 10. Submission of Matters to a Vote of Security Holders.
Not applicable.
Item 11. Controls and Procedures.
(a) The registrant’s principal executive officer and principal financial officer have concluded, based on their evaluation of the registrant’s disclosure controls and procedures as conducted within 90 days of the filing date of this report, that these disclosure controls and procedures are adequately designed and are operating effectively to ensure that information required to be disclosed by
the registrant on Form N-CSR is recorded, processed, summarized and reported within the time periods specified in the Securities and Exchange Commission’s rules and forms.
(b) There were no changes in the registrant’s internal control over financial reporting (as defined in Rule 30a-3(d) under the Investment Company Act of 1940 (17 CFR 270.30a-3(d)) that occurred during the period covered by this report that have materially affected or are reasonably likely to materially affect, the registrant’s internal control over financial reporting.
Item 12. Disclosure of Securities Lending Activities for Closed-End Management Investment Companies.
(a)(1) Not applicable.
(a)(2) Not applicable.
(a)(3) Not applicable.
(a)(4) Not applicable.
(b) Not applicable.
Item 13. Exhibits.
(a)(1) The code of ethics that is the subject of the disclosure required by Item 2 is attached hereto.
(a)(2) Certifications pursuant to Rule 30a-2(a) are attached hereto.
(a)(3) Not applicable.
(b) Certifications pursuant to Rule 30a-2(b) are furnished herewith.
SIGNATURES
Pursuant to the requirements of the Securities Exchange Act of 1934 and the Investment Company Act of 1940, the registrant has duly caused this report to be signed on its behalf by the undersigned, thereunto duly authorized.
(Registrant) | Victory Variable Insurance Funds | |
| |
By (Signature and Title)* | /s/ Allan Shaer | |
| Allan Shaer, Principal Financial Officer |
| |
Date | February 27, 2020 | |
| | | | | | |
Pursuant to the requirements of the Securities Exchange Act of 1934 and the Investment Company Act of 1940, this report has been signed below by the following persons on behalf of the registrant and in the capacities and on the dates indicated.
By (Signature and Title)* | /s/ Christopher K. Dyer | |
| Christopher K. Dyer, Principal Executive Officer |
| |
Date | February 27, 2020 | |
| |
By (Signature and Title)* | /s/ Allan Shaer | |
| Allan Shaer, Principal Financial Officer |
| |
Date | February 27, 2020 | |
| | | | | | |