Table of Contents
UNITED STATES
SECURITIES AND EXCHANGE COMMISSION
Washington, D.C. 20549
FORM 10-K
ANNUAL REPORT PURSUANT TO SECTION 13 OR 15(D) OF
THE SECURITIES EXCHANGE ACT OF 1934
For the fiscal year ended December 31, 2005
Commission file number 000-28401
MAXYGEN, INC.
(Exact name of registrant as specified in its charter)
| Delaware | 77-0449487 | |
| (State or other jurisdiction of incorporation or organization) | (I.R.S. Employer Identification No.) |
515 Galveston Drive
Redwood City, California 94063
(Address of principal executive offices)
(650) 298-5300
Registrant’s telephone number, including area code:
Securities registered pursuant to Section 12(b) of the Act:
None
Securities registered pursuant to Section 12(g) of the Act:
Common Stock, par value $0.0001 per share
(Title of Class)
Indicate by check mark if the registrant is a well-known seasoned issuer, as defined in Rule 405 of the Securities Act. Yes ¨ No x
Indicate by check mark if the registrant is not required to file reports pursuant to Section 13 or Section 15(d) of the Exchange Act. Yes ¨ No x
Indicate by check mark whether the registrant (1) has filed all reports required to be filed by Section 13 or 15(d) of the Securities Exchange Act of 1934 during the preceding 12 months (or for such shorter period that the registrant was required to file such reports), and (2) has been subject to such filing requirements for the past 90 days. Yes x No ¨
Indicate by check mark if disclosure of delinquent filers pursuant to Item 405 of Regulation S-K is not contained herein, and will not be contained, to the best of registrant’s knowledge, in definitive proxy or information statements incorporated by reference in Part III of this Form 10-K or any amendment to this Form 10-K. ¨
Indicate by check mark whether the registrant is a large accelerated filer, an accelerated filer, or a non-accelerated filer. See definition of “accelerated filer and large accelerated filer” in Rule 12b-2 of the Exchange Act.
Large accelerated filer ¨ Accelerated filer x Non-accelerated filer ¨
Indicate by check mark whether the registrant is a shell company (as defined in Rule 12b-2 of the Exchange Act). Yes ¨ No x
As of June 30, 2005, the last business day of the registrant’s most recently completed second fiscal quarter, the aggregate market value of the voting stock held by non-affiliates, computed by reference to the closing price for the common stock as quoted by the Nasdaq National Stock Market as of that date, was approximately $141,447,000. Shares of common stock held by each executive officer and director and by each person who owned 5% or more of the outstanding common stock have been excluded as such persons may be deemed to be affiliates. This determination of affiliate status is not necessarily a conclusive determination for other purposes.
As of February 28, 2006, there were 35,993,675 shares of the registrant’s common stock outstanding.
DOCUMENTS INCORPORATED BY REFERENCE
Certain portions of the registrant’s proxy statement for the 2006 Annual Meeting of Stockholders (hereinafter referred to as the “2006 Proxy Statement”) are incorporated by reference into Part III of this report.
Table of Contents
This report and the disclosures herein include, on a consolidated basis, the business and operations of Maxygen, Inc. and its wholly-owned subsidiaries, Maxygen ApS and Maxygen Holdings Ltd. For the year ended December 31, 2004 and for the two months ended February 28, 2005, the operations of Codexis, Inc. are also included. On February 28, 2005, our voting interests in Codexis fell below 50% and, from such date, the financial position and results of operations of Codexis are no longer consolidated with our financial position and results of operations. We instead reflect our investment in Codexis under the equity method of accounting. The operations of Verdia, Inc., prior to its sale on July 1, 2004, are reflected in our financial statements as discontinued operations. In this report, “Maxygen,” the “company,” “we,” “us” and “our” refer to such consolidated entities, unless, in each case, the context indicates that the disclosure applies only to a named subsidiary.
We own or have rights to various copyrights, trademarks and trade names used in our business, including Maxygen™, MaxyScan™ and MolecularBreeding.™ Other service marks, trademarks and trade names referred to in this report, and in the documents incorporated by reference in this report, are the property of their respective owners. The use of the word “partner” and “partnership” does not mean a legal partner or legal partnership.
i
Table of Contents
Forward Looking Statements
This report contains forward-looking statements within the meaning of federal securities laws that relate to future events or our future financial performance. In some cases, you can identify forward-looking statements by terminology such as “may,” “can,” “will,” “should,” “expect,” “plan,” “anticipate,” “believe,” “estimate,” “predict,” “intend,” “potential” or “continue” or the negative of these terms or other comparable terminology. Examples of these forward-looking statements include, but are not limited to, statements regarding the following:
| · | our ability to develop products suitable for commercialization; |
| · | our predicted development and commercial timelines for any of our potential products, including the timing of any filing with the U.S. Food and Drug Administration or any other regulatory agency with respect to the clinical development of any product candidate; |
| · | our liquidity and future financial performance; |
| · | the establishment, development and maintenance of any manufacturing or collaborative relationships; |
| · | the effectiveness of our MolecularBreeding directed evolution platform and other technologies and processes; |
| · | our ability to protect our intellectual property portfolio and rights; |
| · | our ability to identify and develop new potential products; |
| · | the attributes of any products we may develop; and |
| · | our business strategies and plans. |
These statements are only predictions. Risks and uncertainties and the occurrence of other events could cause actual results to differ materially from these predictions. Important factors that could cause our actual results to differ materially from the forward-looking statements we make in this report are set forth in this report, including the factors described in the section entitled “Item 1A—Risk Factors.”
Although we believe that the expectations reflected in the forward-looking statements are reasonable, we cannot guarantee future results, levels of activity, performance or achievements. Moreover, neither we nor any other person assumes responsibility for the accuracy and completeness of these statements. Other than as required by applicable law, we disclaim any obligation to update or revise any forward-looking statement contained in this report as a result of new information or future events or developments.
ii
Table of Contents
PART I
| Item 1 | BUSINESS |
Overview
We are a biotechnology company committed to the discovery, development and commercialization of improved next-generation protein pharmaceuticals for the treatment of disease and serious medical conditions. We currently have four next-generation product candidates that are in pre-clinical development:
| · | MAXY-G34, a next generation granulocyte colony stimulating factor, or G-CSF, for the treatment of neutropenia; |
| · | MAXY-alpha, a next generation interferon alpha product for the treatment of hepatitis C virus infection; |
| · | MAXY-VII, a next-generation factor VII product for the treatment of uncontrolled bleeding in trauma, intracerebral hemorrhage and other indications; and |
| · | MAXY-gamma, a next-generation interferon gamma product for the treatment of idiopathic pulmonary fibrosis and other indications. |
We currently expect that filings will be made in 2006 with the U.S. Food & Drug Administration, or FDA, or other regulatory agencies for approval to commence clinical development of our MAXY-G34 and MAXY-alpha product candidates.
Business Strategy
Our goal is to develop and commercialize improved and proprietary versions of currently marketed or clinically validated therapeutic proteins. To achieve this objective, we are pursuing the following key strategies:
| · | Advance the Development of Our Lead Product Candidates. Our primary focus is the advancement of our lead product candidates, MAXY-G34, MAXY-alpha and MAXY-VII, into clinical development. We currently expect to file an investigational new drug application, or IND, with the FDA for our lead MAXY-G34 product candidate in the third quarter of 2006 and we have entered into agreements with a contract manufacturer and other third parties to supplement our internal efforts. We have entered into broad strategic alliances with F. Hoffmann-La Roche Ltd., or Roche, for the development of our MAXY-alpha and MAXY-VII programs. Roche is leading the development of our MAXY-alpha product candidates and has informed us that in 2006 it intends to file an IND with the FDA or an application with a comparable foreign regulatory agency for these product candidates. We are also working with Roche to conduct preclinical and clinical development of our MAXY-VII product candidates. |
| · | Create Value with Superior Next-Generation Protein Drugs. We focus our research and development efforts on creating improved and proprietary versions of currently marketed therapeutic proteins that address significant market opportunities. We identify currently marketed or clinically validated protein products that require improvements to address existing unmet medical needs in the treatment of disease and serious medical conditions and use our proprietary MolecularBreeding directed molecular evolution platform and other technologies to improve these products. We commit resources to only those product candidates that we believe are commercially viable and have the potential to be best-in-class products. |
| · | Maximize Value, Minimize Risk. By using our technologies to improve the properties of currently marketed or clinically validated therapeutic proteins that have significant commercial value, we believe we can potentially create novel and proprietary best-in-class products that take advantage of known utility, development paths and markets. We believe that this approach results in reduced risk and enhanced chances of commercial success as compared to the development of novel pharmaceutical products directed at unvalidated targets. |
1
Table of Contents
| · | Establish a Portfolio of Next-Generation Therapeutic Proteins. In addition to our existing product candidates, we have an ongoing discovery effort focused on next-generation protein pharmaceuticals. Our goal is to leverage discoveries in our research programs or in-licensed product candidates to extend and expand our product pipeline. By broadening our product portfolio, we hope to increase the probability of clinical and commercial success and reduce our exposure to the impact of any single product failure. |
| · | Establish Strategic Collaborations to Advance our Product Pipeline and Leverage Our Development Resources. Part of our strategy is to establish strategic collaborations that enable us to retain a large portion of the eventual value from our product candidates. We may enter into strategic collaborations at various stages in our research and development process that will allow us to further diversify our product development risks, reduce costs, access the complementary skills and infrastructure possessed by our partners and accelerate the development and commercialization of our product candidates. |
| · | Manage Our Financial Resources. Fiscal discipline and pragmatic allocation of our resources are key components of our strategy. We focus our financial resources on those functions that should enhance our ability to generate new and superior next-generation product candidates and rapidly advance these new product candidates through pre-clinical and clinical development. |
Product Pipeline
The following table summarizes the status of our product pipeline:
Product Candidate | Indication | Development | Commercialization | Status | ||||
| MAXY-G34 | Neutropenia | Maxygen | Maxygen | Pre-clinical; expect to file an IND with the FDA in the 3rd quarter of 2006 | ||||
| MAXY-alpha | Hepatitis C | Roche | Roche | Pre-clinical; Roche expected to file an IND with the FDA or an application with a comparable regulatory agency in 2006 | ||||
| MAXY-VII | Uncontrolled bleeding (excluding hemophilia) | Maxygen/Roche | Roche | Pre-clinical | ||||
| MAXY-gamma | Idiopathic Pulmonary Fibrosis | InterMune | InterMune | Pre-clinical | ||||
| · | “Pre-clinical” means process development, product scale-up, formulation and further testing in animals, including toxicology, pharmacokinetics and pharmacodynamics. |
MAXY-G34
Our MAXY-G34 product candidates are designed to be superior next-generation granulocyte colony stimulating factors, or G-CSF, for the treatment of neutropenia. G-CSF is a natural protein that works by stimulating the body’s bone marrow to produce more white blood cells.
Neutropenia is a severe decrease in neutrophil cell counts in the blood. Neutrophils are a specific type of blood cell that play an important role in the defense against bacterial infections. Neutropenia is a common side effect of chemotherapeutic treatments for many forms of cancer, including breast cancer, lung cancer, lymphomas and leukemias. Neutropenic patients contract bacterial infections more easily and often, some of which can be life threatening. Further, and most importantly, neutropenic patients may receive reduced or delayed chemotherapy treatment, which can result in cancer progression.
2
Table of Contents
MAXY-G34 may help the body make white blood cells more quickly than the products currently approved for the treatment of neutropenia, Neupogen and Neulasta, which could make it an attractive alternative for both doctors and patients. In multiple preclinical animal models, we have generated data that suggest that our MAXY-G34 product candidate reduces the duration of neutropenia by clinically relevant periods (approximately 25% shorter duration of neutropenia) when compared to the currently marketed products. This may help protect patients from chemotherapy and radiation therapy-related infections, shorten the duration of hospital stays and help keep patients on schedule for their cancer treatments.
Market Opportunity. Neupogen, a first-generation G-CSF product, and Neulasta, a second-generation G-CSF product, currently dominate the market to treat chemotherapy and radiation induced neutropenia. Worldwide sales of G-CSF products were approximately $3.8 billion in 2005.
Development Status. We have completed our pre-IND meeting with the FDA and are currently completing the necessary regulatory toxicology and safety studies and Good Manufacturing Practices, or GMP, manufacturing with our third party contract manufacturing organization in preparation for filing an IND. We currently expect to file an IND with the FDA for our lead MAXY-G34 product candidate in the third quarter of 2006. We currently retain all rights to our MAXY-G34 product candidates.
MAXY-alpha
Our MAXY-alpha product candidates are designed to be superior next-generation interferon alpha products for the treatment of Hepatitis C virus, or HCV, and Hepatitis B virus, or HBV, infections. Alpha interferon is a natural protein that is produced by many cell types, including T-cells and B-cells, macrophages, fibroblasts, endothelial cells, osteoblasts and others, and is an important component of the anti-viral response, stimulating both macrophages and natural killer (NK) cells.
HCV infection causes chronic inflammation in the liver. In a majority of patients, HCV infection can persist for decades and eventually lead to cirrhosis, liver failure and liver cancer. HCV infection represents a significant medical problem worldwide. According to the World Health Organization, HCV is responsible for up to 76% of all liver cancer cases and two thirds of all liver transplants in the developed world. The U.S. Centers for Disease Control, or CDC, estimates that approximately 3.9 million person in the United States, or 1.8% of the U.S population, have been infected with HCV, 2.7 million of whom are chronically infected with HCV and at risk of developing liver cirrhosis or liver cancer. The World Health Organization estimates that approximately 180 million people, or 3% of the world’s population, are infected with HCV worldwide, 130 million of whom are chronic HCV carriers. The World Health Organization also estimates that three to four million persons are newly infected each year, 70% of whom will develop chronic hepatitis.
Currently, there is no vaccine available to prevent HCV infection. The standard treatment for HCV infection is a combination of pegylated interferon and ribavirin, a small molecule. Approximately 50% of patients infected with HCV genotype I, the most common HCV genotype in the United States, fail to show a long-term sustained response to the standard treatment. As a result, we believe that new safe and effective treatment options for HCV infection are needed. We are working in collaboration with our partner, Roche, to create a superior next generation interferon alpha product that is more effective at treating HCV infection. Using our proprietary MolecularBreeding directed molecular evolution platform and other technologies, we believe we have created novel interferon alpha variants with improved clinical properties. The lead novel interferon alpha molecules have been pegylated to obtain the desired biological half-life and dosing convenience of currently approved interferon alpha products.
Although various third parties are currently developing small molecules intended for the treatment of HCV infection, we believe that interferon alpha will remain an important product in the treatment of HCV, both alone and in combination with small molecules. In addition, we believe that our pegylated MAXY-alpha product candidate may have the potential to treat a larger percentage of the 40 to 50% of HCV patients who are not effectively addressed with existing drugs.
3
Table of Contents
Market Opportunity. Based on currently available market data, worldwide sales of drugs for the treatment of HCV, including pegylated interferon alpha and ribavirin, were approximately $2.75 billion in 2005. Sales of HCV drugs are expected to grow due to improved market penetration through improvements in therapies, increased awareness and improved diagnosis rates.
Development Status. In 2003, we entered into a broad strategic alliance with Roche, a market leader in interferon alpha therapies, to develop novel improved interferon alpha and beta products for HCV and HBV infections and a wide range of other indications. See “Our Strategic Collaborations—Roche—MAXY-alpha.” In 2005, we achieved two significant preclinical development milestones for the advancement of our MAXY-alpha product candidate and Roche paid us milestone payments totaling $7 million. Roche has informed us that they plan to file an IND with the FDA or file an application with a comparable foreign regulatory agency for our lead MAXY-alpha product candidate in 2006.
Outside the areas of the treatment of HCV and HBV infections, we retain the right to develop novel interferon alpha product candidates specifically tailored for additional indications, including infectious diseases, oncology, inflammatory diseases and autoimmune diseases. Roche retains an option to acquire worldwide licenses and commercialization rights to these product candidates on pre-agreed terms.
MAXY-VII
Our MAXY-VII product candidates are designed to be superior next generation factor VII products to treat uncontrolled bleeding in emergency situations, such as trauma, intracerebral hemorrhage (hemorrhagic stroke), certain surgeries and other acute indications. Factor VII is a natural protein with a pivotal role in blood coagulation and clotting. Blood clotting factors, such as factors VII, VIII and IX, have been used for many years to control bleeding episodes. NovoSeven, used for the treatment of hemophilia, is the only factor VII product currently approved for any indication. However, over the last two years, new clinical data suggests that factor VII-based products may be useful for the treatment of severe bleeding in trauma and for the treatment of intracerebral hemorrhage.
It is estimated that there are over 160,000 deaths in the United States each year that are a direct result of trauma injuries. The direct and indirect healthcare costs associated with trauma injuries are estimated to be approximately $260 billion per year. Uncontrolled bleeding is believed to account for approximately half of all trauma-related deaths that occur within the first 48 hours after injury. There is currently no effective medical therapy for uncontrolled bleeding other than physical interventions, such as surgery and blood transfusions. We are working with Roche to develop a factor VII product that is a more effective treatment to stop critical bleeding.
Our MAXY-VII product candidates are designed to deliver improved efficacy, a longer circulating half-life and an overall improved therapeutic index. Studies in preclinical animal models have demonstrated that MAXY-VII may be more effective than NovoSeven at treating uncontrolled bleeding.
Market Opportunity. NovoSeven is currently approved in the United States and Europe only for the treatment of hemophilia patients who have become resistant to factor VIII therapy due to the development of antibodies. The use of recombinant factor VII-based products for the treatment of new indications, such as severe bleeding in trauma, surgery and intracerebral hemorrhage, are forecasted to represent significant market opportunities for next-generation recombinant factor VII products. Analysts estimate that world wide sales of all factor VII products could exceed $2 billion by 2012.
Development Status. In December 2005, we formed a strategic alliance with Roche to collaborate on the global development and commercialization of our portfolio of next-generation recombinant factor VII products for multiple indications. See “Our Strategic Collaborations—Roche—MAXY-VII.” We are actively working with Roche to conduct preclinical development of our MAXY-VII product candidates. We have retained all rights for the development and commercialization of factor VII products for hemophilia.
4
Table of Contents
MAXY-gamma
Our MAXY-gamma product candidates are next-generation versions of interferon gamma that may be useful for the treatment of a variety of diseases, including idiopathic pulmonary fibrosis, or IPF, HCV, tuberculosis and meningitis. We believe that interferon gamma may help in the prevention of excessive scarring, or fibrosis, of organs such as the liver and the lung. Interferon gamma is a naturally occurring protein in the human body that plays a role in the activation of the immune system to fight infectious pathogens. Interferon gamma has a wide spectrum of biologic effects, including anti-infective, anti-viral, anti-fibrotic, anti-proliferative, immunomodulatory and chemosensitization activities.
IPF is an inflammatory disease that results in severe fibrosis of the lungs. In time, this fibrosis can build up to the point where the lungs are unable to provide oxygen to the tissues of the body. The average survival rate of a patient with IPF is four to six years after diagnosis.
Our MAXY-gamma product candidates are designed to have improved efficacy and a less-frequent dosing regimen over Actimmune, the currently marketed interferon gamma product of InterMune, Inc., or InterMune. Actimmune is marketed for the treatment of severe, malignant osteopetrosis and chronic granulomatous disease (CGD) and is currently in Phase III clinical trials for the treatment of IPF.
Market Opportunity. We believe that the development of a next-generation version of interferon gamma to treat IPF may represent a significant market opportunity.
Development Status. We have established a collaboration with InterMune in which InterMune has an exclusive license to develop and market our MAXY-gamma product candidates. See “Our Strategic Collaborations—InterMune—MAXY-gamma.” Although InterMune has indicated that it intends to continue to advance the development of our MAXY-gamma product candidates, it has informed us that it does not currently plan to advance these product candidates into clinical development during 2006.
Other Assets and Areas of Research
In addition to our development stage product candidates, we have other assets and areas of research outside of our core business, including vaccine research and investments in other biotechnology companies.
Vaccines
We believe that our proprietary technologies have the potential to transform the design and development of vaccines through the optimization of properties that allow for the generation of broad and strong immune responses. We currently have an active program to advance the research for development of a preventative HIV vaccine. Our vaccine research program is being funded by research grants from the National Institutes of Health, or NIH, and the U.S. Department of Defense. In 2005, the NIH awarded us two competitive grants, including $11.7 million over approximately five years as part of the HIV Research and Development, or HIVRAD, program, and a Phase I grant from the NIH Small Business Innovation Research, or SBIR, program. We were also awarded a one-year contract of $2.4 million in 2005 from the Department of Defense for HIV vaccine discovery.
The HIVRAD grant provides funds for the use of our MolecularBreeding directed evolution platform to generate novel HIV-1 antigens potentially capable of inducing broad antibody responses to multiple strains of the HIV-1 virus. The SBIR award will fund investigations into the effect on immunogenicity of secondary modifications to a specific HIV-1 envelope protein. The grant from the Department of Defense will fund work to develop a high-throughput HIV vaccine screening platform. We anticipate working in collaboration with Monogram Biosciences, Inc. (formerly ViroLogic, Inc.), Aldevron LLC and the Scripps Research Institute with respect to these government-funded projects.
5
Table of Contents
Investment in Codexis, Inc.
We have a minority investment in Codexis, Inc., or Codexis, a biotechnology company focused on developing innovative biotechnology-based solutions for improving the manufacture of existing small molecule pharmaceutical products. We formed Codexis in January 2002 as a wholly-owned subsidiary to operate our former chemicals business. Our voting rights in Codexis were reduced below 50% in the first quarter of 2005 and, as a result, Codexis is no longer consolidated in our financial statements. As of December 31, 2005, our ownership in Codexis was approximately 49%, based upon the voting rights of the issued and outstanding shares of the common and preferred stock of Codexis. We are not obligated to provide additional funding to Codexis. For more information regarding our investment in Codexis, see Notes 1 and 18 of the Notes to Consolidated Financial Statements.
Investment in Avidia Inc.
We have a minority investment in Avidia Inc. (formerly Avidia Research Institute), or Avidia, a biotechnology company focused on developing a new class of therapeutic peptides for the treatment of serious medical conditions in the areas of autoimmunity, inflammation and oncology. We formed Avidia in July 2003, together with a third party investor. As of December 31, 2005, our ownership in Avidia was approximately 13%, based upon the voting rights of the issued and outstanding shares of Avidia’s common and preferred stock. We are not obligated to provide additional funding to Avidia. For more information regarding our investment in Avidia, see Note 14 of the Notes to Consolidated Financial Statements.
Our Technologies
MolecularBreeding
Our MolecularBreeding directed evolution technologies mimic the natural events of evolution. First, genes are subjected to DNAShuffling recombination technologies, generating a diverse library of gene variants. Second, our proprietary MaxyScan screening systems select individual proteins from the gene variants in the library. The proteins that show improvements in the desired characteristics become the initial lead candidates. After confirmation of activity, the initial lead candidates are then used as the genetic starting material for additional rounds of shuffling. Once the level of improvement needed for the particular protein pharmaceutical is achieved, the group of lead candidates is considered for advancement as a product candidate for development.
6
Table of Contents
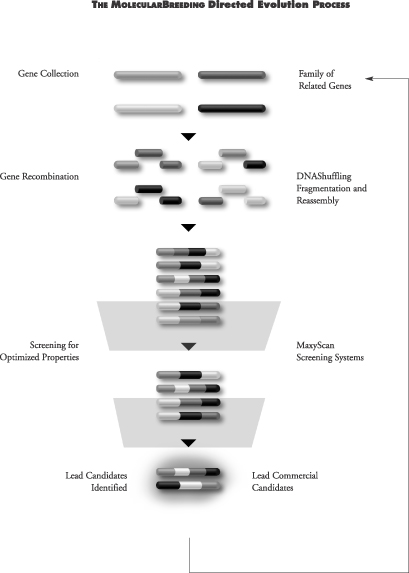
Step One: DNAShuffling Recombination Technologies
Our DNAShuffling recombination technologies work as follows: a single gene or multiple genes are cleaved into fragments and recombined, creating a population of new gene variants. The new genes created by DNAShuffling are then selected for one or more desired characteristics. This selection process yields a population of genes that becomes the starting point for the next cycle of recombination. As with classical breeding of plants and animals, this process is repeated until genes expressing the desired properties are identified.
DNAShuffling can be used to evolve properties that are coded for by single genes, multiple genes or entire genomes. By repeating the process, DNAShuffling ultimately generate libraries with a high percentage of genes that have the desired function. Due to the high quality of these libraries, a relatively small number of screening tests need to be performed to identify gene variants with the desired commercial qualities. This process can reduce the cost and time associated with identifying multiple potential products.
7
Table of Contents
Step Two: MaxyScan Screening
The ability to screen or select for a desired improvement in function is essential to the effective development of an improved gene or protein. As a result, we have invested significant resources in developing automated, stringent, rapid screens and selection formats.
We have developed screening tests that can measure the production of proteins or small molecules in culture without significant purification steps or specific test reagents, thereby eliminating time-consuming steps required for traditional screening tests. We are also focusing on the development of reliable, cell-based screening tests that are predictive of specific functions relevant to our human therapeutics programs. Accordingly, we continue to develop new screening approaches and technologies. Our approach is to create multitiered screening systems where we use a less sensitive screening test as a first screen to quickly select proteins with the desired characteristics, followed by a more sensitive screening test to confirm value in these variants and to select for final lead product candidates. Unlike approaches that create random diversity, our MolecularBreeding directed evolution platform produces potentially valuable libraries of gene variants with a predominance of active genes with the desired function. As a result of capturing the natural process of sexual recombination with our proprietary DNAShuffling methods, we are also able to generate gene variants with the desired characteristic at a frequency 5 to 10-fold higher than combinatorial chemistry, rational design or other directed evolution methods. This allows us to use complex biological screens and formats as a final screening test, as relatively few proteins need to be screened to detect an improvement in the starting gene activity. Furthermore, this allows us to focus on developing screens that generate a broader range of information that is more responsive to commercial and clinical concerns. This separates us from many of our potential competitors who invest significant time and money to screen billions of compounds per day. While we have the capability to screen billions of compounds per day, we generally need to screen far fewer, on the order of 10,000 candidates per day or less. Some of our screening capabilities include mass spectrometry, in vivo animal assays, bioassays, immunochemical assays, chemical assays, and biochemical assays.
We have access to multiple sources of genetic starting material. In addition to the wealth of publicly available genetic sequence information, we are typically able to access our collaborators’ proprietary genes for use outside their specific fields of interest. Furthermore, we are able to inexpensively obtain our own genetic starting material or information, either through our own in-house efforts or through collaborations with third parties. This information and such materials when coupled with our DNAShuffling recombination technologies, can provide a virtually infinite amount of new, proprietary gene variants with potential commercial value.
Other Technologies
In addition to our proprietary MolecularBreeding directed evolution platform, we have acquired capabilities with regard to several complementary technologies potentially useful for the development of protein-based pharmaceuticals. Two examples of the tools that we use to post-translationally modify protein drugs are pegylation and glycosylation technologies. Over the last few years, glycosylation and pegylation have been validated technically and commercially through the successes of drugs, such as the pegylated interferons (Pegasys and PEG-Intron) and Aranesp, a hyper-glycosylated erythropoeitin. These post-translational modifications of proteins have been demonstrated to improve the pharmacokinetics and pharmacodynamics of certain protein drugs. In addition these modifications can improve the solubility, bioavailability and immunogencity profile of protein drugs.
Our Strategic Collaborations
Roche
MAXY-VII. In December 2005, we established an alliance with Roche to co-develop our MAXY-VII product candidates for the treatment of uncontrolled bleeding in multiple indications, including trauma and intracerebral hemorrhage. Under the terms of the agreement, we have agreed to share with Roche worldwide
8
Table of Contents
research and development costs for the creation of novel factor VII product candidates. We have agreed to lead early stage clinical development and Roche has agreed to lead late stage clinical development. Roche has exclusive worldwide rights to commercialize the next generation recombinant factor VII molecules for acute indications. In the United States, we have the option to co-fund marketing activities in the United States for such products and, if we do not exercise this option, we will receive lower royalty payments. We have received an up-front fee of $8 million from Roche and are eligible to receive event-based payments of up to $87 million upon the achievement of development and other milestones, as well as significant royalties on any product sales. We have retained all rights for development and commercialization for next generation novel recombinant factor VII products for the treatment of hemophilia.
MAXY-alpha. In May 2003, we established a broad alliance with Roche to develop our MAXY-alpha product candidates for a wide range of indications. Roche licensed from us worldwide commercialization rights to specific novel interferon product candidates for the treatment of HCV and HBV infections. We received an initial payment and full research and development funding for the first two years of the collaboration. In addition, we are eligible to receive event-based payments based on the achievement of certain development milestones, royalties based on product sales, and option fees. This agreement also provides us and Roche with the option to expand the collaboration to develop other novel interferon alpha and beta products specifically tailored for indications outside of HCV and HBV infections, including oncology, autoimmune diseases, inflammatory diseases, and other infectious diseases, such as HIV. We retain the right to develop such products, while Roche may elect to acquire worldwide license and commercialization rights to these product candidates on pre-agreed terms. We have the option to co-fund development in the United States of any product to which Roche acquires a license in exchange for profit sharing or an increased royalty rate. The funded research term of this collaboration ended in December 2005. In 2005, we achieved two significant preclinical development milestones for the advancement of our MAXY-alpha product candidates and Roche paid us milestone payments totaling $7 million.
InterMune
MAXY-gamma. In October 2001, we entered into a license and collaboration agreement with InterMune to develop and commercialize our novel, next-generation interferon gamma products. Under the terms of this agreement, InterMune has exclusive rights to develop the next-generation interferon gamma products created by us, and retains exclusive worldwide commercialization rights for all human therapeutic indications. We received up-front license fees and full research funding during the research phase of the collaboration, which was completed in June 2004. We remain eligible to receive development and commercialization milestone payments that could exceed $60 million, in addition to royalties on product sales. Although InterMune has indicated that it intends to continue to advance the development of our interferon gamma product candidates, it has informed us that it does not currently plan to advance these product candidates into clinical trials during 2006.
Intellectual Property and Technology Licenses
Pursuant to a technology transfer agreement we entered into with Affymax Technologies N.V. and Glaxo Group Limited (each of which was then a wholly-owned subsidiary of what is now GlaxoSmithKline plc), we were assigned all the patents, applications and know-how related to our MolecularBreeding directed evolution platform, subject to certain internal research rights retained by GlaxoSmithKline plc. Affymetrix, Inc. retains an exclusive, royalty-free license under some of the patents and patent applications previously owned by Affymax for use in the diagnostics and research supply markets for specific applications. In addition, Affymax assigned jointly to us and to Affymetrix a family of patent applications relating to circular PCR techniques.
We have an extensive patent portfolio including 78 issued U.S. patents and over 50 foreign patents relating to our proprietary MolecularBreeding directed evolution platform. Counterpart applications of the U.S. patents are pending in other major industrialized countries. Additionally, we have over 25 pending U.S. patent applications and over 100 pending foreign and international counterpart applications relating to our MolecularBreeding directed evolution platform and specialized screening technologies, and the application of
9
Table of Contents
these technologies to the development of protein pharmaceuticals and other industries, including agriculture, vaccines, gene therapy and chemicals.
Our expanding patent estate provides us with an increasingly broad and unique platform from which to create and improve therapeutic products. Patents owned by us or for which we have exclusive licenses cover a broad range of activities surrounding recombination-based directed molecular evolution including:
| · | methods for template-based gene recombination to produce chimeric genes, including use of single or double-stranded templates; |
| · | methods for recombining nucleic acid segments produced by incomplete nucleic acid chain extension reactions to produce chimeric genes, including the staggered extension process (StEP); |
| · | methods utilizing reiterative screening or only a single cycle of screening; |
| · | methods of combining any mutagenesis technique with DNA recombination methods to produce new chimeric genes; |
| · | methods using synthesized nucleic acid fragments; |
| · | in vivo and in vitro recombination methods of the above, in a variety of formats; |
| · | methods of screening directed evolution libraries; |
| · | methods for ligation- and single-stranded template-based recombination and reassembly; |
| · | mutagenesis, including codon and gene site saturation mutagenesis, used in conjunction with recombination and reassembly; |
| · | cell-based recombination methods; and |
| · | fluorescence-, bioluminescence-, and nutrient-based screening methods, including the use of ultra-high throughput FACS-based methods for screening diverse variants. |
Such patents reinforce our preeminent position as an industry leader in recombination-based directed molecular evolution technologies for the preparation of chimeric genes for commercial applications.
In addition to the patents that we own directly, we have also exclusively licensed patent rights and technology for specific uses from Novozymes, the California Institute of Technology, the University of Washington, GGMJ Technologies, L.L.C. and the University of Minnesota. These licenses give us rights to an additional 21 issued U.S. patents, 13 granted foreign patents and over 50 pending U.S. and foreign counterpart applications.
We have also received from Affymax a worldwide, non-exclusive license to certain Affymax patent applications and patents related to technology for displaying multiple diverse proteins on the surface of bacterial viruses.
As part of our confidentiality and trade secret protection procedures, we enter into confidentiality agreements with our employees, consultants and potential collaborative partners. Despite these precautions, third parties could obtain and use information regarding our technologies without authorization, or develop similar technology independently. It is difficult for us to monitor unauthorized use of our methods. Effective protection of intellectual property rights is also unavailable or limited in some foreign countries. The protection of our proprietary rights may be inadequate and our competitors could independently develop similar technology or design around any patents or other intellectual property rights we hold.
In July 2005, our European Patent 0752008, covering our first generation directed molecular evolution technologies, was the subject of an opposition proceeding before the European Patent Office. All claims of the patent were upheld as valid with minor amendments. In October 2005, the Australian Patent Office found, in an
10
Table of Contents
opposition proceeding regarding our Australian patent application No. 703264 that corresponds to European Patent 0752008, 89 of our claims to be patentable as presented. In February 2006, our European Patent 0876509, covering one embodiment of our second-generation directed molecular evolution technologies, was the subject of an opposition proceeding before the European Patent Office. The opposition board revoked the patent on the grounds of lack of inventive step. We will determine whether to appeal this decision after reviewing the written decision of the opposition board, which has not yet been issued.
Product Patents
Our patent portfolio consists of the following issued patents and pending patent applications for each of our primary product candidates:
| · | For our MAXY-G34 product candidates, we have three U.S. patents, four pending U.S. applications, four foreign patents and 30 pending foreign or international applications. |
| · | For our MAXY-alpha product candidates, we have five pending U.S. applications and 35 pending foreign or international applications. Certain of these applications are jointly held by us and our collaborative partner, Roche. |
| · | For our factor VII product candidates, we have one U.S. patent, seven pending U.S. applications, three foreign patents and 35 pending foreign or international applications. We also have exclusive licenses to two U.S. patents, two pending U.S. applications and four pending foreign or international applications. |
| · | For our MAXY-gamma product candidates, we have one U.S. patent, six pending U.S. applications, five foreign patents and 41 pending foreign or international applications. |
Manufacturing
We rely on third party manufacturers and collaborators to produce our compounds for clinical purposes and may do so for commercial production of any drug candidates that are approved for marketing. We have established an agreement with Rentschler Biotechnologie GmbH, or Rentschler, in Germany for the manufacture of supplies of our MAXY-G34 product candidates for toxicology and safety studies and phase I and II clinical trials.
We believe that our contract manufacturing agreement with Rentschler will be sufficient to accommodate clinical trials of our MAXY-G34 product candidates through phase I and II clinical trials. However, we may need to secure additional manufacturing arrangements or to develop our own manufacturing capability to meet our future needs, which would require significant capital investment. We may also enter into collaborations with pharmaceutical or larger biotechnology companies to enhance the manufacturing capabilities for our product candidates.
Competition
Any products that we develop through our technologies will compete in highly competitive markets. We face competition from large pharmaceutical and biopharmaceutical companies, such as Eli Lilly and Company, Pfizer, Inc., Genentech, Inc., Novo Nordisk A/S, Schering-Plough Corporation and Amgen Inc., and from smaller biotechnology companies, such as Human Genome Sciences, Inc., Zymogenetics, Inc. and InterMune, Inc. In the vaccines field, we face competition from biotechnology companies, such as Corixa Corporation (now a subsidiary of GlaxoSmithKline plc) and Vical Corporation, as well as large pharmaceutical companies, including GlaxoSmithKline plc, Sanofi-Aventis and Merck & Co., Inc.
Many of our potential competitors, either alone or together with their collaborative partners, have substantially greater financial, technical and personnel resources than we do, and there can be no assurance that they will not succeed in developing technologies and products that would render our technologies and products
11
Table of Contents
or those of our collaborators obsolete or noncompetitive. In addition, many of our competitors have significantly greater experience than we do in:
| · | developing products; |
| · | undertaking pre-clinical testing and clinical trials; |
| · | obtaining FDA and other regulatory approvals of products; and |
| · | manufacturing and marketing products. |
We are a leader in the field of directed molecular evolution. We are aware that other companies, including Diversa Corporation, Xencor, Inc. and Nautilus Biotech, have alternative methods for obtaining and generating genetic diversity or use mutagenesis techniques to produce genetic diversity. Academic institutions such as the California Institute of Technology, Pennsylvania State University and the University of Washington are also working in this field. We have licensed certain patents from certain of these institutions. This field is highly competitive and companies and academic and research institutions are actively seeking to develop technologies that could be competitive with our technologies.
We are aware that other companies, organizations and persons have described technologies that appear to have some similarities to our patented proprietary technologies. We monitor publications and patents that relate to directed molecular evolution to be aware of developments in the field and evaluate appropriate courses of action in relation to these developments.
Research and Development Expenses
The majority of our operating expenses to date have been related to research and development. Excluding Codexis, our research and development expenses from continuing operations were $39.3 million in 2005, $37.8 million in 2004 and $30.5 million in 2003. Additional information required by this item is incorporated herein by reference to “Research and Development Expenses” in Note 1 of the Notes to Consolidated Financial Statements. We intend to maintain our strong commitment to research and development as an essential component of our product development effort. Licensed technology or products and/or newly acquired technology or products developed by third parties is an additional source of potential products.
Geographic Distribution
We have operations in two geographic locations, Denmark and the United States. In addition, certain of our collaborators are based outside the United States. Additional information required by this item is incorporated herein by reference to “Segment Information—Geographic Information” in Note 13 of the Notes to Consolidated Financial Statements.
Segment Reporting
We operate our business in one segment, human therapeutics. Prior to February 28, 2005, the date on which Codexis ceased to be our consolidated subsidiary, we operated our business in two segments, human therapeutics and chemicals. Additional information required by this item is incorporated herein by reference to “Segment Information” in Note 13 of the Notes to Consolidated Financial Statements.
Government Regulation
We are subject to regulation by the FDA and comparable regulatory agencies in foreign countries with respect to the development and commercialization of products resulting from our drug discovery activities. The FDA and comparable regulatory bodies in other countries currently regulate therapeutic proteins and related pharmaceutical products as biologics. Biologics are subject to extensive pre- and post-market regulation by the
12
Table of Contents
FDA, including regulations that govern the collection, testing, manufacture, safety, efficacy, potency, labeling, storage, record keeping, advertising, promotion, sale and distribution of the products.
The time required for completing testing and obtaining approvals of our product candidates is uncertain but will take several years. Any delay in testing may hinder product development. In addition, we may encounter delays in product development or rejections of product applications due to changes in FDA or foreign regulatory policies during the period of product development and testing. Failure to comply with regulatory requirements may subject us to, among other things, civil penalties and criminal prosecution; restrictions on product development and production; suspension, delay or withdrawal of approvals; and the seizure or recall of products. The lengthy process of obtaining regulatory approvals and ensuring compliance with appropriate statutes and regulations requires the expenditure of substantial resources. Any delay or failure, by us or our corporate partners, to obtain regulatory approvals could adversely affect our ability to commercialize product candidates, receive royalty payments and generate sales revenue.
Under FDA regulations, the clinical testing program required for marketing approval of a new drug typically involves three sequential phases, which may overlap.
| · | Phase I: Studies are conducted on normal, healthy human volunteers to determine safety, dosage tolerance, absorption, metabolism, distribution and excretion. If possible, Phase I studies may also be designed to gain early evidence of effectiveness. |
| · | Phase II: Studies are conducted on small groups of patients afflicted with a specific disease to gain preliminary evidence of efficacy, to determine the common short-term side effects and risks associated with the substance being tested and to determine dosage tolerance and optimal dosage. |
| · | Phase III: Involves large-scale studies conducted on disease-afflicted patients to provide statistical evidence of efficacy and safety and to provide an adequate basis for physician labeling. |
We currently expect that in 2006, an IND will be filed for our lead MAXY-G34 product candidate and that an IND or comparable foreign application will be filed for our lead MAXY-alpha product candidate. If these applications are not rejected by the FDA or the applicable foreign regulatory agency, we expect that clinical trials would commence shortly after such filings. To date, neither we nor our corporate collaborators have filed an IND or any other applications with the FDA or any other regulatory agency to conduct clinical trials for any of our product candidates. If we or our corporate collaborators are unable to obtain the approval of the FDA or the applicable foreign regulatory agency for any application, we will not be permitted to conduct clinical trials of MAXY-G34, MAXY-alpha or any of our other product candidates and, ultimately, will not be able to seek or obtain regulatory approval for commercialization of the applicable product.
Phase I, Phase II or Phase III testing may not be completed successfully within any specific period of time, if at all, with respect to any of our potential products. Furthermore, we, an institutional review board, the FDA or other regulatory bodies may suspend a clinical trial at any time for various reasons, including a finding that the subjects or patients are being exposed to an unacceptable health risk.
FDA marketing approval is only applicable in the United States. Marketing approval in foreign countries is subject to the regulations of those countries. The approval procedures vary among countries and can involve additional testing. The time required to obtain approval may differ from that required for FDA approval.
Although there are some centralized procedures for filings in the European Union countries, in general each country has its own procedures and requirements, and compliance with these procedures and requirements may be expensive and time-consuming. Accordingly, there may be substantial delays in obtaining required approvals from foreign regulatory authorities after the relevant applications are filed, if approvals are ultimately received at all.
13
Table of Contents
Environmental Regulation
We seek to comply with all applicable statutory and administrative requirements concerning environmental quality. We have made, and will continue to make, expenditures for environmental compliance and protection. Expenditures for compliance with environmental laws have not had, and are not expected to have, a material effect on our capital expenditures, results of operation or competitive position.
Employees
As of January 31, 2006, we had 144 employees, 52 of whom hold Ph.D., Ph.D. equivalent or M.D. degrees and 87 of whom were engaged in full-time research activities. We plan to expand our corporate development programs and hire additional staff if additional corporate collaborations are established or if existing corporate collaborations are expanded. We continue to search for qualified individuals with interdisciplinary training and flexibility to address the various aspects and applications of our technologies. None of our employees is represented by a labor union, and we consider our employee relations to be good.
Corporate Background and History
We began operations in 1997 to commercialize technologies originally conceived at Affymax Research Institute, then a subsidiary of what is now GlaxoSmithKline plc. We were incorporated in Delaware on May 7, 1996 and began operations in March 1997. Our principal executive offices are located at 515 Galveston Drive, Redwood City, CA 94063. Our telephone number is (650) 298-5300.
Our operations were originally focused on the application of our MolecularBreeding directed evolution platform and other technologies to the development of multiple products in a broad range of industries, including human therapeutics, chemicals and agriculture. In August 2000, to complement and expand our human therapeutics operations, we established our Danish subsidiary, Maxygen ApS, through the acquisition of ProFound Pharma A/S, a privately held Danish biotechnology company. In 2002, we formed two wholly owned subsidiaries, Codexis, Inc. and Verdia, Inc., to operate our chemicals and agriculture businesses.
Over the past three years, we have shifted our primary focus to the development of superior, next-generation protein pharmaceuticals. Accordingly, in 2004, we sold Verdia to Pioneer Hi-Bred International, Inc., a wholly-owned subsidiary of E.I. du Pont de Nemours and Company, for $64 million in cash. Codexis received financing from third party investors and operated as independent subsidiary beginning in September 2002 and, in February 2005, our voting rights in Codexis were reduced below 50%. As a result, we no longer consolidate Codexis in our financial statements and instead reflect our investment in Codexis under the equity method of accounting.
Available Information
Our web site is located at www.maxygen.com. We make available free of charge, on or through our web site, our annual, quarterly and current reports, and any amendments to those reports, as soon as reasonably practicable after electronically filing or furnishing such reports with the Securities and Exchange Commission, or SEC. Information contained on our web site is not part of this report.
| Item 1A | RISK FACTORS |
This report contains forward-looking statements that involve risks and uncertainties. Our actual results could differ materially from those anticipated in these forward-looking statements as a result of factors both in and out of our control, including the risks faced by us described below and elsewhere in this report.
You should carefully consider the risks described below, together with all of the other information included in this report, in considering our business and prospects. The risks and uncertainties described below are not the only ones facing our company. Additional risks and uncertainties not presently known to us or that we currently
14
Table of Contents
deem immaterial also may impair our business operations. If any of the following risks actually occur, our business could be harmed. In such case, the trading price of our common stock could decline, and you may lose all or part of your investment.
We have a history of net losses. We expect to continue to incur net losses and may not achieve or maintain profitability.
We have incurred losses since our inception, including a loss applicable to common stockholders of $35.2 million in 2005, before a positive non-recurring adjustment of $16.6 million resulting from the cumulative effect adjustment recorded as a result of the deconsolidation of Codexis, and $33.7 million in 2003. During 2004, we recognized income applicable to common stockholders of $8.3 million, primarily due to the sale of Verdia, but our loss from continuing operations was $49.1 million. Our loss from continuing operations in 2005 was $35.1 million. As of December 31, 2005, we had an accumulated deficit of $204.2 million. We expect to incur net losses and negative cash flow from operating activities for at least the next several years. The funded research portion of one of our primary collaborations, with Roche for our MAXY-alpha product candidates, ended in December 2005. To date, we have derived substantially all our revenues from collaborations and grants and expect to derive a substantial majority of our revenue from such sources for at least the next several years. Revenues from collaborations and grants are uncertain because our existing agreements generally have fixed terms and may be terminated under certain conditions, and because our ability to secure future agreements will depend upon our ability to address the needs of current and potential future collaborators. We expect to spend significant amounts to fund the development of our product candidates. As a result, we expect that our operating expenses will exceed revenues in the near term and we do not expect to achieve profitability during the next several years. If the time required for us to achieve profitability is longer than we anticipate, we may not be able to continue our business.
We are an early stage company deploying unproven technologies. If we do not develop commercially successful products, we may be forced to cease operations.
You must evaluate us in light of the uncertainties and complexities affecting an early stage biotechnology company. We may not be successful in the commercial development of products. Successful products will require significant development and investment, including testing, to demonstrate their safety and effectiveness before their commercialization. To date, companies in the biotechnology industry have developed and commercialized only a limited number of products. We have not proven our ability to develop or commercialize any products. We, either alone or in conjunction with our corporate collaborators, must conduct a substantial amount of additional research and development before any regulatory authority will approve any of our potential products. This research and development may not indicate that our products are safe and effective, in which case regulatory authorities may not approve them. Problems frequently encountered in connection with the development and utilization of new and unproven technologies and the competitive environment in which we operate could limit our ability to develop commercially successful products.
Our revenues, expenses and operating results are subject to fluctuations that may cause our stock price to decline.
Our revenues, expenses and operating results have fluctuated in the past and are likely to do so in the future. These fluctuations could cause our stock price to fluctuate significantly or decline. Some of the factors that could cause our revenues, expenses and operating results to fluctuate include:
| · | termination of research contracts with collaborators or government research grants, which may not be renewed or replaced; |
| · | the success rate of our development or discovery efforts leading to milestones and royalties; |
| · | timing of licensing fees or the achievement of milestones under new or existing licensing and collaborative arrangements; |
15
Table of Contents
| · | timing of expenses, particularly with respect to contract manufacturing, pre-clinical studies and clinical trials; |
| · | the timing and willingness of collaborators to commercialize our products, which would result in royalties to us; and |
| · | general and industry specific economic conditions, which may affect our collaborators’ research and development expenditures. |
A large portion of our expenses are relatively fixed, including expenses for facilities, equipment and personnel. Accordingly, if revenues fluctuate unexpectedly due to unexpected expiration of research contracts or government research grants, failure to obtain anticipated new contracts or other factors, we may not be able to immediately reduce our operating expenses. Failure to achieve anticipated levels of revenues could therefore significantly harm our operating results for a particular fiscal period.
Due to the possibility of fluctuations in our revenues and expenses, we believe that quarter-to-quarter comparisons of our operating results are not a good indication of our future performance. Our operating results in some quarters may not meet the expectations of stock market analysts and investors. In that case, our stock price would likely decline.
Our revenues are substantially dependent on a limited number of collaborative arrangements and government grants, and our inability to maintain existing collaborations or grants or establish future collaborations or grants would adversely impact our revenues, financial position and results of operation.
We expect that substantially all of our revenue for the foreseeable future will result from payments under our collaborative arrangements and from government grants. We currently have one collaboration agreement, with Roche for our MAXY-VII product candidates, and three government grants that are expected to generate revenue in 2006. If this collaboration agreement with Roche is not successful or the agreement or the government grants are terminated and we are unable to enter into new collaboration agreements or secure additional grants, our revenues, financial position and results of operations would be materially adversely affected.
Drug development is a long, expensive and uncertain process and may not result in the development of any commercially successful products.
The development of human therapeutic products is long and uncertain. Most product candidates fail before entering clinical trials and most clinical trials do not result in a marketed product. In addition, due to the nature of human therapeutic research and development, the expected timing of product development and initiation of clinical trials and the results of such development and clinical trials are uncertain and subject to change at any point. This uncertainty may result in research delays, product candidate failures and clinical trial delays and failures. Such delays and failures could drastically reduce the price of our stock and our ability to raise capital. Without sufficient capital, we would need to reduce operations and could be forced to cease operations.
In addition, we may determine that certain preclinical product candidates or programs do not have sufficient potential to warrant further funding. Accordingly, we may elect to terminate our programs for such product candidates or programs at any time. If we terminate a preclinical program in which we have invested significant resources, our financial condition and results of operations may be adversely affected, as we will have expended resources on a program that will not provide a return on our investment and we will have missed the opportunity to have allocated those resources to potentially more productive uses. Termination of such programs could cause the price of our stock to drop significantly.
Our potential products are subject to a lengthy and uncertain regulatory process. If our potential products are not approved, we will not be able to commercialize those products.
The FDA must approve any therapeutic product or vaccine before it can be marketed in the United States. Before we can file a new drug application or biologic license application with the FDA, the product candidate
16
Table of Contents
must undergo extensive testing, including animal and human clinical trials, which can take many years and require substantial expenditures. Data obtained from such testing are susceptible to varying interpretations that could delay, limit or prevent regulatory approval. In addition, changes in regulatory policy for product approval during the period of product development and regulatory agency review of each submitted new application or product license application may cause delays or rejections. The regulatory process is expensive and time consuming. The regulatory agencies of foreign governments must also approve our therapeutic products before the products can be sold in those other countries.
Because our potential products involve the application of new technologies and may be based upon new therapeutic approaches, they may be subject to substantial review by government regulatory authorities and these authorities may grant regulatory approvals more slowly for our products than for products using more conventional technologies. We have not submitted an application to the FDA or any other regulatory authority for any product candidate, and neither the FDA nor any other regulatory authority has approved any therapeutic product candidate developed with our MolecularBreeding directed evolution platform for commercialization in the United States or elsewhere. We may not be able to, or our collaborators may not be able to, conduct clinical testing or obtain the necessary approvals from the FDA or other regulatory authorities for our products.
Even if we receive regulatory approval, this approval may entail limitations on the indicated uses for which we can market a product. Further, once regulatory approval is obtained, a marketed product and its manufacturer are subject to continual review, and discovery of previously unknown problems with a product or manufacturer may result in restrictions on the product, manufacturer or manufacturing facility, including withdrawal of the product from the market. In certain countries, regulatory agencies also set or approve prices.
The manufacturing of our product candidates presents technological, logistical and regulatory risks, each of which may adversely affect our potential revenues.
The manufacturing and manufacturing development of pharmaceuticals, and, in particular, biologicals, are technologically and logistically complex and heavily regulated by the FDA and other governmental authorities. The manufacturing and manufacturing development of our product candidates present many risks, including, but not limited to, the following:
| · | before we can obtain approval of any of our products or product candidates for the treatment of a particular disease or condition, we must demonstrate to the satisfaction of the FDA and other governmental authorities that the drug manufactured for the clinical trials is comparable to the drug manufactured for commercial use and that the manufacturing facility complies with applicable laws and regulations; |
| · | it may not be technically feasible to scale up an existing manufacturing process to meet demand or such scale-up may take longer than anticipated; and |
| · | failure to comply with strictly enforced GMP regulations and similar foreign standards may result in delays in product approval or withdrawal of an approved product from the market. |
Any of these factors could delay any clinical trials, regulatory submissions or commercialization of our product candidates, entail higher costs and result in our being unable to effectively sell any products.
Our manufacturing strategy, which relies on third-party manufacturers, exposes us to additional risks.
We do not currently have the resources, facilities or experience to manufacture any product candidates or potential products ourselves. Completion of any clinical trials and any commercialization of our products will require access to, or development of, manufacturing facilities that meet FDA standards or other regulatory requirements to manufacture a sufficient supply of our potential products. We currently depend on third parties for the scale up and manufacture of our product candidates for preclinical and clinical purposes. If our third party manufacturers are unable to manufacture preclinical or clinical supplies in a timely manner, or are unable or
17
Table of Contents
unwilling to satisfy our needs or FDA or other regulatory requirements, it could delay clinical trials, regulatory submissions and commercialization of our potential products, entail higher costs and possibly result in our being unable to sell our products. In addition, technical problems or other manufacturing delays could delay the advancement of potential products into preclinical or clinical trials or result in the termination of development of particular product candidates, adversely affecting our product development timetable, which in turn could adversely affect our stock price.
In addition, failure of any third party manufacturers or us to comply with applicable regulations, including pre- or post-approval inspections and the GMP requirements of the FDA or other comparable regulatory agencies, could result in sanctions being imposed on us. These sanctions could include fines, injunctions, civil penalties, failure of regulatory authorities to grant marketing approval of our products, delay, suspension or withdrawal of approvals, license revocation, product seizures or recalls, operational restrictions and criminal prosecutions, any of which could significantly and adversely affect our business.
If our collaborations are not successful, we may not be able to effectively develop and market some of our products.
Since we do not currently possess the resources necessary to develop and commercialize multiple products, or the resources to complete all approval processes that may be required for these potential products, we generally seek to enter into collaborative arrangements to develop and commercialize potential products. We have entered into collaborative agreements with other companies to fund the development of new products for specific purposes. These contracts generally expire after a fixed period of time. If they are not renewed or if we do not enter into new collaborative agreements, our revenues will be reduced and our potential products may not be commercialized.
We have limited or no control over the resources that any collaborator may devote to the development and commercialization of our potential products. Any of our present or future collaborators may not perform their obligations as expected. These collaborators may delay such development or commercialization, breach or terminate their agreement with us or otherwise fail to conduct their collaborative activities successfully and in a timely manner. Further, our collaborators may elect not to develop potential products arising out of our collaborative arrangements or devote sufficient resources to the development, manufacture, marketing or sale of these products. If any of these events occur, we may not be able to develop or commercialize our potential products.
In particular, we have entered into agreements with Roche for the co-development and commercialization of two of our lead product candidates, MAXY-alpha and MAXY-VII. The failure of Roche to perform its obligations under either agreement, our failure to perform our obligations under either agreement or to effectively manage our relationship with Roche, or a material contractual dispute with Roche under either agreement would have a material adverse effect on our prospects and financial results.
We conduct proprietary research programs, and any conflicts with our collaborators or any inability to commercialize products resulting from this research could harm our business.
An important part of our strategy involves conducting proprietary research programs. As a result, we may pursue opportunities in fields that could conflict with those of our collaborators. Moreover, disagreements with our collaborators could develop over rights to our intellectual property. Any conflict with our collaborators could reduce our ability to obtain future collaboration agreements and negatively impact our relationship with existing collaborators, which could reduce our revenues.
Certain of our collaborators could become our competitors in the future. Our collaborators could develop competing products, preclude us from entering into collaborations with their competitors, fail to obtain timely regulatory approvals, terminate their agreements with us prematurely or fail to devote sufficient resources to
18
Table of Contents
allow the development and commercialization of our products. Any of these developments could harm our product development efforts.
In some cases, our collaborators already market a product that could be competitive with the product(s) that we are collaborating with them on for an improved version, and could conduct their operations in a manner that discriminates against the product that we developed.
We will either commercialize products resulting from our proprietary programs directly or through licensing to other companies. We have no experience in manufacturing or marketing, and we currently do not have the resources or capability to manufacture products on a commercial scale. In order for us to commercialize these products directly, we would need to develop, or obtain through outsourcing arrangements, the capability to manufacture, market and sell products, each of which could require significant capital investment. We do not have these capabilities, and we may not be able to develop or otherwise obtain the requisite manufacturing, marketing and sales capabilities. If we are unable to successfully commercialize products resulting from our proprietary research efforts, we will continue to incur losses.
Any inability to adequately protect our proprietary technologies could harm our competitive position.
Our success will depend in part on our ability to obtain patents and maintain adequate protection of our intellectual property for our technologies and products in the United States and other countries. If we do not adequately protect our intellectual property, competitors may be able to practice our technologies and erode our competitive advantage. The laws of some foreign countries do not protect proprietary rights to the same extent as the laws of the United States, and many companies have encountered significant problems in protecting their proprietary rights in these foreign countries. These problems can be caused by, for example, a lack of rules and processes allowing for meaningfully defending intellectual property rights.
We will be able to protect our proprietary rights from unauthorized use by third parties only to the extent that our proprietary technologies are covered by valid and enforceable patents or are effectively maintained as trade secrets. The patent positions of biopharmaceutical and biotechnology companies, including our patent positions, are often uncertain and involve complex legal and factual questions. We apply for patents covering our technologies and potential products as we deem appropriate. However, we may not obtain patents on all inventions for which we seek patents, and any patents we obtain may be challenged and may be narrowed in scope or extinguished as a result of such challenges. Our existing patents and any future patents we obtain may not be sufficiently broad to prevent others from practicing our technologies or from developing competing products. Enforcement of our patents against infringers could require us to expend significant amounts with no assurance that we would be successful in any litigation. Others may independently develop similar or alternative technologies or design around our patented technologies or products. In addition, others may challenge or invalidate our patents, or our patents may fail to provide us with any competitive advantages.
We rely upon trade secret protection for our confidential and proprietary information. We have taken security measures to protect our proprietary information. These measures may not provide adequate protection for our trade secrets or other proprietary information. We seek to protect our proprietary information by entering into confidentiality agreements with employees, collaborators and consultants. Nevertheless, employees, collaborators or consultants may still disclose or misuse our proprietary information, and we may not be able to meaningfully protect our trade secrets. In addition, others may independently develop substantially equivalent proprietary information or techniques or otherwise gain access to our trade secrets.
Litigation or other proceedings or third party claims of intellectual property infringement could require us to spend time and money and could require us to shut down some of our operations.
Our ability to develop products depends in part on not infringing patents or other proprietary rights of third parties, and not breaching any licenses that we have entered into with regard to our technologies and products.
19
Table of Contents
Others have filed, and in the future are likely to file, patent applications covering genes or gene fragments or corresponding proteins or peptides that we may wish to utilize with our proprietary technologies, or products that are similar to products developed with the use of our technologies or alternative methods of generating gene diversity. If these patent applications result in issued patents and we wish to use the patented technology, we would need to obtain a license from the third party, which may not be available on acceptable terms, if at all.
Third parties may assert that we are employing their proprietary technology without authorization. In particular, our efforts to develop improved, next-generation protein pharmaceuticals could lead to allegations of patent infringement by the parties commercializing other versions of such proteins. In addition, third parties may obtain patents in the future and claim that our technologies or product candidates infringe these patents. We could incur substantial costs and diversion of the time and attention of management and technical personnel in defending ourselves against any of these claims or enforcing our patents or other intellectual property rights against others. Furthermore, parties making claims against us may be able to obtain injunctive or other equitable relief that could effectively block our ability to further develop, commercialize and sell products. In addition, in the event of a successful claim of infringement against us, we may be required to pay damages and obtain one or more licenses from third parties. We may not be able to obtain these licenses at a reasonable cost, if at all. In that event, we could encounter delays in product introductions while we attempt to develop alternative methods or products, or be required to cease commercializing affected products.
We monitor the public disclosures of other companies operating in our industry regarding their technological development efforts. If we determine that these efforts violate our intellectual property or other rights, we intend to take appropriate action, which could include litigation. Any action we take could result in substantial costs and diversion of management and technical personnel. Furthermore, the outcome of any action we take to protect our rights may not be resolved in our favor.
Budget or cash constraints may force us to delay or terminate our efforts to develop certain products and could prevent us from executing our business plan, meeting our stated timetables and commercializing our potential products as quickly as possible.
Because we are an emerging company with limited resources, and because the research and development of pharmaceuticals is a long and expensive process, we must regularly assess the most efficient allocation of our research and development resources. Accordingly, we may choose to delay or terminate our research and development efforts for a promising product candidate to allocate those resources to another program, which could cause us to fall behind our initial timetables for development and prevent us from commercializing product candidates as quickly as possible. As a result, we may not be able to fully realize the value of some of our product candidates in a timely manner, since they will be delayed in reaching the market, or may not reach the market at all.
We are continuing our efforts to contain costs. On June 16, 2005, we announced a reduction in force of approximately 16% of our personnel, across both our research and administrative functions. This reduction in force was a part of our efforts to focus our resources on product development. As a result of the reduction in force, we recorded termination costs of $807,000 during 2005, comprised primarily of involuntary termination benefits. We continue to believe strict cost containment in the near term is essential if our current funds are to be sufficient to allow us to continue our currently planned operations. We assess market conditions on an ongoing basis and plan to take appropriate actions as required. However, we may not be able to effectively contain our costs and achieve an expense structure commensurate with our business activities and revenues. As a result, we have inadequate levels of cash for future operations or for future capital requirements, which could significantly harm our ability to operate the business.
We may need additional capital in the future. If additional capital is not available, we may have to curtail or cease operations.
We anticipate that existing cash and cash equivalents and income earned thereon, together with anticipated revenues from collaborations and grants, will enable us to maintain our currently planned operations for at least
20
Table of Contents
the next twelve months. However, our current plans and assumptions may change, and our capital requirements may increase in future periods depending on many factors, including payments received under collaborative agreements and government grants, the progress and scope of our collaborative and independent research and development projects, the extent to which we advance products into clinical trials with our own resources, the effect of any acquisitions, and the filing, prosecution and enforcement of patent claims. Changes may also occur that would consume available capital resources significantly sooner than we expect.
We have no committed sources of capital and do not know whether additional financing will be available when needed, or, if available, that the terms will be favorable to us or our stockholders. If additional funds are not available, we may be forced to delay or terminate research or preclinical development programs, clinical trials, if any, or the commercialization of products, if any, resulting from our technologies, curtail or cease operations or obtain funds through collaborative and licensing arrangements that may require us to relinquish commercial rights or potential markets, or grant licenses on terms that are not favorable to us. If adequate funds are not available, we will not be able to successfully execute our business plan or continue our business.
Many potential competitors who have greater resources and experience than we do may develop products and technologies that make ours obsolete.
The biotechnology industry is characterized by rapid technological change, and the area of gene research is a rapidly evolving field. Our future success will depend on our ability to maintain a competitive position with respect to technological advances. Rapid technological development by others may result in our products and technologies becoming obsolete.
We face, and will continue to face, intense competition from both large and small biotechnology companies, as well as academic and research institutions and government agencies, that are pursuing competing technologies for modifying DNA and proteins. These companies and organizations may develop technologies that are alternatives to our technologies. Further, our competitors in the protein optimization field may be more effective at implementing their technologies to develop commercial products. Some of these competitors have entered into collaborations with leading companies within our target markets to produce commercial products.
Any products that we develop through our technologies will compete in multiple, highly competitive markets may fail to achieve market acceptance, which would impair our ability to become profitable. Most of the companies and organizations competing with us in the markets for such products have greater capital resources, research and development and marketing staff and facilities and capabilities, and greater experience in modifying DNA and proteins, obtaining regulatory approvals, manufacturing products and marketing. Our product candidates, even if approved by the FDA or a comparable foreign regulatory agency, may fail to achieve market acceptance, which would impair our ability to become profitable.
Accordingly, our competitors may be able to develop technologies and products more easily, which would render our technologies and products and those of our collaborators obsolete and noncompetitive.
Legislative actions, recent and potential new accounting pronouncements and higher compliance costs are likely to adversely impact our future financial position and results of operations.
Recent changes in financial accounting standards may cause adverse, unexpected earnings fluctuations and will adversely affect our reported results of operations. For example, on December 16, 2004, the Financial Accounting Standards Board, or FASB, issued FASB Statement No. 123 (revised 2004), “Share-Based Payment,” or SFAS 123(R), which requires all share-based payments to employees, including grants of employee stock options, to be recognized in the income statement based at their fair values. We adopted SFAS 123(R) as of January 1, 2006 and we expect the implementation of SFAS 123(R)’s fair value method to have a significant impact on our results of operations. Such charges will significantly increase our net loss and delay our ability to achieve profitability. The magnitude of the impact of expensing stock-based compensation will depend in part
21
Table of Contents
upon the timing and amount of future equity compensation awards. New accounting pronouncements and varying interpretations of such pronouncements have occurred with frequency in the recent past and may occur in the future. In addition, we may make changes in our accounting policies in the future.
Compliance with changing regulations regarding corporate governance and public disclosure will also result in additional expenses. Changing laws, regulations and standards relating to corporate governance and public disclosure, including the Sarbanes-Oxley Act of 2002 and related SEC regulations and Nasdaq National Market listing requirements, have created uncertainty for companies such as ours and compliance costs are increasing as a result of this uncertainty and other factors. We are committed to maintaining high standards of corporate governance and public disclosure. As a result, we intend to invest all reasonably necessary resources to comply with evolving standards, and this investment will result in increased general and administrative expenses and may cause a diversion of management time and attention from revenue-generating activities to compliance activities.
If we do not attract and retain key employees, our business could be impaired.
To be successful and achieve our objectives, we must attract and retain qualified scientific and management personnel. If we are unsuccessful in attracting and retaining qualified personnel, particularly at the management level, our business could be impaired. We have been successful in hiring and retaining key personnel in the past; however, we face significant competition for experienced, management level personnel. Although we believe have been successful in attracting and retaining qualified personnel, competition for experienced management personnel and scientists from numerous companies and academic and other research institutions may limit our ability to do so in the future on acceptable terms. Failure to attract and retain personnel could prevent us from pursuing collaborations or developing our products or core technologies.
The operation of international locations may increase operating expenses and divert management attention.
We conduct certain of our operations through Maxygen ApS, our Danish subsidiary. Operation as an international entity requires additional management attention and resources. We have limited experience in operating internationally and in conforming our operations to local cultures, standards and policies. The costs of operating internationally are expected to continue to exceed our international revenues, if any, for at least the next several years. As we continue to operate internationally, we are subject to risks of doing business internationally, including the following:
| · | regulatory requirements that may limit or prevent the offering of our products in local jurisdictions; |
| · | local legal and governmental limitations on company-wide employee benefit practices, such as the operation of our employee stock option plan in local jurisdictions; |
| · | government limitations on research and/or research involving genetically engineered products or processes; |
| · | difficulties in staffing and managing foreign operations; |
| · | currency exchange risks; and |
| · | potentially adverse tax consequences. |
Acquisitions could result in dilution, operating difficulties and other harmful consequences.
If appropriate opportunities present themselves, we may acquire businesses or technologies that complement our capabilities. The process of integrating any acquisition may create unforeseen operating difficulties and expenditures and is itself risky. The areas where we may face difficulties include:
| · | diversion of management time (both ours and that of the acquired company) from focus on operating the businesses to issues of integration during the period of negotiation through closing and further diversion of such time after closing; |
22
Table of Contents
| · | decline in employee morale and retention issues resulting from changes in compensation, reporting relationships, future prospects, or the direction of the business; |
| · | the need to integrate each company’s accounting, management information, human resource and other administrative systems to permit effective management and the lack of control if such integration is delayed or not implemented; and |
| · | the need to implement controls, procedures and policies appropriate for a larger public company in companies that before acquisition had been smaller, private companies. |
We do not have extensive experience in managing this integration process. Moreover, the anticipated benefits of any or all of these acquisitions may not be realized.
Future acquisitions could result in potentially dilutive issuances of equity securities, the incurrence of debt, contingent liabilities or amortization expenses related to intangible assets, any of which could harm our business. Future acquisitions may require us to obtain additional equity or debt financing, which may not be available on favorable terms or at all. Even if available, this financing may be dilutive.
Our stock price has been, and may continue to be, extremely volatile, and an investment in our stock could decline in value.
The trading prices of life science company stocks in general, and ours in particular, have experienced significant price fluctuations in the last several years. During the twelve-month period ended December 31, 2005, the price of our common stock on the Nasdaq National Market ranged from $6.49 to $12.64. The valuations of many life science companies without product revenues and earnings, including ours, are based on valuation standards such as price to sales ratios and progress in product development or clinical trials. Trading prices based on these valuations may not be sustained. Any negative change in the public’s perception of the prospects of biotechnology or life science companies could depress our stock price regardless of our results of operations. Other broad market and industry factors may decrease the trading price of our common stock, regardless of our performance. In addition, our stock price could be subject to wide fluctuations in response to factors including the following:
| · | our failure to meet our publicly announced revenue and/or expense projections and/or product development timetables; |
| · | adverse results or delays in preclinical development or clinical trials; |
| · | any decisions to discontinue or delay development programs or clinical trials; |
| · | announcements of new technological innovations or new products by us or our competitors; |
| · | conditions or trends in the biotechnology and life science industries; |
| · | changes in the market valuations of other biotechnology or life science companies; |
| · | developments in domestic and international governmental policy or regulations; |
| · | announcements by us or our competitors of significant acquisitions, strategic partnerships, joint ventures or capital commitments; |
| · | developments in or challenges relating to patent or other proprietary rights; and |
| · | sales of our common stock or other securities in the open market. |
In the past, stockholders have often instituted securities class action litigation after periods of volatility in the market price of a company’s securities. If a stockholder files a securities class action suit against us, we could incur substantial legal fees and our management’s attention and resources would be diverted from operating our business to respond to the litigation.
23
Table of Contents
Substantial sales of shares may adversely impact the market price of our common stock.
If our stockholders sell substantial amounts of our common stock, including shares issued upon the exercise of outstanding options, the market price of our common stock may decline. Our common stock trading volume is low and thus the market price of our common stock is particularly sensitive to trading volume. Our low trading volume may also make it more difficult for us to sell equity or equity related securities in the future at a time and price that we deem appropriate. Significant sales of our common stock may adversely impact the then-prevailing market price of our common stock.
Some of our existing stockholders can exert control over us, and may not make decisions that are in the best interests of all stockholders.
As of December 31, 2005, our executive officers and directors, together with GlaxoSmithKline plc, controlled approximately 28% of our outstanding common stock. As a result, these stockholders, if they act together, and GlaxoSmithKline plc, which owns approximately 18% of our outstanding common stock, by itself, could exert a significant degree of influence over our management and affairs and over matters requiring stockholder approval, including the election of directors and approval of significant corporate transactions. In addition, this concentration of ownership may delay or prevent a change in control of our company and might affect the market price of our common stock, even when a change may be in the best interests of all stockholders. In addition, the interests of this concentration of ownership may not always coincide with our interests or the interests of other stockholders and accordingly, they could cause us to enter into transactions or agreements that we would not otherwise consider. This concentration of ownership could also depress our stock price.
| Item 1B | UNRESOLVED STAFF COMMENTS |
Not applicable.
| Item 2 | PROPERTIES |
As of March 1, 2006, we leased an aggregate of 56,980 square feet of office and laboratory facilities in Redwood City, California. Our leases expire on February 24, 2007 and include options to extend for additional one-year terms. We also lease an aggregate of 25,783 square feet of office and laboratory facilities in Horsholm, Denmark. This lease expires on October 31, 2010, but, as of October 31, 2005, may be terminated by us at any time upon six months notice.
We believe that our existing facilities are adequate to meet our needs for the immediate future. We believe that we can accommodate future growth, if any, by leasing additional or alternative space. For additional information regarding our lease obligations, see Note 8 of the Notes to Consolidated Financial Statements.
| Item 3 | LEGAL PROCEEDINGS |
In December 2001, a lawsuit was filed in the U.S. District Court for the Southern District of New York against us, our chief executive officer, Russell Howard, and our chief financial officer at the time of our initial public offering, Simba Gill, together with certain underwriters of our initial public offering and secondary public offering of common stock. The complaint, which alleges claims under Sections 11, 12(a)(2) and 15 of the Securities Act of 1933 and Section 10(b) of the Securities Exchange Act of 1934, is among the so-called “laddering” cases that have been commenced against over 300 companies that had public offerings of securities in 1999 and 2000. The complaint has been consolidated with other laddering claims in a proceeding styledIn re Initial Public Offering Securities Litigation, No. 21 MC 92 (SAS), pending before the Honorable Shira A. Scheindlin. In February 2003, the court dismissed the Section 10(b) claim against Drs. Howard and Gill; the remainder of the case remains pending.
In June 2003, we agreed to the terms of a tentative settlement agreement along with other defendant issuers inIn re Initial Public Offering Securities Litigation. The tentative settlement provides that the insurers of the 309
24
Table of Contents
defendant issuers will pay to the plaintiffs $1 billion, less any recovery of damages the plaintiffs receive from the defendant underwriters. If the plaintiffs receive over $5 billion in damages from the defendant underwriters, we will be entitled to reimbursement of various expenses incurred by us as a result of the litigation. As part of the tentative settlement, we will assign to the plaintiffs “excess compensation claims” and certain other of our claims against the defendant underwriters based on the alleged actions of the defendant underwriters. The settlement is subject to acceptance by a substantial majority of defendants and execution of a definitive settlement agreement. The settlement is also subject to approval of the Court, which cannot be assured. On February 15, 2005, the Court tentatively approved the proposed settlement, conditioned upon the parties altering the proposed settlement to comply with the Private Securities Litigation Reform Act’s settlement discharge provision. The settlement does not contemplate any settlement payments by us.
If the settlement is not accepted by the requisite number of defendants or if it is not approved by the Court, we intend to defend the lawsuit vigorously. We believe the lawsuit against us and our officers is without merit. However, the litigation is in the preliminary stage, and we cannot predict its outcome. The litigation process is inherently uncertain. If the outcome of the litigation is adverse to us and if we are required to pay significant damages, our business would be significantly harmed.
| Item 4 | SUBMISSION OF MATTERS TO A VOTE OF SECURITY HOLDERS |
There were no matters submitted to a vote of security holders during the fourth quarter of the fiscal year ended December 31, 2005.
25
Table of Contents
Part II
| Item 5 | MARKET FOR REGISTRANT’S COMMON EQUITY, RELATED STOCKHOLDER MATTERS AND ISSUER PURCHASES OF EQUITY SECURITIES |
Market Information
Our common stock has been traded on the Nasdaq National Market under the symbol MAXY since December 16, 1999. During the last two fiscal years, through December 31, 2005, the high and low sale prices for our common stock, as reported on the Nasdaq National Market, were as follows:
| High | Low | |||||
Year ended December 31, 2005 | ||||||
First Quarter | $ | 12.64 | $ | 8.15 | ||
Second Quarter | 8.87 | 6.49 | ||||
Third Quarter | 9.25 | 6.85 | ||||
Fourth Quarter | 8.85 | 6.91 | ||||
Year ended December 31, 2004 | ||||||
First Quarter | $ | 10.79 | $ | 8.28 | ||
Second Quarter | 12.19 | 8.46 | ||||
Third Quarter | 10.65 | 8.69 | ||||
Fourth Quarter | 12.79 | 9.30 | ||||
Holders
As of February 28, 2006, there were approximately 265 holders of record of our common stock, although we believe that there are a significantly larger number of beneficial owners of our common stock.
Dividends
We have never declared or paid any cash dividends on our capital stock. We currently intend to retain future earnings, if any, for development of our business and, therefore, do not anticipate that we will declare or pay cash dividends on our capital stock in the foreseeable future.
26
Table of Contents
| Item 6 | SELECTED FINANCIAL DATA |
The following selected financial information is derived from our audited consolidated financial statements. When you read this selected financial data, it is important that you also read the historical financial statements and related notes included in this report, as well as the section of this report entitled “Management’s Discussion and Analysis of Financial Condition and Results of Operations.” Historical results are not necessarily indicative of future results. Historical results include the consolidated operations of Codexis, Inc. for all periods through February 28, 2005. After that date, we account for Codexis, Inc. under the equity method of accounting.
| Year Ended December 31, | ||||||||||||||||||||
| 2001 | 2002 | 2003 | 2004 | 2005 | ||||||||||||||||
| (in thousands, except per share data) | ||||||||||||||||||||
Consolidated Statement of Operations Data: | ||||||||||||||||||||
Collaborative research and development revenue | $ | 14,362 | $ | 24,818 | $ | 20,573 | $ | 14,333 | $ | 11,594 | ||||||||||
Grant revenue | 5,356 | 3,879 | 2,282 | 1,942 | 2,907 | |||||||||||||||
Total revenues | 19,718 | 28,697 | 22,855 | 16,275 | 14,501 | |||||||||||||||
Operating expenses: | ||||||||||||||||||||
Research and development | 41,929 | 49,654 | 44,435 | 53,294 | 41,789 | |||||||||||||||
General and administrative | 11,063 | 10,805 | 11,354 | 14,372 | 13,153 | |||||||||||||||
Stock compensation expense(1) | 12,017 | 6,250 | 1,991 | 355 | 183 | |||||||||||||||
Amortization of goodwill and other intangible assets | 8,726 | 1,144 | 698 | — | — | |||||||||||||||
Total operating expenses | 73,735 | 67,853 | 58,478 | 68,021 | 55,125 | |||||||||||||||
Loss from operations | (54,017 | ) | (39,156 | ) | (35,623 | ) | (51,746 | ) | (40,624 | ) | ||||||||||
Interest income and other (expense), net | 12,861 | 7,981 | 5,253 | 4,055 | 5,572 | |||||||||||||||
Equity in net loss of minority investee | — | — | (500 | ) | (1,395 | ) | — | |||||||||||||
Loss from continuing operations | (41,156 | ) | (31,175 | ) | (30,870 | ) | (49,086 | ) | (35,052 | ) | ||||||||||
Discontinued operations: | ||||||||||||||||||||
Loss from discontinued operations | (3,808 | ) | (2,771 | ) | (1,586 | ) | (2,769 | ) | — | |||||||||||
Gain on sale of discontinued operations (net of taxes and transaction costs) | — | — | — | 61,197 | — | |||||||||||||||
Income (loss) from discontinued operations | (3,808 | ) | (2,771 | ) | (1,586 | ) | 58,428 | — | ||||||||||||
Cumulative effect adjustment(2) | — | — | — | — | 16,616 | |||||||||||||||
Net income (loss) | (44,964 | ) | (33,946 | ) | (32,456 | ) | 9,342 | (18,436 | ) | |||||||||||
Subsidiary preferred stock accretion | — | — | (1,279 | ) | (1,000 | ) | (167 | ) | ||||||||||||
Income (loss) applicable to common stockholders | $ | (44,964 | ) | $ | (33,946 | ) | $ | (33,735 | ) | $ | 8,342 | $ | (18,603 | ) | ||||||
Basic and diluted income (loss) per share: | ||||||||||||||||||||
Continuing operations | $ | (1.26 | ) | $ | (0.93 | ) | $ | (0.89 | ) | $ | (1.40 | ) | $ | (0.98 | ) | |||||
Discontinued operations | $ | (0.12 | ) | $ | (0.08 | ) | $ | (0.05 | ) | $ | 1.66 | $ | — | |||||||
Cumulative effect adjustment | $ | — | $ | — | $ | — | $ | — | $ | 0.46 | ||||||||||
Applicable to common stockholders | $ | (1.38 | ) | $ | (1.01 | ) | $ | (0.98 | ) | $ | 0.24 | $ | (0.52 | ) | ||||||
Shares used in basic and diluted per share calculations | 32,610 | 33,582 | 34,519 | 35,176 | 35,765 | |||||||||||||||
(1) Stock compensation expense related to the following: |
| |||||||||||||||||||
Research and development | $ | 9,626 | $ | 4,674 | $ | 1,514 | $ | 292 | $ | 115 | ||||||||||
General and administrative | 2,391 | 1,576 | 477 | 63 | 68 | |||||||||||||||
| $ | 12,017 | $ | 6,250 | $ | 1,991 | $ | 355 | $ | 183 | |||||||||||
| (2) | The cumulative effect adjustment in the year ended December 31, 2005 resulted from the deconsolidation of Codexis, Inc. as of February 28, 2005 (see Note 1 of Notes to Consolidated Financial Statements). |
27
Table of Contents
| December 31, | ||||||||||||||||||||
| 2001 | 2002 | 2003 | 2004 | 2005 | ||||||||||||||||
| (in thousands) | ||||||||||||||||||||
Consolidated Balance Sheet Data: | ||||||||||||||||||||
Cash, cash equivalents and investments | $ | 234,877 | $ | 219,138 | $ | 191,868 | $ | 232,893 | $ | 188,323 | ||||||||||
Working capital | 196,069 | 209,712 | 115,724 | 211,999 | 152,230 | |||||||||||||||
Total assets | 277,418 | 269,764 | 234,069 | 263,105 | 214,523 | |||||||||||||||
Non-current portion of equipment financing | 673 | 55 | — | 1,751 | — | |||||||||||||||
Minority interest | — | 20,000 | 21,210 | 32,180 | — | |||||||||||||||
Accumulated deficit | (128,726 | ) | (162,672 | ) | (195,128 | ) | (185,786 | ) | (204,222 | ) | ||||||||||
Total stockholders’ equity | 253,734 | 229,199 | 198,224 | 211,341 | 197,344 | |||||||||||||||
QUARTERLY FINANCIAL DATA
(unaudited)
| Quarter Ended | ||||||||||||||||
| March 31, | June 30, | Sept. 30, | Dec. 31, | |||||||||||||
| (in thousands, except per share data) | ||||||||||||||||
2005(1) | ||||||||||||||||
Collaborative research and development revenue | $ | 4,957 | $ | 1,446 | $ | 106 | $ | 5,085 | ||||||||
Grant revenue | 592 | 500 | 629 | 1,186 | ||||||||||||
Total revenues | 5,549 | 1,946 | 735 | 6,271 | ||||||||||||
Operating expenses: | ||||||||||||||||
Research and development | 11,082 | 9,911 | 9,982 | 10,814 | ||||||||||||
General and administrative | 3,769 | 3,372 | 2,997 | 3,015 | ||||||||||||
Stock compensation expense | 108 | 9 | 4 | 62 | ||||||||||||
Total operating expenses | 14,959 | 13,292 | 12,983 | 13,891 | ||||||||||||
Loss from operations | (9,410 | ) | (11,346 | ) | (12,248 | ) | (7,620 | ) | ||||||||
Interest income and other (expense), net | 672 | 1,477 | 1,659 | 1,764 | ||||||||||||
Loss from continuing operations | (8,738 | ) | (9,869 | ) | (10,589 | ) | (5,856 | ) | ||||||||
Cumulative effect adjustment(2) | 16,616 | — | — | — | ||||||||||||
Net income (loss) | 7,878 | (9,869 | ) | (10,589 | ) | (5,856 | ) | |||||||||
Subsidiary preferred stock accretion | (167 | ) | — | — | — | |||||||||||
Income (loss) applicable to common stockholders | $ | 7,711 | $ | (9,869 | ) | $ | (10,589 | ) | $ | (5,856 | ) | |||||
Basic and diluted income (loss) per share: | ||||||||||||||||
Continuing operations | $ | (0.25 | ) | $ | (0.28 | ) | $ | (0.30 | ) | $ | (0.16 | ) | ||||
Cumulative effect adjustment | $ | 0.47 | $ | — | $ | — | $ | — | ||||||||
Applicable to common stockholders | $ | 0.22 | $ | (0.28 | ) | $ | (0.30 | ) | $ | (0.16 | ) | |||||
Shares used in basic and diluted per share calculations | 35,658 | 35,702 | 35,812 | 35,888 | ||||||||||||
| (1) | Includes the consolidated operations of Codexis, Inc. through February 28, 2005. After that date, we account for Codexis, Inc. under the equity method of accounting. |
| (2) | The cumulative effect adjustment in the quarter ended March 31, 2005 resulted from the deconsolidation of Codexis, Inc. as of February 28, 2005 (see Note 1 of Notes to Consolidated Financial Statements). |
28
Table of Contents
| Quarter Ended | ||||||||||||||||
| March 31, | June 30, | Sept. 30, | Dec. 31, | |||||||||||||
| (in thousands, except per share data) | ||||||||||||||||
2004 | ||||||||||||||||
Collaborative research and development revenue | $ | 4,416 | $ | 3,220 | $ | 3,451 | $ | 3,246 | ||||||||
Grant revenue | 452 | 341 | 474 | 675 | ||||||||||||
Total revenues | 4,868 | 3,561 | 3,925 | 3,921 | ||||||||||||
Operating expenses: | ||||||||||||||||
Research and development | 10,819 | 11,794 | 14,428 | 16,253 | ||||||||||||
General and administrative | 2,777 | 3,503 | 3,670 | 4,422 | ||||||||||||
Stock compensation expense | 151 | 131 | 65 | 8 | ||||||||||||
Total operating expenses | 13,747 | 15,428 | 18,163 | 20,683 | ||||||||||||
Loss from operations | (8,879 | ) | (11,867 | ) | (14,238 | ) | (16,762 | ) | ||||||||
Interest income and other (expense), net | 574 | 697 | 1,015 | 1,769 | ||||||||||||
Equity in net losses of minority investee | — | (1,000 | ) | — | (395 | ) | ||||||||||
Loss from continuing operations | (8,305 | ) | (12,170 | ) | (13,223 | ) | (15,388 | ) | ||||||||
Discontinued operations: | ||||||||||||||||
Income (loss) from discontinued operations | (1,543 | ) | (1,226 | ) | — | — | ||||||||||
Gain on sale of discontinued operations (net of taxes and transaction costs) | — | — | 61,197 | — | ||||||||||||
Income (loss) from discontinued operations | (1,543 | ) | (1,226 | ) | 61,197 | — | ||||||||||
Net income (loss) | (9,848 | ) | (13,396 | ) | 47,974 | (15,388 | ) | |||||||||
Subsidiary preferred stock accretion | (250 | ) | (250 | ) | (250 | ) | (250 | ) | ||||||||
Income (loss) applicable to common stockholders | $ | (10,098 | ) | $ | (13,646 | ) | $ | 47,724 | $ | (15,638 | ) | |||||
Basic and diluted income (loss) per share: | ||||||||||||||||
Continuing operations | $ | (0.24 | ) | $ | (0.35 | ) | $ | (0.38 | ) | $ | (0.43 | ) | ||||
Discontinued operations | $ | (0.04 | ) | $ | (0.03 | ) | 1.74 | $ | — | |||||||
Applicable to common stockholders | $ | (0.29 | ) | $ | (0.39 | ) | $ | 1.35 | $ | (0.44 | ) | |||||
Shares used in basic and diluted per share calculations | 34,941 | 35,071 | 35,236 | 35,456 | ||||||||||||
The data provided above for the quarters in the period from January 1, 2004 until and including March 31, 2004 differs from that supplied in our filed Quarterly Reports on Form 10-Q due to the sale of Verdia on July 1, 2004. The quarterly results above differ from earlier reported results in that the financial results of Verdia during such periods have been removed from the “as filed” results and are reflected in the above as discontinued operations.
29
Table of Contents
| Item 7 | MANAGEMENT’S DISCUSSION AND ANALYSIS OF FINANCIAL CONDITION AND RESULTS OF OPERATIONS |
The following discussion should be read in conjunction with our consolidated financial statements and the related notes and other financial information appearing elsewhere in this report. This report contains forward-looking statements that involve risks and uncertainties. Our actual results may differ materially from those indicated in forward-looking statements. See “Forward-Looking Statements” and “Risk Factors.”
Executive Summary
We are a biotechnology company committed to the discovery, development and commercialization of superior next-generation protein pharmaceuticals for the treatment of disease and serious medical conditions. We began operations in March 1997 with the mission to develop important commercial products through the use of biotechnology. Since then, we have established a focus in human therapeutics, particularly on the development and commercialization of optimized protein pharmaceuticals.
Our business strategy focuses on developing next-generation protein pharmaceuticals that address significant markets, on our own or with collaborative partners. We currently have four next-generation product candidates that are in pre-clinical development: MAXY-G34, a next generation granulocyte colony stimulating factor, or G-CSF, for the treatment of neutropenia; MAXY-alpha, a next generation interferon alpha product for the treatment of hepatitis C virus infection; MAXY-VII, an improved factor VII product for the treatment of uncontrolled bleeding in trauma, intracerebral hemorrhage and other indications; and MAXY-gamma, an optimized interferon gamma product for the treatment of idiopathic pulmonary fibrosis and other indications. We currently expect that filings will be made in 2006 with the U.S. Food & Drug Administration, or FDA, or other regulatory agencies for approval to commence clinical development of our MAXY-G34 and MAXY-alpha product candidates.
The successful development of our product candidates is highly uncertain. Product development costs and timelines can vary significantly for each product candidate and are difficult to accurately predict. Various statutes and regulations also govern or influence the manufacturing, safety, labeling, storage, record keeping and marketing of each product. The lengthy process of seeking all necessary approvals to commercialize products, and the subsequent compliance with applicable statutes and regulations, require the expenditure of substantial resources. Any failure by us to obtain, or any delay in obtaining, regulatory approvals would materially adversely affect our business.
Prior to our focus on human therapeutics, we established two industrial subsidiaries, Codexis, Inc., or Codexis, and Verdia, Inc., or Verdia. Codexis focused on the development of biocatalysis and fermentation processes and products for the pharmaceutical industry and Verdia focused on the development of processes and products for the agricultural industry. On February 28, 2005, our voting rights in Codexis were reduced below 50%. As a result, we no longer consolidate the financial position and results of operations of Codexis with our financial results as of such date and instead account for Codexis under the equity method of accounting. To reflect what our basis in Codexis would have been under equity accounting, we recorded a cumulative effect adjustment of $16.6 million for the year ended December 31, 2005 to bring our investment basis in Codexis to zero as of February 28, 2005. On July 1, 2004, we completed the sale of Verdia, our agriculture subsidiary, to Pioneer Hi-Bred International, Inc., a wholly-owned subsidiary of E.I. du Pont de Nemours and Company, for cash proceeds of $64 million. The discussion in this section reflects the results of Verdia as a discontinued operation for the years ended December 31, 2003 and 2004.
To date, we have generated revenues from research collaborations with pharmaceutical, chemical and petroleum companies and from government grants. Moving forward, we anticipate establishing additional strategic alliances. However, as our internal resources and expertise have evolved, we have strategically shifted our focus to pharmaceutical products and internal product development in order to capture more of the potential value resulting from our efforts. We believe this is an important step in building long-term value in our company.
30
Table of Contents
Consistent with our strategic shift, revenue from collaborative research agreements and government grants decreased from $22.9 million in 2003 to $16.3 million in 2004 and to $14.5 million in 2005. However, we expect our revenue for 2006 to increase compared to 2005, due primarily to collaborative research and development revenue we expect to receive from our collaboration with Roche for our MAXY-VII product candidates, which became effective in December 2005, and an increase in activity on our existing grant projects.
For the purposes of this report, our continuing operations consist of the results of Maxygen, Inc. and its wholly-owned subsidiaries, Maxygen ApS (Denmark) and Maxygen Holdings Ltd. (Cayman Islands), as well as the results of Codexis through February 28, 2005.
We continue to maintain a strong cash position to fund our expanded internal product development, with cash, cash equivalents and marketable securities totaling $188.3 million as of December 31, 2005.
We have incurred significant operating losses since our inception. As of December 31, 2005, our accumulated deficit was $204.2 million. We have invested heavily in establishing our proprietary technologies. Our research and development expenses from continuing operations for 2005 were $41.8 million, compared to $53.3 million for 2004 and $44.4 million for 2003. We expect to incur additional operating losses over at least the next several years.
Critical Accounting Policies and Estimates
General
The preparation of financial statements in conformity with generally accepted accounting principles requires management to make judgments, estimates and assumptions in the preparation of our consolidated financial statements and accompanying notes (see Note 1 of Notes to Consolidated Financial Statements). Actual results could differ from those estimates. We believe the following are our critical accounting policies, including those that reflect the more significant judgments, estimates and assumptions we make in the preparation of our consolidated financial statements.
Consolidation
The consolidated financial statements presented in this report include the amounts of us and our wholly-owned subsidiaries, Maxygen ApS (Denmark) and Maxygen Holdings Ltd. (Cayman Islands). For the years ended December 31, 2003 and 2004 and for the two months ended February 28, 2005, 100% of the results of operations of Codexis are also included, as well as the financial position of Codexis at December 31, 2004.
As of February 28, 2005, primarily as a result of the issuance of Codexis common stock in connection with the acquisition by Codexis of Julich Fine Chemicals GmbH, our voting rights in Codexis were reduced below 50%. As a result, we no longer consolidate the financial position and results of operations of Codexis with our financial results as of such date. In accordance with EITF Consensus 96-16, “Investor Accounting for an Investee When the Investor Has a Majority of the Voting Interest but the Minority Stockholder or Stockholders Have Certain Approval or Veto Rights” and paragraph 1 of ARB No. 51, “Consolidated Financial Statements,” we have included 100% of the net losses of Codexis in the determination of our net loss through February 28, 2005. In accordance with APB 18, “The Equity Method of Accounting for Investments in Common Stock,” we are accounting for our investment in Codexis under the equity method of accounting after February 28, 2005. We are not obligated to provide additional funding to Codexis. The operations of Verdia, Inc., prior to its sale on July 1, 2004, are reflected as discontinued operations. All significant intercompany balances and transactions have been eliminated in consolidation.
On July 15, 2003, we formed Avidia Inc. (formerly Avidia Research Institute), or Avidia, together with a third party investor. In conjunction with its initial capitalization, we contributed certain technology to Avidia and invested $500,000 in cash. During 2004, we provided a series of loans to Avidia in the aggregate amount of
31
Table of Contents
$1.4 million. This loan converted into equity securities of Avidia in 2005. As of December 31, 2005, our ownership in Avidia was approximately 13.0%, based upon the voting rights of the issued and outstanding shares of Avidia’s common and preferred stock. Until March 31, 2005, our investment in Avidia was accounted for under the equity method of accounting and our share of its results was recorded to the extent of our accounting basis in Avidia as a component of equity in net loss of minority investee in the Consolidated Statements of Operations. In April 2005, Avidia issued additional equity securities, which lowered our ownership below 20%. Since we do not have the ability to exercise significant influence over Avidia’s operating and financial policies, after March 31, 2005, our investment in Avidia is being accounted for under the cost method of accounting. As of December 31, 2004 and 2005, we had recorded losses equal to our investment basis in Avidia. We are not obligated to provide additional funding to Avidia.
Goodwill and Intangible Impairment
In connection with our acquisition of Maxygen ApS in 2000, we allocated $26.2 million to goodwill and other intangible assets. Prior to adoption of Statement of Financial Accounting Standard No. 142 “Goodwill and Other Intangible Assets,” or SFAS 142, we amortized a portion of the goodwill each year. As of December 31, 2001, the net goodwill balance was $12.2 million. At this time, goodwill and other intangible assets are generally evaluated on an individual acquisition or market basis whenever events or changes in circumstances indicate that such assets are impaired or the estimated useful lives are no longer appropriate. In accordance with SFAS 142, we review our long-lived assets (including goodwill) for impairment at least annually based on estimated future discounted cash flows attributable to the assets and other factors to determine the fair value of the respective assets. In the event such cash flows are not expected to be sufficient to recover the recorded value of the assets, the assets will be written down to their estimated fair values. No impairment charges were recorded in 2003, 2004 or 2005.
The valuation in connection with the initial purchase price allocation and the ongoing evaluation for impairment of goodwill and intangible assets requires significant management estimates and judgment. The purchase price allocation process requires management estimates and judgment as to expectations for various products and business strategies. If any of the significant assumptions differ from the estimates and judgments used in the purchase price allocation, this could result in different valuations for goodwill and intangible assets. Once it is established, we must test goodwill annually for impairment using a two-step process as required by SFAS 142. In addition, in certain circumstances, we must assess if goodwill should be tested for impairment between annual tests. Intangible assets with definite useful lives must be tested for impairment in accordance with SFAS No. 144 “Accounting for the Impairment or Disposal of Long-Lived Assets.” When we conduct our impairment tests for goodwill and intangibles, factors that are considered important in determining whether impairment might exist include existing product portfolio, product development cycle, development expenses, potential royalties and product sales, costs of goods and selling expenses and overall product lifecycle. Any changes in key assumptions about the business and its prospects, or changes in market conditions or other external events, could result in an impairment charge and such a charge could have a material adverse effect on our consolidated results of operations.
Source of Revenue and Revenue Recognition Policy
We recognize revenues from research collaboration agreements as earned upon our achievement of the performance requirements of the agreements. Our existing corporate collaboration agreements generally provide for research funding for a specified number of full-time equivalent researchers working in defined research programs. Revenue related to these payments is earned as the related research work is performed. In addition, these collaborators may make technology advancement payments that are intended to fund further development of our core technology, as opposed to a defined research program. Such payments are recognized ratably over the related research and development period. Payments received that are related to future performance are deferred and recognized as revenue as the performance requirements are achieved. As of December 31, 2005, we have deferred revenues of approximately $8.2 million that we expect to recognize over approximately the next six years.
32
Table of Contents
Revenue related to performance milestones is recognized based upon the achievement of the milestones, as defined in the respective agreements. Substantive, at-risk incentive milestones, if any, are recognized as revenue upon achievement of the incentive milestone event when we have no future performance obligations related to the payment and we judge the event to be the culmination of a separate earnings process. Incentive milestone payments are triggered either by the results of our research efforts or by events external to us, such as regulatory approval to market a product. We receive royalties from licensees, which are based on sales to third parties of licensed products. Royalties are recorded as earned in accordance with the contract terms when third-party results can be reliably measured and collectibility is reasonably assured.
Non-refundable up-front payments received in connection with research and development collaboration agreements, including technology advancement funding that is intended for the development of our core technology, are deferred and recognized on a straight-line basis over the relevant periods specified in the agreement, generally the research term, or recognized ratably over the research term based on planned levels of research services in cases where the planned levels of research services fluctuate substantially over the research term.
The determination of separate units of accounting in arrangements involving multiple deliverables as required under EITF Issue No. 00-21, “Revenue Arrangements with Multiple Deliverables,” requires management to exercise judgment as to whether the delivered item has stand alone value to the collaborator and to estimate whether there is objective and reliable evidence of fair value for the undelivered items. Our collaborative agreements may contain multiple deliverables that require management to determine whether or not the deliverables are separate units of accounting.
Revenue related to grant agreements with various government agencies is recognized as the related research and development expenses are incurred, and when these research and development expenses are within the prior approved funding amounts. Certain grant agreements provide an option for the government to audit the amount of research and development expenses, both direct and indirect, that have been submitted to the government agency for reimbursement. We believe the overhead rates we used to calculate our indirect research and development expenses are within the contractual guidelines of allowable costs and are reasonable estimates of our indirect expenses incurred through the term of the agreements.
Our sources of potential revenues for the next several years are likely to be license fees, research funding and milestone payments under existing and possible future collaborative arrangements and government research grants. See Note 3 of Notes to Consolidated Financial Statements.
Stock-Based Compensation Expense
Stock-based compensation expense for options granted to employees has been determined as the intrinsic value of any stock options granted with exercise prices below the fair value of the common stock on the date of grant. Compensation expense for options granted to consultants has been determined in accordance with Statement of Financial Accounting Standards No. 123 “Accounting for Stock-Based Compensation,” or SFAS 123, and Emerging Issues Task Force Issue No. 96-18 “Accounting for Equity Instruments That Are Issued to Other Than Employees for Acquiring, or in Conjunction with Selling, Goods or Services,” or EITF 96-18, as the fair value of the equity instruments issued. Compensation expense for related options granted to consultants is periodically remeasured as the underlying options vest.
33
Table of Contents
In connection with the grant of stock options to employees before our initial public offering, we recorded deferred stock compensation of approximately $2.4 million in 1998 and $19.5 million in 1999. These amounts were initially recorded as a component of stockholders’ equity and were amortized as charges to operations over the vesting period of the options using a graded vesting method. We recognized stock compensation expense related to the deferred compensation amortization on these option grants, which relate to research and development expense and general and administrative expense, as shown in the following table (in thousands):
| 2003 | 2004 | 2005 | |||||||
Research and development | $ | 586 | $ | 178 | $ | — | |||
General and administrative | 470 | 59 | — | ||||||
As of December 31, 2004, we had fully amortized to expense all deferred compensation relating to pre-IPO grants of stock options to employees.
In connection with our acquisition of Maxygen ApS in August 2000, stock options were granted in exchange for outstanding warrants to purchase Maxygen ApS securities. In connection with this exchange, we recorded aggregate deferred compensation totaling $1.5 million. This amount was amortized over the remaining vesting period of the options, of which $8,000 was expensed in 2003. This deferred compensation was fully amortized to expense as of December 31, 2003. Also in connection with the Maxygen ApS acquisition, Maxygen shares were exchanged for Maxygen ApS shares. For the shares exchanged that had a right of repurchase, we recorded deferred compensation of $13.1 million. This amount was amortized to expense over a three-year graded vesting period. A total of $844,000 was recognized as expense in 2003. This deferred compensation was fully amortized to expense as of December 31, 2003.
In connection with the grant of stock options to consultants, we recorded stock compensation expense of $76,000 in 2003, $96,000 in 2004 and $102,000 in 2005, which were included in research and development expense, and $7,000 in 2003 and $22,000 in 2004 which were included in general and administrative expense. We did not record any stock compensation expense in connection with the grant of stock options to consultants in 2005 included in general and administrative expense.
Results of Operations
Revenues
Our total revenues from continuing operations were $14.5 million in 2005, compared to $16.3 million in 2004 and $22.9 million in 2003. Our revenues are derived primarily from research collaboration agreements and government research grants. Revenues from our research collaboration agreements were $11.6 million, $14.3 million and $20.6 million in 2005, 2004 and 2003, respectively, and revenues from government research grants were $2.9 million, $1.9 million and $2.3 million in 2005, 2004 and 2003, respectively.
The decrease in collaborative research and development revenue of $2.7 million from 2004 to 2005 was primarily due to the completion of the research and development funding terms of several collaborations during 2004 and 2005 and the deconsolidation of Codexis as of February 28, 2005. This decrease was offset, in part, by the achievement of significant milestones from Roche totaling $7 million with regard to our alpha interferon product candidates. The increase in grant revenue of $1.0 million from 2004 to 2005 primarily reflects an increase in activity due to the beginning of three new government grant projects in the third quarter of 2005.
The decrease in collaborative research and development revenue of $6.2 million from 2003 to 2004 was primarily due to a decrease in partner funding as the funded research terms of our collaborations with Lundbeck and ALK-Abelló A/S, and Codexis’ collaboration with Chevron, wound down on schedule, partially offset by additional revenue from Codexis’ collaboration with Pfizer, which commenced in the third quarter of 2004, and a full year of revenue from our collaboration with Roche on our alpha interferon product candidates. The decline in grant revenue of $340,000 from 2003 to 2004 primarily reflects the recognition of grant revenue in 2003 for a one time study.
34
Table of Contents
We expect our revenue for 2006 to increase compared to 2005, due primarily to collaborative research and development revenue we expect to receive from our collaboration with Roche for our factor VII product candidates, which became effective in December 2005, and an increase in activity on our existing grant projects. However, due to the nature of our research, our dependence on our collaborative partners to commercialize certain results of the research and our continuing shift to internal product development, our revenue may fluctuate substantially from year to year, based on the completion of new licensing or collaborative agreements and the achievement of development related milestones. As a result, due to the uncertain nature of the events generating the revenue, we cannot predict with any certainty whether we will receive future milestone payments or royalty payments under our collaborations or whether any particular collaboration or research effort will ultimately result in a commercial product.
Prior to our deconsolidation of Codexis, as of February 28, 2005, we operated as two segments, human therapeutics and chemicals. Revenues for each operating segment were derived from our research collaboration agreements and government research grants and were categorized based on the industry of the product or technology under development. Results of Codexis through February 28, 2005 are shown as our chemicals segment. After February 28, 2005, we have operated as one segment, human therapeutics. The following table presents revenues for each operating segment (in thousands):
| Year Ended December 31, | |||||||||
| 2003 | 2004 | 2005 | |||||||
Human therapeutics | $ | 14,430 | $ | 11,555 | $ | 12,991 | |||
Chemicals (through February 28, 2005) | 8,425 | 4,720 | 1,510 | ||||||
Total revenue | $ | 22,855 | $ | 16,275 | $ | 14,501 | |||
The increased revenue for our human therapeutics segment from 2004 to 2005 primarily reflects the achievement of significant milestones from Roche in the first and fourth quarters of 2005, totaling $7.0 million, partially offset by the shift in focus of our product development strategy towards internal development of product candidates and away from third party funded research collaborations as several of our collaborations came to completion during 2004 and 2005. The decreased revenue for our human therapeutics segment from 2003 to 2004 primarily reflects the scheduled winding down of the funded research terms of our collaborations with Lundbeck and ALK-Abelló A/S, offset in part by collaborative research and development revenue from our collaboration with Roche for our alpha interferon product candidates, which began in July 2003. We expect revenue to increase in 2006, primarily due to our recent collaboration with Roche for our factor VII product candidates, which became effective in December 2005, and the work that began on three new grants in the third quarter of 2005.
During 2005, Roche was the only collaborative partner that contributed collaborative research revenue to our human therapeutics segment. The funded research term of our collaboration with Roche for our alpha interferon product candidates ended in December 2005. In December 2005, we entered into a new collaboration with Roche, which became effective in December 2005, for co-development and commercialization of our factor VII product candidates.
Research and Development Expenses
Our research and development expenses consist primarily of salaries and other personnel-related expenses, research consultants and external collaborative research expenses (including contract manufacturing and research), facility costs, supplies and depreciation of facilities, and expensed laboratory equipment. Research and development expenses were $41.8 million in 2005, $53.3 million in 2004 and $44.4 million in 2003.
The decrease of $11.5 million in research and development expenses from 2004 to 2005 was primarily due to the deconsolidation of Codexis, as of February 28, 2005, offset in part by increased external collaborative
35
Table of Contents
research expenses associated with the development of our product candidates, including the manufacture of product candidates in preparation for clinical trials and termination charges of $471,000 in 2005 related to a reduction in force of research and development personnel announced on June 16, 2005. Excluding Codexis, research and development expenses increased $1.5 million, from $37.8 million in 2004 to $39.3 million in 2005. The $7.3 million increase in research and development expenses from 2003 to 2004 was primarily due to increased expenditures associated with the development of our product candidates, including the manufacture of product candidates in preparation for clinical trials and the termination costs associated with discontinuing clinical development of our interferon beta program, which was terminated in 2004.
Stock compensation expenses included in research and development expenses decreased from $1.5 million in 2003 to $292,000 in 2004 and to $115,000 in 2005, primarily as a result of the amortization of deferred compensation relating to the grant of stock options to employees before our initial public offering, which was fully amortized to expense by August 2004.
We have entered into a number of research and development collaborations to perform research for our collaborators. The major collaborative agreements have similar contractual terms. The agreements generally require us to devote a specified number of full-time equivalent employees to the research efforts over defined terms generally ranging from three to five years.
We do not track fully burdened research and development costs by project. However, we do estimate, based on full-time equivalent personnel effort, the percentage of research and development efforts (as measured in hours incurred, which approximates costs) undertaken for projects funded by, on the one hand, our collaborators and government grants and, on the other hand, projects funded by us. We believe that presenting our research and development expenses in these categories will provide our investors with meaningful information on how our resources are being used.
The following table presents our approximate research and development expenses by funding category (in thousands):
| Year Ended December 31, | |||||||||
| 2003 | 2004 | 2005 | |||||||
Collaborative projects funded by third parties | $ | 12,505 | $ | 11,344 | $ | 6,495 | |||
Internal projects | 31,930 | 41,950 | 35,294 | ||||||
Total | $ | 44,435 | $ | 53,294 | $ | 41,789 | |||
As we do not track fully burdened research and development costs by project, the expense figures provided above are comprised of the number of hours expended in each category multiplied by the approximate cost per hour of research and development effort. In addition, project-specific external costs are added to these costs.
Our product development programs are at an early stage and may not result in any marketed products. Product candidates that may appear promising at early stages of development may not reach the market for a number of reasons. Product candidates may be found ineffective or cause harmful side effects during clinical trials, may take longer to pass through clinical trials than had been anticipated, may fail to receive necessary regulatory approvals and may prove impracticable to manufacture in commercial quantities at reasonable costs and with acceptable quality. In addition, competitors may develop superior competing products. Furthermore, it is uncertain which of our internally developed product candidates will be subject to future collaborative arrangements. The participation of a collaborative partner may accelerate the time to completion and reduce the cost to us of a product candidate or it may delay the time and increase the cost to us due to the alteration of our existing strategy. The risks and uncertainties associated with our research and development projects are discussed more fully in the section of this report entitled “Item 1A—Risk Factors.” Because of these risks and uncertainties, we cannot predict when or whether we will successfully complete the development of our product candidates or the ultimate product development cost in any particular case.
36
Table of Contents
We expect that our research and development costs will increase substantially in 2006 over 2005, due primarily to an increase in research and development costs resulting from advancement our product candidates toward clinical development for the remainder of our consolidated operations. We expect to continue to devote substantial resources to research and development and we expect research and development expenses to increase over the next several years if we are successful in advancing our product candidates into clinical trials. To the extent we out-license our product candidates prior to commencement of clinical trials or collaborate with others with respect to clinical trials, increases in research and development expenses may be reduced or avoided. We intend to manage the level of our expenditures for research and development, including clinical trials, to balance advancing our product candidates against maintaining adequate cash resources for our operations. We expect stock compensation expense related to research and development to increase considerably as a result of our implementation of SFAS 123(R). We adopted SFAS 123(R) as of January 1, 2006 and our implementation of SFAS 123(R) is expected to have a material impact on our consolidated results of operations and net loss per share. The impact of our implementation of SFAS 123(R) will depend on, among other things, the levels of share-based payments granted in the future.
General and Administrative Expenses
Our general and administrative expenses consist primarily of personnel costs for finance, human resources, business development, legal and general management, as well as insurance premiums and professional expenses, such as external expenditures for legal, accounting and commercial assessment of potential products. General and administrative expenses were $13.2 million in 2005, compared to $14.4 million in 2004 and $11.4 million in 2003. General and administrative stock compensation expense was $68,000 in 2005, $63,000 in 2004 and $477,000 in 2003.
The decrease in general and administrative expenses of $1.2 million from 2004 to 2005 was primarily due to the deconsolidation of Codexis, as of February 28, 2005, offset by an increase in professional fees related to an increase in market research and product profile development activity and regulatory compliance costs, as well as termination charges of $336,000 related to a reduction in force announced on June 16, 2005. Excluding Codexis, general and administrative expenses increased from $11.8 million in 2004 to $12.9 million in 2005. The increase in general and administrative expenses from 2004 to 2005 was primarily due to increases in salaries and benefits and the expiration of certain benefits under our services agreements with Codexis that required Codexis to reimburse us for certain administrative expenses. The increase in general and administrative stock compensation expenses from 2004 to 2005 was primarily due to the modification of the terms of certain employees’ stock options.
The increase in general and administrative expenses of $3.0 million from 2003 to 2004 was primarily due to professional fees related to an increase in market research and product profile development activity, and regulatory compliance costs. The decrease in general and administrative stock compensation expenses in 2004 compared to 2003 was primarily related to the amortization of deferred compensation relating to the grant of stock options to employees before our initial public offering, which was fully amortized to expense by August 2004.
We expect that our general and administrative expenses may decrease slightly in 2006, due primarily to reduced personnel costs resulting from terminations in 2005 and the deconsolidation of Codexis in 2005. We expect any decrease to be offset in part by increased professional fees and product assessment costs. We expect that stock compensation expense related to general and administration expenses will increase considerably in 2006 as a result of our implementation of SFAS 123(R). We adopted SFAS 123(R) as of January 1, 2006 and expect that the implementation of SFAS 123(R) will have a material impact on our consolidated results of operations and net loss per share. The ongoing impact of our implementation of SFAS 123(R) will depend on, among other things, the levels of share-based payments granted in the future.
37
Table of Contents
Amortization of Other Intangible Assets
In connection with our acquisition of Maxygen ApS in 2000, we allocated $3.4 million to other intangible assets. We amortized the purchased core technology over its estimated three year useful life. Such technology was fully amortized to expense by September 2003 and we recorded amortization expense of $698,000 in 2003.
Interest Income and Other (Expense), net
Interest income and other (expense), net represents income earned on our cash, cash equivalents and marketable securities, net of interest expense on our equipment leases and currency transaction gains or losses related to the funding of our Danish subsidiary, Maxygen ApS. Interest income and other (expense), net was $5.6 million in 2005, compared to $4.1 million in 2004 and $5.3 million in 2003. Included in these amounts are foreign exchange losses of $537,000 in 2005 and foreign exchange gains of $552,000 and $1.8 million in 2004 and 2003, respectively. The increase in interest income and other (expense), net from 2004 to 2005 was primarily due to higher interest income from higher average balances of cash, cash equivalents and marketable securities, and higher interest rates, offset in part by an increase in foreign exchange losses. The decrease in interest income and other (expense), net from 2003 to 2004 was primarily due to lower foreign exchange gains in 2004 compared with 2003.
Equity in Losses of Minority Investee
Equity in losses of minority investee reflects our share of the net loss of Avidia. Avidia was formed in July 2003 and, prior to March 31, 2005, was accounted for under the equity method of accounting. After March 31, 2005, the Company’s investment in Avidia is being accounted for under the cost method of accounting. In 2003, we invested $500,000 in Avidia in exchange for series A convertible preferred stock. In 2004, we provided a $1.4 million loan to Avidia. This loan had an interest rate of 3% per annum and was converted into equity securities of Avidia in 2005. As of December 31, 2004 and 2005, we had recorded losses equal to our investment basis in Avidia, which includes the loan to Avidia in 2004. We are not obligated to provide additional funding to Avidia.
Cumulative Effect Adjustment
Codexis was formed in January 2002 and independently financed by us and several other investors in September and October of 2002. In August 2004, Codexis received additional equity funding from Pfizer Inc. Until February 28, 2005, we recognized 100% of the operating results of Codexis, even though we only owned a majority of the voting interests in Codexis. At such time, we had recorded cumulative losses of Codexis in the amount of $26.4 million, which was in excess of our investment basis of $9.8 million. On February 28, 2005, our voting rights in Codexis were reduced below 50%. As a result, we no longer consolidate the financial position and results of operations of Codexis with our financial results as of such date and instead account for Codexis under the equity method of accounting. To reflect what our basis in Codexis would have been under equity accounting, we recorded a non-recurring cumulative effect adjustment of $16.6 million in 2005 to bring our investment basis in Codexis to zero as of February 28, 2005. This cumulative effect adjustment does not have any tax consequences.
Subsidiary Preferred Stock Accretion
As of October 1, 2002, Codexis had sold $25 million of Codexis series B convertible preferred stock to investors, of which $5 million was purchased by us and $20 million was purchased by several unrelated investors. The series B convertible preferred stock includes a redemption provision, which provides that the holders of at least a majority of the outstanding shares of series B convertible preferred stock (excluding the series B convertible preferred stock held by us and our affiliates), voting together as a separate class, may require Codexis to redeem the series B convertible preferred stock. The redemption price for each share will be payable in cash in exchange for the shares of series B convertible preferred stock to be redeemed at a sum equal to the applicable original issue price per share plus five percent (5%) of the original issue price per year from the
38
Table of Contents
original issue date until the applicable redemption date, plus declared and unpaid dividends. Notice of redemption can be given at any time on or after the fifth anniversary of the original issue date. In connection with these redemption rights, we recorded accretion of the redemption premium for the series B convertible preferred stock, excluding the shares owned by us, in the amount of $1.3 million, $1.0 million and $167,000 for the years ended December 31, 2003, 2004 and 2005, respectively. The accretion was recorded as subsidiary preferred stock accretion on the Consolidated Statement of Operations through February 28, 2005 and as a reduction of additional paid-in capital and an increase to minority interest on the Consolidated Balance Sheets. Any obligation to make redemption payments is solely an obligation of Codexis and any payments are to be made solely from assets of Codexis. Since we no longer consolidate the financial position of Codexis, as of February 28, 2005, we no longer recognized accretion for the Codexis redemption premium. We also no longer reflect amounts as minority interest on the Consolidated Balance Sheets. We have recorded a $2.3 million adjustment to additional paid-in capital to eliminate the reduction of additional paid-in capital that had resulted from Codexis’ preferred stock accretion prior to February 28, 2005.
Provision for Income Taxes
No income tax expense was recorded from continuing operations for the years ended December 31, 2005, 2004 and 2003. For 2005 and 2003, there was no provision for U.S. federal, U.S. state, or foreign income taxes for any period as we incurred operating losses for all jurisdictions. For 2004, we reported an income tax provision of $921,000 attributable to alternative minimum taxes as a result of the sale of Verdia. This amount has been netted against the gain on sale of Verdia and is reflected in gain on sale of discontinued operations in the Consolidated Statement of Operations. In 2004, we reported income due to the sale of Verdia and utilized prior net operating loss carryforwards for federal and state income tax purposes. Deferred tax assets and the associated valuation allowance increased by $12.0 million in 2003 due primarily to increases in net operating losses and tax credit carryforwards. Deferred tax assets and the associated valuation allowance decreased by $10.2 million during 2004 due to the use of net operating loss carryforwards to offset the income due to the sale of Verdia. The valuation allowance decreased by $2.1 million during 2005 due to the removal of Codexis’ deferred tax assets due to the deconsolidation of Codexis, offset by increases in net operating losses and tax credit carryforwards.
As of December 31, 2005, we had net operating loss carryforwards for federal income tax purposes of approximately $34.7 million, which expire in the years 2022 through 2025, and federal research and development tax credit carryforwards of approximately $2.3 million, which expire in the years 2012 through 2025.
Utilization of our net operating losses and credits may be subject to substantial annual limitation due to the ownership change limitations provided by the Internal Revenue Code of 1986, as amended, and similar state provisions. Such an annual limitation could result in the expiration of the net operating losses and credits before utilization. See Note 11 of the Notes to Consolidated Financial Statements.
New Accounting Pronouncements
In November 2005, the FASB issued FASB Staff Position Nos. FAS 115-1 and FAS 124-1, “The Meaning of Other-Than-Temporary Impairment and Its Application to Certain Investments,” or FSP 115-1, which provides guidance on determining when investments in certain debt and equity securities are considered impaired, whether that impairment is other-than-temporary, and on measuring such impairment loss. FSP 115-1 also includes accounting considerations subsequent to the recognition of an other-than temporary impairment and requires certain disclosures about unrealized losses that have not been recognized as other-than-temporary impairments. FSP 115-1 is required to be applied to reporting periods beginning after December 15, 2005. We are currently evaluating the effect that the adoption of FSP 115-1 will have on our consolidated results of operations and financial condition but do not expect it to have a material impact on our results of operations or financial condition.
In May 2005, the FASB issued Statement No. 154, “Accounting Changes and Error Corrections,” or SFAS 154, a replacement of Accounting Principles Board Opinions No. 20, “Accounting Changes,” and
39
Table of Contents
Statement No. 3, “Reporting Accounting Changes in Interim Financial Statements.” SFAS 154 changes the requirements for the accounting for and reporting of a change in accounting principle. Previously, most voluntary changes in accounting principles were recognized by including in net income during the period of change the cumulative effect of changing to the new accounting principle. SFAS 154 requires retrospective application to prior periods’ financial statements, unless it is impracticable to determine either the period-specific effects or the cumulative effect of the change. SFAS 154 is effective for accounting changes made in fiscal years beginning after December 15, 2005; however, SFAS 154 does not change the transition provisions of any existing accounting pronouncements. We do not believe adoption of SFAS 154 will have a material effect on our consolidated financial position, results of operations or cash flows.
On December 16, 2004, the FASB issued SFAS 123(R), which is a revision of FASB Statement No. 123, “Accounting for Stock-Based Compensation,” or SFAS 123. SFAS 123(R) supersedes APB Opinion No. 25, “Accounting for Stock Issued to Employees,” or Opinion 25, and amends FASB Statement No. 95, “Statement of Cash Flows.” SFAS 123(R) requires all share-based payments to employees, including grants of employee stock options, to be recognized in the income statement based on their fair values. Pro forma disclosure is no longer an alternative.
SFAS 123(R) permits public companies to adopt its requirements using one of two methods:
| 1. | A “modified prospective” method in which compensation cost is recognized beginning with the effective date (a) based on the requirements of SFAS 123(R) for all share-based payments granted after the effective date and (b) based on the requirements of SFAS 123 for all awards granted to employees prior to the effective date of SFAS 123(R) that remain unvested on the effective date. |
| 2. | A “modified retrospective” method that includes the requirements of the modified prospective method described above, but also permits entities to restate, based on the amounts previously recognized under SFAS 123, for purposes of pro forma disclosures for all prior periods presented. |
We adopted SFAS 123(R) as of January 1, 2006 and expect to utilize the modified prospective method and the Black-Scholes option-pricing model.
As permitted by SFAS 123, in 2005 we accounted for share-based payments to employees using Opinion 25’s intrinsic value method and, as such, generally recognized no compensation cost for employee stock options. Accordingly, our implementation of SFAS 123(R)’s fair value method will have a significant impact on our result of operations, although it will have no impact on our overall cash position. The impact of our implementation of SFAS 123(R) cannot be predicted at this time because it will depend on, among other things, the levels of share-based payments granted in the future. However, had we adopted SFAS 123(R) in prior periods, the impact of that standard would have approximated the impact of SFAS 123 as described in the disclosure of pro forma net income (loss) and earnings (loss) per share in Note 1 of the Notes to Consolidated Financial Statements under the heading “Stock-Based Compensation.” SFAS 123(R) also requires the benefits of tax deductions in excess of recognized compensation cost to be reported as a financing cash flow, rather than as an operating cash flow as required under current literature. This requirement may reduce net operating cash flows and increase net financing cash flows in periods after adoption. We cannot estimate what those amounts will be in the future because they depend upon, among other things, the levels of share-based payments granted in the future.
In March 2005, the Securities and Exchange Commission, or SEC, released Staff Accounting Bulletin No. 107, or SAB 107. SAB 107 provides the position of the SEC staff regarding the application of Statement 123(R). SAB 107 contains interpretive guidance relating to the interaction between SFAS 123R and certain SEC rules and regulations, as well as the SEC staff’s views regarding the valuation of share-based payment arrangements for public companies. SAB 107 also highlights the importance of disclosures made related to the accounting for share-based payment transactions. We are currently evaluating SAB 107 and will be incorporating it as part of our implementation of SFAS 123(R).
40
Table of Contents
Liquidity and Capital Resources
Since inception, we have financed our continuing operations primarily through private placements and public offerings of equity securities, research and development funding from collaborators and government grants. In addition, on July 1, 2004, we received $64.0 million in cash as proceeds, before estimated income taxes and transaction costs of $1.4 million, from the sale of Verdia, our former agriculture subsidiary and the sole component of our agriculture segment. As of December 31, 2005, we had $188.3 million in cash, cash equivalents and marketable securities.
Net cash used in operating activities was $29.9 million in 2005, compared to $34.3 million in 2004 and $22.5 million in 2003. Uses of cash in operating activities were primarily to fund losses from continuing operations. The decrease in cash used in operating activities from 2004 to 2005 primarily relates to decreased expenditures in 2005 due to the deconsolidation of Codexis, offset in part by the payment of accrued expenses relating to annual bonuses for 2004 and program termination costs during 2005 that were not paid in 2004. The increase in cash used in operating activities for continuing operations from 2003 to 2004 primarily relates to increased expenditures in 2004 relating to advancing product candidates into manufacturing and toward clinical trials, lower interest income in 2004, increased equity in losses of minority investee during 2004, and a smaller net loss in 2003. This smaller net loss in 2003 was due partially to a one-time non-recurring $2.5 million payment from Hercules Incorporated to terminate its collaboration with Codexis, which was recognized as revenue in the first quarter of 2003.
Net cash provided by investing activities was $16.3 million in 2005, compared to $34.6 million in 2004. Net cash used in investing activities was $13.8 million in 2003. The cash provided during 2005 was primarily related to maturities of available-for-sale securities in excess of purchases, offset by the $2.6 million used by Codexis to acquire Julich Fine Chemicals GmbH in February 2005. The cash provided during 2004 was primarily related to cash received from the sale of Verdia of $61.2 million, offset by purchases of available-for-sale securities and a $1.4 million loan provided to Avidia. The majority of additions of property and equipment in 2004 and 2005 related to Codexis’ investment in its bioprocessing facility. Net cash used in investing activities in 2003 primarily represented purchases of available-for-sale securities in excess of maturities. In connection with the formation of Avidia, we contributed certain intellectual property and invested $500,000 in July 2003. We expect to continue to make investments in the purchase of property and equipment to support our operations. We may use a portion of our cash to acquire or invest in businesses, products or technologies, or to obtain the right to use such technologies.
Net cash provided for continuing operations by financing activities was $2.2 million in 2005, compared to $16.6 million in 2004 and $1.5 million in 2003. The cash provided during 2005 was primarily from the proceeds from the sale of common stock in connection with our Employee Stock Purchase Plan, or ESPP, and the exercise of stock options by employees, from the proceeds of equipment loans entered into by Codexis, net of repayments of such loans, and Codexis’ assumption of loans upon the acquisition of Julich. The cash provided in 2004 was primarily related to Codexis’ receipt of $10 million from the purchase of its equity securities by Pfizer Inc., the proceeds of $2.2 million from equipment loans entered into by Codexis, and $4.3 million from the exercise of stock options by employees and the proceeds of the sale of our common stock in connection with our ESPP. The cash provided in 2003 was primarily from the proceeds of the sale of common stock in connection with our ESPP and the exercise of stock options by employees of $2.2 million, partially offset by payments on equipment financing obligations of $617,000.
There was no cash provided by or used for discontinued operations in 2005. Cash provided by discontinued operations was $2.9 million in 2004 and was related to Verdia’s final payment for services provided by us and reimbursement to us for payments made on behalf of Verdia prior to the sale of Verdia to Pioneer Hi-Bred International, Inc. Cash used for discontinued operations was $607,000 in 2003 and was primarily related to the funding of Verdia’s losses.
In accordance with FASB Statement No. 52, “Foreign Currency Translation,” the functional currency for our Danish operations is its local currency. The effects of foreign exchange rate changes on the translation of the
41
Table of Contents
local currency financial statements into U.S. dollars are reported as a component of accumulated other comprehensives loss on the Consolidated Balance Sheets. The effect of exchange rate changes on cash and cash equivalents was an increase of $276,000 in 2005 and reduction of $582,000 and $1.8 million in 2004 and 2003, respectively.
The following are contractual commitments at December 31, 2005 associated with debt, lease obligations and purchase obligations (in thousands):
| Payments Due by Period | |||||||||||||||
Contractual Obligations | Total | Less than 1 Year | 1-3 Years | 4-5 Years | More than 5 Years | ||||||||||
Long-term debt obligations | $ | —�� | $ | — | $ | — | $ | — | $ | — | |||||
Operating lease obligations | 2,178 | 1,819 | 359 | — | — | ||||||||||
Purchase obligations | 3,158 | 2,851 | 307 | — | — | ||||||||||
Total | $ | 5,336 | $ | 4,670 | $ | 666 | $ | — | $ | — | |||||
Since inception, we have received $179.3 million from our collaborators and from government grants, which includes $55.5 million of funding received by Verdia, our former agriculture subsidiary and sole component of our agriculture segment, prior to its disposition, and $8.2 million of deferred revenue from continuing operations to be recognized over the next six years. Approximately $144.3 million has been received from our collaborators and $35.0 million has been received from government funding. Assuming our research efforts for existing collaborations and grants continue for their full research terms, as of December 31, 2005, we had total committed funding of approximately $14.2 million remaining to be received over the next four years. Potential milestone payments from our existing collaborations could exceed $350.0 million based on the accomplishment of specific performance criteria, $139.0 million of which relates to potential milestone payments in connection with currently active development programs. We may also earn royalties on product sales. In general, the obligation of our corporate collaborators to provide research funding may be terminated by either party before the end of the research term under certain conditions, including upon a material breach of the contract. In the case of such an event, the agreement specifies the rights, if any, that each party will retain.
We believe that our current cash, cash equivalents, short-term investments and long-term investments, together with funding received from collaborators and government grants, will be sufficient to satisfy our anticipated cash needs for working capital and capital expenditures for at least the next twelve months. However, it is possible that we will seek additional financing within this timeframe. We may raise additional funds through public or private financing, collaborative relationships or other arrangements. Additional funding, if sought, may not be available on terms favorable to us. Further, any additional equity financing may be dilutive to stockholders, and debt financing, if available, may involve restrictive covenants. Our failure to raise capital when needed may harm our business and operating results.
Discontinued Operations
Included in our results of operations is a gain on sale of discontinued operations of $61.2 million in 2004. The gain on sale was the result of the sale of Verdia (formerly our agriculture segment) to Pioneer Hi-Bred International, Inc. on July 1, 2004 for $64 million, partially offset by disposition costs. The results of discontinued operations reflect the results of Verdia until it was sold on July 1, 2004. Our loss from discontinued operations was $2.8 million in 2004 and $1.6 million in 2003.
| Item 7A | QUANTITATIVE AND QUALITATIVE DISCLOSURES ABOUT MARKET RISK |
We are exposed to market risks, including changes in interest rates and foreign currency exchange. To mitigate some foreign currency exchange rate risk, we from time to time enter currency forward contracts. We do not use derivative financial instruments for speculative or trading purposes.
42
Table of Contents
Interest Rate Risk
The primary objective of our investment activities is to preserve principal while at the same time maximizing yields without significantly increasing risk. To achieve this objective, we maintain our portfolio of cash equivalents, short-term and long-term investments in a variety of securities, including corporate obligations and money market funds. All investments and substantially all cash and cash equivalents are held in U.S. currency, with approximately 8% of cash and cash equivalents held in Danish kroner and euros at December 31, 2005. As of December 31, 2005, approximately 82% of our total portfolio was to mature in one year or less, with the remainder maturing in less than two years.
The following table represents the fair value balance of our cash, cash equivalents, short-term and long-term investments that are subject to interest rate risk by average interest rates as of December 31, 2005 (dollars in thousands):
| Expected Maturity | ||||||||
| 2006 | 2007 | |||||||
Cash and cash equivalents | $ | 26,940 | $ | — | ||||
Average interest rates | 3.64 | % | — | |||||
Short-term investments | $ | 127,336 | $ | — | ||||
Average interest rates | 3.98 | % | — | |||||
Long-term investments | $ | — | $ | 34,047 | ||||
Average interest rates | — | 4.19 | % | |||||
We did not hold derivative instruments intended to mitigate interest rate risk as of December 31, 2005, and we have never held such instruments in the past. If market interest rates were to increase by 100 basis points, or 1%, from December 31, 2005 levels, the fair value of our portfolio would decline by approximately $2.6 million. The modeling technique used measures the change in fair values arising from an immediate hypothetical shift in market interest rates and assumes ending fair values include principal plus accrued interest.
Foreign Currency Exchange Risk
A portion of our operations consist of research and development activities performed in Denmark by our wholly-owned subsidiary, Maxygen ApS. The functional currency of Maxygen ApS is the Danish kroner. In 2005, approximately 49% of our operating expenses related to Maxygen ApS. As a result, our financial results may be affected by changes in the foreign currency exchange rates of the Danish kroner and the euro. A decrease in the value of the U.S. dollar against the Danish kroner or the euro will result in an increase of our reported operating expenses. To protect against reductions in value and the volatility of future cash flows caused by changes in foreign currency exchange rates, we from time to time enter into cash flow hedging arrangements. Currency forward contracts are utilized in these hedging arrangements. Our hedging arrangements reduce, but do not always eliminate, the impact of foreign currency exchange rate movements. Gains and losses on these foreign currency investments are generally offset by corresponding losses and gains on the related hedging instruments, resulting in negligible net exposure to us on the amounts hedged.
At December 31, 2005, we had foreign currency contracts outstanding in the form of forward exchange contracts totaling $5.3 million which will be settled over the next six months with an average exchange rate of 5.88 Danish kroner to the U.S. dollar and contracts totaling $2.0 million which will be settled over the next six months with an average exchange rate of 1.23 U.S. dollars to the euro. As of December 31, 2005, a 10% decrease in the value of the U.S. dollar relative to the Danish kroner and the euro would result in an additional $800,000 gain on these contracts. During 2005, we recognized $150,000 in foreign exchange losses from hedge contracts; these losses were included with operating expenses. During 2004, we had foreign currency contracts outstanding in the form of forward exchange contracts totaling $5.8 million. We did not have any foreign exchange contracts outstanding at December 31, 2003.
43
Table of Contents
| Item 8 | FINANCIAL STATEMENTS AND SUPPLEMENTARY DATA |
REPORT OF INDEPENDENT REGISTERED PUBLIC ACCOUNTING FIRM ON CONSOLIDATED FINANCIAL STATEMENTS
The Board of Directors and Stockholders of
Maxygen, Inc.
We have audited the accompanying consolidated balance sheets of Maxygen, Inc. as of December 31, 2004 and 2005, and the related consolidated statements of operations, stockholders’ equity, and cash flows for each of the three years in the period ended December 31, 2005. These financial statements are the responsibility of the Company’s management. Our responsibility is to express an opinion on these financial statements based on our audits.
We conducted our audits in accordance with the standards of the Public Company Accounting Oversight Board (United States). Those standards require that we plan and perform the audit to obtain reasonable assurance about whether the financial statements are free of material misstatement. An audit includes examining, on a test basis, evidence supporting the amounts and disclosures in the financial statements. An audit also includes assessing the accounting principles used and significant estimates made by management, as well as evaluating the overall financial statement presentation. We believe that our audits provide a reasonable basis for our opinion.
In our opinion, the financial statements referred to above present fairly, in all material respects, the consolidated financial position of Maxygen, Inc. at December 31, 2004 and 2005, and the consolidated results of its operations and its cash flows for each of the three years in the period ended December 31, 2005 in conformity with U.S. generally accepted accounting principles.
We also have audited, in accordance with the standards of the Public Company Accounting Oversight Board (United States), the effectiveness of Maxygen, Inc.’s internal control over financial reporting as of December 31, 2005, based on criteria established in Internal Control—Integrated Framework issued by the Committee of Sponsoring Organizations of the Treadway Commission and our report dated March 10, 2006 expressed an unqualified opinion thereon.
/s/ ERNST & YOUNG LLP
Palo Alto, California
March 10, 2006
44
Table of Contents
MAXYGEN, INC.
(in thousands, except share and per share data)
| December 31, | ||||||||
| 2004 | 2005 | |||||||
A S S E T S | ||||||||
Current assets: | ||||||||
Cash and cash equivalents | $ | 40,415 | $ | 26,940 | ||||
Short-term investments | 178,883 | 127,336 | ||||||
Accounts receivable and other receivables | 1,735 | 6,076 | ||||||
Prepaid expenses and other current assets | 7,046 | 3,530 | ||||||
Total current assets | 228,079 | 163,882 | ||||||
Property and equipment, net | 7,677 | 4,068 | ||||||
Goodwill | 12,192 | 12,192 | ||||||
Long-term investments | 13,595 | 34,047 | ||||||
Deposits and other long-term assets | 1,562 | 334 | ||||||
Total assets | $ | 263,105 | $ | 214,523 | ||||
L I A B I L I T I E S A N D S T O C K H O L D E R S’ E Q U I T Y | ||||||||
Current liabilities: | ||||||||
Accounts payable | $ | 1,712 | $ | 1,540 | ||||
Accrued compensation | 5,324 | 4,323 | ||||||
Accrued program termination costs | 2,209 | — | ||||||
Other accrued liabilities | 2,144 | 3,121 | ||||||
Deferred revenue | 3,215 | 2,668 | ||||||
Taxes payable | 921 | — | ||||||
Current portion of equipment financing obligations | 555 | — | ||||||
Total current liabilities | 16,080 | 11,652 | ||||||
Non-current deferred revenue | 1,718 | 5,517 | ||||||
Non-current equipment financing obligations | 1,751 | — | ||||||
Other long-term liabilities | 35 | 10 | ||||||
Minority interest | 32,180 | — | ||||||
Commitments and contingencies (Notes 8 and 12) | ||||||||
Stockholders’ equity: | ||||||||
Preferred stock, $0.0001 par value, 5,000,000 shares authorized, no shares issued and outstanding at December 31, 2004 and 2005 | — | — | ||||||
Common stock, $0.0001 par value, 100,000,000 shares authorized, 35,636,333 and 35,922,178 shares issued and outstanding at December 31, 2004 and 2005, respectively | 3 | 3 | ||||||
Additional paid-in capital | 399,314 | 403,120 | ||||||
Accumulated other comprehensive loss | (2,190 | ) | (1,557 | ) | ||||
Accumulated deficit | (185,786 | ) | (204,222 | ) | ||||
Total stockholders’ equity | 211,341 | 197,344 | ||||||
Total liabilities and stockholders’ equity | $ | 263,105 | $ | 214,523 | ||||
See accompanying notes.
45
Table of Contents
MAXYGEN, INC.
CONSOLIDATED STATEMENTS OF OPERATIONS
(in thousands, except per share data)
| Year Ended December 31, | ||||||||||||
| 2003 | 2004 | 2005 | ||||||||||
Collaborative research and development revenue | $ | 20,573 | $ | 14,333 | $ | 11,594 | ||||||
Grant revenue | 2,282 | 1,942 | 2,907 | |||||||||
Total revenues | 22,855 | 16,275 | 14,501 | |||||||||
Operating expenses: | ||||||||||||
Research and development | 44,435 | 53,294 | 41,789 | |||||||||
General and administrative | 11,354 | 14,372 | 13,153 | |||||||||
Stock compensation expense(1) | 1,991 | 355 | 183 | |||||||||
Amortization of other intangible assets | 698 | — | — | |||||||||
Total operating expenses | 58,478 | 68,021 | 55,125 | |||||||||
Loss from operations | (35,623 | ) | (51,746 | ) | (40,624 | ) | ||||||
Interest income and other (expense), net | 5,253 | 4,055 | 5,572 | |||||||||
Equity in net loss of minority investee | (500 | ) | (1,395 | ) | — | |||||||
Loss from continuing operations | (30,870 | ) | (49,086 | ) | (35,052 | ) | ||||||
Discontinued operations: | ||||||||||||
Loss from discontinued operations | (1,586 | ) | (2,769 | ) | — | |||||||
Gain on sale of discontinued operations (net of taxes and transaction costs) | — | 61,197 | — | |||||||||
Income (loss) from discontinued operations | (1,586 | ) | 58,428 | — | ||||||||
Cumulative effect adjustment | — | — | 16,616 | |||||||||
Net income (loss) | (32,456 | ) | 9,342 | (18,436 | ) | |||||||
Subsidiary preferred stock accretion | (1,279 | ) | (1,000 | ) | (167 | ) | ||||||
Income (loss) applicable to common stockholders | $ | (33,735 | ) | $ | 8,342 | $ | (18,603 | ) | ||||
Basic and diluted income (loss) per share: | ||||||||||||
Continuing operations | $ | (0.89 | ) | $ | (1.40 | ) | $ | (0.98 | ) | |||
Discontinued operations | $ | (0.05 | ) | $ | 1.66 | — | ||||||
Cumulative effect adjustment | $ | — | $ | — | $ | 0.46 | ||||||
Applicable to common stockholders | $ | (0.98 | ) | $ | 0.24 | $ | (0.52 | ) | ||||
Shares used in basic and diluted per share calculations | 34,519 | 35,176 | 35,765 | |||||||||
(1) Stock compensation expense related to the following: | ||||||||||||
Research and development | $ | 1,514 | $ | 292 | $ | 115 | ||||||
General and administrative | 477 | 63 | 68 | |||||||||
| $ | 1,991 | $ | 355 | $ | 183 | |||||||
See accompanying notes.
46
Table of Contents
MAXYGEN, INC.
CONSOLIDATED STATEMENTS OF STOCKHOLDERS’ EQUITY
(in thousands, except share and per share data)
| Common Stock | Additional Paid-In Capital | Deferred Stock Compensation | Accumulated Other Comprehensive Income (Loss) | Accumulated Deficit | Total Stockholders’ Equity | ||||||||||||||||||||||
| Shares | Amount | ||||||||||||||||||||||||||
Balance at January 1, 2003 | 34,504,447 | $ | 3 | $ | 393,491 | $ | (2,436 | ) | $ | 813 | $ | (162,672 | ) | $ | 229,199 | ||||||||||||
Issuance of common stock upon exercise of options for cash and for services rendered | 299,447 | — | 1,853 | — | — | — | 1,853 | ||||||||||||||||||||
Issuance of common stock under employee stock purchase plan | 99,441 | — | 608 | — | — | — | 608 | ||||||||||||||||||||
Issuance of common stock under 401(k) employer matching contribution | 48,356 | — | 522 | — | — | — | 522 | ||||||||||||||||||||
Stock compensation expense for consultant options, and fully vested stock options for services rendered | — | — | 46 | — | — | — | 46 | ||||||||||||||||||||
Repurchase of common stock | (41,892 | ) | — | (17 | ) | — | — | — | (17 | ) | |||||||||||||||||
Subsidiary preferred stock accretion | — | — | (1,279 | ) | — | — | — | (1,279 | ) | ||||||||||||||||||
Amortization of deferred compensation | — | — | (258 | ) | 2,185 | — | — | 1,927 | |||||||||||||||||||
Components of comprehensive loss: | |||||||||||||||||||||||||||
Net loss | — | — | — | — | — | (32,456 | ) | (32,456 | ) | ||||||||||||||||||
Currency translation adjustment | — | — | — | — | (1,975 | ) | — | (1,975 | ) | ||||||||||||||||||
Change in unrealized gain (loss) on available-for-sale securities | — | — | — | — | (204 | ) | — | (204 | ) | ||||||||||||||||||
Comprehensive loss | (34,635 | ) | |||||||||||||||||||||||||
Balance at December 31, 2003 | 34,909,799 | 3 | 394,966 | (251 | ) | (1,366 | ) | (195,128 | ) | 198,224 | |||||||||||||||||
Issuance of common stock upon exercise of options for cash and for services rendered | 631,372 | — | 4,382 | — | — | — | 4,382 | ||||||||||||||||||||
Issuance of common stock under employee stock purchase plan | 62,700 | — | 411 | — | — | — | 411 | ||||||||||||||||||||
Issuance of common stock under 401(k) employer matching contribution | 39,241 | — | 443 | — | — | — | 443 | ||||||||||||||||||||
Stock compensation expense for consultant options, and fully vested stock options for services rendered | — | — | 117 | — | — | — | 117 | ||||||||||||||||||||
Repurchase of common stock | (6,779 | ) | — | (5 | ) | — | — | — | (5 | ) | |||||||||||||||||
Subsidiary preferred stock accretion | — | — | (1,000 | ) | — | — | — | (1,000 | ) | ||||||||||||||||||
Amortization of deferred compensation | — | — | — | 251 | — | — | 251 | ||||||||||||||||||||
Components of comprehensive loss: | |||||||||||||||||||||||||||
Net income | — | — | — | — | — | 9,342 | 9,342 | ||||||||||||||||||||
Currency translation adjustment | — | — | — | — | (126 | ) | — | (126 | ) | ||||||||||||||||||
Change in unrealized gain(loss) on available-for-sale securities | — | — | — | — | (698 | ) | — | (698 | ) | ||||||||||||||||||
Comprehensive income | 8,518 | ||||||||||||||||||||||||||
Balance at December 31, 2004 | 35,636,333 | 3 | 399,314 | — | (2,190 | ) | (185,786 | ) | 211,341 | ||||||||||||||||||
Issuance of common stock upon exercise of options for cash and for services rendered | 198,487 | — | 805 | — | — | — | 805 | ||||||||||||||||||||
Issuance of common stock under employee stock purchase plan | 37,966 | — | 299 | — | — | — | 299 | ||||||||||||||||||||
Issuance of common stock under 401(k) employer matching contribution | 49,392 | — | 350 | — | — | — | 350 | ||||||||||||||||||||
Stock compensation expense for consultant options, and fully vested stock options for services rendered | — | — | 102 | — | — | — | 102 | ||||||||||||||||||||
Subsidiary preferred stock accretion | — | — | (167 | ) | — | — | — | (167 | ) | ||||||||||||||||||
Modification of employee stock options | — | — | 81 | — | — | — | 81 | ||||||||||||||||||||
Deconsolidation of Codexis, Inc. | — | — | 2,336 | — | — | — | 2,336 | ||||||||||||||||||||
Components of comprehensive loss: | |||||||||||||||||||||||||||
Net loss | — | — | — | — | — | (18,436 | ) | (18,436 | ) | ||||||||||||||||||
Currency translation adjustment | — | — | — | — | 645 | — | 645 | ||||||||||||||||||||
Change in unrealized gain (loss) on available-for-sale securities | — | — | — | — | (12 | ) | — | (12 | ) | ||||||||||||||||||
Comprehensive income | (17,803 | ) | |||||||||||||||||||||||||
Balance at December 31, 2005 | $ | 35,922,178 | $ | 3 | $ | 403,120 | $ | — | $ | (1,557 | ) | $ | (204,222 | ) | $ | 197,344 | |||||||||||
See accompanying notes.
47
Table of Contents
MAXYGEN, INC.
CONSOLIDATED STATEMENTS OF CASH FLOWS
(in thousands)
| Year Ended December 31, | ||||||||||||
| 2003 | 2004 | 2005 | ||||||||||
Operating activities | ||||||||||||
Net income (loss) | $ | (32,456 | ) | $ | 9,342 | $ | (18,436 | ) | ||||
Loss from discontinued operations | 1,586 | 2,769 | — | |||||||||
Cumulative effect of change in accounting principle | — | — | (16,616 | ) | ||||||||
Gain on sale of discontinued operations | — | (61,197 | ) | — | ||||||||
Loss from continuing operations | (30,870 | ) | (49,086 | ) | (35,052 | ) | ||||||
Adjustments to reconcile loss from continuing operations to net cash used in operating activities: | ||||||||||||
Depreciation and amortization | 6,050 | 6,160 | 3,530 | |||||||||
Amortization of intangible assets | 698 | — | — | |||||||||
Equity in losses of minority investee | 500 | 1,395 | — | |||||||||
Non-cash stock compensation | 2,451 | 696 | 423 | |||||||||
Common stock issued and stock options granted to consultants for services rendered and for certain technology rights | 335 | 567 | 110 | |||||||||
Changes in operating assets and liabilities: | ||||||||||||
Accounts receivable and other receivables | (197 | ) | 1,793 | (5,003 | ) | |||||||
Prepaid expenses and other current assets | (285 | ) | (1,482 | ) | 17 | |||||||
Deposits and other assets | 909 | (216 | ) | 25 | ||||||||
Accounts payable | 159 | 113 | 902 | |||||||||
Accrued compensation | 154 | 2,885 | (583 | ) | ||||||||
Accrued program termination costs | — | 2,209 | (2,209 | ) | ||||||||
Other accrued liabilities | (2,431 | ) | 234 | 1,342 | ||||||||
Taxes payable | — | 921 | (921 | ) | ||||||||
Deferred revenue | (20 | ) | (538 | ) | 7,542 | |||||||
Net cash used in operating activities | (22,547 | ) | (34,349 | ) | (29,877 | ) | ||||||
Investing activities | ||||||||||||
Purchases of available-for-sale securities | (194,190 | ) | (166,482 | ) | (188,635 | ) | ||||||
Maturities of available-for-sale securities | 184,009 | 143,813 | 209,767 | |||||||||
Investment in minority investee | (500 | ) | (1,395 | ) | — | |||||||
Acquisition of property and equipment | (3,098 | ) | (2,559 | ) | (2,240 | ) | ||||||
Cash used in acquisition, net of cash acquired | — | — | (2,617 | ) | ||||||||
Proceeds from the sale of Verdia | — | 61,197 | — | |||||||||
Net cash provided by (used in) investing activities | (13,779 | ) | 34,574 | 16,275 | ||||||||
Financing activities | ||||||||||||
Repayments under equipment financing obligation | (617 | ) | (445 | ) | (115 | ) | ||||||
Borrowings under equipment financing obligation | — | 2,696 | 1,229 | |||||||||
Minority investment | (69 | ) | 9,970 | — | ||||||||
Proceeds from issuance of common stock | 2,153 | 4,335 | 1,102 | |||||||||
Net cash provided by financing activities | 1,467 | 16,556 | 2,216 | |||||||||
Cash provided from (used for) discontinued operations | (607 | ) | 2,863 | — | ||||||||
Codexis related net adjustment | — | — | (2,365 | ) | ||||||||
Effect of exchange rate changes on cash and cash equivalents | (1,781 | ) | (582 | ) | 276 | |||||||
Net increase (decrease) in cash and cash equivalents | (37,247 | ) | 19,062 | (13,475 | ) | |||||||
Cash and cash equivalents at beginning of period | 58,600 | 21,353 | 40,415 | |||||||||
Cash and cash equivalents at end of period | $ | 21,353 | $ | 40,415 | $ | 26,940 | ||||||
Supplemental Cash Flow Information | ||||||||||||
Non-cash transactions: | ||||||||||||
Shares of Codexis common stock issued in acquisition | $ | — | $ | — | $ | (188 | ) | |||||
Cash paid during the period for interest | $ | 46 | $ | 135 | $ | 41 | ||||||
See accompanying notes.
48
Table of Contents
MAXYGEN, INC.
NOTES TO CONSOLIDATED FINANCIAL STATEMENTS
| 1. | Summary of Significant Accounting Policies |
Organization and Principles of Consolidation
Maxygen, Inc. (the “Company”) was incorporated under the laws of the State of Delaware on May 7, 1996. The Company is a biotechnology company committed to the discovery, development and commercialization of superior next-generation protein pharmaceuticals for the treatment of disease and serious medical conditions. The Company began operations in March 1997 with the mission to develop important commercial products through the use of biotechnology. Since then, the Company has established a focus in human therapeutics, particularly on the development and commercialization of optimized protein pharmaceuticals.
The Company will require additional financial resources to complete the development and commercialization of its product candidates. The Company’s management may finance the Company’s operations through issuances of equity securities, collaborative research and development arrangements, government grants, and debt financing.
The consolidated financial statements include the amounts of the Company and its wholly-owned subsidiaries, Maxygen ApS (Denmark) (“Maxygen ApS”), which was acquired by the Company in August 2000, and Maxygen Holdings Ltd. (Cayman Islands) (“Maxygen Holdings”). For the years ended December 31, 2003 and 2004 and for the two months ended February 28, 2005, the results of operations of Codexis, Inc. (“Codexis”) are also included in the Consolidated Financial Statements. The Consolidated Balance Sheet at December 31, 2004 includes the financial position of Codexis as of that date. Subsequent to February 28, 2005, the Company’s investment in Codexis is reflected using the equity method of accounting. The financial results of Verdia, Inc. (“Verdia”), prior to its sale on July 1, 2004, are reflected as discontinued operations.
The Company’s ownership in Codexis as of December 31, 2004 was approximately 51.4%, based upon the voting rights of the issued and outstanding shares of Codexis common and preferred stock. In accordance with Emerging Issues Task Force Consensus 96-16, “Investor Accounting for an Investee When the Investor Has a Majority of the Voting Interest but the Minority Stockholder or Stockholders Have Certain Approval or Veto Rights” (“EITF 96-16”) and paragraph 1 of Accounting Research Bulletin No. 51, “Consolidated Financial Statements” (“ARB 51”), the Company has included 100% of the net losses of Codexis in the determination of the Company’s consolidated net loss. The Company recorded minority interest in the Consolidated Financial Statements to account for the ownership interest of the minority owner. As a result of the issuance of Codexis common stock in connection with the acquisition by Codexis of Julich Fine Chemicals GmbH and certain other matters that occurred in the first quarter of 2005, the Company’s voting rights of the issued and outstanding shares of Codexis common and preferred stock were reduced below 50%. As a result, as of February 28, 2005, the date upon which such rights fell below 50%, the Company no longer consolidated the financial results of Codexis. In accordance with APB 18, “The Equity Method of Accounting for Investments in Common Stock,” the Company accounts for its investment in Codexis under the equity method of accounting after February 28, 2005.
On September 13, 2002, Codexis sold $15 million of Codexis series B convertible preferred stock to investors, of which, $5 million was purchased by the Company and $10 million was purchased by several unrelated investors. On October 1, 2002, Codexis sold an additional $10 million of series B convertible preferred stock to unrelated investors. The Series B convertible preferred stock includes a redemption provision, which provides that the holders of at least a majority of the outstanding shares of series B convertible preferred stock (excluding the series B convertible preferred stock held by the Company and its affiliates), voting together as a separate class, may require Codexis to redeem the series B convertible preferred stock. The redemption price for each share will be payable in cash in exchange for the shares of series B convertible preferred stock to be redeemed at a sum equal to the applicable original issue price per share plus five percent (5%) of the original
49
Table of Contents
MAXYGEN, INC.
NOTES TO CONSOLIDATED FINANCIAL STATEMENTS��(Continued)
issue price per year from the original issue date until the applicable redemption date, plus declared and unpaid dividends. Notice of redemption can be given at any time on or after the fifth anniversary of the original issue date. In connection with these redemption rights, the Company has recorded accretion of the redemption premium for the series B convertible preferred stock, excluding the shares owned by the Company, in the amount of $167,000, $1.0 million and $1.3 million for the years ended December 31, 2005, 2004 and 2003, respectively. The accretion is recorded as subsidiary preferred stock accretion on the Consolidated Statement of Operations and as a reduction of additional paid-in capital and an increase to minority interest on the Consolidated Balance Sheets. Any obligation to make redemption payments is solely an obligation of Codexis and any payments are to be made solely from assets of Codexis.
Until March 31, 2005, the Company’s investment in Avidia Inc. (“Avidia”), formed by the Company and an unrelated third party investor in July 2003, was accounted for under the equity method of accounting. After March 31, 2005, the Company’s investment in Avidia is being accounted for under the cost method of accounting. As of December 31, 2005, the Company had an equity interest in Avidia of approximately 13%. See Note 14.
Cumulative Effect Adjustment
Codexis was formed in January 2002 and financed by the Company and several other independent investors. In accordance with EITF 96-16 and ARB 51, through February 28, 2005, the Company consolidated 100% of the operating results of Codexis, even though it only owned a majority of the voting interests in Codexis. From March 2002 through February 28, 2005, the Company had recorded losses of Codexis of $26.4 million, which was in excess of the Company’s investment basis of $9.8 million. On February 28, 2005, the Company’s voting rights in Codexis were reduced below 50%. As a result, the Company no longer consolidates the financial position and results of operations of Codexis with the Company’s financial results as of such date and instead accounts for Codexis under the equity method of accounting. To reflect what the Company’s basis in Codexis would have been under equity accounting as required by EITF 96-16, the Company recorded a cumulative effect adjustment of $16.6 million in the first quarter of 2005 to bring its investment basis in Codexis to zero as of February 28, 2005. This cumulative effect adjustment does not have any tax consequences.
Foreign Currency Translation
The functional currency of Maxygen ApS is the Danish kroner. Assets and liabilities of Maxygen ApS are translated at current exchange rates. Revenues and expenses are translated at average exchange rates in effect during the period. Gains and losses from currency translation are included in accumulated other comprehensive loss. Currency transaction gains or losses are included in interest income and other (expense), net.
Use of Estimates
The preparation of financial statements in conformity with generally accepted accounting principles requires management to make estimates and assumptions that affect the amounts reported in the financial statements and accompanying notes. Actual results could differ from those estimates.
Reclassifications
Approximately $522,000 in proceeds received in 2003 from the issuance of common stock under the Company’s 401(k) plan was previously reported as financing activities on the Company’s Consolidated Statement of Cash Flows and has been reclassified as operating activities to conform to the current year presentation. This reclassification, when made, did not have any effect on loss applicable to common stockholders, total assets or total liabilities and stockholders’ equity.
50
Table of Contents
MAXYGEN, INC.
NOTES TO CONSOLIDATED FINANCIAL STATEMENTS—(Continued)
Cash, Cash Equivalents and Investments
The Company considers all highly liquid investments with original maturity dates of three months or less, as of the date of purchase, to be cash equivalents. Cash equivalents include marketable debt securities, government and corporate debt obligations. Short and long-term investments include government and corporate debt obligations.
The Company’s management determines the appropriate classification of debt securities at the time of purchase and reevaluates such designation as of each balance sheet date. The Company’s debt securities are classified as available-for-sale and are carried at estimated fair value in cash equivalents and investments. Unrealized gains and losses are reported as a component of accumulated other comprehensive loss in stockholders’ equity. The amortized cost of debt securities in this category is adjusted for amortization of premiums and accretion of discounts to maturity. Such amortization of premiums and accretion of discounts is included in interest income and other (expense), net. Realized gains and losses and declines in value deemed to be other-than-temporary, if any, are included in interest income and other (expense), net. The cost of securities sold is based on the specific identification method. Interest and dividends on securities are included in interest income and other (expense), net.
Derivatives and Financial Instruments
The Company addresses certain financial exposures through a program of risk management that includes the use of derivative financial instruments. To date, the Company has only entered into foreign currency forward exchange contracts generally expiring within fifteen months to reduce the effects of fluctuating foreign currency exchange rates on forecasted cash requirements.
The Company accounts for derivative instruments under the provisions of Financial Accounting Standard No. 133, “Accounting for Derivative Instruments and Hedging Activities” (“SFAS 133”), as amended, which requires that all derivative instruments be reported on the balance sheet at fair value and establishes criteria for designation and evaluating effectiveness of hedging relationships.
All derivatives are recognized on the balance sheet at their fair value. The Company has designated its derivatives as foreign currency cash flow hedges. Changes in the fair value of derivatives that are highly effective as, and that are designated and qualify as, foreign currency cash flow hedges are recorded in other comprehensive income until the associated hedged transaction impacts earnings. Changes in the fair value of derivates that are ineffective are recorded as interest income and other (expense), net in the period of change.
The Company documents all relationships between hedging instruments and hedged items, as well as its risk-management objective and strategy for undertaking various hedge transactions. The Company also assesses, both at the hedge’s inception and on an ongoing basis, whether the derivatives that are used in hedging transactions are highly effective in offsetting changes in fair values or cash flows of hedged items. When it is determined that a derivative is not highly effective as a hedge or that it has ceased to be a highly effective hedge, the Company discontinues hedge accounting prospectively.
The purpose of the hedging activities is to minimize the effect of foreign currency exchange rate movements on the cash flows related to the Company’s funding of Maxygen ApS and payments to vendors in Europe. To date, foreign currency contracts are denominated in Danish kroner and euros. At December 31, 2004 and 2005, the Company had foreign currency contracts outstanding in the form of forward exchange contracts totaling $5.8 million and $7.2 million, respectively.
As a matter of policy, the Company only enters into contracts with counterparties that have at least an “A” (or equivalent) credit rating. The counterparties to these contracts are major financial institutions. Exposure to
51
Table of Contents
MAXYGEN, INC.
NOTES TO CONSOLIDATED FINANCIAL STATEMENTS—(Continued)
credit loss in the event of nonperformance by any of the counterparties is limited to only the recognized, but not realized, gains attributable to the contracts. Management believes risk of loss is remote and in any event would not be material. Costs associated with entering into such contracts have not been material to the Company’s financial results. The Company does not utilize derivative financial instruments for trading or speculative purposes.
Concentration of Credit Risk
Financial instruments that potentially subject the Company to a concentration of credit risk consist of investments and accounts receivable. The Company is exposed to credit risks in the event of default by the financial issuers or collaborators to the extent of the amount recorded on the balance sheet. A portion of the Company’s accounts receivable balance at December 31, 2004 and 2005 consisted of balances due from government agencies. Each grant agreement is subject to funding approvals by the U.S. government. Certain grant agreements provide an option for the government to audit the amount of research and development expenses, both direct and indirect, that have been submitted to the government agency for reimbursement. The Company does not require collateral or other security to support the financial instruments subject to credit risk.
Property and Equipment
Property and equipment, including the cost of purchased software, are stated at cost, less accumulated depreciation. Depreciation is provided using the straight-line method over the estimated useful life of the assets (generally three to five years). Leasehold improvements are amortized over the shorter of the lease term or the estimated useful life of the assets.
Goodwill and Other Intangible Assets
In connection with the Maxygen ApS acquisition, the Company allocated $26.2 million to goodwill and other intangible assets. Prior to adoption of Statement of Financial Accounting Standard No. 142 “Goodwill and Other Intangible Assets” (“SFAS 142”), the Company amortized a portion of the goodwill each year. As of December 31, 2001, the net goodwill balance was $12.2 million. At this time, goodwill and other intangible assets are generally evaluated on an individual acquisition or market basis whenever events or changes in circumstances indicate that such assets are impaired or the estimated useful lives are no longer appropriate. In accordance with SFAS 142, the Company reviews its long-lived assets (including goodwill) for impairment at least annually based on estimated future discounted cash flows attributable to the assets and other factors to determine the fair value of the respective assets. In the event such cash flows are not expected to be sufficient to recover the recorded value of the assets, the assets will be written down to their estimated fair values. No impairment charges were recorded in 2003, 2004 or 2005.
The valuation in connection with the initial purchase price allocation and the ongoing evaluation for impairment of goodwill and intangible assets requires significant management estimates and judgment. The purchase price allocation process requires management estimates and judgment as to expectations for various products and business strategies. If any of the significant assumptions differ from the estimates and judgments used in the purchase price allocation, this could result in different valuations for goodwill and intangible assets. Once it is established, the Company must test goodwill annually for impairment using a two-step process as required by SFAS 142. In addition, in certain circumstances, the Company must assess if goodwill should be tested for impairment between annual tests. Intangible assets with definite useful lives must be tested for impairment in accordance with Statement of Financial Accounting Standard No. 144 “Accounting for the Impairment or Disposal of Long-Lived Assets.” When the Company conducts its impairment tests for goodwill and intangibles, factors that are considered important in determining whether impairment might exist include
52
Table of Contents
MAXYGEN, INC.
NOTES TO CONSOLIDATED FINANCIAL STATEMENTS—(Continued)
existing product portfolio, product development cycle, development expenses, potential royalties and product sales, costs of goods and selling expenses and overall product lifecycle. Any changes in key assumptions about the business and its prospects, or changes in market conditions or other external events, could result in an impairment charge and such a charge could have a material adverse effect on the Company’s consolidated results of operations.
Long-Lived Assets
The Company reviews long-lived assets including intangible assets with finite lives for impairment whenever events or changes in business circumstances indicate that the carrying amount of the assets may not be fully recoverable, such as a significant industry downturn, significant decline in the market value of the Company, or significant reductions in projected future cash flows. An impairment loss would be recognized when estimated undiscounted future cash flows expected to result from the use of the asset and its eventual disposition is less than its carrying amount. The amount of the impairment loss, if any, is determined using discounted cash flows. In assessing the recoverability of long-lived assets, including intangible assets, the Company must make assumptions regarding estimated future cash flows and other factors to determine the fair value of the respective assets.
Revenue Recognition
The Company recognizes revenue from multiple element arrangements under collaborative research agreements, including license payments, research and development services, milestones, and royalties. Revenue arrangements with multiple deliverables are accounted for under the provisions of Staff Accounting Bulletin No. 104 and Emerging Issues Task Force Issue No. 00-21, “Revenue Arrangements with Multiple Deliverables,” and are divided into separate units of accounting if certain criteria are met, including whether the delivered item has stand-alone value to the customer and whether there is objective and reliable evidence of the fair value of the undelivered items in the arrangement. The consideration the Company receives is allocated among the separate units of accounting based on their respective fair values, and the applicable revenue recognition criteria are considered separately for each of the separate units.
Non-refundable up-front payments received in connection with research and development collaboration agreements, including license fees, and technology advancement funding that is intended for the development of the Company’s core technologies, are deferred and recognized on a straight-line basis over the relevant periods specified in the agreement, generally the research term, or recognized ratably over the research term based on planned levels of research services in cases where the planned levels of research services fluctuate substantially over the research term.
Revenue related to collaborative research payments from the Company’s corporate collaborators is recognized as research services are performed over the related funding periods for each contract. Under these agreements, the Company is typically required to perform research and development activities as specified in the respective agreement. Generally, the payments received are not refundable and are based on a contractual cost per full-time equivalent employee working on the project. Research and development expenses under the collaborative research agreements approximate or exceed the research funding revenue recognized under such agreements over the term of the respective agreements. Deferred revenue may result when the Company does not incur the required level of effort during a specific period in comparison to funds received under the respective contracts. Payments received relating to substantive, at-risk incentive milestones, if any, are recognized as revenue upon achievement of the incentive milestone event because the Company has no future performance obligations related to the payment. Incentive milestone payments may be triggered either by the results of the Company’s research efforts or by events external to the Company, such as regulatory approval to market a product.
53
Table of Contents
MAXYGEN, INC.
NOTES TO CONSOLIDATED FINANCIAL STATEMENTS—(Continued)
The Company is eligible to receive royalties from licensees, which are typically based on sales of licensed products to third parties. Royalties are recorded as earned in accordance with the contract terms when third-party results can be reliably measured and collectibility is reasonably assured.
The Company has been awarded grants from the Defense Advanced Research Projects Agency, the National Institute of Standards and Technology-Advanced Technology Program, the U.S. Agency for International Development, the U.S. Army Medical Research and Materiel Command, the National Institutes of Health, and the U.S. Army Space & Missile Defense Command for various research and development projects. The terms of these grant agreements range from one to five years with various termination dates, the last of which is January 2010 for existing agreements. Revenue related to grant agreements is recognized as related research and development expenses are incurred.
Research and Development Expenses
Research and development expenses consist of costs incurred for both Company-sponsored and collaborative research and development activities. These costs include direct and research-related overhead expenses, which include salaries and other personnel-related expenses, facility costs, supplies and depreciation of facilities and laboratory equipment, as well as research consultants and the cost of funding research at universities and other research institutions, and are expensed as incurred. Costs to acquire technologies that are utilized in research and development and that have no alternative future use are expensed when incurred. See Note 5 for detail regarding the Company’s sponsored license and research agreements.
The Company does not track fully burdened research and development costs or capital expenditures by project. However, the Company does estimate, based on full-time equivalent personnel effort, the percentage of research and development efforts (as measured in hours incurred, which approximates costs) undertaken for projects funded by, on the one hand, the Company’s collaborators and government grants and, on the other hand, projects funded by the Company.
The following table presents the Company’s approximate research and development expenses by funding category (in thousands):
| Year Ended December 31, | |||||||||
| 2003 | 2004 | 2005 | |||||||
Collaborative projects funded by third parties | $ | 12,505 | $ | 11,344 | $ | 6,495 | |||
Internal projects | 31,930 | 41,950 | 35,294 | ||||||
Total | $ | 44,435 | $ | 53,294 | $ | 41,789 | |||
As the Company does not track fully burdened research and development costs by project, the expense figures are comprised of the number of hours expended in each category multiplied by the approximate cost per hour of research and development effort. In addition, project-specific external costs are added to these costs.
Stock-Based Compensation
The Company accounts for common stock options granted to employees using the intrinsic value method and, thus, recognizes no compensation expense for options granted with exercise prices equal to or greater than the fair value of the Company’s common stock on the date of the grant. Options granted to consultants are periodically re-valued as they vest in accordance with Statement of Financial Accounting Standards No. 123 “Accounting for Stock-Based Compensation” (“SFAS 123”), and Emerging Issues Task Force Issue No. 96-18
54
Table of Contents
MAXYGEN, INC.
NOTES TO CONSOLIDATED FINANCIAL STATEMENTS—(Continued)
“Accounting for Equity Instruments That Are Issued to Other Than Employees for Acquiring, or in Conjunction with Selling, Goods or Services” (“EITF 96-18”) using the Black-Scholes valuation model. See Note 9.
As permitted under SFAS 123, the Company has elected to continue to follow the intrinsic value method in accounting for its stock-based employee compensation arrangement as defined by Accounting Principles Board Opinion No. 25, “Accounting for Stock Issued to Employees” (“APB 25”), and related interpretations including Financial Accounting Standards Board Interpretation No. 44, “Accounting for Certain Transactions involving Stock Compensation,” an interpretation of APB 25. The following table illustrates the effect on net income (loss) and net income (loss) per common share if the Company had applied the fair value recognition provisions of SFAS 123 to stock-based employee compensation (in thousands, except per share amounts):
| Year Ended December 31, | ||||||||||||
| 2003 | 2004 | 2005 | ||||||||||
Net income (loss), as reported | $ | (32,456 | ) | $ | 9,342 | $ | (18,436 | ) | ||||
Add: Stock based employee compensation cost included in the determination of net loss as reported | 1,909 | 236 | — | |||||||||
Deduct: Total stock-based employee compensation expense determined under fair value-based method for all awards, net of related tax effects | (15,623 | ) | (10,240 | ) | (5,867 | ) | ||||||
Pro forma net loss | $ | (46,170 | ) | $ | (662 | ) | $ | (24,303 | ) | |||
Net income (loss) per common share: | ||||||||||||
Basic and diluted—as reported | $ | (0.94 | ) | $ | 0.27 | $ | (0.52 | ) | ||||
Basic and diluted—pro forma | $ | (1.34 | ) | $ | (0.02 | ) | $ | (0.68 | ) | |||
The Black-Scholes option-pricing model was developed for use in estimating the fair value of traded options that have no restrictions and are fully transferable and negotiable in a free trading market. Black-Scholes does not consider the employment, transfer or vesting restrictions that are inherent in the Company’s employee options. Use of an option valuation model, as required by SFAS 123, includes highly subjective assumptions based on long-term predictions, including the expected stock price volatility and average life of each option grant. The Company’s employee stock options have characteristics significantly different from those of freely traded options, and changes in the subjective input assumptions can materially affect the Company’s estimate of the fair value of those options. The Black-Scholes weighted average estimated fair values of stock options granted during the years ended December 31, 2003, 2004 and 2005 were $4.30, $4.93 and $5.28 per share, respectively.
Stock compensation expense for options granted to non-employees has been determined in accordance with SFAS 123 and EITF 96-18 as the fair value of the consideration received or the fair value of the equity instruments issued, whichever is more reliably measured. The fair value of options granted to non-employees is periodically remeasured as the underlying options vest.
Effective January 1, 2006, the Company adopted Statement of Financial Accounting Standards No. 123 (revised 2004), “Share-Based Payment” (“SFAS 123(R)”) and will begin to account for its stock-based employee compensation using fair value based accounting (see “Recent Accounting Pronouncements” below).
Income (Loss) Per Common Share
Basic and diluted income (loss) per common share has been computed using the weighted-average number of shares of common stock outstanding during the period, less shares subject to repurchase.
55
Table of Contents
MAXYGEN, INC.
NOTES TO CONSOLIDATED FINANCIAL STATEMENTS—(Continued)
The following table presents the calculation of basic and diluted income (loss) per common share (in thousands, except per share data):
| Year Ended December 31, | ||||||||||||
| 2003 | 2004 | 2005 | ||||||||||
Income (loss) applicable to common stockholders | $ | (33,735 | ) | $ | 8,342 | $ | (18,603 | ) | ||||
Basic and diluted: | ||||||||||||
Weighted-average shares of common stock outstanding | 34,734 | 35,177 | 35,765 | |||||||||
Less: weighted-average shares subject to repurchase | (215 | ) | (1 | ) | — | |||||||
Weighted-average shares used in computing basic and diluted income (loss) per share | 34,519 | 35,176 | 35,765 | |||||||||
Basic and diluted income (loss) per common share | $ | (0.98 | ) | $ | 0.24 | $ | (0.52 | ) | ||||
In accordance with paragraph 15 of Statement of Financial Accounting Standards No. 128, “Earnings Per Share,” the Company has excluded all outstanding stock options, outstanding warrants and shares subject to repurchase from the calculation of diluted income (loss) per common share because all such securities are antidilutive to loss from continuing operations for all applicable periods presented. The total number of shares excluded from the calculations of diluted income (loss) per share, prior to application of the treasury stock method for options, was approximately 9,605,028 at December 31, 2003, 8,910,876 at December 31, 2004 and 9,401,599 at December 31, 2005.
Accumulated Other Comprehensive Loss
Accumulated other comprehensive loss is primarily comprised of net unrealized gains or losses on available-for-sale securities, foreign currency translation adjustments and changes in foreign currency contracts. The components of accumulated other comprehensive loss are as follows (in thousands):
| December 31, | ||||||||||||
| 2003 | 2004 | 2005 | ||||||||||
Unrealized gain on available-for-sale securities | $ | 200 | $ | 5 | $ | — | ||||||
Unrealized losses on available-for-sale securities | (82 | ) | (585 | ) | (592 | ) | ||||||
Foreign currency translation adjustments | (1,484 | ) | (2,306 | ) | (579 | ) | ||||||
Changes in foreign currency contracts | — | 696 | (386 | ) | ||||||||
Accumulated other comprehensive loss | $ | (1,366 | ) | $ | (2,190 | ) | $ | (1,557 | ) | |||
Recent Accounting Pronouncements
In November 2005, the FASB issued FASB Staff Position Nos. FAS 115-1 and FAS 124-1, “The Meaning of Other-Than-Temporary Impairment and Its Application to Certain Investments” (“FSP 115-1”), which provides guidance on determining when investments in certain debt and equity securities are considered impaired, whether that impairment is other-than-temporary, and on measuring such impairment loss. FSP 115-1 also includes accounting considerations subsequent to the recognition of an other-than temporary impairment and requires certain disclosures about unrealized losses that have not been recognized as other-than-temporary impairments. FSP 115-1 is required to be applied to reporting periods beginning after December 15, 2005. The Company is currently evaluating the effect that the adoption of FSP 115-1 will have on its consolidated results of operations and financial condition but does not expect it to have a material impact on its results of operations or financial condition.
56
Table of Contents
MAXYGEN, INC.
NOTES TO CONSOLIDATED FINANCIAL STATEMENTS—(Continued)
In May 2005, the FASB issued Statement of Financial Accounting Standards No. 154, “Accounting Changes and Error Corrections” (“SFAS 154”), a replacement of Accounting Principles Board Opinions No. 20, “Accounting Changes”, and Statement No. 3, “Reporting Accounting Changes in Interim Financial Statements.” SFAS 154 changes the requirements for the accounting for and reporting of a change in accounting principle. Previously, most voluntary changes in accounting principles were recognized by including in net income during the period of change the cumulative effect of changing to the new accounting principle. SFAS 154 requires retrospective application to prior periods’ financial statements, unless it is impracticable to determine either the period-specific effects or the cumulative effect of the change. SFAS 154 is effective for accounting changes made in fiscal years beginning after December 15, 2005; however, SFAS 154 does not change the transition provisions of any existing accounting pronouncements. The Company believes adoption of SFAS 154 will not have a material effect on the Company’s consolidated financial position, results of operations or cash flows.
On December 16, 2004, the FASB issued SFAS 123(R). SFAS 123(R) supersedes APB 25 and amends Statement of Financial Accounting Standards No. 95, “Statement of Cash Flows.” SFAS 123(R) requires all share-based payments to employees, including grants of employee stock options, to be recognized in the income statement based on their fair values. Pro forma disclosure is no longer an alternative.
SFAS 123(R) permits public companies to adopt its requirements using one of two methods:
| 1. | A “modified prospective” method in which compensation cost is recognized beginning with the effective date (a) based on the requirements of SFAS 123(R) for all share-based payments granted after the effective date and (b) based on the requirements of SFAS 123 for all awards granted to employees prior to the effective date of SFAS 123(R) that remain unvested on the effective date. |
| 2. | A “modified retrospective” method that includes the requirements of the modified prospective method described above, but also permits entities to restate, based on the amounts previously recognized under SFAS 123, for purposes of pro forma disclosures for all prior periods presented. |
The Company adopted SFAS 123(R) as of January 1, 2006 and expects to utilize the modified prospective method and the Black-Scholes option-pricing model.
As permitted by SFAS 123, the Company currently accounts for share-based payments to employees using APB 25’s intrinsic value method and, as such, generally recognizes no compensation cost for employee stock options. Accordingly, the implementation of SFAS 123(R)’s fair value method will have a significant impact on the Company’s result of operations, although it will have no impact on the Company’s overall financial position. The impact of adoption of SFAS 123(R) cannot be predicted at this time because it will depend on levels of share-based payments granted in the future. However, had the Company adopted SFAS 123(R) in prior periods, the impact of that standard would have approximated the impact of SFAS 123 as described in the disclosure of pro forma net income (loss) and earnings (loss) per share in Note 1 to the Consolidated Financial Statements (“Stock-Based Compensation”). SFAS 123(R) also requires the benefits of tax deductions in excess of recognized compensation cost to be reported as a financing cash flow, rather than as an operating cash flow as required under current literature. This requirement may reduce net operating cash flows and increase net financing cash flows in periods after adoption. The Company cannot estimate what those amounts will be in the future because they depend upon, among other things, the levels of share-based payments granted in the future.
In March 2005, the Securities and Exchange Commission (“SEC”) released Staff Accounting Bulletin No. 107 (“SAB 107”). SAB 107 provides the position of the SEC staff regarding the application of SFAS 123(R). SAB 107 contains interpretive guidance relating to the interaction between SFAS 123(R) and certain SEC rules and regulations, as well as the SEC staff’s views regarding the valuation of share-based payment arrangements for public companies. SAB 107 also highlights the importance of disclosures made related
57
Table of Contents
MAXYGEN, INC.
NOTES TO CONSOLIDATED FINANCIAL STATEMENTS—(Continued)
to the accounting for share-based payment transactions. The Company is currently evaluating SAB 107 and will be incorporating it as part of its implementation of SFAS 123(R).
| 2. | Cash Equivalents and Investments |
The Company’s cash equivalents and investments as of December 31, 2004 were as follows (in thousands):
| Amortized Cost | Gross Unrealized Gains | Gross Unrealized Losses | Estimated Fair Value | ||||||||||||
Money market funds | $ | 37,505 | $ | — | $ | — | $ | 37,505 | |||||||
Corporate debt obligations | 164,959 | 2 | (536 | ) | 164,425 | ||||||||||
U.S. government agency securities | 16,586 | — | (23 | ) | 16,563 | ||||||||||
Commercial paper | 14,423 | 3 | (26 | ) | 14,400 | ||||||||||
Total | 233,473 | 5 | (585 | ) | 232,893 | ||||||||||
Less amounts classified as cash equivalents | (40,415 | ) | — | — | (40,415 | ) | |||||||||
Total investments | $ | 193,058 | $ | 5 | $ | (585 | ) | $ | 192,478 | ||||||
The Company’s cash equivalents and investments as of December 31, 2005 were as follows (in thousands):
| Amortized Cost | Gross Unrealized Gains | Gross Unrealized Losses | Estimated Fair Value | ||||||||||||
Money market funds | $ | 26,940 | $ | — | $ | — | $ | 26,940 | |||||||
Corporate debt obligations | 116,563 | — | (286 | ) | 116,277 | ||||||||||
U.S. government agency securities | 45,412 | — | (306 | ) | 45,106 | ||||||||||
Total | 188,915 | — | (592 | ) | 188,323 | ||||||||||
Less amounts classified as cash equivalents | (26,940 | ) | — | — | (26,940 | ) | |||||||||
Total investments | $ | 161,975 | — | $ | (592 | ) | $ | 161,383 | |||||||
Realized gains or losses on the maturity of available-for-sale securities for 2003, 2004 and 2005 were insignificant. The change in unrealized holding gains (losses) on available-for-sale securities included in accumulated other comprehensive income (loss) were unrealized losses of $204,000 in 2003, $698,000 in 2004 and $12,000 in 2005. The Company intends to hold the securities until maturity and therefore does not believe the current unrealized losses of $592,000 are other than temporary.
At December 31, 2005, the contractual maturities of investments were as follows (in thousands):
| Amortized Cost | Estimated Fair Value | |||||
Due within one year | $ | 127,681 | $ | 127,336 | ||
Due after one year through two years | 34,294 | 34,047 | ||||
| $ | 161,975 | $ | 161,383 | |||
| 3. | Collaborative Agreements |
Sixteen of the Company’s collaborative agreements generated revenue during 2003, 2004 and/or 2005. These agreements typically include up-front licensing fees, technology advancement fees and research funding,
58
Table of Contents
MAXYGEN, INC.
NOTES TO CONSOLIDATED FINANCIAL STATEMENTS—(Continued)
as well as the potential to earn milestone payments and royalties on future product sales or cost savings. The agreements generally require the Company to devote a specified number of full-time equivalent employees to the research efforts over defined research terms ranging from three to five years. Total revenue recognized under these collaboration agreements was $20.6 million in 2003, $14.3 million in 2004 and $11.6 million in 2005.
The following table represents the percentage of the Company’s total revenue that has been recognized pursuant to the Company’s largest non-grant collaborations:
| December 31, | ||||||
| 2003 | 2004 | 2005 | ||||
Partner A | 12.2% | 35.0% | 69.4% | |||
Partner B | 9.1% | 13.4% | — | |||
Partner C | 11.5% | 2.2% | — | |||
Partner D | 4.8% | 3.0% | — | |||
Partner E | 8.8% | — | — | |||
Partner F | 13.3% | — | — | |||
No other collaborator has comprised more than 10% of revenue in any period presented. In addition to providing the research funding summarized above, certain of the Company’s collaborators have also purchased equity securities in the Company or one of its subsidiaries. The Company’s collaboration agreements that generated revenue in 2003, 2004 and/or 2005 are summarized below, organized by segment.
Human Therapeutics
Roche (MAXY-alpha)
In May 2003, the Company formed a broad strategic alliance with F. Hoffmann-La Roche Ltd. (“Roche”) to collaborate on the global development and commercialization of the Company’s portfolio of next-generation interferon alpha and beta variants for a wide range of indications. The collaboration is initially focused on the development of lead candidates for the treatment of hepatitis C virus (“HCV”) and hepatitis B virus (“HBV”) infections that have been designed by the Company to have novel and superior efficacy compared to currently marketed interferon alpha products.
Roche licensed from the Company worldwide commercialization rights to specific novel interferon product candidates for the treatment of HCV and HBV infection. The Company received an initial payment and research and development funding for the first two years of the collaboration. The Company is also entitled to receive option fees. In addition, the Company is eligible to receive milestone payments and royalties based on product sales. The funded research term of this collaboration ended in December 2005. In 2005, the Company achieved two significant preclinical development milestones for the advancement of its MAXY-alpha product candidates and Roche paid the Company milestone payments totaling $7 million.
The alliance also provides the companies with the option to expand the collaboration to develop other novel interferon alpha and beta products specifically tailored for indications outside of the treatment of HCV and HBV infection, including oncology, autoimmune diseases, inflammatory diseases, and other infectious diseases such as HIV infection. The Company retains the right to develop such products while Roche may elect to acquire worldwide license and commercialization rights to these product candidates. The Company also has the option to co-fund commercialization in the United States any product to which Roche acquires a license in exchange for profit sharing or an increased royalty rate in the United States.
59
Table of Contents
MAXYGEN, INC.
NOTES TO CONSOLIDATED FINANCIAL STATEMENTS—(Continued)
Aventis Pasteur
In November 2001, the Company established a three-year collaboration with Aventis Pasteur to develop improved vaccines for a specific undisclosed target. Under the terms of the agreement, the Company received license fees and research and development funding. The Company is entitled to receive potential milestone payments based on success-based milestones, clinical trials, regulatory approvals and commercial sales and royalty payments on product sales. Aventis Pasteur will receive exclusive worldwide rights to commercialize the vaccines developed in the collaboration. The funded research term of this collaboration ended in November 2004.
InterMune, Inc.
In September 2001, Maxygen Holdings entered into a license and collaboration agreement with InterMune, Inc. (“InterMune”) to develop and commercialize novel, next-generation interferon gamma products. Under the terms of the agreement, InterMune has taken product candidates developed by the Company into pre-clinical development. InterMune has funded and is expected to continue to fund optimization and development of the next-generation interferon gamma products, and retains exclusive worldwide commercialization rights for all human therapeutic indications. Under the terms of the agreement, the Company received up-front license fees and research and development funding and is entitled to receive potential development and commercialization milestone payments. In addition, the Company is entitled to receive royalties on any product sales. The funded research term of this collaboration ended in June 2004. Although InterMune has indicated that it intends to continue to advance the development of our interferon gamma product candidates, it has informed the Company that it does not currently plan to advance these product candidates into clinical development during 2006.
ALK-Abelló A/S
In February 2001, the Company established a three-year collaboration with ALK-Abelló A/S, a wholly-owned subsidiary of Chr. Hansen Holding A/S, Denmark, to research and develop novel recombinant therapeutics for the treatment of specific allergies. The Company is collaborating with ALK-Abelló to create therapies for treating specific allergies, including allergies to house dust mites and grasses, which are the cause of many common allergies. Under the terms of the collaboration, the Company received license fees, technology access fees and research and development funding. The Company may also be entitled to receive potential milestone payments and royalties on any product sales. The funded research term of this collaboration ended in February 2004.
International AIDS Vaccine Initiative
In February 2001, the Company established a three-year collaboration with the International AIDS Vaccine Initiative and DBLV, LLC, an entity established and funded by the Rockefeller Foundation to develop novel HIV vaccines. Under the agreement, DBLV has provided research and development funding to the Company to expand the Company’s ongoing program in HIV vaccine development. The Company retains all rights to commercialize the HIV vaccine candidates made in the research program in all developed countries of the world, as well as in certain markets in the developing world. The funded research term of this collaboration ended in February 2004.
H. Lundbeck A/S
In September 2000, Maxygen ApS entered into a three-year collaborative research and development agreement with H. Lundbeck A/S (“Lundbeck”), to develop an improved interferon beta pharmaceutical product that could be used for central nervous system diseases, including multiple sclerosis. Under the terms of the
60
Table of Contents
MAXYGEN, INC.
NOTES TO CONSOLIDATED FINANCIAL STATEMENTS—(Continued)
agreement, the Company received research and development funding and license fees. As a result of the strategic prioritization of Lundbeck’s portfolio and the Company’s growing focus and expertise in the development of type I interferons, in October 2003, the companies agreed to terminate the research program and transfer to the Company all rights held by Lundbeck with regard to the improved interferon beta. In November 2004, the Company substantially terminated its interferon beta program.
Chemicals (Codexis)
Our former chemicals segment was operated by Codexis. Effective February 28, 2005, the Company’s voting interests in Codexis fell below 50% and, from such time, Codexis ceased to be a consolidated subsidiary of the Company. The Company instead accounts for Codexis under the equity method of accounting from that date.
Teva
On December 7, 2004, Codexis entered into a research collaboration agreement with Teva Pharmaceutical Industries Ltd. (“Teva”) to develop improved processes for the manufacturing of a currently marketed fermented pharmaceutical product. Under the terms of the collaboration, Codexis is entitled to receive research and development funding and will be eligible for milestone and royalty payments upon success. Codexis has granted Teva exclusive commercialization rights to the improved process for the pharmaceutical product.
Pfizer
On July 26, 2004, Codexis entered into a multi-year collaborative research agreement and a license agreement with Pfizer, Inc. (“Pfizer”) to discover and develop biocatalysts, and associated processes that use such biocatalysts, in the manufacture of pharmaceutical products for Pfizer. Under the terms of these agreements, Codexis received an upfront technology access fee and is entitled to receive research funding over a multi-year period. Codexis is also eligible to receive milestone payments, a license fee if Pfizer exercises its option to acquire a non-exclusive worldwide license to certain Codexis gene shuffling technologies, and royalties.
Concurrent with the execution of this multi-year collaborative research agreement and the license agreement, Codexis and Pfizer also entered into a stock purchase agreement in which Pfizer purchased from Codexis series C convertible preferred stock for net proceeds of approximately $10 million.
Sandoz
In October 2003, Codexis and Sandoz entered into a research collaboration to develop an improved synthesis of one of Sandoz’s key active pharmaceutical compounds using our MolecularBreeding directed evolution platform. Under the terms of the agreement, Codexis received upfront payments and research and development funding. Codexis is entitled to receive future research and development funding and is eligible for milestone and royalty payments. Codexis has granted Sandoz exclusive commercialization rights to the improved process for the specific pharmaceutical product.
Cargill
In May 2003, Codexis entered into a multi-year collaboration with Cargill, Incorporated (“Cargill”) to develop a novel biochemical platform that may enable production of a broad range of specialty chemicals, polymers and other agricultural raw materials. Under the agreement, Cargill and the U.S. Department of Energy each agreed to contribute to research and development funding for three years at Codexis. Codexis is also eligible to receive milestone and royalty payments from products commercialized by Cargill.
61
Table of Contents
MAXYGEN, INC.
NOTES TO CONSOLIDATED FINANCIAL STATEMENTS—(Continued)
Rio Tinto
In January 2000, Codexis entered into a collaboration with Technological Resources Pty Limited, a wholly-owned subsidiary of Rio Tinto Corporation plc (“Rio Tinto”), one of the world’s leading mining companies. The agreement was extended in February 2003. The collaboration was focused on developing enzymatic systems to increase the efficiency of carbon dioxide fixation in connection with the combustion of fossil fuels and for other purposes. In connection with the collaboration, the Company received research and funding payments and technology advancement fees. This collaboration was assigned to Codexis in connection with its capitalization in March 2002. The collaboration ended in May 2004.
Eli Lilly
In January 2003, Codexis entered into a multi-year collaboration with Eli Lilly and Company (“Eli Lilly”) focused on the development of improved fermentations for several of Eli Lilly’s natural product drugs. Under the terms of the collaboration, Eli Lilly provided Codexis with up-front technology access funding and research funding. The collaboration was terminated by Eli Lilly in January 2005.
Hercules Incorporated
In November 2000, the Company entered into a four-year collaboration with Hercules Incorporated (“Hercules”) focused on developing high value specialty chemicals via custom-made biological catalysts. Under the terms of the collaboration, the Company received research funding, technology access fees and license fees. The collaboration was focused on a number of high revenue-generating products in Hercules’ core business. This agreement was assigned to Codexis in connection with its capitalization in March 2002. Codexis terminated this collaboration agreement in January 2003 in exchange for a termination payment of $2.5 million and the assignment of all program technology to Codexis.
Chevron Research and Technology Co.
In October 2000, the Company entered into a three-year collaboration with Chevron Research and Technology Co. (“Chevron”) to develop novel bioprocesses for specific petrochemical products. Under the terms of the agreement, the Company received license fees, research funding and technology access fees and is also eligible to receive potential milestones and product royalties, if any. Chevron received worldwide commercialization rights. This agreement was assigned to Codexis in connection with its capitalization in March 2002. The funded research term of the collaboration ended in January 2004.
Gist-Brocades N.V.
In March 1999, the Company entered into a three-year collaborative research and license agreement with Gist-Brocades N.V., a subsidiary of DSM N.V. (“DSM”) to utilize the Company’s technologies to develop certain novel enzymes involved in the manufacture of certain classes of antibiotics. Under the terms of the agreement, the Company received research funding and may receive royalties from the commercialization of any enzymes developed through the Company’s technology. DSM received worldwide commercialization rights. This collaboration was assigned to Codexis in connection with its capitalization in March 2002. The funded research term of the collaboration ended in June 2002.
Novozymes
In September 1997, the Company entered into a five-year license and collaboration agreement with Novo Nordisk A/S (now known as Novozymes A/S) to use the Company’s MolecularBreeding directed evolution
62
Table of Contents
MAXYGEN, INC.
NOTES TO CONSOLIDATED FINANCIAL STATEMENTS—(Continued)
platform to develop products in specific industrial enzyme fields. In November 2001, the companies expanded the market areas addressed by the existing industrial enzymes collaboration. Under the terms of the expanded relationship, Novozymes is licensed to use the Company’s MolecularBreeding directed evolution platform for additional industrial enzyme applications. The Company received research funding, certain minimum royalty payments, and may receive royalty payments on the sales of products developed under the agreement and on the sale of products in the expanded industrial enzyme market areas, if any. This collaboration was assigned to Codexis in connection with its capitalization in March 2002. The funded research term of the collaboration ended in December 2003.
| 4. | Roche Factor VII Collaboration |
In December 2005, the Company formed a strategic alliance with Roche to collaborate on the global development and commercialization of the Company’s portfolio of next-generation recombinant factor VII products for multiple acute bleeding indications. Factor VII is a natural protein with a pivotal role in blood coagulation and clotting. The collaboration will initially focus on the development of lead candidates for the treatment of uncontrolled bleeding in trauma and intracerebral hemorrhage (ICH).
Under the terms of the collaboration, the Company and Roche have agreed to share the costs of worldwide research and development activities in connection with the development of the factor VII product candidates. The Company has agreed to lead early stage clinical development of these product candidates and Roche has agreed to lead late stage clinical development. Roche has exclusive worldwide rights to commercialize the factor VII products subject to the collaboration. The Company has retained rights for the development of factor VII products for hemophilia.
The Company received an upfront fee of $8 million and could receive future event-based payments totaling $87 million based on the achievement of certain development milestones, including up to $17 million for pre-clinical milestones and up to $70 million for development and other milestones. The Company is also eligible to receive royalties on sales of the factor VII products subject to the collaboration. In the United States, the Company has the option to co-fund marketing activities in exchange for increased royalty amounts.
| 5. | Technology Licenses and Research Agreements |
The Company has entered into several research agreements to fund research at universities and other research collaborators. These agreements are generally cancelable by either party upon written notice and may be extended by mutual consent of both parties. Research and development expenses are recognized as the related services are performed, generally ratably over the period of the service. Expenses under these agreements were approximately $2.3 million in 2003, $1.3 million in 2004 and $1.5 million in 2005.
63
Table of Contents
MAXYGEN, INC.
NOTES TO CONSOLIDATED FINANCIAL STATEMENTS—(Continued)
| 6. | Properties and Equipment |
Property and equipment consisted of the following (in thousands):
| December 31, | ||||||||
| 2004 | 2005 | |||||||
Leasehold improvements | $ | 6,526 | $ | 3,688 | ||||
Machinery and laboratory equipment | 18,144 | 14,033 | ||||||
Computer equipment and software | 2,650 | 2,527 | ||||||
Furniture and fixtures | 1,211 | 1,211 | ||||||
| 28,531 | 21,459 | |||||||
Less accumulated depreciation and amortization | (20,854 | ) | (17,391 | ) | ||||
Property and equipment, net | $ | 7,677 | $ | 4,068 | ||||
| 7. | Equipment Financing |
In February 2004, Codexis entered into an equipment financing agreement with a financing company for up to $4.8 million of equipment purchases. The financing agreement expired on March 31, 2005. The equipment loans will be repaid over 48 months from the date of each drawdown at an interest rate tied to the prime lending rate at the time of each drawdown. The loans are secured by the related equipment. In connection with this financing agreement, Codexis issued to the financing company a warrant to purchase 46,176 shares of Codexis’ common stock at $0.40 per share which was expensed upon issuance. Any obligations under this equipment financing agreement are solely obligations of Codexis and repayments are to be made solely from assets of Codexis.
| 8. | Commitments |
The Company has entered into various operating leases for its facilities and certain computer equipment and material contracts. The leases expire on various dates through 2007. The facilities leases also include scheduled rent increases. The scheduled rent increases are recognized on a straight-line basis over the term of the leases. The material contracts expire on various dates through 2008.
Minimum annual rental commitments under operating leases are as follows (in thousands):
Year Ending December 31, | |||
2006 | $ | 4,670 | |
2007 | 499 | ||
2008 | 167 | ||
Thereafter | — | ||
| $ | 5,336 | ||
Total rent expense was $4.7 million in 2003, $4.0 million in 2004 and $2.3 million in 2005.
| 9. | Stockholders’ Equity |
Codexis Redeemable Convertible Preferred Stock
On September 13, 2002, Codexis sold $15 million of Codexis series B convertible preferred stock to investors, of which, $5 million was purchased by the Company and $10 million was purchased by several
64
Table of Contents
MAXYGEN, INC.
NOTES TO CONSOLIDATED FINANCIAL STATEMENTS—(Continued)
unrelated investors. On October 1, 2002, Codexis sold an additional $10 million of series B convertible preferred stock to unrelated investors. Series B convertible preferred stock includes a redemption provision, which provides that the holders of at least a majority of the outstanding shares of this series B convertible preferred stock (excluding the series B convertible preferred stock held by the Company and its affiliates), voting together as a separate class, may require Codexis to redeem the series B convertible preferred stock. The redemption price for each share will be payable in cash in exchange for the shares of series B convertible preferred stock to be redeemed at a sum equal to the applicable original issue price per share plus five percent (5%) of the original issue price per year from the original issue date until the applicable redemption date, plus declared and unpaid dividends. Notice of redemption can be given at any time on or after the fifth anniversary of the original issue date. In connection with these redemption rights, the Company has recorded accretion of the redemption premium for the series B convertible preferred stock, excluding the shares owned by the Company, in the amount of $1.3 million, $1.0 and $167,000 million for the years ended December 31, 2003, 2004 and 2005, respectively. The accretion is recorded as subsidiary preferred stock accretion on the Consolidated Statement of Operations and as a reduction of additional paid-in capital and an increase to minority interest on the Consolidated Balance Sheets. Any obligation to make redemption payments is solely an obligation of Codexis and any payments are to be made solely from assets of Codexis.
Codexis Convertible Preferred Stock
In July 2004, in conjunction with entry into a research collaboration between Codexis and Pfizer, Pfizer purchased $10 million of Codexis series C convertible preferred stock. This series of convertible preferred stock does not have a redemption provision.
Maxygen Preferred Stock
The Company is authorized, subject to limitations prescribed by Delaware law, to provide for the issuance of preferred stock in one or more series, to establish from time to time the number of shares included within each series, to fix the rights, preferences and privileges of the shares of each wholly unissued series and any qualifications, limitations or restrictions thereon, and to increase or decrease the number of shares of any such series (but not below the number of shares of such series then outstanding) without any further vote or action by the stockholders.
Codexis Stock Option Exchange Program
On November 14, 2002, the Company and Codexis extended offers to eight employees working for Codexis to exchange certain of their existing Company stock options for Codexis stock options to be granted to them six months and one day after the termination of their exchanged Company stock options. The exchange offers were voluntary and allowed each of the eight employees to choose to accept the exchange or retain all their Company stock options. Each exchange offer was customized to the option holdings of the individual employee. The exchange offers were extended to the eight employees to better align the interests of the employees with the success of the newly formed Codexis.
All eight affected employees accepted the exchange offer and were granted new Codexis stock options on May 16, 2003 with exercise prices of $0.40 per share representing the fair value of Codexis’ common stock on the date of grant. The new options were granted under the terms and conditions of the Codexis 2002 Stock Plan.
The total number of the Company’s shares underlying options terminated under the exchange offers was 381,128. The total number of shares underlying Codexis options granted under the exchange offers was 983,000. The average exercise price per share of the Company’s options that were cancelled was $20.80.
65
Table of Contents
MAXYGEN, INC.
NOTES TO CONSOLIDATED FINANCIAL STATEMENTS—(Continued)
401(k) Savings Plan
The Company has a savings plan that qualifies as a deferred salary arrangement under Section 401(k) of the Internal Revenue Code (the “401(k) Plan”). Under the 401(k) Plan, participating employees may defer a percentage (not to exceed 100%) of their eligible pretax earnings up to the Internal Revenue Service’s annual contribution limit. All employees on the United States payroll of the Company age 18 years or older are eligible to participate in the 401(k) Plan. The Company has not been required to contribute to the 401(k) Plan, but beginning in 2001 elected to match contributions of its participating employees in an amount up to a maximum of the lesser of (i) 50% of the employee’s 401(k) yearly contribution or (ii) 6% of the employee’s yearly base salary. The matching contribution is made in the form of newly issued shares of Company common stock as of each June 30 and December 31. All matching contributions vest immediately. The Company may discontinue such matching contributions at any time. The fair value of the Company’s matching contribution to the 401(k) Plan was $522,000 in 2003, $443,000 in 2004 and $350,000 in 2005.
1997 Stock Option Plan
The Company’s stockholders approved the 1997 Stock Option Plan (the “1997 Plan”) on March 30, 1997 and approved amendments to the 1997 Plan on May 25, 2000 and May 31, 2002. Pursuant to the 1997 Plan, the board of directors may issue incentive stock options to employees, including officers and members of the board of directors who are also employees, and nonqualified stock options to employees, officers, directors, consultants, and advisors of the Company. No options may be granted under the 1997 Plan after March 1, 2007. Under the 1997 Plan, incentive options to purchase Company common stock may be granted to employees at prices not lower than fair value on the date of grant, as determined by the board of directors. Nonstatutory options (options that do not qualify as incentive options) may be granted to key employees, including directors and consultants, at prices not lower than 85% of fair value on the date of grant (110% in certain cases), as determined by the board of directors. The maximum term of the options granted under the 1997 Plan is ten years. Options generally vest over four years (generally vesting at a rate of 25% at the end of each year for grants made prior to January 1, 2002 and for grants made after January 1, 2002, one installment of 25% at the end of the first year and monthly for the three years thereafter). In addition, a number of grants made in 2003 vest over three years, 16.67% on July 1, 2003 and monthly for the two and a half years thereafter. The 1997 Plan provides for annual increases in the number of shares available for issuance on the first day of each year equal to the lesser of (i) 1,500,000 shares, (ii) 4% of the outstanding shares on the date of the annual increase, or (iii) an amount determined by the board of directors. At December 31, 2005, 4,919,626 shares remained available for future option grants under the 1997 Plan.
1999 Nonemployee Directors Stock Option Plan
The Company’s stockholders approved the 1999 Nonemployee Directors Stock Option Plan (the “Directors’ Plan”) on December 14, 1999. The Directors’ Plan reserves a total of 300,000 shares of common stock for issuance thereunder. Each nonemployee director who becomes a Company director is automatically granted a nonstatutory stock option to purchase 20,000 shares of common stock on the date upon which such person first becomes a director. At the first board meeting immediately following each annual stockholders’ meeting, each non-employee director is automatically granted a nonstatutory option to purchase 5,000 shares of common stock. The exercise price of options under the Directors’ Plan is equal to the fair market value of the common stock on the date of grant. Options have a term of ten years. Generally, each initial grant under the Directors’ Plan vests as to 25% of the shares subject to the option at the end of each year. Each subsequent grant generally vests in full one year after the date of grant. The Directors’ Plan will terminate in September 2009, unless terminated earlier in accordance with the provisions of the Directors’ Plan. At December 31, 2005, 120,000 shares remained available for future option grants under the Directors’ Plan.
66
Table of Contents
MAXYGEN, INC.
NOTES TO CONSOLIDATED FINANCIAL STATEMENTS—(Continued)
2000 International Stock Option Plan
The board of directors adopted the 2000 International Stock Option Plan (the “International Plan”) on April 10, 2000 and amended it on March 1, 2001. The International Plan has not been approved by the Company’s stockholders as no such approval is required. Under the International Plan, the board of directors may issue nonqualified stock options to employees, directors and consultants of non-U.S. subsidiaries of the Company. No options may be granted under the International Plan after April 10, 2010. Under the International Plan, nonstatutory options may be granted at prices not lower than 85% of fair value at the date of grant (except in the case of replacement options in the context of acquisitions), as determined by the board of directors. The maximum term of the options granted under the International Plan is ten years. Options vest and become exercisable pursuant to a vesting schedule, generally either at a rate of 25% at the end of each year for grants made prior to January 1, 2002, or for grants made in 2002, one installment of 25% at the end of the first year and monthly for the three years thereafter. In addition, a number of grants made in 2003 vest over three years, 16.67% on July 1, 2003 and monthly for the two and a half years thereafter. The International Plan also provides for annual increases in the number of shares available for issuance on the first day of each year equal to 0.6% of the outstanding shares on the date of the annual increase, or a lower amount determined by the board of directors. At December 31, 2005, 1,722,176 shares remained available for future option grants under the International Plan.
2000 Non-Officer Employee Stock Option Plan
The board of directors adopted the 2000 Non-Officer Stock Option Plan (the “Non-Officer Plan”) on December 6, 2000. The Non-Officer Plan has not been approved by the Company’s stockholders as no such approval is required. Under the Non-Officer’s Plan the board of directors may issue nonqualified stock options to employees (other than executive officers and stockholders owning 10% or more of the Company’s common stock) and consultants of the Company or any of its affiliates. No options may be granted under the Non-Officer Plan after December 6, 2010. Under the Non-Officer Plan, nonstatutory options may be granted at prices not lower than 85% of fair value at the date of grant (except in the case of replacement options in the context of acquisitions), as determined by the board of directors. The maximum term of the options granted under the Non-Officer Plan is ten years. Options vest and become exercisable pursuant to a vesting schedule, generally either at a rate of 25% at the end of each year for grants made prior to January 1, 2002, or for grants made after January 1, 2002, one installment of 25% at the end of the first year and monthly for the three years thereafter. In addition, a number of grants made in 2003 vest over three years, 16.67% on July 1, 2003 and monthly for the two and a half years thereafter. The Non-Officer Plan provides for annual increases in the number of shares available for issuance on the first day of each year equal to the greater of (i) 250,000 shares and (ii) 0.7% of the outstanding shares on the date of the annual increase, or a lower amount determined by the board of directors. At December 31, 2005, 1,174,424 shares remained available for future option grants under the Non-Officer Plan.
67
Table of Contents
MAXYGEN, INC.
NOTES TO CONSOLIDATED FINANCIAL STATEMENTS—(Continued)
Activity under the 1997 Plan, the Directors’ Plan, the International Plan and the Non-Officer Plan (collectively, the “Plans”) was as follows:
| Options Outstanding | |||||||||
Shares Available | Number of Shares | Weighted- Average Exercise Price Per Share | |||||||
Balance at December 31, 2002 | 4,446,550 | 8,431,325 | $ | 21.98 | |||||
Shares authorized | 1,837,203 | — | — | ||||||
Options granted | (2,897,869 | ) | 2,897,869 | $ | 8.51 | ||||
Options exercised | — | (223,054 | ) | $ | 5.38 | ||||
Options canceled | 1,542,875 | (1,542,875 | ) | $ | 24.50 | ||||
Balance at December 31, 2003 | 4,928,759 | 9,563,265 | $ | 17.79 | |||||
Shares authorized | 1,855,849 | — | — | ||||||
Options granted | (1,567,791 | ) | 1,567,791 | $ | 10.07 | ||||
Options exercised | — | (700,831 | ) | $ | 7.12 | ||||
Options canceled | 1,519,344 | (1,519,344 | ) | $ | 18.40 | ||||
Balance at December 31, 2004 | 6,736,161 | 8,910,881 | $ | 17.19 | |||||
Shares authorized | 1,889,270 | — | — | ||||||
Options granted | (2,132,290 | ) | 2,132,290 | $ | 9.34 | ||||
Options exercised | — | (198,487 | ) | $ | 4.06 | ||||
Options canceled | 1,443,085 | (1,443,085 | ) | $ | 14.31 | ||||
Balance at December 31, 2005 | 7,936,226 | 9,401,599 | $ | 16.13 | |||||
The options outstanding and exercisable under the Plans at December 31, 2005 are as follows:
| Options Outstanding | Options Exercisable | |||||||||||
| Exercise Price Range | Number | Weighted- Average Remaining Contractual Life (in Years) | Weighted- Average Exercise Price | Number | Weighted- Average Exercise Price | |||||||
| $0.20–$0.30 | 111,250 | 2.2 | $ | 0.27 | 111,250 | $ | 0.27 | |||||
| $0.50–$0.75 | 249,824 | 3.6 | $ | 0.72 | 249,824 | $ | 0.72 | |||||
| $6.74–$9.95 | 3,460,004 | 7.9 | $ | 7.69 | 2,125,957 | $ | 7.68 | |||||
| $10.22–$15.75 | 3,923,744 | 7.0 | $ | 11.86 | 2,783,789 | $ | 11.98 | |||||
| $15.84–$19.40 | 234,125 | 5.5 | $ | 17.87 | 234,026 | $ | 17.87 | |||||
| $21.56–$32.00 | 389,190 | 4.9 | $ | 29.50 | 389,190 | $ | 29.50 | |||||
| $41.81–$62.00 | 985,462 | 4.5 | $ | 55.63 | 985,462 | $ | 55.63 | |||||
| $162.50 | 48,000 | 4.2 | $ | 162.50 | 48,000 | $ | 162.50 | |||||
| 9,401,599 | 6.8 | $ | 16.13 | 6,927,498 | $ | 18.50 | ||||||
Options exercisable at December 31, 2003 and 2004 were 5,112,140 and 5,710,914, respectively.
The weighted-average grant date fair value of options granted was $4.30 in 2003, $4.93 in 2004 and $5.28 in 2005.
68
Table of Contents
MAXYGEN, INC.
NOTES TO CONSOLIDATED FINANCIAL STATEMENTS—(Continued)
1999 Employee Stock Purchase Plan
The Company’s stockholders approved the 1999 Employee Stock Purchase Plan (the “ESPP”) on December 14, 1999. The ESPP is intended to qualify as an employee stock purchase plan under Section 423 of the Internal Revenue Code. A total of 400,000 shares of the Company’s common stock were initially reserved for issuance under the ESPP. The ESPP permits eligible employees to purchase common stock at a discount, but only through payroll deductions, during defined offering periods. The price at which stock is purchased under the ESPP is equal to 85% of the lower of (i) the fair market value of the common stock on the first day of the offering period or (ii) the fair market value of the common stock on the purchase date. In addition, the ESPP provides for annual increases in the number of shares available for issuance under the purchase plan on the first day of each year, beginning January 1, 2001, equal to the lesser of 200,000 shares, 0.75% of the outstanding shares on the date of the annual increase, or a lower amount determined by the board of directors. The ESPP will terminate in September 2019, unless terminated earlier in accordance with the provisions of the ESPP. The initial offering period commenced on December 16, 1999 and the first purchase under the ESPP occurred on September 29, 2000 when 67,540 shares of common stock were purchased. In 2003, 2004 and 2005, 99,441 shares, 62,700 shares and 37,966 shares of common stock were purchased pursuant to the ESPP, respectively. The weighted average fair value of purchase rights granted during the year was $3.06 in 2003, $1.02 in 2004 and $2.01 in 2005. At December 31, 2005, 895,002 shares remained available for purchase under the ESPP.
Fair value disclosures
Pro forma net loss information is required to be disclosed by SFAS 123 and has been determined as if the Company has accounted for its employee stock options and common stock purchase rights under the fair market value method of that statement.
For 2003, 2004 and 2005, the Company calculated the fair value using the Black-Scholes option pricing model. The following assumptions were used:
2003 | 2004 | 2005 | ||||
Expected dividend yield | 0% | 0% | 0% | |||
Risk-free interest rate range—Options | 1.84% to 2.81% | 2.75% to 3.51% | 3.71% to 4.39% | |||
Risk-free interest rate range—ESPP | 3.33% to 5.28% | 2.75% to 4.45% | 1.23% to 3.38% | |||
Expected life—Options | 4 years | 4 years | 4 years | |||
Expected life—ESPP | 0.7 years | 0.9 years | 0.7 years | |||
Expected volatility | 0.6 | 0.6 | 0.5 |
Options granted to consultants are periodically re-valued as they vest in accordance with SFAS 123 and EITF 96-18 using a Black-Scholes model and the following weighted-average assumptions for 2003: estimated volatility of 0.6, risk-free interest rates of 4.0% to 5.2%, no dividend yield, and an expected life of the option equal to the full term, generally ten years from the date of grant. The assumptions for 2004: estimated volatility of 0.6, risk-free interest rates of 4.0% to 5.2%, no dividend yield, and an expected life of the option equal to the full term, generally ten years from the date of grant. The assumptions for 2005: estimated volatility of 0.6, risk-free interest rates of 3.78% to 3.99%, no dividend yield, and an expected life of the option equal to the full term, generally ten years from the date of grant. The Company recorded total compensation expense of $57,000 in 2003, $48,000 in 2004 and $102,000 in 2005 related to the Black-Scholes revaluation of options grants to consultants. Stock compensation expense relating to the acceleration of stock options was immaterial for 2003, 2004 and 2005.
During the years ended December 31, 1997, 1998 and 1999, in connection with the grant of certain stock options to employees, the Company recorded deferred stock compensation of $2.6 million, $2.4 million and
69
Table of Contents
MAXYGEN, INC.
NOTES TO CONSOLIDATED FINANCIAL STATEMENTS—(Continued)
$19.5 million, respectively, representing the difference between the exercise price and the deemed fair value of the Company’s common stock for financial reporting purposes on the date such stock options were granted. Deferred compensation is included as a reduction of stockholders’ equity and was amortized to expense using a graded vesting method. During the years ended December 31, 2003 and 2004, the Company recorded amortization of deferred stock compensation expense of approximately $1.1 million and $237,000 respectively. The deferred compensation relating to such option grants was fully amortized by December 31, 2004.
In addition, the Company recorded $14.6 million of deferred compensation in 2000 upon the exchange of outstanding Maxygen ApS warrants and the exchange of restricted stock with founders in connection with the August 2000 acquisition of Maxygen ApS. The deferred compensation was amortized over the vesting term of the options. The deferred compensation relating to the restricted stock was amortized using the graded vesting method. A total of $852,000 of deferred compensation expense was recognized in the year ended December 31, 2003 in connection with the Maxygen ApS exchange. The deferred compensation relating to the restricted stock was fully amortized in 2003.
Common Stock
At December 31, 2003, there were 41,614 shares of common stock outstanding subject to the Company’s lapsing right of repurchase at a weighted-average price of $0.75. There were no shares of common stock outstanding subject to the Company’s lapsing right of repurchase as of December 31, 2004 or 2005.
At December 31, 2005, the Company had reserved shares of common stock for future issuance as follows:
2000 Non-Officer Employee Stock Option Plan | 3,881,374 | |
2000 International Stock Option Plan | 2,776,296 | |
1999 Employee Stock Purchase Plan | 895,002 | |
1999 Nonemployee Directors Stock Option Plan | 300,000 | |
1997 Stock Option Plan | 10,380,155 | |
| 18,232,827 | ||
| 10. | Intangible Assets |
In connection with the Maxygen ApS acquisition in 2000, the Company allocated $22.7 million to goodwill and $3.4 million to other intangible assets. Intangible assets subject to amortization consist of purchased core technology that had been fully amortized as of December 31, 2003. The annual amortization expense for these intangible assets was $698,000 for the year ended December 31, 2003 and zero for the years ended December 31, 2005 and 2005.
Prior to adoption of SFAS 142, the Company amortized a portion of the goodwill each year. As of December 31, 2001, the net goodwill balance was $12.2 million. The Company must perform an impairment test of recorded goodwill at least annually. Any impairment loss from the annual test will be recognized as a part of operations. The Company completed its annual impairment test as of October 1, 2003, October 1, 2004 and October 1, 2005, which did not result in a determination of recorded goodwill being impaired.
70
Table of Contents
MAXYGEN, INC.
NOTES TO CONSOLIDATED FINANCIAL STATEMENTS—(Continued)
| 11. | Income Taxes |
Worldwide loss from continuing operations before provision for income taxes consists of the following (in thousands):
| Year Ended December 31, | ||||||||||||
| 2003 | 2004 | 2005 | ||||||||||
United States | $ | (20,267 | ) | $ | (27,303 | ) | $ | (7,445 | ) | |||
Foreign | (10,603 | ) | (21,783 | ) | (27,607 | ) | ||||||
Loss from continuing operations | $ | (30,870 | ) | $ | (49,086 | ) | $ | (35,052 | ) | |||
No income tax expense was recorded from continuing operations for the years ended December 31, 2003, 2004 and 2005.In 2004, the Company reported taxable income due to the Company’s sale of Verdia. The Company utilized prior year federal and state net operating loss carryforwards to reduce the federal and state taxable income to zero for regular tax purposes, however, for federal purposes, was subject to alternative minimum tax of approximately $921,000 and has reported an income tax provision of $921,000. This amount has been netted against the gain on sale of Verdia and is reflected in gain on sale of discontinued operations in the Consolidated Statement of Operations. In 2003 and prior, there has been no provision for U.S. federal, U.S. state or foreign income taxes for any period as the Company has incurred operating losses in all prior periods and for all jurisdictions. The Company’s total deferred tax assets have decreased due to the utilization of the prior year federal and state net operating losses used to offset the gain from the sale of Verdia and the loss of the unutilized tax assets of Verdia at the time of sale. Therefore, there is a corresponding decrease in the valuation allowance to fully offset the deferred tax assets.
Deferred income taxes reflect the net tax effects of temporary differences between the carrying amounts of assets and liabilities for financial reporting purposes and the amounts used for income tax purposes. Significant components of the Company’s deferred tax assets are as follows (in thousands):
| December 31, | ||||||||
| 2004 | 2005 | |||||||
Net operating loss carryforwards | $ | 17,800 | $ | 12,757 | ||||
Research credits | 4,500 | 5,000 | ||||||
Capitalized research | 5,500 | 5,297 | ||||||
Investment in subsidiary | — | 3,979 | ||||||
Other | 5,500 | 4,181 | ||||||
Total deferred tax assets | 33,300 | 31,214 | ||||||
Valuation allowance | (33,300 | ) | (31,214 | ) | ||||
Net deferred tax assets | $ | — | $ | — | ||||
Realization of deferred tax assets is dependent upon future earnings, if any, the timing and amount of which are uncertain. Accordingly, the net deferred tax assets have been fully offset by a valuation allowance at December 31, 2004 and 2005. Deferred tax assets and the associated valuation allowance increased by $12.0 million during 2003. The valuation allowance decreased by $10.2 million and $2.1million during 2004 and 2005, respectively.
As of December 31, 2005, the Company had net operating loss carryforwards for federal income tax purposes of approximately $34.7 million, which expire in the years 2022 through 2025 and federal research and
71
Table of Contents
MAXYGEN, INC.
NOTES TO CONSOLIDATED FINANCIAL STATEMENTS—(Continued)
development tax credit carryforwards of approximately $2.3 million, which expire in the years 2012 through 2025. As of December 31, 2005, the Company had net operating loss carryforwards for state income tax purposes of approximately $10.5 million that expire in 2015 and state research and development tax credits of approximately $2.4 million that have no expiration date.
Approximately $5.4 million of the valuation allowance for deferred tax assets relates to benefits of stock options deductions that, when recognized, will be allocated directly to additional paid-in capital.
Utilization of the Company’s net operating loss carryforwards may be subject to substantial annual limitation due to the ownership change limitations provided by the Internal Revenue Code and similar state provisions. Such an annual limitation could result in the expiration of the net operating loss carryforwards before utilization.
A reconciliation of income taxes at the statutory federal income tax rate to income taxes included in the Consolidated Statements of Operations is as follows (in thousands):
| December 31, | ||||||||||||
| 2003 | 2004 | 2005 | ||||||||||
U.S. federal taxes (benefit) | ||||||||||||
At statutory rate | $ | (10,805 | ) | $ | (17,180 | ) | $ | (12,269 | ) | |||
State taxes (net of federal) | (634 | ) | (2,893 | ) | (1,965 | ) | ||||||
Non-deductible deferred compensation | 219 | — | — | |||||||||
Unutilized net operating losses | 3,711 | 7,624 | 10,120 | |||||||||
Other | (3,845 | ) | (1,149 | ) | (801 | ) | ||||||
Change in valuation allowance | 11,354 | 13,598 | 4,915 | |||||||||
Total | $ | — | $ | — | $ | — | ||||||
| 12. | Litigation |
In December 2001, a lawsuit was filed in the U.S. District Court for the Southern District of New York against the Company, its chief executive officer, Russell Howard, and its chief financial officer at the time of the initial public offering, Simba Gill, together with certain underwriters of the Company’s initial public offering and secondary public offering of common stock. The complaint, which alleges claims under Sections 11, 12(a)(2) and 15 of the Securities Act of 1933 and Section 10(b) of the Securities Exchange Act of 1934, is among the so-called “laddering” cases that have been commenced against over 300 companies that had public offerings of securities in 1999 and 2000. The complaint has been consolidated with other laddering claims in a proceeding styledIn re Initial Public Offering Securities Litigation, No. 21 MC 92 (SAS), pending before the Honorable Shira A. Scheindlin. In February 2003, the court dismissed the Section 10(b) claim against Drs. Howard and Gill; the remainder of the case remains pending.
In June 2003, the Company agreed to the terms of a tentative settlement agreement along with other defendant issuers inIn re Initial Public Offering Securities Litigation. The tentative settlement provides that the insurers of the 309 defendant issuers will pay to the plaintiffs $1 billion, less any recovery of damages the plaintiffs receive from the defendant underwriters. If the plaintiffs receive over $5 billion in damages from the defendant underwriters, the Company will be entitled to reimbursement of various expenses incurred by it as a result of the litigation. As part of the tentative settlement, the Company will assign to the plaintiffs “excess compensation claims” and certain other of its claims against the defendant underwriters based on the alleged actions of the defendant underwriters. The settlement is subject to acceptance by a substantial majority of
72
Table of Contents
MAXYGEN, INC.
NOTES TO CONSOLIDATED FINANCIAL STATEMENTS—(Continued)
defendants and execution of a definitive settlement agreement. The settlement is also subject to approval of the Court, which cannot be assured. On February 15, 2005, the Court tentatively approved the proposed settlement, conditioned upon the parties altering the proposed settlement to comply with the Private Securities Litigation Reform Act’s settlement discharge provision. The settlement does not contemplate any settlement payments by the Company.
If the settlement is not accepted by the requisite number of defendants or if it is not approved by the Court, the Company intends to defend the lawsuit vigorously. The Company believes the lawsuit against the Company and its officers is without merit. However, the litigation is in the preliminary stage, and the Company cannot predict its outcome. The litigation process is inherently uncertain. If the outcome of the litigation is adverse to the Company and if the Company is required to pay significant damages, the Company’s business would be significantly harmed.
The Company is not currently a party to any other material pending legal proceedings.
From time to time, the Company becomes involved in claims and legal proceedings that arise in the ordinary course of its business. The Company does not believe that the resolution of these claims will have a material adverse effect on its financial statements.
| 13. | Segment Information |
On July 1, 2004, the Company sold Verdia, the sole component of its agriculture segment, to Pioneer Hi-Bred International, Inc., a wholly-owned subsidiary of E.I. du Pont de Nemours and Company. The operations of Verdia prior to its sale are reflected in the Company’s financial statements as discontinued operations. Thus the agriculture segment data provided in earlier reports is now reflected as discontinued operations (see Note 15). On February 28, 2005, the Company’s voting interests in Codexis fell below 50% and from such time Codexis ceased to be a consolidated subsidiary of the Company. Accordingly, the financial position of Codexis is included in the Consolidated Balance Sheet as of December 31, 2004, but excluded from the December 31, 2005 Consolidated Balance Sheet, and the results of operations of Codexis are included in the consolidated results presented below only until February 28, 2005. Thereafter the Company’s investment in Codexis is reflected under the equity method of accounting. The Company has determined its reportable operating segments based upon how the business is managed and operated. The accounting policies of the segments described above are the same as those described in Note 1. Corporate administrative costs are generally allocated based on headcount.
73
Table of Contents
MAXYGEN, INC.
NOTES TO CONSOLIDATED FINANCIAL STATEMENTS—(Continued)
Segment Earnings
| Human Therapeutics | Chemicals (Codexis) | Maxygen, Inc. Consolidated | ||||||||||
| (in thousands) | ||||||||||||
2003 | ||||||||||||
Segment loss | $ | (25,655 | ) | $ | (7,279 | ) | $ | (32,934 | ) | |||
Stock compensation | (1,983 | ) | (8 | ) | (1,991 | ) | ||||||
Amortization of intangibles | (698 | ) | — | (698 | ) | |||||||
Interest income and other (expense), net | 4,952 | 301 | 5,253 | |||||||||
Equity in losses of minority investee | (500 | ) | — | (500 | ) | |||||||
Loss from continuing operations | (23,884 | ) | (6,986 | ) | (30,870 | ) | ||||||
Subsidiary preferred stock accretion | — | (1,279 | ) | (1,279 | ) | |||||||
Loss applicable to common stockholders—continuing operations | $ | (23,884 | ) | $ | (8,265 | ) | $ | (32,149 | ) | |||
2004 | ||||||||||||
Segment loss | $ | (38,113 | ) | $ | (13,278 | ) | $ | (51,391 | ) | |||
Stock compensation | (325 | ) | (30 | ) | (355 | ) | ||||||
Interest income and other (expense), net | 3,943 | 112 | 4,055 | |||||||||
Equity in losses of minority investee | (1,395 | ) | — | (1,395 | ) | |||||||
Loss from continuing operations | (35,890 | ) | (13,196 | ) | (49,086 | ) | ||||||
Subsidiary preferred stock accretion | — | (1,000 | ) | (1,000 | ) | |||||||
Loss applicable to common stockholders—continuing operations | $ | (35,890 | ) | $ | (14,196 | ) | $ | (50,086 | ) | |||
2005 | ||||||||||||
Segment loss | $ | (39,116 | ) | $ | (1,325 | ) | $ | (40,441 | ) | |||
Stock compensation | (183 | ) | — | (183 | ) | |||||||
Interest income and other (expense), net | 5,552 | 20 | 5,572 | |||||||||
Equity in losses of minority investee | — | — | — | |||||||||
Loss from continuing operations | (33,747 | ) | (1,305 | ) | (35,052 | ) | ||||||
Cumulative effect of change in accounting principle | 16,616 | — | 16,616 | |||||||||
Subsidiary preferred stock accretion | — | (167 | ) | (167 | ) | |||||||
Loss applicable to common stockholders | $ | (17,131 | ) | $ | (1,472 | ) | $ | (18,603 | ) | |||
In 2003, depreciation expense for the two segments was $4,755,000 for human therapeutics and $1,295,000 for chemicals. In 2004, depreciation expense for the two segments was $4,648,000 for human therapeutics and $1,512,000 for chemicals. In 2005, depreciation expense for the two segments was $3,268,000 for human therapeutics and $262,000 for chemicals. The operations of Codexis are not included in the consolidated operations of the Company after February 28, 2005.
74
Table of Contents
MAXYGEN, INC.
NOTES TO CONSOLIDATED FINANCIAL STATEMENTS—(Continued)
Segment Revenue
Revenues for each operating segment are derived from the Company’s research collaboration agreements and government grants and are categorized based on the industry of the product or technology under development. On February 28, 2005, the Company’s voting interests in Codexis fell below 50% and from such time Codexis ceased to be a consolidated subsidiary of the Company. Thus, the revenues of Codexis are included in the consolidated results presented below only until February 28, 2005 and thereafter the Company’s investment in Codexis is reflected under the equity method of accounting. The following table presents revenues for each reporting segment (in thousands):
| Year Ended December 31, | |||||||||
| 2003 | 2004 | 2005 | |||||||
| (in thousands) | |||||||||
Human therapeutics | $ | 14,430 | $ | 11,555 | $ | 12,991 | |||
Chemicals (through February 28, 2005) | 8,425 | 4,720 | 1,510 | ||||||
Total revenue | $ | 22,855 | $ | 16,275 | $ | 14,501 | |||
Identifiable Assets and Acquisition of Property and Equipment
The following table presents identifiable assets for each reporting segment:
| December 31, | ||||||
| 2004 | 2005 | |||||
| (in thousands) | ||||||
Human therapeutics | $ | 240,372 | $ | 214,523 | ||
Chemicals | 22,733 | — | ||||
Total assets | $ | 263,105 | $ | 214,523 | ||
The following table presents acquisition of property and equipment for each reporting segment:
| December 31, | ||||||
| 2004 | 2005 | |||||
| (in thousands) | ||||||
Human therapeutics | $ | 1,065 | $ | 1,430 | ||
Chemicals (through February 28, 2005) | 1,494 | 810 | ||||
Total acquisitions | $ | 2,559 | $ | 2,240 | ||
75
Table of Contents
MAXYGEN, INC.
NOTES TO CONSOLIDATED FINANCIAL STATEMENTS—(Continued)
Human Therapeutics
On February 28, 2005, the Company’s voting interests in Codexis fell below 50% and from such time Codexis ceased to be a consolidated subsidiary of the Company. Accordingly, the results of operations of Codexis are included in the consolidated results presented in the consolidated statements of operations only until February 28, 2005. Presented below are the results of operations for the Human Therapeutics business on a stand-alone basis:
| Year Ended December 31, | ||||||||||||
| 2003 | 2004 | 2005 | ||||||||||
| (in thousands) | ||||||||||||
Revenues | ||||||||||||
Collaborative research and development revenue | $ | 12,149 | $ | 9,613 | $ | 10,084 | ||||||
Grant revenue | 2,282 | 1,942 | 2,907 | |||||||||
Total revenues | 14,431 | 11,555 | 12,991 | |||||||||
Operating Expenses: | ||||||||||||
Research and development | 30,496 | 37,830 | 39,255 | |||||||||
General and administrative | 9,590 | 11,838 | 12,852 | |||||||||
Stock compensation expense | 1,983 | 325 | 183 | |||||||||
Amortization of intangible assets | 697 | — | — | |||||||||
Total operating expenses | 42,767 | 49,993 | 52,290 | |||||||||
Loss from operations | (28,336 | ) | (38,438 | ) | (39,299 | ) | ||||||
Interest income and other (expense), net | 4,952 | 3,943 | 5,552 | |||||||||
Equity in losses of minority investee | (500 | ) | (1,395 | ) | — | |||||||
Loss from continuing operations | (23,884 | ) | (35,890 | ) | (33,747 | ) | ||||||
Income (loss) from discontinued operations | (1,586 | ) | (2,769 | ) | — | |||||||
Gain on sale of discontinued operations | — | 61,197 | — | |||||||||
Cumulative effect adjustment | — | — | 16,616 | |||||||||
Net income (loss) | $ | (25,470 | ) | $ | 22,538 | $ | (17,131 | ) | ||||
Geographic Information
The Company’s primary country of operation is the United States, its country of domicile. Revenues are attributed to countries based on the location of collaborators. Long-lived assets include property and equipment and intangible assets.
| Year Ended December 31, | |||||||||
| 2003 | 2004 | 2005 | |||||||
| (in thousands) | |||||||||
Revenues | |||||||||
United States | $ | 13,904 | $ | 12,220 | $ | 13,768 | |||
Denmark | 5,630 | 390 | 86 | ||||||
France | 2,082 | 2,182 | — | ||||||
Austria | 192 | 1,065 | — | ||||||
Australia | 855 | 244 | 513 | ||||||
Other foreign countries | 192 | 174 | 134 | ||||||
Total revenue | $ | 22,855 | $ | 16,275 | $ | 14,501 | |||
76
Table of Contents
MAXYGEN, INC.
NOTES TO CONSOLIDATED FINANCIAL STATEMENTS—(Continued)
| December 31, | ||||||
| 2004 | 2005 | |||||
| (in thousands) | ||||||
Long-Lived Assets | ||||||
United States | $ | 48,929 | $ | 39,726 | ||
Denmark | 5,780 | 7,911 | ||||
Total long-lived assets | $ | 54,709 | $ | 47,637 | ||
Major Customers
Major customers that represent more than 10% of total Company revenue are presented in the following table:
| 2003 | 2004 | 2005 | ||||
Human Therapeutics | ||||||
Partner A | 12.2% | 35.0% | 69.4% | |||
Partner B | 9.1% | 13.4% | — | |||
Partner C | 11.5% | 2.2% | — | |||
Partner D | 4.8% | 3.0% | — | |||
Partner E | 8.8% | — | — | |||
Chemicals | ||||||
Partner F | 13.3% | — | — | |||
| 14. | Avidia Inc. (formerly Avidia Research Institute) |
On July 15, 2003, the Company and a third party investor formed Avidia Inc. In conjunction with its initial capitalization, the Company contributed certain technology to Avidia and invested $500,000. During 2004, the Company provided a series of loans to Avidia in the aggregate amount of $1.4 million. The loan had an interest rate of 3% per annum and converted into equity securities of Avidia in 2005. The Company is not obligated to provide additional funding to Avidia. As of December 31, 2005, the Company had an equity interest of approximately 13% in Avidia, based upon the voting rights of the issued and outstanding shares of Avidia’s common and preferred stock. Until March 31, 2005, the Company’s investment in Avidia was accounted for under the equity method of accounting and the Company’s share of Avidia’s results was recorded to the extent of the Company’s accounting basis in Avidia as a component of equity in net loss of minority investee in the Consolidated Statements of Operations. In April 2005, Avidia issued additional equity securities, which lowered the Company’s ownership below 20%. Since the Company does not have the ability to exercise significant influence over Avidia’s operating and financial policies, after March 31, 2005, the Company’s investment in Avidia is being accounted for under the cost method of accounting. As of December 31, 2004 and 2005, the Company had recorded losses equal to its investment basis.
| 15. | Sale of Verdia and Discontinued Operations |
On July 1, 2004, the Company completed the sale of Verdia, its agriculture subsidiary and sole component of its agriculture segment, to Pioneer Hi-Bred International, Inc., a wholly-owned subsidiary of E.I. du Pont de Nemours and Company, for $64 million in cash, before income taxes and transaction costs of $1.4 million. Results of discontinued operations provided below reflect the results of Verdia until and including July 1, 2004.
77
Table of Contents
MAXYGEN, INC.
NOTES TO CONSOLIDATED FINANCIAL STATEMENTS—(Continued)
Verdia’s investment in DeltaMax Cotton LLC, its joint venture with Delta and Pine Land Company in which Verdia had an equity interest of 50% as of July 1, 2004, was accounted for under the equity method of accounting. As a result of the Company’s sale of Verdia on July 1, 2004, Verdia’s portion of the DeltaMax loss as of July 1, 2004 is included in the income (loss) from discontinued operations in the Consolidated Statement of Operations.
The Company has recorded a gain from the sale of Verdia as follows (in thousands):
Cash received from sale | $ | 64,000 | ||
Less: Basis in Verdia | (1,419 | ) | ||
Less: Income tax expense | (921 | ) | ||
Less: Transaction costs: | ||||
Compensation related expense | (325 | ) | ||
Legal, accounting and other fees and expenses | (138 | ) | ||
Gain on sale of discontinued operations | $ | 61,197 | ||
| 16. | Guarantees and Indemnifications |
In November 2002, the FASB issued Interpretation No. 45, “Guarantor’s Accounting and Disclosure Requirements for Guarantees, including Indirect Guarantees of Indebtedness of Others”(“FIN 45”). FIN 45 requires that upon issuance of a guarantee, the guarantor must recognize a liability for the fair value of the obligations it assumes under that guarantee.
As permitted under Delaware law and in accordance with the Company’s Bylaws, the Company indemnifies its officers and directors for certain events or occurrences, subject to certain limits, while the officer or director is or was serving at the Company’s request in such capacity. The indemnification agreements with the Company’s officers and directors terminate upon termination of their employment, but the termination does not affect claims for indemnification relating to events occurring prior to the effective date of termination. The maximum amount of potential future indemnification is unlimited; however, the Company’s director and officer insurance policy reduces the Company’s exposure and may enable the Company to recover a portion of any future amounts paid. The Company believes that the fair value of these indemnification agreements is minimal. Accordingly, the Company has not recorded any liabilities for these agreements as of December 31, 2005.
In addition, the Company customarily agrees in the ordinary course of its business to indemnification provisions in its collaboration agreements, in various agreements involving parties performing services for the Company in the ordinary course of business, and in its real estate leases. With respect to lease agreements, the indemnification provisions typically apply to claims asserted against the landlord relating to personal injury or property damage caused by the Company, to violations of law by the Company or to certain breaches of the Company’s contractual obligations. The indemnification provisions appearing in the Company’s collaboration agreements are similar, but in addition provide some limited indemnification for its collaborator in the event of third party claims alleging infringement of certain intellectual property rights. In each of the cases above, the indemnification obligation generally survives the termination of the agreement for some extended period, although the obligation typically has the most relevance during the contract term and for a short period of time thereafter. The maximum potential amount of future payments that the Company could be required to make under these provisions is generally unlimited. The Company has purchased insurance policies covering personal injury, property damage and general liability that reduce its exposure for indemnification and would enable it in many cases to recover a portion of any future amounts paid. The Company has never paid any material amounts to defend lawsuits or settle claims related to these indemnification provisions. Accordingly, the Company
78
Table of Contents
MAXYGEN, INC.
NOTES TO CONSOLIDATED FINANCIAL STATEMENTS—(Continued)
believes the estimated fair value of these indemnification arrangements is minimal. Accordingly, the Company has not recorded any liabilities for these agreements as of December 31, 2005.
17. Restructuring Charges
In June 2005, the Company implemented a plan to consolidate its organization to increase focus on development of its pharmaceutical product candidates. The consolidation reflected the Company’s strategic shift from early discovery research and collaborative partner funding to an increased focus on internal product development. The restructuring plan included a reduction of approximately 16% of the Company’s personnel over the following four months. The Company recorded severance charges of $807,000 during 2005 in connection with the restructuring. The restructuring balances are comprised entirely of cash charges and are included in operating expenses on the condensed consolidated statements of operations as follows (in thousands):
| Charges | |||
Severance costs | |||
Research and development | $ | 471 | |
General and administrative | 336 | ||
Total | $ | 807 | |
| 18. | Codexis, Inc. |
Prior to February 28, 2005, the Company’s chemicals business was operated through its consolidated subsidiary Codexis. Codexis was incorporated in January 2002, and the Company’s chemicals business was contributed to Codexis in March 2002 in exchange for all the capital stock of Codexis. Prior to its establishment as an independent company, Codexis was the chemicals business unit of the Company, which had been operating since 1997. As of February 28, 2005, the Company controlled less than 50% of the voting rights of the issued and outstanding shares of Codexis common and preferred stock. In accordance with APB 18, “The Equity Method of Accounting for Investments in Common Stock,” the Company is accounting for its investment in Codexis under the equity method of accounting after February 28, 2005. Codexis’ financial position and results of operations are included in the Company’s “Chemicals” segment through February 28, 2005 (see Note 13).
Summary statement of operations for Codexis for the years ended December 31, 2003 and 2004 and summary balance sheet data for Codexis as at December 31, 2004 is presented below (in thousands):
| For the Year Ended December 31, | ||||||||
| 2003 | 2004 | |||||||
Total revenues | $ | 8,425 | $ | 4,720 | ||||
Total operating expenses | $ | 15,712 | $ | 18,028 | ||||
Interest income and other | $ | 301 | $ | 112 | ||||
Net loss | $ | (6,986 | ) | $ | (13,196 | ) | ||
79
Table of Contents
MAXYGEN, INC.
NOTES TO CONSOLIDATED FINANCIAL STATEMENTS—(Continued)
| December 31, 2004 | ||||
Cash, cash equivalents and investments | $ | 17,248 | ||
Other current assets | 750 | |||
Property and equipment, net | 3,225 | |||
Other assets | 1,510 | |||
Total assets | $ | 22,733 | ||
Total liabilities | $ | 8,060 | ||
Redeemable convertible series B preferred stock | 27,779 | |||
Stockholders’ deficit | (13,106 | ) | ||
Total liabilities, redeemable convertible series B preferred stock and stockholders’ deficit | $ | 22,733 | ||
80
Table of Contents
| Item 9 | CHANGES IN AND DISAGREEMENTS WITH ACCOUNTANTS ON ACCOUNTING AND FINANCIAL DISCLOSURE |
Not applicable.
| Item 9A | CONTROLS AND PROCEDURES |
Our management is required to perform two evaluations each quarter, and one additional evaluation each year, in connection with its disclosure controls and procedures (“Disclosure Controls”) and its internal control over financial reporting (“Internal Control”). This Controls and Procedures section describes those evaluations, their limitations and the conclusions of our management based on such evaluations.
Controls Evaluations. Our management, with the participation of our Chief Executive Officer (“CEO”) and Chief Financial Officer (“CFO”), has (i) evaluated the effectiveness of our Disclosure Controls as of December 31, 2005, (ii) assessed the effectiveness of our Internal Control as of December 31, 2005 and (iii) evaluated whether any change in Internal Control that occurred in the most recently completed fiscal quarter has materially affected, or is reasonably likely to materially affect, our Internal Control.
CEO and CFO Certifications. Appearing as Exhibits 31.1 and 31.2 of this report are the certifications of our CEO and CFO that are required in accordance with Rule 13a-14 of the Exchange Act. This Controls and Procedures section includes the information concerning the controls evaluation referred to in the certifications and it should be read in conjunction with the certifications for a more complete understanding of the topics presented.
Definition of Disclosure Controls. Disclosure Controls are controls and procedures designed to ensure that information required to be disclosed in our reports filed under the Exchange Act, such as this report, is recorded, processed, summarized and reported within the time periods specified in the SEC’s rules and forms. Disclosure Controls are also designed to ensure that such information is accumulated and communicated to our management, including our CEO and CFO, as appropriate to allow timely decisions regarding required disclosure.
Definition of Internal Control. Internal Control consists of the control processes designed with the objective of providing reasonable assurance regarding the reliability of financial reporting and the preparation of financial statements for external purposes in accordance with generally accepted accounting principles (“GAAP”) and includes those policies and procedures that (1) pertain to the maintenance of records that in reasonable detail accurately and fairly reflect the transactions and dispositions of our assets, (2) provide reasonable assurance that transactions are recorded as necessary to permit preparation of financial statements in accordance with GAAP, and that receipts and expenditures are being made only in accordance with authorizations of management and directors and (3) provide reasonable assurance regarding prevention or timely detection of unauthorized acquisition, use or disposition of our assets that could have a material effect on our financial statements.
Limitations on the Effectiveness of Controls. Our management, including our CEO and CFO, does not expect that our Disclosure Controls and Internal Control will prevent all error and all fraud. A control system, no matter how well conceived and operated, can provide only reasonable, not absolute, assurance that the objectives of the control system will be met. Further, the design of a control system must reflect the fact that there are resource constraints, and the benefits of controls must be considered relative to their costs. Because of the inherent limitations in all control systems, no evaluation of controls can provide absolute assurance that all control issues and instances of fraud, if any, within our company have been detected. These inherent limitations include the realities that judgments in decision-making can be faulty, and that breakdowns can occur because of simple error or mistake. Additionally, controls can be circumvented by the individual acts of some persons, by collusion of two or more people, or by management override of the controls. The design of any system of
81
Table of Contents
controls also is based in part upon certain assumptions about the likelihood of future events, and there can be no assurance that any design will succeed in achieving its stated goals under all potential future conditions. Over time, controls may become inadequate because of changes in conditions, or deterioration in the degree of compliance with the policies or procedures. Because of the inherent limitations in a cost-effective control system, misstatements due to error or fraud may occur and not be detected.
Scope of the Controls Evaluation. The CEO/CFO evaluation of our Disclosure Controls included a review of the controls’ objectives and design, the controls’ implementation by us and the effect of the controls on the information generated for use in this report. In the course of the controls evaluation, we sought to identify errors, controls problems or acts of fraud. Elements of our controls are also evaluated on an ongoing basis by personnel in our Finance department. The overall goals of these various evaluation activities are to monitor our Disclosure Controls and to make modifications as necessary. Our intent in this regard is that the Disclosure Controls will be maintained as dynamic systems that change (including with improvements and corrections) as conditions warrant.
Among other matters, we sought in our evaluation to determine whether there were any significant deficiencies or material weaknesses in our Internal Control, or whether we had identified any acts of fraud involving personnel who have a significant role in our Internal Control. This information was important both for the controls evaluation generally and because item 5 in the certifications of our CEO and CFO require that the CEO and CFO disclose that information to our Audit Committee and to our independent registered public accounting firm.
Quarterly Reports
Quarterly Evaluation of Disclosure Controls. Based upon the controls evaluation, our CEO and CFO have concluded that our Disclosure Controls were effective as of December 31, 2005 to ensure that material information relating to us and our consolidated subsidiaries is made known to management, including the CEO and CFO, particularly during the period when our periodic reports are being prepared.
Quarterly Evaluation of Changes in Internal Control. During the most recently completed fiscal quarter there has been no change in our Internal Control that has materially affected, or is reasonably likely to materially affect, our Internal Control.
Annual Report Pursuant to Section 404 of the Sarbanes-Oxley Act of 2002
Annual Report on Internal Control Over Financial Reporting: Company management is responsible for establishing and maintaining adequate Internal Control. Management assessed the effectiveness of our Internal Control as of December 31, 2005. In making this assessment, management used the criteria set forth by the Committee of Sponsoring Organizations of the Treadway Commission (COSO) in “Internal Control—Integrated Framework.” Based on the assessment using those criteria, management believes that, as of December 31, 2005, our Internal Control was effective.
Our independent registered public accounting firm, Ernst & Young LLP, have audited the consolidated financial statements included in this annual report and have audited management’s assessment of our Internal Control as well as on the effectiveness of our Internal Control. The report on the audit of Internal Control appears below.
82
Table of Contents
REPORT OF INDEPENDENT REGISTERED PUBLIC ACCOUNTING FIRM
ON INTERNAL CONTROL OVER FINANCIAL REPORTING
The Board of Directors and Stockholders of
Maxygen, Inc.
We have audited management’s assessment, included in the accompanying Annual Report on Internal Control Over Financial Reporting, that Maxygen, Inc. maintained effective internal control over financial reporting as of December 31, 2005, based on criteria established in Internal Control—Integrated Framework issued by the Committee of Sponsoring Organizations of the Treadway Commission (the COSO criteria). Maxygen, Inc.’s management is responsible for maintaining effective internal control over financial reporting and for its assessment of the effectiveness of internal control over financial reporting. Our responsibility is to express an opinion on management’s assessment and an opinion on the effectiveness of the company’s internal control over financial reporting based on our audit.
We conducted our audit in accordance with the standards of the Public Company Accounting Oversight Board (United States). Those standards require that we plan and perform the audit to obtain reasonable assurance about whether effective internal control over financial reporting was maintained in all material respects. Our audit included obtaining an understanding of internal control over financial reporting, evaluating management’s assessment, testing and evaluating the design and operating effectiveness of internal control, and performing such other procedures as we considered necessary in the circumstances. We believe that our audit provides a reasonable basis for our opinion.
A company’s internal control over financial reporting is a process designed to provide reasonable assurance regarding the reliability of financial reporting and the preparation of financial statements for external purposes in accordance with generally accepted accounting principles. A company’s internal control over financial reporting includes those policies and procedures that (1) pertain to the maintenance of records that, in reasonable detail, accurately and fairly reflect the transactions and dispositions of the assets of the company; (2) provide reasonable assurance that transactions are recorded as necessary to permit preparation of financial statements in accordance with generally accepted accounting principles, and that receipts and expenditures of the company are being made only in accordance with authorizations of management and directors of the company; and (3) provide reasonable assurance regarding prevention or timely detection of unauthorized acquisition, use, or disposition of the company’s assets that could have a material effect on the financial statements.
Because of its inherent limitations, internal control over financial reporting may not prevent or detect misstatements. Also, projections of any evaluation of effectiveness to future periods are subject to the risk that controls may become inadequate because of changes in conditions, or that the degree of compliance with the policies or procedures may deteriorate.
In our opinion, management’s assessment that Maxygen, Inc. maintained effective internal control over financial reporting as of December 31, 2005, is fairly stated, in all material respects, based on the COSO criteria. Also, in our opinion, Maxygen, Inc maintained, in all material respects, effective internal control over financial reporting as of December 31, 2005, based on the COSO criteria.
We also have audited, in accordance with the standards of the Public Company Accounting Oversight Board (United States), the consolidated balance sheets of Maxygen, Inc. as of December 31, 2004 and 2005, and the related consolidated statements of operations, stockholders’ equity, and cash flows for each of the three years in the period ended December 31, 2005 and our report dated March10, 2006 expressed an unqualified opinion thereon.
/s/ ERNST & YOUNG LLP
Palo Alto, California
March10, 2006
83
Table of Contents
| Item 9B | OTHER INFORMATION |
There was no information required to be disclosed in a report on Form 8-K during the fourth quarter of 2005 that was not reported.
PART III
| Item 10 | DIRECTORS AND EXECUTIVE OFFICERS OF THE REGISTRANT |
The information required by this item relating to our executive officers, directors and nominees, audit committee financial expert, identification of the audit committee, changes to the procedures by which security holders may recommend board nominees, and compliance with Section 16(a) of the Securities Exchange Act of 1934 is incorporated by reference from the 2006 Proxy Statement.
Code of Ethics
We have adopted a written code of ethics that applies to our senior financial officers, including our principal executive officer, principal financial officer and principal accounting officer. We have posted the text of such code of ethics on our website (www.maxygen.com). We intend to satisfy the disclosure requirement of Item 5.05 of Form 8-K regarding an amendment to, or a waiver from, a provision of our code of ethics that applies to our principal executive officer, principal financial officer, or principal accounting officer by posting such information on our website.
| Item 11 | EXECUTIVE COMPENSATION |
The information required by this item is incorporated by reference from the section captioned “Executive Compensation” contained in the 2006 Proxy Statement.
| Item 12 | SECURITY OWNERSHIP OF CERTAIN BENEFICIAL OWNERS AND MANAGEMENT |
The information required by this item is incorporated by reference from the section captioned “Security Ownership of Certain Beneficial Owners and Management” contained in the 2006 Proxy Statement.
| Item 13 | CERTAIN RELATIONSHIPS AND RELATED TRANSACTIONS |
The information required by this item is incorporated by reference from the section captioned “Related Party Transactions” contained in the 2006 Proxy Statement.
| Item 14 | PRINCIPAL ACCOUNTING FEES AND SERVICES |
The information required by this item is incorporated by reference from the section captioned “Ratification of Selection of Independent Registered Public Accounting Firm” contained in the 2006 Proxy Statement.
Pre-Approval of Non-Audit Services
During the quarter ended December 31, 2005, the Audit Committee approved (i) the engagement of Ernst & Young LLP to provide audit-related consultations regarding accounting for a potential strategic transaction and (ii) the payment of fees for an audit-related online accounting information service provided by Ernst & Young LLP.
The Audit Committee has determined that the rendering of these audit-related services by Ernst & Young LLP is compatible with maintaining their independence.
84
Table of Contents
PART IV
| Item 15 | EXHIBITS, FINANCIAL STATEMENT SCHEDULES |
15(a)(1) Financial Statements. The following documents are being filed as part of this report:
| Page | ||
Report of Independent Public Accounting Firm on Consolidated Financial Statements | 44 | |
| 45 | ||
| 46 | ||
| 47 | ||
| 48 | ||
| 49 |
15(a)(2) Financial Statement Schedules. Financial statement schedules have been omitted because they are either presented elsewhere, are inapplicable or are immaterial as defined in the instructions.
15(a)(3) Exhibits.
| Exhibit Number | Description of Exhibit | |
| 2.1 | Exchange Agreement, dated as of April 12, 2000, by and among Maxygen, Inc., Maxygen Holdings Ltd., ProFound Pharma A/S and the shareholders of ProFound Pharma A/S (1) | |
| 2.2 | Amendment No. 1 to the Exchange Agreement, dated as of July 31, 2000, by and among Maxygen, Inc., Maxygen Holdings Ltd., ProFound Pharma A/S and the shareholders of ProFound Pharma A/S (1) | |
| 2.3 | Agreement and Plan of Merger, dated June 2, 2004, by and among Pioneer Hi-Bred International, Inc., Tango Merger Sub, Inc., Maxygen, Inc. and Verdia, Inc. (2) | |
| 3.1 | Amended and Restated Certificate of Incorporation (3) | |
| 3.2 | Amended and Restated Bylaws (3) | |
| 4.1 | Specimen Common Stock Certificate (Exhibit 4.1 to Amendment No. 1) (4) | |
| 4.2 | Amended and Restated Registration Rights Agreement, dated as of November 13, 2000, among Maxygen, Inc. and certain stockholders of Maxygen, Inc. (5) | |
| 4.3 | Loan and Security Agreement, dated February 12, 2004, by and between Lighthouse Capital Partners V, L.P. and Codexis, Inc. (6) | |
| *10.1 | Form of Executive Officer and Director Indemnification Agreement (Exhibit 10.7) (4) | |
| *10.2 | Form of Executive Officer Change of Control Plan (Exhibit 10.1) (7) | |
| *10.3 | Form of Amendment No. 1 to Executive Officer Change of Control Plan (Exhibit 10.3) (8) | |
| *10.4 | 1997 Stock Option Plan, as amended, with applicable option agreement (9) | |
| *10.5 | 1999 Nonemployee Directors Stock Option Plan, as amended, with applicable option agreement (Exhibit 10.3) (7) | |
| *10.6 | 1999 Employee Stock Purchase Plan, as amended (Exhibit 10.11) (5) | |
| *10.7 | 2000 International Stock Option Plan, as amended, with applicable option agreement (10) | |
| *10.8 | 2000 Non-Officer Stock Option Plan, as amended, with applicable option agreement (11) | |
| 10.9 | Lease, dated as of October 21, 1998, between Metropolitan Life Insurance Company and Maxygen, Inc. (Exhibit 10.4) (4) | |
85
Table of Contents
| Exhibit Number | Description of Exhibit | |
| 10.10 | First Amendment to Lease, dated as of February 26, 1999, by and between Metropolitan Life Insurance Company and Maxygen, Inc. (Exhibit 10.5) (4) | |
| 10.11 | Second Amendment to Lease, dated as of October 24, 2000, by and between Metropolitan Life Insurance Company and Maxygen, Inc. (Exhibit 10.6) (5) | |
| 10.12 | Third Amendment to Lease, dated October 22, 2003, by and between Metropolitan Life Insurance Company and Maxygen, Inc. (Exhibit 10.15) (12) | |
| 10.13 | Fourth Amendment to Lease dated December 15, 2004 by and between Metropolitan Life Insurance Company and Maxygen, Inc. (Exhibit 10.13) (13) | |
| 10.14 | Lease, dated December 15, 2004, between Metropolitan Life Insurance Company and Maxygen, Inc. (Exhibit 10.14) (13) | |
| 10.15 | Lease, dated April 21, 2000, between Metropolitan Life Insurance Company and Maxygen, Inc. (Exhibit 10.2) (3) | |
| 10.16 | Lease Agreement, dated May 5, 2000, between ProFound Pharma A/S and The Science Park in Horsholm (14) | |
| 10.17 | Lease, dated as of October 2003, between Metropolitan Life Insurance Company and Codexis, Inc. (Exhibit 10.16) (12) | |
| 10.18+ | Technology Transfer Agreement, dated March 14, 1997 (effective March 1, 1998), among Maxygen, Inc., Affymax Technologies N.V. and Glaxo Group Limited, as amended (Exhibit 10.3 to Amendment No. 2) (4) | |
| 10.19+ | License and Collaboration Agreement, effective as of September 17, 1997, between Maxygen, Inc. and Novo Nordisk A/S, as amended June 29, 1998, July 29, 1998, and April 19, 1999 (Exhibit 10.11 to Amendment No. 2) (4) (assigned to Codexis in March 2002) | |
| 10.20+ | Agreement, entered into March 15, 1999, between Maxygen, Inc. and Gist-Brocades B.V. (Exhibit 10.13 to Amendment No. 2) (4) (assigned to Codexis in March 2002) | |
| *10.21 | Description of Executive Officer Cash Bonus Program (15) | |
| *10.22 | Description of Goldstein Reimbursement Arrangement (16) | |
| 10.23+ | Co-Development and Commercialization Agreement, dated as of December 9, 2005, among Hoffman-La Roche, Inc., F. Hoffman-La Roche Ltd. and Maxygen Holdings Ltd. | |
| 10.24 | Consulting Agreement, dated as of January 12, 2006 (effective January 1, 2006), between Balkrishan Gill and Maxygen, Inc. | |
| 21.1 | List of Subsidiaries | |
| 23.1 | Consent of Independent Registered Public Accounting Firm | |
| 24.1 | Power of Attorney (included on signature page) | |
| 31.1 | Certification of Chief Executive Officer pursuant to Section 302 of the Sarbanes-Oxley Act of 2002 | |
| 31.2 | Certification of Chief Financial Officer pursuant to Section 302 of the Sarbanes-Oxley Act of 2002 | |
| 32.1 | Certification of Chief Executive Officer and Chief Financial Officer pursuant to Section 906 of the Sarbanes-Oxley Act of 2002 | |
| * | Management contract or compensatory plan or arrangement. |
| + | Confidential treatment has been granted, or requested, with respect to portions of the exhibit. A complete copy of the agreement, including the redacted terms, has been separately filed with the Securities and Exchange Commission. |
86
Table of Contents
| (1) | Incorporated by reference to the corresponding exhibit to Maxygen’s Current Report on Form 8-K (File No. 000-28401) filed with the Securities and Exchange Commission on August 15, 2000. |
| (2) | Incorporated by reference to the corresponding or indicated exhibit to Maxygen’s Quarterly Report on Form 10-Q (File No. 000-28401) for the quarter ended June 30, 2000, filed with the Securities and Exchange Commission on August 14, 2000. |
| (3) | Incorporated by reference to Exhibit 2.1 to Maxygen’s Current Report on Form 8-K (File No. 000-28401) filed with the Securities and Exchange Commission on July 2, 2004. |
| (4) | Incorporated by reference to the indicated exhibit to Maxygen’s Registration Statement on Form S-1, as amended (No. 333-89413) initially filed with the Securities and Exchange Commission on October 20, 1999. |
| (5) | Incorporated by reference to the indicated exhibit to Maxygen’s Annual Report on Form 10-K (File No. 000-28401) for the year ended December 31, 2000, filed with the Securities and Exchange Commission on March 21, 2001. |
| (6) | Incorporated by reference to Exhibit 4.1 to Maxygen’s Quarterly Report on Form 10-Q (File No. 000-28401) for the quarter ended March 31, 2004, filed with the Securities and Exchange Commission on May 7, 2004. |
| (7) | Incorporated by reference to the indicated exhibit to Maxygen’s Quarterly Report on Form 10-Q (File No. 000-28401) for the quarter ended June 30, 2001, filed with the Securities and Exchange Commission on August 14, 2001. |
| (8) | Incorporated by reference to the indicated exhibit to Maxygen’s Annual Report on Form 10-K (File No. 000-28401) for the year ended December 31, 2002, filed with the Securities and Exchange Commission on March 27, 2003. |
| (9) | Incorporated by reference to exhibit 10.1 to Maxygen’s Quarterly Report on Form 10-Q (File No. 000-28401) for the quarter ended June 30, 2002, filed with the Securities and Exchange Commission on August 14, 2002. |
| (10) | Incorporated by reference to exhibit 10.6 to Maxygen’s Annual Report on Form 10-K (File No. 000-28401) for the year ended December 31, 2001, filed with the Securities and Exchange Commission on March 25, 2002. |
| (11) | Incorporated by reference to the exhibit 99.3 to Maxygen’s Registration Statement on Form S-8 (No. 333-57486) filed with the Securities and Exchange Commission on March 23, 2001. |
| (12) | Incorporated by reference to indicated exhibit to Maxygen’s Annual Report on Form 10-K (File No. 000-28401) for the year ended December 31, 2003, filed with the Securities and Exchange Commission on March 12, 2004. |
| (13) | Incorporated by reference to indicated exhibit to Maxygen’s Annual Report on Form 10-K (File No. 000-28401) for the year ended December 31, 2004, filed with the Securities and Exchange Commission on March 12, 2004. |
| (14) | Incorporated by reference to exhibit 10.1 to Maxygen’s Quarterly Report on Form 10-Q (File No. 000-28401) for the quarter ended September 30, 2000, filed with the Securities and Exchange Commission on November 14, 2000. |
| (15) | Incorporated by reference to Exhibit 10.1 to Maxygen’s Current Report on Form 8-K (File No. 000-28401) filed with the Securities and Exchange Commission on December 13, 2004. |
| (16) | Incorporated by reference to Exhibit 10.1 to Maxygen’s Current Report on Form 8-K (File No. 000-28401) filed with the Securities and Exchange Commission on February 7, 2005. |
87
Table of Contents
Pursuant to the requirements of Section 13 or 15(d) of the Securities Exchange Act of 1934, the registrant has duly caused this report to be signed on its behalf by the undersigned, thereunto duly authorized.
| MAXYGEN, INC. | ||||||
March 15, 2006 | By: | /S/ RUSSELL J. HOWARD | ||||
| Russell J. Howard | ||||||
| Chief Executive Officer | ||||||
POWER OF ATTORNEY
KNOW ALL PERSONS BY THESE PRESENTS, that each person whose signature appears below constitutes and appoints Michael Rabson and Lawrence W. Briscoe or either of them, his or her true and lawful attorneys-in-fact and agents, with full power of substitution and re-substitution, for him or her and in his or her name, place and stead, in any and all capacities to sign any and all amendments to this Report on Form 10-K, and to file the same, with all exhibits thereto and other documents in connection therewith, with the Securities and Exchange Commission, granting unto said attorneys-in-fact and agents, and each of them, full power and authority to do and perform each and every act and thing requisite and necessary to be done in connection therewith, as fully to all intents and purposes as he or she might or could do in person, hereby ratifying and confirming all that said attorneys-in-fact and agents, or either of them, or their, his or her substitutes or substitute, may lawfully do or cause to be done by virtue hereof.
Pursuant to the requirements of the Securities Exchange Act of 1934, this report has been signed below by the following persons on behalf of the registrant and in the capacities and on the dates indicated.
Signature | Title | Date | ||
/S/ RUSSELL J. HOWARD Russell J. Howard | Chief Executive Officer and Director (Principal Executive Officer) | March 15, 2006 | ||
/S/ LAWRENCE W. BRISCOE Lawrence W. Briscoe | Chief Financial Officer (Principal Financial and Accounting Officer) | March 15, 2006 | ||
/S/ ISAAC STEIN Isaac Stein | Chairman of the Board | March 15, 2006 | ||
/S/ M.R.C. GREENWOOD M.R.C. Greenwood | Director | March 15, 2006 | ||
/S/ LOUIS G. LANGE Louis G. Lange | Director | March 15, 2006 | ||
/S/ ERNEST MARIO Ernest Mario | Director | March 15, 2006 | ||
/S/ GORDON RINGOLD Gordon Ringold | Director | March 15, 2006 | ||
/S/ JAMES R. SULAT James R. Sulat | Director | March 15, 2006 | ||
88
Table of Contents
EXHIBIT INDEX
| Exhibit Number | Description of Exhibit | |
| 3.2 | Amended and Restated Bylaws (3) | |
| 4.1 | Specimen Common Stock Certificate (Exhibit 4.1 to Amendment No. 1) (4) | |
| 4.2 | Amended and Restated Registration Rights Agreement, dated as of November 13, 2000, among Maxygen, Inc. and certain stockholders of Maxygen, Inc. (5) | |
| 4.3 | Loan and Security Agreement, dated February 12, 2004, by and between Lighthouse Capital Partners V, L.P. and Codexis, Inc. (6) | |
| *10.1 | Form of Executive Officer and Director Indemnification Agreement (Exhibit 10.7) (4) | |
| *10.2 | Form of Executive Officer Change of Control Plan (Exhibit 10.1) (7) | |
| *10.3 | Form of Amendment No. 1 to Executive Officer Change of Control Plan (Exhibit 10.3) (8) | |
| *10.4 | 1997 Stock Option Plan, as amended, with applicable option agreement (9) | |
| *10.5 | 1999 Nonemployee Directors Stock Option Plan, as amended, with applicable option agreement (Exhibit 10.3) (7) | |
| *10.6 | 1999 Employee Stock Purchase Plan, as amended (Exhibit 10.11) (5) | |
| *10.7 | 2000 International Stock Option Plan, as amended, with applicable option agreement (10) | |
| *10.8 | 2000 Non-Officer Stock Option Plan, as amended, with applicable option agreement (11) | |
| 10.9 | Lease, dated as of October 21, 1998, between Metropolitan Life Insurance Company and Maxygen, Inc. (Exhibit 10.4) (4) | |
| 10.10 | First Amendment to Lease, dated as of February 26, 1999, by and between Metropolitan Life Insurance Company and Maxygen, Inc. (Exhibit 10.5) (4) | |
| 10.11 | Second Amendment to Lease, dated as of October 24, 2000, by and between Metropolitan Life Insurance Company and Maxygen, Inc. (Exhibit 10.6) (5) | |
| 10.12 | Third Amendment to Lease, dated October 22, 2003, by and between Metropolitan Life Insurance Company and Maxygen, Inc. (Exhibit 10.15) (12) | |
| 10.13 | Fourth Amendment to Lease dated December 15, 2004 by and between Metropolitan Life Insurance Company and Maxygen, Inc. (Exhibit 10.13) (13) | |
| 10.14 | Lease, dated December 15, 2004, between Metropolitan Life Insurance Company and Maxygen, Inc. (Exhibit 10.14) (13) | |
| 10.15 | Lease, dated April 21, 2000, between Metropolitan Life Insurance Company and Maxygen, Inc. (Exhibit 10.2) (3) | |
| 10.16 | Lease Agreement, dated May 5, 2000, between ProFound Pharma A/S and The Science Park in Horsholm (14) | |
| 10.17 | Lease, dated as of October 2003, between Metropolitan Life Insurance Company and Codexis, Inc. (Exhibit 10.16) (12) | |
| 10.18+ | Technology Transfer Agreement, dated March 14, 1997 (effective March 1, 1998), among Maxygen, Inc., Affymax Technologies N.V. and Glaxo Group Limited, as amended (Exhibit 10.3 to Amendment No. 2) (4) | |
| 10.19+ | License and Collaboration Agreement, effective as of September 17, 1997, between Maxygen, Inc. and Novo Nordisk A/S, as amended June 29, 1998, July 29, 1998, and April 19, 1999 (Exhibit 10.11 to Amendment No. 2) (4) (assigned to Codexis in March 2002) | |
Table of Contents
| Exhibit Number | Description of Exhibit | |
| 10.20+ | Agreement, entered into March 15, 1999, between Maxygen, Inc. and Gist-Brocades B.V. (Exhibit 10.13 to Amendment No. 2) (4) (assigned to Codexis in March 2002) | |
| *10.21 | Description of Executive Officer Cash Bonus Program (15) | |
| *10.22 | Description of Goldstein Reimbursement Arrangement (16) | |
| 10.23+ | Co-Development and Commercialization Agreement, dated as of December 9, 2005, among Hoffman-La Roche, Inc., F. Hoffman-La Roche Ltd. and Maxygen Holdings Ltd. | |
| 10.24 | Consulting Agreement, dated as of January 12, 2006 (effective January 1, 2006), between Balkrishan Gill and Maxygen, Inc. | |
| 21.1 | List of Subsidiaries | |
| 23.1 | Consent of Independent Registered Public Accounting Firm | |
| 24.1 | Power of Attorney (included on signature page) | |
| 31.1 | Certification of Chief Executive Officer pursuant to Section 302 of the Sarbanes-Oxley Act of 2002 | |
| 31.2 | Certification of Chief Financial Officer pursuant to Section 302 of the Sarbanes-Oxley Act of 2002 | |
| 32.1 | Certification of Chief Executive Officer and Chief Financial Officer pursuant to Section 906 of the Sarbanes-Oxley Act of 2002 | |
| * | Management contract or compensatory plan or arrangement. |
| + | Confidential treatment has been granted, or requested, with respect to portions of the exhibit. A complete copy of the agreement, including the redacted terms, has been separately filed with the Securities and Exchange Commission. |
| (1) | Incorporated by reference to the corresponding exhibit to Maxygen’s Current Report on Form 8-K (File No. 000-28401) filed with the Securities and Exchange Commission on August 15, 2000. |
| (2) | Incorporated by reference to the corresponding or indicated exhibit to Maxygen’s Quarterly Report on Form 10-Q (File No. 000-28401) for the quarter ended June 30, 2000, filed with the Securities and Exchange Commission on August 14, 2000. |
| (3) | Incorporated by reference to Exhibit 2.1 to Maxygen’s Current Report on Form 8-K (File No. 000-28401) filed with the Securities and Exchange Commission on July 2, 2004. |
| (4) | Incorporated by reference to the indicated exhibit to Maxygen’s Registration Statement on Form S-1, as amended (No. 333-89413) initially filed with the Securities and Exchange Commission on October 20, 1999. |
| (5) | Incorporated by reference to the indicated exhibit to Maxygen’s Annual Report on Form 10-K (File No. 000-28401) for the year ended December 31, 2000, filed with the Securities and Exchange Commission on March 21, 2001. |
| (6) | Incorporated by reference to Exhibit 4.1 to Maxygen’s Quarterly Report on Form 10-Q (File No. 000-28401) for the quarter ended March 31, 2004, filed with the Securities and Exchange Commission on May 7, 2004. |
| (7) | Incorporated by reference to the indicated exhibit to Maxygen’s Quarterly Report on Form 10-Q (File No. 000-28401) for the quarter ended June 30, 2001, filed with the Securities and Exchange Commission on August 14, 2001. |
| (8) | Incorporated by reference to the indicated exhibit to Maxygen’s Annual Report on Form 10-K (File No. 000-28401) for the year ended December 31, 2002, filed with the Securities and Exchange Commission on March 27, 2003. |
Table of Contents
| (9) | Incorporated by reference to exhibit 10.1 to Maxygen’s Quarterly Report on Form 10-Q (File No. 000-28401) for the quarter ended June 30, 2002, filed with the Securities and Exchange Commission on August 14, 2002. |
| (10) | Incorporated by reference to exhibit 10.6 to Maxygen’s Annual Report on Form 10-K (File No. 000-28401) for the year ended December 31, 2001, filed with the Securities and Exchange Commission on March 25, 2002. |
| (11) | Incorporated by reference to the exhibit 99.3 to Maxygen’s Registration Statement on Form S-8 (No. 333-57486) filed with the Securities and Exchange Commission on March 23, 2001. |
| (12) | Incorporated by reference to indicated exhibit to Maxygen’s Annual Report on Form 10-K (File No. 000-28401) for the year ended December 31, 2003, filed with the Securities and Exchange Commission on March 12, 2004. |
| (13) | Incorporated by reference to indicated exhibit to Maxygen’s Annual Report on Form 10-K (File No. 000-28401) for the year ended December 31, 2004, filed with the Securities and Exchange Commission on March 12, 2004. |
| (14) | Incorporated by reference to exhibit 10.1 to Maxygen’s Quarterly Report on Form 10-Q (File No. 000-28401) for the quarter ended September 30, 2000, filed with the Securities and Exchange Commission on November 14, 2000. |
| (15) | Incorporated by reference to Exhibit 10.1 to Maxygen’s Current Report on Form 8-K (File No. 000-28401) filed with the Securities and Exchange Commission on December 13, 2004. |
| (16) | Incorporated by reference to Exhibit 10.1 to Maxygen’s Current Report on Form 8-K (File No. 000-28401) filed with the Securities and Exchange Commission on February 7, 2005. |