On February 16, 2022, Blucora, Inc. (the “Company”) issued a press release containing the Company’s financial results for its fourth quarter and full year ended December 31, 2021. A copy of the press release can be found below, along with the earnings report upon which it is based, a transcript of the earnings call held on February 16, 2022 and the accompanying presentation.
DALLAS, TX — February 16, 2022 — Blucora, Inc. (NASDAQ: BCOR), a leading provider of technology-enabled, tax focused financial solutions, today announced financial results for the fourth quarter and full year ended December 31, 2021.
“Blucora made substantial progress in 2021, positioning the business for sustainable and profitable growth. Our team continued to exceed expectations as we achieved or exceeded all elements of our outlook from last quarter and we are on track to achieve our three-year revenue and EBITDA growth goals. My thanks go out to all of our team and our financial professionals for the hard work in achieving these goals,” commented Chris Walters, Blucora’s President and Chief Executive Officer. Mr. Walters continued, “The continued progress that we have seen across the business allows us to confirm our expectations of positive net flows for the wealth business and our outlook for strong continued momentum in tax software in the current tax season.”
With the tax season now underway and positive early results from the Company’s new marketing efforts and from its new product and service offerings, Blucora is reconfirming its full-year 2022 outlook for the Tax Software segment to provide revenue growth of between 14% and 18% from the mid-point of our full-year 2021 guidance range, $226 million, as presented on November 4, 2021 and segment operating income of between $98 and $106 million.
Conference Call and Webcast
A conference call and live webcast will be held today at 8:30 a.m. Eastern Time during which the Company will further discuss fourth quarter and full year 2021 results, its outlook for 2022 and other business matters. We will also provide supplemental financial information to our results on the Investor Relations section of the Blucora corporate website at www.blucora.com prior to the call. A replay of the call will be available on our website.
About Blucora®
Blucora, Inc. (NASDAQ: BCOR) is a provider of data and technology-driven solutions that empower people to improve their financial wellness. Blucora operates in two segments (i) wealth management, through its Avantax Wealth Management and Avantax Planning Partners brands, with a collective $89 billion in total client assets as of December 31, 2021 and (ii) tax software, through its TaxAct business, a market leader in tax software with over 3 million consumer users and approximately 24,500 professional users in 2021. With integrated tax-focused software and wealth management, Blucora is uniquely positioned to assist our customers in achieving better long-term outcomes via holistic, tax-advantaged solutions. For more information on Blucora, visit www.blucora.com.
Source: Blucora
Blucora Investor Relations
Dee Littrell (972) 870-6463
IR@Blucora.com
This release contains forward-looking statements within the meaning of Section 27A of the Securities Act of 1933, as amended, and Section 21E of the Securities Exchange Act of 1934, as amended. including without limitation, statements regarding the outlook of Blucora, Inc. (the “Company”) and its segments, expectations regarding net flows for its wealth business, and expectations with respect to the current tax season. Forward-looking statements provide current expectations of future events based on certain assumptions and include any statement that does not directly relate to any historical or current fact. Forward-looking statements can also be identified by words such as “believes,” “estimates,” “should,” “could,” “would,” “plans,” “expects,” “intends,” “anticipates,” “may,” “forecasts,” “future,” “will,” “projects,” “predicts,” “potential,” “continues,” “target,” “outlook,” “guidance,” and similar expressions and variations. Actual results may differ significantly from management’s expectations due to various risks and uncertainties including, but not limited to: our ability to effectively compete within our industries; our ability to attract and retain financial professionals, qualified employees, clients, and customers, as well as our ability to provide strong customer/client service; the impact of the COVID-19 pandemic on our results of operations and our business, including the impact of the resulting economic and market disruption, the extension of tax filing deadlines and other related government actions; our ability to retain employees and acquired client assets following acquisitions; our future capital requirements and the availability of financing, if necessary; our ability to meet our current and future debt service obligations, including our ability to maintain compliance with our debt covenants; any downgrade of the Company’s credit ratings; our ability to generate strong performance for our clients and the impact of the financial markets on our clients’ portfolios; the impact of new or changing legislation and regulations (or interpretations thereof) on our business, including our ability to successfully address and comply with such legislation and regulations (or interpretations thereof) and increased costs, reductions of revenue, and potential fines, penalties or disgorgement to which we may be subject as a result thereof; risks, burdens, and costs, including fines, penalties, or disgorgement, associated with our business being subjected to regulatory inquiries, investigations, or initiatives, including those of the Financial Industry Regulatory Authority, Inc. and the Securities and Exchange Commission (“SEC”); risks associated with legal proceedings, including litigation and regulatory proceedings; our ability to close, finance, and realize all of the anticipated benefits of acquisitions, as well as our ability to integrate the operations of recently acquired businesses, and the potential impact of such acquisitions on our existing indebtedness and leverage the compromising of confidentiality, availability or integrity of information, including cyberattacks; our
ability to manage leadership and employee transitions, including costs and time burdens on management and our board of directors related thereto; political and economic conditions and events that directly or indirectly impact the wealth management and tax preparation software industries; our ability to respond to rapid technological changes, including our ability to successfully release new products and services or improve upon existing products and services; our expectations concerning the revenues we generate from fees associated with the financial products that we distribute; risks related to goodwill and other intangible asset impairment; our ability to develop, establish, and maintain strong brands; risks associated with the use and implementation of information technology and the effect of security breaches, computer viruses, and computer hacking attacks; our ability to comply with laws and regulations regarding privacy and protection of user data; our ability to maintain our relationships with third-party partners, providers, suppliers, vendors, distributors, contractors, financial institutions, industry associations, and licensing partners, and our expectations regarding and reliance on the products, tools, platforms, systems, and services provided by these third parties; our beliefs and expectations regarding the seasonality of our business; our assessments and estimates that determine our effective tax rate; our ability to protect our intellectual property and the impact of any claim that we have infringed on the intellectual property rights of others; and the effects on our business of actions of activist stockholders. A more detailed description of these and certain other factors that could affect actual results is included in the Company’s most recent Annual Report on Form 10-K and most recent Quarterly Report on Form 10-Q filed with the SEC. Readers are cautioned not to place undue reliance on these forward-looking statements, which speak only as of the date hereof. The Company undertakes no obligation to update any forward-looking statements to reflect events or circumstances after the date hereof, except as may be required by law.
Important Additional Information
The Company intends to file a definitive proxy statement, accompanying BLUE proxy card and other relevant documents with the SEC in connection with the solicitation of proxies for the Company’s 2022 annual meeting of stockholders (the “Annual Meeting”). BEFORE MAKING ANY VOTING DECISION, STOCKHOLDERS OF THE COMPANY ARE URGED TO READ ALL RELEVANT DOCUMENTS FILED WITH OR FURNISHED TO THE SEC, INCLUDING THE COMPANY’S DEFINITIVE PROXY STATEMENT AND ANY AMENDMENTS AND SUPPLEMENTS THERETO, BECAUSE THEY WILL CONTAIN IMPORTANT INFORMATION. Investors and stockholders will be able to obtain a copy of the definitive proxy statement and other documents filed by the Company with the SEC free of charge from the SEC’s website at www.sec.gov. In addition, copies will be available at no charge by selecting “SEC Filings” under “Financial Information” in the “Investors” tab of the Company’s website at www.blucora.com.
The Company, its directors and certain of its executive officers are participants in the solicitation of proxies from the Company’s stockholders in connection with the Annual Meeting. The names of these directors and executive officers and their respective direct and indirect interests, by security holdings or otherwise, in the Company are set forth in the Company’s Current Report on Form 8-K filed with the SEC on February 14, 2022.
Blucora, Inc.
Condensed Consolidated Statements of Operations
(Unaudited) (In thousands, except per share data) | | | | | | | | | | | | | | | | | | | | | | | |
| Three months ended
December 31, | | Year ended
December 31, |
| 2021 | | 2020 | | 2021 | | 2020 |
| Revenue: | | | | | | | |
| Wealth Management | $ | 172,192 | | | $ | 149,384 | | | $ | 658,213 | | | $ | 546,189 | |
| Tax Software | 6,139 | | | 5,773 | | | 226,987 | | | 208,763 | |
| Total revenue | 178,331 | | | 155,157 | | | 885,200 | | | 754,952 | |
| Operating expenses: | | | | | | | |
| Cost of revenue: | | | | | | | |
| Wealth Management | 121,119 | | | 103,630 | | | 464,293 | | | 385,962 | |
| Tax Software | 3,228 | | | 2,569 | | | 15,558 | | | 12,328 | |
| | | | | | | |
| Total cost of revenue | 124,347 | | | 106,199 | | | 479,851 | | | 398,290 | |
| Engineering and technology | 8,471 | | | 5,359 | | | 30,704 | | | 27,258 | |
| Sales and marketing | 32,522 | | | 26,833 | | | 173,331 | | | 177,618 | |
| General and administrative | 27,052 | | | 18,625 | | | 98,671 | | | 82,158 | |
| Acquisition and integration | 4,285 | | | 12,303 | | | 32,798 | | | 31,085 | |
| Depreciation | 2,535 | | | 1,948 | | | 10,906 | | | 7,293 | |
| Amortization of acquired intangible assets | 7,073 | | | 7,578 | | | 28,320 | | | 29,745 | |
| Impairment of goodwill | — | | | — | | | — | | | 270,625 | |
| Total operating expenses | 206,285 | | | 178,845 | | | 854,581 | | | 1,024,072 | |
| Operating income (loss) | (27,954) | | | (23,688) | | | 30,619 | | | (269,120) | |
Interest expense and other, net (1) | (7,878) | | | (7,918) | | | (32,080) | | | (31,304) | |
| Loss before income taxes | (35,832) | | | (31,606) | | | (1,461) | | | (300,424) | |
| Income tax benefit (expense) | 12,138 | | | (19,094) | | | 9,218 | | | (42,331) | |
| Net income (loss) | $ | (23,694) | | | $ | (50,700) | | | $ | 7,757 | | | $ | (342,755) | |
| | | | | | | |
| Net income (loss) per share: | | | | | | | |
| Basic | $ | (0.49) | | | $ | (1.05) | | | $ | 0.16 | | | $ | (7.14) | |
| Diluted | $ | (0.49) | | | $ | (1.05) | | | $ | 0.16 | | | $ | (7.14) | |
| | | | | | | |
| Weighted average shares outstanding: | | | | | | | |
| Basic | 48,834 | | | 48,107 | | | 48,578 | | | 47,978 | |
| Diluted | 48,834 | | | 48,107 | | | 49,526 | | | 47,978 | |
_________________________
(1)Interest expense and other, net consisted of the following (in thousands):
| | | | | | | | | | | | | | | | | | | | | | | |
| Three months ended
December 31, | | Year ended
December 31, |
| 2021 | | 2020 | | 2021 | | 2020 |
| Interest expense | $ | 7,018 | | | $ | 7,160 | | | $ | 28,807 | | | $ | 24,570 | |
| Amortization of debt issuance costs | 394 | | | 366 | | | 1,522 | | | 1,372 | |
| Accretion of debt discounts | 295 | | | 279 | | | 1,146 | | | 693 | |
| Total interest expense | 7,707 | | | 7,805 | | | 31,475 | | | 26,635 | |
| Interest income | (19) | | | (38) | | | (21) | | | (65) | |
| Gain on sale of a business | — | | | — | | | — | | | (349) | |
| Non-capitalized debt issuance expenses | — | | | — | | | — | | | 3,687 | |
| Other | 190 | | | 151 | | | 626 | | | 1,396 | |
| Interest expense and other, net | $ | 7,878 | | | $ | 7,918 | | | $ | 32,080 | | | $ | 31,304 | |
Blucora, Inc.
Condensed Consolidated Balance Sheets
(Unaudited) (In thousands)
| | | | | | | | | | | |
| December 31, |
| 2021 | | 2020 |
| ASSETS | | | |
| Current assets: | | | |
| Cash and cash equivalents | $ | 134,824 | | | $ | 150,125 | |
| Cash segregated under federal or other regulations | — | | | 637 | |
| Accounts receivable, net | 21,906 | | | 12,736 | |
| Commissions and advisory fees receivable | 25,073 | | | 26,132 | |
| | | |
| Prepaid expenses and other current assets | 18,476 | | | 11,038 | |
| Total current assets | 200,279 | | | 200,668 | |
| Long-term assets: | | | |
| Property, equipment, and software, net | 73,638 | | | 58,500 | |
| Right-of-use assets, net | 20,466 | | | 23,455 | |
| Goodwill | 454,821 | | | 454,821 | |
| Acquired intangible assets, net | 302,289 | | | 322,179 | |
| | | |
| Other long-term assets | 20,450 | | | 4,569 | |
| Total long-term assets | 871,664 | | | 863,524 | |
| Total assets | $ | 1,071,943 | | | $ | 1,064,192 | |
| LIABILITIES AND STOCKHOLDERS’ EQUITY | | | |
| Current liabilities: | | | |
| Accounts payable | $ | 8,216 | | | $ | 9,290 | |
| Commissions and advisory fees payable | 17,940 | | | 19,021 | |
| Accrued expenses and other current liabilities | 65,678 | | | 56,419 | |
| Current deferred revenue | 13,180 | | | 12,298 | |
| Current lease liabilities | 4,896 | | | 2,304 | |
| Current portion of long-term debt | 1,812 | | | 1,812 | |
| Total current liabilities | 111,722 | | | 101,144 | |
| Long-term liabilities: | | | |
| Long-term debt, net | 553,134 | | | 552,525 | |
| Deferred tax liabilities, net | 20,124 | | | 30,663 | |
| Long-term deferred revenue | 5,322 | | | 6,247 | |
| Long-term lease liabilities | 33,267 | | | 36,404 | |
| Other long-term liabilities | 6,752 | | | 24,919 | |
| Total long-term liabilities | 618,599 | | | 650,758 | |
| Total liabilities | 730,321 | | | 751,902 | |
| | | |
| | | |
| | | |
| Stockholders’ equity: | | | |
| Common stock, par value $0.0001 per share—900,000 authorized shares; 50,137 shares issued and 48,831 shares outstanding at December 31, 2021; 49,483 shares issued and 48,177 shares outstanding at December 31, 2020 | 5 | | | 5 | |
| Additional paid-in capital | 1,619,805 | | | 1,598,230 | |
| Accumulated deficit | (1,249,789) | | | (1,257,546) | |
| | | |
| Treasury stock, at cost—1,306 shares at December 31, 2021 and December 31, 2020 | (28,399) | | | (28,399) | |
| Total stockholders’ equity | 341,622 | | | 312,290 | |
| Total liabilities and stockholders’ equity | $ | 1,071,943 | | | $ | 1,064,192 | |
Blucora, Inc.
Condensed Consolidated Statements of Cash Flows
(Unaudited) (In thousands) | | | | | | | | | | | |
| Year ended December 31, |
| 2021 | | 2020 |
| Operating activities: | | | |
| Net income (loss) | $ | 7,757 | | | $ | (342,755) | |
| Adjustments to reconcile net income (loss) to net cash from operating activities: | | | |
| Depreciation and amortization of acquired intangible assets | 43,426 | | | 39,907 | |
| Stock-based compensation | 20,754 | | | 10,066 | |
| Impairment of goodwill | — | | | 270,625 | |
| | | |
| Reduction of right-of-use lease assets | 3,046 | | | 8,908 | |
| Deferred income taxes | (10,539) | | | 41,059 | |
| Amortization of debt discount and issuance costs | 2,668 | | | 2,065 | |
| | | |
| Gain on sale of a business | — | | | (349) | |
| Change in the fair value of acquisition-related contingent consideration | 22,400 | | | 8,300 | |
| Accretion of lease liabilities | 1,250 | | | 1,922 | |
| Other non-cash expenses | 2,602 | | | 1,508 | |
| Changes in operating assets and liabilities, net of acquisitions and disposals: | | | |
| | | |
| Accounts receivable, net | (9,152) | | | 10,705 | |
| Commissions and advisory fees receivable | 1,059 | | | (4,956) | |
| | | |
| Prepaid expenses and other current assets | (7,438) | | | 3,847 | |
| Other long-term assets | (17,861) | | | 2,232 | |
| Accounts payable | (1,074) | | | (4,192) | |
| Commissions and advisory fees payable | (857) | | | (884) | |
| Lease liabilities | (1,853) | | | (3,894) | |
| Deferred revenue | (43) | | | (796) | |
| Accrued expenses and other current and long-term liabilities | (19,314) | | | 761 | |
| Net cash provided by operating activities | 36,831 | | | 44,079 | |
| Investing activities: | | | |
| Purchases of property, equipment, and software, net | (30,276) | | | (36,002) | |
| Business acquisitions, net of cash acquired | — | | | (101,910) | |
| | | |
| Asset acquisitions | (8,316) | | | (3,143) | |
| Proceeds from sale of a business, net of cash | — | | | 349 | |
| Net cash used by investing activities | (38,592) | | | (140,706) | |
| Financing activities: | | | |
| Proceeds from credit facilities, net of debt issuance costs and debt discounts | (502) | | | 226,278 | |
| Payments on credit facilities | (1,812) | | | (66,531) | |
| Acquisition-related contingent consideration payments | (14,075) | | | — | |
| | | |
| | | |
| | | |
| | | |
| | | |
| Proceeds from stock option exercises | 579 | | | 97 | |
| Proceeds from issuance of stock through employee stock purchase plan | 3,277 | | | 2,258 | |
| Tax payments from shares withheld for equity awards | (1,644) | | | (1,163) | |
| Net cash provided (used) by financing activities | (14,177) | | | 160,939 | |
| | | |
| | | |
| | | |
| | | |
| | | |
| | | |
| | | |
| | | |
| Net increase (decrease) in cash, cash equivalents, and restricted cash | (15,938) | | | 64,312 | |
| Cash, cash equivalents, and restricted cash, beginning of period | 150,762 | | | 86,450 | |
| Cash, cash equivalents, and restricted cash, end of period | $ | 134,824 | | | $ | 150,762 | |
| | | |
| | | |
| | | |
| | | |
| | | |
| | | |
| | | |
Blucora, Inc.
Segment Information
(Unaudited) (In thousands)
Information on reportable segments and a reconciliation to consolidated net income (loss) are presented below (in thousands):
| | | | | | | | | | | | | | | | | | | | | | | |
| Three months ended
December 31, | | Year ended
December 31, |
| 2021 | | 2020 | | 2021 | | 2020 |
| Revenue: | | | | | | | |
| Wealth Management | $ | 172,192 | | | $ | 149,384 | | | $ | 658,213 | | | $ | 546,189 | |
| Tax Software | 6,139 | | | 5,773 | | | 226,987 | | | 208,763 | |
| Total revenue | 178,331 | | | 155,157 | | | 885,200 | | | 754,952 | |
| Operating income (loss): | | | | | | | |
| Wealth Management | 21,856 | | | 20,368 | | | 82,212 | | | 72,195 | |
| Tax Software | (18,593) | | | (11,025) | | | 81,879 | | | 49,621 | |
| Corporate-level activity | (31,217) | | | (33,031) | | | (133,472) | | | (390,936) | |
| Total operating income (loss) | (27,954) | | | (23,688) | | | 30,619 | | | (269,120) | |
| Interest expense and other, net | (7,878) | | | (7,918) | | | (32,080) | | | (31,304) | |
| Loss before income taxes | (35,832) | | | (31,606) | | | (1,461) | | | (300,424) | |
| Income tax benefit (expense) | 12,138 | | | (19,094) | | | 9,218 | | | (42,331) | |
| Net income (loss) | $ | (23,694) | | | $ | (50,700) | | | $ | 7,757 | | | $ | (342,755) | |
Revenues by major category within each segment are presented below (in thousands):
| | | | | | | | | | | | | | | | | | | | | | | |
| Three months ended
December 31, | | Year ended
December 31, |
| 2021 | | 2020 | | 2021 | | 2020 |
| Wealth Management: | | | | | | | |
| Advisory revenue | $ | 104,633 | | | $ | 87,079 | | | $ | 395,800 | | | $ | 314,751 | |
| Commission revenue | 53,480 | | | 49,864 | | | 210,677 | | | 185,201 | |
| Asset-based revenue | 5,587 | | | 4,777 | | | 22,101 | | | 23,688 | |
| Transaction and fee revenue | 8,492 | | | 7,664 | | | 29,635 | | | 22,549 | |
| Total Wealth Management revenue | $ | 172,192 | | | $ | 149,384 | | | $ | 658,213 | | | $ | 546,189 | |
| Tax Software: | | | | | | | |
| Consumer revenue | $ | 5,857 | | | $ | 5,502 | | | $ | 209,748 | | | $ | 192,226 | |
| Professional revenue | 282 | | | 271 | | | 17,239 | | | 16,537 | |
| Total Tax Software revenue | $ | 6,139 | | | $ | 5,773 | | | $ | 226,987 | | | $ | 208,763 | |
Corporate-level activity included the following (in thousands):
| | | | | | | | | | | | | | | | | | | | | | | | | | | | | | | |
| Three months ended
December 31, | | | | Year ended
December 31, | | |
| 2021 | | 2020 | | | | | | 2021 | | 2020 | | | | |
| Unallocated corporate-level general and administrative expenses | $ | 7,103 | | | $ | 7,118 | | | | | | | $ | 25,555 | | | $ | 26,689 | | | | | |
| Stock-based compensation | 5,255 | | | 2,846 | | | | | | | 20,754 | | | 10,066 | | | | | |
| Acquisition and integration | 4,285 | | | 12,303 | | | | | | | 32,798 | | | 31,085 | | | | | |
| Depreciation | 3,855 | | | 2,710 | | | | | | | 15,106 | | | 10,162 | | | | | |
| Amortization of acquired intangible assets | 7,073 | | | 7,578 | | | | | | | 28,320 | | | 29,745 | | | | | |
| Contested proxy and other legal and consulting costs | 3,646 | | | — | | | | | | | 10,939 | | | — | | | | | |
| Executive transition costs | — | | | 476 | | | | | | | — | | | 10,701 | | | | | |
| Headquarters relocation costs | — | | | — | | | | | | | — | | | 1,863 | | | | | |
| Impairment of goodwill | — | | | — | | | | | | | — | | | 270,625 | | | | | |
| Total corporate-level activity | $ | 31,217 | | | $ | 33,031 | | | | | | | $ | 133,472 | | | $ | 390,936 | | | | | |
Blucora, Inc.
Reconciliations of Non-GAAP Financial Measures to the Nearest Comparable GAAP Measures (1)
Adjusted EBITDA Reconciliation (1)
(Unaudited, in thousands) | | | | | | | | | | | | | | | | | | | | | | | |
| Three months ended
December 31, | | Year ended
December 31, |
| 2021 | | 2020 | | 2021 | | 2020 |
Net income (loss) (2) | $ | (23,694) | | | $ | (50,700) | | | $ | 7,757 | | | $ | (342,755) | |
| Stock-based compensation | 5,255 | | | 2,846 | | | 20,754 | | | 10,066 | |
| Depreciation and amortization of acquired intangible assets | 10,928 | | | 10,288 | | | 43,426 | | | 39,907 | |
| Interest expense and other, net | 7,878 | | | 7,918 | | | 32,080 | | | 31,304 | |
| Acquisition and integration—Excluding change in the fair value of HKFS Contingent Consideration | 1,385 | | | 3,003 | | | 10,398 | | | 22,785 | |
| Acquisition and integration—Change in the fair value of HKFS Contingent Consideration | 2,900 | | | 9,300 | | | 22,400 | | | 8,300 | |
| Contested proxy and other legal and consulting costs | 3,646 | | | — | | | 10,939 | | | — | |
| Impairment of goodwill | — | | | — | | | — | | | 270,625 | |
| Executive transition costs | — | | | 476 | | | — | | | 10,701 | |
| Headquarters relocation costs | — | | | — | | | — | | | 1,863 | |
| Income tax (benefit) expense | (12,138) | | | 19,094 | | | (9,218) | | | 42,331 | |
Adjusted EBITDA (1) | $ | (3,840) | | | $ | 2,225 | | | $ | 138,536 | | | $ | 95,127 | |
Non-GAAP Net Income (Loss) and Non-GAAP Net Income (Loss) Per Share Reconciliation (1)
(Unaudited, in thousands, except per share amounts) | | | | | | | | | | | | | | | | | | | | | | | |
| Three months ended
December 31, | | Year ended
December 31, |
| 2021 | | 2020 | | 2021 | | 2020 |
Net income (loss) (2) | $ | (23,694) | | | $ | (50,700) | | | $ | 7,757 | | | $ | (342,755) | |
| Stock-based compensation | 5,255 | | | 2,846 | | | 20,754 | | | 10,066 | |
| Amortization of acquired intangible assets | 7,073 | | | 7,578 | | | 28,320 | | | 29,745 | |
| Acquisition and integration—Excluding change in the fair value of HKFS Contingent Consideration | 1,385 | | | 3,003 | | | 10,398 | | | 22,785 | |
| Acquisition and integration—Change in the fair value of HKFS Contingent Consideration | 2,900 | | | 9,300 | | | 22,400 | | | 8,300 | |
| Contested proxy and other legal and consulting costs | 3,646 | | | — | | | 10,939 | | | — | |
| Impairment of goodwill | — | | | — | | | — | | | 270,625 | |
| Executive transition costs | — | | | 476 | | | — | | | 10,701 | |
| Non-capitalized debt issuance expenses | — | | | — | | | — | | | 3,687 | |
| Headquarters relocation costs | — | | | — | | | — | | | 1,863 | |
| Gain on sale of a business | — | | | — | | | — | | | (349) | |
| Cash tax impact of adjustments to GAAP net income (loss) | (351) | | | (234) | | | (1,874) | | | (1,647) | |
| Non-cash income tax (benefit) expense | (10,345) | | | 18,732 | | | (11,505) | | | 41,059 | |
Non-GAAP Net Income (Loss) (1) | $ | (14,131) | | | $ | (8,999) | | | $ | 87,189 | | | $ | 54,080 | |
| Per diluted share: | | | | | | | |
Net income (loss) (2) | $ | (0.49) | | | $ | (1.05) | | | $ | 0.16 | | | $ | (7.10) | |
| Stock-based compensation | 0.11 | | | 0.06 | | | 0.42 | | | 0.21 | |
| Amortization of acquired intangible assets | 0.14 | | | 0.15 | | | 0.57 | | | 0.61 | |
| Acquisition and integration—Excluding change in the fair value of HKFS Contingent Consideration | 0.03 | | | 0.06 | | | 0.21 | | | 0.47 | |
| Acquisition and integration—Change in the fair value of HKFS Contingent Consideration | 0.06 | | | 0.19 | | | 0.45 | | | 0.17 | |
| Contested proxy and other legal and consulting costs | 0.08 | | | — | | | 0.22 | | | — | |
| Impairment of goodwill | — | | | — | | | — | | | 5.61 | |
| Executive transition costs | — | | | 0.01 | | | — | | | 0.22 | |
| Non-capitalized debt issuance expenses | — | | | — | | | — | | | 0.08 | |
| Headquarters relocation costs | — | | | — | | | — | | | 0.04 | |
| Gain on sale of a business | — | | | — | | | — | | | (0.01) | |
| Cash tax impact of adjustments to GAAP net income (loss) | (0.01) | | | — | | | (0.04) | | | (0.03) | |
| Non-cash income tax (benefit) expense | (0.21) | | | 0.39 | | | (0.23) | | | 0.85 | |
Non-GAAP Net Income (Loss) per share - Diluted (1)(3) | $ | (0.29) | | | $ | (0.19) | | | $ | 1.76 | | | $ | 1.12 | |
Diluted weighted average shares outstanding (3) | 48,834 | | | 48,107 | | | 49,526 | | | 48,244 | |
Adjusted EBITDA Reconciliation for Forward-Looking Guidance (1)
(Unaudited, in thousands)
| | | | | | | | | | | | | | | |
| | | Ranges for the quarter ending |
| | | March 31, 2022 |
| | | | | Low | | High |
| Net income | | | | | $ | 38,000 | | | $ | 62,000 | |
| Stock-based compensation | | | | | 6,000 | | | 6,000 | |
| Depreciation and amortization of acquired intangible assets | | | | | 12,000 | | | 11,500 | |
| Interest expense and other, net | | | | | 8,000 | | | 7,500 | |
Acquisition, integration, and contested proxy and other legal and consulting costs (4) | | | | | 2,000 | | | 2,000 | |
| Income tax expense | | | | | 3,000 | | | 3,000 | |
Adjusted EBITDA (1) | | | | | $ | 69,000 | | | $ | 92,000 | |
Non-GAAP Net Income and Non-GAAP Net Income Per Share Reconciliation
for Forward-Looking Guidance (1)
(Unaudited, in thousands, except per share amounts)
| | | | | | | | | | | | | | | |
| | | Ranges for the quarter ending |
| | | March 31, 2022 |
| | | | | Low | | High |
| Net income | | | | | $ | 38,000 | | | $ | 62,000 | |
| Stock-based compensation | | | | | 6,000 | | | 6,000 | |
| Amortization of acquired intangible assets | | | | | 7,000 | | | 7,000 | |
Acquisition, integration, and contested proxy and other legal and consulting costs (4) | | | | | 2,000 | | | 2,000 | |
| Cash tax impact of adjustments to net income | | | | | (300) | | | (300) | |
| Non-cash income tax (benefit) expense | | | | | (200) | | | (200) | |
Non-GAAP Net Income (1) | | | | | $ | 52,500 | | | $ | 76,500 | |
| Per diluted share: | | | | | | | |
| Net income | | | | | $ | 0.75 | | | $ | 1.23 | |
| Stock-based compensation | | | | | 0.12 | | | 0.12 | |
| Amortization of acquired intangible assets | | | | | 0.14 | | | 0.14 | |
Acquisition, integration, and contested proxy and other legal and consulting costs (4) | | | | | 0.04 | | | 0.04 | |
| Cash tax impact of adjustments to net income | | | | | (0.01) | | | (0.01) | |
| Non-cash income tax (benefit) expense | | | | | — | | | — | |
Non-GAAP Net Income per share - Diluted (1)(3) | | | | | $ | 1.04 | | | $ | 1.52 | |
Diluted weighted average shares outstanding (3) | | | | | 50,285 | | | 50,285 | |
Notes to Reconciliations of Non-GAAP Financial Measures to the Nearest Comparable GAAP Measures
| (1) | We define Adjusted EBITDA as net income (loss), determined in accordance with GAAP, excluding the effects of stock-based compensation, depreciation and amortization of acquired intangible assets, interest expense and other, net, acquisition and integration costs, contested proxy and other legal and consulting costs, impairment of goodwill, executive transition costs, headquarters relocation costs, and income tax benefit (expense). Interest expense and other, net primarily consists of interest expense, net and non-capitalized debt issuance expenses. Acquisition and integration costs primarily relate to the acquisition of Avantax Planning Partners (formerly “HKFS”) and 1st Global. Impairment of goodwill relates to the impairment of our Wealth Management reporting unit goodwill in the first quarter of 2020. Executive transition costs relate to the departure of certain Company executives in the first quarter of 2020. Headquarters relocation costs relate to the process of moving from our Dallas and Irving offices to our new headquarters. |
We believe that Adjusted EBITDA provides meaningful supplemental information regarding our performance. We use this non-GAAP financial measure for internal management and compensation purposes, when publicly providing guidance on possible future results, and as a means to evaluate period-to-period comparisons. We believe that Adjusted EBITDA is a common measure used by investors and analysts to evaluate our performance, that it provides a more complete understanding of the results of operations and trends affecting our business when viewed together with GAAP results, and that management and investors benefit from referring to this non-GAAP financial measure. Items excluded from Adjusted EBITDA are significant and necessary components to the operations of our business and, therefore, Adjusted EBITDA should be considered as a supplement to, and not as a substitute for or superior to, GAAP net income (loss). Other companies may calculate Adjusted EBITDA differently and, therefore, our Adjusted EBITDA may not be comparable to similarly titled measures of other companies.
We define Non-GAAP Net Income (Loss) as net income (loss), determined in accordance with GAAP, excluding the effects of stock-based compensation, amortization of acquired intangible assets, acquisition and integration costs, contested proxy and other legal and consulting costs, impairment of goodwill, executive transition costs, non-capitalized debt issuance expenses, headquarters relocation costs, gain on the sale of a business, the related cash tax impact of those adjustments, and non-cash income tax (benefit) expense. We exclude the non-cash portion of income taxes because of our ability to offset a substantial portion of our cash tax liabilities by using deferred tax assets, which primarily consist of U.S. federal net operating losses. The majority of these net operating losses will expire, if not utilized, between 2022 and 2024. Gain on the sale of a business relates to the disposition of SimpleTax in 2019 and the subsequent working capital adjustment in the third quarter of 2020. Non-capitalized debt issuance expenses relate to the expense recognized as a result of the Term Loan increase in the third quarter of 2020.
We believe that Non-GAAP Net Income (Loss) and Non-GAAP Net Income (Loss) per share provide meaningful supplemental information to management, investors, and analysts regarding our performance and the valuation of our business by excluding items in the statement of operations that we do not consider part of our ongoing operations or that have not been, or are not expected to be, settled in cash. Additionally, we believe that Non-GAAP Net Income (Loss) and Non-GAAP Net Income (Loss) per share are common measures used by investors and analysts to evaluate our performance and the valuation of our business. Non-GAAP Net Income (Loss) and Non-GAAP Net Income (Loss) per share should be evaluated in light of our financial results prepared in accordance with GAAP and should be considered as a supplement to, and not as a substitute for or superior to, GAAP net income (loss) and GAAP net income (loss) per share. Other companies may calculate Non-GAAP Net Income (Loss) and Non-GAAP Net Income (Loss) per share differently, and, therefore, these measures may not be comparable to similarly titled measures of other companies.
| (2) | As presented in the condensed consolidated statements of operations (unaudited). |
| (3) | Any difference in the “per diluted share” amounts between this table and the condensed consolidated statements of operations (unaudited) is due to using different diluted weighted average shares outstanding in the event that there is GAAP net loss but Non-GAAP Net Income and vice versa. |
| (4) | The breakout of components cannot be determined on a forward-looking basis without unreasonable efforts. |
Blucora, Inc.
Supplemental Information
December 31, 2021
Table of Contents
| | | | | |
| Page |
| Financial Information: | |
| |
| |
| |
| |
| |
| |
| Operating Metrics: | |
| |
| |
Blucora Condensed Consolidated Statements of Operations | | | | | | | | | | | | | | | | | | | | | | | | | | | | | | | | | | | | | | | | | | | | | | | | | | | | | | | | | | | | | | | | | |
| (Unaudited, in thousands, except % and per share amounts. Rounding differences may exist) | 2019 | | 2020 | | 2021 |
| FY 12/31 | | 1Q | | 2Q | | 3Q | | 4Q | | FY 12/31 | | 1Q | | 2Q | | 3Q | | 4Q | | FY 12/31 |
| Segment revenue: | | | | | | | | | | | | | | | | | | | | | |
| Wealth Management | $ | 507,979 | | | $ | 144,989 | | | $ | 115,884 | | | $ | 135,932 | | | $ | 149,384 | | | $ | 546,189 | | | $ | 154,491 | | | $ | 162,395 | | | $ | 169,135 | | | $ | 172,192 | | | $ | 658,213 | |
| Tax Software | 209,966 | | | 118,331 | | | 45,238 | | | 39,421 | | | 5,773 | | | 208,763 | | | 123,892 | | | 91,917 | | | 5,039 | | | 6,139 | | | 226,987 | |
| Total segment revenue | 717,945 | | | 263,320 | | | 161,122 | | | 175,353 | | | 155,157 | | | 754,952 | | | 278,383 | | | 254,312 | | | 174,174 | | | 178,331 | | | 885,200 | |
| Operating expenses: | | | | | | | | | | | | | | | | | | | | | |
| Cost of revenue: | | | | | | | | | | | | | | | | | | | | | |
| Wealth Management | 352,081 | | | 102,342 | | | 83,868 | | | 96,122 | | | 103,630 | | | 385,962 | | | 108,623 | | | 113,910 | | | 120,641 | | | 121,119 | | | 464,293 | |
| Tax Software | 10,691 | | | 4,013 | | | 3,054 | | | 2,692 | | | 2,569 | | | 12,328 | | | 5,578 | | | 4,429 | | | 2,323 | | | 3,228 | | | 15,558 | |
| | | | | | | | | | | | | | | | | | | | | |
| Total segment cost of revenue | 362,772 | | | 106,355 | | | 86,922 | | | 98,814 | | | 106,199 | | | 398,290 | | | 114,201 | | | 118,339 | | | 122,964 | | | 124,347 | | | 479,851 | |
| Engineering and technology | 30,931 | | | 8,515 | | | 7,377 | | | 6,007 | | | 5,359 | | | 27,258 | | | 7,128 | | | 7,231 | | | 7,874 | | | 8,471 | | | 30,704 | |
| Sales and marketing | 126,205 | | | 79,710 | | | 40,057 | | | 31,018 | | | 26,833 | | | 177,618 | | | 77,562 | | | 34,848 | | | 28,399 | | | 32,522 | | | 173,331 | |
| General and administrative | 78,529 | | | 24,728 | | | 20,200 | | | 18,605 | | | 18,625 | | | 82,158 | | | 24,685 | | | 23,832 | | | 23,102 | | | 27,052 | | | 98,671 | |
| Acquisition and integration | 25,763 | | | 5,682 | | | 2,824 | | | 10,276 | | | 12,303 | | | 31,085 | | | 8,103 | | | 18,169 | | | 2,241 | | | 4,285 | | | 32,798 | |
| Depreciation | 5,479 | | | 1,796 | | | 1,675 | | | 1,874 | | | 1,948 | | | 7,293 | | | 2,300 | | | 3,204 | | | 2,867 | | | 2,535 | | | 10,906 | |
| Amortization of acquired intangible assets | 37,357 | | | 7,748 | | | 6,673 | | | 7,746 | | | 7,578 | | | 29,745 | | | 7,175 | | | 7,063 | | | 7,009 | | | 7,073 | | | 28,320 | |
Impairment of goodwill and an intangible asset (1) | 50,900 | | | 270,625 | | | — | | | — | | | — | | | 270,625 | | | — | | | — | | | — | | | — | | | — | |
| | | | | | | | | | | | | | | | | | | | | |
| Total operating expenses | 717,936 | | | 505,159 | | | 165,728 | | | 174,340 | | | 178,845 | | | 1,024,072 | | | 241,154 | | | 212,686 | | | 194,456 | | | 206,285 | | | 854,581 | |
| Operating income (loss) | 9 | | | (241,839) | | | (4,606) | | | 1,013 | | | (23,688) | | | (269,120) | | | 37,229 | | | 41,626 | | | (20,282) | | | (27,954) | | | 30,619 | |
| Interest expense and other, net | (16,915) | | | (6,135) | | | (5,288) | | | (11,963) | | | (7,918) | | | (31,304) | | | (7,883) | | | (8,024) | | | (8,295) | | | (7,878) | | | (32,080) | |
| Income (loss) before income taxes | (16,906) | | | (247,974) | | | (9,894) | | | (10,950) | | | (31,606) | | | (300,424) | | | 29,346 | | | 33,602 | | | (28,577) | | | (35,832) | | | (1,461) | |
| Income tax benefit (expense) | 65,054 | | | (67,520) | | | 59,539 | | | (15,256) | | | (19,094) | | | (42,331) | | | (1,700) | | | (1,994) | | | 774 | | | 12,138 | | | 9,218 | |
| | | | | | | | | | | | | | | | | | | | | |
| Net income (loss) | $ | 48,148 | | | $ | (315,494) | | | $ | 49,645 | | | $ | (26,206) | | | $ | (50,700) | | | $ | (342,755) | | | $ | 27,646 | | | $ | 31,608 | | | $ | (27,803) | | | $ | (23,694) | | | $ | 7,757 | |
| | | | | | | | | | | | | | | | | | | | | |
| Net income (loss) per share: | | | | | | | | | | | | | | | | | | | | | |
| Basic | $ | 1.00 | | | $ | (6.60) | | | $ | 1.04 | | | $ | (0.55) | | | $ | (1.05) | | | $ | (7.14) | | | $ | 0.57 | | | $ | 0.65 | | | $ | (0.57) | | | $ | (0.49) | | | $ | 0.16 | |
| Diluted | $ | 0.98 | | | $ | (6.60) | | | $ | 1.03 | | | $ | (0.55) | | | $ | (1.05) | | | $ | (7.14) | | | $ | 0.56 | | | $ | 0.64 | | | $ | (0.57) | | | $ | (0.49) | | | $ | 0.16 | |
| | | | | | | | | | | | | | | | | | | | | |
| Weighted average shares outstanding: | | | | | | | | | | | | | | | | | | | | | |
| Basic | 48,264 | | | 47,827 | | | 47,941 | | | 48,039 | | | 48,107 | | | 47,978 | | | 48,261 | | | 48,508 | | | 48,707 | | | 48,834 | | | 48,578 | |
| Diluted | 49,282 | | | 47,827 | | | 48,092 | | | 48,039 | | | 48,107 | | | 47,978 | | | 49,097 | | | 49,385 | | | 48,707 | | | 48,834 | | | 49,526 | |
____________________________
| (1) | In the first quarter of 2020, we recognized a $270.6 million goodwill impairment related to our Wealth Management reporting unit. In 2019, we recognized a $50.9 million impairment of an intangible asset related to the HD Vest trade name intangible asset. |
Blucora Condensed Consolidated Financial Results (1) | | | | | | | | | | | | | | | | | | | | | | | | | | | | | | | | | | | | | | | | | | | | | | | | | | | | | | | | | | | | | | | | | |
| (Unaudited, in thousands, except % and per share amounts. Rounding differences may exist) | 2019 | | 2020 | | 2021 |
| FY 12/31 | | 1Q | | 2Q | | 3Q | | 4Q | | FY 12/31 | | 1Q | | 2Q | | 3Q | | 4Q | | FY 12/31 |
| Segment revenue: | | | | | | | | | | | | | | | | | | | | | |
Wealth Management (1) | $ | 507,979 | | | $ | 144,989 | | | $ | 115,884 | | | $ | 135,932 | | | $ | 149,384 | | | $ | 546,189 | | | $ | 154,491 | | | $ | 162,395 | | | $ | 169,135 | | | $ | 172,192 | | | $ | 658,213 | |
Tax Software (2) | 209,966 | | | 118,331 | | | 45,238 | | | 39,421 | | | 5,773 | | | 208,763 | | | 123,892 | | | 91,917 | | | 5,039 | | | 6,139 | | | 226,987 | |
| Total segment revenue | $ | 717,945 | | | $ | 263,320 | | | $ | 161,122 | | | $ | 175,353 | | | $ | 155,157 | | | $ | 754,952 | | | $ | 278,383 | | | $ | 254,312 | | | $ | 174,174 | | | $ | 178,331 | | | $ | 885,200 | |
Segment operating income: (3) | | | | | | | | | | | | | | | | | | | | | |
Wealth Management (1) | $ | 68,292 | | | $ | 22,598 | | | $ | 11,731 | | | $ | 17,498 | | | $ | 20,368 | | | $ | 72,195 | | | $ | 19,396 | | | $ | 21,396 | | | $ | 19,564 | | | $ | 21,856 | | | $ | 82,212 | |
Tax Software (2) | 96,249 | | | 37,753 | | | 6,659 | | | 16,234 | | | (11,025) | | | 49,621 | | | 50,888 | | | 63,448 | | | (13,864) | | | (18,593) | | | 81,879 | |
| Total segment operating income | $ | 164,541 | | | $ | 60,351 | | | $ | 18,390 | | | $ | 33,732 | | | $ | 9,343 | | | $ | 121,816 | | | $ | 70,284 | | | $ | 84,844 | | | $ | 5,700 | | | $ | 3,263 | | | $ | 164,091 | |
| Segment operating income as a % of segment revenue: | | | | | | | | | | | | | | | | | | | | | |
Wealth Management (1) | 13 | % | | 16 | % | | 10 | % | | 13 | % | | 14 | % | | 13 | % | | 13 | % | | 13 | % | | 12 | % | | 13 | % | | 12 | % |
Tax Software (2) | 46 | % | | 32 | % | | 15 | % | | 41 | % | | (191) | % | | 24 | % | | 41 | % | | 69 | % | | (275) | % | | (303) | % | | 36 | % |
| Total segment operating income as a % of segment revenue | 23 | % | | 23 | % | | 11 | % | | 19 | % | | 6 | % | | 16 | % | | 25 | % | | 33 | % | | 3 | % | | 2 | % | | 19 | % |
Unallocated corporate-level general and administrative expenses (3) | $ | 27,361 | | | $ | 7,016 | | | $ | 5,810 | | | $ | 6,745 | | | $ | 7,118 | | | $ | 26,689 | | | $ | 5,694 | | | $ | 6,259 | | | $ | 6,499 | | | $ | 7,103 | | | $ | 25,555 | |
Adjusted EBITDA (4) | $ | 137,180 | | | $ | 53,335 | | | $ | 12,580 | | | $ | 26,987 | | | $ | 2,225 | | | $ | 95,127 | | | $ | 64,590 | | | $ | 78,585 | | | $ | (799) | | | $ | (3,840) | | | $ | 138,536 | |
Other unallocated corporate-level operating expenses: (3) | | | | | | | | | | | | | | | | | | | | | |
| Stock-based compensation | $ | 16,300 | | | $ | (1,201) | | | $ | 3,904 | | | $ | 4,517 | | | $ | 2,846 | | | $ | 10,066 | | | $ | 5,610 | | | $ | 5,160 | | | $ | 4,729 | | | $ | 5,255 | | | $ | 20,754 | |
| Acquisition and integration—Excluding change in the fair value of acquisition-related contingent consideration | 25,763 | | | 5,682 | | | 2,824 | | | 11,276 | | | 3,003 | | | 22,785 | | | 1,803 | | | 6,669 | | | 541 | | | 1,385 | | | 10,398 | |
| Acquisition and integration—Change in the fair value of acquisition-related contingent consideration | — | | | — | | | — | | | (1,000) | | | 9,300 | | | 8,300 | | | 6,300 | | | 11,500 | | | 1,700 | | | 2,900 | | | 22,400 | |
| Depreciation | 6,851 | | | 2,420 | | | 2,412 | | | 2,620 | | | 2,710 | | | 10,162 | | | 3,243 | | | 4,102 | | | 3,906 | | | 3,855 | | | 15,106 | |
| Amortization of acquired intangible assets | 37,357 | | | 7,748 | | | 6,673 | | | 7,746 | | | 7,578 | | | 29,745 | | | 7,175 | | | 7,063 | | | 7,009 | | | 7,073 | | | 28,320 | |
| Executive transition costs | — | | | 9,184 | | | 636 | | | 405 | | | 476 | | | 10,701 | | | — | | | — | | | — | | | — | | | — | |
| Headquarters relocation costs | — | | | 716 | | | 737 | | | 410 | | | — | | | 1,863 | | | — | | | — | | | — | | | — | | | — | |
| Contested proxy and other legal and consulting costs | — | | | — | | | — | | | — | | | — | | | — | | | 3,230 | | | 2,465 | | | 1,598 | | | 3,646 | | | 10,939 | |
| Impairment of goodwill and an intangible asset | 50,900 | | | 270,625 | | | — | | | — | | | — | | | 270,625 | | | — | | | — | | | — | | | — | | | — | |
| | | | | | | | | | | | | | | | | | | | | |
| Operating income (loss) | $ | 9 | | | $ | (241,839) | | | $ | (4,606) | | | $ | 1,013 | | | $ | (23,688) | | | $ | (269,120) | | | $ | 37,229 | | | $ | 41,626 | | | $ | (20,282) | | | $ | (27,954) | | | $ | 30,619 | |
Unallocated interest expense and other, net: (3) | | | | | | | | | | | | | | | | | | | | | |
| Interest expense | $ | 19,017 | | | $ | 5,316 | | | $ | 4,840 | | | $ | 7,254 | | | $ | 7,160 | | | $ | 24,570 | | | $ | 7,183 | | | $ | 7,302 | | | $ | 7,304 | | | $ | 7,018 | | | $ | 28,807 | |
| Amortization of debt issuance costs | 1,042 | | | 313 | | | 331 | | | 362 | | | 366 | | | 1,372 | | | 363 | | | 377 | | | 388 | | | 394 | | | 1,522 | |
| Accretion of debt discounts | 228 | | | 68 | | | 70 | | | 276 | | | 279 | | | 693 | | | 277 | | | 284 | | | 290 | | | 295 | | | 1,146 | |
| Total interest expense | 20,287 | | | 5,697 | | | 5,241 | | | 7,892 | | | 7,805 | | | 26,635 | | | 7,823 | | | 7,963 | | | 7,982 | | | 7,707 | | | 31,475 | |
| Interest income | (449) | | | (14) | | | (11) | | | (2) | | | (38) | | | (65) | | | (2) | | | — | | | — | | | (19) | | | (21) | |
| Gain on sale of a business | (3,256) | | | — | | | — | | | (349) | | | — | | | (349) | | | — | | | — | | | — | | | — | | | — | |
| Non-capitalized debt issuance expenses | — | | | — | | | — | | | 3,687 | | | — | | | 3,687 | | | — | | | — | | | — | | | — | | | — | |
| Other | 333 | | | 452 | | | 58 | | | 735 | | | 151 | | | 1,396 | | | 62 | | | 61 | | | 313 | | | 190 | | | 626 | |
| Total interest expense and other, net | 16,915 | | | 6,135 | | | 5,288 | | | 11,963 | | | 7,918 | | | 31,304 | | | 7,883 | | | 8,024 | | | 8,295 | | | 7,878 | | | 32,080 | |
| Income (loss) before income taxes | (16,906) | | | (247,974) | | | (9,894) | | | (10,950) | | | (31,606) | | | (300,424) | | | 29,346 | | | 33,602 | | | (28,577) | | | (35,832) | | | (1,461) | |
| Income tax (benefit) expense: | | | | | | | | | | | | | | | | | | | | | |
| Cash | 3,564 | | | 483 | | | 158 | | | 269 | | | 362 | | | 1,272 | | | 1,969 | | | 2,688 | | | (577) | | | (1,793) | | | 2,287 | |
Non-cash (5) | (68,618) | | | 67,037 | | | (59,697) | | | 14,987 | | | 18,732 | | | 41,059 | | | (269) | | | (694) | | | (197) | | | (10,345) | | | (11,505) | |
| Total income tax (benefit) expense | (65,054) | | | 67,520 | | | (59,539) | | | 15,256 | | | 19,094 | | | 42,331 | | | 1,700 | | | 1,994 | | | (774) | | | (12,138) | | | (9,218) | |
| GAAP Net Income (Loss) | $ | 48,148 | | | $ | (315,494) | | | $ | 49,645 | | | $ | (26,206) | | | $ | (50,700) | | | $ | (342,755) | | | $ | 27,646 | | | $ | 31,608 | | | $ | (27,803) | | | $ | (23,694) | | | $ | 7,757 | |
| | | | | | | | | | | | | | | | | | | | | |
| | | | | | | | | | | | | | | | | | | | | |
| GAAP Net Income (Loss) per share - Diluted | $ | 0.98 | | | $ | (6.60) | | | $ | 1.03 | | | $ | (0.55) | | | $ | (1.05) | | | $ | (7.14) | | | $ | 0.56 | | | $ | 0.64 | | | $ | (0.57) | | | $ | (0.49) | | | $ | 0.16 | |
Non-GAAP Net Income (Loss) (4) | $ | 104,198 | | | $ | 43,561 | | | $ | 4,463 | | | $ | 15,055 | | | $ | (8,999) | | | $ | 54,080 | | | $ | 50,952 | | | $ | 63,122 | | | $ | (12,754) | | | $ | (14,131) | | | $ | 87,189 | |
Non-GAAP Net Income (Loss) per share - Diluted (4) (6) | $ | 2.11 | | | $ | 0.90 | | | $ | 0.09 | | | $ | 0.31 | | | $ | (0.19) | | | $ | 1.12 | | | $ | 1.04 | | | $ | 1.28 | | | $ | (0.26) | | | $ | (0.29) | | | $ | 1.76 | |
| | | | | | | | | | | | | | | | | | | | | |
| Basic weighted average shares outstanding | 48,264 | | | 47,827 | | | 47,941 | | | 48,039 | | | 48,107 | | | 47,978 | | | 48,261 | | | 48,508 | | | 48,707 | | | 48,834 | | | 48,578 | |
Diluted weighted average shares outstanding (6) | 49,282 | | | 47,827 | | | 48,092 | | | 48,039 | | | 48,107 | | | 47,978 | | | 49,097 | | | 49,385 | | | 48,707 | | | 48,834 | | | 49,526 | |
Notes to Condensed Consolidated Financial Results on next page
Notes to Condensed Consolidated Financial Results
| (1) | The operations of 1st Global are included in the Company's operating results as part of the Wealth Management segment beginning May 6, 2019 when 1st Global was acquired. The operations of Avantax Planning Partners (formerly "HKFS") are included in the Company's operating results as part of the Wealth Management segment beginning July 1, 2020 when HKFS was acquired. |
| (2) | As a highly seasonal business, a significant portion of Tax Software revenue is typically generated in the first two quarters of the calendar year. In March 2020 and as a result of the COVID-19 pandemic, the Internal Revenue Service (“IRS”) extended the filing deadline for federal tax returns from April 15, 2020 to July 15, 2020. This filing extension resulted in the shifting of a significant portion of Tax Software segment revenue that is usually earned in the first and second quarters to the third quarter of 2020. As a result of the continued impact of the COVID-19 pandemic, including disruptions associated with the distribution of the second and third rounds of Economic Impact Payments, the IRS delayed the start of the 2021 tax season and extended the filing and payment deadline for tax year 2020 federal tax returns from April 15, 2021 to May 17, 2021. In addition, the IRS extended the federal filing and payment deadline for Texas, Louisiana, and Oklahoma to June 15, 2021. Beyond federal filings, the majority of states also extended their filing and payment deadlines for tax year 2020 state tax returns. This extension resulted in the shifting of a significant portion of Tax Software segment revenue that is usually earned in the first quarter to the second quarter of 2021. |
| (3) | We do not allocate certain operating expenses (including personnel and overhead costs), stock-based compensation, acquisition and integration costs, depreciation, amortization of acquired intangible assets, executive transition costs, headquarters relocation costs, contested proxy and other legal and consulting costs, impairment of goodwill and an intangible asset, interest expense and other, net, or income taxes to the reportable segments. General and administrative costs are included in "Unallocated corporate-level expenses." |
| (4) | See the Reconciliation of Certain Non-GAAP Financial Measures to the Nearest Comparable GAAP Financial Measures on page 5. |
| (5) | Amounts represent the non-cash portion of income taxes. We exclude the non-cash portion of income taxes because of our ability to offset a substantial portion of our cash tax liabilities by using deferred tax assets, which primarily consist of U.S. federal net operating losses. The majority of these federal net operating losses will expire, if not utilized, between 2022 and 2024. |
| (6) | For periods in which non-GAAP net income is generated, non-GAAP net income per share is calculated using diluted weighted average shares outstanding. For periods in which non-GAAP net loss is generated, diluted weighted average shares outstanding is the same as basic weighted average shares outstanding. |
Blucora Reconciliation of Certain Non-GAAP Financial Measures to the Nearest Comparable GAAP Financial Measures (1) (2) | | | | | | | | | | | | | | | | | | | | | | | | | | | | | | | | | | | | | | | | | | | | | | | | | | | | | | | | | | | | | | | | | |
| 2019 | | 2020 | | 2021 |
| (Unaudited, in thousands, rounding differences may exist) | FY 12/31 | | 1Q | | 2Q | | 3Q | | 4Q | | FY 12/31 | | 1Q | | 2Q | | 3Q | | 4Q | | FY 12/31 |
Adjusted EBITDA (1) | | | | | | | | | | | | | | | | | | | | | |
Net income (loss) (2) | $ | 48,148 | | | $ | (315,494) | | | $ | 49,645 | | | $ | (26,206) | | | $ | (50,700) | | | $ | (342,755) | | | $ | 27,646 | | | $ | 31,608 | | | $ | (27,803) | | | $ | (23,694) | | | $ | 7,757 | |
| Stock-based compensation | 16,300 | | | (1,201) | | | 3,904 | | | 4,517 | | | 2,846 | | | 10,066 | | | 5,610 | | | 5,160 | | | 4,729 | | | 5,255 | | | 20,754 | |
| Depreciation and amortization of acquired intangible assets | 44,208 | | | 10,168 | | | 9,085 | | | 10,366 | | | 10,288 | | | 39,907 | | | 10,418 | | | 11,165 | | | 10,915 | | | 10,928 | | | 43,426 | |
| Interest expense and other, net | 16,915 | | | 6,135 | | | 5,288 | | | 11,963 | | | 7,918 | | | 31,304 | | | 7,883 | | | 8,024 | | | 8,295 | | | 7,878 | | | 32,080 | |
| Acquisition and integration—Excluding change in the fair value of HKFS Contingent Consideration | 25,763 | | | 5,682 | | | 2,824 | | | 11,276 | | | 3,003 | | | 22,785 | | | 1,803 | | | 6,669 | | | 541 | | | 1,385 | | | 10,398 | |
| Acquisition and integration—Change in the fair value of HKFS Contingent Consideration | — | | | — | | | — | | | (1,000) | | | 9,300 | | | 8,300 | | | 6,300 | | | 11,500 | | | 1,700 | | | 2,900 | | | 22,400 | |
| Executive transition costs | — | | | 9,184 | | | 636 | | | 405 | | | 476 | | | 10,701 | | | — | | | — | | | — | | | — | | | — | |
| Headquarters relocation costs | — | | | 716 | | | 737 | | | 410 | | | — | | | 1,863 | | | — | | | — | | | — | | | — | | | — | |
| Contested proxy and other legal and consulting costs | — | | | — | | | — | | | — | | | — | | | — | | | 3,230 | | | 2,465 | | | 1,598 | | | 3,646 | | | 10,939 | |
| | | | | | | | | | | | | | | | | | | | | |
| | | | | | | | | | | | | | | | | | | | | |
| Income tax (benefit) expense | (65,054) | | | 67,520 | | | (59,539) | | | 15,256 | | | 19,094 | | | 42,331 | | | 1,700 | | | 1,994 | | | (774) | | | (12,138) | | | (9,218) | |
| Impairment of goodwill and an intangible asset | 50,900 | | | 270,625 | | | — | | | — | | | — | | | 270,625 | | | — | | | — | | | — | | | — | | | — | |
Adjusted EBITDA(1) | $ | 137,180 | | | $ | 53,335 | | | $ | 12,580 | | | $ | 26,987 | | | $ | 2,225 | | | $ | 95,127 | | | $ | 64,590 | | | $ | 78,585 | | | $ | (799) | | | $ | (3,840) | | | $ | 138,536 | |
Non-GAAP Net Income (Loss) (1) | | | | | | | | | | | | | | | | | | | | | |
Net income (loss) (2) | $ | 48,148 | | | $ | (315,494) | | | $ | 49,645 | | | $ | (26,206) | | | $ | (50,700) | | | $ | (342,755) | | | $ | 27,646 | | | $ | 31,608 | | | $ | (27,803) | | | $ | (23,694) | | | $ | 7,757 | |
| Stock-based compensation | 16,300 | | | (1,201) | | | 3,904 | | | 4,517 | | | 2,846 | | | 10,066 | | | 5,610 | | | 5,160 | | | 4,729 | | | 5,255 | | | 20,754 | |
| Amortization of acquired intangible assets | 37,357 | | | 7,748 | | | 6,673 | | | 7,746 | | | 7,578 | | | 29,745 | | | 7,175 | | | 7,063 | | | 7,009 | | | 7,073 | | | 28,320 | |
| Acquisition and integration—Excluding change in the fair value of HKFS Contingent Consideration | 25,763 | | | 5,682 | | | 2,824 | | | 11,276 | | | 3,003 | | | 22,785 | | | 1,803 | | | 6,669 | | | 541 | | | 1,385 | | | 10,398 | |
| Acquisition and integration—Change in the fair value of HKFS Contingent Consideration | — | | | — | | | — | | | (1,000) | | | 9,300 | | | 8,300 | | | 6,300 | | | 11,500 | | | 1,700 | | | 2,900 | | | 22,400 | |
| Executive transition costs | — | | | 9,184 | | | 636 | | | 405 | | | 476 | | | 10,701 | | | — | | | — | | | — | | | — | | | — | |
| Headquarters relocation costs | — | | | 716 | | | 737 | | | 410 | | | — | | | 1,863 | | | — | | | — | | | — | | | — | | | — | |
| Contested proxy and other legal and consulting costs | — | | | — | | | — | | | — | | | — | | | — | | | 3,230 | | | 2,465 | | | 1,598 | | | 3,646 | | | 10,939 | |
| Non-capitalized debt issuance expenses | — | | | — | | | — | | | 3,687 | | | — | | | 3,687 | | | — | | | — | | | — | | | — | | | — | |
| | | | | | | | | | | | | | | | | | | | | |
| | | | | | | | | | | | | | | | | | | | | |
| Impairment of goodwill and an intangible asset | 50,900 | | | 270,625 | | | — | | | — | | | — | | | 270,625 | | | — | | | — | | | — | | | — | | | — | |
| Gain on the sale of a business | (3,256) | | | — | | | — | | | (349) | | | — | | | (349) | | | — | | | — | | | — | | | — | | | — | |
| Cash tax impact of adjustments to GAAP net income (loss) | (2,396) | | | (736) | | | (259) | | | (418) | | | (234) | | | (1,647) | | | (543) | | | (649) | | | (331) | | | (351) | | | (1,874) | |
| Non-cash income tax (benefit) expense | (68,618) | | | 67,037 | | | (59,697) | | | 14,987 | | | 18,732 | | | 41,059 | | | (269) | | | (694) | | | (197) | | | (10,345) | | | (11,505) | |
Non-GAAP Net Income (Loss) (1) | $ | 104,198 | | | $ | 43,561 | | | $ | 4,463 | | | $ | 15,055 | | | $ | (8,999) | | | $ | 54,080 | | | $ | 50,952 | | | $ | 63,122 | | | $ | (12,754) | | | $ | (14,131) | | | $ | 87,189 | |
| | | | | | | | | | | | | | | | | | | | | |
Non-GAAP Net Income (Loss) per share - Diluted (1) (3) | $ | 2.11 | | | $ | 0.90 | | | $ | 0.09 | | | $ | 0.31 | | | $ | (0.19) | | | $ | 1.12 | | | $ | 1.04 | | | $ | 1.28 | | | $ | (0.26) | | | $ | (0.29) | | | $ | 1.76 | |
Diluted weighted average shares outstanding (3) | 49,282 | | | 48,253 | | | 48,092 | | | 48,203 | | | 48,107 | | | 48,244 | | | 49,097 | | | 49,385 | | | 48,707 | | | 48,834 | | | 49,526 | |
Notes to Reconciliations of Certain Non-GAAP Financial Measures to the Nearest Comparable GAAP Measures on next page
Notes to Reconciliations of Certain Non-GAAP Financial Measures to the Nearest Comparable GAAP Measures
| (1) | We define Adjusted EBITDA as net income (loss), determined in accordance with GAAP, excluding the effects of stock-based compensation, depreciation and amortization of acquired intangible assets, interest expense and other, net, acquisition and integration costs, contested proxy and other legal and consulting costs, impairment of goodwill, executive transition costs, headquarters relocation costs, and income tax benefit (expense). Interest expense and other, net primarily consists of interest expense, net and non-capitalized debt issuance expenses. Acquisition and integration costs primarily relate to the acquisition of Avantax Planning Partners and 1st Global. Impairment of goodwill relates to the impairment of our Wealth Management reporting unit goodwill in the first quarter of 2020. Executive transition costs relate to the departure of certain Company executives in the first quarter of 2020. Headquarters relocation costs relate to the process of moving from our Dallas and Irving offices to our new headquarters. |
We believe that Adjusted EBITDA provides meaningful supplemental information regarding our performance. We use this non-GAAP financial measure for internal management and compensation purposes, when publicly providing guidance on possible future results, and as a means to evaluate period-to-period comparisons. We believe that Adjusted EBITDA is a common measure used by investors and analysts to evaluate our performance, that it provides a more complete understanding of the results of operations and trends affecting our business when viewed together with GAAP results, and that management and investors benefit from referring to this non-GAAP financial measure. Items excluded from Adjusted EBITDA are significant and necessary components to the operations of our business and, therefore, Adjusted EBITDA should be considered as a supplement to, and not as a substitute for or superior to, GAAP net income (loss). Other companies may calculate Adjusted EBITDA differently and, therefore, our Adjusted EBITDA may not be comparable to similarly titled measures of other companies.
We define Non-GAAP Net Income (Loss) as net income (loss), determined in accordance with GAAP, excluding the effects of stock-based compensation, amortization of acquired intangible assets, acquisition and integration costs, contested proxy and other legal and consulting costs, impairment of goodwill, executive transition costs, non-capitalized debt issuance expenses, headquarters relocation costs, gain on the sale of a business, the related cash tax impact of those adjustments, and non-cash income tax (benefit) expense. We exclude the non-cash portion of income taxes because of our ability to offset a substantial portion of our cash tax liabilities by using deferred tax assets, which primarily consist of U.S. federal net operating losses. The majority of these net operating losses will expire, if not utilized, between 2022 and 2024. Gain on the sale of a business relates to the disposition of SimpleTax in 2019 and the subsequent working capital adjustment in the third quarter of 2020. Non-capitalized debt issuance expenses relate to the expense recognized as a result of the Term Loan increase in the third quarter of 2020.
We believe that Non-GAAP Net Income (Loss) and Non-GAAP Net Income (Loss) per share provide meaningful supplemental information to management, investors, and analysts regarding our performance and the valuation of our business by excluding items in the statement of operations that we do not consider part of our ongoing operations or that have not been, or are not expected to be, settled in cash. Additionally, we believe that Non-GAAP Net Income (Loss) and Non-GAAP Net Income (Loss) per share are common measures used by investors and analysts to evaluate our performance and the valuation of our business. Non-GAAP Net Income (Loss) and Non-GAAP Net Income (Loss) per share should be evaluated in light of our financial results prepared in accordance with GAAP and should be considered as a supplement to, and not as a substitute for or superior to, GAAP net income (loss) and GAAP net income (loss) per share. Other companies may calculate Non-GAAP Net Income (Loss) and Non-GAAP Net Income (Loss) per share differently, and, therefore, these measures may not be comparable to similarly titled measures of other companies.
| (2) | See the Condensed Consolidated Financial Results on page 3. |
| (3) | For periods in which non-GAAP net income is generated, Non-GAAP Net Income (Loss) per share is calculated using diluted weighted average shares outstanding. For periods in which Non-GAAP Net Loss is generated, diluted weighted average shares outstanding is the same as basic weighted average shares outstanding. |
Blucora Reconciliation of Trailing Twelve Month ("TTM") Adjusted EBITDA (1) (2)
| | | | | | | | | | | | | | | | | | | | | | | | | | | | | | | | | | | | | | | | | | | | | | | | | | | | | | | |
| 2019 | | 2020 | 2021 | | |
| (Unaudited, in thousands, rounding differences may exist) | TTM 4Q | | TTM 1Q | | TTM 2Q | | TTM 3Q | | TTM 4Q | | TTM 1Q | | TTM 2Q | | TTM 3Q | | TTM 4Q | | |
Adjusted EBITDA (1) (2) | | | | | | | | | | | | | | | | | | | |
| Net income (loss) | $ | 48,148 | | | $ | (329,516) | | | $ | (310,907) | | | $ | (274,727) | | | $ | (342,755) | | | $ | 385 | | | $ | (17,652) | | | $ | (19,249) | | | $ | 7,757 | | | |
| Stock-based compensation | 16,300 | | | 12,656 | | | 12,478 | | | 12,356 | | | 10,066 | | | 16,877 | | | 18,133 | | | 18,345 | | | 20,754 | | | |
| Depreciation and amortization of acquired intangible assets | 44,208 | | | 45,022 | | | 43,276 | | | 41,749 | | | 39,907 | | | 40,157 | | | 42,237 | | | 42,786 | | | 43,426 | | | |
| Interest expense and other, net | 16,915 | | | 19,092 | | | 19,262 | | | 28,619 | | | 31,304 | | | 33,052 | | | 35,788 | | | 32,120 | | | 32,080 | | | |
| Acquisition and integration—Excluding change in the fair value of HKFS Contingent Consideration | 25,763 | | | 29,648 | | | 23,289 | | | 27,806 | | | 22,785 | | | 18,906 | | | 22,751 | | | 12,016 | | | 10,398 | | | |
| Acquisition and integration—Change in the fair value of HKFS Contingent Consideration | — | | | — | | | — | | | (1,000) | | | 8,300 | | | 14,600 | | | 26,100 | | | 28,800 | | | 22,400 | | | |
| Executive transition costs | — | | | 9,184 | | | 9,820 | | | 10,225 | | | 10,701 | | | 1,517 | | | 881 | | | 476 | | | — | | | |
| Headquarter relocation costs | — | | | 716 | | | 1,453 | | | 1,863 | | | 1,863 | | | 1,147 | | | 410 | | | — | | | — | | | |
| Contested proxy and other legal and consulting costs | — | | | — | | | — | | | — | | | — | | | 3,230 | | | 5,695 | | | 7,293 | | | 10,939 | | | |
| | | | | | | | | | | | | | | | | | | |
| Impairment of goodwill and an intangible asset | 50,900 | | | 321,525 | | | 321,525 | | | 270,625 | | | 270,625 | | | — | | | — | | | — | | | — | | | |
| Income tax (benefit) expense | (65,054) | | | (1,519) | | | (52,934) | | | (25,347) | | | 42,331 | | | (23,489) | | | 38,044 | | | 22,014 | | | (9,218) | | | |
Adjusted EBITDA(1) | $ | 137,180 | | | $ | 106,808 | | | $ | 67,262 | | | $ | 92,169 | | | $ | 95,127 | | | $ | 106,382 | | | $ | 172,387 | | | $ | 144,601 | | | $ | 138,536 | | | |
Blucora Net Leverage Ratio (1) (3) (4) | | | | | | | | | | | | | | | | | | | | | | | | | | | | | | | | | | | | | | | | | | | | | | | | | | | | | | | | | | |
| 2019 | | 2020 | | 2021 | | | |
| (Unaudited, in thousands, rounding differences may exist) | 4Q | | 1Q | | 2Q | | 3Q | | 4Q | | 1Q | | 2Q | | 3Q | | 4Q | | | |
| DEBT: | | | | | | | | | | | | | | | | | | | | |
| Senior Secured Credit Facility | $ | 399,687 | | | $ | 444,375 | | | $ | 389,062 | | | $ | 563,609 | | | $ | 563,156 | | | $ | 562,703 | | | $ | 562,250 | | | $ | 561,797 | | | $ | 561,344 | | | | |
| CASH: | | | | | | | | | | | | | | | | | | | | |
| Cash and cash equivalents | 80,820 | | | 168,198 | | | 90,081 | | | 151,166 | | | 150,125 | | | 191,803 | | | 232,409 | | | 184,926 | | | 134,824 | | | | |
NET DEBT (3) | $ | 318,867 | | | $ | 276,177 | | | $ | 298,981 | | | $ | 412,443 | | | $ | 413,031 | | | $ | 370,900 | | | $ | 329,841 | | | $ | 376,871 | | | $ | 426,520 | | | | |
| | | | | | | | | | | | | | | | | | | | |
| Last twelve months: | | | | | | | | | | | | | | | | | | | | |
| | | | | | | | | | | | | | | | | | | | |
| | | | | | | | | | | | | | | | | | | | |
| | | | | | | | | | | | | | | | | | | | |
| | | | | | | | | | | | | | | | | | | | |
| | | | | | | | | | | | | | | | | | | | |
ADJUSTED EBITDA (1) (2) | $ | 137,180 | | | $ | 106,808 | | | $ | 67,262 | | | $ | 92,169 | | | $ | 95,127 | | | $ | 106,382 | | | $ | 172,387 | | | $ | 144,601 | | | $ | 138,536 | | | | |
| | | | | | | | | | | | | | | | | | | | |
NET LEVERAGE RATIO (1) (3) (4) | 2.3 | | x | 2.6 | | x | 4.4 | | x | 4.5 | | x | 4.3 | | x | 3.5 | | x | 1.9 | | x | 2.6 | | x | 3.1 | | x | | |
| | | | | | | | | | | | | | | | | | | | |
____________________________
| (1) | Non-GAAP measure using Adjusted EBITDA for the last twelve months. Adjusted EBITDA for the trailing twelve month period is reconciled to the nearest comparable GAAP measure, net income (loss). |
| (2) | For additional information on Adjusted EBITDA and its use as a non-GAAP measure, see page 6. |
| (3) | We define Net Debt, a non-GAAP financial measure, as the outstanding principal of debt less cash and cash equivalents. Management believes that the presentation of this non-GAAP financial measure provides useful information to investors because it is an important liquidity measurement that reflects our ability to service our debt. |
| (4) | Net leverage ratio is calculated by dividing net debt by Adjusted EBITDA for the trailing twelve months. |
Blucora Reconciliation of Operating Free Cash Flow (1) | | | | | | | | | | | | | | | | | | | | | | | | | | | | | | | | | | | | | | | | | | | | | | | | | | | | | | | | | | | | | | | | | |
| 2019 | | 2020 | | 2021 |
| (Unaudited, in thousands, rounding differences may exist) | FY 12/31 | | 1Q | | 2Q | | 3Q | | 4Q | | FY 12/31 | | 1Q | | 2Q | | 3Q | | 4Q | | FY 12/31 |
| Net cash provided by (used in) operating activities | $ | 92,804 | | | $ | 46,864 | | | $ | (12,490) | | | $ | 940 | | | $ | 8,765 | | | $ | 44,079 | | | $ | 53,722 | | | $ | 43,549 | | | $ | (22,880) | | | $ | (37,560) | | | $ | 36,831 | |
| Purchases of property, equipment, and software | (10,501) | | | (7,715) | | | (11,357) | | | (9,639) | | | (7,291) | | | (36,002) | | | (8,598) | | | (4,946) | | | (8,080) | | | (8,652) | | | (30,276) | |
| Operating Free Cash Flow | $ | 82,303 | | | $ | 39,149 | | | $ | (23,847) | | | $ | (8,699) | | | $ | 1,474 | | | $ | 8,077 | | | $ | 45,124 | | | $ | 38,603 | | | $ | (30,960) | | | $ | (46,212) | | | $ | 6,555 | |
____________________________
| (1) | We define Operating Free Cash Flow, which is a non-GAAP measure, as net cash provided by (used in) operating activities less purchases of property, equipment, and software. We believe Operating Free Cash Flow is an important liquidity measure that reflects the cash generated by our businesses, after the purchases of property, equipment, and software, that can then be used for, among other things, strategic acquisitions and investments in the businesses, stock repurchases, and funding ongoing operations. |
Blucora Operating Metrics - Wealth Management | | | | | | | | | | | | | | | | | | | | | | | | | | | | | | | | | | | | | | | | | | | | | | | | | | | | | | | | | | | | | | | | | |
| 2019 | | 2020 | | 2021 | | | | | | |
| (In thousands, rounding differences may exist) | FY 12/31 | | 1Q | | 2Q | | 3Q | | 4Q | | FY 12/31 | | 1Q | | 2Q | | 3Q | | 4Q | | FY 12/31 |
| Segment revenue | $ | 507,979 | | | $ | 144,989 | | | $ | 115,884 | | | $ | 135,932 | | | $ | 149,384 | | | $ | 546,189 | | | $ | 154,491 | | | $ | 162,395 | | | $ | 169,135 | | | $ | 172,192 | | | $ | 658,213 | |
| Less: Financial professional commission payout | (348,003) | | | (100,804) | | | (82,656) | | | (94,794) | | | (102,610) | | | (380,864) | | | (107,211) | | | (112,164) | | | (119,044) | | | (119,609) | | | (458,028) | |
Segment net revenue (1) | $ | 159,976 | | | $ | 44,185 | | | $ | 33,228 | | | $ | 41,138 | | | $ | 46,774 | | | $ | 165,325 | | | $ | 47,280 | | | $ | 50,231 | | | $ | 50,091 | | | $ | 52,583 | | | $ | 200,185 | |
Segment operating income (2) | $ | 68,292 | | | $ | 22,598 | | | $ | 11,731 | | | $ | 17,498 | | | $ | 20,368 | | | $ | 72,195 | | | $ | 19,396 | | | $ | 21,396 | | | $ | 19,564 | | | $ | 21,856 | | | $ | 82,212 | |
| Segment operating income as a % of revenue | 13 | % | | 16 | % | | 10 | % | | 13 | % | | 14 | % | | 13 | % | | 13 | % | | 13 | % | | 12 | % | | 13 | % | | 12 | % |
| Segment operating income as a % of net revenue | 43 | % | | 51 | % | | 35 | % | | 43 | % | | 44 | % | | 44 | % | | 41 | % | | 43 | % | | 39 | % | | 42 | % | | 41 | % |
| | | | | | | | | | | | | | | | | | | | | | | | | | | | | | | | | | | | | | | | | | | | | | | | | | | | | | | | | | | | | | | | | | | | | | | | |
| (In thousands, rounding differences may exist) | 2019 | | 2020 | | 2021 | |
| Sources of Revenue | Primary Drivers | FY 12/31 | | 1Q | | 2Q | | 3Q | | 4Q | | FY 12/31 | | 1Q | | 2Q | | 3Q | | 4Q | | FY 12/31 | |
| Financial professional-driven | Advisory | - Advisory asset levels | $ | 252,367 | | | $ | 78,757 | | | $ | 66,303 | | | $ | 82,612 | | | $ | 87,079 | | | $ | 314,751 | | | $ | 91,119 | | | $ | 96,508 | | | $ | 103,540 | | | $ | 104,633 | | | $ | 395,800 | | |
| Commission | - Transactions
- Asset levels
- Product mix | 191,050 | | | 50,580 | | | 39,836 | | | 44,921 | | | 49,864 | | | 185,201 | | | 52,534 | | | 51,702 | | | 52,961 | | | 53,480 | | | 210,677 | | |
| Other revenue | Asset-based | - Cash balances - Interest rates - Number of accounts - Client asset levels | 48,182 | | | 10,579 | | | 3,981 | | | 4,351 | | | 4,777 | | | 23,688 | | | 5,329 | | | 5,526 | | | 5,659 | | | 5,587 | | | 22,101 | | |
| Transaction and fee | - Account activity - Number of clients - Number of financial professionals - Number of accounts | 16,380 | | | 5,073 | | | 5,764 | | | 4,048 | | | 7,664 | | | 22,549 | | | 5,509 | | | 8,659 | | | 6,975 | | | 8,492 | | | 29,635 | | |
| Total revenue | $ | 507,979 | | | $ | 144,989 | | | $ | 115,884 | | | $ | 135,932 | | | $ | 149,384 | | | $ | 546,189 | | | $ | 154,491 | | | $ | 162,395 | | | $ | 169,135 | | | $ | 172,192 | | | $ | 658,213 | | |
| Total recurring revenue (3) | $ | 422,128 | | | $ | 119,255 | | | $ | 100,004 | | | $ | 117,822 | | | $ | 127,863 | | | $ | 464,944 | | | $ | 130,755 | | | $ | 138,900 | | | $ | 145,311 | | | $ | 144,728 | | | $ | 559,694 | | |
| Recurring revenue rate (3) | 83.1 | % | | 82.3 | % | | 86.3 | % | | 86.7 | % | | 85.6 | % | | 85.1 | % | | 84.6 | % | | 85.5 | % | | 85.9 | % | | 84.1 | % | | 85.0 | % | |
____________________________
| (1) | Non-GAAP financial measure represents segment revenue less financial professional commission payout. |
| (2) | We do not allocate certain operating expenses (including personnel and overhead costs), stock-based compensation, acquisition and integration costs, depreciation, amortization of acquired intangible assets, executive transition costs, headquarters relocation costs, contested proxy and other legal and consulting costs, impairment of goodwill and an intangible asset, interest expense and other, net, or income taxes to the reportable segments. |
| (3) | Recurring revenue consists of advisory fees, trailing commissions, fees from cash sweep programs, and certain transaction and fee revenue. |
Blucora Operating Metrics - Wealth Management (continued) | | | | | | | | | | | | | | | | | | | | | | | | | | | | | | | | | | | | | | | | | | | | | | | | | | | | | | | | | | | | | | | | | |
| (In thousands, rounding differences may exist) | 2019 | | 2020 | | 2021 |
| FY 12/31 | | 1Q | | 2Q | | 3Q | | 4Q | | FY 12/31 | | 1Q | | 2Q | | 3Q | | 4Q | | FY 12/31 |
| Total client assets | $ | 70,644,385 | | | $ | 61,014,454 | | | $ | 68,519,998 | | | $ | 76,152,721 | | | $ | 82,961,244 | | | $ | 82,961,244 | | | $ | 84,776,191 | | | $ | 87,814,790 | | | $ | 86,647,743 | | | $ | 89,086,032 | | | $ | 89,086,032 | |
| Brokerage assets | $ | 43,015,221 | | | $ | 37,395,490 | | | $ | 41,964,610 | | | $ | 43,733,735 | | | $ | 47,357,687 | | | $ | 47,357,687 | | | $ | 48,001,320 | | | $ | 48,373,805 | | | $ | 46,850,354 | | | $ | 46,906,981 | | | $ | 46,906,981 | |
| Advisory assets | $ | 27,629,164 | | | $ | 23,618,964 | | | $ | 26,555,388 | | | $ | 32,418,986 | | | $ | 35,603,557 | | | $ | 35,603,557 | | | $ | 36,774,871 | | | $ | 39,440,985 | | | $ | 39,797,389 | | | $ | 42,179,051 | | | $ | 42,179,051 | |
| % of total client assets | 39.1 | % | | 38.7 | % | | 38.8 | % | | 42.6 | % | | 42.9 | % | | 42.9 | % | | 43.4 | % | | 44.9 | % | | 45.9 | % | | 47.3 | % | | 47.3 | % |
Number of financial professionals (in ones) (1) | 3,984 | | | 3,945 | | | 3,862 | | | 3,975 | | | 3,770 | | | 3,770 | | | 3,718 | | | 3,606 | | | 3,529 | | | 3,416 | | | 3,416 | |
Advisory and commission revenue per financial professional (2) | $ | 111.3 | | | $ | 32.8 | | | $ | 27.5 | | | $ | 32.1 | | | $ | 36.3 | | | $ | 132.6 | | | $ | 38.6 | | | $ | 41.1 | | | $ | 44.3 | | | $ | 46.3 | | | $ | 177.5 | |
| | | | | | | | | | | | | | | | | | | | | |
Quarterly production retention rate: (3) | | | | | | | | | | | | | | | | | | | | | |
TTM Financial professional-driven revenue (4) | $ | 443,417 | | | $ | 495,837 | | | $ | 492,498 | | | $ | 491,829 | | | $ | 499,952 | | | $ | 499,952 | | | $ | 514,268 | | | $ | 556,339 | | | $ | 585,307 | | | $ | 606,477 | | | $ | 606,477 | |
TTM Financial professional-driven revenue related to independent financial professionals who departed in the quarter (4) | $ | 10,770 | | | $ | 4,586 | | | $ | 11,445 | | | $ | 5,366 | | | $ | 19,101 | | | $ | 19,101 | | | $ | 8,127 | | | $ | 9,881 | | | $ | 12,157 | | | $ | 11,079 | | | $ | 11,079 | |
TTM Financial professional-driven revenue, less that related to independent financial professionals who departed in the quarter (4) | $ | 432,647 | | | $ | 491,251 | | | $ | 481,053 | | | $ | 486,463 | | | $ | 480,851 | | | $ | 480,851 | | | $ | 506,141 | | | $ | 546,458 | | | $ | 573,150 | | | $ | 595,398 | | | $ | 595,398 | |
Quarterly production retention rate (3) | 97.6 | % | | 99.1 | % | | 97.7 | % | | 98.9 | % | | 96.2 | % | | 96.2 | % | | 98.4 | % | | 98.2 | % | | 97.9 | % | | 98.2 | % | | 98.2 | % |
____________________________
| (1) | The increase in financial professionals in the third quarter of 2020 resulted from the addition of 19 in-house financial professionals (licensed financial planning consultants, which were employees of Avantax Planning Partners) and 131 licensed referring representatives at CPA firms that partner with Avantax Planning Partners. |
| (2) | Advisory and commission revenue per financial professional is based upon a full year of advisory and commission revenue. |
| (3) | Quarterly production retention rate is a non-GAAP financial measure. We believe quarterly production retention rate is an important measure of our quarterly retention of financial professional-driven revenue (which consists of advisory revenue and commission revenue). Management uses quarterly production retention rate to measure the impact of financial professional departures on our business. Quarterly production retention rate is calculated by dividing (x) the difference of (i) total financial professional-driven revenue for the trailing-twelve-month period then ended minus (ii) financial professional-driven revenue for the trailing-twelve-month period then ended related to independent financial professionals that departed in the quarter by (y) total financial professional-driven revenue for the trailing-twelve-month period then ended. As quarterly production retention rate is a measure of retention during a quarter, it also includes quarterly production from independent financial professionals who departed in prior quarters in the trailing-twelve-month period, and therefore does not show production retention rate over longer periods of time. |
| (4) | For the trailing-twelve-month period then ended. |
Blucora Operating Metrics - Tax Software
| | | | | | | | | | | | | | | | | | | | | | | | | | | | | |
| (In thousands except % and as otherwise indicated, rounding differences may exist) | Year ended December 31, | | Change | | |
| 2021 | | 2020 | | Units | | % | | | | | | |
Total e-files (1) | 5,583 | | | 5,319 | | | 264 | | | 5 | % | | | | | | |
| Consumers | | | | | | | | | | | | | |
E-files (1) | 3,178 | | | 3,178 | | | — | | | — | % | | | | | | |
| Professional | | | | | | | | | | | | | |
| E-files | 2,405 | | | 2,141 | | | 264 | | | 12 | % | | | | | | |
| Units sold (in ones) | 20,901 | | | 20,360 | | | 541 | | | 3 | % | | | | | | |
| E-files per unit sold (in ones) | 115.1 | | | 105.2 | | | 9.9 | | | 9 | % | | | | | | |
____________________________
| (1) | We participate in the Free File Alliance that is part of an IRS partnership that provides free electronic tax filing services to taxpayers meeting certain income-based guidelines. Free File Alliance e-files are included within total e-files and consumer e-files above. |
REFINITIV STREETEVENTS EDITED TRANSCRIPT BCOR.OQ - Q4 2021 Blucora Inc Earnings Call EVENT DATE/TIME: FEBRUARY 16, 2022 / 1:30PM GMT |
REFINITIV STREETEVENTS | www.refinitiv.com | Contact Us
©2022 Refinitiv. All rights reserved. Republication or redistribution of Refinitiv content, including by framing or similar means, is prohibited without the prior written consent of Refinitiv. 'Refinitiv' and the Refinitiv logo are registered trademarks of Refinitiv and its affiliated companies.
| | |
| | |
REFINITIV STREETEVENTS | www.refinitiv.com | Contact Us ©2022 Refinitiv. All rights reserved. Republication or redistribution of Refinitiv content, including by framing or similar means, is prohibited without the prior written consent of Refinitiv. 'Refinitiv' and the Refinitiv logo are registered trademarks of Refinitiv and its affiliated companies. |  |
FEBRUARY 16, 2022 / 1:30PM, BCOR.OQ - Q4 2021 Blucora Inc Earnings Call
C O R P O R A T E P A R T I C I P A N T S
Christopher W. Walters Blucora, Inc. - President, CEO & Director
Dee Littrell Blucora, Inc. - IR
Marc Mehlman Blucora, Inc. - CFO
C O N F E R E N C E C A L L P A R T I C I P A N T S
Daniel Louis Kurnos The Benchmark Company, LLC, Research Division - MD & Senior Equity Analyst
Jackson Edmund Ader JPMorgan Chase & Co, Research Division - Analyst
P R E S E N T A T I O N
Operator
Good day, and thank you for standing by. Welcome to the Blucora Fourth Quarter Year-end 2021 Earnings Conference Call. (Operator Instructions) Please be advised that today's conference is being recorded.
I would now like to hand the conference over to your speaker today, Dee Littrell, Investor Relations. Please go ahead.
Dee Littrell - Blucora, Inc. - IR
Thank you, and welcome, everyone, to Blucora's Fourth Quarter and Full Year 2021 Earnings Conference Call. Earlier this morning, we posted the earnings release and supplemental information on the Investor Relations section of our website at blucora.com. I'm joined today by Chris Walters, Chief Executive Officer; and Marc Mehlman, Chief Financial Officer.
Before we begin, let me remind everyone that today's discussion contains forward-looking statements based on the environment as we currently see it, that speak only as of the current date. As such, they include risks and uncertainties, and actual results and events could differ materially from our current expectations. Please refer to our press release and our SEC filings, including our most recent Form 10-K and Form 10-Q for more information on some of these specific risks and uncertainties. We assume no obligation to update these forward-looking statements, except as required by law. We will discuss both GAAP and non-GAAP financial measures today. Our earnings release and supplemental financial information are available on the Investor Relations section of our website at blucora.com and include full reconciliations of each non-GAAP financial measure discussed to the nearest applicable GAAP measure.
With that, let me hand the call over to Chris.
Christopher W. Walters - Blucora, Inc. - President, CEO & Director
Thank you, Dee, and good morning, everyone. Today, I am pleased to share our fourth quarter and full year 2021 results. Overall, in 2021, we made significant progress executing our sustainable growth strategy for the company and are pleased to be ahead of our long-term growth goals. We generated strong financial results while investing for future growth, deepening our relationships with customers and financial professionals, strengthening our platforms and laying the groundwork to build on the significant opportunities we see ahead. Our financial results exceeded expectations, including delivering revenue growth of 17% and adjusted EBITDA growth of 46% for the full year 2021. We believe that executing on our growth strategy is key to realizing the full value of Blucora's differentiated tax-focused businesses. As we have said, this strategy is not operating in isolation nor without a time frame. We have laid out clear goals and KPIs for our business over the next several years and consistently judge our progress against a wide range of value-creating alternatives through the company's business structure and capital allocation. Our approach across both businesses has been to continue to focus on 3 key drivers of sustainable growth. First, customer acquisition,
| | 2 |
| | |
REFINITIV STREETEVENTS | www.refinitiv.com | Contact Us ©2022 Refinitiv. All rights reserved. Republication or redistribution of Refinitiv content, including by framing or similar means, is prohibited without the prior written consent of Refinitiv. 'Refinitiv' and the Refinitiv logo are registered trademarks of Refinitiv and its affiliated companies. | |
FEBRUARY 16, 2022 / 1:30PM, BCOR.OQ - Q4 2021 Blucora Inc Earnings Call
which is finding unique ways to bring new customers and financial professionals to our business, including innovative marketing and partnerships. Second, customer retention, is building valuable long-term relationships with our financial professionals and customers by providing best-in-class experiences with great products and services. And finally, realizing crossover benefits between our 2 businesses, which is operating high-quality and efficient shared functions, extending our TaxAct technology and marketing capabilities to benefit Avantax as well as introducing wealth management opportunities to TaxAct Pro's customers. With support from our Board of Directors, our leadership and, most importantly, our teams, we made significant progress in each of these areas.
Now I'd like to provide an update on our businesses, beginning with our Tax Software business. TaxAct had a very solid year in 2021, reaching a critical inflection point on the path toward unit share gains and ARPU growth, which, as we have said, are key to unlocking the value of this business and driving profitable growth. In particular, for the first time since 2014, TaxAct was flat on consumer units at 3.2 million after having declining unit volume for a number of years. This is a critical step on our stated expectation of growing units and building share through embracing our value position. As a result, we had a strong finish to the year, exceeding our midpoint guidance of $226 million in revenue. Just as crucially, our customer satisfaction scores continued to improve with Net Promoter Scores up an additional 1.5 points on top of the prior season's historical high, thanks to our continued investments in product and user experience. We tested and iterated on product enhancements to deliver the most value to taxpayers this tax season with a focus on improving product flow and customer data entry.
These results give us solid confidence about our outlook for 2022. When we released our Q3 2021 results in November, we gave our preliminary outlook for 2022 segment revenue to be up between 14% and 18% from fiscal year 2021. And for our 2022 segment operating income of between $98 million and $106 million, representing 26% growth relative to the midpoint of our fiscal 2021 guidance for the business.
Today, we are reaffirming the strong 2022 guidance for our Tax Software business. The team and I are confident and excited about the year ahead. Heading into the 2021 tax season, we are bullish about the potential benefits to be realized from our product enhancements, marketing improvements and partnership investments.
Although it is early in the tax season, I would like to share some initial observations. Over the last several years, we have seen a shift of filers starting and completing their returns later in the season. This shift has accelerated in tax year 2021 as the number of reported e-files by the IRS roughly 2 weeks into the season is approaching 50% below what has been seen in past seasons. This relatively low number of filers makes it difficult to comment definitively on certain elements of the season. That said, we are already seeing a number of areas for which we previously forecasted improvements performing at or above expectations. This season, we are focused on several areas to support our customer acquisition and retention. To support customer acquisition, we focused on partnerships and marketing initiatives. Taking our learnings from prior seasons, we continue to invest in partnerships to build brand recognition and drive track. For the 2021 tax season, we have refined our approach with existing partners and added several new partners.
On the marketing side, this season, we are using improved data and analytics to provide enhanced insights into customer behavior as the season progresses. As we saw last year, we expect this will enable us to more efficiently deploy our marketing spend. Our investment in these enhanced capabilities facilitate our ability to rapidly test and optimize our marketing efforts during the season.
To support customer retention, we are focused on product enhancements and customer systems. We've invested in strategic product enhancements to simplify our user experience and increase start rates. I'll share a couple of great examples. During third peak testing, we learned that improvements in how we import prior year data could increase user completion rate. We also made improvements to W-2 and 1099 form import tools and have already seen significant increase in user leveraging.
We remain committed to making the user experience as smooth as possible for our customers. Beyond improving our product, we've also focused on incremental ways to assist our customers. We've made 2 notable enhancements on this front. We launched Xpert Assist, which provides filers of all types access to a team of CPAs and tax experts at no additional cost. Xpert Assist can guide customers through complex tax situations as a powerful component of our value positioning because easy access to expert help is typically an incremental charge for users of competitors' paid products. We also increased our customer care investments to be able to provide direct human assistance to a significantly greater percentage of customers than prior seasons.
| | 3 |
| | |
REFINITIV STREETEVENTS | www.refinitiv.com | Contact Us ©2022 Refinitiv. All rights reserved. Republication or redistribution of Refinitiv content, including by framing or similar means, is prohibited without the prior written consent of Refinitiv. 'Refinitiv' and the Refinitiv logo are registered trademarks of Refinitiv and its affiliated companies. | |
FEBRUARY 16, 2022 / 1:30PM, BCOR.OQ - Q4 2021 Blucora Inc Earnings Call
Now on to the wealth management side, where we've continued to see the value in our hybrid independent broker-dealer in-house RIA approach
to wealth management. The combination of Avantax Wealth Management and Avantax Planning Partners enables us to offer multiple affiliation
models, which presents unique opportunities for us to better service our financial professionals and CPA firms. Heading into last year, we were
focused on several initiatives. In customer acquisition, the focus was on recruiting new firms and scaling our employee-based RIA model. On the
customer retention front, we were focused on continuing our progress with several initiatives, which also benefit customer acquisition. These
include improving the overall experience for our financial professionals and their clients and enhancing our technology and service capabilities to
provide additional customized resources to our financial professionals to help them grow their practices over time.
I'd like to highlight how we made progress on each of these areas last quarter. On the customer acquisition and recruiting front, it was a great
quarter. We welcome 49 new financial professionals, adding $330 million in total client assets. To improve customer retention, I'm pleased to share
that we are making meaningful progress in meeting the needs of our financial professional community. Our fall 2021 financial professional satisfaction
survey results improved by 20 percentage points since spring 2021 and 33 percentage points since fall 2020. These results were driven by
enhancements in our financial professional, customer service and technology.
On the tech front, we've made several improvements. We launched the first version of a new client portal to a pilot group of financial professionals,
and we'll continue to expand this portal's availability to all firms throughout 2022. This exciting new feature will directly enhance the experience
that end clients have when working with our financial professionals and will be the foundation of how end clients and financial professionals
collaborate. We also launched new account opening and off-platform asset transition tools to help increase financial professional efficiencies by
saving time and decreasing overall processing docs.
Finally, we expanded our consultation services to boost firm efficiency by using sophisticated data and analytics to provide proactive advice to
financial professionals on how to become more operationally efficient as they grow, thus boosting their profitability potential.
We believe our increased investments across wealth management segment will continue to provide a more enhanced cohesive suite of services
and opportunities to support our financial and tax professionals and help them grow their business. In addition, in 2021, we acquired 8 RIA firms
to scale this portion of our business. This initiative is a compelling capital allocation opportunity, in addition to supporting our customer acquisition
and retention efforts as well as enhancing cross-business synergies. Together, these acquisitions have added approximately $1.9 billion in assets
under management to our employee-based model, which, as a reminder, is meaningfully more profitable than our independent broker-dealer
model. The model for each of these deals has us approaching a margin profile double that of our wealth business today.
As this continues to present a compelling opportunity to the business, we will allocate capital in line with our communicated capital allocation
priorities of maintaining a strong balance sheet, driving organic growth and returning capital to shareholders. We plan to increase the number of
RIA acquisitions during 2022. In addition to our focus of executing to improve the fundamental value drivers of our business, we are set up to
benefit greatly from the macro-environmental factors that we believe likely lie ahead.
Market volatility can increase fees as the value of the assets under management impacts our revenue. In a market in which asset values are under
pressure, our fees will be lower. Conversely, as asset values increase, so too will our fees. That said, the profit-sharing model in place with our
financial professionals mutes the impact of market volatility. But the effects of increasing rate environment flowing through to the bottom line is
much more significant.
As everyone on this call no doubt appreciate, the near 0 interest rate environment over the past few years has been unprecedented. This has
severely impacted cash sweep revenue, which is a critical input for our wealth management business. As we have repeatedly said, a return to
historically normalized interest rate environment represented a significant opportunity for additional revenue, which will positively impact Blucora's
earnings. As the interest rate environment normalizes back to conventional pre-COVID rates, sweep revenue will once again be a source of
high-margin income for the business. As an example, upon reaching a Fed funds rate of 125 to 150 basis points, Avantax will generate incremental
annual segment operating income of between $40 million and $50 million assuming today's level of assets, among other factors. This is a key
component of our earnings power. Due to the timing of rate increases and the nonlinear nature of upside associated with the first 4 rate hikes, we
won't see all the positivity hit our P&L in 2022. But based on what the forward interest rate curve implies, we will return to normalized levels in
2023.
| | 4 |
| | |
REFINITIV STREETEVENTS | www.refinitiv.com | Contact Us ©2022 Refinitiv. All rights reserved. Republication or redistribution of Refinitiv content, including by framing or similar means, is prohibited without the prior written consent of Refinitiv. 'Refinitiv' and the Refinitiv logo are registered trademarks of Refinitiv and its affiliated companies. | |
FEBRUARY 16, 2022 / 1:30PM, BCOR.OQ - Q4 2021 Blucora Inc Earnings Call
Now let's talk about Blucora overall. As I complete my second year as Blucora's CEO, I want to reiterate how encouraged I am by the company's
progress and how optimistic I am about our growth outlook. We are making solid headway returning TaxAct and Avantax to sustainable, profitable
growth, which is essential to unlocking Blucora's value. We have focused on empowering our teams, supporting our financial professionals and
exceeding the expectations of our customers. I'm pleased to see the satisfaction improvement we have made with each group, and this bolsters
our confidence in the future. As the macro environment begins to revert to pre-pandemic norms, headwinds of the past few years are becoming
tailwinds and expected to boost our earnings and shareholder value substantially. I believe the steps we have taken to reposition our business,
coupled with the continued execution of our differentiated strategy, have the potential to create tremendous value for our team, our financial
professionals, our customers, and ultimately, our shareholders. I look forward to continuing our progress throughout this year.
With that, I'll turn it over to Marc to outline our Q4 and full year 2021 financial performance.
Marc Mehlman - Blucora, Inc. - CFO
Thank you, Chris, and good morning, everyone. It's great to be with you all again. I'd like to provide some additional detail on our fourth quarter
and full year results as well as our outlook for the quarter ahead.
Starting with fourth quarter results. As Chris mentioned, we are thrilled to have executed well across the board, exceeding the midpoint or high
end of our guidance across most metrics. 2021 was a strong year for the business, one which saw our TaxAct business return to meaningful revenue
and profit growth and considerably higher margins versus the prior year. Further, our wealth management business saw a shift of over 400 basis
points toward higher ROA advisory assets as a percentage of total assets and an expansion of almost $2 billion of assets to our RIA model. Our plan
to create sustainable growth frameworks, while shifting our business towards higher valuation models, is on track and expected to accelerate.
Now on to fourth quarter financial results. Total revenue was $178.3 million, an increase of 15% versus the fourth quarter of the prior year and
above the high end of our guidance. Total revenue was driven primarily by the wealth management business. GAAP net loss was $23.7 million or
(inaudible) loss per diluted share, both of which outperformed the high end of our guidance. As a reminder, the fourth quarter is a seasonally small
quarter for our tax business and we typically generate a consolidated net loss for the period. Embedded within our GAAP net income figure is a
$2.9 million increase in the fair value of the HKFS contingent consideration earn-out, which we still believe will be paid out in full at $30 million as
well as a $12.1 million tax benefit primarily associated with the reduction in our valuation allowance. Adjusted EBITDA, which outperformed the
midpoint of our guidance, was negative $3.8 million versus a positive $2.2 million in the fourth quarter of 2020. Non-GAAP net loss was $14.1 million
or a loss of $0.29 per diluted share, which outperformed the high end of our guidance.
Turning now to the Tax Software segment. Tax Software segment revenue for the fourth quarter was $6.1 million, which outperformed the high
end of our guidance as the backlog of the IRS was significantly reduced, helping to drive overperformance. For the year, the Tax Software segment
delivered $227 million of revenue, representing 8.7% growth versus the prior year. Consumer e-files were $3.2 million for tax year '20, which, as
Chris mentioned, is flat to tax year 2019, the first time we have maintained or grown our e-file volume in at least 6 years. This is a testament to our
team and the strategy they are executing. This is a big moment for the business and is another signal of our turnaround towards healthy unit-driven
growth. Segment operating income was negative $18.6 million, which outperformed the high end of our guidance. We continue to operate the
business prudently from an expense standpoint, maintaining the financial flexibility to invest in a number of marketing opportunities ahead of tax
year 2022 such as the ESPN Bowl series, which exceeded our expectations for brand awareness.
Moving to the wealth management segment. We continued our strong momentum during the fourth quarter. Wealth management segment
revenue was $172.2 million, above the high end of our guidance and up 2% sequentially. Transaction-based commission revenues were $24.2
million, an increase of 8% sequentially. Year-over-year transaction-based commission revenues increased 22% for the quarter and 20% for full year
2021. On a year-over-year basis, total wealth management revenue was up 15% for the quarter and 21% for the full year. Wealth management
segment operating income was $21.9 million for the fourth quarter, above the midpoint of our guidance driven by favorable revenue performance,
offset by incremental headcount and investments in technology to enhance the experience of our financial professionals and their customers. Our
payout rate decreased slightly versus Q3, coming in at 75.6% versus 76.1% in the third quarter of 2021. We will see fluctuations in payout rate
depending on the concentration of transaction-based revenues and makeup of net flows; and lastly, the type of assets for which we have
quarter-to-quarter movement.
| | 5 |
| | |
REFINITIV STREETEVENTS | www.refinitiv.com | Contact Us ©2022 Refinitiv. All rights reserved. Republication or redistribution of Refinitiv content, including by framing or similar means, is prohibited without the prior written consent of Refinitiv. 'Refinitiv' and the Refinitiv logo are registered trademarks of Refinitiv and its affiliated companies. | |
FEBRUARY 16, 2022 / 1:30PM, BCOR.OQ - Q4 2021 Blucora Inc Earnings Call
We ended the year with total client assets of $89.1 billion. Fee-based advisory assets were up 18.5% year-over-year to $42.2 billion with advisory
assets as a percentage of total client assets ending the quarter at a new high of 47.3%, 440 basis points higher than the end of 2020. We saw net
inflows in advisory assets during the fourth quarter of $780 million, with total client assets having net outflows of $562 million, which relates in
part to our change in focus towards higher ROA on platform assets and lower ROA off-platform DTF assets where it makes sense for our customers.
I would now like to turn your attention to Slide 6 in the earnings presentation. Over the last 24 months, a key strategic imperative has been to shift
our business development focus to attract more established financial professionals with higher expected long-term retention. This has been a
success. We have driven our newly recruited assets for full year 2021 to $929 million versus $363 million in 2020 at an average of $407 million for
the years 2017 through 2019. Our expectation for 2022 is for meaningful growth over 2021. This focus on fewer but more productive financial
professionals has greatly increased recruitment of assets. And so while we continue to share financial professional accounts and discuss the drivers
of movement, our strategic focus will continue to primarily be on assets and our drive towards positive net new assets in 2022.
At the corporate level, unallocated corporate expenses during the quarter came in at $7.1 million as we continue to manage our corporate costs
prudently. During the quarter, we had about $3.9 million in acquisition and integration costs related to HKFS and First Global, with the vast majority
of it related to the increase in fair value of HKFS contingent consideration that I previously mentioned.
Turning to the balance sheet. We ended the quarter with cash and cash equivalents of $134.8 million and net debt of $426.5 million. Our net
leverage ratio at the end of the quarter was 3.1x. For the full year 2021, we generated $36.8 million in cash from operating activities, which includes
a $16.9 million onetime settlement with the SEC that dates back to the First Global acquisition. Our key priorities for cash remain investing in our
business to fuel growth and returning cash to shareholders. As it relates to returning cash to shareholders, we commenced share repurchases in
the first quarter of 2022 under our expanded $100 million share repurchase authorization announced in December. Through February 15, we have
purchased roughly 500,000 shares or about 1% of outstanding shares for a total cash outlay of about $8.5 million.
With that, let's turn to our first quarter 2022 outlook. As is customary, we will provide second quarter guidance and full year guidance during Q1
earnings in early May. For first quarter in our Tax Software business, we expect revenue between $150 million and $175 million and segment
operating income of $57 million to $77 million. As Chris mentioned earlier, the tax season is off to a significantly slower than usual start, which
makes it a bit difficult to pinpoint which e-files will come through at the end of March versus the first 2 weeks of April. We, therefore, have a wide
guidance range to take this phasing uncertainty into account. This has no impact on our view for the full season.
For our wealth management business, we expect first quarter revenue of $164.5 million to $171.5 million and segment operating income of $19.5
million to $22 million. On a consolidated basis, we expect first quarter revenue between $314.5 million and $346.5 million; adjusted EBITDA between
$69 million and $92 million; GAAP net income of $38 million to $62 million or $0.75 to $1.23 per diluted share; and non-GAAP income attributable
to Blucora of $52.5 million to $76.5 million or $1.04 to $1.52 per diluted share. This includes unallocated corporate operating expense of $7 million
to $7.5 million.
This concludes our prepared remarks. We will now turn the call over to the operator for Q&A. Operator?
Q U E S T I O N S A N D A N S W E R S
Operator
(Operator Instructions) Our first question comes from Jackson Ader with JPMorgan.
Jackson Edmund Ader - JPMorgan Chase & Co, Research Division - Analyst
The first one is on the slower start to the tax season. I guess 2 parts. Number one, what are kind of the main drivers as to why tax seasons seem to
be getting later and later as we move in recent years? And then secondly, what type of -- I don't know. Are you shifting some of your marketing or
partnerships or any kind of spend in order to capture some of these later returns that might come in, as you said, into March, early April?
| | 6 |
| | |
REFINITIV STREETEVENTS | www.refinitiv.com | Contact Us ©2022 Refinitiv. All rights reserved. Republication or redistribution of Refinitiv content, including by framing or similar means, is prohibited without the prior written consent of Refinitiv. 'Refinitiv' and the Refinitiv logo are registered trademarks of Refinitiv and its affiliated companies. | |
FEBRUARY 16, 2022 / 1:30PM, BCOR.OQ - Q4 2021 Blucora Inc Earnings Call
Christopher W. Walters - Blucora, Inc. - President, CEO & Director
Sure. There's no way to know precisely exactly what's driving the shift, but we think there are a number of factors that are leading to the consistently
kind of pushed-out demand. And I would say this season, a few of the primary contributors are. There's a variety of things that taxpayers are a bit
-- confuse us about. One is child tax credits. A second being the stimulus dollars will be treated. And some of that confusion leads to a delay in
terms of when they actually start and complete. There's also just more dollars in the market within consumers' hands based on the stimulus funds
that have been provided and many early season filers are often securing some dollars, and that's particularly with some of the storefront operators
that cater to kind of the lower end of the market. They secure dollars in advance of getting their returns. And so I think all of those things are
contributing to some of the delays in demand.
In terms of our actions, we've talked about how we've built a more flexible approach to marketing. Obviously, the first year of the pandemic, we
were caught by surprise because the seasons were so predictable in the past and had locked in a fair amount of our marketing spend. And ultimately,
in future seasons, we've built a more flexible approach. We are constantly monitoring demand and market and then we shift our dollars and also
work closely with our partners to shift our actions to make sure that we're actually capitalizing at the points where there's greatest demand.
Jackson Edmund Ader - JPMorgan Chase & Co, Research Division - Analyst
Okay. All right. Great. And then so on Xpert Assist, any -- and I know it's early, but are there any kind of data points you can share on the uptake of
Xpert Assist? And then also what kind of impact will Xpert Assist have on gross margin given, I assume, there's a big cost associated with hiring the
experts and not necessarily the same type of price per return uplift?
Christopher W. Walters - Blucora, Inc. - President, CEO & Director
Yes. So we are excited about Xpert Assist because it really allows us to continue to embrace our value positioning and helping taxpayers through
a filing experience that, honestly, for some of them have complexity. Over the course of the season, as you progress through the season, there's
more and more complex filers. And so the utilization rate will grow as each month progresses in the season. I don't believe we've shared any
utilization rates and so I can't share any now.
And Marc, do you want to comment on the margin impact?
Marc Mehlman - Blucora, Inc. - CFO
Sure. Jackson, thanks for the questions. So as it relates to the Xpert Assist and impact on margins, there is an offsetting benefit to the cost in terms
of attracting new users to the tool as well as just retention rates and what have you from existing users. And so our expectation, based on what
we believe the uptake will be and the benefit associated with new customers, is that it should be a wash and should actually drive additional top
line but allow us to maintain our margins going forward.
Operator
And we have a question from Dan Kurnos with Benchmark Company.
Daniel Louis Kurnos - The Benchmark Company, LLC, Research Division - MD & Senior Equity Analyst
Sorry about that guys. I had to double mute my earphone and my phone, sorry. Hopefully, you can hear me now. Chris, just kind of given the
commentary that we've heard from you guys into it now just on sort of timing of the tax season and sort of lack of visibility, obviously, you guys
are seeing something or at least have kind of your double tested your models to confirm just this tax guide. Is there any thoughts on perhaps mix
| | 7 |
| | |
REFINITIV STREETEVENTS | www.refinitiv.com | Contact Us ©2022 Refinitiv. All rights reserved. Republication or redistribution of Refinitiv content, including by framing or similar means, is prohibited without the prior written consent of Refinitiv. 'Refinitiv' and the Refinitiv logo are registered trademarks of Refinitiv and its affiliated companies. | |
FEBRUARY 16, 2022 / 1:30PM, BCOR.OQ - Q4 2021 Blucora Inc Earnings Call
shift in terms of units, so whether it's coming from partnership, which you mentioned but didn't really talk about extensively in the prepared
remarks versus kind of what were considered D2C or assisted? Is there any mix shift that you're anticipating given the complexity? And how much
are you -- we've seen a lot of commentary about inflation weighing in on people moving up. Obviously, wage brackets and some complexity in
filings, which while that would push assist, it also suggests that you might see some healthier ARPU gains if there are incremental forms or other
things that people would need to pay for. So how much is that weighing in on or influencing kind of your thought process in this relatively early
tax season?
Christopher W. Walters - Blucora, Inc. - President, CEO & Director
As we said, it's early. But what we see, we are optimistic about some of the ancillary services that we have as well as some of the packaging or
bundling things that we tested at the end of last year and third peak. And the early signs are some of the optimism that we had about those
opportunities. They link to my remarks where I said we're seeing some positive signs on them. And so we haven't shared any specific guidance on
any mix shift. But as I said, we've seen some really positive signs on some of the packaging and bundling and ancillary products that we tested in
third peak last year.
Daniel Louis Kurnos - The Benchmark Company, LLC, Research Division - MD & Senior Equity Analyst
And is there any way to quantify -- I mean I assume the answer is no, but is there any way to quantify if there's a change between the ARPU and
unit growth expectations given to the start of the tax season?
Marc Mehlman - Blucora, Inc. - CFO
No. Dan, it's Marc. I'd say it's too early to be able to comment on that. I mean there are a number of factors that go into what we ultimately report
for tax season. And so like Chris mentioned, a lot of the areas that we tested last year are playing out favorably. But it's a bit too early to comment
on those particulars.
Daniel Louis Kurnos - The Benchmark Company, LLC, Research Division - MD & Senior Equity Analyst
Okay. Fair enough. On wealth management, just out of curiosity, historically, it's been about a $2 million impact to segment income for, I think,
every 100 basis point move in the S&P relative to your own forecast. And obviously, there's been some market volatility which you called out. You
guys are shifting to RIA. Is that -- and Chris, you mentioned that kind of the profit-sharing model that's starting to get a bit muted, and you had
very strong net inflows, frankly, at the end of the year. So I'm just trying to get a sense. I'll get into interest rates in a second because I'm curious
but -- on the assumptions there. But is that the right way -- are we still thinking about that level of sensitivity or this shift towards RIA starting to
further dampen kind of the general market impact, understanding you'll always have some just due to the nature of the business?
Marc Mehlman - Blucora, Inc. - CFO
I'd say the $1.5 million to $2 million is still an appropriate range to use for every roughly 100 basis points. While we are seeing really exciting growth
within the RIA, a majority of our assets still reside within the independent broker-dealer. And so that's a good number, Dan.
Daniel Louis Kurnos - The Benchmark Company, LLC, Research Division - MD & Senior Equity Analyst
Okay. And then just on the sort of the interest rate hike, I mean, I think Goldman put up 7 now this year. I think it's a race to see who can guess how
many more they're going to be. But -- and you guys kind of resized or restated the impact. I'm curious, Chris, I know you guys haven't given full
year guidance yet, but how should we be thinking about -- obviously, at the Investor Day, you made very limited assumptions around that. I would
| | 8 |
| | |
REFINITIV STREETEVENTS | www.refinitiv.com | Contact Us ©2022 Refinitiv. All rights reserved. Republication or redistribution of Refinitiv content, including by framing or similar means, is prohibited without the prior written consent of Refinitiv. 'Refinitiv' and the Refinitiv logo are registered trademarks of Refinitiv and its affiliated companies. | |
FEBRUARY 16, 2022 / 1:30PM, BCOR.OQ - Q4 2021 Blucora Inc Earnings Call
expect that you'll continue to conservatively -- make conservative forecast around the benefit from that. But just can you remind us of the cadence
of how quickly that flows through?
And really higher-level question for me is, if you have that incremental operating income that gives you a little bit more flexibility to either delever
buyback, which you said you started doing or be more aggressive on the RIA side. And so maybe it's a combination of all 3, but I'm just curious
how you would look to utilize sort of the incremental cash flow that, that could generate.
Christopher W. Walters - Blucora, Inc. - President, CEO & Director
Let me let -- I'll let Marc take the capital allocation question. But first, in terms of what we shared at Investor Day, we had not made any assumptions.
There's nothing embedded in our outlook that included interest rate increases, right? At that point, we did share a perspective on what the value
might be associated with it. And today, we've shared kind of an annualized view. Obviously, these kind of flown over time based on when the
changes are made. And so the full year impacts are dramatically larger than what might be realized within the year.
Why don't I turn it to Marc to share a little bit more about capital allocation?
Marc Mehlman - Blucora, Inc. - CFO
Sure. And just to piggyback on what Chris was saying. As it relates to Fed rate increases this year, the first 4 rate increases don't impact the P&L in
a linear fashion, right? So -- but by the time we get to 100 basis points, there is about a $28 million to $30 million impact. And as we mentioned in
the prepared remarks, $125 million to $150 million will give us an annualized value of $40 million to $50 million. And so it's all going to come down
then to the timing and the magnitude of each one of those rate hikes. And while we will likely see some positivity this year, it's all going to depend
on the timing. As it relates to the full year, obviously, we're not providing full year guidance until Q1 earnings. But during our Investor Day, we
offered long-term guidance of somewhere between 9% to 12% annually operating segment income growth for the wealth management business
and all else being equal, right? So if we remove any sort of volatility in the market through this first quarter and any sort of interest rates, you would
expect us to be somewhere in that 9% to 10% range growth on operating segment income.
Now as it relates to capital allocation, we're very much looking forward to getting that additional capital and cash into the business. And our
priorities remain the same, right? So it's to fuel organic growth. It's to return capital to shareholders. And it's to maintain a strong balance sheet.
And so depending upon which of those turns out to be the best use of capital is where we will point it .
Operator
And that's all the questions we have. I'd like to turn the call back to Chris Walters for closing remarks.
Christopher W. Walters - Blucora, Inc. - President, CEO & Director
Great. Thanks so much for joining us. We look forward to talking again next quarter.
Operator
This concludes today's conference call. Thank you for participating. You may now disconnect.
| | 9 |
| | |
REFINITIV STREETEVENTS | www.refinitiv.com | Contact Us ©2022 Refinitiv. All rights reserved. Republication or redistribution of Refinitiv content, including by framing or similar means, is prohibited without the prior written consent of Refinitiv. 'Refinitiv' and the Refinitiv logo are registered trademarks of Refinitiv and its affiliated companies. | |
FEBRUARY 16, 2022 / 1:30PM, BCOR.OQ - Q4 2021 Blucora Inc Earnings Call
D I S C L A I M E R
Refinitiv reserves the right to make changes to documents, content, or other information on this web site without obligation to notify any person of such changes.
In the conference calls upon which Event Transcripts are based, companies may make projections or other forward-looking statements regarding a variety of items. Such forward-looking statements are based upon
current expectations and involve risks and uncertainties. Actual results may differ materially from those stated in any forward-looking statement based on a number of important factors and risks, which are more
specifically identified in the companies' most recent SEC filings. Although the companies may indicate and believe that the assumptions underlying the forward-looking statements are reasonable, any of the
assumptions could prove inaccurate or incorrect and, therefore, there can be no assurance that the results contemplated in the forward-looking statements will be realized.
THE INFORMATION CONTAINED IN EVENT TRANSCRIPTS IS A TEXTUAL REPRESENTATION OF THE APPLICABLE COMPANY'S CONFERENCE CALL AND WHILE EFFORTS ARE MADE TO PROVIDE AN ACCURATE TRANSCRIPTION,
THERE MAY BE MATERIAL ERRORS, OMISSIONS, OR INACCURACIES IN THE REPORTING OF THE SUBSTANCE OF THE CONFERENCE CALLS. IN NO WAY DOES REFINITIV OR THE APPLICABLE COMPANY ASSUME ANY
RESPONSIBILITY FOR ANY INVESTMENT OR OTHER DECISIONS MADE BASED UPON THE INFORMATION PROVIDED ON THIS WEB SITE OR IN ANY EVENT TRANSCRIPT. USERS ARE ADVISED TO REVIEW THE APPLICABLE
COMPANY'S CONFERENCE CALL ITSELF AND THE APPLICABLE COMPANY'S SEC FILINGS BEFORE MAKING ANY INVESTMENT OR OTHER DECISIONS.
©2022, Refinitiv. All Rights Reserved.
| | 10 |
| | |
REFINITIV STREETEVENTS | www.refinitiv.com | Contact Us ©2022 Refinitiv. All rights reserved. Republication or redistribution of Refinitiv content, including by framing or similar means, is prohibited without the prior written consent of Refinitiv. 'Refinitiv' and the Refinitiv logo are registered trademarks of Refinitiv and its affiliated companies. | |

Fourth Quarter and Full Year 2021 Earnings Presentation February 16, 2022
This presentation contains forward - looking statements within the meaning of Section 27A of the Securities Act of 1933, as amende d and Section 21E of the Securities Exchange Act of 1934, as amended , including without limitation, statements regarding the outlook of Blucora, Inc. (the “Company”) and its segments, expectations regarding net fl ows for its wealth business, and expectations with respect to the current tax season. Forward - looking statements provide current expectations of future events based on certain assumptions and include any statement that does not di rectly relate to any historical or current fact. Forward - looking statements can also be identified by words such as “believes,” “estimates,” “should,” “could,” “would,” “plans,” “expects,” “intends,” “anticipates,” “may,” “f ore casts,” “future,” “will,” “projects,” “predicts,” “potential,” “continues,” “target,” “outlook”, “guidance,” and similar expressions and variations. Actual results may differ significantly from management’s expectations due to various ris ks and uncertainties including, but not limited to: our ability to effectively compete within our industries; our ability to attract and retain financial professionals, qualified employees, clients, and customers, as well a s o ur ability to provide strong customer/client service; the impact of the COVID - 19 pandemic on our results of operations and our business, including the impact of the resulting economic and market disruption the extension of ta x filing deadlines and other related government actions; our ability to retain employees and acquired client assets following acquisitions; our future capital requirements and the availability of financing, if necessar y; our ability to meet our current and future debt service obligations, including our ability to maintain compliance with our debt covenants; any downgrade of the Company’s credit ratings; our ability to generate strong performance fo r our clients and the impact of the financial markets on our clients’ portfolios; the impact of new or changing legislation and regulations (or interpretations thereof) on our business, including our ability to successful ly address and comply with such legislation and regulations (or interpretations thereof) and increased costs, reductions of revenue, and potential fines, penalties or disgorgement to which we may be subject as a result thereof; ris ks, burdens, and costs, including fines, penalties, or disgorgement, associated with our business being subjected to regulatory inquiries, investigations, or initiatives, including those of the Financial Regulatory Authorit y, Inc. and the Securities and Exchange Commission (“ SEC ”); risks associated with legal proceedings, including litigation and regulatory proceedings; our ability to close, finance, and realize all of the anticipated benefits o f a cquisitions, as well as our ability to integrate the operations of recently acquired businesses, and the potential impact of such acquisitions on our existing indebtedness and leverage; our ability to manage leadership and employe e t ransitions, including costs and time burdens on management and our board of directors related thereto; the compromising of confidentiality, availability or integrity of information, including cyberattacks; political and ec onomic conditions and events that directly or indirectly impact the wealth management and tax preparation software industries; our ability to respond to rapid technological changes, including our ability to successfully re lease new products and services or improve upon existing products and services; our expectations concerning the revenues we generate from fees associated with the financial products that we distribute; risks related to goo dwi ll and other intangible asset impairment; our ability to develop, establish, and maintain strong brands; risks associated with the use and implementation of information technology and the effect of security breaches, compu ter viruses, and computer hacking attacks; our ability to comply with laws and regulations regarding privacy and protection of user data; our ability to maintain our relationships with third - party partners, providers, s uppliers, vendors, distributors, contractors, financial institutions, industry associations, and licensing partners, and our expectations regarding and reliance on the products, tools, platforms, systems, and services provided by th ese third parties; our beliefs and expectations regarding the seasonality of our business; our assessments and estimates that determine our effective tax rate; our ability to protect our intellectual property and the imp act of any claim that we have infringed on the intellectual property rights of others; and the effects on our business of actions of activist stockholders. A more detailed description of these and certain other factors that could a ffe ct actual results is included in the Company’s most recent Annual Report on Form 10 - K and most recent Quarterly Report on Form 10 - Q filed with the SEC. Readers are cautioned not to place undue reliance on these forward - look ing statements, which speak only as of the date hereof. The Company undertakes no obligation to update any forward - looking statements to reflect events or circumstances after the date hereof, except as may be r equired by law. This presentation contains non - GAAP financial measures such as Adjusted EBITDA, non - GAAP net income, non - GAAP net income per sha re, quarterly production retention rate, wealth management segment net revenue, wealth management net revenue excluding cash sweep, net debt, and net leverage ratio. You can find the reconciliation of thes e m easures to the most directly comparable GAAP financial measure in the Appendix at the end of this presentation. The non - GAAP financial measures disclosed by the Company should not be considered a substitute for, or sup erior to, the financial measures prepared in accordance with GAAP. Important Additional Information The Company intends to file a definitive proxy statement, accompanying BLUE proxy card and other relevant documents with the SEC in connection with the solicitation of proxies for the Company’s 2022 annual meeting of stockholders (the “ Annual Meeting ”). BEFORE MAKING ANY VOTING DECISION, STOCKHOLDERS OF THE COMPANY ARE URGED TO READ ALL RELEVANT DOCUMENTS FILED WITH OR FUR NIS HED TO THE SEC, INCLUDING THE COMPANY’S DEFINITIVE PROXY STATEMENT AND ANY AMENDMENTS AND SUPPLEMENTS THERETO, BECAUSE THEY WILL CONTAIN IM PORTANT INFORMATION. Investors and stockholders will be able to obtain a copy of the definitive proxy statement and other documents filed by the Company with th e S EC free of charge from the SEC’s website at www.sec.gov. In addition, copies will be available at no charge by selecting “SEC Filings” under “Financial Information” in the “Investors” tab of the Company’s website at www.blu cor a.com. The Company, its directors and certain of its executive officers are participants in the solicitation of proxies from the Com pan y’s stockholders in connection with the Annual Meeting. The names of these directors and executive officers and their respective direct and indirect interests, by security holdings or otherwise, in the Company are set forth in the Company’s Current Report on Form 8 - K filed with the SEC on February 14, 2022. Disclaimers
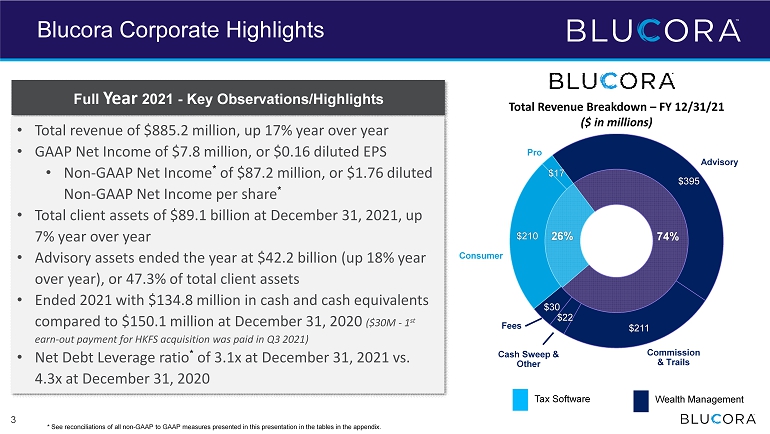
Blucora Corporate Highlights 3 Full Year 2021 - Key Observations/Highlights 74% 26% $395 $211 $22 $30 $210 $17 Advisory Commission & Trails Fees Cash Sweep & Other Consumer Pro Total Revenue Breakdown – FY 12/31/21 ($ in millions) • Total revenue of $885.2 million, up 17% year over year • GAAP Net Income of $7.8 million, or $0.16 diluted EPS • Non - GAAP Net Income * of $87.2 million, or $1.76 diluted Non - GAAP Net Income per share * • Total client assets of $89.1 billion at December 31, 2021, up 7% year over year • Advisory assets ended the year at $42.2 billion (up 18% year over year), or 47.3% of total client assets • Ended 2021 with $134.8 million in cash and cash equivalents compared to $150.1 million at December 31, 2020 ($30M - 1 st earn - out payment for HKFS acquisition was paid in Q3 2021) • Net Debt Leverage ratio * of 3.1x at December 31, 2021 vs. 4.3x at December 31, 2020 Wealth Management Tax Software * See reconciliations of all non - GAAP to GAAP measures presented in this presentation in the tables in the appendix.
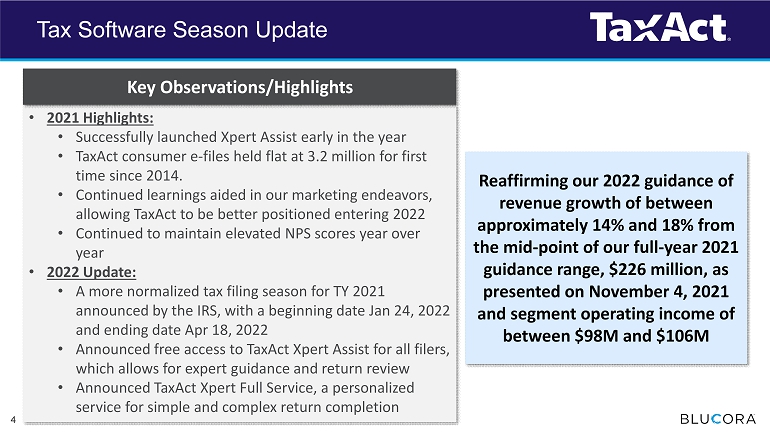
Tax Software Season Update 4 Reaffirming our 2022 guidance of revenue growth of between approximately 14% and 18% from the mid - point of our full - year 2021 guidance range, $226 million, as presented on November 4, 2021 and segment operating income of between $98M and $106M • 2021 Highlights: • Successfully launched Xpert Assist early in the year • TaxAct consumer e - files held flat at 3.2 million for first time since 2014. • Continued learnings aided in our marketing endeavors, allowing TaxAct to be better positioned entering 2022 • Continued to maintain elevated NPS scores year over year • 2022 Update: • A more normalized tax filing season for TY 2021 announced by the IRS, with a beginning date Jan 24, 2022 and ending date Apr 18, 2022 • Announced free access to TaxAct Xpert Assist for all filers, which allows for expert guidance and return review • Announced TaxAct Xpert Full Service, a personalized service for simple and complex return completion Key Observations/Highlights

Wealth Management Update RETENTION OF HIGH - PRODUCING FINANCIAL PROFESSIONALS ATTRITION OF FP’s BY REVENUE PRODUCTION – Q4 2021 QUARTERLY PRODUCTION RETENTION RATE* HIGH PORTION OF REVENUES ARE RETAINED Key Observations /Highlights • 1 Non - producers defined as FPs with less than $50K in rolling gross production. • *See reconciliations of all non - GAAP to GAAP measures presented in this presentation in the tables in the appendix. • Total client assets of $89.1 million at December 31, 2021 • Set a record in Q4 with greatest % of AUM of total assets of 47.3% • 98% Quarterly Production Retention Rate in Q4* • Since we began our M&A program in December 2020, we have completed the closing of 8 transactions with nearly $2.0B in assets that have transitioned from the independent model to the employee - based RIA model. • During the quarter, FP attrition of 125 departing advisors skewed heavily (76%) to non - producers 1 5 98% 99% 98% 99% 96% 98% 98% 98% 98% 4Q19 1Q20 2Q20 3Q20 4Q20 1Q21 2Q21 3Q21 Q421 Production Retention Rate 76% 10% 14% < $50K $50K-$100K > $100K
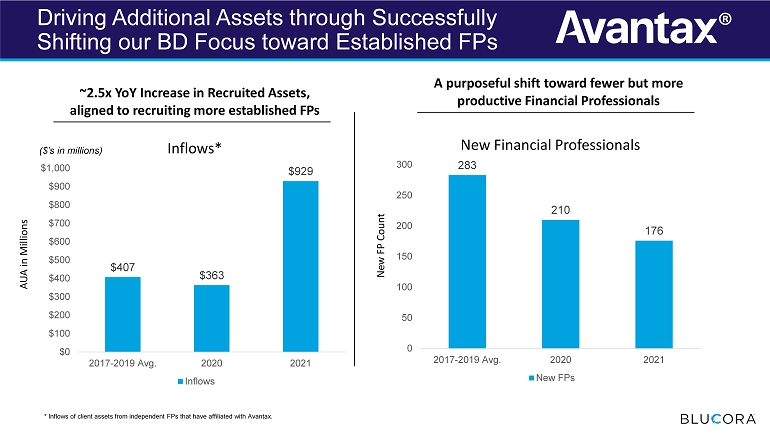
Driving Additional Assets through Successfully Shifting our BD Focus toward Established FPs * Inflows of client assets from independent FPs that have affiliated with Avantax. A purposeful shift toward fewer but more productive Financial Professionals ($’s in millions) $407 $363 $929 $0 $100 $200 $300 $400 $500 $600 $700 $800 $900 $1,000 2017-2019 Avg. 2020 2021 Inflows* Inflows AUA in Millions New FP Count ~2.5x YoY Increase in Recruited Assets, aligned to recruiting more established FPs 283 210 176 0 50 100 150 200 250 300 2017-2019 Avg. 2020 2021 New Financial Professionals New FPs

Organic asset inflows continued to shift toward more durable advisory platforms LONG - TERM ASSET GROWTH CONTINUED STRONG FINANCIAL RESULTS SHIFT TO MORE DURABLE ADVISORY PLATFORMS Strong growth in total client assets 4Q 2021 segment net revenue remains at a high despite a challenging interest rate environment Wealth Management Update (continued) TOTAL CLIENT ASSETS ($ in billions) ADVISORY ASSETS AS A % OF TOTAL CLIENT ASSETS SEGMENT NET REVENUE AND SEGMENT NET REVENUE ROA EX - CASH SWEEP* (dollars in millions) More assets on better platforms have led to more revenue 7 * See reconciliations of all non - GAAP to GAAP measures presented in this presentation in the tables in the appendix. Net Revenue Net Revenue ROA ex - Cash Sweep (bps) $46 $68 $68 $71 $61 $69 $76 $83 $85 $88 $87 $89 $0 $10 $20 $30 $40 $50 $60 $70 $80 $90 $100 30% 39% 39% 39% 39% 39% 43% 43% 43% 45% 46% 47% 0% 5% 10% 15% 20% 25% 30% 35% 40% 45% 50% $33 $41 $47 $47 $50 $50 $53 21.4 21.4 21.5 21.1 21.9 22.3 22.6 $0 $10 $20 $30 $40 $50 $60 2Q20 3Q20 4Q20 1Q21 2Q21 3Q21 4Q21
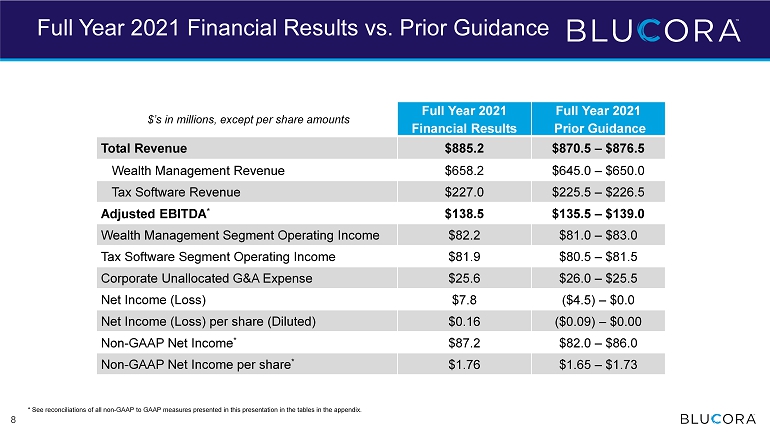
Full Year 2021 Financial Results vs. Prior Guidance * See reconciliations of all non - GAAP to GAAP measures presented in this presentation in the tables in the appendix. 8 $’s in millions, except per share amounts Full Year 2021 Financial Results Full Year 2021 Prior Guidance Total Revenue $885.2 $870.5 – $876.5 Wealth Management Revenue $658.2 $645.0 – $650.0 Tax Software Revenue $227.0 $225.5 – $226.5 Adjusted EBITDA * $138.5 $135.5 – $139.0 Wealth Management Segment Operating Income $82.2 $81.0 – $83.0 Tax Software Segment Operating Income $81.9 $80.5 – $81.5 Corporate Unallocated G&A Expense $25.6 $26.0 – $25.5 Net Income (Loss) $7.8 ($4.5) – $0.0 Net Income (Loss) per share (Diluted) $0.16 ($0.09) – $0.00 Non - GAAP Net Income * $87.2 $82.0 – $86.0 Non - GAAP Net Income per share * $1.76 $1.65 – $1.73
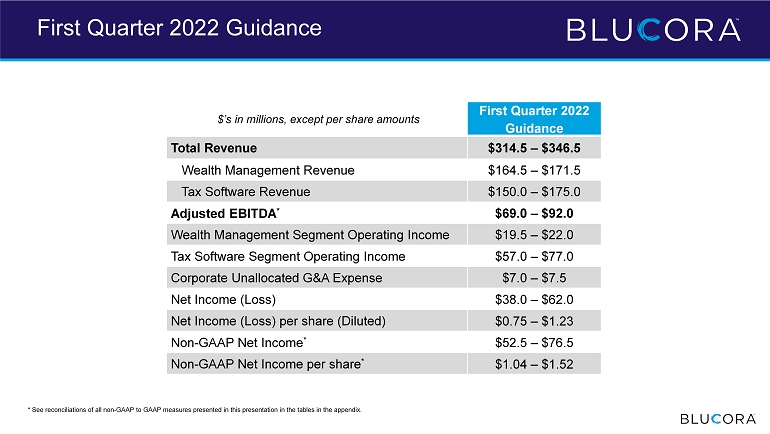
$’s in millions, except per share amounts First Quarter 2022 Guidance Total Revenue $314.5 – $346.5 Wealth Management Revenue $164.5 – $171.5 Tax Software Revenue $150.0 – $175.0 Adjusted EBITDA * $69.0 – $92.0 Wealth Management Segment Operating Income $19.5 – $22.0 Tax Software Segment Operating Income $57.0 – $77.0 Corporate Unallocated G&A Expense $7.0 – $7.5 Net Income (Loss) $38.0 – $62.0 Net Income (Loss) per share (Diluted) $0.75 – $1.23 Non - GAAP Net Income * $52.5 – $76.5 Non - GAAP Net Income per share * $1.04 – $1.52 First Quarter 2022 Guidance * See reconciliations of all non - GAAP to GAAP measures presented in this presentation in the tables in the appendix.

Appendix 10
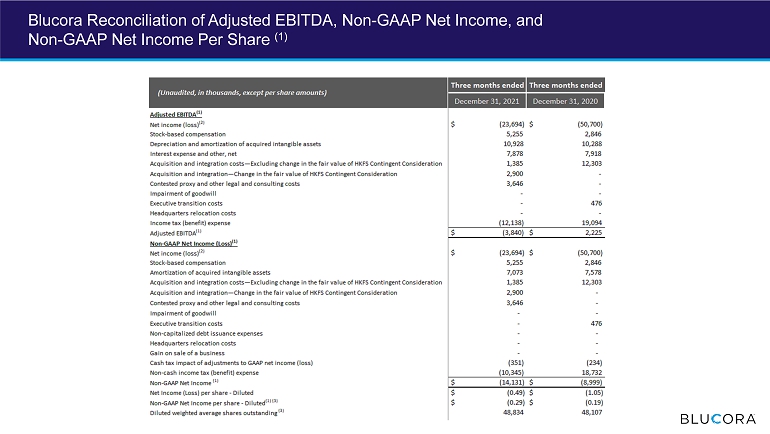
Blucora Reconciliation of Adjusted EBITDA, Non - GAAP Net Income, and Non - GAAP Net Income Per Share (1)
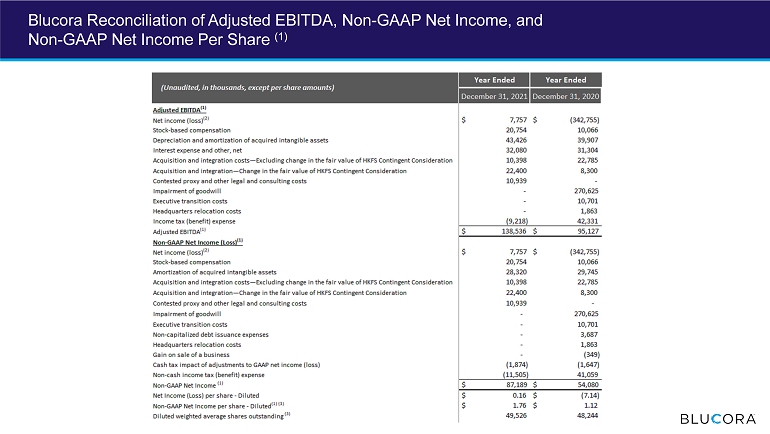
Blucora Reconciliation of Adjusted EBITDA, Non - GAAP Net Income, and Non - GAAP Net Income Per Share (1)
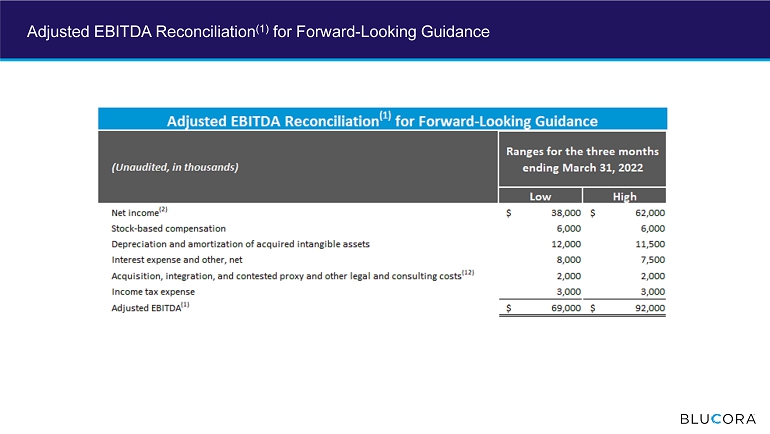
Adjusted EBITDA Reconciliation (1) for Forward - Looking Guidance
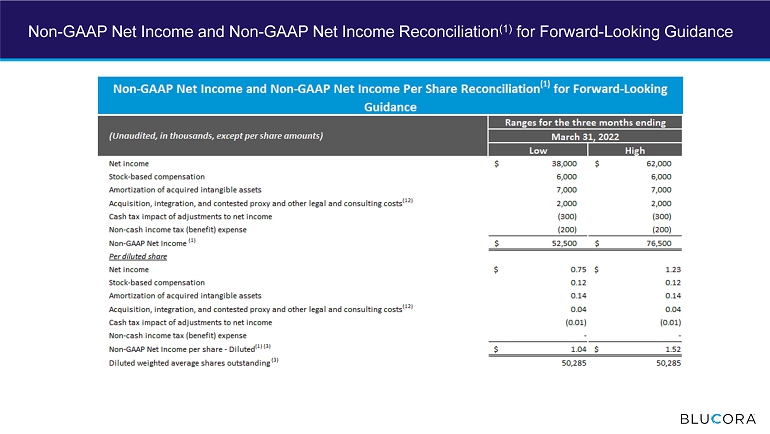
Non - GAAP Net Income and Non - GAAP Net Income Reconciliation (1) for Forward - Looking Guidance
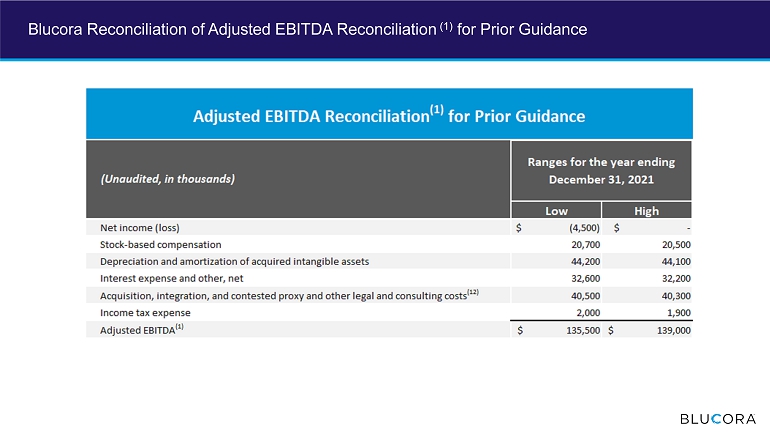
Blucora Reconciliation of Adjusted EBITDA Reconciliation (1) for Prior Guidance
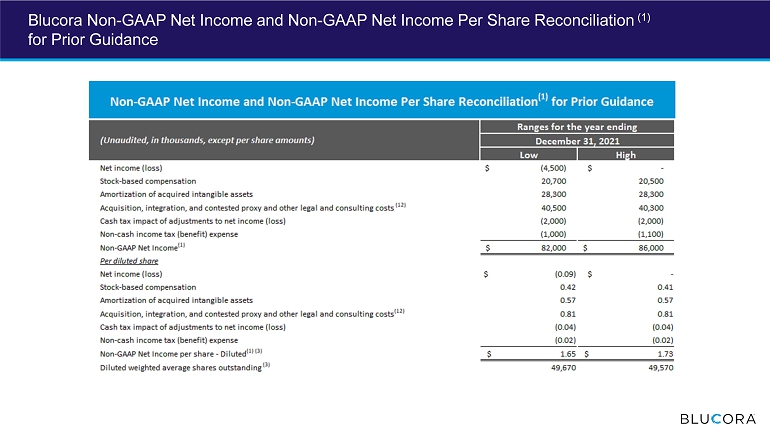
Blucora Non - GAAP Net Income and Non - GAAP Net Income Per Share Reconciliation (1) for Prior Guidance
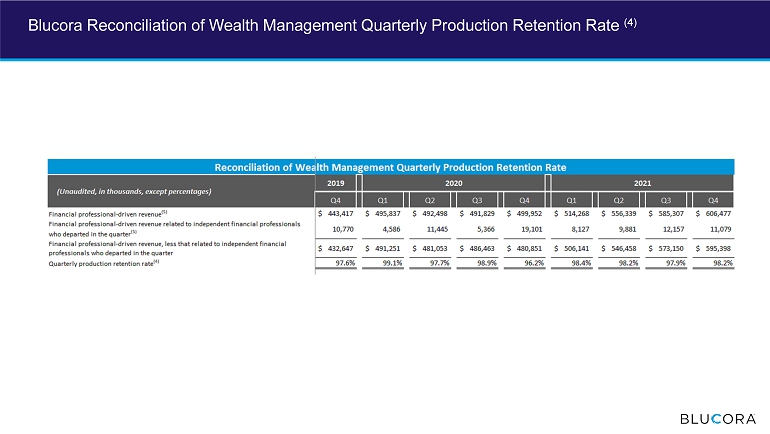
Blucora Reconciliation of Wealth Management Quarterly Production Retention Rate (4)
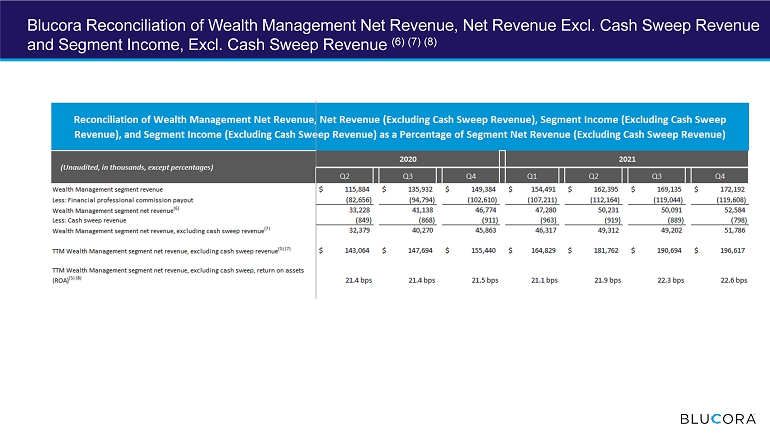
Blucora Reconciliation of Wealth Management Net Revenue, Net Revenue Excl. Cash Sweep Revenue and Segment Income, Excl. Cash Sweep Revenue (6) (7) (8)
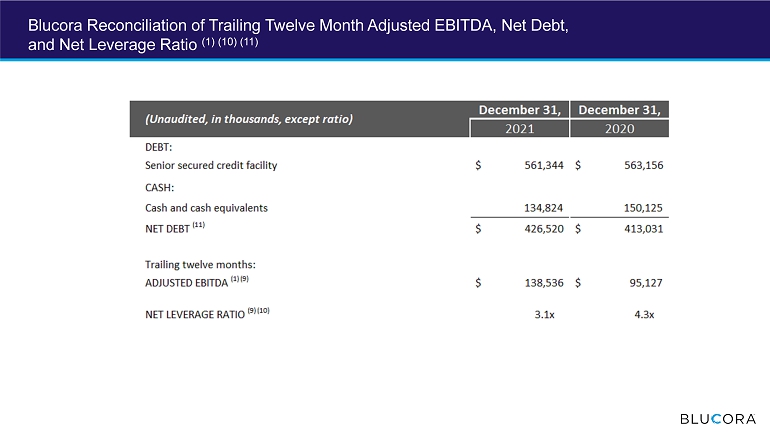
Blucora Reconciliation of Trailing Twelve Month Adjusted EBITDA, Net Debt, and Net Leverage Ratio (1) (10) (11)
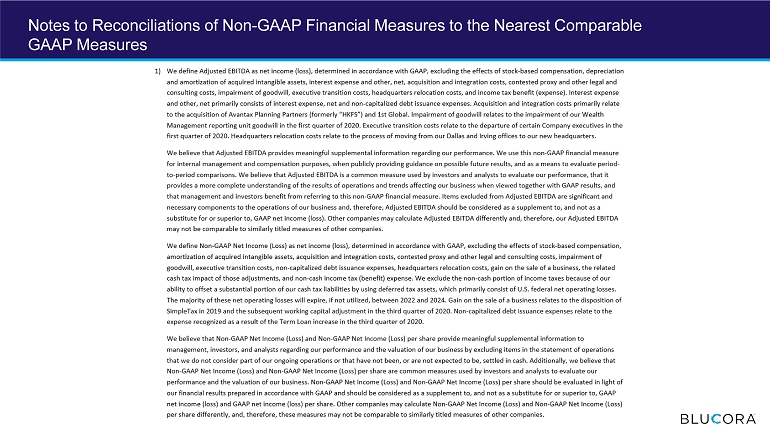
Notes to Reconciliations of Non - GAAP Financial Measures to the Nearest Comparable GAAP Measures
Notes to Reconciliations of Non - GAAP Financial Measures to the Nearest Comparable GAAP Measures (continued)