UNITED STATES
SECURITIES AND EXCHANGE COMMISSION
Washington, D.C. 20549
SCHEDULE 14A
Proxy Statement Pursuant to Section 14(a) of
the Securities Exchange Act of 1934 (Amendment No. )
| Filed by the Registrant ☒ |
| |
| Filed by a Party other than the Registrant ☐ |
| |
| Check the appropriate box: |
| ☐ | Preliminary Proxy Statement |
| ☐ | Confidential, for Use of the Commission Only (as permitted by Rule 14a-6(e)(2)) |
| ☐ | Definitive Proxy Statement |
| ☐ | Definitive Additional Materials |
| ☒ | Soliciting Material under §240.14a-12 |
| |
| AVANTAX, INC. |
| (Name of Registrant as Specified In Its Charter) |
| |
| |
| (Name of Person(s) Filing Proxy Statement, if other than the Registrant) |
| |
| Payment of Filing Fee (Check the appropriate box): |
| ☒ | No fee required. |
| ☐ | Fee computed on table below per Exchange Act Rules 14a-6(i)(1) and 0-11. |
| | (1) | Title of each class of securities to which transaction applies: |
| | | |
| | (2) | Aggregate number of securities to which transaction applies: |
| | | |
| | (3) | Per unit price or other underlying value of transaction computed pursuant to Exchange Act Rule 0-11 (set forth the amount on which the filing fee is calculated and state how it was determined): |
| | | |
| | (4) | Proposed maximum aggregate value of transaction: |
| | | |
| | (5) | Total fee paid: |
| | | |
| ☐ | Fee paid previously with preliminary materials. |
| ☐ | Check box if any part of the fee is offset as provided by Exchange Act Rule 0-11(a)(2) and identify the filing for which the offsetting fee was paid previously. Identify the previous filing by registration statement number, or the Form or Schedule and the date of its filing. |
| | (1) | Amount Previously Paid: |
| | | |
| | (2) | Form, Schedule or Registration Statement No.: |
| | | |
| | (3) | Filing Party: |
| | | |
| | (4) | Date Filed: |
| | | |
| | | | |
On February 15, 2023, Avantax, Inc. (the “Company”) issued a press release containing the Company’s financial results for its fourth quarter and full year ended December 31, 2022. A copy of the press release can be found below, along with the earnings report upon which it is based and the accompanying presentation.

Avantax Reports Fourth Quarter 2022 Results
DALLAS, TX — February 15, 2023 — Avantax, Inc. (NASDAQ: AVTA), a leading provider of technology-enabled, tax focused financial solutions, today announced financial results for the fourth quarter ended December 31, 2022.
Fourth Quarter and Full Year 2022 Highlights and Recent Developments
| • | Following the close of the TaxAct sale in December, the Company changed its corporate name and ticker symbol to Avantax, Inc. and AVTA, respectively. In the fourth quarter and for the year, Avantax set record highs in many of its performance metrics. |
| • | Avantax added over $401 million of newly recruited assets during the fourth quarter for a total of approximately $1.7 billion of newly recruited assets for the full year of 2022, which was a new record. This exceeds full year 2021 newly recruited assets of $929 million. |
| • | Avantax continued to deliver net positive asset flows with $495 million for the quarter and $1.3 billion for the year, which was a new record. |
| • | Avantax reported total revenue of $172.4 million for the quarter, which was a new record, an increase of 0.1% versus the fourth quarter of the prior year. |
| • | Avantax ended the fourth quarter with total client assets of $76.9 billion, $38.3 billion of which were advisory assets, representing 49.8% of total client assets, which was a new record. |
| • | The Company ended the year with $263.9 million in cash and cash equivalents and no outstanding indebtedness under its credit facility, compared to $100.6 million in cash and cash equivalents and $561.3 million of outstanding indebtedness under its credit facility at December 31, 2021. |
Chris Walters, Chief Executive Officer of Avantax said, “I am extremely proud of the progress that we have made following the close of the TaxAct sale in December, and I would personally like to thank all of our financial professionals and our employees who have played a part in getting our company to this point. We have completed our refinancing of the Company’s debt and commenced the modified Dutch Auction tender offer to return capital to shareholders.” Mr. Walters continued, “Also, we have begun streamlining our organization and are positioning our team to execute our wealth-only growth strategy. As part of this work, we have announced the departure of multiple leaders and our team has been aligned to deliver on our strategic priorities. These efforts have positioned the Company well as we enter into this new phase as a pure-play wealth management company.”
Summary Financial Performance: Q4 and Full Year 2022
| ($ in millions, except per share amounts) | | Q4 2022 | | | Q4 2021 | | | Change | | | Full Year
2022 | | | Full Year 2021 | | | Change | |
| GAAP: | | | | | | | | | | | | | | | | | | | | | | | | |
| Revenue | | $ | 172.4 | | | $ | 172.2 | | | | 0.1 | % | | $ | 666.5 | | | $ | 658.2 | | | | 1.3 | % |
| | | | | | | | | | | | | | | | | | | | | | | | | |
| Income (loss) from continuing operations, net of income taxes | | $ | (1.6 | ) | | $ | (8.0 | ) | | | 80.0 | % | | $ | 3.1 | | | $ | (43.5 | ) | | | 107.1 | % |
| Income (loss) from discontinued operations, net of income taxes | | | 369.6 | | | | (15.7 | ) | | | 2454.1 | % | | | 417.1 | | | | 51.3 | | | | 713.1 | % |
| Net Income (Loss) | | $ | 368.0 | | | $ | (23.7 | ) | | | 1652.7 | % | | $ | 420.2 | | | $ | 7.8 | | | | 5287.2 | % |
| Net Income (Loss) per share — Basic: | | | | | | | | | | | | | | | | | | | | | | | | |
| Continuing operations | | $ | (0.03 | ) | | $ | (0.16 | ) | | | 81.3 | % | | $ | 0.07 | | | $ | (0.90 | ) | | | 107.8 | % |
| Discontinued operations | | | 7.69 | | | | (0.33 | ) | | | 2430.3 | % | | | 8.69 | | | | 1.06 | | | | 719.8 | % |
| Net Income (Loss) per share — Basic | | $ | 7.66 | | | $ | (0.49 | ) | | | 1663.3 | % | | $ | 8.76 | | | $ | 0.16 | | | | 5375.0 | % |
| Net Income (Loss) per share — Diluted: | | | | | | | | | | | | | | | | | | | | | | | | |
| Continuing operations | | $ | (0.03 | ) | | $ | (0.16 | ) | | | 81.3 | % | | $ | 0.06 | | | $ | (0.90 | ) | | | 106.7 | % |
| Discontinued operations | | | 7.69 | | | | (0.33 | ) | | | 2430.3 | % | | | 8.48 | | | | 1.06 | | | | 700.0 | % |
| Net Income (Loss) per share — Diluted | | $ | 7.66 | | | $ | (0.49 | ) | | | 1663.3 | % | | $ | 8.54 | | | $ | 0.16 | | | | 5237.5 | % |
| Non-GAAP: | | | | | | | | | | | | | | | | | | | | | | | | |
| Adjusted EBITDA (1) | | $ | 25.9 | | | $ | 12.0 | | | | 115.8 | % | | $ | 53.7 | | | $ | 46.1 | | | | 16.5 | % |
_________________________
Note: Totals may not foot due to rounding.
| (1) | See reconciliations of all non-GAAP to GAAP measures presented in this release in the tables below. |
Full Year 2023 Outlook
| ($ in millions, except per share amounts) | | Full Year 2023 Outlook |
| GAAP: | | |
| Revenue | | $750.0 - $758.0 |
| Net Income | | $25.5 - $40.1 |
| Net Income per share — Diluted | | $0.63 - $0.96 |
| Non-GAAP: | | |
| Adjusted EBITDA (1) | | $124.5 - $135.5 |
____________________________
| (1) | See reconciliations of all non-GAAP to GAAP measures presented in this release in the tables below. |
Our expectations for 2023 financial performance assume 4% market growth during 2023, a 25 basis point increase in the Federal Funds rate in March 2023, between $12.7 million and $13.5 million in interest expense, $14 million in depreciation expense, $25 million in amortization expense, and the achievement of meaningful cost efficiencies in our business.
Conference Call and Webcast
A conference call and live webcast will be held on Thursday, February 16, 2023 at 8:30 a.m. Eastern Time during which the Company will further discuss fourth quarter results, its outlook for full year 2023, and the Company’s strategic transformation. We will also provide supplemental financial information to our results on the Investor Relations section of the Avantax corporate website at www.avantax.com prior to the call. A replay of the call will be available on our website.
About Avantax®
Avantax, Inc. (NASDAQ: AVTA) delivers tax-focused wealth management solutions for Financial Professionals, tax professionals and CPA firms, supporting our goal of minimizing clients’ tax burdens through comprehensive tax-focused financial planning. We have two distinct, but related, models within our business: the independent Financial Professional model and the employee-based model. We refer to our independent Financial Professional model as Avantax Wealth Management®. Avantax Wealth Management offers services through its registered broker-dealer, registered investment advisor (RIA), and insurance agency subsidiaries and is a leading U.S. tax-focused independent broker-dealer that works with a nationwide network of Financial Professionals operating as independent contractors. We refer to our employee-based model as Avantax Planning Partners℠. Avantax Planning Partners offers services through its RIA and insurance agency by partnering with CPA firms to provide their consumer and small-business clients with holistic financial planning and advisory services. Collectively, we had $77 billion in total client assets as of December 31, 2022. For more information on Avantax, visit www.avantax.com.
Source: Avantax
Investor Relations Contact:
Dee Littrell
Avantax, Inc.
(972) 870-6463
IR@Avantax.com
Media Contacts:
Tony Katsulos
Avantax, Inc.
(972) 870-6654
tony.katsulos@avantax.com
Kendra Galante
StreetCred PR for Avantax
(402) 740-2047
kendra@streetcredpr.com
avantax@streetcredpr.com
This release contains forward-looking statements within the meaning of Section 27A of the Securities Act of 1933, as amended, and Section 21E of the Securities Exchange Act of 1934, as amended, including without limitation, statements regarding the outlook of Avantax, Inc. (the “Company”), the anticipated business strategy and corporate focus of the Company following consummation of the sale of our tax software business (the “TaxAct Sale”) and the intended use of proceeds from the TaxAct Sale. Forward-looking statements provide current expectations of future events based on certain assumptions and include any statement that does not directly relate to any historical or current fact. Forward-looking statements can also be identified by words such as “anticipates,” “believes,” “plans,” “expects,” “future,” “intends,” “may,” “will,” “would,” “could,” “should,” “estimates,” “predicts,” “potential,” “continues,” “target,” “outlook,” and similar terms and expressions, but the absence of these words does not mean that the statement is not forward-looking. Actual results may differ significantly from management’s expectations due to various risks and uncertainties including, but not limited to: our ability to effectively compete within our industry; our ability to generate strong performance for our clients and the impact of the financial markets on our clients’ portfolios; our expectations concerning the revenues we generate from fees associated with the financial products that we distribute; our ability to attract and retain financial professionals, employees, and clients, as well as our ability to provide strong client service; the impact of significant interest rate changes; our ability to maintain our relationships with third-party partners, providers, suppliers, vendors, distributors, contractors, financial institutions, industry associations, and licensing partners, and our expectations regarding and reliance on the products, tools, platforms, systems, and services provided by these third parties; political and economic conditions and events that directly or indirectly impact the wealth management industry; risks related to goodwill and acquired intangible asset impairment; our ability to respond to rapid technological changes, including our ability to successfully release new products and services or improve upon existing products and services; our future capital requirements and the availability of financing, if necessary; the impact of new or changing legislation and regulations (or interpretations thereof) on our business, including our ability to successfully address and comply with such legislation and
regulations (or interpretations thereof) and increased costs, reductions of revenue, and potential fines, penalties, or disgorgement to which we may be subject as a result thereof; risks, burdens, and costs, including fines, penalties, or disgorgement, associated with our business being subjected to regulatory inquiries, investigations, or initiatives, including those of the Financial Industry Regulatory Authority, Inc. and the Securities and Exchange Commission (the “SEC”); any compromise of confidentiality, availability, or integrity of information, including cyberattacks; risks associated with legal proceedings, including litigation and regulatory proceedings; our ability to close, finance, and realize all of the anticipated benefits of acquisitions, as well as our ability to integrate the operations of recently acquired businesses, and the potential impact of such acquisitions on our existing indebtedness and leverage; our ability to retain employees and acquired client assets following acquisitions; our ability to manage leadership and employee transitions, including costs and time burdens on management and our board of directors related thereto; our ability to develop, establish, and maintain strong brands; our ability to comply with laws and regulations regarding privacy and protection of user data; our assessments and estimates that determine our effective tax rate; our ability to protect our intellectual property and the impact of any claim that we infringed on the intellectual property rights of others; any downgrade of the Company’s credit ratings; our failure to realize the expected benefits of the sale of our tax software business; disruptions to our business and operations resulting from the transition services we are providing in connection with the TaxAct Sale; our inability to return capital to stockholders in the amount anticipated; and the effects on our business of actions of activist stockholders. A more detailed description of these and certain other factors that could affect actual results is included in the Company’s most recent Annual Report on Form 10-K and most recent Quarterly Report on Form 10-Q filed with the SEC. Readers are cautioned not to place undue reliance on these forward-looking statements, which speak only as of the date hereof. The Company undertakes no obligation to update any forward-looking statements to reflect events or circumstances after the date hereof, except as may be required by law.
Important Additional Information
The Company intends to file a definitive proxy statement, accompanying WHITE proxy card and other relevant documents with the SEC in connection with the solicitation of proxies for the Company’s 2023 annual meeting of stockholders (the “Annual Meeting”). BEFORE MAKING ANY VOTING DECISION, STOCKHOLDERS OF THE COMPANY ARE URGED TO READ ALL RELEVANT DOCUMENTS FILED WITH OR FURNISHED TO THE SEC, INCLUDING THE COMPANY’S DEFINITIVE PROXY STATEMENT AND ANY AMENDMENTS AND SUPPLEMENTS THERETO, BECAUSE THEY WILL CONTAIN IMPORTANT INFORMATION. Investors and stockholders will be able to obtain a copy of the definitive proxy statement and other documents filed by the Company with the SEC free of charge from the SEC’s website at www.sec.gov. In addition, copies will be available at no charge by selecting “SEC Filings” under “Financial Information” in the “Investors” tab of the Company’s website at www.avantax.com.
The Company, its directors and certain of its executive officers are participants in the solicitation of proxies from the Company’s stockholders in connection with the Annual Meeting. The names of these directors and executive officers and their respective direct and indirect interests, by security holdings or otherwise, in the Company are set forth in the Company’s Current Report on Form 8-K filed with the SEC on January 23, 2023.
AVANTAX, INC.
CONDENSED CONSOLIDATED STATEMENTS OF OPERATIONS
(Unaudited) (In thousands, except per share amounts)
| | | Three Months Ended | | | Twelve Months Ended | |
| | | December 31, | | | December 31, | |
| | | 2022 | | | 2021 | | | 2022 | | | 2021 | |
| Revenue | | $ | 172,392 | | | $ | 172,192 | | | $ | 666,496 | | | $ | 658,213 | |
| Operating expenses: | | | | | | | | | | | | | | | | |
| Cost of revenue | | | 103,475 | | | | 121,519 | | | | 444,918 | | | | 466,464 | |
| Engineering and technology | | | 1,968 | | | | 2,018 | | | | 8,701 | | | | 8,190 | |
| Sales and marketing | | | 27,088 | | | | 22,498 | | | | 97,914 | | | | 84,828 | |
| General and administrative | | | 23,367 | | | | 22,437 | | | | 92,755 | | | | 81,668 | |
| Acquisition and integration | | | 524 | | | | 4,285 | | | | (4,186 | ) | | | 32,798 | |
| Depreciation | | | 3,454 | | | | 2,046 | | | | 11,882 | | | | 8,987 | |
| Amortization of acquired intangible assets | | | 6,415 | | | | 7,073 | | | | 25,850 | | | | 28,320 | |
| Total operating expenses | | | 166,291 | | | | 181,876 | | | | 677,834 | | | | 711,255 | |
| Operating income (loss) from continuing operations | | | 6,101 | | | | (9,684 | ) | | | (11,338 | ) | | | (53,042 | ) |
| Interest expense and other, net | | | (52 | ) | | | (156 | ) | | | (475 | ) | | | (422 | ) |
| Income (loss) from continuing operations before income taxes | | | 6,049 | | | | (9,840 | ) | | | (11,813 | ) | | | (53,464 | ) |
| Income tax benefit (expense) | | | (7,648 | ) | | | 1,833 | | | | 14,934 | | | | 9,959 | |
| Income (loss) from continuing operations | | | (1,599 | ) | | | (8,007 | ) | | | 3,121 | | | | (43,505 | ) |
| Discontinued operations | | | | | | | | | | | | | | | | |
| Income (loss) from discontinued operations before gain on disposal and income taxes | | | (21,673 | ) | | | (25,992 | ) | | | 52,492 | | | | 52,003 | |
| Pre-tax gain on disposal | | | 472,237 | | | | — | | | | 472,237 | | | | — | |
| Income (loss) from discontinued operations before income taxes | | | 450,564 | | | | (25,992 | ) | | | 524,729 | | | | 52,003 | |
| Income tax benefit (expense) | | | (80,922 | ) | | | 10,305 | | | | (107,603 | ) | | | (741 | ) |
| Income (loss) from discontinued operations | | $ | 369,642 | | | $ | (15,687 | ) | | $ | 417,126 | | | $ | 51,262 | |
| Net income (loss) | | $ | 368,043 | | | $ | (23,694 | ) | | $ | 420,247 | | | $ | 7,757 | |
| | | | | | | | | | | | | | | | | |
| Basic net income (loss) per share: | | | | | | | | | | | | | | | | |
| Continuing operations | | $ | (0.03 | ) | | $ | (0.16 | ) | | $ | 0.07 | | | $ | (0.90 | ) |
| Discontinued operations | | | 7.69 | | | | (0.33 | ) | | | 8.69 | | | | 1.06 | |
| Basic net income (loss) per share | | $ | 7.66 | | | $ | (0.49 | ) | | $ | 8.76 | | | $ | 0.16 | |
| Diluted net income (loss) per share: | | | | | | | | | | | | | | | | |
| Continuing operations | | $ | (0.03 | ) | | $ | (0.16 | ) | | $ | 0.06 | | | $ | (0.90 | ) |
| Discontinued operations | | | 7.69 | | | | (0.33 | ) | | | 8.48 | | | | 1.06 | |
| Diluted net income (loss) per share | | $ | 7.66 | | | $ | (0.49 | ) | | $ | 8.54 | | | $ | 0.16 | |
| Weighted average shares outstanding: | | | | | | | | | | | | | | | | |
| Basic | | | 48,034 | | | | 48,834 | | | | 47,994 | | | | 48,578 | |
| Diluted | | | 48,034 | | | | 48,834 | | | | 49,183 | | | | 48,578 | |
AVANTAX, INC.
CONDENSED CONSOLIDATED BALANCE SHEETS
(Unaudited) (In thousands, except per share amounts)
| | | December 31,
2022 | | | December 31,
2021 | |
| ASSETS | | | | | | | | |
| Current assets: | | | | | | | | |
| Cash and cash equivalents | | $ | 263,928 | | | $ | 100,629 | |
| Accounts receivable, net | | | 24,117 | | | | 21,214 | |
| Commissions and advisory fees receivable | | | 20,679 | | | | 25,073 | |
| Prepaid expenses and other current assets | | | 15,027 | | | | 11,731 | |
| Current assets of discontinued operations | | | — | | | | 41,632 | |
| Total current assets | | | 323,751 | | | | 200,279 | |
| Long-term assets: | | | | | | | | |
| Property, equipment, and software, net | | | 53,041 | | | | 50,040 | |
| Right-of-use assets, net | | | 19,361 | | | | 20,466 | |
| Goodwill, net | | | 266,279 | | | | 266,279 | |
| Acquired intangible assets, net | | | 266,002 | | | | 282,789 | |
| Other long-term assets | | | 35,081 | | | | 20,414 | |
| Long-term assets of discontinued operations | | | — | | | | 231,676 | |
| Total long-term assets | | | 639,764 | | | | 871,664 | |
| Total assets | | $ | 963,515 | | | $ | 1,071,943 | |
| LIABILITIES AND STOCKHOLDERS’ EQUITY | | | | | | | | |
| Current liabilities: | | | | | | | | |
| Accounts payable | | $ | 7,531 | | | $ | 6,493 | |
| Commissions and advisory fees payable | | | 13,829 | | | | 17,940 | |
| Accrued expenses and other current liabilities | | | 111,212 | | | | 55,658 | |
| Current deferred revenue | | | 4,583 | | | | 4,792 | |
| Current lease liabilities | | | 5,139 | | | | 4,896 | |
| Current portion of long-term debt | | | — | | | | 1,812 | |
| Current liabilities of discontinued operations | | | — | | | | 20,131 | |
| Total current liabilities | | | 142,294 | | | | 111,722 | |
| Long-term liabilities: | | | | | | | | |
| Long-term debt, net | | | — | | | | 553,134 | |
| Long-term lease liabilities | | | 30,332 | | | | 33,267 | |
| Deferred tax liabilities, net | | | 20,819 | | | | 19,124 | |
| Long-term deferred revenue | | | 4,396 | | | | 5,322 | |
| Other long-term liabilities | | | 22,476 | | | | 6,752 | |
| Long-term liabilities of discontinued operations | | | — | | | | 1,000 | |
| Total long-term liabilities | | | 78,023 | | | | 618,599 | |
| Total liabilities | | | 220,317 | | | | 730,321 | |
| | | | | | | | | |
| Stockholders’ equity: | | | | | | | | |
| Common stock, par value $0.0001 per share—900,000 authorized shares; 51,260 shares issued and 48,079 shares outstanding as of December 31, 2022; 50,137 shares issued and 48,831 shares outstanding as of December 31, 2021 | | | 5 | | | | 5 | |
| Additional paid-in capital | | | 1,636,134 | | | | 1,619,805 | |
| Accumulated deficit | | | (829,542 | ) | | | (1,249,789 | ) |
| Treasury stock, at cost—3,181 shares at December 31, 2022 and 1,306 shares at December 31, 2021 | | | (63,399 | ) | | | (28,399 | ) |
| Total stockholders’ equity | | | 743,198 | | | | 341,622 | |
| Total liabilities and stockholders’ equity | | $ | 963,515 | | | $ | 1,071,943 | |
AVANTAX, INC.
CONDENSED CONSOLIDATED STATEMENTS OF CASH FLOWS
(Unaudited) (In thousands)
| | | Twelve Months Ended | |
| | | December 31, | |
| | | 2022 | | | 2021 | |
| Operating activities: | | | | | | | | |
| Net income | | $ | 420,247 | | | $ | 7,757 | |
| Less: Income from discontinued operations, net of income taxes | | | 417,126 | | | | 51,262 | |
| Income (loss) from continuing operations | | | 3,121 | | | | (43,505 | ) |
| Adjustments to reconcile income (loss) from continuing operations to net cash from operating activities: | | | | | | | | |
| Depreciation and amortization of acquired intangible assets | | | 37,732 | | | | 37,307 | |
| Stock-based compensation | | | 21,153 | | | | 18,119 | |
| Change in the fair value of acquisition-related contingent consideration | | | (5,320 | ) | | | 22,400 | |
| Reduction of right-of-use lease assets | | | 1,495 | | | | 2,749 | |
| Deferred income taxes | | | 1,695 | | | | (8,909 | ) |
| Accretion of lease liabilities | | | 2,012 | | | | 1,250 | |
| Other non-cash items | | | 5,230 | | | | 2,390 | |
| Changes in operating assets and liabilities, net of acquisitions and disposals: | | | | | | | | |
| Accounts receivable, net | | | (2,747 | ) | | | (9,304 | ) |
| Commissions and advisory fees receivable | | | 4,394 | | | | 1,059 | |
| Prepaid expenses and other current assets | | | (1,661 | ) | | | (5,130 | ) |
| Other long-term assets | | | (21,430 | ) | | | (18,154 | ) |
| Accounts payable | | | 1,038 | | | | 2,290 | |
| Commissions and advisory fees payable | | | (4,111 | ) | | | (857 | ) |
| Lease liabilities | | | (5,095 | ) | | | (1,553 | ) |
| Deferred revenue | | | (1,134 | ) | | | (829 | ) |
| Accrued expenses and other current and long-term liabilities | | | 80,702 | | | | (21,657 | ) |
| Net cash provided (used) by operating activities from continuing operations | | | 117,074 | | | | (22,334 | ) |
| Investing activities: | | | | | | | | |
| Purchases of property, equipment, and software | | | (14,892 | ) | | | (20,999 | ) |
| Asset acquisitions | | | (7,887 | ) | | | (8,316 | ) |
| Net cash used by investing activities from continuing operations | | | (22,779 | ) | | | (29,315 | ) |
| Financing activities: | | | | | | | | |
| Proceeds from credit facilities, net of debt discount and issuance costs | | | — | | | | (502 | ) |
| Payments on credit facilities | | | (561,344 | ) | | | (1,812 | ) |
| Acquisition-related contingent consideration payments | | | (15,148 | ) | | | (14,075 | ) |
| Stock repurchases | | | (35,000 | ) | | | — | |
| Proceeds from issuance of stock through employee stock purchase plan | | | 3,983 | | | | 3,277 | |
| Proceeds from stock option exercises | | | 935 | | | | 579 | |
| Tax payments from shares withheld for equity awards | | | (2,589 | ) | | | (1,644 | ) |
| Net cash used by financing activities from continuing operations | | | (609,163 | ) | | | (14,177 | ) |
| Net cash used by continuing operations | | | (514,868 | ) | | | (65,826 | ) |
| Net cash provided (used) by operating activities from discontinued operations | | | (10,452 | ) | | | 42,890 | |
| Net cash provided (used) by investing activities from discontinued operations | | | 688,619 | | | | (9,277 | ) |
| Net cash provided by financing activities from discontinued operations | | | — | | | | — | |
| Net cash provided by discontinued operations | | | 678,167 | | | | 33,613 | |
| Net increase (decrease) in cash and cash equivalents | | | 163,299 | | | | (32,213 | ) |
| Cash and cash equivalents, beginning of period | | | 100,629 | | | | 132,842 | |
| Cash and cash equivalents, end of period | | $ | 263,928 | | | $ | 100,629 | |
| | | | | | | | | |
| Supplemental cash flow information: | | | | | | | | |
| Cash paid for income taxes | | $ | 5,986 | | | $ | 3,056 | |
| Cash paid for interest | | $ | 32,442 | | | $ | 28,897 | |
AVANTAX, INC.
Revenue Recognition
(Unaudited) (In thousands)
Revenues by major category are presented below:
| | | Three Months Ended | | | Twelve Months Ended | |
| | | December 31, | | | December 31, | |
| | | 2022 | | | 2021 | | | 2022 | | | 2021 | |
| Total revenue: | | | | | | | | | | | | | | | | |
| Advisory | | $ | 92,445 | | | $ | 104,633 | | | $ | 398,839 | | | $ | 395,800 | |
| Commission | | | 41,153 | | | | 53,480 | | | | 173,431 | | | | 210,677 | |
| Asset-based | | | 31,269 | | | | 5,587 | | | | 65,043 | | | | 22,101 | |
| Transaction and fee | | | 7,525 | | | | 8,492 | | | | 29,183 | | | | 29,635 | |
| Total revenue | | $ | 172,392 | | | $ | 172,192 | | | $ | 666,496 | | | $ | 658,213 | |
AVANTAX, INC.
Reconciliations of Non-GAAP Financial Measures to the Nearest Comparable GAAP Measures (1)
(Unaudited) (In thousands)
Adjusted EBITDA Reconciliation (1)
| | | Three Months Ended | | | Twelve Months Ended | |
| | | December 31, | | | December 31, | |
| | | 2022 | | | 2021 | | | 2022 | | | 2021 | |
| Net income (loss) (2) | | $ | 368,043 | | | $ | (23,694 | ) | | $ | 420,247 | | | $ | 7,757 | |
| Less: Income (loss) from discontinued operations, net of income taxes | | | 369,642 | | | | (15,687 | ) | | | 417,126 | | | | 51,262 | |
| Income from continuing operations, net of income taxes | | | (1,599 | ) | | | (8,007 | ) | | | 3,121 | | | | (43,505 | ) |
| Stock-based compensation | | | 6,371 | | | | 4,586 | | | | 21,153 | | | | 18,119 | |
Depreciation and amortization of acquired intangible
assets | | | 9,869 | | | | 9,119 | | | | 37,732 | | | | 37,307 | |
| Interest expense and other, net | | | 52 | | | | 156 | | | | 475 | | | | 422 | |
| Acquisition and integration—Excluding change in the fair value of HKFS Contingent Consideration | | | 524 | | | | 1,385 | | | | 1,134 | | | | 10,398 | |
| Acquisition and integration—Change in the fair value of HKFS Contingent Consideration | | | — | | | | 2,900 | | | | (5,320 | ) | | | 22,400 | |
| Contested proxy, transaction and other legal and consulting costs | | | 1,197 | | | | 3,646 | | | | 5,062 | | | | 10,939 | |
| TaxAct divestiture costs (3) | | | 1,813 | | | | — | | | | 5,252 | | | | — | |
| Income tax (benefit) expense | | | 7,648 | | | | (1,833 | ) | | | (14,934 | ) | | | (9,959 | ) |
| Adjusted EBITDA (1) | | $ | 25,875 | | | $ | 11,952 | | | $ | 53,675 | | | $ | 46,121 | |
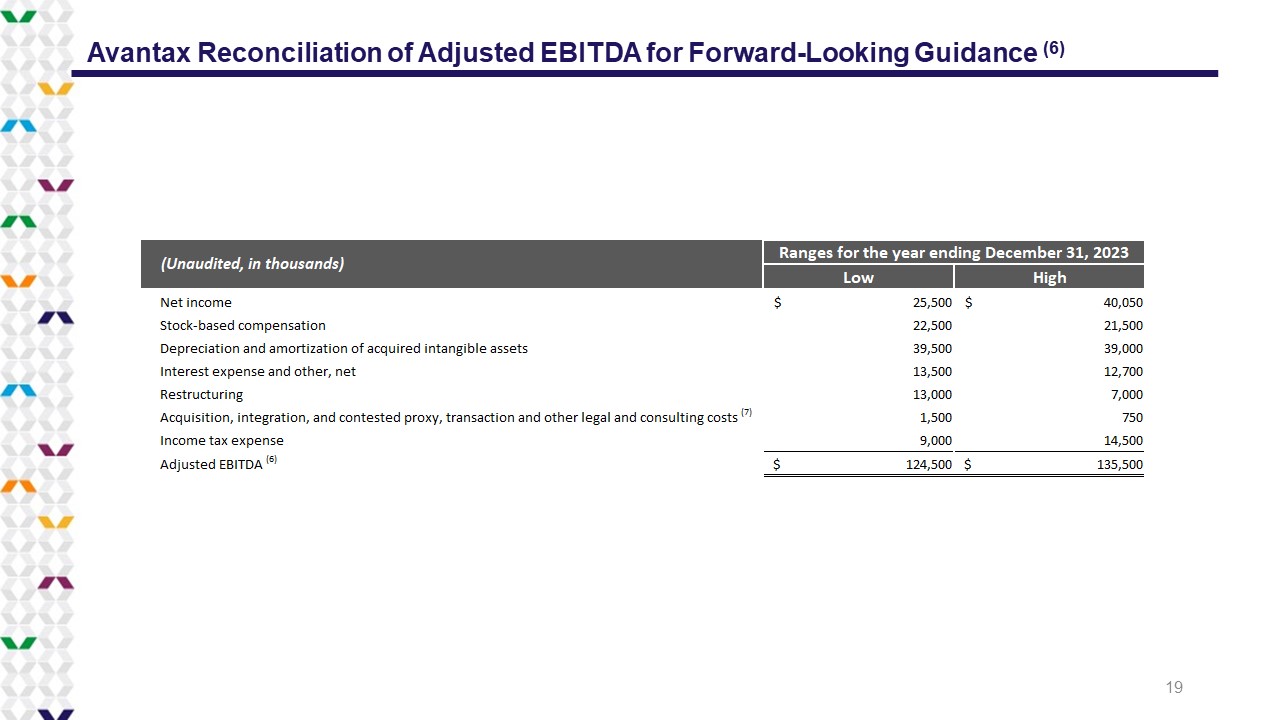
Adjusted EBITDA Reconciliation for Forward-Looking Guidance (1)
| | | Ranges for year ending | |
| | | December 31, 2023 | |
| | | Low | | | High | |
| Net income | | $ | 25,500 | | | $ | 40,050 | |
| Stock-based compensation | | | 22,500 | | | | 21,500 | |
| Depreciation and amortization of acquired intangible assets | | | 39,500 | | | | 39,000 | |
| Interest expense and other, net | | | 13,500 | | | | 12,700 | |
| Restructuring | | | 13,000 | | | | 7,000 | |
| Acquisition, integration, and contested proxy, transaction and other legal and consulting costs (4) | | | 1,500 | | | | 750 | |
| Income tax expense | | | 9,000 | | | | 14,500 | |
| Adjusted EBITDA (1) | | $ | 124,500 | | | $ | 135,500 | |
Notes to Reconciliations of Non-GAAP Financial Measures to the Nearest Comparable GAAP Measures
| (1) | We define Adjusted EBITDA as net income (loss), determined in accordance with GAAP, excluding the effects of discontinued operations, stock-based compensation, depreciation and amortization of acquired intangible assets, interest expense and other, net, acquisition and integration costs, contested proxy, transaction and other legal and consulting costs, TaxAct divestiture costs, and income tax (benefit) expense. Interest expense and other, net primarily consists of interest expense, net. Acquisition and integration costs primarily relate to the acquisitions of Avantax Planning Partners and 1st Global. |
| | We believe that Adjusted EBITDA provides meaningful supplemental information regarding our performance. We use this non-GAAP financial measure for internal management and compensation purposes, when publicly providing guidance on possible future results, and as a means to evaluate period-to-period comparisons. We believe that Adjusted EBITDA is a common measure used by investors and analysts to evaluate our performance, that it provides a more complete understanding of the results of operations and trends affecting our business when viewed together with GAAP results, and that management and investors benefit from referring to this non-GAAP financial measure. Items excluded from Adjusted EBITDA are significant and necessary components to the operations of our business and, therefore, Adjusted EBITDA should be considered as a supplement to, and not as a substitute for or superior to, GAAP net income (loss). Other companies may calculate Adjusted EBITDA differently and, therefore, our Adjusted EBITDA may not be comparable to similarly titled measures of other companies. |
| (2) | As presented in the condensed consolidated statements of operations (unaudited). |
| (3) | These costs do not include $17.6 million of transaction costs that were determined to be directly attributable to the sale of TaxAct, and are included within income from discontinued operations, net of income taxes, as a reduction to the gain on disposal. TaxAct divestiture costs primarily relate to incremental professional services, consulting, and insurance costs that were incurred in connection with the divestiture. |
| (4) | The breakout of components cannot be determined on a forward-looking basis without unreasonable efforts. |
Avantax, Inc.
Supplemental Information
December 31, 2022
Table of Contents
Avantax Condensed Consolidated Financial Results
| (Unaudited, in thousands, except per share amounts. Rounding differences may exist.) | | 2020 | | | 2021 | | | 2022 | |
| | | FY 12/31 | | | 1Q | | | 2Q | | | 3Q | | | 4Q | | | FY 12/31 | | | 1Q | | | 2Q | | | 3Q | | | 4Q | | | FY 12/31 | |
| Revenue | | $ | 546,189 | | | $ | 154,491 | | | $ | 162,395 | | | $ | 169,135 | | | $ | 172,192 | | | $ | 658,213 | | | $ | 166,403 | | | $ | 162,669 | | | $ | 165,032 | | | $ | 172,392 | | | $ | 666,496 | |
| Operating expenses: | | | | | | | | | | | | | | | | | | | | | | | | | | | | | | | | | | | | | | | | | | | | |
| Cost of revenue | | | 388,063 | | | | 109,269 | | | | 114,643 | | | | 121,033 | | | | 121,519 | | | | 466,464 | | | | 121,188 | | | | 114,446 | | | | 105,809 | | | | 103,475 | | | | 444,918 | |
| Engineering and technology | | | 5,743 | | | | 1,873 | | | | 1,852 | | | | 2,447 | | | | 2,018 | | | | 8,190 | | | | 1,814 | | | | 2,302 | | | | 2,617 | | | | 1,968 | | | | 8,701 | |
| Sales and marketing | | | 65,979 | | | | 20,157 | | | | 20,212 | | | | 21,961 | | | | 22,498 | | | | 84,828 | | | | 22,174 | | | | 24,882 | | | | 23,770 | | | | 27,088 | | | | 97,914 | |
| General and administrative | | | 69,836 | | | | 20,217 | | | | 19,688 | | | | 19,326 | | | | 22,437 | | | | 81,668 | | | | 23,875 | | | | 21,721 | | | | 23,792 | | | | 23,367 | | | | 92,755 | |
| Acquisition and integration | | | 31,085 | | | | 8,103 | | | | 18,169 | | | | 2,241 | | | | 4,285 | | | | 32,798 | | | | 1,666 | | | | (6,792 | ) | | | 416 | | | | 524 | | | | (4,186 | ) |
| Depreciation | | | 6,823 | | | | 2,049 | | | | 2,528 | | | | 2,364 | | | | 2,046 | | | | 8,987 | | | | 2,443 | | | | 2,642 | | | | 3,343 | | | | 3,454 | | | | 11,882 | |
| Amortization of acquired intangible assets | | | 29,745 | | | | 7,175 | | | | 7,063 | | | | 7,009 | | | | 7,073 | | | | 28,320 | | | | 6,631 | | | | 6,462 | | | | 6,342 | | | | 6,415 | | | | 25,850 | |
| Impairment of goodwill | | | 270,625 | | | | — | | | | — | | | | — | | | | — | | | | — | | | | — | | | | — | | | | — | | | | — | | | | — | |
| Total operating expenses | | | 867,899 | | | | 168,843 | | | | 184,155 | | | | 176,381 | | | | 181,876 | | | | 711,255 | | | | 179,791 | | | | 165,663 | | | | 166,089 | | | | 166,291 | | | | 677,834 | |
| Operating income (loss) from continuing operations | | | (321,710 | ) | | | (14,352 | ) | | | (21,760 | ) | | | (7,246 | ) | | | (9,684 | ) | | | (53,042 | ) | | | (13,388 | ) | | | (2,994 | ) | | | (1,057 | ) | | | 6,101 | | | | (11,338 | ) |
| Interest expense and other, net | | | (4,670 | ) | | | (67 | ) | | | (64 | ) | | | (135 | ) | | | (156 | ) | | | (422 | ) | | | (53 | ) | | | (212 | ) | | | (158 | ) | | | (52 | ) | | | (475 | ) |
| Income (loss) from continuing operations before income taxes | | | (326,380 | ) | | | (14,419 | ) | | | (21,824 | ) | | | (7,381 | ) | | | (9,840 | ) | | | (53,464 | ) | | | (13,441 | ) | | | (3,206 | ) | | | (1,215 | ) | | | 6,049 | | | | (11,813 | ) |
| Income tax benefit (expense) | | | (41,665 | ) | | | 2,686 | | | | 4,065 | | | | 1,375 | | | | 1,833 | | | | 9,959 | | | | 16,993 | | | | 4,053 | | | | 1,536 | | | | (7,648 | ) | | | 14,934 | |
| Income (loss) from continuing operations | | | (368,045 | ) | | | (11,733 | ) | | | (17,759 | ) | | | (6,006 | ) | | | (8,007 | ) | | | (43,505 | ) | | | 3,552 | | | | 847 | | | | 321 | | | | (1,599 | ) | | | 3,121 | |
| Income (loss) from discontinued operations before gain on disposal and income taxes (1) | | | 25,956 | | | | 43,765 | | | | 55,426 | | | | (21,196 | ) | | | (25,992 | ) | | | 52,003 | | | | 50,643 | | | | 45,874 | | | | (22,352 | ) | | | (21,673 | ) | | | 52,492 | |
| Pre-tax gain on disposal (1) | | | — | | | | — | | | | — | | | | — | | | | — | | | | — | | | | — | | | | — | | | | — | | | | 472,237 | | | | 472,237 | |
| Income tax benefit (expense) (1) | | | (666 | ) | | | (4,386 | ) | | | (6,059 | ) | | | (601 | ) | | | 10,305 | | | | (741 | ) | | | (19,575 | ) | | | (7,296 | ) | | | 190 | | | | (80,922 | ) | | | (107,603 | ) |
| Income (loss) from discontinued operations (1) | | | 25,290 | | | | 39,379 | | | | 49,367 | | | | (21,797 | ) | | | (15,687 | ) | | | 51,262 | | | | 31,068 | | | | 38,578 | | | | (22,162 | ) | | | 369,642 | | | | 417,126 | |
| Net income (loss) | | $ | (342,755 | ) | | $ | 27,646 | | | $ | 31,608 | | | $ | (27,803 | ) | | $ | (23,694 | ) | | $ | 7,757 | | | $ | 34,620 | | | $ | 39,425 | | | $ | (21,841 | ) | | $ | 368,043 | | | $ | 420,247 | |
| Basic net income (loss) per share: | | | | | | | | | | | | | | | | | | | | | | | | | | | | | | | | | | | | | | | | | | | | |
| Continuing operations | | $ | (7.67 | ) | | $ | (0.24 | ) | | $ | (0.37 | ) | | $ | (0.12 | ) | | $ | (0.16 | ) | | $ | (0.90 | ) | | $ | 0.07 | | | $ | 0.02 | | | $ | 0.01 | | | $ | (0.03 | ) | | $ | 0.07 | |
| Discontinued operations (1) | | | 0.53 | | | | 0.81 | | | | 1.02 | | | | (0.45 | ) | | | (0.33 | ) | | | 1.06 | | | | 0.64 | | | | 0.81 | | | | (0.47 | ) | | | 7.69 | | | | 8.69 | |
| Basic net income (loss) per share: | | $ | (7.14 | ) | | $ | 0.57 | | | $ | 0.65 | | | $ | (0.57 | ) | | $ | (0.49 | ) | | $ | 0.16 | | | $ | 0.71 | | | $ | 0.83 | | | $ | (0.46 | ) | | $ | 7.66 | | | $ | 8.76 | |
| Diluted net income (loss) per share: | | | | | | | | | | | | | | | | | | | | | | | | | | | | | | | | | | | | | | | | | | | | |
| Continuing operations | | $ | (7.67 | ) | | $ | (0.24 | ) | | $ | (0.37 | ) | | $ | (0.12 | ) | | $ | (0.16 | ) | | $ | (0.90 | ) | | $ | 0.07 | | | $ | 0.02 | | | $ | 0.01 | | | $ | (0.03 | ) | | $ | 0.06 | |
| Discontinued operations (1) | | | 0.53 | | | | 0.81 | | | | 1.02 | | | | (0.45 | ) | | | (0.33 | ) | | | 1.06 | | | | 0.63 | | | | 0.79 | | | | (0.46 | ) | | | 7.69 | | | | 8.48 | |
| Diluted net income (loss) per share: | | $ | (7.14 | ) | | $ | 0.57 | | | $ | 0.65 | | | $ | (0.57 | ) | | $ | (0.49 | ) | | $ | 0.16 | | | $ | 0.70 | | | $ | 0.81 | | | $ | (0.45 | ) | | $ | 7.66 | | | $ | 8.54 | |
| Weighted average shares outstanding: | | | | | | | | | | | | | | | | | | | | | | | | | | | | | | | | | | | | | | | | | | | | |
| Basic | | | 47,978 | | | | 48,261 | | | | 48,508 | | | | 48,707 | | | | 48,834 | | | | 48,578 | | | | 48,513 | | | | 47,582 | | | | 47,847 | | | | 48,034 | | | | 47,994 | |
| Diluted | | | 47,978 | | | | 48,261 | | | | 48,508 | | | | 48,707 | | | | 48,834 | | | | 48,578 | | | | 49,747 | | | | 48,690 | | | | 49,016 | | | | 48,034 | | | | 49,183 | |
| | | | | | | | | | | | | | | | | | | | | | | | | | | | | | | | | | | | | | | | | | | | | |
| Non-GAAP Financial Results: (2) | | | | | | | | | | | | | | | | | | | | | | | | | | | | | | | | | | | | | | | | | | | | |
| Adjusted EBITDA (2) | | $ | 37,191 | | | $ | 10,846 | | | $ | 13,104 | | | $ | 10,219 | | | $ | 11,952 | | | $ | 46,121 | | | $ | 5,652 | | | $ | 5,153 | | | $ | 16,995 | | | $ | 25,875 | | | $ | 53,675 | |
____________________________
| (1) | On October 31, 2022, we entered into a Stock Purchase Agreement (the “Purchase Agreement”) with TaxAct Holdings, Inc. (f/k/a Avantax Holdings, Inc.), a Delaware corporation and a direct subsidiary of Blucora, Inc., Franklin Cedar Bidco, LLC, a Delaware limited liability company (the “Buyer”), and, solely for purposes of certain provisions thereof, DS Admiral Bidco, LLC, a Delaware limited liability company, pursuant to which we sold our tax software business to Buyer for an aggregate purchase price of $720.0 million in cash, subject to customary purchase price adjustments set forth in the Purchase Agreement (the “TaxAct Sale”). This transaction subsequently closed on December 19, 2022. Our results of operations have been recast to reflect TaxAct as a discontinued operation in accordance with ASC 205, Presentation of Financial Statements. |
| (2) | Refer to the subsequent pages for reconciliations of these non-GAAP financial measures to their nearest comparable GAAP financial measures. |
Avantax Reconciliation of Certain Non-GAAP Financial Measures to the Nearest Comparable GAAP Financial Measures (1) (2)
| (Unaudited, in thousands except per share amounts. Rounding differences may exist.) | | 2020 | | | 2021 | | | 2022 | |
| | | FY 12/31 | | | 1Q | | | 2Q | | | 3Q | | | 4Q | | | FY 12/31 | | | 1Q | | | 2Q | | | 3Q | | | 4Q | | | FY 12/31 | |
| Adjusted EBITDA (1) | | | | | | | | | | | | | | | | | | | | | | | | | | | | | | | | | | | | | | | | | | | | |
| Net income (loss) (2) | | $ | (342,755 | ) | | $ | 27,646 | | | $ | 31,608 | | | $ | (27,803 | ) | | $ | (23,694 | ) | | $ | 7,757 | | | $ | 34,620 | | | $ | 39,425 | | | $ | (21,841 | ) | | $ | 368,043 | | | $ | 420,247 | |
| Less: Income (loss) from discontinued operations, net of income taxes | | | 25,290 | | | | 39,379 | | | | 49,367 | | | | (21,797 | ) | | | (15,687 | ) | | | 51,262 | | | | 31,068 | | | | 38,578 | | | | (22,162 | ) | | | 369,642 | | | | 417,126 | |
| Income (loss) from continuing operations, net of income taxes | | | (368,045 | ) | | | (11,733 | ) | | | (17,759 | ) | | | (6,006 | ) | | | (8,007 | ) | | | (43,505 | ) | | | 3,552 | | | | 847 | | | | 321 | | | | (1,599 | ) | | | 3,121 | |
| Stock-based compensation | | | 8,059 | | | | 4,641 | | | | 4,639 | | | | 4,253 | | | | 4,586 | | | | 18,119 | | | | 5,380 | | | | 4,438 | | | | 4,964 | | | | 6,371 | | | | 21,153 | |
| Depreciation and amortization of acquired intangible assets | | | 36,568 | | | | 9,224 | | | | 9,591 | | | | 9,373 | | | | 9,119 | | | | 37,307 | | | | 9,074 | | | | 9,104 | | | | 9,685 | | | | 9,869 | | | | 37,732 | |
| Interest expense and other, net | | | 4,670 | | | | 67 | | | | 64 | | | | 135 | | | | 156 | | | | 422 | | | | 53 | | | | 212 | | | | 158 | | | | 52 | | | | 475 | |
| Acquisition and integration—Excluding change in the fair value of HKFS Contingent Consideration | | | 22,785 | | | | 1,803 | | | | 6,669 | | | | 541 | | | | 1,385 | | | | 10,398 | | | | (34 | ) | | | 228 | | | | 416 | | | | 524 | | | | 1,134 | |
| Acquisition and integration—Change in the fair value of HKFS Contingent Consideration | | | 8,300 | | | | 6,300 | | | | 11,500 | | | | 1,700 | | | | 2,900 | | | | 22,400 | | | | 1,700 | | | | (7,020 | ) | | | — | | | | — | | | | (5,320 | ) |
| Executive transition costs | | | 10,701 | | | | — | | | | — | | | | — | | | | — | | | | — | | | | — | | | | — | | | | — | | | | — | | | | — | |
| Headquarters relocation costs | | | 1,863 | | | | — | | | | — | | | | — | | | | — | | | | — | | | | — | | | | — | | | | — | | | | — | | | | — | |
| Contested proxy, transaction and other legal and consulting costs | | | — | | | | 3,230 | | | | 2,465 | | | | 1,598 | | | | 3,646 | | | | 10,939 | | | | 2,920 | | | | 1,195 | | | | (250 | ) | | | 1,197 | | | | 5,062 | |
| TaxAct divestiture costs (4) | | | — | | | | — | | | | — | | | | — | | | | — | | | | — | | | | — | | | | 202 | | | | 3,237 | | | | 1,813 | | | | 5,252 | |
| Impairment of goodwill | | | 270,625 | | | | — | | | | — | | | | — | | | | — | | | | — | | | | — | | | | — | | | | — | | | | — | | | | — | |
| Income tax (benefit) expense | | | 41,665 | | | | (2,686 | ) | | | (4,065 | ) | | | (1,375 | ) | | | (1,833 | ) | | | (9,959 | ) | | | (16,993 | ) | | | (4,053 | ) | | | (1,536 | ) | | | 7,648 | | | | (14,934 | ) |
| Adjusted EBITDA (1) | | $ | 37,191 | | | $ | 10,846 | | | $ | 13,104 | | | $ | 10,219 | | | $ | 11,952 | | | $ | 46,121 | | | $ | 5,652 | | | $ | 5,153 | | | $ | 16,995 | | | $ | 25,875 | | | $ | 53,675 | |
____________________________
| (1) | We define Adjusted EBITDA as net income (loss), determined in accordance with GAAP, excluding (if applicable) the effects of discontinued operations, stock-based compensation, depreciation and amortization of acquired intangible assets, interest expense and other, net, acquisition and integration costs, executive transition costs, headquarters relocation costs, contested proxy, transaction and other legal and consulting costs, TaxAct divestiture costs, impairment of goodwill, and income tax (benefit) expense. Interest expense and other, net primarily consists of interest expense, net, and non-capitalized debt issuance expenses. Acquisition and integration costs primarily relate to the acquisitions of Avantax Planning Partners and 1st Global. Impairment of goodwill relates to the impairment in the first quarter of 2020. Executive transition costs relate to the departure of certain Company executives in the first quarter of 2020. Headquarters relocation costs relate to the process of moving from our Dallas, TX and Irving, TX offices to our new headquarters. |
We believe that Adjusted EBITDA provides meaningful supplemental information regarding our performance. We use this non-GAAP financial measure for internal management and compensation purposes, when publicly providing guidance on possible future results, and as a means to evaluate period-to-period comparisons. We believe that Adjusted EBITDA is a common measure used by investors and analysts to evaluate our performance, that it provides a more complete understanding of the results of operations and trends affecting our business when viewed together with GAAP results, and that management and investors benefit from referring to this non-GAAP financial measure. Items excluded from Adjusted EBITDA are significant and necessary components to the operations of our business and, therefore, Adjusted EBITDA should be considered as a supplement to, and not as a substitute for or superior to, GAAP net income (loss). Other companies may calculate Adjusted EBITDA differently and, therefore, our Adjusted EBITDA may not be comparable to similarly titled measures of other companies.
| (2) | See the Condensed Consolidated Financial Results on page 2. |
| (3) | These costs do not include $17.6 million of transaction costs that were determined to be directly attributable to the TaxAct Sale, and are included within income from discontinued operations, net of income taxes, as a reduction to the gain on disposal. TaxAct divestiture costs included in the table above primarily relate to incremental professional services, consulting, and insurance costs that were incurred in connection with the divestiture. |
| | | 2022 | |
| (Unaudited, in thousands. Rounding differences may exist.) | | 1Q | | | 2Q | | | 3Q | | | 4Q | | | FY 12/31 | |
| Operating Free Cash Flow (4) | | | | | | | | | | | | | | | | | | | | |
| Net cash provided by (used in) operating activities from continuing operations | | $ | 7,053 | | | $ | 7,855 | | | $ | (4,999 | ) | | $ | 107,165 | | | $ | 117,074 | |
| Purchases of property, equipment, and software | | | (3,846 | ) | | | (5,173 | ) | | | (3,582 | ) | | | (2,291 | ) | | | (14,892 | ) |
| Operating Free Cash Flow (4) | | $ | 3,207 | | | $ | 2,682 | | | $ | (8,581 | ) | | $ | 104,874 | | | $ | 102,182 | |
| ____________________________ | |
| (4) | We define Operating Free Cash Flow, a non-GAAP financial measure, as net cash provided by (used in) operating activities from continuing operations less purchases of property, equipment, and software. We believe Operating Free Cash Flow is an important liquidity measure that reflects the cash generated by our businesses, after the purchases of property, equipment, and software, that can then be used for, among other things, strategic acquisitions and investments in the businesses, stock repurchases, and funding ongoing operations. |
Operating Metrics
| (In thousands, except percentages. Rounding differences may exist.) | | 2020 | | | 2021 | | | 2022 | | | | | | | |
| | | FY 12/31 | | | 1Q | | | 2Q | | | 3Q | | | 4Q | | | FY 12/31 | | | 1Q | | | 2Q | | | 3Q | | | 4Q | | | FY 12/31 | |
| Revenue | | $ | 546,189 | | | $ | 154,491 | | | $ | 162,395 | | | $ | 169,135 | | | $ | 172,192 | | | $ | 658,213 | | | $ | 166,403 | | | $ | 162,669 | | | $ | 165,032 | | | $ | 172,392 | | | $ | 666,496 | |
| Less: Financial professional commission payout | | | (379,543 | ) | | | (106,855 | ) | | | (111,708 | ) | | | (118,231 | ) | | | (118,560 | ) | | | (455,354 | ) | | | (116,704 | ) | | | (110,958 | ) | | | (102,760 | ) | | | (99,118 | ) | | | (429,540 | ) |
| Revenue Not Remitted to Financial Professionals (1) | | $ | 166,646 | | | $ | 47,636 | | | $ | 50,687 | | | $ | 50,904 | | | $ | 53,632 | | | $ | 202,859 | | | $ | 49,699 | | | $ | 51,711 | | | $ | 62,272 | | | $ | 73,274 | | | $ | 236,956 | |
| | | | | | | | | | | | | | | | | | | | | | | | | | | | | | | | | | | | | | | | | | | | | |
| Payout Rate (2) | | | 75.9 | % | | | 74.4 | % | | | 75.4 | % | | | 75.5 | % | | | 75.0 | % | | | 75.1 | % | | | 75.4 | % | | | 75.5 | % | | | 75.1 | % | | | 74.2 | % | | | 75.1 | % |
| (In thousands, except percentages. Rounding differences may exist.) | | 2020 | | | 2021 | | | 2022 | |
| | | Sources of Revenue | | Primary Drivers | | FY 12/31 | | | 1Q | | | 2Q | | | 3Q | | | 4Q | | | FY 12/31 | | | 1Q | | | 2Q | | | 3Q | | | 4Q | | | FY 12/31 | |
| Financial professional-driven | | Advisory | | - Advisory asset levels | | $ | 314,751 | | | $ | 91,119 | | | $ | 96,508 | | | $ | 103,540 | | | $ | 104,633 | | | $ | 395,800 | | | $ | 107,169 | | | $ | 104,155 | | | $ | 95,070 | | | $ | 92,445 | | | $ | 398,839 | |
| | Commission | | - Transactions
- Asset levels
- Product mix | | | 185,201 | | | | 52,534 | | | | 51,702 | | | | 52,961 | | | | 53,480 | | | | 210,677 | | | | 47,655 | | | | 42,835 | | | | 41,788 | | | | 41,153 | | | | 173,431 | |
| Other revenue | | Asset-based | | - Cash balances
- Interest rates
- Number of accounts
- Client asset levels | | | 23,688 | | | | 5,329 | | | | 5,526 | | | | 5,659 | | | | 5,587 | | | | 22,101 | | | | 5,663 | | | | 6,964 | | | | 21,147 | | | | 31,269 | | | | 65,043 | |
| | Transaction and fee | | - Account activity
- Number of clients
- Number of financial professionals
- Number of accounts | | | 22,549 | | | | 5,509 | | | | 8,659 | | | | 6,975 | | | | 8,492 | | | | 29,635 | | | | 5,916 | | | | 8,715 | | | | 7,027 | | | | 7,525 | | | | 29,183 | |
| | | Total revenue | | | | $ | 546,189 | | | $ | 154,491 | | | $ | 162,395 | | | $ | 169,135 | | | $ | 172,192 | | | $ | 658,213 | | | $ | 166,403 | | | $ | 162,669 | | | $ | 165,032 | | | $ | 172,392 | | | $ | 666,496 | |
| | | Total recurring revenue (3) | | | | $ | 464,944 | | | $ | 130,755 | | | $ | 138,900 | | | $ | 145,311 | | | $ | 144,728 | | | $ | 559,694 | | | $ | 143,737 | | | $ | 141,935 | | | $ | 144,512 | | | $ | 150,457 | | | $ | 580,641 | |
| | | Recurring revenue rate (3) | | | | | 85.1 | % | | | 84.6 | % | | | 85.5 | % | | | 85.9 | % | | | 84.1 | % | | | 85.0 | % | | | 86.4 | % | | | 87.3 | % | | | 87.6 | % | | | 87.3 | % | | | 87.1 | % |
____________________________
| (1) | We define Revenue Not Remitted to Financial Professionals, a non-GAAP financial measure, as GAAP revenue less financial professional commission payout. Financial professional commission payout represents commissions owed to financial professionals based on their advisory and commission revenues generated during the respective period. Financial professional commission payout does not include charges associated with financial professional stock-based compensation or the amortization of financial professional forgivable loans. We believe that the presentation of this non-GAAP financial measure provides useful information to investors because it reflects the portion of our segment revenue that is not remitted to financial professionals in the form of cash. We and investors utilize this non-GAAP financial measure when evaluating our performance relative to total client assets. |
| (2) | We define Payout Rate as financial professional commission payout as a percentage of financial professional-driven revenue from the tables above. |
| (3) | Recurring revenue consists of advisory fees, trailing commissions, fees from cash sweep programs, and certain transaction and fee revenue. |
Operating Metrics (continued)
| (In thousands, except percentages. Rounding differences may exist.) | | 2020 | | | 2021 | | | 2022 | |
| | | FY 12/31 | | | 1Q | | | 2Q | | | 3Q | | | 4Q | | | FY 12/31 | | | 1Q | | | 2Q | | | 3Q | | | 4Q | | | FY 12/31 | |
| Total client assets (1) | | $ | 82,961,244 | | | $ | 84,776,191 | | | $ | 87,814,790 | | | $ | 86,647,743 | | | $ | 89,086,032 | | | $ | 89,086,032 | | | $ | 86,144,055 | | | $ | 76,522,066 | | | $ | 72,592,882 | | | $ | 76,939,096 | | | $ | 76,939,096 | |
| Brokerage assets (1) | | $ | 47,357,687 | | | $ | 48,001,320 | | | $ | 48,373,805 | | | $ | 46,850,354 | | | $ | 46,906,981 | | | $ | 46,906,981 | | | $ | 45,222,763 | | | $ | 39,776,018 | | | $ | 37,150,327 | | | $ | 38,656,763 | | | $ | 38,656,763 | |
| Advisory assets (1) | | $ | 35,603,557 | | | $ | 36,774,871 | | | $ | 39,440,985 | | | $ | 39,797,389 | | | $ | 42,179,051 | | | $ | 42,179,051 | | | $ | 40,921,292 | | | $ | 36,746,048 | | | $ | 35,442,555 | | | $ | 38,282,333 | | | $ | 38,282,333 | |
| % of total client assets (1) | | | 42.9 | % | | | 43.4 | % | | | 44.9 | % | | | 45.9 | % | | | 47.3 | % | | | 47.3 | % | | | 47.5 | % | | | 48.0 | % | | | 48.8 | % | | | 49.8 | % | | | 49.8 | % |
| Number of financial professionals (in ones) | | | 3,770 | | | | 3,718 | | | | 3,606 | | | | 3,529 | | | | 3,416 | | | | 3,416 | | | | 3,409 | | | | 3,349 | | | | 3,347 | | | | 3,109 | | | | 3,109 | |
| Advisory and commission revenue per financial professional (2) | | $ | 132.6 | | | $ | 38.6 | | | $ | 41.1 | | | $ | 44.3 | | | $ | 46.3 | | | $ | 177.5 | | | $ | 45.4 | | | $ | 43.9 | | | $ | 40.9 | | | $ | 43.0 | | | $ | 184.1 | |
| | | | | | | | | | | | | | | | | | | | | | | | | | | | | | | | | | | | | | | | | | | | | |
| Quarterly Production Retention Rate: (3) | | | | | | | | | | | | | | | | | | | | | | | | | | | | | | | | | | | | | | | | | | | | |
| TTM Financial professional-driven revenue (4) | | $ | 499,952 | | | $ | 514,268 | | | $ | 556,339 | | | $ | 585,307 | | | $ | 606,477 | | | $ | 606,477 | | | $ | 617,648 | | | $ | 616,428 | | | $ | 596,785 | | | $ | 572,270 | | | $ | 572,270 | |
| TTM Financial professional-driven revenue related to independent financial professionals who departed in the quarter (4) | | | 19,101 | | | | 8,127 | | | | 9,881 | | | | 12,157 | | | | 11,079 | | | | 11,079 | | | | 2,201 | | | | 3,836 | | | | 8,356 | | | | 4,122 | | | | 4,122 | |
| TTM Financial professional-driven revenue, less that related to independent financial professionals who departed in the quarter (4) | | $ | 480,851 | | | $ | 506,141 | | | $ | 546,458 | | | $ | 573,150 | | | $ | 595,398 | | | $ | 595,398 | | | $ | 615,447 | | | $ | 612,592 | | | $ | 588,429 | | | $ | 568,148 | | | $ | 568,148 | |
| Quarterly Production Retention Rate (3) | | | 96.2 | % | | | 98.4 | % | | | 98.2 | % | | | 97.9 | % | | | 98.2 | % | | | 98.2 | % | | | 99.6 | % | | | 99.4 | % | | | 98.6 | % | | | 99.3 | % | | | 99.3 | % |
| ____________________________ | |
| (1) | In connection with our ongoing integration of acquisitions, as of December 31, 2021, we refined the methodology by which we calculate client assets to align the methodologies within our Wealth Management segment for calculating such metrics. Specifically, such changes to the methodology include alignment to one third party data aggregator for assets not placed in custody with our clearing firm and to one consistent set of logic for all assets and transaction types. We have not recast client assets for prior periods to conform to our current presentation as we believe the changes to the calculation to be immaterial. |
| (2) | Calculations are based on the ending number of financial professionals and advisory and commission revenue for each respective period. |
| (3) | Quarterly Production Retention Rate is a non-GAAP financial measure. We believe Quarterly Production Retention Rate is an important measure of our quarterly retention of financial professional-driven revenue (which consists of advisory revenue and commission revenue). We use Quarterly Production Retention Rate to measure the impact of financial professional departures on our business. Quarterly Production Retention Rate is calculated by dividing (x) the difference of (i) total financial professional-driven revenue for the trailing twelve-month period then ended minus (ii) financial professional-driven revenue for the trailing twelve-month period then ended related to independent financial professionals that departed in the quarter by (y) total financial professional-driven revenue for the trailing twelve-month period then ended. As Quarterly Production Retention Rate is a measure of retention during a quarter, it also includes quarterly production from independent financial professionals who departed in prior quarters in the trailing twelve-month period, and therefore does not show production retention rate over longer periods of time. |
| (4) | For the trailing twelve-month period then ended. |

Avantax, Inc. (NASDAQ: AVTA) Q4 2022 Earnings Presentation February 15, 2023

Forward - Looking Statements This presentation contains forward - looking statements within the meaning of Section 27 A of the Securities Act of 1933 , as amended, and Section 21 E of the Securities Exchange Act of 1934 , as amended, including without limitation, statements regarding the outlook of Avantax, Inc . ( “Avantax” or the “Company” ), the anticipated business strategy and corporate focus of the Company following consummation of the sale of our tax software business (the “TaxAct Sale” ) and the intended use of proceeds from the TaxAct Sale . Forward - looking statements provide current expectations of future events based on certain assumptions and include any statement that does not directly relate to any historical or current fact . Forward - looking statements can also be identified by words such as “anticipates,” “believes,” “plans,” “expects,” “future,” “intends,” “may,” “will,” “would,” “could,” “should,” “estimates,” “predicts,” “potential,” “continues,” “target,” “outlook,” and similar terms and expressions, but the absence of these words does not mean that the statement is not forward - looking . Actual results may differ significantly from management’s expectations due to various risks and uncertainties including, but not limited to : our ability to effectively compete within our industry ; our ability to generate strong performance for our clients and the impact of the financial markets on our clients’ portfolios ; our expectations concerning the revenues we generate from fees associated with the financial products that we distribute ; our ability to attract and retain financial professionals, employees, and clients, as well as our ability to provide strong client service ; the impact of significant interest rate changes ; our ability to maintain our relationships with third - party partners, providers, suppliers, vendors, distributors, contractors, financial institutions, industry associations, and licensing partners, and our expectations regarding and reliance on the products, tools, platforms, systems, and services provided by these third parties ; political and economic conditions and events that directly or indirectly impact the wealth management industry ; risks related to goodwill and acquired intangible asset impairment ; our ability to respond to rapid technological changes, including our ability to successfully release new products and services or improve upon existing products and services ; our future capital requirements and the availability of financing, if necessary ; the impact of new or changing legislation and regulations (or interpretations thereof) on our business, including our ability to successfully address and comply with such legislation and regulations (or interpretations thereof) and increased costs, reductions of revenue, and potential fines, penalties, or disgorgement to which we may be subject as a result thereof ; risks, burdens, and costs, including fines, penalties, or disgorgement, associated with our business being subjected to regulatory inquiries, investigations, or initiatives, including those of the Financial Industry Regulatory Authority, Inc . and the Securities and Exchange Commission (the “SEC” ) ; any compromise of confidentiality, availability, or integrity of information, including cyberattacks ; risks associated with legal proceedings, including litigation and regulatory proceedings ; our ability to close, finance, and realize all of the anticipated benefits of acquisitions, as well as our ability to integrate the operations of recently acquired businesses, and the potential impact of such acquisitions on our existing indebtedness and leverage ; our ability to retain employees and acquired client assets following acquisitions ; our ability to manage leadership and employee transitions, including costs and time burdens on management and our board of directors related thereto ; our ability to develop, establish, and maintain strong brands ; our ability to comply with laws and regulations regarding privacy and protection of user data ; our assessments and estimates that determine our effective tax rate ; our ability to protect our intellectual property and the impact of any claim that we infringed on the intellectual property rights of others ; any downgrade of the Company’s credit ratings ; our failure to realize the expected benefits of the sale of our tax software business ; disruptions to our business and operations resulting from the transition services we are providing in connection with the TaxAct Sale ; our inability to return capital to stockholders in the amount anticipated ; and the effects on our business of actions of activist stockholders . A more detailed description of these and certain other factors that could affect actual results is included in the Company’s most recent Annual Report on Form 10 - K and most recent Quarterly Report on Form 10 - Q filed with the SEC . Readers are cautioned not to place undue reliance on these forward - looking statements, which speak only as of the date hereof and reflect our good faith beliefs, assumptions, and expectations but are not guarantees of future performance or events . The Company undertakes no obligation to update any forward - looking statements to reflect events or circumstances after the date hereof, except as may be required by law . Non - GAAP Financial Information This presentation contains certain non - GAAP financial measures relating to our performance . You can find the reconciliation of these measures to the most directly comparable GAAP financial measure in the Appendix at the end of this presentation . The non - GAAP financial measures disclosed by the Company should not be considered a substitute for, or superior to, the financial measures prepared in accordance with GAAP . Forward - Looking Statements and Non - GAAP Financial Measures 2
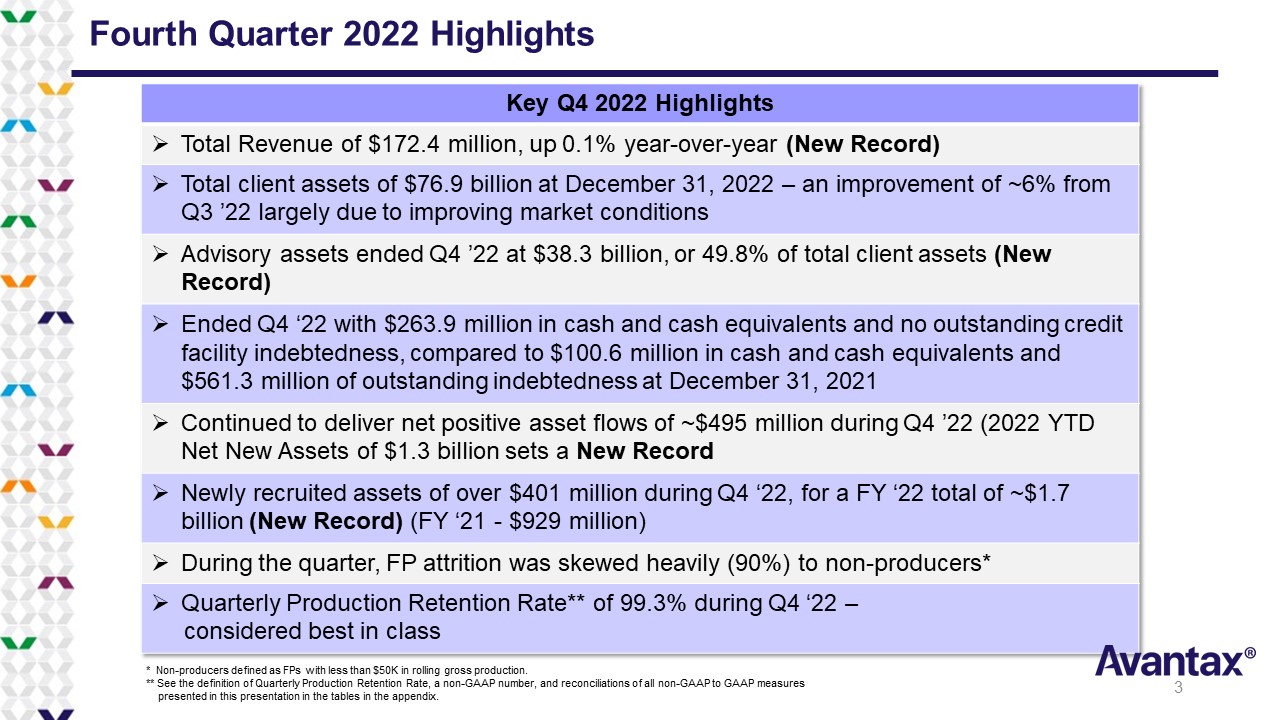
Key Q4 2022 Highlights » Total Revenue of $172.4 million, up 0.1% year - over - year (New Record) » Total client assets of $76.9 billion at December 31, 2022 – an improvement of ~6% from Q3 ’22 largely due to improving market conditions » Advisory assets ended Q4 ’22 at $38.3 billion, or 49.8% of total client assets (New Record) » Ended Q4 ‘22 with $263.9 million in cash and cash equivalents and no outstanding credit facility indebtedness, compared to $100.6 million in cash and cash equivalents and $561.3 million of outstanding indebtedness at December 31, 2021 » Continued to deliver net positive asset flows of ~$495 million during Q 4 ’22 (2022 YTD Net New Assets of $1.3 billion sets a New Record » Newly recruited assets of over $401 million during Q4 ‘22, for a FY ‘22 total of ~$1.7 billion (New Record) (FY ‘21 - $929 million) » During the quarter, FP attrition was skewed heavily (90%) to non - producers* » Quarterly Production Retention Rate** of 99.3% during Q4 ‘22 – considered best in class Fourth Quarter 2022 Highlights * Non - producers defined as FPs with less than $50K in rolling gross production. ** S ee the definition of Quarterly Production Retention Rate, a non - GAAP number, and reconciliations of all non - GAAP to GAAP measure s presented in this presentation in the tables in the appendix. 3
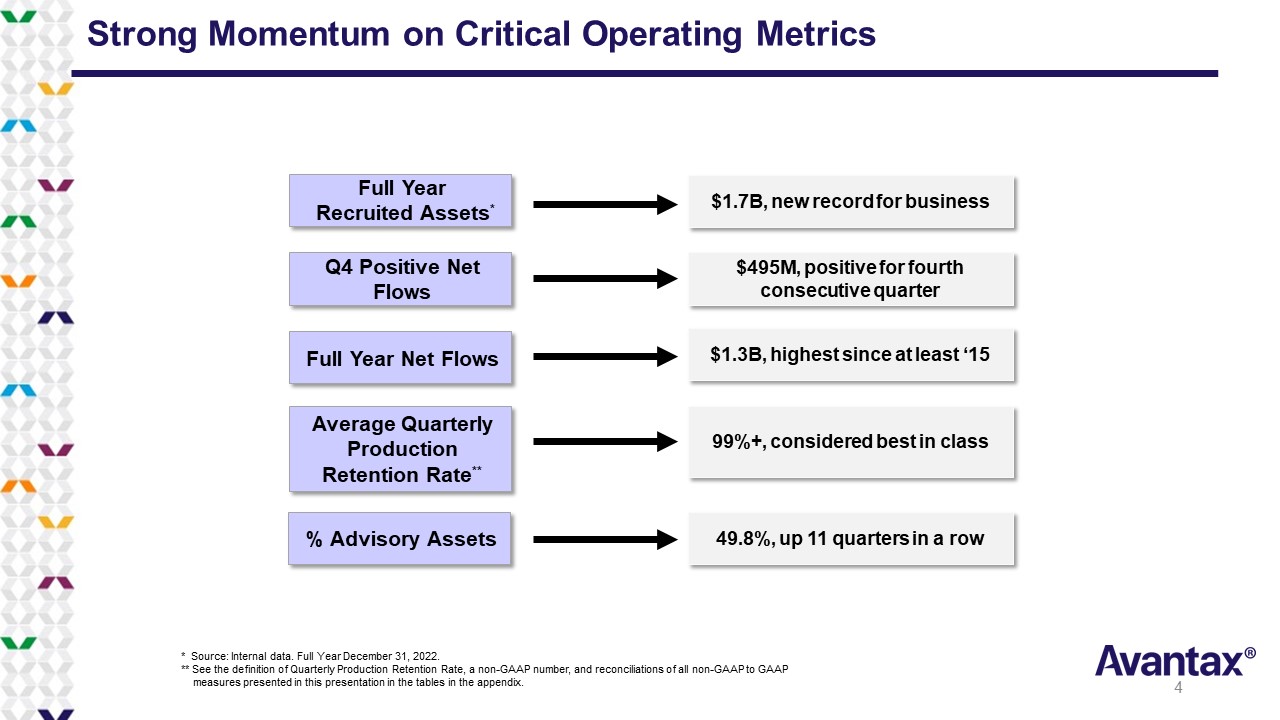
Strong Momentum on Critical Operating Metrics Full Year Recruited Assets * $1.7B, new record for business Q4 Positive Net Flows Full Year Net Flows Average Quarterly Production Retention Rate ** % Advisory Assets $495M, positive for fourth consecutive quarter $1.3B, highest since at least ‘15 99%+, considered best in class 49.8%, up 11 quarters in a row * Source: Internal data. Full Year December 31, 2022. ** See the definition of Quarterly Production Retention Rate, a non - GAAP number, and reconciliations of all non - GAAP to GAAP measures presented in this presentation in the tables in the appendix. 4
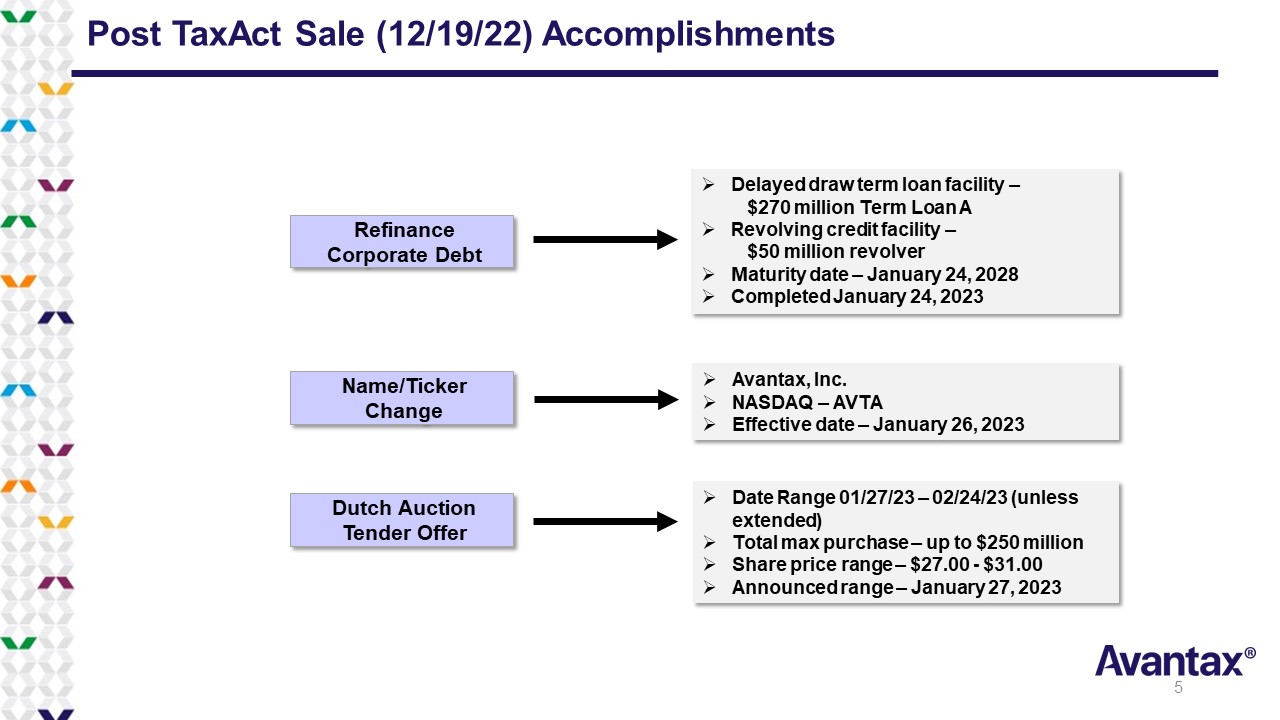
Refinance Corporate Debt Dutch Auction Tender Offer Name/Ticker Change » Delayed draw term loan facility – $270 million Term Loan A » Revolving credit facility – $50 million revolver » Maturity date – January 24, 2028 » Completed January 24, 2023 » Date Range 01/27/23 – 02/24/23 (unless extended) » Total max purchase – up to $250 million » Share price range – $27.00 - $31.00 » Announced range – January 27, 2023 Post TaxAct Sale (12/19/22) Accomplishments » Avantax, Inc. » NASDAQ – AVTA » Effective date – January 26, 2023 5
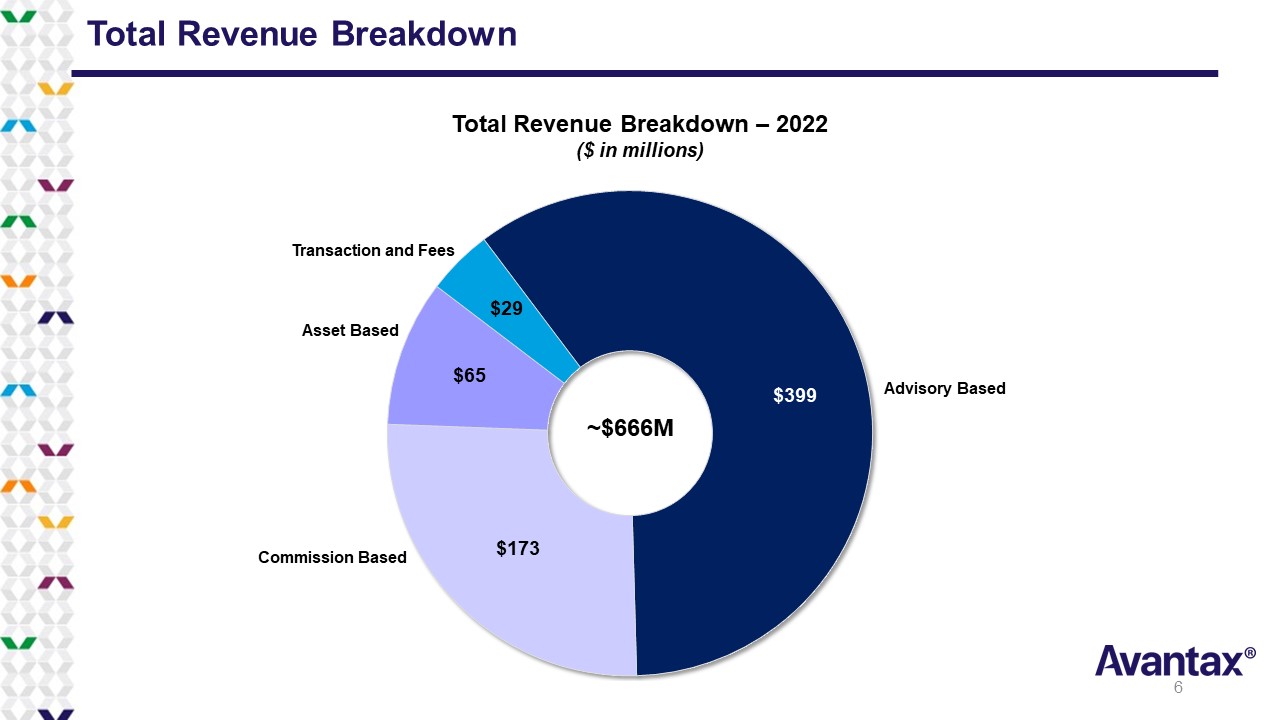
Total Revenue Breakdown $399 $173 $65 $29 Total Revenue Breakdown – 2022 ($ in millions) Asset Based Transaction and Fees Commission Based Advisory Based ~$666M 6
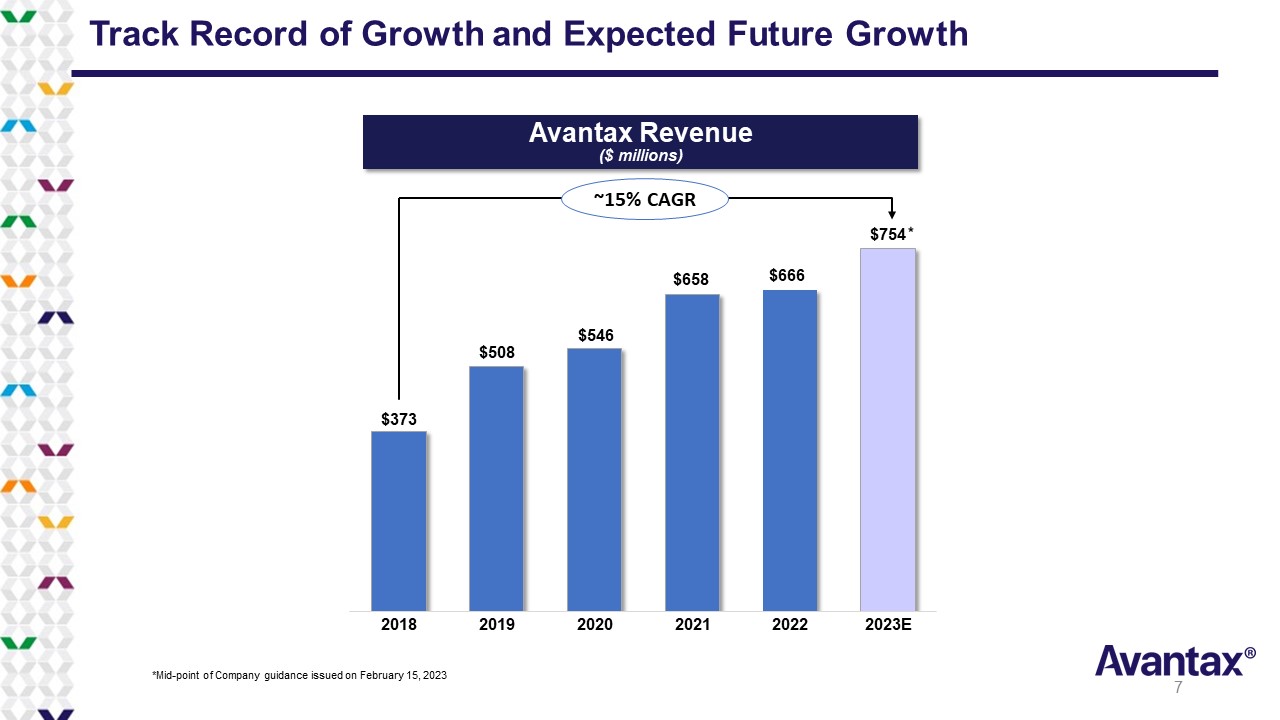
Track Record of Growth and Expected Future Growth Avantax Revenue ($ millions) $373 $508 $546 $658 $666 $754 2018 2019 2020 2021 2022 2023E (1) ~15% CAGR *Mid - point of Company guidance issued on February 15, 2023 7

Financial Professional Retention RETENTION OF HIGH - PRODUCING FINANCIAL PROFESSIONALS ATTRITION OF FPs BY REVENUE PRODUCTION – Q4 2022 HIGH PORTION OF REVENUES ARE RETAINED * See the definition of Quarterly Production Retention Rate, a non - GAAP number, and reconciliations of all non - GAAP to GAAP measures presented in this presentation in the tables in the appendix. 90% 5% 5% <$50K $50K-$100K >$100K 96.2% 98.4% 98.2% 97.9% 98.2% 99.6% 99.4% 98.6% 99.3% 4Q20 1Q21 2Q21 3Q21 4Q21 1Q22 2Q22 3Q22 4Q22 PRODUCTION RETENTION RATE QUARTERLY PRODUCTION RETENTION RATE* 8
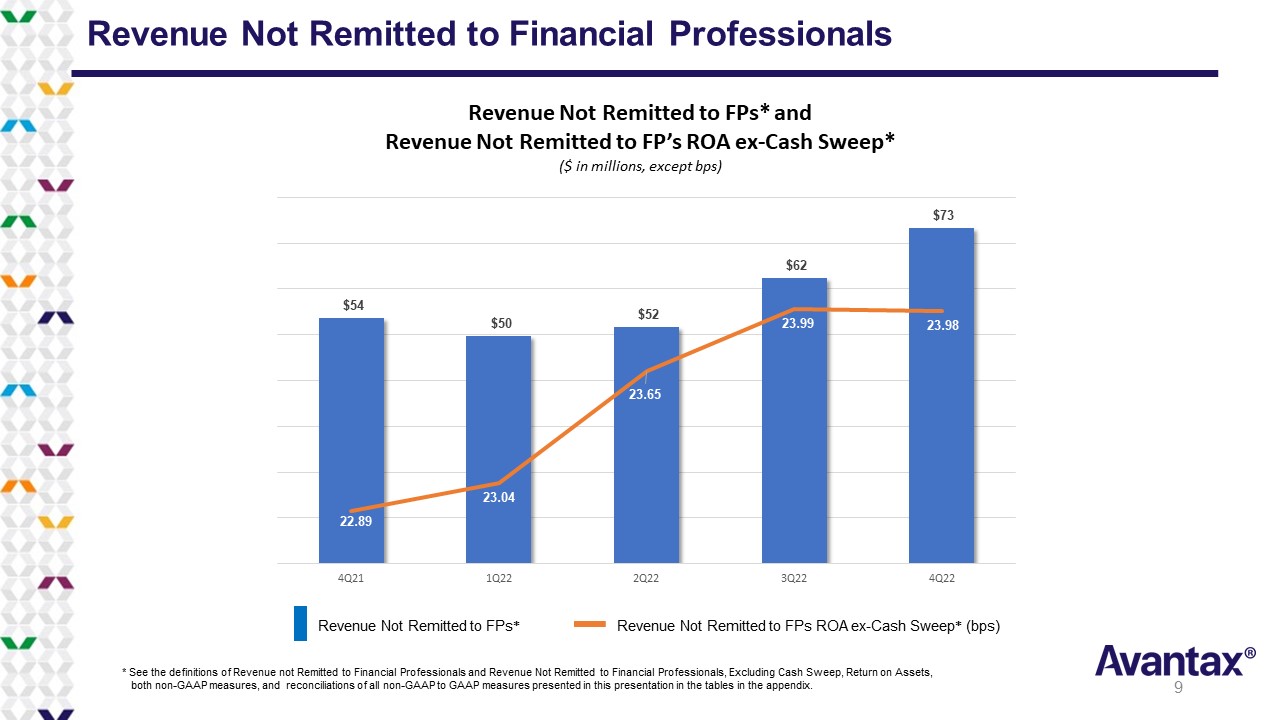
$54 $50 $52 $62 $73 22.89 23.04 23.65 23.99 23.98 22.6 22.8 23 23.2 23.4 23.6 23.8 24 24.2 24.4 24.6 $- $10 $20 $30 $40 $50 $60 $70 $80 4Q21 1Q22 2Q22 3Q22 4Q22 Revenue Not Remitted to Financial Professionals Revenue Not Remitted to FPs* and Revenue Not Remitted to FP’s ROA ex - Cash Sweep* ($ in millions, except bps) * See the definitions of Revenue not Remitted to Financial Professionals and Revenue Not Remitted to Financial Professionals, Ex cluding Cash Sweep, Return on Assets, both non - GAAP measures, and reconciliations of all non - GAAP to GAAP measures presented in this presentation in the tables in the appendix. Revenue Not Remitted to FPs * Revenue Not Remitted to FPs ROA ex - Cash Sweep * (bps) 9
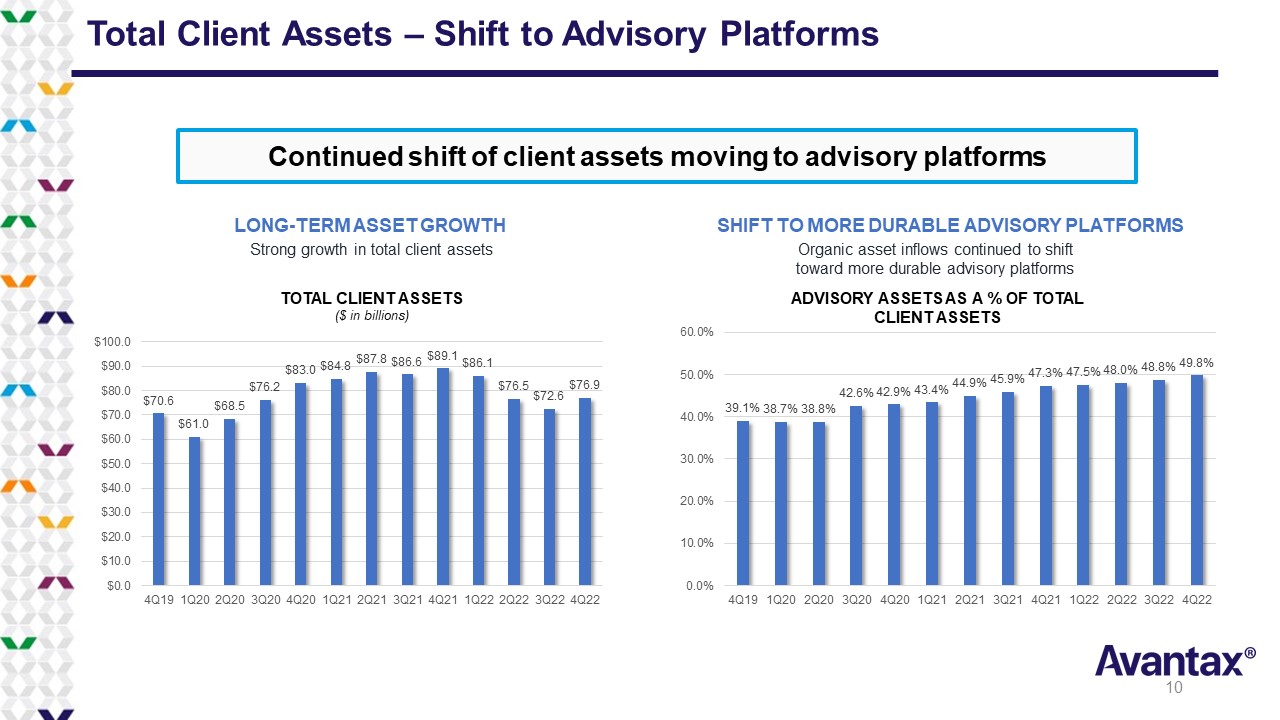
Total Client Assets – Shift to Advisory Platforms Organic asset inflows continued to shift toward more durable advisory platforms LONG - TERM ASSET GROWTH SHIFT TO MORE DURABLE ADVISORY PLATFORMS Strong growth in total client assets TOTAL CLIENT ASSETS ($ in billions) ADVISORY ASSETS AS A % OF TOTAL CLIENT ASSETS Continued shift of client assets moving to advisory platforms $70.6 $61.0 $68.5 $76.2 $83.0 $84.8 $87.8 $86.6 $89.1 $86.1 $76.5 $72.6 $76.9 $0.0 $10.0 $20.0 $30.0 $40.0 $50.0 $60.0 $70.0 $80.0 $90.0 $100.0 4Q19 1Q20 2Q20 3Q20 4Q20 1Q21 2Q21 3Q21 4Q21 1Q22 2Q22 3Q22 4Q22 39.1% 38.7% 38.8% 42.6% 42.9% 43.4% 44.9% 45.9% 47.3% 47.5% 48.0% 48.8% 49.8% 0.0% 10.0% 20.0% 30.0% 40.0% 50.0% 60.0% 4Q19 1Q20 2Q20 3Q20 4Q20 1Q21 2Q21 3Q21 4Q21 1Q22 2Q22 3Q22 4Q22 10

Newly Recruited Assets AUA in Millions New FP Count Newly Recruited Assets New Financial Professionals $44 $116 $51 $88 $108 $150 $297 $193 $289 $529 $514 $214 $401 62 65 28 50 67 58 31 38 49 81 37 74 66 0 10 20 30 40 50 60 70 80 90 $0 $100 $200 $300 $400 $500 $600 4Q19 1Q20 2Q20 3Q20 4Q20 1Q21 2Q21 3Q21 4Q21 1Q22 2Q22 3Q22 4Q22 11

Successful Shift Toward Established FPs to Drive Asset Growth * Inflows of client assets from independent FPs that have affiliated with Avantax. A purposeful shift toward more productive FPs $323 $363 $929 $1,658 $0 $200 $400 $600 $800 $1,000 $1,200 $1,400 $1,600 $1,800 2019 2020 2021 2022 Inflows* Inflows AUA New FP Count Continued increase in recruited assets, aligned to recruiting more established FPs 186 210 176 258 0 50 100 150 200 250 300 2019 2020 2021 2022 New Financial Professionals New FPs ($ in millions) 12
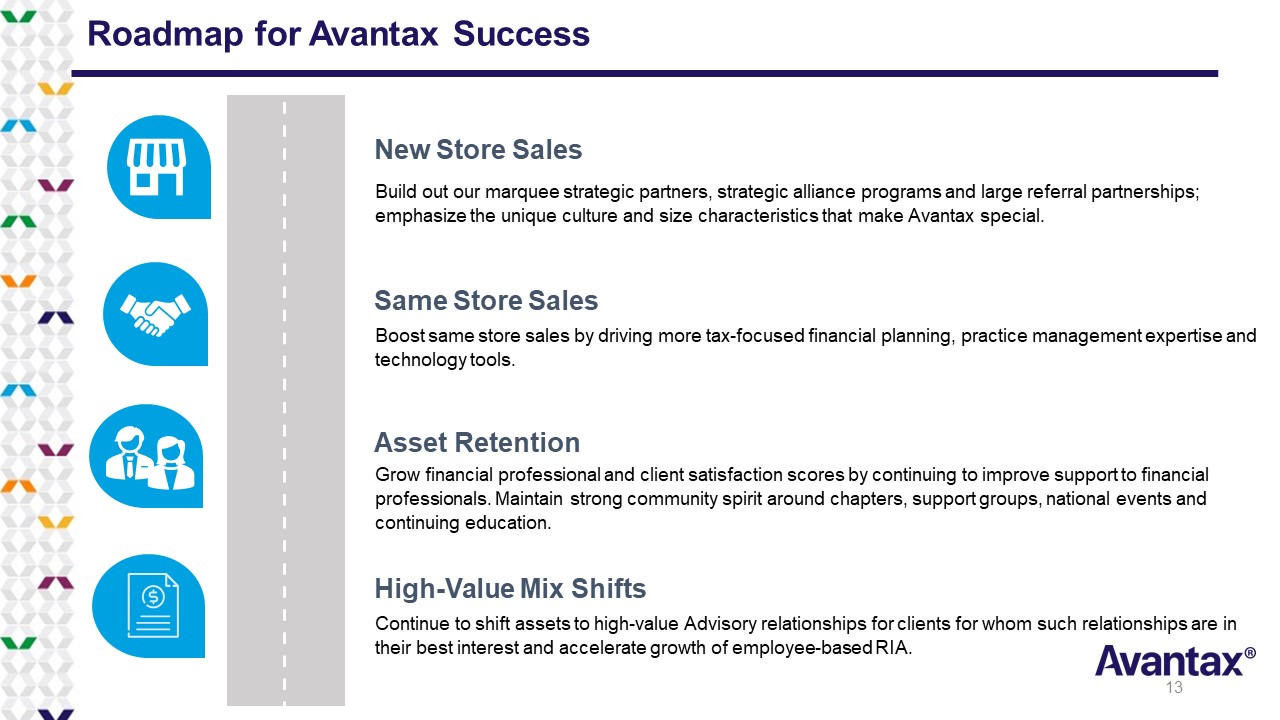
Roadmap for Avantax Success Build out our marquee strategic partners, strategic alliance programs and large referral partnerships; emphasize the unique culture and size characteristics that make Avantax special. New Store Sales Boost same store sales by driving more tax - focused financial planning, practice management expertise and technology tools. Same Store Sales Grow financial professional and client satisfaction scores by continuing to improve support to financial professionals. Maintain strong community spirit around chapters, support groups, national events and continuing education. Asset Retention Continue to shift assets to high - value Advisory relationships for clients for whom such relationships are in their best interest and accelerate growth of employee - based RIA. High - Value Mix Shifts 13
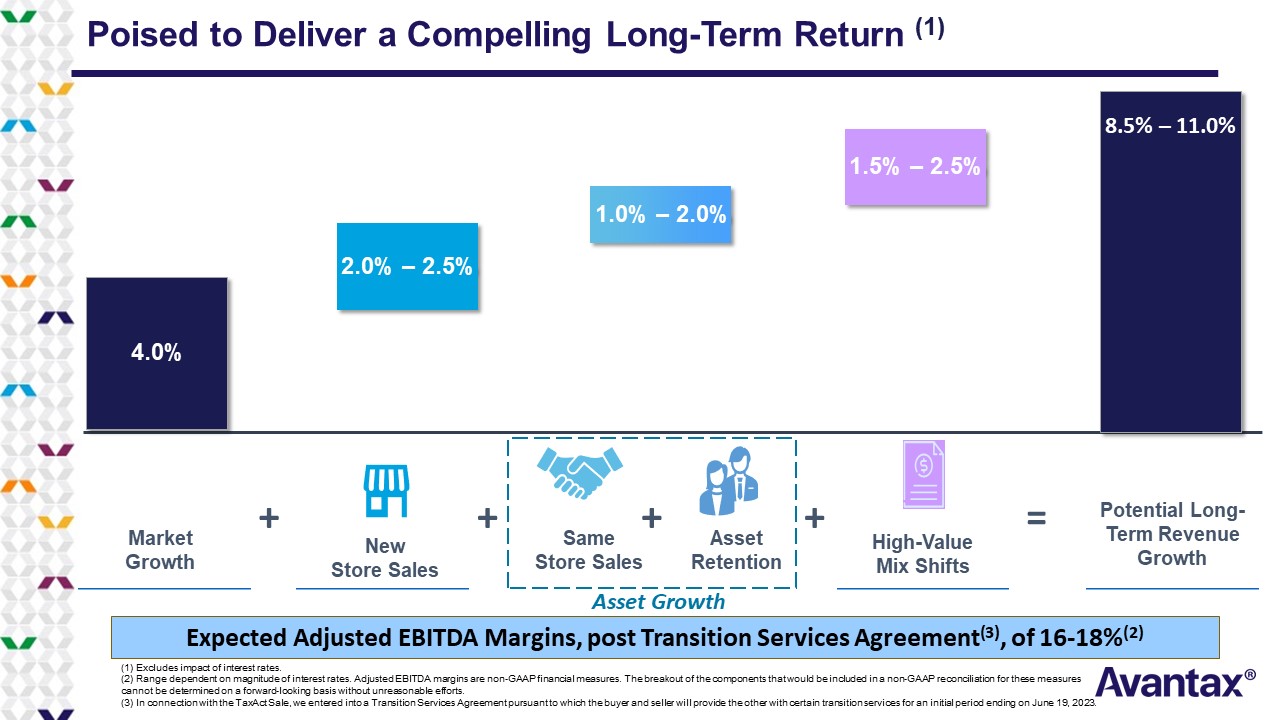
Poised to Deliver a Compelling Long - Term Return (1) Expected Adjusted EBITDA Margins, post Transition Services Agreement (3) , of 16 - 18% (2) (1) Excludes impact of interest rates. (2) Range dependent on magnitude of interest rates. Adjusted EBITDA margins are non - GAAP financial measures. The breakout of the components that would be included in a non - GAAP reconciliation for these measures cannot be determined on a forward - looking basis without unreasonable efforts. (3) In connection with the TaxAct Sale, we entered into a Transition Services Agreement pursuant to which the buyer and selle r w ill provide the other with certain transition services for an initial period ending on June 19, 2023. + + = New Store Sales 2.0% – 2.5% Same Store Sales Asset Retention + Asset Growth 1.0% – 2.0% High - Value Mix Shifts 1.5% – 2.5% Potential Long - Term Revenue Growth 8.5% – 11.0% Market Growth 4.0% +
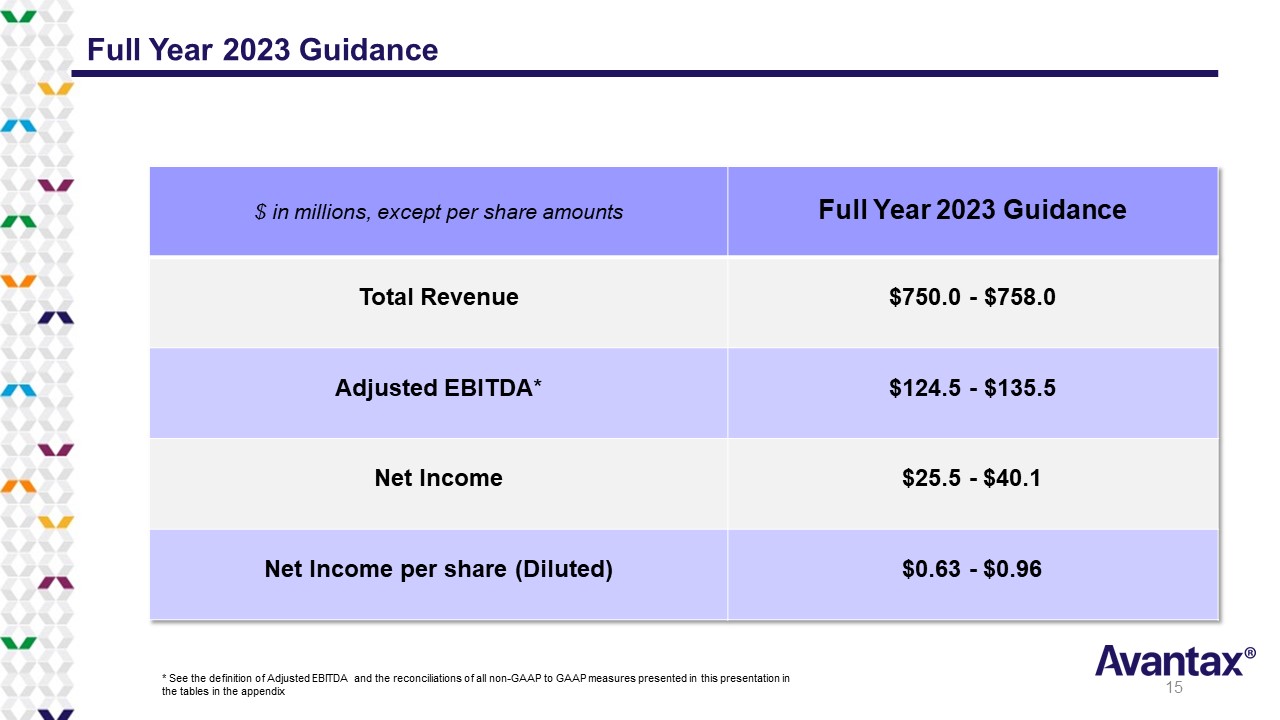
Full Year 2023 Guidance $ in millions, except per share amounts Full Year 2023 Guidance Total Revenue $750.0 - $758.0 Adjusted EBITDA * $124.5 - $135.5 Net Income $25.5 - $40.1 Net Income per share (Diluted) $0.63 - $0.96 * See the definition of Adjusted EBITDA and the reconciliations of all non - GAAP to GAAP measures presented in this presentation in the tables in the appendix 15
Appendix 16
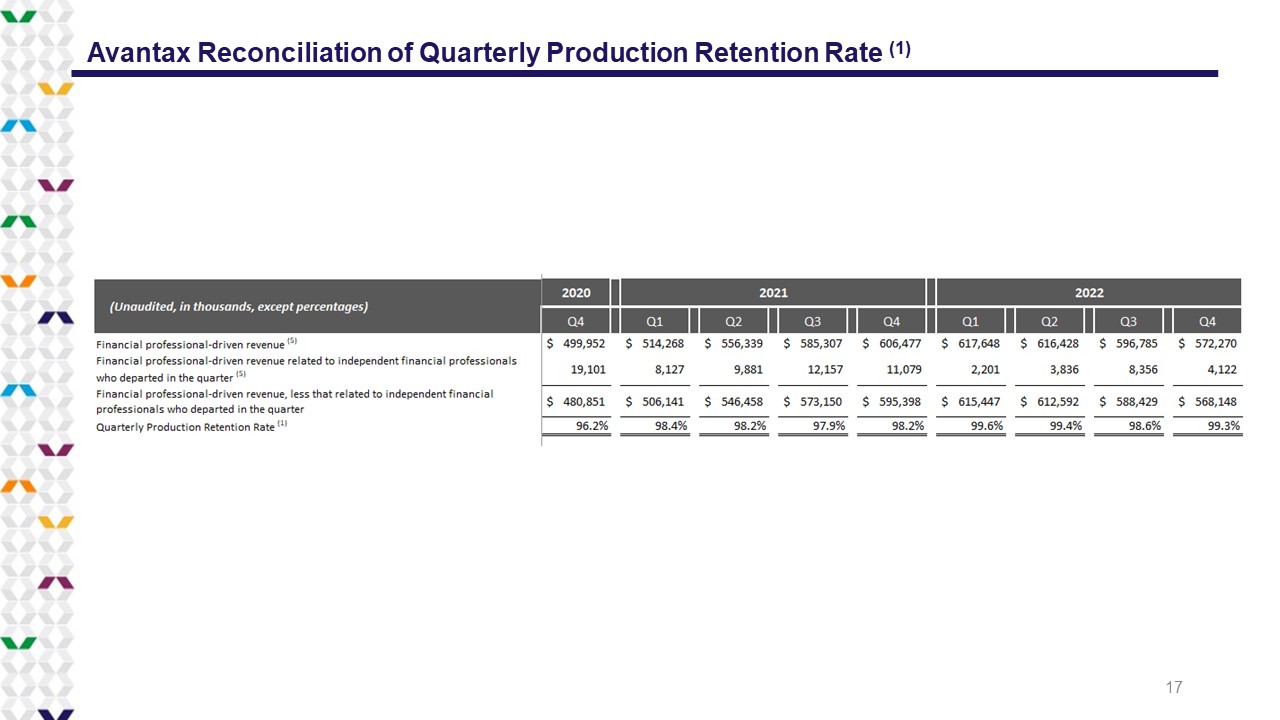
Avantax Reconciliation of Quarterly Production Retention Rate (1) 17

Avantax Reconciliation of Revenue Not Remitted to Financial Professionals and Revenue Not Remitted to Financial Professionals, Excl. Cash Sweep Revenue, ROA (2) (3) (4) Q4 Q1 Q2 Q3 Q4 Revenue $ 172,192 $ 166,403 $ 162,669 $ 165,032 $ 172,392 Less: Financial professional commission payout (118,560) (116,704) (110,958) (102,760) (99,118) Revenue Not Remitted to Financial Professionals (2) 53,632 49,699 51,711 62,272 73,274 Less: Cash sweep revenue (798) (929) (3,251) (17,792) (27,829) Revenue Not Remitted to Financial Professionals, Excluding Cash Sweep Revenue (3) 52,834 48,770 48,460 44,480 45,445 TTM Revenue Not Remitted to Financial Professionals, Excluding Cash Sweep Revenue (3) (5) $ 199,290 $ 201,387 $ 200,079 $ 194,544 $ 187,155 TTM Revenue Not Remitted to Financial Professionals, Excluding Cash Sweep, Return on Assets (ROA) (4) (5) 22.89 bps 23.04 bps 23.65 bps 23.99 bps 23.98 bps (Unaudited, in thousands, except percentages) 2021 2022 18
Avantax Reconciliation of Adjusted EBITDA for Forward - Looking Guidance (6) 19
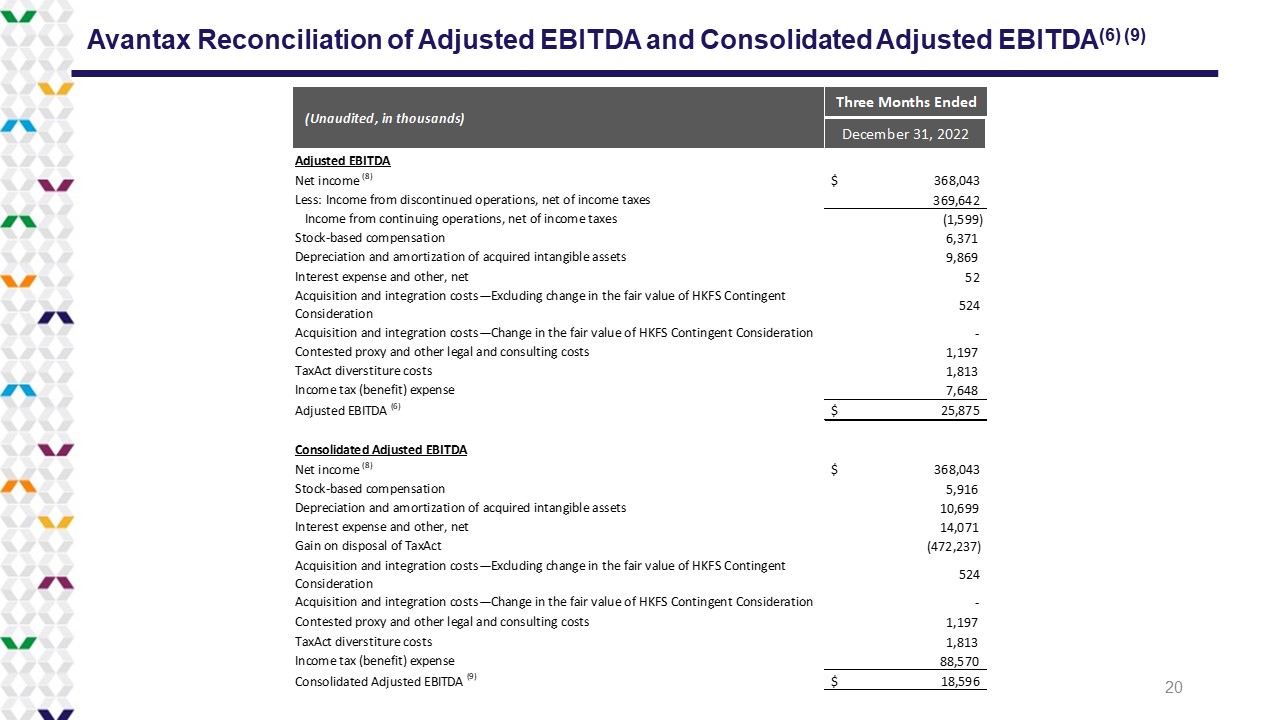
Avantax Reconciliation of Adjusted EBITDA and Consolidated Adjusted EBITDA (6) (9) Three Months Ended December 31, 2022 Adjusted EBITDA Net income (8) $ 368,043 Less: Income from discontinued operations, net of income taxes 369,642 Income from continuing operations, net of income taxes (1,599) Stock-based compensation 6,371 Depreciation and amortization of acquired intangible assets 9,869 Interest expense and other, net 52 Acquisition and integration costs—Excluding change in the fair value of HKFS Contingent Consideration 524 Acquisition and integration costs—Change in the fair value of HKFS Contingent Consideration - Contested proxy and other legal and consulting costs 1,197 TaxAct diverstiture costs 1,813 Income tax (benefit) expense 7,648 Adjusted EBITDA (6) $ 25,875 Consolidated Adjusted EBITDA Net income (8) $ 368,043 Stock-based compensation 5,916 Depreciation and amortization of acquired intangible assets 10,699 Interest expense and other, net 14,071 Gain on disposal of TaxAct (472,237) Acquisition and integration costs—Excluding change in the fair value of HKFS Contingent Consideration 524 Acquisition and integration costs—Change in the fair value of HKFS Contingent Consideration - Contested proxy and other legal and consulting costs 1,197 TaxAct diverstiture costs 1,813 Income tax (benefit) expense 88,570 Consolidated Adjusted EBITDA (9) $ 18,596 (Unaudited, in thousands) 20
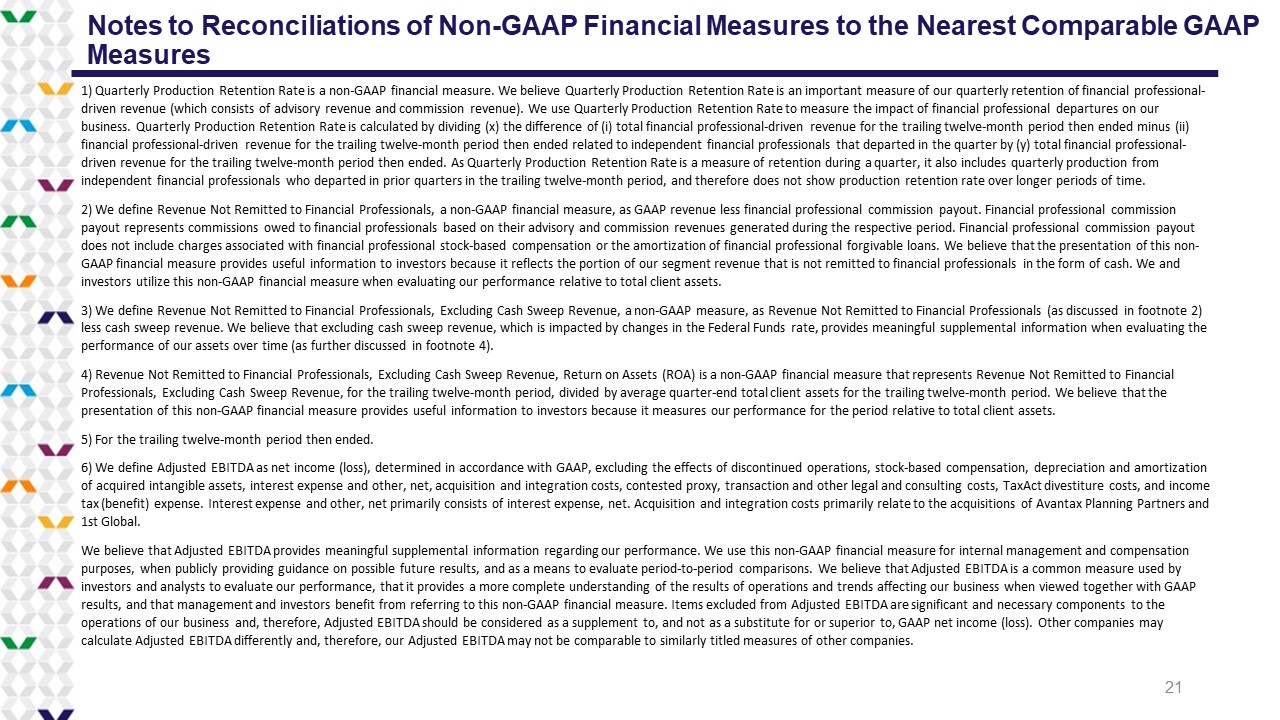
Notes to Reconciliations of Non - GAAP Financial Measures to the Nearest Comparable GAAP Measures 1) Quarterly Production Retention Rate is a non - GAAP financial measure. We believe Quarterly Production Retention Rate is an imp ortant measure of our quarterly retention of financial professional - driven revenue (which consists of advisory revenue and commission revenue). We use Quarterly Production Retention Rate to mea sur e the impact of financial professional departures on our business. Quarterly Production Retention Rate is calculated by dividing (x) the difference of ( i ) total financial professional - driven revenue for the trailing twelve - month period then ended minus (ii) financial professional - driven revenue for the trailing twelve - month period then ended related to independent financial professio nals that departed in the quarter by (y) total financial professional - driven revenue for the trailing twelve - month period then ended. As Quarterly Production Retention Rate is a measure of retention during a quarter, it also includes quarterly production from independent financial professionals who departed in prior quarters in the trailing twelve - month period, and therefore does not s how production retention rate over longer periods of time. 2) We define Revenue Not Remitted to Financial Professionals, a non - GAAP financial measure, as GAAP revenue less financial professi onal commission payout. Financial professional commission payout represents commissions owed to financial professionals based on their advisory and commission revenues generated durin g t he respective period. Financial professional commission payout does not include charges associated with financial professional stock - based compensation or the amortization of financial profes sional forgivable loans. We believe that the presentation of this non - GAAP financial measure provides useful information to investors because it reflects the portion of our segment revenue that i s n ot remitted to financial professionals in the form of cash. We and investors utilize this non - GAAP financial measure when evaluating our performance relative to total client assets. 3) We define Revenue Not Remitted to Financial Professionals, Excluding Cash Sweep Revenue, a non - GAAP measure, as Revenue Not R emitted to Financial Professionals (as discussed in footnote 2) less cash sweep revenue. We believe that excluding cash sweep revenue, which is impacted by changes in the Federal Funds rate, provides meaningful supplemental information when evaluating the performance of our assets over time (as further discussed in footnote 4). 4 ) Revenue Not Remitted to Financial Professionals, Excluding Cash Sweep Revenue, Return on Assets (ROA) is a non - GAAP financial measure that represents Revenue Not Remitted to Financial Professionals, Excluding Cash Sweep Revenue, for the trailing twelve - month period, divided by average quarter - end total client a ssets for the trailing twelve - month period. We believe that the presentation of this non - GAAP financial measure provides useful information to investors because it measures our performance for the period relative to total client assets. 5) For the trailing twelve - month period then ended. 6) We define Adjusted EBITDA as net income (loss), determined in accordance with GAAP, excluding the effects of discontinued ope rations, stock - based compensation, depreciation and amortization of acquired intangible assets, interest expense and other, net, acquisition and integration costs, contested proxy, transacti on and other legal and consulting costs, TaxAct divestiture costs, and income tax (benefit) expense. Interest expense and other, net primarily consists of interest expense, net. Acquisition and integrati on costs primarily relate to the acquisitions of Avantax Planning Partners and 1st Global. We believe that Adjusted EBITDA provides meaningful supplemental information regarding our performance. We use this non - GAAP fin ancial measure for internal management and compensation purposes, when publicly providing guidance on possible future results, and as a means to evaluate period - to - period comparisons. We believe that Adjusted EBITDA is a common measure used by investors and analysts to evaluate our performance, that it provides a more complete understanding of the results of operatio ns and trends affecting our business when viewed together with GAAP results, and that management and investors benefit from referring to this non - GAAP financial measure. Items excluded from Adjust ed EBITDA are significant and necessary components to the operations of our business and, therefore, Adjusted EBITDA should be considered as a supplement to, and not as a substitute f or or superior to, GAAP net income (loss). Other companies may calculate Adjusted EBITDA differently and, therefore, our Adjusted EBITDA may not be comparable to similarly titled measures of other companies. 21
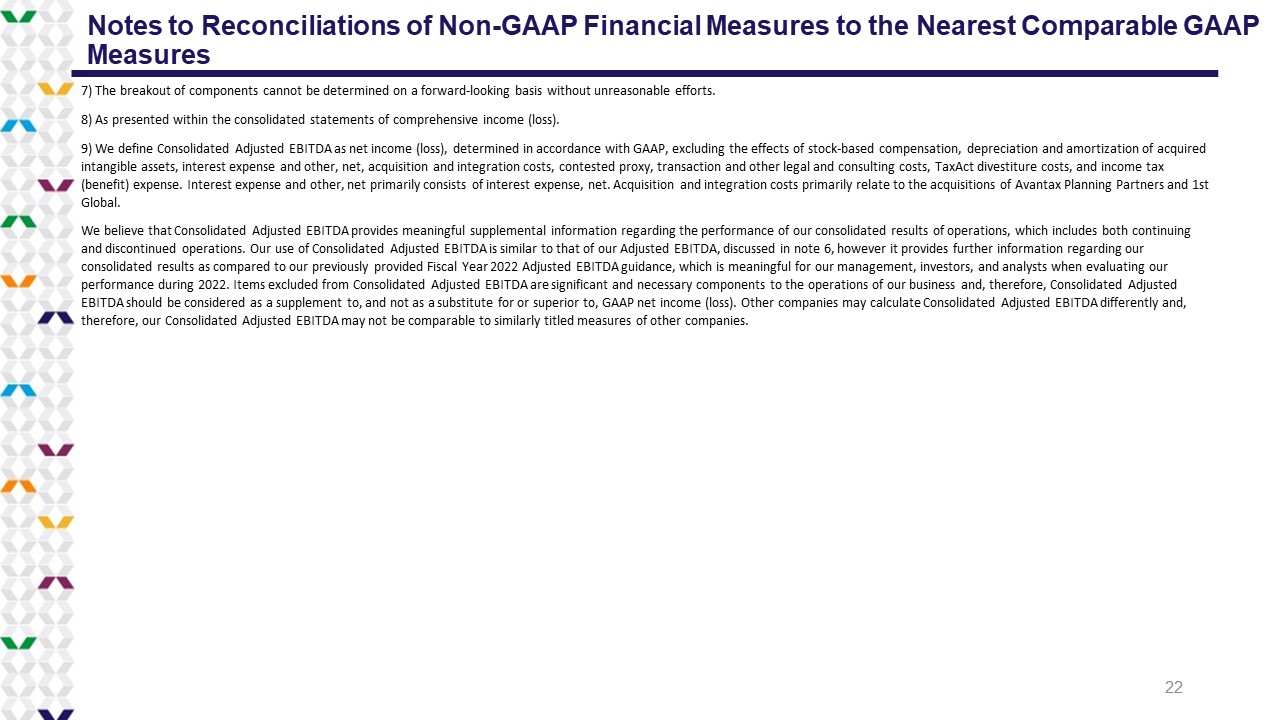
Notes to Reconciliations of Non - GAAP Financial Measures to the Nearest Comparable GAAP Measures 7) The breakout of components cannot be determined on a forward - looking basis without unreasonable efforts. 8) As presented within the consolidated statements of comprehensive income (loss). 9) We define Consolidated Adjusted EBITDA as net income (loss), determined in accordance with GAAP, excluding the effects of sto ck - based compensation, depreciation and amortization of acquired intangible assets, interest expense and other, net, acquisition and integration costs, contested proxy, transaction and other le gal and consulting costs, TaxAct divestiture costs, and income tax (benefit) expense. Interest expense and other, net primarily consists of interest expense, net. Acquisition and integration c ost s primarily relate to the acquisitions of Avantax Planning Partners and 1st Global. We believe that Consolidated Adjusted EBITDA provides meaningful supplemental information regarding the performance of our co nso lidated results of operations, which includes both continuing and discontinued operations. Our use of Consolidated Adjusted EBITDA is similar to that of our Adjusted EBITDA, discussed in not e 6, however it provides further information regarding our consolidated results as compared to our previously provided Fiscal Year 2022 Adjusted EBITDA guidance, which is meaningful fo r o ur management, investors, and analysts when evaluating our performance during 2022. Items excluded from Consolidated Adjusted EBITDA are significant and necessary components to the ope rat ions of our business and, therefore, Consolidated Adjusted EBITDA should be considered as a supplement to, and not as a substitute for or superior to, GAAP net income (loss). Other com pan ies may calculate Consolidated Adjusted EBITDA differently and, therefore, our Consolidated Adjusted EBITDA may not be comparable to similarly titled measures of other companies. 22