Form 6-K
SECURITIES AND EXCHANGE COMMISSION
Washington, D.C. 20549
Report of Foreign Private Issuer
Pursuant to Rules 13a-16 or 15d-16 of
the Securities Exchange Act of 1934
Dated: April 1, 2003
Swisscom AG
(Translation of registrant’s name into English)
Alte Tiefenaustrasse 6
3050 Bern, Switzerland
(Address of principal executive offices)
Indicate by check mark whether the registrant files or will file annual reports under cover Form 20-F or Form 40-F.
Form 20-F  Form 40-F
Indicate by check mark if the registrant is submitting the Form 6-K in paper as permitted by Regulation S-T Rule 101(b)(1): ___
Indicate by check mark if the registrant is submitting the Form 6-K in paper as permitted by Regulation S-T Rule 101(b)(7): ___
Indicate by check mark whether the registrant by furnishing the information contained in this Form is also thereby furnishing the information to the Commission pursuant to Rule 12g3-2(b) under the Securities Exchange Act of 1934.
Yes No
If “Yes” is marked, indicate below the file number assigned to the registrant in connection with Rule 12g3-2(b): 82-______
Back to Contents
| |  | |
| | Analyst meeting
Annual results 2002
“rock-solid-return(s)” 26 March 2003, Zurich | 1 |
| | | |
Back to Contents
| | | |
| | Cautionary statement regarding forward-looking statements "This communication contains statements that constitute "forward-looking statements". In this communication, such forward-looking statements include, without limitation, statements relating to our financial condition, results of operations and business and certain of our strategic plans and objectives. Because these forward-looking statements are subject to risks and uncertainties, actual future results may differ materially from those expressed in or implied by the statements. Many of these risks and uncertainties relate to factors which are beyond Swisscom's ability to control or estimate precisely, such as future market conditions, currency fluctuations, the behaviour of other market participants, the actions of governmental regulators and other risk factors detailed in Swisscom's past and future filings and reports filed with the U.S. Security and Exchange Commission and posted on our Websites. Readers are cautioned not to put undue reliance on forward-looking statements, which speak only of the date of this communication. Swisscom disclaims any intention or obligation to update and revise any forward-looking statements, whether as a result of new information, future events or otherwise.” | 2 |
| | | |
2
Back to Contents
Back to Contents
| | | |
| | | |
| | | |
| | | |
| | | |
| | | |
| | | |
| | | |
| | | |
| | | |
| | | |
| | The Overview | |
| | | |
| | | |
| | | |
| | | |
| | | |
| | | |
| | | |
| | | |
| | Jens Alder, CEO Swisscom | |
| |
| |
| |
| |
| |
| |
| |
| |
| |
| |
| |
| |
| | | 4 |
| | | |
Back to Contents
| | | |
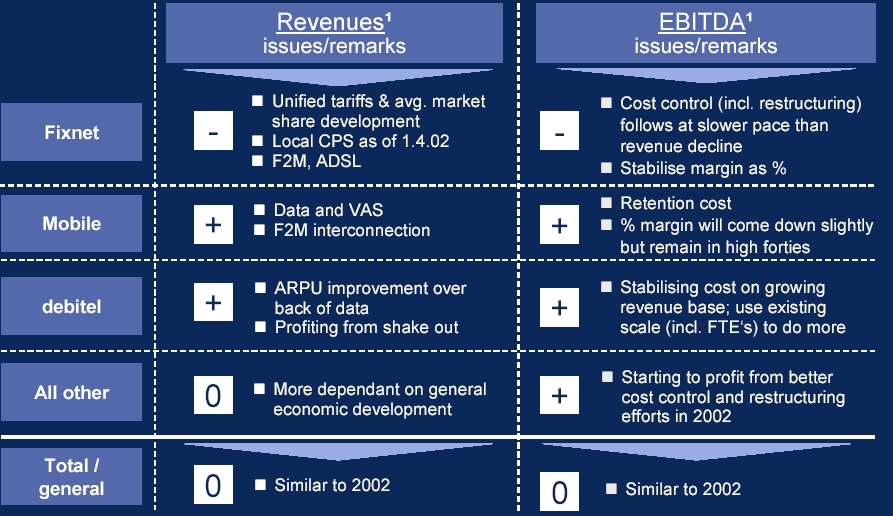
| | 2002 in review | |
| | | |
| | Key financials | | Key achievements | |
| | | |
| | | |
| | | | | | |
| | in CHF mm | 2002 | | change | |
| |
|
|
|
| |
| | Net revenue | 14,526 | | 2.5% | |
| | | | | | |
| | EBITDA | 4,413 | | 0.1% | |
| | | | | | |
| | EBIT1 | 2,408 | | 7.7% | |
| | | | | | |
| | Reported net income | 824 | | (83.4%) | |
| | | | | | |
| | CAPEX | 1,222 | | (1%) | |
| | | | | | |
| | Net debt | 642 | | nm | |
| | | | | | |
| | Book leverage2 | 9% | | nm | |
| | | | | | |
| | Number of FTE's | 20,470 | | (4.0%) | |
| |
|
|
|
| |
| | Adj. net income3 | 1,319 | | 12.4% | |
| | | | | | |
| | Adj. EPS in CHF4 | 19.92 | | 24.8% | |
| |
|
|
|
| |
| | | |
| | 1 | before exceptional item |
| | 2 | net debt / shareholders’ equity |
| | 3 | adjusted only by substantial exceptional items, net of taxes |
| | 4 | number of outstanding shares at YE 2002: 66.2mm |
| | | |
| |  |
| | | |
| | | Successfully defended strong market position |
| | | |
| | | Launched several new products and price packages in wireline and wireless markets |
| | | |
| | | On track with operating cost reductions |
| | | |
| | | Finalised new organisational structure, reduced workforce by 858 FTE's (-4%) |
| | | |
| |  |
| | | |
| | | Have not been able to execute large acquisition options, that would satisfy investment criteria |
| | | |
| | | Completed few minor investments into "ventures" as "entry-ticket-options" (more recently for example into public WLAN) |
| | | |
| |  |
| | | |
| | | Robust financial management and strong balance sheet |
| | | |
| | | Defined new return policy: "delivering full annual equity free cash flow to shareholders" |
| | | |
| | | |
| | | |
| | | |
| |
On the back of strong results, Swisscom proposes
“rock-solid-returns” to shareholders
| |
| | | 5 |
| | | |
Back to Contents
| | Swisscom introduces new Return Policy to shareholders | | |
| | | | |
| | | | | |
| from “dividend policy” | | to “return policy” | |
| | | |
| | | |
| | | | | |
| | | | |
| | | | | |
| | paying approx. half of adjusted net
income + opportunistic return of
funds through share buy back | | returning the full annual equity free cash
flow (EFCF) to shareholders, through: • dividends
• par value reduction
• share buy backs
| |
| | | | | |
Back to Contents
| | | | |
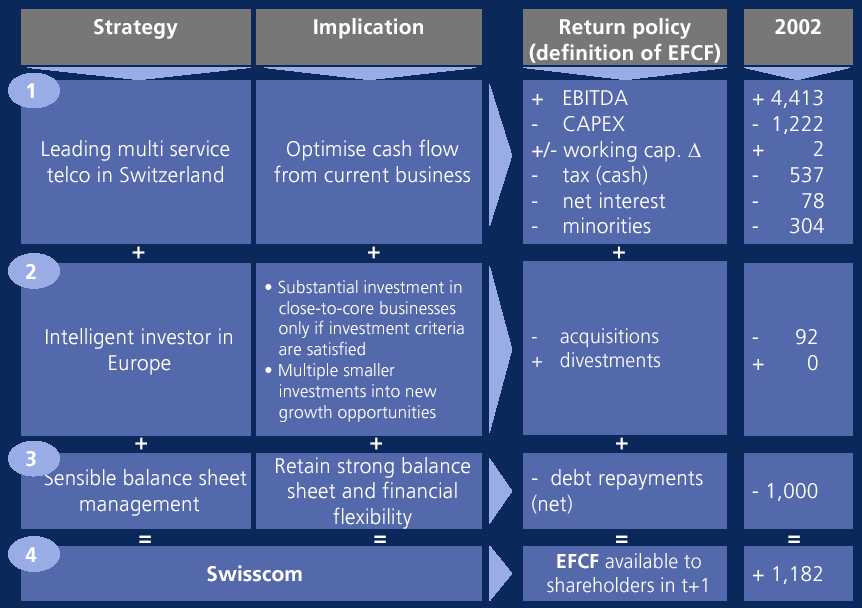
 | | New Return Policy - reflects strategy | |
| | | | | |
 |
| | | | | 7 |
| | | | | |
Back to Contents
| | | | | |
 | | New Return Policy - ties in considerations
of strategic flexibility and capital structure | |
| | | | | |
| |  |
| | | | | |
| | Return Policy takes it from cash flow perspective. Current business cash flows are higher than profits mainly due to fact that depreciation charges are - and will be - substantially higher than level of capital expenditure. Taking profits as the basis for returns to shareholders would hence lead to creation of cash pile | | |
| | | | | |
| |  |
| | | | | |
| | Return Policy deliberately subtracts cash required for acquisitions. This highlights the company’s view that acquisitions have to be cashflow accretive to make sense: otherwise money should be returned | | |
| | | | | |
| |  |
| | | | |
| | Return Policy reflects company’s desire to retain strong balance sheet by including debt repayments. Underlines company’s wish to restore strategic flexibility as fast as possible through conscious debt maturity management in case of debt-funded acquisitions | | |
| | | | | |
| | | | | |
| | | | | |
| | | In conclusion, the new Return Policy prevents Swisscom from building again a cash pile, as all annual free cash generated is returned to either providers of debt or equity. At the same time, this Policy does not weaken the balance sheet | | |
| | | | | |
| | | | | 8 |
| | | | | |
Back to Contents
| | | | | |
 | | New Return Policy and financial year 2002:
offers better yield than dividends only can do | | |
| | | | | |
 | | Remarks | |
| | | | |
| | | | |
| | | | |
| | | | |
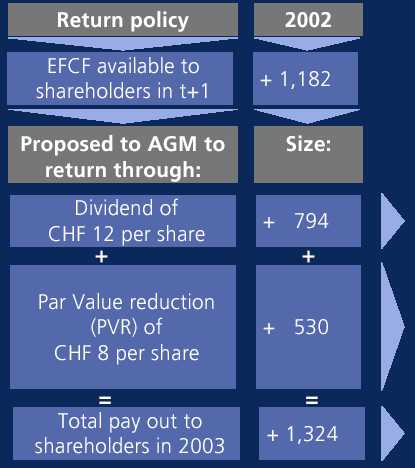
| | CHF 12/share compares to CHF 11 for 2001, and represents 60% of adjusted net income. Higher dividend also possible through the accretion effect of the 10% share buy back concluded in 2002. Reflects ongoing commitment to pay around half of adjusted net income in form of dividends.
Will be paid on May 9, 2003 | |
| | | | |
| | To pay remaining EFCF after dividends in PVR would imply CHF 6/share. However, this would be sub-optimal, as we should reduce the PVR straight away to a final nominal value of CHF 1/share. Hence, the full remaining CHF 8/share will now be returned.
Will be paid by August 2003 latest | |
| | | | |
| | As a result, Swisscom will return the full EFCF plus an additional CHF 142mm to shareholders in 2003 | |
| | | | | | | |
| | | | | |
| | | | | |
| | | High return for year 2002 through dividends and par value reduction payable
in 2003. No share buy back (SBB) in 2003, unless government decides
to dilute. That may trigger Swisscom to do a SBB in order to serve
the interests of free float holders | | |
| | | | | |
| | | | | 9 |
| | | | | |
Back to Contents
| | | | |
 | | New Return Policy - builds on strong outlook | |
Back to Contents
| | |
| Update on the “quest for acquisitions” | |
| | | | | | | | | | |
| | Criteria | | | Explanation | | | | Rationale | |
| | | | | | | | | | |
| | | | | |  | | What is the uniqueness of the constellation?
what makes Swisscom a better investor than a financial investor directly: | |
| | sustainability | | | Focus on sustainable cash flow | | |
| | | | generation and accretion | | |
| | | | to group cash flows | | |
| | | | | | | |
| | | | | | | |
| | strategic fit | | | Potential synergies, and ability | | | |
| | | | to exploit these through | | – | we may be the only acceptance | |
| | | | control | | | buyer for a majority stake | |
| | | | | | | – | we can sweat the asset better | |
| | | | | | | | thanks to our experience | |
| | management | | | Availability of experienced | | | | |
| | | | management team | | – | we can extract some synergies with | |
| | | | | | | | current operations | |
| | | | | | | | | |
| | price | | | Attractive valuation | | – | we may improve the position | |
| | | | | | | | of the combination in the | |
| | size/risk | | | No major shift in existing | | | run-up to potential further | |
| | | | risk profile | | | industry consolidation | |
| | | | | | | | | | |
| | So far not been able to execute convincing options. Having looked at most possibilities, the route forward is opportunistic. If new possibilities arise, Swisscom will continue to screen these, using its robust set of criteria | |
| | |
| | |
| | | | | | | | | | 11 |
| | | | | | | | | | |
Back to Contents
| In summary | |
| | | |
| | | |
| | | |
| | Your 3 “bets” when investing in Swisscom | |
| | | |
| |  | |
| | | |
| | Swisscom is able to sustain strong annual equity free cash flows - through continued strong operational performance | |
| | | |
| |  | |
| | | |
| | Swisscom doesn’t have a long term strategic (scale) problem if it doesn’t acquire, and only acquires if this is value accretive | |
| | | |
| |  | |
| | | |
| | Swisscom will return all equity free cash flow to shareholders while preserving a strong balance sheet | |
| | | |
| | | 12 |
| | | |
Back to Contents
| | |
| | |
| | |
| | |
| | |
| | |
| | |
| | |
| | |
| | | | |
| | | Domestic wireline business | |
| | | | |
| | |
| | |
| | |
| | |
| | Adrian Bult, CEO Swisscom Fixnet |
| | |
| | |
| | |
| | |
| | |
| | |
| | |
| | |
| | |
| | |
| | 13 |
| | |
Back to Contents
| | | |
| Highlights 2002 | |
| | |
| | | | | | | | | |
| | | Key financials Fixnet | | | | Key achievements FX | | |
| | | | | | | | | |
| | | | | | | | |
| | in CHF mm | 2002 | change | | | Stabilised overall market share after | |
| |
|
|
| | | renumbering at 59% | |
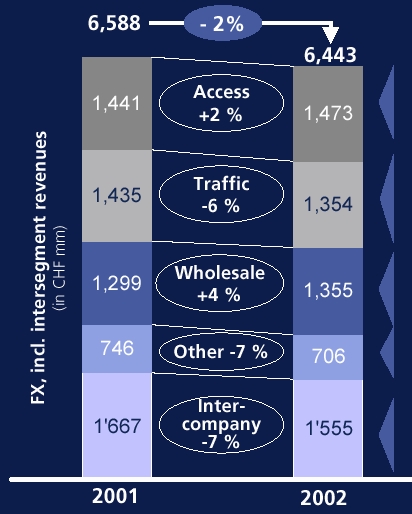
| | Net revenue 1 | 6,443 | (2.2%) | | | | |
| | | | | | | | |
| | EBITDA | 1,903 | (4.3%) | | | Reduced FTE’s by 7%, costs by 1% | |
| | | | | | | and CAPEX by 2% while increasing | |
| | EBITDA margin | 29.5% | (2.3%) | | | investments in new business | |
| | | | | | | | |
| | EBIT | 848 | (6.7%) | | | | |
| | | | | | | | |
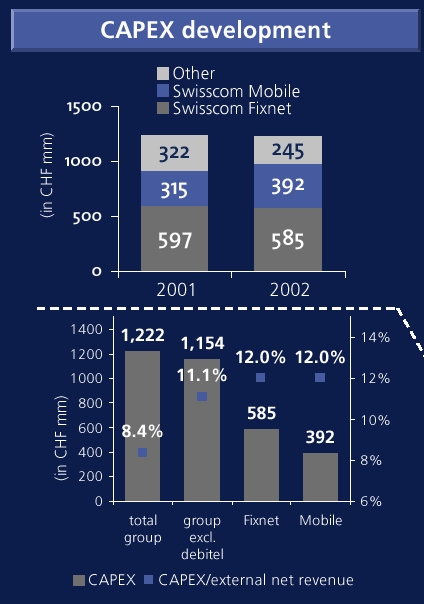
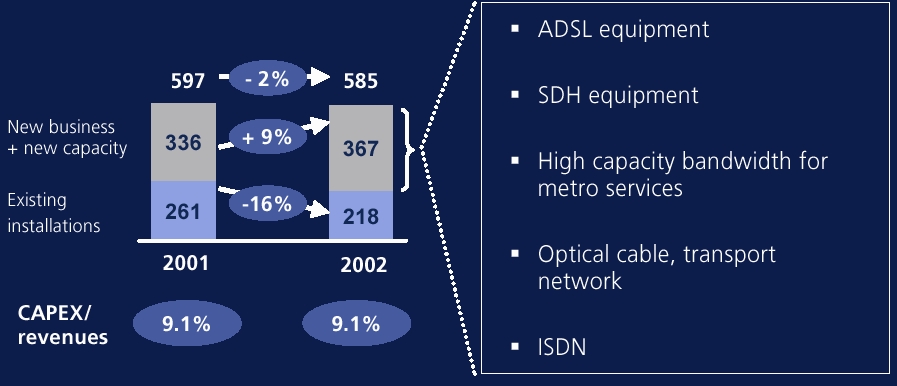
| | CAPEX | 585 | (2.0%) | | | Exceeded target of Broadband; rolled | |
| | | | | | | out close to 200k lines | |
| | Number of FTE's | 8,010 | (7.3%) | | | | |
| |
|
|
| | | | |
| | | | | | | | |
| | | | | | | | | |
| | | Key financials Enterprise Solutions | | | | Key achievements ES | | |
| | | | | | | | | |
| | | | | | | | |
| | in CHF mm | 2002 | change | | | Improved customer relationships | |
| |
|
|
| | | | |
| | Net revenue 1 | 1,450 | (8.5%) | | | Moved from technology-driven products | |
| | | | | | | to target group offerings | |
| | EBITDA | 68 | (40.4%) | | | | |
| | | | | | | | |
| | EBITDA margin | 4.7% | (34.7%) | | | Established partnerships (e.g. with | |
| | | | | | | Unit.net) | |
| | EBIT | 36 | (55.6%) | | | | |
| | | | | | | | |
| | CAPEX | 23 | (20.9%) | | | Reduced future cost base through | |
| | | | | | | ongoing restructuring | |
| | Number of FTE's | 1,410 | (9.4%) | | | | |
| |
|
|
| | | | |
| | 1 including intersegment revenue | | | | | | |
| | | |
| | Strong cash generative business, however full focus on efficiency
improvements required to ensure sustainability | |
| | | |
| | | |
| | | 14 |
| | | |
Back to Contents
| | | |
| | Q1. Overall volume development? | |
| | | |
| | Significant retail traffic reduction through renumbering
and market reduction |
| | |
| | | | | |
| | Change in retail traffic volumes of FX+ES
(in mm minutes) | | | Decline in local and DLD traffic |
| | | – | New renumbering introduced |
| | | | | | | in April 2002 - one off effect |
| | | | | | | (1,000mm) |
| | 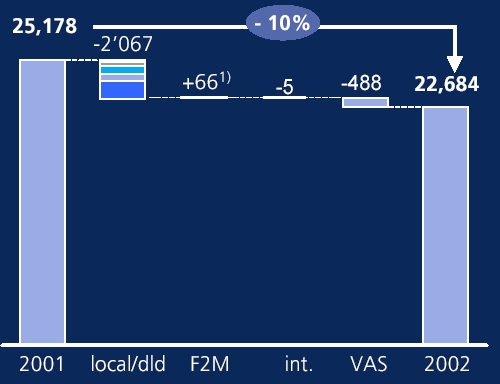 | | | | – | Market reduction on SCM |
| | | | | retail traffic (388mm) |
| | | | – | Surf effect (350mm) |
| | | | – | Market share loss (270mm) |
| | | | – | Hard mobile substitution |
| | | | | |
| | | Increased F2M traffic due to higher |
| | | mobile penetration |
| | | |
| | | Stable international traffic |
| | | |
| | | Reduction in value added services |
| | | | – | Reduced dial-up traffic due to |
| | | | | ADSL substitution |
| | – | Carrier specific filtering |
| | | | | | | |
| | | |
| | Action to stabilize market shares will be taken in 2003 | |
| | | |
| | | |
| | 1) Gross increase estimated at 73mm minutes; 7mm minutes lost due to hard mobile substitution | |
| | | 15 |
| | | |
Back to Contents
| | | | | |
| | Q2. Fixed-to-Mobile substitution? | | | |
| | |
| | Overall mobile impact on wireline revenues neutral |
| | | |
| | Estimated impact of Mobile on FX + ES national retail traffic 1 | |
National traffic volumes (in mm minutes) 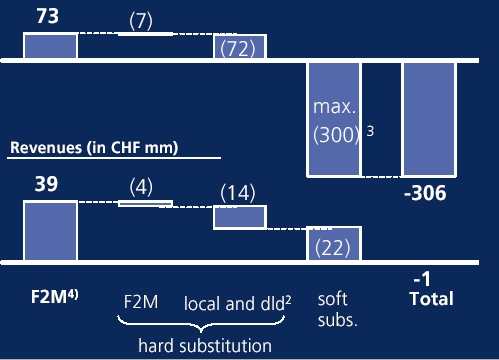
| | |
| Loss of ca. 1.5% access lines due to hard mobile substitution (largely line cancellation) |
| | | |
| | – | Estimated impact 66,000 lines |
| | | |
| | – | Traffic 79mm minutes |
| | |
| Overall market reduction impacted Swisscom retail traffic by 388mm minutes |
| | | |
| | – | Maximally 300mm attributed to soft mobile substitution |
| | | |
| | – | Remaining reduction attributed to other behavioral changes (e.g., e-mail use) |
| | | |
| | | |
| | | |
| Lost minutes gained back by mobile operators with
Swisscom Mobile being main beneficiary | |
| | 1 Includes national and F2M traffic. Not included is international and wholesale traffic | |
| | 2 Revenues include CHF 10mm lost access revenues | |
| | 3 Estimate of maximum impact based on observed market reductions of total 388mm minutes and analysis of national traffic | |
| | 4 Attributable to traffic change. Other changes such as change in rebates are not included | |
| | | 16 |
| | | |
Back to Contents
| | | | | |
| | Q3. Voice over Cable? | | | |
| | |
| | Cablecom’s recent Voice offer appears quite attractive as first line offer |
| | |
| | | | | |
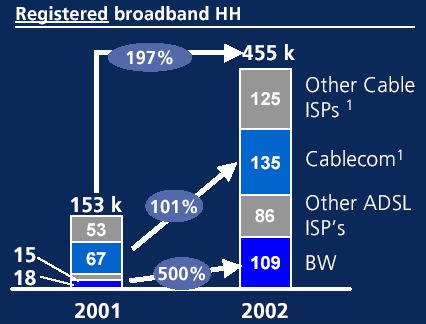
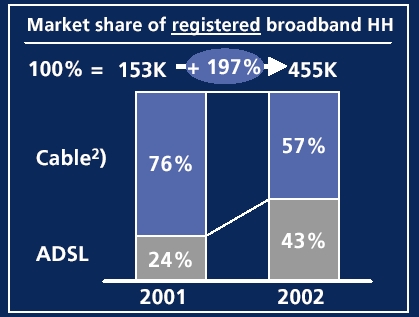
| | Strong growth of broadband in 2002 | | Comparison of Cablecom to FX offers 2 | |
| | | | | |
| | | | | | | | | | |
| |   | | | | One Line | Two Lines | |
| | | | |
| |
| | | Add-on to
existing
Cable BB-offer | | | -18% | | -23% | |
| | | | | | | | | |
| | | | | | | | | |
| | | Combined
Cable BB/Voice
package | | | -8% | | -12% | |
| | | | | | | | | |
| | | | | | | | | |
| | | Cable BB/Voice
package as second
line 3 | | | +12% | | +17% | |
| | | | | | | | | | |
| | | | | | | | | | |
| However, similar to other European Cable providers in Europe,
Cablecom will need to prove to be able to deliver satisfactory voice services | |
| | 1 Estimated. Source: Swiss Press, Swisscable report | |
| | 2 Relative to Swisscom FX retail prices (in %). Approximated values | |
| | 3 Standard telephony access is kept at Swisscom | 17 |
| | | |
Back to Contents
| | | | | |
| | Q4. ADSL business case? | | | |
| | |
| | ADSL expected to be cash flow positive from 2004/2005 |
| | |
| | | | | |
| | Background | | Business case characteristics | |
| | | | | |
| | | Swiss market characterised by aggressive | | | | Recurrent ARPU/Subs1) (CHF/month): | |
| | | growth in broadband market. Swisscom | | | – | around CHF 49 on a standalone basis | |
| | | pushes mainly for defensive reasons | | | – | around CHF 31 on a net basis (after substitution) | |
| | |  | | | | | |
 CAPEX per new subs moving down towards CHF 500-550 | |
| | | | | | | |
| | | | | | Swisscom ADSL expected to be cash flow positive in 2004/2005 - including negative effects from substitution, and earlier on a standalone basis. Latest review indicates approx. 400k subs for breakeven standalone | |
| | | | | | | |
| | | | | | Business case further improved through the side effect of protection of voice minutes that may otherwise be lost to cable operators | |
| | | | | | | |
| | | | | | | |
| | | | | | | |
| Breakeven - on a standalone basis - at approximately 400k ADSL | |
| | 1) Blended ARPU, WS and retail over all bandwidth offers | |
| | 2) Estimates. Source: Swiss press, Swisscable report | 18 |
| | | |
Back to Contents
Back to Contents
| | Q5. Swisscom and regulation? | | |
| | | | |
| | | | |
| B. Where does Swiss regulation differ from the rest of Europe? |
| | | | |
Back to Contents
| Q6. Outlook Swisscom Fixnet? | | |
| | | |
| |
Back to Contents
| |
|
| |
| |
| |
| |
| |
| |
| |
| |
| | | |
| | Domestic wireless business | |
| | | |
| |
| |
| |
| |
| |
| |
| Carsten Schloter, CEO Swisscom Mobile |
| |
| |
| |
| |
| |
| |
| |
| |
| |
| |
| 22 |
| |
Back to Contents
Back to Contents
| | | | | | | | |
| | | | | | | |
| | Q7. Operational development? | |
| | | | | | |
| | | | | | | |
| | | | | | | |
| | | | | | | |
| | | | | | |
| | | ARPU development | | Comments | |
| | | | | | |
| | | | | | | |
| | | | | | | |
| | | 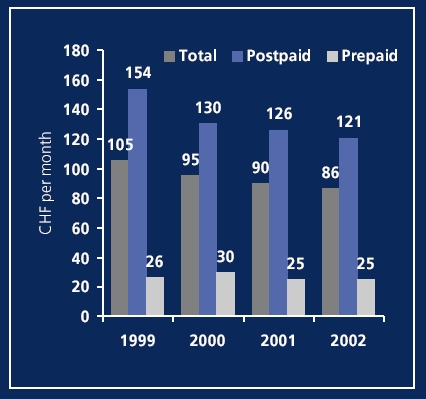 | | | Market penetration in CH reached 77.5% at YE 2002 | |
| | | | | | |
| | | | | Market gross adds reduced to 1.6mm, of which Swisscom Mobile achieved over 50% | |
| | | | | | |
| | | | | Swisscom Mobile's successful retention program lead to a low churn of 17% churn p.a. (15% on postpaid, 20% on prepaid) | |
| | | | | | |
| | | | | ARPU non-voice (SMS, data traffic) at CHF 8 despite data tariffs on European average (9% of ARPU) | |
| | | | | | |
| | | | | ARPU voice decreased due to right grading, dilution from new subs, and economic downturn | |
| | | | | | | |
| | | | | | | |
| | | |
| | Slow down in ARPU erosion and decrease in churn | |
| | | |
| | | | | | | |
| | | | | | | 24 |
| | | | | | | |
Back to Contents
Back to Contents
Back to Contents
Back to Contents
| | | |
| | | |
| | | |
| | | |
| | | |
| | | |
| | | |
| | | |
| | Other businesses | |
| | | |
| | | |
| | | |
| | | |
| | | |
| | Mike Shipton, CSO Swisscom | |
| | | |
| | | |
| | | |
| | | |
| | | |
| | | |
| | | |
| | | |
| | | |
| | | |
| | | 28 |
| | | |
Back to Contents
| Key financials and achievements - debitel | |
| | |
| | |
| | |
| | | | |
| Key financials - debitel |
| | | | |
| | | | |
| in CHF mm | 2002 | | change |
|
|
|
|
| | | | |
| Total subscribers (mm) | 10.1 | | 0.6% |
| | | | |
| ARPU (€/month)1 | 17 | | 2.8% |
| | | | |
| Net revenue2 | 4,111 | | 8.0% |
| | | | |
| EBITDA2 | 159 | | (15.0%) |
| | | | |
| EBITDA margin2 | 3.9% | | (20.4%) |
| | | | |
| EBIT2 | 97 | | (28.7%) |
| | | | |
| CAPEX2 | 68 | | 3.0% |
| | | | |
| Number of FTE's | 3,299 | | (6.9%) |
|
|
|
|
| 1 according debitel accounting standards (US GAAP) |
| 2 under IAS accounting standards |
| | | | |
| | Key achievements |
| | | | |
| | | | |
| | | | Robust performance |
| | | | |
| | | | – 8%-revenue2 increase (driven by all countries) |
| | | | |
| | | | – further cost savings realised |
| | | | |
| | | | – increased equity ratio from 20% to 24%1 |
| | | | |
| | | | – no net debt 1 |
| | | | |
| | | | Positive EBIT-contribution of international |
| | | | business |
| | | | |
| | | | Strengthened distribution power |
| | | | |
| |
| |
| |
| Positive business development despite difficult market conditions |
| |
| 29 |
Back to Contents
| Q 11: Swisscom and Debitel? | |
| | | |
| | | |
| | | |
| 1999 - Swisscom acquires majority in Debitel - for strategic reasons | | 2003 - Swisscom holds majority in Debitel - as important financial stake |
| | | |
 |
| |
| Rationale: |
| | | |
| | acquire UMTS license in Germany |
| | | |
| | turn Debitel into an operator |
| | | |
| | combine customer base with Swisscom |
| | | Mobile - to realise economies of scale |
| |
| Situation: |
| | | |
| | not possible to acquire license at |
| | | justifiable price |
| |
| Decision: |
| | | |
| | find different solution for gaining footprint |
| | | for Swisscom Mobile (done through |
| | | Vodafone partnership) |
| | | |
| | refocus Debitel as a network independent |
| | | ESP, with access to UMTS platforms |
| | | without being a licensed operator |
| | | |
| Implications (1): |
| | | |
| | Debitel moves from strategic investment |
| | | to an important financial investment |
| | | |
| | | |
| |
| Implications (2): |
| | | |
| | Swisscom has to treat Debitel as any |
| | | other important financial investment |
| | | |
| | Swisscom has to create options with |
| | | flexibility |
| | | |
| What to do: |
| | | |
| | actively support Debitel in their corporate |
| | | development: any action that generates |
| | | shareholder value (also in the long run) is |
| | | in the interest of its shareholders: |
| | | Swisscom with a 93% direct stake |
| | | inclusive |
| | | |
| | review frequently the value of our |
| | | investment, and do impairment test. |
| | | Result: Swisscom now has € 10/share |
| | | book value as per 31.12.2002 |
| | | |
| | create options that improve flexibility with |
| | | respect to Swisscom's stake. Result: |
| | | Swisscom secured a right (call option) to |
| | | get above 95% stake. This provides |
| | | freedom to either increase free float, |
| | | squeeze out or sell stake. No decision |
| | | imminent |
| | | 30 |
Back to Contents
| | | |
| | Key financials and achievements - segment Other | |
| | | |
| | Key financials - segment Other | | Key achievements | |
| | | | | | | | |
| | in CHF mm | 2002 | change | | Swisscom IT Services: | |
| |
|
|
| | | | |
| | External revenue | 833 | 12.3% | | | Completed PMI process with AGI | |
| | | | | | | | |
| | of which Systems | 406 | (14.7%) | | | Successfully positioned IT Services brand in the Swiss IT Market | |
| | | | | | | | |
| | of which IT Services | 210 | nm | | | Defined services & solutions portfolio | |
| | | | | | | | |
| | of which Broadcast | 162 | (10.6%) | | | Installed sales organisation & processes | |
| | | | | | | | |
| | Net revenue 1 | 1,463 | 4.3% | | | Integrated Conextrade | |
| | | | | | | | |
| | EBITDA | 111 | (18.4%) | | Swisscom Systems: | |
| | | | | | | | |
| | EBITDA margin | 7.6% | (21.6%) | | | Operational start as of January 1, 2002 | |
| | | | | | | | |
| | EBIT | (114) | (22.6%) | | | Completed set up of a restructuring plan | |
| | | | | | | | |
| | CAPEX | 103 | (40.5%) | | | Completed full re-engineering of process | |
| | | | | | | and IT architecture | |
| | Number of FTE's | 4,374 | (0.1%) | | | | |
| |
|
|
| | | | |
| | 1 including intersegment revenue | | | | |
| Both IT Services and Systems experience effects from more difficult
market and macro economic environment | |
| | | 31 |
| | | |
Back to Contents
| | | | | |
| | Q12. How is the general economic development impacting your business? | | |
| | |
| | |
| | |
| | |
| | Overall economic environment | | Impact and outlook for Swisscom | |
| | | | | | | |
| | | Slow economic recovery with modest but robust GDP growth - small improvement for 2003 and higher growth in 2004 expected | | | Residential Market: Revenues in fixed- line and mobile more protected against economic downturn and rise in unemployment rate: | |
| | | Continued structural weakness in equipment investments by Swiss enterprises and weak private and corporate consumption for non-basic needs | |
| – commodity serving basic needs – non-cyclical behaviour Business Market: Investment related revenues from solutions business under pressure - however, less established operators suffering most | |
| Impact on Swisscom of current weak economic environment is limited in residential segment, more serious in business segment | |
| | | 32 |
| | | |
Back to Contents
| | | | | |
| | Q13. Outlook Swisscom IT Services and Swisscom Systems? | | |
| | |
| | |
| | |
| | |
Back to Contents
| | | | |
| | Q14. How do you look at options for product bundling? | | |
| | | | |
| | | | |
| | | | |
| | Residential: price bundles | |
| | |
| | | | |
| | | | |
| | | Swisscom well positioned to provide bundles as market leader in fixed and mobile telephony but considers bundles mainly for defensive reasons | |
| | | | |
| | | No aggressive price bundles launched by competitors so far in residential market and Swisscom not a first-mover | |
| | | | |
| | | Potential bundling packages that Swisscom could envisage are | |
| | | | |
| | | – | Voice/broad band | |
| | | | |
| | | – | Fixed/mobile | |
| | | | |
| | | However, potential regulatory hurdles for implementation (“market dominance”) exist | |
| | | |
| Corporate: solution bundles | |
| |
| | | |
| | | |
| Corporate customers demand for integrated solutions including e.g. voice, data (both fixed and mobile) and IT | |
| | | |
| Though international players are present in the market for corporate solutions, Swisscom has unique local capabilities | |
| | | |
| Swisscom's Enterprise Solutions has been at forefront of corporate bundled solutions | |
| | | |
| | | |
| | | |
| | | |
| | | |
| | | |
| | | |
| | | |
| | Swisscom has a unique bundling capacity in Switzerland
for both residential and corporate | |
| | |
| | |
| | |
| | | |
| | 34 |
| | | |
Back to Contents
| | | | |
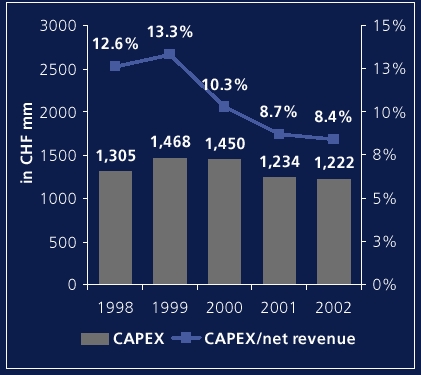
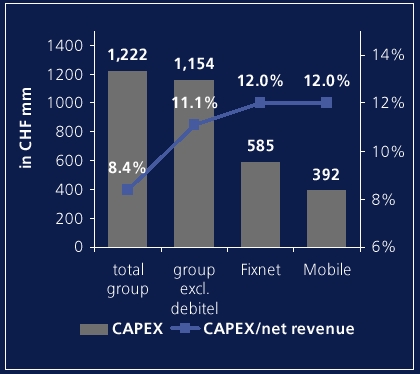
| | Q15. How does your CAPEX-profile look? | | |
| | | | |
Back to Contents
| | | | | |
| | | | |
| | | | | |
| | | | | |
| | | | | |
| | | | | |
| | | | | |
| | | | | |
| | | | | |
| | | | | |
| | | Group financials 2002 | | |
| | | | | |
| | | | | |
| | | | | |
| | | | | |
| | | Ueli Dietiker, CFO Swisscom | | |
| | | | | |
| | | | | |
| | | | | |
| | | | | |
| | | | | |
| | | | | |
| | | | | |
| | | | | |
| | | | | |
| | | | | |
| | | | 36 |
| | | | | |
Back to Contents
| | Key figures and financial highlights | |
| in CHF mm | 2001 | change | |
|
| Net revenue | 14,526 | 2,5% | |
| | | | |
| EBITDA | 4,413 | 0.1% | |
| | | | |
| EBIT1 | 2,408 | 7.7% | |
| | | | |
| Net income | 824 | (83.4%) | |
| | | | |
| Net debt | 642 | nm | |
| | | | |
| CAPEX | 1,222 | (0.1%) | |
| | | | |
| Number of FTE's2 | 20,470 | (4.0%) | |
|
| ADj. net income3 | 1,319 | 12.4% | |
| Adj. EPS in CHF4 | 19.92 | 24.8% | |
|
| |
| 1 | before exceptional item |
| 2 | excluding Work Link (252 people) |
| 3 | adjusted only by substantial exceptional items |
| 4 | number of outstanding shares at YE 2002: 66.2mm |
| | | Revenue development inline with expectations |
| | | |
| | | Solid EBITDA performance: CHF 4,4bln |
| | | |
| | | EBIT grew by 7.7% mainly due to lower
depreciation and amortisation |
| | | |
| | | Impairment of debitel goodwill (CHF 0,7bln) |
| | | |
| | | Adjusted net income of CHF 1,3bln (+12.4%) |
| | | |
| | | Successful share buyback led to an adjusted
EPS accretion of 11% |
| | | |
| | | In total, CHF 5,5bln (>20% of balance sheet total)
in cash returned to shareholders in 2002 |
| | | |
| | | Strong balance sheet and solid ratios, also after completion of share buyback |
| | | |
| | | Strong cash generation |
| | | |
| | | |
| |
| | | |
| | Simply steady, simply solid. Simply Swisscom | |
| | | |
| | | 37 |
Back to Contents
| | External revenue development | |
| | | |
| | 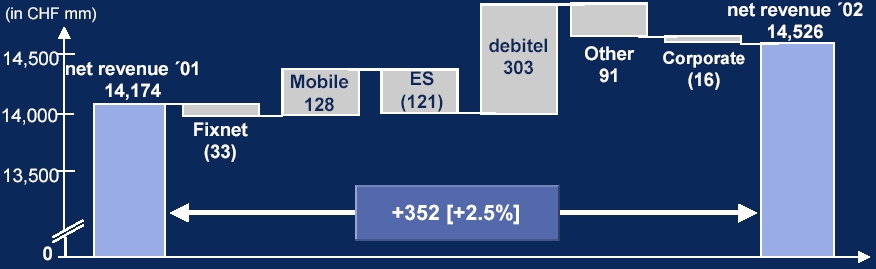 |
| | | |
| in CHF mm | Fixnet | Mobile | ES | debitel | Other | Corporate | Net revenue |
2001
2002 | 4,921
4,888 | 3,127
3,255 | 1,486
1,365 | 3,808
4,111 | 742
833 | 90
74 | 14,174
14,526 |
| % | (0.7%) | 4.1% | (8.1%) | 8.0% | 12.3% | (17.8%) | 2.5% |
| | |
| | | |
| | Stable at first sight, shifting underneath | |
| | | |
| | | 38 |
Back to Contents
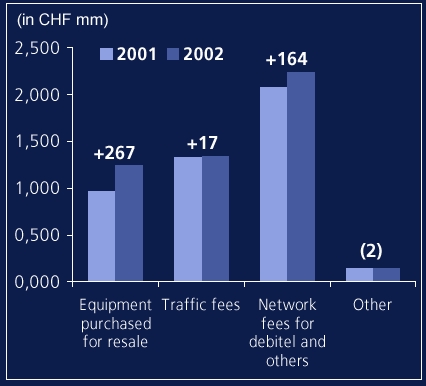
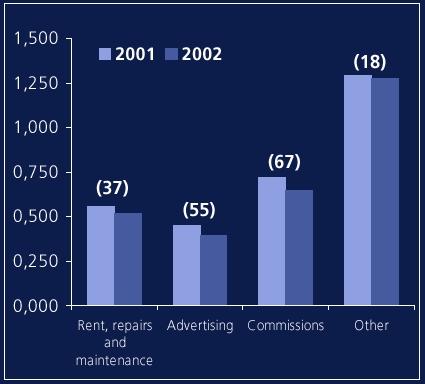
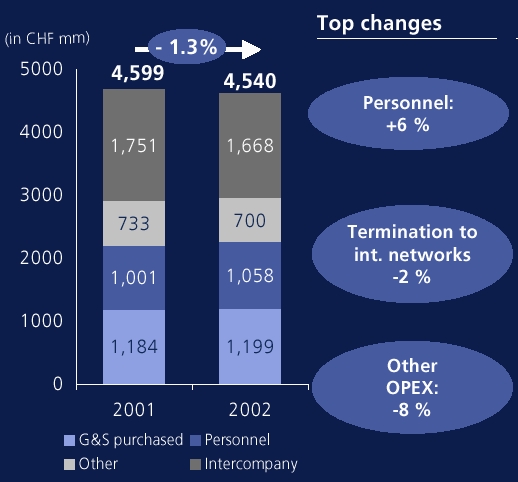
| | Cost overview | |
| | | |
| | 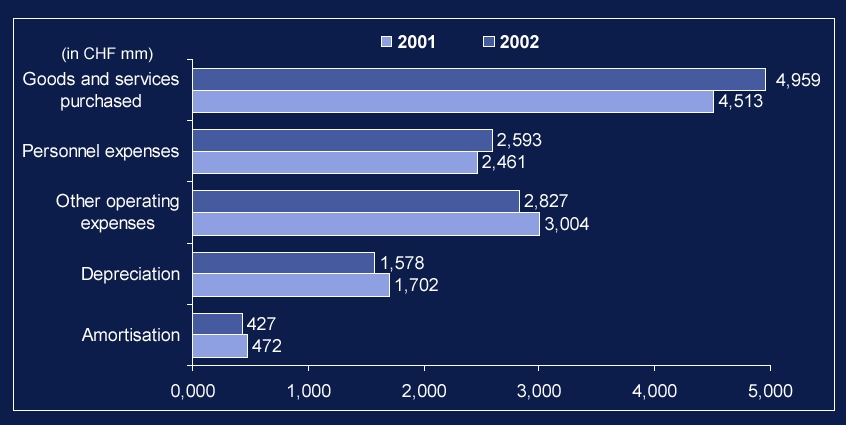 |
| | | |
| | | |
| | Compared to 2001, almost unchanged level of total OPEX | |
| | | |
| | | 39 |
Back to Contents
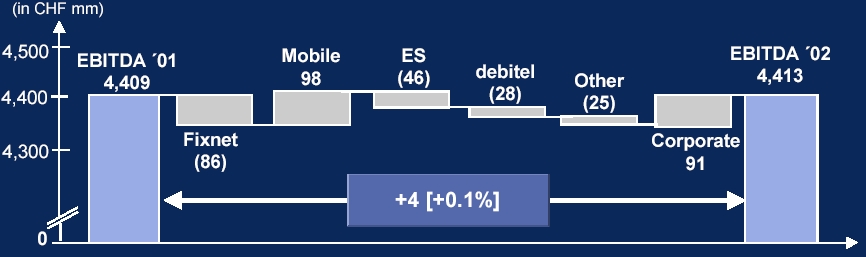
| Group EBITDA development | |
| |
| |
 |
| |
| in CHF mm | Fixnet | Mobile | ES | debitel | Other | Corporate | EBITDA |
2001
2002 | 1,989
1,903 | 1,876
1,974 | 114
68 | 187
159 | 136
111 | 107
198 | 4,409
4,413 |
% | (4.3%) | 5.2% | (40.4%) | (15.0%) | (18.4%) | 85.0% | 0.1% |
| |
EBITDA stable, and in line with guidance |
| |
| 40 |
Back to Contents
| | | | | |
| | Reported net income | | |
| | | | | |
| | | | | |
| | | | | |
| | (in CHF mm) | 2001 | 2002 | |
| | | | | |
| | | | | |
| | EBIT excluding exceptional items | 2,235 | 2,408 | |
| | | | | |
| | Exceptional items 1 | 3,275 | (702) | |
| | | | | |
| | | | | |
| | EBIT including exceptional items | 5,510 | 1,706 | |
| | | | | |
| |
|
|
| |
| | | | | |
| | Net financial result | (355) | (311) | |
| | | | | |
| | Income before income taxes, equity in net income
of affiliated companies and minority interest | 5,155 | 1,395 | |
| | | | | |
| |
|
|
| |
| | | | | |
| | Income tax benefit (expense) | 15 | (361) | |
| | | | | |
| | Equity in net income of affiliated companies | 32 | 95 | |
| | | | | |
| | Minority interest | (238) | (305) | |
| | | | | |
| | | | | | |
| | Net income | 4,964 | 824 | | |
| | | | | | |
| | | | | |
| | | | | |
| | 1 Exceptional items in 2001: impairment of goodwill CHF 1,130mm, gain on sale of real estate CHF 568mm and the gain on partial sale of Swisscom
Mobile CHF 3,837mm; exceptional item in 2002: impairment of goodwill CHF 702mm | |
| |
| |
| | | | | |
| Substantial lower net income due to lack of exceptional gains and
a further impairment of goodwill in 2002 | |
| | | | | 41 |
| | | | | |
Back to Contents
| | | | | | |
| | Adjusted net income | | | |
| | | | | | |
| | | | | | |
| | (in CHF mm) | 2001 | 2002 | | |
| | | | | | |
| | | | | | |
| | Net income | 4,964 | 824 | | |
| | | | | | |
| | Impairment of debitel goodwill | 1,130 | 702 | | |
| | | | | | |
| | Gain on sale of real estate portfolios | (568) | | | |
| | | | | | |
| | Gain on partial sale of Swisscom Mobile | (3,837) | | | |
| | | | | | |
| | Tax effect on exceptional items, net | (515) | (207) | | |
| | | | | | |
| | | | | | |
| | Adjusted net income | 1,174 | 1,319 | | |
| |
|
|
|
| |
| | | | | | |
| | Number of shares (in mm, at ye) | 73.55 | 66.2 | | |
| | | | | | |
| | Adjusted EPS (in CHF) | 15.96 | 19.92 | | |
| | | | | | |
| |
|
|
|
| |
| | | | | | |
| | | | | | |
| | Share buyback in 2002 led to an adjusted EPS accretion of 11% | | |
| | | | | | |
| | | | | | 42 |
Back to Contents
| | | |
| | | |
| | Reconciliation: loss under US GAAP resulting
from new rule on impairment accounting |
| | | |
| | | |
| | | | | | | | | | | | | |
| | | under IAS | | | under US GAAP | | | P+L impact | | |
| | (in CHF mm) | Goodwill | | | Goodwill | | Customer list | | | delta US
GAAP to IAS | | |
| | | | | | | | | | | | | |
| | Balance at YE '01 | 2,085 | | | 2,648 | | 174 | |  | | | |
 | | | | | | | |
| | Impairment because of new US GAAP standard | | | | (1,636) | | | (1,636) | | |
| | | | | | | | | | | |
| | Additions | (28) | | | 4 | | 8 | | | |
| | | | | | | | | | | |
| | Amortization '02 | (302) | | | (30) | | (81) | 191 | | |
| | | | | | | | | | | |
| | Balance at YE '02, before impairment '02 | 1,755 | | | 986 | | 101 | | | |
| | | | | | | | | | | |
| | Impairment '02 | 702 | | | (986) | | | (284) | | |
| | | | | | | | | | |
| |
| | Balance at YE '02, after impairment '02 | 1,053 | | | 0 | | 101 | | | (1,729) | | |
| | | | | | | | | | | | | |
| | | | | | | | | | | | | |
| | Fair value (€ 10/share) | 1,053 | | | 0 | | 1,053 | | | | | |
| | | | | | | | | | | | | |
| | | | | | | | | | | | | |
| | | | | | | | | |
| | Additional impairment and amortization charges for debitel goodwill due to
new US GAAP accounting standard leads to a net loss under US GAAP | |
| | | | | | | | | | | | |
| | | | | | | | | | | | | |
| | | | | | | | | | | | | 43 |
| | | | | | | | | | | | | |
Back to Contents
| | | |
| | | |
| | Group capital structure |
| | | |
| | | |
| | | | | | |
| | (in CHF mm) | 31.12.2001 | 31.12.2002 | | |
| | | | | | |
| | Short term debt | 1,757 | 1,016 | | |
| | | | | | |
| | Long term debt | 2,413 | 1,505 | | |
| | | | | | |
| | Interest bearing debt excl. finance lease | 4,170 | 2,521 | | |
| |
|
|
|
| |
| | Long term net finance lease obligation | 1,330 | 1,192 | | |
| | | | | | |
| | Less: financial assets from lease-and-leaseback transactions | (1,295) | (1,104) | | |
| | | | | | |
| | Less: cash, cash equivalents and securities | (7,104) | (1,967) | | |
| | | | | | |
| | | | | | |
| | Net (cash) debt | (2,899) | 642 | | |
| | | | | | |
| | | | | | |
| | Shareholders’ equity | 12,069 | 7,299 | | |
| | | | | | |
| | Balance sheet total | 24,349 | 16,958 | | |
| | | | | | |
| | | | | | |
| | Book leverage ¹ | (24.0)% | 8.8% | | |
| | | | | | |
| | Equity ratio ² | 49.6% | 43.0% | | |
| | | | | | |
| | | | | | |
| | | | |
| | Strong balance sheet ratios, offering opportunity to increase return to
shareholders - introduction of “return policy” | |
| | | | | |
| | | | | | |
| | | | | | |
| 1 | Book leverage = Net debt / Shareholders’ equity | | | | |
| 2 | Equity ratio = Shareholders’ equity / Total assets | | | | |
| | | | | | 44 |
| | | | | | |
Back to Contents
| | Q16. What’s the situation with your distributable reserves? | | |
| | | | |
| | | | |
| | | | |
| | | | | | | | | | | | |
| | | | | | | | | | | | |
| | | (in CHF mm) | Shareholders'
equity
Swisscom AG | | Share
capital | | non-
distributable
reserves | | distri-
butable
reserves | | |
| | | | | | | | | | | | |
| | | | | | | | | | | | |
| | | 31.12.2001 | 8,013 | | 1,250 | | 250 | | 6,513 | | |
| | |
|
|
|
|
|
|
|
| | |
| | | Dividend, PVR and SBB paid in 2002 | (5,521) | | (654 | ) | (131 | ) | (4,736 | ) | |
| | | | | | | | | | | | |
| | | Net income under Swiss GAAP | 1,599 | | | | | | 1,599 | | |
| | | | | | | | | | | | |
| | | 31.12.2002 before extra reserves | 4,091 | | 596 | | 119 | | 3,376 | | |
| | |
|
|
|
|
|
|
|
| | |
| | | | | | | | | | | | |
| | | Extra reserves created through change in accounting treatment of dividends from group companies | 1,125 | | | | | | 1,125 | | |
| | | | | | | | | | | | |
| | | 31.12.2002 before 2002 profit distribution | 5,216 | | 596 | | 119 | | 4,501 | | |
| | |
|
|
|
|
|
|
|
| | |
| | | | | | | | | | | | |
| | | Dividend in 2003 | (794) | | | | | | (794 | ) | |
| | | | | | | | | | | | |
| | | PVR in 2003 | (530) | | (530 | ) | (106 | ) | 106 | | |
| | | | | | | | | | | | |
| | | After 2002 profit distribution, before 2003 profits | 3,892 | | 66 | | 13 | | 3,813 | | |
| | | | | | | | | | | | |
| | | | | | | | | | | | |
| | | | | | | | | | | | |
| | | | | | | | | | | | |
| | | | | | | | | | | | |
| | | | | | | | | | | | |
| | | Effective distributable reserves increased,
supporting continuation of Return Policy over years to come | | |
| |
| |
| |
| 45 |
Back to Contents
| | Q17a. Pension fund: facts at YE 2002? | | |
| | | | |
| | 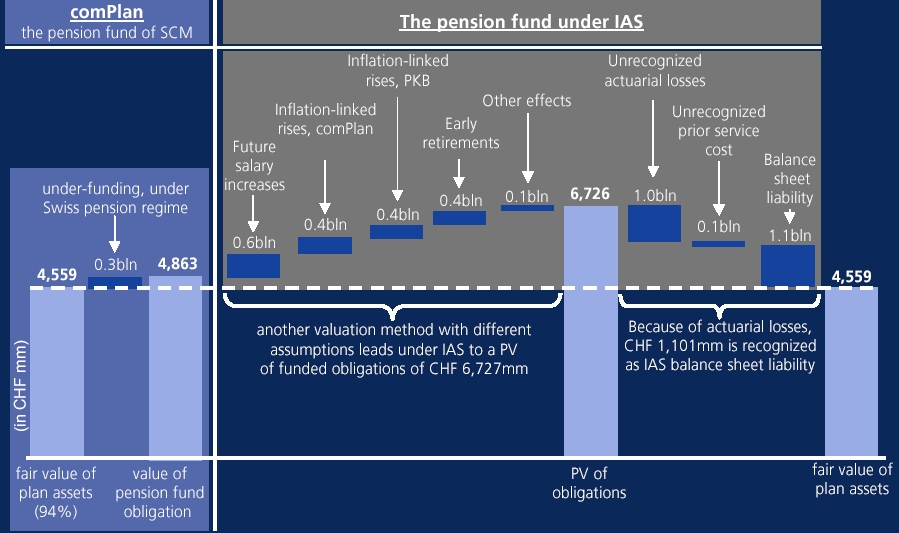 | |
| | | |
| | Under-funding under Swiss pension regime of CHF 304mm
(represents a 94%-coverage) determines future CF impact | |
| | | 46 |
| | | |
Back to Contents
| | Q17b. Pension fund: implications? | | |
| | | | |
| | | | From the difference under IAS between the PV of funded obligations and the fair value of plan assets, legally only the under-funding of CHF 304mm determined by Swiss pension regime requires further financing measures |
| | | | | |
| | | | There are different ways to finance the under-funding of CHF 304mm: |
| | | | | |
| | | | — | | increased contributions from Swisscom, |
| | | | | | |
| | | | — | | higher employee's contribution, |
| | | | | | |
| | | | — | | changed pension fund benefits and / or |
| | | | | | |
| | | | — | | improvement of the plan's rate of return |
| | | | | | |
| | | | No decision to be expected before summer 2003 |
| | | | |
| | | | Impact on annual results 2003: | |
| | | | | | | | |
| | | | — | | P&L: | max CHF 50mm, from | |
| | | | | | | | |
| | | | | | | — a) recognition of actuarial losses | |
| | | | | | | | |
| | | | | | | — b) change in assumptions of the expected rate of return on plan assets | |
| | | | | | | | |
| | | | — | | CF: | max CHF 15mm per %-point increase in employer contribution | |
| | | | | | | | |
| | | | | | | subject to decision of the pension fund committee | |
| | | | | | | | 47 |
| | | | | | | | |
Back to Contents
| |  | |
| | | |
| | ¹ Compared to 2002 | |
| | | |
| | | |
| | Outlook 2002 - striving for CHF 4,4bn EBITDA | |
| | | 48 |
| | | |
Back to Contents
| | | |
| | | |
| | Thank you for your attention! (Other) Questions & Answers For further information, please contact:
Swisscom - Investor Relations
phone +41 31 342 2538
fax +41 31 342 6411
or visit our homepage: www.swisscom.com/ir | |
| | | |
| | | |
| | | 49 |
| | | |
Back to Contents
| | | |
| | | |
| | Analyst meeting
Annual results 2002 “back-up slides”
handout at analyst meeting 26 March 2003, Zurich | |
| | | |
| | | |
| | | 1 |
| | | |
Back to Contents
| | | |
| | | |
| | | |
| |  | |
| | | |
| | | |
| | | 2 |
| | | |
Back to Contents
| | | |
| | | |
| | | |
| | | |
| | 1. Swisscom Fixnet | |
| | | |
| | | |
| | | |
| | | |
| | | 3 |
| | | |
Back to Contents
| | | | | |
| | | | | |
| | Stabilized decline in Fixnet revenues | |
| | | | | |
| |  | | | |
 |
| |  | Price increase ISDN light | |
| | | Hard mobile substitution | |
| | | | |
| | | Increased F2M traffic | |
| | | Introduction renumbering plan | |
| | | Market share losses, surf effect1 and mobile subs. | |
| | | | |
| | | Higher volumes WS and ADSL growth | |
| | | Lower LRIC pricing | |
| | | | |
| | | ADSL growth | |
| | | Price reduction cards and shrinking use of 111 | |
| | | | |
| | | Reduction volumes and prices voice traffic | |
| | | Price reduction leased lines | |
| | | | |
| | | | |
| | | | |
| | | | |
| | | | |
| | | | |
| | | | |
| | | | |
| | | 1 Shift to VAS | |
| | | | |
| | | | 4 |
| | | | |
Back to Contents
| | | | |
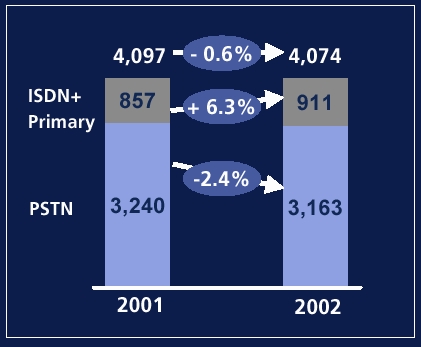
| | Penetration still very high, but access substitution
due to mobile starting to become visible | |
Back to Contents
| | | | |
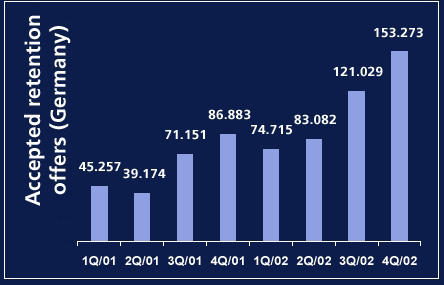
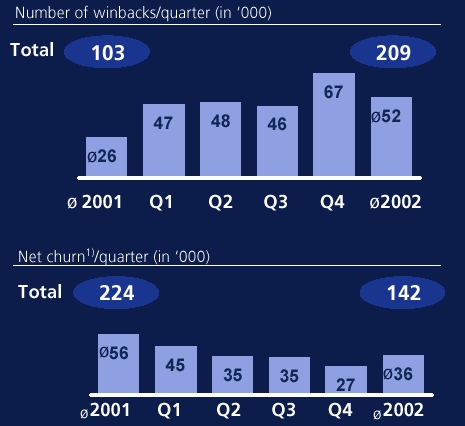
| | Stabilized traffic market shares | |
| | | | | |
| | | | | |
| | Overall market share stabilized
at 59%1 | | Substantial additional win-backs achieved, net-churn reduced | |
| | | | | |
| |  | | 
| |
| | | | | | |
| | 1 Estimated values | | | | |
| | | | | | 6 |
| | | | | | |
Back to Contents
| | | | |
| | Improved Service to the customer | |
| | | |
| | Substantial improvements in Customer Care | |
| | | |
| | | | 2001 | | 2002 | |
| | | |
| |
| | | First resolution rate
— fulfillment
— assurance |
N.A.
60% |  |
90%
80% | |
| | | | | | | |
| | | Response time high
value customers | 90 secs1) | | <20 sec's for 80% | |
| | | | | | | |
Back to Contents
| | |
| | Tight OPEX control: OPEX reduced, despite increased restructuring costs |
| | |
| | |
| |  | | Description | |
| |
| |
| | | | Headcount reduction (>600 FTE’s) | |
| | | | Increased restructuring charges (CHF 50mm higher than in 2001) | |
| | | | | |
| | | | Reduced mobile termination costs | |
| | | | Reduced international termination costs | |
| | | | | |
| | | | Reduced network maintenance costs | |
| | | | Reduced IT-infrastructure costs | |
| | | | Reduced marketing costs | |
| | | | | | |
| | | | | | 8 |
| | | | | | |
Back to Contents
| | |
| | Reduced CAPEX while growing in new businesses | |
| | | |
Back to Contents
| | |
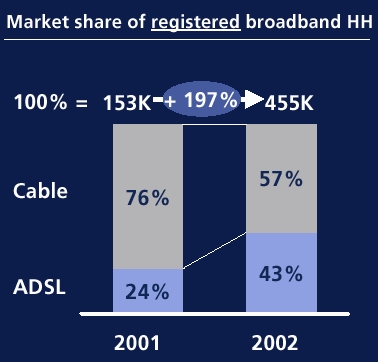
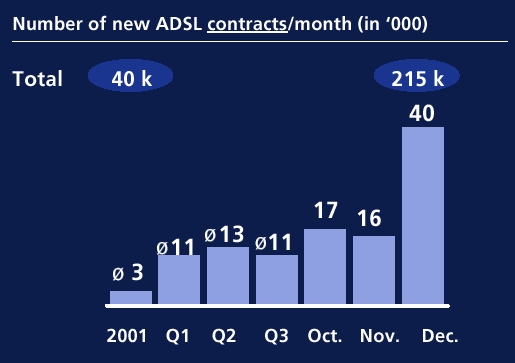
| | Strong ADSL growth, surpassed the inflection point of maximum cash exposure | |
| | | |
| | | |
| | ADSL growing faster
than cable | | Aggressive growth last months of 2002 to exceed 215 k contracts signed1 | |
| | | | | |
| | | | 1 ADSL connections in operation per YE 2002: 195k | |
| | | | | |
| | | | | |
| | | | | 10 |
| | | | | |
Back to Contents
| | |
| | Bluewin secured leadership | |
| | | |
| | Despite aggressive broadband growth sustained narrowband leadership | |
| | | |
| | | | | |
| | | | | |
| | Portal Reach2 : re-confirmed market leadership | |
| | | | | |
| | | | | | | | 2nd | | Microsoft.com | 21.9% | |
| | 1st | | Bluewin.ch | 28.9% | |  | | | | | |
 | | 3rd | | Google.ch | 21.4% | |
| | 1 Estimated. Source: Swiss Press, Swissable report | | | | | | | |
| | 2 Nielsen/Netrating, December 2002 | | | | | | | |
| | | | | | | | | | | | |
| | | | | | | | | | | | 11 |
| | | | | | | | | | | | |
Back to Contents
Back to Contents
Back to Contents
| | High management attention to improve cost efficiencies |
| | | | | | |
| | | | | | |
| | Breakdown of costs | | Comments | |
| | | | | | |
| |  | | | Network and interconnection cost stable although traffic increased | |
| | | | | |
| | | | SAC at CHF 212mm reduced by 15%, SRC doubled to CHF 141mm | |
| | | | | |
| | | | Total COGS down to 34% of revenue (35% in 2001) | |
| | | | | |
| | | | Further investment in staff to 2,359 FTE’s to push new business opportunities (UMTS, WLAN, Mobile Solutions) | |
| | | | | |
| | | | | |
| | | | | | 14 |
| | | | | | |
Back to Contents
| | | | | |
| | | | | |
| | Strict customer focus to provide superior quality | |
| | | | | |
| | | USP network quality: |  | |
| | | – | We offer to our customers all state-of-the-art technologies on mobile communication such as GSM, GPRS, UMTS, WLAN at the best coverage within Switzerland and abroad. | |
| | | | | | |
| | | USP customer service: |  | |
| | | – | We offer to our customers at all touch points such as shops, call centers and communication a superior service with an emotional touch. | |
| | | | | | |
| | | USP products: |  | |
| | | – | We offer for customers the broadest range of products fitting to their needs both on business and leisure. We are the leader in innovation on messaging services and mobile solutions. | |
| | | | | | |
| | | | | | |
| | | | | | 15 |
| | | | | | |
Back to Contents
| | | |
| | | |
| | | |
| | 3. debitel | |
| | | |
| | | |
| | | |
| | | |
| | | 16 |
| | | |
Back to Contents
Back to Contents
| | | | | |
| | Strengthening of distribution power through
attractive distribution program | |
| | | | | |
| | 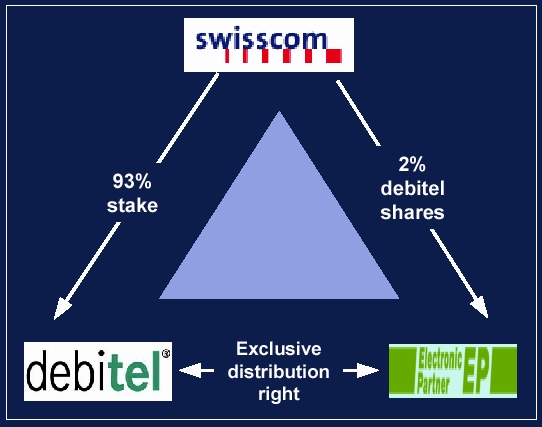 | | | |
| | | Extension of the exclusive distribution contract with EP: for five more years (Germany); EP: took a 2%-stake in debitel; retention programme open for further sales partners | |
| | | | |
| | | Co-operation with additional sales channels such as Ringfoto (Germany) | |
| | | | |
| | | Acquisition of Videlec and Télécom Option (France), Tiscali (Denmark) | |
| | |
| | | | | 18 |
| | | | | |
Back to Contents
| | 3G | | | |
| | | | | | |
| | Current status - ESP implementation | |
| | | | | | |
| | | Implementation of ESP model in Germany on track | |
| | | – | | First company to offer content billing | |
| | | – | | Specified access to network operators' infrastructure ensured by ESP-contracts | |
| | | – | | Advanced product and service development of Jamba! | |
| | | – | | Technical ability of hosting platforms such as portal platform | |
| | | | | | |
| | | Roll out of ESP-model in Slovenia and the Netherlands | |
| | | – | | ESP contract with KPN mobile and extended cooperation agreement with O2 (The Netherlands) | |
| | | – | | extended Cooperation agreement with Mobitel (Slovenia) | |
| | | | | | |
| | | | | | |
| | | | | | 19 |
| | | | | | |
Back to Contents
| | 3G | | |
| | | | | |
| | ESP model - general conditions for further implementation | |
| | | | | |
| | Secure debitel’s positioning regarding the German regulatory framework for UMTS | |
| | | – | debitel is actively involved to review German telecommunication law | |
| | | | | |
| | | Ability of billing various services and contents | |
| | | – | implementation of new billing system to cover various tariffs and products on the way | |
| | | | | |
| | | Ability to design products and mobile value added services and to extend service offerings | |
| | | – | develop “answer” to network operators portal strategy in line with ESP-strategy | |
| | | – | launch of own MMS-services | |
| | | | | |
| | | | | |
| | | | | 20 |
| | | | | |
Back to Contents
| | | | |
| | | | | |
| | Product / service development | |
| | | | | |
| | | | | |
| | | Extension of debitel mobile service offerings: | |
| | | – | Multi-Media Messaging Services (MMS) | |
| | | – | in addition to own portal (Jamba!) access to network operator portals such as i-Mode, Vodafone Life! | |
| | | – | launch of “partner card” (2 SIM-cards, 1 monthly fee) across different networks | |
| | | – | innovative tariffs such as “debitel Automatic in Denmark” (monthly fee will automatically decreased according to usage) | |
| | | | | |
| | | Content billing for Jamba!/debitel and third parties (e.g. Club Nokia, Microsoft Network Online) | |
| | | | | |
| | | Further service developments follow ESP strategy | |
| | | | | |
| | | | | |
| | | | | 21 |
| | | | | |
Back to Contents
Back to Contents
Back to Contents
| | Operational performance 2002 | |
| | | | | | | | | |
| | Swisscom Systems | | Swisscom IT Services | |
| | |
| | |
| | | | | | | |
| | | Operational performance | | Completed PMI process below assumed costs | |
| | | – | approx. 3,000 PBX sold and 90,000 rent and maintain contracts |
| Market growth below expectations generated high price pressure | |
| | | Market development |
| | | – | Swisscom Systems suffered from a declining demand for network and telephony equipment caused by the deteriorating economic situation, which has led many customers to postpone new investments in telecommunications equipment. | | Above market growth of external revenue although missing external revenue target | |
| EBIT target exceeded | |
| Adjusted resources according to weak market demand | |
| Further cost improvement measures identified through benchmarks | |
Back to Contents
| | | |
| | Product-/service development | |
| | | |
| | Swisscom Systems | |
| | | | |
| | | Successfully introduced IP-based systems and system extensions of major suppliers (Siemens, Nortel, Ascom) to serve those customers who need a VoIP or integrated Voice/VoIP infrastructure | |
| | | | |
| | | The product line of Alcatel was introduced to the portfolio as an alternative to Ascom in the small customer segment | |
| | | | |
| | | With the purchase of a CTI / Unified Messaging solution for MS Outlook Swisscom Systems can offer an add-on solution to its customers in the strategically important overlap between desktop computing and telephony | |
| | | | |
| | | | |
| | | | |
| | Swisscom IT Services | |
| | | | |
| | | Redefined existing solution sets to meet market requirements and demand | |
| | | | |
| | | Defined portfolio across 3 key trends in the Swiss market:
— business integration
— business mobility
— IT - outstanding | |
| | | | |
| | | Focusing industry verticals: financial services, telecom | |
| | | | |
| | | Assessing opportunities in new industry verticals: healthcare, insurance, government | |
| | | | |
| | | | |
| | | | 25 |
| | | | |
Back to Contents
| | | |
| | | |
| | | |
| | 5. Group Financials | |
| | | |
| | | |
| | | 26 |
| | | |
Back to Contents
| | | |
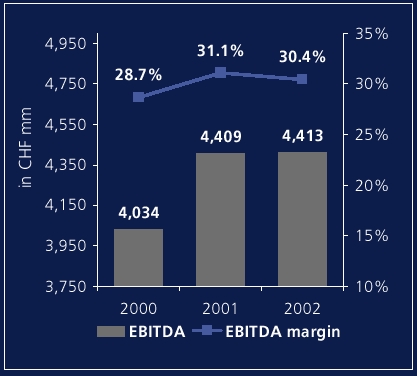
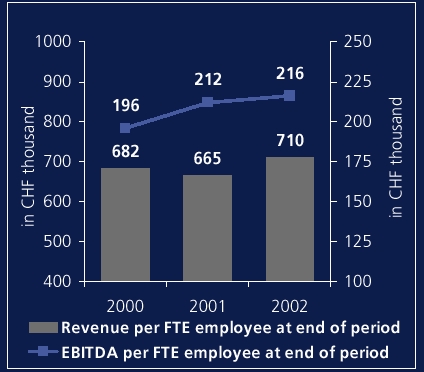
| | Solid operating performance ... | |
| | | |
| | EBITDA and margins | | Per employee ratios1 | |
| | | | | |
| |  | |  | |
| | | | | |
| | | | 1 FTE employee numbers at end of period: 20,604 (2000), 20,835 (2001) and 20,471 (2002) | |
| | | | | |
| | | | | |
| | | | | 27 |
| | | | | |
Back to Contents
| | | |
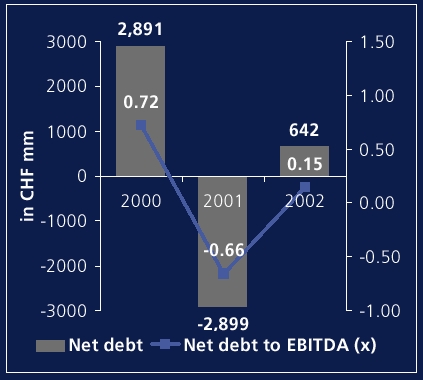
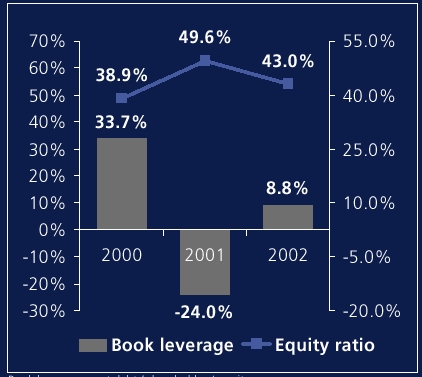
| | ... and ongoing healthy balance sheet | |
| | | |
| | Net debt and net debt/EBITDA | | Book leverage and equity ratio | |
| | | | | |
| |  | |  | |
| | | | | |
| | | | Book leverage = net debt / shareholders’ equity
Equity ratio = shareholders’ equity / total assets | |
| | | | | |
| | | | | |
| | | | | 28 |
| | | | | |
Back to Contents
| | |
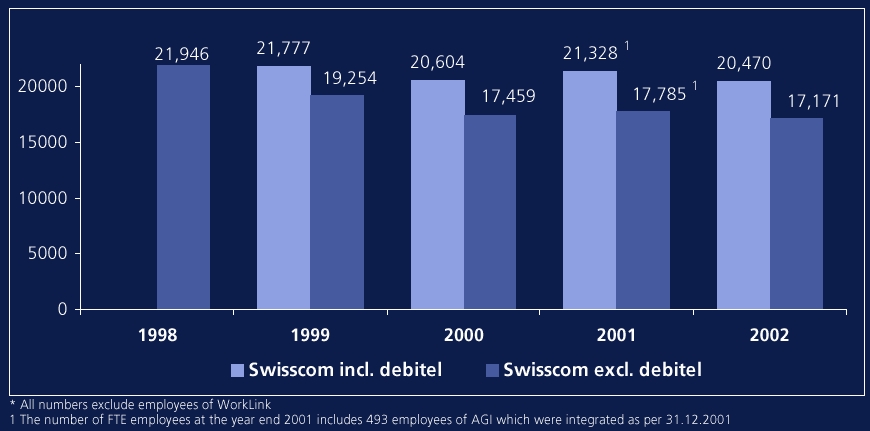
| | Headcount development | |
| | | |
| | | |
| |  | |
| | | |
| | | 29 |
| | | |
Back to Contents
Back to Contents
| | | |
| | Impairment of debitel goodwill, under IAS | | |
| | | | |
| | | | |
| | (in CHF mm) | Goodwill | |
| | | | |
| | Book value of debitel as per 31.12.2001, € 18 | 2,084 | |
| |
|
| |
| | | | |
| | Amortisation of goodwill | (265) | |
| | Impairment of goodwill | (702) | |
| | Other adjustments, net | (64) | |
| | | | |
| | Book value of debitel [93%] as per 31.12.2002, € 10 | 1,053 | |
| |
|
| |
| | | | |
| | Future amortisation p.a. | 156 | |
| |
|
| |
| | | | |
| | | | |
| | | | 31 |
| | | | |
Back to Contents
| | |
| | Drivers of financial result | | |
| | | | |
| | | | |
| | Financial expense 2002 | | Financial income 2002 | |
| | | | | | | |
| | (in CHF mm) | | | (in CHF mm) | | |
| |
|
| |
|
| |
| | Interest on debt and finance lease | 246 | | Interest | 168 | |
| | PV adjustment on accrued liabilities | 25 | | Dividends | 8 | |
| | Impairment charge on Infonet | 111 | | Gain on CB tax lease transactions | 28 | |
| | Impairment charge on Swiss | 41 | | Other | 2 | |
| | Currency losses | 71 | | | | |
| | Other | 23 | | | | |
| | | | | | | |
| | Total financial expense | 517 | | Total financial income | 206 | |
| | | | | | | |
| | | | | | | |
| | | | | | | 32 |
| | | | | | | |
Back to Contents
| | |
| | Overview of income tax payments | | | | | | | | | | |
| | | | | | | | | | | | |
| | | | | | | | | | | | |
| | | 1998 | | 1999 | | 2000 | | 2001 | | 2002 | |
| | | | | | | | | | | | |
| | P+L Statement | | | | | | | | | | |
| | Current income tax expense | 409 | | 317 | | 439 | | 499 | | 123 | |
| | Deferred income tax (benefit) expense | (90) | | 218 | | 201 | | (514) | | 238 | |
| | Total income tax expense | 319 | | 535 | | 640 | | (15) | | 361 | |
| |
|
|
|
|
|
|
|
|
|
| |
| | CF Statement | | | | | | | | | | |
| | Income taxes paid | 26 | | 135 | | 398 | | 678 | | 537 | |
| |
|
|
|
|
|
|
|
|
|
| |
| | Balance Sheet | | | | | | | | | | |
| | Current tax liabilities, net | 225 | | 457 | | 519 | | 359 | | -57 | |
| |
|
|
|
|
|
|
|
|
|
| |
| | Difference between current and paid income taxes | 383 | | 182 | | 41 | | -179 | | -414 | |
| | | | | | | | | | | | |
| | | | | | | | | | | | |
| | | | | | | | | | | | 33 |
| | | | | | | | | | | | |
Back to Contents
|
| | Tax calculation 2002 | | | | | | | | | | |
| | | | | | | | | | | | |
| | | | | | | | | | | | |
| | (in CHF mm) | EBT1 | | Income tax expense | | Tax rate | |
| | | | | | | | | | | | |
| | | | | current | | deferred | | total | | | |
| | | | | | | | | | | | |
| | reported numbers | 1,395 | | 123 | | 238 | | 361 | | 25.9% | |
| | | | | | | | | | | | |
| |
|
|
|
|
|
|
|
|
|
| |
| | | | | | | | | | | | |
| | Result of the transition from a parent company to a holding company, net | | | | | (115) | | (115) | | | |
| | | | | | | | | | | | |
| | Impairment of debitel goodwill | 702 | | 127 | | 80 | | 207 | | | |
| | | | | | | | | | | | |
| |
|
|
|
|
|
|
|
|
|
| |
| | | | | | | | | | | | |
| | adjusted numbers | 2,097 | | 240 | | 213 | | 453 | | 21.6% | |
| | | | | | | | | | | | |
| | 1 EBT = earnings before taxes | | | | | | | | | | |
| | | | | | | | | | | | |
| | | | | | | | | | | | 34 |
| | | | | | | | | | | | |
Back to Contents
|
| | Group cash flow statement (I) | | | | |
| | | | | | | |
| | | | | | | |
| | (in CHF mm) | 2001 | | 2002 | |
| | | | | | | |
| | EBITDA | 4,409 | | 4,413 | |
| |
|
|
|
|
| |
| | | Change in working capital, net | 275 | | 2 | |
| | | Payments for early retirements | (225) | | (43) | |
| | | Special contribution to pension fund | (440) | | | |
| | | Net interests | 48 | | (78) | |
| | | Income taxes paid | (678) | | (537) | |
| | | Gain from cross-border tax lease transactions | | | 28 | |
| | | | | | | |
| | | Net cash provided by operating activities | 3,389 | | 3,785 | |
| | | | | | | |
| | | | | | | |
| | | | | | | 35 |
| | | | | | | |
Back to Contents
| | | |
| | Group cash flow statement (II) | | | | |
| | | | | | |
| | | | | | |
| | (in CHF mm) | 2001 | | 2002 | |
| | | | | | |
| | Net cash provided by operating activities | 3,389 | | 3,785 | |
| |
|
|
|
| |
| | CAPEX | (1,234) | | (1,222) | |
| | Proceeds from sale of real estate | 1,734 | | | |
| | Proceeds from partial sale of Swisscom Mobile | 4,282 | | | |
| | Proceeds from sale of affiliated companies | 73 | | 42 | |
| | Investments, net | (894) | | (92) | |
| | Purchase (sale) of current financial assets, net | (3,059) | | 2,896 | |
| | Other cash flows from investing activities, net | (53) | | (52) | |
| | Net cash from investing activities | 849 | | 1,572 | |
| |
|
|
|
| |
| | Net cash used in financing activities | (2,709) | | (7,454) | |
| | Net increase (decrease) in cash and cash equivalents | 1,529 | | (2,097) | |
| | Cash and cash equivalents at the end of the perios | 3,788 | | 1,682 | |
| | | | | | |
| | | | | | |
| | | | | | 36 |
| | | | | | |
Back to Contents
Back to Contents
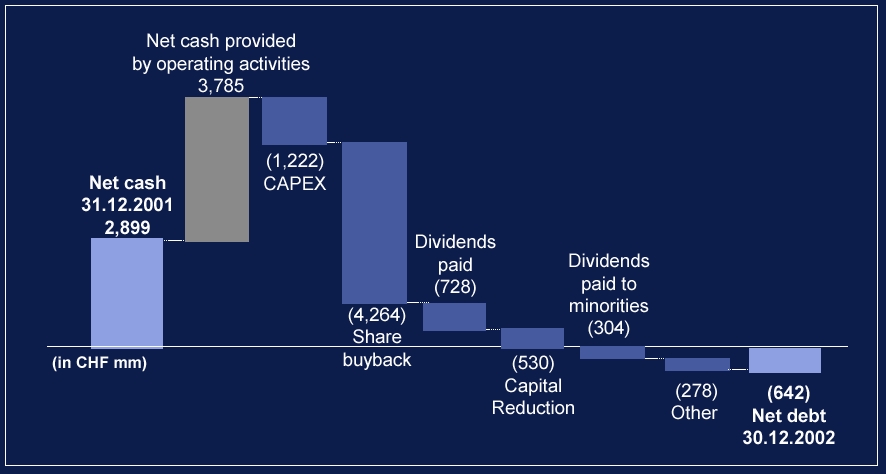
| | |
| | Change of net debts | |
| | | |
| | | |
| | | |
| | | |
| | | |
| | | 38 |
| | | |
Back to Contents
SIGNATURES
Pursuant to the requirements of the Securities Exchange Act of 1934, the registrant has duly caused this report to be signed on its behalf by the undersigned, thereunto duly authorized.
| Dated: April 1, 2003 | by:
Name:
Title: | /s/ Stephan Wiederkehr
Stephan Wiederkehr
Senior Counsel
Head of Corporate & Financial Law |