UNITED STATES
SECURITIES AND EXCHANGE COMMISSION
Washington, D.C. 20549
FORM N-CSR
CERTIFIED SHAREHOLDER REPORT OF REGISTERED
MANAGEMENT INVESTMENT COMPANIES
Investment Company Act file number: 811-09025
NEW COVENANT FUNDS
(Exact name of registrant as specified in charter)
200 EAST TWELFTH STREET
JEFFERSONVILLE, IN 47130
(Address of principal executive offices) (Zip code)
BISYS FUND SERVICES
3435 STELZER ROAD
COLUMBUS, OH 43219
(Name and address of agent for service)
Registrant’s telephone number, including area code: 1-800-858-6127
Date of fiscal year end: June 30, 2006
Date of reporting period: June 30, 2006
Form N-CSR is to be used by management investment companies to file reports with the Commission not later than 10 days after the transmission to stockholders of any report that is required to be transmitted to stockholders under Rule 30e-1 under the Investment Company Act of 1940 (17 CFR 270.30e-1). The Commission may use the information provided on Form N-CSR in its regulatory, disclosure review, inspection, and policymaking roles.
A registrant is required to disclose the information specified by Form N-CSR, and the Commission will make this information public. A registrant is not required to respond to the collection of information contained in Form N-CSR unless the Form displays a currently valid Office of Management and Budget (“OMB”) control number. Please direct comments concerning the accuracy of the information collection burden estimate and any suggestions for reducing the burden to Secretary, Securities and Exchange Commission, 450 Fifth Street, NW, Washington, DC 20549-0609. The OMB has reviewed this collection of information under the clearance requirements of 44 U.S.C. § 3507.
Item 1. Reports to Stockholders.
Include a copy of the report transmitted to stockholders pursuant to Rule 30e-1 under the Act (17 CFR 270.30e-1).
You can get free copies of reports and the SAI, or request other information and discuss your questions about the Funds by contacting a broker that sells the Funds, or by contacting the Funds at:
New Covenant Funds
3435 Stelzer Road
Columbus, OH 43219
Telephone: 1-800-858-6127
Internet: http://www.newcovenantfunds.com
You can review and get copies of the Funds’ reports and SAI at the Public Reference Room of the Securities and Exchange Commission. You can get text-only copies:
| • | | For a duplicating fee, by writing the Public Reference Section of the Commission, Washington, DC 20549-6009 or calling 1-202-942-8090, or by electronic request, by e-mailing the SEC at the following address: publicinfo@sec.gov |
| |
| • | | Free from the Commission’s website at http://www.sec.gov. |
to our shareholders
NEW COVENANT FUNDS
June 30, 2006
Dear Shareholders:
The economy generated healthy growth during the 12-month period between July 1, 2005 and June 30, 2006. Stocks posted solid returns for the year, although the market became increasingly volatile late in the period, and bonds generally retreated.
Economic growth fluctuated throughout the fiscal year 2006. The economy expanded briskly during the summer of 2005, supported by increases in corporate spending. The after-effects of Gulf Coast hurricanes, including a spike in already-high energy prices, combined with rising interest rates to restrain consumer and business spending for the rest of 2005. During the first three months of 2006, the economy expanded rapidly as energy prices retreated and a warm winter boosted home construction. Growth then slowed during the spring, due to the effects of higher interest rates and energy prices.
Oil and gasoline prices were generally high throughout the period. Economic strength around the world, particularly in the fast growing, oil-thirsty Chinese economy, increased demand for energy. Meanwhile, fears of supply disruptions, due largely to conflicts in the Middle East and Africa, caused speculators to bid up the price of crude oil. Steep oil and gasoline prices slowed the economy and led to higher prices on energy-intensive products such as food and transportation.
The Federal Reserve Board raised short-term interest rates nine times during the 12 months through June, each time by 0.25 percentage points, pushing the Federal Funds rate to 5.25% by the end of the period. Those actions continued a series of quarter-point interest-rate hikes at every Federal Reserve meeting since June of 2004. That policy was designed to combat the inflationary pressures resulting from strong economic growth and high energy prices. A new Chairman, Ben Bernanke, assumed leadership of the Federal Reserve in early 2006.
The economic environment during the 12-month period proved difficult for consumers, particularly those with lower incomes, as higher energy costs reduced disposable income and higher interest rates increased borrowing costs. Reduced consumer spending was offset by increased corporate spending. Corporations enjoyed strong balance sheets and good free cash flows, and increasingly sought ways to invest that money—in many cases by engaging in mergers and acquisitions.
Stocks posted strong gains through early May, and then pulled back amid volatile trading. The Standard & Poor’s 500 Composite Index (the “S&P 500” or the “S&P 500 Index”)1 returned 8.62% for the period as a whole, slightly lower than long-term averages.
The broad market generated gains early in the period. Stocks pulled back in early fall as investors worried that dramatically higher energy prices would weaken consumer spending, thereby undercutting economic growth and corporate profits. But the economy and profits proved resilient, and the market rallied between October and early May. The market sold off again in late spring, as investors worried that rising inflation would persuade the Federal Reserve to raise interest rates enough to slow the economy to a standstill. Stock prices were very volatile through the remainder of the period, as investors tried to weigh economic data and comments from the new Federal Reserve chairman. Stocks recovered somewhat by the end of June, as fears about inflation moderated.
Small- and mid-cap stocks and foreign equities led the way during the market’s rally, with emerging-markets stocks posting some of the strongest gains. Those leading stock categories generally fell the furthest when the market declined in late spring. Stocks in emerging markets especially suffered from the reversal of Japan’s 0% interest rate policy, which threatened to reduce growth in many Asian markets. Nevertheless, smaller stocks and foreign shares outperformed their larger, domestic counterparts for the period as a whole. Energy was the best-performing sector, as higher prices for oil and gasoline improved profits at energy firms. That trend helped value indices outperform growth indices.
Bonds declined slightly during the period. The Federal Reserve’s interest-rate increases contributed to higher yields on fixed-income securities, which led to lower prices on existing bonds. The bond market experienced a slightly inverted yield curve early in late 2005, an uncommon condition in which short-term bonds offer higher yields than longer-term bonds. That development reflected the market’s uncertainty about how the new Federal Reserve chairman would handle a difficult environment of rising inflation and potentially slower economic growth. But the yield curve subsequently flattened, and then yields rose on bonds of all term lengths. Corporate bonds and mortgage-backed securities outperformed government bonds during the period.
The New Covenant Growth Fund
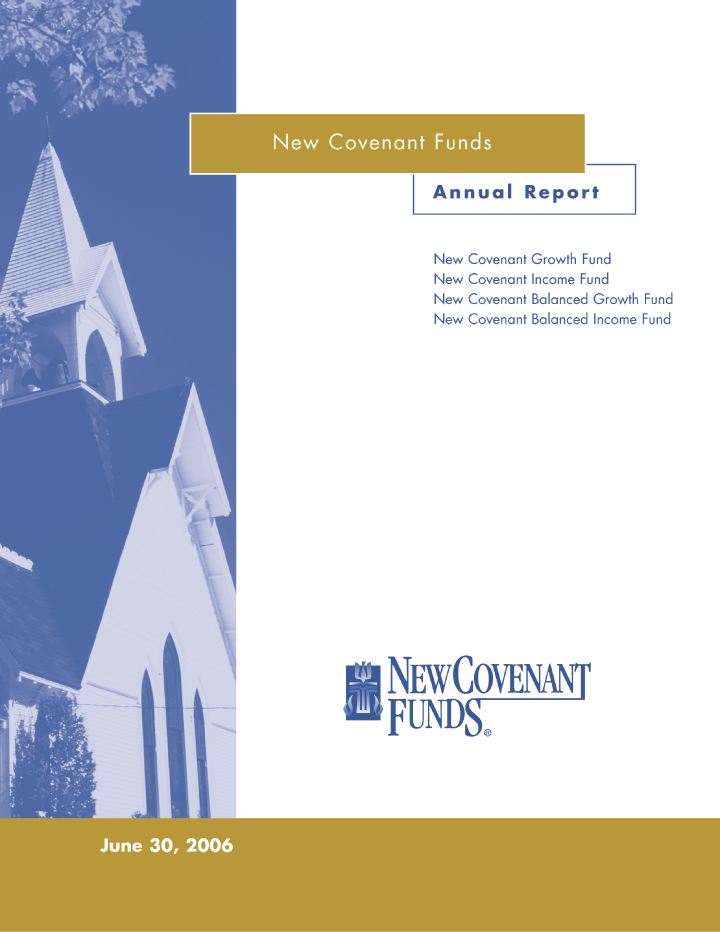
The New Covenant Growth Fund gained 10.17% during the 12-month period ended June 30, 2006. That compared to an 8.62% return for the Fund’s benchmark, the S&P 500 Index.
This Fund invests the majority of its assets in a core portfolio, and adds satellite portfolios of value, growth and international stocks to provide shareholders with greater diversification. The Fund also spreads its assets among small-, mid- and large-cap shares to gain exposure to various sectors of the equity market.2
The Fund’s exposure to international stocks, including emerging-markets shares, boosted returns relative to the benchmark during the 12-month period. The Fund generally held between 13% and 15% of assets in foreign stocks, including 2% to 3% of assets in emerging markets. Those allocations helped shareholders benefit from the strong run-up in foreign shares that occurred during much of the fiscal year. The Fund’s roughly 30% allocation to small- and mid-cap stocks also improved returns against the S&P 500, as smaller stocks outperformed larger stocks. The declines in foreign shares and smaller stocks toward the end of the period decreased the magnitude of the Fund’s superior performance relative to the benchmark. 2
The New Covenant Income Fund
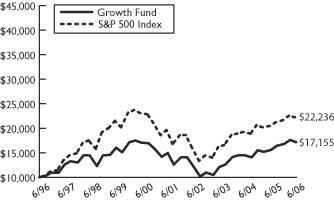
The New Covenant Income Fund returned -0.90% during the 12-month period ended June 30, 2006. That net return nearly matched the -0.81% return of the Fund’s benchmark, the Lehman Brothers Aggregate Bond Index.3
The Fund’s Sub-Advisor held the Fund’s duration shorter than that of its benchmark throughout the period, but gradually reduced the duration gap to capture higher yields as interest rates rose. That strategy helped relative returns. The Fund’s relative performance also benefited early in the period from employing a structure known as a “barbell”, in which the portfolio emphasized bonds on either end of
2
to our shareholders
NEW COVENANT FUNDS
June 30, 2006
the yield curve and held few intermediate-term securities. The Sub-Advisor gradually unwound that barbell structure during the period by adding intermediate-term securities. Finally, effective selection among mortgage-backed securities improved performance relative to the benchmark.2
The New Covenant Balanced Growth Fund
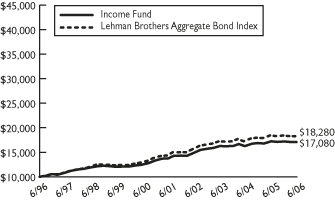
The New Covenant Balanced Growth Fund gained 5.93% during the 12-month period ended June 30, 2006. That compared to a 4.83% return for its benchmark, a composite index that is comprised of a 60% weighting in the S&P 500 and a 40% weighting in the Lehman Brothers Aggregate Bond Index.
The Fund held a slightly overweight stock allocation throughout the period. That positioning helped the Fund outperform its composite benchmark, as stocks outperformed bonds and the Fund’s equity allocation out-gained the S&P 500. As of June 30, 2006, the Fund held 62.1% of its assets in the New Covenant Growth Fund and 37.1% in the New Covenant Income Fund. 2
The New Covenant Balanced Income Fund
The New Covenant Balanced Income Fund gained 3.26% during the 12-month period ended June 30, 2006. That compared to a 2.47% return for its benchmark, a composite index with a 35% allocation to the S&P 500 Index and a 65% allocation to the Lehman Brothers Aggregate Bond Index.
Like the Balanced Growth Fund, the Balanced Income Fund held a slightly overweight allocation to stocks during the 12-month period. The Fund, as of June 30, 2006, held 36.8% of its assets in the New Covenant Growth Fund, with 60.8% of assets in the New Covenant Income Fund. That overweight stake in equities helped the Fund outperform its benchmark for the period, as did the strong relative performance of the New Covenant Growth Fund. 2
Thank you for your confidence in the New Covenant Funds.

George W. Rue III
Senior Vice President and Chief Investment Officer
NCF Investment Department of New Covenant Trust Company, N.A.
4Past performance does not guarantee future results. The performance data quoted represents past performance and current returns may be lower or higher. Total return figures include change in share price, reinvestment of dividends and capital gains. The investment return and principal value will fluctuate so that an investor’s shares, when redeemed, may be worth more or less than the original cost. Returns do not reflect the deduction of taxes that a shareholder would pay on Fund distributions or redemptions of fund shares. To obtain performance information current to the most recent month end, please call 877-835-4531 or visit our website at www.NewCovenantFunds.com.
| 1 | | The Standard & Poor’s 500 Composite Index of stocks is an unmanaged, capitalization weighted index that measures the performance of 500 large-capitalization stocks representing all major industries. It is not possible to invest directly in any index. |
| |
| 2 | | Portfolio composition is subject to change. |
| |
| 3 | | The Lehman Brothers Aggregate Bond Index is an unmanaged index of U.S. bonds, which includes reinvestment of any earnings. It is widely used to measure the overall performance of the U.S. bond market. It is not possible to invest directly in any index. |
| |
| 4 | | A subsidiary of the Presbyterian Foundation. |
Portfolio Allocation (unaudited) (subject to change)
GROWTH FUND:
| | | | | |
| | | Percentage of |
| Security Allocation | | Market Value |
| |
| Financials | | | 20.1 | % |
| Information Technology | | | 18.0 | % |
| Health Care | | | 16.2 | % |
| Industrials | | | 13.3 | % |
| Consumer Discretionary | | | 12.7 | % |
| Energy | | | 8.2 | % |
| Consumer Staples | | | 5.9 | % |
| Telecommunication Services | | | 2.2 | % |
| Materials | | | 1.9 | % |
| Utilities | | | 1.5 | % |
| |
| Total | | | 100.0 | % |
BALANCED GROWTH FUND:
| | | | | |
| | | Percentage of |
| Security Allocation | | Market Value |
| |
| New Covenant Growth Fund | | | 62.1 | % |
| New Covenant Income Fund | | | 37.1 | % |
| Cash Equivalents | | | 0.8 | % |
| |
| Total | | | 100.0 | % |
INCOME FUND:
| | | | | |
| | | Percentage of |
| Security Allocation | | Market Value |
| |
| Government Agency/MBS | | | 49.0 | % |
| Non-Government Agency/MBS | | | 17.0 | % |
| Corporates | | | 16.0 | % |
| Treasuries | | | 11.0 | % |
| Asset Backed | | | 5.0 | % |
| Cash | | | 2.0 | % |
| |
| Total | | | 100.0 | % |
BALANCED INCOME FUND:
| | | | | |
| | | Percentage of |
| Security Allocation | | Market Value |
| |
| New Covenant Income Fund | | | 60.8 | % |
| New Covenant Growth Fund | | | 36.8 | % |
| Cash Equivalents | | | 2.4 | % |
| |
| Total | | | 100.0 | % |
3
to our shareholders
June 30, 2006
Hypothetical Illustration of $10,000 Invested in
New Covenant Growth Fund*
vs.
The S&P 500 Index†
| | | | | | | | | | | | | | | | | |
| | | 1 Year | | 3 Year | | 5 Year | | 10 Year |
| | | Return** | | Return** | | Return** | | Return** |
| Growth Fund | | | 10.17 | % | | | 12.33 | % | | | 2.77 | % | | | 5.55 | % |
| S&P500 Index | | | 8.62 | % | | | 11.21 | % | | | 2.49 | % | | | 8.32 | % |
| | |
| † | | The Standard & Poor’s 500 Index is an unmanaged, capitalization weighted index that measures the performance of 500 large-capitalization stocks representing all major industries. Investors cannot invest directly in an index, although they may invest in the underlying securities. |
June 30, 2006
Hypothetical Illustration of $10,000 Invested in
New Covenant Income Fund*
vs.
The Lehman Brothers Aggregate Bond Index
| | | | | | | | | | | | | | | | | |
| | | 1 Year | | 3 Year | | 5 Year | | 10 Year |
| | | Return** | | Return** | | Return** | | Return** |
| Income Fund | | | -0.90 | % | | | 1.66 | % | | | 4.45 | % | | | 5.50 | % |
| Lehman Brothers Aggregate Bond Index | | | -0.81 | % | | | 2.05 | % | | | 4.97 | % | | | 6.22 | % |
| | |
| †† | | The Lehman Brothers Aggregate Bond Index is representative of intermediate and long-term government and investment grade corporate debt securities. Investors cannot invest directly in an index, although they may invest in the underlying securities. |
Past performance does not guarantee future results. The performance data quoted represents past performance and current returns may be lower or higher. Total return figures include change in share price, reinvestment of dividends and capital gains. The investment return and principal value will fluctuate so that an investor’s shares, when redeemed, may be worth more or less than the original cost. Returns do not reflect the deduction of taxes that a shareholder would pay on Fund distributions or redemptions of Fund shares. To obtain performance information current to the most recent month end, please call 877-835-4531 or visit our website at www.NewCovenantFunds.com.
| | |
| * | | The performance information for all of the New Covenant Funds reflects performance prior to the July 1, 1999 inception date of the Funds. It represents performance records of the private pools previously managed by the Presbyterian Church (U.S.A.) Foundation, the predecessor entity to the Advisor. These private pools had investment objectives and policies in all material respects equivalent to those of the Funds. They were not subject to the requirements of the Investment Company Act of 1940 or the Internal Revenue Code of 1986, which may adversely affect performance results. The performance has been restated to reflect the total expenses of the Funds. |
| |
| ** | | Returns shown are average annual returns, assuming reinvestment of all dividends and distributions. |
4
to our shareholders
June 30, 2006
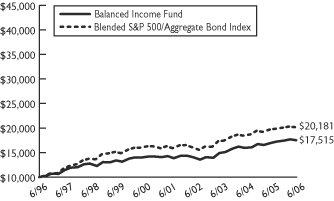
Hypothetical Illustration of $10,000 Invested in
New Covenant Balanced Growth Fund*
vs.
The Blended S&P 500/Aggregate Bond Index†
| | | | | | | | | | | | | | | | | |
| | | 1 Year | | 3 Year | | 5 Year | | 10 Year |
| | | Return** | | Return** | | Return** | | Return** |
| Balanced Growth Fund | | | 5.93 | % | | | 8.15 | % | | | 3.76 | % | | | 5.93 | % |
| Blended S&P 500/ Aggregate Bond Index | | | 4.83 | % | | | 7.57 | % | | | 3.78 | % | | | 7.82 | % |
| | |
| † | | The Blended S&P 500/Aggregate Bond Index is a composite index composed of 60% S&P 500 Index and 40% Lehman Brothers Aggregate Bond Index. Investors cannot invest directly in an index, although they may invest in the underlying securities. |
June 30, 2006
Hypothetical Illustration of $10,000 Invested in
New Covenant Balanced Income Fund*
vs.
The Blended S&P 500/Aggregate Bond Index††
| | | | | | | | | | | | | | | | | |
| | | 1 Year | | 3 Year | | 5 Year | | 10 Year |
| | | Return** | | Return** | | Return** | | Return** |
| Balanced Income Fund | | | 3.26 | % | | | 5.54 | % | | | 4.17 | % | | | 5.76 | % |
| Blended S&P 500/ Aggregate Bond Index | | | 2.47 | % | | | 5.27 | % | | | 4.38 | % | | | 7.27 | % |
| | |
| †† | | The Blended S&P 500/Aggregate Bond Index is a composite index composed of 35% S&P 500 Index and 65% Lehman Brothers Aggregate Bond Index. Investors cannot invest directly in an index, although they may invest in the underlying securities. |
Past performance does not guarantee future results. The performance data quoted represents past performance and current returns may be lower or higher. Total return figures include change in share price, reinvestment of dividends and capital gains. The investment return and principal value will fluctuate so that an investor’s shares, when redeemed, may be worth more or less than the original cost. Returns do not reflect the deduction of taxes that a shareholder would pay on Fund distributions or redemptions of Fund shares. To obtain performance information current to the most recent month end, please call 877-835-4531 or visit our website at www.NewCovenantFunds.com.
| | |
| * | | The performance information for all of the New Covenant Funds reflects performance prior to the July 1, 1999 inception date of the Funds. It represents performance records of the private pools previously managed by the Presbyterian Church (U.S.A.) Foundation, the predecessor entity to the Advisor. These private pools had investment objectives and policies in all material respects equivalent to those of the Funds. They were not subject to the requirements of the Investment Company Act of 1940 or the Internal Revenue Code of 1986, which may adversely affect performance results. The performance has been restated to reflect the total expenses of the Funds. |
| |
| ** | | Returns shown are average annual returns, assuming reinvestment of all dividends and distributions. |
5
portfolio of investments
NEW COVENANT GROWTH FUND
June 30, 2006
| | | | | | | | | |
| | | | | | | Value | |
| Shares | | | | | (Note 2) | |
| |
| COMMON STOCKS (97.4%): | | | | |
| | | | | Advertising (0.9%): | | | | |
| | 333,400 | | | Interpublic Group of Cos., Inc. (b) (L) | | $ | 2,783,890 | |
| | 60,600 | | | Omnicom Group, Inc | | | 5,398,854 | |
| | 7,663 | | | PagesJaunes SA | | | 240,519 | |
| | | | | | | | |
| | | | | | | | 8,423,263 | |
| | | | | | | | |
| | | | | Automotive (1.1%): | | | | |
| | 4,700 | | | Aftermarket Technology Corp. (b) (L) | | | 116,795 | |
| | 5,500 | | | Bayerische Motoren Werke AG | | | 274,518 | |
| | 29,400 | | | BorgWarner, Inc. (L) | | | 1,913,941 | |
| | 8,400 | | | DaimlerChrysler AG | | | 414,109 | |
| | 52,500 | | | Goodyear Tire & Rubber Co. (b) (L) | | | 582,750 | |
| | 90,200 | | | Honda Motor Co. Ltd. (L) | | | 2,870,165 | |
| | 26,000 | | | NGK Spark Plug Co | | | 523,185 | |
| | 80,100 | | | Nissan Motors | | | 875,984 | |
| | 15,550 | | | Noble International, Ltd | | | 222,676 | |
| | 2,100 | | | Renault SA | | | 225,526 | |
| | 5,020 | | | Reynolds & Reynolds Co. (L) | | | 153,963 | |
| | 3,300 | | | Scania AB, Class B | | | 149,846 | |
| | 31,400 | | | Suzuki Motor Corp | | | 679,921 | |
| | 14,180 | | | Tenneco Automotive, Inc. (b) | | | 368,680 | |
| | 9,900 | | | Volkswagen AG | | | 693,609 | |
| | 3,600 | | | Volkswagen AG PFD | | | 180,421 | |
| | | | | | | | |
| | | | | | | | 10,246,089 | |
| | | | | | | | |
| | | | | Banking (7.0%): | | | | |
| | 24,710 | | | ABN AMRO Holdings NV | | | 675,744 | |
| | 21,300 | | | ABSA Group, Ltd | | | 299,773 | |
| | 97,022 | | | Akbank Turk Anonim Sirketi | | | 464,923 | |
| | 77,900 | | | Banco Bilbao Vizcaya | | | 1,601,483 | |
| | 74,000 | | | Banco Santander Central Hispano SA | | | 1,080,430 | |
| | 385,191 | | | Bank of America Corp | | | 18,527,686 | |
| | 14,800 | | | Bank of East Asia, Ltd | | | 60,883 | |
| | 34,000 | | | Bank of Yokohama, Ltd | | | 263,255 | |
| | 12,100 | | | Banque Nationale de Paris | | | 1,157,913 | |
| | 16,500 | | | Barclays Plc | | | 187,503 | |
| | 125,000 | | | BOC Hong Kong (Holdings) Ltd | | | 244,634 | |
| | 3,500 | | | Canadian Imperial Bank of Commerce | | | 235,191 | |
| | 498,000 | | | China Construction Bank (R) | | | 227,626 | |
| | 22,300 | | | City Holding Co. (L) | | | 805,922 | |
| | 45,400 | | | Comerica, Inc | | | 2,360,346 | |
| | 6,409 | | | Commerzbank AG | | | 232,624 | |
| | 5,550 | | | Credit Suisse Group | | | 309,970 | |
| | 18,600 | | | Depfa Bank Plc | | | 309,140 | |
| | 2,200 | | | Deutsche Bank AG | | | 247,404 | |
| | 43,400 | | | Doral Financial Corp. (L) | | | 278,194 | |
| | 8,900 | | | East West Bancorp, Inc. (L) | | | 337,399 | |
| | 5,300 | | | Farmers Capital Bank Corp. (L) | | | 173,575 | |
| | 4,020 | | | First Citizens Bancshares, Inc., Class A (L) | | | 806,010 | |
| | 1,900 | | | First Community Bancorp (L) | | | 112,252 | |
| | 2,500 | | | First Regional Bancorp (b) (L) | | | 220,000 | |
| | 4,900 | | | Fortis | | | 167,077 | |
| | 11,241 | | | Holcim Ltd | | | 860,032 | |
| | 12,000 | | | HSBC Holdings Plc | | | 211,151 | |
| | 46,356 | | | JPMorgan Chase & Co | | | 1,946,952 | |
| | 22,392 | | | Kookmin Bank — ADR | | | 1,859,880 | |
| | 62,400 | | | Lloyds TSB Group Plc | | | 613,326 | |
| | 6,432 | | | Macquarie Bank Ltd | | | 329,616 | |
| | 13 | | | Mitsubishi Tokyo Financial Group, Inc | | | 181,977 | |
| | 132 | | | Mizuho Financial Group, Inc | | | 1,119,055 | |
| | 5,900 | | | Peoples Bancorp Inc. (L) | | | 176,056 | |
| | 1,394,500 | | | PT Bank Mandiri | | | 258,966 | |
| | 14,600 | | | R & G Financial Corp. (L) | | | 125,414 | |
| | 41,100 | | | Royal Bank of Scotland Group Plc | | | 1,351,379 | |
| | 3,600 | | | Societe Generale | | | 529,297 | |
| | 59,400 | | | Standard Bank | | | 641,784 | |
| | 14,000 | | | Standard Chartered Plc | | | 341,748 | |
| | 73,800 | | | State Street Corporation | | | 4,287,042 | |
| | 267 | | | Sumitomo Mitsui Financial Group | | | 2,826,509 | |
| | 16,500 | | | SVB Financial Group (b) (L) | | | 750,090 | |
| | 3,700 | | | Taylor Capital Group, Inc. (L) | | | 150,997 | |
| | 11,830 | | | TriCo Bancshares (L) | | | 323,905 | |
| | 49,700 | | | Turkiye Garanti Bankasi AG | | | 123,467 | |
| | 209,400 | | | U.S. Bancorp | | | 6,466,272 | |
| | 6,000 | | | Unibanco — GDR | | | 398,340 | |
| | 68,900 | | | Wachovia Corp | | | 3,726,112 | |
| | 35,400 | | | Wells Fargo & Co | | | 2,374,632 | |
| | 3,300 | | | Wintrust Financial Corp. (L) | | | 167,805 | |
| | | | | | | | |
| | | | | | | | 63,528,761 | |
| | | | | | | | |
| | | | | Broadcasting and Media (2.6%): | | | | |
| | 73,100 | | | CBS Corp | | | 1,977,355 | |
| | 17,000 | | | CKX, Inc. (b) (L) | | | 230,690 | |
| | 40,400 | | | Clear Channel Communications, Inc | | | 1,250,380 | |
| | 82,272 | | | Comcast Corp., New Class A (b) | | | 2,693,585 | |
| | 7,600 | | | Comcast Corp., Special Class A (b) | | | 249,128 | |
| | 16,140 | | | Cumulus Media, Inc. (b) (L) | | | 172,214 | |
| | 212,500 | | | DIRECTV Group, Inc. (b) | | | 3,506,250 | |
| | 15,800 | | | E.W. Scripps Co., Class A | | | 681,612 | |
| | 17,900 | | | Entravision Communications Corp. (b) | | | 153,403 | |
| | 35,200 | | | Grupo Televisa | | | 679,712 | |
| | 33,581 | | | Liberty Global, Inc., Class A (b) | | | 721,992 | |
| | 34,057 | | | Liberty Global, Inc., Class C (b) | | | 700,552 | |
| | 33,100 | | | Liberty Media Holding Corp. — Capital (b) | | | 2,772,787 | |
| | 8,300 | | | Radio One, Inc. (b) | | | 62,250 | |
| | 213,000 | | | Time Warner, Inc | | | 3,684,900 | |
| | 98,000 | | | Viacom, Inc., Class B (b) | | | 3,512,320 | |
| | 10,800 | | | Vivendi SA | | | 378,332 | |
| | | | | | | | |
| | | | | | | | 23,427,462 | |
| | | | | | | | |
| | | | | Chemicals (1.0%): | | | | |
| | 7,400 | | | CF Industries Holdings, Inc. (L) | | | 105,524 | |
| | 12,500 | | | Dow Chemical Co | | | 487,875 | |
| | 137,000 | | | Lyondell Chemical Co | | | 3,104,420 | |
| | 133,000 | | | Mosaic Co., Inc. (b) (L) | | | 2,081,450 | |
| | 16,000 | | | Nitto Denko Corp | | | 1,140,857 | |
| | 3,500 | | | Pioneer Cos., Inc. (b) (L) | | | 95,480 | |
| | 7,600 | | | Potash Corp. of Saskatchewan, Inc | | | 653,499 | |
| | 15,200 | | | Symyx Technologies, Inc (b) | | | 367,080 | |
| | 12,300 | | | Takeda Chemical Industries | | | 766,194 | |
| | 8,500 | | | UAP Holding Corp. (L) | | | 185,385 | |
| | | | | | | | |
| | | | | | | | 8,987,764 | |
| | | | | | | | |
| | | | | Commercial Services (1.5%): | | | | |
| | 16,369 | | | Aaron Rents, Inc. (L) | | | 439,999 | |
| | 162,500 | | | Accenture Ltd | | | 4,601,999 | |
| | 17,000 | | | Apollo Group, Inc., Class A (b) (L) | | | 878,390 | |
| | 27,000 | | | Coinmach Service Corp., Class A (L) | | | 276,750 | |
| | 17,790 | | | CSG Systems International, Inc. (b) | | | 440,125 | |
| | 8,980 | | | Gevity HR, Inc. (L) | | | 238,419 | |
| | 16,290 | | | John H. Harland Co | | | 708,615 | |
| | 11,400 | | | McGrath Rentcorp (L) | | | 317,034 | |
| | 65,900 | | | Move, Inc. (b) | | | 361,132 | |
| | | | |
| | | | | |
| 6 | | See accompanying notes to financial statements. | | |
portfolio of investments (continued)
NEW COVENANT GROWTH FUND
June 30, 2006
| | | | | | | | | |
| | | | | | | Value | |
| Shares | | | | | (Note 2) | |
| |
| | | | | Commercial Services (cont.): | | | | |
| | 58,300 | | | Pitney Bowes, Inc | | $ | 2,407,790 | |
| | 2,400 | | | Pre-Paid Legal Services, Inc. (L) | | | 82,800 | |
| | 17,500 | | | Weight Watchers International, Inc | | | 715,575 | |
| | 181,800 | | | Xerox Corp. (b) | | | 2,528,838 | |
| | | | | | | | |
| | | | | | | | 13,997,466 | |
| | | | | | | | |
| | | | | Computer Services and Software(6.0%): | | | | |
| | 16,000 | | | Activision, Inc. (b) | | | 182,080 | |
| | 24,700 | | | Actuate Corp. (b) | | | 99,788 | |
| | 81,300 | | | Adobe Systems, Inc. (b) | | | 2,468,268 | |
| | 32,900 | | | Affiliated Computer Services Inc., Class A (b) (L) | | | 1,697,969 | |
| | 4,320 | | | ANSYS, Inc. (b) (L) | | | 206,582 | |
| | 39,900 | | | Automatic Data Processing, Inc | | | 1,809,465 | |
| | 3,900 | | | Avid Technology, Inc. (b) (L) | | | 129,987 | |
| | 18,600 | | | CalAmp Corp. (b) | | | 165,354 | |
| | 432,200 | | | Cisco Systems, Inc. (b) | | | 8,440,867 | |
| | 9,200 | | | Covansys Corp. (b) (L) | | | 115,644 | |
| | 5,400 | | | Dassault Systemes SA (b) | | | 289,272 | |
| | 126,200 | | | Dell, Inc. (b) | | | 3,080,542 | |
| | 17,200 | | | DST Systems, Inc. (b) | | | 1,023,400 | |
| | 21,200 | | | Earthlink, Inc. (b) | | | 183,592 | |
| | 2,600 | | | FactSet Research Systems, Inc | | | 122,980 | |
| | 162,300 | | | Hewlett Packard Co | | | 5,141,664 | |
| | 6,900 | | | Infosys Technologies Ltd. (L) | | | 527,229 | |
| | 8,700 | | | Infousa, Inc. (L) | | | 89,697 | |
| | 11,200 | | | InterDigital Communications Corp. (b) (L) | | | 390,992 | |
| | 10,900 | | | Intergraph Corp. (b) (L) | | | 343,241 | |
| | 100,300 | | | International Business Machines Corp | | | 7,705,047 | |
| | 9,500 | | | Jack Henry & Associates, Inc. (L) | | | 186,770 | |
| | 8,190 | | | Komag, Inc. (b) (L) | | | 378,214 | |
| | 740,000 | | | Lenovo Group Limited | | | 245,342 | |
| | 22,900 | | | Lexmark International, Inc. (b) | | | 1,278,507 | |
| | 5,300 | | | Manhattan Associates, Inc. (b) | | | 107,537 | |
| | 495,300 | | | Microsoft Corp | | | 11,540,491 | |
| | 4,170 | | | Microstrategy, Inc. (b) (L) | | | 406,658 | |
| | 14,520 | | | Parametric Technology Corp. (b) | | | 184,549 | |
| | 9,300 | | | Radyne Corp. (b) (L) | | | 105,834 | |
| | 9,800 | | | Red Hats, Inc. (b) | | | 229,320 | |
| | 4,900 | | | Renanissance Learning, Inc. (L) | | | 66,395 | |
| | 6,900 | | | Salesforce.com, Inc. (b) | | | 183,954 | |
| | 3,600 | | | SAP AG | | | 758,965 | |
| | 58,100 | | | Seagate Technology | | | 1,315,384 | |
| | 19,200 | | | Sonic Solutions (b) (L) | | | 316,800 | |
| | 7,070 | | | Sybase, Inc. (b) (L) | | | 137,158 | |
| | 10,000 | | | Sykes Enterprises, Inc. (b) | | | 161,600 | |
| | 8,200 | | | Syntel, Inc. (L) | | | 167,772 | |
| | 26,800 | | | THQ, Inc. (b) (L) | | | 578,880 | |
| | 8,480 | | | Transaction Systems Architects, Inc. (b) (L) | | | 353,531 | |
| | 12,000 | | | Trend Micro, Inc | | | 405,249 | |
| | 9,700 | | | Trident Microsystems (b) | | | 184,106 | |
| | 36,130 | | | United Online, Inc. (L) | | | 433,560 | |
| | 92,700 | | | Wind River Systems, Inc. (b) (L) | | | 825,030 | |
| | | | | | | | |
| | | | | | | | 54,765,266 | |
| | | | | | | | |
| | | | | Construction and Building Materials (1.2%): | | | | |
| | 28,643 | | | Bouygues SA | | | 1,472,121 | |
| | 2,634 | | | Brookfield Homes Corp. (L) | | | 86,790 | |
| | 18,581 | | | CRH Plc | | | 605,533 | |
| | 122,700 | | | D. R. Horton, Inc | | | 2,922,713 | |
| | 1,200 | | | Dycom Industries, Inc. (b) | | | 25,548 | |
| | 12,930 | | | Eagle Materials | | | 614,175 | |
| | 4,500 | | | Granite Construction, Inc | | | 203,715 | |
| | 28,000 | | | Jacobs Engineering Group, Inc. (b) | | | 2,229,920 | |
| | 3,400 | | | Lafarge SA | | | 426,646 | |
| | 4,200 | | | Orascom Construction Industries — GDR | | | 255,985 | |
| | 1,062 | | | Orascom Construction Industries — GDR (R) | | | 64,728 | |
| | 5,400 | | | Quanex Corp. (L) | | | 232,578 | |
| | 39,063 | | | Rinker Group Limited | | | 475,508 | |
| | 18,000 | | | Stanley Works | | | 849,960 | |
| | 6,700 | | | Titan Cement Co | | | 314,198 | |
| | | | | | | | |
| | | | | | | | 10,780,118 | |
| | | | | | | | |
| | | | | Consumer Products (3.4%): | | | | |
| | 60,309 | | | Amcor Ltd | | | 299,207 | |
| | 31,000 | | | Cintas Corp | | | 1,232,560 | |
| | 55,800 | | | Clorox Co | | | 3,402,126 | |
| | 52,500 | | | Colgate-Palmolive Company | | | 3,144,750 | |
| | 16,400 | | | Crocs, Inc. (b) (L) | | | 412,460 | |
| | 4,000 | | | Deckers Outdoor Corp. (b) | | | 154,240 | |
| | 83,700 | | | General Mills, Inc | | | 4,323,942 | |
| | 9,500 | | | Harman International Industries, Inc | | | 811,015 | |
| | 15,800 | | | Herman Miller, Inc | | | 407,166 | |
| | 8,400 | | | JAKKS Pacific, Inc. (b) (L) | | | 168,756 | |
| | 74,300 | | | Kimberly-Clark Corp | | | 4,584,310 | |
| | 21,200 | | | Knoll, Inc | | | 389,232 | |
| | 6,700 | | | L’OREAL SA | | | 632,593 | |
| | 104,000 | | | Li & Fung Ltd | | | 210,231 | |
| | 8,300 | | | Mannatech, Inc. (L) | | | 104,663 | |
| | 3,800 | | | Michelin | | | 228,339 | |
| | 40,280 | | | NIKE, Inc., Class B | | | 3,262,680 | |
| | 18,000 | | | Nikon Corp | | | 314,646 | |
| | 4,600 | | | Nintendo Co | | | 772,703 | |
| | 5,400 | | | Polo Ralph Lauren Corp | | | 296,460 | |
| | 69,522 | | | Procter & Gamble Co | | | 3,865,423 | |
| | 15,000 | | | Skechers U.S.A., Inc., Class A (b) (L) | | | 361,650 | |
| | 4,820 | | | Stanley Furniture Co., Inc. (L) | | | 115,535 | |
| | 4,820 | | | Toro Co. (L) | | | 225,094 | |
| | 37,000 | | | Toto Ltd | | | 354,138 | |
| | 5,800 | | | WD-40 Co. (L) | | | 194,706 | |
| | 10,700 | | | Wolseley Plc | | | 236,063 | |
| | 8,400 | | | Yankee Candle Co. (L) | | | 210,084 | |
| | | | | | | | |
| | | | | | | | 30,714,772 | |
| | | | | | | | |
| | | | | Diversified Operations (3.1%): | | | | |
| | 59,100 | | | 3M Co | | | 4,773,507 | |
| | 7,600 | | | Acuity Brands, Inc. (L) | | | 295,716 | |
| | 39,001 | | | Brambles Industries Ltd | | | 318,626 | |
| | 148,128 | | | First Data Corp | | | 6,671,685 | |
| | 332,400 | | | General Electric Co | | | 10,955,905 | |
| | 5,040 | | | Harsco Corp | | | 392,918 | |
| | 71,500 | | | IOI Corp. Berhad | | | 278,445 | |
| | 7,100 | | | Martha Stewart Living Omnimedia, Inc., Class A (b) (L) | | | 118,641 | |
| | 22,200 | | | Mitsubishi Corp | | | 443,806 | |
| | 4,100 | | | Rofin-Sinar Technologies, Inc. (b) (L) | | | 235,627 | |
| | 9,500 | | | Shin-Etsu Chemical Co., Ltd | | | 516,973 | |
| | 74,000 | | | Sumitomo Corp | | | 976,955 | |
| | 59,000 | | | Swire Pacific Ltd., Class A | | | 608,862 | |
| | 22,900 | | | Teleflex, Inc | | | 1,237,058 | |
| | | | | | | | |
| | | | | | | | 27,824,724 | |
| | | | | | | | |
| | | | |
| | | | | |
| | | See accompanying notes to financial statements. | | 7 |
portfolio of investments (continued)
NEW COVENANT GROWTH FUND
June 30, 2006
| | | | | | | | | |
| | | | | | | Value | |
| Shares | | | | | (Note 2) | |
| |
| | | | | Electronics (4.4%): | | | | |
| | 2,000 | | | Advantest Corp | | $ | 204,025 | |
| | 92,500 | | | Altera Corp. (b) | | | 1,623,375 | |
| | 16,500 | | | Amkor Technology, Inc. (b) (L) | | | 156,090 | |
| | 46,300 | | | Amphenol Corp., Class A | | | 2,590,948 | |
| | 62,400 | | | Arm Holdings Plc | | | 130,685 | |
| | 12,600 | | | ASML Holding N.V. (b) | | | 255,167 | |
| | 21,300 | | | AU Optronics Corp. — ADR (L) | | | 303,312 | |
| | 3,310 | | | Bel Fuse, Inc., Class B (L) | | | 108,601 | |
| | 17,200 | | | Cree Research, Inc. (b) (L) | | | 408,672 | |
| | 14,610 | | | Diodes, Inc. (b) (L) | | | 605,438 | |
| | 68,100 | | | Emerson Electric Co | | | 5,707,461 | |
| | 5,000 | | | Fanuc Co., Ltd | | | 449,694 | |
| | 298,300 | | | Flextronics International Ltd. (b) | | | 3,167,946 | |
| | 59,900 | | | Freescale Semiconductor Inc. (b) | | | 1,761,060 | |
| | 137,000 | | | Freescale Semiconductor, Inc., Class A (b) | | | 3,973,000 | |
| | 4,400 | | | Hirose Electric Co., Ltd | | | 535,083 | |
| | 57,185 | | | Hon Hai Precision Industry Co., Ltd | | | 706,486 | |
| | 7,600 | | | Intersil Corp., Class A | | | 176,700 | |
| | 800 | | | Keyence Corp | | | 204,514 | |
| | 103,500 | | | Lam Research Corp. (b) | | | 4,825,170 | |
| | 72,700 | | | Lattice Semiconductor Corp. (b) | | | 449,286 | |
| | 8,200 | | | LoJack Corp. (b) (L) | | | 154,652 | |
| | 13,900 | | | MEMC Electronic Materials, Inc. (b) | | | 521,250 | |
| | 50,400 | | | Microchip Technology, Inc | | | 1,690,920 | |
| | 9,970 | | | MTS Systems Corp. (L) | | | 393,915 | |
| | 7,100 | | | Multi-Fineline Electronix, Inc. (b) (L) | | | 235,649 | |
| | 27,000 | | | Nippon Electric Glass Co., Ltd | | | 542,126 | |
| | 44 | | | Nippon Telegraph & Telephone Corp | | | 215,958 | |
| | 17,100 | | | Novellus Systems, Inc. (b) | | | 422,370 | |
| | 10,700 | | | OmniVision Technologies, Inc. (b) (L) | | | 225,984 | |
| | 5,900 | | | Photronics, Inc. (b) (L) | | | 87,320 | |
| | 38,800 | | | Pixelworks, Inc. (b) (L) | | | 105,924 | |
| | 10,700 | | | PortalPlayer, Inc. (b) (L) | | | 104,967 | |
| | 4,600 | | | Rohm Co., Ltd | | | 411,706 | |
| | 5,154 | | | Samsung Electornics — GDR | | | 1,619,645 | |
| | 8,200 | | | Sony Corp | | | 362,292 | |
| | 28,400 | | | Synopsis, Inc. (b) | | | 533,068 | |
| | 109,817 | | | Taiwan Semiconductor — ADR (L) | | | 1,008,116 | |
| | 51,600 | | | Teradyne, Inc. (b) | | | 718,788 | |
| | 12,300 | | | Tokyo Electron Ltd | | | 860,892 | |
| | 28,000 | | | Toshiba Corp | | | 182,992 | |
| | 13,900 | | | TTM Technologies, Inc. (b) (L) | | | 201,133 | |
| | 12,500 | | | Ushio, Inc | | | 264,108 | |
| | 2,600 | | | Yamada Denki Co., Ltd | | | 265,459 | |
| | | | | | | | |
| | | | | | | | 39,471,947 | |
| | | | | | | | |
| | | | | Energy (3.0%): | | | | |
| | 153,200 | | | AES Corp. (b) | | | 2,826,540 | |
| | 127,800 | | | El Paso Corp | | | 1,917,000 | |
| | 1,900 | | | Energy Conversion Devices, Inc. (b) (L) | | | 69,217 | |
| | 14,360 | | | Energy Partners Ltd. (b) (L) | | | 272,122 | |
| | 39,474 | | | Exelon Corp | | | 2,243,307 | |
| | 2,900 | | | Headwaters, Inc. (b) (L) | | | 74,124 | |
| | 11,900 | | | Iberdrola SA | | | 409,715 | |
| | 17,100 | | | Kansai Electric Power, Inc | | | 382,992 | |
| | 6,990 | | | Korea Electric Power Corp | | | 132,530 | |
| | 7,300 | | | Maverick Tube Corp. (b) (L) | | | 461,287 | |
| | 17,900 | | | Oklahoma Gas & Electric Co. (L) | | | 627,037 | |
| | 24,400 | | | Pepco Holdings, Inc. (L) | | | 575,352 | |
| | 63,600 | | | PG&E Corp. (L) | | | 2,498,208 | |
| | 2,900 | | | RAO Unified Energy System (UES) — GDR | | | 200,390 | |
| | 3,800 | | | Reliance Energy Ltd.-GDR | | | 117,800 | |
| | 7,102 | | | Reliance Energy Ventures Ltd. — GDR (R)(b)(c)(d) | | | 9,434 | |
| | 7,102 | | | Reliance Natural Resources Ltd. — GDR (R)(b)(c)(d) | | | 5,560 | |
| | 11,000 | | | Scottish & Southern Energy Plc | | | 234,138 | |
| | 14,400 | | | Tokyo Electric Power Co | | | 398,110 | |
| | 22,000 | | | Tokyo Gas Ltd | | | 103,745 | |
| | 40,600 | | | TXU Corp | | | 2,427,474 | |
| | 4,600 | | | UIL Holdings Corporation (L) | | | 258,934 | |
| | 75,800 | | | Valero Energy | | | 5,042,216 | |
| | 3,100 | | | Veba AG | | | 356,700 | |
| | 7,200 | | | VeraSun Energy Corp. (b) (L) | | | 188,928 | |
| | 14,030 | | | Westar Energy, Inc. (L) | | | 295,332 | |
| | 82,000 | | | Williams Co., Inc | | | 1,915,520 | |
| | 156,400 | | | Xcel Energy, Inc. (L) | | | 2,999,752 | |
| | | | | | | | |
| | | | | | | | 27,043,464 | |
| | | | | | | | |
| | | | | Entertainment and Leisure (1.1%): | | | | |
| | 3,900 | | | Ambassadors Group, Inc. (L) | | | 112,632 | |
| | 11,900 | | | Bally Total Fitness Holding Corp. (b) (L) | | | 80,682 | |
| | 6,200 | | | Carnival Plc | | | 252,586 | |
| | 23,800 | | | Regal Entertainment Group (L) | | | 483,616 | |
| | 299,500 | | | Walt Disney Co | | | 8,985,000 | |
| | | | | | | | |
| | | | | | | | 9,914,516 | |
| | | | | | | | |
| | | | | Financial Services (7.0%): | | | | |
| | 8,400 | | | Accredited Home Lenders (b) (L) | | | 401,604 | |
| | 12,110 | | | Advanta, Class B (L) | | | 435,355 | |
| | 5,800 | | | Affiliated Managers Group, Inc. (b) (L) | | | 503,962 | |
| | 5,760 | | | American Capital Strategies (L) | | | 192,845 | |
| | 3,500 | | | BlackRock, Inc., Class A (L) | | | 487,095 | |
| | 7,100 | | | Calamos Asset Management (L) | | | 205,829 | |
| | 105,246 | | | CapitalSource, Inc. (L) | | | 2,469,071 | |
| | 298,276 | | | Citigroup, Inc | | | 14,388,834 | |
| | 111,800 | | | Commerce Assets Holdings | | | 181,157 | |
| | 9,420 | | | CompuCredit Corp. (b) (L) | | | 362,105 | |
| | 122,798 | | | Countrywide Credit Industries, Inc | | | 4,676,148 | |
| | 56,100 | | | E*TRADE Financial Corp. (b) | | | 1,280,202 | |
| | 7,800 | | | eFunds Corp. (b) (L) | | | 171,990 | |
| | 59,300 | | | Federal Home Loan Mortgage Corp | | | 3,380,693 | |
| | 45,000 | | | Fubon Financial Holding Co., Ltd. — GDR (R) | | | 389,165 | |
| | 39,960 | | | Goldman Sachs Group, Inc | | | 6,011,183 | |
| | 7,800 | | | Greenhill & Co., Inc. (L) | | | 473,928 | |
| | 28,900 | | | HBOS Plc | | | 502,376 | |
| | 5,300 | | | Huron Consulting Group, Inc. (b) | | | 185,977 | |
| | 30,879 | | | ING Groep NV | | | 1,213,178 | |
| | 16,600 | | | Jefferies Group, Inc. (L) | | | 491,858 | |
| | 82,200 | | | Lehman Brothers Holdings, Inc | | | 5,355,330 | |
| | 5,200 | | | MainSource Financial Group, Inc. (L) | | | 90,636 | |
| | 60,800 | | | MBIA, Inc. (L) | | | 3,559,840 | |
| | 62,100 | | | Merrill Lynch & Co | | | 4,319,676 | |
| | 52,600 | | | Morgan Stanley Dean Witter & Co | | | 3,324,846 | |
| | 3,900 | | | Morningstar, Inc. (b) | | | 161,772 | |
| | 7,040 | | | ORIX Corp | | | 1,721,505 | |
| | 52,700 | | | Paychex, Inc | | | 2,054,246 | |
| | 24,700 | | | PNC Financial Services Group | | | 1,733,199 | |
| | 7,102 | | | Reliance Capital Ventures Ltd. -GDR (R)(b)(c)(d) | | | 6,814 | |
| | 10,200 | | | SEI Investments Co | | | 498,576 | |
| | 4,980 | | | Shinhan Financial Group Co., Ltd | | | 233,667 | |
| | 10,500 | | | SWS Group, Inc. (L) | | | 253,260 | |
| | | | |
| | | | | |
| 8 | | See accompanying notes to financial statements. | | |
portfolio of investments (continued)
NEW COVENANT GROWTH FUND
June 30, 2006
| | | | | | | | | |
| | | | | | | Value | |
| Shares | | | | | (Note 2) | |
| |
| | | | | Financial Services (cont.): | | | | |
| | 7,000 | | | The First Marblehead Corp. (L) | | | 398,580 | |
| | 4,800 | | | Triad Guaranty, Inc. (b) (L) | | $ | 234,624 | |
| | 8,305 | | | UBS AG | | | 908,688 | |
| | 11,600 | | | Waddell & Reed Financial, Inc | | | 238,496 | |
| | | | | | | | |
| | | | | | | | 63,498,310 | |
| | | | | | | | |
| | | | | Food and Beverages (3.4%): | | | | |
| | 31,900 | | | Aramark Corp | | | 1,056,209 | |
| | 20,000 | | | Cadbury Schweppes Plc | | | 192,880 | |
| | 8,000 | | | Coca-Cola Co | | | 344,160 | |
| | 4,700 | | | Groupe Danone | | | 596,987 | |
| | 62,100 | | | Hormel Foods Corp | | | 2,306,394 | |
| | 9,741 | | | Koninklijke Numico NV | | | 437,004 | |
| | 87,800 | | | Kraft Foods, Inc., Class A (L) | | | 2,713,020 | |
| | 100 | | | Lindt & Spruengli AG | | | 197,518 | |
| | 5,596 | | | Nestle SA | | | 1,754,604 | |
| | 100,000 | | | Pepsi Bottling Group, Inc | | | 3,215,000 | |
| | 45,300 | | | PepsiAmericas, Inc | | | 1,001,583 | |
| | 127,500 | | | PepsiCo, Inc | | | 7,655,101 | |
| | 12,100 | | | Pyaterochka Holding NV — GDR (b) | | | 201,465 | |
| | 20,700 | | | Ruddick Corp. (L) | | | 507,357 | |
| | 83,560 | | | SUPERVALU, Inc | | | 2,565,292 | |
| | 52,300 | | | Sysco Corp | | | 1,598,288 | |
| | 151,500 | | | Unilever NV — ADR | | | 3,416,325 | |
| | 16,250 | | | Unilever Plc | | | 365,418 | |
| | 25,108 | | | Woolworths Ltd | | | 375,751 | |
| | | | | | | | |
| | | | | | | | 30,500,356 | |
| | | | | | | | |
| | | | | Forest and Paper Products (0.5%): | | | | |
| | 27,800 | | | Abitibi-Consolidated, Inc | | | 75,264 | |
| | 6,300 | | | Bowater, Inc | | | 143,325 | |
| | 14,284 | | | Norske Skogsindustrier Asa | | | 209,542 | |
| | 3,200 | | | Universal Forest Products, Inc. (L) | | | 200,736 | |
| | 11,100 | | | UPM-Kymmene Oyj | | | 239,123 | |
| | 63,400 | | | Weyerhaeuser Co | | | 3,946,650 | |
| | | | | | | | |
| | | | | | | | 4,814,640 | |
| | | | | | | | |
| | | | | Health Services (2.9%): | | | | |
| | 14,900 | | | Candela Corp. (b) | | | 236,314 | |
| | 41,450 | | | Coventry Health Care, Inc. (b) | | | 2,277,263 | |
| | 31,900 | | | Express Scripts, Inc., Class A (b) | | | 2,288,506 | |
| | 68,700 | | | Health Management Associates, Inc., Class A (L) | | | 1,354,077 | |
| | 24,800 | | | Healthspring, Inc. (b) (L) | | | 465,000 | |
| | 40,800 | | | Magellan Health Services, Inc. (b) (L) | | | 1,848,648 | |
| | 82,700 | | | McKesson Corp | | | 3,910,056 | |
| | 4,700 | | | Molina Heathcare Inc. (b) (L) | | | 178,835 | |
| | 5,500 | | | Odyssey HealthCare, Inc. (b) (L) | | | 96,635 | |
| | 3,000 | | | Pediatrix Medical Group, Inc. (b) (L) | | | 135,900 | |
| | 40,800 | | | Quest Diagnostics, Inc | | | 2,444,736 | |
| | 44,200 | | | Stryker Corp | | | 1,861,262 | |
| | 129,320 | | | UnitedHealth Group, Inc | | | 5,790,950 | |
| | 11,300 | | | Universal Health Services, Inc, Class B | | | 567,938 | |
| | 46,000 | | | Varian Medical Systems, Inc. (b) | | | 2,178,100 | |
| | 4,300 | | | WellCare Health Plans, Inc. (b) (L) | | | 210,915 | |
| | | | | | | | |
| | | | | | | | 25,845,135 | |
| | | | | | | | |
| | | | | Hotels and Other Lodging Places (0.2%): | | | | |
| | 7,100 | | | Accor SA | | | 431,989 | |
| | 6,400 | | | Four Seasons Hotels, Inc. (L) | | | 393,216 | |
| | 24,600 | | | Lodgian, Inc. (b) (L) | | | 350,550 | |
| | 156,000 | | | Shangri-La Asia Ltd | | | 300,282 | |
| | 23,400 | | | Strategic Hotel Capital, Inc | | | 485,316 | |
| | | | | | | | |
| | | | | | | | 1,961,353 | |
| | | | | | | | |
| | | | | Insurance (7.6%): | | | | |
| | 56,000 | | | Ace Ltd | | | 2,833,040 | |
| | 22,764 | | | Aegon NV | | | 389,116 | |
| | 175,100 | | | Aetna, Inc | | | 6,991,742 | |
| | 43,500 | | | AFLAC, Inc | | | 2,016,225 | |
| | 3,100 | | | Allianz AG | | | 489,273 | |
| | 69,679 | | | American International Group, Inc | | | 4,114,545 | |
| | 78,900 | | | Aon Corp | | | 2,747,298 | |
| | 48,590 | | | Arch Capital Group Ltd. (b) | | | 2,889,161 | |
| | 9,500 | | | Aspen Insurance Holdings Ltd. (L) | | | 221,255 | |
| | 74,900 | | | Assurant, Inc | | | 3,625,160 | |
| | 22,300 | | | Axis Capital Holdings Ltd | | | 638,003 | |
| | 26 | | | Berkshire Hathaway, Inc., Class A (b) | | | 2,383,134 | |
| | 9,300 | | | Bristol West Holdings, Inc. (L) | | | 148,800 | |
| | 7,900 | | | China Life Insurance Co. — ADR | | | 500,070 | |
| | 49,000 | | | Chubb Corp | | | 2,445,100 | |
| | 39,600 | | | CIGNA Corp | | | 3,900,996 | |
| | 1,200 | | | Everest Re Group, Ltd | | | 103,884 | |
| | 2,700 | | | FPIC Insurance Group, Inc. (b) (L) | | | 104,625 | |
| | 92,200 | | | Genworth Financial, Inc., Class A | | | 3,212,248 | |
| | 57,800 | | | Hartford Financial Services Group, Inc | | | 4,889,880 | |
| | 54,200 | | | Insurance Australia Group Ltd | | | 215,361 | |
| | 3,400 | | | LandAmerica Financial Group, Inc. (L) | | | 219,640 | |
| | 108,200 | | | Marsh & McLennan Cos., Inc | | | 2,909,498 | |
| | 72,240 | | | MetLife, Inc | | | 3,699,410 | |
| | 33 | | | Millea Holdings, Inc | | | 614,961 | |
| | 15,000 | | | Mitsui Marine And Fire | | | 188,583 | |
| | 61,700 | | | Promina Group Ltd | | | 257,534 | |
| | 16,303 | | | QBE Insurance Group Ltd | | | 248,219 | |
| | 62,500 | | | Reinsurance Group of America, Inc. (L) | | | 3,071,875 | |
| | 2,000 | | | Samsung Fire & Marine Insurance Co., Ltd. | | | 268,874 | |
| | 3,360 | | | Selective Insurance Group, Inc. (L) | | | 187,723 | |
| | 94,739 | | | St. Paul Cos., Inc | | | 4,223,465 | |
| | 9,993 | | | Swiss Re | | | 697,233 | |
| | 156,000 | | | UnumProvident Corp. (L) | | | 2,828,280 | |
| | 58,100 | | | Wellpoint, Inc. (b) | | | 4,227,937 | |
| | 39,300 | | | Yasuda F & M Insurance | | | 550,131 | |
| | | | | | | | |
| | | | | | | | 69,052,279 | |
| | | | | | | | |
| | | | | Internet Services (1.1%): | | | | |
| | 9,000 | | | Checkfree Corp. (b) (L) | | | 446,040 | |
| | 6,200 | | | Click Commerce, Inc. (b) (L) | | | 122,326 | |
| | 61,800 | | | CNET Networks, Inc. (b) | | | 493,164 | |
| | 4,300 | | | Digital River, Inc. (b) (L) | | | 173,677 | |
| | 2,600 | | | Google, Inc., Class A (b) | | | 1,090,258 | |
| | 7,500 | | | InfoSpace, Inc. (b) (L) | | | 170,025 | |
| | 15,400 | | | Ipass, Inc. (b) (L) | | | 86,240 | |
| | 7,700 | | | j2 Global Communications, Inc. (b) (L) | | | 240,394 | |
| | 14,400 | | | Openwave Systems, Inc. (b) (L) | | | 166,176 | |
| | 7,600 | | | Packeteer, Inc. (b) (L) | | | 86,184 | |
| | 29,500 | | | Silicon Image, Inc. (b) | | | 318,010 | |
| | 59,700 | | | Softbank Corp | | | 1,339,724 | |
| | 315,112 | | | Symantec Corp. (b) | | | 4,896,841 | |
| | 6,200 | | | Websense, Inc. (b) (L) | | | 127,348 | |
| | 708 | | | Yahoo Japan Corp | | | 375,370 | |
| | | | | | | | |
| | | | | | | | 10,131,777 | |
| | | | | | | | |
| | | | | Machinery and Equipment (1.6%): | | | | |
| | 6,200 | | | Albany International Corp., Class A (L) | | | 262,818 | |
| | 13,300 | | | Atlas Copca AB, A Shares | | | 369,373 | |
| | 3,400 | | | Cascade Corp | | | 134,470 | |
| | 79,100 | | | Caterpillar, Inc | | | 5,891,367 | |
| | | | |
| | | | | |
| | | See accompanying notes to financial statements. | | 9 |
portfolio of investments (continued)
NEW COVENANT GROWTH FUND
June 30, 2006
| | | | | | | | | |
| | | | | | | Value | |
| Shares | | | | | (Note 2) | |
| |
| | | | | Machinery and Equipment (cont.): | | | | |
| | 53,400 | | | Fastenal Co | | $ | 2,151,486 | |
| | 10,650 | | | Graco, Inc. (L) | | | 489,687 | |
| | 7,600 | | | Lennox International, Inc | | | 201,248 | |
| | 4,000 | | | NIDEC Corp | | | 286,964 | |
| | 11,200 | | | Schneider SA | | | 1,167,010 | |
| | 3,900 | | | SMC Corp | | | 552,415 | |
| | 20,200 | | | Whirlpool Corp | | | 1,669,530 | |
| | 35,100 | | | Zebra Technologies Corp., Class A (b) | | | 1,199,016 | |
| | | | | | | | |
| | | | | | | | 14,375,384 | |
| | | | | | | | |
| | | | | | | | | |
| | | | | Manufacturing (1.7%): | | | | |
| | 7,000 | | | A.O. Smith Corp. (L) | | | 324,520 | |
| | 10,950 | | | Applied Industrial Tech, Inc | | | 266,195 | |
| | 5,000 | | | Arcelor (L) | | | 241,252 | |
| | 12,000 | | | Arctic Cat, Inc. (L) | | | 234,120 | |
| | 13,100 | | | Assa Abloy AB, Class B | | | 220,110 | |
| | 1,300 | | | Chaparral Steel Co. (b) | | | 93,626 | |
| | 1,800 | | | FEI Co. (b) | | | 40,824 | |
| | 7,500 | | | Goodman Global, Inc.. (b) | | | 113,850 | |
| | 3,200 | | | Greif Inc., Class A (L) | | | 239,872 | |
| | 70,600 | | | Gujarat Ambuja Cements Ltd. — GDR (R) | | | 152,503 | |
| | 31,030 | | | Hankook Tire Co., Ltd | | | 364,809 | |
| | 23,800 | | | Identix, Inc. (b) (L) | | | 166,362 | |
| | 33,400 | | | Illinois Tool Works, Inc | | | 1,586,500 | |
| | 90,100 | | | Ingersoll-Rand Co | | | 3,854,477 | |
| | 10,000 | | | Kao Corp | | | 262,030 | |
| | 5,600 | | | Lancaster Colony Corp. (L) | | | 221,032 | |
| | 7,000 | | | LSI Industries, Inc. (L) | | | 118,930 | |
| | 72,000 | | | Mitsubishi Heavy Industries Ltd | | | 311,181 | |
| | 1,800 | | | NACCO Industries, Inc. (L) | | | 247,338 | |
| | 6,400 | | | Nordson Corp. (L) | | | 314,752 | |
| | 46,800 | | | Parker Hannifin Corp | | | 3,631,680 | |
| | 10,200 | | | Siemens AG | | | 887,416 | |
| | 68,100 | | | Skyworks Solutions, Inc. (b) (L) | | | 375,231 | |
| | 4,800 | | | Standex International Corp. (L) | | | 145,680 | |
| | 95,000 | | | Sumitomo Metal Industries, Ltd | | | 392,301 | |
| | 5,200 | | | Sun Hydraulics Corp. (L) | | | 108,056 | |
| | 4,300 | | | Tennant Co. (L) | | | 216,204 | |
| | 4,500 | | | Tokyo Seimitsu Co., Ltd | | | 233,858 | |
| | | | | | | | |
| | | | | | | | 15,364,709 | |
| | | | | | | | |
| | | | | Medical Products (4.7%): | | | | |
| | 12,400 | | | Affymetrix, Inc. (b) (L) | | | 317,440 | |
| | 9,300 | | | Alcon, Inc | | | 916,515 | |
| | 5,800 | | | Alkermes, Inc. (b) | | | 109,736 | |
| | 92,000 | | | Amgen, Inc. (b) | | | 6,001,161 | |
| | 15,650 | | | Applera Corp.-Celera Genomics Group (b) | | | 202,668 | |
| | 97,600 | | | Baxter International, Inc | | | 3,587,776 | |
| | 35,400 | | | Beckman Coulter, Inc | | | 1,966,470 | |
| | 36,500 | | | Biomet, Inc | | | 1,142,085 | |
| | 4,400 | | | Biosite, Inc. (b) | | | 200,904 | |
| | 226,600 | | | Boston Scientific Corp. (b) | | | 3,815,944 | |
| | 13,700 | | | C. R. Bard, Inc | | | 1,003,662 | |
| | 34,700 | | | Depomed, Inc. (b) (L) | | | 203,689 | |
| | 20,110 | | | Exelixis, Inc. (b) (L) | | | 202,106 | |
| | 27,864 | | | Genzyme Corp. (b) | | | 1,701,097 | |
| | 6,600 | | | Hoya Corp | | | 235,013 | |
| | 88,900 | | | Johnson & Johnson, Inc | | | 5,326,888 | |
| | 68,200 | | | Kinetic Concepts, Inc. (b) | | | 3,011,030 | |
| | 27,500 | | | Laboratory Corp. of America Holdings (b) | | | 1,711,325 | |
| | 3,940 | | | Landauer, Inc. (L) | | | 188,726 | |
| | 4,100 | | | Medical Action Industries Inc. (b) | | | 90,569 | |
| | 32,400 | | | Medtronic, Inc | | | 1,520,208 | |
| | 4,000 | | | Meridian Bioscience, Inc. (L) | | | 99,800 | |
| | 4,226 | | | Metabasis Therapeutics, Inc. (b) | | | 32,244 | |
| | 3,300 | | | Palomar Medical Technologies, Inc. (b) (L) | | | 150,579 | |
| | 27,000 | | | Patterson Co., Inc. (b) (L) | | | 943,110 | |
| | 10,200 | | | Quidel Corp. (b) (L) | | | 96,900 | |
| | 3,700 | | | Replidyne, Inc. (b) | | | 38,406 | |
| | 28,400 | | | Sanofi-Synthelabo SA | | | 2,770,395 | |
| | 32,000 | | | Smith & Nephew Plc | | | 246,472 | |
| | 26,600 | | | Telik, Inc. (b) (L) | | | 438,900 | |
| | 72,100 | | | Vertex Pharmaceuticals, Inc. (b) (L) | | | 2,646,791 | |
| | 20,380 | | | Zeneca Group Plc | | | 1,230,149 | |
| | | | | | | | |
| | | | | | | | 42,148,758 | |
| | | | | | | | |
| | | | | | | | | |
| | | | | Metals and Mining (1.7%): | | | | |
| | 21,200 | | | Alcan, Inc | | | 995,128 | |
| | 31,100 | | | Alcoa, Inc | | | 1,006,396 | |
| | 5,600 | | | AngloGold Ashanti Ltd. — ADR | | | 269,472 | |
| | 10,800 | | | Barrick Gold Corp | | | 319,680 | |
| | 35,700 | | | Cameco Corp | | | 1,427,936 | |
| | 1,090 | | | Carpenter Technology Corp. (L) | | | 125,895 | |
| | 6,400 | | | Cleveland-Cliffs, Inc. (L) | | | 507,456 | |
| | 20,080 | | | Commercial Metals Co | | | 516,056 | |
| | 59,500 | | | Freeport-McMoran Copper & Gold, Inc., Class B (L) | | | 3,296,895 | |
| | 3,200 | | | GMK Norilsk Nickel (L) | | | 416,000 | |
| | 40,903 | | | Harmony Gold Mining Co., Ltd. (b) | | | 654,866 | |
| | 13,800 | | | Harmony Gold Mining Co., Ltd. — ADR (b) (L) | | | 224,802 | |
| | 6,500 | | | Mueller Industries, Inc. (L) | | | 214,695 | |
| | 5,110 | | | NS Group, Inc. (b) (L) | | | 281,459 | |
| | 3,900 | | | Polyus Gold — ADR (b) | | | 167,700 | |
| | 23,900 | | | Repsol YPF SA | | | 684,149 | |
| | 13,700 | | | Rio Tinto Plc | | | 724,333 | |
| | 4,500 | | | Ryerson, Inc. (L) | | | 121,500 | |
| | 31,500 | | | Southern Copper Corp. (L) | | | 2,807,595 | |
| | 7,600 | | | Xstrata Plc | | | 288,118 | |
| | | | | | | | |
| | | | | | | | 15,050,131 | |
| | | | | | | | |
| | | | | | | | | |
| | | | | Oil and Gas (7.2%): | | | | |
| | 17,700 | | | Canadian Natural Resources | | | 982,590 | |
| | 144,792 | | | ChevronTexaco Corp | | | 8,985,792 | |
| | 333,000 | | | CNOOC Ltd | | | 265,827 | |
| | 116,038 | | | ConocoPhillips | | | 7,603,970 | |
| | 2,300 | | | Delek US Holdings, Inc. (b) | | | 34,960 | |
| | 62,380 | | | Devon Energy Corp | | | 3,768,376 | |
| | 5,350 | | | Eni SpA | | | 157,524 | |
| | 29,300 | | | EXCO Resources, Inc. (b) | | | 334,020 | |
| | 220,800 | | | Exxon Mobil Corp | | | 13,546,080 | |
| | 13,800 | | | Frontier Oil Corp. (L) | | | 447,120 | |
| | 3,500 | | | Giant Industries, Inc. (b) | | | 232,925 | |
| | 9,700 | | | Global Industries Ltd. (b) | | | 161,990 | |
| | 5,000 | | | Holly Corp | | | 241,000 | |
| | 1,967 | | | Hugoton Royalty Trust (L) | | | 58,420 | |
| | 2,421 | | | L’Air Liquide | | | 471,424 | |
| | 2,900 | | | Lone Star Technologies, Inc. (b) | | | 156,658 | |
| | 22,300 | | | Marathon Oil Corp | | | 1,857,590 | |
| | 29,400 | | | Meridian Resource Corp. (b) | | | 102,900 | |
| | 8,200 | | | Neste Oil OYJ | | | 288,720 | |
| | 138,200 | | | NiSource, Inc | | | 3,018,288 | |
| | 5,400 | | | OAO Gazprom — ADR | | | 227,070 | |
See accompanying notes to financial statements.
10
portfolio of investments (continued )
NEW COVENANT GROWTH FUND
June 30, 2006
| | | | | | | | | |
| | | | | | | Value | |
| Shares | | | | | (Note 2) | |
| |
| | | | | Oil and Gas (cont.): | | | | |
| | 55,000 | | | Occidental Petroleum Corporation | | $ | 5,640,250 | |
| | 23,200 | | | Parker Drilling Co. (b) (L) | | | 166,576 | |
| | 6,400 | | | Patterson-UTI Energy, Inc | | | 181,184 | |
| | 234,000 | | | PetroChina Co. Ltd | | | 250,068 | |
| | 5,300 | | | Petroleo Brasileiro SA — ADR | | | 473,343 | |
| | 4,000 | | | Petroleo Brasileiro SA — ADR | | | 319,360 | |
| | 1,800 | | | Range Resources Corp. (L) | | | 48,942 | |
| | 7,102 | | | Reliance Industries Ltd. — GDR (b) (c) | | | 326,979 | |
| | 3,400 | | | Remington Oil & Gas Corp. (b) | | | 149,498 | |
| | 54,000 | | | Royal Dutch Shell — ADR | | | 3,616,920 | |
| | 69,896 | | | Royal Dutch Shell, A Shares | | | 2,350,211 | |
| | 61,100 | | | Sasol Ltd | | | 2,357,683 | |
| | 19,000 | | | SeaDrill Ltd. (b) | | | 250,470 | |
| | 5,100 | | | St. Mary Land & Exploration Co. (L) | | | 205,275 | |
| | 7,260 | | | Stone Energy Corp. (b) | | | 337,953 | |
| | 5,900 | | | Suncor Energy, Inc | | | 479,408 | |
| | 21,700 | | | Sunoco, Inc | | | 1,503,593 | |
| | 7,900 | | | Swift Energy Co. (b) (L) | | | 339,147 | |
| | 10,400 | | | Total SA | | | 684,097 | |
| | 6,300 | | | Trico Marine Services, Inc. (b) | | | 214,200 | |
| | 7,033 | | | Tupras-Turkiye Petrol Rafinerileri A.S | | | 117,512 | |
| | 1,800 | | | Ultra Petroleum Corp. (b) | | | 106,686 | |
| | 6,000 | | | W&T Offshore, Inc. (L) | | | 233,340 | |
| | 33,000 | | | XTO Energy, Inc | | | 1,460,910 | |
| | | | | | | | |
| | | | | | | | 64,756,849 | |
| | | | | | | | |
| | | | | | | | | |
| | | | | Pharmaceuticals (5.5%): | | | | |
| | 146,500 | | | Abbott Laboratories | | | 6,388,864 | |
| | 3,500 | | | Altana AG | | | 195,367 | |
| | 54,800 | | | Amylin Pharmaceuticals (b) (L) | | | 2,705,476 | |
| | 15,000 | | | Array Biopharma, Inc. (b) (L) | | | 129,000 | |
| | 15,970 | | | Astrazeneca Plc | | | 963,558 | |
| | 34,900 | | | Barr Pharmaceuticals, Inc. (b) | | | 1,664,381 | |
| | 9,300 | | | Bayer AG | | | 427,802 | |
| | 67,000 | | | Cardinal Health, Inc | | | 4,310,110 | |
| | 40,240 | | | Cephalon, Inc. (b) (L) | | | 2,418,424 | |
| | 26,300 | | | Cubist Pharmaceuticals, Inc. (b) (L) | | | 662,234 | |
| | 41,550 | | | CV Therapeutics, Inc. (b) (L) | | | 580,454 | |
| | 10,000 | | | Daiichi Sankyo Co., Ltd | | | 275,591 | |
| | 44,100 | | | Dendreon Corp. (b) (L) | | | 213,444 | |
| | 12,460 | | | Encysive Pharmaceuticals, Inc. (b) | | | 86,348 | |
| | 19,000 | | | Endo Pharmaceuticals Holdings, Inc. (b) | | | 626,620 | |
| | 101,600 | | | Forest Laboratories, Inc. (b) | | | 3,930,904 | |
| | 16,200 | | | Human Genome Sciences, Inc. (b) | | | 173,340 | |
| | 26,000 | | | ICOS Corp. (b) (L) | | | 571,740 | |
| | 98,600 | | | IMS Health, Inc. (L) | | | 2,647,410 | |
| | 48,800 | | | Incyte Pharmaceutical, Inc. (b) (L) | | | 224,480 | |
| | 2,800 | | | Kos Pharmaceuticals, Inc. (b) (L) | | | 105,336 | |
| | 89,800 | | | Medarex, Inc. (b) (L) | | | 862,978 | |
| | 38,300 | | | Merck & Co. Inc | | | 1,395,269 | |
| | 118,900 | | | Millennium Pharmaceuticals, Inc. (b) | | | 1,185,433 | |
| | 13,300 | | | Neurogen Corp. (b) (L) | | | 68,096 | |
| | 40,301 | | | Novartis AG | | | 2,178,432 | |
| | 4,100 | | | Novo Nordisk A/S, Class B | | | 261,131 | |
| | 19,080 | | | NPS Pharmaceuticals, Inc. (b) (L) | | | 93,110 | |
| | 236,915 | | | Pfizer, Inc | | | 5,560,395 | |
| | 28,460 | | | Regeneron Pharmaceuticals, Inc. (b) (L) | | | 364,857 | |
| | 27,500 | | | Rigel Pharmaceuticals, Inc. (b) (L) | | | 267,575 | |
| | 4,067 | | | Roche Holding AG | | | 671,136 | |
| | 16,600 | | | Teva Pharmaceutical Industries (b) | | | 524,394 | |
| | 3,300 | | | Teva Pharmaceutical SP — ADR | | | 104,247 | |
| | 6,200 | | | Trimeris, Inc. (b) (L) | | | 71,238 | |
| | 6,100 | | | UCB SA | | | 329,890 | |
| | 100,400 | | | Watson Pharmaceutical, Inc. (b) (L) | | | 2,337,312 | |
| | 86,800 | | | Wyeth | | | 3,854,788 | |
| | 18,280 | | | Zymogenetics, Inc. (b)(L) | | | 346,772 | |
| | | | | | | | |
| | | | | | | | 49,777,936 | |
| | | | | | | | |
| | | | | | | | | |
| | | | | Printing and Publishing (0.5%): | | | | |
| | 5,570 | | | Advo, Inc. (L) | | | 137,078 | |
| | 19,800 | | | Journal Register Co. (L) | | | 177,408 | |
| | 69,600 | | | McGraw-Hill Companies,Inc | | | 3,496,007 | |
| | 13,700 | | | Pearson plc | | | 186,594 | |
| | 40,200 | | | Reed International plc | | | 405,903 | |
| | 15,900 | | | Trinity Mirror plc | | | 143,490 | |
| | 38,800 | | | Yell Group plc | | | 367,012 | |
| | | | | | | | |
| | | | | | | | 4,913,492 | |
| | | | | | | | |
| | | | | Real Estate (0.7%): | | | | |
| | 171,000 | | | Amoy Properties Ltd | | | 306,037 | |
| | 19,060 | | | Anthracite Capital, Inc.(L) | | | 231,770 | |
| | 12,290 | | | Arbor Realty Trust, Inc | | | 307,865 | |
| | 36,500 | | | Ashford Hospitality Trust (L) | | | 460,630 | |
| | 9,000 | | | Diamondrock Hospitality Co | | | 133,290 | |
| | 33,900 | | | GMH Communities Trust (L) | | | 446,802 | |
| | 51,000 | | | Hang Lung Group, Ltd | | | 110,317 | |
| | 14,600 | | | Hersha Hospitality Trust | | | 135,634 | |
| | 5,100 | | | Highwoods Properties, Inc. (L) | | | 184,518 | |
| | 24,600 | | | Impac Mortgage Holdings, Inc. (L) | | | 275,028 | |
| | 35,090 | | | IndyMac Mortgage Holdings, Inc | | | 1,608,876 | |
| | 6,500 | | | Meritage Homes Corp. (b) (L) | | | 307,125 | |
| | 39,000 | | | Mitsubishi Estate Co | | | 829,134 | |
| | 3,500 | | | Sovran Self Storage,Inc. (L) | | | 177,765 | |
| | 10,000 | | | Sumitomo Realty & Development Co., Ltd | | | 246,719 | |
| | 26,000 | | | Sun Hung Kai Properties | | | 265,132 | |
| | 8,375 | | | Technical Olympic USA (L) | | | 120,265 | |
| | 34,900 | | | Trustreet Properties,Inc. (L) | | | 460,331 | |
| | | | | | | | |
| | | | | | | | 6,607,238 | |
| | | | | | | | |
| | | | | | | | | |
| | | | | Restaurants (0.9%): | | | | |
| | 2,600 | | | CBRL Group, Inc. (L) | | | 88,192 | |
| | 48,300 | | | Cheesecake Factory, Inc.(b) | | | 1,301,685 | |
| | 39,600 | | | Darden Restaurants, Inc | | | 1,560,240 | |
| | 87,900 | | | McDonald’s Corp | | | 2,953,440 | |
| | 7,800 | | | P.F. Chang’s China Bistro, Inc. (b) (L) | | | 296,556 | |
| | 4,800 | | | Panera Bread Co., Class A (b) | | | 322,752 | |
| | 38,900 | | | YUM! Brands, Inc | | | 1,955,503 | |
| | | | | | | | |
| | | | | | | | 8,478,368 | |
| | | | | | | | |
| | | | | | | | | |
| | | | | Retail (3.2%): | | | | |
| | 5,200 | | | AnnTaylor Stores Corp.(b) | | | 225,576 | |
| | 1,000 | | | Arden Group, Inc., Class A (L) | | | 113,170 | |
| | 73,820 | | | Barnes & Noble, Inc | | | 2,694,430 | |
| | 48,300 | | | Bed Bath & Beyond, Inc.(b) | | | 1,602,111 | |
| | 3,000 | | | Blair Corp. (L) | | | 89,250 | |
| | 6,100 | | | Bon-Ton Stores, Inc. (L) | | | 133,468 | |
| | 5,800 | | | Brown Shoe Co., Inc | | | 197,664 | |
| | 3,200 | | | Building Materials Holding Corp. (L) | | | 89,184 | |
| | 22,405 | | | Cato Corp. (L) | | | 579,169 | |
| | 4,900 | | | Cawachi, Ltd | | | 168,478 | |
| | 1,900 | | | Circuit City Stores, Inc | | | 51,718 | |
| | 75,090 | | | Claire’s Stores, Inc | | | 1,915,546 | |
| | 1,600 | | | Columbia Sportswear Co. (b) (L) | | | 72,416 | |
See accompanying notes to financial statements.
11
portfolio of investments (continued)
NEW COVENANT GROWTH FUND
June 30, 2006
| | | | | | | | | |
| | | | | | Value | |
| Shares | | | | | (Note 2) | |
| |
| | | | | Retail (cont.): | | | | |
| | 6,200 | | | CONN’S, Inc. (b) (L) | | $ | 164,610 | |
| | 54,900 | | | Dillard’s, Inc., Class A (L) | | | 1,748,565 | |
| | 92,000 | | | Dollar General Corp | | | 1,286,160 | |
| | 79,300 | | | DSW, Inc. (b) (L) | | | 2,888,106 | |
| | 6,900 | | | Furniture Brands International, Inc. (L) | | | 143,796 | |
| | 1,000 | | | GameStop Corp. (b) | | | 42,000 | |
| | 5,700 | | | Genesco, Inc. (b) | | | 193,059 | |
| | 5,900 | | | Ingles Markets, Inc., Class A (L) | | | 100,300 | |
| | 1,300 | | | J. Crew Group, Inc. (b) | | | 35,685 | |
| | 34,100 | | | Jusco Ltd | | | 748,828 | |
| | 55,300 | | | Kesa Electricals Plc | | | 295,547 | |
| | 61,200 | | | Kingfisher Plc | | | 269,925 | |
| | 6,703 | | | Lotte Shopping Co. — GDR (R) (b) | | | 128,429 | |
| | 20,500 | | | Massmart Holdings Ltd | | | 135,196 | |
| | 81,120 | | | Office Depot, Inc. (b) | | | 3,082,559 | |
| | 3,900 | | | Pantry, Inc. (b) | | | 224,406 | |
| | 68,800 | | | Quiksilver, Inc. (b) (L) | | | 837,984 | |
| | 8,250 | | | Select Comfort Corp. (b) (L) | | | 189,503 | |
| | 5,000 | | | Shimamura Co., Ltd | | | 548,556 | |
| | 640 | | | Shinsegae Co., Ltd | | | 320,540 | |
| | 4,300 | | | Shoe Carnival, Inc. (b) (L) | | | 102,598 | |
| | 6,500 | | | Smart & Final, Inc. (b) (L) | | | 109,460 | |
| | 18,000 | | | Stride Rite Corp | | | 237,420 | |
| | 1,900 | | | Talbots, Inc. (L) | | | 35,055 | |
| | 3,900 | | | Tractor Supply Co. (b) | | | 215,553 | |
| | 28,900 | | | Wal-Mart Stores, Inc | | | 1,392,113 | |
| | 43,000 | | | Walgreen Co | | | 1,928,120 | |
| | 314,712 | | | Walmart De Mexico SA | | | 884,156 | |
| | 14,500 | | | Weis Markets, Inc. (L) | | | 597,400 | |
| | 15,900 | | | Wet Seal, Inc., Class A (b) | | | 77,592 | |
| | 33,800 | | | Whole Foods Market, Inc | | | 2,184,832 | |
| | | | | | | | |
| | | | | | | | 29,080,233 | |
| | | | | | | | |
| | | | | | | | | |
| | | | | Technology (1.0%): | | | | |
| | 29,900 | | | Aquantive, Inc. (b) | | | 757,367 | |
| | 55,100 | | | Brooks Automation, Inc. (b) | | | 650,180 | |
| | 5,250 | | | Canon, Inc | | | 257,677 | |
| | 5,100 | | | CommScope, Inc. (b) (L) | | | 160,242 | |
| | 37,000 | | | Eresearch Technology, Inc. (b) (L) | | | 336,700 | |
| | 13,800 | | | Hitachi High Technology Corp | | | 420,157 | |
| | 7,700 | | | Hutchinson Technology, Inc. (b) (L) | | | 166,551 | |
| | 114,090 | | | Intel Corp | | | 2,162,006 | |
| | 2,800 | | | Kronos, Inc. (b) (L) | | | 101,388 | |
| | 41,200 | | | Linear Technology Corp | | | 1,379,788 | |
| | 133,300 | | | RF Micro Devices, Inc. (b) (L) | | | 795,801 | |
| | 74,000 | | | Western Digital Corp. (b) (L) | | | 1,465,940 | |
| | | | | | | | |
| | | | | | | | 8,653,797 | |
| | | | | | | | |
| | | | | | | | | |
| Shares or | | | | | | |
| Principal Amount | | | | | | |
| |
| | | | | Telecommunications (5.7%): | | | | |
| | 6,100 | | | Adtran, Inc. (L) | | | 136,823 | |
| | 46,300 | | | America Movil | | | 1,539,938 | |
| | 237,700 | | | AT&T, Inc | | | 6,629,453 | |
| | 101,300 | | | Avaya, Inc. (b) | | | 1,156,846 | |
| | 94,300 | | | BellSouth Corp | | | 3,413,660 | |
| | 59,900 | | | CenturyTel, Inc | | | 2,225,285 | |
| | 27,500 | | | Consolidated Communications Holdings, Inc. | | | 457,325 | |
| | 216,400 | | | Corning, Inc. (b) | | | 5,234,716 | |
| | 9,694 | | | Embarq Corp. (b) | | | 397,357 | |
| | 78,700 | | | Koninklijke (Royal) KPN NV | | | 884,428 | |
| | 24,100 | | | Korea Telecom Corp | | | 516,945 | |
| | 163,700 | | | Motorola, Inc | | | 3,298,555 | |
| | 44,900 | | | Nokia Oyj — Class A | | | 916,174 | |
| | 9,400 | | | Nokia Oyj ADR | | | 190,444 | |
| | 84,900 | | | Polycom, Inc. (b) | | | 1,861,008 | |
| | 30,430 | | | Premiere Global Services, Inc. (b) (L) | | | 229,747 | |
| | 1,705,500 | | | PT Telekomunikasi Indonesia | | | 1,353,425 | |
| | 169,030 | | | Qualcomm, Inc | | | 6,773,032 | |
| | 296,200 | | | Qwest Communications International, Inc.(b) | | | 2,396,258 | |
| | 7,102 | | | Reliance Communication Ventures Ltd. -GDR (R)(b)(c)(d) | | | 69,409 | |
| | 398,500 | | | Singapore Telecommunications Ltd. (R) | | | 640,221 | |
| | 17,000 | | | Societe Europeenne Satellite | | | 241,252 | |
| | 373,681 | | | Sprint Corp | | | 7,469,884 | |
| | 1,214 | | | Swisscom AG | | | 398,983 | |
| | 6,300 | | | Syniverse Holdings, Inc. (b) | | | 92,610 | |
| | 100,000 | | | Telefonaktiebolaget LM Ericsson | | | 330,491 | |
| | 23,903 | | | Telefonica De Espana | | | 397,889 | |
| | 4,360 | | | Telekom Austria AG | | | 97,047 | |
| | 24,939 | | | Telstra Corp., Ltd | | | 68,162 | |
| | 6,600 | | | Tim Participacoes SA — ADR | | | 181,830 | |
| | 1,118,268 | | | Vodafone Group plc | | | 2,383,364 | |
| | | | | | | | |
| | | | | | | | 51,982,561 | |
| | | | | | | | |
| | | | | | | | | |
| | | | | Transportation (3.1%): | | | | |
| | 3,840 | | | Alexander & Baldwin (L) | | | 169,997 | |
| | 14,390 | | | Arkansas Best Corp. (L) | | | 722,522 | |
| | 66,400 | | | Con-way, Inc | | | 3,846,552 | |
| | 22,700 | | | CSX Corp | | | 1,598,988 | |
| | 15,800 | | | Deutsche Post AG | | | 424,406 | |
| | 42,800 | | | Expeditors International of Washington,Inc. | | | 2,397,228 | |
| | 12,500 | | | Fedex Corp | | | 1,460,750 | |
| | 3,800 | | | Grupo Aeroportuario del Pacifico SA de CV — ADR | | | 121,030 | |
| | 42,000 | | | Hankyu Holdings, Inc | | | 205,774 | |
| | 188,000 | | | JetBlue Airways Corp. (b) (L) | | | 2,282,320 | |
| | 42,000 | | | Odakyu Electric Railway Co., Ltd | | | 271,181 | |
| | 8,100 | | | Pacer International, Inc. (L) | | | 263,898 | |
| | 161,148 | | | Qantas Airways, Ltd | | | 354,266 | |
| | 27,850 | | | Ryder System, Inc | | | 1,627,276 | |
| | 212,000 | | | Southwest Airlines Co | | | 3,470,440 | |
| | 41,000 | | | Tokyu Corp | | | 239,615 | |
| | 67,900 | | | United Parcel Service, Inc | | | 5,590,207 | |
| | 8,300 | | | Veolia Environnement | | | 428,811 | |
| | 103,800 | | | Werner Enterprises, Inc. (L) | | | 2,104,026 | |
| | 35,000 | | | Yamato Transport | | | 621,610 | |
| | | | | | | | |
| | | | | | | | 28,200,897 | |
| | | | | | | | |
| | | | | | | | | |
| | | | | Waste Management (0.9%): | | | | |
| | 5,200 | | | Waste Industries USA, Inc | | | 117,936 | |
| | 231,900 | | | Waste Management, Inc | | | 8,320,572 | |
| | | | | | | | |
| | | | | | | | 8,438,508 | |
| | | | | | | | |
| | | | | Total Common Stocks | | | 882,758,323 | |
| | | | | | | | |
| | | | | | | | | |
| EXCHANGE TRADED FUNDS (0.4%): | | | | |
| | 54,100 | | | iShares Russell 1000 Index Fund | | | 3,737,228 | |
| | | | | | | | |
| | | | | Total Exchange Traded Funds | | | 3,737,228 | |
| | | | | | | | |
| | | | | | | | | |
| CASH EQUIVALENTS (2.3%): | | | | |
| $ | 20,926,143 | | | JP Morgan Cash Trade Execution | | | 20,926,143 | |
| | | | | | | | |
| | | | | Total Cash Equivalents | | | 20,926,143 | |
| | | | | | | | |
See accompanying notes to financial statements.
12
portfolio of investments (continued)
NEW COVENANT GROWTH FUND
June 30, 2006
| | | | | | | | | |
| | | | | | | Value | |
| Principal Amount | | | (Note 2) | |
| |
| INVESTMENTS HELD AS COLLATERAL FOR LOANED SECURITIES (13.2%): |
| $ | 4,831,886 | | | Bear Stearns Asset Backed Securities, Series 2006-HE5, Class A1, 5.37%, 7/25/06 | | $ | 4,831,886 | |
| | 7,000,000 | | | BNP Paribas Repurchase Agreement, 5.36%, 7/3/06 (Purchased on 6/30/06, proceeds at maturity $7,003,128, collateralized by various corporate bonds, fair value $7,350,000) | | | 7,000,000 | |
| | 2,000,000 | | | Cantor Fitzgerald & Co. Repurchase Agreement, 5.36%, 7/3/06 (Purchased on 6/30/06, proceeds at maturity $2,000,894, collateralized by various corporate bonds, fair value $2,100,000) | | | 2,000,000 | |
| | 5,998,020 | | | CC USA, Inc. MTN, 5.38%, 7/3/06 | | | 5,998,020 | |
| | 6,000,000 | | | Citigroup Global Markets, Inc. Repurchase Agreement, 5.36%, 7/3/06 (Purchased on 6/30/06, proceeds at maturity $6,002,681, collateralized by various corporate bonds, fair value $6,300,000) | | | 6,000,000 | |
| | 5,000,000 | | | Citigroup, Inc. MTN, 5.41%, 7/3/06 | | | 5,000,000 | |
| | 5,000,000 | | | Goldman Sachs Asset Allocation, Series 2006-11, 5.44%, 7/25/06 | | | 5,000,000 | |
| | 5,000,000 | | | Goldman Sachs Group, Inc. MTN, 5.42%, 7/3/06 | | | 5,000,000 | |
| | 4,997,500 | | | K2 (USA) LLC MTN, 5.38%, 7/3/06 | | | 4,997,500 | |
| | 10,793,000 | | | Lehman Brothers Repurchase Agreement, 5.46%, 7/3/06 (Purchased on 6/30/06, proceeds at maturity $10,797,913, collateralized by various corporate bonds, fair value $11,332,650) | | | 10,793,000 | |
| | 57,000 | | | Lehman Brothers Repurchase Agreement, 5.46%, 7/3/06 (Purchased on 6/30/06, proceeds at maturity $57,026, collateralized by various corporate bonds, fair value $59,850) | | | 57,000 | |
| | 12,000,000 | | | Lehman Holdings MTN, 5.43%, 7/3/06 | | | 12,000,000 | |
| | 3,999,575 | | | Liberty Lighthouse US Capital MTN, 5.33%, 7/3/06 | | | 3,999,575 | |
| | 7,051,889 | | | Merrill Lynch & Co. MTN, 5.35%, 7/3/06 | | | 7,051,889 | |
| | 19,000,000 | | | Merrill Lynch Repurchase Agreement, 5.37%, 7/3/06 (Purchased on 6/30/06, proceeds at maturity $19,008,506, collateralized by various corporate bonds, fair value $19,950,000) | | | 19,000,000 | |
| | 5,000,000 | | | Monumental Global Funding II MTN, 5.47%, 7/3/06 | | | 5,000,000 | |
| | 5,327,878 | | | Morgan Stanley Repurchase Agreement, 5.25%, 7/3/06 (Purchased on 6/30/06, proceeds at maturity $5,330,209, collateralized by various corporate bonds, fair value $5,434,436) | | | 5,327,878 | |
| | 3,300 | | | Morgan Stanley Repurchase Agreement, 5.44%, 7/3/06 (Purchased on 6/30/06, proceeds at maturity $3,302, collateralized by various corporate bonds, fair value $3,465) | | | 3,300 | |
| | 496,700 | | | Morgan Stanley Repurchase Agreement, 5.44%, 7/3/06 (Purchased on 6/30/06, proceeds at maturity $496,925, collateralized by various corporate bonds, fair value $521,535) | | | 496,700 | |
| | 5,000,000 | | | United of Omaha Life Insurance Funding Agreement, 5.19%, 7/3/06 | | | 5,000,000 | |
| | 4,999,040 | | | Wachovia Bank NA Bank Note, 5.37%, 7/3/06 | | | 4,999,040 | |
| | | | | | | | |
| | | | | Total Investments Held As Collateral For Loaned Securities | | | 119,555,788 | |
| | | | | | | | |
| TOTAL INVESTMENTS (Cost $918,475,445) (a) | | $ | 1,026,977,482 | |
| | | | | | | | |
| | |
| Percentages indicated are based on net assets of $906,009,632. |
| |
| (a) | | See notes to financial statements for tax unrealized appreciation (depreciation) of securities. |
| |
| (b) | | Non-income producing security. |
| |
| (c) | | Fair valued security. |
| |
| (d) | | Illiquid security. |
| |
| (L) | | A portion or all of the security is on loan. |
| |
| (R) | | Security exempt from registration under Rule 144A of the Securities Act of 1933 or otherwise restricted as to resale. These securities may be resold in transactions exempt from registration, normally to qualified buyers. The Advisor, using procedures approved by the Board of Trustees, has deemed these securities to be liquid except for those noted as illiquid above. |
| |
| ADR | | American Depositary Receipt |
| |
| GDR | | Global Depositary Receipt |
| |
| MTN | | Medium Term Note |
Growth Fund Foreign Currency Contracts as of June 30, 2006:
| | | | | | | | | | | | | | | | | | | | | |
| | | | | | | Contract Amount | | Contract Value | | Current Value | | Unrealized Appreciation/ |
| | | Delivery Date | | (Local Currency) | | U.S. Dollar | | U.S. Dollar | | (Depreciation) |
| |
Australian Dollar | | | 7/3/2006 | | | | 17,440 | | | $ | 12,714 | | | $ | 12,952 | | | $ | 238 | |
| Short Contracts | | | 7/5/2006 | | | | 9,255 | | | | 6,832 | | | | 6,873 | | | | (41 | ) |
| | | | | | | | | | | | | | | | | | | | | |
Euro | | | 7/3/2006 | | | | 35,016 | | | | 43,965 | | | | 44,778 | | | | (813 | ) |
| Short Contracts | | | 7/5/2006 | | | | 103,736 | | | | 132,658 | | | | 132,675 | | | | (17 | ) |
| | | | | | | | | | | | | | | | | | | | | |
JapaneseYen | | | 7/3/2006 | | | | 3,462,407 | | | | 29,753 | | | | 30,307 | | | | (554 | ) |
| Short Contracts | | | 7/5/2006 | | | | 3,459,564 | | | | 29,855 | | | | 30,291 | | | | (436 | ) |
| | | | 7/5/2006 | | | | 5,036,582 | | | | 44,026 | | | | 44,099 | | | | (73 | ) |
| | | | | | | | | | | | | | | | | | | | | |
Swedish Krone | | | 7/3/2006 | | | | 460,183 | | | | 62,642 | | | | 63,920 | | | | (1,278 | ) |
| Short Contracts | | | 7/4/2006 | | | | 18,573 | | | | 2,526 | | | | 2,580 | | | | (54 | ) |
| | | | | | | | | | | | | | | | | | | | | |
Turkish Lira | | | 7/3/2006 | | | | 105,794 | | | | 66,018 | | | | 66,624 | | | | 606 | |
| Short Contracts | | | 7/3/2006 | | | | 29,835 | | | | 18,841 | | | | 18,789 | | | | (52 | ) |
| | | | |
| | | | | |
| | | See accompanying notes to financial statements. | | 13 |
portfolio of investments
NEW COVENANT INCOME FUND
June 30, 2006
| | | | | | | | | |
| Principal | | | | | Value | |
| Amount | | | | | (Note 2) | |
| |
| ASSET BACKED SECURITIES (3.4%): |
| $ | 3,310,000 | | | Bank of America Commercial Mortgage, Inc., 5.30%, 6/10/39, * | | $ | 3,220,971 | |
| | 575,000 | | | Lehman XS Trust, 5.11%, 7/25/35, 2005-1 3A3A * | | | 533,077 | |
| | 565,000 | | | Lehman XS Trust, 5.76%, 11/25/35, 2005-6 3A3A * | | | 535,755 | |
| | 4,860,000 | | | Master Asset Backed Securities Trust, 5.23%, 11/25/35, * | | | 4,770,739 | |
| | 433,891 | | | Residential Asset Mortgage Products, Inc., 4.00%, 1/25/30 | | | 432,267 | |
| | 2,895,000 | | | Residential Asset Mortgage Products, Inc., 5.46%, 5/25/32 | | | 2,876,525 | |
| | 5,459,030 | | | Residential Asset Mortgage Products, Inc., 5.57%, 6/25/32, Series 2002-RS3, Class A15 | | | 5,425,836 | |
| | | | | | | | |
| | | | | Total Asset Backed Securities | | | 17,795,170 | |
| | | | | | | | |
| CORPORATE BONDS (15.4%): |
| | 2,000,000 | | | Abbott Laboratories, 5.88%, 5/15/16 | | | 1,986,534 | |
| | 2,165,000 | | | Alcan, Inc., 6.13%, 12/15/33 (L) | | | 2,054,960 | |
| | 850,000 | | | Allergan, Inc., 5.75%, 4/1/16, (R) | | | 827,418 | |
| | 780,000 | | | American General Finance, 4.50%, 11/15/07 | | | 768,526 | |
| | 2,500,000 | | | American International Group, 4.70%, 10/1/10, (R) | | | 2,408,435 | |
| | 775,000 | | | AOL Time Warner, Inc., 6.88%, 5/1/12 (L) | | | 801,896 | |
| | 2,400,000 | | | AOL Time Warner, Inc., 7.63%, 4/15/31 (L) | | | 2,591,604 | |
| | 1,000,000 | | | Bank of America Corp., 4.38%, 12/1/10 | | | 951,063 | |
| | 3,675,000 | | | Bottling Group LLC, 5.00%, 11/15/13 | | | 3,500,110 | |
| | 3,800,000 | | | Burlington Northern Santa Fe, 6.75%, 7/15/11 | | | 3,966,323 | |
| | 2,500,000 | | | Carolina Power & Light, 6.50%, 7/15/12 | | | 2,572,025 | |
| | 750,000 | | | CarrAmerica Realty Corp., 5.13%, 9/1/11 | | | 753,085 | |
| | 1,500,000 | | | Caterpillar Financial Services Corp., 3.70%, 8/15/08 | | | 1,442,210 | |
| | 10,000,000 | | | Coca-Cola Enterprises, 0.00%, 6/20/20 | | | 4,114,980 | |
| | 1,600,000 | | | EOP Operating LP, 6.80%, 1/15/09 | | | 1,634,782 | |
| | 1,901,265 | | | FedEx Corp., 6.72%, 1/15/22, Series 98-1A (L) | | | 1,977,800 | |
| | 1,950,000 | | | Firstar Bank, 7.13%, 12/1/09 | | | 2,034,454 | |
| | 4,510,000 | | | General Electric Capital Corp., 6.13%, 2/22/11 | | | 4,599,348 | |
| | 3,350,000 | | | General Mills, Inc., 6.00%, 2/15/12 | | | 3,373,691 | |
| | 2,000,000 | | | Home Depot, Inc., 5.40%, 3/1/16 | | | 1,920,702 | |
| | 600,000 | | | Household Finance Corp., 4.75%, 5/15/09 (L) | | | 586,238 | |
| | 1,500,000 | | | Household Finance Corp., 4.13%, 11/16/09 | | | 1,428,750 | |
| | 1,070,000 | | | International Paper Co., 6.50%, 11/15/07 | | | 1,077,772 | |
| | 475,000 | | | International Paper Co., 5.85%, 10/30/12 | | | 468,274 | |
| | 1,750,000 | | | Kinder Morgan Energy Partners, 7.40%, 3/15/31 | | | 1,815,681 | |
| | 2,235,000 | | | May Department Stores Co., 7.45%, 9/15/11 | | | 2,364,932 | |
| | 4,000,000 | | | Merrill Lynch & Co., 4.13%, 9/10/09 | | | 3,822,192 | |
| | 4,250,000 | | | Metlife, Inc., 5.00%, 6/15/15 (L) | | | 3,938,415 | |
| | 3,055,000 | | | Morgan Stanley, 3.63%, 4/1/08 (L) | | | 2,957,778 | |
| | 1,250,000 | | | National City Corp., 4.50%, 3/15/10 | | | 1,199,720 | |
| | 1,185,000 | | | National City Corp., 6.88%, 5/15/19 | | | 1,258,848 | |
| | 560,000 | | | Nomura Asset Acceptance Corp., 6.41%, 5/25/36 | | | 556,304 | |
| | 3,785,000 | | | PNC Funding Corp., 6.13%, 2/15/09 | | | 3,826,218 | |
| | 5,015,000 | | | SBC Communications, Inc., 4.13%, 9/15/09 (L) | | | 4,768,032 | |
| | 900,000 | | | Sprint Capital Corp., 7.63%, 1/30/11 | | | 958,903 | |
| | 2,930,000 | | | Sprint Capital Corp., 6.88%, 11/15/28 | | | 2,960,120 | |
| | 2,000,000 | | | SunTrust Banks, Inc., 4.25%, 10/15/09 | | | 1,914,432 | |
| | 1,000,000 | | | Virginia Electric & Power, 6.00%, 1/15/36 (L) | | | 917,120 | |
| | | | | | | | |
| | | | | Total Corporate Bonds | | | 81,099,675 | |
| | | | | | | | |
| MORTGAGE-BACKED SECURITIES (68.4%): |
| | 4,885,000 | | | Banc of America Commercial Mortgage, Inc., 4.76%, 11/10/39 | | | 4,560,868 | |
| | 3,825,000 | | | Banc of America Commercial Mortgage, Inc., 4.88%, 7/10/42 | | | 3,581,714 | |
| | 4,615,000 | | | Bear Stearns Commercial Mortgage Securities, 5.47%, 6/11/41 | | | 4,488,600 | |
| | 727,973 | | | Commercial Mortgage Pass-Through Certificate, 2.96%, 3/10/39, * | | | 700,505 | |
| | 4,355,000 | | | CS First Boston Mortgage Secruities Corp., 4.75%, 1/15/37 | | | 4,052,231 | |
| | 4,305,000 | | | Deutsche ALT-A Securities, Inc. Mortgage Loan Trust, 5.25%, 6/25/35 | | | 4,205,857 | |
| | 1,370,000 | | | General Electric Capital Commercial Mortgage Corp., 4.60%, 11/10/38 | | | 1,266,777 | |
| | 1,230,000 | | | GMAC Commercial Mortgage Securities, Inc., 5.30%, 8/10/38 | | | 1,183,120 | |
| | 3,130,620 | | | Goldman Sachs Mortgage Securities Corp., 2.90%, 1/10/40 | | | 3,046,502 | |
| | 4,580,000 | | | JP Morgan Chase Commercial Mortgage Securities Corp., 4.40%, 1/12/39 | | | 4,163,017 | |
| | 5,025,000 | | | JP Morgan Chase Commercial Mortgage Securities Corp., 5.38%, 5/15/41, * (L) | | | 4,834,735 | |
| | 4,000,000 | | | JP Morgan Chase Commercial Mortgage Securities Corp., 5.38%, 6/12/41, * | | | 3,909,038 | |
| | 4,000,000 | | | JP Morgan Chase Commercial Mortgage Securities Corp., 5.81%, 6/12/43, * | | | 3,972,000 | |
| | 1,125,000 | | | LB-UBS Commercial Mortgage Trust, 5.02%, 8/15/29 | | | 1,063,881 | |
| | 8,410,000 | | | LB-UBS Commercial Mortgage Trust, 4.79%, 10/15/29 | | | 7,814,733 | |
| | 5,220,000 | | | LB-UBS Commercial Mortgage Trust, 5.59%, 6/15/31 | | | 5,188,520 | |
| | 3,885,000 | | | LB-UBS Commercial Mortgage Trust, 4.93%, 9/15/35 | | | 3,689,941 | |
| | 612,867 | | | Merrill Lynch Mortgage Investors, Inc., 5.37%, 7/25/36 | | | 609,248 | |
| | 1,611,480 | | | Wachovia Bank Commercial Mortgage Trust, 3.00%, 4/15/35 | | | 1,560,015 | |
| | 3,000,000 | | | Washington Mutual, Inc., 4.20%, 1/15/10 (L) | | | 2,855,856 | |
| | 1,125,000 | | | Washington Mutual, Inc., 3.99%, 10/25/33, * | | | 1,083,466 | |
| | 4,130,000 | | | Washington Mutual, Inc., 4.68%, 5/25/35 | | | 3,951,319 | |
| | 3,500,000 | | | Wells Fargo Corp., 4.20%, 1/15/10 | | | 3,347,362 | |
| | 4,605,000 | | | Wells Fargo Mortgage Backed Securities Trust, 3.54%, 9/25/34, * | | | 4,382,857 | |
| | 5,320,000 | | | Wells Fargo Mortgage Backed Securities Trust, 5.62%, 5/25/36, * | | | 5,225,303 | |
| | | | | Fannie Mae | | | | |
| | 5,545,265 | | | 7.07%, 11/1/06 | | | 5,534,284 | |
| | 1,482,865 | | | 7.21%, 5/1/07 | | | 1,483,140 | |
| | 463,057 | | | 6.61%, 9/1/07 | | | 464,088 | |
| | 2,110,352 | | | 6.23%, 1/1/08 | | | 2,112,078 | |
| | 3,525,903 | | | 6.36%, 8/1/08 | | | 3,546,331 | |
| | 908,601 | | | 6.13%, 10/1/08 | | | 911,332 | |
| | 1,549,226 | | | 7.01%, 11/1/08 | | | 1,579,103 | |
| | 4,024,358 | | | 6.14%, 4/1/09 | | | 4,045,438 | |
| | 3,300,312 | | | 7.26%, 12/1/10 | | | 3,472,832 | |
| | | | |
| | | | | |
| 14 | | See accompanying notes to financial statements. | | |
portfolio of investments (continued)
NEW COVENANT INCOME FUND
June 30, 2006
| | | | | | | | | |
| Principal | | | | | Value | |
| Amount | | | | | (Note 2) | |
| |
| | | | | Fannie Mae (cont): | | | | |
| $ | 7,867,607 | | | 6.20%, 1/1/11 | | | 7,975,932 | |
| | 2,598,431 | | | 6.48%, 1/1/11 | | | 2,659,023 | |
| | 1,049,787 | | | 4.92%, 4/1/11 | | | 1,025,445 | |
| | 4,694,410 | | | 6.10%, 4/1/11 | | | 4,801,999 | |
| | 938,184 | | | 6.09%, 5/1/11 | | | 948,241 | |
| | 1,310,289 | | | 6.31%, 5/1/11 | | | 1,334,911 | |
| | 2,515,959 | | | 6.13%, 10/1/11 | | | 2,552,158 | |
| | 5,897,754 | | | 3.95%, 7/1/13 | | | 5,336,265 | |
| | 3,521,336 | | | 6.00%, 12/25/16 | | | 3,540,596 | |
| | 1,448,446 | | | 6.50%, 8/1/17 | | | 1,469,903 | |
| | 4,102,938 | | | 5.00%, 1/1/21 | | | 3,961,668 | |
| | 6,225,000 | | | 5.00%, 7/1/21 (b) | | | 5,995,453 | |
| | 3,945,000 | | | 5.00%, 7/1/21 (b) | | | 3,799,528 | |
| | 9,065,000 | | | 5.00%, 7/1/21 (b) | | | 8,730,728 | |
| | 12,955,000 | | | 5.00%, 7/1/21 (b) | | | 12,477,285 | |
| | 4,830,000 | | | 5.00%, 7/1/21 (b) | | | 4,651,894 | |
| | 1,357,533 | | | 4.50%, 9/25/25 | | | 1,324,465 | |
| | 167,606 | | | 7.50%, 5/1/27 | | | 174,079 | |
| | 166,731 | | | 7.50%, 4/1/29, Pool #323640 | | | 173,104 | |
| | 138,865 | | | 7.50%, 4/1/29, Pool #323645 | | | 144,172 | |
| | 10,043 | | | 7.50%, 8/1/29, Pool #252712 | | | 10,427 | |
| | 145,333 | | | 7.50%, 7/1/30 | | | 150,888 | |
| | 5,738,000 | | | 5.00%, 10/25/30 | | | 5,475,653 | |
| | 568,277 | | | 7.50%, 12/1/30 | | | 589,877 | |
| | 1,986,516 | | | 6.09%, 10/25/31 | | | 1,980,789 | |
| | 993,256 | | | 5.00%, 5/25/32 | | | 955,884 | |
| | 704,672 | | | 7.00%, 6/1/32 | | | 722,121 | |
| | 960,000 | | | 4.50%, 7/25/33 | | | 913,366 | |
| | 1,019,203 | | | 5.50%, 7/25/34 | | | 1,005,409 | |
| | 2,135,000 | | | 5.00%, 8/25/34 | | | 2,082,083 | |
| | 2,735,000 | | | 5.50%, 10/25/34 | | | 2,601,439 | |
| | 4,165,378 | | | 5.50%, 12/25/34 | | | 4,108,446 | |
| | 4,115,000 | | | 5.50%, 12/25/34 | | | 3,913,936 | |
| | 5,133,738 | | | 5.50%, 2/1/35, Pool #735224 | | | 4,954,124 | |
| | 2,573,856 | | | 5.50%, 8/1/35, ARM 835749 | | | 2,474,723 | |
| | 4,547,191 | | | 5.36%, 9/1/35, ARM 836133 | | | 4,414,581 | |
| | 675,626 | | | 5.50%, 10/1/35, ARM 836178 | | | 649,605 | |
| | 1,259,908 | | | 5.46%, 1/1/36 | | | 1,228,150 | |
| | 4,826,284 | | | 5.48%, 1/1/36, ARM 849272 | | | 4,763,284 | |
| | 2,283,538 | | | 5.52%, 2/1/36, ARM 852435 | | | 2,257,810 | |
| | 5,915,000 | | | 5.50%, 7/1/36 (b) | | | 5,682,097 | |
| | 1,095,000 | | | 5.50%, 7/1/36 (b) | | | 1,051,884 | |
| | 4,275,000 | | | 5.50%, 7/1/36 (b) | | | 4,106,672 | |
| | 5,275,000 | | | 5.50%, 7/1/36 (b) | | | 5,067,297 | |
| | 3,380,000 | | | 5.50%, 7/1/36 (b) | | | 3,246,913 | |
| | 3,260,000 | | | 5.50%, 7/1/36 (b) | | | 3,131,638 | |
| | 3,695,000 | | | 5.50%, 7/1/36 (b) | | | 3,549,509 | |
| | 4,627,861 | | | 5.90%, 7/25/42 | | | 4,595,995 | |
| | 7,645,000 | | | 5.50%, 11/25/43 | | | 7,574,132 | |
| |
| Shares or | | | | | | |
| Principal Amount | | | | | | |
| |
| | | | | Freddie Mac | | | | |
| | 5,532,864 | | | 6.98%, 10/1/10, Pool #W20024 | | | 5,761,372 | |
| | 1,285,000 | | | 6.90%, 12/1/10 | | | 1,337,942 | |
| | 2,348,706 | | | 4.00%, 8/15/13 | | | 2,303,108 | |
| | 1,490,000 | | | 4.50%, 8/15/13 | | | 1,462,203 | |
| | 3,105,000 | | | 4.50%, 7/15/16 | | | 3,008,980 | |
| | 1,047,250 | | | 6.00%, 11/15/16 | | | 1,054,130 | |
| | 3,475,984 | | | 6.00%, 5/15/17 | | | 3,498,223 | |
| | 758,691 | | | 6.50%, 9/1/19 | | | 767,962 | |
| | 4,150,000 | | | 5.00%, 2/15/20 | | | 4,047,727 | |
| | 1,955,336 | | | 4.50%, 10/1/20, Pool #G11897 | | | 1,846,667 | |
| | 4,285,014 | | | 5.00%, 12/1/20, Pool #G11880 (b) | | | 4,126,888 | |
| | 4,209,454 | | | 5.00%, 4/1/21, Pool #G12185 (b) | | | 4,054,116 | |
| | 5,240,000 | | | 5.00%, 2/15/28 | | | 5,071,486 | |
| | 1,240,000 | | | 5.50%, 4/15/30 | | | 1,212,472 | |
| | 4,165,000 | | | 5.00%, 7/15/30 | | | 3,982,608 | |
| | 3,973,022 | | | 5.00%, 5/15/31 | | | 3,871,326 | |
| | 3,216,444 | | | 5.00%, 6/15/31 | | | 3,132,471 | |
| | 5,270,000 | | | 5.00%, 8/15/31 | | | 4,980,645 | |
| | 1,230,000 | | | 5.00%, 3/15/32 | | | 1,158,674 | |
| | 5,124,482 | | | 4.50%, 6/15/32 | | | 4,884,858 | |
| | 3,150,000 | | | 5.50%, 6/15/32 | | | 3,054,115 | |
| | 4,165,000 | | | 5.00%, 10/15/32 | | | 3,931,473 | |
| | 4,150,000 | | | 5.00%, 6/15/33 | | | 3,849,508 | |
| | 4,297,000 | | | 5.50%, 6/15/33 | | | 4,045,055 | |
| | 1,040,000 | | | 5.00%, 10/15/33 | | | 963,240 | |
| | 3,395,000 | | | 5.00%, 3/15/34 | | | 3,142,996 | |
| | 3,120,000 | | | 5.00%, 5/15/34 | | | 2,885,210 | |
| | 1,115,000 | | | 5.00%, 6/15/34 | | | 1,031,130 | |
| | 950,000 | | | 5.00%, 9/15/34 | | | 878,493 | |
| | 1,125,000 | | | 5.50%, 6/15/35 | | | 1,068,075 | |
| | 2,667,653 | | | 5.00%, 12/1/35, Pool #A40536 | | | 2,494,095 | |
| | 1,124,872 | | | 5.35%, 4/1/36 | | | 1,100,764 | |
| | 4,375,000 | | | 5.00%, 7/1/36 (b) | | | 4,086,521 | |
| | 1,430,000 | | | 5.00%, 7/1/36 (b) | | | 1,335,709 | |
| | 535,000 | | | 5.00%, 7/1/36 (b) | | | 499,723 | |
| | | | | | | | |
| | | | | Total Mortgage-backed Securities | | | 360,151,637 | |
| | | | | | | | |
| U.S. TREASURY OBLIGATIONS (10.8%): |
| | 8,295,000 | | | U.S. Treasury Bonds, 7.50%, 11/15/16 (L) | | | 9,814,030 | |
| | 24,710,000 | | | U.S. Treasury Bonds, 7.25%, 8/15/22 (L) | | | 29,819,954 | |
| | 15,390,000 | | | U.S. Treasury Notes, 3.00%, 2/15/08 (L) | | | 14,874,805 | |
| | 840,000 | | | U.S. Treasury Notes, 3.38%, 11/15/08 (L) | | | 807,253 | |
| | 1,775,000 | | | U.S. Treasury Notes, 4.25%, 8/15/15 (L) | | | 1,661,359 | |
| | | | | | | | |
| | | | | Total U.S. Treasury Obligations | | | 56,977,401 | |
| | | | | | | | |
| CLOSED END INVESTMENT COMPANIES (1.3%): |
| | 358,900 | | | MFS Government Markets Income Trust | | | 2,253,892 | |
| | 175,300 | | | MFS Intermediate Income Trust | | | 1,067,577 | |
| | 148,700 | | | Putnam Master Intermediate Income Trust | | | 890,713 | |
| | 139,900 | | | Putnam Premier Income Trust | | | 840,799 | |
| | 69,500 | | | Salomon Brothers Global High Income Fund Inc. (L) | | | 874,310 | |
| | 72,500 | | | Western Asset/Claymore US Treasury Inflation Protected Securities Fund | | | 807,650 | |
| | | | | | | | |
| | | | | Total Closed End Investment Companies | | | 6,734,941 | |
| | | | | | | | |
| CASH EQUIVALENTS (16.2%): |
| $ | 85,323,194 | | | JP Morgan Cash Trade Execution (c) | | | 85,323,194 | |
| | | | | | | | |
| | | | | Total Cash Equivalents | | | 85,323,194 | |
| | | | | | | | |
| INVESTMENTS HELD AS COLLATERAL FOR LOANED SECURITIES (5.9%): |
| | 7,500,000 | | | Cantor Fitzgerald & Co. Repurchase Agreement, 5.36%, 7/3/06 (Purchased on 6/30/06, proceeds at maturity $7,503,352 collateralized by various corporate bonds, fair value $7,875,000) | | | 7,500,000 | |
| | 4,998,350 | | | CC USA, Inc. MTN, 5.38%, 7/3/06* | | | 4,998,350 | |
| | 1,000,000 | | | Citigroup, Inc. MTN, 5.41%, 7/3/06* | | | 1,000,000 | |
| | 1,000,000 | | | Deutsche Bank Securities, Inc. Repurchase Agreement, 5.36%, 7/3/06 (Purchased on 6/30/06, proceeds at maturity $1,000,447, collateralized by various corporate bonds, fair value $1,050,000) | | | 1,000,000 | |
| | | | |
| | | | | |
| | | See accompanying notes to financial statements. | | 15 |
portfolio of investments (continued)
NEW COVENANT INCOME FUND
June 30, 2006
| | | | | | | | | |
| Principal | | | | | Value | |
| Amount | | | | | (Note 2) | |
| |
| INVESTMENTS HELD AS COLLATERAL FOR LOANED SECURITIES (cont.): |
| $ | 1,000,000 | | | Lehman Brothers Repurchase Agreement 5.46%, 7/3/06 (Purchased on 6/30/06, proceeds at maturity $1,000,455 collateralized by various corporate bonds, fair value $1,050,000) | | $ | 1,000,000 | |
| | 2,000,000 | | | Lehman Holdings MTN, 5.43%, 7/3/06* | | | 2,000,000 | |
| | 3,022,238 | | | Merrill Lynch & Co. MTN, 5.35%, 7/3/06* | | | 3,022,238 | |
| | 1,000,000 | | | Merrill Lynch Repurchase Agreement, 5.35%, 7/3/06 (Purchased on 6/30/06, proceeds at maturity $1,000,446, collateralized by various corporate bonds, fair value $1,050,000) | | | 1,000,000 | |
| | 6,000,000 | | | Merrill Lynch Repurchase Agreement, 5.37%, 7/3/06, (Purchased on 6/30/06, proceeds at maturity $6,002,686, collateralized by various corporate bonds, fair value $6,300,000) | | | 6,000,000 | |
| | 2,000,000 | | | Monumental Global Funding II MTN, 5.47%, 7/3/06* | | | 2,000,000 | |
| | 1,010,418 | | | Morgan Stanley Repurchase Agreement, 5.25%, 7/3/06 (Purchased on 6/30/06, proceeds at maturity $1,010,860, collateralized by various U.S. government agency obligations, fair value $1,030,626) | | | 1,010,418 | |
| | 750,000 | | | Morgan Stanley Repurchase Agreement, 5.44%, 7/3/06 (Purchased on 6/30/06, proceeds at maturity $750,340, collateralized by various corporate bonds, fair value $787,500) | | | 750,000 | |
| | 250,007 | | | Royal Bank of Canada Yankee CD, 5.30%, 7/3/06* | | | 250,007 | |
| | | | | | | | |
| | | | | Total Investments Held As Collateral For Loaned Securities | | | 31,531,013 | |
| | | | | | | | |
| TOTAL INVESTMENTS (Cost $651,006,675) (a) | | $ | 639,613,031 | |
| | | | | | | | |
| | |
| Percentages indicated are based on net assets of $526,358,578. |
| |
| (a) | | See notes to financial statements for tax unrealized appreciation (depreciation) of securities. |
| |
| (b) | | Security purchased on a when-issued or delayed delivery basis. |
| |
| (c) | | All or a portion of this security has been segregated as collateral for securities purchased on a when-issued or delayed delivery basis. |
| |
| (L) | | A portion or all of the security is on loan. |
| |
| (R) | | Security exempt from registration under Rule 144A of the Securities Act of 1933. These securities may be resold in transactions exempt from registration, normally to qualified institutional buyers. The Advisor, using procedures approved by the Board of Trustees, has deemed these securities to be liquid. |
| |
| * | | Variable rate security. The interest rate shown reflects the rate in effect as of June 30, 2006. |
MTN Medium Term Note
| | | | |
| | | | | |
| 16 | | See accompanying notes to financial statements. | | |
portfolio of investments
NEW COVENANT BALANCED GROWTH FUND
June 30, 2006
| | | | | | | | | |
| | | | | | | Value | |
| Shares | | | | | (Note 2) | |
| |
| INVESTMENT COMPANIES (98.5%): |
| | 5,880,734 | | | New Covenant Growth Fund (b) | | $ | 192,652,833 | |
| | 4,732,994 | | | New Covenant Income Fund (b) | | | 114,917,096 | |
| | | | | | | | |
| | | | | Total Investment Companies | | | 307,569,929 | |
| | | | | | | | |
| | | | | | | | | |
| Principal | | | | | | | |
| Amount | | | | | | | |
| CASH EQUIVALENTS (0.8%): |
| $ | 2,459,843 | | | JP Morgan Cash Trade Execution | | | 2,459,843 | |
| | | | | | | | |
| | | | | Total Cash Equivalents | | | 2,459,843 | |
| | | | | | | | |
| | | | | | | | | |
| TOTAL INVESTMENTS | | | | |
| (Cost $280,116,245) (a) | | $ | 310,029,772 | |
| | | | | | | | |
| | |
| Percentages indicated are based on net assets of $312,077,054. |
| |
| (a) | | See notes to financial statements for tax unrealized appreciation (depreciation) of securities. |
| |
| (b) | | Investment in affiliate in accordance with Section 12(d)(1)(G) of the Investment Company Act of 1940, as amended. |
NEW COVENANT BALANCED INCOME FUND
June 30, 2006
| | | | | | | | | |
| | | | | | | Value | |
| Shares | | | | | (Note 2) | |
| |
| INVESTMENT COMPANIES (98.7%): |
| | 1,392,107 | | | New Covenant Growth Fund (b) | | $ | 45,605,426 | |
| | 3,100,800 | | | New Covenant Income Fund (b) | | | 75,287,422 | |
| | | | | | | | |
| | | | | Total Investment Companies | | | 120,892,848 | |
| | | | | | | | |
| | | | | | | | | |
| Principal | | | | | | | |
| Amount | | | | | | | |
| CASH EQUIVALENTS (2.5%): |
| $ | 3,018,395 | | | JP Morgan Cash Trade Execution | | | 3,018,395 | |
| | | | | | | | |
| | | | | Total Cash Equivalents | | | 3,018,395 | |
| | | | | | | | |
| | | | | | | | | |
| TOTAL INVESTMENTS | | | | |
| (Cost $115,618,687) (a) | | $ | 123,911,243 | |
| | | | | | | | |
| | |
| Percentages indicated are based on net assets of $122,512,346. |
| |
| (a) | | See notes to financial statements for tax unrealized appreciation (depreciation) of securities. |
| |
| (b) | | Investment in affiliate in accordance with Section 12(d)(1)(G) of the Investment Company Act of 1940, as amended. |
| | | | |
| | | | | |
| | | See accompanying notes to financial statements. | | 17 |
statements of assets and liabilities
NEW COVENANT FUNDS
June 30, 2006
| | | | | | | | | | | | | | | | | |
| | | | | | | | | | | Balanced | | | Balanced | |
| | | Growth Fund | | | Income Fund | | | Growth Fund | | | Income Fund | |
| |
ASSETS: | | | | | | | | | | | | | | | | |
| Investments, at value (Cost $798,919,657, $619,475,662, $2,459,843, and $3,018,395, respectively) | | $ | 907,421,694 | | | $ | 608,082,018 | | | $ | 2,459,843 | | | $ | 3,018,395 | |
| Investment in affiliates (Cost $0, $0, $277,656,402, and $112,600,292, respectively) | | | — | | | | — | | | | 307,569,929 | | | | 120,892,848 | |
| Investments held as collateral for loaned securities (Cost $119,555,788, $31,531,013, $0, and $0, respectively) | | | 119,555,788 | | | | 31,531,013 | | | | — | | | | — | |
| | | | | | | | | | | | | |
| Total Investments | | | 1,026,977,482 | | | | 639,613,031 | | | | 310,029,772 | | | | 123,911,243 | |
| Cash | | | — | | | | — | | | | 2,065,825 | | | | — | |
| Foreign currency, at value (Cost $71,108, $0, $0, and $0, respectively) | | | 71,242 | | | | — | | | | — | | | | — | |
| Interest and dividends receivable | | | 868,748 | | | | 4,903,981 | | | | 18,865 | | | | 7,717 | |
| Receivable for capital shares issued | | | 2,326 | | | | 4,248 | | | | 25,276 | | | | 1,483 | |
| Receivable for investments sold | | | 2,283,896 | | | | 24,336,690 | | | | — | | | | — | |
| Receivable for forward foreign currency contracts | | | 844 | | | | — | | | | — | | | | — | |
| Receivable from Advisor | | | — | | | | — | | | | 68,522 | | | | 25,453 | |
| Reclaims receivable | | | 72,300 | | | | — | | | | — | | | | — | |
| Prepaid expenses | | | 16,123 | | | | 14,961 | | | | 12,439 | | | | 10,845 | |
| | | | | | | | | | | | | |
| Total Assets | | | 1,030,292,961 | | | | 668,872,911 | | | | 312,220,699 | | | | 123,956,741 | |
| | | | | | | | | | | | | |
| | | | | | | | | | | | | | | | | |
LIABILITIES: | | | | | | | | | | | | | | | | |
| Payable for investments purchased | | | 3,153,723 | | | | 106,450,610 | | | | — | | | | — | |
| Payable for capital shares redeemed | | | 5,737 | | | | 2,302 | | | | 3,929 | | | | 168,791 | |
| Payable for forward foreign currency contracts | | | 3,318 | | | | — | | | | — | | | | — | |
| Payable for return of collateral received on securities loaned | | | 119,555,788 | | | | 31,531,013 | | | | — | | | | — | |
| Cash overdraft | | | 676,859 | | | | 4,121,609 | | | | — | | | | 1,217,918 | |
| Accrued expenses and other payables: | | | | | | | | | | | | | | | | |
| Investment advisory | | | 603,486 | | | | 255,857 | | | | — | | | | — | |
| Administration | | | 3,278 | | | | 2,516 | | | | 1,339 | | | | 547 | |
| Shareholder service | | | 124,320 | | | | 70,387 | | | | 68,793 | | | | 25,398 | |
| Transfer agent | | | 13,715 | | | | 11,270 | | | | 28,542 | | | | 14,454 | |
| Accounting | | | 27,553 | | | | 13,999 | | | | 7,819 | | | | 2,677 | |
| Chief Compliance Officer | | | 16,387 | | | | 7,240 | | | | 5,738 | | | | 1,971 | |
| Other | | | 99,165 | | | | 47,530 | | | | 27,485 | | | | 12,639 | |
| | | | | | | | | | | | | |
| Total Liabilities | | | 124,283,329 | | | | 142,514,333 | | | | 143,645 | | | | 1,444,395 | |
| | | | | | | | | | | | | |
| | | | | | | | | | | | | | | | | |
NET ASSETS | | $ | 906,009,632 | | | $ | 526,358,578 | | | $ | 312,077,054 | | | $ | 122,512,346 | |
| | | | | | | | | | | | | |
NET ASSETS consist of: | | | | | | | | | | | | | | | | |
| Paid-in Capital | | | 855,350,310 | | | | 544,783,226 | | | | 307,289,739 | | | | 120,204,147 | |
| Undistributed (distributions in excess of) net investment income | | | (430,316 | ) | | | — | | | | — | | | | 338 | |
| Accumulated net realized gains/(losses) on investments and foreign currency transactions | | | (57,412,767 | ) | | | (7,031,004 | ) | | | (25,126,212 | ) | | | (5,984,695 | ) |
| Net unrealized appreciation/(depreciation) on investment transactions and translation of assets and liabilities denominated in foreign currencies | | | 108,502,405 | | | | (11,393,644 | ) | | | 29,913,527 | | | | 8,292,556 | |
| | | | | | | | | | | | | |
| Net Assets | | $ | 906,009,632 | | | $ | 526,358,578 | | | $ | 312,077,054 | | | $ | 122,512,346 | |
| | | | | | | | | | | | | |
| | | | | | | | | | | | | | | | | |
| Shares outstanding | | | 27,659,325 | | | | 21,675,568 | | | | 3,838,632 | | | | 6,452,994 | |
| Net asset value, offering and redemption price per share | | $ | 32.76 | | | $ | 24.28 | | | $ | 81.30 | | | $ | 18.99 | |
See accompanying notes to financial statements.
18
statements of operations
NEW COVENANT FUNDS
For the year ended June 30, 2006
| | | | | | | | | | | | | | | | | |
| | | | | | | | | | | Balanced | | | Balanced | |
| | | Growth Fund | | | Income Fund | | | Growth Fund | | | Income Fund | |
| |
INVESTMENT INCOME: | | | | | | | | | | | | | | | | |
| Interest | | $ | 636,200 | | | $ | 25,886,777 | | | $ | 174,922 | | | $ | 68,331 | |
| Dividend | | | 14,153,469 | | | | 242,155 | | | | — | | | | — | |
| Dividend income from affiliates | | | — | | | | — | | | | 5,949,231 | | | | 3,507,264 | |
| Foreign tax withholding | | | (206,765 | ) | | | — | | | | — | | | | — | |
| Income from securities lending | | | 366,364 | | | | 79,139 | | | | — | | | | — | |
| | | | | | | | | | | | | |
| Total Income | | | 14,949,268 | | | | 26,208,071 | | | | 6,124,153 | | | | 3,575,595 | |
| | | | | | | | | | | | | |
| | | | | | | | | | | | | | | | | |
EXPENSES: | | | | | | | | | | | | | | | | |
| Investment advisory | | | 8,966,603 | | | | 4,027,005 | | | | — | | | | — | |
| Administration | | | 181,128 | | | | 107,378 | | | | 61,943 | | | | 25,059 | |
| Shareholder service | | | 1,627,734 | | | | 862,816 | | | | 758,349 | | | | 308,418 | |
| Accounting | | | 285,678 | | | | 158,978 | | | | 80,701 | | | | 33,026 | |
| Custodian | | | 85,506 | | | | 5,117 | | | | 435 | | | | 446 | |
| Chief Compliance Officer | | | 12,516 | | | | 6,381 | | | | 4,280 | | | | 1,696 | |
| Transfer agent | | | 68,497 | | | | 64,943 | | | | 144,016 | | | | 76,658 | |
| Other | | | 324,006 | | | | 210,364 | | | | 133,571 | | | | 64,761 | |
| | | | | | | | | | | | | |
| Total expenses before contractual fee reductions | | | 11,551,668 | | | | 5,442,982 | | | | 1,183,295 | | | | 510,064 | |
| Expenses contractually reduced by Advisor | | | (1,625,344 | ) | | | (865,232 | ) | | | (758,079 | ) | | | (308,474 | ) |
| Expenses contractually reduced by Administrator | | | (134,950 | ) | | | (80,016 | ) | | | (46,154 | ) | | | (18,674 | ) |
| Expenses paid indirectly | | | (121,110 | ) | | | (1,901 | ) | | | — | | | | — | |
| | | | | | | | | | | | | |
| Total Expenses | | | 9,670,264 | | | | 4,495,833 | | | | 379,062 | | | | 182,916 | |
| | | | | | | | | | | | | |
| | | | | | | | | | | | | | | | | |
NET INVESTMENT INCOME | | | 5,279,004 | | | | 21,712,238 | | | | 5,745,091 | | | | 3,392,679 | |
| | | | | | | | | | | | | |
| | | | | | | | | | | | | | | | | |
REALIZED AND UNREALIZED GAINS/ (LOSSES) FROM INVESTMENTS AND FOREIGN CURRENCY TRANSACTIONS: | | | | | | | | | | | | | | | | |
| Net realized gains/(losses) on investment and foreign currency transactions | | | 79,446,959 | | | | (5,468,313 | ) | | | (326,125 | ) | | | (139,528 | ) |
| Net change in unrealized appreciation/(depreciation) on investments and translation of assets and liabilities denominated in foreign currency | | | 2,215,704 | | | | (21,045,802 | ) | | | 12,330,244 | | | | 744,992 | |
| | | | | | | | | | | | | |
| Net realized/unrealized gains/(losses) on investments and foreign currency | | | 81,662,663 | | | | (26,514,115 | ) | | | 12,004,119 | | | | 605,464 | |
| | | | | | | | | | | | | |
| Change in net assets resulting from operations | | $ | 86,941,667 | | | $ | (4,801,877 | ) | | $ | 17,749,210 | | | $ | 3,998,143 | |
| | | | | | | | | | | | | |
See accompanying notes to financial statements.
19
statements of changes in net assets
NEW COVENANT FUNDS
| | | | | | | | | | | | | | | | | |
| | | Growth Fund | | | Income Fund | |
| | | For the | | | For the | | | For the | | | For the | |
| | | Year Ended | | | Year Ended | | | Year Ended | | | Year Ended | |
| | | June 30, 2006 | | | June 30, 2005 | | | June 30, 2006 | | | June 30, 2005 | |
OPERATIONS: | | | | | | | | | | | | | | | | |
| Net investment income | | $ | 5,279,004 | | | $ | 6,327,831 | | | $ | 21,712,238 | | | $ | 19,505,062 | |
| Net realized gains/(losses) on investment and foreign currency transactions | | | 79,446,959 | | | | 28,371,237 | | | | (5,468,313 | ) | | | 4,612,365 | |
| Net change in unrealized appreciation/(depreciation) on investments and translation of assets and liabilities denominated in foreign currency | | | 2,215,704 | | | | 26,222,561 | | | | (21,045,802 | ) | | | 6,746,552 | |
| | | | | | | | | | | | | |
| Change in net assets resulting from operations | | | 86,941,667 | | | | 60,921,629 | | | | (4,801,877 | ) | | | 30,863,979 | |
| | | | | | | | | | | | | |
| | | | | | | | | | | | | | | | | |
DISTRIBUTIONS TO SHAREHOLDERS: | | | | | | | | | | | | | | | | |
| From net investment income | | | (5,561,246 | ) | | | (6,321,345 | ) | | | (22,526,735 | ) | | | (21,501,226 | ) |
| From net realized gains/(losses) on investment | | | — | | | | — | | | | (236,126 | ) | | | (1,303,165 | ) |
| Tax return of capital | | | — | | | | — | | | | (7,219 | ) | | | — | |
| | | | | | | | | | | | | |
| Change in net assets from shareholder distributions | | | (5,561,246 | ) | | | (6,321,345 | ) | | | (22,770,080 | ) | | | (22,804,391 | ) |
| | | | | | | | | | | | | |
| | | | | | | | | | | | | | | | | |
CAPITAL TRANSACTIONS: | | | | | | | | | | | | | | | | |
| Proceeds from shares issued | | | 46,592,143 | | | | 50,628,532 | | | | 77,699,741 | | | | 39,398,853 | |
| Dividends reinvested | | | 398,185 | | | | 403,177 | | | | 1,894,158 | | | | 2,523,604 | |
| Cost of shares redeemed | | | (100,943,787 | ) | | | (61,624,740 | ) | | | (52,871,436 | ) | | | (46,798,854 | ) |
| | | | | | | | | | | | | |
| Change in net assets from share transactions | | | (53,953,459 | ) | | | (10,593,031 | ) | | | 26,722,463 | | | | (4,876,397 | ) |
| | | | | | | | | | | | | |
| Change in net assets | | | 27,426,962 | | | | 44,007,253 | | | | (849,494 | ) | | | 3,183,191 | |
| | | | | | | | | | | | | |
| | | | | | | | | | | | | | | | | |
NET ASSETS: | | | | | | | | | | | | | | | | |
| Beginning of year | | | 878,582,670 | | | | 834,575,417 | | | | 527,208,072 | | | | 524,024,881 | |
| | | | | | | | | | | | | |
| End of year | | $ | 906,009,632 | | | $ | 878,582,670 | | | $ | 526,358,578 | | | $ | 527,208,072 | |
| | | | | | | | | | | | | |
| | | | | | | | | | | | | | | | | |
SHARE TRANSACTIONS: | | | | | | | | | | | | | | | | |
| Issued | | | 1,430,614 | | | | 1,761,611 | | | | 3,095,727 | | | | 1,545,813 | |
| Reinvested | | | 12,377 | | | | 13,925 | | | | 76,612 | | | | 95,941 | |
| Redeemed | | | (3,151,687 | ) | | | (2,144,207 | ) | | | (2,124,522 | ) | | | (1,830,986 | ) |
| | | | | | | | | | | | | |
| Net increase (decrease) | | | (1,708,696 | ) | | | (368,671 | ) | | | 1,047,817 | | | | (189,232 | ) |
| | | | | | | | | | | | | |
| | | | | | | | | | | | | | | | | |
| Undistributed (distributions in excess of) net investment income (loss) | | $ | (430,316 | ) | | $ | (139,239 | ) | | $ | — | | | $ | 33,110 | |
| | | | | | | | | | | | | |
See accompanying notes to financial statements.
20
statements of changes in net assets
NEW COVENANT FUNDS
| | | | | | | | | | | | | | | | | |
| | | Balanced Growth Fund | | | Balanced Income Fund | |
| | | For the | | | For the | | | For the | | | For the | |
| | | Year Ended | | | Year Ended | | | Year Ended | | | Year Ended | |
| | | June 30, 2006 | | | June 30, 2005 | | | June 30, 2006 | | | June 30, 2005 | |
OPERATIONS: | | | | | | | | | | | | | | | | |
| Net investment income | | $ | 5,745,091 | | | $ | 5,580,288 | | | $ | 3,392,679 | | | $ | 3,185,482 | |
| Net realized gains/(losses) on investment and foreign currency transactions | | | (326,125 | ) | | | (6,816,575 | ) | | | (139,528 | ) | | | (1,712,699 | ) |
| Realized gain distributions from underlying funds | | | — | | | | 274,261 | † | | | — | | | | 181,705 | † |
| Net change in unrealized appreciation/(depreciation) on investments and translation of assets and liabilities denominated in foreign currency | | | 12,330,244 | | | | 20,674,190 | | | | 744,992 | | | | 5,905,857 | |
| | | | | | | | | | | | | |
| Change in net assets resulting from operations | | | 17,749,210 | | | | 19,712,164 | | | | 3,998,143 | | | | 7,560,345 | |
| | | | | | | | | | | | | |
| | | | | | | | | | | | | | | | | |
DISTRIBUTIONS TO SHAREHOLDERS: | | | | | | | | | | | | | | | | |
| From net investment income | | | (5,762,319 | ) | | | (5,571,223 | ) | | | (3,400,312 | ) | | | (3,181,809 | ) |
| Tax return of capital | | | (617 | ) | | | — | | | | — | | | | — | |
| | | | | | | | | | | | | |
| Change in net assets from shareholder distributions | | | (5,762,936 | ) | | | (5,571,223 | ) | | | (3,400,312 | ) | | | (3,181,809 | ) |
| | | | | | | | | | | | | |
| | | | | | | | | | | | | | | | | |
CAPITAL TRANSACTIONS: | | | | | | | | | | | | | | | | |
| Proceeds from shares issued | | | 33,824,396 | | | | 25,120,358 | | | | 13,534,324 | | | | 9,215,771 | |
| Dividends reinvested | | | 4,321,801 | | | | 4,122,054 | | | | 2,072,777 | | | | 1,924,091 | |
| Cost of shares redeemed | | | (43,579,142 | ) | | | (40,305,856 | ) | | | (18,501,980 | ) | | | (15,624,364 | ) |
| | | | | | | | | | | | | |
| Change in net assets from share transactions | | | (5,432,945 | ) | | | (11,063,444 | ) | | | (2,894,879 | ) | | | (4,484,502 | ) |
| | | | | | | | | | | | | |
| Change in net assets | | | 6,553,329 | | | | 3,077,497 | | | | (2,297,048 | ) | | | (105,966 | ) |
| | | | | | | | | | | | | |
| | | | | | | | | | | | | | | | | |
NET ASSETS: | | | | | | | | | | | | | | | | |
| Beginning of year | | | 305,523,725 | | | | 302,446,228 | | | | 124,809,394 | | | | 124,915,360 | |
| | | | | | | | | | | | | |
| End of year | | $ | 312,077,054 | | | $ | 305,523,725 | | | $ | 122,512,346 | | | $ | 124,809,394 | |
| | | | | | | | | | | | | |
| | | | | | | | | | | | | | | | | |
SHARE TRANSACTIONS: | | | | | | | | | | | | | | | | |
| Issued | | | 414,257 | | | | 329,356 | | | | 702,194 | | | | 494,461 | |
| Reinvested | | | 53,383 | | | | 53,802 | | | | 108,749 | | | | 103,269 | |
| Redeemed | | | (535,931 | ) | | | (527,726 | ) | | | (960,940 | ) | | | (842,433 | ) |
| | | | | | | | | | | | | |
| Net increase (decrease) | | | (68,291 | ) | | | (144,568 | ) | | | (149,997 | ) | | | (244,703 | ) |
| | | | | | | | | | | | | |
| | | | | | | | | | | | | | | | | |
| Undistributed (distributions in excess of) net investment income (loss) | | $ | — | | | $ | 17,228 | | | $ | 338 | | | $ | 7,971 | |
| | | | | | | | | | | | | |
| | |
| † | | Represents realized gains from investment transactions with affiliates. |
See accompanying notes to financial statements.
21
financial highlights
NEW COVENANT FUNDS
For a Share outstanding throughout each period.
| | | | | | | | | | | | | | | | | | | | | |
| | | Growth Fund | |
| | | For the | | | For the | | | For the | | | For the | | | For the | |
| | | Year Ended | | | Year Ended | | | Year Ended | | | Year Ended | | | Year Ended | |
| | | June 30, 2006 | | | June 30, 2005 | | | June 30, 2004 | | | June 30, 2003 | | | June 30, 2002 | |
| Net Asset Value, Beginning of Year | | $ | 29.92 | | | $ | 28.07 | | | $ | 23.51 | | | $ | 24.13 | | | $ | 29.26 | |
| | | | | | | | | | | | | | | | |
| | | | | | | | | | | | | | | | | | | | | |
INVESTMENT ACTIVITIES: | | | | | | | | | | | | | | | | | | | | |
| Net investment income | | | 0.18 | | | | 0.21 | | | | 0.07 | | | | 0.10 | | | | 0.04 | |
| Net realized and unrealized gain/(loss) from investments and foreign currency transactions | | | 2.86 | | | | 1.85 | | | | 4.58 | | | | (0.63 | ) | | | (5.11 | ) |
| | | | | | | | | | | | | | | | |
| Total from Investment Activities | | | 3.04 | | | | 2.06 | | | | 4.65 | | | | (0.53 | ) | | | (5.07 | ) |
| | | | | | | | | | | | | | | | |
| | | | | | | | | | | | | | | | | | | | | |
DIVIDENDS: | | | | | | | | | | | | | | | | | | | | |
| Net investment income | | | (0.20 | ) | | | (0.21 | ) | | | (0.09 | ) | | | (0.09 | ) | | | (0.01 | ) |
| Tax return of capital | | | — | | | | — | | | | — | | | | — | | | | (0.05 | ) |
| | | | | | | | | | | | | | | | |
| Total Dividends | | | (0.20 | ) | | | (0.21 | ) | | | (0.09 | ) | | | (0.09 | ) | | | (0.06 | ) |
| | | | | | | | | | | | | | | | |
| | | | | | | | | | | | | | | | | | | | | |
| Change in net asset value per share | | | 2.84 | | | | 1.85 | | | | 4.56 | | | | (0.62 | ) | | | (5.13 | ) |
| | | | | | | | | | | | | | | | |
| | | | | | | | | | | | | | | | | | | | | |
Net Asset Value, End of Year | | $ | 32.76 | | | $ | 29.92 | | | $ | 28.07 | | | $ | 23.51 | | | $ | 24.13 | |
| | | | | | | | | | | | | | | | |
| | | | | | | | | | | | | | | | | | | | | |
| Total Return | | | 10.17 | % | | | 7.38 | % | | | 19.81 | % | | | (2.17 | %) | | | (17.34 | %) |
| | | | | | | | | | | | | | | | | | | | | |
RATIOS/SUPPLEMENTARY DATA: | | | | | | | | | | | | | | | | | | | | |
| Net Assets at end of year (in 000’s) | | $ | 906,010 | | | $ | 878,583 | | | $ | 834,575 | | | $ | 708,885 | | | $ | 695,622 | |
| Ratio of expenses to average net assets | | | 1.07 | % | | | 1.11 | % | | | 1.13 | % | | | 1.13 | % | | | 1.11 | % |
| Ratio of net investment income to average net assets | | | 0.58 | % | | | 0.75 | % | | | 0.32 | % | | | 0.47 | % | | | 0.15 | % |
| Ratio of expenses to average net assets (a) | | | 1.28 | % | | | 1.36 | % | | | 1.39 | % | | | 1.13 | % | | | 1.11 | % |
| Portfolio turnover rate | | | 51 | % | | | 76 | % | | | 94 | % | | | 63 | % | | | 79 | % |
| | |
| (a) | | Ratios excluding waivers and expenses paid indirectly. |
See accompanying notes to financial statements.
22
financial highlights
NEW COVENANT FUNDS
For a Share outstanding throughout each period.
| | | | | | | | | | | | | | | | | | | | | |
| | | Income Fund | |
| | | For the | | | For the | | | For the | | | For the | | | For the | |
| | | Year Ended | | | Year Ended | | | Year Ended | | | Year Ended | | | Year Ended | |
| | | June 30, 2006 | | | June 30, 2005 | | | June 30, 2004 | | | June 30, 2003 | | | June 30, 2002 | |
| Net Asset Value, Beginning of Year | | $ | 25.56 | | | $ | 25.17 | | | $ | 26.62 | | | $ | 25.54 | | | $ | 24.83 | |
| | | | | | | | | | | | | | | | |
| | | | | | | | | | | | | | | | | | | | | |
INVESTMENT ACTIVITIES: | | | | | | | | | | | | | | | | | | | | |
| Net investment income | | | 1.00 | | | | 0.94 | | | | 0.96 | | | | 1.00 | | | | 1.21 | |
| Net realized and unrealized gain/(loss) from investments | | | (1.23 | ) | | | 0.55 | | | | (0.96 | ) | | | 1.42 | | | | 0.73 | |
| | | | | | | | | | | | | | | | |
| Total from Investment Activities | | | (0.23 | ) | | | 1.49 | | | | — | | | | 2.42 | | | | 1.94 | |
| | | | | | | | | | | | | | | | |
| | | | | | | | | | | | | | | | | | | | | |
DIVIDENDS: | | | | | | | | | | | | | | | | | | | | |
| Net investment income | | | (1.04 | ) | | | (1.04 | ) | | | (0.90 | ) | | | (1.06 | ) | | | (1.23 | ) |
| Net realized gains | | | (0.01 | ) | | | (0.06 | ) | | | (0.44 | ) | | | (0.28 | ) | | | — | |
| Tax return of capital | | | — | * | | | — | | | | (0.11 | ) | | | — | | | | — | |
| | | | | | | | | | | | | | | | |
| Total Dividends | | | (1.05 | ) | | | (1.10 | ) | | | (1.45 | ) | | | (1.34 | ) | | | (1.23 | ) |
| | | | | | | | | | | | | | | | |
| | | | | | | | | | | | | | | | | | | | | |
| Change in net asset value per share | | | (1.28 | ) | | | 0.39 | | | | (1.45 | ) | | | 1.08 | | | | 0.71 | |
| | | | | | | | | | | | | | | | |
| | | | | | | | | | | | | | | | | | | | | |
Net Asset Value, End of Year | | $ | 24.28 | | | $ | 25.56 | | | $ | 25.17 | | | $ | 26.62 | | | $ | 25.54 | |
| | | | | | | | | | | | | | | | |
| | | | | | | | | | | | | | | | | | | | | |
| Total Return | | | (0.90 | %) | | | 6.02 | % | | | 0.00 | % | | | 9.63 | % | | | 7.97 | % |
| | | | | | | | | | | | | | | | | | | | | |
RATIOS/SUPPLEMENTARY DATA: | | | | | | | | | | | | | | | | | | | | |
| Net Assets at end of year (in 000’s) | | $ | 526,359 | | | $ | 527,208 | | | $ | 524,025 | | | $ | 525,734 | | | $ | 545,356 | |
| Ratio of expenses to average net assets | | | 0.84 | % | | | 0.86 | % | | | 0.86 | % | | | 0.85 | % | | | 0.84 | % |
| Ratio of net investment income to average net assets | | | 4.04 | % | | | 3.68 | % | | | 3.70 | % | | | 3.79 | % | | | 4.72 | % |
| Ratio of expenses to average net assets (a) | | | 1.01 | % | | | 1.08 | % | | | 1.11 | % | | | 0.85 | % | | | 0.84 | % |
| Portfolio turnover rate | | | 263 | % | | | 206 | % | | | 242 | % | | | 226 | % | | | 290 | % |
| | |
| * | | Less than $0.005. |
| |
| (a) | | Ratios excluding waivers and expenses paid indirectly. |
See accompanying notes to financial statements.
23
financial highlights
NEW COVENANT FUNDS
For a Share outstanding throughout each period.
| | | | | | | | | | | | | | | | | | | | | |
| | | Balanced Growth Fund |
| | | For the | | | For the | | | For the | | | For the | | | For the | |
| | | Year Ended | | | Year Ended | | | Year Ended | | | Year Ended | | | Year Ended | |
| | | June 30. 2006 | | | June 30. 2005 | | | June 30. 2004 | | | June 30. 2003 | | | June 30. 2002 | |
| Net Asset Value, Beginning of Year | | $ | 78.20 | | | $ | 74.65 | | | $ | 67.88 | | | $ | 67.25 | | | $ | 81.92 | |
| | | | | | | | | | | | | | | | |
| | | | | | | | | | | | | | | | | | | | | |
INVESTMENT ACTIVITIES: | | | | | | | | | | | | | | | | | | | | |
| Net investment income (a) | | | 1.52 | | | | 1.41 | | | | 1.34 | | | | 1.27 | | | | 1.52 | |
| Net realized and unrealized gain/(loss) from investments (a) | | | 3.10 | | | | 3.54 | | | | 6.73 | | | | 0.71 | | | | (7.44 | ) |
| | | | | | | | | | | | | | | | |
| Total from Investment Activities | | | 4.62 | | | | 4.95 | | | | 8.07 | | | | 1.98 | | | | (5.92 | ) |
| | | | | | | | | | | | | | | | |
| | | | | | | | | | | | | | | | | | | | | |
DIVIDENDS: | | | | | | | | | | | | | | | | | | | | |
| Net investment income | | | (1.52 | ) | | | (1.40 | ) | | | (1.23 | ) | | | (1.27 | ) | | | (1.34 | ) |
| Net realized gains | | | — | | | | — | | | | — | | | | (0.08 | ) | | | (7.00 | ) |
| Tax return of capital | | | — | * | | | — | | | | (0.07 | ) | | | — | | | | (0.41 | ) |
| | | | | | | | | | | | | | | | |
| Total Dividends | | | (1.52 | ) | | | (1.40 | ) | | | (1.30 | ) | | | (1.35 | ) | | | (8.75 | ) |
| | | | | | | | | | | | | | | | |
| | | | | | | | | | | | | | | | | | | | | |
| Change in net asset value per share | | | 3.10 | | | | 3.55 | | | | 6.77 | | | | 0.63 | | | | (14.67 | ) |
| | | | | | | | | | | | | | | | |
| | | | | | | | | | | | | | | | | | | | | |
Net Asset Value, End of Year | | $ | 81.30 | | | $ | 78.20 | | | $ | 74.65 | | | $ | 67.88 | | | $ | 67.25 | |
| | | | | | | | | | | | | | | | |
| | | | | | | | | | | | | | | | | | | | | |
| Total Return | | | 5.93 | % | | | 6.68 | % | | | 11.95 | % | | | 3.10 | % | | | (7.79 | %) |
| | | | | | | | | | | | | | | | | | | | | |
RATIOS/SUPPLEMENTARY DATA: | | | | | | | | | | | | | | | | | | | | |
| Net Assets at end of year (in 000’s) | | $ | 312,077 | | | $ | 305,524 | | | $ | 302,446 | | | $ | 272,467 | | | $ | 286,314 | |
| Ratio of expenses to average net assets | | | 0.12 | % | | | 0.14 | % | | | 0.15 | % | | | 0.14 | % | | | 0.11 | % |
| Ratio of net investment income to average net assets | | | 1.85 | % | | | 1.83 | % | | | 1.52 | % | | | 1.96 | % | | | 2.02 | % |
| Ratio of expenses to average net assets (b) | | | 0.38 | % | | | 0.22 | % | | | 0.15 | % | | | 0.14 | % | | | 0.11 | % |
| Portfolio turnover rate | | | 10 | % | | | 5 | % | | | 12 | % | | | 15 | % | | | 18 | % |
| | |
| * | | Less than $0.005. |
| |
| (a) | | Includes income or gains/(losses) from affiliates. |
| |
| (b) | | Ratios excluding waivers. |
See accompanying notes to financial statements.
24
financial highlights
NEW COVENANT FUNDS
For a Share outstanding throughout each period.
| | | | | | | | | | | | | | | | | | | | | |
| | | Balanced Income Fund |
| | | For the | | | For the | | | For the | | | For the | | | For the | |
| | | Year Ended | | | Year Ended | | | Year Ended | | | Year Ended | | | Year Ended | |
| | | June 30, 2006 | | | June 30, 2005 | | | June 30, 2004 | | | June 30, 2003 | | | June 30, 2002 | |
| Net Asset Value, Beginning of Year | | $ | 18.90 | | | $ | 18.24 | | | $ | 17.52 | | | $ | 17.10 | | | $ | 18.88 | |
| | | | | | | | | | | | | | | | |
| | | | | | | | | | | | | | | | | | | | | |
INVESTMENT ACTIVITIES: | | | | | | | | | | | | | | | | | | | | |
| Net investment income (a) | | | 0.52 | | | | 0.48 | | | | 0.53 | | | | 0.52 | | | | 0.57 | |
| Net realized and unrealized gain/(loss) from investments (a) | | | 0.09 | | | | 0.66 | | | | 0.70 | | | | 0.47 | | | | (0.84 | ) |
| | | | | | | | | | | | | | | | |
| Total from Investment Activities | | | 0.61 | | | | 1.14 | | | | 1.23 | | | | 0.99 | | | | (0.27 | ) |
| | | | | | | | | | | | | | | | |
| | | | | | | | | | | | | | | | | | | | | |
DIVIDENDS: | | | | | | | | | | | | | | | | | | | | |
| Net investment income | | | (0.52 | ) | | | (0.48 | ) | | | (0.48 | ) | | | (0.52 | ) | | | (0.54 | ) |
| Net realized gains | | | — | | | | — | | | | — | | | | (0.05 | ) | | | (0.94 | ) |
| Tax return of capital | | | — | | | | — | | | | (0.03 | ) | | | — | | | | (0.03 | ) |
| | | | | | | | | | | | | | | | |
| Total Dividends | | | (0.52 | ) | | | (0.48 | ) | | | (0.51 | ) | | | (0.57 | ) | | | (1.51 | ) |
| | | | | | | | | | | | | | | | |
| | | | | | | | | | | | | | | | | | | | | |
| Change in net asset value per share | | | 0.09 | | | | 0.66 | | | | 0.72 | | | | 0.42 | | | | (1.78 | ) |
| | | | | | | | | | | | | | | | |
| | | | | | | | | | | | | | | | | | | | | |
Net Asset Value, End of Year | | $ | 18.99 | | | $ | 18.90 | | | $ | 18.24 | | | $ | 17.52 | | | $ | 17.10 | |
| | | | | | | | | | | | | | | | |
| | | | | | | | | | | | | | | | | | | | | |
| Total Return | | | 3.26 | % | | | 6.32 | % | | | 7.07 | % | | | 6.00 | % | | | (1.55 | %) |
| | | | | | | | | | | | | | | | | | | | | |
RATIOS/SUPPLEMENTARY DATA: | | | | | | | | | | | | | | | | | | | | |
| Net Assets at end of year (in 000’s) | | $ | 122,512 | | | $ | 124,809 | | | $ | 124,915 | | | $ | 122,576 | | | $ | 114,013 | |
| Ratio of expenses to average net assets | | | 0.15 | % | | | 0.17 | % | | | 0.18 | % | | | 0.16 | % | | | 0.14 | % |
| Ratio of net investment income to average net assets | | | 2.71 | % | | | 2.58 | % | | | 2.34 | % | | | 3.08 | % | | | 3.13 | % |
| Ratio of expenses to average net assets (b) | | | 0.41 | % | | | 0.25 | % | | | 0.18 | % | | | 0.16 | % | | | 0.14 | % |
| Portfolio turnover rate | | | 13 | % | | | 6 | % | | | 12 | % | | | 18 | % | | | 11 | % |
| | |
| (a) | | Includes income or gains/(losses) from affiliates. |
| |
| (b) | | Ratios excluding waivers. |
See accompanying notes to financial statements.
25
notes to financial statements
NEW COVENANT FUNDS
June 30, 2006
1. Organization
New Covenant Funds (the “Trust”), an open-end, diversified management investment company, was organized as a Delaware business trust on September 30, 1998. It currently consists of four investment funds: New Covenant Growth Fund (“Growth Fund”), New Covenant Income Fund (“Income Fund”), New Covenant Balanced Growth Fund (“Balanced Growth Fund”), and New Covenant Balanced Income Fund (“Balanced Income Fund”), (individually, a “Fund,” and collectively, the “Funds”). The Funds commenced operations on July 1, 1999. The Trust’s authorized capital consists of an unlimited number of shares of beneficial interest of $0.001 par value. The Funds’ investment advisor is the NCF Investment Department of New Covenant Trust Company, N.A., a wholly owned subsidiary of the Presbyterian Church (U.S.A.) Foundation (the “Advisor”).
The objectives of the Funds are as follows:
| | | |
Growth Fund | | Long-term capital appreciation. Dividend income, if any, will be incidental. |
| | | |
Income Fund | | High level of current income with preservation of capital. |
| | | |
Balanced Growth Fund | | Capital appreciation with less risk than would be present in a portfolio of only common stocks. |
| | | |
Balanced Income Fund | | Current income and long-term growth of capital. |
Under the Trust’s organizational documents, its officers and trustees are indemnified against certain liabilities arising out of the performance of their duties to the Funds. In addition, in the normal course of business, the Trust enters into contracts with its vendors and others that provide general indemnification. Each Fund’s maximum exposure under these arrangements is unknown, as this would involve future claims that may be made against a Fund. However, based on experience, the Funds expect the risk of loss to be remote.
2. Significant Accounting Policies
The preparation of financial statements in conformity with accounting principles generally accepted in the United States (“GAAP”) requires management to make estimates and assumptions that affect the reported amounts of assets and liabilities and disclosure of contingent assets and liabilities at the date of the financial statements and the reported amounts of income and expenses during the reporting period. Actual results could differ from those estimates. The following is a summary of the significant accounting policies consistently followed by the Funds in the preparation of their financial statements. The policies are in conformity with GAAP.
Portfolio Valuation: Fund investments are recorded at market value. Portfolio securities listed on a domestic or foreign exchange are valued at the last sale price on the day of valuation or, if there was no sale that day, at the last reported bid price as of the close of trading. Equity securities traded on NASDAQ use the official closing price. Equity securities which are traded in the over-the-counter market only, but which are not included on NASDAQ, are valued at the mean between the last preceding bid and ask prices. Debt securities with a remaining maturity of sixty days or more are valued using a pricing service when such prices are believed to reflect fair market value. Debt securities with a remaining maturity of less than sixty days are valued at amortized cost, which approximates market value. Investment companies are valued at net asset value. All other assets and securities with no readily determinable market values are valued using procedures adopted by the Board of Trustees. Factors used in determining fair value include but are not limited to: type of security or asset, fundamental analytical data relating to the investment in the security, evaluation of the forces that influence the market in which the security is purchased and sold, and information as to any transactions or offers with respect to the security.
Foreign securities traded outside the United States are generally valued as of the time their trading is complete, which is usually different from the close of the New York Stock Exchange (“NYSE”). Occasionally, events affecting the value of such securities may occur between such times and the close of the NYSE that will not be reflected in the security’s market value. If events materially affecting the value of such securities occur during such period, these securities will be valued at their fair value according to procedures adopted by the Board of Trustees. All securities and other assets of a Fund initially expressed in foreign currencies will be converted to U.S. dollar values at the foreign exchange rate every business day, generally at 4:00pm EST.
Securities Transactions and Investment Income: During the period, security transactions are accounted for no later than one business day following the trade date. For financial reporting purposes, however, security transactions are accounted for on trade date on the last business day of the reporting period. Securities sold are determined on a specific identification basis. Interest income is recognized on the accrual basis and includes, where applicable, the amortization of premium or accretion of discount for both financial reporting and tax purposes. Dividend income is recorded on the ex-dividend date. Gains or losses realized on sales of securities are determined by comparing the identified cost of the security lot sold with the net sales proceeds.
26
notes to financial statements
NEW COVENANT FUNDS
June 30, 2006
Options: The Income Fund may purchase or write options which are traded over-the-counter to hedge fluctuation risks in the prices of certain securities. When the Fund writes a call or put option, an amount equal to the premium received is reflected as a liability. The liability is subsequently “marked-to-market” to reflect the current market value of the option written. The premium paid by the Fund for the purchase of a call or put option is recorded as an investment and subsequently “marked-to-market” to reflect the current market value of the option purchased. The Fund is subject to the risk of an imperfect correlation between movement in the price of the option and the price of the underlying security. Risks may also arise due to illiquid secondary markets for the options. There were no options outstanding at June 30, 2006.
Foreign Currency Translation: The books and records of the Funds are maintained in U.S. dollars. Investment valuation and other assets and liabilities initially expressed in foreign currencies are converted each business day into U.S. dollars based upon current exchange rates. Purchases and sales of foreign investments and income and expenses are converted into U.S. dollars based upon exchange rates prevailing on the respective dates of such transactions. That portion of unrealized gains or losses on investments due to fluctuations in foreign currency exchange rates is not separately disclosed.
The Funds do not isolate the portion of gains and losses on investments in securities that is due to changes in the foreign exchange rates from that which is due to changes in the market prices of such securities. The Funds report gains and losses on foreign currency related transactions as realized and unrealized gains and losses for financial reporting purposes, whereas such gains and losses are treated as ordinary income or loss for U.S. federal income tax purposes.
Forward Foreign Currency Contracts: The Growth Fund may enter into forward foreign currency contracts as hedges against either specific transactions or portfolio positions. All commitments are “marked-to-market” daily at the applicable foreign exchange rate and any resulting unrealized gains or losses are recorded currently. The Fund realizes gains and losses at the time forward foreign currency contracts are extinguished.
Loans of Portfolio Securities: The Growth Fund and Income Fund may lend their securities pursuant to a securities lending agreement (“Lending Agreement”) with JPMorgan Chase Bank, N.A. (“JPMorgan”). Security loans made pursuant to the Lending Agreement are required at all times to be secured by collateral valued at at least 102% of the market value of the securities loaned. Cash collateral received is invested by JPMorgan pursuant to the terms of the Lending Agreement. All such investments are made at the risk of the Funds and, as such, the Funds are liable for investment losses. To the extent a loan is secured by non-cash col lateral, the borrower is required to pay a loan premium. Non-cash collateral received cannot be sold or repledged. Net income earned on the investment of cash collateral and loan premiums received on non-cash collateral are allocated between JPMorgan and the Funds in accordance with the Lending Agreement. Income allocated to the Funds is included in investment income in the respective Statements of Operations.
At June 30, 2006, the cash collateral received by the Growth Fund and the Income Fund was invested in repurchase agreements and other short-term securities. Information on the investment of cash collateral is shown in the Portfolio of Investments. The Growth Fund and the Income Fund receive payments from borrowers equivalent to the dividends and interest that would have been earned on the securities lent while simultaneously seeking to earn income on the investment cash collateral, a portion of which is retained by the Advisor. One of the risks in lending portfolio securities, as with other extensions of credit, is the possible delay in the recovery of the securities or possible loss of rights in the collateral should the borrower fail financially. There is also the risk that, when lending portfolio securities, the securities may not be available to a Fund on a timely basis and a Fund may, therefore, lose the opportunity to sell the securities at a desirable price. In addition, in the event that a borrower of securities would file for bankruptcy or become insolvent, disposition of the securities may be delayed pending court action. However, loans will be made only to borrowers deemed by the Advisor to be creditworthy under guidelines established by the Board of Trustees and when, in the judgment of the Advisor, the consideration which can be earned currently from such securities loans justifies the attendant risks. Loans are subject to termination by the Funds or the borrower at any time, and are, therefore, not considered to be illiquid investments.
The value of the loaned securities and related collateral at June 30, 2006, was as follows:
| | | | | | | | | | | | | |
| | | Value of | | Value of | | Value of |
| Fund | | Securities Loaned | | Cash Collateral | | Non-Cash Collateral |
| |
Growth Fund | | $ | 117,639,073 | | | $ | 119,555,788 | | | $ | — | |
Income Fund | | | 76,789,893 | | | | 31,531,013 | | | | 46,647,550 | |
| |
27
notes to financial statements
NEW COVENANT FUNDS
June 30, 2006
Repurchase Agreements: The Funds may enter into repurchase agreements, which are secured by obligations of the U.S. government, with a bank, broker-dealer or other financial institution. Each repurchase agreement is at least 102% collateralized and marked-to-market daily. However, in the event of default or bankruptcy by the counterparty to the repurchase agreement, realization of the collateral may by subject to certain costs, losses or delays.
Forward Commitments, When-Issued Securities and Delayed-Delivery Transactions: The Growth Fund and the Income Fund may purchase or sell securities on a when-issued or delayed-delivery basis and make contracts to purchase or sell securities for a fixed price at a future date beyond customary settlement time. Debt securities are often issued on that basis. No income will accrue on securities purchased on a when-issued or delayed-delivery basis until the securities are delivered. Securities purchased or sold on a when-issued, delayed-delivery of forward-commitment basis involve a risk of loss if the value of the security to be purchased declines prior to settlement date. Although the Funds would generally purchase securities on a when-issued, delayed-delivery or a forward-commitment basis with the intention of acquiring the securities, the Funds may dispose of such securities prior to settlement if the portfolio manager deems it appropriate to do so.
The Funds may dispose of or renegotiate a when-issued or forward commitment. The Funds will normally realize a capital gain or loss in connection with these transactions. For purposes of determining the Income Fund’s average dollar-weighted maturity, the maturity of when-issued or forward-commitment securities will be calculated from the commitment date.
When the Funds purchase securities on a when-issued, delayed-delivery or forward-commitment basis, the Funds will maintain cash, U.S. government securities or other liquid portfolio securities having a value (determined daily) at least equal to the amount of the Funds’ purchase commitments. In the case of a forward-commitment to sell portfolio securities, the custodian will hold the portfolio securities in a segregated account while the commitment is outstanding. These procedures are designed to ensure that the Funds will maintain sufficient assets at all times to cover their obligations under when-issued purchases, forward-commitments and delayed-delivery transactions.
As of June 30, 2006, the Funds had outstanding when-issued or delayed-delivery purchase commitments with corresponding assets segregated, as follows:
| | | | | |
| Fund | | Amount |
| |
| Income Fund | | $ | 75,593,854 | |
Dividends and Distributions to Shareholders: Dividends from net investment income of all Funds are declared and paid at least annually. For all Funds, all net realized long-term or short-term capital gains, if any, will be declared and distributed at least annually. Interest and dividend payments will normally be distributed as income dividends on a quarterly basis for each of the Funds.
Income dividends and capital gain distributions are determined in accordance with income tax regulations, which may differ from GAAP. These differences are primarily due to differing treatments of income, gains and losses on various investment securities held by a Fund, timing differences in the recognition of income, gains and losses and differing characterizations of distributions made by the Fund.
These “book/tax” differences are either considered temporary or permanent in nature. To the extent these differences are permanent in nature, such amounts are reclassified within the composition of net assets based on their federal tax-basis treatment; temporary differences do not require reclassifications. To the extent that distributions exceed net investment income and net realized gains for tax purposes, they are reported as returns of capital.
Federal Income Taxes: It is each Fund’s intention to continue to qualify annually as a regulated investment company by complying with the appropriate provisions of the Internal Revenue Code of 1986, as amended. Accordingly, no provision for federal income tax has been made.
On July 13, 2006, the Financial Accounting Standards Board (FASB) released FASB Interpretation No. 48 “Accounting for Uncertainty in Income Taxes” (FIN 48). FIN 48 provides guidance for how uncertain tax positions should be recognized, measured, presented and disclosed in the financial statements. FIN 48 requires the evaluation of tax positions taken or expected to be taken in the course of preparing the Funds’ tax returns to determine whether the tax positions are “more-likely-than-not” of being sustained by the applicable tax authority. Tax positions not deemed to meet the more-likely-than-not threshold would be recorded as a tax benefit or expense in the current year. Adoption of FIN 48 is required for fiscal years beginning after December 15, 2006 and is to be applied to all open tax years as of the effective date. Management has not completed their analysis on whether the adoption of FIN 48 will have an impact to the financial statements.
28
notes to financial statements
NEW COVENANT FUNDS
June 30, 2006
Allocation of Expenses: Expenses directly attributable to a Fund are charged directly to that Fund, while expenses which are attributable to more than one Fund of the Trust are allocated among the respective Funds based upon relative net assets or some other reasonable method.
Expenses Paid Indirectly: The Growth and Income Funds direct certain portfolio trades to brokers who pay a portion of their expenses. Under this arrangement, the Growth Fund and the Income Fund had expenses reduced by $121,110 and $1,901, respectively, or 0.01 % and 0.00%, respectively, as a percentage of the average daily net assets of the Fund on an annualized basis for the year ended June 30, 2006.
3. Investment Advisory and Other Agreements
The Trust, on behalf of each Fund, has entered into an Investment Advisory Agreement with the NCF Investment Department of New Covenant Trust Company, N.A. Under the Agreement, the Advisor is responsible for managing the Funds’ investments as well as furnishing the Funds with certain administrative services. The Growth Fund pays the Advisor a monthly fee at the annual rate of 0.99% of the Growth Fund’s average daily net assets and the Income Fund pays the Advisor a monthly fee at the annual rate of 0.75% of the Income Fund’s average daily net assets. The Advisor does not receive advisory fees for the Balanced Growth Fund and Balanced Income Fund (the “Balanced Funds”). The Advisor has entered into Sub-Advisory Agreements with Sub-Advisors to assist in the selection and management of the Growth Fund’s and Income Fund’s investment securities. It is the responsibility of the Sub-Advisors, under the direction of the Advisor, to make day-to-day investment decisions for these Funds. The Advisor, not the Funds, pays each Sub-Advisor a quarterly fee for their services. The Advisor pays the Sub-Advisor’s fee directly from its own advisory fees. The sub-advisory fees are based on the assets of a Fund for which the Sub-Advisor is responsible for making investment decisions.
The following are the Sub-Advisors for the Growth Fund: Capital Guardian Trust Company, Mazama Capital Management Inc., Santa Barbara Asset Management Inc., Sound Shore Management Inc., and Wellington Management Company, LLP.
Tattersall Advisory Group is the Sub-Advisor for the Income Fund.
The Trust employs a Chief Compliance Officer (“CCO”) who receives a portion of his compensation as approved by the Board of Trustees, as well as reimbursement of out-of-pocket expenses. The CCO is also an employee of the Advisor.
The Trust is a party to a Shareholder Services Agreement pursuant to which each Fund is authorized to make payments to certain entities which may include investment advisors, banks, trust companies and other types of organizations (“Authorized Service Providers”) for providing administrative services with respect to shares of the Funds attributable to or held in the name of the Authorized Service Provider for its clients or other parties with whom they have a servicing relationship. Under the terms of the Shareholder Services Agreement, each Fund is authorized to pay monthly an Authorized Service Provider (which may include affiliates of the Funds) a shareholder services fee at the rate of 0.25% on an annual basis of the average daily net assets of the shares of the Fund attributable to or held in the name of the Authorized Service Provider for providing certain administrative services to Fund shareholders with whom the Authorized Service Provider has a servicing relationship. In connection with the Shareholder Services Agreement, the Advisor has agreed to waive the amount of the investment advisory fees payable to it by the Fund to the extent of the amount paid in fees by the Fund to any affiliated Authorized Service Provider under the Shareholder Services Agreement.
The Trust has entered into servicing agreements with BISYS Fund Services Ohio, Inc. (“BISYS Ohio”), an indirect, wholly owned subsidiary of The BISYS Group, Inc. (“BISYS”). Under the servicing agreements, BISYS Ohio provides transfer agency, administrative and fund accounting services to the Funds. Under the terms of the Transfer Agency Agreement, BISYS Ohio is entitled to receive account based fees and annual fund level fees, as well as reimbursement of out-of-pocket expenses incurred in providing transfer agency services. Under the terms of a fund accounting agreement, BISYS Ohio is entitled to a fee computed at an annual rate of 0.03% of the Trust’s average daily net assets for the first $500,000,000, 0.0225% for $500,000,001 to $5,000,000,000, and 0.01% over $5,000,000,000. Under the Administration Agreement, BISYS is entitled to a fee computed at an annual rate of 0.02% of the Trust’s average daily net assets. However, pursuant to an April 22, 2005 amendment to the Administration Agreement, BISYS Ohio annually waives $280,000.
The Trust issues shares of the Funds pursuant to a Distribution Agreement with New Covenant Funds Distributor, Inc. (the “Distributor”), under which the Distributor serves as the principal distributor of the Funds’ shares. The Funds do not pay the Distributor in its capacity as principal distributor. On February 23, 2006, the Distributor became a wholly-owned subsidiary of New Covenant Trust Company, N.A., a subsidiary of the Presbyterian Church (U.S.A.) Foundation. Prior to February 23, 2006, the Distributor was an indirect, wholly-owned subsidiary of BISYS.
The Trust has a Custodian Agreement with JPMorgan.
29
notes to financial statements
NEW COVENANT FUNDS
June 30, 2006
No officer, Trustee or employee of the Trust, BISYS, or any affiliate thereof, except the CCO, receives any compensation from the Funds for serving as a Trustee or officer of the Trust. The Funds reimburse expenses incurred by the Trustees and Officers in attending Board and Committee meetings.
4. Purchases and Sales of Securities
The cost of purchases and proceeds from sales of securities, excluding short-term investments, for the year ended June 30,2006, were as follows:
| | | | | | | | | | | | | | | | | |
| | | Purchases | | Sales | | | | |
| | | (excluding U.S. | | (excluding U.S. | | Purchases of | | Sales of |
| Fund | | Government) | | Government) | | U.S. Government | | U.S. Government |
| |
| Growth Fund | | $ | 452,134,166 | | | $ | 503,783,770 | | | $ | — | | | $ | — | |
| Income Fund | | | 182,193,482 | | | | 245,064,910 | | | | 1,218,284,608 | | | | 1,115,090,163 | |
| Balanced Growth Fund | | 31,387,515 | | | 36 856 875 | | | | — | | | | — | |
| Balanced Income Fund | | | 16,231,027 | | | | 18,955,088 | | | | — | | | | — | |
| |
5. Risk Factors
The performance of a Fund’s investments in non-U.S. companies and in companies operating internationally or in foreign countries will depend principally on economic conditions in their product markets, the securities markets where their securities are traded, and currency exchange rates. These risks are present because of uncertainty in future exchange rates back into U.S. dollars and possible political instability, which could affect foreign financial markets and local economies. There are also risks related to social and economic developments abroad, as well as risks resulting from the differences between the regulations to which U.S. and foreign issuers and markets are subject.
The Funds will not invest more than 15% of the value of their net assets in securities that are illiquid because of restrictions on transferability or other reasons. Repurchase agreements with deemed maturities in excess of seven days and securities that are not registered under the Securities Act of 1933, as amended, but that may be purchased by institutional buyers pursuant to Rule 144A are subject to this 15% limit (unless such securities are variable-amount master-demand notes with maturities of nine months or less or unless the Board determines that a liquid trading market exists). The Funds may purchase securities which are not registered under the Securities Act but which can be sold to “qualified institutional buyers” in accordance with Rule I44A under the Securities Act. In some cases, such securities are classified as “illiquid securities”; however, any such security will not be considered illiquid so long as it is determined by the Advisor, under guidelines approved by the Board of Trustees, that an adequate trading market exists for that security. This investment practice could have the effect of increasing the level of illiquidity in a Fund during any period that qualified institutional buyers become uninterested in purchasing these restricted securities.
The Income Fund may invest a limited amount of assets in debt securities which are rated below investment grade (hereinafter referred to as “lower-rated securities”) or which are unrated but deemed equivalent to those rated below investment grade by the portfolio managers. The lower the ratings of such debt securities, the greater their risks. These debt instruments generally offer a higher current yield than that available from higher-grade issues, and typically involve greater risks. The yields on lower-rated securities will fluctuate over time. In general, prices of all bonds rise when interest rates fall and fall when interest rates rise. Lower-rated securities are subject to adverse changes in general economic conditions and to changes in the financial condition of their issuers. During periods of economic downturn or rising interest rates, issuers of these instruments may experience financial stress that could adversely affect their ability to make payments of principal and interest, and increase the possibility of default.
The Balanced Funds invest their assets primarily in the Growth Fund and the Income Fund. By investing primarily in shares of these Funds, shareholders of the Balanced Funds indirectly pay a portion of the operating expenses, management expenses and brokerage costs of the underlying Funds as well as their own operating expenses. Thus, shareholders of the Balanced Funds may indirectly pay slightly higher total operating expenses and other costs than they would pay by directly owning shares of the Growth Fund and Income Fund. Total fees and expenses to be borne by shareholders in either Balanced Fund will depend on the portion of the Funds’ assets invested in the Growth Fund and in the Income Fund. A change in the asset allocation of either Balanced Fund could increase or decrease the fees and expenses actually borne by shareholders in that Fund. The Balanced Funds are also subject to rebalancing risk. Rebalancing activities, while undertaken to maintain a Fund’s investment risk-to-reward ratio, may cause the Fund to under-perform other funds with similar investment objectives. For the Balanced Growth Fund, it is possible after rebalancing from equities into a greater percentage of fixed-income securities, that equities will outperform fixed- income investments. For the Balanced Income Fund, it is possible that after rebalancing from fixed-income securities into a greater percentage of equity securities, that fixed-income securities will outperform equity investments. The performance of the Balanced Growth Fund and the Balanced Income Fund depends on the performance of the underlying Funds in which they invest.
30
notes to financial statements
NEW COVENANT FUNDS
June 30, 2006
6. Distribution Information
Income and long-term capital gain distributions are determined in accordance with federal income tax regulations, which may differ from accounting principles generally accepted in the United States. The tax character of distributions paid during the fiscal years ended June 30, 2006 and June 30, 2005, was as follows:
| | | | | | | | | | | | | | | | | | | | | | | | | | | | | | | | | | | | | | | | | |
| | | Distributions Paid From | | | | | | |
| | | Ordinary | | Net Long Term | | Total Taxable | | Return of | | Total Distributions |
| | | Income | | Capital Gains | | Distributions | | Capital | | Paid* |
| | | 2006 | | 2005 | | 2006 | | 2005 | | 2006 | | 2005 | | 2006 | | 2005 | | 2006 | | 2005 |
| Growth Fund | | $ | 5,561,246 | | | $ | 6,321,345 | | | $ | — | | | $ | — | | | $ | 5,561,246 | | | $ | 6,321,345 | | | $ | — | | | $ | — | | | $ | 5,561,246 | | | $ | 6,321,345 | |
| Income Fund | | | 22,762,861 | | | | 21,851,973 | | | | — | | | | 952,418 | | | | 22,762,861 | | | | 22,804,391 | | | | 7,219 | | | | — | | | | 22,770,080 | | | | 22,804,391 | |
| Balanced Growth Fund | | | 5,762,319 | | | | 5,571,223 | | | | — | | | | — | | | | 5,762,319 | | | | 5,571,223 | | | | 617 | | | | — | | | | 5,762,936 | | | | 5,571,223 | |
| Balanced Income Fund | | | 3,400,312 | | | | 3,181,809 | | | | — | | | | — | | | | 3,400,312 | | | | 3,181,809 | | | | — | | | | — | | | | 3,400,312 | | | | 3,181,809 | |
| |
| | |
| * | | Total distributions paid may differ from the Statements of Changes in Net Assets because distributions are recognized when actually paid for tax purposes. |
7. Federal Income Taxes
As of June 30, 2006, the Funds had available for federal tax purposes unused capital loss carryforwards expiring as follows:
| | | | | | | | | | | | | | | | | | | | | |
| | | 2011 | | | 2012 | | | 2013 | | | 2014 | | | Total | |
| Growth Fund | | $ | 35,331,694 | | | $ | 14,207,521 | | | $ | — | | | $ | — | | | $ | 49,539,215 | |
| Income Fund | | | — | | | | — | | | | — | | | | 1,591,357 | | | | 1,591,357 | |
| Balanced Growth Fund | | | — | | | | 1,737,647 | | | | 6,966,124 | | | | 2,286,304 | | | | 10,990,075 | |
| Balanced Income Fund | | | — | | | | 2,825,156 | | | | 792,155 | | | | — | | | | 3,617,311 | |
| |
Under tax law, certain capital and foreign currency losses realized after October 31, and within the taxable year may be deferred and treated as occurring on the first business day of the following fiscal year. For the year ended June 30, 2006, the Funds deferred to July 1, 2006, post-October capital losses of:
| | | | | |
| | | Post-October Losses |
| Growth Fund | | $ | 9,013 | |
| Income Fund | | | 5,150,428 | |
As of June 30, 2006, the components of accumulated earnings/(deficit) on a tax basis were as follows:
| | | | | | | | | | | | | | | | | | | | | | | | | | | | | |
| | | | | | | | | | | | | | | | | | | | | | | | | | | Total |
| | | Undistributed | | Undistributed | | | | | | | | | | Accumulated | | Unrealized | | Accumulated |
| | | Ordinary | | Long-Term | | Accumulated | | Dividends | | Capital and | | Appreciation/ | | Earnings/ |
| | | Income | | Capital Gains | | Earnings | | Payable | | Other Losses | | (Depreciation)* | | (Deficit) |
| |
Growth Fund | | $ | 693,355 | | | $ | — | | | $ | 693,355 | | | $ | — | | | $ | (49,548,228 | ) | | $ | 99,514,195 | | | $ | 50,659,322 | |
| | | | | | | | | | | | | | | | | | | | | | | | | | | | | |
Income Fund | | | — | | | | — | | | | — | | | | — | | | | (6,741,785 | ) | | | (11,682,863 | ) | | | (18,424,648 | ) |
| | | | | | | | | | | | | | | | | | | | | | | | | | | | | |
Balanced Growth Fund | | | — | | | | — | | | | — | | | | — | | | | (10,990,075 | ) | | | 15,777,390 | | | | 4,787,315 | |
| | | | | | | | | | | | | | | | | | | | | | | | | | | | | |
Balanced Income Fund | | | 338 | | | | — | | | | 338 | | | | — | | | | (3,617,311 | ) | | | 5,925,172 | | | | 2,308,199 | |
| |
|
| *The differences between the book-basis and tax-basis unrealized appreciation (depreciation) is attributable primarily to:tax deferral of losses on wash sales, passive foreign investment companies (“PFICs”) and the difference between book and tax amortization methods for premium and market discount. |
At June 30, 2006, the cost, gross unrealized appreciation and gross unrealized depreciation on securities, for federal income tax purposes, were as follows:
| | | | | | | | | | | | | | | | | |
| | | | | | | | | | | | | | | Net Unrealized |
| | | | | | | Tax Unrealized | | Tax Unrealized | | Appreciation |
| | | Tax Cost | | Appreciation | | (Depreciation) | | (Depreciation) |
| |
| Growth Fund | | $ | 927,466,682 | | | $ | 136,072,270 | | | $ | (36,561,470 | ) | | $ | 99,510,800 | |
| Income Fund | | | 651,295,894 | | | | 1,094,814 | | | | (12,777,677 | ) | | | (11,682,863 | ) |
| Balanced Growth Fund | | | 294,252,382 | | | | 19,238,149 | | | | (3,460,759 | ) | | | 15,777,390 | |
| Balanced Income Fund | | | 117,986,071 | | | | 8,437,794 | | | | (2,512,622 | ) | | | 5,925,172 | |
| |
31
notes to financial statements
NEW COVENANT FUNDS
June 30, 2006
8. Other Federal Income Tax Information (unaudited)
For the year ended June 30,2006, dividends paid by the Funds may be subject to a maximum tax rate of 15% as provided for by the Jobs and Growth Tax Relief Act of 2003. The Funds intend to designate the maximum amount allowable as taxed at a maximum rate of 15%. Complete information will be reported in conjunction with the 2006 Form 1099-DIV.
For the year ended June 30, 2006, the following Funds paid qualified dividend income of:
| | | | | |
| | | Qualified Dividend Income |
| Growth Fund | | $ | 11,562,552 | |
| Balanced Growth Fund | | | 1,176,026 | |
| Balanced Income Fund | | | 285.451 | |
The Funds designate the following percentage of distributions eligible for the dividends received deduction for corporations:
| | | | | |
| | | Amount |
| Growth Fund | | | 100 | % |
| Balanced Growth Fund | | | 21 | |
| Balanced Income Fund | | | 8 | |
32
report of independent registered public accounting firm
Report of Independent Registered Public Accounting Firm
To the Board of Trustees and Shareholders of
New Covenant Funds:
We have audited the accompanying statements of assets and liabilities, of the New Covenant Funds (comprised of New Covenant Growth Fund, New Covenant Income Fund, New Covenant Balanced Growth Fund, and New Covenant Balanced Income Fund) (collectively “the Funds”) including the portfolios of investments, as of June 30, 2006, and the related statements of operations for the year then ended, the statement of changes in net assets for each of the two years in the period then ended, and financial highlights for each of the five years in the period then ended. These financial statements and financial highlights are the responsibility of the Funds’ management. Our responsibility is to express an opinion on these financial statements and financial highlights based on our audits.
We conducted our audits in accordance with the standards of the Public Company Accounting Oversight Board (United States). Those standards require that we plan and perform the audits to obtain reasonable assurance about whether the financial statements and financial highlights are free of material misstatement. We were not engaged to perform an audit of the Funds’ internal control over financial reporting. Our audits included consideration of internal control over financial reporting as a basis for designing audit procedures that are appropriate in the circumstances, but not for the purpose of expressing an opinion on the effectiveness of the Funds’ internal control over financial reporting. Accordingly, we express no such opinion. An audit also includes examining, on a test basis, evidence supporting the amounts and disclosures in the financial statements and financial highlights, assessing the accounting principles used and significant estimates made by management, and evaluating the overall financial statement presentation. Our procedures included confirmation of securities owned as of June 30, 2006, by correspondence with the custodian and brokers. We believe that our audits provide a reasonable basis for our opinion.
In our opinion, the financial statements and financial highlights referred to above present fairly, in all material respects, the financial position of each of the New Covenant Funds as of June 30, 2006, the results of their operations for the year then ended, the changes in their net assets for each of the two years in the period then ended, and financial highlights for each of the five years in the period then ended, in conformity with U.S. generally accepted accounting principles.
Columbus, Ohio
August 17, 2006
33
supplemental data (unaudited)
NEW COVENANT FUNDS
June 30, 2006
Proxy Voting Policy and Proxy Voting Record
A description of the policies and procedures that the Trust uses to determine how to vote proxies related to portfolio securities is available (i) without charge, upon request, by calling 800-858-6127 and (ii) on the Securities and Exchange Commission’s website at http://www.sec.gov. Information regarding how each Fund voted proxies related to securities held during the most recent 12 month period ended June 30 is (i) available without charge, upon request, by calling 800-858-6127; (ii) on the Funds’ website at http://www.newcovenantfunds.com and (iii) on the Securities and Exchange Commission’s website at http://www.sec.gov.
Quarterly Holdings
Portfolio holdings statements for the Funds for the quarters ended March 31 and September 30 are available, without charge, on the Securities and Exchange Commission’s website at http://www.sec.gov.
Additional Fund Information — Hypothetical Cost of Investing
As a shareholder of the New Covenant Funds, you incur ongoing costs, including management fees and other Fund expenses. This example is intended to help you understand your ongoing costs (in dollars) of investing in the New Covenant Funds and to compare these costs with the ongoing costs of investing in other mutual funds.
The Example is based on an investment of $1,000 invested at the beginning of the period and held for the entire period from January 1, 2006 through June 30, 2006.
Actual Expenses
The table below provides information about actual account values and actual expenses. You may use the information below, together with the amount you invested, to estimate the expenses that you paid over the period. Simply divide your account value by $1,000 (for example, an $8,600 account value divided by $1,000 = 8.6), then multiply the result by the number in the table under the heading entitled “Expenses Paid During Period” to estimate the expenses you paid on your account during this period.
| | | | | | | | | | | | | | | | | |
| | | Beginning | | Ending | | Expense Paid | | Expense Ratio |
| | | Account Value | | Account Value | | During Period* | | During Period** |
| | | 1/1/06 | | 6/30/06 | | 1/1/06 - 6/30/06 | | 1/1/06 - 6/30/06 |
| |
| Growth Fund | | $ | 1,000.00 | | | $ | 1,021.30 | | | $ | 5.31 | | | | 1.06 | % |
| Income Fund | | | 1,000.00 | | | | 992.90 | | | | 4.15 | | | | 0.84 | % |
| Balanced Growth Fund | | | 1,000.00 | | | | 1,011.10 | | | | 0.60 | | | | 0.12 | % |
| Balanced Income Fund | | | 1,000.00 | | | | 1,004.30 | | | | 0.70 | | | | 0.14 | % |
| |
Hypothetical Example for Comparison Purposes
The table below provides information about hypothetical account values and hypothetical expenses based on each of the New Covenant Funds’ actual expense ratios and an assumed rate of return of 5% per year before expenses, which is not the Fund’s actual return. The hypothetical account values and expenses may not be used to estimate the actual ending account balance or expenses you paid for the period. You may use this information to compare this 5% hypothetical example with the 5% hypothetical examples that appear in the shareholder reports of other funds.
| | | | | | | | | | | | | | | | | |
| | | Beginning | | Ending | | Expense Paid | | Expense Ratio |
| | | Account Value | | Account Value | | During Period* | | During Period** |
| | | 1/1/06 | | 6/30/06 | | 1/1/06 - 6/30/06 | | 1/1/06 - 6/30/06 |
| |
| Growth Fund | | $ | 1,000.00 | | | $ | 1,019.54 | | | $ | 5.31 | | | | 1.06 | % |
| Income Fund | | | 1,000.00 | | | | 1,020.63 | | | | 4.21 | | | | 0.84 | % |
| Balanced Growth Fund | | | 1,000.00 | | | | 1,024.20 | | | | 0.60 | | | | 0.12 | % |
| Balanced Income Fund | | | 1,000.00 | | | | 1,024.10 | | | | 0.70 | | | | 0.14 | % |
| |
| | | |
| * | | Expenses are equal to the average account value times the Fund’s annualized expense ratio multiplied by the number of days in the most recent fiscal half-year divided by the number of days in the fiscal year. |
| |
| ** | | Annualized. |
34
supplemental data (unaudited)
NEW COVENANT FUNDS
June 30, 2006
Approval of the Continuation of the Investment Advisory and Sub-Advisory Agreements
The Investment Advisory Agreement and Sub Advisory Agreements (collectively, the “Agreements”) were most recently re-approved by the Board of Trustees of the New Covenant Funds (the “Trust”) on May 22, 2006. Relevant provisions of the Investment Company Act of 1940 specifically provide that it is the duty of the Board to request and evaluate such information as the Board determines is reasonably necessary to allow the Board to properly consider the continuation of the Agreements, and it is the duty of the Advisor and the Sub Advisors to furnish the Trustees with such information as is responsive to their request. Accordingly, in determining whether to renew the Agreements, the Board of Trustees requested, and the Advisor and the Sub Advisors provided, information and data relevant to the Board’s consideration. This included materials regarding the investment performance of the Funds and information regarding the fees and expenses of the Funds, as compared to other similar mutual funds. As part of their deliberations, the Trustees also considered and relied upon the information about the Funds, the Advisor and the Sub Advisors that had been provided to them throughout the past year in connection with their regular Board meetings at which they engage in the ongoing oversight of the Funds and their operations. The Independent Trustees discussed the materials prior to the May 22, 2006 Board meeting as well as in executive session during the meeting.
Among the factors the Board considered was the overall performance of each Fund and each Sub Advisor relative to the performance of similar mutual funds in each Fund’s peer group and relative to applicable benchmark indexes on a long-term basis and, particularly for the two new Sub Advisors, Mazama Capital Management, Inc. and Santa Barbara Asset Management, Inc., over shorter time periods. The Board took note of the fact that the performance results achieved for the Funds were favorable on both a short-term and on a long-term basis and that the Advisor produced these results in a manner consistent with the stated investment objective and policies of each of the Funds. The Board looked at the contribution made by each Sub Advisor to the short-term and, if relevant, long-term performance. The Board also took note of the long-term relationship between the Advisor and the Funds and the efforts that had been undertaken by the Advisor to foster the growth and development of the Funds since their inception. The Board considered the Advisor’s formation in 2005 of a Social Witness Committee of its board to raise the visibility and importance of the social responsibility aspect of investing the Funds’ portfolios. In addition, the Board compared the expenses of each of the Funds to the expenses of their peers, based on data compiled by an independent source. The Board noted the range of investment advisory and administrative services provided by the Advisor to the Funds and the nature, extent and quality of these services. The Board also reviewed financial information concerning the Advisor relating to its operation of the Funds, noting the overall profitability of the relationship with the Funds to the Advisor and the financial soundness of the Advisor as demonstrated by the financial information provided. In addition, the Board discussed with the Advisor economies of scale that could be realized by the Funds and the impact of potential economies of scale on the fees assessed on the Growth and Income Funds. The Trustees considered information regarding the Advisor’s services in connection with negotiating a relationship with a new custodian that resulted in reducing the Funds’ custodial expenses significantly during the year; the Advisor’s purchase of the Funds’ distributor and the costs assumed by the Advisor’s affiliates in that regard; the services performed by the Trust’s Chief Compliance Officer (who is an employee of the Advisor), particularly in his oversight of the Sub Advisors; the services provided by the Advisor in managing the Funds’ proxy voting and other additional services provided by the Advisor to the Funds, and concluded that the shareholders benefit from these additional services under the Investment Advisory Agreement.
In connection with their review of the Sub Advisory Agreements, the Trustees considered, in addition to the performance information discussed above, the Sub Advisors’ adherence to the Funds’ investment objectives and policies, the Trust’s Chief Compliance Officer’s favorable compliance report on each Sub Advisor and the fees charged by the Sub Advisors to other clients as compared to the fees they receive from the Advisor. While the Board considered financial information regarding each Sub Advisor, it did not consider information as to the profitability of each Sub Advisory Agreement to the applicable Sub Advisor, since the fees payable to the Sub Advisors had been negotiated at arm’s length and were paid by the Advisor. The Trustees noted that the Sub Advisors participated in a commission recapture program administered by the Advisor, which reduced the Funds’ expenses. The Board considered that Capital Guardian Trust Company and Santa Barbara Asset Management, Inc. do not pay for any soft dollar services through trades for the Growth Fund, and that the soft dollar commissions for trades by Mazama Capital Management, Inc., Sound Shore Management Inc. and Wellington Management Company LLC were a small portion of their trades for the Growth Fund.
In reaching their conclusion with respect to the continuation of the Agreements, the Trustees did not identify any one single factor as being controlling; rather, the Trustees took note of a combination of factors that influenced their decision-making process. The Board did, however, identify the performance of the Funds, the commitment of the Advisor to the successful operation of the Funds, and the level of expenses of the Funds as being important elements of their consideration. The Board took particular note of the performance of each Fund compared to that of similar socially responsible (“SRI”) funds in the Morningstar database, noting that the Growth Fund significantly outperformed the average of its SRI peers for the 1, 3 and 5 year periods ended March 31, 2006; the Income Fund performed near the average of its peers for each such period; the Balanced Growth Fund performed in the top half of its SRI peers for each such period; and the Balanced Income Fund was the top performing of its very small SRI peer group for each such period. The Board also took particular note of the unique duties that the Advisor undertakes in order to assure that the Funds are invested in a manner that is consistent with the social-witness principles of the Presbyterian Church (U.S.A.). The Board further considered the fact that the Advisor had undertaken during the year to waive its investment advisory fees to the extent of the amount of shareholder services fees paid by the Funds during the year in order to limit the overall operating expenses of the Funds.
Based upon their review and consideration of these factors and other matters deemed relevant by the Board in reaching an informed business judgment, the Board of Trustees, including all of the Independent Trustees, concluded that the terms of the Advisory Agreement and the Sub Advisory Agreements are fair and reasonable in light of the services provided and the Board therefore voted to renew the Agreements for an additional one-year period. During this process the Independent Trustees were counseled by their own independent legal counsel (as such term is defined in the rules under the 1940 Act).
35
trustees and officers
NEW COVENANT FUNDS
June 30, 2006
Trustees and Officers of the New Covenant Funds
| | | | | | | | | | | | | |
| | | | | | | | | Number of | | |
| | | | | | | | | Portfolios in | | Other |
| | | Position(s) | | Length | | | | Fund Complex | | Trusteeships/ |
| | | Held With | | of Time | | Principal Occupation(s) | | Overseen by | | Directorships |
| Name and Age | | Trust | | Served | | During Past 5 Years | | Trustee | | Held by Trustee |
| |
INDEPENDENT TRUSTEES | | | | | | | | | | | | |
| |
F. Kenneth Bateman
c/o 200 E. Twelfth St.
Jeffersonville, IN 47130
Age: 66 | | Chairman and Trustee | | Since
inception | | Attorney, Gerber & Bateman, P.A. (1999 to present); Attorney, Potter, Mills & Bateman, P.A. (1997 to 1999); Trustee, Presbyterian Church (U.S.A.) Foundation (1995 to 2001) | | | 4 | | | None |
| | | | | | | | | | | | | |
Gail C. Duree
c/o 200 E. Twelfth St.
Jeffersonville, IN 47130
Age: 59 | | Trustee | | Since
inception | | Independent Financial Consultant, Montview Boulevard Presbyterian Church Treasurer (1994 to present); Women’s Foundation of Colorado (1995 to present); Logan School (1996 to present); Alpha Gamma Delta Foundation Board (2005) | | | 4 | | | None |
| | | | | | | | | | | | | |
Cynthia S. Gooch
c/o 200 E. Twelfth St.
Jeffersonville, IN 47130
Age: 73 | | Trustee | | Since
inception | | Retired; Trustee, Presbyterian Church (U.S.A.) Foundation (1997 to 2002) | | | 4 | | | None |
| | | | | | | | | | | | | |
Rev. Donald B. Register
c/o 200 E. Twelfth St.
Jeffersonville, IN 47130
Age: 69 | | Trustee | | Since
inception | | Retired; From 1988 to May 2005, Pastor, Sixth-Grace Presbyterian Church, Chicago, IL | | | 4 | | | None |
| | | | | | | | | | | | | |
John D. Stuart
c/o 200 E. Twelfth St.
Jeffersonville, IN 47130
Age: 75 | | Trustee | | February
2002 | | Independent Financial Consultant | | | 4 | | | None |
| | | | | | | | | | | | | |
William C. Lauderbach
c/o 200 E. Twelfth St.
Jeffersonville, IN 47130
Age: 67 | | Trustee | | August
2005 | | Executive Vice President and Senior Investment Officer, Chemical Bank and Trust Company, Midland, Michigan (1985 to present) | | | 4 | | | None |
| | | | | | | | | | | | | |
| |
INTERESTED TRUSTEES | | | | | | | | | | | | |
| |
Robert E. Leech
200 E. Twelfth St.
Jeffersonville, IN 47130
Age: 61 | | President and Trustee | | May 2005 | | President and Chief Executive Officer of the Presbyterian Church (U.S.A.) Foundation (2000 to present) | | | 4 | | | Director, New
Covenant Trust
Company |
| | | | | | | | | | | | | |
Samuel W. McNairy
200 E. Twelfth St.
Jeffersonville, IN 47130
Age: 64 | | Trustee | | August
2005 | | Retired; From 1964 to 2001, Deloitte & Touche LLP (retired as Partner, 2001) | | | 4 | | | Trustee, Presbyterian Church (U.S.A.) Foundation (January 2005 to present) |
| |
36
trustees and officers (continued)
NEW COVENANT FUNDS
June 30, 2006
Trustees and Officers of the New Covenant Funds (continued)
| | | | | | | | | | | |
| | | | | | | | | Number of | | |
| | | | | | | | | Portfolios in | | Other |
| | | Position(s) | | Length | | | | Fund Complex | | Trusteeships/ |
| | | Held With | | of Time | | Principal Occupation(s) | | Overseen by | | Directorships |
| Name and Age | | Trust | | Served | | During Past 5 Years | | Trustee | | Held by Trustee |
| |
EXECUTIVE OFFICERS | | | | | | | | | | |
| |
Dennis J. Murphy
200 E. Twelfth St.
Jeffersonville, IN 47130
Age: 64 | | Vice
President | | Since
Inception | | Retired. Former Executive Vice President and Chief Investment Officer, Presbyterian Church (U.S.A.) Foundation and New Covenant Trust Company (2002 to 2005) | | N/A | | N/A |
| | | | | | | | | | | |
George W. Rue III
200 E. Twelfth St.
Jeffersonville, IN 47130
Age: 41 | | Vice
President | | August
2005 | | Senior Vice President and Chief Investment Officer, Presbyterian Church (U.S.A.) Foundation and New Covenant Trust Company, N.A. (2004 to present); Relationship Manager/Product Manager, INVESCO-National Asset Management (2001 to 2004); Relationship Manager, National Asset Management (2000 to 2001) | | N/A | | N/A |
| | | | | | | | | | | |
Anita J. Clemons
200 E. Twelfth St.
Jeffersonville, IN 47130
Age: 52 | | Vice
President | | August
2003 | | Vice President and Investment Officer, New Covenant Trust Company (2000 to present) | | N/A | | N/A |
| | | | | | | | | | | |
Harry Harper
200 E. Twelfth St.
Jeffersonville, IN 47130
Age: 61 | | Chief
Compliance
Officer | | August
2004 | | Chief Compliance Officer, New Covenant Trust Company (2002 to present); Chief Compliance Officer, Allegheny Financial Group (2000 to 2002) | | N/A | | N/A |
| | | | | | | | | | | |
Martin R. Dean
3435 Stelzer Rd., Suite 1000
Columbus, OH 43219
Age: 42 | | Treasurer | | November
2005 | | Vice President, Fund Administration, BISYS Fund Services (1994 to present) | | N/A | | N/A |
| | | | | | | | | | | |
Charles J. Daly
3435 Stelzer Rd., Suite 1000
Columbus, OH 43219
Age: 35 | | Secretary | | February
2004 | | Counsel, BISYS Fund Services (November 2003-present); Associate, Goodwin Proctor LLP (2001 to 2003) | | N/A | | N/A |
| | | | | | | | | | | |
Alaina V. Metz
3435 Stelzer Rd., Suite 1000
Columbus, OH 43219
Age: 38 | | Assistant
Secretary | | February
2004 | | Vice President, Blue Sky Compliance, BISYS Fund Services (1995 to present) | | N/A | | N/A |
| |
37
[This Page Intentionally Left Blank]
[This Page Intentionally Left Blank]
[This Page Intentionally Left Blank]
New Covenant Funds
200 E. Twelfth Street
Jeffersonville, IN 47130
This report is authorized for distribution only if preceded or accompanied by a current prospectus. Shares of New Covenant Funds are distributed by
New Covenant Funds Distributor, Inc.
200 E. Twelfth Street
Jeffersonville, IN 47130.
Item 2. Code of Ethics.
Disclose whether, as of the end of the period covered by the report, the registrant has adopted a code of ethics that applies to the registrant’s principal executive officer, principal financial officer, principal accounting officer or controller, or persons performing similar functions, regardless of whether these individuals are employed by the registrant or a third party. If the registrant has not adopted such a code of ethics, explain why it has not done so.
The registrant has adopted a code of ethics that applies to the registrant’s principal executive officer, principal financial officer, principal accounting officer or controller, or persons performing similar functions. This code of ethics is included as Exhibit 12(a)(i).
The registrant must briefly describe the nature of any amendment, during the period covered by the report, to a provision of its code of ethics that applies to the registrant’s principal executive officer, principal financial officer, principal accounting officer or controller, or persons performing similar functions, regardless of whether these individuals are employed by the registrant or a third party, and that relates to any element of the code of ethics definition enumerated in paragraph (b) of this Item. The registrant must file a copy of any such amendment as an exhibit pursuant to Item 12(a)(1), unless the registrant has elected to satisfy paragraph (f) of this Item by posting its code of ethics on its website pursuant to paragraph (f)(2) of this Item, or by undertaking to provide its code of ethics to any person without charge, upon request, pursuant to paragraph (f)(3) of this Item.
If the registrant has, during the period covered by the report, granted a waiver, including an implicit waiver, from a provision of the code of ethics that applies to the registrant’s principal executive officer, principal financial officer, principal accounting officer or controller, or persons performing similar functions, regardless of whether these individuals are employed by the registrant or a third party, that relates to one or more items set forth in paragraph (b) of this Item, the registrant must briefly describe the nature of the waiver, the name of the person to whom the waiver was granted, and the date of the waiver.
During the period covered by the report, with respect to the registrant’s code of ethics that applies to its principal executive officer, principal financial officer, principal accounting officer or controller, or persons performing similar functions; there have been no amendments to, nor any waivers granted from, a provision that relates to any element of the code of ethics definition enumerated in paragraph (b) of this Item 2.
Item 3. Audit Committee Financial Expert.
(a) (1) Disclose that the registrant’s board of directors has determined that the registrant either:
(i) Has at least one audit committee financial expert serving on its audit committee; or
(ii) Does not have an audit committee financial expert serving on its audit committee.
(2) If the registrant provides the disclosure required by paragraph (a)(1)(i) of this Item, it must disclose the name of the audit committee financial expert and whether that person is “independent.” In order to be considered “independent” for purposes of this Item, a member of an audit committee may not, other than in his or her capacity as a member of the audit committee, the board of directors, or any other board committee:
(i) Accept directly or indirectly any consulting, advisory, or other compensatory fee from the issuer; or
(ii) Be an “interested person” of the investment company as defined in Section 2(a)(19) of the Act (15 U.S.C. 80a-2(a)(19)).
(3) If the registrant provides the disclosure required by paragraph (a)(1)(ii) of this Item, it must explain why it does not
have an audit committee financial expert.
3(a)(1) The registrant’s board of directors has determined that the registrant has at least one audit committee financial expert serving on its audit committee.
3(a)(2) The audit committee financial experts are John Stuart and William Lauderbach, who are each “independent” for purposes of this Item 3 of Form N-CSR.
Item 4. Principal Accountant Fees and Services.
(a) Disclose, under the caption Audit Fees, the aggregate fees billed for each of the last two fiscal years for professional services rendered by the principal accountant for the audit of the registrant’s annual financial statements or services that are normally provided by the accountant in connection with statutory and regulatory filings or engagements for those fiscal years.
| | | | | |
| 2006 | | $ | 72,200 | |
| 2005 | | $ | 62,850 | |
(b) Disclose, under the caption Audit-Related Fees, the aggregate fees billed in each of the last two fiscal years for assurance and related services by the principal accountant that are reasonably related to the performance of the audit of the registrant’s financial statements and are not reported under paragraph (a) of this Item. Registrants shall describe the nature of the services comprising the fees disclosed under this category.
(c) Disclose, under the caption Tax Fees, the aggregate fees billed in each of the last two fiscal years for professional services rendered by the principal accountant for tax compliance, tax advice, and tax planning. Registrants shall describe the nature of the services comprising the fees disclosed under this category.
| | | | | |
| 2006 | | $ | 17,500 | |
| 2005 | | $ | 16,500 | |
Fees for both 2006 and 2005 relate to the preparation of federal income and excise tax returns and the review of excise tax distributions.
(d) Disclose, under the caption All Other Fees, the aggregate fees billed in each of the last two fiscal years for products and services provided by the principal accountant, other than the services reported in paragraphs (a) through (c) of this Item. Registrants shall describe the nature of the services comprising the fees disclosed under this category.
(e) (1) Disclose the audit committee’s pre-approval policies and procedures described in paragraph (c)(7) of Rule 2-01 of Regulation S-X.
(2) Disclose the percentage of services described in each of paragraphs (b) through (d) of this Item that were approved by the audit committee pursuant to paragraph (c)(7)(i)(C) of Rule 2-01 of Regulation S-X.
None of the services summarized in (b) — (d), above, were approved by the audit Committee pursuant to Rule 2-01(c)(7)(i)(C) of Regulation S-X.
(f) If greater than 50 percent, disclose the percentage of hours expended on the principal accountant’s engagement to audit the registrant’s financial statements for the most recent fiscal year that were attributed to work performed by persons other than the principal accountant’s full-time, permanent employees.
Not applicable.
(g) Disclose the aggregate non-audit fees billed by the registrant’s accountant for services rendered to the registrant, and rendered to the registrant’s investment adviser (not including any sub-adviser whose role is primarily portfolio management and is subcontracted with or overseen by another investment adviser), and any entity controlling, controlled by, or under common control with the adviser that provides ongoing services to the registrant for each of the last two fiscal years of the registrant.
| | | | | |
| 2006 | | $ | 29,094 | |
| 2005 | | $ | 38,525 | |
(h) Disclose whether the registrant’s audit committee of the board of directors has considered whether the provision of nonaudit services that were rendered to the registrant’s investment adviser (not including any subadviser whose role is primarily portfolio management and is subcontracted with or overseen by another investment adviser), and any entity controlling, controlled by, or under common control with the investment adviser that provides ongoing services to the registrant that were not pre-approved
pursuant to paragraph (c)(7)(ii) of Rule 2-01 of Regulation S-X is compatible with maintaining the principal accountant’s independence.
The audit committee considered the nonaudit services rendered to the registrant’s investment adviser and any entity controlling, controlled by, or under common control with the investment adviser, and believes the services are compatible with the principal accountant’s independence.
Item 5. Audit Committee of Listed Registrants.
| | (a) | | If the registrant is a listed issuer as defined in Rule 10A-3 under the Exchange Act (17CFR 240.10A-3), state whether or not the registrant has a separately-designated standing audit committee established in accordance with Section 3(a)(58)(A) of the Exchange Act (15 U.S.C. 78c(a)(58)(A)). If the registrant has such a committee, however designated, identify each committee member. If the entire board of directors is acting as the registrant’s audit committee as specified in Section 3(a)(58)(B) of the Exchange Act (15 U.S.C. 78c(a)(58)(B)), so state. |
| | (b) | | If applicable, provide the disclosure required by Rule 10A-3(d) under the Exchange Act (17CFR 240.10A-3(d)) regarding an exemption from the listing standards for all audit committees. |
Not applicable.
Item 6. Schedule of Investments.
File Schedule I — Investments in securities of unaffiliated issuers as of the close of the reporting period as set forth in § 210.12-12 of Regulation S-X, unless the schedule is included as part of the report to shareholders filed under Item 1 of this Form.
Not applicable.
Item 7. Disclosure of Proxy Voting Policies and Procedures for Closed-End Management Investment Companies.
A closed-end management investment company that is filing an annual report on this Form N-CSR must, unless it invests exclusively in non-voting securities, describe the policies and procedures that it uses to determine how to vote proxies relating to portfolio securities, including the procedures that the company uses when a vote presents a conflict between the interests of its shareholders, on the one hand, and those of the company’s investment adviser; principal underwriter; or any affiliated person (as defined in Section 2(a)(3) of the Investment Company Act of 1940 (15 U.S.C. 80a-2(a)(3)) and the rules thereunder) of the company, its investment adviser, or its principal underwriter, on the other. Include any policies and procedures of the company’s investment adviser, or any other third party, that the company uses, or that are used on the company’s behalf, to determine how to vote proxies relating to portfolio securities.
Not applicable.
Item 8. Portfolio Managers of Closed-End Management Investment Companies.
If the registrant is a closed-end management investment company that is filing an annual report on this Form N-CSR, provide the information specified in paragraphs (a) and (b) of this Item with respect to portfolio managers.
Not applicable.
Item 9. Purchases of Equity Securities by Closed-End Management Investment Company.
If the registrant is a closed-end management investment company, provide the information specified in paragraph (b) of this Item with respect to any purchase made by or on behalf of the registrant or any “affiliated purchaser,” as defined in Rule 10b-18(a)(3) under the Exchange Act (17 CFR 240.10b-18(a)(3)), of shares or other units of any class of the registrant’s equity securities that is registered by the registrant pursuant to Section 12 of the Exchange Act (15 U.S.C. 781).
Not applicable.
Item 10. Submission of Matters to a Vote of Security Holders.
Describe any material changes to the procedures by which shareholders may recommend nominees to the registrant’s board of directors, where those changes were implemented after the registrant last provided disclosure in response to the requirements of Item 7(d)(2)(ii)(G) of Schedule 14A (17 CFR 240.14a-101), or this Item.
Not applicable.
Item 11. Controls and Procedures.
(a) Disclose the conclusions of the registrant’s principal executive and principal financial officers, or persons performing similar functions, regarding the effectiveness of the registrant’s disclosure controls and procedures (as defined in Rule 30a-3(c) under the Act (17 CFR 270.30a-3(c))) as of a date within 90 days of the filing date of the report that includes the disclosure required by this paragraph, based on the evaluation of these controls and procedures required by Rule 30a-3(b) under the Act (17 CFR 270.30a-3(b)) and Rules 13a-15(b) or 15d-15(b) under the Exchange Act (17 CFR 240.13a-15(b) or 240.15d-15(b)).
The registrant’s principal executive officer and principal financial officer have concluded, based on their evaluation of the registrant’s disclosure controls and procedures as conducted within 90 days of the filing date of this report, that these disclosure controls and procedures are adequately designed and are operating effectively to ensure that information required to be disclosed by the registrant on Form N-CSR is recorded, processed, summarized and reported within the time periods specified in the Securities and Exchange Commission’s rules and forms.
(b) Disclose any change in the registrant’s internal control over financial reporting (as defined in Rule 30a-3(d) under the Act (17 CFR 270.30a-3(d)) that occurred during the second fiscal quarter of the period covered by this report that has materially affected, or is reasonably likely to materially affect, the registrant’s internal control over financial reporting.
There were no changes in the registrant’s internal control over financial reporting that occurred during the second fiscal quarter of the period covered by this report that have materially affected or are reasonably likely to materially affect, the registrant’s internal control over financial reporting.
Item 12. Exhibits.
(a) File the exhibits listed below as part of this Form. Letter or number the exhibits in the sequence indicated.
(a)(1) Any code of ethics, or amendment thereto, that is the subject of the disclosure required by Item 2, to the extent that the registrant intends to satisfy the Item 2 requirements through filing of an exhibit.
The code of ethics that is the subject of the disclosure required by Item 2 is attached hereto.
(a)(2) A separate certification for each principal executive officer and principal financial officer of the registrant as required by Rule 30a-2(a) under the Act (17 CFR 270.30a-2). Certifications pursuant to Rule 30a-2(a) are attached hereto.
(a)(3) Any written solicitation to purchase securities under Rule 23c-1 under the Act (17 CFR 270.23c-1) sent or given during the period covered by the report by or on behalf of the registrant to 10 or more persons. Not applicable.
(b) If the report is filed under Section 13(a) or 15(d) of the Exchange Act, provide the certifications required by rule 30a-2(b) under the Act as an exhibit. A certification furnished pursuant to this paragraph will not be deemed “filed” for purposes of Section 18 of the Exchange Act, or otherwise subject to the liability of that section. Such certification will not be deemed to be incorporated by reference into any filing under the Securities Act of 1933 or the Exchange Act, except to the extent that the registrant incorporates it by reference. Certifications pursuant to Rule 30a-2(b) are furnished herewith.
SIGNATURES
Pursuant to the requirements of the Securities Exchange Act of 1934 and the Investment Company Act of 1940, the registrant has duly caused this report to be signed on its behalf by the undersigned, thereunto duly authorized.
| | | |
(Registrant) NEW COVENANT FUNDS
| | |
| | | |
| | | |
By /s/ Martin R. Dean Martin R. Dean Treasurer | | |
| | | |
| | |
Pursuant to the requirements of the Securities Exchange Act of 1934 and the Investment Company Act of 1940, this report has been signed below by the following persons on behalf of the registrant and in the capacities and on the dates indicated.
| | | |
| | | |
By /s/ Robert E. Leech Robert E. Leech President | | |
| | | |
| | |
| | | |
By /s/ Martin R. Dean Martin R. Dean Treasurer | | |
| | | |
| | |