As filed with the Securities and Exchange Commission on September 8, 2008
UNITED STATES
SECURITIES AND EXCHANGE COMMISSION
Washington, D.C. 20549
FORM N-CSR
CERTIFIED SHAREHOLDER REPORT OF REGISTERED
MANAGEMENT INVESTMENT COMPANIES
Investment Company Act file number 811-09025
New Covenant Funds
(Exact name of registrant as specified in charter)
200 East Twelfth Street, Jeffersonville, IN 47130
(Address of principal executive offices) (Zip code)
U.S. Bancorp Fund Service, LLC
777 E Wisconsin Avenue
Milwaukee, WI 53202
(Name and address of agent for service)
414-765-5138
Registrant’s telephone number, including area code
Date of fiscal year end: June 30
Date of reporting period: June 30, 2008
Item 1. Report to Stockholders.
to our shareholders
NEW COVENANT FUNDS ANNUAL REPORT
Letter to Shareholders
Dear Shareholders:
We are pleased to present this annual report covering the 12-month period between July 1, 2007 and June 30, 2008. The economy slowed considerably but continued to expand, while stocks posted substantial losses. The bond market generated strong gains on the whole, but experienced high levels of volatility.
The economy faced a confluence of headwinds during this fiscal year. Rising defaults on subprime mortgages caused institutions to become much more cautious about lending, leading to a credit and liquidity crunch that slowed the economy. The subprime mortgage crisis also undermined the balance sheets of many large financial institutions, calling into question the health of parts of the financial system. Tighter credit meanwhile exacerbated the recession in the housing market, which saw home prices drop, inventory rise and activity slow during this period.
Prices on energy, food and other commodities surged. A number of factors contributed to the run-up in the cost of raw materials, including powerful demand from China and other developing economies, the conversion of farmland from food-crop production to biofuel production, a weaker dollar, and concerns about commodity supplies due to weather and geopolitical factors. Higher commodities costs led to concerns about higher inflation by the end of the period.
Falling home prices, tighter credit and higher food and energy costs weighed on consumers. Consumers also faced a weaker job market, as corporations expecting slower economic growth reduced their hiring. These factors sent consumer confidence to its lowest point in more than a decade. Nevertheless, consumer spending held up better than many economists had expected—in part due to the federal government’s economic stimulus package—helping the economy avoid contraction.
Other factors buoyed the economy as well. The Federal Reserve reduced its target short-term interest rate eight times during this 12-month period, from 5.25% to 2.00%. The Fed also orchestrated the buyout of troubled securities firm Bear Stearns in order to shore up the health of the financial system. A weaker dollar meanwhile supported strong exports, as U.S. firms’ products and services became more competitive and revenues earned in foreign currencies became more valuable.
The stock market experienced broad declines during the 12 months through June, 2008. The large-cap S&P 500 fell −13.11%, while the Russell 2000 index of small- and mid-cap stocks lost −16.19% and the dollar-denominated MSCI All Country World ex-U.S. Index declined −6.2%.
The financial sector led the stock market’s declines, as investors concerned about the possible repercussions of the subprime crisis and the credit crunch fled financial stocks. Consumer discretionary stocks also suffered, due to the combination of factors crimping consumer spending. Stocks in the energy and materials sectors meanwhile performed well, on the whole, as skyrocketing commodities prices increased profits for firms related to raw materials.
Large stocks generally outperformed smaller stocks. That trend occurred in part because investors favored shares of firms with the ability to generate their own financing—for example, through cash reserves or current revenues—over stocks of companies that relied on borrowing. Larger firms also provided somewhat greater exposure to overseas markets, which offered stronger growth and more-valuable currencies.
Growth stocks held up much better than value stocks during this difficult environment: The Russell 3000 Growth Index, which includes shares of large, medium-sized and small growth-oriented firms, lost −6.38%, while its value-oriented counterpart, the Russell 3000 Value Index, fell −19.02%. Financial stocks, which comprise a large portion of the value index, were the greatest contributor to that benchmark’s declines.
The fixed-income markets posted strong overall returns despite periods of volatility. The Lehman Aggregate Bond Index returned 7.12% for the 12-month period. Investors seeking safety and quality favored Treasury securities, pushing prices up and yields down on Treasury bonds. Investors generally sold other types of bonds—often to shore up balance sheets that were under pressure from write-downs related to the subprime crisis. Still, attractive yields on many non-Treasury issues helped the bonds produce solid total returns for the period.
Corporate bonds were very volatile, as investors worried about the effects of credit downgrades. Yields on short-term bonds fell dramatically, due to the Federal Reserve’s interest-rate cuts and investors’ flight to safety, while longer-term bond yields declined modestly.
The New Covenant Growth Fund
The New Covenant Growth Fund returned −12.61% during the 12-month period through June 30, 2008. That compared to a −13.11% return for the Fund’s benchmark, the Standard & Poor’s 500 Index.1
This Fund takes a core-satellite approach to diversification2: It invests the majority of its assets in a core portfolio and adds satellite portfolios of value, growth and international stocks. The Fund also spreads its assets among small-, mid- and large-cap shares in order to gain exposure to the broad equity market.
Strong performance by the Fund’s large-cap growth and large cap value managers helped the New Covenant Growth Fund outperform its benchmark. Both managers outperformed the S&P 500 as well as their style-specific indexes. Holding a specific allocation to growth stocks also boosted returns relative to the benchmark, as growth shares led the equity markets. Likewise, the Fund’s allocation to foreign stocks, which held up better than the U.S. market during this period, helped the Fund post a smaller decline than the S&P 500.
The Fund’s dedicated allocations to small- and mid-cap stocks reduced its relative performance, as smaller stocks generally trailed larger cap stocks.
The New Covenant Income Fund
The New Covenant Income Fund returned 1.36% during the 12-month period ended June 30, 2008. That compared to a 7.17% return for its primary benchmark, the Lehman Intermediate Aggregate Bond Index and a 7.12% return for the Lehman Aggregate Bond Index.
The Fund lagged its benchmark primarily because of an overweight stake in high-quality mortgage-backed securities and an underweight position in Treasury securities. The Fund’s manager reduced the portfolio’s position in Treasuries after they rallied during 2007, and captured higher yields by shifting more assets to mortgage-backed securities. Investors’ flight to quality caused mortgage-backed bonds to continue trailing Treasuries, however, weighing on relative performance. The overweight position in mortgage bonds did help the Fund generate a strong yield relative to the benchmark as of the end of the period, however.
The New Covenant Balanced Growth Fund
The New Covenant Balanced Growth Fund returned −7.26% during the 12-month period ended June 30, 2008. That compared to a −5.24% return for its primary benchmark, a composite index comprised of a 60% weighting in the S&P 500 and a 40% weighting in the Lehman Intermediate
2
to our shareholders
NEW COVENANT FUNDS ANNUAL REPORT
Letter to Shareholders
Aggregate Bond Index and a −5.25% return for the index comprised of a 60% weighting in the S&P 500 and a 40% weighting in the Lehman Aggregate Bond Index
The Balanced Growth Fund trailed its composite benchmark primarily because of underperformance by the Income Fund, which trailed the Lehman Aggregate Bond Index by nearly six percentage points. As of June 30, 2008, the Fund held an asset allocation of 61% of assets in the New Covenant Growth Fund and 38% in the New Covenant Income Fund.*
The New Covenant Balanced Income Fund
The New Covenant Balanced Income Fund returned −3.95% during the 12-month period ended June 30, 2008. That compared to a −0.15% return for its primary benchmark, a composite index comprised of a 35% weighting in the S&P 500 and a 65% weighting in the Lehman Intermediate Aggregate Bond Index and a −0.17% return for the index comprised of a 35% weighting in the S&P 500 and a 65% weighting in the Lehman Aggregate Bond Index.
The Income Fund trailed its benchmark significantly, detracting from the Balanced Income Fund’s performance relative to the composite index. The Fund as of June 30, 2008 held 36% of its assets in the New Covenant Growth Fund and 61% of its assets in the New Covenant Income Fund.*
We believe that the difficult environment during this fiscal year illustrates the importance of appropriate asset allocation and thorough diversification. An investor who held both stocks and bonds during this period would have significantly outperformed an equity-only investor, as the performance of the New Covenant Balanced Funds indicates. Furthermore, diversification among various sizes and styles of stocks, both in the U.S. and abroad, helped the Funds’ equity allocation hold up better than the narrower S&P 500 benchmark.
Thank you for choosing the New Covenant Funds. We look forward to working with you to attempt to achieve your most important financial objectives over the coming years and decades.
Sincerely,
Anita Clemons
Vice President
Acting Chief Investment Officer
The NCF Investment Department of New Covenant Trust Company, N.A.
Past performance does not guarantee future results. The performance data quoted represents past performance and current returns may be lower or higher. Total return figures include change in share price, reinvestment of dividends and capital gains. The investment return and principal value will fluctuate so that an investor’s shares, when redeemed, may be worth more or less than the original cost. To obtain performance information current to the most recent month end, please call 877-835-4531 or visit our website at www.NewCovenantFunds.com.
| | |
| * | | Portfolio composition is subject to change. |
| 1 | | The Standard & Poor’s 500 (“S&P 500”) Index of stocks is a capitalization weighted index that measures the performance of 500 large-capitalization stocks representing all major industries. The Lehman Aggregate Bond Index is a market value-weighted performance benchmark for investment-grade fixed-rate debt issues, including government, corporate, asset-backed, and mortgage-backed securities, with maturities of at least one year. These indices are unmanaged and do not reflect the fees or expenses associated with a mutual fund. It is not possible to invest directly in any index. |
| 2 | | Diversification does not guarantee a profit nor protect against a loss. |
Portfolio Allocation as of 6/30/08 (unaudited) (subject to change)
GROWTH FUND:
| | | | | |
| | | Percentage of
|
| Security Allocation | | Market Value |
| Information Technology | | | 18.9% | |
| Health Care | | | 17.2% | |
| Financials | | | 14.1% | |
| Industrials | | | 13.9% | |
| Energy | | | 12.3% | |
| Consumer Discretionary | | | 11.5% | |
| Consumer Staples | | | 6.0% | |
| Materials | | | 2.3% | |
| Utilities | | | 2.0% | |
| Telecommunication Services | | | 1.8% | |
| |
| |
| Total | | | 100.0% | |
INCOME FUND:
| | | | | |
| | | Percentage of
|
| Security Allocation | | Market Value |
| Non-Government Agency/Mortgage Backed Securities | | | 40.7% | |
| Government Agency/Mortgage Backed Securities | | | 27.8% | |
| Corporates | | | 23.3% | |
| Asset Backed | | | 4.0% | |
| Treasuries | | | 0.5% | |
| Closed End Investment Companies | | | 1.5% | |
| Cash Equivalents(a) | | | 2.2% | |
| |
| |
| Total | | | 100.0% | |
BALANCED GROWTH FUND:
| | | | | |
| | | Percentage of
|
| Security Allocation | | Market Value |
| New Covenant Growth Fund | | | 60.7% | |
| New Covenant Income Fund | | | 37.6% | |
| Cash Equivalents(a) | | | 1.7% | |
| |
| |
| Total | | | 100.0% | |
BALANCED INCOME FUND:
| | | | | |
| | | Percentage of
|
| Security Allocation | | Market Value |
| New Covenant Income Fund | | | 61.0% | |
| New Covenant Growth Fund | | | 35.9% | |
| Cash Equivalents(a) | | | 3.1% | |
| |
| |
| Total | | | 100.0% | |
| | |
| (a) | | Includes other assets in excess of liabilities |
3
to our shareholders
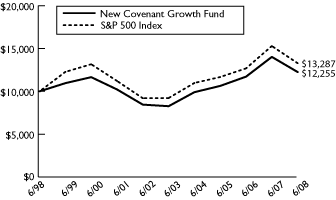
Hypothetical Illustration of a $10,000 Investment
As of June 30, 2008
New Covenant Growth Fund
| | | | | | | | | | | | | | | | | |
| | | Average Annual Total Return1 |
| | | |
| | | 1 Year | | 3 Year | | 5 Year | | 10 Year |
New Covenant Growth Fund2 | | | -12.61% | | | | 4.84% | | | | 8.19% | | | | 2.05% | |
| S&P 500 Index | | | -13.11% | | | | 4.40% | | | | 7.58% | | | | 2.88% | |
| |
Gross Expense Ratio: 1.34%
Net Expense Ratio: 1.08%
The Gross Expense Ratio is based on the most recent prospectus. The Fund’s Adviser has contractually agreed to limit the fees for the period from July 1, 2007 through June 30, 2008. The Net Expense Ratio is based upon the Gross Expense less the fees waived by the Adviser. Had this waiver not been in effect, the performance would have been lower.
The S&P 500 Index is a capitalization weighted index that measures the performance of 500 large-capitalization stocks representing all major industries. The index is unmanaged and does not reflect fees or expenses associated with a mutual fund. Investors cannot invest directly in an index.
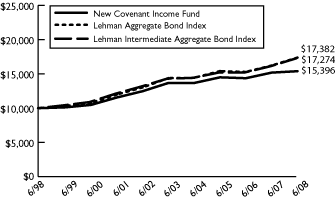
As of June 30, 2008
New Covenant Income Fund
| | | | | | | | | | | | | | | | | |
| | | Average Annual Total Return1 |
| | | |
| | | 1 Year | | 3 Year | | 5 Year | | 10 Year |
New Covenant Income Fund2 | | | 1.36% | | | | 2.02% | | | | 2.39% | | | | 4.41% | |
| Lehman Intermediate Aggregate Bond Index | | | 7.17% | | | | 4.35% | | | | 3.85% | | | | 5.62% | |
| Lehman Aggregate Bond Index | | | 7.12% | | | | 4.09% | | | | 3.85% | | | | 5.68% | |
| |
Gross Expense Ratio: 1.10%
Net Expense Ratio: 0.85%
The Gross Expense Ratio is based on the most recent prospectus. The Fund’s Adviser has contractually agreed to limit the fees for the period from July 1, 2007 through June 30, 2008. The Net Expense Ratio is based upon the Gross Expense less the fees waived by the Adviser. Had this waiver not been in effect, the performance would have been lower.
The Lehman Aggregate Bond Index is representative of intermediate and long-term government investment grade corporate debt securities. The index is unmanaged and does not reflect fees or expenses associated with a mutual fund. The Lehman Intermediate Aggregate Bond index is representative of Intermediate investment grade government and corporate debt securities with maturities of 10 years or less. Investors cannot invest directly in an index.
The investment seeks investment results that correspond to the total return of the Lehman Intermediate Aggregate Bond index. The portfolio normally invests at least 80% of assets, plus borrowings for investment purposes, in a portfolio of investment grade debt securities, rated at least A by Moody’s Investors Service, Inc. or rated at least A by Standard & Poor’s Rating Group, or of comparable quality if unrated, included in the index, derivatives whose economic returns are, by design closely equivalent to the returns of the index or its components and exchange-traded funds.
Past performance does not guarantee future results. The performance data quoted represents past performance and current returns may be lower or higher. Total return figures include change in share price, reinvestment of dividends and capital gains. The investment return and principal value will fluctuate so that an investor’s shares, when redeemed, may be worth more or less than the original cost. Returns do not reflect the deduction of taxes that a shareholder would pay on Fund distributions or redemptions of Fund shares. To obtain performance information current to the most recent month end, please call 877-835-4531 or visit our website at www.NewCovenantFunds.com.
The growth charts above illustrate a hypothetical investment in the Fund versus the appropriate index and represent the reinvestment of dividends and capital gains. The performance of the Fund does not reflect any sales charge or the deduction of taxes that a shareholder would pay on Fund distributions or redemptions of Fund shares.
| | |
| 1 | | Returns shown assume reinvestment of all dividends and distributions. |
4
to our shareholders
| | |
| 2 | | The performance information for all of the New Covenant Funds reflects performance prior to the July 1, 1999 inception date of the Funds. It represents performance records of the private pools previously managed by the Presbyterian Church (U.S.A.) Foundation, the predecessor entity to the Adviser. These private pools had investment objectives and policies in all material respects equivalent to those of the Funds. They were not subject to the requirements of the Investment Company Act of 1940 or the Internal Revenue Code of 1986, which may adversely affect performance results. The performance has been restated to reflect the total expenses of the Funds. |
| |
| 3 | | The Benchmark of the New Covenant Income Fund was changed from the Lehman Aggregate Bond Index to the Lehman Intermediate Aggregate Bond Index on June 1, 2008. The Adviser believes that the Lehman Intermediate Aggregate Bond Index is more highly correlated to the holdings and style of the New Covenant Income Fund. |
5
to our shareholders
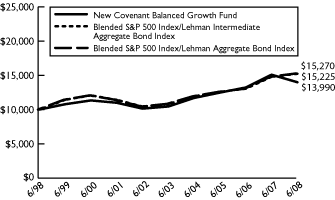
Hypothetical Illustration of a $10,000 Investment
As of June 30, 2008
New Covenant Balanced Growth Fund
| | | | | | | | | | | | | | | | | |
| | | Average Annual Total Return1 |
| | | |
| | | 1 Year | | 3 Year | | 5 Year | | 10 Year |
New Covenant Balanced Growth Fund2 | | | -7.26% | | | | 3.88% | | | | 6.00% | | | | 3.41% | |
| Blended S&P 500 Index/Lehman Intermediate Aggregate Bond Index | | | -5.24% | | | | 4.53% | | | | 6.21% | | | | 4.29% | |
| Blended S&P 500 Index/Lehman Aggregate Bond Index | | | -5.25% | | | | 4.43% | | | | 6.22% | | | | 4.32% | |
| |
Gross Expense Ratio: 0.37%
Net Expense Ratio: 0.12%
The Gross Expense Ratio is based on the most recent prospectus. The Fund’s adviser has contractually agreed to limit the fees for the period from July 1, 2007 through June 30, 2008. The Net Expense Ratio is based upon the Gross Expense less the fees waived by the adviser. Had this waiver not been in effect, the performance would have been lower. The Fund expense, inclusive of your pro rata share of fees and expenses incurred by the Growth Fund and Income Fund in which the Balanced Growth Fund invests, is expected to be 1.10% and prior to any expense waivers and reimbursements 1.35%.
The Blended S&P 500 Index/Lehman Aggregate Bond Index is a composite index composed of 60% S&P 500 Index and 40% Lehman Aggregate Bond Index. The S&P 500 Index is a capitalization weighted index that measures the performance of 500 large capitalization stocks representing all major industries. The Lehman Aggregate Bond Index is representative of intermediate and long-term government and investment grad corporate debt securities. The Lehman Intermediate Aggregate Bond Index is representative of intermediate investment grade government and corporate debt securities with maturities of 10 years of less. These indices are unmanaged and do not reflect fees or expenses associate with a mutual fund. Investors cannot invest directly in an index.
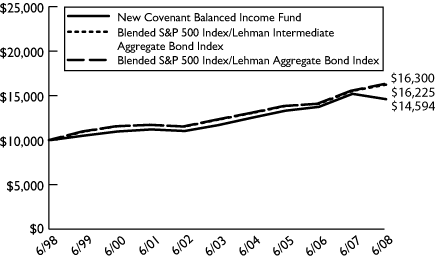
As of June 30, 2008
New Covenant Balanced Income Fund
| | | | | | | | | | | | | | | | | |
| | | Average Annual Total Return1 |
| | | |
| | | 1 Year | | 3 Year | | 5 Year | | 10 Year |
New Covenant Balanced Income Fund2 | | | -3.95% | | | | 3.15% | | | | 4.55% | | | | 3.85% | |
| Blended S&P 500 Index/Lehman Intermediate Aggregate Bond Index | | | -0.15% | | | | 4.51% | | | | 5.27% | | | | 4.96% | |
| Blended S&P 500 Index/Lehman Aggregate Bond Index | | | -0.17% | | | | 4.34% | | | | 5.28% | | | | 5.01% | |
| |
Gross Expense Ratio: 0.40%
Net Expense Ratio: 0.15%
The Gross Expense Ratio is based on the most recent prospectus. The Fund’s adviser has contractually agreed to limit the fees for the period from July 1, 2007 through June 30, 2008. The Net Expense Ratio is based upon the Gross Expense less the fees waived by the adviser. Had this waiver not been in effect, the performance would have been lower. The Fund expense, inclusive of your pro rata share of fees and expenses incurred by the Growth Fund and Income Fund in which the Balanced Growth Fund invests, is expected to be 1.08% and prior to any expense waivers and reimbursements 1.33%.
The Blended S&P 500 Index/Lehman Aggregate Bond Index is a composite index composed of 35% S&P 500 Index and 65% Lehman Aggregate Bond Index. The S&P 500 Index is a capitalization weighted index that measures the performance of 500 large capitalization stocks representing all major industries. The Lehman Aggregate Bond Index is representative of intermediate and long-term government and investment grad corporate debt securities. The Lehman Intermediate Aggregate Bond Index is representative of intermediate investment grade government and corporate debt securities with maturities of 10 years of less. These indices are unmanaged and do not reflect fees or expenses associate with a mutual fund. Investors cannot invest directly in an index.
Past performance does not guarantee future results. The performance data quoted represents past performance and current returns may be lower or higher. Total return figures include change in share price, reinvestment of dividends and capital gains. The investment return and principal value will fluctuate so that an investor’s shares, when redeemed, may be worth more or less than the original cost. Returns do not reflect the deduction of taxes that a shareholder would pay on Fund distributions or redemptions of Fund shares. To obtain performance information current to the most recent month end, please call 877-835-4531 or visit our website at www.NewCovenantFunds.com.
The growth charts above illustrate a hypothetical investment in the Fund versus the appropriate index and represent the reinvestment of dividends and capital gains. The performance of the Fund does not reflect any sales charge or the deduction of taxes that a shareholder would pay on Fund distributions or redemptions of Fund shares.
| | |
| 1 | | Returns shown assume reinvestment of all dividends and distributions. |
| |
| 2 | | The performance information for all of the New Covenant Funds reflects performance prior to the July 1, 1999 inception date of the Funds. It represents performance records of the private pools previously managed by the Presbyterian Church (U.S.A.) Foundation, the predecessor entity to the Adviser. These private pools had investment objectives and policies in all material respects equivalent to those of the Funds. They were not subject to the requirements of the Investment Company Act of 1940 or the Internal Revenue Code of 1986, which may adversely affect performance results. The performance has been restated to reflect the total expenses of the Funds. |
6
to our shareholders
| | |
| 3 | | The Benchmark of the New Covenant Balanced Growth Fund was changed from the Blended 60% S&P 500/40% Lehman Aggregate Bond Index to the Blended 60% S&P 500/40% Lehman Intermediate Aggregate Bond Index on June 1, 2008. The Adviser believes that the Blended 60% S&P 500/40% Lehman Intermediate Aggregate Bond Index is more highly correlated to the holdings and style of the New Covenant Balanced Income Fund. |
| |
| 4 | | The Benchmark of the New Covenant Balanced Income Fund was changed from the Blended 35% S&P 500/65% Lehman Aggregate Bond Index to the Blended 35% S&P 500/65% Lehman Intermediate Aggregate Bond Index on June 1, 2008. The Adviser believes that the Blended 35% S&P 500/65% Lehman Intermediate Aggregate Bond Index is more highly correlated to the holdings and style of the New Covenant Balanced Income Fund. |
7
portfolio of investments
NEW COVENANT GROWTH FUND
June 30, 2008
| | | | | | | | | |
|
| Shares | | Value |
|
| |
COMMON STOCKS (98.0%) |
| | | | | Advertising (0.6%) |
| | 325,400 | | | Interpublic Group of Cos., Inc.(a) | | | $2,798,440 | |
| | 45,400 | | | Omnicom Group, Inc. | | | 2,037,552 | |
| | 11,973 | | | PagesJaunes Groupe Sa(L) | | | 176,256 | |
| | | | | | | | | |
| | | | | | | | 5,012,248 | |
| | | | | | | | | |
| | | | | Aerospace & Defense (0.1%) |
| | 12,000 | | | BE Aerospace, Inc.(a) | | | 279,480 | |
| | 2,000 | | | Esterline Technologies Corp.(a)(L) | | | 98,520 | |
| | 12,700 | | | Hexcel Corp.(a)(L) | | | 245,110 | |
| | 1,500 | | | Integral Systems, Inc.(L) | | | 58,050 | |
| | 2,070 | | | Teledyne Technologies, Inc.(a)(L) | | | 100,995 | |
| | | | | | | | | |
| | | | | | | | 782,155 | |
| | | | | | | | | |
| | | | | Automotive (0.6%) |
| | 28,200 | | | BorgWarner, Inc.(L) | | | 1,251,516 | |
| | 6,700 | | | Compagnie Generale des Etablissements Michelin(L) | | | 481,450 | |
| | 42,100 | | | Nissan Motor Co., Ltd. | | | 347,711 | |
| | 4,000 | | | Peugeot SA(L) | | | 217,212 | |
| | 1,320 | | | Porsche AG | | | 203,443 | |
| | 7,700 | | | Suzuki Motor Corp. | | | 182,013 | |
| | 4,520 | | | Tenneco Automotive, Inc.(a)(L) | | | 61,155 | |
| | 140,300 | | | TRW Automotive Holdings Corp.(a)(L) | | | 2,591,341 | |
| | | | | | | | | |
| | | | | | | | 5,335,841 | |
| | | | | | | | | |
| | | | | Banks (3.8%) |
| | 12,500 | | | Allied Irish Banks PLC | | | 192,851 | |
| | 61,300 | | | Banco Bilbao Vizcaya Argentaria SA | | | 1,174,577 | |
| | 6,500 | | | Banco Santander Central Hispano SA | | | 119,430 | |
| | 41,000 | | | Bank Muscat SA - GDR(a) | | | 766,655 | |
| | 295,829 | | | Bank of America Corp. | | | 7,061,438 | |
| | 81,800 | | | Bank of East Asia Ltd. | | | 444,289 | |
| | 71,900 | | | Bank of New York Mellon Corp. | | | 2,719,977 | |
| | 11,400 | | | Boston Private Financial Holdings, Inc.(L) | | | 64,638 | |
| | 172,000 | | | China Construction Bank Corp. | | | 138,531 | |
| | 4,390 | | | City Holding Co.(L) | | | 178,980 | |
| | 184,600 | | | Commerce Asset Holdings | | | 451,966 | |
| | 17,269 | | | Commercial International Bank | | | 264,776 | |
| | 9,500 | | | Dime Community Bancshares, Inc.(L) | | | 156,845 | |
| | 21,660 | | | East West Bancorp, Inc.(a)(L) | | | 264,630 | |
| | 1,160 | | | First Citizens BancShares, Inc.(L) | | | 161,808 | |
| | 6,500 | | | Frontier Financial Corp.(L) | | | 55,380 | |
| | 231,900 | | | Grupo Financiero Inbursa SA | | | 840,076 | |
| | 17,052 | | | HSBC Holdings PLC | | | 263,482 | |
| | 181,700 | | | Huntington Bancshares, Inc.(L) | | | 1,048,409 | |
| | 248,000 | | | Industrial and Commercial Bank of China - Class H | | | 169,527 | |
| | 9,980 | | | International Bancshares Corp.(L) | | | 213,273 | |
| | 49,756 | | | JPMorgan Chase & Co. | | | 1,707,128 | |
| | 20,400 | | | Lloyds TSB Group PLC | | | 126,268 | |
| | 20,100 | | | Mitsubishi Tokyo Financial Group, Inc. | | | 178,124 | |
| | 113 | | | Mizuho Financial Group, Inc. | | | 527,834 | |
| | 3,300 | | | National Bank of Canada | | | 163,883 | |
| | 3,300 | | | Oriental Financial Group, Inc.(L) | | | 47,058 | |
| | 8,800 | | | Peoples United Financial, Inc. | | | 137,280 | |
| | 2,997 | | | Raiffeisen International Bank Holding(L) | | | 383,012 | |
| | 153,344 | | | Royal Bank of Scotland Group PLC | | | 656,689 | |
| | 4,000 | | | Santander BanCorp | | | 42,440 | |
| | 601 | | | Sberbank - GDR(a) | | | 205,336 | |
| | 2,090 | | | SCBT Financial Corp.(L) | | | 59,690 | |
| | 8,600 | | | Standard Chartered PLC | | | 244,956 | |
| | 85,000 | | | State Street Corp. | | | 5,439,150 | |
| | 139 | | | Sumitomo Mitsui Financial Group, Inc. | | | 1,045,920 | |
| | 74,600 | | | UCBH Holdings, Inc.(L) | | | 167,850 | |
| | 7,280 | | | UMB Financial Corp.(L) | | | 373,246 | |
| | 38,100 | | | Wachovia Corp.(L) | | | 591,693 | |
| | 178,710 | | | Washington Mutual, Inc.(L) | | | 881,041 | |
| | 73,300 | | | Wells Fargo & Co. | | | 1,740,875 | |
| | | | | | | | | |
| | | | | | | | 31,471,011 | |
| | | | | | | | | |
| | | | | Chemicals (2.0%) |
| | 1,600 | | | Albemarle Corp. | | | 63,856 | |
| | 2,860 | | | CF Industries Holdings, Inc. | | | 437,008 | |
| | 16,900 | | | Eastman Chemical Co. | | | 1,163,734 | |
| | 186 | | | Givaudan AS | | | 166,236 | |
| | 5,561 | | | Israel Chemicals Ltd. | | | 129,577 | |
| | 1,300 | | | Intrepid Potash, Inc.(a) | | | 85,514 | |
| | 20,600 | | | Metabolix, Inc.(a)(L) | | | 201,880 | |
| | 6,400 | | | Methanex Corp.(a) | | | 180,884 | |
| | 41,400 | | | Mosaic Co., Inc.(a) | | | 5,990,580 | |
| | 1,040 | | | OM Group, Inc.(a)(L) | | | 34,102 | |
| | 20,000 | | | Potash Corp of Saskatchewan, Inc.(a) | | | 4,639,992 | |
| | 27,200 | | | Praxair, Inc. | | | 2,563,328 | |
| | 5,900 | | | Rhodia SA(a) | | | 108,870 | |
| | 220,000 | | | Sinofert Holdings Ltd.(L) | | | 170,701 | |
| | 57,000 | | | Sumitomo Chemical Co. Ltd. | | | 359,118 | |
| | 4,280 | | | Terra Industries, Inc.(a)(L) | | | 211,218 | |
| | 1,442 | | | Uralkali - GDR(a) | | | 104,833 | |
| | 4,100 | | | W.R. Grace & Co.(a)(L) | | | 96,309 | |
| | | | | | | | | |
| | | | | | | | 16,707,740 | |
| | | | | | | | | |
| | | | | Commercial Services (3.1%) |
| | 3,779 | | | Aaron Rents, Inc. | | | 84,385 | |
| | 180,100 | | | Accenture Ltd. - Class A | | | 7,333,672 | |
| | 39,001 | | | Brambles Ltd. | | | 326,401 | |
| | 900 | | | Consolidated Graphics, Inc.(a) | | | 44,343 | |
| | 9,470 | | | CSG Systems International Inc.(a)(L) | | | 104,359 | |
| | 5,470 | | | Dollar Financial Corp.(a)(L) | | | 82,652 | |
| | 6,800 | | | Genpact Ltd(a)(L) | | | 101,456 | |
| | 5,800 | | | ICF International, Inc.(a)(L) | | | 96,396 | |
| | 63,100 | | | Manpower, Inc. | | | 3,674,944 | |
| | 2,000 | | | MAXIMUS, Inc.(L) | | | 69,640 | |
| | 3,700 | | | Msci, Inc.(a) | | | 134,273 | |
| | 1,380 | | | Pre-Paid Legal Services, Inc.(a)(L) | | | 56,056 | |
| | 9,500 | | | Priceline.com, Inc.(a)(L) | | | 1,096,870 | |
| | 11,600 | | | Sapient Corp.(a)(L) | | | 74,472 | |
| | 600 | | | Strayer Education, Inc.(L) | | | 125,442 | |
| | 2,600 | | | SYKES Enterprises, Inc.(a)(L) | | | 49,036 | |
| | 12,800 | | | Visa, Inc., Class A(a) | | | 1,040,768 | |
| | 3,510 | | | Watson Wyatt Worldwide, Inc.(L) | | | 185,644 | |
| | 242,300 | | | Western Union Co. | | | 5,989,656 | |
| | 408,900 | | | Xerox Corp. | | | 5,544,684 | |
| | | | | | | | | |
| | | | | | | | 26,215,149 | |
| | | | | | | | | |
| | | | | Computer Services & Software (7.1%) |
| | 32,700 | | | 3Com Corp.(a) | | | 69,324 | |
| | 37,900 | | | Affiliated Computer Services Inc., Class A(a) | | | 2,027,271 | |
| | 4,280 | | | ANSYS, Inc.(a)(L) | | | 201,674 | |
| | 19,500 | | | Apple Computer, Inc.(a) | | | 3,265,080 | |
| | 83,700 | | | Autodesk, Inc.(a) | | | 2,829,897 | |
| | 47,900 | | | Automatic Data Processing, Inc. | | | 2,007,010 | |
| | 7,030 | | | Avocent Corp.(a) | | | 130,758 | |
| | 3,290 | | | Belden CDT, Inc.(L) | | | 111,465 | |
| | 79,100 | | | BMC Software, Inc.(a) | | | 2,847,600 | |
| | 8,440 | | | Brocade Communications Systems, Inc.(a) | | | 69,545 | |
| | 75,500 | | | Cisco Systems, Inc.(a) | | | 1,756,130 | |
| | 5,100 | | | CMGI, Inc.(a)(L) | | | 54,060 | |
| | 12,500 | | | Commvault Systems, Inc.(a)(L) | | | 208,000 | |
| | 3,670 | | | Earthlink, Inc.(a)(L) | | | 31,746 | |
| | 700 | | | FactSet Research Systems, Inc.(L) | | | 39,452 | |
| | 234,000 | | | Hewlett Packard Co. | | | 10,345,140 | |
| | 29,300 | | | Immersion Corp.(a)(L) | | | 199,533 | |
| | 2,600 | | | Infosys Technologies Ltd - ADR | | | 112,996 | |
| | 41,400 | | | International Business Machines Corp. | | | 4,907,142 | |
| | 86,700 | | | Intuit, Inc.(a) | | | 2,390,319 | |
| | 5,100 | | | Kenexa Corp.(a)(L) | | | 96,084 | |
| | 2,000 | | | Lexmark International, Inc.(a) | | | 66,860 | |
| | 6,100 | | | Longtop Financial Technologies Ltd. - ADR(a) | | | 101,016 | |
| | 9,400 | | | MedAssets, Inc.(a) | | | 160,270 | |
The accompanying notes are an integral part of these financial statements.
8
portfolio of investments (continued)
NEW COVENANT GROWTH FUND
June 30, 2008
| | | | | | | | | |
|
| Shares | | Value |
|
| |
COMMON STOCKS (cont.) |
| | | | | Computer Services & Software (cont.) |
| | 396,000 | | | Microsoft Corp. | | | $10,893,960 | |
| | 900 | | | MicroStrategy, Inc.(a)(L) | | | 58,275 | |
| | 87,700 | | | NetApp, Inc.(a) | | | 1,899,582 | |
| | 37,700 | | | Opentv Corp.(a)(L) | | | 49,387 | |
| | 257,900 | | | Oracle Corp.(a) | | | 5,415,900 | |
| | 11,600 | | | Oracle Corp. Japan(L) | | | 473,024 | |
| | 5,700 | | | Parametric Technology Corp.(a)(L) | | | 95,019 | |
| | 3,330 | | | Progress Software Corp.(a)(L) | | | 85,148 | |
| | 3,700 | | | Radiant Systems, Inc.(a)(L) | | | 39,701 | |
| | 45,000 | | | Red Hats, Inc.(a) | | | 931,050 | |
| | 61,100 | | | Riverbed Technology, Inc.(a)(L) | | | 838,292 | |
| | 7,400 | | | SAP AG | | | 387,511 | |
| | 2,400 | | | Solera Holdings, Inc.(a) | | | 66,384 | |
| | 2,450 | | | SPSS, Inc.(a)(L) | | | 89,107 | |
| | 224,800 | | | Sun Microsystems, Inc.(a)(L) | | | 2,445,824 | |
| | 4,820 | | | Sybase, Inc.(a)(L) | | | 141,804 | |
| | 1,800 | | | Take-Two Interactive Software, Inc.(a) | | | 46,026 | |
| | 24,000 | | | Trend Micro, Inc. | | | 791,072 | |
| | 11,400 | | | United Online, Inc.(L) | | | 114,342 | |
| | 29,000 | | | Wind River Systems, Inc.(a)(L) | | | 315,810 | |
| | | | | | | | | |
| | | | | | | | 59,205,590 | |
| | | | | | | | | |
| | | | | Construction & Building Materials (1.5%) |
| | 16,600 | | | AGCO Corp.(a)(L) | | | 870,006 | |
| | 26,000 | | | Anhui Conch Cement Co., Ltd., Class H(L) | | | 173,895 | |
| | 4,380 | | | Apogee Enterprises, Inc.(L) | | | 70,781 | |
| | 17,830 | | | Bouygues SA | | | 1,183,539 | |
| | 14,076 | | | Cemex S.A.B. de CV - ADR(a) | | | 347,677 | |
| | 2,750 | | | Ceradyne, Inc.(a)(L) | | | 94,325 | |
| | 92,500 | | | China Railway(a) | | | 130,495 | |
| | 18,000 | | | Chiyoda Corp.(L) | | | 195,621 | |
| | 18,081 | | | CRH PLC | | | 525,980 | |
| | 12,740 | | | Emcor Group, Inc.(a)(L) | | | 363,472 | |
| | 32,400 | | | Foster Wheeler Ltd(a) | | | 2,370,060 | |
| | 5,200 | | | Gibraltar Industries, Inc.(L) | | | 83,044 | |
| | 10,500 | | | Gujarat Ambuja Cements Ltd - ADR | | | 18,536 | |
| | 20,100 | | | Gujarat Ambuja Cements Ltd - GDR(b) | | | 35,778 | |
| | 10,841 | | | Holcim Ltd. | | | 878,168 | |
| | 34,000 | | | Jacobs Engineering Group, Inc.(a) | | | 2,743,800 | |
| | 1,500 | | | Lafarge SA | | | 230,004 | |
| | 2,530 | | | Lennox International, Inc.(L) | | | 73,269 | |
| | 16,667 | | | OJSC LSR Group(a) | | | 256,672 | |
| | 2,562 | | | Orascom Construction Industries - ADR(b) | | | 346,867 | |
| | 1,980 | | | Perini Corp.(a)(L) | | | 65,439 | |
| | 10,455 | | | Persimmon PLC | | | 65,806 | |
| | 35,400 | | | Stanley Works | | | 1,586,982 | |
| | | | | | | | | |
| | | | | | | | 12,710,216 | |
| | | | | | | | | |
| | | | | Consumer Products (3.4%) |
| | 32,700 | | | Abercrombie & Fitch Co., Class A | | | 2,049,636 | |
| | 2,500 | | | Chattem, Inc.(a) | | | 162,625 | |
| | 71,600 | | | Crocs, Inc.(a)(L) | | | 573,516 | |
| | 1,390 | | | Deckers Outdoor Corp.(a)(L) | | | 193,488 | |
| | 1,100 | | | Energizer Holdings, Inc.(a) | | | 80,399 | |
| | 5,700 | | | Fossil, Inc.(a)(L) | | | 165,699 | |
| | 4,600 | | | Guess ?, Inc.(L) | | | 172,270 | |
| | 5,900 | | | Herman Miller, Inc.(L) | | | 146,851 | |
| | 9,280 | | | Hot Topic, Inc.(a)(L) | | | 50,205 | |
| | 2,900 | | | Inditex SA(L) | | | 133,599 | |
| | 2,790 | | | Jakks Pacific, Inc.(a)(L) | | | 60,961 | |
| | 8,000 | | | Kimball International, Inc.(L) | | | 66,240 | |
| | 126,700 | | | Kimberly-Clark Corp. | | | 7,574,126 | |
| | 12,200 | | | L’OREAL SA(L) | | | 1,327,298 | |
| | 106,360 | | | NIKE, Inc. | | | 6,340,120 | |
| | 2,800 | | | Nintendo Co., Ltd. | | | 1,579,507 | |
| | 3,900 | | | Nu Skin Enterprises, Inc.(L) | | | 58,188 | |
| | 126,000 | | | Peace Mark | | | 87,585 | |
| | 8,200 | | | Phillips-Van Heusen Corp. | | | 300,284 | |
| | 86,922 | | | Procter & Gamble Co. | | | 5,285,727 | |
| | 110,000 | | | Quiksilver, Inc.(a) | | | 1,080,200 | |
| | 6,070 | | | Skechers U.S.A., Inc., Class A(a)(L) | | | 119,943 | |
| | 11,900 | �� | | Spectrum Brands, Inc.(a)(L) | | | 30,345 | |
| | 2,400 | | | Tupperware Corp. | | | 82,128 | |
| | 5,300 | | | Uni-Charm Corp. | | | 376,842 | |
| | 2,320 | | | Warnaco Group, Inc.(a)(L) | | | 102,242 | |
| | | | | | | | | |
| | | | | | | | 28,200,024 | |
| | | | | | | | | |
| | | | | Diversified Operations (1.8%) |
| | 1,290 | | | Actuant Corp.(L) | | | 40,441 | |
| | 4,000 | | | Acuity Brands, Inc.(L) | | | 192,320 | |
| | 71,000 | | | BAE Systems | | | 625,784 | |
| | 13,600 | | | Compass Diversified Holdings(L) | | | 155,448 | |
| | 37,700 | | | FPL Group, Inc. | | | 2,472,366 | |
| | 387,200 | | | General Electric Co. | | | 10,334,368 | |
| | 32,700 | | | Martha Stewart Living Omnimedia Inc., Class A(a)(L) | | | 241,980 | |
| | 1,600 | | | McCormick & Co., Inc. | | | 57,056 | |
| | 3,800 | | | Mitsubishi Corp. | | | 125,253 | |
| | 1,900 | | | Rofin-Sinar Technologies, Inc.(a)(L) | | | 57,380 | |
| | 58,000 | | | Sumitomo Corp. | | | 761,972 | |
| | 42,900 | | | Wolseley PLC | | | 321,718 | |
| | | | | | | | | |
| | | | | | | | 15,386,086 | |
| | | | | | | | | |
| | | | | Electronics (4.4%) |
| | 81,000 | | | Applied Materials, Inc. | | | 1,546,290 | |
| | 4,900 | | | Atmi, Inc.(a) | | | 136,808 | |
| | 35,300 | | | Avnet, Inc.(a) | | | 962,984 | |
| | 1,400 | | | Axsys Technologies, Inc.(a)(L) | | | 72,856 | |
| | 8,000 | | | Benchmark Electronics, Inc.(a) | | | 130,720 | |
| | 18,200 | | | China Digital TV Holdings Co., Ltd. - ADR(a)(L) | | | 253,162 | |
| | 1,630 | | | Cubic Corp.(L) | | | 36,317 | |
| | 7,900 | | | DSP Group, Inc.(a)(L) | | | 55,300 | |
| | 278,800 | | | Duke Energy Corp. | | | 4,845,544 | |
| | 37,000 | | | Edison International | | | 1,901,060 | |
| | 7,600 | | | Elpida Memory, Inc.(a) | | | 243,349 | |
| | 42,900 | | | Emerson Electric Co. | | | 2,121,405 | |
| | 11,800 | | | Emulex Corp.(a)(L) | | | 137,470 | |
| | 11,300 | | | Fanuc Ltd. | | | 1,103,555 | |
| | 408,400 | | | Flextronics International Ltd.(a) | | | 3,838,960 | |
| | 6,700 | | | Fuji Photo Film Co., Ltd. | | | 230,306 | |
| | 6,100 | | | Gentex Corp. | | | 88,084 | |
| | 5,500 | | | Hirose Electric Co., Ltd. | | | 552,149 | |
| | 8,780 | | | Hynix Semiconductor, Inc.(a) | | | 209,837 | |
| | 7,500 | | | Intersil Corp., Class A(L) | | | 182,400 | |
| | 900 | | | Itron, Inc.(a)(L) | | | 88,515 | |
| | 1,000 | | | Keyence Corp. | | | 238,169 | |
| | 65,200 | | | Lam Research Corp.(a) | | | 2,356,980 | |
| | 1,210 | | | LG Electronics, Inc. | | | 137,073 | |
| | 233,000 | | | LSI Corp.(a)(L) | | | 1,430,620 | |
| | 26,000 | | | Matsushita Electric Industrial Co., Ltd. | | | 560,719 | |
| | 23,300 | | | MEMC Electronic Materials, Inc.(a) | | | 1,433,882 | |
| | 4,950 | | | Methode Electronics, Inc.(L) | | | 51,727 | |
| | 3,920 | | | MKS Instruments, Inc.(a)(L) | | | 85,848 | |
| | 3,100 | | | Multi-Fineline Electronix, Inc.(a)(L) | | | 85,777 | |
| | 11,100 | | | Murata Manufacturing Co., Ltd. | | | 522,673 | |
| | 2,800 | | | Novellus Systems, Inc.(a)(L) | | | 59,332 | |
| | 6,580 | | | OmniVision Technologies, Inc.(a)(L) | | | 79,552 | |
| | 2,080 | | | Plexus Corp.(a)(L) | | | 57,574 | |
| | 193,500 | | | RF Micro Devices, Inc.(a)(L) | | | 561,150 | |
| | 1,138 | | | Samsung Electronics Co., Ltd. | | | 679,939 | |
| | 2,634 | | | Samsung Electronics Co., Ltd. - GDR | | | 776,371 | |
| | 86,100 | | | Seagate Technology | | | 1,647,093 | |
| | 10,800 | | | Silicon Image, Inc.(a)(L) | | | 78,300 | |
| | 1,500 | | | Synopsis, Inc.(a) | | | 35,865 | |
| | 146,720 | | | Taiwan Semiconductor - ADR(a) | | | 1,600,715 | |
| | 14,300 | | | Teradyne, Inc.(a) | | | 158,301 | |
| | 105,800 | | | Texas Instruments, Inc. | | | 2,979,328 | |
| | 11,800 | | | Tokyo Electron Ltd. | | | 680,096 | |
The accompanying notes are an integral part of these financial statements.
9
portfolio of investments (continued)
NEW COVENANT GROWTH FUND
June 30, 2008
| | | | | | | | | |
|
| Shares | | Value |
|
| |
COMMON STOCKS (cont.) |
| | | | | Electronics (cont.) |
| | 92,000 | | | Toshiba Corp. | | | $678,401 | |
| | 12,100 | | | Trident Microsystems, Inc.(a) | | | 44,165 | |
| | 56,100 | | | Triquint Semiconductor, Inc.(a)(L) | | | 339,966 | |
| | 11,660 | | | TTM Technologies, Inc.(a)(L) | | | 154,029 | |
| | 3,100 | | | Ultralife Batteries, Inc.(a)(L) | | | 33,139 | |
| | 7,390 | | | Varian Semiconductor Equipment Associates, Inc.(a)(L) | | | 257,320 | |
| | 3,390 | | | Yamada Denki Co., Ltd. | | | 241,356 | |
| | | | | | | | | |
| | | | | | | | 36,782,531 | |
| | | | | | | | | |
| | | | | Energy (4.0%) |
| | 172,000 | | | AES Corp.(a) | | | 3,304,120 | |
| | 1,800 | | | Alpha Natural Resources, Inc.(a)(L) | | | 187,722 | |
| | 2,300 | | | Avista Corp. | | | 49,358 | |
| | 69,100 | | | Banpu Public Co., Inc. | | | 1,101,158 | |
| | 121,500 | | | China Shenhua Energy Co., Ltd. | | | 476,822 | |
| | 2,000 | | | Cleco Corp.(L) | | | 46,660 | |
| | 15,872 | | | Companhia Energetica De Minas(a) | | | 384,942 | |
| | 135,200 | | | El Paso Corp. | | | 2,939,248 | |
| | 1,900 | | | Electricite De France | | | 180,505 | |
| | 22,300 | | | Enersis SA - ADR | | | 347,434 | |
| | 34,900 | | | Entergy Corp. | | | 4,204,752 | |
| | 53,500 | | | Evergreen Solar, Inc.(a)(L) | | | 518,415 | |
| | 61,774 | | | Exelon Corp. | | | 5,557,189 | |
| | 27,300 | | | FirstEnergy Corp. | | | 2,247,609 | |
| | 5,400 | | | Headwaters, Inc.(a)(L) | | | 63,558 | |
| | 51,600 | | | McDermott International, Inc.(a) | | | 3,193,524 | |
| | 18,900 | | | National Grid PLC | | | 248,650 | |
| | 1,800 | | | Ormat Technologies, Inc.(L) | | | 88,524 | |
| | 35,200 | | | Public Service Enterprise Group, Inc. | | | 1,616,736 | |
| | 14,200 | | | Scottish & Southern Energy PLC | | | 396,825 | |
| | 123,300 | | | Spectra Energy Corp. | | | 3,543,642 | |
| | 9,100 | | | Suncor Energy, Inc.(a) | | | 528,312 | |
| | 7,300 | | | SunPower Corp., Class A(a)(L) | | | 525,454 | |
| | 4,400 | | | Suntech Power Holdings Co., Ltd - ADR(a)(L) | | | 164,824 | |
| | 7,700 | | | Superior Energy Services, Inc.(a) | | | 424,578 | |
| | 74,400 | | | Xcel Energy, Inc. | | | 1,493,208 | |
| | | | | | | | | |
| | | | | | | | 33,833,769 | |
| | | | | | | | | |
| | | | | Entertainment (1.0%) |
| | 4,410 | | | NetFlix, Inc.(a)(L) | | | 114,969 | |
| | 17,500 | | | Royal Caribbean Cruises Ltd.(L) | | | 393,225 | |
| | 256,500 | | | The Walt Disney Co. | | | 8,002,800 | |
| | | | | | | | | |
| | | | | | | | 8,510,994 | |
| | | | | | | | | |
| | | | | Financial Services (4.9%) |
| | 4,100 | | | Affiliated Managers Group, Inc.(a) | | | 369,246 | |
| | 22,400 | | | Alliance & Leicester | | | 131,620 | |
| | 12,400 | | | Anworth Mortgage Asset Corp. | | | 80,724 | |
| | 44,200 | | | Blackstone Group LP | | | 804,882 | |
| | 20,300 | | | BNP Paribas SA | | | 1,839,062 | |
| | 22,000 | | | Bovespa Holding Sa | | | 273,096 | |
| | 81,100 | | | Capital One Financial Corp.(L) | | | 3,082,611 | |
| | 3,000 | | | CapitalSource, Inc.(L) | | | 33,240 | |
| | 7,200 | | | Capstead Mortgage Corp.(L) | | | 78,120 | |
| | 104,476 | | | Citigroup, Inc. | | | 1,751,018 | |
| | 3,300 | | | CME Group, Inc. | | | 1,264,527 | |
| | 13,800 | | | Comerica, Inc.(L) | | | 353,694 | |
| | 73,000 | | | Credit Suisse Group - ADR(L) | | | 3,307,630 | |
| | 2,880 | | | Deluxe Corp.(L) | | | 51,321 | |
| | 2,672 | | | Douglas Emmett, Inc.(L) | | | 58,704 | |
| | 3,000 | | | FCStone Group, Inc.(a) | | | 83,790 | |
| | 4,400 | | | Fortis(a) | | | 69 | |
| | 8,500 | | | Fortis - Strip | | | 136,104 | |
| | 6,100 | | | GLG Partners, Inc. | | | 47,580 | |
| | 5,600 | | | Greenhill & Co., Inc.(L) | | | 301,616 | |
| | 3,600 | | | Groupe Danone | | | 252,795 | |
| | 13,900 | | | Hercules Technology Growth Capital, Inc.(L) | | | 124,127 | |
| | 26,979 | | | ING Groep NV(L) | | | 860,377 | |
| | 5,500 | | | IntercontinentalExchange, Inc.(a) | | | 627,000 | |
| | 112,700 | | | Invesco Ltd. | | | 2,702,546 | |
| | 16,000 | | | Irish Life & Permanent PLC | | | 166,514 | |
| | 90,600 | | | Lehman Brothers Holdings, Inc.(L) | | | 1,794,786 | |
| | 3,432 | | | Macquarie Group Ltd.(L) | | | 160,030 | |
| | 71,100 | | | MF Global Ltd(a)(L) | | | 448,641 | |
| | 17,500 | | | MFA Mortgage Investments, Inc.(L) | | | 114,100 | |
| | 400 | | | Morningstar, Inc.(a)(L) | | | 28,812 | |
| | 468,500 | | | National City Corp.(L) | | | 2,234,745 | |
| | 1,800 | | | Net 1 UEPS Technologies, Inc.(a)(L) | | | 43,740 | |
| | 100,500 | | | Nomura Holdings, Inc. | | | 1,488,784 | |
| | 20,900 | | | Och-Ziff Capital Management Group LLC | | | 397,309 | |
| | 5,700 | | | Onex Corp. | | | 167,864 | |
| | 13,120 | | | ORIX Corp. | | | 1,876,845 | |
| | 52,700 | | | Paychex, Inc. | | | 1,648,456 | |
| | 3,300 | | | Pennantpark Invt Corp.(L) | | | 23,793 | |
| | 4,600 | | | SVB Financial Group(a)(L) | | | 221,306 | |
| | 34,860 | | | Goldman Sachs Group, Inc. | | | 6,097,014 | |
| | 3,361 | | | Thinkorswim Group, Inc.(a)(L) | | | 23,695 | |
| | 25,357 | | | UBS AG(a) | | | 532,186 | |
| | 151,400 | | | US Bancorp | | | 4,222,546 | |
| | 7,600 | | | Waddell & Reed Financial, Inc., Class A(L) | | | 266,076 | |
| | 9,100 | | | Zions Bancorporation(L) | | | 286,559 | |
| | | | | | | | | |
| | | | | | | | 40,859,300 | |
| | | | | | | | | |
| | | | | Food & Beverages (3.3%) |
| | 31,700 | | | Bunge Ltd.(L) | | | 3,413,773 | |
| | 900 | | | Central European Distribution Corp.(a)(L) | | | 66,735 | |
| | 2,000 | | | Chiquita Brands International, Inc.(a)(L) | | | 30,340 | |
| | 27,600 | | | Coca-Cola Co. | | | 1,434,648 | |
| | 5,900 | | | Diamond Foods, Inc.(L) | | | 135,936 | |
| | 121,100 | | | Host Marriott Corp. | | | 1,653,015 | |
| | 71,900 | | | Kroger Co. | | | 2,075,753 | |
| | 230 | | | Lindt & Spruengli AG | | | 635,143 | |
| | 27,000 | | | Nestle SA | | | 1,220,028 | |
| | 80,200 | | | Pepsi Bottling Group, Inc. | | | 2,239,184 | |
| | 124,800 | | | PepsiCo, Inc. | | | 7,936,032 | |
| | 129,000 | | | Premier Foods PLC(a) | | | 244,742 | |
| | 70,900 | | | Supervalu, Inc. | | | 2,190,101 | |
| | 96,600 | | | Unilever NV - ADR | | | 2,743,440 | |
| | 24,200 | | | Unilever NV | | | 686,976 | |
| | 7,950 | | | Unilever PLC | | | 226,283 | |
| | 62,000 | | | Wilmar Int’l Ltd | | | 230,583 | |
| | 17,579 | | | Woolworths Ltd. | | | 412,036 | |
| | | | | | | | | |
| | | | | | | | 27,574,748 | |
| | | | | | | | | |
| | | | | Forest Products & Paper (0.0%) |
| | 16,600 | | | Domtar Corp.(a)(L) | | | 90,470 | |
| | 319,000 | | | Nine Dragons Paper Holdings Ltd. | | | 248,744 | |
| | | | | | | | | |
| | | | | | | | 339,214 | |
| | | | | | | | | |
| | | | | Health Care Services (3.0%) |
| | 24,100 | | | Aetna, Inc. | | | 976,773 | |
| | 4,630 | | | Amerigroup Corp.(a)(L) | | | 96,304 | |
| | 166,200 | | | Bristol-Myers Squibb Co. | | | 3,412,086 | |
| | 3,140 | | | Corvel Corp.(a)(L) | | | 106,352 | |
| | 50,450 | | | Coventry Health Care, Inc.(a) | | | 1,534,689 | |
| | 5,600 | | | Emergency Medical Services Corp.(a) | | | 126,728 | |
| | 26,400 | | | Express Scripts, Inc., Class A(a) | | | 1,655,808 | |
| | 3,500 | | | HealthSpring, Inc.(a)(L) | | | 59,080 | |
| | 3,200 | | | Henry Schein, Inc.(a) | | | 165,024 | |
| | 7,960 | | | LifePoint Hospitals, Inc.(a)(L) | | | 225,268 | |
| | 75,500 | | | McKesson Corp. | | | 4,221,205 | |
| | 2,000 | | | Millipore Corp.(a) | | | 135,720 | |
| | 3,600 | | | Owens & Minor, Inc.(L) | | | 164,484 | |
| | 5,500 | | | Psychiatric Solutions, Inc.(a)(L) | | | 208,120 | |
| | 48,700 | | | Quest Diagnostics, Inc. | | | 2,360,489 | |
| | 3,230 | | | RehabCare Group, Inc.(a)(L) | | | 51,777 | |
| | 31,400 | | | Stryker Corp. | | | 1,974,432 | |
| | 2,700 | | | Synthes, Inc. | | | 372,140 | |
The accompanying notes are an integral part of these financial statements.
10
portfolio of investments (continued)
NEW COVENANT GROWTH FUND
June 30, 2008
| | | | | | | | | |
|
| Shares | | Value |
|
| |
COMMON STOCKS (cont.) |
| | | | | Health Care Services (cont.) |
| | 6,400 | | | TranS1, Inc.(a) | | | $96,448 | |
| | 132,720 | | | UnitedHealth Group, Inc. | | | 3,483,900 | |
| | 17,100 | | | Universal Health Services, Inc.(L) | | | 1,081,062 | |
| | 46,000 | | | Varian Medical Systems, Inc.(a) | | | 2,385,100 | |
| | | | | | | | | |
| | | | | | | | 24,892,989 | |
| | | | | | | | | |
| | | | | Insurance (5.5%) |
| | 72,600 | | | Ace Ltd. | | | 3,999,534 | |
| | 8,074 | | | Aegon NV | | | 106,948 | |
| | 86,600 | | | AFLAC, Inc. | | | 5,438,480 | |
| | 4,500 | | | Allianz AG | | | 792,817 | |
| | 2,110 | | | Allied World Assurance Co. Holdings Ltd. | | | 83,598 | |
| | 83,379 | | | American International Group, Inc. | | | 2,206,208 | |
| | 16,970 | | | Amerisafe, Inc.(a)(L) | | | 270,502 | |
| | 57,000 | | | Aon Corp. | | | 2,618,580 | |
| | 23,120 | | | Arch Capital Group Ltd.(a) | | | 1,533,318 | |
| | 1,401 | | | Argo Group International Holdings Ltd.(a)(L) | | | 47,018 | |
| | 54,100 | | | Assurant, Inc. | | | 3,568,436 | |
| | 13,684 | | | AXA | | | 406,336 | |
| | 78,500 | | | Axis Capital Holdings Ltd.(L) | | | 2,340,085 | |
| | 94,600 | | | CIGNA Corp. | | | 3,347,894 | |
| | 24,000 | | | Hartford Financial Services Group, Inc. | | | 1,549,680 | |
| | 6,200 | | | Manulife Financial Corp.(a) | | | 216,821 | |
| | 93,300 | | | Marsh & McLennan Cos., Inc. | | | 2,477,115 | |
| | 8,480 | | | Max Re Capital Ltd.(L) | | | 180,878 | |
| | 43,300 | | | Metlife, Inc. | | | 2,284,941 | |
| | 19,600 | | | Millea Holdings, Inc. | | | 764,176 | |
| | 4,240 | | | ProAssurance Corp.(a)(L) | | | 203,986 | |
| | 51,600 | | | Reinsurance Group of America, Inc.(L) | | | 2,245,632 | |
| | 5,800 | | | Sun Life Financial Services, Inc.(a) | | | 238,609 | |
| | 10,635 | | | Swiss Re | | | 708,445 | |
| | 69,739 | | | The Travelers Cos., Inc. | | | 3,026,673 | |
| | 255,300 | | | UnumProvident Corp. | | | 5,220,885 | |
| | | | | | | | | |
| | | | | | | | 45,877,595 | |
| | | | | | | | | |
| | | | | Internet (1.1%) |
| | 5,000 | | | Alibaba.com Ltd.(a)(b)(L) | | | 7,054 | |
| | 4,400 | | | Blue Nile, Inc.(a)(L) | | | 187,088 | |
| | 45,000 | | | Expedia, Inc.(a) | | | 827,100 | |
| | 13,000 | | | Giant Interactive Group, Inc. - ADR(a)(L) | | | 157,560 | |
| | 2,600 | | | Google, Inc., Class A(a) | | | 1,368,692 | |
| | 12,100 | | | GSI Commerce, Inc.(a) | | | 164,923 | |
| | 3,850 | | | J2 Global Communications, Inc.(a)(L) | | | 88,550 | |
| | 700 | | | NHN Corp.(a) | | | 122,126 | |
| | 91,900 | | | Softbank Corp. | | | 1,549,192 | |
| | 158,600 | | | Symantec Corp.(a) | | | 3,068,910 | |
| | 47,600 | | | VeriSign, Inc.(a) | | | 1,799,280 | |
| | 3,000 | | | Website Pros, Inc.(a) | | | 24,990 | |
| | | | | | | | | |
| | | | | | | | 9,365,465 | |
| | | | | | | | | |
| | | | | Lodging (0.2%) |
| | 2,400 | | | Lasalle Hotel Properties(L) | | | 60,312 | |
| | 108,000 | | | Shangri-La Asia Ltd. | | | 252,089 | |
| | 92,660 | | | Sunstone Hotel Investors Inc.(L) | | | 1,538,156 | |
| | | | | | | | | |
| | | | | | | | 1,850,557 | |
| | | | | | | | | |
| | | | | Machinery & Equipment (0.8%) |
| | 1,200 | | | Colfax Corp.(a) | | | 30,108 | |
| | 57,700 | | | Deere & Co. | | | 4,161,901 | |
| | 1,300 | | | Gardner Denver, Inc.(a) | | | 73,840 | |
| | 2,580 | | | Graco, Inc.(L) | | | 98,221 | |
| | 50,220 | | | Manitowoc Co., Inc.(L) | | | 1,633,657 | |
| | 3,354 | | | Schneider SA | | | 362,310 | |
| | 4,900 | | | SMC Corp. | | | 536,676 | |
| | 2,400 | | | Tecumseh Products Co., Class A(a)(L) | | | 78,672 | |
| | | | | | | | | |
| | | | | | | | 6,975,385 | |
| | | | | | | | | |
| | | | | Manufacturing (4.8%) |
| | 1,820 | | | A.O. Smith Corp.(L) | | | 59,751 | |
| | 5,850 | | | Applied Industrial Tech, Inc.(L) | | | 141,395 | |
| | 13,100 | | | Assa Abloy AB, Class B | | | 189,785 | |
| | 20,900 | | | Church & Dwight Co., Inc.(L) | | | 1,177,715 | |
| | 30,000 | | | Cummins, Inc. | | | 1,965,600 | |
| | 58,200 | | | Danaher Corp. | | | 4,498,860 | |
| | 30,300 | | | Dover Corp. | | | 1,465,611 | |
| | 4,830 | | | Enpro Industries, Inc.(a)(L) | | | 180,352 | |
| | 13,750 | | | Graftech International Ltd.(a) | | | 368,912 | |
| | 3,210 | | | Greif, Inc., Class A(L) | | | 205,536 | |
| | 12,130 | | | Hankook Tire Co., Ltd. | | | 168,722 | |
| | 107,700 | | | Honeywell International, Inc. | | | 5,415,156 | |
| | 24,700 | | | Illinois Tool Works, Inc. | | | 1,173,497 | |
| | 29,200 | | | ITT Industries, Inc. | | | 1,849,236 | |
| | 4,400 | | | Kaydon Corp.(L) | | | 226,204 | |
| | 400 | | | Lindsay Manufacturing Co.(L) | | | 33,988 | |
| | 940 | | | NACCO Industries, Inc.(L) | | | 69,889 | |
| | 29,900 | | | Owens-Illinois, Inc.(a) | | | 1,246,531 | |
| | 92,550 | | | Parker Hannifin Corp. | | | 6,600,666 | |
| | 41,000 | | | Precision Castparts Corp. | | | 3,951,170 | |
| | 2,180 | | | Robbins & Myers, Inc.(L) | | | 108,717 | |
| | 56,070 | | | Skyworks Solutions, Inc.(a)(L) | | | 553,411 | |
| | 29,000 | | | Sumitomo Metal Industries, Ltd. | | | 127,542 | |
| | 3,070 | | | Sun Hydraulics Corp.(L) | | | 99,069 | |
| | 7,396 | | | Tmk-GDR Reg S(a)(L) | | | 291,254 | |
| | 11,230 | | | Trimas Corp.(a)(L) | | | 67,268 | |
| | 40,300 | | | United States Steel Corp. | | | 7,446,634 | |
| | | | | | | | | |
| | | | | | | | 39,682,471 | |
| | | | | | | | | |
| | | | | Media (2.3%) |
| | 170,500 | | | Comcast Corp., Class A | | | 3,234,385 | |
| | 125,900 | | | DIRECTV Group, Inc.(a) | | | 3,262,069 | |
| | 55,700 | | | Dish Network Corp.(a) | | | 1,630,896 | |
| | 4,300 | | | Focus Media Hldg Ltd - ADR(a) | | | 119,196 | |
| | 24,700 | | | Rhi Entmt Inc(a) | | | 320,853 | |
| | 3,500 | | | Scholastic Corp.(a)(L) | | | 100,310 | |
| | 9,900 | | | Shaw Communications(a) | | | 202,136 | |
| | 30,000 | | | McGraw-Hill Cos., Inc. | | | 1,203,600 | |
| | 5,473 | | | Washington Post Co., Class B | | | 3,212,104 | |
| | 232,600 | | | Time Warner, Inc. | | | 3,442,480 | |
| | 6,300 | | | Valassis Communications, Inc.(a)(L) | | | 78,876 | |
| | 63,900 | | | Viacom, Inc., Class B(a) | | | 1,951,506 | |
| | 11,500 | | | Vivendi SA | | | 436,360 | |
| | 38,800 | | | Yell Group PLC | | | 54,485 | |
| | | | | | | | | |
| | | | | | | | 19,249,256 | |
| | | | | | | | | |
| | | | | Medical (4.8%) |
| | 45,200 | | | Affymetrix, Inc.(a) | | | 465,108 | |
| | 15,000 | | | Alcon, Inc. | | | 2,441,850 | |
| | 174,700 | | | Alkermes, Inc.(a)(L) | | | 2,159,292 | |
| | 33,600 | | | Allergan, Inc. | | | 1,748,880 | |
| | 21,800 | | | American Oriental Bioengineering, Inc.(a)(L) | | | 215,166 | |
| | 61,600 | | | Amgen, Inc.(a) | | | 2,905,056 | |
| | 2,800 | | | AmSurg Corp.(a)(L) | | | 68,180 | |
| | 9,030 | | | Applera Corp - Celera Genomics Group(a)(L) | | | 102,581 | |
| | 16,500 | | | Arthrocare Corp.(a)(L) | | | 673,365 | |
| | 28,700 | | | Baxter International, Inc. | | | 1,835,078 | |
| | 267,000 | | | Boston Scientific Corp.(a) | | | 3,281,430 | |
| | 69,700 | | | Bruker Corp.(a)(L) | | | 895,645 | |
| | 25,700 | | | C.R. Bard, Inc. | | | 2,260,315 | |
| | 83,100 | | | Cell Genesys, Inc.(a)(L) | | | 216,060 | |
| | 2,080 | | | Conmed Corp.(a)(L) | | | 55,224 | |
| | 1,800 | | | Cooper Cos., Inc. | | | 66,870 | |
| | 18,000 | | | Hologic, Inc.(a)(L) | | | 392,400 | |
| | 30,000 | | | Hoya Corp. | | | 693,601 | |
| | 3,400 | | | InterMune, Inc.(a)(L) | | | 44,608 | |
| | 9,690 | | | Invacare Corp.(L) | | | 198,064 | |
| | 46,200 | | | Johnson & Johnson, Inc. | | | 2,972,508 | |
| | 800 | | | Kendle International, Inc.(a)(L) | | | 29,064 | |
| | 34,600 | | | Kinetic Concepts, Inc.(a)(L) | | | 1,380,886 | |
| | 98,000 | | | Medtronic, Inc. | | | 5,071,500 | |
The accompanying notes are an integral part of these financial statements.
11
portfolio of investments (continued)
NEW COVENANT GROWTH FUND
June 30, 2008
| | | | | | | | | |
|
| Shares | | Value |
|
| |
COMMON STOCKS (cont.) |
| | | | | Medical (cont.) |
| | 54,000 | | | Patterson Co., Inc.(a)(L) | | | $1,587,060 | |
| | 2,600 | | | PerkinElmer, Inc. | | | 72,410 | |
| | 14,400 | | | Sanofi-Synthelabo SA | | | 961,980 | |
| | 217,700 | | | Schering-Plough Corporation | | | 4,286,513 | |
| | 6,500 | | | Symmetry Medical, Inc.(a)(L) | | | 105,430 | |
| | 7,400 | | | Triple-S Management Corp., Class B(a) | | | 120,990 | |
| | 73,000 | | | Vertex Pharmaceuticals, Inc.(a)(L) | | | 2,443,310 | |
| | | | | | | | | |
| | | | | | | | 39,750,424 | |
| | | | | | | | | |
| | | | | Metals & Mining (3.1%) |
| | 2,700 | | | AngloGold Ashanti | | | 92,707 | |
| | 3,900 | | | AngloGold Ashanti Ltd. - ADR | | | 132,366 | |
| | 79,300 | | | Barrick Gold Corp. | | | 3,608,150 | |
| | 16,300 | | | BHP Billiton PLC | | | 623,364 | |
| | 700 | | | Bucyrus International, Inc. - Class A(L) | | | 51,114 | |
| | 11,400 | | | Cameco Corp.(a) | | | 489,673 | |
| | 910 | | | Century Aluminum Co.(a)(L) | | | 60,506 | |
| | 29,300 | | | Cleveland-Cliffs, Inc. | | | 3,492,267 | |
| | 5,850 | | | Commercial Metals Co. | | | 220,545 | |
| | 6,700 | | | Dynamic Materials Corp.(L) | | | 220,765 | |
| | 900 | | | Evraz Group SA — GDR | | | 104,850 | |
| | 42,400 | | | Freeport-McMoRan Copper & Gold, Inc. Class B(L) | | | 4,968,856 | |
| | 39,303 | | | Harmony Gold Mining Co.(a)(L) | | | 476,856 | |
| | 17,000 | | | Harmony Gold Mining Co., Ltd. - ADR(a)(L) | | | 208,250 | |
| | 31,500 | | | Indo Tambangraya Mega PT(a) | | | 114,965 | |
| | 2,660 | | | Ini Steel Co. | | | 200,380 | |
| | 8,000 | | | MMC Norilsk Nickel - ADR | | | 201,600 | |
| | 1,980 | | | Mueller Industries, Inc.(L) | | | 63,756 | |
| | 1,043 | | | New World Resources Bv-w/i(a) | | | 36,979 | |
| | 14,373 | | | Newcrest Mining Ltd. | | | 403,717 | |
| | 55,300 | | | Newmont Mining Corp. | | | 2,884,448 | |
| | 28,900 | | | Nucor Corp. | | | 2,157,963 | |
| | 5,500 | | | Rautaruukki Oyj | | | 251,645 | |
| | 10,200 | | | Repsol YPF SA | | | 401,968 | |
| | 7,500 | | | Rio Tinto PLC | | | 897,670 | |
| | 13,500 | | | Southern Copper Corp. | | | 1,439,505 | |
| | 3,200 | | | Tenaris SA - ADR | | | 238,400 | |
| | 15,100 | | | Titanium Metals Corp.(L) | | | 211,249 | |
| | 3,000 | | | Usinas Siderurgics de Minas Gerais SA | | | 147,838 | |
| | 1,754 | | | Vallourec SA | | | 615,587 | |
| | 1,100 | | | Walter Industries, Inc. | | | 119,647 | |
| | 5,600 | | | Xstrata PLC | | | 448,848 | |
| | | | | | | | | |
| | | | | | | | 25,586,434 | |
| | | | | | | | | |
| | | | | Oil & Gas (11.9%) |
| | 2,796 | | | Air Liquide SA | | | 369,237 | |
| | 1,300 | | | Arena Resources, Inc.(a) | | | 68,666 | |
| | 5,300 | | | Atwood Oceanics, Inc.(a) | | | 659,002 | |
| | 88,657 | | | BP PLC | | | 1,029,961 | |
| | 6,300 | | | Cairn Energy PLC(a) | | | 405,946 | |
| | 21,800 | | | Canadian Natural Resources Ltd.(a) | | | 2,155,842 | |
| | 81,692 | | | ChevronTexaco Corp. | | | 8,098,128 | |
| | 1,800 | | | Complete Production Services(a)(L) | | | 65,556 | |
| | 900 | | | Comstock Resources, Inc.(a) | | | 75,987 | |
| | 94,538 | | | ConocoPhillips | | | 8,923,442 | |
| | 2,900 | | | Continental Resources, Inc.(a)(L) | | | 201,028 | |
| | 4,410 | | | Delek US Holdings, Inc.(L) | | | 40,616 | |
| | 18,500 | | | EnCana Corp.(a) | | | 1,693,792 | |
| | 17,000 | | | EOG Resources, Inc. | | | 2,230,400 | |
| | 3,900 | | | Exco Resources, Inc.(a)(L) | | | 143,949 | |
| | 190,400 | | | Exxon Mobil Corp. | | | 16,779,952 | |
| | 2,300 | | | FMC Technologies, Inc.(a) | | | 176,939 | |
| | 2,300 | | | Frontier Oil Corp.(L) | | | 54,993 | |
| | 20,100 | | | Gazprom - ADR(a) | | | 1,163,790 | |
| | 131,200 | | | Halliburton Co.(L) | | | 6,962,784 | |
| | 10,300 | | | Helix Energy Solutions Group, Inc.(a) | | | 428,892 | |
| | 12,900 | | | Hercules Offshore, Inc.(a) | | | 490,458 | |
| | 49,100 | | | Hess Corp. | | | 6,195,929 | |
| | 4,900 | | | Inmet Mining Corp. | | | 325,225 | |
| | 29 | | | Inpex Holdings, Inc. | | | 365,965 | |
| | 199,375 | | | IOI Corp. Berhad(a) | | | 454,581 | |
| | 7,000 | | | JGC Corp. | | | 137,778 | |
| | 110,600 | | | Marathon Oil Corp. | | | 5,736,822 | |
| | 8,800 | | | Mariner Energy, Inc.(a)(L) | | | 325,336 | |
| | 27,500 | | | Meridian Resource Corp.(a)(L) | | | 81,125 | |
| | 28,400 | | | Noble Corp. | | | 1,844,864 | |
| | 21,700 | | | Noble Energy, Inc. | | | 2,182,152 | |
| | 22,800 | | | OAO Gazprom - ADR(a) | | | 1,322,400 | |
| | 43,733 | | | OAO Rosneft Oil Co. - ADR(a) | | | 507,303 | |
| | 80,800 | | | Occidental Petroleum Corp. | | | 7,260,688 | |
| | 2,760 | | | Oil States International, Inc.(a)(L) | | | 175,094 | |
| | 9,600 | | | Petroleo Brasileiro SA - ADR | | | 679,968 | |
| | 6,763 | | | Petroplus Holdings(a) | | | 363,456 | |
| | 11,570 | | | Petroquest Energy, Inc.(a)(L) | | | 311,233 | |
| | 8,570 | | | Pioneer Drilling Co.(a)(L) | | | 161,202 | |
| | 36,400 | | | Pioneer Natural Resources Co. | | | 2,849,392 | |
| | 4,800 | | | Polski Koncern Naftowy Orlen SA - ADR(a) | | | 154,095 | |
| | 35,751 | | | Royal Dutch Shell, Class A | | | 1,471,097 | |
| | 39,700 | | | Royal Dutch Shell - ADR | | | 3,243,887 | |
| | 5,800 | | | Sasol Ltd. | | | 341,481 | |
| | 29,800 | | | Schlumberger Ltd. | | | 3,201,414 | |
| | 12,800 | | | SeaDrill Ltd.(a) | | | 391,424 | |
| | 5,000 | | | St. Mary Land & Exploration Co.(L) | | | 323,200 | |
| | 3,330 | | | Stone Energy Corp.(a) | | | 219,480 | |
| | 4,930 | | | Swift Energy Co.(a)(L) | | | 325,676 | |
| | 14,700 | | | Tesoro Petroleum Corp.(L) | | | 290,619 | |
| | 3,900 | | | Total SA | | | 332,809 | |
| | 3,729 | | | Trico Marine Services, Inc.(a)(L) | | | 135,810 | |
| | 69,030 | | | UGI Corp. | | | 1,981,851 | |
| | 3,420 | | | Union Drilling, Inc.(a)(L) | | | 74,146 | |
| | 18,500 | | | Vaalco Energy, Inc.(a)(L) | | | 156,695 | |
| | 1,400 | | | Whiting Petroleum Corp.(a) | | | 148,512 | |
| | 3,869 | | | Woodside Petroleum Ltd. | | | 250,360 | |
| | 45,500 | | | XTO Energy, Inc. | | | 3,117,205 | |
| | | | | | | | | |
| | | | | | | | 99,659,634 | |
| | | | | | | | | |
| | | | | Pharmaceuticals (5.3%) |
| | 26,500 | | | Abbott Laboratories | | | 1,403,705 | |
| | 44,400 | | | Amylin Pharmaceuticals, Inc.(a)(L) | | | 1,127,316 | |
| | 12,740 | | | Arena Pharmaceuticals, Inc.(a)(L) | | | 66,121 | |
| | 13,350 | | | Astrazeneca PLC | | | 568,450 | |
| | 14,800 | | | Bare Escentuals, Inc.(a)(L) | | | 277,204 | |
| | 91,200 | | | Barr Pharmaceuticals, Inc.(a)(L) | | | 4,111,296 | |
| | 6,800 | | | Bayer AG | | | 572,359 | |
| | 49,700 | | | Cardinal Health, Inc. | | | 2,563,526 | |
| | 34,440 | | | Cephalon, Inc.(a)(L) | | | 2,296,804 | |
| | 49,800 | | | Cubist Pharmaceuticals, Inc.(a) | | | 889,428 | |
| | 49,880 | | | CV Therapeutics, Inc.(a)(L) | | | 410,512 | |
| | 32,400 | | | Cytokinetics, Inc.(a)(L) | | | 120,204 | |
| | 106,700 | | | Eli Lilly & Co. | | | 4,925,272 | |
| | 8,400 | | | Exelixis, Inc.(a)(L) | | | 42,000 | |
| | 68,200 | | | Forest Laboratories, Inc.(a) | | | 2,369,268 | |
| | 71,500 | | | Gilead Sciences, Inc.(a) | | | 3,785,925 | |
| | 9,180 | | | Human Genome Sciences, Inc.(a)(L) | | | 47,828 | |
| | 22,490 | | | Incyte Pharmaceuticals, Inc.(a)(L) | | | 171,149 | |
| | 114,400 | | | Medarex, Inc.(a)(L) | | | 756,184 | |
| | 4,900 | | | Medicines Co.(a)(L) | | | 97,118 | |
| | 8,400 | | | Medicis Pharmaceutical Corp., Class A(L) | | | 174,552 | |
| | 79,600 | | | Merck & Co., Inc. | | | 3,000,124 | |
| | 6,200 | | | Mylan(L) | | | 74,834 | |
| | 5,698 | | | Novartis AG | | | 313,751 | |
| | 6,200 | | | Novo Nordisk A/S, Class B(L) | | | 405,776 | |
| | 10,930 | | | NPS Pharmaceuticals, Inc.(a)(L) | | | 48,638 | |
| | 2,500 | | | Par Pharmaceutical Cos., Inc.(a)(L) | | | 40,575 | |
| | 3,290 | | | Perrigo Co.(L) | | | 104,524 | |
| | 310,915 | | | Pfizer, Inc. | | | 5,431,685 | |
The accompanying notes are an integral part of these financial statements.
12
portfolio of investments (continued)
NEW COVENANT GROWTH FUND
June 30, 2008
| | | | | | | | | |
|
| Shares | | Value |
|
| |
COMMON STOCKS (cont.) |
| | | | | Pharmaceuticals (cont.) |
| | 4,200 | | | Progenics Pharmaceuticals, Inc.(a)(L) | | | $66,654 | |
| | 18,052 | | | Ranbaxy Laboratories Ltd.(a) | | | 221,137 | |
| | 11,100 | | | Regeneron Pharmaceuticals, Inc.(a)(L) | | | 160,284 | |
| | 8,790 | | | Rigel Pharmaceuticals, Inc.(a)(L) | | | 199,181 | |
| | 6,545 | | | Roche Holding AG | | | 1,178,875 | |
| | 4,300 | | | Salix Pharmaceuticals Ltd.(a)(L) | | | 30,229 | |
| | 4,900 | | | Teva Pharmaceutical Industries Ltd. | | | 224,420 | |
| | 52,100 | | | Watson Pharmaceuticals, Inc.(a) | | | 1,415,557 | |
| | 85,300 | | | Wyeth | | | 4,090,988 | |
| | 17,560 | | | Zymogenetics, Inc.(a)(L) | | | 147,855 | |
| | | | | | | | | |
| | | | | | | | 43,931,308 | |
| | | | | | | | | |
| | | | | Real Estate (0.2%) |
| | 2,980 | | | American Campus Communities, Inc.(L) | | | 82,963 | |
| | 404,000 | | | China Overseas Land & Investment Ltd. | | | 638,338 | |
| | 3,900 | | | Glimcher Realty Trust(L) | | | 43,602 | |
| | 8,529 | | | Hypo Real Estate Holdings(L) | | | 240,102 | |
| | 30,500 | | | Kerry Properties Ltd. | | | 160,181 | |
| | 78,600 | | | Meruelo Maddux Properties, Inc.(a)(L) | | | 171,348 | |
| | 6,200 | | | National Retail Properties, Inc.(L) | | | 129,580 | |
| | 8,510 | | | Resource Capital Corp.(L) | | | 61,357 | |
| | 136,000 | | | SP Setia Berhad | | | 122,369 | |
| | 7,000 | | | Sumitomo Realty & Development Co. Ltd. | | | 139,097 | |
| | | | | | | | | |
| | | | | | | | 1,788,937 | |
| | | | | | | | | |
| | | | | Restaurants (0.1%) |
| | 3,500 | | | Bob Evans Farms, Inc.(L) | | | 100,100 | |
| | 1,970 | | | CBRL Group, Inc.(L) | | | 48,285 | |
| | 1,900 | | | CEC Entertainment, Inc.(a)(L) | | | 53,219 | |
| | 5,400 | | | Chipotle Mexican Grill, Inc., Class A(a)(L) | | | 446,148 | |
| | 3,400 | | | P.F. Chang’s China Bistro, Inc.(a)(L) | | | 75,956 | |
| | 6,700 | | | The Cheesecake Factory(a)(L) | | | 106,597 | |
| | | | | | | | | |
| | | | | | | | 830,305 | |
| | | | | | | | | |
| | | | | Retail (4.4%) |
| | 110,000 | | | Aeon Co Ltd | | | 1,358,101 | |
| | 5,880 | | | Aeropostale, Inc.(a)(L) | | | 184,220 | |
| | 100,400 | | | BJ’s Wholesale Club, Inc.(a)(L) | | | 3,885,480 | |
| | 4,460 | | | Brown Shoe Co., Inc.(L) | | | 60,433 | |
| | 3,100 | | | Carrefour SA | | | 175,514 | |
| | 3,600 | | | Casey’s General Stores, Inc.(L) | | | 83,412 | |
| | 2,100 | | | Charlotte Russe Holding, Inc.(a)(L) | | | 37,296 | |
| | 51,300 | | | Chico’s FAS, Inc.(a)(L) | | | 275,481 | |
| | 24,000 | | | Citizen Watch | | | 182,851 | |
| | 12,766 | | | Compagnie Financiere Richemont AG | | | 711,062 | |
| | 50,100 | | | Costco Wholesale Corp. | | | 3,514,014 | |
| | 3,100 | | | Dick’s Sporting Goods, Inc.(a)(L) | | | 54,994 | |
| | 1,880 | | | Dollar Tree, Inc.(a) | | | 61,457 | |
| | 23,400 | | | GameStop Corp.(a) | | | 945,360 | |
| | 201,600 | | | Gap, Inc. | | | 3,360,672 | |
| | 476,000 | | | GOME Electrical Appliances Holdings, Ltd.(a)(L) | | | 225,875 | |
| | 12,900 | | | J Crew Group, Inc.(a)(L) | | | 425,829 | |
| | 100,600 | | | Lowe’s Cos., Inc. | | | 2,087,450 | |
| | 5,100 | | | Lululemon Athletica, Inc.(a)(L) | | | 148,206 | |
| | 11,900 | | | Magnit Ojsc-spon GDR(a) | | | 138,040 | |
| | 23,400 | | | Marks & Spencer PLC | | | 153,110 | |
| | 1,900 | | | Regis Corp. | | | 50,065 | |
| | 3,500 | | | Rent-A-Center, Inc.(a)(L) | | | 71,995 | |
| | 6,700 | | | Rush Enterprises, Inc. - Class A(a)(L) | | | 80,467 | |
| | 2,800 | | | Shimamura Co. Ltd. | | | 172,454 | |
| | 5,800 | | | Shoppers Drug Mart Corp. | | | 317,899 | |
| | 81,400 | | | Staples, Inc. | | | 1,933,250 | |
| | 95,500 | | | Tesco PLC | | | 702,483 | |
| | 6,200 | | | Tiffany & Co.(L) | | | 252,650 | |
| | 79,700 | | | TJX Cos., Inc. | | | 2,508,159 | |
| | 10,900 | | | Urban Outfitters, Inc.(a)(L) | | | 339,971 | |
| | 88,000 | | | Walgreen Co. | | | 2,860,880 | |
| | 35,100 | | | Walmart De Mexico SA | | | 139,133 | |
| | 155,600 | | | Wal-Mart Stores, Inc. | | | 8,744,720 | |
| | 14,900 | | | Whole Foods Market, Inc.(L) | | | 352,981 | |
| | 6,200 | | | Williams-Sonoma, Inc.(L) | | | 123,008 | |
| | | | | | | | | |
| | | | | | | | 36,718,972 | |
| | | | | | | | | |
| | | | | Schools (0.6%) |
| | 113,200 | | | Apollo Group, Inc., Class A(a) | | | 5,010,232 | |
| | 2,360 | | | Devry, Inc.(L) | | | 126,543 | |
| | 2,320 | | | ITT Educational Services, Inc.(a)(L) | | | 191,702 | |
| | | | | | | | | |
| | | | | | | | 5,328,477 | |
| | | | | | | | | |
| | | | | Technology (1.5%) |
| | 19,700 | | | Canon, Inc. | | | 1,012,968 | |
| | 1,920 | | | CommScope, Inc.(a)(L) | | | 101,319 | |
| | 139,000 | | | Ingram Micro, Inc.(a) | | | 2,467,250 | |
| | 320,690 | | | Intel Corp. | | | 6,888,421 | |
| | 2,610 | | | JDA Software Group, Inc.(a) | | | 47,241 | |
| | 23,800 | | | United Technologies Corp. | | | 1,468,460 | |
| | 19,600 | | | Universal Display Corp.(a)(L) | | | 241,472 | |
| | | | | | | | | |
| | | | | | | | 12,227,131 | |
| | | | | | | | | |
| | | | | Telecommunications (4.4%) |
| | 27,900 | | | America Movil SA, Series L - ADR | | | 1,471,725 | |
| | 7,070 | | | Arris Group, Inc.(a) | | | 59,742 | |
| | 334,547 | | | AT&T, Inc. | | | 11,270,888 | |
| | 62,000 | | | CenturyTel, Inc. | | | 2,206,580 | |
| | 31,400 | | | Clearwire Corp., Class A(a)(L) | | | 406,944 | |
| | 7,290 | | | Consolidated Communications Holdings, Inc.(L) | | | 108,548 | |
| | 117,200 | | | Corning, Inc. | | | 2,701,460 | |
| | 19,600 | | | Embarq Corp. | | | 926,492 | |
| | 2,800 | | | EMS Technologies, Inc.(a)(L) | | | 61,152 | |
| | 4,190 | | | Encore Wire Corp.(L) | | | 88,786 | |
| | 4,600 | | | Mobile Telesystems - ADR(a) | | | 352,406 | |
| | 7,600 | | | Mobinil | | | 230,546 | |
| | 250 | | | Motorola, Inc. | | | 1,835 | |
| | 17,400 | | | MTN Group Ltd | | | 276,667 | |
| | 15,000 | | | NII Holdings, Inc.(a) | | | 712,350 | |
| | 900 | | | NTELOS Holding Corp.(L) | | | 22,833 | |
| | 69 | | | NTT DoCoMo, Inc. | | | 101,370 | |
| | 1,600 | | | Orascom Telecom - ADR | | | 102,948 | |
| | 6,900 | | | Orascom Telecom Holding | | | 441,600 | |
| | 60,800 | | | Polycom, Inc.(a) | | | 1,481,088 | |
| | 139,300 | | | Qualcomm, Inc. | | | 6,180,741 | |
| | 2,400 | | | Research In Motion(a) | | | 281,706 | |
| | 21,400 | | | Royal KPN NV | | | 367,258 | |
| | 2,100 | | | SBA Communications Corp.(a) | | | 75,621 | |
| | 5,400 | | | SES Global | | | 134,758 | |
| | 140,575 | | | Singapore Telecommunications Ltd.(b) | | | 374,026 | |
| | 517 | | | Swisscom AG | | | 172,451 | |
| | 17,600 | | | Telefonaktiebolaget LM Ericsson - ADR(L) | | | 183,040 | |
| | 112,600 | | | Telefonaktiebolaget LM Ericsson - Class B | | | 1,174,153 | |
| | 9,203 | | | Telefonica de Espana | | | 244,587 | |
| | 29,200 | | | Telefonos de Mexico SA - ADR(L) | | | 691,456 | |
| | 910,000 | | | Telekomunikasi Indonesia(a) | | | 720,499 | |
| | 25,300 | | | Telenor ASA | | | 475,878 | |
| | 22,500 | | | TeliaSonera AB(L) | | | 166,627 | |
| | 78,300 | | | Telmex Internacional Sab-l(a) | | | 63,699 | |
| | 53,900 | | | Telmex Internacional Sab De Cv Spons Adr Sr L - ADR(a)(L) | | | 867,790 | |
| | 75,000 | | | Telstra Corp., Ltd. | | | 304,852 | |
| | 128,700 | | | Tim Participacoes SA | | | 366,086 | |
| | 18,200 | | | Turk Telekomunikasyon(a) | | | 61,276 | |
| | 7,000 | | | Turkcell Iletisim Hizmet AS - ADR | | | 101,850 | |
| | 14,700 | | | Verizon Communications, Inc. | | | 520,380 | |
| | 21,000 | | | Virgin Mobile USA, Inc., Class A(a) | | | 57,750 | |
| | 110,784 | | | Vodafone Group PLC | | | 329,119 | |
| | | | | | | | | |
| | | | | | | | 36,941,563 | |
| | | | | | | | | |
| | | | | Transportation (1.8%) |
| | 26,000 | | | Burlington Northern Santa Fe Corp. | | | 2,597,140 | |
| | 17,200 | | | C H Robinson Worldwide, Inc. | | | 943,248 | |
| | 35 | | | East Japan Railway Co. | | | 285,116 | |
The accompanying notes are an integral part of these financial statements.
13
portfolio of investments (continued)
NEW COVENANT GROWTH FUND
June 30, 2008
| | | | | | | | | |
|
Shares or
| | |
| Principal Amount | | Value |
|
| |
COMMON STOCKS (cont.) |
| | | | | Transportation (cont.) |
| | 29,200 | | | Expeditors International of Washington, Inc. | | | $1,255,600 | |
| | 42,000 | | | Hankyu Holdings, Inc.(L) | | | 176,409 | |
| | 3,910 | | | HUB Group, Inc., Class A(a) | | | 133,448 | |
| | 2,100 | | | J.B. Hunt Transport Services, Inc.(L) | | | 69,888 | |
| | 2,830 | | | Landstar System, Inc. | | | 156,272 | |
| | 17,000 | | | Mitsui O.S.K. Lines Ltd. | | | 242,228 | |
| | 700 | | | Overseas Shipholding Group, Inc.(L) | | | 55,664 | |
| | 18,950 | | | Ryder System, Inc. | | | 1,305,276 | |
| | 4,220 | | | Skywest, Inc.(L) | | | 53,383 | |
| | 205,400 | | | Southwest Airlines Co. | | | 2,678,416 | |
| | 15,815 | | | Veolia Environnement | | | 887,188 | |
| | 120,200 | | | Werner Enterprises, Inc.(L) | | | 2,233,316 | |
| | 69,000 | | | Yamato Holdings Co., Ltd. | | | 963,018 | |
| | 60,900 | | | YRC Worldwide, Inc.(a)(L) | | | 905,583 | |
| | | | | | | | | |
| | | | | | | | 14,941,193 | |
| | | | | | | | | |
| | | | | Waste Management (0.6%) |
| | 7,700 | | | Darling International, Inc.(a) | | | 127,204 | |
| | 128,200 | | | Waste Management, Inc. | | | 4,834,422 | |
| | | | | | | | | |
| | | | | | | | 4,961,626 | |
| | | | | | | | | |
| | | | | Total Common Stocks | | | | |
| | | | | (Cost $765,127,534) | | | 819,486,338 | |
| | | | | | | | | |
| |
CORPORATE BOND (0.1%) |
| | $707,000 | | | Suzlon Energy Ltd. (0.00%), 06/12/2012 | | | 713,750 | |
| | | | | | | | | |
| | | | | Total Corporate Bond | | | | |
| | | | | (Cost $750,981) | | | 713,750 | |
| | | | | | | | | |
| |
CASH EQUIVALENT (1.9%) |
| | 15,766,404 | | | JP Morgan Cash Trade Execution | | | 15,766,404 | |
| | | | | | | | | |
| | | | | Total Cash Equivalent | | | | |
| | | | | (Cost $15,766,404) | | | 15,766,404 | |
| | | | | | | | | |
| |
INVESTMENTS HELD AS COLLATERAL FOR LOANED SECURITIES (12.2%) |
| | $18,000,000 | | | Barclays Capital Repurchase Agreement, 2.70%, 07/01/08 (Purchased on 06/30/08, proceeds at maturity $18,001,350, collateralized by various corporate bonds, fair value $18,900,000) | | | 18,000,000 | |
| | 932,460 | | | JP Morgan Chase Asset Backed Securities Trust ABS, 2.53%, 07/25/08(c) | | | 932,460 | |
| | 6,000,000 | | | Citigroup Funding Inc. MTN, 2.16%, 06/01/09(c) | | | 6,000,000 | |
| | 10,000,000 | | | Citigroup Global Markets, Inc. Repurchase Agreement, 2.60%, 07/01/08 (Purchased on 06/30/08, proceeds at maturity $10,000,722, collateralized by various corporate bonds, fair value $10,500,000) | | | 10,000,000 | |
| | 3,500,000 | | | Citigroup Global Markets, Inc., 2.80%, 07/07/08(c) | | | 3,500,000 | |
| | $25,000,000 | | | Credit Suisse (USA) LLC Repurchase Agreement, 2.75%, 07/01/08 (Purchased on 06/30/08, proceeds at maturity $25,001,910, collateralized by various corporate bonds, fair value $26,228,924) | | | 25,000,000 | |
| | 17,187,200 | | | Deutshe Bank Securities Inc. Repurchase Agreement, 2.50%, 07/01/08 (Purchased on 06/30/08, proceeds at maturity $17,188,394, collateralized by various corporate bonds, fair value $17,530,946) | | | 17,187,200 | |
| | 2,335,346 | | | GSAA Home Equity Trust ABS, 2.57%, 07/30/08(c) | | | 2,335,346 | |
| | 6,000,000 | | | Goldman Sachs Group, Inc. MTN, 2.63%, 02/13/09(c) | | | 6,000,000 | |
| | 491,189 | | | Long Beach Mortgage Loan Trust ABS, 2.52%, 09/19/08(c) | | | 491,189 | |
| | 7,000,000 | | | Monumental Global Funding II MTN, 2.66%, 05/26/10(c) | | | 7,000,000 | |
| | 3,000,000 | | | Santander U.S. Debt SA MTN, 2.73%, 11/20/09(c) | | | 3,000,000 | |
| | 2,500,000 | | | Wachovia Bank N.A. Bank Note, 2.64%, 08/10/09(c) | | | 2,500,000 | |
| | | | | | | | | |
| | | | | Total Investments Held As Collateral For Loaned Securities | | | | |
| | | | | (Cost $101,946,195) | | | 101,946,195 | |
| | | | | | | | | |
| | | | | |
TOTAL INVESTMENTS — (112.2%) | | | | |
| (Cost $883,591,114) | | | $937,912,687 | |
Liabilities in excess of other assets — (12.2)% | | | (101,826,334 | ) |
| | | | | |
TOTAL NET ASSETS — 100.00% | | | $836,086,353 | |
| | | | | |
| | |
| (a) | | Non-income producing security. |
| (b) | | Security exempt from registration under Rule 144A of the Securities Act of 1933 or otherwise restricted as to resale. These securities may be resold in transactions exempt from registration, normally for qualified buyers. The Adviser, using procedures approved by the Board of Trustees, has deemed these securities to be liquid. |
| (c) | | Variable or Floating Rate Security. Rate disclosed is as of June 30, 2008. |
| (L) | | A portion or all of the security is on loan. |
| ABS | | Asset Backed Security |
| ADR | | American Depository Receipt |
| GDR | | Global Depository Receipt |
| LLC | | Limited Liability Company |
| LP | | Limited Partnership |
| MTN | | Medium Term Note |
| PLC | | Public Liability Company |
The accompanying notes are an integral part of these financial statements.
14
portfolio of investments (continued)
NEW COVENANT INCOME FUND
SCHEDULE OF INVESTMENTS at June 30, 2008
| | | | | | | | | |
|
| Principal Amount | | Value |
|
| |
ASSET BACKED SECURITIES (1.4%) |
| | $575,000 | | | Lehman XS Trust 2005-1 3A3A,
5.11%, 07/25/35 | | | $362,844 | |
| | 565,000 | | | Lehman XS Trust 2005-6 3A3A,
5.76%, 11/25/35 | | | 387,471 | |
| | 2,420,000 | | | Lehman XS Trust 2006-5 2A4A,
5.89%, 04/25/36 | | | 1,890,893 | |
| | 4,860,000 | | | Master Asset Backed Securities 2005-AB1,
5.23%, 11/25/35 | | | 4,413,055 | |
| | | | | | | | | |
| | | | | Total Asset Backed Securities | | | | |
| | | | | (Cost $8,396,782) | | | 7,054,263 | |
| | | | | | | | | |
| |
CORPORATE BONDS (24.4%) |
| | 1,650,000 | | | Abbott Laboratories, 5.88%, 05/15/16 | | | 1,700,277 | |
| | 3,600,000 | | | American International Group, Inc.,
4.70%, 10/01/10 | | | 3,534,714 | |
| | 2,150,000 | | | American Water Capital Corp.,
6.09%, 10/15/17 | | | 2,065,873 | |
| | 3,700,000 | | | Amgen, Inc.,
5.85%, 06/01/17 | | | 3,650,616 | |
| | 3,100,000 | | | Arcelormittal Sa Luxembourg,
5.38%, 06/01/13(b) | | | 3,055,766 | |
| | 2,500,000 | | | AstraZeneca Plc, 5.40%, 09/15/12(L) | | | 2,559,022 | |
| | 3,600,000 | | | AT&T Wireless Services, Inc.,
8.13%, 05/01/12 | | | 3,946,327 | |
| | 2,800,000 | | | Bank of America Commercial Mortgage,
5.30%, 03/15/17(L) | | | 2,574,617 | |
| | 2,800,000 | | | BRE Properties, Inc., 5.50%, 03/15/17 | | | 2,471,143 | |
| | 3,800,000 | | | Burlington Northern Santa Fe Corp.,
6.75%, 07/15/11 | | | 3,987,880 | |
| | 2,800,000 | | | Carolina Power & Light Co.,
6.50%, 07/15/12 | | | 2,940,076 | |
| | 850,000 | | | Citigroup, Inc., 5.50%, 08/27/12(L) | | | 838,962 | |
| | 2,285,000 | | | Citigroup, Inc., 6.13%, 11/21/17 | | | 2,196,758 | |
| | 850,000 | | | Comcast Cable Communications, Inc.,
6.75%, 01/30/11(L) | | | 881,098 | |
| | 2,500,000 | | | Covidien Ltd., 5.45%, 10/15/12(L) | | | 2,536,823 | |
| | 1,150,000 | | | Credit Suisse, 6.00%, 02/15/18 | | | 1,109,342 | |
| | 1,125,000 | | | Eaton Vance Corp., 6.50%, 10/02/17 | | | 1,136,873 | |
| | 2,775,000 | | | ERP Operating LP, 5.75%, 06/15/17 | | | 2,565,773 | |
| | 1,000,000 | | | Federated Retail Holdings, Inc.,
5.90%, 12/01/16 | | | 870,072 | |
| | 1,743,258 | | | FedEx Corp., 6.72%, 07/15/23 | | | 1,804,621 | |
| | 3,700,000 | | | Fifth Third Bancorp, 6.25%, 05/01/13(L) | | | 3,390,077 | |
| | 1,950,000 | | | Firstar Bank, 7.13%, 12/01/09 | | | 2,023,899 | |
| | 4,100,000 | | | General Electric Capital Corp.,
6.13%, 02/22/11(L) | | | 4,286,370 | |
| | 3,350,000 | | | General Mills, Inc., 6.00%, 02/15/12 | | | 3,447,488 | |
| | 875,000 | | | GlaxoSmithKline Plc, 4.85%, 05/15/13 | | | 874,758 | |
| | 3,100,000 | | | Goldman Sachs Group, Inc.,
5.30%, 02/14/12 | | | 3,122,593 | |
| | 3,000,000 | | | Goldman Sachs Group, Inc.,
5.95%, 01/18/18 | | | 2,885,013 | |
| | 2,500,000 | | | Home Depot, Inc., 5.40%, 03/01/16 | | | 2,299,138 | |
| | 1,500,000 | | | HSBC Finance Corp., 4.13%, 11/16/09 | | | 1,490,550 | |
| | 750,000 | | | HSBC Finance Corp., 6.75%, 05/15/11 | | | 779,927 | |
| | 3,300,000 | | | International Lease Finance Corp.,
6.38%, 03/25/13 | | | 3,015,111 | |
| | 1,750,000 | | | Kinder Morgan Energy Partners LP,
7.40%, 03/15/31 | | | 1,803,487 | |
| | 1,000,000 | | | Kraft Foods, Inc., 6.13%, 08/23/18 | | | 970,219 | |
| | 3,550,000 | | | Lehman Brothers Holdings, Inc.,
5.63%, 01/24/13 | | | 3,363,394 | |
| | 2,100,000 | | | May Department Stores Co.,
7.45%, 09/15/11 | | | 2,096,655 | |
| | 1,600,000 | | | Merrill Lynch & Co., 4.13%, 09/10/09(L) | | | 1,581,341 | |
| | 3,450,000 | | | Merrill Lynch & Co., 6.50%, 08/15/12 | | | 3,379,596 | |
| | 3,250,000 | | | MetLife, Inc., 5.00%, 06/15/15 | | | 3,162,016 | |
| | 3,400,000 | | | Morgan Stanley, 5.63%, 01/09/12 | | | 3,405,205 | |
| | 2,900,000 | | | Morgan Stanley, 5.95%, 12/28/17 | | | 2,637,248 | |
| | 1,250,000 | | | National City Corp., 4.50%, 03/15/10 | | | 1,152,427 | |
| | 2,375,000 | | | National City Corp., 6.88%, 05/15/19 | | | 1,754,141 | |
| | $600,000 | | | Nationwide Financial Services, Inc.,
5.90%, 07/01/12 | | | 596,946 | |
| | 725,000 | | | PNC Funding Corp., 5.50%, 09/28/12 | | | 715,863 | |
| | 2,785,000 | | | PNC Funding Corp., 6.13%, 02/15/09 | | | 2,811,084 | |
| | 2,100,000 | | | Prudential Financial, Inc,
6.10%, 06/15/17 | | | 2,095,206 | |
| | 2,500,000 | | | Rio Tinto Ltd, 5.875%, 07/15/13 | | | 2,516,570 | |
| | 2,000,000 | | | SunTrust Banks, Inc., 4.25%, 10/15/09 | | | 1,979,128 | |
| | 600,000 | | | SunTrust Banks, Inc., 5.25%, 11/05/12 | | | 587,204 | |
| | 1,732,000 | | | Verizon Communications, Inc.,
5.88%, 01/17/12 | | | 1,757,521 | |
| | 3,250,000 | | | Washington Mutual, Inc., 4.20%, 01/15/10 | | | 2,828,495 | |
| | 3,175,000 | | | Time Warner, Inc., 6.88%, 05/01/12 | | | 3,250,892 | |
| | 2,725,000 | | | Vodafone Group PLC, 5.63%, 02/27/17 | | | 2,629,355 | |
| | 200,000 | | | WellPoint, Inc., 5.88%, 06/15/17 | | | 193,647 | |
| | | | | | | | | |
| | | | | Total Corporate Bonds
(Cost $126,412,984) | | | 121,309,197 | |
| | | | | | | | | |
| |
MORTGAGE BACKED SECURITIES (41.2%) |
| | 3,490,000 | | | American Home Mortgage Investment Trust 2005-2 5A4C, 5.41%, 09/25/35 | | | 2,925,751 | |
| | 2,363,232 | | | American Home Mortgage Investment Trust 2006-21A1, 5.48%, 09/25/46 | | | 1,755,645 | |
| | 176,431 | | | American Home Mortgage Investment Trust 2007-1 A1, 5.22%, 02/25/47 | | | 126,837 | |
| | 4,310,000 | | | Banc of America Commercial Mortgage 2004-3 A5, 5.320%, 06/10/39 | | | 4,320,510 | |
| | 3,825,000 | | | Banc of America Commercial Mortgage 2004-4 A6, 4.88%, 07/10/42 | | | 3,654,551 | |
| | 3,230,000 | | | Banc of America Commercial Mortgage 2005-6 AM, 5.18%, 09/10/47 | | | 3,050,620 | |
| | 5,235,000 | | | Banc of America Commercial Mortgage 2006-4, 0.06%, 08/10/16 | | | 4,857,865 | |
| | 891,551 | | | Banc of America Commercial Mortgage 2006-F, 5.18%, 07/20/36 | | | 858,371 | |
| | 4,215,000 | | | Banc of America Commercial Mortgage 2006-3, 5.81%, 07/10/44 | | | 3,986,077 | |
| | 700,000 | | | Banc of America Commercial Mortgage 2007-1, 5.45%, 01/15/49 | | | 652,946 | |
| | 921,126 | | | Citigroup Mortgage Loan Trust Inc. 2005-7, 5.18%, 11/25/35 | | | 882,564 | |
| | 2,075,000 | | | Citigroup Commercial Mortgage Trust 2007-C6 C, 5.70%, 12/10/49 | | | 1,494,531 | |
| | 1,531,000 | | | Citigroup Commercial Mortgage Trust 2008-C7, 6.10%, 12/10/49 | | | 1,250,932 | |
| | 100,252 | | | Commercial Mortgage Pass-Through Certificate 2004-LB2A A1, 2.96%, 03/10/39 | | | 99,964 | |
| | 2,415,000 | | | Commercial Mortgage Pass-Through Certificate 2007-C9, 5.82%, 12/10/49 | | | 2,316,479 | |
| | 4,361,018 | | | Countrywide Alternative Loan Trust 2005-50CB 1A1, 5.50%, 11/25/35 | | | 3,652,074 | |
| | 1,745,836 | | | Countrywide Alternative Loan Trust 2007-24 A11, 7.00%, 10/25/37 | | | 1,273,584 | |
| | 2,829,586 | | | Countrywide Alternative Loan Trust 2007-26R A1, 7.00%, 01/25/37 | | | 2,554,267 | |
| | 4,970,209 | | | Countrywide Alternative Loan Trust 2007-OA2 1A1, 5.36%, 03/25/47 | | | 3,602,407 | |
| | 1,070,806 | | | Countrywide Home Loans 2005-HYB6 4A1B, 5.37%, 10/20/35 | | | 1,026,404 | |
| | 3,750,341 | | | Countrywide Home Loans 2007-HY5 1A1, 5.95%, 09/25/37 | | | 3,540,721 | |
| | 374,381 | | | Credit Suisse First Boston Mortgage Securities Corp. 2003-C3, 2.85%, 05/15/38 | | | 373,773 | |
| | 1,365,000 | | | Credit Suisse First Boston Mortgage Securities Corp. 2003-C3 A5,
3.94%, 05/15/38 | | | 1,266,492 | |
| | 1,540,000 | | | Credit Suisse First Boston Mortgage Securities Corp. 2005-C1 A4,
5.01%, 02/15/38 | | | 1,473,828 | |
| | 1,825,000 | | | Credit Suisse First Boston Mortgage Securities Corp. 2007-4R 1A1,
5.70%, 10/26/36 | | | 1,509,640 | |
The accompanying notes are an integral part of these financial statements.
15
portfolio of investments (continued)
NEW COVENANT INCOME FUND
SCHEDULE OF INVESTMENTS at June 30, 2008
| | | | | | | | | |
|
| Principal Amount | | Value |
|
| |
MORTGAGE BACKED SECURITIES (cont.) |
| | $1,205,000 | | | Credit Suisse Mortgage Capital Certificate 2006-C1 AM, 5.55%, 02/15/39 | | | $1,120,474 | |
| | 6,060,000 | | | Credit Suisse Mortgage Capital Certificate 2006-C4 A3, 5.47%, 09/15/39 | | | 5,771,894 | |
| | 720,000 | | | Credit Suisse Mortgage Capital Certificate 2007-3 1A3A, 5.75%, 04/25/37 | | | 530,840 | |
| | 4,585,000 | | | Deutsche ALT-A Securities, Inc. Mortgage Loan Trust 005-3 5A5, 5.25%, 06/25/35 | | | 4,322,349 | |
| | 1,207,768 | | | First Horizon Mortgage Trust, 2007-AR2 5.89%, 07/25/37 | | | 1,106,641 | |
| | 1,370,000 | | | General Electric Capital Commercial Mortgage Corp., 4.60%, 11/10/38 | | | 1,316,090 | |
| | 1,230,000 | | | GMAC Commercial Mortgage Securities 2004-C2 A4, 5.30%, 08/10/38 | | | 1,202,501 | |
| | 3,220,000 | | | Goldman Sachs Mortgage Securities Corp. 2007-GG10 A2, 5.78%, 08/10/45(L) | | | 3,181,994 | |
| | 1,235,000 | | | Goldman Sachs Mortgage Securities Corp. 2007-GG10 A4, 5.99%, 08/10/45 | | | 1,183,495 | |
| | 1,402,749 | | | GSAA Home Equity Trust 2007-5,
2.49%, 05/25/37 | | | 1,194,316 | |
| | 1,449,738 | | | GSAA Home Equity Trust 2007-10 A1A, 6.00%, 11/25/37 | | | 1,292,441 | |
| | 870,529 | | | GSAA Home Equity Trust 2007-10 A1A, 6.50%, 11/25/37 | | | 810,095 | |
| | 3,790,289 | | | HSI Home Loan Obligation 2007-AR2 2A1, 6.00%, 09/25/37 | | | 3,138,114 | |
| | 3,865,107 | | | Indymac Index Mortgage Loan Trust 2006AR11 3A1, 5.83%, 06/25/36 | | | 2,991,697 | |
| | 3,169,253 | | | JP Morgan Chase Adjustable Rate Mortgage Trust 2007-5, 5.80%, 08/25/47 | | | 2,906,056 | |
| | 1,155,000 | | | JP Morgan Chase Commercial Mortgage Securities Corp. 2004-CB8 A4,
4.40%, 01/12/39 | | | 1,079,231 | |
| | 5,445,000 | | | JP Morgan Chase Commercial Mortgage Securities Corp. 2004-CB9 A4,
5.39%, 06/12/41 | | | 5,387,007 | |
| | 293,460 | | | JP Morgan Chase Commercial Mortgage Securities Corp. 2004-PNC1 A1,
2.80%, 06/12/41 | | | 292,165 | |
| | 1,200,000 | | | JP Morgan Chase Commercial Mortgage Securities Corp. 2006-LDP7 A4,
6.07%, 04/15/45 | | | 1,181,019 | |
| | 2,125,000 | | | JP Morgan Chase Commercial Mortgage Securities Corp. 2006-LDP8 B,
5.52%, 05/15/45 | | | 1,612,386 | |
| | 4,270,000 | | | JP Morgan Chase Commercial Mortgage Securities Corp. 2006-LDP9 A4,
5.34%, 05/15/47 | | | 4,013,759 | |
| | 1,305,000 | | | JP Morgan Chase Commercial Mortgage Securities Corp. 2007-CIBC18 A4,
5.44%, 06/12/47 | | | 1,216,405 | |
| | 1,565,000 | | | JP Morgan Chase Commercial Mortgage Securities Corp. 2007-LDP11 A4,
6.01%, 06/15/49 | | | 1,500,229 | |
| | 1,470,000 | | | JP Morgan Chase Commercial Mortgage Securities 2007-PWR18, 6.21%, 06/11/50 | | | 1,210,630 | |
| | 2,680,000 | | | JP Morgan Chase Commercial Mortgage Securities Corp. 2007-CIBC20,
5.79%, 02/12/51 | | | 2,548,284 | |
| | 3,880,000 | | | JP Morgan Chase Commercial Mortgage Securities Corp. 2007-LDP12,
5.83%, 02/15/51 | | | 3,834,992 | |
| | 4,165,000 | | | JP Morgan Chase Commercial Mortgage Securities Corp. 2007-LD12 A4,
5.88%, 02/15/51 | | | 3,985,473 | |
| | 4,364,000 | | | LB-UBS Commercial Mortgage Trust 2004-C7 A6, 4.79%, 10/15/29 | | | 4,141,655 | |
| | 3,770,000 | | | LB-UBS Commercial Mortgage Trust 2006-C6 AM, 0.05%, 09/15/36 | | | 3,424,327 | |
| | 2,551,536 | | | Master Adjustable Rate Mortgage 2006-OA2 4A1B, 5.72%, 12/25/46 | | | 1,892,219 | |
| | 1,460,369 | | | Master Reperforming Loan Trust 2006-2 1a1 5.90%, 05/25/36 | | | 1,464,897 | |
| | $565,000 | | | Merrill Lynch/Countrywide Commercial Mortgage Trust 2006-4 A3,
5.17%, 12/12/49 | | | 526,840 | |
| | 1,675,000 | | | Morgan Stanley Capital I, 2004-IQ7
5.41%, 06/15/38 | | | 1,650,535 | |
| | 5,945,000 | | | Morgan Stanley Capital I, 2007-IQ15 A-4 5.88%, 06/11/49 | | | 5,733,087 | |
| | 3,050,000 | | | Morgan Stanley Mortgage Loan Trust 2006-7 5A2, 5.96%, 06/25/36 | | | 2,338,255 | |
| | 560,000 | | | Nomura Asset Acceptance Corp. 2006-AF2 1A4, 6.41%, 05/25/36 | | | 370,078 | |
| | 2,105,891 | | | PHH Alternative Mortgage Trust 2007-1 21A, 6.00%, 02/25/37 | | | 1,812,131 | |
| | 227,253 | | | Residential Accredit Loans, Inc. 2007-QS9 A33, 6.50%, 07/25/37 | | | 195,552 | |
| | 2,875,966 | | | Residential Accredit Loans, Inc. 2007-QS10 A1, 6.50%, 09/25/37 | | | 2,445,950 | |
| | 830,873 | | | Residential Funding Mortgage Securities I 2006-SA2 2A1 5.85%, 08/25/36 | | | 786,591 | |
| | 3,399,870 | | | Structured Adjustable Rate Mortgage Loan 2007-3 3A1, 5.72%, 04/25/37 | | | 3,042,487 | |
| | 2,621,024 | | | TBW Mortgage Backed Pass-Through Certificate 2006-2 7A1, 7.00%, 07/25/36 | | | 1,833,774 | |
| | 3,839,840 | | | Wachovia Mortgage Loan Trust LLC 2006-A 3A1, 5.24%, 05/20/36 | | | 3,678,743 | |
| | 4,995,000 | | | Wachovia Bank Commercial Mortgage Trust 2004-C11, 5.22%, 01/15/41 | | | 4,886,700 | |
| | 4,885,000 | | | Wachovia Bank Commercial Mortgage Trust 2004-C12 A4, 5.41%, 07/15/41 | | | 4,794,258 | |
| | 1,125,000 | | | Washington Mutual Mortgage Pass-Through Certificates 2003-AR11
3.99%, 10/25/33 | | | 1,121,605 | |
| | 4,289,193 | | | Washington Mutual Mortgage Pass-Through Certificates 2005-AR3
4.64%, 03/25/35 | | | 4,169,859 | |
| | 4,130,000 | | | Washington Mutual Mortgage Pass-Through Certificates 2005-AR5,
4.68%, 05/25/35 | | | 3,939,393 | |
| | 3,614,754 | | | Washington Mutual Mortgage Pass-Through Certificates 2006-AR12
5.75%, 10/25/36 | | | 3,353,985 | |
| | 936,106 | | | Washington Mutual Mortgage Pass-Through Certificates 2006-AR2
5.27%, 04/25/46 | | | 702,079 | |
| | 1,186,854 | | | Washington Mutual Mortgage Pass-Through Certificates 2006-AR3,
5.30%, 05/25/46 | | | 893,582 | |
| | 469,514 | | | Washington Mutual Mortgage Pass-Through Certificates 2006-AR8
5.18%, 10/25/46 | | | 353,544 | |
| | 427,078 | | | Washington Mutual Mortgage Pass-Through Certificates 2006-AR9
5.17%, 11/25/46 | | | 320,137 | |
| | 5,148,827 | | | Washington Mutual Mortgage Pass-Through Certificates 2007-HY3
5.35%, 08/25/36 | | | 4,807,510 | |
| | 3,083,886 | | | Washington Mutual Mortgage Pass-Through Certificates 2007-HY5
5.34%, 05/25/37 | | | 2,854,356 | |
| | 9,352,830 | | | Washington Mutual Mortgage Pass-Through Certificates 2007-HY6
5.70%, 06/25/37 | | | 8,682,931 | |
| | 3,320,677 | | | Washington Mutual Mortgage Pass-Through Certificates 2007-HY6
5.71%, 06/25/37 | | | 2,992,359 | |
| | 1,099,971 | | | Washington Mutual Mortgage Pass-Through Certificates 2007-HY7
5.91%, 07/25/37 | | | 1,037,978 | |
| | 879,218 | | | Washington Mutual Mortgage Pass-Through Certificates 2007-OA3
5.10%, 04/25/47 | | | 567,975 | |
The accompanying notes are an integral part of these financial statements.
16
portfolio of investments (continued)
NEW COVENANT INCOME FUND
SCHEDULE OF INVESTMENTS at June 30, 2008
| | | | | | | | | |
|
| Principal Amount | | Value |
|
| |
MORTGAGE BACKED SECURITIES (cont.) |
| | $1,133,700 | | | Washington Mutual Mortgage Pass-Through Certificates 2007-OA4
5.09%, 04/25/47 | | | $623,535 | |
| | 917,176 | | | Washington Mutual Mortgage Pass-Through Certificates 2007-OA5
5.78%, 06/25/47 | | | 612,949 | |
| | 1,214,654 | | | Washington Mutual Mortgage Pass-Through Certificates 2007-OA6
5.14%, 07/25/47 | | | 922,286 | |
| | 4,287,148 | | | Wells Fargo Mortgage Backed Securities Trust 2006-AR10 5A1, 5.60%, 07/25/36 | | | 4,141,028 | |
| | 5,320,000 | | | Wells Fargo Mortgage Backed Securities Trust 2006-AR7 2A5, 5.61%, 05/25/36 | | | 5,004,382 | |
| | | | | | | | | |
| | | | | Total Mortgage Backed Securities
(Cost $218,485,882) | | | 204,556,962 | |
| | | | | | | | | |
| |
U.S. GOVERNMENT AGENCIES (27.6%) |
| | | | | Fannie Mae | | | | |
| | 870,720 | | | 6.13%, 10/01/08 | | | 868,959 | |
| | 1,918,870 | | | 4.96%, 11/01/08 | | | 1,915,044 | |
| | 1,365,752 | | | 6.12%, 04/01/09 | | | 1,375,907 | |
| | 3,662,739 | | | 7.16%, 04/01/10 | | | 3,814,672 | |
| | 2,060,059 | | | 7.56%, 12/01/10 | | | 2,146,913 | |
| | 7,628,599 | | | 6.41%, 01/01/11 | | | 7,873,876 | |
| | 1,892,128 | | | 6.70%, 01/01/11 | | | 1,961,072 | |
| | 4,545,886 | | | 5.90%, 04/01/11 | | | 4,690,853 | |
| | 907,380 | | | 6.09%, 05/01/11 | | | 936,686 | |
| | 1,272,793 | | | 6.52%, 05/01/11 | | | 1,318,857 | |
| | 2,745,000 | | | 6.28%, 08/01/11 | | | 2,850,867 | |
| | 2,659,241 | | | 6.13%, 10/01/11 | | | 2,754,849 | |
| | 1,622,800 | | | 6.01%, 11/01/11 | | | 1,674,019 | |
| | 5,527,503 | | | 5.71%, 02/01/12 | | | 5,742,129 | |
| | 1,528,604 | | | 5.78%, 07/01/12 | | | 1,571,990 | |
| | 892,292 | | | 4.88%, 01/01/13 | | | 889,509 | |
| | 1,197,414 | | | 5.77%, 06/01/13 | | | 1,231,241 | |
| | 2,000,000 | | | 5.52%, 05/01/17 | | | 2,016,800 | |
| | 844,015 | | | 6.50%, 08/01/17 | | | 880,616 | |
| | 2,843,961 | | | 5.00%, 01/01/21 | | | 2,840,821 | |
| | 15,170,000 | | | 4.50%, 08/01/23(a) | | | 14,634,317 | |
| | 12,260,000 | | | 5.00%, 08/01/23(a) | | | 12,097,175 | |
| | 855,000 | | | 5.00%, 03/25/32 | | | 840,769 | |
| | 960,000 | | | 4.50%, 07/25/33 | | | 961,725 | |
| | 4,935,000 | | | 5.00%, 04/25/34 | | | 4,824,200 | |
| | 3,799,385 | | | 5.50%, 12/25/34 | | | 3,866,866 | |
| | 1,050,674 | | | 5.44%, 01/01/36 | | | 1,064,423 | |
| | 806,064 | | | 5.48%, 03/01/36 | | | 816,450 | |
| | 3,011,618 | | | 5.90%, 07/25/42 | | | 3,041,053 | |
| | | | | | | | | |
| | | | | | | | 91,502,658 | |
| | | | | | | | | |
| | | | | Freddie Mac | | | | |
| | 5,402,782 | | | 6.98%, 10/01/10 | | | 5,672,921 | |
| | 1,285,000 | | | 6.90%, 12/01/10 | | | 1,347,965 | |
| | 2,292,915 | | | 4.50%, 07/15/16 | | | 2,303,059 | |
| | 3,283,874 | | | 5.00%, 12/01/20 | | | 3,260,305 | |
| | 4,150,000 | | | 5.00%, 02/15/20 | | | 4,222,154 | |
| | 5,270,000 | | | 5.00%, 08/15/31 | | | 5,223,115 | |
| | 1,230,000 | | | 5.00%, 03/15/32 | | | 1,213,130 | |
| | 4,150,000 | | | 5.00%, 06/15/33 | | | 4,026,922 | |
| | 3,395,000 | | | 5.00%, 03/15/34 | | | 3,283,133 | |
| | 13,595,000 | | | 5.00%, 07/01/38(a) | | | 13,027,830 | |
| | | | | | | | | |
| | | | | | | | 43,580,534 | |
| | | | | | | | | |
| | | | | Ginnie Mae | | | | |
| | 2,045,000 | | | 5.50%, 07/01/38(a) | | | 2,035,094 | |
| | | | | | | | | |
| | | | | Total U.S. Government Agencies
(Cost $136,933,068) | | | 137,118,286 | |
| | | | | | | | | |
| |
U.S. TREASURY OBLIGATIONS (0.5%) |
| | 1,155,000 | | | U.S. Treasury Note, 4.63%, 11/15/2009 | | | 1,190,734 | |
| | 1,190,000 | | | U.S. Treasury Note, 3.88%, 05/15/2018(L) | | | 1,180,425 | |
| | | | | | | | | |
| | | | | Total U.S. Treasury Obligations
(Cost $2,364,589) | | | 2,371,159 | |
| | | | | | | | | |
Principal Amount
| | |
| or Shares | | |
|
| |
CLOSED-END INVESTMENT COMPANIES (1.5%) |
| | 156,000 | | | BlackRock Income Trust(L) | | | 921,960 | |
| | 25,300 | | | First Trust/FIDAC Mortgage Income Fund | | | 432,630 | |
| | 49,589 | | | MFS Government Markets Income Trust | | | 345,635 | |
| | 297,100 | | | MFS Intermediate Income Trust(L) | | | 1,853,904 | |
| | 76,216 | | | Putnam Master Intermediate Income Trust | | | 460,345 | |
| | 221,136 | | | Putnam Premier Income Trust(L) | | | 1,331,239 | |
| | 73,600 | | | Western Asset/Claymore US Treasury(L) | | | 903,072 | |
| | 72,500 | | | Western Asset/Claymore US Treasury Inflation Protected Securities Fund 2 | | | 898,275 | |
| | | | | | | | | |
| | | | | Total Closed-end Investment Companies
(Cost $6,897,603) | | | 7,147,060 | |
| | | | | | | | | |
| |
CASH EQUIVALENT (11.2%) |
| | 55,721,945 | | | JP Morgan Cash Trade Execution(d) | | | 55,721,945 | |
| | | | | | | | | |
| | | | | Total Cash Equivalent
(Cost $55,721,945) | | | 55,721,945 | |
| | | | | | | | | |
| |
INVESTMENTS HELD AS COLLATERAL FOR LOANED SECURITIES (2.2%) |
| | $7,000,000 | | | Barclays Capital Repurchase Agreement ABS, 2.70%, 07/01/08 (Purchased on 06/30/08, proceeds at maturity $7,000,525, collateralized by various corporate bonds, fair value $7,350,000) | | | 7,000,000 | |
| | 366,478 | | | CWL 2006-14 2A1ABS, 2.53%, 09/05/08(c) | | | 366,478 | |
| | 1,412,505 | | | Deutsche Bank Securities Inc. Repurchase Agreement, 2.50%, 07/01/08 (Purchased on 06/30/08, proceeds at maturity $1,412,603, collateralized by various corporate bonds, fair value $1,440,756) | | | 1,412,505 | |
| | 2,000,000 | | | Santander U.S. Debt SA MTN, 2.73%, 11/20/09(c) | | | 2,000,000 | |
| | | | | | | | | |
| | | | | Total Investments Held As Collateral For Loaned Securities
(Cost $10,778,983) | | | 10,778,983 | |
| | | | | | | | | |
Total Investments — (110.0%) | | | | |
| (Cost $565,991,836) | | | $546,057,855 | |
Liabilities in excess of other assets — (10.0)% | | | (49,732,521 | ) |
| | | | | |
TOTAL NET ASSETS — 100.0% | | | $496,325,334 | |
| | | | | |
| | | | | | | | | |
| | |
| (a) | | Security purchased on a when-issued or delayed delivery basis. |
| (b) | | Security exempt from registration under Rule 144A of the Securities Act of 1933 or otherwise restricted as to resale. These securities may be resold in transactions exempt from registration, normally for qualified buyers. The Adviser, using procedures approved by the Board of Trustees, has deemed these securities to be liquid. |
| (c) | | Variable or Floating Rate Security. Rate disclosed is as of June 30, 2008. |
| (d) | | All or a portion of this security has been segregated as collateral for securities purchased on a when-issued or delayed delivery basis. |
| (L) | | A portion or all of the security is on loan. |
| ABS | | Asset Backed Security. |
| LP | | Limited Partnership. |
| MTN | | Medium Term Note. |
| PLC | | Public Liability Company |
The accompanying notes are an integral part of these financial statements.
17
portfolio of investments (continued)
NEW COVENANT BALANCED GROWTH FUND
June 30, 2008
| | | | | | | | | |
|
| Shares | | Value |
|
| |
INVESTMENT COMPANIES (98.3%): |
| | 5,798,140 | | | New Covenant Growth Fund(a) | | | $185,250,587 | |
| | 4,844,231 | | | New Covenant Income Fund(a) | | | 114,953,608 | |
| | | | | | | | | |
| | | | | Total Investment Companies
(Cost $278,028,078) | | | 300,204,195 | |
| | | | | | | | | |
| |
CASH EQUIVALENTS (1.1%): |
| | 3,353,857 | | | JP Morgan Cash Trade Execution | | | 3,353,857 | |
| | | | | | | | | |
| | | | | Total Cash Equivalents
(Cost $3,353,857) | | | 3,353,857 | |
| | | | | | | | | |
| | | | | |
TOTAL INVESTMENTS — (99.4%) | | | | |
| (Cost $281,381,935) | | | $303,558,052 | |
Other Assets in Excess of Liabilities — (0.6)% | | | 1,736,194 | |
| | | | | |
NET ASSETS — 100.00% | | | $305,294,246 | |
| | | | | |
| | |
| (a) | | Investment in affiliate. |
NEW COVENANT BALANCED INCOME FUND
June 30, 2008
| | | | | | | | | |
| |
| Shares | | Value | |
| |
| |
INVESTMENT COMPANIES (96.9%): |
| | 1,153,258 | | | New Covenant Growth Fund(a) | | | $36,846,584 | |
| | 2,637,195 | | | New Covenant Income Fund(a) | | | 62,580,635 | |
| | | | | | | | | |
| | | | | Total Investment Companies | | | | |
| | | | | (Cost $93,659,259) | | | 99,427,219 | |
| | | | | | | | | |
| |
CASH EQUIVALENTS (2.5%): |
| | 2,580,038 | | | JP Morgan Cash Trade Execution | | | 2,580,038 | |
| | | | | | | | | |
| | | | | Total Cash Equivalents | | | | |
| | | | | (Cost $2,580,038) | | | 2,580,038 | |
| | | | | | | | | |
| | | | | |
TOTAL INVESTMENTS — (99.4%) | | | | |
| (Cost $96,239,297) | | | $102,007,257 | |
Other Assets in Excess of Liabilities — (0.6)% | | | 649,675 | |
| | | | | |
TOTAL NET ASSETS — 100.00% | | | $102,656,932 | |
| | | | | |
| | |
| (a) | | Investment in affiliate. |
The accompanying notes are an integral part of these financial statements.
18
statements of assets and liabilities
NEW COVENANT FUNDS
June 30, 2008
| | | | | | | | | | | | | | | | | |
| | | | | | | Balanced
| | Balanced
|
| | | Growth Fund | | Income Fund | | Growth Fund | | Income Fund |
|
| |
ASSETS: | | | | | | | | | | | | | | | | |
| Investments, at value (Cost $883,591,114, $565,991,836, $3,353,857 and $2,580,038, respectively)(a) | | | $937,912,687 | | | | $546,057,855 | | | | $3,353,857 | | | | $2,580,038 | |
| Investments in affiliates, at value (Cost $0, $0, $278,028,078 and $93,659,259, respectively) | | | — | | | | — | | | | 300,204,195 | | | | 99,427,219 | |
| Foreign currency, at value (cost $255,992, $0, $0, $0, respectively) | | | 255,361 | | | | — | | | | — | | | | — | |
| Interest and dividends receivable | | | 1,017,616 | | | | 3,772,212 | | | | 1,971,622 | | | | 853,671 | |
| Receivable for capital shares issued | | | 200 | | | | 100 | | | | 1,093 | | | | 327 | |
| Receivable for investments sold | | | 3,614,872 | | | | 28,883,531 | | | | — | | | | — | |
| Receivable from Adviser | | | — | | | | — | | | | 61,414 | | | | 20,873 | |
| Reclaims receivable | | | 17,019 | | | | 12,939 | | | | — | | | | — | |
| Prepaid expenses | | | 7,366 | | | | 4,339 | | | | 5,090 | | | | 1,696 | |
| | | | | | | | | | | | | | | | | |
| Total Assets | | | 942,825,121 | | | | 578,730,976 | | | | 305,597,271 | | | | 102,883,824 | |
| | | | | | | | | | | | | | | | | |
| | | | | | | | | | | | | | | | | |
LIABILITIES: | | | | | | | | | | | | | | | | |
| Payable for investments purchased | | | 3,356,069 | | | | 71,128,171 | | | | — | | | | — | |
| Payable for capital shares redeemed | | | 156,465 | | | | 101,419 | | | | 155,300 | | | | 169,674 | |
| Payable for return of collateral received on securities loaned | | | 101,946,195 | | | | 10,778,983 | | | | — | | | | — | |
| Cash overdraft | | | 326,390 | | | | 57,583 | | | | — | | | | — | |
| Accrued expenses and other payables: | | | | | | | | | | | | | | | | |
| Investment advisory | | | 477,348 | | | | 97,653 | | | | — | | | | — | |
| Administration | | | 21,764 | | | | 12,868 | | | | 8,002 | | | | 2,666 | |
| Shareholder service | | | 263,125 | | | | 128,121 | | | | 64,643 | | | | 20,083 | |
| Transfer agent | | | 8,076 | | | | 9,479 | | | | 25,628 | | | | 12,092 | |
| Accounting | | | 23,111 | | | | 12,544 | | | | 9,026 | | | | 5,002 | |
| Chief Compliance Officer | | | 12,604 | | | | 7,491 | | | | 4,631 | | | | 1,608 | |
| Other | | | 147,621 | | | | 71,330 | | | | 35,795 | | | | 15,767 | |
| | | | | | | | | | | | | | | | | |
| Total Liabilities | | | 106,738,768 | | | | 82,405,642 | | | | 303,025 | | | | 226,892 | |
| | | | | | | | | | | | | | | | | |
| | | | | | | | | | | | | | | | | |
NET ASSETS | | | $836,086,353 | | | | $496,325,334 | | | | $305,294,246 | | | | $102,656,932 | |
| | | | | | | | | | | | | | | | | |
NET ASSETS consist of: | | | | | | | | | | | | | | | | |
| Capital | | | 800,243,951 | | | | 525,535,696 | | | | 294,940,649 | | | | 99,108,089 | |
| Undistributed (distributions in excess of) net investment income | | | (502,255 | ) | | | 452,350 | | | | — | | | | — | |
| Accumulated net realized losses from investment and foreign currency transactions | | | (17,983,772 | ) | | | (9,728,731 | ) | | | (11,822,520 | ) | | | (2,219,117 | ) |
| Net unrealized appreciation (depreciation) on investment transactions and translation of assets and liabilities denominated in foreign currency | | | 54,328,429 | | | | (19,933,981 | ) | | | 22,176,117 | | | | 5,767,960 | |
| | | | | | | | | | | | | | | | | |
| Net Assets | | | $836,086,353 | | | | $496,325,334 | | | | $305,294,246 | | | | $102,656,932 | |
| | | | | | | | | | | | | | | | | |
| | | | | | | | | | | | | | | | | |
| Shares Outstanding | | | 26,170,685 | | | | 20,912,289 | | | | 3,701,081 | | | | 5,399,925 | |
| Net asset value, offering price and redemption price per share | | | $31.95 | | | | $23.73 | | | | $82.49 | | | | $19.01 | |
| | |
| (a) | | Includes value of securities on loan of $96,849,624, $10,461,791, $0 and $0, respectively. |
The accompanying notes are an integral part of these financial statements.
19
statements of operations
NEW COVENANT FUNDS
For the year ended June 30, 2008
| | | | | | | | | | | | | | | | | |
| | | | | | | Balanced
| | Balanced
|
| | | Growth Fund | | Income Fund | | Growth Fund | | Income Fund |
|
| |
INVESTMENT INCOME: | | | | | | | | | | | | | | | | |
| Interest | | | $725,689 | | | | $28,831,407 | | | | $178,414 | | | | $66,235 | |
| Dividend | | | 16,435,226 | | | | 523,613 | | | | — | | | | — | |
| Dividend income from affiliates | | | — | | | | — | | | | 7,211,132 | | | | 3,482,728 | |
| Foreign tax withholding | | | (340,775 | ) | | | — | | | | — | | | | — | |
| Income from securities lending | | | 168,215 | | | | 12,293 | | | | — | | | | — | |
| | | | | | | | | | | | | | | | | |
| Total Investment Income | | | 16,988,355 | | | | 29,367,313 | | | | 7,389,546 | | | | 3,548,963 | |
| | | | | | | | | | | | | | | | | |
| | | | | | | | | | | | | | | | | |
EXPENSES (Note 3): | | | | | | | | | | | | | | | | |
| Investment advisory | | | 9,301,746 | | | | 3,995,194 | | | | — | | | | — | |
| Shareholder servicing | | | 1,711,159 | | | | 814,348 | | | | 812,246 | | | | 276,832 | |
| Other | | | 333,436 | | | | 210,582 | | | | 145,377 | | | | 69,564 | |
| Accounting | | | 270,226 | | | | 159,976 | | | | 84,936 | | | | 31,947 | |
| Custodian | | | 165,974 | | | | 16,592 | | | | 8,906 | | | | 1,283 | |
| Administration | | | 104,757 | | | | 59,360 | | | | 37,352 | | | | 12,575 | |
| Transfer agent | | | 87,591 | | | | 76,277 | | | | 211,114 | | | | 103,608 | |
| Chief Compliance Officer | | | 29,159 | | | | 17,711 | | | | 10,562 | | | | 2,973 | |
| | | | | | | | | | | | | | | | | |
| Total expenses before contractual fee reductions | | | 12,004,048 | | | | 5,350,040 | | | | 1,310,493 | | | | 498,782 | |
| Expenses contractually reduced by Adviser | | | (1,697,708 | ) | | | (857,855 | ) | | | (810,665 | ) | | | (277,105 | ) |
| | | | | | | | | | | | | | | | | |
| Total expenses | | | 10,306,340 | | | | 4,492,185 | | | | 499,828 | | | | 221,677 | |
| | | | | | | | | | | | | | | | | |
NET INVESTMENT INCOME | | | 6,682,015 | | | | 24,875,128 | | | | 6,889,718 | | | | 3,327,286 | |
| | | | | | | | | | | | | | | | | |
| | | | | | | | | | | | | | | | | |
REALIZED AND UNREALIZED GAINS (LOSSES) FROM INVESTMENTS AND FOREIGN CURRENCY TRANSACTIONS | | | | | | | | | | | | | | | | |
| Net realized gains (losses) on investment transactions | | | 13,512,707 | | | | (1,484,526 | ) | | | 1,460,253 | | | | 804,143 | |
| Net realized losses on foreign currency transactions | | | (111,720 | ) | | | — | | | | — | | | | — | |
| Capital gain distributions from regulated investment companies | | | — | | | | — | | | | 11,104,348 | † | | | 2,255,957 | † |
| Net change in unrealized appreciation/depreciation on investments and foreign currency transactions | | | (143,982,348 | ) | | | (14,848,719 | ) | | | (43,833,206 | ) | | | (10,660,838 | ) |
| | | | | | | | | | | | | | | | | |
| Net realized/unrealized losses from investments and foreign currency transactions | | | (130,581,361 | ) | | | (16,333,245 | ) | | | (31,268,605 | ) | | | (7,600,738 | ) |
| | | | | | | | | | | | | | | | | |
| Change in net assets resulting from operations | | | $(123,899,346 | ) | | | $8,541,883 | | | | $(24,378,887 | ) | | | $(4,273,452 | ) |
| | | | | | | | | | | | | | | | | |
| | |
| † | | Represents realized gains (losses) from investment transactions with affiliates. |
The accompanying notes are an integral part of these financial statements.
20
statements of changes in net assets
NEW COVENANT FUNDS
| | | | | | | | | | | | | | | | | |
| | | | | |
| | | Growth Fund | | Income Fund |
| | | For the year
| | For the year
| | For the year
| | For the year
|
| | | ended
| | ended
| | ended
| | ended
|
| | | June 30, 2008 | | June 30, 2007 | | June 30, 2008 | | June 30, 2007 |
| |
OPERATIONS: | | | | | | | | | | | | | | | | |
| Net investment income | | | $6,682,015 | | | | $7,031,244 | | | | $24,875,128 | | | | $24,148,842 | |
| Net realized gains (losses) from investment and foreign currency transactions | | | 13,400,987 | | | | 76,717,411 | | | | (1,484,526 | ) | | | (1,186,020 | ) |
| Net change in unrealized appreciation (depreciation) on investments and translation of assets and liabilities in foreign currency | | | (143,982,348 | ) | | | 89,808,372 | | | | (14,848,719 | ) | | | 6,308,382 | |
| | | | | | | | | | | | | | | | | |
| Change in net assets resulting from operations | | | (123,899,346 | ) | | | 173,557,027 | | | | 8,541,883 | | | | 29,271,204 | |
| | | | | | | | | | | | | | | | | |
| | | | | | | | | | | | | | | | | |
DISTRIBUTIONS TO SHAREHOLDERS: | | | | | | | | | | | | | | | | |
| From net investment income | | | (6,213,533 | ) | | | (7,673,788 | ) | | | (24,383,715 | ) | | | (24,215,086 | ) |
| From net realized gains on investments | | | (50,587,280 | ) | | | — | | | | — | | | | — | |
| Tax return of capital | | | (583,333 | ) | | | — | | | | — | | | | (94,148 | ) |
| | | | | | | | | | | | | | | | | |
| Change in net assets from distributions to shareholders | | | (57,384,146 | ) | | | (7,673,788 | ) | | | (24,383,715 | ) | | | (24,309,234 | ) |
| | | | | | | | | | | | | | | | | |
| | | | | | | | | | | | | | | | | |
CAPITAL TRANSACTIONS: | | | | | | | | | | | | | | | | |
| Proceeds from shares issued | | | 79,145,233 | | | | 54,842,359 | | | | 57,836,439 | | | | 59,306,070 | |
| Dividends reinvested | | | 37,621,232 | | | | 388,217 | | | | 4,783,382 | | | | 1,720,299 | |
| Cost of shares redeemed | | | (132,932,426 | ) | | | (93,587,641 | ) | | | (87,797,578 | ) | | | (55,001,994 | ) |
| | | | | | | | | | | | | | | | | |
| Change in net assets from capital transactions | | | (16,165,961 | ) | | | (38,357,065 | ) | | | (25,177,757 | ) | | | 6,024,375 | |
| | | | | | | | | | | | | | | | | |
| Change in net assets | | | (197,449,453 | ) | | | 127,526,174 | | | | (41,019,589 | ) | | | 10,986,345 | |
| | | | | | | | | | | | | | | | | |
| | | | | | | | | | | | | | | | | |
NET ASSETS: | | | | | | | | | | | | | | | | |
| Beginning of year | | | 1,033,535,806 | | | | 906,009,632 | | | | 537,344,923 | | | | 526,358,578 | |
| | | | | | | | | | | | | | | | | |
| End of year | | | $836,086,353 | | | | $1,033,535,806 | | | | $496,325,334 | | | | $537,344,923 | |
| | | | | | | | | | | | | | | | | |
| | | | | | | | | | | | | | | | | |
SHARE TRANSACTIONS: | | | | | | | | | | | | | | | | |
| Issued | | | 2,172,726 | | | | 1,510,806 | | | | 2,329,879 | | | | 2,380,735 | |
| Reinvested | | | 1,063,966 | | | | 16,552 | | | | 194,341 | | | | 68,972 | |
| Redeemed | | | (3,635,350 | ) | | | (2,617,340 | ) | | | (3,528,009 | ) | | | (2,209,197 | ) |
| | | | | | | | | | | | | | | | | |
| Net increase (decrease) | | | (398,658 | ) | | | (1,089,982 | ) | | | (1,003,789 | ) | | | 240,510 | |
| | | | | | | | | | | | | | | | | |
| | | | | | | | | | | | | | | | | |
| Undistributed (distributions in excess of) net investment income | | | $(502,255 | ) | | | $(1,039,525 | ) | | | $452,350 | | | | $— | |
| | | | | | | | | | | | | | | | | |
The accompanying notes are an integral part of these financial statements.
21
statements of changes in net assets
NEW COVENANT FUNDS
| | | | | | | | | | | | | | | | | |
| | | | | |
| | | Balanced Growth Fund | | Balanced Income Fund |
| | | For the year
| | For the year
| | For the year
| | For the year
|
| | | ended
| | ended
| | ended
| | ended
|
| | | June 30, 2008 | | June 30, 2007 | | June 30, 2008 | | June 30, 2007 |
| |
OPERATIONS: | | | | | | | | | | | | | | | | |
| Net investment income | | | $6,889,718 | | | | $7,056,369 | | | | $3,327,286 | | | | $3,612,926 | |
| Net realized gains from investment and foreign currency transactions | | | 12,564,601 | † | | | 743,569 | † | | | 3,060,100 | † | | | 705,478 | † |
| Net change in unrealized appreciation (depreciation) on investments and translation of assets and liabilities in foreign currency | | | (43,833,206 | ) | | | 36,095,796 | | | | (10,660,838 | ) | | | 8,136,242 | |
| | | | | | | | | | | | | | | | | |
| Change in net assets resulting from operations | | | (24,378,887 | ) | | | 43,895,734 | | | | (4,273,452 | ) | | | 12,454,646 | |
| | | | | | | | | | | | | | | | | |
| | | | | | | | | | | | | | | | | |
DISTRIBUTIONS TO SHAREHOLDERS: | | | | | | | | | | | | | | | | |
| From net investment income | | | (6,897,814 | ) | | | (7,052,751 | ) | | | (3,327,286 | ) | | | (3,613,264 | ) |
| Tax return of capital | | | — | | | | — | | | | (4,188 | ) | | | (3,119 | ) |
| | | | | | | | | | | | | | | | | |
| Change in net assets from distributions to shareholders | | | (6,897,814 | ) | | | (7,052,751 | ) | | | (3,331,474 | ) | | | (3,616,383 | ) |
| | | | | | | | | | | | | | | | | |
| | | | | | | | | | | | | | | | | |
CAPITAL TRANSACTIONS: | | | | | | | | | | | | | | | | |
| Proceeds from shares issued | | | 28,451,471 | | | | 28,542,412 | | | | 5,908,103 | | | | 5,503,331 | |
| Dividends reinvested | | | 5,431,198 | | | | 5,379,927 | | | | 2,087,756 | | | | 2,225,098 | |
| Cost of shares redeemed | | | (50,655,654 | ) | | | (29,498,444 | ) | | | (19,589,213 | ) | | | (17,223,826 | ) |
| | | | | | | | | | | | | | | | | |
| Change in net assets from capital transactions | | | (16,772,985 | ) | | | 4,423,895 | | | | (11,593,354 | ) | | | (9,495,397 | ) |
| | | | | | | | | | | | | | | | | |
| Change in net assets | | | (48,049,686 | ) | | | 41,266,878 | | | | (19,198,280 | ) | | | (657,134 | ) |
| | | | | | | | | | | | | | | | | |
| | | | | | | | | | | | | | | | | |
NET ASSETS: | | | | | | | | | | | | | | | | |
| Beginning of year | | | 353,343,932 | | | | 312,077,054 | | | | 121,855,212 | | | | 122,512,346 | |
| | | | | | | | | | | | | | | | | |
| End of year | | | $305,294,246 | | | | $353,343,932 | | | | $102,656,932 | | | | $121,855,212 | |
| | | | | | | | | | | | | | | | | |
| | | | | | | | | | | | | | | | | |
SHARE TRANSACTIONS: | | | | | | | | | | | | | | | | |
| Issued | | | 321,476 | | | | 327,193 | | | | 292,233 | | | | 274,677 | |
| Reinvested | | | 62,912 | | | | 61,468 | | | | 105,772 | | | | 111,204 | |
| Redeemed | | | (572,086 | ) | | | (338,514 | ) | | | (971,203 | ) | | | (865,752 | ) |
| | | | | | | | | | | | | | | | | |
| Net increase (decrease) | | | (187,698 | ) | | | 50,147 | | | | (573,198 | ) | | | (479,871 | ) |
| | | | | | | | | | | | | | | | | |
| | | | | | | | | | | | | | | | | |
| Undistributed net investment income | | | $— | | | | $3,618 | | | | $— | | | | $— | |
| | | | | | | | | | | | | | | | | |
| | |
| † | | Represents realized gains (losses) from investment transactions with affiliates. |
The accompanying notes are an integral part of these financial statements.
22
financial highlights
NEW COVENANT FUNDS
For a Share outstanding throughout the year
| | | | | | | | | | | | | | | | | | | | | |
| |
| | | Growth Fund |
| |
| | | For the year
| | For the year
| | For the year
| | For the year
| | For the year
|
| | | ended
| | ended
| | ended
| | ended
| | ended
|
| | | June 30,
| | June 30,
| | June 30,
| | June 30,
| | June 30,
|
| | | 2008 | | 2007 | | 2006 | | 2005 | | 2004 |
| |
| Net Asset Value, Beginning of Year | | | $38.90 | | | | $32.76 | | | | $29.92 | | | | $28.07 | | | | $23.51 | |
| | | | | | | | | | | | | | | | | | | | | |
| | | | | | | | | | | | | | | | | | | | | |
INVESTMENT ACTIVITIES: | | | | | | | | | | | | | | | | | | | | |
| Net investment income | | | 0.26 | | | | 0.26 | | | | 0.18 | | | | 0.21 | | | | 0.07 | |
| Net realized and unrealized gains (losses) on investments and foreign currency transactions | | | (4.98 | ) | | | 6.17 | | | | 2.86 | | | | 1.85 | | | | 4.58 | |
| | | | | | | | | | | | | | | | | | | | | |
| Total from Investment Activities | | | (4.72 | ) | | | 6.43 | | | | 3.04 | | | | 2.06 | | | | 4.65 | |
| | | | | | | | | | | | | | | | | | | | | |
| | | | | | | | | | | | | | | | | | | | | |
DIVIDENDS: | | | | | | | | | | | | | | | | | | | | |
| Net investment income | | | (0.24 | ) | | | (0.29 | ) | | | (0.20 | ) | | | (0.21 | ) | | | (0.09 | ) |
| Net realized gains | | | (1.97 | ) | | | — | | | | — | | | | — | | | | — | |
| Tax return of capital | | | (0.02 | ) | | | — | | | | — | | | | — | | | | — | |
| | | | | | | | | | | | | | | | | | | | | |
| Total Dividends | | | (2.23 | ) | | | (0.29 | ) | | | (0.20 | ) | | | (0.21 | ) | | | (0.09 | ) |
| | | | | | | | | | | | | | | | | | | | | |
| | | | | | | | | | | | | | | | | | | | | |
| Change in net asset value per share | | | (6.95 | ) | | | 6.14 | | | | 2.84 | | | | 1.85 | | | | 4.56 | |
| | | | | | | | | | | | | | | | | | | | | |
Net Asset Value, End of Year | | | $31.95 | | | | $38.90 | | | | $32.76 | | | | $29.92 | | | | $28.07 | |
| | | | | | | | | | | | | | | | | | | | | |
| | | | | | | | | | | | | | | | | | | | | |
| Total Return | | | (12.61)% | | | | 19.68% | | | | 10.17% | | | | 7.38% | | | | 19.81% | |
| | | | | | | | | | | | | | | | | | | | | |
RATIOS/SUPPLEMENTARY DATA: | | | | | | | | | | | | | | | | | | | | |
| Net assets at end of year (in 000’s) | | | $836,086 | | | | $1,033,536 | | | | $906,010 | | | | $878,583 | | | | $834,575 | |
| Ratio of expenses to average net assets | | | 1.10% | | | | 1.08% | | | | 1.07% | | | | 1.11% | | | | 1.13% | |
| Ratio of net investment income to average net assets | | | 0.73% | | | | 0.73% | | | | 0.58% | | | | 0.75% | | | | 0.32% | |
| Ratio of expenses to average net assets(a) | | | 1.29% | | | | 1.28% | | | | 1.28% | | | | 1.36% | | | | 1.39% | |
| Ratio of net investment income to average net assets(a) | | | 0.54% | | | | 0.53% | | | | 0.37% | | | | 0.50% | | | | 0.06% | |
| Portfolio turnover rate | | | 65% | | | | 65% | | | | 51% | | | | 76% | | | | 94% | |
| | |
| (a) | | Ratios excluding waivers. |
The accompanying notes are an integral part of these financial statements.
23
financial highlights
NEW COVENANT FUNDS
For a Share outstanding throughout the year
| | | | | | | | | | | | | | | | | | | | | |
| |
| | | Income Fund |
| |
| | | For the year
| | For the year
| | For the year
| | For the year
| | For the year
|
| | | ended
| | ended
| | ended
| | ended
| | ended
|
| | | June 30,
| | June 30,
| | June 30,
| | June 30,
| | June 30,
|
| | | 2008 | | 2007 | | 2006 | | 2005 | | 2004 |
| |
| Net Asset Value, Beginning of Year | | | $24.52 | | | | $24.28 | | | | $25.56 | | | | $25.17 | | | | $26.62 | |
| | | | | | | | | | | | | | | | | | | | | |
| | | | | | | | | | | | | | | | | | | | | |
INVESTMENT ACTIVITIES: | | | | | | | | | | | | | | | | | | | | |
| Net investment income | | | 1.16 | | | | 1.12 | | | | 1.00 | | | | 0.94 | | | | 0.96 | |
| Net realized and unrealized gains (losses) on investments(a) | | | (0.81 | ) | | | 0.25 | | | | (1.23 | ) | | | 0.55 | | | | (0.96 | ) |
| | | | | | | | | | | | | | | | | | | | | |
| Total from Investment Activities | | | 0.35 | | | | 1.37 | | | | (0.23 | ) | | | 1.49 | | | | — | |
| | | | | | | | | | | | | | | | | | | | | |
| | | | | | | | | | | | | | | | | | | | | |
DIVIDENDS: | | | | | | | | | | | | | | | | | | | | |
| Net investment income | | | (1.14 | ) | | | (1.13 | ) | | | (1.04 | ) | | | (1.04 | ) | | | (0.90 | ) |
| Net realized gains | | | — | | | | — | | | | (0.01 | ) | | | (0.06 | ) | | | (0.44 | ) |
| Tax return of capital | | | — | | | | — | * | | | — | * | | | — | | | | (0.11 | ) |
| | | | | | | | | | | | | | | | | | | | | |
| Total Dividends | | | (1.14 | ) | | | (1.13 | ) | | | (1.05 | ) | | | (1.10 | ) | | | (1.45 | ) |
| | | | | | | | | | | | | | | | | | | | | |
| | | | | | | | | | | | | | | | | | | | | |
| Change in net asset value per share | | | (0.79 | ) | | | 0.24 | | | | (1.28 | ) | | | 0.39 | | | | (1.45 | ) |
| | | | | | | | | | | | | | | | | | | | | |
Net Asset Value, End of Year | | | $23.73 | | | | $24.52 | | | | $24.28 | | | | $25.56 | | | | $25.17 | |
| | | | | | | | | | | | | | | | | | | | | |
| | | | | | | | | | | | | | | | | | | | | |
| Total Return | | | 1.36% | | | | 5.65% | | | | (0.90)% | | | | 6.02% | | | | 0.00% | |
| | | | | | | | | | | | | | | | | | | | | |
RATIOS/SUPPLEMENTARY DATA: | | | | | | | | | | | | | | | | | | | | |
| Net assets at end of year (in 000’s) | | | $496,325 | | | | $537,345 | | | | $526,359 | | | | $527,208 | | | | $524,025 | |
| Ratio of expenses to average net assets | | | 0.85% | | | | 0.84% | | | | 0.84% | | | | 0.86% | | | | 0.86% | |
| Ratio of net investment income to average net assets | | | 4.70% | | | | 4.49% | | | | 4.04% | | | | 3.68% | | | | 3.70% | |
| Ratio of expenses to average net assets(a) | | | 1.01% | | | | 1.01% | | | | 1.01% | | | | 1.08% | | | | 1.11% | |
| Ratio of net investment income to average net assets(a) | | | 4.54% | | | | 4.32% | | | | 3.87% | | | | 3.46% | | | | 3.45% | |
| Portfolio turnover rate | | | 170% | | | | 258% | | | | 263% | | | | 206% | | | | 242% | |
| | |
| * | | Less than $0.005. |
| (a) | | Ratios excluding waivers. |
The accompanying notes are an integral part of these financial statements.
24
financial highlights
NEW COVENANT FUNDS
For a Share outstanding throughout the year
| | | | | | | | | | | | | | | | | | | | | |
| |
| | | Balanced Growth Fund |
| |
| | | For the year
| | For the year
| | For the year
| | For the year
| | For the year
|
| | | ended
| | ended
| | ended
| | ended
| | ended
|
| | | June 30,
| | June 30,
| | June 30,
| | June 30,
| | June 30,
|
| | | 2008 | | 2007 | | 2006 | | 2005 | | 2004 |
| |
| Net Asset Value, Beginning of Year | | | $90.86 | | | | $81.30 | | | | $78.20 | | | | $74.65 | | | | $67.88 | |
| | | | | | | | | | | | | | | | | | | | | |
| | | | | | | | | | | | | | | | | | | | | |
INVESTMENT ACTIVITIES: | | | | | | | | | | | | | | | | | | | | |
| Net investment income(a) | | | 1.83 | | | | 1.83 | | | | 1.52 | | | | 1.41 | | | | 1.34 | |
| Net realized and unrealized gains (losses) on investments(a) | | | (8.37 | ) | | | 9.56 | | | | 3.10 | | | | 3.54 | | | | 6.73 | |
| | | | | | | | | | | | | | | | | | | | | |
| Total from Investment Activities | | | (6.54 | ) | | | 11.39 | | | | 4.62 | | | | 4.95 | | | | 8.07 | |
| | | | | | | | | | | | | | | | | | | | | |
| | | | | | | | | | | | | | | | | | | | | |
DIVIDENDS: | | | | | | | | | | | | | | | | | | | | |
| Net investment income | | | (1.83 | ) | | | (1.83 | ) | | | (1.52 | ) | | | (1.40 | ) | | | (1.23 | ) |
| Net realized gains | | | — | | | | — | | | | — | | | | — | | | | — | |
| Tax return of capital | | | — | | | | — | | | | — | * | | | — | | | | (0.07 | ) |
| | | | | | | | | | | | | | | | | | | | | |
| Total Dividends | | | (1.83 | ) | | | (1.83 | ) | | | (1.52 | ) | | | (1.40 | ) | | | (1.30 | ) |
| | | | | | | | | | | | | | | | | | | | | |
| | | | | | | | | | | | | | | | | | | | | |
| Change in net asset value per share | | | (8.37 | ) | | | 9.56 | | | | 3.10 | | | | 3.55 | | | | 6.77 | |
| | | | | | | | | | | | | | | | | | | | | |
Net Asset Value, End of Year | | | $82.49 | | | | $90.86 | | | | $81.30 | | | | $78.20 | | | | $74.65 | |
| | | | | | | | | | | | | | | | | | | | | |
| | | | | | | | | | | | | | | | | | | | | |
| Total Return | | | (7.26)% | | | | 14.11% | | | | 5.93% | | | | 6.68% | | | | 11.95% | |
| | | | | | | | | | | | | | | | | | | | | |
RATIOS/SUPPLEMENTARY DATA: | | | | | | | | | | | | | | | | | | | | |
| Net assets at end of year (in 000’s) | | | $305,294 | | | | $353,344 | | | | $312,077 | | | | $305,524 | | | | $302,446 | |
| Ratio of expenses to average net assets | | | 0.15% | | | | 0.12% | | | | 0.12% | | | | 0.14% | | | | 0.15% | |
| Ratio of net investment income to average net assets | | | 2.07% | | | | 2.11% | | | | 1.85% | | | | 1.83% | | | | 1.52% | |
| Ratio of expenses to average net assets(b) | | | 0.39% | | | | 0.37% | | | | 0.38% | | | | 0.22% | | | | 0.15% | |
| Ratio of net investment income to average net assets(b) | | | 1.83% | | | | 1.86% | | | | 1.59% | | | | 1.75% | | | | 1.52% | |
| Portfolio turnover rate | | | 17% | | | | 7% | | | | 10% | | | | 5% | | | | 12% | |
| | |
| * | | Less than $0.005. |
| (a) | | Includes income or gains (losses) from affiliates. |
| (b) | | Ratios excluding waivers. |
The accompanying notes are an integral part of these financial statements.
25
financial highlights
NEW COVENANT FUNDS
For a Share outstanding throughout the year.
| | | | | | | | | | | | | | | | | | | | | |
| |
| | | Balanced Income Fund |
| |
| | | For the year
| | For the year
| | For the year
| | For the year
| | For the year
|
| | | ended
| | ended
| | ended
| | ended
| | ended
|
| | | June 30,
| | June 30,
| | June 30,
| | June 30,
| | June 30,
|
| | | 2008 | | 2007 | | 2006 | | 2005 | | 2004 |
| |
| Net Asset Value, Beginning of Year | | | $20.40 | | | | $18.99 | | | | $18.90 | | | | $18.24 | | | | $17.52 | |
| | | | | | | | | | | | | | | | | | | | | |
| | | | | | | | | | | | | | | | | | | | | |
INVESTMENT ACTIVITIES: | | | | | | | | | | | | | | | | | | | | |
| Net investment income(a) | | | 0.60 | | | | 0.59 | �� | | | 0.52 | | | | 0.48 | | | | 0.53 | |
| Net realized and unrealized gains (losses) on investments(a) | | | (1.39 | ) | | | 1.41 | | | | 0.09 | | | | 0.66 | | | | 0.70 | |
| | | | | | | | | | | | | | | | | | | | | |
| Total from Investment Activities | | | (0.79 | ) | | | 2.00 | | | | 0.61 | | | | 1.14 | | | | 1.23 | |
| | | | | | | | | | | | | | | | | | | | | |
| | | | | | | | | | | | | | | | | | | | | |
DIVIDENDS: | | | | | | | | | | | | | | | | | | | | |
| Net investment income | | | (0.60 | ) | | | (0.59 | ) | | | (0.52 | ) | | | (0.48 | ) | | | (0.48 | ) |
| Net realized gains | | | — | | | | — | | | | — | | | | — | | | | — | |
| Tax return of capital | | | — | | | | — | * | | | — | | | | — | | | | (0.03 | ) |
| | | | | | | | | | | | | | | | | | | | | |
| Total Dividends | | | (0.60 | ) | | | (0.59 | ) | | | (0.52 | ) | | | (0.48 | ) | | | (0.51 | ) |
| | | | | | | | | | | | | | | | | | | | | |
| | | | | | | | | | | | | | | | | | | | | |
| Change in net asset value per share | | | (1.39 | ) | | | 1.41 | | | | 0.09 | | | | 0.66 | | | | 0.72 | |
| | | | | | | | | | | | | | | | | | | | | |
Net Asset Value, End of Year | | | $19.01 | | | | $20.40 | | | | $18.99 | | | | $18.90 | | | | $18.24 | |
| | | | | | | | | | | | | | | | | | | | | |
| | | | | | | | | | | | | | | | | | | | | |
| Total Return | | | (3.95 | )% | | | 10.65% | | | | 3.26% | | | | 6.32% | | | | 7.07% | |
| | | | | | | | | | | | | | | | | | | | | |
RATIOS/SUPPLEMENTARY DATA: | | | | | | | | | | | | | | | | | | | | |
| Net assets at end of year (in 000’s) | | | $102,657 | | | | $121,855 | | | | $122,512 | | | | $124,809 | | | | $124,915 | |
| Ratio of expenses to average net assets | | | 0.20% | | | | 0.15% | | | | 0.15% | | | | 0.17% | | | | 0.18% | |
| Ratio of net investment income to average net assets | | | 2.97% | | | | 2.95% | | | | 2.71% | | | | 2.58% | | | | 2.34% | |
| Ratio of expenses to average net assets(b) | | | 0.44% | | | | 0.40% | | | | 0.41% | | | | 0.25% | | | | 0.18% | |
| Ratio of net investment income to average net assets(b) | | | 2.73% | | | | 2.70% | | | | 2.45% | | | | 2.50% | | | | 2.34% | |
| Portfolio turnover rate | | | 10% | | | | 7% | | | | 13% | | | | 6% | | | | 12% | |
| | |
| * | | Less than $0.005. |
| (a) | | Includes income or gains (losses) from affiliates. |
| (b) | | Ratios excluding waivers. |
The accompanying notes are an integral part of these financial statements.
26
notes to financial statements
NEW COVENANT FUNDS
June 30, 2008
1. Organization
New Covenant Funds (the “Trust”), an open-end, diversified management investment company, was organized as a Delaware business trust on September 30, 1998. It currently consists of four investment funds: New Covenant Growth Fund (“Growth Fund”), New Covenant Income Fund (“Income Fund”), New Covenant Balanced Growth Fund (“Balanced Growth Fund”), and New Covenant Balanced Income Fund (“Balanced Income Fund”), (individually, a “Fund,” and collectively, the “Funds”). The Funds commenced operations on July 1, 1999. The Trust’s authorized capital consists of an unlimited number of shares of beneficial interest of $0.001 par value. The Funds’ investment adviser is the NCF Investment Department of New Covenant Trust Company, N.A., a wholly owned subsidiary of the Presbyterian Church (U.S.A.) Foundation (the “Adviser”).
The objectives of the Funds are as follows:
| | | |
| | | |
Growth Fund | | Long-term capital appreciation. Dividend income, if any, will be incidental. |
| | | |
Income Fund | | High level of current income with preservation of capital. |
| | | |
Balanced Growth Fund | | Capital appreciation with less risk than would be present in a portfolio of only common stocks. |
| | | |
Balanced Income Fund | | Current income and long-term growth of capital. |
Under the Trust’s organizational documents, its officers and trustees are indemnified against certain liabilities arising out of the performance of their duties to the Funds. In addition, in the normal course of business, the Trust enters into contracts with its vendors and others that provide general indemnification. Each Fund’s maximum exposure under these arrangements is unknown, as this would involve future claims that may be made against a Fund. However, based on experience, the Funds expect the risk of loss to be remote.
2. Significant Accounting Policies
The preparation of financial statements in conformity with accounting principles generally accepted in the United States (“GAAP”) requires management to make estimates and assumptions that affect the reported amounts of assets and liabilities and disclosure of contingent assets and liabilities at the date of the financial statements and the reported amounts of income and expenses during the reporting period. Actual results could differ from those estimates. The following is a summary of the significant accounting policies consistently followed by the Funds in the preparation of their financial statements. The policies are in conformity with GAAP.
Portfolio Valuation: Fund investments are recorded at market value. Portfolio securities listed on a domestic or foreign exchange are valued at the last sale price on the day of valuation or, if there was no sale that day, at the last reported bid price as of the close of trading. Security valuations for the Funds’ investment in investment companies are furnished by an independent pricing service that has been approved by the Funds’ Board of Trustees. Equity securities traded on NASDAQ use the official closing price. Equity securities which are traded in the over-the-counter market only, but which are not included on NASDAQ, are valued at the mean between the last preceding bid and ask prices. Debt securities with a remaining maturity of sixty days or more are valued using a pricing service when such prices are believed to reflect fair market value. Debt securities with a remaining maturity of less than sixty days are valued at amortized cost, which approximates market value. Investment companies are valued at net asset value. All other assets and securities with no readily determinable market values are valued using procedures adopted by the Board of Trustees. Factors used in determining fair value include but are not limited to: type of security or asset, fundamental analytical data relating to the investment in the security, evaluation of the forces that influence the market in which the security is purchased and sold, and information as to any transactions or offers with respect to the security.
Foreign securities traded outside the United States are generally valued as of the time their trading is complete, which is usually different from the close of the New York Stock Exchange (“NYSE”). Occasionally, events affecting the value of such securities may occur between such times and the close of the NYSE that will not be reflected in the security’s market value. If events materially affecting the value of such securities occur during such period, these securities will be valued at their fair value according to procedures adopted by the Board of Trustees. All securities and other assets of a Fund initially expressed in foreign currencies will be converted to U.S. dollar values at the foreign exchange rate every business day, generally at 4:00 PM ET.
Securities Transactions and Investment Income: During the period, security transactions are accounted for no later than one business day following the trade date. For financial reporting purposes, however, security transactions are accounted for on trade date on the last business day of the reporting period. Securities sold are determined on a specific identification basis. Interest income is recognized on the accrual basis and includes, where applicable, the amortization of premium or accretion of discount for both financial reporting and tax purposes. Dividend income is recorded on the ex-dividend date. Gains or losses realized on sales of securities are determined by comparing the identified cost of the security lot sold with the net sales proceeds.
Options: The Income Fund may purchase or write options which are traded over-the-counter to hedge fluctuation risks in the prices of certain securities. When the Fund writes a call or put option, an amount equal to the premium received is reflected as a liability. The liability is subsequently “marked-to-market” to reflect the current market value of the option written. The premium paid
27
notes to financial statements
NEW COVENANT FUNDS
June 30, 2008
by the Fund for the purchase of a call or put option is recorded as an investment and subsequently “marked-to-market” to reflect the current market value of the option purchased. The Fund is subject to the risk of an imperfect correlation between movement in the price of the option and the price of the underlying security. Risks may also arise due to illiquid secondary markets for the options. There were no options outstanding at June 30, 2008.
Foreign Currency Translation: The books and records of the Funds are maintained in U.S. dollars. Investment valuation and other assets and liabilities initially expressed in foreign currencies are converted each business day into U.S. dollars based upon current exchange rates. Purchases and sales of foreign investments and income and expenses are converted into U.S. dollars based upon exchange rates prevailing on the respective dates of such transactions. That portion of unrealized gains or losses on investments due to fluctuations in foreign currency exchange rates is not separately disclosed.
The Funds do not isolate the portion of gains and losses on investments in securities that is due to changes in the foreign exchange rates from that which is due to changes in the market prices of such securities. The Funds report gains and losses on foreign currency related transactions as realized and unrealized gains and losses for financial reporting purposes, whereas such gains and losses are treated as ordinary income or loss for U.S. federal income tax purposes.
Forward Foreign Currency Contracts: The Growth Fund may enter into forward foreign currency contracts as hedges against either specific transactions or portfolio positions. All commitments are “marked-to-market” daily at the applicable foreign exchange rate and any resulting unrealized gains or losses are recorded currently. The Fund realizes gains and losses at the time foreign forward contracts are extinguished.
Loans of Portfolio Securities: The Growth Fund and the Income Fund may lend their securities pursuant to a securities lending agreement (“Lending Agreement”) with JPMorgan Chase Bank, N.A. (“JPMorgan”). Security loans made pursuant to the Lending Agreement are required at all times to be secured by collateral valued at a minimum of 102% of the market value of the securities loaned. Cash collateral received is invested by JPMorgan pursuant to the terms of the Lending Agreement. All such investments are made at the risk of the Funds and, as such, the Funds are liable for investment losses. To the extent a loan is secured by non-cash collateral, the borrower is required to pay a loan premium. Non-cash collateral received cannot be sold or repledged. Net income earned on the investment of cash collateral and loan premiums received on non-cash collateral are allocated between JPMorgan and the Funds in accordance with the Lending Agreement. Income allocated to the Funds is included in investment income in the respective Statements of Operations.
At June 30, 2008, the cash collateral received by the Growth Fund and the Income Fund was invested in repurchase agreements and other short-term securities. Information on the investment of cash collateral is shown in the Portfolios of Investments. The Growth Fund and the Income Fund receive payments from borrowers equivalent to the dividends and interest that would have been earned on the securities lent while simultaneously seeking to earn income on the investment cash collateral. One of the risks in lending portfolio securities, as with other extensions of credit, is the possible delay in the recovery of the securities or possible loss of rights in the collateral should the borrower fail financially. There is also the risk that, when lending portfolio securities, the securities may not be available to a Fund on a timely basis and a Fund may, therefore, lose the opportunity to sell the securities at a desirable price. In addition, in the event that a borrower of securities would file for bankruptcy or become insolvent, disposition of the securities may be delayed pending court action. However, loans will be made only to borrowers deemed by the Adviser to be creditworthy under guidelines established by the Board of Trustees and when, in the judgment of the Adviser, the consideration which can be earned currently from such securities loans justifies the attendant risks. Loans are subject to termination by the Funds or the borrower at any time, and are, therefore, not considered to be illiquid investments.
The value of the loaned securities and related collateral at June 30, 2008, was as follows:
| | | | | | | | | |
| |
| | | Value of
| | Value of
|
| Fund | | Securities Loaned | | Cash Collateral |
| |
| |
| Growth Fund | | | $96,849,624 | | | | $101,946,195 | |
| Income Fund | | | 10,461,791 | | | | 10,778,983 | |
| |
| |
Repurchase Agreements: The Funds may enter into repurchase agreements which are secured by obligations of the U.S. government with a bank, broker-dealer or other financial institution. Each repurchase agreement is at least 102% collateralized and marked-to-market. However, in the event of default or bankruptcy by the counterparty to the repurchase agreement, realization of the collateral may by subject to certain costs, losses or delays.
Forward Commitments, When-Issued Securities and Delayed-Delivery Transactions: The Growth Fund and the Income Fund may purchase or sell securities on a when-issued or delayed-delivery basis and make contracts to purchase or sell securities for a fixed price at a future date beyond customary settlement time. Debt securities are often issued on that basis. No income will accrue on securities purchased on a when-issued or delayed-delivery basis until the securities are delivered. Securities purchased or sold on a when-issued, delayed-delivery or forward-commitment basis involve a risk of loss if the value of the security to be purchased declines prior to settlement date. Although the Funds would generally purchase securities on a when-issued, delayed-delivery or a forward-
28
notes to financial statements
NEW COVENANT FUNDS
June 30, 2008
commitment basis with the intention of acquiring the securities, the Funds may dispose of such securities prior to settlement if the portfolio manager deems it appropriate to do so.
The Funds may dispose of or renegotiate a when-issued or forward commitment. The Funds will normally realize a capital gain or loss in connection with these transactions.
When the Funds purchase securities on a when-issued, delayed-delivery or forward-commitment basis, the Funds will maintain cash, U.S. government securities or other liquid portfolio securities having a value (determined daily) at least equal to the amount of the Funds’ purchase commitments. In the case of a forward commitment to sell portfolio securities, the custodian will hold the portfolio securities in a segregated account while the commitment is outstanding.
These procedures are designed to ensure that the Funds will maintain sufficient assets at all times to cover their obligations under when-issued purchases, forward commitments and delayed-delivery transactions.
As of June 30, 2008, the Fund had outstanding when-issued or delayed-delivery purchase commitments with corresponding assets segregated, as follows:
| | | | | |
| | |
| Fund | | Amount | |
| | |
| |
| Income Fund | | | $41,794,416 | |
| |
| |
Dividends and Distributions to Shareholders: Dividends from net investment income of all Funds are declared and paid at least annually. For all Funds, all net realized long-term or short-term capital gains, if any, will be declared and distributed at least annually. Interest and dividend payments will normally be distributed as income dividends on a quarterly basis for each of the Funds.
Income dividends and capital gain distributions are determined in accordance with income tax regulations, which may differ from GAAP. These differences are primarily due to differing treatments of income, gains and losses on various investment securities held by a Fund, timing differences in the recognition of income, gains and losses and differing characterizations of distributions made by the Fund.
These “book/tax” differences are either considered temporary or permanent in nature. To the extent these differences are permanent in nature, such amounts are reclassified within the composition of net assets based on their federal tax-basis treatment; temporary differences do not require reclassifications. To the extent that distributions exceed net investment income and net realized gains for tax purposes, they are reported as returns of capital.
On the Statements of Assets and Liabilities, the following adjustments were made for permanent tax adjustments:
| | | | | | | | | | | | | |
| | | Accumulated
| | Undistributed
| | |
| | | Net Realized
| | Net Investment
| | Portfolio
|
| | | Gain (Loss) | | Income | | Capital |
| |
| |
| Growth Fund | | | $(68,788 | ) | | | $68,788 | | | | $— | |
| Income Fund | | | 39,063 | | | | (39,063 | ) | | | — | |
| Balanced Growth Fund | | | (4,478 | ) | | | 4,478 | | | | — | |
| Balanced Income Fund | | | — | | | | — | | | | — | |
| |
| |
Federal Income Taxes: It is each Fund’s intention to continue to qualify annually as a regulated investment company by complying with the appropriate provisions of the Internal Revenue Code of 1986, as amended. Accordingly, no provision for federal income tax has been made.
Financial Accounting Standards Board Interpretation No. 48
On July 13, 2006, the Financial Accounting Standards Board (FASB) released FASB Interpretation No. 48 “Accounting for Uncertainty in Income Taxes” (“FIN 48”). FIN 48 provides guidance for how uncertain tax positions should be recognized, measured, presented and disclosed in the financial statements. FIN 48 requires the evaluation of tax positions taken or expected to be taken in the course of preparing the Funds’ tax returns to determine whether the tax positions are “more-likely-than-not” of being sustained by the applicable tax authority. Tax positions not deemed to meet the more-likely-than-not threshold would be recorded as a tax benefit or expense in the current year. Adoption of FIN 48 is required as of the date of the last Net Asset Value (“NAV”) calculation in the first required financial statement reporting period for fiscal years beginning after December 15, 2006 and is to be applied to all open tax years ended June 30, 2005 through 2008. The portfolios have adopted FIN 48 and as of June 30, 2008, the portfolios do not have any tax positions that did not meet the “more-likely-than-not threshold” of being sustained by the applicable tax authority.
Recently Issued Accounting Pronouncements: In September 2006, the FASB issued Statement on Financial Accounting Standards (SFAS) No. 157, “Fair Value Measurements.” This standard establishes a single authoritative definition of fair value,
29
notes to financial statements
NEW COVENANT FUNDS
June 30, 2008
sets out a framework for measuring fair value and requires additional disclosures about fair value measurements. SFAS No. 157 applies to fair value measurements already required or permitted by existing standards. SFAS No. 157 is effective for financial statements issued for fiscal years beginning after November 15, 2007 and interim periods within those fiscal years. The changes to current GAAP from the application of this Statement relate to the definition of fair value, the methods used to measure fair value, and the expanded disclosures about fair value measurements. As of June 30, 2008, the Funds do not believe the adoption of SFAS No. 157 will impact the financial statement amounts; however, additional disclosures may be required about the inputs used to develop the measurements and the effect of certain of the measurements on changes in net assets.
The Funds will adopt SFAS No. 157 with financial statements issued after July 1, 2008.
In March 2008, FASB issued its Statement on Financial Accounting Standards No. 161, “Disclosures about Derivative Instruments and Hedging Activities” (“SFAS 161”). This standard is intended to enhance financial disclosures for derivative instruments and hedging activities and enable investors to understand: a) how and why a fund uses derivative instruments, b) how derivative instruments and related hedge items are accounted for, and c) how derivative instruments and related hedge items affect a fund’s financial position, results of operations and cash flows. SFAS No. 161 is effective for financial statements issued for fiscal years and interim periods beginning after November 15, 2008. As of June 30, 2008 the Funds do not believe the adoption of SFAS No. 161 will impact the financial statement amounts; however, additional footnote disclosures may be required about the use of derivative instruments and hedge items.
Allocation of Expenses: Expenses directly attributable to a Fund are charged directly to that Fund, while expenses which are attributable to more than one Fund of the Trust are allocated among the respective Funds based upon relative net assets or some other reasonable method.
Commission Rebates: The Growth Fund directs certain portfolio trades to brokers who rebate a portion of their commissions in cash to the Fund. Under this arrangement, the Growth Fund had commissions rebated by $83,520, or less then 0.01%, as a percentage of the average daily net assets of the Fund on an annualized basis for the year ended June 30, 2008.
3. Investment Advisory and Other Agreements
The Trust, on behalf of each Fund, has entered into an Investment Advisory Agreement with the NCF Investment Department of New Covenant Trust Company, N.A. Under the Agreement, the Adviser is responsible for managing the Funds’ investments as well as furnishing the Funds with certain administrative services. The Growth Fund pays the Adviser a monthly fee at the annual rate of 0.99% of the Growth Fund’s average daily net assets and the Income Fund pays the Adviser a monthly fee at the annual rate of 0.75% of the Income Fund’s average daily net assets. The Adviser does not receive advisory fees for the Balanced Growth and Balanced Income Funds (the “Balanced Funds”). The Adviser has entered into Sub-Advisory Agreements with six Sub-Advisors to assist in the selection and management of the Growth Fund’s and Income Fund’s investment securities. It is the responsibility of the Sub-Advisers, under the direction of the Adviser, to make day-to-day investment decisions for these Funds. The Adviser, not the Funds, pays each Sub-Adviser a quarterly fee for their services. The Adviser pays the Sub-Adviser’s fee directly from its own advisory fees. The sub-advisory fees are based on the assets of a Fund for which the Sub-Adviser is responsible for making investment decisions.
The following are the Sub-Advisers for the Growth Fund: Capital Guardian Trust Company, Mazama Capital Management Inc., Santa Barbara Asset Management Inc. (a newly acquired firm of Madison Dearborn Partners, LLC as of November 13, 2007), Sound Shore Management Inc., and Wellington Management Company, LLP.
Tattersall Advisory Group is the Sub-Adviser for the Income Fund.
The Trust employs a Chief Compliance Officer (“CCO”) who receives a portion of his compensation from the Trust as approved by the Board of Trustees, as well as reimbursement of out-of-pocket expenses. The CCO is also an employee of the Adviser. For the year ended June 30, 2008, the Growth Fund, the Income Fund, the Balanced Growth Fund, and the Balanced Income Fund were allocated $29,159, $17,711, $10,562 and $2,973, respectively, of the CCO’s compensation.
The Trust is a party to a Shareholder Services Agreement pursuant to which each Fund is authorized to make payments to certain entities which may include investment advisers, banks, trust companies and other types of organizations (“Authorized Service Providers”) for providing administrative services with respect to shares of the Funds attributable to or held in the name of the Authorized Service Provider for its clients or other parties with whom they have a servicing relationship. Under the terms of the Shareholder Services Agreement, each Fund is authorized to pay monthly an Authorized Service Provider (which may include affiliates of the Funds) a shareholder services fee at the rate of 0.25% on an annual basis of the average daily net assets of the shares of the Fund attributable to or held in the name of the Authorized Service Provider for providing certain administrative services to Fund shareholders with whom the Authorized Service Provider has a servicing relationship. In connection with the Shareholder Services Agreement, the Adviser has agreed to waive the amount of the investment advisory fees payable to it by the Growth Fund, and the Income Fund to the extent of the amount paid in fees by a Fund to any affiliated Authorized Service Provider under the Shareholder Services Agreement.
30
notes to financial statements
NEW COVENANT FUNDS
June 30, 2008
Effective April 14, 2008, U.S. Bancorp Fund Services, LLC (“USBFS”), an indirect wholly owned subsidiary of U.S. Bancorp, serves as the Funds’ Administrator (the “Administrator”) and, in that capacity, performs various administrative and accounting services for each Fund. USBFS also serves as the Funds’ fund accountant, transfer agent, dividend disbursing agent and registrar. The Administrator prepares various federal and state regulatory filings, reports and returns for the Fund; prepares reports and materials to be supplied to the trustees; coordinates the preparation and payment of Fund expenses and reviews the Fund’s expense accruals. For its services, the Administrator receives a monthly fee at the following annual rates:
| | | |
| Minimum | | $40,000 per Fund |
| $0 to $500 million | | 0.03% of average daily net assets |
| $500 million to $1 billion | | 0.02% of average daily net assets |
| Over $1 billion | | 0.01% of average daily net assets |
Prior to April 14, 2008, the Trust entered into servicing agreements with Citi Fund Services Ohio, Inc. (“Citi Ohio”). Under the servicing agreements, Citi Ohio provided the transfer agency, administrative and fund accounting services to the Funds. Under the terms of the Transfer Agency Agreement, Citi Ohio was entitled to account based fees and annual fund level fees, as well as reimbursement of out-of-pocket expenses incurred in providing transfer agency services. Under the Fund Accounting Agreement, Citi Ohio was entitled to a fee computed at an annual rate of 0.03% of the Trust’s average daily net assets for the first $500,000,000, 0.0225% for $500,000,001 to $5,000,000,000, and 0.01% over $5,000,000,000. Under the Administration Agreement, Citi Ohio was entitled to a fee computed at an annual rate of 0.01% of the Trust’s average daily net assets.
The Trust issues shares of the Funds pursuant to a Distribution Agreement with New Covenant Funds Distributor, Inc. (the “Distributor”), a wholly-owned subsidiary of New Covenant Trust Company, N.A., a subsidiary of the Adviser, under which the Distributor serves as the principal distributor of the Funds’ shares. The Funds do not pay the Distributor in its capacity as principal distributor.
The Trust has a Custodian Agreement with JPMorgan.
No officer, trustee or employee of the Trust, USBFS, or any affiliate thereof, except the CCO, receives any compensation from the Funds for serving as a trustee or officer of the Trust. The Funds reimburse expenses incurred by the Trustees and Officers in attending Board and Committee meetings.
A summary of each Balanced Fund’s investment in the Growth Fund and Income Fund for the year ended June 30, 2008, is as follows:
| | | | | | | | | | | | | | | | | | | | | | | | | | | | | |
| | | Share Activity | | | | | | |
| | | Balanced
| | | | | | Balanced
| | Realized
| | | | Value
|
| Fund | | June 30, 2007 | | Purchases | | Sales | | June 30, 2008 | | Gain (Loss) | | Income | | June 30, 2008 |
| |
| |
| Balanced Growth Fund | | | | | | | | | | | | | | | | | | | | | | | | | | | | |
| Growth Fund | | | 5,721,291 | | | | 957,319 | | | | 880,470 | | | | 5,798,140 | | | | $13,344,494 | | | | $1,666,152 | | | | $185,250,587 | |
| Income Fund | | | 5,107,767 | | | | 869,851 | | | | 1,133,387 | | | | 4,844,231 | | | | (779,893 | ) | | | 5,723,394 | | | | 114,953,608 | |
| | | | | | | | | | | | | | | | | | | | | | | | | | | | | |
| Balanced Income Fund | | | | | | | | | | | | | | | | | | | | | | | | | | | | |
| Growth Fund | | | 1,212,992 | | | | 167,786 | | | | 227,520 | | | | 1,153,258 | | | | 3,410,646 | | | | 363,607 | | | | 36,846,584 | |
| Income Fund | | | 2,965,666 | | | | 207,550 | | | | 536,021 | | | | 2,637,195 | | | | (350,546 | ) | | | 3,183,356 | | | | 62,580,635 | |
| |
| |
4. Purchases and Sales of Securities
The cost of purchases and proceeds from sales of securities, excluding U.S. government and other short-term investments, for the year ended June 30, 2008, were as follows:
| | | | | | | | | | | | | | | | | |
| | | Purchases
| | Sales
| | | | |
| | | (excluding U.S.
| | (excluding U.S.
| | Purchases of
| | Sales of
|
| Fund | | Government) | | Government) | | U.S. Government | | U.S. Government |
| |
| |
| Growth Fund | | | $597,201,169 | | | | $660,702,319 | | | | $— | | | | $— | |
| Income Fund | | | 750,551,965 | | | | 764,730,877 | | | | 110,815,628 | | | | 145,213,080 | |
| Balanced Growth Fund | | | 56,145,309 | | | | 61,419,899 | | | | — | | | | — | |
| Balanced Income Fund | | | 11,128,740 | | | | 21,777,994 | | | | — | | | | — | |
| |
| |
5. Risk Factors
The performance of a Fund’s investments in non-U.S. companies and in companies operating internationally or in foreign countries will depend principally on economic conditions in their product markets, the securities markets where their securities are traded, and currency exchange rates. These risks are present because of uncertainty in future exchange rates back into U.S. dollars and possible political instability, which could affect foreign financial markets and local economies. There are also risks related to social and
31
notes to financial statements
NEW COVENANT FUNDS
June 30, 2008
economic developments abroad, as well as risks resulting from the differences between the regulations to which U.S. and foreign issuers and markets are subject.
The Funds will not invest more than 15% of the value of their net assets in securities that are illiquid because of restrictions on transferability or other reasons. Repurchase agreements with deemed maturities in excess of seven days and securities that are not registered under the Securities Act of 1933, as amended, but that may be purchased by institutional buyers pursuant to Rule 144A are subject to this 15% limit (unless such securities are variable-amount master-demand notes with maturities of nine months or less or unless the Board determines that a liquid trading market exists). The Funds may purchase securities which are not registered under the Securities Act but which can be sold to “qualified institutional buyers” in accordance with Rule 144A under the Securities Act. In some cases, such securities are classified as “illiquid securities”; however, any such security will not be considered illiquid so long as it is determined by the Adviser, under guidelines approved by the Board of Trustees, that an adequate trading market exists for that security. This investment practice could have the effect of increasing the level of illiquidity in a Fund during any period that qualified institutional buyers become uninterested in purchasing these restricted securities.
The Income Fund may invest a limited amount of assets in debt securities which are rated below investment grade (hereinafter referred to as “lower-rated securities”) or which are unrated but deemed equivalent to those rated below investment grade by the portfolio managers. The lower the ratings of such debt securities, the greater their risks. These debt instruments generally offer a higher current yield than that available from higher-grade issues, and typically involve greater risks. The yields on lower-rated securities will fluctuate over time. In general, prices of all bonds rise when interest rates fall and fall when interest rates rise. Lower-rated securities are subject to adverse changes in general economic conditions and to changes in the financial condition of their issuers. During periods of economic downturn or rising interest rates, issuers of these instruments may experience financial stress that could adversely affect their ability to make payments of principal and interest, and increase the possibility of default.
The Balanced Funds invest their assets primarily in the Growth Fund and the Income Fund. By investing primarily in shares of these Funds, shareholders of the Balanced Funds indirectly pay a portion of the operating expenses, management expenses and brokerage costs of the underlying Funds as well as their own operating expenses. Thus, shareholders of the Balanced Funds may indirectly pay slightly higher total operating expenses and other costs than they would pay by directly owning shares of the Growth Fund and Income Fund. Total fees and expenses to be borne by investors in either Balanced Fund will depend on the portion of the Funds’ assets invested in the Growth Fund and in the Income Fund. A change in the asset allocation of either Balanced Fund could increase or reduce the fees and expenses actually borne by investors in that Fund. The Balanced Funds are also subject to rebalancing risk. Rebalancing activities, while undertaken to maintain a Fund’s investment risk-to-reward ratio, may cause the Fund to under-perform other funds with similar investment objectives. For the Balanced Growth Fund, it is possible after rebalancing from equities into a greater percentage of fixed-income securities, that equities will outperform fixed-income investments. For the Balanced Income Fund, it is possible that after rebalancing from fixed-income securities into a greater percentage of equity securities, that fixed-income securities will outperform equity investments. The performance of the Balanced Growth Fund and the Balanced Income Fund depends on the performance of the underlying Funds in which they invest.
6. Distribution Information
Income and long-term capital gain distributions are determined in accordance with federal income tax regulations, which may differ from GAAP. The tax character of distributions paid during the fiscal years ended June 30, 2008 and June 30, 2007, was as follows:
| | | | | | | | | | | | | | | | | | | | | | | | | | | | | | | | | | | | | | | | | |
| | | Distributions Paid From | | | | | | | | | | | | | | | | | | | |
| | | Ordinary
| | | Net Long Term
| | | Total Taxable
| | | Return of
| | | Total Distributions
| |
| | | Income | | | Capital Gains | | | Distributions | | | Capital | | | Paid* | |
| | | | |
| | | 2008 | | | 2007 | | | 2008 | | | 2007 | | | 2008 | | | 2007 | | | 2008 | | | 2007 | | | 2008 | | | 2007 | |
| |
| | | | | | | | | | | | | | | | | | | | | | | | | | | | | | | | | | | | | | | | | |
| Growth Fund | | | $9,729,900 | | | | $7,673,788 | | | | $47,070,913 | | | | $— | | | | $56,800,813 | | | | $7,673,788 | | | | $583,333 | | | | $— | | | | $57,384,146 | | | | $7,673,788 | |
| | | | | | | | | | | | | | | | | | | | | | | | | | | | | | | | | | | | | | | | | |
| Income Fund | | | 24,383,715 | | | | 24,215,086 | | | | — | | | | — | | | | 24,383,715 | | | | 24,215,086 | | | | — | | | | 94,148 | | | | 24,383,715 | | | | 24,309,234 | |
| | | | | | | | | | | | | | | | | | | | | | | | | | | | | | | | | | | | | | | | | |
Balanced
Growth Fund | | | 6,897,814 | | | | 7,052,751 | | | | — | | | | — | | | | 6,897,814 | | | | 7,052,751 | | | | — | | | | — | | | | 6,897,814 | | | | 7,052,751 | |
| | | | | | | | | | | | | | | | | | | | | | | | | | | | | | | | | | | | | | | | | |
| Balanced Income Fund | | | 3,327,286 | | | | 3,613,264 | | | | — | | | | — | | | | 3,327,286 | | | | 3,613,264 | | | | 4,188 | | | | 3,119 | | | | 3,331,474 | | | | 3,616,383 | |
| |
| |
| |
| | |
| * | | Total distributions paid may differ from the Statements of Changes in Net Assets because distributions are recognized when actually paid for tax purposes. |
32
notes to financial statements
NEW COVENANT FUNDS
June 30, 2008
7. Federal Income Taxes
As of June 30, 2008, the Funds had available for federal tax purposes unused capital loss carryforwards expiring as follows:
| | | | | | | | | | | | | | | | | | | | | | | | | |
| | | 2012 | | 2013 | | 2014 | | 2015 | | 2016 | | Total |
| |
| Income Fund | | | $— | | | | $— | | | | $1,591,357 | | | | $5,673,243 | | | | $517,116 | | | | $7,781,716 | |
| Balanced Income Fund | | | 1,227,811 | | | | 792,155 | | | | — | | | | — | | | | — | | | | 2,019,966 | |
| |
| |
The New Covenant Balance Income Fund and Balanced Growth Fund utilized $1,061,815 and $10,020,881, respectively, of capital loss carryforwards during the fiscal year end June 30, 2008.
Under tax law, certain capital and foreign currency losses realized after October 31, and within the taxable year may be deferred and treated as occurring on the first business day of the following fiscal year. For the year ended June 30, 2008, the Funds deferred to July 1, 2009, post-October capital losses of:
| | | | | |
| | | Post-October Losses |
| |
| Growth Fund | | | $11,487,881 | |
| Income Fund | | | 1,935,521 | |
| Balanced Growth Fund | | | 304,193 | |
| Balanced Income Fund | | | 98,625 | |
As of June 30, 2008, the components of accumulated earnings/(deficit) on a tax basis were as follows:
| | | | | | | | | | | | | | | | | | | | | | | | | | | | | |
| | | | | | | | | | | | | | | | | | | | | Total
| |
| | | Undistributed
| | | Undistributed
| | | | | | | | | Accumulated
| | | Unrealized
| | | Accumulated
| |
| | | Ordinary
| | | Long-Term
| | | Accumulated
| | | Dividends
| | | Capital and
| | | Appreciation/
| | | Earnings/
| |
| | | Income | | | Capital Gains | | | Earnings | | | Payable | | | Other Losses | | | (Depreciation)* | | | (Deficit) | |
| | |
| |
| | | | | | | | | | | | | | | | | | | | | | | | | | | | | |
| Growth Fund | | | $— | | | | $— | | | | $— | | | | $— | | | | $(11,533,547 | ) | | | $47,375,950 | | | | $35,842,403 | |
| | | | | | | | | | | | | | | | | | | | | | | | | | | | | |
| Income Fund | | | 452,350 | | | | — | | | | 452,350 | | | | — | | | | (9,717,237 | ) | | | (19,945,475 | ) | | | (29,210,362 | ) |
| | | | | | | | | | | | | | | | | | | | | | | | | | | | | |
Balanced
Growth Fund | | | 850,333 | | | | 2,488,943 | | | | 3,339,276 | | | | — | | | | (421,753 | ) | | | 7,436,074 | | | | 10,353,597 | |
| | | | | | | | | | | | | | | | | | | | | | | | | | | | | |
| Balanced Income Fund | | | — | | | | — | | | | — | | | | — | | | | (2,118,591 | ) | | | 5,667,434 | | | | 3,548,843 | |
| |
| |
| |
| | |
| * | | The differences between the book-basis and tax-basis unrealized appreciation (depreciation) is attributable primarily to: tax deferral of losses on wash sales, passive foreign investment companies (“PFICs”) and the difference between book and tax amortization methods for premium and market discount, and the return of capital adjustments from real estate investment trusts. |
At June 30, 2008, the cost, gross unrealized appreciation and gross unrealized depreciation on securities, for federal income tax purposes, were as follows:
| | | | | | | | | | | | | | | | | |
| | | | | | | | | Net Unrealized
|
| | | | | Tax Unrealized
| | Tax Unrealized
| | Appreciation
|
| Portfolio Name | | Tax Cost | | Appreciation | | (Depreciation) | | (Depreciation) |
| |
| |
| Growth Fund | | | $890,799,585 | | | | $136,605,340 | | | | $(89,229,390 | ) | | | $47,375,950 | |
| Income Fund | | | 566,003,330 | | | | 2,754,325 | | | | (22,699,800 | ) | | | (19,945,475 | ) |
| Balanced Growth Fund | | | 296,121,978 | | | | 28,708,500 | | | | (21,272,426 | ) | | | 7,436,074 | |
| Balanced Income Fund | | | 96,339,823 | | | | 9,006,727 | | | | (3,339,293 | ) | | | 5,667,434 | |
| |
| |
8. Other Federal Income Tax Information (unaudited)
For the fiscal year ended June 30, 2008, certain dividends paid by the Funds may be subject to a maximum tax rate of 15%, as provided for by the Jobs and Growth Tax Relief Reconciliation Act of 2003.
The percentage of dividends declared from ordinary income designated as qualified dividend income was as follows:
| | | | | |
| Income Fund | | | 44.21% | |
| Growth Fund | | | 46.45% | |
| Balanced Income Fund | | | 46.49% | |
| Balanced Growth Fund | | | 46.75% | |
33
notes to financial statements
NEW COVENANT FUNDS
June 30, 2008
For corporate shareholders, the percent of ordinary income distributions qualifying for the corporate dividends received deduction for the fiscal year ended June 30, 2008 was as follows:
| | | | | |
| Income Fund | | | 45.24% | |
| Growth Fund | | | 42.93% | |
| Balanced Income Fund | | | 47.15% | |
| Balanced Growth Fund | | | 46.84% | |
The Percentage of taxable ordinary income distributions that are designated as short-term capital gain distributions under Internal Revenue Section 871(k)(2)(C) for each Fund were as follows.
| | | | | |
| Income Fund | | | 0.00% | |
| Growth Fund | | | 0.00% | |
| Balanced Income Fund | | | 0.00% | |
| Balanced Growth Fund | | | 0.00% | |
9. Subsequent Events
Russell Implementation Services, Inc. (“Russell”), was approved by the Board of Trustees on May 19, 2008 to serve as a sub-adviser to the Growth Fund, replacing Mazama Capital Management, Inc. Russell began managing its allocated portion of the Growth Fund’s portfolio on or about August 1, 2008.
Effective August 8, 2008, the NCF Investment Department of New Covenant Trust Company, N.A. (the “Advisor”) has changed its name to One Compass Advisors. All references to the Advisor in this annual report now pertain to One Compass Advisors.
34
report of independent registered public accounting firm
REPORT OF INDEPENDENT REGISTERED PUBLIC ACCOUNTING FIRM
To the Board of Trustees and Shareholders
of the New Covenant Funds:
We have audited the accompanying statements of assets and liabilities, including the portfolios of investments, of the New Covenant Funds (comprised of New Covenant Growth Fund, New Covenant Income Fund, New Covenant Balanced Growth Fund, and New Covenant Balanced Income Fund) (collectively the “Funds”), as of June 30, 2008, and the related statements of operations for the year then ended, the statements of changes in net assets for each of the two years in the period then ended, and the financial highlights for each of the five years in the period then ended. These financial statements and financial highlights are the responsibility of the Funds’ management. Our responsibility is to express an opinion on these financial statements and financial highlights based on our audits.
We conducted our audits in accordance with the standards of the Public Company Accounting Oversight Board (United States). Those standards require that we plan and perform the audit to obtain reasonable assurance about whether the financial statements and financial highlights are free of material misstatement. We were not engaged to perform an audit of the Funds’ internal control over financial reporting. Our audits included consideration of internal control over financial reporting as a basis for designing audit procedures that are appropriate in the circumstances, but not for the purpose of expressing an opinion on the effectiveness of the Funds’ internal control over financial reporting. Accordingly, we express no such opinion. An audit also includes examining, on a test basis, evidence supporting the amounts and disclosures in the financial statements and financial highlights, assessing the accounting principles used and significant estimates made by management, and evaluating the overall financial statement presentation. Our procedures included confirmation of securities owned as of June 30, 2008, by correspondence with the custodian and brokers or by other appropriate auditing procedures where replies from brokers were not received. We believe that our audits provide a reasonable basis for our opinion.
In our opinion, the financial statements and financial highlights referred to above present fairly, in all material respects, the financial position of each of the respective portfolios constituting the New Covenant Funds at June 30, 2008, the results of their operations, the changes in their net assets for each of the two years in the period then ended, and the financial highlights for each of the five years in the period then ended, in conformity with U.S. generally accepted accounting principles.
Cincinnati, Ohio
August 28, 2008
35
supplemental data (unaudited)
NEW COVENANT FUNDS
June 30, 2008
Proxy Voting Policy and Proxy Voting Record
A description of the policies and procedures that the Trust uses to determine how to vote proxies related to portfolio securities is available (i) without charge, upon request, by calling 800-858-6127 and (ii) on the Securities and Exchange Commission’s website at http://www.sec.gov. Information regarding how each Fund voted proxies related to securities held during the most recent 12 month period ended June 30 is (i) available without charge, upon request, by calling 800-858-6127; (ii) on the Funds’ website at http://www.newcovenantfunds.com and (iii) on the Securities and Exchange Commission’s website at http://www.sec.gov.
Quarterly Holdings
The Funds file their complete schedule of portfolio holdings with the SEC for the first and third quarters of each fiscal year on Form N-Q. The Funds’ Form N-Qs are available on the SEC’s website at www.sec.gov and may be reviewed and copied at the SEC’s Public Reference Room in Washington, DC. Information on the operation of the Public Reference Room may be obtained by calling 1-800-SEC-0330.
Additional Fund Information - Hypothetical Cost of Investing
As a shareholder of the New Covenant Funds, you incur ongoing costs, including management fees and other Fund expenses. This example is intended to help you understand your ongoing costs (in dollars) of investing in the New Covenant Funds and to compare these costs with the ongoing costs of investing in other mutual funds.
The Example is based on an investment of $1,000 invested at the beginning of the period and held for the entire period from January 1, 2008 through June 30, 2008.
Actual Expenses
The table below provides information about actual account values and actual expenses. You may use the information below, together with the amount you invested, to estimate the expenses that you paid over the period. Simply divide your account value by $1,000 (for example, an $8,600 account value divided by $1,000 = 8.6), then multiply the result by the number in the table under the heading entitled “Expenses Paid During Period” to estimate the expenses you paid on your account during this period.
| | | | | | | | | | | | | | | | | |
| | | Beginning
| | Ending
| | Expenses Paid
| | Expense Ratio
|
| | | Account Value
| | Account Value
| | During Period*
| | During Period**
|
| | | 1/1/08 | | 6/30/08 | | 1/1/08 - 6/30/08 | | 1/1/08 - 6/30/08 |
| |
| |
| Growth Fund | | | $1,000.00 | | | | $896.10 | | | | $5.19 | | | | 1.10% | |
| Income Fund | | | 1,000.00 | | | | 969.10 | | | | 4.16 | | | | 0.85% | |
| Balanced Growth Fund | | | 1,000.00 | | | | 923.60 | | | | 0.72 | | | | 0.15% | |
| Balanced Income Fund | | | 1,000.00 | | | | 941.50 | | | | 0.97 | | | | 0.20% | |
| |
| |
Hypothetical Example for Comparison Purposes
The table below provides information about hypothetical account values and hypothetical expenses based on each of the New Covenant Funds’ actual expense ratios and an assumed rate of return of 5% per year before expenses, which is not the Fund’s actual return. The hypothetical account values and expenses may not be used to estimate the actual ending account balance or expenses you paid for the period. You may use this information to compare this 5% hypothetical example with the 5% hypothetical examples that appear in the shareholder reports of other funds.
| | | | | | | | | | | | | | | | | |
| | | Beginning
| | Ending
| | Expenses Paid
| | Expense Ratio
|
| | | Account Value
| | Account Value
| | During Period*
| | During Period**
|
| | | 1/1/08 | | 6/30/08 | | 1/1/08 - 6/30/08 | | 1/1/08 - 6/30/08 |
| |
| |
| Growth Fund | | | $1,000.00 | | | | $1,019.39 | | | | $5.52 | | | | 1.10% | |
| Income Fund | | | 1,000.00 | | | | 1,020.64 | | | | 4.27 | | | | 0.85% | |
| Balanced Growth Fund | | | 1,000.00 | | | | 1,024.12 | | | | 0.75 | | | | 0.15% | |
| Balanced Income Fund | | | 1,000.00 | | | | 1,023.87 | | | | 1.01 | | | | 0.20% | |
| |
| |
| | |
| * | | Expenses are equal to the average account value times the Fund’s annualized expense ratio multiplied by the number of days in the most recent fiscal half-year divided by the number of days in the fiscal year. |
| ** | | Annualized. |
36
supplemental data (unaudited)
NEW COVENANT FUNDS
June 30, 2008
Approval of the Continuation of the Investment Advisory and Sub-Advisory Agreements
The current Investment Advisory Agreement and each of the Sub-Advisory Agreements (collectively, the “Agreements”) were most recently re-approved by the Board of Trustees of the New Covenant Funds (the “Trust”) on May 19, 2008, for a one-year period ending June 30, 2009. (As discussed more fully below, the Sub-Advisory Agreement of one of the Sub-Advisers, Mazama Capital Management, Inc., (“Mazama”) was only re-approved on a short-term basis through July 31, 2008, due to the fact that the Board determined at the meeting to replace Mazama with a new Sub-Adviser, Russell Implementation Services, Inc. (“Russell”), effective as of August 1, 2008). Relevant provisions of the Investment Company Act of 1940 specifically provide that it is the duty of the Board to request and evaluate such information as the Board determines is reasonably necessary to allow the Board to properly consider the continuation of the Agreements, and it is the duty of the Adviser and the Sub-Advisers to furnish the Trustees with such information as is responsive to their request. Accordingly, in determining whether to renew the Agreements, the Board of Trustees requested, and the Adviser and the Sub-Advisers provided, information and data relevant to the Board’s consideration. This included materials regarding the investment performance of the Funds and information regarding the fees and expenses of the Funds, as compared to other similar mutual funds, including other mutual funds having socially responsible investment (“SRI”) mandates. As part of their deliberations, the Trustees also considered and relied upon the information about the Funds, the Adviser and the Sub-Advisers that had been provided to them throughout the past year in connection with their regular Board meetings at which they engage in the ongoing oversight of the Funds and their operations. The Independent Trustees discussed the materials prior to the May 19, 2008 Board meeting as well as in an executive session during the meeting. During this process the Independent Trustees were counseled by their own independent legal counsel (as such term is defined in the rules under the 1940 Act).
Among the factors the Board considered was the overall performance of each Fund and each Sub-Adviser relative to the performance of similar mutual funds in each Fund’s peer group and relative to applicable benchmark indexes on a long-term basis and over shorter periods of time. The Board took note of the fact that the performance results achieved for the Funds were favorable on both a short-term and on a long-term basis and that the Adviser produced these results in a manner consistent with the stated investment objective and policies of each of the Funds. The Board considered the contribution made by each Sub-Adviser to the short-term and, as relevant, long-term performance. The Board also took note of the long-term relationship between the Adviser and the Funds and the efforts that have been undertaken by the Adviser to foster the growth and development of the Funds since their inception.
In connection with its consideration of the continuation of the Agreement with the Adviser, the Board compared the expenses of each of the Funds to the expenses of their peers, based on data compiled by an independent source. The Board noted the range of investment advisory and administrative services provided by the Adviser to the Funds and the nature, extent and quality of these services. The Board also reviewed financial information concerning the Adviser relating to its operation of the Funds, noting the overall profitability of the relationship with the Funds to the Adviser and the financial soundness of the Adviser as demonstrated by the financial information provided. In addition, the Board discussed with the Adviser economies of scale that could be realized by the Funds and the impact of potential economies of scale on the fees assessed on the Growth and Income Funds. The members of the Board also considered the fact that the Adviser makes available the services of its subsidiary New Covenant Funds Distributor, Inc. (the “Distributor”) to serve as the distributor of the shares of each of the Funds and they noted that the Adviser bears all of the costs of the distribution services for the Funds that are provided by the Distributor. The Board also took note of the fact that the Distributor continued to undertake efforts to expand the marketing of the Funds and to provide for expanded distribution of the Funds at no direct cost to the Funds. The Trustees considered the services performed by the Trust’s Chief Compliance Officer (who is an employee of the Adviser), particularly in his oversight of the Sub-Advisers; the services provided by the Adviser in managing the Funds’ proxy voting program; and other additional services provided by the Adviser to the Funds, and concluded that the shareholders continue to benefit from these additional services under the Investment Advisory Agreement with the Adviser. The Board also discussed the function of the Adviser’s Social Witness Committee of its board to raise the visibility and importance of the social responsibility aspect of investing the Funds’ portfolios, and the Adviser’s participation on the Mission Responsibility Through Investment Committee of the Presbyterian Church (U.S.A.) Foundation.
In connection with their review of each of the Sub-Advisory Agreements, the Trustees considered, in addition to the performance information discussed above, the Sub-Advisers’ adherence to the Funds’ investment objectives and policies, the Trust’s Chief Compliance Officer’s favorable compliance report on each Sub-Adviser and the fees charged or proposed to be charged, in the case of Russell, by the Sub-Advisers to other clients as compared to the fees they receive from the Adviser. While the Board considered financial information regarding each Sub-Adviser, it did not consider information as to the profitability of each Sub-Advisory Agreement to the applicable Sub-Adviser, since the fees payable to the Sub-Advisers had been negotiated at arm’s length and were paid by the Adviser. The Board considered the soft dollar practices of certain of the Sub-Advisers to the Growth Fund and they noted that those Sub-Advisers that do engage in soft dollar transactions with respect to portfolio transactions for the Growth Fund do so in a manner that is consistent with industry practice within the mutual fund industry and also consistent with relevant regulatory guidance and that these transactions reflect a small portion of the overall portfolio trading done for the Growth Fund.
In connection with its review of the investment performance of the Sub-Advisers, the Board took into consideration the below-benchmark performance of Mazama in connection with its management of a portion of the Growth Fund’s portfolio and the Board considered the Adviser’s recommendation with respect to the proposed replacement of Mazama. At the conclusion of their
37
supplemental data (unaudited)
NEW COVENANT FUNDS
June 30, 2008
consideration of the performance results achieved by Mazama, and in accordance with the recommendation of the Adviser, the Board determined to replace Mazama with Russell. The Board reviewed information and materials regarding Russell, its prior investment performance, its proposed portfolio management process and its proposed level of fees, and it selected Russell to manage the portion of the Growth Fund being managed by Mazama. Due to the fact that Russell would not begin managing Fund assets prior to August 1, 2008, the Board approved the continuation of the Sub-Advisory Agreement with Mazama for a one-month period in order to provide for the transition from Mazama to Russell effective as of August 1, 2008. In connection with its choice of Russell as a replacement Sub-Adviser, the Board took note of the fact that Russell may receive indirect compensation from the Growth Fund by performing portfolio brokerage transactions for the Fund for which Russell is entitled to receive brokerage commissions, and the Board concluded that because such transactions must conform with applicable regulatory requirements that provide that such commissions must be fair and reasonable, the ability to receive such additional indirect income by Russell was acceptable and not unfair to investors.
In reaching their conclusion with respect to the continuation of the Agreements, the Trustees did not identify any one single factor as being controlling; rather, the Trustees took note of a combination of factors that influenced their decision-making process. The Board did, however, identify the performance of the Funds, the commitment of the Adviser to the successful operation of the Funds, and the level of expenses of the Funds as being important elements of their consideration. The Board took particular note of the performance of each Fund compared to that of similar SRI funds. The Board also took particular note of the unique duties that the Adviser undertakes in order to assure that the Funds are invested in a manner that is consistent with the social-witness principles of the Presbyterian Church (U.S.A.). The Board further considered the fact that the Adviser had undertaken during the year to waive its investment advisory fees to the extent of the amount of shareholder services fees paid by the Funds during the year in order to limit the overall operating expenses of the Funds. The Board also took into consideration the fact that the Adviser manages the Funds under a “manager of managers” arrangement pursuant to which the Adviser is responsible for the ongoing oversight of the investment program of each of the Sub-Advisers with respect to their management of the Funds and the Board determined that the Adviser has continued to successfully implement the “manager of managers” program for the Funds in a manner that has been beneficial to the Funds and their shareholders.
Based upon their review and consideration of these factors and other matters deemed relevant by the Board in reaching an informed business judgment, the Board of Trustees, including a majority of the Independent Trustees, concluded that the terms of the Advisory Agreement and the Sub-Advisory Agreements are fair and reasonable in light of the services provided and the Board therefore voted to renew the Agreements for an additional one-year period (except with respect to Mazama) and to approve the new Sub-Advisory Agreement with Russell.
38
trustees and officers
NEW COVENANT FUNDS
June 30, 2008
| | | | | | | | | | | |
| Trustees and Officers of the New Covenant Funds |
| |
| | | | | | | | | Number of
| | |
| | | | | | | | | Portfolios in
| | Other
|
| | | Position(s)
| | Length
| | Term of Office and
| | Fund Complex
| | Trusteeships/
|
| | | Held With
| | of Time
| | Principal Occupation(s)
| | Overseen by
| | Directorships
|
| Name and Age | | Trust | | Served | | During Past 5 Years | | Trustee | | Held by Trustee |
| |
| |
| INDEPENDENT TRUSTEES |
| |
|
F. Kenneth Bateman
200 E. Twelfth St.
Jeffersonville, IN 47130
Age: 68 | | Trustee | | Since
inception | | Attorney, Gerber & Bateman, P.A. (1999 to present); Attorney, Potter, Mills & Bateman, P.A. (1997 to 1999); Trustee, Presbyterian Church (U.S.A.) Foundation (1995 to 2001) | | 4 | | None |
| | | | | | | | | | | |
Gail C. Duree
200 E. Twelfth St.
Jeffersonville, IN 47130
Age: 62 | | Trustee | | Since
inception | | Independent Financial Consultant, Montview Boulevard Presbyterian Church Treasurer (1994 to present); Women’s Foundation of Colorado (1995 to present); Alpha Gamma Delta Foundation Board (2005 to present) | | 4 | | None |
| | | | | | | | | | | |
Donald B. Register
200 E. Twelfth St.
Jeffersonville, IN 47130
Age: 71 | | Trustee | | Since
inception | | Retired; (1988 to 2005), Pastor, Sixth-Grace Presbyterian Church, Chicago, IL | | 4 | | None |
| | | | | | | | | | | |
Alison John
200 E. Twelfth St.
Jeffersonville, IN 47130
Age: 52 | | Trustee | | February
2007 | | Pastor, First Presbyterian Church in Brookline, MA (1999-present) | | 4 | | None |
| | | | | | | | | | | |
William C. Lauderbach
200 E. Twelfth St.
Jeffersonville, IN 47130
Age: 65 | | Trustee | | August
2005 | | Retired; (1985 to 2008), Executive Vice President and Senior Investment Officer, Chemical Bank and Trust Company, Midland, Michigan | | 4 | | None |
| | | | | | | | | | | |
Elinor K. Hite
200 E. Twelfth St.
Jeffersonville, IN 47130
Age: 66 | | Trustee | | May
2008 | | Senior Vice President of Human Resources, YMCA of the USA, Chicago, Illinois (2005 to present); Director of Human Resources, Jenner & Block LLP (1999 to 2005) | | 4 | | None |
| | | | | | | | | | | |
Henry H. Gardiner
200 E. Twelfth St.
Jeffersonville, IN 47130
Age: 65 | | Trustee | | May
2008 | | National Accounts Manager, SunGard iWORKS, Aurora, Colorado (2000 to present) | | 4 | | None |
| |
|
| INTERESTED TRUSTEES |
| |
|
| | | | | | | | | | | |
Robert E. Leech
200 E. Twelfth St.
Jeffersonville, IN 47130
Age: 63 | | President
and Trustee | | May 2005 | | President and Chief Executive Officer of the Presbyterian Church (U.S.A.) Foundation (2000 to present) | | 4 | | None |
| | | | | | | | | | | |
Samuel W. McNairy
200 E. Twelfth St.
Jeffersonville, IN 47130
Age: 66 | | Trustee | | August
2005 | | Retired; From 1964 to 2001, Deloitte & Touche LLP (retired as Partner, 2001); Trustee, Presbyterian Church (U.S.A.) Foundation (January 2005 to present) | | 4 | | None |
| |
|
39
trustees and officers (continued)
NEW COVENANT FUNDS
June 30, 2008
| | | | | | | |
| Trustees and Officers of the New Covenant Funds (continued) |
| |
| | | Position(s)
| | Length
| | Term of Office and
|
| | | Held With
| | of Time
| | Principal Occupation(s)
|
| Name and Age | | Trust | | Served | | During Past 5 Years |
| |
| |
| EXECUTIVE OFFICERS |
| |
|
| | | | | | | |
Anita J. Clemons
200 E. Twelfth St.
Jeffersonville, IN 47130
Age: 54 | | Vice
President | | April
2008 | | Vice President of Investments, Presbyterian Church (U.S.A.) Foundation and New Covenant Trust Company, N.A.(2008 to present); Vice President and Investment Officer, New Covenant Trust Company (2000-2008) |
| | | | | | | |
Harry Harper
200 E. Twelfth St.
Jeffersonville, IN 47130
Age: 64 | | Chief
Compliance
Officer | | August
2004 | | Chief Compliance Officer, New Covenant Trust Company (2002-present); Chief Compliance Officer, Allegheny Financial Group (2000-2002); Chief Compliance Officer, Keystone Financial (1997-2000) |
| | | | | | | |
Patrick J. Rudnick
315 E Michigan St.,
Milwaukee, WI 53202
Age: 34 | | Treasurer | | April
2008 | | Vice President, U.S. Bancorp Fund Services, LLC (2006 to present); Audit Manager, PricewaterhouseCoopers, LLP (1999-2006) |
| | | | | | | |
James R. Matel
315 E. Michigan St.,
Milwaukee, WI 53202
Age: 37 | | Secretary | | April
2008 | | Assistant Vice President, U.S. Bancorp Fund Services, LLC (1995 to present) |
| |
|
40
Item 2. Code of Ethics.
The registrant has adopted a code of ethics that applies to the registrant’s principal executive officer, principal financial officer, principal accounting officer or controller. The registrant has not made any amendments to its code of ethics during the period covered by this report. The registrant has not granted any waivers from any provisions of the code of ethics during the period covered by this report.
(1) File: A copy of the registrant’s Code of Ethics is filed herewith.
Item 3. Audit Committee Financial Expert.
The registrant’s board of directors has determined that there is at least one audit committee financial expert serving on its audit committee. William Lauderbach is the “audit committee financial expert” and is considered to be “independent” as each term is defined in Item 3 of Form N-CSR.
Item 4. Principal Accountant Fees and Services.
The registrant has engaged its principal accountant to perform audit services, audit-related services, tax services and other services during the past two fiscal years. “Audit services” refer to performing an audit of the registrant’s annual financial statements or services that are normally provided by the accountant in connection with statutory and regulatory filings or engagements for those fiscal years. “Audit-related services” refer to the assurance and related services by the principal accountant that are reasonably related to the performance of the audit. “Tax services” refer to professional services rendered by the principal accountant for tax compliance, tax advice, and tax planning. There were no “Other services” provided by the principal accountant. The following table details the aggregate fees billed or expected to be billed for each of the last two fiscal years for audit fees, audit-related fees, tax fees and other fees by the principal accountant.
| | | | | | | | | |
| | | FYE 6/30/2008 | | FYE 6/30/2007 |
| |
| Audit Fees | | $ | 78,000 | | | $ | 75,600 | |
| Audit-Related Fees | | $ | 0 | | | $ | 0 | |
| Tax Fees | | $ | 19,700 | | | $ | 18,600 | |
| All Other Fees | | $ | 0 | | | $ | 0 | |
The audit committee has adopted pre-approval policies and procedures that require the audit committee to pre-approve all audit and non-audit services of the registrant, including services provided to any entity affiliated with the registrant. All of the principal accountant’s hours spent on auditing the registrant’s financial statements were attributed to work performed by full-time permanent employees of the principal accountant. (If more than 50 percent of the accountant’s hours were spent to audit the registrant’s financial statements for the most recent fiscal year, state how many hours were attributed to work performed by persons other than the principal accountant’s full-time, permanent employees.)
The following table indicates the non-audit fees billed or expected to be billed by the registrant’s accountant for services to the registrant and to the registrant’s investment adviser (and any other controlling entity, etc.—not sub-adviser) for the last two years. The audit committee of the board of trustees has considered whether the provision of non-audit services that were rendered to the registrant’s investment adviser is compatible with maintaining the principal accountant’s independence and has concluded that the provision of such non-audit services by the accountant has not compromised the accountant’s independence.
| | | | | | | | | |
| Non-Audit Related Fees | | FYE 6/30/2008 | | FYE 6/30/2007 |
| |
| Registrant | | | N/A | | | | N/A | |
| Registrant’s Investment Adviser | | | N/A | | | | N/A | |
Item 5. Audit Committee of Listed Registrants.
Not applicable.
Item 6. Schedule of Investments.
Not Applicable.
Item 7. Disclosure of Proxy Voting Policies and Procedures for Closed-End Management Investment Companies.
Not Applicable.
Item 8. Portfolio Managers of Closed-End Management Investment Companies.
Not Applicable.
Item 9. Purchases of Equity Securities by Closed-End Management Investment Company and Affiliated Purchasers.
Not Applicable.
Item 10. Submission of Matters to a Vote of Security Holders.
Not Applicable.
Item 11. Controls and Procedures.
| (a) | | The Registrant’s Principal Executive Officer and Principal Financial Officer have reviewed the Registrant’s disclosure controls and procedures (as defined in Rule 30a-3(c) under the Investment Company Act of 1940 (the “Act”)) as of a date within 90 days of the filing of this report, as required by Rule 30a-3(b) under the Act and Rules 13a-15(b) or 15d-15(b) under the Securities Exchange Act of 1934. Based on their review, such officers have concluded that the disclosure controls and procedures are effective in ensuring that information required to be disclosed in this report is appropriately recorded, processed, summarized and |
2
| | | reported and made known to them by others within the Registrant and by the Registrant’s service provider. |
| |
| (b) | | There were no changes in the Registrant’s internal control over financial reporting (as defined in Rule 30a-3(d) under the Act) that occurred during the second fiscal quarter of the period covered by this report that has materially affected, or is reasonably likely to materially affect, the Registrant’s internal control over financial reporting. |
Item 12. Exhibits.
| (a) | | (1) Any code of ethics or amendment thereto, that is subject of the disclosure required by Item 2, to the extent that the registrant intends to satisfy Item 2 requirements through filing an exhibit. Filed here within. |
| |
| | | (2) Certifications pursuant to Section 302 of the Sarbanes-Oxley Act of 2002. Filed herewith. |
| |
| | | (3) Any written solicitation to purchase securities under Rule 23c-1 under the Act sent or given during the period covered by the report by or on behalf of the registrant to 10 or more persons. Not applicable to open-end investment companies. |
| |
| (b) | | Certification pursuant to Section 906 of the Sarbanes-Oxley Act of 2002. Furnished herewith. |
3
SIGNATURES
Pursuant to the requirements of the Securities Exchange Act of 1934 and the Investment Company Act of 1940, the registrant has duly caused this report to be signed on its behalf by the undersigned, thereunto duly authorized.
| | | | |
| (Registrant) New Covenant Funds | |
| | | | |
| By (Signature and Title) | /s/ Patrick J. Rudnick Patrick J. Rudnick, Treasurer | | |
| | | | |
Date 9/8/08 | | | |
Pursuant to the requirements of the Securities Exchange Act of 1934 and the Investment Company Act of 1940, this report has been signed below by the following persons on behalf of the registrant and in the capacities and on the dates indicated.
| | | | |
| By (Signature and Title) | /s/ Robert E. Leech Robert E. Leech, President | | |
| | | | |
Date 9/8/08 | | | |
| | | | |
| By (Signature and Title) | /s/ Patrick J. Rudnick Patrick J. Rudnick, Treasurer | | |
| | | | |
Date 9/8/08 | | | |
4