UNITED STATES
SECURITIES AND EXCHANGE COMMISSION
Washington, D.C. 20549
FORMN-CSR
CERTIFIED SHAREHOLDER REPORT OF REGISTERED MANAGEMENT
INVESTMENT COMPANIES
Investment Company Act File Number811-09025
New Covenant Funds
SEI Investments
One Freedom Valley Drive
Oaks, PA 19456
Timothy D. Barto, Esq.
SEI Investments Company
One Freedom Valley Drive
Oaks, PA 19456
Registrant’s telephone number, including area code:610-676-1000
Date of fiscal year end: June 30, 2020
Date of reporting period: December 31, 2019
| Item 1. | Reports to Stockholders. |
|  |

December 31, 2019
SEMI-ANNUAL REPORT
New Covenant Funds
| ➤ | New Covenant Growth Fund |
| ➤ | New Covenant Income Fund |
| ➤ | New Covenant Balanced Growth Fund |
| ➤ | New Covenant Balanced Income Fund |
Beginning on January 1, 2021, as permitted by regulations adopted by the Securities and Exchange Commission, paper copies of the Funds’ shareholder reports like this one will no longer be sent by mail, unless you specifically request paper copies of the reports from the Funds or from your financial intermediary, such as a broker-dealer or bank. Instead, the reports will be made available on a website, and you will be notified by mail each time a report is posted and provided with a website link to access the report.
If you already elected to receive shareholder reports electronically, you will not be affected by this change and you need not take any action. You may elect to receive shareholder reports and other communications from the Funds electronically by contacting your financial intermediary.
You may elect to receive all future reports in paper free of charge. If you invest through a financial intermediary, you can follow the instructions included with this disclosure, if applicable, or you can contact your financial intermediary to inform it that you wish to continue receiving paper copies of your shareholder reports. If you invest directly with the Funds, you can inform the Funds that you wish to continue receiving paper copies of your shareholder reports by calling1-877-835-4531. Your election to receive reports in paper will apply to all funds held with the SEI Funds or your financial intermediary.

| 1 | ||||
| ||||
| 37 | ||||
| ||||
| 38 | ||||
| ||||
| 39 | ||||
| ||||
| 41 | ||||
| ||||
| 45 | ||||
| ||||
| 57 | ||||
| ||||
Board of Trustees Considerations in Approving the Advisory andSub-Advisory Agreements | 58 | |||
| ||||
The Trust files its complete schedule of portfolio holdings with the Securities and Exchange Commission for the first and third quarters of each fiscal year as an exhibit to its reports on FormN-PORT. The Trust’s FormN-PORT reports are available on the Commission’s website at http://www.sec.gov.
A description of the policies and procedures that the Trust uses to determine how to vote proxies relating to portfolio securities, as well as information relating to how a Fund voted proxies relating to portfolio securities during the most recent12-month period ended June 30, is available (i) without charge, upon request, by calling1-877-835-4531; and (ii) on the Commission’s website at http://www.sec.gov.
SCHEDULE OF INVESTMENTS (Unaudited)
December 31, 2019
New Covenant Growth Fund
Sector Weightings†:
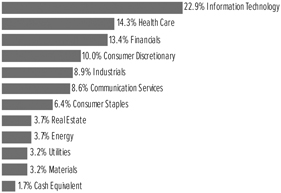
†Percentages are based on total investments.
| Description | Shares | Market Value ($ Thousands) | ||||||
COMMON STOCK — 97.9% |
| |||||||
Bosnia and Herzegovina — 0.0% |
| |||||||
RenaissanceRe Holdings Ltd. | 248 | $ | 49 | |||||
Canada — 0.1% | ||||||||
Lululemon Athletica Inc * | 1,014 | 235 | ||||||
Cayman Islands — 0.0% | ||||||||
Herbalife * | 1,088 | 52 | ||||||
Ireland — 1.3% | ||||||||
Accenture PLC, Cl A | 11,297 | 2,379 | ||||||
Ingersoll-Rand PLC | 7,234 | 962 | ||||||
Jazz Pharmaceuticals PLC * | 616 | 92 | ||||||
Mallinckrodt * | 13,812 | 48 | ||||||
Medtronic PLC | 19,976 | 2,266 | ||||||
NortonLifeLock | 13,065 | 333 | ||||||
Perrigo Co PLC | 211 | 11 | ||||||
| 6,091 | ||||||||
Puerto Rico — 0.0% | ||||||||
Popular Inc | 1,507 | 89 | ||||||
Switzerland — 0.0% | ||||||||
Garmin Ltd | 1,092 | 106 | ||||||
United Kingdom — 0.2% | ||||||||
Aon PLC | 2,921 | 608 | ||||||
Healthpeak Properties | 6,436 | 222 | ||||||
| 830 | ||||||||
United States — 96.3% | ||||||||
Communication Services — 8.5% |
| |||||||
Activision Blizzard Inc | 8,114 | 482 | ||||||
Alphabet Inc, CI A * | 4,360 | 5,840 | ||||||
Alphabet Inc, CI C * | 4,441 | 5,937 | ||||||
AMC Entertainment Holdings, Cl A | 6,158 | 45 | ||||||
AT&T Inc | 127,327 | 4,976 | ||||||
Bandwidth, CI A * | 821 | 53 | ||||||
Cardlytics * | 855 | 54 | ||||||
Care.com * | 3,844 | 58 | ||||||
| Description | Shares | Market Value ($ Thousands) | ||||||
COMMON STOCK (continued) |
| |||||||
Cargurus, CI A * | 1,369 | $ | 48 | |||||
Cars.com * | 4,178 | 51 | ||||||
CenturyLink Inc | 872 | 12 | ||||||
Charter Communications Inc, CI A * | 1,832 | 889 | ||||||
Cinemark Holdings Inc | 2,104 | 71 | ||||||
Clear Channel Outdoor Holdings, CI A * | 19,686 | 56 | ||||||
Cogent Communications Holdings | 807 | 53 | ||||||
Comcast Corp, Cl A | 60,142 | 2,705 | ||||||
comScore * | 10,205 | 50 | ||||||
DISH Network, CI A * | 1,451 | 51 | ||||||
Electronic Arts Inc * | 2,676 | 288 | ||||||
Emerald Expositions Events | 4,781 | 50 | ||||||
Eventbrite, CI A * | 2,537 | 51 | ||||||
EverQuote, CI A * | 1,468 | 50 | ||||||
EW Scripps, CI A | 3,299 | 52 | ||||||
Facebook lnc, CI A * | 33,558 | 6,888 | ||||||
Fox Corp, CI A | 1,372 | 51 | ||||||
Gogo * | 9,226 | 59 | ||||||
IMAX * | 2,244 | 46 | ||||||
Intelsat * | 8,389 | 59 | ||||||
Interpublic Group of Cos Inc/The | 8,487 | 196 | ||||||
Iridium Communications * | 2,090 | 51 | ||||||
John Wiley & Sons Inc, CI A | 236 | 11 | ||||||
Liberty Broadband, CI A * | 419 | 52 | ||||||
Liberty Broadband, CI C * | 414 | 52 | ||||||
Liberty Media Corp-Liberty Formula One, | 1,192 | 52 | ||||||
Liberty Media Corp-Liberty Formula One, | 259 | 12 | ||||||
Live Nation Entertainment Inc * | 181 | 13 | ||||||
Match Group * | 703 | 58 | ||||||
Meredith | 1,401 | 45 | ||||||
MSG Networks * | 2,988 | 52 | ||||||
New York Times, CI A | 1,515 | 49 | ||||||
Nexstar Media Group, CI A | 455 | 53 | ||||||
Omnicom Group Inc | 10,137 | 821 | ||||||
Scholastic | 1,266 | 49 | ||||||
Shenandoah Telecommunications | 1,286 | 54 | ||||||
Sirius XM Holdings | 7,153 | 51 | ||||||
Spotify Technology SA * | 201 | 30 | ||||||
Sprint Corp * | 2,200 | 11 | ||||||
Take-Two Interactive Software Inc * | 830 | 102 | ||||||
TechTarget * | 1,986 | 52 | ||||||
TEGNA | 3,052 | 51 | ||||||
T-Mobile US Inc * | 2,154 | 169 | ||||||
Twitter Inc * | 7,369 | 236 | ||||||
Verizon Communications Inc | 62,462 | 3,835 | ||||||
ViacomCBS, Cl B | 4,113 | 173 | ||||||
Walt Disney Co/The | 26,709 | 3,863 | ||||||
World Wrestling Entertainment, CI A | 780 | 51 | ||||||
Yelp, CI A * | 1,470 | 51 | ||||||
Zayo Group Holdings Inc * | 333 | 12 | ||||||
| New Covenant Funds / Semi-Annual Report / December 31, 2019 | 1 |
SCHEDULE OF INVESTMENTS (Unaudited)
December 31, 2019
New Covenant Growth Fund(Continued)
| Description | Shares | Market Value ($ Thousands) | ||||||
COMMON STOCK (continued) |
| |||||||
Zillow Group Inc, CI A * | 1,170 | $ | 54 | |||||
Zillow Group Inc, CI C * | 264 | 12 | ||||||
Zynga lnc, CIA * | 14,448 | 88 | ||||||
| 39,486 | ||||||||
Consumer Discretionary — 9.9% |
| |||||||
1-800-Flowers.com, CI A * | 3,668 | 53 | ||||||
Aaron’s | 832 | 48 | ||||||
Abercrombie & Fitch, Cl A | 2,970 | 51 | ||||||
Adient * | 2,126 | 45 | ||||||
Adtalem Global Education * | 1,460 | 51 | ||||||
Advance Auto Parts Inc | 317 | 51 | ||||||
Amazon.com Inc * | 5,880 | 10,865 | ||||||
AMC Networks, CI A * | 1,349 | 53 | ||||||
American Eagle Outfitters | 3,416 | 50 | ||||||
American Public Education * | 1,831 | 50 | ||||||
Aptiv PLC | 3,490 | 331 | ||||||
Aramark | 260 | 11 | ||||||
Asbury Automotive Group * | 425 | 48 | ||||||
AutoNation * | 970 | 47 | ||||||
AutoZone Inc * | 235 | 280 | ||||||
Beazer Homes USA * | 3,361 | 48 | ||||||
Bed Bath & Beyond | 2,963 | 51 | ||||||
Best Buy Co lnc | 3,307 | 290 | ||||||
Big Lots | 1,758 | 50 | ||||||
BJ’s Restaurants | 1,344 | 51 | ||||||
Bloomin’ Brands | 2,259 | 50 | ||||||
Booking Holdings Inc * | 563 | 1,156 | ||||||
Boot Barn Holdings * | 1,181 | 53 | ||||||
BorgWarner Inc | 2,278 | 99 | ||||||
Bright Horizons Family Solutions Inc * | 76 | 11 | ||||||
Brinker International | 1,180 | 50 | ||||||
Brunswick | 839 | 50 | ||||||
Buckle | 1,885 | 51 | ||||||
Burlington Stores Inc * | 482 | 110 | ||||||
Cable One Inc | 79 | 118 | ||||||
Caleres | 2,200 | 52 | ||||||
Callaway Golf | 2,383 | 51 | ||||||
Capri Holdings * | 1,319 | 50 | ||||||
CarMax Inc * | 1,086 | 95 | ||||||
Carnival Corp | 11,633 | 591 | ||||||
Carter’s | 471 | 52 | ||||||
Carvana Co, CI A * | 121 | 11 | ||||||
Cavco Industries * | 255 | 50 | ||||||
Cheesecake Factory | 1,236 | 48 | ||||||
Chegg * | 1,304 | 49 | ||||||
Chico’s FAS | 12,286 | 47 | ||||||
Children’s Place | 812 | 51 | ||||||
Chipotle Mexican Grill Inc, CI A * | 184 | 154 | ||||||
Choice Hotels International Inc | 113 | 12 | ||||||
Citi Trends | 2,295 | 53 | ||||||
Columbia Sportswear Co | 891 | 89 | ||||||
Conn’s * | 4,000 | 50 | ||||||
| Description | Shares | Market Value ($ Thousands) | ||||||
COMMON STOCK (continued) |
| |||||||
Cooper Tire & Rubber | 1,668 | $ | 48 | |||||
Cracker Barrel Old Country Store | 323 | 50 | ||||||
Dana | 2,660 | 48 | ||||||
Darden Restaurants Inc | 705 | 77 | ||||||
Dave & Buster’s Entertainment | 1,283 | 52 | ||||||
Deckers Outdoor * | 306 | 52 | ||||||
Denny’s * | 2,500 | 50 | ||||||
Designer Brands, CI A | 3,316 | 52 | ||||||
Dick’s Sporting Goods | 1,054 | 52 | ||||||
Dillard’s, CI A | 726 | 53 | ||||||
Discovery Inc, CI C * | 354 | 11 | ||||||
Dollar General Corp | 2,783 | 434 | ||||||
Dollar Tree Inc * | 1,466 | 138 | ||||||
Domino’s Pizza Inc | 309 | 91 | ||||||
Dorman Products * | 677 | 51 | ||||||
DR Horton Inc | 1,973 | 104 | ||||||
Duluth Holdings, CI B * | 4,946 | 52 | ||||||
Dunkin’ Brands Group Inc | 2,803 | 212 | ||||||
eBay Inc | 24,197 | 874 | ||||||
Ethan Allen Interiors | 2,741 | 52 | ||||||
Etsy lnc * | 1,162 | 51 | ||||||
Expedia Group Inc | 103 | 11 | ||||||
Express * | 10,267 | 50 | ||||||
Five Below * | 410 | 52 | ||||||
Flexsteel Industries | 2,468 | 49 | ||||||
Floor & Decor Holdings Inc, CI A * | 232 | 12 | ||||||
Foot Locker | 1,308 | 51 | ||||||
Ford Motor Co | 36,252 | 337 | ||||||
Fossil Group * | 6,641 | 52 | ||||||
Fox Factory Holding * | 749 | 52 | ||||||
frontdoor Inc * | 251 | 12 | ||||||
Gap lnc/The | 11,382 | 201 | ||||||
General Motors Co | 11,713 | 429 | ||||||
Gentex Corp | 3,795 | 110 | ||||||
Gentherm * | 1,113 | 49 | ||||||
Genuine Parts Co | 109 | 12 | ||||||
Goodyear Tire & Rubber Co/The | 690 | 11 | ||||||
Graham Holdings, Cl B | 78 | 50 | ||||||
Grand Canyon Education Inc * | 121 | 12 | ||||||
Group 1 Automotive | 479 | 48 | ||||||
GrubHub Inc * | 1,289 | 63 | ||||||
Guess? | 2,341 | 52 | ||||||
H&R Block Inc | 3,157 | 74 | ||||||
Hanesbrands lnc | 13,319 | 198 | ||||||
Harley-Davidson Inc | 306 | 11 | ||||||
Hasbro Inc | 2,632 | 278 | ||||||
Haverty Furniture | 2,408 | 49 | ||||||
Helen of Troy * | 304 | 55 | ||||||
Hibbett Sports * | 1,869 | 52 | ||||||
Hilton Grand Vacations Inc * | 3,016 | 104 | ||||||
Hilton Worldwide Holdings Inc | 4,365 | 484 | ||||||
Home Depot Inc/The | 16,979 | 3,708 | ||||||
| 2 | New Covenant Funds / Semi-Annual Report / December 31, 2019 |
| Description | Shares | Market Value ($ Thousands) | ||||||
COMMON STOCK (continued) | ||||||||
Hooker Furniture | 1,972 | $ | 51 | |||||
Hyatt Hotels Corp, Cl A | 135 | 12 | ||||||
Installed Building Products * | 694 | 48 | ||||||
iRobot * | 1,013 | 51 | ||||||
Jack in the Box | 658 | 51 | ||||||
Johnson Outdoors, CI A | 659 | 51 | ||||||
K12 * | 2,452 | 50 | ||||||
KB Home | 1,467 | 50 | ||||||
Kohl’s Corp | 1,859 | 95 | ||||||
Kontoor Brands | 1,282 | 54 | ||||||
L Brands Inc | 638 | 12 | ||||||
Laureate Education, CI A * | 2,881 | 51 | ||||||
La-Z-Boy, Cl Z | 1,597 | 50 | ||||||
LCI Industries | 483 | 52 | ||||||
Lear Corp | 893 | 123 | ||||||
Leggett & Platt Inc | 222 | 11 | ||||||
Lennar Corp, Cl B | 1,103 | 49 | ||||||
Lennar Corp, Cl A | 199 | 11 | ||||||
LGI Homes * | 695 | 49 | ||||||
Liberty Media -Liberty SiriusXM * | 1,054 | 51 | ||||||
Liberty Media -Liberty SiriusXM Group. CI C * | 1,062 | 51 | ||||||
LKQ Corp * | 317 | 11 | ||||||
Lowe’s Cos Inc | 15,716 | 1,882 | ||||||
Lumber Liquidators Holdings * | 5,050 | 49 | ||||||
M * | 1,195 | 47 | ||||||
Macy’s lnc | 4,042 | 69 | ||||||
Madison Square Garden Co/The * | 39 | 11 | ||||||
Malibu Boats, CI A * | 1,232 | 50 | ||||||
Marriott International Inc/MD, Cl A | 3,599 | 545 | ||||||
Marriott Vacations Worldwide | 394 | 51 | ||||||
MasterCraft Boat Holdings * | 3,123 | 49 | ||||||
Mattel Inc * | 14,805 | 201 | ||||||
McDonald’s Corp | 11,361 | 2,245 | ||||||
MDC Holdings | 1,302 | 50 | ||||||
Meritage Homes * | 794 | 49 | ||||||
Michaels * | 7,530 | 61 | ||||||
Mohawk Industries Inc * | 127 | 17 | ||||||
Monro | 626 | 49 | ||||||
Movado Group | 2,352 | 51 | ||||||
Murphy USA * | 422 | 49 | ||||||
Nathan’s Famous | 717 | 51 | ||||||
National Vision Holdings * | 1,563 | 51 | ||||||
Netflix Inc * | 5,391 | 1,744 | ||||||
Newell Brands Inc | 605 | 12 | ||||||
News Corp, Cl A | 829 | 12 | ||||||
NIKE Inc, CI B | 17,693 | 1,792 | ||||||
Nordstrom Inc | 3,866 | 158 | ||||||
Norwegian Cruise Line Holdings Ltd * | 206 | 12 | ||||||
NVR * | 13 | 50 | ||||||
Office Depot | 19,011 | 52 | ||||||
Ollie’s Bargain Outlet Holdings * | 746 | 49 | ||||||
OneSpaWorld Holdings | 3,063 | 52 | ||||||
| Description | Shares | Market Value ($ Thousands) | ||||||
COMMON STOCK (continued) | ||||||||
O’Reilly Automotive Inc * | 677 | $ | 297 | |||||
Oxford Industries | 665 | 50 | ||||||
Papa John’s International | 806 | 51 | ||||||
Penske Automotive Group | 957 | 48 | ||||||
PetMed Express | 2,172 | 51 | ||||||
Planet Fitness, CI A * | 685 | 51 | ||||||
Polaris Industries Inc | 966 | 98 | ||||||
Pool Corp | 54 | 11 | ||||||
PulteGroup Inc | 5,125 | 199 | ||||||
PVH Corp | 108 | 11 | ||||||
Quotient Technology * | 4,484 | 44 | ||||||
Qurate Retail Inc * | 1,412 | 12 | ||||||
Ralph Lauren Corp, Cl A | 690 | 81 | ||||||
RealReal * | 2,868 | 54 | ||||||
Red Robin Gourmet Burgers * | 1,675 | 55 | ||||||
Rent-A-Center, Cl A | 1,764 | 51 | ||||||
RH * | 224 | 48 | ||||||
Roku Inc, CI A * | 84 | 11 | ||||||
Ross Stores Inc | 3,209 | 374 | ||||||
Royal Caribbean Cruises Ltd | 8,804 | 1,175 | ||||||
Rubicon Project * | 7,204 | 59 | ||||||
Ruth’s Hospitality Group | 2,238 | 49 | ||||||
Sally Beauty Holdings * | 2,794 | 51 | ||||||
SeaWorld Entertainment * | 1,594 | 51 | ||||||
Service Corp International/US | 250 | 12 | ||||||
ServiceMaster Global Holdings * | 1,327 | 51 | ||||||
Shake Shack, CI A * | 847 | 50 | ||||||
Shutterstock * | 1,176 | 50 | ||||||
Signet Jewelers | 2,402 | 52 | ||||||
Six Flags Entertainment Corp | 248 | 11 | ||||||
Sleep Number * | 1,033 | 51 | ||||||
Stamps.com * | 630 | 53 | ||||||
Standard Motor Products | 943 | 50 | ||||||
Starbucks Corp | 16,902 | 1,486 | ||||||
Steven Madden | 1,178 | 51 | ||||||
Stitch Fix, CI A * | 1,950 | 50 | ||||||
Strategic Education | 331 | 53 | ||||||
Tapestry Inc | 2,803 | 76 | ||||||
Target Corp | 6,577 | 843 | ||||||
Taylor Morrison Home, CI A * | 2,239 | 49 | ||||||
Tempur-Pedic International * | 568 | 49 | ||||||
Tenneco, CI A * | 3,599 | 47 | ||||||
Tesla Inc * | 1,659 | 694 | ||||||
Texas Roadhouse, Cl A | 889 | 50 | ||||||
Thor Industries | 721 | 54 | ||||||
Tiffany & Co | 85 | 11 | ||||||
TJX Cos Inc/The | 13,863 | 846 | ||||||
Toll Brothers Inc | 2,246 | 89 | ||||||
TopBuild * | 476 | 49 | ||||||
Tractor Supply Co | 2,377 | 222 | ||||||
TRI Pointe Group * | 3,236 | 50 | ||||||
TripAdvisor * | 1,712 | 52 | ||||||
| New Covenant Funds / Semi-Annual Report / December 31, 2019 | 3 |
SCHEDULE OF INVESTMENTS (Unaudited)
December 31, 2019
New Covenant Growth Fund(Continued)
| Description | Shares | Market Value ($ Thousands) | ||||||||||
COMMON STOCK (continued) | ||||||||||||
Tupperware Brands Corp * | 6,142 | $ | 53 | |||||||||
Ulta Beauty lnc * | 279 | 71 | ||||||||||
Under Armour Inc, CI C * | 556 | 11 | ||||||||||
Unifi * | 1,944 | 49 | ||||||||||
Urban Outfitters lnc * | 417 | 12 | ||||||||||
Vail Resorts Inc | 46 | 11 | ||||||||||
VF Corp | 4,023 | 401 | ||||||||||
Visteon Corp * | 551 | 48 | ||||||||||
Wayfair lnc, CI A * | 590 | 53 | ||||||||||
Wendy’s Co/The | 11,419 | 254 | ||||||||||
Whirlpool Corp | 638 | 94 | ||||||||||
Williams-Sonoma Inc | 160 | 12 | ||||||||||
Wingstop | 582 | 50 | ||||||||||
Winnebago Industries | 1,043 | 55 | ||||||||||
Wolverine World Wide | 1,511 | 51 | ||||||||||
WW International * | 1,262 | 48 | ||||||||||
Wyndham Destinations Inc | 4,669 | 241 | ||||||||||
Wyndham Hotels & Resorts Inc | 189 | 12 | ||||||||||
Yum China Holdings Inc | 1,913 | 92 | ||||||||||
Yum! Brands Inc | 3,237 | 326 | ||||||||||
Zumiez * | 1,593 | 55 | ||||||||||
| 45,885 | ||||||||||||
Consumer Staples — 6.3% | ||||||||||||
Andersons | 1,960 | 50 | ||||||||||
Archer-Daniels-Midland Co | 4,581 | 212 | ||||||||||
B&G Foods | 2,907 | 52 | ||||||||||
Beyond Meat lnc * | 535 | 40 | ||||||||||
BJ’s Wholesale Club Holdings * | 2,099 | 48 | ||||||||||
Bunge Ltd | 1,596 | 92 | ||||||||||
Calavo Growers | 571 | 52 | ||||||||||
Campbell Soup Co | 10,354 | 512 | ||||||||||
Casey’s General Stores | 319 | 51 | ||||||||||
Chefs’ Warehouse * | 1,366 | 52 | ||||||||||
Church & Dwight Co lnc | 953 | 67 | ||||||||||
Clorox Co/The | 3,366 | 517 | ||||||||||
Coca-Cola Co/The | 65,159 | 3,607 | ||||||||||
Colgate-Palmolive Co | 14,526 | 1,000 | ||||||||||
Conagra Brands Inc | 14,479 | 496 | ||||||||||
Costco Wholesale Corp | 6,288 | 1,848 | ||||||||||
Coty Inc, CI A | 1,026 | 12 | ||||||||||
Darling Ingredients * | 1,847 | 52 | ||||||||||
Edgewell Personal Care * | 1,589 | 49 | ||||||||||
Energizer Holdings Inc | 231 | 12 | ||||||||||
Estee Lauder Cos Inc/The, Cl A | 2,390 | 494 | ||||||||||
Farmer Brothers * | 3,118 | 47 | ||||||||||
Flowers Foods Inc | 9,872 | 215 | ||||||||||
Fresh Del Monte Produce | 1,442 | 50 | ||||||||||
General Mills Inc | 13,887 | 744 | ||||||||||
Grocery Outlet Holding * | 1,603 | 52 | ||||||||||
Hain Celestial Group Inc/The * | 461 | 12 | ||||||||||
Hershey Co/The | 2,295 | 337 | ||||||||||
HF Foods Group * | 2,213 | 43 | ||||||||||
| Description | Shares | Market Value ($ Thousands) | ||||||||||
COMMON STOCK (continued) | ||||||||||||
Hormel Foods Corp | 4,797 | $ | 216 | |||||||||
Hostess Brands, CI A * | 3,470 | 50 | ||||||||||
Ingredion Inc | 1,110 | 103 | ||||||||||
J&J Snack Foods | 274 | 50 | ||||||||||
JM Smucker Co/The | 7,294 | 759 | ||||||||||
John B Sanfilippo & Son | 544 | 50 | ||||||||||
Kellogg Co | 6,713 | 464 | ||||||||||
Keurig Dr Pepper Inc | 18,064 | 523 | ||||||||||
Kimberly-Clark Corp | 6,484 | 892 | ||||||||||
Kraft Heinz Co/The | 4,224 | 136 | ||||||||||
Kroger Co/The | 26,817 | 777 | ||||||||||
Lamb Weston Holdings | 594 | 51 | ||||||||||
Lancaster Colony | 319 | 51 | ||||||||||
McCormick & Co Inc/MD | 2,916 | 495 | ||||||||||
Medifast | 533 | 58 | ||||||||||
Mondelez International Inc, Cl A | 18,714 | 1,031 | ||||||||||
Monster Beverage Corp * | 1,960 | 125 | ||||||||||
National Beverage * | 975 | 50 | ||||||||||
New Age Beverages * | 27,322 | 50 | ||||||||||
PepsiCo Inc | 28,202 | 3,854 | ||||||||||
Performance Food Group * | 1,023 | 53 | ||||||||||
Pilgrim’s Pride Corp * | 355 | 12 | ||||||||||
Post Holdings Inc * | 108 | 12 | ||||||||||
Pricesmart | 690 | 49 | ||||||||||
Procter & Gamble Co/The | 36,001 | 4,497 | ||||||||||
Sanderson Farms | 297 | 52 | ||||||||||
SpartanNash | 3,599 | 51 | ||||||||||
Spectrum Brands Holdings Inc | 183 | 12 | ||||||||||
Sprouts Farmers Market Inc * | 6,575 | 127 | ||||||||||
Sysco Corp | 8,925 | 763 | ||||||||||
Tootsie Roll Industries | 1,461 | 50 | ||||||||||
TreeHouse Foods Inc * | 237 | 11 | ||||||||||
Tyson Foods Inc, CI A | 1,963 | 179 | ||||||||||
US Foods Holding Corp * | 2,211 | 93 | ||||||||||
Walgreens Boots Alliance Inc | 8,946 | 527 | ||||||||||
Walmart lnc | 18,508 | 2,199 | ||||||||||
WD-40 | 259 | 50 | ||||||||||
|
| |||||||||||
| 29,337 | ||||||||||||
|
| |||||||||||
Energy — 3.7% | ||||||||||||
Altus Midstream, CI A * | 18,316 | 52 | ||||||||||
Antero Midstream | 7,912 | 60 | ||||||||||
Apache Corp | 4,822 | 123 | ||||||||||
Apergy Corp * | 383 | 13 | ||||||||||
Baker Hughes a GE Co, CI A | 4,496 | 115 | ||||||||||
Cabot Oil & Gas Corp | 3,306 | 58 | ||||||||||
Cactus, CI A | 1,525 | 52 | ||||||||||
Cheniere Energy Inc * | 1,265 | 77 | ||||||||||
Chesapeake Energy Corp * | 32,883 | 27 | ||||||||||
Chevron Corp | 25,760 | 3,104 | ||||||||||
Cimarex Energy | 995 | 52 | ||||||||||
CNX Resources * | 6,091 | 54 | ||||||||||
Concho Resources Inc | 142 | 13 | ||||||||||
| 4 | New Covenant Funds / Semi-Annual Report / December 31, 2019 |
| Description | Shares | Market Value ($ Thousands) | ||||||||||
COMMON STOCK (continued) | ||||||||||||
ConocoPhillips | 28,755 | $ | 1,870 | |||||||||
CONSOL Energy * | 3,418 | 50 | ||||||||||
Continental Resources lnc/OK | 337 | 12 | ||||||||||
Devon Energy Corp | 8,276 | 215 | ||||||||||
Diamond S Shipping * | 3,276 | 55 | ||||||||||
Diamondback Energy Inc | 133 | 12 | ||||||||||
Dril-Quip * | 1,072 | 50 | ||||||||||
EOG Resources Inc | 6,126 | 513 | ||||||||||
EQT Corp | 2,732 | 30 | ||||||||||
Equitrans Midstream Corp | 2,185 | 29 | ||||||||||
Exxon Mobil Corp | 58,201 | 4,061 | ||||||||||
Frank’s International * | 9,174 | 48 | ||||||||||
Golar LNG * | 3,888 | 55 | ||||||||||
Halliburton Co | 4,450 | 109 | ||||||||||
Helmerich & Payne Inc | 1,494 | 68 | ||||||||||
Hess Corp | 4,195 | 280 | ||||||||||
HollyFrontier Corp | 3,119 | 158 | ||||||||||
International Seaways * | 1,773 | 53 | ||||||||||
Kinder Morgan Inc/DE | 21,442 | 454 | ||||||||||
Kosmos Energy Ltd | 2,007 | 12 | ||||||||||
Magnolia Oil & Gas * | 3,984 | 50 | ||||||||||
Marathon Oil Corp | 5,472 | 74 | ||||||||||
Marathon Petroleum Corp | 7,000 | 422 | ||||||||||
Murphy Oil Corp | 449 | 12 | ||||||||||
Nabors Industries | 18,382 | 53 | ||||||||||
National Oilwell Varco Inc | 482 | 12 | ||||||||||
NextDecade * | 8,250 | 51 | ||||||||||
Noble Energy Inc | 6,179 | 154 | ||||||||||
Occidental Petroleum Corp | 7,026 | 290 | ||||||||||
Oceaneering International Inc * | 3,376 | 50 | ||||||||||
Oil States International * | 3,021 | 49 | ||||||||||
ONEOK Inc | 3,505 | 265 | ||||||||||
Parsley Energy, Cl A | 2,802 | 53 | ||||||||||
Patterson-UTI Energy | 4,952 | 52 | ||||||||||
PBF Energy Inc, CI A | 363 | 11 | ||||||||||
Phillips 66 | 5,367 | 598 | ||||||||||
Pioneer Natural Resources Co | 1,910 | 289 | ||||||||||
Range Resources Corp | 2,413 | 12 | ||||||||||
RPC * | 10,482 | 55 | ||||||||||
Schlumberger Ltd | 41,175 | 1,655 | ||||||||||
Southwestern Energy * | 21,739 | 53 | ||||||||||
Targa Resources Corp | 301 | 12 | ||||||||||
Teekay * | 9,842 | 52 | ||||||||||
Tellurian * | 7,235 | 53 | ||||||||||
Transocean * | 8,264 | 57 | ||||||||||
Valero Energy Corp | 4,715 | 442 | ||||||||||
Williams Cos Inc/The | 11,002 | 261 | ||||||||||
WPX Energy * | 3,940 | 54 | ||||||||||
|
| |||||||||||
| 17,125 | ||||||||||||
|
| |||||||||||
Financials — 13.2% |
| |||||||||||
Affiliated Managers Group Inc | 910 | 77 | ||||||||||
Aflac lnc | 6,398 | 338 | ||||||||||
| Description | Shares | Market Value ($ Thousands) | ||||||||||
COMMON STOCK (continued) | ||||||||||||
AGNC Investment | 2,838 | $ | 50 | |||||||||
Alleghany Corp * | 15 | 12 | ||||||||||
Allegiance Bancshares * | 1,318 | 50 | ||||||||||
Allstate Corp/The | 3,458 | 389 | ||||||||||
Ally Financial | 1,575 | 48 | ||||||||||
American Express Co | 9,360 | 1,165 | ||||||||||
American Financial Group | 449 | 49 | ||||||||||
American Homes 4 Rent, CI A‡ | 1,974 | 52 | ||||||||||
American International Group Inc | 8,217 | 422 | ||||||||||
American National Insurance | 421 | 50 | ||||||||||
Ameriprise Financial Inc | 1,250 | 208 | ||||||||||
Ameris Bancorp | 1,129 | 48 | ||||||||||
AMERISAFE | 743 | 49 | ||||||||||
Annaly Capital Management Inc‡ | 8,922 | 84 | ||||||||||
Anworth Mortgage Asset | 13,514 | 48 | ||||||||||
Apollo Commercial Real Estate Finance | 2,686 | 49 | ||||||||||
Arch Capital Group Ltd * | 2,404 | 103 | ||||||||||
Argo Group International Holdings | 750 | 49 | ||||||||||
ARMOUR Residential REIT | 2,854 | 51 | ||||||||||
Arthur J Gallagher & Co | 275 | 26 | ||||||||||
Artisan Partners Asset Management, Cl A | 1,589 | 51 | ||||||||||
Assetmark Financial Holdings * | 1,796 | 52 | ||||||||||
Assurant Inc | 87 | 11 | ||||||||||
Assured Guaranty | 994 | 49 | ||||||||||
Athene Holding, CI A * | 1,071 | 50 | ||||||||||
Atlantic Capital Bancshares * | 2,642 | 49 | ||||||||||
Atlantic Union Bankshares | 1,302 | 49 | ||||||||||
AXA Equitable Holdings Inc | 21,911 | 543 | ||||||||||
Axis Capital Holdings | 825 | 49 | ||||||||||
Axos Financial * | 1,657 | 50 | ||||||||||
Banc of California | 2,959 | 51 | ||||||||||
BancorpSouth Bank | 1,525 | 48 | ||||||||||
Bank of America Corp | 115,778 | 4,078 | ||||||||||
Bank of Hawaii Corp | 1,051 | 100 | ||||||||||
Bank of Marin Bancorp | 1,079 | 49 | ||||||||||
Bank of New York Mellon Corp/The | 12,656 | 637 | ||||||||||
Bank of NT Butterfield & Son | 1,324 | 49 | ||||||||||
Bank OZK | 366 | 11 | ||||||||||
BankUnited Inc | 2,418 | 88 | ||||||||||
Banner | 851 | 48 | ||||||||||
Berkshire Hathaway Inc, CI B * | 27,405 | 6,207 | ||||||||||
Berkshire Hills Bancorp | 1,501 | 49 | ||||||||||
BGC Partners, CI A | 8,389 | 50 | ||||||||||
BlackRock lnc, CI A | 1,478 | 743 | ||||||||||
Blackstone Mortgage Trust, Cl A | 1,347 | 50 | ||||||||||
B0K Financial | 568 | 50 | ||||||||||
Boston Private Financial Holdings | 4,112 | 50 | ||||||||||
Bridge Bancorp | 1,467 | 49 | ||||||||||
Brighthouse Financial Inc * | 268 | 11 | ||||||||||
Brown & Brown Inc | 290 | 11 | ||||||||||
Bryn Mawr Bank | 1,221 | 50 | ||||||||||
Camden National | 1,097 | 51 | ||||||||||
| New Covenant Funds / Semi-Annual Report / December 31, 2019 | 5 |
SCHEDULE OF INVESTMENTS (Unaudited)
December 31, 2019
New Covenant Growth Fund(Continued)
| Description | Shares | Market Value ($ Thousands) | ||||||||||
COMMON STOCK (continued) |
| |||||||||||
Capital One Financial Corp | 4,592 | $ | 473 | |||||||||
Capitol Federal Financial | 3,529 | 48 | ||||||||||
Capstead Mortgage | 6,235 | 49 | ||||||||||
Carolina Financial | 1,156 | 50 | ||||||||||
Cathay General Bancorp | 1,291 | 49 | ||||||||||
Cboe Global Markets Inc | 99 | 12 | ||||||||||
CenterState Bank | 1,942 | 49 | ||||||||||
Central Pacific Financial | 1,651 | 49 | ||||||||||
Charles Schwab Corp/The | 13,043 | 620 | ||||||||||
Cherry Hill Mortgage Investment | 3,400 | 50 | ||||||||||
Chimera Investment | 2,402 | 49 | ||||||||||
Chubb Ltd | 6,169 | 960 | ||||||||||
Cincinnati Financial Corp | 891 | 94 | ||||||||||
CIT Group | 1,060 | 48 | ||||||||||
Citigroup Inc | 29,852 | 2,385 | ||||||||||
Citizens Financial Group Inc | 2,381 | 97 | ||||||||||
City Holding | 607 | 50 | ||||||||||
CME Group Inc, CI A | 4,726 | 949 | ||||||||||
CNA Financial Corp | 253 | 11 | ||||||||||
Cohen & Steers | 764 | 48 | ||||||||||
Colony Credit Real Estate | 3,608 | 48 | ||||||||||
Columbia Banking System | 1,223 | 50 | ||||||||||
Comerica Inc | 1,232 | 88 | ||||||||||
Commerce Bancshares Inc/MO | 1,489 | 101 | ||||||||||
Community Bank System | 710 | 50 | ||||||||||
ConnectOne Bancorp | 1,891 | 49 | ||||||||||
Credit Acceptance Corp * | 177 | 78 | ||||||||||
Cullen/Frost Bankers Inc | 850 | 83 | ||||||||||
CVB Financial | 2,268 | 49 | ||||||||||
Discover Financial Services | 3,009 | 255 | ||||||||||
Dynex Capital | 2,918 | 49 | ||||||||||
E*TRADE Financial Corp | 1,729 | 78 | ||||||||||
Eagle Bancorp | 1,035 | 50 | ||||||||||
East West Bancorp Inc | 1,710 | 83 | ||||||||||
eHealth * | 512 | 49 | ||||||||||
Ellington Financial | 2,748 | 50 | ||||||||||
Enterprise Financial Services | 1,063 | 51 | ||||||||||
Erie Indemnity Co, CI A | 433 | 72 | ||||||||||
Evercore, Cl A | 659 | 49 | ||||||||||
Everest Re Group | 179 | 50 | ||||||||||
FactSet Research Systems Inc | 306 | 82 | ||||||||||
FB Financial | 1,250 | 50 | ||||||||||
Federal Agricultural Mortgage, Cl C | 597 | 50 | ||||||||||
Federated Investors, Cl B | 1,492 | 49 | ||||||||||
Fidelity National Financial | 1,063 | 48 | ||||||||||
Fifth Third Bancorp | 4,599 | 141 | ||||||||||
First American Financial | 814 | 48 | ||||||||||
First BanCorp | 4,571 | 48 | ||||||||||
First Busey | 1,790 | 49 | ||||||||||
First Citizens BancShares, CI A | 94 | 50 | ||||||||||
First Commonwealth Financial | 3,365 | 49 | ||||||||||
First Financial Bancorp | 1,921 | 49 | ||||||||||
| Description | Shares | Market Value ($ Thousands) | ||||||||||
COMMON STOCK (continued) |
| |||||||||||
First Financial Bankshares | 1,378 | $ | 48 | |||||||||
First Hawaiian Inc | 3,126 | 90 | ||||||||||
First Horizon National | 3,007 | 50 | ||||||||||
First Merchants | 1,182 | 49 | ||||||||||
First Midwest Bancorp | 2,129 | 49 | ||||||||||
First Republic Bank/CA | 831 | 98 | ||||||||||
FirstCash | 612 | 49 | ||||||||||
FNB | 3,907 | 50 | ||||||||||
Franklin Financial Network | 1,421 | 49 | ||||||||||
Franklin Resources Inc | 6,856 | 178 | ||||||||||
Fulton Financial | 2,789 | 49 | ||||||||||
Genworth Financial, CI A * | 10,439 | 46 | ||||||||||
German American Bancorp | 1,414 | 50 | ||||||||||
Globe Life | 108 | 11 | ||||||||||
Goldman Sachs Group Inc/The | 3,708 | 853 | ||||||||||
Goosehead Insurance, CI A * | 1,190 | 50 | ||||||||||
Granite Point Mortgage Trust | 2,716 | 50 | ||||||||||
Great Western Bancorp | 1,390 | 48 | ||||||||||
Hancock Whitney | 1,142 | 50 | ||||||||||
Hanmi Financial | 2,417 | 48 | ||||||||||
Hanover Insurance Group Inc/The | 694 | 95 | ||||||||||
HarborOne Bancorp * | 4,621 | 51 | ||||||||||
Hartford Financial Services Group Inc/The | 4,042 | 246 | ||||||||||
Heartland Financial USA | 1,003 | 50 | ||||||||||
Heritage Financial | 1,744 | 49 | ||||||||||
Home BancShares | 2,523 | 50 | ||||||||||
HomeStreet * | 1,465 | 50 | ||||||||||
Hope Bancorp | 3,233 | 48 | ||||||||||
Horace Mann Educators | 1,125 | 49 | ||||||||||
Houlihan Lokey, CI A | 1,032 | 50 | ||||||||||
Huntington Bancshares Inc/OH | 6,282 | 95 | ||||||||||
IBERIABANK | 662 | 50 | ||||||||||
Independent Bank | 580 | 48 | ||||||||||
Independent Bank Group | 846 | 47 | ||||||||||
Intercontinental Exchange Inc | 6,879 | 637 | ||||||||||
International Bancshares | 1,137 | 49 | ||||||||||
Invesco Ltd | 18,276 | 329 | ||||||||||
Invesco Mortgage Capital | 2,946 | 49 | ||||||||||
Investors Bancorp | 4,061 | 48 | ||||||||||
James River Group Holdings | 1,180 | 49 | ||||||||||
Janus Henderson Group | 2,016 | 49 | ||||||||||
Jefferies Financial Group | 2,313 | 49 | ||||||||||
JPMorgan Chase & Co | 52,769 | 7,356 | ||||||||||
KeyCorp | 12,904 | 261 | ||||||||||
Kinsale Capital Group | 488 | 50 | ||||||||||
KKR Real Estate Finance Trust | 2,440 | 50 | ||||||||||
Lakeland Bancorp | 2,890 | 50 | ||||||||||
Lazard Ltd, Cl A (A) | 2,316 | 93 | ||||||||||
Legg Mason | 1,356 | 49 | ||||||||||
Lending Club * | 3,859 | 49 | ||||||||||
Lending Tree * | 175 | 53 | ||||||||||
Lincoln National Corp | 3,621 | 214 | ||||||||||
| 6 | New Covenant Funds / Semi-Annual Report / December 31, 2019 |
| Description | Shares | Market Value ($ Thousands) | ||||||||
COMMON STOCK (continued) |
| |||||||||
Loews Corp | 222 | $ | 12 | |||||||
LPL Financial Holdings Inc | 1,036 | 96 | ||||||||
M&T Bank Corp | 929 | 158 | ||||||||
Markel Corp * | 10 | 11 | ||||||||
MarketAxess Holdings Inc | 305 | 116 | ||||||||
Marsh & McLennan Cos Inc | 17,124 | 1,908 | ||||||||
Mercantile Bank | 1,349 | 49 | ||||||||
Mercury General Corp | 233 | 11 | ||||||||
Meta Financial Group | 1,407 | 51 | ||||||||
MetLife Inc | 7,024 | 358 | ||||||||
MFA Financial | 6,337 | 49 | ||||||||
MGIC Investment | 3,455 | 49 | ||||||||
MidWestOne Financial Group | 1,357 | 49 | ||||||||
Moelis, CI A | 1,564 | 50 | ||||||||
Moody’s Corp | 1,782 | 423 | ||||||||
Morgan Stanley | 35,755 | 1,828 | ||||||||
Morningstar Inc | 1,607 | 243 | ||||||||
Mr Cooper Group * | 3,903 | 49 | ||||||||
MSCI Inc, CI A | 1,669 | 431 | ||||||||
Nasdaq Inc | 2,378 | 255 | ||||||||
Navient | 3,513 | 48 | ||||||||
NBT Bancorp | 1,213 | 49 | ||||||||
Nelnet, CI A | 793 | 46 | ||||||||
New Residential Investment | 3,080 | 50 | ||||||||
New York Community Bancorp Inc | 951 | 11 | ||||||||
New York Mortgage Trust | 7,776 | 48 | ||||||||
NMI Holdings, CI A * | 1,470 | 49 | ||||||||
Northern Trust Corp | 8,350 | 887 | ||||||||
Northfield Bancorp | 2,868 | 49 | ||||||||
OFG Bancorp | 2,119 | 50 | ||||||||
Old National Bancorp | 2,680 | 49 | ||||||||
Old Republic International | 2,203 | 49 | ||||||||
On Deck Capital * | 12,500 | 52 | ||||||||
OneMain Holdings Inc, CI A | 258 | 11 | ||||||||
Opus Bank | 1,893 | 49 | ||||||||
Pacific Premier Bancorp | 1,485 | 48 | ||||||||
PacWest Bancorp | 1,283 | 49 | ||||||||
Palomar Holdings, CI A * | 929 | 47 | ||||||||
PennyMac Mortgage Investment Trust | 2,213 | 49 | ||||||||
People’s United Financial Inc | 5,001 | 85 | ||||||||
Pinnacle Financial Partners Inc | 1,489 | 95 | ||||||||
PNC Financial Services Group Inc/The | 5,690 | 908 | ||||||||
PRA Group * | 1,320 | 48 | ||||||||
Preferred Bank | 845 | 51 | ||||||||
Primerica | 365 | 48 | ||||||||
Principal Financial Group Inc | 662 | 36 | ||||||||
ProAssurance | 1,351 | 49 | ||||||||
Progressive Corp/The | 6,981 | 505 | ||||||||
ProSight Global * | 2,999 | 48 | ||||||||
Prosperity Bancshares Inc | 1,192 | 86 | ||||||||
Provident Financial Services | 1,988 | 49 | ||||||||
Prudential Financial Inc | 16,015 | 1,501 | ||||||||
| Description | Shares | Market Value ($ Thousands) | ||||||||
COMMON STOCK (continued) |
| |||||||||
PS Business Parks‡ | 306 | $ | 50 | |||||||
Radian Group | 1,924 | 48 | ||||||||
Raymond James Financial Inc | 980 | 88 | ||||||||
Redwood Trust | 2,992 | 50 | ||||||||
Regions Financial Corp | 5,703 | 98 | ||||||||
Reinsurance Group of America Inc, CI A | 578 | 94 | ||||||||
Renasant | 1,366 | 48 | ||||||||
RLI | 545 | 49 | ||||||||
S&P Global Inc | 7,599 | 2,075 | ||||||||
S&T Bancorp | 1,247 | 50 | ||||||||
Safeguard Scientifics * | 4,091 | 45 | ||||||||
Sandy Spring Bancorp | 1,350 | 51 | ||||||||
Santander Consumer USA Holdings Inc | 476 | 11 | ||||||||
Seacoast Banking Corp of Florida * | 1,616 | 49 | ||||||||
Selective Insurance Group | 739 | 48 | ||||||||
ServisFirst Bancshares | 1,306 | 49 | ||||||||
Signature Bank/New York NY | 676 | 92 | ||||||||
Simmons First National, CI A | 1,836 | 49 | ||||||||
SLM Corp | 8,316 | 74 | ||||||||
South State | 573 | 50 | ||||||||
Starwood Property Trust‡ | 2,000 | 50 | ||||||||
State Street Corp | 9,970 | 789 | ||||||||
Sterling Bancorp | 2,321 | 49 | ||||||||
Stifel Financial | 807 | 49 | ||||||||
SVB Financial Group * | 346 | 87 | ||||||||
Synchrony Financial | 4,720 | 170 | ||||||||
Synovus Financial | 1,267 | 50 | ||||||||
T Rowe Price Group Inc | 2,711 | 330 | ||||||||
TCF Financial | 1,085 | 51 | ||||||||
TD Ameritrade Holding Corp | 221 | 11 | ||||||||
Texas Capital Bancshares * | 822 | 47 | ||||||||
TFS Financial Corp | 573 | 11 | ||||||||
Tiptree | 6,082 | 50 | ||||||||
Tompkins Financial | 549 | 50 | ||||||||
TPG RE Finance Trust | 2,439 | 49 | ||||||||
Travelers Cos Inc/The | 2,743 | 376 | ||||||||
TriCo Bancshares | 1,219 | 50 | ||||||||
TriState Capital Holdings * | 1,917 | 50 | ||||||||
Triumph Bancorp * | 1,296 | 49 | ||||||||
Truist Financial | 16,871 | 950 | ||||||||
Trustmark | 1,410 | 49 | ||||||||
Two Harbors Investment Corp | 6,390 | 93 | ||||||||
UMB Financial | 715 | 49 | ||||||||
Umpqua Holdings | 2,753 | 49 | ||||||||
Universal Insurance Holdings | 1,696 | 48 | ||||||||
Univest Financial | 1,820 | 49 | ||||||||
Unum Group | 1,638 | 48 | ||||||||
US Bancorp | 20,106 | 1,192 | ||||||||
Valley National Bancorp | 4,269 | 49 | ||||||||
Veritex Holdings | 1,729 | 50 | ||||||||
Virtu Financial, CI A | 3,026 | 48 | ||||||||
Voya Financial Inc | 4,001 | 244 | ||||||||
| New Covenant Funds / Semi-Annual Report / December 31, 2019 | 7 |
SCHEDULE OF INVESTMENTS (Unaudited)
December 31, 2019
New Covenant Growth Fund(Continued)
| Description | Shares | Market Value ($Thousands) | ||||||||||
COMMON STOCK (continued) | ||||||||||||
Waddell & Reed Financial, CI A | 2,974 | $ | 50 | |||||||||
Walker & Dunlop | 749 | 48 | ||||||||||
Washington Federal | 1,337 | 49 | ||||||||||
Washington Trust Bancorp | 924 | 50 | ||||||||||
Watford Holdings * | 1,869 | 47 | ||||||||||
Webster Financial | 934 | 50 | ||||||||||
Wells Fargo & Co | 53,452 | 2,876 | ||||||||||
Westamerica Bancorporation | 731 | 50 | ||||||||||
Western Alliance Bancorp | 1,801 | 103 | ||||||||||
White Mountains Insurance Group | 44 | 49 | ||||||||||
Willis Towers Watson PLC | 907 | 183 | ||||||||||
Wintrust Financial | 708 | 50 | ||||||||||
WR Berkley Corp | 165 | 11 | ||||||||||
Zions Bancorp NA | 1,771 | 92 | ||||||||||
| 61,169 | ||||||||||||
Health Care — 13.7% | ||||||||||||
Abbott Laboratories | 35,040 | 3,044 | ||||||||||
AbbVie Inc | 21,492 | 1,903 | ||||||||||
ABIOMED Inc * | 332 | 57 | ||||||||||
Acadia Healthcare * | 1,517 | 50 | ||||||||||
Acceleron Pharma * | 953 | 51 | ||||||||||
Adaptive Biotechnologies * | 1,704 | 51 | ||||||||||
Addus HomeCare * | 545 | 53 | ||||||||||
Adverum Biotechnologies * | 4,537 | 52 | ||||||||||
Aerie Pharmaceuticals * | 2,282 | 55 | ||||||||||
Agilent Technologies Inc | 7,874 | 672 | ||||||||||
Agios Pharmaceuticals * | 1,062 | 51 | ||||||||||
Aimmune Therapeutics * | 1,579 | 53 | ||||||||||
Aldeyra Therapeutics * | 9,277 | 54 | ||||||||||
Alexion Pharmaceuticals Inc * | 1,593 | 172 | ||||||||||
Align Technology Inc * | 602 | 168 | ||||||||||
Alkermes * | 2,433 | 50 | ||||||||||
Allakos * | 378 | 36 | ||||||||||
Allergan PLC | 4,194 | 802 | ||||||||||
Allogene Therapeutics * | 1,838 | 48 | ||||||||||
Alnylam Pharmaceuticals Inc * | 1,202 | 138 | ||||||||||
Amedisys * | 309 | 52 | ||||||||||
AmerisourceBergen Corp, Cl A | 138 | 12 | ||||||||||
Amgen Inc | 11,116 | 2,680 | ||||||||||
Amicus Therapeutics * | 5,193 | 51 | ||||||||||
AMN Healthcare Services * | 832 | 52 | ||||||||||
Anika Therapeutics * | 920 | 48 | ||||||||||
Anthem Inc | 2,950 | 891 | ||||||||||
Apollo Medical Holdings * | 2,730 | 50 | ||||||||||
Arena Pharmaceuticals * | 1,077 | 49 | ||||||||||
ArQule* | 2,487 | 50 | ||||||||||
Arrowhead Pharmaceuticals * | 788 | 50 | ||||||||||
Atara Biotherapeutics * | 3,254 | 54 | ||||||||||
Atrion | 71 | 53 | ||||||||||
Audentes Therapeutics * | 842 | 50 | ||||||||||
Avanos Medical * | 1,561 | 53 | ||||||||||
Avantor * | 2,699 | 49 | ||||||||||
| Description | Shares | Market Value ($ Thousands) | ||||||||||
COMMON STOCK (continued) | ||||||||||||
Axonics Modulation Technologies * | 1,976 | $ | 55 | |||||||||
Axsome Therapeutics * | 618 | 64 | ||||||||||
Baxter International Inc | 12,373 | 1,035 | ||||||||||
Becton Dickinson and Co | 4,437 | 1,207 | ||||||||||
BioDelivery Sciences International * | 7,746 | 49 | ||||||||||
Biogen Inc * | 3,113 | 924 | ||||||||||
Biohaven Pharmaceutical Holding * | 941 | 51 | ||||||||||
BioMarin Pharmaceutical Inc * | 1,042 | 88 | ||||||||||
Bio-Rad Laboratories Inc, CIA * | 32 | 12 | ||||||||||
BioSpecifics Technologies * | 871 | 50 | ||||||||||
Bio-Techne Corp | 53 | 12 | ||||||||||
BioTelemetry * | 1,100 | 51 | ||||||||||
Bluebird Bio Inc * | 645 | 57 | ||||||||||
Boston Scientific Corp * | 15,046 | 680 | ||||||||||
Bridgebio Pharma * | 1,432 | 50 | ||||||||||
Bristol-Myers Squibb Co | 38,732 | 2,486 | ||||||||||
Brookdale Senior Living * | 7,397 | 54 | ||||||||||
BrukerCorp | 233 | 12 | ||||||||||
Cantel Medical Corp | 163 | 12 | ||||||||||
Cara Therapeutics * | 2,942 | 47 | ||||||||||
Cardinal Health Inc | 2,213 | 112 | ||||||||||
CASI Pharmaceuticals * | 15,874 | 49 | ||||||||||
Catalent * | 949 | 53 | ||||||||||
Catalyst Pharmaceuticals * | 11,416 | 43 | ||||||||||
Centene Corp * | 2,830 | 178 | ||||||||||
Cerner Corp | 1,769 | 130 | ||||||||||
Change Healthcare * | 3,522 | 58 | ||||||||||
Charles River Laboratories International Inc * | 77 | 12 | ||||||||||
Chemed | 114 | 50 | ||||||||||
ChemoCentryx * | 1,468 | 58 | ||||||||||
Cigna Corp | 4,819 | 985 | ||||||||||
C0NMED | 450 | 50 | ||||||||||
Constellation Pharmaceuticals * | 1,060 | 50 | ||||||||||
Cooper Cos Inc/The | 36 | 12 | ||||||||||
Corcept Therapeutics * | 3,878 | 47 | ||||||||||
CorVel * | 606 | 53 | ||||||||||
Covetrus Inc * | 1,045 | 14 | ||||||||||
Crinetics Pharmaceuticals * | 2,310 | 58 | ||||||||||
CVS Health Corp | 28,143 | 2,091 | ||||||||||
Cytokinetics * | 5,011 | 53 | ||||||||||
Danaher Corp | 7,712 | 1,184 | ||||||||||
DaVita Inc * | 160 | 12 | ||||||||||
Deciphera Pharmaceuticals * | 716 | 45 | ||||||||||
Denali Therapeutics * | 2,631 | 46 | ||||||||||
DENTSPLY SIRONA Inc | 3,113 | 176 | ||||||||||
DexCom Inc * | 430 | 94 | ||||||||||
Dicerna Pharmaceuticals * | 1,898 | 42 | ||||||||||
Diplomat Pharmacy * | 12,723 | 51 | ||||||||||
Eagle Pharmaceuticals * | 828 | 50 | ||||||||||
Editas Medicine * | 1,596 | 47 | ||||||||||
Edwards Lifesciences Corp * | 2,828 | 660 | ||||||||||
Eidos Therapeutics * | 786 | 45 | ||||||||||
| 8 | New Covenant Funds / Semi-Annual Report / December 31, 2019 |
| Description | Shares | Market Value ($ Thousands) | ||||||||||
COMMON STOCK (continued) | ||||||||||||
Elanco Animal Health Inc * | 398 | $ | 12 | |||||||||
Eli Lilly & Co | 11,942 | 1,570 | ||||||||||
Emergent BioSolutions * | 950 | 51 | ||||||||||
Enanta Pharmaceuticals * | 785 | 48 | ||||||||||
Encompass Health Corp | 164 | 11 | ||||||||||
Envista Holdings * | 1,731 | 51 | ||||||||||
Epizyme * | 2,749 | 68 | ||||||||||
Esperion Therapeutics * | 962 | 57 | ||||||||||
Exact Sciences Corp * | 930 | 86 | ||||||||||
Exelixis Inc * | 4,344 | 77 | ||||||||||
Fate Therapeutics * | 2,450 | 48 | ||||||||||
FibroGen * | 1,053 | 45 | ||||||||||
Flexion Therapeutics * | 2,711 | 56 | ||||||||||
Forty Seven * | 1,401 | 55 | ||||||||||
G1 Therapeutics * | 1,715 | 45 | ||||||||||
Gilead Sciences Inc | 18,126 | 1,178 | ||||||||||
Glaukos * | 886 | 48 | ||||||||||
Global Blood Therapeutics * | 643 | 51 | ||||||||||
Globus Medical, CI A * | 851 | 50 | ||||||||||
Gossamer Bio * | 3,279 | 51 | ||||||||||
Halozyme Therapeutics * | 2,641 | 47 | ||||||||||
Hanger * | 1,891 | 52 | ||||||||||
HCA Healthcare Inc | 2,314 | 342 | ||||||||||
Health Catalyst * | 1,594 | 55 | ||||||||||
HealthEquity * | 673 | 50 | ||||||||||
Henry Schein Inc * | 2,612 | 174 | ||||||||||
Heron Therapeutics * | 1,977 | 46 | ||||||||||
Heska * | 532 | 51 | ||||||||||
Hill-Rom Holdings Inc | 825 | 94 | ||||||||||
HMS Holdings * | 1,707 | 50 | ||||||||||
Hologic lnc * | 216 | 11 | ||||||||||
Horizon Therapeutics * | 1,437 | 52 | ||||||||||
Humana Inc * | 1,529 | 560 | ||||||||||
ICU Medical Inc * | 62 | 12 | ||||||||||
IDEXX Laboratories Inc * | 535 | 140 | ||||||||||
lllumina Inc * | 3,200 | 1,062 | ||||||||||
Immunomedics * | 2,499 | 53 | ||||||||||
Incyte Corp * | 1,063 | 93 | ||||||||||
Innoviva * | 3,557 | 50 | ||||||||||
Inogen * | 706 | 48 | ||||||||||
Inovalon Holdings, CIA * | 2,733 | 51 | ||||||||||
Insmed * | 2,129 | 51 | ||||||||||
Inspire Medical Systems * | 715 | 53 | ||||||||||
Insulet Corp * | 65 | 11 | ||||||||||
Integer Holdings * | 625 | 50 | ||||||||||
Integra LifeSciences Holdings Corp * | 188 | 11 | ||||||||||
Intercept Pharmaceuticals * | 417 | 52 | ||||||||||
Intra-Cellular Therapies * | 3,894 | 134 | ||||||||||
Intuitive Surgical Inc * | 1,277 | 755 | ||||||||||
lonis Pharmaceuticals * | 782 | 47 | ||||||||||
lovance Biotherapeutics * | 1,782 | 49 | ||||||||||
IQVIA Holdings Inc * | 1,378 | 213 | ||||||||||
| Description | Shares | Market Value ($ Thousands) | ||||||||||
COMMON STOCK (continued) | ||||||||||||
Ironwood Pharmaceuticals, CI A * | 3,844 | $ | 51 | |||||||||
Johnson & Johnson | 40,148 | 5,856 | ||||||||||
Karuna Therapeutics * | 717 | 54 | ||||||||||
Karyopharm Therapeutics * | 2,929 | 56 | ||||||||||
Kiniksa Pharmaceuticals, CI A * | 4,016 | 44 | ||||||||||
Kodiak Sciences * | 702 | 50 | ||||||||||
Krystal Biotech * | 823 | 46 | ||||||||||
Kura Oncology * | 3,438 | 47 | ||||||||||
La Jolla Pharmaceutical * | 12,626 | 50 | ||||||||||
Laboratory Corp of America Holdings * | 515 | 87 | ||||||||||
Lantheus Holdings * | 2,408 | 49 | ||||||||||
LHC Group * | 383 | 53 | ||||||||||
Ligand Pharmaceuticals * | 462 | 48 | ||||||||||
LivaNova * | 657 | 50 | ||||||||||
Livongo Health * | 1,898 | 48 | ||||||||||
Luminex | 2,284 | 53 | ||||||||||
Madrigal Pharmaceuticals * | 531 | 48 | ||||||||||
McKesson Corp | 1,288 | 178 | ||||||||||
MEDNAX Inc * | 417 | 12 | ||||||||||
Merck & Co lnc | 45,906 | 4,175 | ||||||||||
Meridian Bioscience * | 5,130 | 50 | ||||||||||
Mettler-Toledo International Inc * | 562 | 446 | ||||||||||
Minerva Neurosciences * | 7,183 | 51 | ||||||||||
Mirati Therapeutics * | 429 | 55 | ||||||||||
Moderna Inc * | 2,959 | 58 | ||||||||||
Mylan NV* | 607 | 12 | ||||||||||
MyoKardia * | 751 | 55 | ||||||||||
Myriad Genetics * | 1,860 | 51 | ||||||||||
Natera * | 1,361 | 46 | ||||||||||
National Research | 779 | 51 | ||||||||||
Natus Medical * | 1,614 | 53 | ||||||||||
Nektar Therapeutics, CI A * | 2,328 | 50 | ||||||||||
Neogen * | 721 | 47 | ||||||||||
Neurocrine Biosciences Inc * | 1,089 | 117 | ||||||||||
Nevro * | 450 | 53 | ||||||||||
NextCure * | 952 | 54 | ||||||||||
NextGen Healthcare * | 3,392 | 54 | ||||||||||
NuVasive * | 653 | 50 | ||||||||||
Option Care Health * | 15,290 | 57 | ||||||||||
OraSure Technologies * | 6,042 | 48 | ||||||||||
PDL BioPharma * | 15,625 | 51 | ||||||||||
Pennant Group * | 1,609 | 53 | ||||||||||
Penumbra Inc * | 72 | 12 | ||||||||||
PerkinElmer Inc | 120 | 12 | ||||||||||
Pfizer Inc | 86,529 | 3,390 | ||||||||||
Phreesia * | 1,922 | 51 | ||||||||||
Portola Pharmaceuticals Inc * | 1,960 | 47 | ||||||||||
PRA Health Sciences Inc * | 108 | 12 | ||||||||||
Premier Inc, CI A * | 2,266 | 86 | ||||||||||
Principia Biopharma * | 925 | 51 | ||||||||||
Prothena * | 713 | 11 | ||||||||||
PTC Therapeutics * | 1,021 | 49 | ||||||||||
| New Covenant Funds / Semi-Annual Report / December 31, 2019 | 9 |
SCHEDULE OF INVESTMENTS (Unaudited)
December 31, 2019
New Covenant Growth Fund(Continued)
| Description | Shares | Market Value ($ Thousands) | ||||||||||
COMMON STOCK (continued) | ||||||||||||
Puma Biotechnology * | 5,574 | $ | 49 | |||||||||
QIAGEN NV * | 2,338 | 79 | ||||||||||
Quest Diagnostics Inc | 865 | 92 | ||||||||||
Radius Health * | 2,352 | 47 | ||||||||||
Reata Pharmaceuticals, CIA * | 235 | 48 | ||||||||||
Regeneron Pharmaceuticals Inc * | 1,105 | 415 | ||||||||||
Repligen * | 553 | 51 | ||||||||||
ResMed Inc | 2,930 | 454 | ||||||||||
Retrophin * | 3,434 | 49 | ||||||||||
Revance Therapeutics * | 3,056 | 50 | ||||||||||
Rhythm Pharmaceuticals * | 2,112 | 48 | ||||||||||
Rubius Therapeutics * | 3,679 | 35 | ||||||||||
Sage Therapeutics Inc * | 516 | 37 | ||||||||||
Sarepta Therapeutics Inc * | 87 | 11 | ||||||||||
Seattle Genetics * | 441 | 50 | ||||||||||
Shockwave Medical * | 1,114 | 49 | ||||||||||
Simulations Plus | 1,477 | 43 | ||||||||||
Sorrento Therapeutics * | 12,406 | 42 | ||||||||||
Spero Therapeutics * | 4,416 | 42 | ||||||||||
STAAR Surgical * | 1,343 | 47 | ||||||||||
STERIS PLC | 1,661 | 253 | ||||||||||
Stryker Corp | 3,855 | 809 | ||||||||||
Supernus Pharmaceuticals * | 2,174 | 52 | ||||||||||
Surmodics * | 1,169 | 48 | ||||||||||
Synlogic * | 22,321 | 58 | ||||||||||
Synthorx * | 735 | 51 | ||||||||||
Syros Pharmaceuticals * | 1,610 | 11 | ||||||||||
Tactile Systems Technology * | 728 | 49 | ||||||||||
Tandem Diabetes Care * | 798 | 48 | ||||||||||
Teladoc Health * | 630 | 53 | ||||||||||
Teleflex Inc | 742 | 279 | ||||||||||
TG Therapeutics * | 4,916 | 55 | ||||||||||
Theravance Biopharma * | 2,200 | 57 | ||||||||||
Thermo Fisher Scientific Inc | 5,075 | 1,649 | ||||||||||
Turning Point Therapeutics * | 828 | 52 | ||||||||||
Ultragenyx Pharmaceutical * | 1,143 | 49 | ||||||||||
United Therapeutics * | 559 | 49 | ||||||||||
UnitedHealth Group Inc | 17,361 | 5,104 | ||||||||||
Universal Health Services Inc, Cl B | 80 | 11 | ||||||||||
UroGen Pharma * | 1,543 | 51 | ||||||||||
US Physical Therapy | 428 | 49 | ||||||||||
Varex Imaging * | 1,631 | 49 | ||||||||||
Varian Medical Systems Inc * | 1,773 | 252 | ||||||||||
Veeva Systems Inc, CI A * | 904 | 127 | ||||||||||
Vertex Pharmaceuticals Inc * | 3,062 | 670 | ||||||||||
Viking Therapeutics * | 6,150 | 49 | ||||||||||
Waters Corp * | 395 | 92 | ||||||||||
WellCare Health Plans Inc * | 36 | 12 | ||||||||||
West Pharmaceutical Services Inc | 1,875 | 282 | ||||||||||
Wright Medical Group * | 1,682 | 51 | ||||||||||
Zimmer Biomet Holdings Inc | 3,501 | 524 | ||||||||||
Zoetis lnc, CI A | 6,022 | 797 | ||||||||||
| Description | Shares | Market Value ($ Thousands) | ||||||||||
COMMON STOCK (continued) | ||||||||||||
Zogenix * | 947 | $ | 49 | |||||||||
| 63,452 | ||||||||||||
Industrials — 8.7% | ||||||||||||
3M Co | 10,841 | 1,913 | ||||||||||
AAON | 997 | 49 | ||||||||||
AAR | 1,101 | 50 | ||||||||||
ABM Industries | 1,349 | 51 | ||||||||||
ACCO Brands | 5,214 | 49 | ||||||||||
Acuity Brands Inc | 84 | 12 | ||||||||||
ADT | 6,039 | 48 | ||||||||||
Advanced Disposal Services * | 1,523 | 50 | ||||||||||
AECOM * | 6,633 | 286 | ||||||||||
AeroVironment * | 790 | 49 | ||||||||||
AGCO Corp | 149 | 12 | ||||||||||
Air Lease, Cl A | 1,053 | 50 | ||||||||||
Aircastle | 1,564 | 50 | ||||||||||
Alamo Group | 424 | 53 | ||||||||||
Alaska Air Group Inc | 3,175 | 215 | ||||||||||
Albany International, CI A | 636 | 48 | ||||||||||
Allegiant Travel, CI A | 281 | 49 | ||||||||||
Allegion PLC | 855 | 106 | ||||||||||
Allison Transmission Holdings Inc | 1,870 | 90 | ||||||||||
Altra Industrial Motion | 1,437 | 52 | ||||||||||
AMERCO * | 136 | 51 | ||||||||||
American Airlines Group Inc | 405 | 12 | ||||||||||
American Woodmark * | 461 | 48 | ||||||||||
AMETEK Inc | 990 | 99 | ||||||||||
AO Smith Corp | 1,708 | 81 | ||||||||||
Apogee Enterprises | 1,229 | 40 | ||||||||||
Applied Industrial Technologies | 745 | 50 | ||||||||||
ArcBest | 1,766 | 49 | ||||||||||
Arconic Inc | 7,379 | 227 | ||||||||||
Arcosa Inc | 1,128 | 50 | ||||||||||
Argan | 1,315 | 53 | ||||||||||
Armstrong Flooring * | 11,849 | 51 | ||||||||||
Armstrong World Industries Inc | 979 | 92 | ||||||||||
ASGN * | 723 | 51 | ||||||||||
Astec Industries | 1,175 | 49 | ||||||||||
Astronics * | 1,739 | 49 | ||||||||||
Atkore International Group * | 1,234 | 50 | ||||||||||
Axon Enterprise * | 701 | 51 | ||||||||||
AZZ | 1,071 | 49 | ||||||||||
Barnes Group | 807 | 50 | ||||||||||
Barrett Business Services | 547 | 49 | ||||||||||
Bloom Energy, CI A * | 7,553 | 56 | ||||||||||
Brady, Cl A | 873 | 50 | ||||||||||
Brink’s | 540 | 49 | ||||||||||
BWX Technologies Inc | 184 | 11 | ||||||||||
Caesarstone * | 3,257 | 49 | ||||||||||
Carlisle | 311 | 50 | ||||||||||
Casella Waste Systems, CI A * | 1,080 | 50 | ||||||||||
CBIZ * | 1,805 | 49 | ||||||||||
| 10 | New Covenant Funds / Semi-Annual Report / December 31, 2019 |
| Description | Shares | Market Value ($ Thousands) | ||||||||||
COMMON STOCK (continued) | ||||||||||||
CH Robinson Worldwide Inc | 148 | $ | 12 | |||||||||
Chart Industries * | 807 | 54 | ||||||||||
Cimpress * | 398 | 50 | ||||||||||
Cintas Corp | 1,907 | 513 | ||||||||||
CIRCOR International * | 1,110 | 51 | ||||||||||
Clean Harbors Inc * | 137 | 12 | ||||||||||
Colfax * | 1,455 | 53 | ||||||||||
Comfort Systems USA | 988 | 49 | ||||||||||
Construction Partners, CI A * | 2,838 | 48 | ||||||||||
Continental Building Products * | 1,374 | 50 | ||||||||||
Copa Holdings, CI A | 469 | 51 | ||||||||||
Copart Inc * | 1,284 | 117 | ||||||||||
CoStar Group Inc * | 266 | 159 | ||||||||||
Covanta Holding | 3,388 | 50 | ||||||||||
Crane Co | 135 | 12 | ||||||||||
CSW Industrials | 645 | 50 | ||||||||||
CSX Corp | 9,694 | 701 | ||||||||||
Cummins Inc | 3,179 | 569 | ||||||||||
Curtiss-Wright Corp | 1,789 | 252 | ||||||||||
Deere & Co | 4,735 | 820 | ||||||||||
Delta Air Lines Inc | 20,837 | 1,219 | ||||||||||
Deluxe | 981 | 49 | ||||||||||
Donaldson Co Inc | 202 | 12 | ||||||||||
Douglas Dynamics | 918 | 50 | ||||||||||
Dover Corp | 2,207 | 254 | ||||||||||
Dycom Industries * | 1,064 | 50 | ||||||||||
Eaton Corp PLC | 13,217 | 1,252 | ||||||||||
EMCOR Group | 565 | 49 | ||||||||||
Emerson Electric Co | 6,592 | 503 | ||||||||||
EnerSys | 664 | 50 | ||||||||||
EnPro Industries | 738 | 49 | ||||||||||
Equifax Inc | 85 | 12 | ||||||||||
ESCO Technologies | 568 | 53 | ||||||||||
Expeditors International of Washington Inc | 1,163 | 91 | ||||||||||
Exponent | 727 | 50 | ||||||||||
Fastenal Co | 6,120 | 226 | ||||||||||
Federal Signal | 1,560 | 50 | ||||||||||
FedEx Corp | 3,239 | 490 | ||||||||||
Flowserve Corp | 239 | 12 | ||||||||||
Fluor Corp | 4,373 | 83 | ||||||||||
Forrester Research * | 1,169 | 49 | ||||||||||
Fortune Brands Home & Security Inc | 174 | 11 | ||||||||||
Forward Air | 727 | 51 | ||||||||||
Franklin Electric | 897 | 51 | ||||||||||
FTI Consulting * | 443 | 49 | ||||||||||
Gardner Denver Holdings Inc * | 318 | 12 | ||||||||||
Gates Industrial Corp PLC * | 886 | 12 | ||||||||||
GATX | 603 | 50 | ||||||||||
Generac Holdings * | 496 | 50 | ||||||||||
General Electric Co | 121,638 | 1,357 | ||||||||||
Gibraltar Industries * | 959 | 48 | ||||||||||
Graco Inc | 223 | 12 | ||||||||||
| Description | Shares | Market Value ($ Thousands) | ||||||||||
COMMON STOCK (continued) | ||||||||||||
GrafTech International Ltd | 954 | $ | 11 | |||||||||
Granite Construction | 1,780 | 49 | ||||||||||
Great Lakes Dredge & Dock * | 4,289 | 49 | ||||||||||
Greenbrier | 1,583 | 51 | ||||||||||
Hawaiian Holdings | 1,619 | 47 | ||||||||||
HD Supply Holdings Inc * | 1,986 | 80 | ||||||||||
Healthcare Services Group | 2,050 | 50 | ||||||||||
Heartland Express | 2,380 | 50 | ||||||||||
HEICO Corp | 4,884 | 557 | ||||||||||
HEICO Corp, CI A | 4,197 | 376 | ||||||||||
Helios Technologies | 1,091 | 50 | ||||||||||
Herc Holdings * | 1,012 | 50 | ||||||||||
Herman Miller | 1,053 | 44 | ||||||||||
Hexcel Corp | 4,105 | 301 | ||||||||||
Hillenbrand | 1,501 | 50 | ||||||||||
HNI | 1,268 | 48 | ||||||||||
Honeywell International Inc | 10,659 | 1,887 | ||||||||||
Hub Group, CI A * | 976 | 50 | ||||||||||
Hubbell lnc, CI B | 682 | 101 | ||||||||||
IAA * | 253 | 12 | ||||||||||
ICF International | 545 | 50 | ||||||||||
IDEX Corp | 68 | 12 | ||||||||||
IHS Markit Ltd * | 3,910 | 295 | ||||||||||
Illinois Tool Works Inc | 10,776 | 1,936 | ||||||||||
Insperity | 592 | 51 | ||||||||||
Interface, CI A | 2,949 | 49 | ||||||||||
ITT Inc | 1,404 | 104 | ||||||||||
Jacobs Engineering Group Inc | 1,091 | 98 | ||||||||||
JB Hunt Transport Services | 437 | 51 | ||||||||||
JetBlue Airways Corp * | 4,688 | 88 | ||||||||||
John Bean Technologies | 439 | 49 | ||||||||||
Johnson Controls International plc | 22,116 | 900 | ||||||||||
Kadant | 475 | 50 | ||||||||||
Kaman | 743 | 49 | ||||||||||
Kansas City Southern | 1,741 | 267 | ||||||||||
KAR Auction Services | 2,303 | 50 | ||||||||||
Kelly Services, Cl A | 2,214 | 50 | ||||||||||
Kennametal | 1,343 | 50 | ||||||||||
Kforce | 1,239 | 49 | ||||||||||
Kimball International, Cl B | 2,422 | 50 | ||||||||||
Kirby Corp * | 1,032 | 92 | ||||||||||
Knight-Swift Transportation Holdings, Cl A | 1,357 | 49 | ||||||||||
Knoll | 1,853 | 47 | ||||||||||
Korn Ferry | 1,193 | 51 | ||||||||||
Landstar System Inc | 432 | 49 | ||||||||||
Lennox International Inc | 44 | 11 | ||||||||||
Lincoln Electric Holdings Inc | 1,027 | 99 | ||||||||||
Lindsay | 523 | 50 | ||||||||||
Lyft lnc, CI A * | 240 | 10 | ||||||||||
Macquarie Infrastructure Corp | 266 | 11 | ||||||||||
ManpowerGroup Inc | 3,586 | 348 | ||||||||||
Marten Transport | 2,313 | 50 | ||||||||||
| New Covenant Funds / Semi-Annual Report / December 31, 2019 | 11 |
SCHEDULE OF INVESTMENTS (Unaudited)
December 31, 2019
New Covenant Growth Fund(Continued)
| Description | Shares | Market Value ($ Thousands) | ||||||||||
COMMON STOCK (continued) | ||||||||||||
Masco Corp | 6,315 | $ | 303 | |||||||||
MasTec * | 795 | 51 | ||||||||||
Matson | 1,273 | 52 | ||||||||||
Maxar Technologies | 3,949 | 62 | ||||||||||
McGrath RentCorp | 666 | 51 | ||||||||||
Mercury Systems * | 708 | 49 | ||||||||||
Meritor * | 2,088 | 55 | ||||||||||
Middleby Corp/The * | 103 | 11 | ||||||||||
Mobile Mini | 1,315 | 50 | ||||||||||
Moog, CI A | 580 | 49 | ||||||||||
MRC Global * | 3,597 | 49 | ||||||||||
MSA Safety | 392 | 50 | ||||||||||
MSC Industrial Direct Co lnc, CI A | 1,115 | 87 | ||||||||||
Nielsen Holdings PLC | 7,584 | 154 | ||||||||||
Nordson Corp | 600 | 98 | ||||||||||
Norfolk Southern Corp | 3,218 | 625 | ||||||||||
NOW * | 4,359 | 49 | ||||||||||
NV5 Global * | 1,080 | 54 | ||||||||||
nVent Electric PLC | 457 | 12 | ||||||||||
Old Dominion Freight Line | 267 | 51 | ||||||||||
Omega Flex | 448 | 48 | ||||||||||
Oshkosh Corp | 2,762 | 261 | ||||||||||
Owens Corning | 4,958 | 323 | ||||||||||
PACCAR Inc | 2,134 | 169 | ||||||||||
Parker-Hannifin Corp | 1,231 | 253 | ||||||||||
Parsons * | 1,198 | 49 | ||||||||||
Pentair PLC | 4,928 | 226 | ||||||||||
Pitney Bowes | 11,792 | 48 | ||||||||||
Proto Labs * | 491 | 50 | ||||||||||
Quanex Building Products | 2,637 | 45 | ||||||||||
Quanta Services Inc | 2,291 | 93 | ||||||||||
Raven Industries | 1,437 | 50 | ||||||||||
RBC Bearings * | 320 | 51 | ||||||||||
Regal Beloit Corp | 1,068 | 91 | ||||||||||
Republic Services Inc, CI A | 539 | 48 | ||||||||||
Resideo Technologies Inc * | 448 | 5 | ||||||||||
Rexnord * | 1,539 | 50 | ||||||||||
Robert Half international | 806 | 51 | ||||||||||
Rockwell Automation Inc | 1,620 | 328 | ||||||||||
Rollins Inc | 2,355 | 78 | ||||||||||
Roper Technologies Inc | 838 | 297 | ||||||||||
RR Donnelley & Sons | 12,049 | 48 | ||||||||||
Ryder System Inc | 1,425 | 77 | ||||||||||
Saia * | 547 | 51 | ||||||||||
Schneider National Inc, Cl B | 521 | 11 | ||||||||||
Sensata Technologies Holding PLC * | 4,273 | 230 | ||||||||||
Simpson Manufacturing | 643 | 52 | ||||||||||
Southwest Airlines Co | 3,131 | 169 | ||||||||||
SP Plus * | 1,169 | 50 | ||||||||||
Spartan Motors | 2,836 | 51 | ||||||||||
Spirit AeroSystems Holdings Inc, Cl A | 9,098 | 663 | ||||||||||
Spirit Airlines * | 1,221 | 49 | ||||||||||
| Description | Shares | Market Value ($ Thousands) | ||||||||||
COMMON STOCK (continued) | ||||||||||||
SPX * | 999 | $ | 51 | |||||||||
SPX FLOW * | 1,044 | 51 | ||||||||||
Stanley Black & Decker Inc | 1,349 | 224 | ||||||||||
Steelcase, Cl A | 2,620 | 54 | ||||||||||
Stericycle lnc * | 179 | 11 | ||||||||||
Teledyne Technologies Inc * | 878 | 304 | ||||||||||
Tennant | 639 | 50 | ||||||||||
Terex | 1,651 | 49 | ||||||||||
Tetra Tech | 564 | 49 | ||||||||||
Timken Co/The | 204 | 11 | ||||||||||
Toro Co/The | 1,175 | 94 | ||||||||||
TPI Composites * | 2,686 | 50 | ||||||||||
TransDigm Group Inc * | 1,732 | 970 | ||||||||||
TransUnion | 2,713 | 232 | ||||||||||
Trex * | 567 | 51 | ||||||||||
TriMas * | 1,583 | 50 | ||||||||||
TriNet Group * | 898 | 51 | ||||||||||
Trinity Industries Inc | 511 | 11 | ||||||||||
Triumph Group | 1,853 | 47 | ||||||||||
TrueBlue * | 2,106 | 51 | ||||||||||
Uber Technologies * | 6,090 | 181 | ||||||||||
UniFirst | 235 | �� | 47 | |||||||||
Union Pacific Corp | 12,488 | 2,258 | ||||||||||
United Airlines Holdings Inc * | 2,850 | 251 | ||||||||||
United Parcel Service Inc, Cl B | 9,414 | 1,102 | ||||||||||
United Rentals Inc * | 1,692 | 282 | ||||||||||
Univar lnc * | 476 | 12 | ||||||||||
Universal Forest Products | 1,033 | 49 | ||||||||||
US Ecology | 900 | 52 | ||||||||||
Valmont Industries Inc | 76 | 11 | ||||||||||
Vectrus * | 984 | 50 | ||||||||||
Verisk Analytics Inc, CI A | 1,729 | 258 | ||||||||||
Viad | 737 | 50 | ||||||||||
Wabash National | 3,217 | 47 | ||||||||||
WABCO Holdings Inc * | 649 | 88 | ||||||||||
Wabtec Corp | 465 | 36 | ||||||||||
Waste Management Inc | 6,467 | 737 | ||||||||||
Watsco lnc | 537 | 97 | ||||||||||
Watts Water Technologies, Cl A | 507 | 51 | ||||||||||
Welbilt * | 3,137 | 49 | ||||||||||
Werner Enterprises | 1,360 | 49 | ||||||||||
Wesco Aircraft Holdings * | 4,537 | 50 | ||||||||||
WESCO International Inc * | 3,527 | 209 | ||||||||||
Woodward Inc | 769 | 91 | ||||||||||
WW Grainger Inc | 2,835 | 960 | ||||||||||
XPO Logistics Inc * | 1,396 | 111 | ||||||||||
Xylem Inc/NY | 8,168 | 644 | ||||||||||
|
| |||||||||||
| 40,364 | ||||||||||||
|
| |||||||||||
Information Technology — 22.2% | ||||||||||||
2U lnc * | 2,061 | 49 | ||||||||||
8x8 * | 2,725 | 50 | ||||||||||
Acacia Communications * | 744 | 50 | ||||||||||
| 12 | New Covenant Funds / Semi-Annual Report / December 31, 2019 |
| Description | Shares | Market Value ($ Thousands) | ||||||||||
COMMON STOCK (continued) |
| |||||||||||
ACI Worldwide * | 1,373 | $ | 52 | |||||||||
Adobe lnc * | 10,406 | 3,432 | ||||||||||
ADTRAN | 5,303 | 52 | ||||||||||
Advanced Energy Industries * | 725 | 52 | ||||||||||
Advanced Micro Devices Inc * | 10,606 | 486 | ||||||||||
Agilysys * | 2,024 | 51 | ||||||||||
Akamai Technologies Inc * | 3,119 | 269 | ||||||||||
Akoustis Technologies * | 6,091 | 49 | ||||||||||
Alarm.com Holdings * | 1,192 | 51 | ||||||||||
Alliance Data Systems Corp | 1,335 | 150 | ||||||||||
Altair Engineering, CI A * | 1,454 | 52 | ||||||||||
Alteryx Inc, CI A * | 118 | 12 | ||||||||||
Ambarella * | 885 | 54 | ||||||||||
Amdocs Ltd | 3,632 | 262 | ||||||||||
Amkor Technology * | 3,864 | 50 | ||||||||||
Amphenol Corp, CI A | 2,090 | 226 | ||||||||||
Analog Devices Inc | 4,564 | 542 | ||||||||||
Anaplan Inc * | 217 | 11 | ||||||||||
Anixter International * | 561 | 52 | ||||||||||
ANSYS Inc * | 448 | 115 | ||||||||||
Appian, CI A * | 1,246 | 48 | ||||||||||
Apple Inc | 64,856 | 19,045 | ||||||||||
Applied Materials Inc | 10,761 | 657 | ||||||||||
Applied Optoelectronics * | 4,449 | 53 | ||||||||||
Arista Networks Inc * | 768 | 156 | ||||||||||
Arlo Technologies * | 11,738 | 49 | ||||||||||
Arrow Electronics Inc * | 2,550 | 216 | ||||||||||
Aspen Technology * | 413 | 50 | ||||||||||
Atlassian Corp PLC, CI A * | 665 | 80 | ||||||||||
Autodesk Inc * | 3,559 | 653 | ||||||||||
Automatic Data Processing Inc | 12,646 | 2,156 | ||||||||||
Avaya Holdings * | 4,140 | 56 | ||||||||||
Avnet lnc | 1,892 | 80 | ||||||||||
AVX | 2,456 | 50 | ||||||||||
Axcelis Technologies * | 2,104 | 51 | ||||||||||
Badger Meter | 775 | 50 | ||||||||||
Belden | 900 | 50 | ||||||||||
Benchmark Electronics | 1,447 | 50 | ||||||||||
Black Knight Inc * | 1,569 | 101 | ||||||||||
Blackbaud | 629 | 50 | ||||||||||
Blackline * | 975 | 50 | ||||||||||
Booz Allen Hamilton Holding Corp, Cl A | 1,402 | 100 | ||||||||||
Bottomline Technologies DE * | 943 | 51 | ||||||||||
Box, CI A * | 2,984 | 50 | ||||||||||
Broadcom Inc | 6,023 | 1,903 | ||||||||||
Broadridge Financial Solutions Inc | 720 | 89 | ||||||||||
Brooks Automation | 1,150 | 48 | ||||||||||
Cabot Microelectronics | 373 | 54 | ||||||||||
Cadence Design Systems Inc * | 2,046 | 142 | ||||||||||
Cardtronics * | 1,198 | 53 | ||||||||||
Cass Information Systems | 865 | 50 | ||||||||||
CDK Global Inc | 1,636 | 89 | ||||||||||
| Description | Shares | Market Value ($ Thousands) | ||||||||||
COMMON STOCK (continued) |
| |||||||||||
CDW Corp/DE | 806 | $ | 115 | |||||||||
Cerence * | 2,645 | 60 | ||||||||||
Ceridian HCM Holding * | 792 | 54 | ||||||||||
Ciena * | 1,223 | 52 | ||||||||||
Cirrus Logic * | 640 | 53 | ||||||||||
Cisco Systems Inc | 68,588 | 3,289 | ||||||||||
Citrix Systems Inc | 1,980 | 220 | ||||||||||
Cloudera * | 4,481 | 52 | ||||||||||
Cognex Corp | 203 | 11 | ||||||||||
Cognizant Technology Solutions Corp, Cl A | 8,315 | 516 | ||||||||||
Coherent Inc * | 626 | 104 | ||||||||||
Cohu | 2,351 | 54 | ||||||||||
CommScope Holding Co lnc * | 7,086 | 101 | ||||||||||
CommVault Systems * | 1,095 | 49 | ||||||||||
Comtech Telecommunications | 1,417 | 50 | ||||||||||
CoreLogic Inc/United States | 271 | 12 | ||||||||||
Cornerstone OnDemand * | 862 | 50 | ||||||||||
Corning Inc | 6,104 | 178 | ||||||||||
Coupa Software Inc * | 81 | 12 | ||||||||||
Cree Inc * | 248 | 11 | ||||||||||
CSG Systems International | 965 | 50 | ||||||||||
CTS | 1,735 | 52 | ||||||||||
Cypress Semiconductor Corp | 488 | 11 | ||||||||||
Dell Technologies Inc, CI C * | 4,108 | 211 | ||||||||||
Diebold Nixdorf * | 4,695 | 50 | ||||||||||
Digi International * | 2,744 | 49 | ||||||||||
Digital Turbine * | 6,346 | 45 | ||||||||||
DocuSign Inc, CI A * | 1,618 | 120 | ||||||||||
Dolby Laboratories, CI A | 731 | 50 | ||||||||||
Dropbox, CI A * | 2,914 | 52 | ||||||||||
DXC Technology Co | 5,395 | 203 | ||||||||||
Dynatrace * | 465 | 12 | ||||||||||
Ebix | 1,517 | 51 | ||||||||||
EchoStar, CI A * | 1,124 | 49 | ||||||||||
Elastic NV * | 183 | 12 | ||||||||||
Enphase Energy * | 1,935 | 51 | ||||||||||
Entegris | 980 | 49 | ||||||||||
Envestnet * | 717 | 50 | ||||||||||
EPAM Systems Inc * | 1,434 | 304 | ||||||||||
ePIus * | 592 | 50 | ||||||||||
Euronet Worldwide Inc * | 74 | 12 | ||||||||||
Everbridge * | 639 | 50 | ||||||||||
EVERTEC | 1,569 | 53 | ||||||||||
ExIService Holdings * | 711 | 49 | ||||||||||
Extreme Networks * | 6,878 | 51 | ||||||||||
F5 Networks Inc * | 578 | 81 | ||||||||||
Fair Isaac Corp * | 299 | 112 | ||||||||||
Fidelity National Information Services Inc | 7,874 | 1,095 | ||||||||||
FireEye lnc * | 5,502 | 91 | ||||||||||
First Solar Inc * | 3,538 | 198 | ||||||||||
Fiserv Inc * | 6,758 | 781 | ||||||||||
Fitbit, CI A * | 7,553 | 50 | ||||||||||
| New Covenant Funds / Semi-Annual Report / December 31, 2019 | 13 |
SCHEDULE OF INVESTMENTS (Unaudited)
December 31, 2019
New Covenant Growth Fund(Continued)
| Description | Shares | Market Value ($ Thousands) | ||||||||||
COMMON STOCK (continued) |
| |||||||||||
Five9 * | 751 | $ | 49 | |||||||||
FleetCor Technologies Inc * | 729 | 210 | ||||||||||
FLIR Systems Inc | 1,671 | 87 | ||||||||||
ForeScout Technologies * | 1,454 | 48 | ||||||||||
FormFactor * | 1,939 | 50 | ||||||||||
Fortinet lnc * | 566 | 60 | ||||||||||
Genpact Ltd | 6,870 | 290 | ||||||||||
Global Payments Inc | 3,059 | 558 | ||||||||||
GoDaddy lnc, CI A * | 1,102 | 75 | ||||||||||
Guidewire Software Inc * | 109 | 12 | ||||||||||
Hackett Group | 3,129 | 51 | ||||||||||
HubSpot * | 322 | 51 | ||||||||||
IAC/lnterActiveCorp * | 376 | 94 | ||||||||||
Ichor Holdings * | 1,480 | 49 | ||||||||||
ll-VI * | 1,509 | 51 | ||||||||||
Infinera * | 6,579 | 52 | ||||||||||
Inphi * | 680 | 50 | ||||||||||
Inseego * | 7,132 | 52 | ||||||||||
Insight Enterprises * | 754 | 53 | ||||||||||
Instructure * | 1,033 | 50 | ||||||||||
Intel Corp | 67,438 | 4,036 | ||||||||||
Intelligent Systems * | 1,128 | 45 | ||||||||||
InterDigital | 917 | 50 | ||||||||||
International Business Machines Corp | 13,123 | 1,759 | ||||||||||
Intuit Inc | 3,714 | 973 | ||||||||||
IPG Photonics Corp * | 558 | 81 | ||||||||||
Itron * | 588 | 49 | ||||||||||
j2 Global * | 540 | 51 | ||||||||||
Jabil Inc | 6,948 | 287 | ||||||||||
Jack Henry & Associates Inc | 636 | 93 | ||||||||||
Juniper Networks Inc | 7,826 | 193 | ||||||||||
KBR | 1,640 | 50 | ||||||||||
KEMET | 1,871 | 51 | ||||||||||
Keysight Technologies Inc * | 3,329 | 342 | ||||||||||
KLA-Tencor Corp | 1,904 | 339 | ||||||||||
Knowles * | 2,314 | 49 | ||||||||||
Lam Research Corp | 3,493 | 1,021 | ||||||||||
Lattice Semiconductor * | 2,475 | 47 | ||||||||||
Littelfuse lnc | 60 | 11 | ||||||||||
LivePerson * | 1,299 | 48 | ||||||||||
LogMeln Inc | 1,076 | 92 | ||||||||||
Lumentum Holdings * | 660 | 52 | ||||||||||
Manhattan Associates Inc * | 1,278 | 102 | ||||||||||
Marvell Technology Group Ltd | 3,312 | 88 | ||||||||||
Mastercard Inc, CI A | 13,112 | 3,915 | ||||||||||
Maxim Integrated Products Inc | 3,740 | 230 | ||||||||||
MAXIMUS | 682 | 51 | ||||||||||
Medallia * | 1,562 | 49 | ||||||||||
Microchip Technology Inc | 1,615 | 169 | ||||||||||
Micron Technology Inc * | 11,740 | 631 | ||||||||||
Microsoft Corp | 115,179 | 18,164 | ||||||||||
MicroStrategy, CI A * | 339 | 48 | ||||||||||
| Description | Shares | Market Value ($ Thousands) | ||||||||||
COMMON STOCK (continued) |
| |||||||||||
Mitek Systems * | 6,887 | $ | 53 | |||||||||
MKS Instruments Inc | 103 | 11 | ||||||||||
Model N * | 1,438 | 50 | ||||||||||
MongoDB Inc, CI A * | 574 | 76 | ||||||||||
Monolithic Power Systems Inc | 64 | 11 | ||||||||||
MTS Systems | 1,057 | 51 | ||||||||||
National Instruments Corp | 2,353 | 100 | ||||||||||
NCR Corp * | 334 | 12 | ||||||||||
NetApp Inc | 2,936 | 183 | ||||||||||
NetScout Systems * | 2,073 | 50 | ||||||||||
New Relic * | 749 | 49 | ||||||||||
NIC | 2,268 | 51 | ||||||||||
Novanta * | 547 | 48 | ||||||||||
Nuance Communications * | 2,832 | 50 | ||||||||||
Nutanix lnc, CI A * | 359 | 11 | ||||||||||
NVIDIA Corp | 9,892 | 2,328 | ||||||||||
Okta Inc, CI A * | 812 | 94 | ||||||||||
ON Semiconductor Corp * | 9,649 | 235 | ||||||||||
Oracle Corp | 34,708 | 1,839 | ||||||||||
OSI Systems * | 497 | 50 | ||||||||||
Pagerduty lnc * | 1,821 | 43 | ||||||||||
Palo Alto Networks Inc * | 541 | 125 | ||||||||||
Paychex Inc | 2,612 | 222 | ||||||||||
Paycom Software * | 194 | 51 | ||||||||||
Paylocity Holding * | 417 | 50 | ||||||||||
PayPal Holdings Inc * | 18,658 | 2,018 | ||||||||||
Paysign * | 4,721 | 48 | ||||||||||
Pegasystems lnc | 150 | 12 | ||||||||||
Perficient * | 1,142 | 53 | ||||||||||
Perspecta | 1,895 | 50 | ||||||||||
Photronics * | 3,197 | 50 | ||||||||||
Plantronics | 1,930 | 53 | ||||||||||
Plexus * | 633 | 49 | ||||||||||
Pluralsight lnc, CI A * | 2,621 | 45 | ||||||||||
Power Integrations | 531 | 53 | ||||||||||
Progress Software | 1,206 | 50 | ||||||||||
Proofpoint Inc * | 98 | 11 | ||||||||||
PROS Holdings * | 818 | 49 | ||||||||||
PTC * | 677 | 51 | ||||||||||
Pure Storage Inc, CI A * | 685 | 12 | ||||||||||
Q2 Holdings * | 633 | 51 | ||||||||||
Qorvo Inc * | 100 | 12 | ||||||||||
QUALCOMM Inc | 17,833 | 1,573 | ||||||||||
Qualys * | 591 | 49 | ||||||||||
Rambus * | 3,633 | 50 | ||||||||||
Rapid7 * | 892 | 50 | ||||||||||
RealPage lnc * | 211 | 11 | ||||||||||
RingCentral Inc, CI A * | 699 | 118 | ||||||||||
Rogers * | 392 | 49 | ||||||||||
Sabre Corp | 506 | 11 | ||||||||||
SailPoint Technologies Holding * | 2,129 | 50 | ||||||||||
salesforce.com * | 18,578 | 3,022 | ||||||||||
| 14 | New Covenant Funds / Semi-Annual Report / December 31, 2019 |
| Description | Shares | Market Value ($ Thousands) | ||||||||||
COMMON STOCK (continued) |
| |||||||||||
Sanmina * | 1,459 | $ | 50 | |||||||||
ScanSource * | 1,292 | 48 | ||||||||||
SecureWorks, CI A * | 3,538 | 59 | ||||||||||
Semtech * | 1,000 | 53 | ||||||||||
ServiceNow Inc * | 2,017 | 569 | ||||||||||
Silicon Laboratories * | 437 | 51 | ||||||||||
Skyworks Solutions Inc | 2,779 | 336 | ||||||||||
Smartsheet lnc, CI A * | 266 | 12 | ||||||||||
SolarWinds Corp * | 634 | 12 | ||||||||||
Splunk lnc * | 1,095 | 164 | ||||||||||
SPS Commerce * | 882 | 49 | ||||||||||
Square Inc, CI A * | 2,537 | 159 | ||||||||||
SS&C Technologies Holdings | 831 | 51 | ||||||||||
Switch Inc, CI A | 779 | 12 | ||||||||||
Synaptics * | 771 | 51 | ||||||||||
SYNNEX | 387 | 50 | ||||||||||
Synopsys lnc * | 1,083 | 151 | ||||||||||
Tech Data * | 348 | 50 | ||||||||||
Teradata Corp * | 4,437 | 119 | ||||||||||
Teradyne Inc | 4,784 | 326 | ||||||||||
Texas Instruments Inc | 13,483 | 1,730 | ||||||||||
Trade Desk Inc/The, CI A * | 376 | 98 | ||||||||||
Trimble Inc * | 2,035 | 85 | ||||||||||
TTEC Holdings | 1,378 | 55 | ||||||||||
TTM Technologies * | 3,357 | 51 | ||||||||||
Tucows, CI A * | 834 | 52 | ||||||||||
Twilio lnc, CI A * | 639 | 63 | ||||||||||
Tyler Technologies Inc * | 393 | 118 | ||||||||||
Ubiquiti | 263 | 50 | ||||||||||
Unisys * | 4,078 | 48 | ||||||||||
Universal Display Corp | 521 | 107 | ||||||||||
Upland Software * | 1,378 | 49 | ||||||||||
Varonis Systems * | 653 | 51 | ||||||||||
Verint Systems * | 947 | 52 | ||||||||||
VeriSign Inc * | 484 | 93 | ||||||||||
Verra Mobility, CI A * | 3,479 | 49 | ||||||||||
ViaSat * | 693 | 51 | ||||||||||
Viavi Solutions * | 3,355 | 50 | ||||||||||
Virtusa * | 1,123 | 51 | ||||||||||
Visa Inc, CI A | 30,481 | 5,727 | ||||||||||
VMware Inc, CI A * | 1,343 | 204 | ||||||||||
Western Digital Corp | 2,423 | 154 | ||||||||||
Western Union Co/The | 425 | 11 | ||||||||||
WEX Inc * | 55 | 12 | ||||||||||
Workday Inc, CI A * | 2,079 | 342 | ||||||||||
Workiva, CI A * | 1,224 | 51 | ||||||||||
Xerox Holdings | 7,073 | 261 | ||||||||||
Xilinx lnc | 2,632 | 257 | ||||||||||
Xperi | 2,351 | 43 | ||||||||||
Zebra Technologies Corp, CI A * | 438 | 112 | ||||||||||
Zendesk lnc * | 152 | 12 | ||||||||||
Zscaler lnc * | 1,122 | 52 | ||||||||||
| Description | Shares | Market Value ($ Thouısands) | ||||||||||
COMMON STOCK (continued) |
| |||||||||||
Zuora, CI A * | 3,498 | $ | 50 | |||||||||
| 102,950 | ||||||||||||
Materials — 3.2% |
| |||||||||||
AdvanSix * | 2,397 | 48 | ||||||||||
Air Products & Chemicals Inc | 4,688 | 1,102 | ||||||||||
AK Steel Holding * | 14,926 | 49 | ||||||||||
Albemarle Corp | 167 | 12 | ||||||||||
Alcoa Corp * | 5,657 | 122 | ||||||||||
Allegheny Technologies * | 2,362 | 49 | ||||||||||
AptarGroup Inc | 1,944 | 225 | ||||||||||
Ashland Global Holdings Inc | 152 | 12 | ||||||||||
Avery Dennison Corp | 88 | 12 | ||||||||||
Axalta Coating Systems Ltd * | 7,963 | 242 | ||||||||||
Balchem | 488 | 50 | ||||||||||
Ball Corp | 14,154 | 915 | ||||||||||
Berry Global Group Inc * | 4,123 | 196 | ||||||||||
Cabot Corp | 238 | 11 | ||||||||||
Carpenter Technology | 1,006 | 50 | ||||||||||
Celanese Corp, CI A | 93 | 11 | ||||||||||
CF Industries Holdings | 1,066 | 51 | ||||||||||
Chase | 421 | 50 | ||||||||||
Chemours | 2,832 | 51 | ||||||||||
Cleveland-Cliffs | 5,918 | 50 | ||||||||||
Coeur Mining * | 6,945 | 56 | ||||||||||
Commercial Metals | 2,280 | 51 | ||||||||||
Compass Minerals International | 851 | 52 | ||||||||||
Corteva Inc | 4,112 | 122 | ||||||||||
Crown Holdings Inc * | 6,925 | 502 | ||||||||||
Domtar Corp | 298 | 11 | ||||||||||
Dow lnc | 6,685 | 366 | ||||||||||
DuPont de Nemours Inc | 7,322 | 470 | ||||||||||
Eagle Materials Inc | 126 | 11 | ||||||||||
Eastman Chemical Co | 9,101 | 721 | ||||||||||
Ecolab Inc | 3,153 | 609 | ||||||||||
Element Solutions Inc * | 1,023 | 12 | ||||||||||
FMC Corp | 2,400 | 240 | ||||||||||
Freeport-McMoRan Inc | 31,087 | 408 | ||||||||||
GCP Applied Technologies * | 2,199 | 50 | ||||||||||
Graphic Packaging Holding Co | 681 | 11 | ||||||||||
Greif, CI A | 1,122 | 50 | ||||||||||
HB Fuller | 976 | 50 | ||||||||||
Huntsman Corp | 475 | 11 | ||||||||||
Ingevity * | 563 | 49 | ||||||||||
Innospec | 499 | 52 | ||||||||||
International Flavors & Fragrances Inc | 2,307 | 298 | ||||||||||
International Paper Co | 785 | 36 | ||||||||||
Kraton * | 2,033 | 51 | ||||||||||
Linde PLC | 7,642 | 1,627 | ||||||||||
Livent * | 5,807 | 50 | ||||||||||
Louisiana-Pacific | 1,740 | 52 | ||||||||||
LyondellBasell Industries NV, Cl A | 2,182 | 206 | ||||||||||
Martin Marietta Materials Inc | 397 | 111 | ||||||||||
| New Covenant Funds / Semi-Annual Report / December 31, 2019 | 15 |
SCHEDULE OF INVESTMENTS (Unaudited)
December 31, 2019
New Covenant Growth Fund(Continued)
| Description | Shares | Market Value ($ Thousands) | ||||||||||
COMMON STOCK (continued) | ||||||||||||
Minerals Technologies | 880 | $ | 51 | |||||||||
Mosaic Co/The | 3,590 | 78 | ||||||||||
Neenah | 693 | 49 | ||||||||||
NewMarket | 102 | 50 | ||||||||||
Newmont Goldcorp Corp | 29,273 | 1,272 | ||||||||||
Novagold Resources * | 6,675 | 60 | ||||||||||
Nucor Corp | 1,510 | 85 | ||||||||||
Packaging Corp of America | 101 | 11 | ||||||||||
PH Glatfelter | 2,740 | 50 | ||||||||||
PPG Industries Inc | 2,274 | 304 | ||||||||||
Quaker Chemical | 309 | 51 | ||||||||||
Reliance Steel & Aluminum Co | 412 | 49 | ||||||||||
Royal Gold | 437 | 53 | ||||||||||
RPM International | 664 | 51 | ||||||||||
ScottsMiracle-Gro | 482 | 51 | ||||||||||
Sealed Air Corp | 293 | 12 | ||||||||||
Sensient Technologies | 779 | 51 | ||||||||||
Sherwin-Williams Co/The | 2,451 | 1,430 | ||||||||||
Silgan Holdings | 1,635 | 51 | ||||||||||
Sonoco Products Co | 185 | 11 | ||||||||||
Southern Copper Corp | 272 | 12 | ||||||||||
Steel Dynamics Inc | 2,648 | 90 | ||||||||||
Stepan | 510 | 52 | ||||||||||
Summit Materials, CI A * | 2,136 | 51 | ||||||||||
Trinseo | 1,345 | 50 | ||||||||||
Tronox Holdings | 4,385 | 50 | ||||||||||
United States Lime & Minerals | 581 | 52 | ||||||||||
United States Steel | 3,709 | 42 | ||||||||||
Valvoline Inc | 11,216 | 240 | ||||||||||
Verso * | 2,760 | 50 | ||||||||||
Vulcan Materials Co | 665 | 96 | ||||||||||
Warrior Met Coal | 2,378 | 50 | ||||||||||
Westlake Chemical | 718 | 50 | ||||||||||
Westrock Co | 3,989 | 171 | ||||||||||
Worthington Industries | 1,149 | 48 | ||||||||||
WR Grace | 733 | 51 | ||||||||||
| 14,618 | ||||||||||||
Real Estate — 3.7% | ||||||||||||
Acadia Realty Trust‡ | 1,946 | 50 | ||||||||||
Agree Realty‡ | 736 | 52 | ||||||||||
Alexander & Baldwin‡ | 2,342 | 49 | ||||||||||
Alexandria Real Estate Equities Inc‡ | 1,497 | 242 | ||||||||||
American Assets Trust‡ | 1,128 | 52 | ||||||||||
American Campus Communities Inc‡ | 252 | 12 | ||||||||||
American Finance Trust‡ | 3,743 | 50 | ||||||||||
American Tower Corp, CI A‡ | 6,167 | 1,417 | ||||||||||
Americold Realty Trust‡ | 346 | 12 | ||||||||||
Apartment Investment & Management Co, CI A‡ | 1,721 | 89 | ||||||||||
Apple Hospitality REIT Inc‡ | 718 | 12 | ||||||||||
AvalonBay Communities Inc‡ | 3,261 | 684 | ||||||||||
Boston Properties Inc‡ | 1,468 | 202 | ||||||||||
| Description | Shares | Market Value ($ Thousands) | ||||||||||
COMMON STOCK (continued) | ||||||||||||
Brandywine Realty Trust‡ | 14,492 | $ | 228 | |||||||||
Brixmor Property Group Inc‡ | 4,703 | 102 | ||||||||||
Brookfield Property REIT Inc, Cl A‡ | 622 | 11 | ||||||||||
Camden Property Trust‡ | 850 | 90 | ||||||||||
CareTrust REIT | 2,438 | 50 | ||||||||||
CBRE Group Inc, CI A * | 4,438 | 272 | ||||||||||
Colony Capital Inc‡ | 41,643 | 198 | ||||||||||
Columbia Property Trust Inc‡ | 565 | 12 | ||||||||||
Community Healthcare Trust‡ | 1,136 | 49 | ||||||||||
CorEnergy Infrastructure Trust‡ | 1,162 | 52 | ||||||||||
CorePoint Lodging‡ | 4,605 | 49 | ||||||||||
Corporate Office Properties Trust‡ | 7,752 | 228 | ||||||||||
Cousins Properties‡ | 289 | 12 | ||||||||||
Crown Castle International Corp‡ | 4,655 | 662 | ||||||||||
CubeSmart‡ | 377 | 12 | ||||||||||
Cushman & Wakefield * | 2,593 | 53 | ||||||||||
CyrusOne lnc‡ | 181 | 12 | ||||||||||
DiamondRock Hospitality‡ | 4,575 | 51 | ||||||||||
Digital Realty Trust Inc‡ | 1,874 | 224 | ||||||||||
Douglas Emmett Inc‡ | 2,338 | 103 | ||||||||||
Duke Realty Corp‡ | 2,798 | 97 | ||||||||||
EastGroup Properties‡ | 379 | 50 | ||||||||||
Empire State Realty Trust Inc, Cl A‡ | 5,592 | 78 | ||||||||||
EPR Properties | 735 | 52 | ||||||||||
Equinix Inc‡ | 963 | 562 | ||||||||||
Equity Commonwealth *‡ | 2,677 | 88 | ||||||||||
Equity Lifestyle Properties Inc‡ | 167 | 12 | ||||||||||
Equity Residential‡ | 3,485 | 282 | ||||||||||
Essential Properties Realty Trust‡ | 2,028 | 50 | ||||||||||
Essex Property Trust Inc‡ | 454 | 137 | ||||||||||
Extra Space Storage Inc‡ | 811 | 86 | ||||||||||
Federal Realty Investment Trust‡ | 664 | 85 | ||||||||||
First Industrial Realty Trust‡ | 1,226 | 51 | ||||||||||
Four Corners Property Trust‡ | 1,848 | 52 | ||||||||||
Franklin Street Properties‡ | 5,897 | 50 | ||||||||||
Gaming and Leisure Properties Inc‡ | 275 | 12 | ||||||||||
Global Net Lease‡ | 2,484 | 50 | ||||||||||
Hannon Armstrong Sustainable Infrastructure Capital‡ | 1,600 | 51 | ||||||||||
Healthcare Realty Trust‡ | 1,555 | 52 | ||||||||||
Healthcare Trust of America Inc, Cl A‡ | 392 | 12 | ||||||||||
Hersha Hospitality Trust, CIA‡ | 3,513 | 51 | ||||||||||
Highwoods Properties Inc‡ | 247 | 12 | ||||||||||
Host Hotels & Resorts Inc‡ | 17,568 | 326 | ||||||||||
Howard Hughes Corp/The * | 795 | 101 | ||||||||||
Hudson Pacific Properties Inc‡ | 2,475 | 93 | ||||||||||
Independence Realty Trust‡ | 3,625 | 51 | ||||||||||
Industrial Logistics Properties Trust | 2,389 | 54 | ||||||||||
Invitation Homes‡ | 398 | 12 | ||||||||||
Iron Mountain Inc‡ | 5,996 | 191 | ||||||||||
JBG SMITH Properties‡ | 2,065 | 82 | ||||||||||
Jones Lang LaSalle Inc | 1,270 | 221 | ||||||||||
| 16 | New Covenant Funds / Semi-Annual Report / December 31, 2019 |
| Description | Shares | Market Value ($ Thousands) | ||||||||||
COMMON STOCK (continued) | ||||||||||||
Kennedy-Wilson Holdings | 2,254 | $ | 50 | |||||||||
Kilroy Realty Corp‡ | 4,516 | 379 | ||||||||||
Kimco Realty Corp‡ | 4,679 | 97 | ||||||||||
Kite Realty Group Trust‡ | 2,741 | 54 | ||||||||||
Lamar Advertising Co, CI A‡ | 1,059 | 95 | ||||||||||
Lexington Realty Trust, Cl B‡ | 4,761 | 51 | ||||||||||
Liberty Property Trust‡ | 1,784 | 107 | ||||||||||
Life Storage Inc‡ | 110 | 12 | ||||||||||
LTC Properties | 1,142 | 51 | ||||||||||
Macerich Co/The‡ | 5,238 | 141 | ||||||||||
Marcus & Millichap * | 1,380 | 51 | ||||||||||
Medical Properties Trust‡ | 2,513 | 53 | ||||||||||
Mid-America Apartment Communities Inc‡ | 772 | 102 | ||||||||||
Monmouth Real Estate Investment‡ | 3,365 | 49 | ||||||||||
National Health Investors | 635 | 52 | ||||||||||
National Retail Properties‡ | 975 | 52 | ||||||||||
National Storage Affiliates Trust‡ | 1,534 | 52 | ||||||||||
Newmark Group, CI A | 3,753 | 50 | ||||||||||
Office Properties Income Trust‡ | 1,618 | 52 | ||||||||||
Omega Healthcare Investors‡ | 1,229 | 52 | ||||||||||
Outfront Media‡ | 1,951 | 52 | ||||||||||
Paramount Group Inc‡ | 5,922 | 82 | ||||||||||
Park Hotels & Resorts | 1,996 | 52 | ||||||||||
Pebblebrook Hotel Trust‡ | 1,899 | 51 | ||||||||||
Physicians Realty Trust‡ | 2,753 | 52 | ||||||||||
Piedmont Office Realty Trust, Cl A‡ | 2,333 | 52 | ||||||||||
PotlatchDeltic‡ | 1,174 | 51 | ||||||||||
Prologis lnc‡ | 19,404 | 1,730 | ||||||||||
Public Storage‡ | 1,626 | 346 | ||||||||||
QTS Realty Trust, Cl A‡ | 981 | 53 | ||||||||||
Rayonier‡ | 1,593 | 52 | ||||||||||
RE, CI A | 1,292 | 50 | ||||||||||
Realogy Holdings * | 4,621 | 45 | ||||||||||
Realty Income Corp‡ | 2,296 | 169 | ||||||||||
Redfin * | 2,435 | 51 | ||||||||||
Regency Centers Corp‡ | 3,123 | 197 | ||||||||||
Retail Opportunity Investments‡ | 2,907 | 51 | ||||||||||
Retail Properties of America Inc, Cl A‡ | 876 | 12 | ||||||||||
Rexford Industrial Realty | 1,114 | 51 | ||||||||||
RLJ Lodging Trust | 2,849 | 50 | ||||||||||
RMR Group, CI A | 1,095 | 50 | ||||||||||
RPT Realty | 3,429 | 52 | ||||||||||
Ryman Hospitality Properties | 577 | 50 | ||||||||||
Sabra Health Care REIT‡ | 2,410 | 51 | ||||||||||
Safehold‡ | 1,296 | 52 | ||||||||||
SBA Communications Corp, Cl A‡ | 994 | 240 | ||||||||||
Senior Housing Properties Trust‡ | 6,702 | 57 | ||||||||||
Service Properties Trust‡ | 483 | 12 | ||||||||||
Simon Property Group Inc‡ | 3,706 | 552 | ||||||||||
SITE Centers‡ | 3,734 | 52 | ||||||||||
SL Green Realty Corp‡ | 2,476 | 227 | ||||||||||
Spirit Realty Capital‡ | 237 | 12 | ||||||||||
| Description | Shares | Market Value ($ Thousands) | ||||||||||
COMMON STOCK (continued) | ||||||||||||
St. Joe * | 2,464 | $ | 49 | |||||||||
STAG Industrial‡ | 1,647 | 52 | ||||||||||
STORE Capital Corp‡ | 2,555 | 95 | ||||||||||
Summit Hotel Properties‡ | 4,173 | 51 | ||||||||||
Sunstone Hotel Investors‡ | 3,516 | 49 | ||||||||||
Tanger Factory Outlet Centers‡ | 3,357 | 49 | ||||||||||
Taubman Centers Inc‡ | 1,690 | 53 | ||||||||||
Terreno Realty‡ | 941 | 51 | ||||||||||
UDR Inc‡ | 250 | 12 | ||||||||||
Uniti Group‡ | 6,587 | 54 | ||||||||||
Universal Health Realty Income Trust‡ | 439 | 51 | ||||||||||
Urban Edge Properties | 2,679 | 51 | ||||||||||
Urstadt Biddle Properties, Cl A | 2,126 | 53 | ||||||||||
Ventas lnc‡ | 3,279 | 189 | ||||||||||
VEREIT Inc‡ | 10,217 | 94 | ||||||||||
VICI Properties‡ | 2,012 | 51 | ||||||||||
Vornado Realty Trust‡ | 2,903 | 193 | ||||||||||
Washington Real Estate Investment Trust ‡ | 1,705 | 50 | ||||||||||
Weingarten Realty Investors‡ | 2,933 | 92 | ||||||||||
Welltower lnc‡ | 4,270 | 349 | ||||||||||
Weyerhaeuser Co‡ | 17,005 | 514 | ||||||||||
Whitestone REIT, Cl B‡ | 3,773 | 51 | ||||||||||
WP Carey Inc‡ | 149 | 12 | ||||||||||
Xenia Hotels & Resorts‡ | 2,347 | 51 | ||||||||||
| 17,070 | ||||||||||||
Utilities — 3.2% | ||||||||||||
AES Corp/VA | 5,282 | 105 | ||||||||||
ALLETE | 620 | 50 | ||||||||||
Alliant Energy Corp | 213 | 12 | ||||||||||
Ameren Corp | 1,172 | 90 | ||||||||||
American Electric Power Co Inc | 5,930 | 560 | ||||||||||
American States Water | 580 | 50 | ||||||||||
American Water Works Co lnc | 2,717 | 334 | ||||||||||
Aqua America Inc | 2,221 | 104 | ||||||||||
Atmos Energy | 461 | 52 | ||||||||||
Avangrid Inc | 1,720 | 88 | ||||||||||
Black Hills | 641 | 50 | ||||||||||
California Water Service Group | 978 | 50 | ||||||||||
CenterPoint Energy Inc | 434 | 12 | ||||||||||
Clearway Energy, Cl C | 2,583 | 52 | ||||||||||
CMS Energy Corp | 21,450 | 1,348 | ||||||||||
Consolidated Edison Inc | 3,086 | 279 | ||||||||||
Dominion Energy Inc | 9,438 | 782 | ||||||||||
DTE Energy Co | 9,809 | 1,274 | ||||||||||
Duke Energy Corp | 9,540 | 870 | ||||||||||
Edison International | 3,288 | 248 | ||||||||||
El Paso Electric | 742 | 50 | ||||||||||
Entergy Corp | 2,276 | 273 | ||||||||||
Evergy lnc | 180 | 12 | ||||||||||
Eversource Energy | 10,983 | 934 | ||||||||||
Exelon Corp | 11,090 | 506 | ||||||||||
FirstEnergy Corp | 4,900 | 238 | ||||||||||
| New Covenant Funds / Semi-Annual Report / December 31, 2019 | 17 |
SCHEDULE OF INVESTMENTS (Unaudited)
December 31, 2019
New Covenant Growth Fund(Concluded)
| Description | Shares | Market Value ($ Thousands) | ||||||
COMMON STOCK (continued) |
| |||||||
Hawaiian Electric Industries Inc | 249 | $ | 12 | |||||
IDACORP | 108 | 12 | ||||||
MDU Resources Group Inc | 386 | 12 | ||||||
MGE Energy | 631 | 50 | ||||||
Middlesex Water | 790 | 50 | ||||||
National Fuel Gas Co | 245 | 11 | ||||||
New Jersey Resources | 1,111 | 50 | ||||||
NextEra Energy Inc | 6,768 | 1,639 | ||||||
NiSource Inc | 419 | 12 | ||||||
Northwest Natural Holding | 699 | 52 | ||||||
NRG Energy Inc | 2,300 | 91 | ||||||
OGE Energy Corp | 261 | 12 | ||||||
ONE Gas | 534 | 50 | ||||||
Ormat Technologies | 644 | 48 | ||||||
Pattern Energy Group, CI A | 1,838 | 49 | ||||||
PG&E Corp * | 4,614 | 50 | ||||||
Pinnacle West Capital Corp | 2,640 | 237 | ||||||
PNM Resources | 975 | 49 | ||||||
Portland General Electric | 894 | 50 | ||||||
PPL Corp | 7,025 | 252 | ||||||
Public Service Enterprise Group Inc | 5,257 | 310 | ||||||
Sempra Energy | 3,086 | 467 | ||||||
SJW Group | 716 | 51 | ||||||
South Jersey Industries | 1,556 | 51 | ||||||
| Description | Shares | Market Value ($ Thousands) | ||||||
COMMON STOCK (continued) |
| |||||||
Southern Co/The | 13,370 | $ | 852 | |||||
Sunnova Energy International * | 4,524 | 51 | ||||||
UGI Corp | 253 | 11 | ||||||
Unitil | 794 | 49 | ||||||
Vistra Energy | 2,088 | 48 | ||||||
WEC Energy Group Inc | 2,064 | 190 | ||||||
Xcel Energy Inc | 21,147 | 1,343 | ||||||
| 14,634 | ||||||||
| 446,090 | ||||||||
Total Common Stock | 453,542 | |||||||
CASH EQUIVALENT — 1.7% | ||||||||
SEI Daily Income Trust, Government Fund, CI F | ||||||||
1.500%**† | 7,997,660 | 7,998 | ||||||
Total Cash Equivalent | 7,998 | |||||||
Total Investments in Securities — 99.6% | $ | 461,540 | ||||||
A list of the open futures contracts held by the Fund at December 31, 2019 are as follows:
| Type of Contract | Number of | Expiration Date | Notional Amount (Thousands) | Value (Thousands) | Unrealized Appreciation (Thousands) | |||||||||||||||
S&P 500 IndexE-MINI | 49 | Mar-2020 | $ | 7,860 | $ | 7,916 | $ | 56 | ||||||||||||
S&P Mid Cap 400 IndexE-MINI | 2 | Mar-2020 | 410 | 413 | 3 | |||||||||||||||
|
|
|
|
|
| |||||||||||||||
| $ | 8,270 | $ | 8,329 | $ | 59 | |||||||||||||||
|
|
|
|
|
| |||||||||||||||
The futures contracts are considered to have interest rate risk associated with them.
| Percentages | are based on Net Assets of $463,574 ($ Thousands). |
| ‡ | Real Estate Investment Trust. |
| * | Non-income producing security. |
| ** | Rate shown is the7-day effective yield as of December 31, 2019. |
| † | Investment in Affiliated Security (see Note 3). |
| (A) | Security is a Master Limited Partnership. At December 31, 2019, such securities amounted to $93 ($ Thousands), or 0.02% of the net assets. |
Cl — Class
Ltd. — Limited
MSCI — Morgan Stanley Capital International
PLC — Public Limited Company
S&P — Standard & Poor’s
| 18 | New Covenant Funds / Semi-Annual Report / December 31, 2019 |
The following is a list of the levels of inputs used as of December 31, 2019 in valuing the Fund’s investments and other financial instruments carried at value ($ Thousands):
| Investments in Securities | Level 1 ($) | Level 2 ($) | Level 3 ($) | Total ($) | ||||||||||||
Common Stock | $ | 453,542 | $ | – | $ | – | $ | 453,542 | ||||||||
Cash Equivalent | 7,998 | – | – | 7,998 | ||||||||||||
|
|
|
|
|
|
|
| |||||||||
Total Investments in Securities | $ | 461,540 | $ | – | $ | – | $ | 461,540 | ||||||||
|
|
|
|
|
|
|
| |||||||||
| Other Financial Instruments | Level 1 ($) | Level 2 ($) | Level 3 ($) | Total ($) | ||||||||||||
Futures Contracts * | ||||||||||||||||
Unrealized Appreciation | $ | 59 | $ | – | $ | – | $ | 59 | ||||||||
|
|
|
|
|
|
|
| |||||||||
Total Other Financial Instruments | $ | 59 | $ | – | $ | – | $ | 59 | ||||||||
|
|
|
|
|
|
|
| |||||||||
| * | Futures contracts are valued at the unrealized appreciation on the instrument. |
For the period ended December 31, 2019, there were no transfers in or out of Level 3.
For more information on valuation inputs, see Note 2 – Significant Accounting Policies in Notes to Financial Statements.
The following is a summary of the Fund’s transactions with affiliates for the year ended December 31, 2019 ($ Thousands):
| Security Description | Value 6/30/19 | Purchases at Cost | Proceeds from Sales | Realized Gain/ (Loss) | Change in Unrealized Appreciation (Depreciation) | Value 12/31/19 | Shares | Dividend Income | Capital Gains | |||||||||
SEI Daily Income Trust, Government Fund, Cl F | $8,829 | $36,914 | $(37,745) | $– | $– | $7,998 | 7,997,660 | $59 | $ – | |||||||||
|
|
|
|
|
|
|
|
| ||||||||||
The accompanying notes are an integral part of the financial statements.
| New Covenant Funds / Semi-Annual Report / December 31, 2019 | 19 |
SCHEDULE OF INVESTMENTS (Unaudited)
December 31, 2019
New Covenant Income Fund
Sector Weightings†:
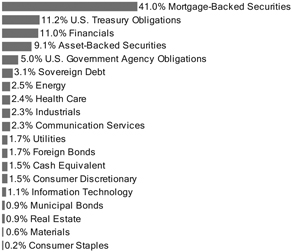
†Percentages based on total investments.
| Description | Face Amount (Thousands) | Market Value ($ Thousands) | ||||||||||
MORTGAGE-BACKED SECURITIES — 41.9% |
| |||||||||||
Agency Mortgage-Backed Obligations — 34.5% |
| |||||||||||
FHLMC | ||||||||||||
6.500%, 09/01/2039 | $ | 32 | $ | 36 | ||||||||
5.500%, 12/01/2036 to 12/01/2038 | 269 | 301 | ||||||||||
5.000%, 12/01/2020 to 01/01/2049 | 2,142 | 2,346 | ||||||||||
4.500%, 06/01/2038 to 06/01/2049 | 7,909 | 8,467 | ||||||||||
4.000%, 07/01/2037 to 11/01/2049 | 5,340 | 5,619 | ||||||||||
3.500%, 11/01/2042 to 12/01/2049 | 2,981 | 3,121 | ||||||||||
3.000%, 12/01/2032 to 01/01/2050 | 9,822 | 10,050 | ||||||||||
2.500%, 03/01/2033 to 12/01/2049 | 1,661 | 1,662 | ||||||||||
2.000%, 09/01/2023 | 365 | 362 | ||||||||||
FHLMC CMO, Ser 2011-3947, Cl SG, IO | ||||||||||||
4.210%, VAR LIBOR USD 1 Month+5.950%, 10/15/2041 | 261 | 40 | ||||||||||
FHLMC CMO, Ser 2012-4057, Cl Ul, IO | ||||||||||||
3.000%, 05/15/2027 | 144 | 10 | ||||||||||
FHLMC CMO, Ser 2012-4085, Cl IO, IO | ||||||||||||
3.000%, 06/15/2027 | 297 | 20 | ||||||||||
FHLMC CMO, Ser 2012-4099, Cl ST, IO | ||||||||||||
4.260%, VAR LIBOR USD 1 Month+6.000%, 08/15/2042 | 121 | 20 | ||||||||||
FHLMC CMO, Ser 2013-4194, Cl BI, IO | ||||||||||||
3.500%, 04/15/2043 | 163 | 24 | ||||||||||
FHLMC CMO, Ser2013-4203, Cl PS, IO | ||||||||||||
4.510%, VAR LIBOR USD 1 Month+6.250%, 09/15/2042 | 181 | 26 | ||||||||||
FHLMC CMO, Ser 2014-4310, CI SA, IO | ||||||||||||
4.210%, VAR LIBOR USD 1 Month+5.950%, 02/15/2044 | 48 | 8 | ||||||||||
| Description | Face Amount (Thousands) | Market Value ($ Thousands) | ||||||||||
MORTGAGE-BACKED SECURITIES (continued) |
| |||||||||||
FHLMC CMO, Ser 2014-4335, Cl SW, IO | ||||||||||||
4.260%, VAR LIBOR USD 1 Month+6.000%, 05/15/2044 | $ | 101 | $ | 16 | ||||||||
FHLMC CMO, Ser 2014-4415, Cl IO, IO | ||||||||||||
2.094%, 04/15/2041 (A) | 49 | 3 | ||||||||||
FHLMC Multifamily Structured Pass Through Certificates, Ser K091, Cl A2 | ||||||||||||
3.505%, 03/25/2029 | 160 | 173 | ||||||||||
FHLMC Structured Agency Credit Risk Debt Notes, Ser 2017-DNA1, CI M1 | ||||||||||||
2.908%, VAR ICE LIBOR USD 1 Month+1.200%, 07/25/2029 | 144 | 145 | ||||||||||
FHLMC, Ser2016-353, Cl S1, IO | ||||||||||||
4.260%, VAR LIBOR USD 1 Month+6.000%, 12/15/2046 | 144 | 25 | ||||||||||
FNMA | ||||||||||||
7.000%, 11/01/2037 to 11/01/2038 | 29 | 33 | ||||||||||
6.500%, 01/01/2038 to 05/01/2040 | 204 | 232 | ||||||||||
6.000%, 07/01/2037 to 11/01/2038 | 148 | 164 | ||||||||||
5.500%, 02/01/2035 | 123 | 139 | ||||||||||
5.000%, 01/01/2021 to 08/01/2049 | 10,178 | 11,062 | ||||||||||
4.500%, 02/01/2035 to 04/01/2056 | 4,590 | 4,931 | ||||||||||
4.438%, VAR ICE LIBOR USD 12 Month+1.700%, 03/01/2036 | 21 | 22 | ||||||||||
4.390%, VAR ICE LIBOR USD 12 Month+1.428%, 05/01/2043 | 254 | 261 | ||||||||||
4.000%, 06/01/2025 to 10/01/2049 | 11,919 | 12,696 | ||||||||||
3.893%, VAR US Treas Yield Curve Rate T Note Const Mat 1 Yr+2.268%, 01/01/2036 | 24 | 25 | ||||||||||
3.640%, 11/01/2028 | 100 | 108 | ||||||||||
3.500%, 04/01/2033 to 03/01/2057 | 15,424 | 16,123 | ||||||||||
3.350%, 05/01/2029 | 20 | 21 | ||||||||||
3.160%, 06/01/2029 | 370 | 390 | ||||||||||
3.000%, 07/01/2032 to 01/01/2050 | 5,968 | �� | 6,092 | |||||||||
2.850%, 08/01/2031 | 100 | 103 | ||||||||||
2.810%, 08/01/2031 | 100 | 102 | ||||||||||
2.790%, 08/01/2029 | 200 | 206 | ||||||||||
2.770%, 08/01/2031 | 100 | 102 | ||||||||||
2.765%, 08/01/2031 | 100 | 102 | ||||||||||
2.740%, 08/01/2029 | 100 | 103 | ||||||||||
2.520%, 10/01/2029 | 20 | 20 | ||||||||||
2.500%, 10/01/2042 | 527 | 523 | ||||||||||
2.240%, 09/01/2026 | 141 | 141 | ||||||||||
FNMA CMO, Ser2003-W2, CI 2A9 | ||||||||||||
5.900%, 07/25/2042 | 446 | 502 | ||||||||||
FNMA CMO, Ser2012-93, CI UI, IO | ||||||||||||
3.000%, 09/25/2027 | 396 | 27 | ||||||||||
FNMA CMO, Ser2014-47, CI AI, IO | ||||||||||||
2.229%, 08/25/2044 (A) | 124 | 7 | ||||||||||
FNMA CMO, Ser2015-55, Cl IO, IO | ||||||||||||
1.938%, 08/25/2055 (A) | 30 | 2 | ||||||||||
| 20 | New Covenant Funds / Semi-Annual Report / December 31, 2019 |
| Description | Face Amount (Thousands) | Market Value ($ Thousands) | ||||||||||
MORTGAGE-BACKED SECURITIES (continued) |
| |||||||||||
FNMA CMO, Ser2015-56, Cl AS, IO | ||||||||||||
4.358%, VAR LIBOR USD 1 | $ | 60 | $ | 13 | ||||||||
FNMA CMO, Ser M3, CI X2, IO | ||||||||||||
0.351%, 10/25/2024 (A) | 3,828 | 52 | ||||||||||
FNMA Connecticut Avenue Securities, Ser2014-C04, CI 1M2 | ||||||||||||
6.692%, VAR ICE LIBOR USD 1 Month+4.900%, 11/25/2024 | 261 | 287 | ||||||||||
FNMA Connecticut Avenue Securities,Ser 2017-C01, CI 1M1 | ||||||||||||
3.092%, VAR ICE LIBOR USD 1 Month+1.300%, 07/25/2029 | 53 | 53 | ||||||||||
FNMA Connecticut Avenue Securities, | ||||||||||||
2.542%, VAR ICE LIBOR USD 1 Month+0.750%, 09/25/2031 (B) | 93 | 93 | ||||||||||
FNMA TBA | ||||||||||||
3.500%, 01/01/2041 | 200 | 206 | ||||||||||
3.000%, 01/15/2043 | 800 | 811 | ||||||||||
FNMA, Ser2005-29, Cl ZA | ||||||||||||
5.500%, 04/25/2035 | 139 | 158 | ||||||||||
FNMA, Ser2012-101, Cl Bl, IO | ||||||||||||
4.000%, 09/25/2027 | 14 | 1 | ||||||||||
FNMA, Ser2013-54, Cl BS, IO | ||||||||||||
4.358%, VAR LIBOR USD 1 Month+6.150%, 06/25/2043 | 48 | 10 | ||||||||||
FNMA, Ser2017-76, Cl SB, IO | ||||||||||||
4.308%, VAR LIBOR USD 1 Month+6.100%, 10/25/2057 | 273 | 55 | ||||||||||
FNMA, Ser2017-85, Cl SC, IO | ||||||||||||
4.408%, VAR LIBOR USD 1 Month+6.200%, 11/25/2047 | 68 | 11 | ||||||||||
FNMA, Ser M19, CI A2 | ||||||||||||
2.560%, 09/25/2029 | 539 | 541 | ||||||||||
FNMA, Ser M23, CI 3A3 | ||||||||||||
2.720%, 10/25/2031 (A) | 100 | 100 | ||||||||||
FNMA, Ser M4, CI A2 | ||||||||||||
3.610%, 02/25/2031 | 80 | 87 | ||||||||||
FNMA, Ser M6, CI A2 | ||||||||||||
3.450%, 01/01/2029 | 170 | 182 | ||||||||||
FRESB Mortgage Trust, Ser SB48, Cl A10F | ||||||||||||
3.370%, 02/25/2028 (A) | 716 | 755 | ||||||||||
FRESB Mortgage Trust, Ser SB58, Cl A10F | ||||||||||||
3.610%, 10/25/2028 (A) | 1,048 | 1,108 | ||||||||||
GNMA | ||||||||||||
5.500%, 02/20/2037 to 01/15/2039 | 131 | 147 | ||||||||||
5.000%, 12/20/2038 to 01/20/2049 | 1,278 | 1,387 | ||||||||||
4.600%, 09/15/2034 | 1,996 | 2,146 | ||||||||||
4.500%, 07/20/2038 to 04/20/2049 | 4,131 | 4,394 | ||||||||||
4.000%, 01/15/2041 to 11/20/2049 | 3,897 | 4,099 | ||||||||||
3.500%, 06/20/2044 to 10/20/2049 | 3,776 | 3,921 | ||||||||||
3.000%, 09/15/2042 to 12/20/2049 | 1,554 | 1,599 | ||||||||||
| Description | Face Amount (Thousands) | Market Value ($ Thousands) | ||||||
MORTGAGE-BACKED SECURITIES (continued) |
| |||||||
2.500%, 02/20/2027 to 09/20/2049 | $ | 738 | $ | 745 | ||||
GNMA CMO, Ser 186, CI IO, lO | ||||||||
0.757%, 08/16/2054 (A) | 1,572 | 69 | ||||||
GNMA CMO, Ser2012-34, CI SA, IO | ||||||||
4.285%, VAR LIBOR USD 1 Month+6.050%, 03/20/2042 | 34 | 7 | ||||||
GNMA CMO, Ser2012-66, Cl Cl, IO | ||||||||
3.500%, 02/20/2038 | 61 | 3 | ||||||
GNMA CMO, Ser2012-H18, CI NA | ||||||||
2.294%, VAR ICE LIBOR USD 1 Month+0.520%, 08/20/2062 | 177 | 177 | ||||||
GNMA CMO, Ser2012-H30, CI GA | ||||||||
2.124%, VAR ICE LIBOR USD 1 Month+0.350%, 12/20/2062 | 815 | 812 | ||||||
GNMA CMO, Ser2013-H01, CI TA | ||||||||
2.274%, VAR ICE LIBOR USD 1 Month+0.500%, 01/20/2063 | 8 | 8 | ||||||
GNMA CMO, Ser2013-H08, CI BF | ||||||||
2.397%, VAR ICE LIBOR USD 1 Month+0.400%, 03/20/2063 | 747 | 744 | ||||||
GNMA CMO, Ser2014-105, Cl IO, IO | ||||||||
0.954%, 06/16/2054 (A) | 1,212 | 55 | ||||||
GNMA CMO, Ser2015-H20, CI FA | ||||||||
2.244%, VAR ICE LIBOR USD 1 Month+0.470%, 08/20/2065 | 266 | 265 | ||||||
GNMA CMO, Ser 85, Cl IA, IO | ||||||||
0.690%, 03/16/2047 (A) | 2,794 | 90 | ||||||
GNMA CMO, Ser 95, Cl IO, IO | ||||||||
0.547%, 04/16/2047 (A) | 1,377 | 44 | ||||||
GNMA TBA | ||||||||
3.000%, 01/15/2043 | 1,800 | 1,849 | ||||||
2.500%, 01/21/2169 | 1,800 | 1,808 | ||||||
GNMA, Ser2013-H21, CI FB | ||||||||
2.474%, VAR ICE LIBOR USD 1 Month+0.700%, 09/20/2063 | 495 | 497 | ||||||
GNMA, Ser2015-167, Cl OI, IO | ||||||||
4.000%, 04/16/2045 | 105 | 19 | ||||||
GNMA, Ser 28, Cl AB | ||||||||
3.150%, 06/16/2060 | 80 | 81 | ||||||
| 116,202 | ||||||||
Non-Agency Mortgage-Backed Obligations — 7.4% |
| |||||||
280 Park Avenue Mortgage Trust, Ser 280P, CI A | ||||||||
2.620%, VAR ICE LIBOR USD 1 Month+0.880%, 09/15/2034 (B) | 130 | 130 | ||||||
Citigroup Commercial Mortgage Trust, | ||||||||
4.017%, 10/10/2047 | 100 | 105 | ||||||
Citigroup Commercial Mortgage Trust, Ser2016-P6, CI AAB | ||||||||
3.512%, 12/10/2049 | 810 | 851 | ||||||
| New Covenant Funds / Semi-Annual Report / December 31, 2019 | 21 |
SCHEDULE OF INVESTMENTS (Unaudited)
December 31, 2019
New Covenant Income Fund(Continued)
| Description | Face Amount (Thousands) | Market Value ($ Thousands) | ||||||||||
MORTGAGE-BACKED SECURITIES (continued) |
| |||||||||||
Citigroup Commercial Mortgage Trust, Ser 375P, CI A | ||||||||||||
3.251%, 05/10/2035 (B) | $ | 190 | $ | 195 | ||||||||
COMM Mortgage Trust, Ser CR5, Cl A4 | ||||||||||||
2.771%, 12/10/2045 | 700 | 711 | ||||||||||
COMM Mortgage Trust, Ser CR5, Cl AM | ||||||||||||
3.223%, 12/10/2045 (B) | 590 | 603 | ||||||||||
COMM Mortgage Trust, Ser CR8, Cl A4 | ||||||||||||
3.334%, 06/10/2046 | 565 | 584 | ||||||||||
Commercial Mortgage Trust, Ser 2013-CR12, CI B | ||||||||||||
4.762%, 10/10/2046 (A) | 20 | 21 | ||||||||||
Commercial Mortgage Trust, Ser 2013-CR12, Cl C | ||||||||||||
5.250%, 10/10/2046 (A) | 10 | 10 | ||||||||||
Commercial Mortgage Trust, Ser 2013-CR12, Cl AM | ||||||||||||
4.300%, 10/10/2046 | 20 | 21 | ||||||||||
CSMC Trust, Ser2018-J1, CI A2 | ||||||||||||
3.500%, 02/25/2048 (A)(B) | 1,171 | 1,195 | ||||||||||
CSMC, Ser USA, Cl B | ||||||||||||
4.185%, 09/15/2037 (B) | 470 | 490 | ||||||||||
DBUBS Mortgage Trust, Ser LC2A, Cl A4 | ||||||||||||
4.537%, 07/10/2044 (B) | 1,009 | 1,030 | ||||||||||
DRB Prime Student Loan Trust, Ser2015-B, CI A1 | ||||||||||||
3.692%, VAR ICE LIBOR USD 1 Month+1.900%, 10/27/2031 (B) | 105 | 106 | ||||||||||
Flagstar Mortgage Trust, Ser2018-2, Cl A4 | ||||||||||||
3.500%, 04/25/2048 (A)(B) | 262 | 267 | ||||||||||
GS Mortgage Securities Trust, Ser 2013- GC16, CIB | ||||||||||||
5.161%, 11/10/2046 (A) | 80 | 87 | ||||||||||
GS Mortgage Securities Trust, Ser 2018- SRP5, CI A | ||||||||||||
3.281%, 06/09/2021 | 620 | 617 | ||||||||||
GS Mortgage Securities Trust, Ser 2018- SRP5, Cl B | ||||||||||||
4.481%, 06/09/2021 | 430 | 424 | ||||||||||
JPMBB Commercial Mortgage Securities Trust, Ser2013-C15, CI B | ||||||||||||
4.927%, 11/15/2045 (A) | 210 | 227 | ||||||||||
JPMBB Commercial Mortgage Securities Trust, Ser2013-C17, CI B | ||||||||||||
5.055%, 01/15/2047 (A) | 30 | 32 | ||||||||||
JPMBB Commercial Mortgage Securities | ||||||||||||
4.557%, 09/15/2047 (A) | 80 | 82 | ||||||||||
JPMorgan Chase Commercial Mortgage Securities Trust, Ser C6, CI A3 | ||||||||||||
3.507%, 05/15/2045 | 1,117 | 1,148 | ||||||||||
| Description | Face Amount (Thousands) | Market Value ($ Thousands) | ||||||||||
MORTGAGE-BACKED SECURITIES (continued) |
| |||||||||||
JPMorgan Chase Commercial Mortgage Securities Trust, Ser FL7, Cl D | ||||||||||||
5.515%, VAR ICE LIBOR USD 1 Month+3.750%, 05/15/2028 (B) | $ | 129 | $ | 127 | ||||||||
JPMorgan Chase Commercial Mortgage | ||||||||||||
3.353%, 12/15/2047 (B) | 380 | 389 | ||||||||||
JPMorgan Mortgage Trust, Ser2015-5, Cl A9 | ||||||||||||
3.232%, 05/25/2045 (A)(B) | 83 | 83 | ||||||||||
JPMorgan Mortgage Trust, Ser2016-1, Cl A5 | ||||||||||||
3.500%, 05/25/2046 (A)(B) | 414 | 415 | ||||||||||
JPMorgan Mortgage Trust, Ser2018-3, Cl A1 | ||||||||||||
3.500%, 09/25/2048 (A)(B) | 641 | 653 | ||||||||||
JPMorgan Mortgage Trust, Ser2018-4, Cl A1 | ||||||||||||
3.500%, 10/25/2048 (A)(B) | 244 | 249 | ||||||||||
JPMorgan Mortgage Trust, Ser2018-5, Cl A1 | ||||||||||||
3.500%, 10/25/2048 (A)(B) | 461 | 470 | ||||||||||
JPMorgan Mortgage Trust, Ser2018-6, Cl 1A4 | ||||||||||||
3.500%, 12/25/2048 (A)(B) | 441 | 443 | ||||||||||
Lanark Master Issuer, Ser2018-1A, Cl 1A | ||||||||||||
2.319%, VAR ICE LIBOR USD 3 Month+0.420%, 12/22/2069 (B) | 595 | 595 | ||||||||||
MAD Mortgage Trust, Ser 330M, Cl A | ||||||||||||
3.188%, 08/15/2034 (A)(B) | 222 | 227 | ||||||||||
Morgan Stanley Bank of America Merrill Lynch Trust, Ser C34, Cl ASB | ||||||||||||
3.354%, 11/15/2052 | 615 | 638 | ||||||||||
Morgan Stanley Bank of America Merrill Lynch Trust, Ser C5, Cl A4 | ||||||||||||
3.176%, 08/15/2045 | 1,475 | 1,506 | ||||||||||
Morgan Stanley Bank of America Merrill Lynch Trust, Ser C9, Cl A4 | ||||||||||||
3.102%, 05/15/2046 | 714 | 732 | ||||||||||
Morgan Stanley Capital I Trust, Ser2012-C4, CI A4 | ||||||||||||
3.244%, 03/15/2045 | 220 | 224 | ||||||||||
MSCG Trust, Ser2016-SNR, CI C | ||||||||||||
5.205%, 11/15/2034 (B) | 128 | 130 | ||||||||||
MSCG Trust, Ser ALDR, CI A2 | ||||||||||||
3.577%, 06/07/2035 (A)(B) | 410 | 419 | ||||||||||
Natixis Commercial Mortgage Securities Trust, Ser FAME, Cl B | ||||||||||||
3.655%, 08/15/2034 (B) | 410 | 414 | ||||||||||
New Residential Mortgage Loan Trust, Ser2019-4A, CI A1B | ||||||||||||
3.500%, 12/25/2058 (A)(B) | 387 | 397 | ||||||||||
New Residential Mortgage Loan Trust, Ser 2019-NQM4, CI A1 | ||||||||||||
2.492%, 09/25/2059 (A)(B) | 554 | 551 | ||||||||||
Nomura Asset Acceptance Alternative Loan Trust, Ser2007-1, Cl 1A3 | ||||||||||||
5.957%, 03/25/2047 | 71 | 74 | ||||||||||
| 22 | New Covenant Funds / Semi-Annual Report / December 31, 2019 |
| Description | Face Amount (Thousands) | Market Value ($ Thousands) | ||||||||||
MORTGAGE-BACKED SECURITIES (continued) |
| |||||||||||
Seasoned Credit Risk Transfer Trust, Ser2019-1, Cl MA | ||||||||||||
3.500%, 07/25/2058 | $ | 940 | $ | 970 | ||||||||
Seasoned Credit Risk Transfer Trust, Ser2019-2, Cl MA | ||||||||||||
3.500%, 08/25/2058 | 778 | 809 | ||||||||||
Sequoia Mortgage Trust, Ser2017-1, Cl A4 | ||||||||||||
3.500%, 02/25/2047 (A)(B) | 670 | 678 | ||||||||||
Sequoia Mortgage Trust, Ser2017-5, Cl A4 | ||||||||||||
3.500%, 08/25/2047 (A)(B) | 704 | 718 | ||||||||||
Sequoia Mortgage Trust, Ser2017-6, Cl A4 | ||||||||||||
3.500%, 09/25/2047 (A)(B) | 356 | 363 | ||||||||||
Towd Point Mortgage Trust, Ser2015-5, CI A1B | ||||||||||||
2.750%, 05/25/2055 (A)(B) | 196 | 196 | ||||||||||
UBS-BAMLL Trust, Ser2012-WRM, CI A | ||||||||||||
3.663%, 06/10/2030 (B) | 116 | 119 | ||||||||||
UBS-Barclays Commercial Mortgage Trust, Ser2012-C2, CI A4 | ||||||||||||
3.525%, 05/10/2063 | 73 | 75 | ||||||||||
UBS-Barclays Commercial Mortgage Trust, Ser2012-CN, CI XA, IO | ||||||||||||
1.309%, 05/10/2063 (A)(B) | 332 | 9 | ||||||||||
Wells Fargo Commercial Mortgage Trust, Ser 2015-NXS3, Cl NXS3 | ||||||||||||
3.371%, 09/15/2057 | 160 | 165 | ||||||||||
WFRBS Commercial Mortgage Trust, Ser2012-C7, CI XA, IO | ||||||||||||
1.345%, 06/15/2045 (A)(B) | 1,080 | 26 | ||||||||||
WFRBS Commercial Mortgage Trust, Ser2013-C13, Cl XA, IO | ||||||||||||
1.196%, 05/15/2045 (A)(B) | 1,079 | 36 | ||||||||||
WFRBS Commercial Mortgage Trust, Ser2014-C23, CI B | ||||||||||||
4.378%, 10/15/2057 (A) | 270 | 287 | ||||||||||
WFRBS Commercial Mortgage Trust, Ser2014-C23, CI XA, IO | ||||||||||||
0.569%, 10/15/2057 (A) | 1,073 | 25 | ||||||||||
WFRBS Commercial Mortgage Trust, Ser C11, Cl AS | ||||||||||||
3.311%, 03/15/2045 | 160 | 164 | ||||||||||
WFRBS Commercial Mortgage Trust, Ser C2, CI A4 | ||||||||||||
4.869%, 02/15/2044 (A)(B) | 846 | 862 | ||||||||||
WFRBS Commercial Mortgage Trust, Ser C4, CI A4 | ||||||||||||
4.902%, 06/15/2044 (A)(B) | 1,796 | 1,845 | ||||||||||
| 25,019 | ||||||||||||
Total Mortgage-Backed Securities | 141,221 | |||||||||||
| Description | Face Amount (Thousands) | Market Value ($ Thousands) | ||||||||||
CORPORATE OBLIGATIONS — 27.1% |
| |||||||||||
Communication Services — 2.3% |
| |||||||||||
AT&T | ||||||||||||
4.250%, 03/01/2027 | $ | 150 | $ | 165 | ||||||||
4.125%, 02/17/2026 | 408 | 442 | ||||||||||
3.875%, 08/15/2021 | 10 | 10 | ||||||||||
3.721%, 11/27/2022 (B)(C) | 2,000 | 1,870 | ||||||||||
3.000%, 06/30/2022 | 10 | 10 | ||||||||||
Charter Communications Operating | ||||||||||||
5.050%, 03/30/2029 | 20 | 23 | ||||||||||
4.908%, 07/23/2025 | 110 | 121 | ||||||||||
3.750%, 02/15/2028 | 20 | 21 | ||||||||||
3.579%, 07/23/2020 | 30 | 30 | ||||||||||
Comcast | ||||||||||||
4.150%, 10/15/2028 | 80 | 90 | ||||||||||
3.950%, 10/15/2025 | 150 | 164 | ||||||||||
Comcast Cable Communications Holdings | ||||||||||||
9.455%, 11/15/2022 | 1,116 | 1,349 | ||||||||||
Cox Communications | ||||||||||||
3.250%, 12/15/2022 (B) | 859 | 884 | ||||||||||
Fox | ||||||||||||
4.709%, 01/25/2029 (B) | 40 | 46 | ||||||||||
NBCUniversal Media | ||||||||||||
4.375%, 04/01/2021 | 10 | 10 | ||||||||||
Sprint Spectrum | ||||||||||||
3.360%, 09/20/2021 (B) | 337 | 340 | ||||||||||
TCI Communications | ||||||||||||
7.875%, 02/15/2026 | 240 | 312 | ||||||||||
Telefonica Emisiones SAU | ||||||||||||
4.895%, 03/06/2048 | 340 | 390 | ||||||||||
Tencent Holdings MTN | ||||||||||||
3.595%, 01/19/2028 (B) | 250 | 261 | ||||||||||
Verizon Communications | ||||||||||||
3.875%, 02/08/2029 | 30 | 33 | ||||||||||
3.376%, 02/15/2025 | 232 | 246 | ||||||||||
2.625%, 08/15/2026 | 513 | 521 | ||||||||||
Viacom | ||||||||||||
3.875%, 04/01/2024 | 20 | 21 | ||||||||||
Vodafone Group PLC | ||||||||||||
3.750%, 01/16/2024 | 410 | 434 | ||||||||||
Walt Disney | ||||||||||||
3.000%, 09/15/2022 | 30 | 31 | ||||||||||
| 7,824 | ||||||||||||
Consumer Discretionary — 1.5% |
| |||||||||||
Amazon.com | ||||||||||||
3.150%, 08/22/2027 | 470 | 498 | ||||||||||
BMW US Capital | ||||||||||||
2.150%, 04/06/2020 (B) | 950 | 951 | ||||||||||
1.850%, 09/15/2021 (B) | 20 | 20 | ||||||||||
Ford Motor Credit | ||||||||||||
8.125%, 01/15/2020 | 340 | 341 | ||||||||||
| New Covenant Funds / Semi-Annual Report / December 31, 2019 | 23 |
SCHEDULE OF INVESTMENTS (Unaudited)
December 31, 2019
New Covenant Income Fund(Continued)
| Description | Face Amount (Thousands) | Market Value ($ Thousands) | ||||||||||
CORPORATE OBLIGATIONS (continued) |
| |||||||||||
General Motors Financial | ||||||||||||
4.150%, 06/19/2023 | $ | 600 | $ | 630 | ||||||||
3.700%, 11/24/2020 | 80 | 81 | ||||||||||
3.700%, 05/09/2023 | 190 | 196 | ||||||||||
2.450%, 11/06/2020 | 30 | 30 | ||||||||||
KazMunayGas National JSC | ||||||||||||
5.375%, 04/24/2030 (B) | 400 | 463 | ||||||||||
McDonald’s MTN | ||||||||||||
3.350%, 04/01/2023 | 280 | 292 | ||||||||||
Newell Brands | ||||||||||||
3.850%, 04/01/2023 | 53 | 55 | ||||||||||
Time Warner Cable | ||||||||||||
5.000%, 02/01/2020 | 990 | 992 | ||||||||||
Volkswagen Group of America Finance | ||||||||||||
4.625%, 11/13/2025 (B) | 461 | 510 | ||||||||||
|
| |||||||||||
| 5,059 | ||||||||||||
|
| |||||||||||
Consumer Staples — 0.2% |
| |||||||||||
Kraft Heinz Foods | ||||||||||||
4.875%, 02/15/2025 (B) | 48 | 49 | ||||||||||
Mars | ||||||||||||
3.200%, 04/01/2030 (B) | 30 | 32 | ||||||||||
2.700%, 04/01/2025 (B) | 60 | 61 | ||||||||||
PepsiCo | ||||||||||||
3.000%, 08/25/2021 | 290 | 296 | ||||||||||
2.750%, 03/05/2022 | 80 | 81 | ||||||||||
Walmart | ||||||||||||
3.050%, 07/08/2026 | 100 | 106 | ||||||||||
|
| |||||||||||
| 625 | ||||||||||||
|
| |||||||||||
Energy — 2.6% | ||||||||||||
Apache | ||||||||||||
3.250%, 04/15/2022 | 616 | 628 | ||||||||||
BP Capital Markets America | ||||||||||||
3.790%, 02/06/2024 | 80 | 85 | ||||||||||
3.410%, 02/11/2026 | 40 | 42 | ||||||||||
3.216%, 11/28/2023 | 90 | 94 | ||||||||||
3.119%, 05/04/2026 | 170 | 178 | ||||||||||
BP Capital Markets PLC | ||||||||||||
3.535%, 11/04/2024 | 20 | 21 | ||||||||||
Cameron LNG | ||||||||||||
2.902%, 07/15/2031 (B) | 60 | 60 | ||||||||||
Chevron | ||||||||||||
2.100%, 05/16/2021 | 130 | 131 | ||||||||||
1.991%, 03/03/2020 | 1,150 | 1,150 | ||||||||||
Cimarex Energy | ||||||||||||
4.375%, 06/01/2024 | 50 | 53 | ||||||||||
3.900%, 05/15/2027 | 130 | 135 | ||||||||||
Concho Resources | ||||||||||||
4.375%, 01/15/2025 | 10 | 10 | ||||||||||
4.300%, 08/15/2028 | 30 | 33 | ||||||||||
3.750%, 10/01/2027 | 90 | 95 | ||||||||||
| Description | Face Amount (Thousands) | Market Value ($ Thousands) | ||||||||||
CORPORATE OBLIGATIONS (continued) |
| |||||||||||
Continental Resources | ||||||||||||
5.000%, 09/15/2022 | $ | 120 | $ | 121 | ||||||||
4.375%, 01/15/2028 | 20 | 21 | ||||||||||
3.800%, 06/01/2024 | 160 | 166 | ||||||||||
Devon Energy | ||||||||||||
5.850%, 12/15/2025 | 210 | 249 | ||||||||||
Enterprise Products Operating | ||||||||||||
4.150%, 10/16/2028 | 140 | 155 | ||||||||||
3.900%, 02/15/2024 | 457 | 485 | ||||||||||
EOG Resources | ||||||||||||
4.150%, 01/15/2026 | 60 | 66 | ||||||||||
ExxonMobil | ||||||||||||
3.043%, 03/01/2026 | 150 | 157 | ||||||||||
Halliburton | ||||||||||||
3.800%, 11/15/2025 | 10 | 10 | ||||||||||
3.250%, 11/15/2021 | 180 | 184 | ||||||||||
Kinder Morgan | ||||||||||||
4.300%, 06/01/2025 | 60 | 65 | ||||||||||
Kinder Morgan Energy Partners | ||||||||||||
3.500%, 03/01/2021 | 30 | 30 | ||||||||||
MidAmerican Energy | ||||||||||||
3.650%, 04/15/2029 | 140 | 153 | ||||||||||
MPLX | ||||||||||||
4.800%, 02/15/2029 | 50 | 55 | ||||||||||
4.125%, 03/01/2027 | 110 | 116 | ||||||||||
4.000%, 03/15/2028 | 40 | 41 | ||||||||||
Noble Energy | ||||||||||||
3.250%, 10/15/2029 | 80 | 81 | ||||||||||
Occidental Petroleum | ||||||||||||
5.550%, 03/15/2026 | 180 | 204 | ||||||||||
4.381%, 10/10/2036 (C) | 3,000 | 1,507 | ||||||||||
4.100%, 02/01/2021 | 50 | 51 | ||||||||||
3.400%, 04/15/2026 | 80 | 82 | ||||||||||
3.200%, 08/15/2026 | 130 | 131 | ||||||||||
3.125%, 02/15/2022 | 100 | 102 | ||||||||||
3.000%, 02/15/2027 | 130 | 130 | ||||||||||
2.600%, 08/13/2021 | 250 | 252 | ||||||||||
Phillips 66 Partners | ||||||||||||
2.450%, 12/15/2024 | 413 | 413 | ||||||||||
Schlumberger Holdings | ||||||||||||
3.900%, 05/17/2028 (B) | 456 | 486 | ||||||||||
Sinopec Group Overseas Development | ||||||||||||
4.375%, 04/10/2024 (B) | 290 | 313 | ||||||||||
Williams | ||||||||||||
5.250%, 03/15/2020 | 40 | 40 | ||||||||||
3.750%, 06/15/2027 | 60 | 63 | ||||||||||
|
| |||||||||||
| 8,644 | ||||||||||||
|
| |||||||||||
Financials — 11.2% | ||||||||||||
American Express | ||||||||||||
3.400%, 02/27/2023 | 972 | 1,009 | ||||||||||
2.650%, 12/02/2022 | 264 | 269 | ||||||||||
| 24 | New Covenant Funds / Semi-Annual Report / December 31, 2019 |
| Description | Face Amount (Thousands) | Market Value ($ Thousands) | ||||||||||
CORPORATE OBLIGATIONS (continued) |
| |||||||||||
American Express Credit MTN | ||||||||||||
2.375%, 05/26/2020 | $ | 80 | $ | 80 | ||||||||
2.200%, 03/03/2020 | 710 | 710 | ||||||||||
Anglo American Capital | ||||||||||||
3.625%, 09/11/2024 (B) | 200 | 207 | ||||||||||
Banco Santander | ||||||||||||
4.379%, 04/12/2028 | 200 | 219 | ||||||||||
3.121%, VAR ICE LIBOR USD 3 Month+1.120%, 04/12/2023 | 200 | 201 | ||||||||||
Bank of America | ||||||||||||
3.419%, VAR ICE LIBOR USD 3 Month+1.040%, 12/20/2028 | 234 | 246 | ||||||||||
3.004%, VAR ICE LIBOR USD 3 Month+0.790%, 12/20/2023 | 258 | 264 | ||||||||||
Bank of America MTN | ||||||||||||
4.450%, 03/03/2026 | 678 | 745 | ||||||||||
4.200%, 08/26/2024 | 210 | 225 | ||||||||||
4.125%, 01/22/2024 | 370 | 398 | ||||||||||
4.100%, 07/24/2023 | 280 | 299 | ||||||||||
4.000%, 04/01/2024 | 440 | 471 | ||||||||||
4.000%, 01/22/2025 | 80 | 85 | ||||||||||
3.974%, VAR ICE LIBOR USD 3 Month+1.210%, 02/07/2030 | 80 | 88 | ||||||||||
3.593%, VAR ICE LIBOR USD 3 Month+1.370%, 07/21/2028 | 210 | 223 | ||||||||||
3.550%, VAR ICE LIBOR USD 3 Month+0.780%, 03/05/2024 | 80 | 83 | ||||||||||
3.500%, 04/19/2026 | 130 | 138 | ||||||||||
3.300%, 01/11/2023 | 60 | 62 | ||||||||||
Bank of New York Mellon MTN | ||||||||||||
3.300%, 08/23/2029 | 790 | 827 | ||||||||||
Barclays Bank | ||||||||||||
2.650%, 01/11/2021 | 1,199 | 1,207 | ||||||||||
BNP Paribas | ||||||||||||
5.198%, VAR ICE LIBOR USD 3 Month+2.567%, 01/10/2030 (B) | 200 | 235 | ||||||||||
4.705%, VAR ICE LIBOR USD 3 Month+2.235%, 01/10/2025 (B) | 270 | 293 | ||||||||||
4.400%, 08/14/2028 (B) | 200 | 222 | ||||||||||
BPCE MTN | ||||||||||||
3.000%, 05/22/2022 (B) | 640 | 651 | ||||||||||
Capital One | ||||||||||||
2.650%, 08/08/2022 | 830 | 843 | ||||||||||
Charles Schwab | ||||||||||||
3.850%, 05/21/2025 | 110 | 119 | ||||||||||
Citigroup | ||||||||||||
8.125%, 07/15/2039 | 12 | 20 | ||||||||||
5.500%, 09/13/2025 | 150 | 171 | ||||||||||
5.300%, 05/06/2044 | 31 | 39 | ||||||||||
4.650%, 07/30/2045 | 28 | 35 | ||||||||||
4.450%, 09/29/2027 | 120 | 132 | ||||||||||
4.400%, 06/10/2025 | �� | 160 | 174 | |||||||||
4.300%, 11/20/2026 | 40 | 44 | ||||||||||
| Description | Face Amount (Thousands) | Market Value ($ Thousands) | ||||||||||
CORPORATE OBLIGATIONS (continued) |
| |||||||||||
4.125%, 07/25/2028 | $ | 40 | $ | 44 | ||||||||
4.075%, VAR ICE LIBOR USD 3 Month+1.192%, 04/23/2029 | 240 | 263 | ||||||||||
4.050%, 07/30/2022 | 40 | 42 | ||||||||||
3.668%, VAR ICE LIBOR USD 3 Month+1.390%, 07/24/2028 | 340 | 362 | ||||||||||
3.500%, 05/15/2023 | 100 | 104 | ||||||||||
3.400%, 05/01/2026 | 354 | 372 | ||||||||||
Cooperatieve Rabobank UA | ||||||||||||
3.950%, 11/09/2022 | 670 | 701 | ||||||||||
3.875%, 09/26/2023 (B) | 595 | 629 | ||||||||||
Daiwa Securities Group | ||||||||||||
3.129%, 04/19/2022 (B) | 50 | 51 | ||||||||||
Danske Bank | ||||||||||||
5.000%, 01/12/2022 (B) | 200 | 210 | ||||||||||
3.001%, VAR ICE LIBOR USD 3 Month+1.249%, 09/20/2022 (B) | 200 | 202 | ||||||||||
Ferguson Finance | ||||||||||||
4.500%,10/24/2028 (B) | 780 | 854 | ||||||||||
General Electric Capital MTN | ||||||||||||
4.650%, 10/17/2021 | 180 | 188 | ||||||||||
4.375%, 09/16/2020 | 10 | 10 | ||||||||||
Glencore Funding | ||||||||||||
2.875%, 04/16/2020 (B) | 20 | 20 | ||||||||||
Goldman Sachs Group | ||||||||||||
5.750%, 01/24/2022 | 662 | 711 | ||||||||||
5.150%, 05/22/2045 | 20 | 25 | ||||||||||
4.750%, 10/21/2045 | 40 | 49 | ||||||||||
4.250%, 10/21/2025 | 90 | 98 | ||||||||||
4.223%, VAR ICE LIBOR USD 3 Month+1.301%, 05/01/2029 | 550 | 606 | ||||||||||
3.691%, VAR ICE LIBOR USD 3 Month+1.510%, 06/05/2028 | 300 | 319 | ||||||||||
3.500%, 11/16/2026 | 90 | 95 | ||||||||||
Goldman Sachs Group MTN | ||||||||||||
6.000%, 06/15/2020 | 480 | 488 | ||||||||||
5.375%, 03/15/2020 | 640 | 644 | ||||||||||
4.000%, 03/03/2024 | 420 | 448 | ||||||||||
HSBC Holdings PLC | ||||||||||||
4.583%, VAR ICE LIBOR USD 3 Month+1.535%, 06/19/2029 | 400 | 447 | ||||||||||
3.400%, 03/08/2021 | 360 | 366 | ||||||||||
2.950%, 05/25/2021 | 380 | 385 | ||||||||||
Intesa Sanpaolo | ||||||||||||
3.375%, 01/12/2023 (B) | 200 | 203 | ||||||||||
John Deere Capital | ||||||||||||
1.700%, 01/15/2020 | 40 | 40 | ||||||||||
JPMorgan Chase | ||||||||||||
4.500%, 01/24/2022 | 786 | 825 | ||||||||||
4.452%, VAR ICE LIBOR USD 3 Month+1.330%, 12/05/2029 | 200 | 228 | ||||||||||
4.203%, VAR ICE LIBOR USD 3 Month+1.260%, 07/23/2029 | 773 | 863 | ||||||||||
| New Covenant Funds / Semi-Annual Report / December 31, 2019 | 25 |
SCHEDULE OF INVESTMENTS (Unaudited)
December 31, 2019
New Covenant Income Fund(Continued)
| Description | Face Amount (Thousands) | Market Value ($ Thousands) | ||||||||||
CORPORATE OBLIGATIONS (continued) |
| |||||||||||
4.023%, VAR ICE LIBOR USD 3 Month+1.000%, 12/05/2024 | $ | 230 | $ | 245 | ||||||||
4.005%, VAR ICE LIBOR USD 3 Month+1.120%, 04/23/2029 | 100 | 110 | ||||||||||
3.875%, 09/10/2024 | 290 | 311 | ||||||||||
2.550%, 03/01/2021 | 30 | 30 | ||||||||||
KKR Group Finance VI | ||||||||||||
3.750%, 07/01/2029 (B) | 595 | 634 | ||||||||||
Liberty Mutual Group | ||||||||||||
4.569%, 02/01/2029 (B) | 321 | 359 | ||||||||||
4.250%, 06/15/2023 (B) | 91 | 96 | ||||||||||
Lincoln National | ||||||||||||
6.250%, 02/15/2020 | 570 | 573 | ||||||||||
Lloyds Banking Group | ||||||||||||
2.858%, VAR ICE LIBOR USD 3 Month+1.249%, 03/17/2023 | 434 | 440 | ||||||||||
Mitsubishi UFJ Financial Group | ||||||||||||
3.407%, 03/07/2024 | 510 | 532 | ||||||||||
Morgan Stanley MTN | ||||||||||||
3.772%, VAR ICE LIBOR USD 3 Month+1.140%, 01/24/2029 | 150 | 162 | ||||||||||
3.750%, 02/25/2023 | 1,110 | 1,162 | ||||||||||
National Rural Utilities Cooperative Finance | ||||||||||||
2.850%, 01/27/2025 | 1,060 | 1,091 | ||||||||||
ORIX | ||||||||||||
4.050%, 01/16/2024 | 365 | 388 | ||||||||||
Peachtree Corners Funding Trust | ||||||||||||
3.976%, 02/15/2025 (B) | 944 | 998 | ||||||||||
Penske Truck Leasing Lp | ||||||||||||
3.900%, 02/01/2024 (B) | 965 | 1,014 | ||||||||||
Principal Life Global Funding II | ||||||||||||
2.625%, 11/19/2020 (B) | 570 | 573 | ||||||||||
Reliance Standard Life Global Funding II MTN | ||||||||||||
2.500%, 01/15/2020 (B) | 30 | 30 | ||||||||||
Royal Bank of Canada MTN | ||||||||||||
2.150%, 10/26/2020 | 70 | 70 | ||||||||||
Royal Bank of Scotland Group | ||||||||||||
4.269%, VAR ICE LIBOR USD 3 Month+1.762%, 03/22/2025 | 200 | 212 | ||||||||||
Royal Bank of Scotland Group PLC | ||||||||||||
4.519%, VAR ICE LIBOR USD 3 Month+1.550%, 06/25/2024 | 290 | 308 | ||||||||||
Santander UK Group Holdings PLC | ||||||||||||
3.571%, 01/10/2023 | 200 | 205 | ||||||||||
Santander UK PLC | ||||||||||||
2.375%, 03/16/2020 | 40 | 40 | ||||||||||
SMBC Aviation Capital Finance DAC | ||||||||||||
4.125%, 07/15/2023 (B) | 200 | 210 | ||||||||||
SunTrust Bank | ||||||||||||
2.800%, 05/17/2022 | 1,146 | 1,168 | ||||||||||
Svenska Handelsbanken MTN | ||||||||||||
3.350%, 05/24/2021 | 250 | 255 | ||||||||||
| Description | Face Amount (Thousands) | Market Value ($ Thousands) | ||||||||||
CORPORATE OBLIGATIONS (continued) |
| |||||||||||
UBS Group Funding Jersey | ||||||||||||
4.125%, 04/15/2026 (B) | $ | 634 | $ | 689 | ||||||||
UBS Group Funding Switzerland | ||||||||||||
4.253%, 03/23/2028 (B) | 250 | 273 | ||||||||||
3.491%, 05/23/2023 (B) | 390 | 402 | ||||||||||
US Bancorp | ||||||||||||
3.375%, 02/05/2024 | 540 | 567 | ||||||||||
USAA Capital MTN | ||||||||||||
2.625%, 06/01/2021 (B) | 350 | 354 | ||||||||||
Wells Fargo | ||||||||||||
3.069%, 01/24/2023 | 808 | 825 | ||||||||||
3.000%, 10/23/2026 | 190 | 195 | ||||||||||
Wells Fargo MTN | ||||||||||||
4.900%, 11/17/2045 | 30 | 37 | ||||||||||
4.600%, 04/01/2021 | 480 | 495 | ||||||||||
4.300%, 07/22/2027 | 200 | 219 | ||||||||||
3.750%, 01/24/2024 | 540 | 571 | ||||||||||
3.450%, 02/13/2023
|
| 120
|
|
| 124
|
| ||||||
|
| |||||||||||
| 37,893 | ||||||||||||
|
| |||||||||||
Health Care — 2.5% |
| |||||||||||
Abbott Laboratories | ||||||||||||
3.400%, 11/30/2023 | 175 | 184 | ||||||||||
AbbVie | ||||||||||||
3.600%, 05/14/2025 | 10 | 11 | ||||||||||
3.200%, 11/21/2029 (B) | 40 | 41 | ||||||||||
2.950%, 11/21/2026 (B) | 20 | 20 | ||||||||||
2.600%, 11/21/2024 (B) | 140 | 141 | ||||||||||
2.300%, 11/21/2022 (B) | 1,046 | 1,051 | ||||||||||
Adventist Health System | ||||||||||||
2.433%, 09/01/2024 | 431 | 432 | ||||||||||
Aetna | ||||||||||||
2.800%, 06/15/2023 | 20 | 20 | ||||||||||
Amgen | ||||||||||||
2.125%, 05/01/2020 | 20 | 20 | ||||||||||
Anthem | ||||||||||||
3.125%, 05/15/2022 | 340 | 349 | ||||||||||
Baylor Scott & White Holdings | ||||||||||||
1.947%, 11/15/2021 | 1,226 | 1,225 | ||||||||||
Becton Dickinson | ||||||||||||
4.685%, 12/15/2044 | 40 | 47 | ||||||||||
3.734%, 12/15/2024 | 24 | 25 | ||||||||||
3.363%, 06/06/2024 | 210 | 219 | ||||||||||
Bristol-Myers Squibb | ||||||||||||
3.875%, 08/15/2025 (B) | 130 | 141 | ||||||||||
3.550%, 08/15/2022 (B) | 60 | 62 | ||||||||||
3.400%, 07/26/2029 (B) | 50 | 54 | ||||||||||
3.200%, 06/15/2026 (B) | 120 | 126 | ||||||||||
2.900%, 07/26/2024 (B) | 180 | 186 | ||||||||||
2.600%, 05/16/2022 (B) | 80 | 81 | ||||||||||
2.250%, 08/15/2021 (B) | 70 | 70 | ||||||||||
| 26 | New Covenant Funds / Semi-Annual Report / December 31, 2019 |
| Description | Face Amount (Thousands) | Market Value ($ Thousands) | ||||||||||
CORPORATE OBLIGATIONS (continued) |
| |||||||||||
Cigna | ||||||||||||
4.375%, 10/15/2028 | $ | 120 | $ | 133 | ||||||||
4.125%, 11/15/2025 | 50 | 54 | ||||||||||
3.500%, 06/15/2024 (B) | 160 | 167 | ||||||||||
3.400%, 09/17/2021 | 60 | 62 | ||||||||||
CVS Health | ||||||||||||
4.300%, 03/25/2028 | 80 | 87 | ||||||||||
3.875%, 07/20/2025 | 95 | 101 | ||||||||||
3.350%, 03/09/2021 | 32 | 33 | ||||||||||
2.800%, 07/20/2020 | 190 | 191 | ||||||||||
CVS Pass-Through Trust | ||||||||||||
7.507%, 01/10/2032 (B) | 1,154 | 1,427 | ||||||||||
Eli Lilly | ||||||||||||
2.350%, 05/15/2022 | 170 | 172 | ||||||||||
Gilead Sciences | ||||||||||||
2.550%, 09/01/2020 | 20 | 20 | ||||||||||
2.500%, 09/01/2023 | 50 | 51 | ||||||||||
Humana | ||||||||||||
3.150%, 12/01/2022 | 240 | 246 | ||||||||||
2.900%, 12/15/2022 | 290 | 296 | ||||||||||
SSM Health Care | ||||||||||||
3.688%, 06/01/2023 | 644 | 672 | ||||||||||
Teva Pharmaceutical Finance BV | ||||||||||||
2.950%, 12/18/2022 | 30 | 29 | ||||||||||
UnitedHealth Group | ||||||||||||
3.875%, 12/15/2028 | 30 | 33 | ||||||||||
2.875%, 12/15/2021 | 50 | 51 | ||||||||||
2.700%, 07/15/2020
|
| 70
|
|
| 70
|
| ||||||
|
| |||||||||||
| 8,400 | ||||||||||||
|
| |||||||||||
Industrials — 2.4% |
| |||||||||||
3M | ||||||||||||
2.375%, 08/26/2029 | 30 | 30 | ||||||||||
AerCap Ireland Capital DAC | ||||||||||||
4.625%, 10/30/2020 | 730 | 745 | ||||||||||
4.500%, 05/15/2021 | 310 | 320 | ||||||||||
American Airlines, Ser2016-3, Cl A | ||||||||||||
3.250%, 10/15/2028 | 1,087 | 1,114 | ||||||||||
American Airlines Pass-Through Trust, Ser2013-2, CI A | ||||||||||||
4.950%, 01/15/2023 | 286 | 298 | ||||||||||
Aviation Capital Group | ||||||||||||
4.125%, 08/01/2025 (B) | 160 | 167 | ||||||||||
Burlington Northern and Santa Fe Railway Pass-Through Trust, Ser2002-2 | ||||||||||||
5.140%, 01/15/2021 | 44 | 44 | ||||||||||
Burlington Northern Santa Fe | ||||||||||||
4.550%, 09/01/2044 | 10 | 12 | ||||||||||
Continental AirlinesPass-Through Trust, Ser2012-2, CI A | ||||||||||||
4.000%, 10/29/2024 | 635 | 670 | ||||||||||
| Description | Face Amount (Thousands) | Market Value ($ Thousands) | ||||||||||
CORPORATE OBLIGATIONS (continued) |
| |||||||||||
Delta Air Lines Pass-Through Trust, Ser 2015-1, CI AA | ||||||||||||
3.625%, 07/30/2027 | $ | 544 | $ | 577 | ||||||||
Delta Air Lines Pass-Through Trust, Ser 2019-1, CI AA | ||||||||||||
3.204%, 04/25/2024 | 621 | 646 | ||||||||||
Eaton | ||||||||||||
2.750%, 11/02/2022 | 450 | 459 | ||||||||||
GE Capital International Funding Unlimited Co | ||||||||||||
2.342%, 11/15/2020 | 1,205 | 1,206 | ||||||||||
General Electric MTN | ||||||||||||
6.875%, 01/10/2039 | 30 | 40 | ||||||||||
5.500%, 01/08/2020 | 10 | 10 | ||||||||||
General Electric Capital MTN | ||||||||||||
5.300%, 02/11/2021 | 160 | 165 | ||||||||||
International Lease Finance | ||||||||||||
5.875%, 08/15/2022 | 400 | 436 | ||||||||||
Republic Services | ||||||||||||
3.200%, 03/15/2025 | 180 | 187 | ||||||||||
Union Pacific | ||||||||||||
3.950%, 09/10/2028 | 20 | 22 | ||||||||||
3.750%, 07/15/2025 | 20 | 22 | ||||||||||
United Airlines Pass-Through Trust, Ser 2014-1, CI A | ||||||||||||
4.000%, 04/11/2026 | 707 | 752 | ||||||||||
Waste Management | ||||||||||||
3.500%, 05/15/2024 | 120 | 126 | ||||||||||
3.450%, 06/15/2029 | 30 | 32 | ||||||||||
3.200%, 06/15/2026
|
| 30
|
|
| 32
|
| ||||||
|
| |||||||||||
| 8,112 | ||||||||||||
|
| |||||||||||
Information Technology — 1.1% |
| |||||||||||
Apple | ||||||||||||
3.350%, 02/09/2027 | 210 | 224 | ||||||||||
2.900%, 09/12/2027 | 110 | 114 | ||||||||||
2.450%, 08/04/2026 | 70 | 71 | ||||||||||
2.000%, 11/13/2020 | 80 | 80 | ||||||||||
1.550%, 08/04/2021 | 60 | 60 | ||||||||||
Broadcom | ||||||||||||
3.625%, 10/15/2024 (B) | 485 | 504 | ||||||||||
Diamond 1 Finance | ||||||||||||
4.420%, 06/15/2021 (B) | 430 | 443 | ||||||||||
Intel | ||||||||||||
3.700%, 07/29/2025 | 30 | 33 | ||||||||||
Mastercard | ||||||||||||
3.375%, 04/01/2024 | 190 | 202 | ||||||||||
Microsoft | ||||||||||||
3.300%, 02/06/2027 | 90 | 96 | ||||||||||
2.400%, 02/06/2022 | 150 | 152 | ||||||||||
1.850%, 02/06/2020 | 360 | 360 | ||||||||||
1.550%, 08/08/2021 | 110 | 110 | ||||||||||
| New Covenant Funds / Semi-Annual Report / December 31, 2019 | 27 |
SCHEDULE OF INVESTMENTS (Unaudited)
December 31, 2019
New Covenant Income Fund(Continued)
| Description | Face Amount (Thousands) | Market Value ($ Thousands) | ||||||||||
CORPORATE OBLIGATIONS (continued) |
| |||||||||||
NXP BV | ||||||||||||
4.625%, 06/01/2023 (B) | $ | 479 | $ | 512 | ||||||||
Oracle | ||||||||||||
2.500%, 10/15/2022 | 130 | 132 | ||||||||||
salesforce.com | ||||||||||||
3.700%, 04/11/2028 | 150 | 164 | ||||||||||
3.250%, 04/11/2023 | 70 | 73 | ||||||||||
Visa | ||||||||||||
4.300%, 12/14/2045 | 10 | 12 | ||||||||||
3.150%, 12/14/2025 | 110 | 117 | ||||||||||
2.200%, 12/14/2020
|
| 300
|
|
| 301
|
| ||||||
|
| |||||||||||
| 3,760 | ||||||||||||
|
| |||||||||||
Materials — 0.6% |
| |||||||||||
ArcelorMittal | ||||||||||||
4.550%, 03/11/2026 | 100 | 106 | ||||||||||
3.600%, 07/16/2024 | 180 | 185 | ||||||||||
Equate Petrochemical BV MTN | ||||||||||||
4.250%, 11/03/2026 (B) | 200 | 214 | ||||||||||
Glencore Funding | ||||||||||||
4.125%, 05/30/2023 (B) | 890 | 927 | ||||||||||
4.125%, 03/12/2024 (B) | 120 | 126 | ||||||||||
4.000%, 03/27/2027 (B) | 120 | 125 | ||||||||||
Southern Copper | ||||||||||||
3.500%, 11/08/2022 | 130 | 134 | ||||||||||
Vale Overseas | ||||||||||||
6.250%, 08/10/2026
|
| 140
|
|
| 164
|
| ||||||
|
| |||||||||||
| 1,981 | ||||||||||||
|
| |||||||||||
Real Estate — 0.9% |
| |||||||||||
American Tower Trust, Ser2013-13, Cl 2A | ||||||||||||
3.070%, 03/15/2048 (B) | 620 | 628 | ||||||||||
Digital Realty Trust | ||||||||||||
3.600%, 07/01/2029 | 815 | 848 | ||||||||||
Ventas Realty | ||||||||||||
3.500%, 02/01/2025 | 488 | 510 | ||||||||||
Welltower | ||||||||||||
4.500%, 01/15/2024
|
| 902
|
|
| 974
|
| ||||||
|
| |||||||||||
| 2,960 | ||||||||||||
|
| |||||||||||
Utilities — 1.8% |
| |||||||||||
Aquarion | ||||||||||||
4.000%, 08/15/2024 (B) | 227 | 239 | ||||||||||
Commonwealth Edison | ||||||||||||
3.700%, 08/15/2028 | 468 | 512 | ||||||||||
Dominion Energy | ||||||||||||
2.579%, 07/01/2020 | 260 | 260 | ||||||||||
Duke Energy | ||||||||||||
3.550%, 09/15/2021 | 170 | 174 | ||||||||||
2.400%, 08/15/2022 | 150 | 151 | ||||||||||
FirstEnergy | ||||||||||||
4.250%, 03/15/2023 | 380 | 401 | ||||||||||
| Description | Face Amount (Thousands) | Market Value ($ Thousands) | ||||||||||
CORPORATE OBLIGATIONS (continued) |
| |||||||||||
2.850%, 07/15/2022 | $ | 330 | $ | 335 | ||||||||
NextEra Energy Capital Holdings | ||||||||||||
2.403%, 09/01/2021 | 513 | 517 | ||||||||||
Northern States Power | ||||||||||||
7.125%, 07/01/2025 | 1,190 | 1,468 | ||||||||||
Perusahaan Listrik Negara MTN | ||||||||||||
5.450%, 05/21/2028 (B) | 370 | 426 | ||||||||||
Public Service Enterprise Group | ||||||||||||
2.875%, 06/15/2024 | 713 | 729 | ||||||||||
Sempra Energy | ||||||||||||
2.400%, 03/15/2020 |
| 840
|
|
| 840
|
| ||||||
|
| |||||||||||
| 6,052 | ||||||||||||
|
| |||||||||||
Total Corporate Obligations | 91,310 | |||||||||||
|
| |||||||||||
U.S. TREASURY OBLIGATIONS — 11.4% |
| |||||||||||
U.S. Treasury Bonds | ||||||||||||
3.125%, 05/15/2048 | 140 | 162 | ||||||||||
3.000%, 08/15/2048 | 50 | 56 | ||||||||||
3.000%, 02/15/2049 | 360 | 407 | ||||||||||
2.875%, 05/15/2049 | 20 | 22 | ||||||||||
2.750%, 08/15/2047 | 120 | 129 | ||||||||||
2.375%, 11/15/2049 | 420 | 420 | ||||||||||
U.S. Treasury Inflation-Protected Securities | ||||||||||||
2.375%, 01/15/2025 | 177 | 198 | ||||||||||
1.750%, 01/15/2028 | 86 | 97 | ||||||||||
1.375%, 02/15/2044 | 541 | 638 | ||||||||||
1.000%, 02/15/2046 | 391 | 430 | ||||||||||
1.000%, 02/15/2048 | 459 | 508 | ||||||||||
1.000%, 02/15/2049 | 1,606 | 1,744 | ||||||||||
0.750%, 02/15/2042 | 467 | 485 | ||||||||||
U.S. Treasury Notes | ||||||||||||
2.750%, 09/15/2021 | 2,759 | 2,812 | ||||||||||
2.750%, 02/15/2028 | 4 | 4 | ||||||||||
2.625%, 02/15/2029 | 1,600 | 1,697 | ||||||||||
2.375%, 02/29/2024 | 3,015 | 3,101 | ||||||||||
2.250%, 04/30/2024 | 30 | 31 | ||||||||||
2.250%, 02/15/2027 | 583 | 599 | ||||||||||
2.125%, 05/31/2021 | 1,400 | 1,410 | ||||||||||
2.000%, 02/15/2025 | 50 | 51 | ||||||||||
1.750%, 06/30/2024 | 16,682 | 16,735 | ||||||||||
1.750%, 12/31/2024 | 1,760 | 1,766 | ||||||||||
1.750%, 11/15/2029 | 1,130 | 1,114 | ||||||||||
1.625%, 12/15/2022 | 1,470 | 1,471 | ||||||||||
1.500%, 11/30/2024 | 80 | 79 | ||||||||||
1.375%, 08/31/2026 | 110 | 107 | ||||||||||
| 28 | New Covenant Funds / Semi-Annual Report / December 31, 2019 |
| Description | Face Amount (Thousands) | Market Value ($ Thousands) | ||||||||||
U.S. TREASURY OBLIGATIONS (continued) |
| |||||||||||
United States Treasury Bills | ||||||||||||
1.574%, 01/30/2020 (C) | $ | 2,287 | $ | 2,285 | ||||||||
Total U.S. Treasury Obligations | 38,558 | |||||||||||
ASSET-BACKED SECURITIES — 9.3% |
| |||||||||||
Automotive — 1.9% | ||||||||||||
Avis Budget Rental Car Funding AESOP, Ser2017-2A, CI A | ||||||||||||
2.970%, 03/20/2024 (B) | 310 | 316 | ||||||||||
Avis Budget Rental Car Funding AESOP, Ser2019-2A, CI A | ||||||||||||
3.350%, 09/22/2025 (B) | 320 | 330 | ||||||||||
Capital One Prime Auto Receivables Trust, Ser2019-2, CI A4 | ||||||||||||
1.960%, 02/18/2025 | 1,662 | 1,656 | ||||||||||
Hertz Vehicle Financing II, Ser2018-1A, Cl A | ||||||||||||
3.290%, 02/25/2024 (B) | 350 | 358 | ||||||||||
Honda Auto Receivables Owner Trust, Ser2019-2, Cl A3 | ||||||||||||
2.520%, 06/21/2023 | 572 | 579 | ||||||||||
NextGear Floorplan Master Owner Trust, Ser2019-1A, CI A2 | ||||||||||||
3.210%, 02/15/2024 (B) | 1,182 | 1,205 | ||||||||||
NextGear Floorplan Master Owner Trust, Ser2019-2A, CI A2 | ||||||||||||
2.070%, 10/15/2024 (B) | 556 | 552 | ||||||||||
World Omni Auto Receivables Trust, Ser2019-B, Cl A3 | ||||||||||||
2.590%, 07/15/2024 | 1,299 | 1,314 | ||||||||||
| 6,310 | ||||||||||||
Financials — 0.3% | ||||||||||||
BX Commercial Mortgage Trust, Ser XL, Cl A | ||||||||||||
2.685%, VAR ICE LIBOR USD 1 Month+0.920%, 10/15/2036 (B) | 1,105 | 1,106 | ||||||||||
Home — 0.4% | ||||||||||||
Citifinancial Mortgage Securities, Ser 2004-1, Cl AF4 | ||||||||||||
5.070%, 04/25/2034 | 206 | 214 | ||||||||||
GS Mortgage-Backed Securities Trust, Ser 2018-RPL1, CI A1A | ||||||||||||
3.750%, 10/25/2057 (B) | 352 | 364 | ||||||||||
Lake Country Mortgage Loan Trust, Ser2006-HE1, Cl M5 | ||||||||||||
3.792%, VAR ICE LIBOR USD 1 Month+2.000%, 07/25/2034 (B) | 390 | 401 | ||||||||||
| Description | Face Amount (Thousands) | Market Value ($ Thousands) | ||||||||||
ASSET-BACKED SECURITIES (continued) |
| |||||||||||
Master Asset-Backed Securities Trust, Ser2007-NCW, CI A1 | ||||||||||||
2.008%, VAR ICE LIBOR USD 1 Month+0.300%, 05/25/2037 (B) | $ | 218 | $ | 204 | ||||||||
New Century Home Equity Loan Trust, Ser2003-A, CI A | ||||||||||||
2.512%, VAR ICE LIBOR USD 1 Month+0.720%, 10/25/2033 (B) | 86 | 85 | ||||||||||
| 1,268 | ||||||||||||
Other Asset-Backed Securities — 6.7% |
| |||||||||||
AEP Texas Restoration Funding, Ser2019-1, CI A2 | ||||||||||||
2.294%, 08/01/2031 | 1,646 | 1,622 | ||||||||||
Ameriquest Mortgage Securities Asset-Backed Pass-Through Certificates, Ser2005-R7, CI M2 | ||||||||||||
2.208%, VAR ICE LIBOR USD 1 Month+0.500%, 09/25/2035 | 326 | 327 | ||||||||||
Applebee’s Funding, Ser2019-1A, Cl A2I | ||||||||||||
4.194%, 06/07/2049 (B) | 300 | 304 | ||||||||||
Ascentium Equipment Receivables, Ser 2019-1A, CI A2 | ||||||||||||
2.840%, 06/10/2022 (B) | 645 | 648 | ||||||||||
Atrium Hotel Portfolio Trust, Ser ATRM, Cl C | ||||||||||||
3.415%, VAR ICE LIBOR USD 1 Month+1.650%, 12/15/2036 (B) | 410 | 409 | ||||||||||
Citigroup Mortgage Loan Trust, Ser 2007- WFH3, CI A3 | ||||||||||||
1.958%, VAR ICE LIBOR USD 1 Month+0.250%, 06/25/2037 | 256 | 256 | ||||||||||
Countrywide Asset-Backed Certificates, Ser2007-13, Cl 2A2M | ||||||||||||
3.042%, VAR ICE LIBOR USD 1 Month+1.250%, 10/25/2047 | 155 | 153 | ||||||||||
Countrywide Home Equity Loan Trust, Ser2006-F, CI 2A1A | ||||||||||||
1.905%, VAR ICE LIBOR USD 1 Month+0.140%, 07/15/2036 | 328 | 315 | ||||||||||
Credit Suisse Mortgage Trust, Cl A3 | ||||||||||||
3.064%, 10/25/2059 | 405 | 406 | ||||||||||
DB Master Finance, Ser2017-1A, Cl A2I | ||||||||||||
3.629%, 11/20/2047 (B) | 430 | 436 | ||||||||||
Domino’s Pizza Master Issuer, Ser2017-1A, CI A2I | ||||||||||||
3.526%, VAR ICE LIBOR USD 3 Month+1.250%, 07/25/2047 (B) | 697 | 697 | ||||||||||
Education Loan Asset-Backed Trust, Ser2013-1, CI A2 | ||||||||||||
2.508%, VAR ICE LIBOR USD 1 Month+0.800%, 04/26/2032 (B) | 500 | 496 | ||||||||||
| New Covenant Funds / Semi-Annual Report / December 31, 2019 | 29 |
SCHEDULE OF INVESTMENTS (Unaudited)
December 31, 2019
New Covenant Income Fund(Continued)
| Description | Face Amount (Thousands) | Market Value ($ Thousands) | ||||||||
ASSET-BACKED SECURITIES (continued) |
| |||||||||
Invitation Homes Trust, Ser 2018-SFR1, Cl A | ||||||||||
2.437%, VAR ICE LIBOR USD 1 Month+0.700%, 03/17/2037 (B) | $ | 1,391 | $ | 1,379 | ||||||
MMAF Equipment Finance, Ser2018-A, Cl A3 | ||||||||||
3.200%, 09/12/2022 (B) | 1,255 | 1,269 | ||||||||
Morgan Stanley ABS Capital I Trust, Ser2004-NC7, CI M1 | ||||||||||
2.647%, VAR ICE LIBOR USD 1 Month+0.855%, 07/25/2034 | 475 | 471 | ||||||||
Morgan Stanley Capital I Trust, Ser BPR, Cl A | ||||||||||
3.165%, VAR ICE LIBOR USD 1 Month+1.400%, 05/15/2036 (B) | 320 | 319 | ||||||||
Navient Student Loan Trust, Ser2016-6A, Cl A3 | ||||||||||
3.008%, VAR ICE LIBOR USD 1 Month+1.300%, 03/25/2066 (B) | 900 | 907 | ||||||||
Progress Residential Trust, Ser 2018-SFR3, CI A | ||||||||||
3.880%, 10/17/2035 (B) | 640 | 652 | ||||||||
RAAC Series Trust, Ser2005-SP3, Cl M2 | ||||||||||
2.592%, VAR ICE LIBOR USD 1 Month+0.800%, 12/25/2035 | 390 | 391 | ||||||||
Residential Mortgage Loan Trust, Ser 2019- 3, CI A2 | ||||||||||
2.941%, 09/25/2059 | 404 | 403 | ||||||||
Residential Mortgage Loan Trust, Ser 2019-3, Cl A3 | ||||||||||
3.044%, 09/25/2059 | 404 | 403 | ||||||||
SBA Small Business Investment, Ser 2019- 10A, CI 1 | ||||||||||
3.113%, 03/10/2029 | 198 | 205 | ||||||||
Shops at Crystals Trust, Ser CSTL, Cl A | ||||||||||
3.126%, 07/05/2036 (B) | 100 | 101 | ||||||||
SLC Student Loan Trust, Ser2010-1, Cl A | ||||||||||
3.007%, VAR ICE LIBOR USD 3 Month+0.875%, 11/25/2042 | 277 | 278 | ||||||||
SLM Private Credit Student Loan Trust, Ser2006-A, CI A5 | ||||||||||
2.184%, VAR ICE LIBOR USD 3 Month+0.290%, 06/15/2039 | 286 | 279 | ||||||||
SLM Student Loan Trust, Ser2003-7A, Cl A5A | ||||||||||
3.094%, VAR ICE LIBOR USD 3 Month+1.200%, 12/15/2033 (B) | 140 | 138 | ||||||||
Stack Infrastructure Issuer, Ser2019-1A, CI A2 | ||||||||||
4.540%, 02/25/2044 (B) | 312 | 327 | ||||||||
Store Master Fundingl-VII, Ser2018-1A, Cl A1 | ||||||||||
3.960%, 10/20/2048 (B) | 382 | 395 | ||||||||
Store Master Fundingl-VII, Ser2019-1, Cl A1 | ||||||||||
2.820%, 11/20/2049 (B) | 330 | 328 | ||||||||
United States Small Business Administration, | ||||||||||
3.520%, 08/01/2030 | 303 | 312 | ||||||||
| Description | Face Amount (Thousands) | Market Value ($ Thousands) | ||||||||
ASSET-BACKED SECURITIES (continued) |
| |||||||||
United States Small Business Administration, Ser2011-20B, CI 1 | ||||||||||
4.220%, 02/01/2031 | $ | 322 | $ | 341 | ||||||
United States Small Business Administration, | ||||||||||
2.760%, 10/01/2031 | 181 | 182 | ||||||||
United States Small Business Administration, | ||||||||||
3.380%, 11/01/2033 | 761 | 792 | ||||||||
United States Small Business Administration, | ||||||||||
2.990%, 06/01/2034 | 870 | 887 | ||||||||
United States Small Business Administration, | ||||||||||
2.720%, 03/01/2035 | 902 | 914 | ||||||||
United States Small Business Administration, | ||||||||||
2.770%, 05/01/2035 | 481 | 490 | ||||||||
United States Small Business Administration, | ||||||||||
2.700%, 11/01/2035 | 518 | 525 | ||||||||
United States Small Business Administration, Ser2017-20J, CI 1 | ||||||||||
2.850%, 10/01/2037 | 662 | 673 | ||||||||
United States Small Business Administration, | ||||||||||
3.500%, 05/01/2038 | 1,279 | 1,357 | ||||||||
United States Small Business Administration, | ||||||||||
3.770%, 10/01/2038 | 634 | 678 | ||||||||
United States Small Business Administration, | ||||||||||
2.690%, 07/01/2044 | 60 | 61 | ||||||||
Verizon Owner Trust, Ser2019-B, Cl A1A | ||||||||||
2.330%, 12/20/2023 | 624 | 629 | ||||||||
Wendy’s Funding, Ser2019-1A, Cl A2I | ||||||||||
3.783%, 06/15/2049 (B) | 338 | 345 | ||||||||
| 22,500 | ||||||||||
Total Asset-Backed Securities | 31,184 | |||||||||
| 30 | New Covenant Funds / Semi-Annual Report / December 31, 2019 |
| Description | Face Amount (Thousands) | Market Value ($ Thousands) | ||||||||
U.S. GOVERNMENT AGENCY OBLIGATIONS — 5.1% |
| |||||||||
FHLMC | ||||||||||
6.500%, 12/01/2035 | $ | 730 | $ | 821 | ||||||
6.000%, 03/01/2035 | 1,152 | 1,321 | ||||||||
5.000%, 10/01/2048 | 67 | 71 | ||||||||
4.000%, 04/01/2048 | 80 | 83 | ||||||||
4.000%, 05/01/2048 | 614 | 641 | ||||||||
3.500%, 09/01/2048 | 530 | 546 | ||||||||
3.500%, 10/01/2048 | 737 | 759 | ||||||||
3.500%, 01/01/2049 | 76 | 78 | ||||||||
3.500%, 04/01/2049 | 830 | 854 | ||||||||
3.000%, 02/01/2038 | 84 | 86 | ||||||||
3.000%, 04/01/2038 | 82 | 84 | ||||||||
3.000%, 11/01/2043 | 645 | 664 | ||||||||
3.000%, 01/01/2048 | 96 | 98 | ||||||||
3.000%, 03/01/2049 | 86 | 87 | ||||||||
3.000%, 04/01/2049 | 1,663 | 1,690 | ||||||||
2.375%, 01/13/2022 | 1,090 | 1,107 | ||||||||
FHLMC, Ser 2018-4813, Cl CJ | ||||||||||
3.000%, 08/15/2048 | 216 | 216 | ||||||||
FNMA | ||||||||||
4.500%, 09/01/2057 | 237 | 257 | ||||||||
4.000%, 02/01/2056 | 70 | 75 | ||||||||
4.000%, 06/01/2057 | 76 | 82 | ||||||||
3.500%, 10/01/2047 | 1,220 | 1,267 | ||||||||
3.500%, 06/01/2048 | 635 | 659 | ||||||||
3.500%, 07/01/2048 | 420 | 437 | ||||||||
3.500%, 02/01/2049 | 90 | 95 | ||||||||
3.000%, 12/01/2037 | 81 | 83 | ||||||||
3.000%, 03/01/2046 | 1,251 | 1,289 | ||||||||
3.000%, 05/01/2046 | 83 | 85 | ||||||||
3.000%, 07/01/2046 | 145 | 149 | ||||||||
3.000%, 10/01/2046 | 221 | 228 | ||||||||
3.000%, 11/01/2046 | 1,812 | 1,856 | ||||||||
3.000%, 09/01/2047 | 341 | 349 | ||||||||
FNMA, Ser M1, CI A2 | ||||||||||
3.555%, 09/25/2028 (A) | 270 | 292 | ||||||||
Tennessee Valley Authority | ||||||||||
3.875%, 02/15/2021 | 790 | 807 | ||||||||
Total U.S. Government Agency Obligations | 17,216 | |||||||||
SOVEREIGN DEBT — 3.1% | ||||||||||
Abu Dhabi Government International Bond | ||||||||||
2.500%, 10/11/2022 (B) | 490 | 496 | ||||||||
Colombia Government International Bond | ||||||||||
5.625%, 02/26/2044 | 280 | 348 | ||||||||
5.200%, 05/15/2049 | 310 | 373 | ||||||||
4.500%, 03/15/2029 | 200 | 222 | ||||||||
| Description | Face Amount (Thousands) | Market Value ($ Thousands) | ||||||||
SOVEREIGN DEBT (continued) |
| |||||||||
Indonesia Government International Bond MTN | ||||||||||
5.125%, 01/15/2045 (B) | $ | 200 | $ | 238 | ||||||
3.850%, 07/18/2027 (B) | 200 | 213 | ||||||||
3.750%, 04/25/2022 | 370 | 382 | ||||||||
Kuwait International Government Bond | ||||||||||
3.500%, 03/20/2027 (B) | 210 | 226 | ||||||||
Mexico Government International Bond | ||||||||||
4.000%, 10/02/2023 | 610 | 642 | ||||||||
3.600%, 01/30/2025 | 380 | 398 | ||||||||
Panama Government International Bond | ||||||||||
6.700%, 01/26/2036 | 190 | 266 | ||||||||
4.300%, 04/29/2053 | 300 | 349 | ||||||||
Peruvian Government International Bond | ||||||||||
6.550%, 03/14/2037 | 250 | 366 | ||||||||
5.625%, 11/18/2050 | 310 | 453 | ||||||||
Poland Government International Bond | ||||||||||
5.125%, 04/21/2021 | 440 | 458 | ||||||||
4.000%, 01/22/2024 | 450 | 484 | ||||||||
Province of Ontario Canada | ||||||||||
4.400%, 04/14/2020 | 840 | 846 | ||||||||
Province of Quebec Canada | ||||||||||
2.625%, 02/13/2023 | 500 | 513 | ||||||||
Province of Quebec Canada, Ser A MTN | ||||||||||
6.350%, 01/30/2026 | 1,010 | 1,211 | ||||||||
Qatar Government International Bond | ||||||||||
3.250%, 06/02/2026 | 370 | 389 | ||||||||
Russian Foreign Bond - Eurobond | ||||||||||
7.500%, 03/31/2030 | 149 | 170 | ||||||||
5.875%, 09/16/2043 | 400 | 539 | ||||||||
5.625%, 04/04/2042 | 400 | 523 | ||||||||
Uruguay Government International Bond | ||||||||||
4.375%, 01/23/2031 | 390 | 436 | ||||||||
Total Sovereign Debt | 10,541 | |||||||||
FOREIGN BONDS — 1.8% | ||||||||||
Allergan Funding SCS | ||||||||||
3.800%, 03/15/2025 | 40 | 42 | ||||||||
3.450%, 03/15/2022 | 120 | 123 | ||||||||
Banco Santander | ||||||||||
3.125%, 02/23/2023 | 200 | 204 | ||||||||
Banco Santander Chile | ||||||||||
2.500%, 12/15/2020 (B) | 240 | 240 | ||||||||
Barclays Bank | ||||||||||
10.179%, 06/12/2021 (B) | 370 | 411 | ||||||||
BHP Billiton Finance USA | ||||||||||
2.875%, 02/24/2022 | 10 | 10 | ||||||||
BP Capital Markets PLC | ||||||||||
3.561%, 11/01/2021 | 230 | 237 | ||||||||
| New Covenant Funds / Semi-Annual Report / December 31, 2019 | 31 |
SCHEDULE OF INVESTMENTS (Unaudited)
December 31, 2019
New Covenant Income Fund(Continued)
| Description | Face Amount (Thousands) | Market Value ($ Thousands) | ||||||||||
FOREIGN BONDS (continued) |
| |||||||||||
CNOOC Finance | ||||||||||||
3.500%, 05/05/2025 | $ | 330 | $ | 345 | ||||||||
Cooperatieve Rabobank UA | ||||||||||||
4.375%, 08/04/2025 | 500 | 543 | ||||||||||
Ecopetrol | ||||||||||||
5.375%, 06/26/2026 | 140 | 157 | ||||||||||
HSBC Holdings PLC | ||||||||||||
4.250%, 08/18/2025 | 230 | 246 | ||||||||||
Intesa Sanpaolo | ||||||||||||
5.017%, 06/26/2024 (B) | 200 | 210 | ||||||||||
3.125%, 07/14/2022 (B) | 200 | 203 | ||||||||||
OCP | ||||||||||||
4.500%, 10/22/2025 (B) | 400 | 428 | ||||||||||
Petrobras Global Finance BV | ||||||||||||
6.850%, 06/05/2115 | 150 | 171 | ||||||||||
Petroleos del Peru | ||||||||||||
4.750%, 06/19/2032 (B) | 400 | 438 | ||||||||||
Petroleos Mexicanos | ||||||||||||
4.875%, 01/18/2024 | 190 | 199 | ||||||||||
Shell International Finance | ||||||||||||
4.375%, 03/25/2020 | 130 | 131 | ||||||||||
Shell International Finance BV | ||||||||||||
3.250%, 05/11/2025 | 150 | 159 | ||||||||||
2.875%, 05/10/2026 | 40 | 41 | ||||||||||
2.250%, 11/10/2020 | 360 | 361 | ||||||||||
1.750%, 09/12/2021 | 690 | 690 | ||||||||||
Telefonica Emisiones SAU | ||||||||||||
5.134%, 04/27/2020 | 80 | 81 | ||||||||||
Teva Pharmaceutical Finance Netherlands III BV | ||||||||||||
2.200%, 07/21/2021 | 227 | 220 | ||||||||||
Vale Overseas | ||||||||||||
6.875%, 11/21/2036 | 48 | 62 | ||||||||||
|
| |||||||||||
Total Foreign Bonds | 5,952 | |||||||||||
|
| |||||||||||
MUNICIPAL BONDS – 0.9% |
| |||||||||||
Florida – 0.1% |
| |||||||||||
Florida State, Board of Administration | ||||||||||||
2.638%, 07/01/2021 | 420 | 425 | ||||||||||
|
| |||||||||||
Michigan — 0.2% |
| |||||||||||
Michigan State, Finance Authority, RB | ||||||||||||
2.988%, 09/01/2049 (D) | 755 | 774 | ||||||||||
|
| |||||||||||
| Description | Face Amount (Thousands) | Market Value ($ Thousands) | ||||||||||
MUNICIPAL BONDS (continued) |
| |||||||||||
New Jersey — 0.1% | ||||||||||||
New Jersey State Transportation Trust Fund | ||||||||||||
2.551%, 06/15/2023 | $ | 125 | $ | 125 | ||||||||
|
| |||||||||||
New York — 0.2% | ||||||||||||
NewYorkState, Urban Development, RB | ||||||||||||
3.350%, 03/15/2026 | 665 | 703 | ||||||||||
|
| |||||||||||
Wisconsin — 0.3% | ||||||||||||
Wisconsin State, SerA, RB, AGM | ||||||||||||
5.700%, 05/01/2026 | 890 | 999 | ||||||||||
|
| |||||||||||
Total Municipal Bonds | 3,026 | |||||||||||
|
| |||||||||||
| Shares | ||||||||||||
CASH EQUIVALENT — 1.5% |
| |||||||||||
SEI Daily Income Trust, Government Fund, CI F | ||||||||||||
1.500%**† | 5,171,125 | 5.171 | ||||||||||
|
| |||||||||||
Total Cash Equivalent | 5.171 | |||||||||||
|
| |||||||||||
Total Investments in Securities — 102.1% |
| $ | 344,179 | |||||||||
|
| |||||||||||
| Contracts | ||||||||||||
PURCHASED OPTIONS* — 0.0% | ||||||||||||
Total Purchased Options(E) | 46 | $ | 17 | |||||||||
|
| |||||||||||
WRITTEN OPTIONS* — 0.0% |
| |||||||||||
Total Written Options(E) | (75 | ) | $ | (13 | ) | |||||||
|
| |||||||||||
| 32 | New Covenant Funds / Semi-Annual Report / December 31, 2019 |
A list of open option contracts by the Fund at December 31, 2019 are as follows:
| Description | Number of Contracts | Notional Amount (Thousands) | Exercise Price | Expiration Date | Value (Thousands) | |||||||||||||||
PURCHASED OPTIONS — 0.0% | ||||||||||||||||||||
Call Options | ||||||||||||||||||||
February 2020, U.S. 10 Year Future Option* | 11 | $ | 1,413 | $128.50 | 01/18/20 | $ | 5 | |||||||||||||
February 2020, U.S. 5 Year Future Option* | 35 | 4,151 | 118.50 | 01/18/20 | 12 | |||||||||||||||
|
|
|
| |||||||||||||||||
Total Purchased Options | $ | 5,564 | $ | 17 | ||||||||||||||||
|
|
|
| |||||||||||||||||
WRITTEN OPTIONS — 0.0% |
| |||||||||||||||||||
Put Options | ||||||||||||||||||||
March 2020, U.S. 10 Year Future Option* | (7 | ) | $ | (899 | ) | 128.00 | 02/22/20 | $ | (4) | |||||||||||
February 2020, U.S. 5 Year Future Option* | (15 | ) | (1,779 | ) | 118.00 | 01/18/20 | (1) | |||||||||||||
February 2020, U.S. 5 Year Future Option* | (13 | ) | (1,542 | ) | 118.25 | 01/18/20 | (2) | |||||||||||||
|
|
|
| |||||||||||||||||
| (4,220 | ) | (7) | ||||||||||||||||||
|
|
|
| |||||||||||||||||
Call Options | ||||||||||||||||||||
February 2020, U.S. 10 Year Future Option* | (8 | ) | (1,028 | ) | 129.25 | 01/18/20 | (2) | |||||||||||||
February 2020, U.S. 10 Year Future Option* | (10 | ) | (1,284 | ) | 129.50 | 01/18/20 | (1) | |||||||||||||
March 2020, U.S. 10 Year Future Option* | (7 | ) | (899 | ) | 131.00 | 02/22/20 | (1) | |||||||||||||
February 2020, U.S. 5 Year Future Option* | (15 | ) | (1,779 | ) | 119.00 | 01/18/20 | (2) | |||||||||||||
|
|
|
| |||||||||||||||||
| (4,990 | ) | (6) | ||||||||||||||||||
|
|
|
| |||||||||||||||||
Total Written Options | $ | (9,210 | ) | $ | (13) | |||||||||||||||
|
|
|
| |||||||||||||||||
A list of the open futures contracts held by the Fund at December 31, 2019 are as follows:
| Type of Contract | Number of Contracts Long (Short) | Expiration Date | Notional Amount (Thousands) | Value (Thousands) | Unrealized Appreciation/ Depreciation (Thousands) | |||||||||||||||
90-Day Euro$ | (119) | Mar-2020 | $ | (29,227 | ) | $ | (29,234 | ) | $ | (7) | ||||||||||
90-Day Euro$ | 72 | Mar-2021 | 17,709 | 17,719 | 11 | |||||||||||||||
90-Day Euro$ | 118 | Jun-2020 | 28,695 | 29,001 | 306 | |||||||||||||||
90-Day Euro$ | 33 | Dec-2020 | 8,085 | 8,116 | 31 | |||||||||||||||
U.S.2-Year Treasury Note | (57) | Apr-2020 | (12,295 | ) | (12,284 | ) | 11 | |||||||||||||
U.S.5-Year Treasury Note | 270 | Apr-2020 | 32,119 | 32,025 | (94) | |||||||||||||||
U.S.10-Year Treasury Note | 35 | Mar-2020 | 4,539 | 4,495 | (44) | |||||||||||||||
U.S. Long Treasury Bond | (143) | Mar-2020 | (22,854 | ) | (22,295 | ) | 559 | |||||||||||||
U.S. Ultra Long Treasury Bond | 28 | Mar-2020 | 5,252 | 5,086 | (165) | |||||||||||||||
Ultra10-Year U.S. Treasury Note | 24 | Mar-2020 | 3,420 | 3,377 | (43) | |||||||||||||||
|
|
|
|
|
| |||||||||||||||
| $ | 35,443 | $ | 36,006 | $ | 565 | |||||||||||||||
|
|
|
|
|
| |||||||||||||||
The futures contracts are considered to have interest rate risk associated with them.
Percentages are based on Net Assets of $337,189 ($ Thousands). |
| * | Non-income producing security. |
| ** | Rate shown is the7-day effective yield as of December 31, 2019. |
| † | Investment in Affiliated Security (see Note 3). |
| (A) | Security exempt from registration under Rule 144A of the Securities Act of 1933. These securities may be resold in transactions exempt from registration normally to qualified institutions. On December 31, 2019, the value of these securities amounted to $55,329 ($ Thousands), representing 16.4% of the Net Assets of the Fund. |
| (B) | Variable or floating rate security, the interest rate of which adjusts periodically based on changes in current interest rates and prepayments on the underlying pool of assets. |
| (C) | Zero coupon security. The rate shown on the Schedule of Investments is the security’s effective yield at the time of purchase. |
| (D) | Variable or floating rate security, the interest rate of which adjusts periodically based on prevailing interest rates. |
| (E) | Refer to table below for details on Options Contracts. |
AGM — Assured Guaranty Municipal
Cl — Class
CMO — Collateralized Mortgage Obligation
FHLMC — Federal Home Loan Mortgage Corporation
FNMA — Federal National Mortgage Association
| New Covenant Funds / Semi-Annual Report / December 31, 2019 | 33 |
SCHEDULE OF INVESTMENTS (Unaudited)
December 31, 2019
New Covenant Income Fund(Concluded)
GNMA — Government National Mortgage Association
ICE — Intercontinental Exchange
IO — Interest Only — face amount represents notional amount.
LIBOR — London Interbank Offered Rate
MTN — Medium Term Note
PLC — Public Limited Company
RB — Revenue Bond
Ser — Series
TBA — To Be Announced
USD — United States Dollar
VAR — Variable Rate
The following is a list of the levels of inputs used as of December 31, 2019 in valuing the Fund’s investments and other financial instruments carried at value ($ Thousands):
| Investments in Securities | Level 1 ($) | Level 2 ($) | Level 3 ($) | Total ($) | ||||||||||||
Mortgage-Backed Securities | – | 141,221 | – | 141,221 | ||||||||||||
Corporate Obligations | – | 91,310 | – | 91,310 | ||||||||||||
U.S. Treasury Obligations | 1,697 | 36,861 | – | 38,558 | ||||||||||||
Asset-Backed Securities | – | 31,184 | – | 31,184 | ||||||||||||
U.S. Government Agency Obligations | – | 17,216 | – | 17,216 | ||||||||||||
Sovereign Debt | – | 10,541 | – | 10,541 | ||||||||||||
Foreign Bonds | – | 5,952 | – | 5,952 | ||||||||||||
Municipal Bonds | – | 3,026 | – | 3,026 | ||||||||||||
Cash Equivalent | 5,171 | – | – | 5,171 | ||||||||||||
|
|
|
|
|
|
|
| |||||||||
Total Investments in Securities | 6,868 | 337,311 | – | 344,179 | ||||||||||||
|
|
|
|
|
|
|
| |||||||||
| Other Financial Instruments | Level 1 ($) | Level 2 ($) | Level 3 ($) | Total ($) | ||||||||||||
Purchase Options | 17 | – | – | 17 | ||||||||||||
Written Options | (13) | – | – | (13) | ||||||||||||
Futures Contracts * | ||||||||||||||||
Unrealized Appreciation | 918 | – | – | 918 | ||||||||||||
Unrealized Depreciation | (353) | – | – | (353) | ||||||||||||
|
|
|
|
|
|
|
| |||||||||
Total Other Financial Instruments | 569 | – | – | 569 | ||||||||||||
|
|
|
|
|
|
|
| |||||||||
| * | Futures contracts are valued at the unrealized appreciation (depreciation) on the instrument. |
For the period ended December 31, 2019, there were no transfers in or out of Level 3.
Amounts designated as “—” are either $0 or have been rounded to $0.
For more information on valuation inputs, see Note 2 – Significant Accounting Policies in Notes to Financial Statements.
The following is a summary of the transactions with affiliates for the period ended December 31,2019 ($ Thousands):
| Security Description | Value 6/30/19 | Purchases at Cost | Proceeds from Sales | Realized Gain/ (Loss) | Change in Unrealized Appreciation/ (Depreciation) | Value 12/31/19 | Shares | Dividend Income | Capital Gains | |||||||||
SEI Daily Income Trust, Government Fund, Cl F | $11,031 | $74,708 | $(80,568) | $— | $— | $5,171 | 5,171,125 | $50 | $ — | |||||||||
|
|
|
|
|
|
|
|
|
The accompanying notes are an integral part of the financial statements.
| 34 | New Covenant Funds / Semi-Annual Report / December 31, 2019 |
SCHEDULE OF INVESTMENTS (Unaudited)
December 31, 2019
New Covenant Balanced Growth Fund

†Percentages are based on total investments.
| Description | Shares | Market Value ($ Thousands) | ||||||||||
AFFILIATED INVESTMENT FUNDS — 98.8% |
| |||||||||||
Equity Fund — 59.9% | ||||||||||||
New Covenant Growth Fund† | 3,990,809 | $ | 179,506 | |||||||||
Total Equity Fund | 179,506 | |||||||||||
Fixed Income Fund — 38.9% | ||||||||||||
New Covenant Income Fund† | 4,937,681 | 116,776 | ||||||||||
Total Fixed Income Fund | 116,776 | |||||||||||
| Description | Shares | Market Value ($ Thousands) | ||||||||||
CASH EQUIVALENT — 1.1% | ||||||||||||
SEI Daily Income Trust, Government Fund, CI F | 3,465,558 | $ | 3,466 | |||||||||
Total Cash Equivalent | 3,466 | |||||||||||
Total Investments in Securities — 99.9% | $ | 299,748 | ||||||||||
Percentages are based on a Net Assets of $299,950 ($ Thousands).
| † | Investment in Affiliated Security (see Note 3). |
| ** | Rate shown is the7-day effective yield as of December 31, 2019. |
Cl — Class
As of December 31, 2019, all of the Fund’s investments were considered Level 1, in accordance with the authoritative guidance on fair value measurements and disclosure under U.S. GAAP.
For the period ended December 31, 2019, there were no transfers in or out of Level 3.
For more information on valuation inputs, see Note 2 – Significant Accounting Policies in Notes to Financial Statements.
The following is a summary of the transactions with affiliates for the period ended December 31, 2019 ($ Thousands):
| Security Description | Value 6/30/19 | Purchases at Cost | Proceeds from Sales | Realized Gain | Change in Unrealized Appreciation | Value 12/31/19 | Shares | Dividend Income | Capital Gains | |||||||||
New Covenant Growth Fund | $ 178,591 | $ 11,146 | $ (19,193) | $ 2,863 | $ 6,099 | $ 179,506 | 3,990,809 | $ 1,545 | $ 7,788 | |||||||||
New Covenant Income Fund | 112,871 | 7,663 | (4,512) | 61 | 693 | 116,776 | 4,937,681 | 1,361 | — | |||||||||
SEI Daily Income Trust, Government Fund, Cl F | 2,176 | 17,554 | (16,264) | — | — | 3,466 | 3,465,558 | 23 | — | |||||||||
|
|
|
|
|
|
|
|
| ||||||||||
Totals | $293,638 | $36,363 | $(39,969) | $2,924 | $6,792 | $299,748 | 12,394,048 | $2,929 | $7,788 | |||||||||
|
|
|
|
|
|
|
|
|
The accompanying notes are an integral part of the financial statements.
| New Covenant Funds / Semi-Annual Report / December 31, 2019 | 35 |
SCHEDULE OF INVESTMENTS (Unaudited)
December 31, 2019
New Covenant Balanced Income Fund

†Percentages are based on total investments.
| Description | Shares | Market Value ($ Thousands) | ||||||||||
AFFILIATED INVESTMENT FUNDS — 99.3% |
| |||||||||||
Fixed Income Fund — 64.0% |
| |||||||||||
New Covenant Income Fund† | 2,114,230 | $ | 50,002 | |||||||||
Total Fixed Income Fund | 50,002 | |||||||||||
Equity Fund — 35.3% | ||||||||||||
New Covenant Growth Fund† | 613,286 | 27,586 | ||||||||||
Total Equity Fund | 27,586 | |||||||||||
| Description | Shares | Market Value ($ Thousands) | ||||||||||
CASH EQUIVALENT — 0.9% | ||||||||||||
SEI Daily Income Trust, Government Fund, CI F | ||||||||||||
1.500%**† | 720,479 | $ | 720 | |||||||||
Total Cash Equivalent | 720 | |||||||||||
Total Investments in Securities — 100.2% | $ | 78,308 | ||||||||||
Percentages are based on a Net Assets of $78,135 ($ Thousands).
| † | Investment in Affiliated Security (see Note 3). |
| ** | Rate shown is the7-day effective yield as of December 31, 2019. |
Cl — Class
As of December 31, 2019, all of the Fund’s investments were considered Level 1, in accordance with the authoritative guidance on fair value measurements and disclosure under U.S. GAAP.
For the period ended December 31, 2019, there were no transfers in or out of Level 3.
For more information on valuation inputs, see Note 2 – Significant Accounting Policies in Notes to Financial Statements.
The following is a summary of the transactions with affiliates for the period ended December 31, 2019 ($ Thousands):
| Security Description | Value 6/30/19 | Purchases at Cost | Proceeds from Sales | Realized Gain/ (Loss) | Change in Unrealized Appreciation | Value 12/31/19 | Shares | Dividend Income | Capital Gains | |||||||||
New Covenant Income Fund | $ 50,043 | $ 1,929 | $ (2,296) | $ (38) | $ 364 | $ 50,002 | $ 2,114,230 | $ 586 | $- | |||||||||
New Covenant Growth Fund | 27,539 | 3,099 | (4,444) | 307 | 1,085 | 27,586 | 613,286 | 240 | 1,240 | |||||||||
SEI Daily Income Trust, Government Fund, Cl F | 1,207 | 5,419 | (5,906) | — | — | 720 | 710,479 | 6 | — | |||||||||
|
|
|
|
|
|
|
|
| ||||||||||
Totals | $78,789 | $ 10,447 | $ (12,646) | $269 | $ 1,449 | $78,308 | 3,437,995 | $832 | $ 1,240 | |||||||||
|
|
|
|
|
|
|
|
|
The accompanying notes are an integral part of the financial statements.
| 36 | New Covenant Funds / Semi-Annual Report / December 31, 2019 |
STATEMENTS OF ASSETS AND LIABILITIES ($ THOUSANDS)
December 31, 2019
| Growth Fund | Income Fund | Balanced Growth Fund | Balanced Income Fund | |||||||||||||
Assets: | ||||||||||||||||
Investments, at value† | $ | 453,542 | $ | 339,008 | $ | — | $ | — | ||||||||
Affiliated investments, at value†† | 7,998 | 5,171 | 299,748 | 78,308 | ||||||||||||
Options purchased, at value††† | — | 17 | — | — | ||||||||||||
Cash and cash equivalents | 1,209 | — | — | — | ||||||||||||
Dividends and interest receivable | 537 | 1,740 | 225 | 96 | ||||||||||||
Cash pledged as collateral for futures contracts | 324 | 215 | — | — | ||||||||||||
Receivable for fund shares sold | 92 | 106 | 30 | 2 | ||||||||||||
Foreign tax reclaim receivable | 80 | 18 | — | — | ||||||||||||
Receivable for investment securities sold | 50 | 8,006 | — | — | ||||||||||||
Receivable for variation margin | 19 | 49 | — | — | ||||||||||||
Prepaid expenses | 24 | 18 | 16 | 4 | ||||||||||||
Total Assets | 463,875 | 354,348 | 300,019 | 78,410 | ||||||||||||
Liabilities: | ||||||||||||||||
Options written, at value††† | — | 13 | — | — | ||||||||||||
Investment advisory fees payable | 91 | 79 | — | — | ||||||||||||
Administration fees payable | 72 | 57 | 20 | 7 | ||||||||||||
Social witness and licensing fees payable | 59 | 41 | — | — | ||||||||||||
Shareholder servicing fees payable | 39 | 28 | — | — | ||||||||||||
Payable for fund shares redeemed | 3 | 38 | 24 | 262 | ||||||||||||
Trustees’ fees payable | 2 | 2 | 2 | — | ||||||||||||
CCO fees payable | 1 | 1 | 1 | — | ||||||||||||
Payable for investment securities purchased | — | 16,135 | — | — | ||||||||||||
Income distribution payable | — | 594 | — | — | ||||||||||||
Payable to custodian | — | 69 | — | — | ||||||||||||
Payable for variation margin | — | 54 | — | — | ||||||||||||
Accrued expense payable | 34 | 48 | 22 | 6 | ||||||||||||
Total Liabilities | 301 | 17,159 | 69 | 275 | ||||||||||||
Net Assets | $ | 463,574 | $ | 337,189 | $ | 299,950 | $ | 78,135 | ||||||||
†Cost of investments | $ | 323,468 | $ | 336,579 | $ | — | $ | — | ||||||||
†† Cost of affiliated investments | — | — | 222,311 | 63,107 | ||||||||||||
††† Cost (premiums received) | — | (8 | ) | — | — | |||||||||||
Net Assets: | ||||||||||||||||
Paid-in Capital — (unlimited authorization — par value $0,001) | $ | 316,878 | $ | 330,853 | $ | 224,133 | $ | 64,132 | ||||||||
Total distributable earnings | 146,696 | 6,336 | 75,817 | 14,003 | ||||||||||||
Net Assets | $ | 463,574 | $ | 337,189 | $ | 299,950 | $ | 78,135 | ||||||||
Net Asset Value, Offering and Redemption Price Per Share | $ | 44.98 | $ | 23.65 | $ | 105.18 | $ | 21.65 | ||||||||
| (463,574,119 ÷ | (337,188,992 ÷ | (299,950,230 ÷ | (78,134,962 ÷ | |||||||||||||
| 10,307,113 shares | ) | 14,255,709 shares | ) | 2,851,669 shares | ) | 3,608,715 shares | ) | |||||||||
Amounts designated as “—” are $0 or have been rounded to $0.
The accompanying notes are an integral part of the financial statements.
| New Covenant Funds / Semi-Annual Report / December 31, 2019 | 37 |
STATEMENTS OF OPERATIONS ($ THOUSANDS)
For the period ended December 31, 2019
| Growth Fund | Income Fund | Balanced Growth Fund | Balanced Income Fund | |||||||||||||
Investment Income: | ||||||||||||||||
Dividend income | $ | 4,376 | $ | — | $ | — | $ | — | ||||||||
Dividend income from affiliated registered investment company | 59 | 50 | 2,929 | 832 | ||||||||||||
Interest income | 19 | 4,856 | — | — | ||||||||||||
Total Investment Income | 4,454 | 4,906 | 2,929 | 832 | ||||||||||||
Expenses: | ||||||||||||||||
Investment advisory fees | 1,062 | 703 | — | — | ||||||||||||
Administration fees | 452 | 335 | 223 | 58 | ||||||||||||
Social witness and licensing fees | 339 | 251 | — | — | ||||||||||||
Shareholder servicing fees | 226 | 167 | — | — | ||||||||||||
Trustee fees | 4 | 3 | 2 | 1 | ||||||||||||
Chief compliance officer fees | 1 | 1 | 1 | — | ||||||||||||
Transfer agent fees | 38 | 28 | 25 | 7 | ||||||||||||
Professional fees | 26 | 19 | 17 | 4 | ||||||||||||
Registration fees | 18 | 13 | 12 | 3 | ||||||||||||
Printing fees | 14 | 11 | 9 | 2 | ||||||||||||
Custodian fees | 6 | 8 | 6 | 2 | ||||||||||||
Other expenses | 15 | 44 | 2 | 1 | ||||||||||||
Total Expenses | 2,201 | 1,583 | 297 | 78 | ||||||||||||
Less: | ||||||||||||||||
Waiver of investment advisory fees | (539 | ) | (240 | ) | — | — | ||||||||||
Waiver of administration fees | (31 | ) | (3 | ) | (102 | ) | (19 | ) | ||||||||
Net Expenses | 1,631 | 1,340 | 195 | 59 | ||||||||||||
Net Investment Income | 2,823 | 3,566 | 2,734 | 773 | ||||||||||||
Net Realized and Change in Unrealized Gain (Loss) on Investments: | ||||||||||||||||
Net Realized Gain (Loss) on: | ||||||||||||||||
Investments | 12,362 | 1,896 | — | — | ||||||||||||
Affiliated investments | — | — | 2,924 | 269 | ||||||||||||
Written and purchased options | — | 255 | — | — | ||||||||||||
Capital gain distributions received from affiliated investment | — | — | 7,788 | 1,204 | ||||||||||||
Futures contracts | 640 | (874 | ) | — | — | |||||||||||
Net Change in Unrealized Appreciation (Depreciation) on: | ||||||||||||||||
Investments | 30,341 | 631 | — | — | ||||||||||||
Affiliated investments | — | — | 6,792 | 1,449 | ||||||||||||
Written and purchased options | — | (19 | ) | — | — | |||||||||||
Futures contracts | (98 | ) | 627 | — | — | |||||||||||
Net Increase in Net Assets Resulting from Operations | $ | 46,068 | $ | 6,082 | $ | 20,238 | $ | 3,695 | ||||||||
Amounts designated as “—” are $0 or have been rounded to $0.
The accompanying notes are an integral part of the financial statements.
| 38 | New Covenant Funds / Semi-Annual Report / December 31, 2019 |
STATEMENTS OF CHANGES IN NET ASSETS ($ THOUSANDS)
For the period ended December 31, 2019 (Unaudited) and the year ended June 30, 2019
| Growth Fund | Income Fund | |||||||||||||||
| 07/01/19 to 12/31/19 | 07/01/18 to 06/30/19 | 07/01/19 to 12/31/19 | 07/01/18 to 06/30/19 | |||||||||||||
Operations: | ||||||||||||||||
Net investment income | $ | 2,823 | $ | 5,146 | $ | 3,566 | $ | 7,267 | ||||||||
Net realized gain from investments, affiliated investments, written and purchased options and futures contracts | 13,002 | 22,515 | 1,277 | 701 | ||||||||||||
Net change in unrealized appreciation on investments, affiliated investments, written and purchased options and futures contracts | 30,243 | 3,899 | 1,239 | 11,913 | ||||||||||||
Net change in unrealized depreciation on foreign currency transactions and translation of other assets and liabilities denominated in foreign currency | — | (1 | ) | — | — | |||||||||||
Net increase in net assets resulting from operations | 46,068 | 31,559 | 6,082 | 19,881 | ||||||||||||
Distributions: | (23,804 | ) | (31,095 | ) | (3,959 | ) | (7,780 | ) | ||||||||
Total distributions | (23,804 | ) | (31,095 | ) | (3,959 | ) | (7,780 | ) | ||||||||
Capital Share Transactions: | ||||||||||||||||
Proceeds from shares issued | 10,876 | 41,305 | 17,870 | 40,669 | ||||||||||||
Reinvestment of dividends & distributions | 19,775 | 25,807 | 395 | 749 | ||||||||||||
Cost of shares redeemed | (38,299 | ) | (47,292 | ) | (13,697 | ) | (41,976 | ) | ||||||||
Increase (decrease) in net assets derived from capital share transactions | (7,648 | ) | 19,820 | 4,568 | (558 | ) | ||||||||||
Net increase in net assets | 14,616 | 20,284 | 6,691 | 11,543 | ||||||||||||
Net Assets: | ||||||||||||||||
Beginning of Period | 448,958 | 428,674 | 330,498 | 318,955 | ||||||||||||
End of Period | $ | 463,574 | $ | 448,958 | $ | 337,189 | $ | 330,498 | ||||||||
Share Transactions: | ||||||||||||||||
Shares issued | 253 | 1,019 | 757 | 1,781 | ||||||||||||
Shares issued in lieu of dividends and distributions | 448 | 665 | 17 | 33 | ||||||||||||
Shares redeemed | (870 | ) | (1,139 | ) | (579 | ) | (1,852 | ) | ||||||||
Increase (Decrease) in net assets derived from share transactions | (169 | ) | 545 | 195 | (38 | ) | ||||||||||
Amounts designated as “—” are $0 or have been rounded to $0.
The accompanying notes are an integral part of the financial statements.
| New Covenant Funds / Semi-Annual Report / December 31, 2019 | 39 |
STATEMENTS OF CHANGES IN NET ASSETS ($ THOUSANDS) (Concluded)
For the period ended December 31, 2019 (Unaudited) and the year ended June 30, 2019
| Balanced Growth Fund | Balanced Income Fund | |||||||||||||||
| 07/01/19 to 12/31/19 | 07/01/18 to 06/30/19 | 07/01/19 to 12/31/19 | 07/01/18 to 06/30/19 | |||||||||||||
Operations: | ||||||||||||||||
Net investment income | $ | 2,734 | $ | 4,518 | $ | 773 | $ | 1,406 | ||||||||
Net realized gain from affiliated investments | 2,924 | 862 | 269 | 344 | ||||||||||||
Capital gain distributions received from affiliated investments | 7,788 | 10,539 | 1,204 | 1,618 | ||||||||||||
Net change in unrealized appreciation on affiliated investments | 6,792 | 4,138 | 1,449 | 1,640 | ||||||||||||
Net increase in net assets resulting from operations | 20,238 | 20,057 | 3,695 | 5,008 | ||||||||||||
Distributions: | (15,195 | ) | (17,635 | ) | (2,834 | ) | (4,160 | ) | ||||||||
Total distributions | (15,195 | ) | (17,635 | ) | (2,834 | ) | (4,160 | ) | ||||||||
Capital Share Transactions: | ||||||||||||||||
Proceeds from shares issued | 7,143 | 16,016 | 2,814 | 3,589 | ||||||||||||
Reinvestment of dividends & distributions | 13,944 | 16,007 | 2,343 | 3,509 | ||||||||||||
Cost of shares redeemed | (20,002 | ) | (31,067 | ) | (6,331 | ) | (6,827 | ) | ||||||||
Increase (decrease) in net assets derived from capital share transactions | 1,085 | 956 | (1,174 | ) | 271 | |||||||||||
Net increase (decrease) in net assets | 6,128 | 3,378 | (313 | ) | 1,119 | |||||||||||
Net Assets: | ||||||||||||||||
Beginning of Period | 293,822 | 290,444 | 78,448 | 77,329 | ||||||||||||
End of Period | $ | 299,950 | $ | 293,822 | $ | 78,135 | $ | 78,448 | ||||||||
Share Transactions: | ||||||||||||||||
Shares issued | 68 | 163 | 130 | 173 | ||||||||||||
Shares issued in lieu of dividends and distributions | 134 | 166 | 109 | 174 | ||||||||||||
Shares redeemed | (190 | ) | (310 | ) | (294 | ) | (325 | ) | ||||||||
Increase (Decrease) in net assets derived from share transactions | 12 | 19 | (55 | ) | 22 | |||||||||||
Amounts designated as “—” are $0 or have been rounded to $0.
The accompanying notes are an integral part of the financial statements.
| 40 | New Covenant Funds / Semi-Annual Report / December 31, 2019 |
For the period ended December 31, 2019 (Unaudited) and years ended June 30,
For a Share Outstanding Throughout the Period
| Growth Fund | ||||||||||||||||||||||||
| 2019@ | 2019 | 2018 | 2017 | 2016 | 2015 | |||||||||||||||||||
Net Asset Value, Beginning of Period | $42.86 | $43.17 | $40.15 | $34.23 | $38.28 | $43.70 | ||||||||||||||||||
Investment Activities: | ||||||||||||||||||||||||
Net investment income(1) | 0.28 | 0.50 | 0.46 | 0.27 | 0.27 | 0.22 | ||||||||||||||||||
Net realized and unrealized gains(losses) on securities (1) | 4.21 | 2.28 | 5.34 | 5.91 | (1.67) | 2.29 | ||||||||||||||||||
Total from investment activities | 4.49 | 2.78 | 5.80 | 6.18 | (1.40) | 2.51 | ||||||||||||||||||
Dividends and Distributions from: | ||||||||||||||||||||||||
Net investment income | (0.38) | (0.50) | (0.39) | (0.26) | (0.21) | (0.22) | ||||||||||||||||||
Net realized gains | (1.99) | (2.59) | (2.39) | – | (2.44) | (7.71) | ||||||||||||||||||
Total dividends and distributions | (2.37) | (3.09) | (2.78) | (0.26) | (2.65) | (7.93) | ||||||||||||||||||
Net Asset Value, End of Period | $44.98 | $42.86 | $43.17 | $40.15 | $34.23 | $38.28 | ||||||||||||||||||
Total Return† | 10.63% | 7.21% | 14.74% | 18.12% | (3.68)% | 6.41% | ||||||||||||||||||
Supplemental Data and Ratios: | ||||||||||||||||||||||||
Net assets, end of period ($ Thousands) | $463,574 | $448,958 | $428,674 | $412,229 | $394,943 | $416,158 | ||||||||||||||||||
Ratio of net expenses to average net assets | 0.72% | 0.85% | 0.87% | 0.95% | 1.02% | 1.02% | ||||||||||||||||||
Ratio of expenses to average net assets, excluding waivers | �� | 0.98% | 1.12% | 1.12% | 1.13% | 1.14% | 1.12% | |||||||||||||||||
Ratio of net investment income to average net assets | 1.25% | 1.19% | 1.08% | 0.73% | 0.76% | 0.54% | ||||||||||||||||||
Portfolio turnover rate | 12% | 47% | 24% | 50% | 103% | 107% | ||||||||||||||||||
| † | Returns shown do not reflect the deduction of taxes that a shareholder would pay on Fund distributions or the redemption of Fund shares. |
| (1) | Per share net investment income and net realized and unrealized gains/(losses) calculated using average shares. |
| @ | For the six month period ended December 31, 2019. All ratios for the period have been annualized. |
Amounts designated as ‘‘—‘‘ are $0 or have been rounded to $0.
The accompanying notes are an integral part of the financial statements
| New Covenant Funds / Semi-Annual Report / December 31, 2019 | 41 |
FINANCIAL HIGHLIGHTS
For the period ended December 31, 2019 (Unaudited) and years ended June 30,
For a Share Outstanding Throughout the Period
| Income Fund | ||||||||||||||||||||||||
| 2019 @ | 2019 | 2018 | 2017 | 2016 | 2015 | |||||||||||||||||||
Net Asset Value, Beginning of Period | $23.50 | $22.62 | $23.21 | $23.58 | $23.09 | $23.13 | ||||||||||||||||||
Investment Activities: | ||||||||||||||||||||||||
Net investment income(1) | 0.25 | 0.52 | 0.45 | 0.37 | 0.40 | 0.35 | ||||||||||||||||||
Net realized and unrealized gains(losses) on securities(1) | 0.18 | 0.92 | (0.57) | (0.31) | 0.51 | (0.01) | ||||||||||||||||||
Total from investment activities | 0.43 | 1.44 | (0.12) | 0.06 | 0.91 | 0.34 | ||||||||||||||||||
Dividends and Distributions from: | ||||||||||||||||||||||||
Net investment income | (0.28) | (0.56) | (0.47) | (0.43) | (0.42) | (0.38) | ||||||||||||||||||
Total dividends and distributions | (0.28) | (0.56) | (0.47) | (0.43) | (0.42) | (0.38) | ||||||||||||||||||
Net Asset Value, End of Period | $23.65 | $23.50 | $22.62 | $23.21 | $23.58 | $23.09 | ||||||||||||||||||
Total Return† | 1.84% | 6.46% | (0.54)% | 0.27% | 4.00% | 1.46% | ||||||||||||||||||
Supplemental Data and Ratios: | ||||||||||||||||||||||||
Net assets, end of period ($ Thousands) | $337,189 | $330,498 | $318,955 | $305,157 | $297,165 | $304,295 | ||||||||||||||||||
Ratio of net expenses to average net assets | 0.80% | 0.80% | 0.80% | 0.80% | 0.80% | 0.80% | ||||||||||||||||||
Ratio of expenses to average net assets, excluding waivers | 0.95% | 0.95% | 0.95% | 0.95% | 0.98% | 0.95% | ||||||||||||||||||
Ratio of net investment income to average net assets | 2.14% | 2.29% | 1.95% | 1.58% | 1.71% | 1.50% | ||||||||||||||||||
Portfolio turnover rate | 72% | 188% | 210% | 140% | 202% | 115% | ||||||||||||||||||
| † | Returns shown do not reflect the deduction of taxes that a shareholder would pay on Fund distributions or the redemption of Fund shares. |
| (1) | Per share net investment income and net realized and unrealized gains/(losses) calculated using average shares. |
| @ | For the six month period ended December 31, 2019. All ratios for the period have been annualized. |
The accompanying notes are an integral part of the financial statements.
| 42 | New Covenant Funds / Semi-Annual Report / December 31, 2019 |
FINANCIAL HIGHLIGHTS
For the period ended December 31, 2019 (Unaudited) and years ended June 30,
For a Share Outstanding Throughout the Period
| Balanced Growth Fund | ||||||||||||||||||||||||
| 2019@ | 2019 | 2018 | 2017 | 2016 | 2015 | |||||||||||||||||||
Net Asset Value, Beginning of Period | $103.45 | $102.94 | $96.48 | $90.32 | $101.71 | $101.92 | ||||||||||||||||||
Investment Activities: | ||||||||||||||||||||||||
Net investment income(1) | 0.97 | 1.58 | 1.23 | 0.94 | 0.88 | 0.85 | ||||||||||||||||||
Net realized and unrealized gains(losses) on securities(1) | 6.22 | 5.21 | 6.86 | 8.44 | (1.63) | 3.71 | ||||||||||||||||||
Total from investment activities | 7.19 | 6.79 | 8.09 | 9.38 | (0.75) | 4.56 | ||||||||||||||||||
Dividends and Distributions from: | ||||||||||||||||||||||||
Net investment income | (1.29) | (1.83) | (0.90) | (0.94) | (1.72) | (2.86) | ||||||||||||||||||
Net realized gains | (4.17) | (4.45) | (0.73) | (2.28) | (8.92) | (1.91) | ||||||||||||||||||
Total dividends and distributions | (5.46) | (6.28) | (1.63) | (3.22) | (10.64) | (4.77) | ||||||||||||||||||
Net Asset Value, End of Period | $105.18 | $103.45 | $102.94 | $96.48 | $90.32 | $101.71 | ||||||||||||||||||
Total Return† | 7.05% | 7.12% | 8.45% | 10.59% | (0.50)% | 4.54% | ||||||||||||||||||
Supplemental Data and Ratios: | ||||||||||||||||||||||||
Net assets, end of period ($ Thousands) | $299,950 | $293,822 | $290,444 | $285,970 | $284,430 | $297,560 | ||||||||||||||||||
Ratio of net expenses to average net assets | 0.13% | 0.13% | 0.13% | 0.14% | 0.14% | 0.14% | ||||||||||||||||||
Ratio of expenses to average net assets, excluding waivers | 0.20% | 0.21% | 0.21% | 0.23% | 0.27% | 0.26% | ||||||||||||||||||
Ratio of net investment income to average net assets | 1.84% | 1.56% | 1.22% | 1.01% | 0.94% | 0.83% | ||||||||||||||||||
Portfolio turnover rate | 6% | 16% | 11% | 4% | 14% | 13% | ||||||||||||||||||
| † | Returns shown do not reflect the deduction of taxes that a shareholder would pay on Fund distributions or the redemption of Fund shares. |
| (1) | Per share net investment income and net realized and unrealized gains/(losses) calculated using average shares. |
| @ | For the six month period ended December 31, 2019. All ratios for the period have been annualized. |
Amounts designated as ‘‘—‘‘ are $0 or have been rounded to $0.
The accompanying notes are an integral part of the financial statements.
| New Covenant Funds / Semi-Annual Report / December 31, 2019 | 43 |
FINANCIAL HIGHLIGHTS
For the period ended December 31, 2019 (Unaudited) and years ended June 30,
For a Share Outstanding Throughout the Period
| Balanced Income Fund | ||||||||||||||||||||||||
| 2019@ | 2019 | 2018 | 2017 | 2016 | 2015 | |||||||||||||||||||
Net Asset Value, Beginning of Period | $21.41 | $21.23 | $20.74 | $20.06 | $21.20 | $21.55 | ||||||||||||||||||
Investment Activities: | ||||||||||||||||||||||||
Net investment income(1) | 0.22 | 0.39 | 0.31 | 0.25 | 0.24 | 0.22 | ||||||||||||||||||
Net realized and unrealized gains(losses) on securities(1) | 0.81 | 0.96 | 0.63 | 0.95 | 0.02 | 0.46 | ||||||||||||||||||
Total from investment activities | 1.03 | 1.35 | 0.94 | 1.20 | 0.26 | 0.68 | ||||||||||||||||||
Dividends and Distributions from: | ||||||||||||||||||||||||
Net investment income | (0.30) | (0.42) | (0.29) | (0.25) | (0.31) | (0.47) | ||||||||||||||||||
Net realized gains | (0.49) | (0.75) | (0.16) | (0.27) | (1.09) | (0.56) | ||||||||||||||||||
Total dividends and distributions | (0.79) | (1.17) | (0.45) | (0.52) | (1.40) | (1.03) | ||||||||||||||||||
Net Asset Value, End of Period | $21.65 | $21.41 | $21.23 | $20.74 | $20.06 | $21.20 | ||||||||||||||||||
Total Return† | 4.88% | 6.76% | 4.57% | 6.11% | 1.41% | 3.22% | ||||||||||||||||||
Supplemental Data and Ratios: | ||||||||||||||||||||||||
Net assets, end of period ($ Thousands) | $78,135 | $78,448 | $77,329 | $79,100 | $77,945 | $80,203 | ||||||||||||||||||
Ratio of net expenses to average net assets | 0.15% | 0.15% | 0.15% | 0.19% | 0.20% | 0.20% | ||||||||||||||||||
Ratio of expenses to average net assets, excluding waivers | 0.20% | 0.20% | 0.21% | 0.23% | 0.27% | 0.25% | ||||||||||||||||||
Ratio of net investment income to average net assets | 1.98% | 1.86% | 1.48% | 1.25% | 1.19% | 1.04% | ||||||||||||||||||
Portfolio turnover rate | 7% | 11% | 10% | 5% | 17% | 15% | ||||||||||||||||||
| † | Returns shown do not reflect the deduction of taxes that a shareholder would pay on Fund distributions or the redemption of Fund shares. |
| (1) | Per share net investment income and net realized and unrealized gains/(losses) calculated using average shares. |
| @ | For the six month period ended December 31, 2019. All ratios for the period have been annualized. |
Amounts designated as “–” are $0 or have been rounded to $0.
The accompanying notes are an integral part of the financial statements.
| 44 | New Covenant Funds / Semi-Annual Report / December 31, 2019 |
NOTES TO FINANCIAL STATEMENTS (Unaudited)
December 31, 2019
1. ORGANIZATION
New Covenant Funds (the “Trust”), anopen-end, diversified management investment company, was organized as a Delaware business trust on September 30, 1998. It currently consists of four investment funds: New Covenant Growth Fund (“Growth Fund”), New Covenant Income Fund (“Income Fund”), New Covenant Balanced Growth Fund (“Balanced Growth Fund”), and New Covenant Balanced Income Fund (“Balanced Income Fund”), (individually, a “Fund,” and collectively, the “Funds”). The Funds commenced operations on July 1, 1999. The Trust’s authorized capital consists of an unlimited number of shares of beneficial interest of $0.001 par value. Effective February 20, 2012, the Funds’ investment adviser is SEI Investments Management Corporation (the “Adviser”). Prior to February 20, 2012, the Funds’ investment adviser was One Compass Advisors, a wholly owned subsidiary of the Presbyterian Church (U.S.A.) Foundation.
The objectives of the Funds are as follows:
| Growth Fund | Long-term capital appreciation. A modest amount of dividend income may be produced by the Fund’s equity securities. | |
| Income Fund | High level of current income with preservation of capital. | |
| Balanced Growth Fund | Capital appreciation with less risk than would be present in a portfolio of only common stocks. | |
| Balanced Income Fund | Current income and long-term growth of capital. | |
2. SIGNIFICANT ACCOUNTING POLICIES
The following are significant accounting policies, which are consistently followed in the preparation of its financial statements by the Funds. The Funds are investment companies that apply the accounting and reporting guidance issued in Topic 946 by the U.S. Financial Accounting Standards Board (“FASB”).
Use of Estimates — The preparation of financial statements, in conformity with U.S. generally accepted accounting principles (“U.S. GAAP”), requires management to make estimates and assumptions that affect the reported amount of assets and liabilities and disclosure of contingent assets and liabilities as of the date of the financial statements and the reported amounts of increases and decreases in net assets from operations during the reporting period. Actual results could differ from those estimates.
Security Valuation — Securities listed on a securities exchange, market or automated quotation system for which quotations are readily available (except for securities traded on NASDAQ) are valued at the last quoted sale price on the primary exchange or market (foreign or domestic) on which they are traded, or, if there is no such reported sale, at the most recent quoted bid price. For securities traded on NASDAQ, the NASDAQ Official Closing Price will be used. Debt securities are priced based upon valuations provided by independent, third-party pricing agents, if available. Such values generally reflect the last reported sales price if the security is actively traded. The third-party pricing agents may also value debt securities at an evaluated bid price by employing methodologies that utilize actual market transactions, broker-supplied valuations, or other methodologies designed to identify the market value for such securities. Debt obligations acquired with remaining maturities of sixty days or less may be valued at their amortized cost, which approximates market value. The prices for foreign securities are reported in local currency and converted to U.S. dollars using currency exchange rates. Prices for most securities held in the Funds are provided daily by recognized independent pricing agents. If a security price cannot be obtained from an independent, third-party pricing agent, the Funds seek to obtain a bid price from at least one independent broker.
Securities for which market prices are not “readily available” are valued in accordance with fair value procedures established by the Trust’s Board of Trustees. The Trust’s fair value procedures are implemented through a Fair Value Committee (the “Committee”) designated by the Trust’s Board of Trustees. Some of the more common reasons that may necessitate that a security be valued using fair value procedures include: the security’s trading has been halted or suspended; the security has beende-listed from a national exchange; the security’s primary trading market is temporarily closed at a time when under normal conditions it would be open; or the security’s primary pricing source is not able or willing to provide a price. When a security is valued in accordance with the fair value procedures, the Committee will determine the value after taking into consideration relevant information reasonably available to the Committee.
| New Covenant Funds / Semi-Annual Report / December 31, 2019 | 45 |
NOTES TO FINANCIAL STATEMENTS (Unaudited) (Continued)
December 31, 2019
For securities that principally trade on a foreign market or exchange, a significant gap in time can exist between the time of a particular security’s last trade and the time at which a Fund calculates its net asset value. The closing prices of such securities may no longer reflect their market value at the time a Fund calculates net asset value if an event that could materially affect the value of those securities (a “Significant Event”) has occurred between the time of the security’s last close and the time that a Fund calculates net asset value. A Significant Event may relate to a single issuer or to an entire market sector. If the adviser orsub-adviser of a Fund becomes aware of a Significant Event that has occurred with respect to a security or group of securities after the closing of the exchange or market on which the security or securities principally trade, but before the time at which a Fund calculates net asset value, the adviser orsub-adviser may request that a Committee Meeting be called. In addition, the Trust’s administrator monitors price movements among certain selected indices, securities and/or baskets of securities that may be an indicator that the closing prices received earlier from foreign exchanges or markets may not reflect market value at the time a Fund calculates net asset value. If price movements in a monitored index or security exceed levels established by the administrator, the administrator notifies the adviser orsub-adviser for any Fund holding the relevant securities that such limits have been exceeded. In such event, the adviser orsub-adviser makes the determination whether a Committee Meeting should be called based on the information provided.
The Growth Fund holds international securities that also use a third-party fair valuation vendor. The vendor provides a fair value for foreign securities held by this Fund based on certain factors and methodologies (involving, generally, tracking valuation correlations between the U.S. market and eachnon-U.S. security). Values from the fair value vendor are applied in the event that there is a movement in the U.S. market that exceeds a specific threshold that has been established by the Committee. The Committee has also established a “confidence interval” which is used to determine the level of historical correlation between the value of a specific foreign security and movements in the U.S. market before a particular security will be fair valued when the threshold is exceeded. In the event that the threshold established by the Committee is exceeded on a specific day, the Growth Fund will value thenon-U.S. securities that exceed the applicable “confidence interval” based upon the adjusted prices provided by the fair valuation vendor.
Options for which the primary market is a national securities exchange are valued at the last sale price on the exchange on which they are traded, or, in the absence of any sale, at the closing bid price. Options not traded on a national securities exchange are valued at the last quoted bid price.
Futures cleared through a central clearing house (“centrally cleared futures”) are valued at the settlement price established each day by the board of exchange on which they are traded. The daily settlement prices for financial futures is provided by an independent source. On days when there is excessive volume, market volatility or the future does not end trading by the time a Fund calculates its NAV, the settlement price may not be available at the time at which the Fund calculates its NAV. On such days, the best available price (which is typically the last sales price) may be used to value a Fund’s futures position.
The assets of the Balanced Growth Fund and the Balanced Income Fund (the “Balanced Funds”) consist primarily of investments in underlying affiliated investment companies, which are valued at their respective daily net asset values in accordance with the established NAV of each fund.
In accordance with U.S. GAAP, fair value is defined as the price that a Fund would receive upon selling an investment in an orderly transaction to an independent buyer in the principal or most advantageous market of the investment. A three tier hierarchy has been established to maximize the use of observable and minimize the use of unobservable inputs and to establish classification of fair value measurements for disclosure purposes. Inputs refer broadly to the assumptions that market participants would use in pricing an asset. Inputs may be observable or unobservable. Observable inputs are inputs that reflect the assumptions market participants would use in pricing the asset or liability based on market data obtained from sources independent of the reporting entity. Unobservable inputs are inputs that reflect the reporting entity’s own assumptions about the assumptions market participants would use in pricing the asset or liability based on the best information available in the circumstances.
The three-tier hierarchy of inputs is summarized in the three broad Levels listed below:
Level 1 — quoted prices in active markets for identical investments
Level 2 — other significant observable inputs (including quoted prices for similar investments, interest rates, prepayment speeds, credit risks, etc.)
| 46 | New Covenant Funds / Semi-Annual Report / December 31, 2019 |
Level 3 — significant unobservable inputs (including the Fund’s own assumptions in determining the fair value of investments)
The valuation techniques used by the Funds to measure fair value during the period ended December 31, 2019 maximized the use of observable inputs and minimized the use of unobservable inputs.
For the period ended December 31, 2019, there have been no significant changes to the Trust’s fair valuation methodologies. For details of the investment classifications reference the Schedules of Investments.
Securities Transactions and Investment Income — Security transactions are recorded on the trade date. Cost used in determining net realized capital gains and losses on the sale of securities is determined on the basis of specific identification. Dividend income and expense is recognized on theex-dividend date, and interest income or expense is recognized using the accrual basis of accounting.
Distributions received on securities that represent a return of capital or capital gains are recorded as a reduction of cost of investments and/or as a realized gain. The Trust estimates the components of distributions received that may be considered nontaxable distributions or capital gain distributions.
Amortization and accretion is calculated using the scientific interest method, which approximates the effective interest method over the holding period of the security. Amortization of premiums and discounts is included in interest income.
Cash and Cash Equivalents — Idle cash and currency balances may be swept into various overnight sweep accounts and are classified as cash equivalents on the Statement of Assets and Liabilities. These amounts, at times, may exceed United States federally insured limits. Amounts swept are available on the next business day.
Expenses — Expenses that are directly related to a Fund are charged directly to that Fund. Other operating expenses of the Funds are prorated to the Funds on the basis of relative net assets.
Foreign Currency Translation — The books and records of the Funds investing in international securities are maintained in U.S. dollars on the following basis:
(I) market value of investment securities, assets and liabilities at the current rate of exchange; and
(II) purchases and sales of investment securities, income and expenses at the relevant rates of exchange prevailing on the respective dates of such transactions.
The Funds do not isolate that portion of gains and losses on investments in equity securities that is due to changes in the foreign exchange rates from that which is due to changes in market prices of equity securities.
The Funds report certain foreign-currency-related transactions as components of realized gains for financial reporting purposes, whereas such components are treated as ordinary income for Federal income tax purposes.
Repurchase Agreements — To the extent consistent with its investment objective and strategies, a Fund may enter into repurchase agreements which are secured by obligations of the U.S. Government with a bank, broker-dealer or other financial institution. Each repurchase agreement is at least 102% collateralized andmarked-to-market. However, in the event of default or bankruptcy by the counterparty to the repurchase agreement, realization of the collateral may by subject to certain costs, losses or delays.
Futures Contracts — To the extent consistent with its investment objective and strategies, a Fund may use futures contracts for tactical hedging purposes as well as to enhance the Fund’s returns. These Funds’ investments in futures contracts are designed to enable the Funds to more closely approximate the performance of their benchmark indices. Initial margin deposits of cash or securities are made upon entering into futures contracts. The contracts aremarked-to-market daily and the resulting changes in value are accounted for as unrealized gains and losses. Variation margin payments are paid or received, depending upon whether unrealized gains or losses are incurred. When contracts are closed, the Funds record a realized gain or loss equal to the difference between the proceeds from (or cost of) the closing transaction and the amount invested in the contract.
Risks of entering into futures contracts include the possibility that there will be an imperfect price correlation between the futures and the underlying securities. Second, it is possible that a lack of liquidity for futures contracts could exist in the secondary market, resulting in an inability to close a position prior to its maturity date. Third, futures contracts involve the risk that a Fund could lose more than the original margin deposit required to initiate a futures transaction.
| New Covenant Funds / Semi-Annual Report / December 31, 2019 | 47 |
NOTES TO FINANCIAL STATEMENTS (Unaudited) (Continued)
December 31, 2019
Finally, the risk exists that losses could exceed amounts disclosed on the Statements of Assets and Liabilities. Refer to each Fund’s Schedule of Investments for details regarding open futures contracts as of December 31, 2019, if applicable.
Options Writing/Purchasing — To the extent consistent with its investment objective and strategies, a Fund may invest in financial options contracts for the purpose of hedging its existing portfolio securities, or securities that a Fund intends to purchase, against fluctuations in fair market value caused by changes in prevailing market interest rates. A Fund may also invest in financial option contracts to enhance its returns. When the Fund writes or purchases an option, an amount equal to the premium received or paid by the Fund is recorded as a liability or an asset and is subsequently adjusted to the current market value of the option written or purchased. Premiums received or paid from writing or purchasing options which expire unexercised are treated by the Fund on the expiration date as realized gains or losses. The difference between the premium and the amount paid or received on affecting a closing purchase or sale transaction, including brokerage commissions, is also treated as a realized gain or loss. If an option is exercised, the premium paid or received is added to the cost of the purchase or proceeds from the sale in determining whether the Fund has realized a gain or a loss.
The risk in writing a call option is a Fund may give up the opportunity for profit if the market price of the security increases. The risk in writing a put option is a Fund may incur a loss if the market price of the security decreases and the option is exercised. The risk in purchasing an option is a Fund may pay a premium whether or not the option is exercised. The Funds also have the additional risk of being unable to enter into a closing transaction at an acceptable price if a liquid secondary market does not exist. Option contracts also involve the risk that they may not work as intended due to unanticipated developments in market conditions or other causes.
Forward Treasury Commitments — To the extent consistent with its investment objective and strategies, the Growth Fund and Income Fund may invest in commitments to purchase U.S. Treasury securities on an extended settlement basis. Such transactions involve the commitment to purchase a security with payment and delivery taking place in the future, sometimes a month or more after the transaction date. The Funds account for such transactions as purchases and sales and record an unrealized gain or loss each day equal to the difference between the cost of the purchase commitment and the current market value. Realized gains or losses are recorded upon closure or settlement of such commitments. No interest is earned prior to settlement of the transaction. These instruments are subject to market fluctuation due to changes in interest rates and the market value at the time of settlement could be higher or lower than the purchase price. A Fund may incur losses due to changes in the value of the underlying treasury securities from interest rate fluctuations or as a result of counterparty nonperformance. These transactions may increase the overall investment exposure for a Fund (and so may also create investment leverage) and involve a risk of loss if the value of the securities declines prior to the settlement date.
Master Limited Partnerships — To the extent consistent with its investment objective and strategies, a Fund may invest in entities commonly referred to as “MLPs” that are generally organized under state law as limited partnerships or limited liability companies. The Funds intend to primarily invest in MLPs receiving partnership taxation treatment under the Internal Revenue Code of 1986 (the “Code”), and whose interests or “units” are traded on securities exchanges like shares of corporate stock. To be treated as a partnership for U.S. federal income tax purposes, an MLP whose units are traded on a securities exchange must receive at least 90% of its income from qualifying sources such as interest, dividends, real estate rents, gain from the sale or disposition of real property, income and gain from mineral or natural resources activities, income and gain from the transportation or storage of certain fuels, and, in certain circumstances, income and gain from commodities or futures,for- wards and options with respect to commodities. Mineral or natural resources activities include exploration, development, production, processing, mining, refining, marketing and transportation (including pipelines) of oil and gas, minerals, geothermal energy, fertilizer, timber or industrial source carbon dioxide. An MLP consists of a general partner and limited partners (or in the case of MLPs organized as limited liability companies, a managing member and members). The general partner or managing member typically controls the operations and management of the MLP and has an ownership stake in the partnership. The limited partners or members, through their ownership of limited partner or member interests, provide capital to the entity, are intended to have no role in the operation and management of the entity and receive cash distributions. The MLPs themselves generally do not pay U.S. Federal income taxes. Thus, unlike investors in corporate securities, direct MLP investors are generally not subject to double taxation (i.e., corporate level tax and tax on corporate dividends). Currently, most MLPs operate in the energy and/or natural resources sector.
Delayed Delivery Transactions — To the extent consistent with its investment objective and strategies, the Growth Fund and Income Fund may purchase or sell securities on a when-issued or delayed delivery basis. These
| 48 | New Covenant Funds / Semi-Annual Report / December 31, 2019 |
transactions involve a commitment by those Funds to purchase or sell securities for a predetermined price or yield, with payment and delivery taking place beyond the customary settlement period. When delayed delivery purchases are outstanding, the Funds will set aside liquid assets in an amount sufficient to meet the purchase price. When purchasing a security on a delayed delivery basis, that Fund assumes the rights and risks of ownership of the security, including the risk of price and yield fluctuations, and takes such fluctuations into account when determining its net asset value. Those Funds may dispose of or renegotiate a delayed delivery transaction after it is entered into, and may sell when-issued securities before they are delivered, which may result in a capital gain or loss. When those Funds have sold a security on a delayed delivery basis, that Fund does not participate in future gains and losses with respect to the security.
Dividends and Distributions to Shareholders — Dividends from net investment income are declared and paid to shareholders quarterly for the Growth Fund, Balanced Growth Fund and Balanced Income Fund; declared and paid monthly for the Income Fund. Dividends and distributions are recorded on theex-dividend date. Any net realized capital gains will be distributed at least annually by the Funds.
Illiquid Securities — A security is considered illiquid if it cannot be sold or disposed of in the ordinary course of business within seven days or less for its approximate carrying value on the books of a Fund. Valuations of illiquid securities may differ significantly from the values that would have been used had an active market value for these securities existed. As of December 31, 2019, the Funds did not own any illiquid securities.
Investments in Real Estate Investment Trusts (“REITs”) — Dividend income is recorded based on the income included in distributions received from the REIT investments using published REIT reclassifications including some management estimates when actual amounts are not available. Distributions received in excess of this estimated amount are recorded as a reduction of the cost of investments or reclassified to capital gains. The actual amounts of income, return of capital, and capital gains are only determined by each REIT after its fiscalyear-end, and may differ from the estimated amounts.
3. AGREEMENTS AND OTHER TRANSACTIONS WITH AFFILIATES
Administration Agreement — The Trust entered into an Administration Agreement with SEI Investments Global Funds Services (the “Administrator”). Under the Administration Agreement, the Administrator provides administrative and accounting services to the Funds. The Administrator has voluntarily agreed to waive a portion of its fee so that the total annual expenses of the Balanced Growth Fund and the Balanced Income Fund, exclusive of acquired fund fees and expenses, will not exceed certain voluntary expense limitations adopted by the Adviser. Accordingly, effective April 1, 2017, the voluntary expense limitations are 0.13% and 0.15% for the Balanced Growth Fund and the Balanced Income Fund, respectively. These voluntary waivers may be terminated by the adviser at any time. The following is a summary of annual fees payable to the Administrator:
| First $2.5 Billion | Next $500 Million | Over $3 Billion | ||||||
Growth Fund | 0.2000% | 0.1650% | 0.1200% |
| First $1.5 Billion | Next $500 Million | Next $500 Million | Next $500 Million | Over $3 Billion | ||||||||
Income Fund | 0.2000% | 0.1775% | 0.1550% | 0.1325% | 0.1100% | |||||||
Balanced Growth Fund | 0.1500% | 0.1375% | 0.1250% | 0.1125% | 0.1000% | |||||||
Balanced Income Fund | 0.1500% | 0.1375% | 0.1250% | 0.1125% | 0.1000% |
Transfer Agent Servicing Agreement — In 2008, the Trust entered into a transfer agent servicing agreement (“Agreement”) with U.S. Bancorp Fund Services, LLC (“USBFS”), an indirect, wholly-owned subsidiary of U.S. Bancorp. Under the terms of the Agreement, USBFS is entitled to account based fees and annual fund level fees, as well as reimbursement ofout-of-pocket expenses incurred in providing transfer agency services.
Investment Advisory Agreement — The Trust, on behalf of each Fund, entered into an Investment Advisory Agreement (“Agreement”) with SEI Investments Management Corporation (the “Adviser”). Under the Agreement, the Adviser is responsible for the investment management of the Funds and receives an annual advisory fee of 0.47% for the Growth Fund and 0.42% for the Income Fund. The Adviser does not receive an advisory fee for the Balanced Growth Fund and Balanced Income Fund. The Adviser has voluntarily agreed to waive a portion of its fee so that the total annual expenses of the Growth and Income Funds, exclusive of acquired fund fees and expenses, will not exceed certain voluntary expense limitations adopted by the Adviser. Accordingly, effective April 1, 2017, the
| New Covenant Funds / Semi-Annual Report / December 31, 2019 | 49 |
NOTES TO FINANCIAL STATEMENTS (Unaudited) (Continued)
December 31, 2019
voluntary expense limitation is 0.80% for the Income Fund. The voluntary expense limitation for the Growth Fund was 0.87% until May 13, 2019 when the voluntary expense limitation was changed to be 0.72%.
The Adviser has entered intosub-advisory agreements to assist in the selection and management of investment securities in the Growth Fund and the Income Fund. It is the responsibility of thesub-advisers, under the direction of the Adviser, to makeday-to-day investment decisions for these Funds. The Adviser, not the Funds, pays eachsub-adviser a quarterly fee, in arrears, for their services. The Adviser payssub-advisory fees directly from its own advisory fee. Thesub-advisory fees are based on the assets of the Fund allocated to thesub-adviser for which thesub- adviser is responsible for making investment decisions.
The following is thesub-adviser for the Growth Fund: Parametric Portfolio Associates LLC.
The following are thesub-advisers for the Income Fund: Income Research & Management, Western Asset Management Company and Western Asset Management Company Limited.
Shareholder Service Plan and Agreement—The Trust entered into a Shareholder Service Plan and Agreement (the “Agreement”) with the Distributor. Per the Agreement, a Fund is authorized to make payments to certain entities which may include investment advisors, banks, trust companies and other types of organizations (“Authorized Service Providers”) for providing administrative services with respect to shares of the Funds attributable to or held in the name of the Authorized Service Providers for its clients or other parties with whom they have a servicing relationship. Under the terms of the Agreement, the Growth Fund and the Income Funds are authorized to pay an Authorized Service Provider a shareholder servicing fee at an annual rate of up to 0.10% of the average daily net asset value of the Growth Fund and Income Fund, respectively, which fee will be computed daily and paid monthly, for providing certain administrative services to Fund shareholders with whom the Authorized Service Provider has a servicing relationship.
Distribution Agreement — The Trust issues shares of the Funds pursuant to a Distribution Agreement with SEI Investments Distribution Co. (the “Distributor”), a wholly owned subsidiary of SEI Investments Company (“SEI”). In consideration of the services and facilities to be provided by the Distributor or any service provider, each of the Growth Fund and the Income Fund (if such Fund has issued Shares) will pay to the Distributor a fee, as agreed from time to time, at an annual rate of up to 0.10% (ten basis points) of the average daily net asset value of the Growth Fund and the Income Fund, respectively, which fee will be computed daily and paid monthly.
Social Witness Services and License Agreement — The Trust retained New Covenant Trust Company (“NCTC”) to ensure that each Fund continues to invest consistent with social witness principles adopted by the General Assembly of the Presbyterian Church (U.S.A.). No less than annually, NCTC will provide the Trust with an updated list of issuers in which the Funds will be prohibited from investing.
NCTC will distribute to the Trust proxy voting guidelines and shareholder advocacy services for the Funds that NCTC deems to be consistent with social witness principles adopted by the General Assembly of the Presbyterian Church (U.S.A.). The Trust also engages NCTC to vote Fund proxies consistent with such proxy voting guidelines. NCTC shall monitor and review and, as necessary, amend the Proxy Voting Guidelines periodically to ensure that they remain consistent with the social witness principles.
NCTC also grants to the Trust anon-exclusive right and license to use and refer to the trade name, trademark and/ or service mark rights to the name “New Covenant Funds” and the phrase “Funds with a Mission”, in the name of the Trust and each Fund, and in connection with the offering, marketing, promotion, management and operation of the Trust and the Funds.
In consideration of the services provided by NCTC, the Growth Fund and the Income Fund will each pay to NCTC a fee at an annual rate of 0.15% of the average daily net asset value of the shares of such Fund, which fee will be computed daily and paid monthly.
Payment to Affiliates — Certain officers and/or interested trustees of the Trust are also officers of the Distributor, the Adviser, the Administrator or NCTC. The Trust pays each unaffiliated Trustee an annual fee for attendance at quarterly and interim board meetings. Compensation of officers and affiliated Trustees of the Trust is paid by the Adviser, the Administrator or NCTC.
A portion of the services provided by the Chief Compliance Officer (“CCO”) and his staff, whom are employees of the Administrator, are paid for by the Trust as incurred. The services include regulatory oversight of the Trust’s Adviser,
| 50 | New Covenant Funds / Semi-Annual Report / December 31, 2019 |
sub-advisers and service providers as required by SEC regulations. The CCO’s services have been approved by and are reviewed annually by the Board.
Investment in Affiliated Security — The Funds may invest excess cash in the SEI Daily Income Trust (SDIT) Government Fund, an affiliated money market fund. The Balanced Funds invest in the Growth Fund and Income Fund.
Interfund Lending — The SEC has granted an exemption that permits the Trust to participate in an interfund lending program (the ‘‘Program’’) with existing or future investment companies registered under the 1940 Act that are advised by SIMC (the ‘‘SEI Funds’’). The Program allows the SEI Funds to lend money to and borrow money from each other for temporary or emergency purposes. Participation in the Program is voluntary for both borrowing and lending funds. Interfund loans may be made only when the rate of interest to be charged is more favorable to the lending fund than an investment in overnight repurchase agreements (‘‘Repo Rate’’), and more favorable to the borrowing fund than the rate of interest that would be charged by a bank for short-term borrowings (‘‘Bank Loan Rate’’). The Bank Loan Rate will be determined using a formula reviewed annually by the SEI Funds’ Board of Trustees. The interest rate imposed on interfund loans is the average of the Repo Rate and the Bank Loan Rate. During the period ended December 31, 2019, the Trust did not participate in interfund lending.
4. DERIVATIVE TRANSACTIONS
The International Swaps and Derivatives Association, Inc. Master Agreements and Credit Support Annexes (“ISDA Master Agreements”) maintain provisions for general obligations, representations, agreements, collateral, and events of default or termination. The occurrence of a specified event of termination may give a counterparty the right to terminate all of its contracts and affect settlement of all outstanding transactions under the applicable ISDA Master Agreement.
To reduce counterparty risk with respect to Over The Counter (“OTC”) transactions, the Funds have entered into master netting arrangements, established within the Funds’ ISDA master agreements, which allow the Funds to make (or to have an entitlement to receive) a single net payment in the event of default(close-out netting) for outstanding payables and receivables with respect to certain OTC positions in swaps for each individual counterparty. In addition, the Funds may require that certain counterparties post cash and/or securities in collateral accounts to cover their net payment obligations for those derivative contracts subject to ISDA Master Agreements. If the counterparty fails to perform under these contracts and agreements, the cash and/or securities will be made available to the Funds.
For financial reporting purposes, the Funds do not offset derivative assets and derivative liabilities that are subject to netting arrangements in the Statement of Assets and Liabilities and therefore disclose these derivative assets and derivative liabilities on a gross basis. Bankruptcy or insolvency laws of a particular jurisdiction may impose restrictions on or prohibitions against the right of offset in bankruptcy, insolvency or other events.
Collateral terms are contract specific for OTC derivatives. For derivatives traded under an ISDA Master Agreement, the collateral requirements are typically calculated by netting the mark to market amount of each transaction under such agreement and comparing that amount to the value of any collateral currently pledged by the Funds or the counterparty. For financial reporting purposes, cash collateral that has been pledged to cover obligations of the Funds, if any, is reported separately on the Statement of Assets and Liabilities as cash pledged as collateral. Non-cash collateral pledged by the Funds, if any, is noted in the Schedules of Investments. Generally, the amount of collateral due from or to a party must exceed a minimum transfer amount threshold before a transfer has to be made. To the extent amounts due to the Funds from its counterparties are not fully collateralized, contractually or otherwise, the Funds bear the risk of loss from counterparty nonperformance.
The following is a summary of the variation margin of exchange-traded financial derivative instruments of the Funds as of December 31, 2019 ($ Thousands):
| Financial Derivative Asset | Financial Derivative Liability | ||||||||||||||
| Variation Margin Asset | Variation Margin Liability | ||||||||||||||
| Fund | Futures | Futures | |||||||||||||
Growth Fund | $19 | $ - | |||||||||||||
Income Fund | $49 | $ 54 | |||||||||||||
Cash with a total market value of $324 and 215 ($ Thousands) for the Growth Fund and Income Fund, respectively, has been pledged as collateral for exchange-traded derivative instruments as of December 31, 2019.
| New Covenant Funds / Semi-Annual Report / December 31, 2019 | 51 |
NOTES TO FINANCIAL STATEMENTS (Unaudited) (Continued)
December 31, 2019
The following table discloses the volume of the Fund’s futures contracts activity during the period ended December 31, 2019 ($ Thousands):
| Growth Fund | Income Fund | |||||||||||||||||||
Futures Contracts: |
| |||||||||||||||||||
Equity Contracts |
| |||||||||||||||||||
Average Notional Balance Long | $ 7,456 | $ 79,445 | ||||||||||||||||||
Average Notional Balance Short | – | 54,248 | ||||||||||||||||||
Ending Notional Balance Long | – | – | ||||||||||||||||||
Ending Notional Balance Short | – | – | ||||||||||||||||||
Options: | ||||||||||||||||||||
Equity Contracts |
| |||||||||||||||||||
Average Notional Balance Long | $ – | $ 34 | ||||||||||||||||||
Average Notional Balance Short | – | 60 | ||||||||||||||||||
Ending Notional Balance Long | – | – | ||||||||||||||||||
Ending Notional Balance Short | – | – | ||||||||||||||||||
5. INVESTMENT TRANSACTIONS
The cost of security purchases and the proceeds from the sale and maturities of securities, excluding U.S. government and other short-term investments, for the period ended December 31, 2019, were as follows:
| ||||||||||||||||
| Fund | Purchases ($ Thousands) | Sales (excluding ($ Thousands) | Purchases of ($ Thousands) | Sales of U.S. Government ($ Thousands) | ||||||||||||
| ||||||||||||||||
Growth Fund | $ 54,597 | $ 81,587 | $ — | $ — | ||||||||||||
Income Fund | 17,579 | 30,151 | 223,271 | 209,926 | ||||||||||||
Balanced Growth Fund | 18,810 | 23,705 | — | — | ||||||||||||
Balanced Income Fund | 5,027 | 6,740 | — | — | ||||||||||||
6. FEDERAL TAX INFORMATION
It is each Fund’s intention to continue to qualify as a regulated investment company under Subchapter M of the Internal Revenue Code and distribute all of its taxable income (including net capital gains). Accordingly, no provision for federal income tax is required.
Dividends from net investment income and distributions from net realized capital gains are determined in accordance with U.S. Federal income tax regulations, which may differ from those amounts determined under U.S. GAAP. These book/tax differences are either temporary or permanent in nature. To the extent these differences are permanent, they are charged or credited topaid-in capital or distributable earnings (loss), as appropriate, in the period that the differences arise.
The tax character of dividends and distributions paid during the last two years ended June 30 were as follows:
| ||||||||||||||||||
Ordinary ($ Thousands) | Long Term Capital Gains ($ Thousands) | Total Taxable Deductions ($ Thousands) | Total Distributions Paid | |||||||||||||||
| ||||||||||||||||||
Growth Fund | 2019 | $ 5,700 | $ 25,395 | $ 31,095 | $ 31,095 | |||||||||||||
| 2018 | 5,007 | 23,033 | 28,040 | 28,040 | ||||||||||||||
Income Fund | 2019 | 7,780 | — | 7,780 | 7,780 | |||||||||||||
| 2018 | 6,403 | — | 6,403 | 6,403 | ||||||||||||||
Balanced Growth Fund | 2019 | 5,632 | 12,003 | 17,635 | 17,635 | |||||||||||||
| 2018 | 2,619 | 2,087 | 4,706 | 4,706 | ||||||||||||||
Balanced Income Fund | 2019 | 1,606 | 2,554 | 4,160 | 4,160 | |||||||||||||
| 2018 | 1,114 | 583 | 1,697 | 1,697 | ||||||||||||||
| 52 | New Covenant Funds / Semi-Annual Report / December 31, 2019 |
As of June 30, 2019, the components of distributable earnings (accumulated losses) were as follows:
| Undistributed Ordinary Income ($ Thousands) | Undistributed Long-Term Capital Gain ($ Thousands) | Capital Loss Carryforwards ($ Thousands) | Post- October Losses ($ Thousands) | Unrealized Appreciation (Depreciation) ($ Thousands) | Other Temporary Differences ($ Thousands) | Total Distributable Earnings (Accumulated Losses) ($ Thousands) | ||||||||||||||||||||||
New Covenant Growth Fund | $ | 857 | $ | 17,284 | $ | — | $ | — | $ | 106,288 | $ | 2 | $ | 124,431 | ||||||||||||||
New Covenant Income Fund | 715 | — | (1,950 | ) | — | 6,967 | (1,519 | ) | 4,213 | |||||||||||||||||||
New Covenant Balanced Growth Fund | 2,544 | 9,488 | — | — | 58,742 | — | 70,774 | |||||||||||||||||||||
New Covenant Balanced Income Fund | 483 | 1,371 | — | — | 11,288 | — | 13,142 | |||||||||||||||||||||
Post October losses represent losses realized on investment transactions from November 1, 2018 through June 30, 2019 that, in accordance with Federal income tax regulations, the Funds may defer and treat as having arisen in the following fiscal year. Deferred Late-Year Losses represent ordinary losses realized on investment transactions from January 1, 2019 through June 30, 2019 and specified losses realized on investment transactions from November 1, 2016 through June 30, 2019, that, in accordance with Federal income tax regulations, the Fund defers and treats as having arisen in the following fiscal year.
The Funds are permitted to carry forward capital losses incurred in taxable years beginning after December 22, 2010 for an unlimited period. Additionally, post-enactment capital losses that are carried forward will retain their character as either short-term or long-term capital losses rather than being considered all short-term as under previous law. Losses carried forward under these new provisions are as follows:
| Short-Term Loss ($ Thousands) | Long-Term Loss ($ Thousands) | Total* ($ Thousands) | ||||||||||
Income Fund | $ — | $ 1,950 | $ 1,950 | |||||||||
*This table should be used in conjunction with the capital loss carryforwards table.
For Federal income tax purposes, the cost of securities owned at June 30, 2019, and the net realized gains or losses on securities sold for the period were not materially different from amounts reported for financial reporting purposes. These differences are primarily due to wash sales, MLP basis adjustments and basis adjustments from investments in registered investment companies which cannot be used for Federal income tax purposes in the current year and have been deferred for use in future years.
The aggregate gross unrealized appreciation and depreciation on total investments held by the Funds at December 31, 2019 was as follows:
| Federal Tax Cost ($ Thousands) | Appreciated Securities ($ Thousands) | Depreciated Securities ($ Thousands) | Net Unrealized Appreciation (Depreciation) ($ Thousands) | |||||||||||||
Growth Fund | $ | 323,468 | $ | 145,913 | $ | (7,841 | ) | $ | 138,072 | |||||||
Income Fund | 336,579 | 8,214 | (614 | ) | 7,600 | |||||||||||
Balanced Growth Fund | 222,311 | 77,437 | — | 77,437 | ||||||||||||
Balanced Income Fund | 63,107 | 15,201 | — | 15,201 | ||||||||||||
Management has analyzed the Funds’ tax positions taken on Federal income tax returns for all open tax years and has concluded that as of June 30, 2019, no provision for income tax would be required in the Funds’ financial statements. The Funds’ Federal and state income and Federal excise tax returns for tax years for which the applicable statutes of limitations have not expired are subject to examination by the Internal Revenue Service and state departments of revenue.
7. CONCENTRATIONS/RISKS
In the normal course of business, the Trust enters into contracts that provide general indemnifications by the Trust to the counterparty to the contract. The Trust’s maximum exposure under these arrangements is dependent on future
| New Covenant Funds / Semi-Annual Report / December 31, 2019 | 53 |
NOTES TO FINANCIAL STATEMENTS (Unaudited) (Continued)
December 31, 2019
claims that may be made against the Trust and, therefore, cannot be estimated; however, management believes that, based on experience, the risk of loss from such claims is considered remote.
Asset Allocation Risk — The risk that SIMC’s decisions regarding the allocation of Fund assets to the Growth Fund and Income Fund will not anticipate market trends successfully.
Asset-Backed Securities Risk — Payment of principal and interest on asset-backed securities is dependent largely on the cash flows generated by the assets backing the securities. Securitization trusts generally do not have any assets or sources of funds other than the receivables and related property they own, and asset-backed securities are generally not insured or guaranteed by the related sponsor or any other entity. Asset-backed securities may be more illiquid than more conventional types of fixed income securities that the Fund may acquire.
Below Investment Grade Securities (Junk Bonds) Risk — Fixed income securities rated below investment grade (junk bonds) involve greater risks of default or downgrade and are generally more volatile than investment grade securities because the prospect for repayment of principal and interest of many of these securities is speculative. Because these securities typically offer a higher rate of return to compensate investors for these risks, they are sometimes referred to as “high yield bonds,” but there is no guarantee that an investment in these securities will result in a high rate of return. These risks may be increased in foreign and emerging markets.
Corporate Fixed Income Securities Risk — Corporate fixed income securities respond to economic developments, especially changes in interest rates, as well as perceptions of the creditworthiness and business prospects of individual issuers.
Credit Risk — The risk that the issuer of a security or the counterparty to a contract will default or otherwise become unable to honor a financial obligation.
Duration Risk — The longer-term securities in which the Fund may invest are more volatile. A portfolio with a longer average portfolio duration is more sensitive to changes in interest rates than a portfolio with a shorter average portfolio duration.
Equity Market Risk — The risk that the market value of a security may move up and down, sometimes rapidly and unpredictably. Market risk may affect a single issuer, an industry, a sector or the equity or bond market as a whole.
Extension Risk — The risk that rising interest rates may extend the duration of a fixed income security, typically reducing the security’s value.
Fixed Income Market Risk — The prices of the Fund’s fixed income securities respond to economic developments, particularly interest rate changes, as well as to perceptions about the creditworthiness of individual issuers, including governments and their agencies. Generally, the Fund’s fixed income securities will decrease in value if interest rates rise and vice versa. In a low interest rate environment, risks associated with rising rates are heightened. In the case of foreign securities, price fluctuations will reflect international economic and political events, as well as changes in currency valuations relative to the U.S. dollar.
Foreign Investment/Emerging Markets Risk — The risk thatnon-U.S. securities may be subject to additional risks due to, among other things, political, social and economic developments abroad, currency movements and different legal, regulatory and tax environments. These additional risks may be heightened with respect to emerging market countries because political turmoil and rapid changes in economic conditions are more likely to occur in these countries.
Foreign Sovereign Debt Securities Risk — The risks that (i) the governmental entity that controls the repayment of sovereign debt may not be willing or able to repay the principal and/or interest when it becomes due because of factors such as debt service burden, political constraints, cash flow problems and other national economic factors; (ii) governments may default on their debt securities, which may require holders of such securities to participate in debt
| 54 | New Covenant Funds / Semi-Annual Report / December 31, 2019 |
rescheduling or additional lending to defaulting governments; and (iii) there is no bankruptcy proceeding by which defaulted sovereign debt may be collected in whole or in part.
Interest Rate Risk — The risk that a rise in interest rates will cause a fall in the value of fixed income securities, including U.S. Government securities, in which the Fund invests. A low interest rate environment may present greater interest rate risk, because there may be a greater likelihood of rates increasing and rates may increase more rapidly.
Investment Style Risk — The risk that the equity securities in which the Fund invests may underperform other segments of the equity markets or the equity markets as a whole.
Liquidity Risk— The risk that certain securities may be difficult or impossible to sell at the time and the price that the Fund would like. The Fund may have to accept a lower price to sell a security, sell other securities to raise cash or give up an investment opportunity, any of which could have a negative effect on Fund management or performance.
Mortgage-Backed Securities Risk— Mortgage-backed securities are affected significantly by the rate of prepayments and modifications of the mortgage loans backing those securities, as well as by other factors such as borrower defaults, delinquencies, realized or liquidation losses and other shortfalls. Mortgage-backed securities are particularly sensitive to prepayment risk, which is described below, given that the term to maturity for mortgage loans is generally substantially longer than the expected lives of those securities; however, the timing and amount of prepayments cannot be accurately predicted. The timing of changes in the rate of prepayments of the mortgage loans may significantly affect the Fund’s actual yield to maturity on any mortgage-backed securities, even if the average rate of principal payments is consistent with the Fund’s expectation. Along with prepayment risk, mortgage-backed securities are significantly affected by interest rate risk, which is described above. In a low interest rate environment, mortgage loan prepayments would generally be expected to increase due to factors such as refinancings and loan modifications at lower interest rates. In contrast, if prevailing interest rates rise, prepayments of mortgage loans would generally be expected to decline and therefore extend the weighted average lives of mortgage-backed securities held or acquired by the Fund.
Opportunity Risk — The risk of missing out on an investment opportunity because the assets necessary to take advantage of it are tied up in other investments.
Portfolio Turnover Risk — Due to its investment strategy, the Fund may buy and sell securities frequently. This may result in higher transaction costs and additional capital gains tax liabilities, which may affect the Fund’s performance.
Prepayment Risk — The risk that, in a declining interest rate environment, fixed income securities with stated interest rates may have the principal paid earlier than expected, requiring the Fund to invest the proceeds at generally lower interest rates.
Repurchase Agreement Risk — Although repurchase agreement transactions must be fully collateralized at all times, they generally create leverage and involve some counterparty risk to the Fund whereby a defaulting counterparty could delay or prevent the Fund’s recovery of collateral.
Small Capitalization Risk — Smaller capitalization companies in which the Fund may invest may be more vulnerable to adverse business or economic events than larger, more established companies. In particular, small capitalization companies may have limited product lines, markets and financial resources and may depend upon a relatively small management group. Therefore, small capitalization stocks may be more volatile than those of larger companies. Small capitalization stocks may be tradedover-the-counter or listed on an exchange.
Social-Witness Principles/Socially Responsible Investing Risk — The Fund considers various social- witness principles and other socially responsible investing principles in its investment process and may choose not to purchase, or may sell, otherwise profitable investments in companies which have been identified as being in conflict with its established social-witness principles and other socially responsible investing principles. This means that the Fund may underperform other similar mutual funds that do not consider social-witness principles and other socially responsible investing principles in their investing.
U.S. Government Securities Risk — Although U.S. Government securities are considered to be among the safest investments, they are not guaranteed against price movements due to changing interest rates. Obligations issued by some U.S. Government agencies are backed by the U.S. Treasury, while others are backed solely by the ability of the agency to borrow from the U.S. Treasury or by the agency’s own resources.
The Balanced Growth Fund and Balanced Income Fund invest their assets primarily in the Growth Fund and the Income Fund. By investing primarily in shares of these Funds, shareholders of the Balanced Funds indirectly pay a
| New Covenant Funds / Semi-Annual Report / December 31, 2019 | 55 |
NOTES TO FINANCIAL STATEMENTS (Unaudited) (Concluded)
December 31, 2019
portion of the operating expenses, management fees and brokerage costs of the underlying Funds as well as their own operating expenses. Thus, shareholders of the Balanced Funds may indirectly pay slightly higher total operating expenses and other costs than they would pay by directly owning shares of the Growth Fund and Income Fund. A change in the asset allocation of either Balanced Fund could increase or reduce the fees and expenses actually borne by investors in that Fund. The Balanced Funds are also subject to rebalancing risk. Rebalancing activities, while undertaken to maintain a Fund’s investmentrisk-to- reward ratio, may cause the Fund to under-perform other funds with similar investment objectives. For the Balanced Growth Fund, it is possible after rebalancing from equities into a greater percentage of fixed-income securities, that equities will outperform fixed income investments. For the Balanced Income Fund, it is possible that after rebalancing from fixed-income securities into a greater percentage of equity securities, that fixed-income securities will outperform equity investments. The performance of the Balanced Growth Fund and the Balanced Income Fund depends on the performance of the underlying Funds in which they invest.
8. CONCENTRATION OF SHAREHOLDERS
On December 31, 2019, the number of shareholders below held the following percentage of the outstanding shares of the Funds. These shareholders are affiliated with the Funds.
| # of Shareholders | % of Outstanding Shares | |||
Growth Fund | 3 | 77.02% | ||
Income Fund | 3 | 83.29% | ||
Balanced Growth Fund | 1 | 1.38% | ||
Balanced Income Fund | 1 | 0.23% |
9. REGULATORY MATTERS
On August 17, 2018, the SEC adopted amendments to RegulationS-X. These changes are effective for periods after November 5, 2018. The updates to Registered Investment Companies were mainly focused on simplifying the presentation of distributable earnings by eliminating the need to present the components of distributable earning on a book basis in the Statements of Assets and Liabilities. The update also impacted the presentation of undistributed net investment income and distributions to shareholders on the Statements of Changes in Net Assets.
The amounts presented in the current Statements of Changes in Net Assets represent the aggregated total distributions of net investment income and realized capital gains, except for distributions classified as return of capital which are still presented separately.
10. ACCOUNTING PRONOUNCEMENT
In August 2018, The FASB issued Accounting Standards Update2018-13, Fair Value Measurement (Topic 820). The new guidance includes additions and modifications to disclosures requirements for fair value measurements. For public entities, the amendments are effective for financial statements issued for fiscal years beginning after December 15, 2019, and interim periods within those fiscal years. Management elected to early adopt the removal and modifications of certain disclosures and delay the adoption of additional disclosures until the effective date.
11. SUBSEQUENT EVENTS
Management has evaluated the need for disclosures and/or adjustments resulting from subsequent events through the date the financial statements were issued. Based on this evaluation, no disclosures and/or adjustments were required to the financial statements as of December 31, 2019.
| 56 | New Covenant Funds / Semi-Annual Report / December 31, 2019 |
DISCLOSURE OF FUND EXPENSES (UNAUDITED)
December 31, 2019
All mutual funds have operating expenses. As a shareholder of a mutual fund, your investment is affected by these ongoing costs, which include (among others) costs for portfolio management, administrative services, and shareholder reports like this one. It is important for you to understand the impact of these costs on your investment returns.
Operating expenses such as these are deducted from the mutual fund’s gross income and directly reduce its final investment return. These expenses are expressed as a percentage of the mutual fund’s average net assets; this percentage is known as the mutual fund’s expense ratio.
The following examples use the expense ratio and are intended to help you understand the ongoing costs (in dollars) of investing in your Fund and to compare these costs with those of other mutual funds. The examples are based on an investment of $1,000 made at the beginning of the period shown and held for the entire period (July 1, 2019 to December 31, 2019).
The table on this page illustrates your Fund’s costs in two ways:
Actual Fund Return: This section helps you to estimate the actual expenses after fee waivers that your Fund incurred over the period. The “Expenses Paid During Period” column shows the actual dollar expense cost incurred by a $1,000 investment in the Fund, and the “Ending Account Value” number is derived from deducting that expense cost from the Fund’s gross investment return.
You can use this information, together with the actual amount you invested in your Fund, to estimate the expenses you paid over that period. Simply divide your actual starting account value by $1,000 to arrive at a ratio (for example, an $8,600 account value divided by $1,000 = 8.6), then multiply that ratio by the number shown for your Fund under “Expenses Paid During Period.”
Hypothetical 5% Return: This section helps you compare your Fund’s costs with those of other mutual funds. It assumes that your Fund had an annual 5% return before expenses during the year, but that the expense ratio (Column 3) is unchanged. This example is useful in making comparisons because the Securities and Exchange Commission requires all mutual funds to make this 5% calculation. You can assess your Fund’s comparative cost by comparing the hypothetical result for your Fund in the “Expenses Paid During Period” column with those that appear in the same charts in the shareholder reports for other mutual funds.
NOTE: Because the return is set at 5% for comparison purposes — NOT your Fund’s actual return — the account values shown do not apply to your specific investment.
| Beginning Account Value 7/1/2019 | Ending Account Value 12/31/19 | Annualized Expense Ratios | Expenses Paid During Period* | |||||||||||||
Growth Fund | ||||||||||||||||
Actual Fund Return | $1,000.00 | $1,106.30 | 0.72 | % | $3.81 | |||||||||||
Hypothetical 5% Return | $1,000.00 | $1,021.52 | 0.72 | % | $3.66 | |||||||||||
Income Fund | ||||||||||||||||
Actual Fund Return | $1,000.00 | $1,018.40 | 0.80 | % | $4.06 | |||||||||||
Hypothetical 5% Return | $1,000.00 | $1,021.11 | 0.80 | % | $4.06 | |||||||||||
Balanced Growth Fund | ||||||||||||||||
Actual Fund Return | $1,000.00 | $1,070.50 | 0.13 | % | $0.68 | |||||||||||
Hypothetical 5% Return | $1,000.00 | $1,024.48 | 0.13 | % | $0.66 | |||||||||||
Balanced Income Fund | ||||||||||||||||
Actual Fund Return | $1,000.00 | $1,048.80 | 0.15 | % | $0.77 | |||||||||||
Hypothetical 5% Return | $1,000.00 | $1,024.38 | 0.15 | % | $0.76 | |||||||||||
| * | Expenses are equal to the Fund’s annualized expense ratio multiplied by the average account value over the period, multiplied by 184/366 (to reflect theone-half year period shown). |
| † | Excludes expenses of the underlying affiliated investment companies. |
| New Covenant Funds / Semi-Annual Report / December 31, 2019 | 57 |
BOARD OF TRUSTEES CONSIDERATIONS IN APPROVING THE ADVISORY ANDSUB-ADVISORY AGREEMENTS (UNAUDITED)
New Covenant Funds (the “Trust”) and SEI Investments Management Corporation (“SIMC”) have entered into an investment advisory agreement (the “Advisory Agreement”), pursuant to which SIMC provides investment advisory services to the series of the Trust (the “Funds”). Pursuant to separatesub-advisory agreements with SIMC (the“Sub-Advisory Agreements”) and under the supervision of SIMC and the Trust’s Board of Trustees (the “Board”), thesub-advisers (each, a“Sub-Adviser” and collectively, the“Sub-Advisers”) provide security selection and certain other advisory services with respect to all or a discrete portion of the assets of the Funds. TheSub-Advisers are also responsible for managing their employees who provide services to the Funds. TheSub-Advisers are selected based primarily upon the research and recommendations of SIMC, which evaluates quantitatively and qualitatively theSub-Advisers’ skills and investment results in managing assets for specific asset classes, investment styles and strategies.
The Investment Company Act of 1940, as amended (the “1940 Act”), requires that the initial approval of a Fund’sSub-Advisory Agreements be specifically approved by the vote of a majority of the outstanding shareholders of the Funds and the vote of a majority of the Trustees who are not parties to theSub-Advisory Agreements or “interested persons” of any party (the “Independent Trustees”) cast in person at a meeting called for such purpose. In addition, the 1940 Act requires that the continuation or renewal of any Investment Advisory Agreement be approved at least annually (after an initial period of up to two years), which also requires the vote of a majority of the Board, including a majority of the Independent Trustees. In connection with their consideration of such renewals, the Funds’ Trustees must request and evaluate, and SIMC and theSub-Advisers are required to furnish, such information as may be reasonably necessary to evaluate the terms of theSub-Advisory Agreements. In addition, the Securities and Exchange Commission takes the position that, as part of their fiduciary duties with respect to a mutual fund’s fees, mutual fund boards are required to evaluate the material factors applicable to a decision to approve asub-advisory agreement.
Consistent with these responsibilities, the Board calls and holds meetings each year to consider whether to approve new and/or renew existingSub-Advisory Agreements between SIMC and theSub-Advisers with respect to the Funds. In preparation for these meetings, the Board requests and reviews a wide variety of materials provided by SIMC and theSub-Advisers, including information about SIMC’s and theSub-Advisers’ affiliates, personnel and operations and the services provided pursuant to theSub-Advisory Agreements. The Board also receives data from third parties. This information is provided in addition to the detailed information about the Funds that the Board reviews during the course of each year, including information that relates to Fund operations and Fund performance. The Trustees also receive a memorandum from counsel regarding the responsibilities of Trustees in connection with their consideration of whether to approve the Trust’sSub-Advisory Agreements. Finally, the Independent Trustees receive advice from independent counsel to the Independent Trustees, meet in executive sessions outside the presence of Fund management and participate in question and answer sessions with representatives of SIMC and theSub-Advisers.
Specifically, during the first half of the Trust’s fiscal year, the Board requested and received written materials from SIMC and certain of theSub-Advisers regarding: (i) the quality of eachSub-Adviser’s investment management and other services; (ii) eachSub-Adviser’s investment management personnel; (iii) eachSub-Adviser’s operations and financial condition; (iv) eachSub-Adviser’s brokerage practices (including any soft dollar arrangements) and investment strategies; (v) the level of thesub-advisory fees that SIMC pays eachSub-Adviser, compared with fees each charge to comparable accounts; (vi) the level of eachSub-Adviser’s profitability from their Fund-related operations; (vii) eachSub-Adviser’s compliance program, including a description of material compliance matters and material compliance violations; (viii) eachSub-Adviser’s policies on and compliance procedures for personal securities transactions; (ix) eachSub-Adviser’s expertise and resources in domestic and/or international financial markets; and (x) the Funds’ performance over various periods of time.
At the September9-11, 2019 and December3-4, 2019 meetings of the Board, the Trustees, including a majority of the Independent Trustees, approved the renewal of certainSub-Advisory Agreements. In each case, the Board’s renewal was based on its consideration and evaluation of the factors described above, as discussed at the meetings and at prior meetings. The following discusses some, but not all, of the factors that were considered by the Board in connection with its assessment of theSub-Advisory Agreements.
Nature, Extent and Quality of Services. The Board considered the nature, extent and quality of the services provided by theSub-Advisers to the Funds and the resources of theSub-Advisers and their affiliates dedicated to the Funds. In this regard, the Trustees evaluated, among other things, eachSub-Adviser’s personnel, experience, track record and compliance program. Following evaluation, the Board concluded that, within the context of its full deliberations,
| 58 | New Covenant Funds / Semi-Annual Report / December 31, 2019 |
the nature, extent and quality of services provided by theSub-Advisers to the Funds and the resources of theSub-Advisers and their affiliates dedicated to the Funds were sufficient to support the renewal of theSub-Advisory Agreements.
Performance.In determining whether to renew theSub-Advisory Agreements, the Trustees considered the Funds’ performance relative to their peer groups and appropriate indexes/benchmarks. The Trustees reviewed performance information for each Fund, noting that they receive performance reports that permit them to monitor each Fund’s performance at board meetings throughout the year. Based on the materials considered and discussed at the meetings, the Trustees found Fund performance satisfactory, or, where performance was materially below the benchmark and/or peer group, the Trustees were satisfied with the reasons provided to explain such performance. In connection with the renewal ofSub-Advisory Agreements, the Board considered the performance of theSub-Adviser relative to appropriate indexes/benchmarks. Following evaluation, the Board concluded that, within the context of its full deliberations, the performance of eachSub-Adviser was sufficient to support renewal of theSub-Advisory Agreement.
Fees. With respect to the Funds’ expenses under theSub-Advisory Agreements, the Trustees considered the rate of compensation called for by theSub-Advisory Agreements and the Funds’ net operating expense ratios in comparison to those of the Funds’ respective peer groups. Based on the materials considered and discussion at the meetings, the Trustees further determined that fees were either shown to be below the peer average in the comparative fee analysis, or that there was a reasonable basis for the fee level. When considering fees paid to Sub-Advisers, the Board took into account the fact that theSub-Advisers are compensated by SIMC and not by the Funds directly, and that such compensation with respect to any unaffiliatedSub-Adviser reflects an arms-length negotiation between theSub-Adviser and SIMC. Following evaluation, the Board concluded that, within the context of its full deliberations, the expenses of the Funds are reasonable and supported renewal of theSub-Advisory Agreements. The Board also considered whether theSub-Advisers and their affiliates may have realized other benefits from their relationship with the Funds, such as any research and brokerage services received under soft dollar arrangements.
Profitability. With regard to profitability, the Trustees considered compensation flowing to theSub-Advisers and their affiliates, directly or indirectly. The Trustees considered whether the levels of compensation and profitability were reasonable. As with the fee levels, when considering the profitability of theSub-Advisers, the Board took into account the fact that compensation with respect to any unaffiliatedSub-Adviser reflects an arms-length negotiation between theSub-Adviser and SIMC. In connection with the renewal of eachSub-Advisory Agreement, the Board also took into consideration the impact that the fees paid to theSub-Adviser have on SIMC’s advisory fee margin and profitability. Based on this evaluation, the Board concluded that, within the context of its full deliberations, the profitability of each of theSub-Advisers is reasonable and supported renewal of theSub-Advisory Agreements.
Economies of Scale. The Trustees considered whether any economies of scale were being realized by the Sub-Advisers and their affiliates and, if so, whether the benefits of such economies of scale were passed along to the Funds’ shareholders through a graduated investment advisory fee schedule. The Trustees recognized that economies of scale are difficult to identify and quantify and are rarely identifiable on afund-by-fund basis. Based on this evaluation, the Board determined that the fees were reasonable in light of the information that was provided by SIMC and theSub-Advisers with respect to economies of scale.
Based on the Trustees’ deliberation and their evaluation of the information described above, the Board, including all of the Independent Trustees, with the assistance of Fund counsel and Independent Trustees’ counsel, unanimously approved the renewal, as applicable, of theSub-Advisory Agreements and concluded that the compensation under theSub-Advisory Agreements is fair and reasonable in light of such services and expenses and such other matters as the Trustees considered to be relevant in the exercise of their reasonable judgment. In the course of its deliberations, the Board did not identify any particular factor (or conclusion with respect thereto) or single piece of information that wasall-important, controlling or determinative of its decision, but considered all of the factors together, and each Trustee may have attributed different weights to the various factors (and conclusions with respect thereto) and information.
| New Covenant Funds / Semi-Annual Report / December 31, 2019 | 59 |
(This page intentionally left blank)
NEW COVENANT FUNDS SEMI-ANNUAL REPORT DECEMBER 31, 2019
Robert A. Nesher,Chairman
Trustees
William M. Doran
George J. Sullivan, Jr.
Nina Lesavoy
James M. Williams
Mitchell A. Johnson
Hubert L. Harris, Jr.
Susan C. Cote
James B. Taylor
Christine Reynolds
Officers
Robert A. Nesher
President and Chief Executive Officer
James J. Hoffmayer
Controller and Chief Financial Officer
Glenn R. Kurdziel
Assistant Controller
Russell Emery
Chief Compliance Officer
Timothy D. Barto
Vice President, Secretary
Aaron Buser
Vice President, Assistant Secretary
David F. McCann
Vice President, Assistant Secretary
Stephen G. MacRae
Vice President
Bridget E. Sudall
Anti-Money Laundering Compliance Officer
Privacy Officer
Investment Adviser
SEI Investments Management Corporation
Administrator
SEI Investments Global Funds Services
Distributor
SEI Investments Distribution Co.
Legal Counsel
Morgan, Lewis & Bockius LLP
Independent Registered Public Accounting Firm
KPMG LLP
This report and the financial statements contained herein are submitted for the general information of the shareholders of the Trust and must be preceded or accompanied by a current prospectus. Shares of the Funds are not deposits or obligations of, or guaranteed or endorsed by, any bank. The shares are not federally insured by the Federal Deposit Insurance Corporation (FDIC), the Federal Reserve Board, or any other government agency. Investment in the shares involves risk, including the possible loss of principal.
For more information call
New Covenant Fund
877-835-4531
 |  |
1 Freedom Valley Drive, P.O. Box 1100, Oaks, PA 19456
NCF-F-004 (12/19)
| Item 2. | Code of Ethics. |
Not applicable for semi-annual report.
| Item 3. | Audit Committee Financial Expert. |
Not applicable for semi-annual report.
| Item 4. | Principal Accountant Fees and Services. |
Not applicable for semi-annual report.
| Item 5. | Audit Committee of Listed Registrants. |
Not applicable for semi-annual report.
| Item 6. | Investments |
(a) The Schedules of Investments are included as part of the report to shareholders filed under Item 1 of this form.
| Item 7. | Disclosure of Proxy Voting Policies and Procedures forClosed-End Management Investment Companies. |
Not applicable.
| Item 8. | Portfolio Managers ofClosed-End Management Investment Companies |
Not applicable.
| Item 9. | Purchases of Equity Securities byClosed-End Management Company and Affiliated Purchasers. |
Not applicable.
| Item 10. | Submission of Matters to a Vote of Security Holders. |
There have been no material changes to the procedures by which shareholders may recommend nominees to the Registrant’s Board of Trustees (the “Board”). The Registrant has a standing Governance Committee (the “Committee”) currently consisting of the Independent Trustees. The Committee is responsible for evaluating and recommending nominees for election to the Board. Pursuant to the Committee’s Charter, adopted on February 22, 2012, the Committee will review all shareholder recommendations for nominations to fill vacancies on the Board if such recommendations are submitted in writing and addressed to the Committee at the Registrant’s office.
| Item 11. | Controls and Procedures. |
(a) The Registrant’s principal executive and principal financial officers, or persons performing similar functions, have concluded that the Registrant’s disclosure controls and procedures (as defined in Rule30a-3(c) under the Act (17 CFR270.30a-3(c)) are effective, based on the evaluation of these controls and procedures required by Rule30a-3(b) under the Act and Rules13a-15(b) or15d-15(b) under the Exchange Act as of a date within 90 days of the filing date of this report.
(b) There were no changes in the Registrant’s internal control over financial reporting (as defined in Rule30a-3(d) under the Act (17 CFR270.30a-3(d)) that occurred during the period covered by this report that have materially affected, or are reasonably likely to materially affect, the Registrant’s internal control over financial reporting.
| Item 12. | Disclosure of Securities Lending Activities forClosed-End Management Investment Companies. |
Not applicable.
| Item 13. | Exhibits. |
(a)(1) Not applicable for semi-annual report.
(a)(2) A separate certification of each principal executive officer and principal financial officer of the Registrant as required by Rule30a-2(a) under the 1940 Act, are filed herewith.
(b) Officer certifications as required by Rule30a-2(b) under the 1940 Act, as amended also accompany this filing as exhibits.
SIGNATURES
Pursuant to the requirements of the Securities Exchange Act of 1934 and the Investment Company Act of 1940, the Registrant has duly caused this report to be signed on its behalf by the undersigned, thereunto duly authorized.
| New Covenant Funds | ||||||
| By | /s/ Robert A. Nesher | |||||
| Robert A. Nesher | ||||||
| President & CEO | ||||||
Date: March 6, 2020
Pursuant to the requirements of the Securities Exchange Act of 1934 and the Investment Company Act of 1940, this report has been signed below by the following persons on behalf of the Registrant and in the capacities and on the dates indicated.
| By | /s/ Robert A. Nesher | |||||
| Robert A. Nesher | ||||||
| President & CEO |
Date: March 6, 2020
| By | /s/ James J. Hoffmayer | |||||
| James J. Hoffmayer | ||||||
| Controller & CFO |
Date: March 6, 2020