UNITED STATES
SECURITIES AND EXCHANGE COMMISSION
Washington, D.C. 20549
SECURITIES AND EXCHANGE COMMISSION
Washington, D.C. 20549
FORM N-CSR
CERTIFIED SHAREHOLDER REPORT OF REGISTERED
MANAGEMENT INVESTMENT COMPANIES
Investment Company Act file number 811-09067
Kirr, Marbach Partners Funds, Inc.
(Exact name of registrant as specified in charter)
(Exact name of registrant as specified in charter)
621 Washington Street, Columbus, IN 47201
(Address of principal executive offices) (Zip code)
(Address of principal executive offices) (Zip code)
Kirr, Marbach & Company, LLC, 621 Washington Street, Columbus, IN 47201
(Name and address of agent for service)
(Name and address of agent for service)
(812) 376-9444
Registrant's telephone number, including area code
Date of fiscal year end: September 30, 2019
Date of reporting period: March 31, 2019
Item 1. Report to Stockholders.
Kirr, Marbach Partners
Value Fund
Beginning on January 1, 2021, as permitted by regulations adopted by the U.S. Securities and Exchange Commission, paper copies of the Fund’s annual and semi-annual shareholder reports will no longer be sent by mail, unless you specifically request paper copies of the reports. Instead, the reports will be made available on the Fund’s website www.kmpartnersfunds.com, and you will be notified by mail each time a report is posted and provided with a website link to access the report.
If you already elected to receive shareholder reports electronically, you will not be affected by this change and you need not take any action. You may elect to receive shareholder reports and other communications from the Fund electronically anytime by contacting your financial intermediary (such as a broker-dealer or a bank) or, if you are a direct investor, by calling 1-800-870-8039 or by enrolling with Matt Kirr at matt@kirrmar.com.
You may elect to receive all future reports in paper free of charge. If you invest through a financial intermediary, you can contact your financial intermediary to request that you continue to receive paper copies of your shareholder reports. If you invest directly with the Fund, you can call 1-800-870-8039 or by contacting the Fund at matt@kirrmar.com to let the Fund know you wish to continue receiving paper copies of your shareholder reports. Your election to receive reports in paper will apply to all funds held in your account if you invest through your financial intermediary.
| Semi-Annual Report | |
| www▪kmpartnersfunds▪com | March 31, 2019 |
KIRR, MARBACH PARTNERS
VALUE FUND
“It is not the mountain that we conquer, but ourselves.”—Sir Edmund Percival Hillary
May 30, 2019
Dear Fellow Shareholders:
“Way back” in December, stock prices collapsed as investor anxiety reached a fever pitch over the Federal Reserve raising short-term interest rates too quickly, the threat of a tariff spat with China morphing into a full-blown trade war and the inability of our political leaders to prevent a government shutdown. As always, the financial media was quick to pounce on the opportunity to fan the flames of panic with headlines screaming about December 2018 being the worst December for stocks since the Great Depression, Christmas Eve being the worst in history and 2018 the worst year since the Global Financial Crisis a decade ago.
Fortunately, after witnessing the S&P 500 plummet 6.2% from the December 19 announcement of the fourth rate hike of 2018 and a signal of 2-3 additional hikes in 2019 to December 24, Fed Chairman Jerome Powell performed an abrupt 180 degree turn by first assuring investors the Fed is “listening carefully to the markets” and then indicating no further increases in 2019. Investors were cheered this will be a pause that refreshes. Additionally, a long-awaited trade deal with China could be imminent.
Back From the Abyss
The doom and gloom headlines from December turned suddenly ebullient as the S&P 500 posted a total return of 13.65% for the first quarter of 2019, its best performance since the third quarter of 2009, and strongest first quarter since 1998. The Wall Street Journal trumpeted “Stocks Post Best January in 30 Years” to “Stocks Set Torrid Pace to Open Year” and finally “Stocks Surge to Cap Banner First Quarter.”
Warren Buffett said, “Investing is simple, but not easy.” The experience of the fourth calendar quarter of 2018 and first calendar quarter of 2019 is the perfect example. You have to keep your head when all about you are losing theirs. Focus on the signal and ignore the noise. It can be brutally difficult at times, but as investors this is what you signed up for. As Sir Edmund Hillary said, “We must conquer ourselves to succeed.”
Understand stock prices can fluctuate wildly, but the underlying business valuations generally don’t. According to Crandall Pierce, Corrections (drops between 10-20%) and Bear Markets (drops > 20%) occur once every two years, on average, so are part of the normal investment landscape. The frightening drop of -19.78% for the S&P 500 between the peak on September 20, 2018 and December 24, 2018 was the 37th such occurrence since 1945. We expect there will be a 38th, but nobody can tell when it will happen.
If you had taken a 6-month nap from the end of last September through the end of March, you’d find the S&P 500 had declined less than 3%. You would have missed the panic in December and rocket ship rebound in January-February. In other words, you would have witnessed very little fluctuation.
This teaches us an important lesson. If we aren’t comfortable with the amount of fluctuation in our investments, the best thing we can do is stop looking. We may not be able to control the amount of volatility in the markets, but we can control how much we experience. It is simply a function of how often we look.
Summary
We think the key to long-term investment success is buying the right businesses at attractive prices and letting the miracle of compound interest work its magic. We thank you for your business and strive to earn your trust and confidence each day.
Periods ending March 31, 2019
(Total Returns-Dividends Reinvested in Index-Annualized*)
Kirr, Marbach Value Fund(1) | S&P 500 Index(2) | |
| Six-months | -8.41% | -1.72% |
| One-year* | -4.98% | 9.50% |
| Three-years* | 6.83% | 13.51% |
| Five-years* | 2.70% | 10.91% |
| Ten-Years* | 15.20% | 15.92% |
The Fund’s Gross Expense Ratio and Net Expense Ratio were 1.46% and 1.45%, respectively, according to the Prospectus dated January 28, 2019. Contractual fee waivers are in effect until February 29, 2020.
Performance data quoted represents past performance; past performance is no guarantee of future results. The investment return and principal value of an investment will fluctuate so that an investor’s shares, when redeemed, may be worth more or less than their original cost. Current performance of the fund may be lower or higher than the performance quoted. Performance data current to the most recent month-end may be obtained by calling 1-800-870-8039.
1
KIRR, MARBACH PARTNERS
VALUE FUND
The fund imposes a 1.00% redemption fee on shares held less than 30 days. Performance data quoted does not reflect the redemption fee. If reflected, total returns would be reduced.
| (1) | The performance data quoted assumes the reinvestment of capital gains and income distributions. The performance does not reflect the deduction of taxes that a shareholder would pay on Fund distributions or the redemption of Fund shares. | |
| (2) | The S&P 500 Index is an unmanaged, capitalization-weighted index generally representative of the U.S. market for large capitalization stocks. This Index cannot be invested in directly. Because the majority of the Fund’s holdings have market capitalizations of $1-$15 billion, the S&P 500 Index is an imperfect performance benchmark. However, the S&P 500 Index is the most widely utilized performance benchmark for U.S. equities and has more readily accessible data than other benchmarks. Further, it is not the goal of the Fund to replicate the returns of the S&P 500 Index and there are material differences between the holdings of the Fund and the S&P 500 Index. | |
| * | One-year, Two-years, Three-years, Five-years, Ten-years and Since Inception returns are Average Annualized Returns. |
Percent Change in Top Ten Holdings from Book Cost (as of 3/31/2019)
| 1. | Dollar Tree, Inc. | +1400.2% | 6. | Aon Plc | +73.5% | |
| 2. | AutoZone, Inc. | +852.8% | 7. | Innospec, Inc. | +171.0% | |
| 3. | Colliers International Group, Inc. | +74.9% | 8. | Voya Financial, Inc. | +122.9% | |
| 4. | MasTec, Inc. | +172.6% | 9. | Vistra Energy Corp. | +65.4% | |
| 5. | Cognizant Technology Solutions | +669.1% | 10. | EMCOR Group, Inc. | +1400.5% |
Performance quoted represents past performance and is no guarantee of future results.
Fund holdings and sector allocations are subject to change and are not recommendations to buy or sell any security.
Regards,
 |  |
| Mark D. Foster, CFA | Mickey Kim, CFA |
| President | Vice-President, Treasurer and Secretary |
Mutual fund investing involves risk. Principal loss is possible.
Value Fund invests in foreign securities, which involves greater volatility and political, economic and currency risks and differences in accounting methods. Value Fund may also invest in small- and medium-capitalization companies, which tend to have more limited liquidity and greater price volatility than large-capitalization companies.
Past performance is not a guarantee of future results.
Please refer to the Schedule of Investments for complete fund holdings information.
The information provided herein represents the opinion of Value Fund’s investment adviser and is not intended to be a forecast of future events, a guarantee of future results, nor investment advice.
A stock’s market capitalization is calculated by multiplying the price of the stock by the number of shares outstanding.
This material must be preceded or accompanied by a current Prospectus.
Quasar Distributors, LLC is the Distributor for Value Fund.
For further information about Value Fund and/or an account application, please call Matt Kirr at Value Fund at (812) 376-9444 or (800) 808-9444 or write to Value Fund at 621 Washington Street, Columbus, IN 47201.
2
KIRR, MARBACH PARTNERS
VALUE FUND
Value of $10,000 Investment (Unaudited)
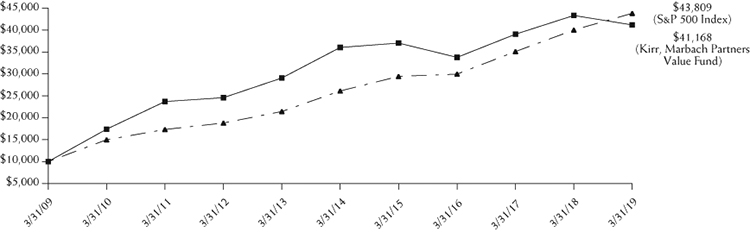
This chart assumes an initial investment of $10,000. Performance reflects fee waivers in effect. In the absence of fee waivers, total return would be reduced. Past performance is not predictive of future performance. Investment return and principal value will fluctuate, so that your shares, when redeemed maybe worth more or less than their original cost. Performance assumes the reinvestment of capital gains and income distributions. The performance does not reflect the deduction of taxes that a shareholder would pay on Fund distributions or the redemption of Fund shares.
| Average Annual Rate of Return (%) | ||||
| One Year Ended | Five Years Ended | Ten Years Ended | Since Inception* to | |
| March 31, 2019 | March 31, 2019 | March 31, 2019 | March 31, 2019 | |
| Kirr Marbach Partners Value Fund | -4.98% | 2.70% | 15.20% | 6.97% |
| S&P 500 Index** | 9.50% | 10.91% | 15.92% | 6.22% |
| * | December 31, 1998 | |
| ** | The Standard & Poor’s 500 Index (S&P 500) is an unmanaged, capitalization-weighted index generally representative of the U.S. market for large capitalization stocks. This Index cannot be invested in directly. |
3
KIRR, MARBACH PARTNERS
VALUE FUND
Expense Example – March 31, 2019 (Unaudited)
As a shareholder of the Fund, you incur two types of costs: (1) transaction costs, which may include redemption fees; and exchange fees; and (2) ongoing costs, including management fees; distribution fees; and other Fund expenses. This Example is intended to help you understand your ongoing costs (in dollars) of investing in the Fund and to compare these costs with the ongoing costs of investing in other mutual funds. The Example is based on an investment of $1,000 invested at the beginning of the period and held for the entire period (October 1, 2018 – March 31, 2019).
Actual Expenses
The first line of the table below provides information about actual account values and actual expenses. Although the Fund charges no sales load or transaction fees, you will be assessed fees for outgoing wire transfers, returned checks and stop payment orders at prevailing rates charged by U.S. Bancorp Fund Services, LLC, the Fund’s transfer agent. If you request that a redemption be made by wire transfer, currently a $15.00 fee is charged by the Fund’s transfer agent. You will be charged a transaction fee equal to 1.00% of the net amount of the redemption if you redeem your shares within 30 days of purchase. IRA accounts will be charged a $15.00 annual maintenance fee. To the extent the Fund invests in shares of other investment companies as part of its investment strategy, you will indirectly bear your proportionate share of any fees and expenses charged by the underlying funds in which the Fund invests in addition to the expenses of the Fund. Actual expenses of the underlying funds are expected to vary among the various underlying funds. These expenses are not included in the example below. The example below includes, but is not limited to, management fees, shareholder servicing fees, fund accounting, custody and transfer agent fees. However, the example below does not include portfolio trading commissions and related expenses, interest expense and other extraordinary expenses as determined under generally accepted accounting principles. You may use the information in this line, together with the amount you invested, to estimate the expenses that you paid over the period. Simply divide your account value by $1,000 (for example, an $8,600 account value divided by $1,000 = 8.6), then multiply the result by the number in the first line under the heading entitled “Expenses Paid During Period” to estimate the expenses you paid on your account during this period.
Hypothetical Example for Comparison Purposes
The second line of the table below provides information about hypothetical account values and hypothetical expenses based on the Fund’s actual expense ratio and an assumed rate of return of 5% per year before expenses, which is not the Fund’s actual return. The hypothetical account values and expenses may not be used to estimate the actual ending account balance or expenses you paid for the period. You may use this information to compare the ongoing costs of investing in the Fund and other funds. To do so, compare this 5% hypothetical example with the 5% hypothetical examples that appear in the shareholder reports of the other funds.
Please note that the expenses shown in the table are meant to highlight your ongoing costs only and do not reflect any transactional costs, such as redemption fees, or exchange fees. Therefore, the second line of the table is useful in comparing ongoing costs only, and will not help you determine the relative total costs of owning different funds. In addition, if these transactional costs were included, your costs would have been higher.
| Beginning | Ending | Expense Paid | |
| Account Value | Account Value | During Period | |
| 10/1/18 | 3/31/19 | 10/1/18 – 3/31/19(1) | |
| Actual | $1,000.00 | $ 915.90 | $6.93 |
| Hypothetical (5% return before expenses) | 1,000.00 | 1,017.70 | 7.29 |
| (1) | Expenses are equal to the Fund’s annualized expense ratio after reimbursement of 1.45% multiplied by the average account value over the period, multiplied by 182/365 to reflect the one-half year period. The annualized expense ratio prior to reimbursement was 1.54%. |
4
KIRR, MARBACH PARTNERS
VALUE FUND
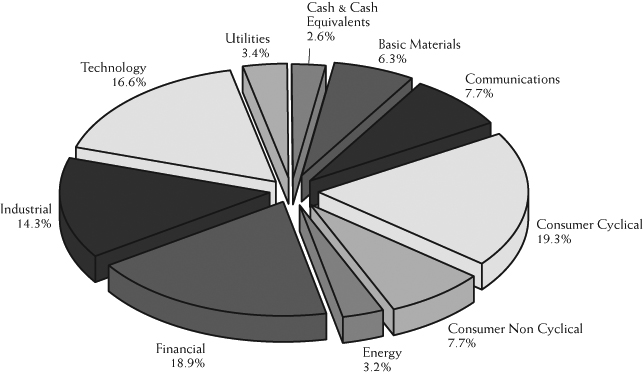
Allocation of Portfolio Net Assets (Unaudited)
March 31, 2019
Top Ten Equity Holdings (Unaudited)
as of March 31, 2019
(% of net assets)
| Dollar Tree, Inc. | 3.8% |
| AutoZone, Inc. | 3.8% |
| Colliers International Group, Inc. | 3.7% |
| MasTec, Inc. | 3.7% |
| Cognizant Technology Solutions Corp. – Class A | 3.6% |
| Aon plc | 3.6% |
| Innospec, Inc. | 3.5% |
| Voya Financial, Inc. | 3.5% |
| Vistra Energy Corp. | 3.4% |
| EMCOR Group, Inc. | 3.4% |
5
KIRR, MARBACH PARTNERS
VALUE FUND
Schedule of Investments
March 31, 2019 (Unaudited)
| Number | |||||||
| of Shares | Value | ||||||
| COMMON STOCKS – 97.4% | |||||||
| Basic Materials – 6.3% | |||||||
| 29,410 | Innospec, Inc. | $ | 2,451,324 | ||||
| 23,837 | LyondellBasell | ||||||
| Industries NV – Class A | 2,004,215 | ||||||
| 4,455,539 | |||||||
| Communications – 7.7% | |||||||
| 13,095 | Alliance Data Systems Corp. | 2,291,363 | |||||
| 16,200 | Liberty SiriusXM Group – Class A* | 618,516 | |||||
| 32,590 | Liberty SiriusXM Group – Class C* | 1,246,242 | |||||
| 212,545 | Nokia Corp. – ADR | 1,215,757 | |||||
| 5,371,878 | |||||||
| Consumer Cyclical – 19.3% | |||||||
| 2,600 | AutoZone, Inc.* | 2,662,712 | |||||
| 28,180 | Dave & Buster’s Entertainment, Inc. | 1,405,337 | |||||
| 25,560 | Dollar Tree, Inc.* | 2,684,822 | |||||
| 98,550 | Extended Stay America, Inc. | 1,768,972 | |||||
| 27,225 | KAR Auction Services, Inc. | 1,396,915 | |||||
| 12,277 | Marriott Vacations Worldwide Corp. | 1,147,900 | |||||
| 44,510 | Motorcar Parts of America, Inc.* | 839,904 | |||||
| 53,169 | Spartan Motors, Inc. | 469,482 | |||||
| 17,775 | Visteon Corp.* | 1,197,146 | |||||
| 13,573,190 | |||||||
| Consumer Non Cyclical – 7.7% | |||||||
| 5,360 | Allergan plc | 784,758 | |||||
| 18,560 | Brink’s Co. | 1,399,610 | |||||
| 30,880 | Dentsply Sirona, Inc. | 1,531,339 | |||||
| 13,110 | Zimmer Biomet Holdings, Inc. | 1,674,147 | |||||
| 5,389,854 | |||||||
| Energy – 3.2% | |||||||
| 24,615 | KLX Energy Services | ||||||
| Holdings, Inc.* | 618,821 | ||||||
| 27,199 | Marathon Petroleum Corp. | 1,627,860 | |||||
| 2,246,681 | |||||||
| Financial – 18.9% | |||||||
| 38,725 | American International Group, Inc. | 1,667,498 | |||||
| 14,875 | Aon plc | 2,539,163 | |||||
| 39,115 | Colliers International Group, Inc. | 2,611,317 | |||||
| 42,175 | Heritage Insurance Holdings, Inc. | 615,755 | |||||
| 1,916 | Markel Corp.* | 1,908,796 | |||||
| 46,300 | Synchrony Financial | 1,476,970 | |||||
| 48,825 | Voya Financial, Inc. | 2,439,297 | |||||
| 13,258,796 | |||||||
| Industrials – 14.3% | |||||||
| 25,320 | Arcosa, Inc. | 773,526 | |||||
| 10,188 | Canadian Pacific Railway Ltd. | 2,099,034 | |||||
| 20,195 | Deluxe Corp. | 882,925 | |||||
| 32,455 | EMCOR Group, Inc. | 2,371,811 | |||||
| 53,700 | MasTec, Inc.* | 2,582,970 | |||||
| 24,425 | XPO Logistics, Inc.* | 1,312,600 | |||||
| 10,022,866 | |||||||
| Technology – 16.6% | |||||||
| 5,180 | Broadcom, Inc. | 1,557,678 | |||||
| 35,170 | Cognizant Technology | ||||||
| Solutions Corp. – Class A | 2,548,066 | ||||||
| 113,005 | Conduent, Inc.* | 1,562,859 | |||||
| 20,980 | DXC Technology Co. | 1,349,224 | |||||
| 47,119 | NCR Corp.* | 1,285,878 | |||||
| 97,215 | Nuance Communications, Inc.* | 1,645,850 | |||||
| 26,275 | SS&C Technologies Holdings, Inc. | 1,673,454 | |||||
| 11,623,009 | |||||||
| Utilities – 3.4% | |||||||
| 91,490 | Vistra Energy Corp. | 2,381,485 | |||||
| TOTAL COMMON STOCKS | |||||||
| (Cost $45,045,062) | 68,323,298 | ||||||
| SHORT-TERM INVESTMENT – 0.6% | |||||||
| 405,801 | First American Government | ||||||
| Obligations Fund – | |||||||
| Class X, 2.36%** | |||||||
| (Cost $405,801) | 405,801 | ||||||
| Total Investments | |||||||
| (Cost $45,450,863) – 98.0% | 68,729,099 | ||||||
| Other Assets and | |||||||
| Liabilities, Net 2.0% | 1,383,289 | ||||||
| TOTAL NET ASSETS – 100.0% | $ | 70,112,388 | |||||
| * | Non-income producing security. | |
| ** | Rate in effect as of March 31, 2019. | |
| ADR – American Depositary Receipt |
See Notes to the Financial Statements
6
KIRR, MARBACH PARTNERS
VALUE FUND
Statement of Assets and Liabilities
March 31, 2019 (Unaudited)
| ASSETS: | ||||
| Investments, at current value | ||||
| (cost $45,450,863) | $ | 68,729,099 | ||
| Receivable for investment securities sold | 2,403,881 | |||
| Dividends receivable | 30,333 | |||
| Prepaid expenses | 18,441 | |||
| Receivable for Fund shares sold | 4,500 | |||
| Interest receivable | 494 | |||
| Total Assets | 71,186,748 | |||
| LIABILITIES: | ||||
| Payable to Adviser | 54,964 | |||
| Payable for investment securities purchased | 980,086 | |||
| Accrued expenses | 24,715 | |||
| Accrued distribution fees | 14,595 | |||
| Total Liabilities | 1,074,360 | |||
| NET ASSETS | $ | 70,112,388 | ||
| NET ASSETS CONSIST OF: | ||||
| Capital Stock | $ | 43,689,895 | ||
| Total Distributable Earnings | 26,422,493 | |||
| Total Net Assets | $ | 70,112,388 | ||
| Shares outstanding (500,000,000 | ||||
| shares of $0.01 par value authorized) | 3,286,239 | |||
Net asset value and offering price per share(1) | $ | 21.34 | ||
| (1) | A redemption fee is assessed against shares redeemed within 30 days of purchase. |
Statement of Operations
Six Months Ended March 31, 2019
(Unaudited)
| INVESTMENT INCOME: | ||||
| Dividend income | ||||
| (net of withholding of $1,781) | $ | 404,828 | ||
| Interest income | 13,138 | |||
| Total Investment Income | 417,966 | |||
| EXPENSES: | ||||
| Investment Adviser fees | 344,980 | |||
| Legal fees | 44,163 | |||
| Distribution fees | 32,369 | |||
| Administration fees | 24,344 | |||
| Transfer agent fees | 20,287 | |||
| Federal & state registration fees | 14,884 | |||
| Fund accounting fees | 14,094 | |||
| Audit fees | 11,102 | |||
| Custody fees | 8,287 | |||
| Postage & printing fees | 6,933 | |||
| Directors fees | 6,006 | |||
| Other | 4,833 | |||
| Total expenses before reimbursement | 532,282 | |||
| Less: Reimbursement from Investment Adviser | (32,061 | ) | ||
| Net Expenses | 500,221 | |||
| NET INVESTMENT LOSS | (82,255 | ) | ||
| REALIZED AND UNREALIZED | ||||
| GAIN (LOSS) ON INVESTMENTS: | ||||
| Net realized gain on investments | 3,557,415 | |||
| Net change in unrealized | ||||
| appreciation/depreciation on investments | (10,331,653 | ) | ||
| Net realized and unrealized | ||||
| loss on investments | (6,774,238 | ) | ||
| NET DECREASE IN NET ASSETS | ||||
| RESULTING FROM OPERATIONS | $ | (6,856,493 | ) | |
See Notes to the Financial Statements
7
KIRR, MARBACH PARTNERS
VALUE FUND
Statements of Changes in Net Assets
| Six Months Ended | ||||||||
| March 31, 2019 | Year Ended | |||||||
(Unaudited) | September 30, 2018 | |||||||
| OPERATIONS: | ||||||||
| Net investment loss | $ | (82,255 | ) | $ | (286,634 | ) | ||
| Net realized gain on investments | 3,557,415 | 5,286,558 | ||||||
| Net change in unrealized appreciation/depreciation on investments | (10,331,653 | ) | 1,683,169 | |||||
| Net increase (decrease) in net assets resulting from operations | (6,856,493 | ) | 6,683,093 | |||||
| CAPITAL SHARE TRANSACTIONS: | ||||||||
| Proceeds from shares sold | 1,306,194 | 3,081,225 | ||||||
| Proceeds from reinvestment of distributions | 5,114,173 | 5,040,518 | ||||||
| Payments for shares redeemed | (3,979,271 | ) | (6,149,886 | ) | ||||
| Redemption fees | — | — | ||||||
| Net increase in net assets resulting from capital share transactions | 2,441,096 | 1,971,857 | ||||||
| DISTRIBUTIONS TO SHAREHOLDERS | (5,290,759 | ) | (5,212,562 | ) | ||||
| TOTAL INCREASE (DECREASE) IN NET ASSETS | (9,706,156 | ) | 3,442,388 | |||||
| NET ASSETS: | ||||||||
| Beginning of period | 79,818,544 | 76,376,156 | ||||||
| End of period | $ | 70,112,388 | $ | 79,818,544 | ||||
| CHANGES IN SHARES OUTSTANDING: | ||||||||
| Shares sold | 63,059 | 121,368 | ||||||
| Shares issued to holders in reinvestment of dividends | 279,769 | 200,897 | ||||||
| Shares redeemed | (187,463 | ) | (242,682 | ) | ||||
| Net increase | 155,365 | 79,583 | ||||||
See Notes to the Financial Statements
8
KIRR, MARBACH PARTNERS
VALUE FUND
Financial Highlights
For a Fund share outstanding throughout the period.
March 31, 2019(1) | Year Ended September 30, | |||||||||||||||||||||||
(Unaudited) | 2018 | 2017 | 2016 | 2015 | 2014 | |||||||||||||||||||
| PER SHARE DATA: | ||||||||||||||||||||||||
| Net asset value, beginning of period | $ | 25.49 | $ | 25.03 | $ | 22.65 | $ | 21.38 | $ | 22.33 | $ | 20.88 | ||||||||||||
| Investment operations: | ||||||||||||||||||||||||
| Net investment income (loss) | (0.04 | ) | (0.10 | ) | (0.08 | ) | 0.16 | (0.16 | ) | (0.19 | ) | |||||||||||||
| Net realized and unrealized | ||||||||||||||||||||||||
| gain (loss) on investments | (2.39 | ) | 2.27 | 3.75 | 1.18 | (0.79 | ) | 1.64 | ||||||||||||||||
| Total from investment operations | (2.43 | ) | 2.17 | 3.67 | 1.34 | (0.95 | ) | 1.45 | ||||||||||||||||
| Less distributions: | ||||||||||||||||||||||||
| Dividends from net investment income | — | — | — | — | — | — | ||||||||||||||||||
| Dividends from net capital gains | (1.72 | ) | (1.71 | ) | (1.29 | ) | (0.07 | ) | — | — | ||||||||||||||
| Total distributions | (1.72 | ) | (1.71 | ) | (1.29 | ) | (0.07 | ) | — | — | ||||||||||||||
| Paid in capital from redemption fees | — | — | — | (2) | — | (2) | — | (2) | — | (2) | ||||||||||||||
| Net asset value, end of period | $ | 21.34 | $ | 25.49 | $ | 25.03 | $ | 22.65 | $ | 21.38 | $ | 22.33 | ||||||||||||
| TOTAL RETURN | -8.41 | % | 8.80 | % | 16.72 | % | 6.29 | % | -4.25 | % | 6.94 | % | ||||||||||||
| SUPPLEMENTAL DATA AND RATIOS: | ||||||||||||||||||||||||
| Net assets, end of period (in millions) | $ | 70.1 | $ | 79.8 | $ | 76.4 | $ | 70.2 | $ | 70.0 | $ | 73.7 | ||||||||||||
| Ratio of expenses to average net assets: | ||||||||||||||||||||||||
| Before expense reimbursement/recoupment | 1.54 | % | 1.46 | % | 1.47 | % | 1.49 | % | 1.46 | % | 1.45 | % | ||||||||||||
After expense reimbursement/recoupment | 1.45 | % | 1.45 | % | 1.45 | % | 1.45 | % | 1.45 | % | 1.45 | % | ||||||||||||
| Ratio of net investment income (loss) | ||||||||||||||||||||||||
| to average net assets: | ||||||||||||||||||||||||
Before expense reimbursement/recoupment | (0.33 | )% | (0.37 | )% | (0.35 | )% | 0.70 | % | (0.69 | )% | (0.85 | )% | ||||||||||||
After expense reimbursement/recoupment | (0.24 | )% | (0.36 | )% | (0.33 | )% | 0.74 | % | (0.68 | )% | (0.85 | )% | ||||||||||||
| Portfolio turnover rate | 16 | % | 14 | % | 16 | % | 23 | % | 21 | % | 11 | % | ||||||||||||
| (1) | All ratios for the six month period ended March 31, 2019 have been annualized, except total return and portfolio turnover. |
| (2) | Less than $0.01 per share. |
See Notes to the Financial Statements
9
KIRR, MARBACH PARTNERS
VALUE FUND
Notes to the Financial Statements
March 31, 2019 (Unaudited)
1. ORGANIZATION AND SIGNIFICANT ACCOUNTING POLICIES
Kirr, Marbach Partners Funds, Inc. (the “Corporation”) was organized as a Maryland corporation on September 23, 1998 and is registered under the Investment Company Act of 1940, as amended (the “1940 Act”), as an open-end diversified management investment company issuing its shares in series, each series representing a distinct portfolio with its own investment objective and policies. The Fund is an investment company and accordingly follows the investment company accounting and reporting guidance of the Financial Accounting Standards Board (FASB) Accounting Standards Codification Topic 946 “Financial Services-Investment Companies.” The one series presently authorized is Kirr, Marbach Partners Value Fund (the “Fund”). The investment objective of the Fund is to seek long-term capital growth. The Fund commenced operations on December 31, 1998.
The following is a summary of significant accounting policies consistently followed by the Fund. These policies are in conformity with generally accepted accounting principles in the United States of America (“GAAP”).
| a) | Investment Valuation – Securities listed on the Nasdaq National Market are valued at the Nasdaq Official Closing Price (“NOCP”). Other securities traded on a national securities exchange (including options on indices so traded) are valued at the last sales price on the exchange where the security is primarily traded. Exchange-traded securities for which there were no transactions and Nasdaq-traded securities for which there is no NOCP are valued at the mean of the bid and asked prices. Securities for which market quotations are not readily available are valued at fair value as determined in good faith under the supervision of the Board of Directors. Foreign securities have been issued by foreign private issuers registered on United States exchanges in accordance with Section 12 of the Securities Exchange Act of 1934. Debt securities, including short-term debt instruments having maturities less than 60 days, are valued at the mean between the bid and asked prices as reported by an approved pricing service. | |
| The Fund has performed an analysis of all existing investments to determine the significance and character of all inputs to their fair value determination. Various inputs are used in determining the value of each of the Fund’s investments. These inputs are summarized in the following three broad categories: |
| Level 1 – | Unadjusted quoted prices in active markets for identical assets or liabilities that the company has the ability to access. | ||
| Level 2 – | Observable inputs other than quoted prices included in Level 1 that are observable for the asset or liability either directly or indirectly. These inputs may include quoted prices for the identical instruments on an inactive market, prices for similar instruments, interest rates, prepayment speeds, credit risk, yield curves, default rates, and similar data. | ||
| Level 3 – | Unobservable inputs for the asset or liability to the extent that relevant observable inputs are not available, representing the company’s own assumptions about the assumptions that a market participant would use in valuing the asset or liability, and that would be based on the best information available. |
| The availability of observable inputs can vary from security to security and is affected by a wide variety of factors, including, for example, the type of security, whether the security is new and not yet established in the marketplace, the liquidity of markets, and other characteristics particular to the security. To the extent that valuation is based on models or inputs that are less observable or unobservable in the market, the determination of fair value requires more judgment. Accordingly, the degree of judgment exercised in determining fair value is greatest for instruments categorized in Level 3. |
10
KIRR, MARBACH PARTNERS
VALUE FUND
Notes to the Financial Statements (Continued)
March 31, 2019 (Unaudited)
| The inputs used to measure fair value may fall into different levels of the fair value hierarchy. In such cases, for disclosure purposes, the level in the fair value hierarchy within which the fair value measurement falls in its entirety, is determined based on the lowest level input that is significant to the fair value measurement in its entirety. | ||
| The inputs or methodology used for valuing securities are not an indication of the risk associated with investing in those securities. The following is a summary of the inputs used to value the Fund’s investments as of March 31, 2019: |
| Level 1 | Level 2 | Level 3 | Total | ||||||||||||||
| Common Stocks | $ | 68,323,298 | $ | — | $ | — | $ | 68,323,298 | |||||||||
| Short-Term Investment | 405,801 | — | — | 405,801 | |||||||||||||
| Total Investments | $ | 68,729,099 | $ | — | $ | — | $ | 68,729,099 | |||||||||
| Refer to the Schedule of Investments for industry classifications. | ||
| b) | Federal Income Taxes – A provision, for federal income taxes or excise taxes, has not been made since the Fund has elected to be taxed as a “regulated investment company” and intends to distribute substantially all taxable income to its shareholders and otherwise comply with the provisions of the Internal Revenue Code applicable to regulated investment companies. There is no tax liability resulting from unrecognized tax benefits relating to uncertain income tax positions taken or expected to be taken on the tax return for the fiscal year ended September 30, 2018, or for any other tax years which are open for exam. As of September 30, 2018, open tax years include the tax years ended September 30, 2015 through 2018. The Fund is also not aware of any tax positions for which it is reasonably possible that the total amounts of unrecognized tax benefits will significantly change in the next twelve months. The Fund recognizes interest and penalties, if any, related to unrecognized tax benefits as income tax expense in the Statement of Operations. During the period ended March 31, 2019, the Fund did not incur any interest or penalties. | |
| c) | Income and Expenses – The Fund is charged for those expenses that are directly attributable to the Fund, such as advisory, administration and certain shareholder service fees. | |
| d) | Distributions to Shareholders – Dividends from net investment income and distributions of net realized capital gains, if any, will be declared and paid at least annually. The character of distributions made during the period from net investment income or net realized gains may differ from the characterization for federal income tax purposes due to differences in the recognition of income, expense and gain items for financial statement and tax purposes. All short term capital gains are included in ordinary income for tax purposes. | |
| e) | Use of Estimates – The preparation of financial statements in conformity with GAAP requires management to make estimates and assumptions that affect the reported amounts of assets and liabilities and disclosure of contingent assets and liabilities at the date of the financial statements and the reported amounts of revenues and expenses during the reporting period. Actual results could differ from those estimates. | |
| f) | Repurchase Agreements – The Fund may enter into repurchase agreements with certain banks or non-bank dealers. The Adviser will monitor, on an ongoing basis, the value of the underlying securities to ensure that the value always equals or exceeds the repurchase price plus accrued interest. |
11
KIRR, MARBACH PARTNERS
VALUE FUND
Notes to the Financial Statements (Continued)
March 31, 2019 (Unaudited)
| g) | Security Transactions and Investment Income – The Fund follows industry practice and records security transactions on the trade date. Realized gains and losses on sales of securities are calculated on the basis of identified cost. Dividend income is recorded on the ex-dividend date and interest income is recorded on an accrual basis. Withholding taxes on foreign dividends have been provided for in accordance with the Fund’s understanding of the applicable country’s tax rules and regulations. Discounts and premiums on securities purchased are amortized over the expected life of the respective securities. | |
| The Fund distributes all net investment income, if any, and net realized capital gains, if any, annually. Distributions to shareholders are recorded on the ex-dividend date. The treatment for financial reporting purposes of distributions made to shareholders during the year from net investment income or net realized capital gains may differ from their ultimate treatment for federal income tax purposes. These differences are caused primarily by differences in the timing of the recognition of certain components of income, expense or realized capital gain for federal income tax purposes. Where such differences are permanent in nature, GAAP requires that they be reclassified in the components of the net assets based on their ultimate characterization for federal income tax purposes. Any such reclassifications will have no effect on net assets, results of operations or net asset values per share of the Fund. | ||
| h) | Subsequent Events – Management has evaluated Fund related events and transactions that occurred subsequent to March 31, 2019 through the date of issuance of the Fund’s financial statements. There were no events or transactions that occurred during this period that materially impacted the amounts or disclosures in the Fund’s financial statements. |
2. INVESTMENT TRANSACTIONS
The aggregate purchases and sales of securities, excluding short-term investments, by the Fund for the period ended March 31, 2019, were as follows:
| Purchases | Sales | ||||||||
| U.S. Government | $ | — | $ | — | |||||
| Other | $ | 10,852,853 | $ | 13,214,026 | |||||
At September 30, 2018, the Fund’s most recent fiscal year end, the components of distributable earnings on a tax basis were as follows:
| Cost of investments | $ | 46,187,189 | |||
| Gross unrealized appreciation | $ | 35,363,559 | |||
| Gross unrealized depreciation | (1,653,580 | ) | |||
| Net unrealized appreciation | $ | 33,709,979 | |||
| Undistributed ordinary income | $ | 273,110 | |||
| Undistributed long-term capital gain | 4,586,656 | ||||
| Total distributable earnings | $ | 4,859,766 | |||
| Other accumulated losses | $ | — | |||
| Total distributable earnings | $ | 38,569,745 |
12
KIRR, MARBACH PARTNERS
VALUE FUND
Notes to the Financial Statements (Continued)
March 31, 2019 (Unaudited)
As of September 30, 2018, the Fund’s most recently completed fiscal year end, the Fund did not have any capital loss carryovers. A regulated investment company may elect for any taxable year to treat any portion of any qualified late year loss as arising on the first day of the next taxable year. Qualified late year losses are certain capital, and ordinary losses which occur during the portion of the Fund’s taxable year subsequent to October 31. For the taxable year ended September 30, 2018, the Fund did not defer any qualified late year losses.
The tax character of distributions paid during the period ended March 31, 2019 were as follows:
| Ordinary Income* | Long Term Capital Gains** | Total |
| $273,129 | $5,017,630 | $5,290,759 |
The tax character of distributions paid during the year ended September 30, 2018 were as follows:
| Long Term Capital Gains** | ||
| $5,212,562 |
| * | For Federal income tax purposes, distributions of short-term capital gains are treated as ordinary income. |
| ** | The Fund also designates as distributions of long-term gains, to the extent necessary to fully distribute such capital gains, earnings and profits distributed to shareholders on the redemption of shares. |
3. AGREEMENTS
The Fund has entered into an Investment Advisory Agreement with Kirr, Marbach & Company, LLC (the “Investment Adviser”). Pursuant to its advisory agreement with the Fund, the Investment Adviser is entitled to receive a fee, calculated daily and payable monthly, at the annual rate of 1.00% as applied to the Fund’s daily net assets.
The Investment Adviser has contractually agreed to waive its management fee and/or reimburse the Fund’s other expenses to the extent necessary to ensure that the Fund’s total annual operating expenses (excluding acquired fund fees and expenses, interest, taxes, brokerage commissions and extraordinary expenses) do not exceed 1.45% of its average daily net assets until February 29, 2020. The Investment Adviser may decide to continue the agreement, or revise the total annual operating expense limitations after February 29, 2020. Any waiver or reimbursement is subject to later adjustment to allow the Investment Adviser to recoup amounts waived or reimbursed to the extent actual fees and expenses for a period are less than the expense limitation cap of 1.45%, provided, however, that the Investment Adviser shall only be entitled to recoup such amounts for a period of thirty-six months following the date on which such fee waiver or expense reimbursement was made. Waived/reimbursed fees and expenses subject to potential recovery by month of expiration are as follows:
| Year of Expiration | Amount | ||||
| April 2019 – September 2019 | $ | 16,535 | |||
| October 2019 – September 2020 | 15,117 | ||||
| October 2020 – September 2021 | 11,773 | ||||
| October 2021 – March 2022 | 32,061 | ||||
| $ | 75,486 | ||||
As of March 31, 2019, it was possible, but not probable, those amounts would be recovered by the Investment Adviser. At the end of each fiscal year in the future, the Fund will continue to assess the potential recovery of waived/reimbursed fees and expenses for financial reporting purposes.
13
KIRR, MARBACH PARTNERS
VALUE FUND
Notes to the Financial Statements (Continued)
March 31, 2019 (Unaudited)
Quasar Distributors, LLC, (the “Distributor”) serves as principal underwriter of the shares of the Fund pursuant to a Distribution Agreement between the Distributor and the Corporation. The Fund’s shares are sold on a no-load basis and, therefore, the Distributor receives no sales commission or sales load for providing services to the Fund. The Corporation has adopted a plan pursuant to Rule 12b-1 under the 1940 Act (the “12b-1 Plan”), which authorizes the Corporation to pay the Distributor and certain financial intermediaries who assist in distributing the Fund shares or who provided shareholder services to Fund shareholders a distribution and shareholder servicing fee of up to 0.25% of the Fund’s average daily net assets (computed on an annual basis). All or a portion of the fee may be used by the Fund or the Distributor to pay its distribution fee and costs of printing reports and prospectuses for potential investors and the costs of other distribution and shareholder servicing expenses. During the period ended March 31, 2019, the Fund incurred expenses of $32,369 pursuant to the 12b-1 Plan.
U.S Bancorp Fund Services, LLC, doing business as U.S. Bank Global Fund Services (the “Administrator”), serves as transfer agent, administrator and accounting services agent for the Fund. U.S. Bank, N.A. serves as custodian for the Fund.
The Fund imposes a 1.00% redemption fee on shares held 30 days or less. For the period ended March 31, 2019 and the year ended September 30, 2018, the Fund did not collect any redemption fees.
14
KIRR, MARBACH PARTNERS
VALUE FUND
Additional Information
March 31, 2019 (Unaudited)
BOARD APPROVAL OF INVESTMENT ADVISORY AGREEMENT
On November 14, 2018, at an in-person meeting of the Board of Directors of the Kirr, Marbach Partners Fund, Inc. (the “Corporation”), the directors, including a majority of the disinterested directors, approved the continuation of the investment advisory agreement dated June 10, 2005 (the “Advisory Agreement”) between the Corporation and Kirr, Marbach & Company, LLC (the “Adviser”). It was noted that, as described in the Adviser’s memorandum, the Adviser has significant experience providing investment advice and is qualified to provide investment advisory services to the Fund. In addition, it was noted that the Adviser promoted a culture of compliance. The directors noted that the Fund’s short and mid-term underperformance has lagged its benchmarks. The directors considered the Adviser’s explanation for the Fund’s short and mid-term underperformance and were satisfied with the Adviser’s explanations relating to these periods. The directors also considered the Fund’s longer-term performance, particularly since inception numbers. The directors also noted that a significant percentage of the Fund is owned by Adviser insiders and therefore the directors feel that the Adviser’s interests are aligned with other Fund shareholders. The directors considered information relating to the Fund’s fees, costs and expense ratios and compared such fees, costs and expense ratios to competitive industry fee structures and expense ratios. Specifically, the directors reviewed charts prepared by the administrator based on data compiled by a nationally recognized third party comparative data provider. In connection with this, the directors also considered the control of the Fund’s operating expenses through the expense cap agreement, and noted that the current expense cap agreement maintains an overall reasonable total expense level as evidenced by the comparative data presented at the meeting. In addition, the Board noted that the Adviser is providing substantially similar investment advisory services to the Fund and its other separate account clients and, with the current expense cap arrangement in place, providing such services to the Fund at substantially similar rates to those charged to the Adviser’s other clients. The directors considered whether the Adviser would receive any fall-out benefits through its relationship with the Fund, and it was noted that because none of the other service providers to the Fund are affiliated with the Adviser, there are no identifiable material fall-out benefits accruing to the Adviser. The directors considered the Adviser’s cost of providing services to the Fund and the profitability of its relationship to the Fund. It was noted that the Adviser’s profitability was in line with its profitability for providing investment advice to its separate account clients given the current expense cap agreement, and the directors noted that the Adviser’s profit in connection with its services to the Fund appeared reasonable. The directors considered whether economies of scale were being realized that could justify reduced expenses for the Fund. It was noted that current asset levels slightly increased from the prior year. During the deliberations, the disinterested directors did not identify any single consideration or particular piece of information that was all important or controlling in determining whether to approve the Advisory Agreement. The disinterested directors evaluated all information presented to them and determined that the compensation paid to the Adviser under the Advisory Agreement was fair and reasonable in light of the services to be performed.
15
KIRR, MARBACH PARTNERS
VALUE FUND
Additional Information (Continued)
March 31, 2019 (Unaudited)
AVAILABILITY OF FUND PORTFOLIO INFORMATION
The Fund files its complete schedule of portfolio holdings with the SEC for the first and third quarters of each fiscal year on Form N-Q, which is available on the SEC’s website at www.sec.gov. The Fund’s Form N-Q may be reviewed and copied at the SEC’s Public Reference Room in Washington D.C. For information on the Public Reference Room call 1-800-SEC-0330.
AVAILABILITY OF PROXY VOTING INFORMATION
Both a description of the Fund’s Proxy Voting Policies and Procedures and information about the Fund’s proxy voting record will be available (1) without charge, upon request, by calling 1-800-870-8039, and (2) on the SEC’s website at www.sec.gov.
16
Directors
Mark D. Foster, CFA
Mickey Kim, CFA
Jeffrey N. Brown
Mark E. Chesnut
John Elwood
Principal Officers
Mark D. Foster, CFA, President
Mickey Kim, CFA, Vice President, Treasurer and Secretary
Investment Adviser
Kirr, Marbach & Company, LLC
621 Washington Street
Columbus, IN 47201
Distributor
Quasar Distributors, LLC
777 East Wisconsin Avenue
Milwaukee, WI 53202
Custodian
U.S. Bank, N.A.
1555 North River Center Drive
Milwaukee, WI 53212
Administrator,
Transfer Agent and
Dividend – Disbursing Agent
U.S. Bancorp Fund Services, LLC
615 East Michigan Street
Milwaukee, WI 53202
Independent Registered
Public Accounting Firm
Tait, Weller & Baker LLP
Two Liberty Place
50 South 16th Street, Suite 2900
Philadelphia, PA 19102
Legal Counsel
Kirkland & Ellis LLP
300 North LaSalle
Chicago, IL 60654
This report should be accompanied or preceded by a prospectus.
The Fund’s Statement of Additional Information contains additional information about the
Fund’s directors and is available without charge upon request by calling 1-800-808-9444.
The Fund’s Proxy Voting Policies and Procedures are available without charge upon request by calling 1-800-808-9444. A description of the
Fund’s proxy voting policies and procedures is available on the Fund’s website, www.kmpartnersfunds.com, or on the SEC’s website, at
www.sec.gov. Information regarding how the Fund voted proxies relating to portfolio securities during the twelve months ended June 30,
is available without charge upon request by calling 1-800-808-9444 or on the SEC’s website, at www.sec.gov.
| Semi-Annual Report |
| March 31, 2019 |
Item 2. Code of Ethics.
Not applicable for semi-annual reports.
Item 3. Audit Committee Financial Expert.
Not applicable for semi-annual reports.
Item 4. Principal Accountant Fees and Services.
Not applicable for semi-annual reports.
Item 5. Audit Committee of Listed Registrants.
Not applicable to registrants who are not listed issuers (as defined in Rule 10A-3 under the Securities Exchange Act of 1934).
Item 6. Schedule of Investments.
(a) Schedule of Investments is included as part of the report to shareholders filed under Item 1 of this Form.
(b) Not applicable
Item 7. Disclosure of Proxy Voting Policies and Procedures for Closed-End Management Investment Companies.
Not applicable to open-end investment companies.
Item 8. Portfolio Managers of Closed-End Management Investment Companies.
Not applicable to open-end investment companies.
Item 9. Purchases of Equity Securities by Closed‑End Management Investment Company and Affiliated Purchases.
Not applicable to open-end investment companies.
Item 10. Submission of Matters to a Vote of Security Holders.
There have been no material changes to the procedures by which shareholders may recommend nominees to the registrant’s board of trustees.
Item 11. Controls and Procedures.
| (a) | The Registrant’s President and Treasurer have reviewed the Registrant's disclosure controls and procedures (as defined in Rule 30a-3(c) under the Investment Company Act of 1940 (the “Act”)) as of a date within 90 days of the filing of this report, as required by Rule 30a-3(b) under the Act and Rules 13a-15(b) or 15d‑15(b) under the Securities Exchange Act of 1934. Based on their review, such officers have concluded that the disclosure controls and procedures are effective in ensuring that information required to be disclosed in this report is appropriately recorded, processed, summarized and reported and made known to them by others within the Registrant and by the Registrant’s service provider. |
| (b) | There were no significant changes in the Registrant's internal control over financial reporting (as defined in Rule 30a-3(d) under the Act) that occurred during the second fiscal quarter of the period covered by this report that has materially affected, or is reasonably likely to materially affect, the Registrant's internal control over financial reporting. |
Item 12. Disclosure of Securities Lending Activities for Closed-End Management Investment Companies
Not applicable to open-end investment companies.
Item 13. Exhibits.
| (a) | (1) Any code of ethics or amendment thereto, that is subject of the disclosure required by Item 2, to the extent that the registrant intends to satisfy Item 2 requirements through filing an exhibit. Not applicable for semi-annual reports. |
(2) Certifications pursuant to Section 302 of the Sarbanes-Oxley Act of 2002. Filed herewith.
(3) Any written solicitation to purchase securities under Rule 23c‑1 under the Act sent or given during the period covered by the report by or on behalf of the registrant to 10 or more persons. Not applicable to open-end investment companies.
(4) Change in the registrant’s independent public accountant. There was no change in the registrant’s independent public accountant for the period covered by this report.
| (b) | Certification pursuant to Section 906 of the Sarbanes‑Oxley Act of 2002. Furnished herewith. |
SIGNATURES
Pursuant to the requirements of the Securities Exchange Act of 1934 and the Investment Company Act of 1940, the registrant has duly caused this report to be signed on its behalf by the undersigned, thereunto duly authorized.
(Registrant) Kirr, Marbach Partners Funds, Inc.
By (Signature and Title)* /s/Mr. Mark Foster
Mr. Mark Foster, President
Date June 4, 2019
Pursuant to the requirements of the Securities Exchange Act of 1934 and the Investment Company Act of 1940, this report has been signed below by the following persons on behalf of the registrant and in the capacities and on the dates indicated.
By (Signature and Title)* /s/Mr. Mark Foster
Mr. Mark Foster, President
Date June 4, 2019
By (Signature and Title)* /s/Mr. Mickey Kim
Mr. Mickey Kim, Treasurer
Date June 4, 2019
* Print the name and title of each signing officer under his or her signature.