UNITED STATES
SECURITIES AND EXCHANGE COMMISSION
Washington, D.C. 20549
SECURITIES AND EXCHANGE COMMISSION
Washington, D.C. 20549
FORM N-CSR
CERTIFIED SHAREHOLDER REPORT OF REGISTERED
MANAGEMENT INVESTMENT COMPANIES
Investment Company Act file number 811-09067
Kirr, Marbach Partners Funds, Inc.
(Exact name of registrant as specified in charter)
(Exact name of registrant as specified in charter)
621 Washington Street, Columbus, IN 47201
(Address of principal executive offices) (Zip code)
(Address of principal executive offices) (Zip code)
Kirr, Marbach & Company, LLC, 621 Washington Street, Columbus, IN 47201
(Name and address of agent for service)
(Name and address of agent for service)
(812) 376-9444
Registrant's telephone number, including area code
Date of fiscal year end: September 30, 2016
Date of reporting period: March 31, 2016
Item 1. Report to Stockholders.
KIRR, MARBACH PARTNERS
VALUE FUND
| SEMI-ANNUAL REPORT | |
wwwnkmpartnersfundsncom | MARCH 31, 2016 |
KIRR, MARBACH PARTNERS
VALUE FUND
“Patience is bitter, but its fruit is sweet.” – Aristotle
May 18, 2016
Dear Fellow Shareholders:
Kings Island amusement park says “riders (on Banshee) will scream their way through 4,124 feet of track and seven stomach-churning inversions at speeds up to 68 mph on the world’s longest steel inverted roller coaster.” While Banshee riders get on and off at about the same place, many exit feeling like their insides have been rearranged.
Following a robust December 31, 2015 quarter, investors had plenty of reasons to have their confidence shaken in the March 31, 2016 quarter, as headlines blared U.S. stocks had their worst start to the year in history. The possibility of an economic hard landing in China and further devaluation of the yuan, oil free-falling 50% and weak manufacturing data led to fears of a global recession.
As usual, this brought market pundits trying to make a name for themselves by calling the next crash out of the woodwork. RBS, a major global bank, advised its clients to “sell everything,” predicting a “fairly cataclysmic year ahead.” This being a presidential election year, candidates also one-upped each other portraying how bad things are and, of course, how they are the only one able to fix the situation.
Oil stabilized, though inventories remain elevated. Manufacturing activity strengthened, probably aided by a slightly weaker dollar. Employment continued to expand. In response to the global turmoil, the Federal Reserve adopted a “dovish” stance regarding future interest rate increases.
With the S&P 500 experiencing a harrowing plunge of 11% between New Year’s Day and February 11 and subsequent slingshot recovery of 13% to the end of March (finishing the quarter essentially flat), investors endured their own Banshee ride.
We understand and share your frustration regarding our recent underperformance. As we’ll explain, we believe there are valid reasons to be optimistic the tide will reverse, hopefully sooner rather than later. In addition, despite the strong rally from the middle of February through the end of the March quarter, investor sentiment remains very pessimistic. From a contrarian point of view, we believe this could be great news.
| Periods ending | Value Fund(1) | Russell 3000(2) | S&P 500(3) |
March 31, 2016(4) | Total Return | Index | Index |
| 6-months | 1.41% | 7.30% | 8.49% |
| One-year | -8.79% | -0.34% | 1.78% |
| Two-years | -3.18% | 5.82% | 7.12% |
| Three-years | 5.13% | 11.15% | 11.82% |
| Five-years | 7.35% | 11.01% | 11.58% |
| Ten-years | 5.24% | 6.90% | 7.01% |
| Since Inception (December 31, 1998) | 6.99% | 5.42% | 5.00% |
The Fund’s Gross Expense Ratio was 1.47%, according to the Prospectus dated January 28, 2016. Investment performance reflects previous fee waivers in effect. In the absence of such waivers, total return would be reduced.
Performance data quoted represents past performance; past performance is no guarantee of future results. The investment return and principal value of an investment will fluctuate so that an investor’s shares, when redeemed, may be worth more or less than their original cost. Current performance of the fund may be lower or higher than the performance quoted. Performance data current to the most recent month-end may be obtained by calling 1-800-870-8039. The fund imposes a 1.00% redemption fee on shares held less than 30 days. Performance data quoted does not reflect the redemption fee. If reflected, total returns would be reduced.
1
KIRR, MARBACH PARTNERS
VALUE FUND
| (1) | The performance data quoted assumes the reinvestment of capital gains and income distributions. The performance does not reflect the deduction of taxes that a shareholder would pay on Fund distributions or the redemption of Fund shares. |
| (2) | The Russell 3000 Index is an unmanaged, capitalization-weighted index generally representative of the overall U.S. stock market. This Index cannot be invested in directly. |
| (3) | The S&P 500 Index is an unmanaged, capitalization-weighted index generally representative of the U.S. market for large capitalization stocks. This Index cannot be invested in directly. |
| (4) | One-year, Two-years, Three-years, Five-years, Ten-years and Since Inception returns are Average Annualized Returns. |
THE STOCK MARKET
The first half of fiscal 2016 provided excellent examples of some timeless investing lessons.
The stock market is inherently volatile. J.P. Morgan Asset Management calculated the average intra-year drop (peak-to-trough) for the S&P 500 (price only) in individual years from 1980-2015 was a whopping 14.2%. However, these drops seldom led to yearly losses, with 27 of the 36 years ending with positive returns. You may not have realized it at the time, but if you’re invested in stocks, this is what you signed-up for.
Time in the market is more important than timing the market. You’d like to sell ahead of drops and buy ahead of rallies. Successful market timing requires you to get both the sell and subsequent buy correct. This is not only futile, but devastating to long-term returns.
According to Crandall, Pierce, if you invested $100 in the S&P 500 on the first day of 1991 and didn’t touch it, you would have had $618.96 at the end of 2015. However, if you missed just the single best trading day in each of those 25 years, you would have had just $247.85.
Bad news can be your friend, if you let it. As Warren Buffett said in the New York Times at the darkest point of the global financial crisis, “bad news is an investor’s best friend. It lets you buy a slice of America’s future at a marked-down price.”
Successful investors focus on process, not outcome. You can’t tell if a short-term outcome was the result of a “good” or “bad” process. However, a sound process should lead to a good long-term outcome.
Investing is a probabilistic endeavor. We are long-term owners of businesses and expect to hold positions for five or more years. Our process involves exploring the market’s nooks and crannies to find underfollowed, unloved or misunderstood companies with common characteristics we believe increase our odds of success, over the long-haul:
Low Valuation. We research stocks as if we were buying the entire business. We estimate earnings the business should generate over time. We like to buy stocks trading at a significant discount to our evaluation of the intrinsic value of the business.
High-quality business. Many times a stock is cheap for good reasons. Just because you see a discarded cigar butt with a couple puffs left on the sidewalk doesn’t mean you should pick it up. Similarly, we like companies with solid growth prospects and a sustainable competitive advantage.
Strong, shareholder-oriented management. We are big believers in “eating our own cooking” and are invested heavily alongside you. Similarly, we like it when the management team owns a significant amount of its own stock and allocates its resources to benefit shareholders.
2
KIRR, MARBACH PARTNERS
VALUE FUND
Low financial risk. We avoid companies with excessive debt or risk obsolescence.
We also stay away from what’s currently “hot” and sectors we don’t understand. Despite our best efforts, we’ve made mistakes (and will again). So, we diversify our holdings and limit the size of individual positions.
Given our disappointing absolute and relative performance going back to 2014, it’s reasonable to question whether A) our process is still sound and B) there is good reason to expect performance to turn.
We’ve been “value” investors since Kirr, Marbach & Company, LLC (“KM”-adviser to Value Fund) was founded 41 years ago. It seems like a long time ago, but this same process led to our winning a prestigious Lipper Best Fund Award (Multi-Cap Core) in both 2013 and 2014. The Fund won the 2014 Lipper Best Multi-Cap Core Fund Award out of 581 funds for the 5-year period ended November 30, 2013 based on risk-adjusted performance. Value Fund previously won the 2013 Lipper Best Multi-Cap Core Fund Award out of 647 funds for the 3-year period ended November 30, 2012 based on risk-adjusted performance.
We understand you can’t spend awards, but want to highlight two points.
First, returns from value investing are necessarily “lumpy.” By definition, value investors are buying stocks that are out of favor. We can control the price we pay, but have absolutely no control over when other investors will recognize the company’s improved prospects and start to favor the stock.
Second, value investing requires patience and a thick skin to withstand the inevitable periods of underperformance. The majority of investors simply aren’t wired to have the discipline, patience and fortitude required.
This is all well and good, but why do we expect the performance pendulum could swing back from growth to value? The reasons are A) growth and value have historically run in cycles (lasting several years) and B) growth has been very much “in style” since the current bull market began (and become expensive, in our opinion).
Percent Change in Top Ten Holdings from Book Cost (as of 3/31/2016)
| 1. | WABCO Holdings Inc. | +331.9% | 6. | NCR Corporation | +83.6% | |
| 2. | Cognizant Technology Solutions | +492.4% | 7. | AutoZone, Inc. | +557.6% | |
| 3. | Alliance Data Systems Corp. | +175.2% | 8. | Dollar Tree, Inc. | +680.0% | |
| 4. | Alere, Inc. | +72.7% | 9. | Allergan Plc. | -0.2% | |
| 5. | LyondellBasell Industries NV | +279.1% | 10. | American International Group | +47.2% |
Performance quoted represents past performance and is no guarantee of future results.
Fund holdings and sector allocations are subject to change and are not recommendations to buy or sell any security.
SUMMARY
As stated at the beginning of this letter, we certainly understand our weak absolute and relative performance going back to 2014 has been very frustrating. We are heavily invested alongside you, so our experience has been the same. We don’t know when the performance pendulum will swing from growth to value, but we believe history shows it eventually could. We do know the market won’t ring a bell when it’s about to happen, so we need to “be there” when it does.
3
KIRR, MARBACH PARTNERS
VALUE FUND
Ours is a most humbling business. We try to generate strong performance every day and for all periods. Unfortunately, that’s just not how the real investment world works. We have to remind ourselves not to get too high when performance is strong, nor too low when it’s weak. As KM approaches its 41st birthday, we thank you for the trust and confidence you’ve placed in us. We assure you we take the responsibility of investing your precious assets very seriously.
Regards,
 |  |
| Mark D. Foster, CFA | Mickey Kim, CFA |
| President | Vice-President, Treasurer and Secretary |
Mutual fund investing involves risk. Principal loss is possible.
Value Fund invests in foreign securities, which involves greater volatility and political, economic and currency risks and differences in accounting methods. Value Fund may also invest in small- and medium-capitalization companies, which tend to have more limited liquidity and greater price volatility than large-capitalization companies.
Past performance is not a guarantee of future results.
Please refer to the Schedule of Investments for complete fund holdings information.
A Lipper Fund Award is awarded to one fund in each Lipper classification for achieving the strongest trend of consistent risk-adjusted performance against its classification peers over a three-, five- or ten-year period. Although Lipper makes reasonable efforts to ensure the accuracy and reliability of the data contained herein, the accuracy is not guaranteed by Lipper. Users acknowledge that they have not relied upon any warranty, condition, guarantee, or representation made by Lipper. Any use of the data for analyzing, managing, or trading financial instruments is at the user’s own risk. This is not an offer to buy or sell securities. Lipper—a Thomson Reuters company is an independent mutual fund research and rating service.
The information provided herein represents the opinion of Value Fund’s investment adviser and is not intended to be a forecast of future events, a guarantee of future results, nor investment advice.
This material must be preceded or accompanied by a current Prospectus.
Quasar Distributors, LLC is the Distributor for Value Fund.
For further information about Value Fund and/or an account application, please call Matt Kirr at Value Fund at (812) 376-9444 or (800) 808-9444 or write to Value Fund at 621 Washington Street, Columbus, IN 47201.
4
KIRR, MARBACH PARTNERS
VALUE FUND
VALUE OF $10,000 INVESTMENT (UNAUDITED)

This chart assumes an initial investment of $10,000. Performance reflects fee waivers in effect. In the absence of fee waivers, total return would be reduced. Past performance is not predictive of future performance. Investment return and principal value will fluctuate, so that your shares, when redeemed maybe worth more or less than their original cost. Performance assumes the reinvestment of capital gains and income distributions. The performance does not reflect the deduction of taxes that a shareholder would pay on Fund distributions or the redemption of Fund shares.
| Average Annual Rate of Return (%) | ||||
| One Year Ended | Five Years Ended | Ten Years Ended | Since Inception* to | |
| March 31, 2016 | March 31, 2016 | March 31, 2016 | March 31, 2016 | |
| Kirr Marbach Partners Value Fund | (8.79)% | 7.35% | 5.24% | 6.99% |
| Russell 3000 Index** | (0.34)% | 11.01% | 6.90% | 5.42% |
| S&P 500 Index*** | 1.78% | 11.58% | 7.01% | 5.00% |
| * | December 31, 1998 | |
| ** | The Russell 3000 Index is an unmanaged, capitalization-weighted index generally representative of the overall U.S. stock market. This Index cannot be invested in directly. | |
| *** | The Standard & Poor’s 500 Index (S&P 500) is an unmanaged, capitalization-weighted index generally representative of the U.S. market for large capitalization stocks. This Index cannot be invested in directly. |
5
KIRR, MARBACH PARTNERS
VALUE FUND
EXPENSE EXAMPLE – MARCH 31, 2016
As a shareholder of the Fund, you incur two types of costs: (1) transaction costs, which may include redemption fees; and exchange fees; and (2) ongoing costs, including management fees; distribution fees; and other Fund expenses. This Example is intended to help you understand your ongoing costs (in dollars) of investing in the Fund and to compare these costs with the ongoing costs of investing in other mutual funds. The Example is based on an investment of $1,000 invested at the beginning of the period and held for the entire period (October 1, 2015 – March 31, 2016).
ACTUAL EXPENSES
The first line of the table below provides information about actual account values and actual expenses. Although the Fund charges no sales load or transaction fees, you will be assessed fees for outgoing wire transfers, returned checks and stop payment orders at prevailing rates charged by U.S. Bancorp Fund Services, LLC, the Fund’s transfer agent. If you request that a redemption be made by wire transfer, currently a $15.00 fee is charged by the Fund’s transfer agent. You will be charged a transaction fee equal to 1.00% of the net amount of the redemption if you redeem your shares within 30 days of purchase. IRA accounts will be charged a $15.00 annual maintenance fee. To the extent the Fund invests in shares of other investment companies as part of its investment strategy, you will indirectly bear your proportionate share of any fees and expenses charged by the underlying funds in which the Fund invests in addition to the expenses of the Fund. Actual expenses of the underlying funds are expected to vary among the various underlying funds. These expenses are not included in the example below. The example below includes, but is not limited to, management fees, shareholder servicing fees, fund accounting, custody and transfer agent fees. However, the example below does not include portfolio trading commissions and related expenses, interest expense and other extraordinary expenses as determined under generally accepted accounting principles. You may use the information in this line, together with the amount you invested, to estimate the expenses that you paid over the period. Simply divide your account value by $1,000 (for example, an $8,600 account value divided by $1,000 = 8.6), then multiply the result by the number in the first line under the heading entitled “Expenses Paid During Period” to estimate the expenses you paid on your account during this period.
HYPOTHETICAL EXAMPLE FOR COMPARISON PURPOSES
The second line of the table below provides information about hypothetical account values and hypothetical expenses based on the Fund’s actual expense ratio and an assumed rate of return of 5% per year before expenses, which is not the Fund’s actual return. The hypothetical account values and expenses may not be used to estimate the actual ending account balance or expenses you paid for the period. You may use this information to compare the ongoing costs of investing in the Fund and other funds. To do so, compare this 5% hypothetical example with the 5% hypothetical examples that appear in the shareholder reports of the other funds.
Please note that the expenses shown in the table are meant to highlight your ongoing costs only and do not reflect any transactional costs, such as redemption fees, or exchange fees. Therefore, the second line of the table is useful in comparing ongoing costs only, and will not help you determine the relative total costs of owning different funds. In addition, if these transactional costs were included, your costs would have been higher.
| Beginning | Ending | Expenses Paid | |
| Account Value | Account Value | During Period | |
10/1/15 | 3/31/16 | 10/1/15 – 3/31/16(1) | |
| Actual | $1,000.00 | $1,014.10 | $7.30 |
| Hypothetical (5% return before expenses) | 1,000.00 | 1,017.75 | 7.31 |
| (1) | Expenses are equal to the Fund’s annualized expense ratio after expense reimbursement of 1.45%, multiplied by the average account value over the period, multiplied by 183/366 to reflect the one-half year period. The annualized expense ratio prior to expense reimbursement was 1.49%. |
6
KIRR, MARBACH PARTNERS
VALUE FUND
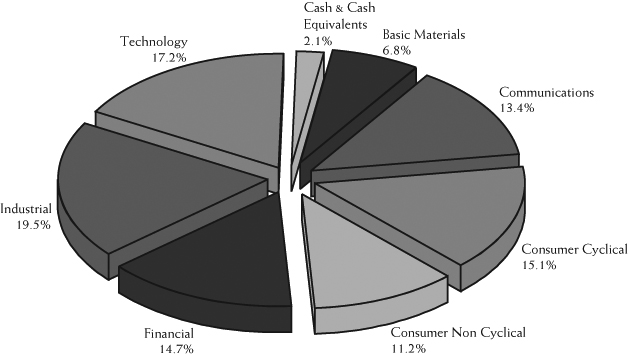
ALLOCATION OF PORTFOLIO NET ASSETS
MARCH 31, 2016 (UNAUDITED)
TOP TEN EQUITY HOLDINGS
AS OF MARCH 31, 2016 (UNAUDITED)
(% OF NET ASSETS)
| WABCO Holdings, Inc. | 4.7 | % | |||
| Cognizant Technology Solutions Corp. – Class A | 4.5 | % | |||
| Alliance Data Systems Corp. | 4.3 | % | |||
| Alere, Inc. | 4.1 | % | |||
| LyondellBasell Industries NV – Class A | 4.0 | % | |||
| NCR Corp. | 3.5 | % | |||
| AutoZone, Inc. | 3.3 | % | |||
| Dollar Tree, Inc. | 3.3 | % | |||
| Allergan plc | 3.3 | % | |||
| American International Group, Inc. | 3.1 | % |
7
KIRR, MARBACH PARTNERS
VALUE FUND
SCHEDULE OF INVESTMENTS
MARCH 31, 2016 (UNAUDITED)
| Number | |||||||
| of Shares | Value | ||||||
| COMMON STOCKS – 97.9% | |||||||
| Basic Materials – 6.8% | |||||||
| 44,585 | Innospec, Inc. | $ | 1,933,206 | ||||
| 32,397 | LyondellBasell | ||||||
| Industries NV – Class A | 2,772,535 | ||||||
| 4,705,741 | |||||||
| Communications – 13.4% | |||||||
| 13,500 | Alliance Data Systems Corp.* | 2,970,000 | |||||
| 74,630 | ARRIS International plc* | 1,710,520 | |||||
| 4,075 | Liberty Broadband Corp. – Class A* | 237,002 | |||||
| 10,835 | Liberty Broadband Corp. – Class C* | 627,888 | |||||
| 16,700 | Liberty Media Corp. – Class A* | 645,121 | |||||
| 33,600 | Liberty Media Corp. – Class C* | 1,279,824 | |||||
| 33,975 | NeuStar, Inc. – Class A* | 835,785 | |||||
| 25,630 | Tribune Co. | 982,910 | |||||
| 9,289,050 | |||||||
| Consumer Cyclical – 15.1% | |||||||
| 46,825 | American Airlines Group, Inc. | 1,920,293 | |||||
| 2,885 | AutoZone, Inc.* | 2,298,451 | |||||
| 35,970 | CST Brands, Inc. | 1,377,291 | |||||
| 27,795 | Dollar Tree, Inc.* | 2,291,976 | |||||
| 28,905 | Motorcar Parts of America, Inc.* | 1,097,812 | |||||
| 18,325 | Visteon Corp. | 1,458,487 | |||||
| 10,444,310 | |||||||
| Consumer Non Cyclical – 11.2% | |||||||
| 56,480 | Alere, Inc.* | 2,858,453 | |||||
| 8,515 | Allergan plc* | 2,282,275 | |||||
| 43,935 | Sotheby’s | 1,174,383 | |||||
| 13,515 | Zimmer Biomet Holdings, Inc. | 1,441,104 | |||||
| 7,756,215 | |||||||
| Financial – 14.7% | |||||||
| 39,925 | American International Group, Inc. | 2,157,946 | |||||
| 16,265 | Aon plc | 1,698,879 | |||||
| 42,590 | Colliers International Group, Inc. | 1,612,458 | |||||
| 1,976 | Markel Corp.* | 1,761,742 | |||||
| 47,730 | Synchrony Financial* | 1,367,942 | |||||
| 54,455 | Voya Financial, Inc. | 1,621,125 | |||||
| 10,220,092 | |||||||
| Industrial – 19.5% | |||||||
| 52,447 | Babcock & Wilcox Enterprises, Inc.* | 1,122,366 | |||||
| 49,155 | BWX Technologies, Inc. | 1,649,642 | |||||
| 16,163 | Canadian Pacific Railway Ltd. | 2,144,668 | |||||
| 33,460 | EMCOR Group, Inc. | 1,626,156 | |||||
| 95,595 | Gentex Corp. | 1,499,886 | |||||
| 33,335 | KLX, Inc.* | 1,071,387 | |||||
| 57,630 | MasTec, Inc.* | 1,166,431 | |||||
| 30,653 | WABCO Holdings, Inc.* | 3,277,419 | |||||
| 13,557,955 | |||||||
| Technology – 17.2% | |||||||
| 50,000 | Cognizant Technology | ||||||
| Solutions Corp. – Class A* | 3,135,000 | ||||||
| 22,535 | Computer Sciences Corp. | 774,979 | |||||
| 22,535 | CSRA, Inc. | 606,191 | |||||
| 81,064 | NCR Corp.* | 2,426,246 | |||||
| 2,175 | NetScout Systems, Inc.* | 49,960 | |||||
| 32,200 | Open Text Corp. | 1,667,960 | |||||
| 69,190 | Tessera Technologies, Inc. | 2,144,890 | |||||
| 30,535 | Yahoo! Inc.* | 1,123,993 | |||||
| 11,929,219 | |||||||
| TOTAL COMMON STOCKS | |||||||
| (Cost $42,482,421) | 67,902,582 | ||||||
| SHORT-TERM INVESTMENT – 2.4% | |||||||
| 1,690,351 | Fidelity Institutional Money | ||||||
| Market Portfolio – Class I, 0.34%** | |||||||
| (Cost $1,690,351) | 1,690,351 | ||||||
| Total Investments | |||||||
| (Cost $44,172,772) – 100.3% | 69,592,933 | ||||||
| Other Assets and | |||||||
| Liabilities, Net (0.3)% | (195,227 | ) | |||||
| TOTAL NET ASSETS – 100.0% | $ | 69,397,706 | |||||
| * | Non-income producing security. | |
| ** | Rate in effect as of March 31, 2016. |
See Notes to the Financial Statements
8
KIRR, MARBACH PARTNERS
VALUE FUND
STATEMENT OF ASSETS AND LIABILITIES
MARCH 31, 2016 (UNAUDITED)
| ASSETS: | ||||
| Investments, at current value | ||||
| (cost $44,172,772) | $ | 69,592,933 | ||
| Receivable for investment securities sold | 174,484 | |||
| Prepaid expenses | 19,031 | |||
| Receivable for Fund shares sold | 16,550 | |||
| Dividends receivable | 9,194 | |||
| Cash | 5,474 | |||
| Interest receivable | 431 | |||
| Total Assets | 69,818,097 | |||
| LIABILITIES: | ||||
| Payable for capital shares redeemed | 336,083 | |||
| Payable to Adviser | 55,171 | |||
| Accrued expenses | 21,965 | |||
| Accrued distribution fees | 7,172 | |||
| Total Liabilities | 420,391 | |||
| NET ASSETS | $ | 69,397,706 | ||
| NET ASSETS CONSIST OF: | ||||
| Capital Stock | $ | 43,416,440 | ||
| Undistributed net investment income | 402,855 | |||
| Undistributed net realized gain on investments | 158,223 | |||
| Net unrealized appreciation on investments | 25,420,188 | |||
| Total Net Assets | $ | 69,397,706 | ||
| Shares outstanding (500,000,000 shares | ||||
| of $0.01 par value authorized) | 3,211,734 | |||
Net asset value and offering price per share(1) | $ | 21.61 | ||
| (1) | A redemption fee of 1.00% is assessed against shares redeemed within 30 days of purchase. |
STATEMENT OF OPERATIONS
SIX MONTHS ENDED MARCH 31, 2016
(UNAUDITED)
| INVESTMENT INCOME: | ||||
| Dividend income | ||||
| (net of withholding of $3,446) | $ | 1,248,237 | ||
| Interest income | 2,572 | |||
| Total Investment Income | 1,250,809 | |||
| EXPENSES: | ||||
| Investment Adviser fees | 347,874 | |||
| Distribution fees | 34,680 | |||
| Legal fees | 26,010 | |||
| Administration fees | 23,907 | |||
| Transfer agent fees | 20,568 | |||
| Federal & state registration fees | 14,532 | |||
| Fund accounting fees | 13,917 | |||
| Audit fees | 10,797 | |||
| Custody fees | 8,112 | |||
| Directors fees | 6,039 | |||
| Postage & printing fees | 6,039 | |||
| Other | 4,470 | |||
| Total expenses before reimbursement | 516,945 | |||
| Less: Reimbursement from Investment Adviser | (12,527 | ) | ||
| Net Expenses | 504,418 | |||
| NET INVESTMENT INCOME | 746,391 | |||
| REALIZED AND UNREALIZED | ||||
| GAIN (LOSS) ON INVESTMENTS: | ||||
| Net realized gain on investments | 2,692,835 | |||
| Net change in unrealized appreciation | ||||
| on investments | (2,406,436 | ) | ||
| Net realized and unrealized | ||||
| gain (loss) on investments | 286,399 | |||
| NET INCREASE IN NET ASSETS | ||||
| RESULTING FROM OPERATIONS | $ | 1,032,790 | ||
See Notes to the Financial Statements
9
KIRR, MARBACH PARTNERS
VALUE FUND
STATEMENT OF CHANGES IN NET ASSETS
| Six Months Ended | ||||||||
| March 31, 2016 | Year Ended | |||||||
| (UNAUDITED) | September 30, 2015 | |||||||
| OPERATIONS: | ||||||||
| Net investment income (loss) | $ | 746,391 | $ | (521,341 | ) | |||
| Net realized gain on investments | 2,692,835 | 4,595,921 | ||||||
| Net change in unrealized appreciation on investments | (2,406,436 | ) | (7,055,677 | ) | ||||
| Net increase (decrease) in net assets resulting from operations | 1,032,790 | (2,981,097 | ) | |||||
| CAPITAL SHARE TRANSACTIONS: | ||||||||
| Proceeds from shares sold | 1,680,131 | 6,518,087 | ||||||
| Proceeds from reinvestment of distributions | 228,591 | — | ||||||
| Payments for shares redeemed | (3,338,032 | ) | (7,168,705 | ) | ||||
| Redemption fees | 2 | 78 | ||||||
| Net decrease in net assets resulting from capital share transactions | (1,429,308 | ) | (650,540 | ) | ||||
| DISTRIBUTIONS TO SHAREHOLDERS: | ||||||||
| From net investment income | — | — | ||||||
| From net realized gains | (236,748 | ) | — | |||||
| Total distributions to shareholders | (236,748 | ) | — | |||||
| TOTAL DECREASE IN NET ASSETS | (633,266 | ) | (3,631,637 | ) | ||||
| NET ASSETS: | ||||||||
| Beginning of period | 70,030,972 | 73,662,609 | ||||||
| End of period (including undistributed net investment income (loss) of | ||||||||
| $402,855 and ($343,536), respectively) | $ | 69,397,706 | $ | 70,030,972 | ||||
| CHANGES IN SHARES OUTSTANDING: | ||||||||
| Shares sold | 81,120 | 287,827 | ||||||
| Shares issued to holders in reinvestment of dividends | 10,278 | — | ||||||
| Shares redeemed | (155,558 | ) | (310,204 | ) | ||||
| Net decrease | (64,160 | ) | (22,377 | ) | ||||
See Notes to the Financial Statements
10
KIRR, MARBACH PARTNERS
VALUE FUND
FINANCIAL HIGHLIGHTS
For a Fund share outstanding throughout the period.
| March 31, 2016 | Year Ended September 30, | |||||||||||||||||||||||
(UNAUDITED)(1) | 2015 | 2014 | 2013 | 2012 | 2011 | |||||||||||||||||||
| PER SHARE DATA: | ||||||||||||||||||||||||
| Net asset value, beginning of period | $ | 21.38 | $ | 22.33 | $ | 20.88 | $ | 16.12 | $ | 11.78 | $ | 11.53 | ||||||||||||
| Investment operations: | ||||||||||||||||||||||||
| Net investment income (loss) | 0.23 | (0.16 | ) | (0.19 | ) | (0.06 | ) | (0.07 | ) | (0.09 | ) | |||||||||||||
| Net realized and unrealized | ||||||||||||||||||||||||
| gain (loss) on investments | 0.07 | (0.79 | ) | 1.64 | 4.82 | 4.41 | 0.34 | |||||||||||||||||
| Total from investment operations | 0.30 | (0.95 | ) | 1.45 | 4.76 | 4.34 | 0.25 | |||||||||||||||||
| Less distributions: | ||||||||||||||||||||||||
| Dividends from net investment income | — | — | — | — | — | — | ||||||||||||||||||
| Dividends from net capital gains | (0.07 | ) | — | — | — | — | — | |||||||||||||||||
| Total distributions | (0.07 | ) | — | — | — | — | — | |||||||||||||||||
| Paid in capital from redemption fees | — | (2) | — | (2) | — | (2) | — | (2) | — | (2) | — | (2) | ||||||||||||
| Net asset value, end of period | $ | 21.61 | $ | 21.38 | $ | 22.33 | $ | 20.88 | $ | 16.12 | $ | 11.78 | ||||||||||||
| TOTAL RETURN | 1.41 | % | (4.25 | )% | 6.94 | % | 29.53 | % | 36.84 | % | 2.17 | % | ||||||||||||
| SUPPLEMENTAL DATA AND RATIOS: | ||||||||||||||||||||||||
| Net assets, end of period (in millions) | $ | 69.4 | $ | 70.0 | $ | 73.7 | $ | 66.6 | $ | 48.4 | $ | 66.3 | ||||||||||||
| Ratio of expenses to average net assets: | ||||||||||||||||||||||||
| Before expense reimbursement/recoupment | 1.49 | % | 1.46 | % | 1.45 | % | 1.54 | % | 1.66 | % | 1.66 | % | ||||||||||||
| After expense reimbursement/recoupment | 1.45 | % | 1.45 | % | 1.45 | % | 1.45 | % | 1.45 | % | 1.45 | % | ||||||||||||
| Ratio of net investment income (loss) | ||||||||||||||||||||||||
| to average net assets: | ||||||||||||||||||||||||
| Before expense reimbursement/recoupment | 2.10 | % | (0.69 | )% | (0.85 | )% | (0.45 | )% | (0.63 | )% | (1.05 | )% | ||||||||||||
| After expense reimbursement/recoupment | 2.14 | % | (0.68 | )% | (0.85 | )% | (0.36 | )% | (0.42 | )% | (0.84 | )% | ||||||||||||
| Portfolio turnover rate | 10 | % | 21 | % | 11 | % | 21 | % | 14 | % | 15 | % | ||||||||||||
| (1) | All ratios for the six month period ended March 31, 2016 have been annualized, except total return and portfolio turnover. |
| (2) | Less than 0.01 per share. |
See Notes to the Financial Statements
11
KIRR, MARBACH PARTNERS
VALUE FUND
NOTES TO THE FINANCIAL STATEMENTS
MARCH 31, 2016 (UNAUDITED)
1. ORGANIZATION AND SIGNIFICANT ACCOUNTING POLICIES
Kirr, Marbach Partners Funds, Inc. (the “Corporation”) was organized as a Maryland corporation on September 23, 1998 and is registered under the Investment Company Act of 1940, as amended (the “1940 Act”), as an open-end diversified management investment company issuing its shares in series, each series representing a distinct portfolio with its own investment objective and policies. The one series presently authorized is the Kirr, Marbach Partners Value Fund (the “Fund”). The investment objective of the Fund is to seek long-term capital growth. The Fund commenced operations on December 31, 1998.
The following is a summary of significant accounting policies consistently followed by the Fund. These policies are in conformity with generally accepted accounting principles in the United States of America (“GAAP”).
| a) | Investment Valuation – Securities listed on the Nasdaq National Market are valued at the Nasdaq Official Closing Price (“NOCP”). Other securities traded on a national securities exchange (including options on indices so traded) are valued at the last sales price on the exchange where the security is primarily traded. Exchange-traded securities for which there were no transactions and Nasdaq-traded securities for which there is no NOCP are valued at the mean of the bid and asked prices. Securities for which market quotations are not readily available are valued at fair value as determined in good faith under the supervision of the Board of Directors. Foreign securities have been issued by foreign private issuers registered on United States exchanges in accordance with Section 12 of the Securities Exchange Act of 1934. Debt securities, including short-term debt instruments having maturities less than 60 days, are valued at the mean between the bid and asked prices as reported by an approved pricing service. | |
| The Fund has performed an analysis of all existing investments to determine the significance and character of all inputs to their fair value determination. Various inputs are used in determining the value of each of the Fund’s investments. These inputs are summarized in the following three broad categories: |
| Level 1 – | Unadjusted quoted prices in active markets for identical assets or liabilities that the company has the ability to access. | ||
| Level 2 – | Observable inputs other than quoted prices included in Level 1 that are observable for the asset or liability either directly or indirectly. These inputs may include quoted prices for the identical instruments on an inactive market, prices for similar instruments, interest rates, prepayment speeds, credit risk, yield curves, default rates, and similar data. | ||
| Level 3 – | Unobservable inputs for the asset or liability to the extent that relevant observable inputs are not available, representing the company’s own assumptions about the assumptions that a market participant would use in valuing the asset or liability, and that would be based on the best information available. |
| The availability of observable inputs can vary from security to security and is affected by a wide variety of factors, including, for example, the type of security, whether the security is new and not yet established in the marketplace, the liquidity of markets, and other characteristics particular to the security. To the extent that valuation is based on models or inputs that are less observable or unobservable in the market, the determination of fair value requires more judgment. Accordingly, the degree of judgment exercised in determining fair value is greatest for instruments categorized in Level 3. |
12
KIRR, MARBACH PARTNERS
VALUE FUND
NOTES TO THE FINANCIAL STATEMENTS (CONTINUED)
MARCH 31, 2016 (UNAUDITED)
| The inputs used to measure fair value may fall into different levels of the fair value hierarchy. In such cases, for disclosure purposes, the level in the fair value hierarchy within which the fair value measurement falls in its entirety, is determined based on the lowest level input that is significant to the fair value measurement in its entirety. | ||
| The inputs or methodology used for valuing securities are not an indication of the risk associated with investing in those securities. The following is a summary of the inputs used to value the Fund’s investments as of March 31, 2016: |
| Level 1 | Level 2 | Level 3 | Total | |||||||||||||||
| Common Stocks | $ | 67,902,582 | $ | — | $ | — | $ | 67,902,582 | ||||||||||
| Short-Term Investment | 1,690,351 | — | — | 1,690,351 | ||||||||||||||
| Total Investments | $ | 69,592,933 | $ | — | $ | — | $ | 69,592,933 | ||||||||||
| Refer to the Schedule of Investments for industry classifications. Transfers between levels are recognized at the end of the reporting period. During the period ended March 31, 2016, the Fund recognized no transfers between levels. The Fund did not invest in any Level 3 investments during the period. | ||
| b) | Federal Income Taxes – A provision, for federal income taxes or excise taxes, has not been made since the Fund has elected to be taxed as a “regulated investment company” and intends to distribute substantially all taxable income to its shareholders and otherwise comply with the provisions of the Internal Revenue Code applicable to regulated investment companies. There is no tax liability resulting from unrecognized tax benefits relating to uncertain income tax positions taken or expected to be taken on the tax return for the fiscal year ended September 30, 2015, or for any other tax years which are open for exam. As of September 30, 2015, open tax years include the tax years ended September 30, 2012 through 2015. The Fund is also not aware of any tax positions for which it is reasonably possible that the total amounts of unrecognized tax benefits will significantly change in the next twelve months. The Fund recognizes interest and penalties, if any, related to unrecognized tax benefits as income tax expense in the Statement of Operations. During the period, the Fund did not incur any interest or penalties. | |
| c) | Income and Expenses – The Fund is charged for those expenses that are directly attributable to the Fund, such as advisory, administration and certain shareholder service fees. | |
| d) | Distributions to Shareholders – Dividends from net investment income and distributions of net realized capital gains, if any, will be declared and paid at least annually. The character of distributions made during the period from net investment income or net realized gains may differ from the characterization for federal income tax purposes due to differences in the recognition of income, expense and gain items for financial statement and tax purposes. All short term capital gains are included in ordinary income for tax purposes. | |
| e) | Use of Estimates – The preparation of financial statements in conformity with GAAP requires management to make estimates and assumptions that affect the reported amounts of assets and liabilities and disclosure of contingent assets and liabilities at the date of the financial statements and the reported amounts of revenues and expenses during the reporting period. Actual results could differ from those estimates. | |
| f) | Repurchase Agreements – The Fund may enter into repurchase agreements with certain banks or non-bank dealers. The Adviser will monitor, on an ongoing basis, the value of the underlying securities to ensure that the value always equals or exceeds the repurchase price plus accrued interest. |
13
KIRR, MARBACH PARTNERS
VALUE FUND
NOTES TO THE FINANCIAL STATEMENTS (CONTINUED)
MARCH 31, 2016 (UNAUDITED)
| g) | Security Transactions and Investment Income – The Fund follows industry practice and records security transactions on the trade date. Realized gains and losses on sales of securities are calculated on the basis of identified cost. Dividend income is recorded on the ex-dividend date and interest income is recorded on an accrual basis. Withholding taxes on foreign dividends have been provided for in accordance with the Fund’s understanding of the applicable country’s tax rules and regulations. Discounts and premiums on securities purchased are amortized over the expected life of the respective securities. | |
| The Fund distributes all net investment income, if any, and net realized capital gains, if any, annually. Distributions to shareholders are recorded on the ex-dividend date. The treatment for financial reporting purposes of distributions made to shareholders during the year from net investment income or net realized capital gains may differ from their ultimate treatment for federal income tax purposes. These differences are caused primarily by differences in the timing of the recognition of certain components of income, expense or realized capital gain for federal income tax purposes. Where such differences are permanent in nature, GAAP requires that they be reclassified in the components of the net assets based on their ultimate characterization for federal income tax purposes. Any such reclassifications will have no effect on net assets, results of operations or net asset values per share of the Fund. | ||
| h) | Subsequent Events – Management has evaluated fund related events and transactions that occurred subsequent to March 31, 2016 through the date of issuance of the Fund’s financial statements. There were no events or transactions that occurred during this period that materially impacted the amounts or disclosures in the Fund’s financial statements. |
2. INVESTMENT TRANSACTIONS
The aggregate purchases and sales of securities, excluding short-term investments, by the Fund for the period ended March 31, 2016, were as follows:
| Purchases | Sales | |||||||
| U.S. Government | $ | — | $ | — | ||||
| Other | $ | 7,794,327 | $ | 7,018,176 | ||||
At September 30, 2015, the components of accumulated earnings (losses) on a tax basis were as follows:
| Cost of investments | $ | 42,969,630 | ||
| Gross unrealized appreciation | $ | 29,435,029 | ||
| Gross unrealized depreciation | $ | (2,279,910 | ) | |
| Net unrealized appreciation | $ | 27,155,119 | ||
| Undistributed ordinary income | — | |||
| Undistributed long-term capital gain | — | |||
| Total distributable earnings | — | |||
| Other accumulated gains/losses | $ | (1,969,895 | ) | |
| Total accumulated earnings (losses) | $ | 25,185,224 |
14
KIRR, MARBACH PARTNERS
VALUE FUND
NOTES TO THE FINANCIAL STATEMENTS (CONTINUED)
MARCH 31, 2016 (UNAUDITED)
As of September 30, 2015, the most recently completed fiscal year end, the Fund had a capital loss carry forward as follows:
| Capital Loss Carryover | Character | Expiration | |
| $1,626,336 | — | 9/30/2018 |
As of September 30, 2015, the Fund deferred, on a tax basis, post-October losses of:
| Late Year Loss | Post October Loss | |
| $343,536 | $— |
For the period ended March 31, 2016, the Fund paid the following distribution to shareholders:
Long Term Capital Gain | |
$236,748 |
The Fund paid no distributions during the year ended September 30, 2015.
3. AGREEMENTS
The Fund has entered into an Investment Advisory Agreement with Kirr, Marbach & Company, LLC (the “Investment Adviser”). Pursuant to its advisory agreement with the Fund, the Investment Adviser is entitled to receive a fee, calculated daily and payable monthly, at the annual rate of 1.00% as applied to the Fund’s daily net assets.
The Investment Adviser has contractually agreed to waive its management fee and/or reimburse the Fund’s other expenses to the extent necessary to ensure that the Fund’s total annual operating expenses (excluding acquired fund fees and expenses, interest, taxes, brokerage commissions and extraordinary expenses) do not exceed 1.45% of its average daily net assets until February 28, 2017. The Investment Adviser may decide to continue the agreement, or revise the total annual operating expense limitations after February 28, 2017. Any waiver or reimbursement is subject to later adjustment to allow the Investment Adviser to recoup amounts waived or reimbursed to the extent actual fees and expenses for a period are less than the expense limitation cap of 1.45%, provided, however, that the Investment Adviser shall only be entitled to recoup such amounts for a period of three years from the date such amount was waived or reimbursed. Waived/reimbursed fees and expenses subject to potential recovery by year of expiration are as follows.
| Year of Expiration | Amount | |||
| 9/30/2016 | $ | 53,758 | ||
| 9/30/2017 | — | |||
| 9/30/2018 | 5,165 | |||
| 9/30/2019 | 12,527 | |||
| Total | $ | 71,450 | ||
As of March 31, 2016, it was possible, but not probable, those amounts would be recovered by the Investment Adviser. At the end of each fiscal year in the future, the Fund will continue to assess the potential recovery of waived/reimbursed fees and expenses for financial reporting purposes.
15
KIRR, MARBACH PARTNERS
VALUE FUND
NOTES TO THE FINANCIAL STATEMENTS (CONTINUED)
MARCH 31, 2016 (UNAUDITED)
Quasar Distributors, LLC, (the “Distributor”) serves as principal underwriter of the shares of the Fund pursuant to a Distribution Agreement between the Distributor and the Corporation. The Fund’s shares are sold on a no-load basis and, therefore, the Distributor receives no sales commission or sales load for providing services to the Fund. The Corporation has adopted a plan pursuant to Rule 12b-1 under the 1940 Act (the “12b-1 Plan”), which authorizes the Corporation to pay the Distributor and certain financial intermediaries who assist in distributing the Fund shares or who provided shareholder services to Fund shareholders a distribution and shareholder servicing fee of up to 0.25% of the Fund’s average daily net assets (computed on an annual basis). All or a portion of the fee may be used by the Fund or the Distributor to pay its distribution fee and costs of printing reports and prospectuses for potential investors and the costs of other distribution and shareholder servicing expenses. During the period ended March 31, 2016, the Fund incurred expenses of $34,680 pursuant to the 12b-1 Plan.
U.S. Bancorp Fund Services, LLC serves as transfer agent, administrator and accounting services agent for the Fund. U.S. Bank, N.A. serves as custodian for the Fund.
The Fund imposes a 1% redemption fee on shares held 30 days or less. For the period end March 31, 2016 and the year ended September 30, 2015, the Fund collected $2 and $78, respectively, in redemption fees.
16
KIRR, MARBACH PARTNERS
VALUE FUND
ADDITIONAL INFORMATION
MARCH 31, 2016 (UNAUDITED)
BOARD APPROVAL OF INVESTMENT ADVISORY AGREEMENT
On November 18, 2015, at an in-person meeting of the Board of Directors of the Kirr, Marbach Partners Fund, Inc. (the “Corporation”), the directors, including a majority of the disinterested directors, approved the continuation of the investment advisory agreement dated June 10, 2005 (the “Advisory Agreement”) between the Corporation and Kirr, Marbach & Company, LLC (the “Adviser”). It was noted that, as described in the Adviser’s memorandum, the Adviser has significant experience providing investment advice and is qualified to provide investment advisory services to the Fund. In addition, it was noted that the Adviser promoted a culture of compliance. The directors noted that the Fund’s recent short and mid-term underperformance has lagged its benchmarks. The directors considered the Adviser’s explanation for the Fund’s recent short and mid-term underperformance, including the Fund’s short-term underperformance during the fiscal year ending September 30, 2015, and were satisfied with the Adviser’s explanations relating to these periods. The directors also considered the Fund’s longer-term performance, particularly the five-year and since inception numbers. The directors also noted that a significant percentage of the Fund is owned by Adviser insiders and therefore the directors feel that the Adviser’s interests are aligned with other Fund shareholders. The directors considered information relating to the Fund’s fees, costs and expense ratios and compared such fees, costs and expense ratios to competitive industry fee structures and expense ratios. Specifically, the directors reviewed charts prepared by the administrator based on data compiled by a nationally recognized third party comparative data provider. In connection with this, the directors also considered the control of the Fund’s operating expenses through the expense cap agreement, and noted that the current expense cap agreement maintains an overall reasonable total expense level as evidenced by the comparative data presented at the meeting. In addition, the Board noted that the Adviser is providing substantially similar investment advisory services to the Fund and its other separate account clients and, with the current expense cap arrangement in place, providing such services to the Fund at substantially similar rates to those charged to the Adviser’s other clients. The directors considered whether the Adviser would receive any fall-out benefits through its relationship with the Fund, and it was noted that because none of the other service providers to the Fund are affiliated with the Adviser, there are no identifiable material fall-out benefits accruing to the Adviser. The directors considered the Adviser’s cost of providing services to the Fund and the profitability of its relationship to the Fund. It was noted that the Adviser’s profitability was in line with its profitability for providing investment advice to its separate account clients given the current expense cap agreement, and the directors noted that the Adviser’s profit in connection with its services to the Fund appeared reasonable. The directors considered whether economies of scale were being realized that could justify reduced expenses for the Fund. It was noted that current asset levels had decreased from the prior year. During the deliberations, the disinterested directors did not identify any single consideration or particular piece of information that was all important or controlling in determining whether to approve the Advisory Agreement. The disinterested directors evaluated all information presented to them and determined that the compensation paid to the Adviser under the Advisory Agreement was fair and reasonable in light of the services to be performed.
17
KIRR, MARBACH PARTNERS
VALUE FUND
ADDITIONAL INFORMATION
MARCH 31, 2016 (UNAUDITED)
AVAILABILITY OF FUND PORTFOLIO INFORMATION
The Fund files its complete schedule of portfolio holdings with the SEC for the first and third quarters of each fiscal year on Form N-Q, which is available on the SEC’s website at www.sec.gov. The Fund’s Form N-Q may be reviewed and copied at the SEC’s Public Reference Room in Washington D.C. For information on the Public Reference Room call 1-800-SEC-0330. In addition, the Fund will post its complete schedule of portfolio holdings as of the end of its last completed fiscal quarter as part of its quarterly shareholder update on the Fund’s website on or soon after the 14th day after the end of each fiscal quarter.
AVAILABILITY OF PROXY VOTING INFORMATION
Both a description of the Fund’s Proxy Voting Policies and Procedures and information about the Fund’s proxy voting record will be available (1) without charge, upon request, by calling 1-800-870-8039, and (2) on the SEC’s website at www.sec.gov.
18
(This Page Intentionally Left Blank.)
DIRECTORS
Mark D. Foster, CFA
Mickey Kim, CFA
Jeffrey N. Brown
Mark E. Chesnut
John F. Dorenbusch
PRINCIPAL OFFICERS
Mark D. Foster, CFA, President
Mickey Kim, CFA, Vice President, Treasurer and Secretary
INVESTMENT ADVISER
Kirr, Marbach & Company, LLC
621 Washington Street
Columbus, IN 47201
DISTRIBUTOR
Quasar Distributors, LLC
615 East Michigan Street
Milwaukee, WI 53202
CUSTODIAN
U.S. Bank, N.A.
1555 North River Center Drive
Milwaukee, WI 53212
ADMINISTRATOR,
TRANSFER AGENT AND
DIVIDEND – DISBURSING AGENT
U.S. Bancorp Fund Services, LLC
615 E. Michigan Street
Milwaukee, WI 53202
INDEPENDENT REGISTERED
PUBLIC ACCOUNTING FIRM
Tait, Weller & Baker LLP
1818 Market Street, Suite 2400
Philadelphia, PA 19103
LEGAL COUNSEL
Kirkland & Ellis LLP
300 North LaSalle
Chicago, IL 60654
This report should be accompanied or preceded by a prospectus.
The Fund’s Statement of Additional Information contains additional information about the
Fund’s directors and is available without charge upon request by calling 1-800-808-9444.
The Fund’s Proxy Voting Policies and Procedures are available without charge upon request by calling 1-800-808-9444. A description of the
Fund’s proxy voting policies and procedures is available on the Fund’s website, www.kmpartnersfunds.com, or on the SEC’s website, at
www.sec.gov. Information regarding how the Fund voted proxies relating to portfolio securities during the twelve months ended June 30,
is available without charge upon request by calling 1-800-808-9444 or on the SEC’s website, at www.sec.gov.
SEMI-ANNUAL REPORT
MARCH 31, 2016
Item 2. Code of Ethics.
Not applicable for semi-annual reports.
Item 3. Audit Committee Financial Expert.
Not applicable for semi-annual reports.
Item 4. Principal Accountant Fees and Services.
Not applicable for semi-annual reports.
Item 5. Audit Committee of Listed Registrants.
Not applicable for semi-annual reports.
Item 6. Schedule of Investments.
Schedule of Investments is included as part of the report to shareholders filed under Item 1 of this Form.
Item 7. Disclosure of Proxy Voting Policies and Procedures for Closed-End Management Investment Companies.
Not applicable to open-end investment companies.
Item 8. Portfolio Managers of Closed-End Management Investment Companies.
Not applicable to open-end investment companies.
Item 9. Purchases of Equity Securities by Closed‑End Management Investment Company and Affiliated Purchases.
Not applicable to open-end investment companies.
Item 10. Submission of Matters to a Vote of Security Holders.
Not Applicable.
Item 11. Controls and Procedures.
| (a) | The Registrant’s President and Treasurer have reviewed the Registrant's disclosure controls and procedures (as defined in Rule 30a-3(c) under the Investment Company Act of 1940 (the “Act”)) as of a date within 90 days of the filing of this report, as required by Rule 30a-3(b) under the Act and Rules 13a-15(b) or 15d‑15(b) under the Securities Exchange Act of 1934. Based on their review, such officers have concluded that the disclosure controls and procedures are effective in ensuring that information required to be disclosed in this report is appropriately recorded, processed, summarized and reported and made known to them by others within the Registrant and by the Registrant’s service provider. |
| (b) | There were no significant changes in the Registrant's internal control over financial reporting (as defined in Rule 30a-3(d) under the Act) that occurred during the second fiscal quarter of the period covered by this report that has materially affected, or is reasonably likely to materially affect, the Registrant's internal control over financial reporting. |
Item 12. Exhibits.
| (a) | (1) Any code of ethics or amendment thereto, that is subject of the disclosure required by Item 2, to the extent that the registrant intends to satisfy Item 2 requirements through filing an exhibit. Not applicable for semi-annual reports. |
(2) Certifications pursuant to Section 302 of the Sarbanes-Oxley Act of 2002. Filed herewith.
(3) Any written solicitation to purchase securities under Rule 23c‑1 under the Act sent or given during the period covered by the report by or on behalf of the registrant to 10 or more persons. Not applicable to open-end investment companies.
| (b) | Certification pursuant to Section 906 of the Sarbanes‑Oxley Act of 2002. Furnished herewith. |
SIGNATURES
Pursuant to the requirements of the Securities Exchange Act of 1934 and the Investment Company Act of 1940, the registrant has duly caused this report to be signed on its behalf by the undersigned, thereunto duly authorized.
(Registrant) Kirr, Marbach Partners Funds, Inc.
By (Signature and Title)* /s/Mr. Mark Foster
Mr. Mark Foster, President
Date June 3, 2016
Pursuant to the requirements of the Securities Exchange Act of 1934 and the Investment Company Act of 1940, this report has been signed below by the following persons on behalf of the registrant and in the capacities and on the dates indicated.
By (Signature and Title)* /s/Mr. Mark Foster
Mr. Mark Foster, President
Date June 3, 2016
By (Signature and Title)* /s/Mr. Mickey Kim
Mr. Mickey Kim, Treasurer
Date June 3, 2016
* Print the name and title of each signing officer under his or her signature.