UNITED STATES
SECURITIES AND EXCHANGE COMMISSION
Washington, D.C. 20549
FORM N-CSR
CERTIFIED SHAREHOLDER REPORT OF REGISTERED MANAGEMENT
INVESTMENT COMPANIES
Investment Company Act file number 811-09037
Nuveen Investment Trust III
(Exact name of registrant as specified in charter)
Nuveen Investments
333 West Wacker Drive Chicago, IL 60606
(Address of principal executive offices) (Zip code)
Kevin J. McCarthy
Nuveen Investments
333 West Wacker Drive Chicago, IL 60606
(Name and address of agent for service)
Registrant’s telephone number, including area code: (312) 917-7700
Date of fiscal year end: September 30
Date of reporting period: March 31, 2007
Form N-CSR is to be used by management investment companies to file reports with the Commission not later than 10 days after the transmission to stockholders of any report that is required to be transmitted to stockholders under Rule 30e-1 under the Investment Company Act of 1940 (17 CFR 270.30e-1). The Commission may use the information provided on Form N-CSR in its regulatory, disclosure review, inspection, and policy making roles.
A registrant is required to disclose the information specified by Form N-CSR, and the Commission will make this information public. A registrant is not required to respond to the collection of information contained in Form N-CSR unless the Form displays a currently valid Office of Management and Budget (“OMB”) control number. Please direct comments concerning the accuracy of the information collection burden estimate and any suggestions for reducing the burden to Secretary, Securities and Exchange Commission, 450 Fifth Street, NW, Washington, DC 20549-0609. The OMB has reviewed this collection of information under the clearance requirements of 44 U.S.C. ss.3507.
Item 1. Reports to Stockholders.
NUVEEN INVESTMENTS MUTUAL FUNDS
| | |
| | |
Semiannual Report dated March 31, 2007 | | For Investors Seeking Attractive
Monthly Income Potential |

Nuveen Investments
Taxable Bond Funds
Nuveen Short Duration Bond Fund
Nuveen Core Bond Fund
Nuveen High Yield Bond Fund


NOW YOU CAN RECEIVE YOUR
NUVEEN INVESTMENTS FUND REPORTS FASTER.
NO MORE WAITING.
SIGN UP TODAY TO RECEIVE NUVEEN INVESTMENTS FUND INFORMATION BY
E-MAIL.
It only takes a minute to sign up for E-Reports. Once enrolled, you’ll receive an e-mail as soon as your Nuveen Investments Fund information is ready — no more waiting for delivery by regular mail. Just click on the link within the e-mail to see the report, and save it on your computer if your wish.

IT’S FAST, EASY & FREE:
www.investordelivery.com
if you get your Nuveen Investments Fund dividends and statements from your financial advisor or brokerage account.
(Be sure to have the address sheet that accompanied this report handy. You’ll need it to complete the enrollment process.)
OR
www.nuveen.com/accountaccess
if you get your Nuveen Investments Fund dividends and statements directly from Nuveen Investments.

Must be preceded by or accompanied by a prospectus.
NOT FDIC INSURED MAY LOSE VALUE NO BANK GUARANTEE

“In addition to
providing regular
income, a bond
investment like
your Fund also
may help you
achieve and benefit
from greater portfolio
diversification – a
potential way to
reduce some of
the risk that comes
with investing.”
Dear Shareholder,
I am pleased to report that over the six-month period covered by this report your Fund continued to provide you with attractive monthly income. For more details about the performance and management strategy of your Fund, please read the Portfolio Manager’s Comments and Fund Spotlight sections of this report.
In addition to providing regular income, a bond investment like your Fund also may help you achieve and benefit from greater portfolio diversification – a potential way to reduce some of the risk that comes with investing. Since one part of your portfolio may be going up when another is going down, portfolio diversification may help smooth your investment returns over time. Your financial advisor can explain these potential advantages in more detail. I urge you to contact him or her soon for more information on this important investment strategy.
As you look through this report, be sure to review the inside front cover. This contains information on how you can receive future Fund reports and other Fund information faster by using e-mails and the internet. You may also help your Fund reduce expenses. Sign up is quick and easy – just follow the step-by-step instructions.
At Nuveen Investments, our mission continues to be to assist you and your financial advisor by offering investment services and products that can help you to secure your financial objectives. We are grateful that you have chosen us as a partner as you pursue your financial goals, and we look forward to continuing to earn your trust in the months and years ahead.
Sincerely,

Timothy R. Schwertfeger
Chairman of the Board
May 15, 2007
Semiannual Report Page 1
Portfolio Manager’s Comments for the Nuveen Short Duration Bond Fund,
Nuveen Core Bond Fund, and Nuveen High Yield Bond Fund
The Nuveen Short Duration, Core, and High Yield Bond Funds feature portfolio management by the Taxable Fixed Income group of Nuveen Asset Management. We recently spoke with Andrew Stenwall, Managing Director, Taxable Fixed Income, and the Funds’ portfolio manager, about the performance and management of the Funds during the six-month reporting period ended March 31, 2007.
How did the Funds perform during the six-month reporting period?
The nearby chart provides the total return on net asset value for the Class A shares of the three Funds for the six months ended March 31, 2007. Each Fund’s total return performance is compared with its corresponding benchmark index and Lipper peer fund category average. All three Funds Class A shares at NAV outperformed their benchmark indexes and performed in line with their Lipper peer group category averages during the period.
Both the Nuveen Short Duration Bond Fund and the Nuveen Core Bond Fund benefited from our multi-strategy approach. During this six-month period our U.S. interest rate strategy, credit positions, global fixed income exposure, and the positioning in mortgage-backed securities all added to relative outperformance. Volatility in commodity markets and the sudden correction in local Chinese stock markets created significant volatility in non-U.S. dollar securities and currencies, which detracted from returns slightly. However, our proprietary risk models helped to limit the exposure to these events.
Both Funds’ interest rate exposure added to performance during the final quarter of 2006. We held short positions in U.S. Treasury securities because we believed that interest rates in the United States were lower than warranted. This stance helped results as yields rose during that quarter and Treasury prices fell accordingly (bond yields and prices move in opposite directions). Also contributing positively was our allocation to lower-rated, higher-yielding bonds, which helped offset our relative underweighting in strong-performing investment-grade debt. Another positive was our lack of exposure during the period to 15-year Government National Mortgage Association (GNMA) mortgage-backed securities, which underperformed, as well as our relative overweighting in 30-year Federal National Mortgage Association (FNMA) mortgage-backed securities, which outperformed.
The Funds also benefited from their exposure to higher-yielding currencies all of which recovered after a period of high volatility. Our exposure to currencies of commodity-exporting countries, proved to be a negative early in 2007 following a sharp correction in commodity markets. By late February, a significant correction in China’s stock market had spilled over to other world stock markets, which in turn led to currency market volatility. Relying on our proprietary risk models, we subsequently reduced exposure and invested in U.S. LIBOR bonds (very short-term, liquid debt). As the markets calmed, we reinvested in currencies, many of which performed well during the first quarter of 2007.
The Nuveen High Yield Bond Fund continues to enjoy solid results relative to its benchmark and Lipper peer group, thanks primarily to effective sector and security selection. During the fourth quarter the Fund’s relatively short duration (price sensitivity to interest rate movements) relative to its benchmark was another positive. Having less price sensitivity was helpful during a quarter in which bond prices generally were trending downward. Overweighting building materials bonds, which performed well, and underweighting aerospace and lodging bonds, which lagged, contributed to results
Semiannual Report Page 2
Class A Shares—
Total Returns as of 3/31/07
| | | | | | |
| | | | | Average Annual |
| | | Cumulative 6-Month | | 1-Year | | Since
inception (12/20/04) |
Nuveen Short Duration Bond Fund | | | | | | |
A Shares at NAV | | 2.55% | | 4.63% | | 2.84% |
A Shares at Offer | | 0.51% | | 2.56% | | 1.94% |
Lipper Short Investment Grade Debt Funds Category Average1 | | 2.57% | | 5.32% | | 3.38% |
Citigroup 1-3 Year Treasury Index2 | | 2.30% | | 4.98% | | 3.11% |
| | | |
Nuveen Core Bond Fund | | | | | | |
A Shares at NAV | | 2.89% | | 5.87% | | 3.12% |
A Shares at Offer | | -0.96% | | 1.89% | | 1.41% |
Lipper Intermediate Investment Grade Debt Funds Category Average3 | | 2.87% | | 6.60% | | 3.66% |
Citigroup Broad Investment Grade Bond Index4 | | 2.76% | | 6.60% | | 3.75% |
| | | |
Nuveen High Yield Bond Fund | | | | | | |
A Shares at NAV | | 7.06% | | 11.16% | | 7.28% |
A Shares at Offer | | 1.96% | | 5.86% | | 5.02% |
Lipper High Current Yield Funds Category Average5 | | 7.06% | | 10.33% | | 7.04% |
Citigroup High Yield BB/B Index6 | | 6.29% | | 10.53% | | 7.11% |
Returns quoted represent past performance, which is no guarantee of future results. Returns at NAV would be lower if the sales charge were included. Returns less than one year are cumulative. Current performance may be higher or lower than the performance shown. Investment returns and principal value will fluctuate so that when shares are redeemed, they may be worth more or less than their original cost. Maximum sales charges for Class A shares of each Fund are 2.0% for Nuveen Short Duration Bond Fund, 3.75% for Nuveen Core Bond Fund, and 4.75% for Nuveen High Yield Bond Fund. Returns do not reflect the deduction of taxes that a shareholder would pay on Fund distributions or the redemption of shares. For the most recent month-end performance, visit www.nuveen.com or call (800) 257-8787.
during the period. Counterbalancing these benefits, our relative underweighting in auto-related, paper, and cable-television bonds generally detracted from performance as these lower-quality sectors tended to outperform the overall market during this period. Sector selection boosted results during the first three months of 2007. Specifically, our continued underweighting in automotive finance bonds and overweightings in chemical, retail, and consumer products bonds contributed to positive overall performance. However, the Fund’s underweighting in gas pipeline bonds and continued limited exposure to cable and paper/forest product bonds was a corresponding negative, as these sectors performed well. Unlike the last three months of 2006, the Fund’s relatively short duration proved to be a negative when interest rates fell and the market outperformed in February 2007.
What strategies were used to manage the Funds during the period, and how did these strategies influence performance?
We manage both the Short Duration and Core Bond Funds with similar strategies. Both Funds principally invest in corporate debt securities, including bonds, notes, and debentures; U.S. government obligations; foreign debt securities; mortgage-related securities issued by governments, their agencies or instrumentalities, or corporations; and asset-backed securities. In addition, in an effort to enhance returns and manage risk, both Funds
| 1 | The Lipper Short Investment Grade Debt Funds Category Average represents the cumulative or average annualized total returns for the 30 largest funds in the Lipper Short Investment Grade Debt Funds Category for the periods ended March 31, 2007. The since inception data for the Lipper index represents returns for the period 12/31/04 - 3/31/07, as returns for the index are calculated on a calendar-month basis. The returns account for the effects of management fees and assume reinvestment of dividends, but do not reflect any applicable sales charges. You cannot invest directly in a Lipper index. |
| 2 | The Citigroup 1-3 Year Treasury Index is an index comprised of U.S. Treasury Notes and Bonds with maturities of one year or greater, but less than three years (minimum amount outstanding is $1 billion per issue). The since inception data for the Index represents returns for the period 12/31/04 - 3/31/07, as returns for the Index are calculated on a calendar-month basis. An index is not available for direct investment. |
| 3 | The Lipper Intermediate Investment Grade Debt Funds Category Average represents the cumulative or average annualized total returns for the 30 largest funds in the Lipper Intermediate Investment Grade Debt Funds Category for the periods ended March 31, 2007. The since inception data for the Lipper index represents returns for the period 12/31/04 - 3/31/07, as returns for the index are calculated on a calendar-month basis. The returns account for the effects of management fees and assume reinvestment of dividends, but do not reflect any applicable sales charges. You cannot invest directly in a Lipper index. |
| 4 | The Citigroup Broad Investment Grade Bond Index (the “BIG” Index) is an unmanaged index generally considered representative of the U.S. investment grade bond market. The since inception data for the Index represents returns for the period 12/31/04 - 3/31/07, as returns for the Index are calculated on a calendar-month basis. An index is not available for direct investment. |
| 5 | The Lipper High Current Yield Funds Category Average represents the cumulative or average annualized total returns for the 30 largest funds in the Lipper High Current Yield Funds Category for the periods ended March 31, 2007. The since inception data for the Lipper index represents returns for the period 12/31/04 - 3/31/07, as returns for the index are calculated on a calendar-month basis. The returns account for the effects of management fees and assume reinvestment of dividends, but do not reflect any applicable sales charges. You cannot invest directly in a Lipper index. |
| 6 | The Citigroup High Yield BB/B Index is a market capitalization-weighted index that comprises all high-yield issues rated BB or B by Standard & Poor’s for which Citigroup calculates a monthly return. The since inception data for the Index represents returns for the period 12/31/04 - 3/31/07, as returns for the Index are calculated on a calendar-month basis. An index is not available for direct investment. |
Semiannual Report Page 3
employ a variety of strategies that may include the use of futures, options, swaps, and other derivatives to create debt or foreign currency exposures designed to take advantage of our outlook for the global economic environment and the expected relative performance of different sectors of and securities in the fixed-income market.
In the High Yield Bond Fund, we generally invest at least 80% of the Fund’s assets in both domestic and foreign corporate high yield debt securities, including zero-coupon, payment in-kind, and convertible bonds. These securities generally are rated BB or below at the time of purchase or are unrated. In addition, the Fund also invests in domestic and foreign corporate investment grade securities; U.S. government obligations, including U.S. Treasury securities and securities issued by U.S. government agencies or instrumentalities; and cash equivalents and other short-duration investments. At times, in an effort to hedge risk, enhance returns, or as a substitute for a position in the underlying asset, the Fund also may invest in futures, options, interest rate or total return swaps, credit derivatives, or other fixed-income derivative instruments.
In the lower-rated portion of the bond market, volatility in credit spreads – the premium investors expect in exchange for taking on additional credit risk – remained relatively attractive during this six-month period. Issuer fundamentals have remained strong and corporate default rates are expected to stay well below their historical averages. Despite the strong fundamentals, we looked for opportunities to reduce the Funds’ risk by selling some lower-quality bonds that we believed were overvalued.
We remained relatively inactive in the mortgage-backed securities (MBS) market during the period as these investments turned in a relatively flat performance, especially during the first quarter of 2007. This was due primarily to uncertainty about interest rates and market volatility, as well as turmoil in the subprime mortgage market. None of the Funds had exposure to the subprime debt market during the period.
Over this period, countries with low fixed-income yields, strongly appreciating currencies, and robust economic growth generally saw higher inflation and, in some cases, interest rate increases from their central banks. Countries with higher-yielding securities generally saw inflation decelerate or stabilize and their central banks either lowered or kept interest rates steady. In the Short Duration and Core Bond Funds, we owned long positions in debt of higher-yielding countries such as Turkey, Columbia, Hungary, Poland, and Mexico. We also owned Norwegian interest rate swaps, believing that the country’s central bank would not raise interest rates as aggressively as others in the market appeared to believe. Our interest rate positions proved to be positives overall during the first quarter of 2007, with our Brazilian positions making especially favorable contributions to relative performance.
Dividend Information
Each Fund seeks to pay dividends at a rate that reflects the past and projected performance of the Fund. To permit a Fund to maintain a more stable monthly dividend, the Fund may pay dividends at a rate that may be more or less than the amount of net investments income actually earned by the Fund during the period. If the Fund has cumulatively earned more than it has paid in dividends, it will hold the excess in reserve as undistributed net investment income (UNII) as part of the Fund’s net asset value. Conversely, if the Fund has cumulatively paid in dividends more than it has earned, the excess will constitute a negative UNII that will likewise be reflected in the Fund’s net asset value. Each Fund will, over time, pay all its net investment income as dividends to shareholders. As of March 31, 2007, the Nuveen Short Duration Bond Fund and Nuveen Core Bond Fund had negative UNII balances for financial statement purposes and positive UNII balances, based on our best estimate, for tax purposes. The Nuveen High Yield Bond Fund had a positive UNII balance for financial statement purposes, and a positive UNII balance, based on our best estimate, for tax purposes.
Semiannual Report Page 4
Fund Spotlight as of 3/31/07 Nuveen Short Duration Bond Fund
| | | | | | |
| Quick Facts | | | | | | |
| | | A Shares | | C Shares | | R Shares |
NAV | | $19.29 | | $19.30 | | $19.26 |
Latest Monthly Dividend1 | | $0.0730 | | $0.0610 | | $0.0770 |
Inception Date | | 12/20/04 | | 12/20/04 | | 12/20/04 |
Returns quoted represent past performance which is no guarantee of future results. Returns without sales charges would be lower if the sales charge were included. Current performance may be higher or lower than the performance shown. Investment returns and principal value will fluctuate so that when shares are redeemed, they may be worth more or less than their original cost. Returns do not reflect the deduction of taxes that a shareholder would pay on Fund distributions or the redemption of shares. For the most recent month-end performance visit www.nuveen.com or call (800) 257-8787.
Fund returns assume reinvestment of dividends and capital gains. Class A shares have a 2.00% maximum sales charge. Class C shares have a 1% contingent deferred sales charge (CDSC), also known as a back-end sales charge, for redemptions within less than one year, which is not reflected in the one-year total return. Class R shares have no sales charge and may be purchased under limited circumstances or by specified classes of investors. Returns reflect an expense limitation by the Fund’s investment adviser.
| | | | |
| Average Annual Total Returns as of 3/31/07 |
| | |
| A Shares | | NAV | | Offer |
1-Year | | 4.63% | | 2.56% |
Since Inception | | 2.84% | | 1.94% |
| | |
| C Shares | | NAV | | |
1-Year | | 3.85% | | |
Since Inception | | 2.08% | | |
| | |
| R Shares | | NAV | | |
1-Year | | 4.90% | | |
Since Inception | | 3.04% | | |
| Yields | | | | |
| | |
| A Shares | | NAV | | Offer |
Dividend Yield4 | | 4.54% | | 4.45% |
SEC 30-Day Yield5 | | 4.66% | | 4.57% |
| | |
| C Shares | | NAV | | |
Dividend Yield4 | | 3.79% | | |
SEC 30-Day Yield | | 3.91% | | |
| | |
| R Shares | | NAV | | |
Dividend Yield4 | | 4.80% | | |
SEC 30-Day Yield | | 4.91% | | |
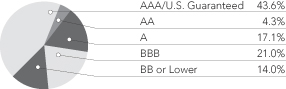
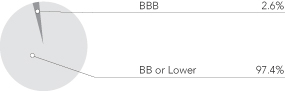
Credit Quality2
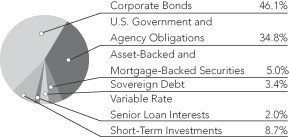
Portfolio Allocation3
| | |
Net Assets ($000) | | $11,352 |
| 1 | Paid April 2, 2007. This is the latest monthly dividend declared during the period ended March 31, 2007. |
| 2 | As a percentage of total investments (excluding securities sold short, short-term investments and derivative transactions) as of March 31, 2007. Holdings are subject to change. |
| 3 | As a percentage of total investments (excluding securities sold short and derivative transactions) as of March 31, 2007. Holdings are subject to change. |
| 4 | Dividend Yield is the most recent dividend per share (annualized) divided by the appropriate price per share. The SEC 30-Day Yield is a standardized measure of the current market yield on the Fund’s portfolio and is based on the maximum offer price per share. The Dividend Yield also differs from the SEC 30-Day Yield because the Fund may be paying out more or less than it is earning and it may not include the effect of amortization of bond premium. |
| 5 | The SEC 30-Day Yield on A Shares at NAV applies only to A Shares purchased at no-load pursuant to the Fund’s policy permitting waiver of the A Share load in certain specified circumstances. |
Semiannual Report l Page 5
Fund Spotlight as of 3/31/07 Nuveen Short Duration Bond Fund
| | |
| Industry/Security Type1 |
U.S. Treasury Bonds/Notes | | 34.8% |
Electric Utilities | | 6.6% |
Residentials – Mortgage-Backed Securities | | 4.6% |
Sovereign Debt | | 3.4% |
Metals & Mining | | 3.2% |
Capital Markets | | 3.1% |
Media | | 3.0% |
Pharmaceuticals | | 2.5% |
Commercial Banks | | 2.4% |
Food Products | | 2.3% |
Multi-Utilities | | 2.3% |
Diversified Telecommunication Services | | 2.3% |
Road & Rail | | 2.0% |
Oil, Gas & Consumable Fuels | | 1.6% |
Machinery | | 1.5% |
Health Care Providers & Services | | 1.5% |
Short-Term Investments | | 8.7% |
Other | | 14.2% |
| 1 | As a percentage of total investments (excluding securities sold short and derivative transactions) as of March 31, 2007. Holdings are subject to change. |
Expense Example
As a shareholder of the Fund, you incur two types of costs: (1) transaction costs, including front and back end sales charges (loads) or redemption fees, where applicable; and (2) ongoing costs, including management fees; distribution and service (12b-1) fees, where applicable; and other Fund expenses. This Example is intended to help you understand your ongoing costs (in dollars) of investing in the Fund and to compare these costs with the ongoing costs of investing in other mutual funds.
The Example below is based on an investment of $1,000 invested at the beginning of the period and held for the period.
The information under “Actual Performance,” together with the amount you invested, allows you to estimate actual expenses incurred over the reporting period. Simply divide your account value by $1,000 (for example, an $8,600 account value divided by $1,000 = 8.60) and multiply the result by the cost shown for your share class, in the row entitled “Expenses Incurred During Period” to estimate the expenses incurred on your account during this period.
The information under “Hypothetical Performance,” provides information about hypothetical account values and hypothetical expenses based on the Fund’s actual expense ratio and an assumed rate of return of 5% per year before expenses, which is not the Fund’s actual return. The hypothetical account values and expenses may not be used to estimate the actual ending account balance or expense you incurred for the period. You may use this information to compare the ongoing costs of investing in the Fund and other Funds. To do so, compare this 5% hypothetical example with the 5% hypothetical examples that appear in the shareholder reports of the other funds.
Please note that the expenses shown in the table are meant to highlight your ongoing costs only and do not reflect any transactional costs, such as front and back end sales charges (loads) or redemption fees, where applicable. Therefore, the hypothetical information is useful in comparing ongoing costs only, and will not help you determine the relative total costs of owning different funds or share classes. In addition, if these transactional costs were included, your costs would have been higher.
| | | | | | | | | | | | | | | | | | | | |
| | | | | | | | | | | Hypothetical Performance |
| | | |
| | | Actual Performance | | | | (5% return before expenses) |
| | | | | | | |
| | | A Shares | | C Shares | | R Shares | | | | A Shares | | C Shares | | R Shares |
Beginning Account Value (10/01/06) | | $ | 1,000.00 | | $ | 1,000.00 | | $ | 1,000.00 | | | | $ | 1,000.00 | | $ | 1,000.00 | | $ | 1,000.00 |
Ending Account Value (3/31/07) | | $ | 1,025.50 | | $ | 1,021.10 | | $ | 1,026.80 | | | | $ | 1,022.14 | | $ | 1,018.35 | | $ | 1,023.34 |
Expenses Incurred During Period | | $ | 2.83 | | $ | 6.65 | | $ | 1.62 | | | | $ | 2.82 | | $ | 6.64 | | $ | 1.61 |
For each class of the Fund, expenses are equal to the Fund’s annualized expense ratio of .56%, 1.32%, and .32% for Classes A, C and R, respectively, multiplied by the average account value over the period, multiplied by 182/365 (to reflect the one-half year period).
Semiannual Report l Page 6
Fund Spotlight as of 3/31/07 Nuveen Core Bond Fund
| | | | | | | | |
| Quick Facts | | | | | | | | |
| | | A Shares | | B Shares | | C Shares | | R Shares |
NAV | | $19.38 | | $19.42 | | $19.40 | | $19.37 |
Latest Monthly Dividend1 | | $0.0775 | | $0.0655 | | $0.0655 | | $0.0815 |
Inception Date | | 12/20/04 | | 12/20/04 | | 12/20/04 | | 12/20/04 |
Returns quoted represent past performance which is no guarantee of future results. Returns without sales charges would be lower if the sales charge were included. Current performance may be higher or lower than the performance shown. Investment returns and principal value will fluctuate so that when shares are redeemed, they may be worth more or less than their original cost. Returns do not reflect the deduction of taxes that a shareholder would pay on Fund distributions or the redemption of shares. For the most recent month-end performance visit www.nuveen.com or call (800) 257-8787.
Fund returns assume reinvestment of dividends and capital gains. Class A shares have a 3.75% maximum sales charge. Class B shares have a contingent deferred sales charge (CDSC), also known as a back-end sales charge, that begins at 5% for redemptions during the first year after purchase and declines periodically to 0% over the following five years. Class B shares automatically convert to Class A shares eight years after purchase. Class C shares have a 1% CDSC for redemptions within less than one year, which is not reflected in the one-year total return. Class R shares have no sales charge and may be purchased under limited circumstances or by specified classes of investors. Returns reflect an expense limitation by the Fund’s investment adviser.
| | | | |
| Average Annual Total Returns as of 3/31/07 |
| | |
| A Shares | | NAV | | Offer |
1-Year | | 5.87% | | 1.89% |
Since Inception | | 3.12% | | 1.41% |
| | |
| B Shares | | w/o CDSC | | w/CDSC |
1-Year | | 5.24% | | 1.24% |
Since Inception | | 2.42% | | 0.76% |
| | |
| C Shares | | NAV | | w/CDSC |
1-Year | | 5.14% | | |
Since Inception | | 2.38% | | |
| | |
| R Shares | | NAV | | |
1-Year | | 6.25% | | |
Since Inception | | 3.36% | | |
| Yields |
| | |
| A Shares | | NAV | | Offer |
Dividend Yield4 | | 4.80% | | 4.62% |
SEC 30-Day Yield5 | | 4.82% | | 4.64% |
| | |
| B Shares | | NAV | | |
Dividend Yield4 | | 4.05% | | |
SEC 30-Day Yield | | 5.17% | | |
| | |
| C Shares | | NAV | | |
Dividend Yield4 | | 4.05% | | |
SEC 30-Day Yield | | 4.07% | | |
| | |
| R Shares | | NAV | | |
Dividend Yield4 | | 5.05% | | |
SEC 30-Day Yield | | 5.08% | | |
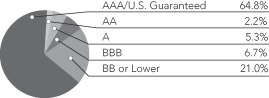
Credit Quality2
Portfolio Allocation3
| | |
Net Assets ($000) | | $12,290 |
| 1 | Paid April 2, 2007. This is the latest monthly dividend declared during the period ended March 31, 2007. |
| 2 | As a percentage of total investments (excluding securities sold short, short-term investments and derivative transactions) as of March 31, 2007. Holdings are subject to change. |
| 3 | As a percentage of total investments (excluding securities sold short and derivative transactions) as of March 31, 2007. Holdings are subject to change. |
| 4 | Dividend Yield is the most recent dividend per share (annualized) divided by the appropriate price per share. The SEC 30-Day Yield is a standardized measure of the current market yield on the Fund’s portfolio and is based on the maximum offer price per share. The Dividend Yield also differs from the SEC 30-Day Yield because the Fund may be paying out more or less than it is earning and it may not include the effect of amortization of bond premium. |
| 5 | The SEC 30-Day Yield on A Shares at NAV applies only to A Shares purchased at no-load pursuant to the Fund’s policy permitting waiver of the A Share load in certain specified circumstances. |
Semiannual Report l Page 7
Fund Spotlight as of 3/31/07 Nuveen Core Bond Fund
| | |
| Industry/Security Type1 |
Residentials – Mortgage-Backed Securities | | 38.5% |
U.S. Treasury Bonds/Notes | | 10.5% |
Metals & Mining | | 3.9% |
Sovereign Debt | | 3.9% |
Oil, Gas & Consumable Fuels | | 3.1% |
Chemicals | | 1.6% |
Cards – Asset-Backed Securities | | 1.6% |
Media | | 1.5% |
Short-Term Investments | | 20.7% |
Other | | 14.7% |
| 1 | As a percentage of total investments (excluding securities sold short and derivative transactions) as of March 31, 2007. Holdings are subject to change. |
Expense Example
As a shareholder of the Fund, you incur two types of costs: (1) transaction costs, including front and back end sales charges (loads) or redemption fees, where applicable; and (2) ongoing costs, including management fees; distribution and service (12b-1) fees, where applicable; and other Fund expenses. This Example is intended to help you understand your ongoing costs (in dollars) of investing in the Fund and to compare these costs with the ongoing costs of investing in other mutual funds.
The Example below is based on an investment of $1,000 invested at the beginning of the period and held for the period.
The information under “Actual Performance,” together with the amount you invested, allows you to estimate actual expenses incurred over the reporting period. Simply divide your account value by $1,000 (for example, an $8,600 account value divided by $1,000 = 8.60) and multiply the result by the cost shown for your share class, in the row entitled “Expenses Incurred During Period” to estimate the expenses incurred on your account during this period.
The information under “Hypothetical Performance,” provides information about hypothetical account values and hypothetical expenses based on the Fund’s actual expense ratio and an assumed rate of return of 5% per year before expenses, which is not the Fund’s actual return. The hypothetical account values and expenses may not be used to estimate the actual ending account balance or expense you incurred for the period. You may use this information to compare the ongoing costs of investing in the Fund and other Funds. To do so, compare this 5% hypothetical example with the 5% hypothetical examples that appear in the shareholder reports of the other funds.
Please note that the expenses shown in the table are meant to highlight your ongoing costs only and do not reflect any transactional costs, such as front and back end sales charges (loads) or redemption fees, where applicable. Therefore, the hypothetical information is useful in comparing ongoing costs only, and will not help you determine the relative total costs of owning different funds or share classes. In addition, if these transactional costs were included, your costs would have been higher.
| | | | | | | | | | | | | | | | | | | | | | | | | | |
| | | | | | | Hypothetical Performance |
| | | |
| | | Actual Performance | | | | (5% return before expenses) |
| | | | | | | | | |
| | | A Shares | | B Shares | | C Shares | | R Shares | | | | A Shares | | B Shares | | C Shares | | R Shares |
Beginning Account Value (10/01/06) | | $ | 1,000.00 | | $ | 1,000.00 | | $ | 1,000.00 | | $ | 1,000.00 | | | | $ | 1,000.00 | | $ | 1,000.00 | | $ | 1,000.00 | | $ | 1,000.00 |
Ending Account Value (3/31/07) | | $ | 1,028.90 | | $ | 1,026.70 | | $ | 1,026.20 | | $ | 1,031.30 | | | | $ | 1,021.34 | | $ | 1,018.95 | | $ | 1,017.60 | | $ | 1,022.59 |
Expenses Incurred During Period | | $ | 3.64 | | $ | 6.06 | | $ | 7.43 | | $ | 2.38 | | | | $ | 3.63 | | $ | 6.04 | | $ | 7.39 | | $ | 2.37 |
For each class of the Fund, expenses are equal to the Fund’s annualized expense ratio of .72%, 1.20%, 1.47% and .47% for Classes A, B, C and R, respectively, multiplied by the average account value over the period, multiplied by 182/365 (to reflect the one-half year period).
Semiannual Report l Page 8
Fund Spotlight as of 3/31/07 Nuveen High Yield Bond Fund
| | | | | | | | |
| Quick Facts | | | | | | | | |
| | | A Shares | | B Shares | | C Shares | | R Shares |
NAV | | $20.00 | | $19.98 | | $19.96 | | $19.98 |
Latest Monthly Dividend1 | | $0.1200 | | $0.1075 | | $0.1075 | | $0.1240 |
Inception Date | | 12/20/04 | | 12/20/04 | | 12/20/04 | | 12/20/04 |
Returns quoted represent past performance which is no guarantee of future results. Returns without sales charges would be lower if the sales charge were included. Current performance may be higher or lower than the performance shown. Investment returns and principal value will fluctuate so that when shares are redeemed, they may be worth more or less than their original cost. Returns do not reflect the deduction of taxes that a shareholder would pay on Fund distributions or the redemption of shares. For the most recent month-end performance visit www.nuveen.com or call (800) 257-8787.
Fund returns assume reinvestment of dividends and capital gains. Class A shares have a 4.75% maximum sales charge. Class B shares have a contingent deferred sales charge (CDSC), also known as a back-end sales charge, that begins at 5% for redemptions during the first year after purchase and declines periodically to 0% over the following five years. Class B shares automatically convert to Class A shares eight years after purchase. Class C shares have a 1% CDSC for redemptions within less than one year, which is not reflected in the one-year total return. Class R shares have no sales charge and may be purchased under limited circumstances or by specified classes of investors. Returns reflect an expense limitation by the Fund’s investment adviser.
| | | | |
| Average Annual Total Returns as of 3/31/07 |
| | |
| A Shares | | NAV | | Offer |
1-Year | | 11.16% | | 5.86% |
Since Inception | | 7.28% | | 5.02% |
| | |
| B Shares | | w/o CDSC | | w/CDSC |
1-Year | | 10.18% | | 6.18% |
Since Inception | | 6.42% | | 4.79% |
| | |
| C Shares | | NAV | | w/CDSC |
1-Year | | 10.07% | | |
Since Inception | | 6.37% | | |
| | |
| R Shares | | NAV | | |
1-Year | | 11.27% | | |
Since Inception | | 7.50% | | |
| Yields |
| | |
| A Shares | | NAV | | Offer |
Dividend Yield4 | | 7.20% | | 6.86% |
SEC 30-Day Yield5 | | 7.13% | | 6.79% |
| | |
| B Shares | | NAV | | |
Dividend Yield4 | | 6.46% | | |
SEC 30-Day Yield | | 6.37% | | |
| | |
| C Shares | | NAV | | |
Dividend Yield4 | | 6.46% | | |
SEC 30-Day Yield | | 6.37% | | |
| | |
| R Shares | | NAV | | |
Dividend Yield4 | | 7.45% | | |
SEC 30-Day Yield | | 7.39% | | |
Credit Quality2
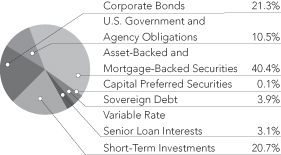
Portfolio Allocation3
| | |
Net Assets ($000) | | $22,221 |
| 1 | Paid April 2, 2007. This is the latest monthly dividend declared during the period ended March 31, 2007. |
| 2 | As a percentage of total investments (excluding short-term investments and derivative transactions) as of March 31, 2007. Holdings are subject to change. |
| 3 | As a percentage of total investments (excluding derivative transactions) as of March 31, 2007. Holdings are subject to change. |
| 4 | Dividend Yield is the most recent dividend per share (annualized) divided by the appropriate price per share. The SEC 30-Day Yield is a standardized measure of the current market yield on the Fund’s portfolio and is based on the maximum offer price per share. The Dividend Yield also differs from the SEC 30-Day Yield because the Fund may be paying out more or less than it is earning and it may not include the effect of amortization of bond premium. |
| 5 | The SEC 30-Day Yield on A Shares at NAV applies only to A Shares purchased at no-load pursuant to the Fund’s policy permitting waiver of the A Share load in certain specified circumstances. |
Semiannual Report l Page 9
Fund Spotlight as of 3/31/07 Nuveen High Yield Bond Fund
| | |
| Industries1 |
Metals & Mining | | 11.9% |
Media | | 11.5% |
Chemicals | | 9.8% |
Oil, Gas & Consumable Fuels | | 7.8% |
Energy Equipment & Services | | 6.5% |
Paper & Forest Products | | 4.2% |
Automobiles | | 3.9% |
Hotels, Restaurants & Leisure | | 3.2% |
Commercial Services & Supplies | | 3.2% |
Containers & Packaging | | 2.8% |
Consumer Finance | | 2.5% |
Multi-Utilities | | 2.3% |
Pharmaceuticals | | 1.9% |
Diversified Telecommunication Services | | 1.7% |
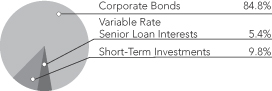
Short-Term Investments | | 9.8% |
Other | | 17.0% |
| 1 | As a percentage of total investments (excluding derivative transactions) as of March 31, 2007. Holdings are subject to change. |
Expense Example
As a shareholder of the Fund, you incur two types of costs: (1) transaction costs, including front and back end sales charges (loads) or redemption fees, where applicable; and (2) ongoing costs, including management fees; distribution and service (12b-1) fees, where applicable; and other Fund expenses. This Example is intended to help you understand your ongoing costs (in dollars) of investing in the Fund and to compare these costs with the ongoing costs of investing in other mutual funds.
The Example below is based on an investment of $1,000 invested at the beginning of the period and held for the period.
The information under “Actual Performance,” together with the amount you invested, allows you to estimate actual expenses incurred over the reporting period. Simply divide your account value by $1,000 (for example, an $8,600 account value divided by $1,000 = 8.60) and multiply the result by the cost shown for your share class, in the row entitled “Expenses Incurred During Period” to estimate the expenses incurred on your account during this period.
The information under “Hypothetical Performance,” provides information about hypothetical account values and hypothetical expenses based on the Fund’s actual expense ratio and an assumed rate of return of 5% per year before expenses, which is not the Fund’s actual return. The hypothetical account values and expenses may not be used to estimate the actual ending account balance or expense you incurred for the period. You may use this information to compare the ongoing costs of investing in the Fund and other Funds. To do so, compare this 5% hypothetical example with the 5% hypothetical examples that appear in the shareholder reports of the other funds.
Please note that the expenses shown in the table are meant to highlight your ongoing costs only and do not reflect any transactional costs, such as front and back end sales charges (loads) or redemption fees, where applicable. Therefore, the hypothetical information is useful in comparing ongoing costs only, and will not help you determine the relative total costs of owning different funds or share classes. In addition, if these transactional costs were included, your costs would have been higher.
| | | | | | | | | | | | | | | | | | | | | | | | | | |
| | | | | | | Hypothetical Performance |
| | | |
| | | Actual Performance | | | | (5% return before expenses) |
| | | | | | | | | |
| | | A Shares | | B Shares | | C Shares | | R Shares | | | | A Shares | | B Shares | | C Shares | | R Shares |
Beginning Account Value (10/01/06) | | $ | 1,000.00 | | $ | 1,000.00 | | $ | 1,000.00 | | $ | 1,000.00 | | | | $ | 1,000.00 | | $ | 1,000.00 | | $ | 1,000.00 | | $ | 1,000.00 |
Ending Account Value (3/31/07) | | $ | 1,070.60 | | $ | 1,066.20 | | $ | 1,065.70 | | $ | 1,072.00 | | | | $ | 1,020.89 | | $ | 1,017.20 | | $ | 1,017.15 | | $ | 1,022.14 |
Expenses Incurred During Period | | $ | 4.18 | | $ | 7.98 | | $ | 8.03 | | $ | 2.89 | | | | $ | 4.08 | | $ | 7.80 | | $ | 7.85 | | $ | 2.82 |
For each class of the Fund, expenses are equal to the Fund’s annualized expense ratio of .81%, 1.55%, 1.56% and .56% for Classes A, B, C and R, respectively, multiplied by the average account value over the period, multiplied by 182/365 (to reflect the one-half year period).
Semiannual Report l Page 10
Portfolio of Investments (Unaudited)
Nuveen Short Duration Bond Fund
March 31, 2007
| | | | | | | | | | | | |
Principal
Amount (000) | | Description | | Coupon | | Maturity | | Ratings (1) | | Value |
| | | | | |
| | | CORPORATE BONDS – 52.0% | | | | | | | | | |
| | | Aerospace & Defense – 0.9% | | | | | | | | | |
| | | | | |
| $ | 100 | | Raytheon Company | | 6.750% | | 8/15/07 | | BBB+ | | $ | 100,437 |
| | | Automobiles – 0.9% | | | | | | | | | |
| | | | | |
| | 100 | | DaimlerChrysler NA Holding Corporation | | 4.750% | | 1/15/08 | | Baa1 | | | 99,548 |
| | | Beverages – 0.9% | | | | | | | | | |
| | | | | |
| | 100 | | Miller Brewing Company, 144A | | 4.250% | | 8/15/08 | | BBB+ | | | 98,514 |
| | | Capital Markets – 3.5% | | | | | | | | | |
| | | | | |
| | 100 | | ABN AMRO Bank NV Chicago | | 7.125% | | 6/18/07 | | Aa2 | | | 100,350 |
| | | | | |
| | 100 | | Credit Suisse First Boston | | 5.750% | | 4/15/07 | | AA– | | | 100,007 |
| | | | | |
| | 100 | | Goldman Sachs Group, Inc. | | 4.125% | | 1/15/08 | | AA– | | | 99,181 |
| | | | | |
| | 100 | | Lehamn Brothers Holdings Inc. | | 8.250% | | 6/15/07 | | A+ | | | 100,554 |
| | 400 | | Total Capital Markets | | | | | | | | | 400,092 |
| | | Chemicals – 1.2% | | | | | | | | | |
| | | | | |
| | 50 | | Equistar Chemicals LP | | 8.750% | | 2/15/09 | | BB– | | | 52,375 |
| | | | | |
| | 25 | | Lyondell Chemical Company | | 10.875% | | 5/01/09 | | B | | | 25,250 |
| | | | | |
| | 50 | | PolyOne Corporation | | 10.625% | | 5/15/10 | | B+ | | | 53,000 |
| | 125 | | Total Chemicals | | | | | | | | | 130,625 |
| | | Commercial Banks – 2.7% | | | | | | | | | |
| | | | | |
| | 100 | | JP Morgan Chase & Company | | 4.000% | | 2/01/08 | | Aa2 | | | 98,924 |
| | | | | |
| | 100 | | US Bank National Association | | 6.300% | | 7/15/08 | | AA | | | 101,465 |
| | | | | |
| | 100 | | Wachovia Corporation | | 6.250% | | 8/04/08 | | A+ | | | 100,997 |
| | 300 | | Total Commercial Banks | | | | | | | | | 301,386 |
| | | Commercial Services & Supplies – 0.5% | | | | | | | | | |
| | | | | |
| | 60 | | Allied Waste North America | | 6.500% | | 11/15/10 | | BB | | | 60,450 |
| | | Diversified Telecommunication Services – 2.6% | | | | | | | | | |
| | | | | |
| | 100 | | CenturyTel Inc. | | 4.628% | | 5/15/07 | | BBB | | | 99,910 |
| | | | | |
| | 40 | | Citizens Communications Company | | 7.625% | | 8/15/08 | | BB+ | | | 41,400 |
| | | | | |
| | 100 | | Sprint Capital Corporation, Unsecured Note | | 6.125% | | 11/15/08 | | BBB | | | 101,310 |
| | | | | |
| | 50 | | US West Communications Inc. | | 5.625% | | 11/15/08 | | BB+ | | | 50,250 |
| | 290 | | Total Diversified Telecommunication Services | | | | | | | | | 292,870 |
| | | Electric Utilities – 7.4% | | | | | | | | | |
| | | | | |
| | 100 | | Cinergy Corporation | | 6.530% | | 12/16/08 | | Baa2 | | | 101,894 |
| | | | | |
| | 50 | | Commonwealth Edison Company, First Mortgage | | 3.700% | | 2/01/08 | | BBB | | | 49,087 |
| | | | | |
| | 100 | | Constellation Energy Group | | 6.350% | | 4/01/07 | | BBB+ | | | 100,000 |
| | | | | |
| | 100 | | Florida Power Corporation | | 6.810% | | 7/01/07 | | A3 | | | 100,303 |
| | | | | |
| | 100 | | Niagara Mohawk Power Corporation, Series 1998G | | 7.750% | | 10/01/08 | | A– | | | 103,552 |
| | | | | |
| | 100 | | Ohio Edison Company | | 4.000% | | 5/01/08 | | Baa2 | | | 98,683 |
| | | | | |
| | 100 | | PPL Electric Utilities Corporation | | 5.875% | | 8/15/07 | | A– | | | 100,157 |
| | | | | |
| | 100 | | Public Service Electric & Gas Company, Series 2003C | | 4.000% | | 11/01/08 | | A– | | | 98,289 |
| | | | | |
| | 100 | | Puget Sound Energy Inc. | | 3.363% | | 6/01/08 | | BBB | | | 97,738 |
| | 850 | | Total Electric Utilities | | | | | | | | | 849,703 |
11
Portfolio of Investments (Unaudited)
Nuveen Short Duration Bond Fund (continued)
March 31, 2007
| | | | | | | | | | | | |
Principal
Amount (000) | | Description | | Coupon | | Maturity | | Ratings (1) | | Value |
| | | Energy Equipment & Services – 0.2% | | | | | | | | | |
| | | | | |
| $ | 25 | | Northwest Pipeline Corporation | | 6.625% | | 12/01/07 | | BB+ | | $ | 25,188 |
| | | Food Products – 2.6% | | | | | | | | | |
| | | | | |
| | 100 | | Campbell Soup Company | | 5.875% | | 10/01/08 | | A | | | 100,853 |
| | | | | |
| | 100 | | Kellogg Company | | 2.875% | | 6/01/08 | | A3 | | | 97,228 |
| | | | | |
| | 100 | | Kraft Foods Inc. | | 5.250% | | 6/01/07 | | A– | | | 99,946 |
| | 300 | | Total Food Products | | | | | | | | | 298,027 |
| | | Gas Utilities – 1.6% | | | | | | | | | |
| | | | | |
| | 100 | | Noram Energy Corporation | | 6.500% | | 2/01/08 | | BBB | | | 100,832 |
| | | | | |
| | 30 | | SEMCO Energy | | 7.125% | | 5/15/08 | | Ba2 | | | 30,383 |
| | | | | |
| | 50 | | Southern Natural Gas | | 6.125% | | 9/15/08 | | Baa3 | | | 50,759 |
| | 180 | | Total Gas Utilities | | | | | | | | | 181,974 |
| | | Health Care Equipment & Supplies – 0.9% | | | | | | | | | |
| | | | | |
| | 100 | | Baxter International Inc. | | 7.250% | | 2/15/08 | | A | | | 101,639 |
| | | Health Care Providers & Services – 1.7% | | | | | | | | | |
| | | | | |
| | 100 | | UnitedHealth Group Inc. | | 3.750% | | 2/10/09 | | A | | | 97,457 |
| | | | | |
| | 100 | | Wellpoint Inc. | | 3.750% | | 12/14/07 | | BBB+ | | | 98,901 |
| | 200 | | Total Health Care Providers & Services | | | | | | | | | 196,358 |
| | | Hotels, Restaurants & Leisure – 1.4% | | | | | | | | | |
| | | | | |
| | 50 | | Park Place Entertainment | | 8.875% | | 9/15/08 | | Ba1 | | | 52,250 |
| | | | | |
| | 100 | | Tricon Global Restaurants Inc. | | 7.650% | | 5/15/08 | | BBB | | | 102,411 |
| | 150 | | Total Hotels, Restaurants & Leisure | | | | | | | | | 154,661 |
| | | Household Durables – 1.1% | | | | | | | | | |
| | | | | |
| | 25 | | Beazer Homes USA, Inc. | | 8.625% | | 5/15/11 | | Ba1 | | | 24,563 |
| | | | | |
| | 50 | | D.R. Horton, Inc. | | 7.500% | | 12/01/07 | | BBB– | | | 50,641 |
| | | | | |
| | 25 | | KB Home | | 9.500% | | 2/15/11 | | Ba2 | | | 25,656 |
| | | | | |
| | 25 | | Toll Corporation | | 8.250% | | 2/01/11 | | BB+ | | | 25,625 |
| | 125 | | Total Household Durables | | | | | | | | | 126,485 |
| | | Industrial Conglomerates – 0.9% | | | | | | | | | |
| | | | | |
| | 100 | | Tyco International Group SA | | 6.125% | | 11/01/08 | | BBB+ | | | 101,384 |
| | | Insurance – 0.9% | | | | | | | | | |
| | | | | |
| | 100 | | Prudential Financial Inc. | | 3.750% | | 5/01/08 | | A | | | 98,488 |
| | | IT Services – 0.9% | | | | | | | | | |
| | | | | |
| | 100 | | First Data Corporation | | 3.375% | | 8/01/08 | | A | | | 97,483 |
| | | Machinery – 1.7% | | | | | | | | | |
| | | | | |
| | 100 | | Caterpillar Financial Services Corporation, Series MTNF | | 3.800% | | 2/08/08 | | A | | | 98,741 |
| | | | | |
| | 100 | | John Deere Capital Corporation, Series 2005D | | 4.500% | | 8/25/08 | | A | | | 99,053 |
| | 200 | | Total Machinery | | | | | | | | | 197,794 |
| | | Media – 3.4% | | | | | | | | | |
| | | | | |
| | 100 | | AOL Time Warner Inc. | | 6.150% | | 5/01/07 | | BBB+ | | | 100,028 |
| | | | | |
| | 100 | | Comcast Cable Communications Inc. | | 8.375% | | 5/01/07 | | BBB+ | | | 100,228 |
| | | | | |
| | 50 | | Echostar DBS Corporation | | 5.750% | | 10/01/08 | | BB– | | | 50,188 |
| | | | | |
| | 100 | | Gannett Company Inc. | | 5.500% | | 4/01/07 | | A– | | | 100,000 |
| | | | | |
| | 35 | | Sinclair Broadcasting Group | | 8.000% | | 3/15/12 | | B1 | | | 36,400 |
| | 385 | | Total Media | | | | | | | | | 386,844 |
12
| | | | | | | | | | | | |
Principal
Amount (000) | | Description | | Coupon | | Maturity | | Ratings (1) | | Value |
| | | Metals & Mining – 1.4% | | | | | | | | | |
| | | | | |
| $ | 50 | | IPSCO Inc., Senior Note | | 8.750% | | 6/01/13 | | BBB– | | $ | 53,500 |
| | | | | |
| | 100 | | Steel Dynamics, Inc. | | 9.500% | | 3/15/09 | | BB+ | | | 102,375 |
| | 150 | | Total Metals & Mining | | | | | | | | | 155,875 |
| | | Multiline Retail – 0.9% | | | | | | | | | |
| | | | | |
| | 100 | | Federated Department Stores, Inc. | | 6.625% | | 9/01/08 | | BBB | | | 101,580 |
| | | | | |
| | | Multi-Utilities – 2.6% | | | | | | | | | |
| | | | | |
| | 100 | | Duke Energy Corporation | | 4.200% | | 10/01/08 | | A3 | | | 98,522 |
| | | | | |
| | 100 | | MidAmerican Energy Holdings Company | | 3.500% | | 5/15/08 | | BBB+ | �� | | 98,155 |
| | | | | |
| | 100 | | Sempra Energy | | 4.621% | | 5/17/07 | | BBB+ | | | 99,893 |
| | 300 | | Total Multi-Utilities | | | | | | | | | 296,570 |
| | | Oil, Gas & Consumable Fuels – 1.8% | | | | | | | | | |
| | | | | |
| | 50 | | Alpha Natural Resources, Inc. | | 10.000% | | 6/01/12 | | B– | | | 54,000 |
| | | | | |
| | 100 | | Kinder Morgan Energy Partners, L.P. | | 5.350% | | 8/15/07 | | Baa1 | | | 99,930 |
| | | | | |
| | 50 | | Massey Energy Company, Global Notes | | 6.625% | | 11/15/10 | | B+ | | | 50,750 |
| | 200 | | Total Oil, Gas & Consumable Fuels | | | | | | | | | 204,680 |
| | | Paper & Forest Products – 1.1% | | | | | | | | | |
| | | | | |
| | 35 | | Tembec Industries, Inc. | | 7.750% | | 3/15/12 | | CCC– | | | 21,438 |
| | | | | |
| | 100 | | Weyerhaeuser Company | | 5.950% | | 11/01/08 | | BBB | | | 100,912 |
| | 135 | | Total Paper & Forest Products | | | | | | | | | 122,350 |
| | | Pharmaceuticals – 2.8% | | | | | | | | | |
| | | | | |
| | 120 | | Biovail Corporation International | | 7.875% | | 4/01/10 | | BB– | | | 122,363 |
| | | | | |
| | 100 | | Bristol-Myers Squibb Company | | 4.000% | | 8/15/08 | | A+ | | | 98,511 |
| | | | | |
| | 100 | | Wyeth | | 4.375% | | 3/01/08 | | A | | | 99,078 |
| | 320 | | Total Pharmaceuticals | | | | | | | | | 319,952 |
| | | Road & Rail – 2.2% | | | | | | | | | |
| | | | | |
| | 100 | | CSX Corporation | | 7.450% | | 5/01/07 | | BBB | | | 100,127 |
| | | | | |
| | 50 | | Kansas City Southern Railway Company | | 9.500% | | 10/01/08 | | B– | | | 52,625 |
| | | | | |
| | 100 | | Union Pacific Corporation | | 6.625% | | 2/01/08 | | BBB | | | 101,044 |
| | 250 | | Total Road & Rail | | | | | | | | | 253,796 |
| | | Trading Companies & Distributors – 0.4% | | | | | | | | | |
| | | | | |
| | 50 | | GATX Financial Corporation | | 5.125% | | 4/15/10 | | BBB+ | | | 49,827 |
| | | Wireless Telecommunication Services – 0.9% | | | | | | | | | |
| | | | | |
| | 100 | | Airtouch Communications Inc. | | 6.650% | | 5/01/08 | | A– | | | 101,426 |
| $ | 5,895 | | Total Corporate Bonds (cost $5,917,271) | | | | | | | | | 5,906,006 |
| | | | | | | | | | | | |
| | | | | |
Principal
Amount (000) | | Description | | Coupon | | Maturity | | Ratings (1) | | Value |
| | | U.S. GOVERNMENT AND AGENCY OBLIGATIONS – 39.2% | | | | | | | | | |
| | | | | |
| | | U.S. Treasury Bonds/Notes – 39.2% | | | | | | | | | |
| | | | | |
| $ | 700 | | United States of America Treasury Bonds/Notes | | 4.875% | | 1/31/09 | | AAA | | $ | 703,063 |
| | | | | |
| | 770 | | United States of America Treasury Bonds/Notes | | 4.250% | | 10/31/07 | | AAA | | | 766,872 |
| | | | | |
| | 1,200 | | United States of America Treasury Bonds/Notes | | 4.750% | | 11/15/08 | | AAA | | | 1,200,938 |
| | | | | |
| | 1,200 | | United States of America Treasury Bonds/Notes | | 3.500% | | 11/15/09 | | AAA | | | 1,169,203 |
| | | | | |
| | 250 | | United States of America Treasury Bonds/Notes | | 4.000% | | 3/15/10 | | AAA | | | 246,416 |
| | | | | |
| | 400 | | United States of America Treasury Bonds/Notes | | 0.000% | | 8/15/09 | | AAA | | | 359,637 |
| $ | 4,520 | | Total U.S. Government and Agency Obligations (cost $4,442,523) | | | | | | | | | 4,446,129 |
13
Portfolio of Investments (Unaudited)
Nuveen Short Duration Bond Fund (continued)
March 31, 2007
| | | | | | | | | | | | |
Principal
Amount (000) | | Description | | Coupon | | Maturity | | Ratings (1) | | Value |
| | | ASSET-BACKED AND MORTGAGE-BACKED SECURITIES – 5.6% | | | | | | | | | |
| | | | | |
| | | Autos – Asset-Backed Securities – 0.4% | | | | | | | | | |
| | | | | |
| $ | 51 | | Daimler Chrysler Auto Trust, Class A3, Series 2005B | | 4.040% | | 9/08/09 | | AAA | | $ | 50,572 |
| | | Home Equity – Asset-Backed Securities – 0.0% | | | | | | | | | |
| | | | | |
| | —* | | Master CI-9 NIM Notes, Series 2005, 144A | | 4.940% | | 3/26/35 | | A+ | | | 285 |
| | | Residentials – Mortgage-Backed Securities – 5.2% | | | | | | | | | |
| | | | | |
| | 600 | | Federal National Mortgage Association Pool (MDR) (TBA) (WI/DD) | | 5.500% | | TBA | | AAA | | | 593,625 |
| $ | 651 | | Total Asset-Backed and Mortgage-Backed Securities (cost $646,635) | | | | | | | | | 644,482 |
| | | | | |
Principal
Amount (000) | | Description | | Coupon | | Maturity | | Ratings (1) | | Value |
| | | SOVEREIGN DEBT – 3.8% | | | | | | | | | |
| | | | | |
| | | Turkey – 3.8% | | | | | | | | | |
| | | | | |
| $ | 200 | | Republic of Turkey, Government Bond | | 14.000% | | 1/19/11 | | Ba3 | | $ | 131,820 |
| | | | | |
| | 400 | | Republic of Turkey, Government Bond | | 10.000% | | 2/15/12 | | BB | | | 296,631 |
| | 600 | | Total Turkey | | | | | | | | | 428,451 |
| $ | 600 | | Total Sovereign Debt (cost $412,426) | | | | | | | | | 428,451 |
| | | | | |
Principal
Amount (000) | | Description | | Weighted
Average
Coupon | | Maturity (2) | | Ratings (1) | | Value |
| | | VARIABLE RATE SENIOR LOAN INTERESTS – 2.2% (3) | | | | | |
| | | |
| | | Metals & Mining – 2.2% | | | | | |
| | | | | |
| $ | 250 | | Freeport-McMoRan Copper & Gold Inc., Bridge Loan, (WI/DD) | | TBD | | TBD | | B1 | | $ | 250,000 |
| $ | 250 | | Total Variable Rate Senior Loan Interests (cost $250,000) | | | | | | | | | 250,000 |
| | | | | |
Principal
Amount (000) | | Description | | Coupon | | Maturity | | | | Value |
| | | SHORT-TERM INVESTMENTS – 9.8% | | | | | |
| | | | | |
| $ | 1,107 | | Repurchase Agreement with Fixed Income Clearing Corporation, dated 3/30/07,
repurchase price $1,107,948, collateralized by $1,160,000 U.S. Treasury Bills, 0.000%, due 9/27/07, value $1,132,160 | | 4.900% | | 4/02/07 | | | | $ | 1,107,496 |
| | | Total Short-Term Investments (cost $1,107,496) | | | | | | | | | 1,107,496 |
| | | |
| | | Total Investments (cost $12,776,351) – 112.6% | | | | | | | | | 12,782,564 |
| | | |
| | | | | |
Principal
Amount (000) | | Description | | Coupon | | Maturity | | Ratings (1) | | Value |
| | | ASSET-BACKED AND MORTGAGE-BACKED SECURITIES SOLD SHORT- (5.2)% | | | | | | | | | |
| | | | | |
| $ | (600) | | Federal National Mortgage Association Pool (TBA) | | 5.000% | | TBA | | AAA | | $ | (591,937) |
| | | Total Asset-Backed and Mortgage-Backed Securities Sold Short (cost $593,086) | | | | | | | | | (591,937) |
| | | |
| | | Other Assets Less Liabilities – (7.4)% | | | | | | | | | (838,551) |
| | | |
| | | Net Assets – 100% | | | | | | | | $ | 11,352,076 |
| | | |
14
Forward Foreign Currency Exchange Contracts outstanding at March 31, 2007:
| | | | | | | | | | | | |
| Currency Contracts to Deliver | | Amount
(Local Currency) | | In Exchange For
Currency | | Amount
(Local Currency) | | Settlement
Date | | Unrealized
Appreciation
(Depreciation)
(U.S. Dollars) | |
| Canadian Dollar | | 125,000 | | U.S. Dollar | | 106,434 | | 4/10/07 | | $ | (1,870 | ) |
| Czech Koruna | | 2,500,000 | | U.S. Dollar | | 117,719 | | 4/12/07 | | | (1,641 | ) |
| Euro | | 6,500 | | Iceland Krona | | 591,825 | | 6/22/07 | | | 109 | |
| Euro | | 38,500 | | Iceland Krona | | 3,505,618 | | 6/22/07 | | | 646 | |
| Euro | | 45,000 | | Iceland Krona | | 4,070,250 | | 6/22/07 | | | 350 | |
| Hungarian Forint | | 22,000,000 | | U.S. Dollar | | 113,198 | | 5/08/07 | | | (5,066 | ) |
| Japanese Yen | | 141,480,000 | | U.S. Dollar | | 1,214,525 | | 6/25/07 | | | 530 | |
| Mexican Peso | | 1,210,000 | | U.S. Dollar | | 108,051 | | 4/19/07 | | | (1,465 | ) |
| New Turkish Lira | | 184,000 | | U.S. Dollar | | 126,635 | | 4/30/07 | | | (4,112 | ) |
| New Turkish Lira | | 179,450 | | U.S. Dollar | | 124,086 | | 5/14/07 | | | (2,744 | ) |
| New Turkish Lira | | 225,000 | | U.S. Dollar | | 153,207 | | 6/01/07 | | | (4,737 | ) |
| New Zealand Dollar | | 152,000 | | U.S. Dollar | | 104,274 | | 4/05/07 | | | (4,271 | ) |
| New Zealand Dollar | | 260,000 | | U.S. Dollar | | 181,171 | | 5/15/07 | | | (3,986 | ) |
| Norwegian Krone | | 747,955 | | U.S. Dollar | | 118,000 | | 4/10/07 | | | (5,089 | ) |
| Norwegian Krone | | 686,950 | | U.S. Dollar | | 112,390 | | 5/08/07 | | | (751 | ) |
| Pound Sterling | | 61,000 | | U.S. Dollar | | 119,444 | | 4/10/07 | | | (592 | ) |
| Pound Sterling | | 61,000 | | U.S. Dollar | | 119,602 | | 4/10/07 | | | (434 | ) |
| Singapore Dollar | | 160,000 | | U.S. Dollar | | 104,541 | | 4/30/07 | | | (1,117 | ) |
| South African Rand | | 785,000 | | U.S. Dollar | | 108,067 | | 4/25/07 | | | 144 | |
| Swedish Krona | | 772,372 | | U.S. Dollar | | 110,000 | | 5/08/07 | | | (845 | ) |
| Swedish Krona | | 800,000 | | U.S. Dollar | | 114,062 | | 6/14/07 | | | (978 | ) |
| Swiss Franc | | 147,000 | | U.S. Dollar | | 119,431 | | 4/10/07 | | | (1,646 | ) |
| Swiss Franc | | 147,000 | | U.S. Dollar | | 120,924 | | 6/14/07 | | | (822 | ) |
| U.S. Dollar | | 106,851 | | New Zealand Dollar | | 152,000 | | 4/05/07 | | | 1,693 | |
| U.S. Dollar | | 107,374 | | Canadian Dollar | | 125,000 | | 4/10/07 | | | 931 | |
| U.S. Dollar | | 118,000 | | Norwegian Krone | | 734,798 | | 4/10/07 | | | 2,924 | |
| U.S. Dollar | | 119,979 | | Pound Sterling | | 61,000 | | 4/10/07 | | | 57 | |
| U.S. Dollar | | 119,994 | | Pound Sterling | | 61,000 | | 4/10/07 | | | 42 | |
| U.S. Dollar | | 121,028 | | Swiss Franc | | 147,000 | | 4/10/07 | | | 49 | |
| U.S. Dollar | | 117,041 | | Czech Koruna | | 2,500,000 | | 4/12/07 | | | 2,319 | |
| U.S. Dollar | | 110,189 | | Mexican Peso | | 1,210,000 | | 4/19/07 | | | (673 | ) |
| U.S. Dollar | | 109,213 | | South African Rand | | 785,000 | | 4/25/07 | | | (1,289 | ) |
| U.S. Dollar | | 59,922 | | Hungarian Forint | | 11,056,200 | | 4/26/07 | | | (437 | ) |
| U.S. Dollar | | 128,501 | | New Turkish Lira | | 184,000 | | 4/30/07 | | | 2,246 | |
| U.S. Dollar | | 105,263 | | Singapore Dollar | | 160,000 | | 4/30/07 | | | 395 | |
| U.S. Dollar | | 111,669 | | Hungarian Forint | | 22,000,000 | | 5/08/07 | | | 6,593 | |
| U.S. Dollar | | 110,000 | | Norwegian Krone | | 686,950 | | 5/08/07 | | | 3,141 | |
| U.S. Dollar | | 111,189 | | Swedish Krona | | 772,372 | | 5/08/07 | | | (344 | ) |
| U.S. Dollar | | 118,621 | | Brazilian Real | | 250,800 | | 5/14/07 | | | 2,398 | |
| U.S. Dollar | | 177,892 | | New Zealand Dollar | | 260,000 | | 5/15/07 | | | 7,264 | |
| U.S. Dollar | | 59,687 | | Hungarian Forint | | 11,340,000 | | 6/14/07 | | | 1,115 | |
| U.S. Dollar | | 59,412 | | South African Rand | | 440,520 | | 6/14/07 | | | 820 | |
| U.S. Dollar | | 60,478 | | South African Rand | | 440,520 | | 6/14/07 | | | (246 | ) |
| U.S. Dollar | | 1,091,685 | | Japanese Yen | | 127,380,000 | | 6/25/07 | | | 1,322 | |
| U.S. Dollar | | 59,497 | | Colombian Peso | | 130,000,000 | | 6/27/07 | | | (770 | ) |
| U.S. Dollar | | 119,452 | | Mexican Peso | | 1,320,000 | | 6/27/07 | | | (429 | ) |
| U.S. Dollar | | 59,051 | | Indian Rupee | | 2,600,000 | | 6/28/07 | | | 26 | |
| | | | | | | | | | | $ | (11,240 | ) |
Interest Rate Swaps outstanding at March 31, 2007:
| | | | | | | | | | | | | | | | | | | | |
| Counterparty | | Notional
Amount | | | | Fund
Pay/Receive
Floating Rate | | Floating Rate
Index | | Fixed Rate
(Annualized) | | | Fixed Rate
Payment
Frequency | | Termination
Date | | Unrealized
Appreciation
(Depreciation)
(U.S. Dollars) | |
| Bank of America (4) | | 465,000,000 | | | HUF | | Receive | | 6-Month BUBOR | | 7.300 | % | | Annually | | 10/02/08 | | $ | — | |
| Citigroup Inc. (4) | | 15,000,000 | | | NOK | | Pay | | 6-Month NIBOR | | 5.460 | | | Annually | | 2/09/09 | | | 1,119 | |
| JPMorgan | | 750,000 | | | MXN | | Pay | | 28-Day MXN TIIE | | 10.370 | | | 28-Day | | 5/13/10 | | | 4,761 | |
| JPMorgan (4) | | 18,500,000 | | | ZAR | | Pay | | 3-Month JIBA | | 9.050 | | | Quarterly | | 9/29/08 | | | — | |
| Merrill Lynch | | 400,000 | | | BRL | | Receive | | 1-Day BZDIORA | | 11.690 | | | Annually | | 1/02/09 | | | (186 | ) |
| Merrill Lynch | | 1,000,000 | | | BRL | | Pay | | 1-Day BZDIORA | | 11.690 | | | Annually | | 1/02/17 | | | (199 | ) |
| Morgan Stanley | | 400,000 | | | BRL | | Receive | | 1-Day BZDIORA | | 11.790 | | | Annually | | 1/02/09 | | | 202 | |
| Morgan Stanley | | 1,000,000 | | | BRL | | Pay | | 1-Day BZDIORA | | 11.850 | | | Annually | | 1/03/17 | | | 1,800 | |
| | | | | | | | | | | | | | | | | | | $ | 7,497 | |
15
Portfolio of Investments (Unaudited)
Nuveen Short Duration Bond Fund (continued)
March 31, 2007
Credit Default Swap outstanding at March 31, 2007:
| | | | | | | | | | | | | | | | |
| Counterparty | | Referenced Entity | | Buy/Sell
Protection | | Notional
Amount | | Fixed
Rate | | | Termination
Date | | Unrealized
Appreciation
(Depreciation)
(U.S. Dollars) | |
| Morgan Stanley | | Louisiana-Pacific Corporation | | Buy | | $ | 330,000 | | 1.350 | % | | 12/20/11 | | $ | (3,403 | ) |
Futures Contracts outstanding at March 31, 2007:
| | | | | | | | | | | |
| Type | | Contract
Position | | Number of
Contracts | | Contract
Expiration | | Value at
March 31, 2007
(U.S. Dollars) | | Unrealized
Appreciation
(Depreciation
(U.S. Dollars) |
| U.S. 2-Year Treasury Note | | Long | | 11 | | 6/07 | | 2,253,797 | | $ | 4,951 |
| U.S. 5-Year Treasury Note | | Long | | 5 | | 6/07 | | 528,984 | | | 219 |
| | | | | | | | | | | $ | 5,170 |
| | (1) | | Ratings: Using the higher of Standard & Poor’s or Moody’s rating. Ratings below BBB by Standard & Poor’s Group or Baa by Moody’s Investor Service, Inc. are considered to be below investment grade. |
| | (2) | | Senior Loans generally are subject to mandatory and/or optional prepayment. Because of these mandatory prepayment conditions and because there may be significant economic incentives for a Borrower to prepay, prepayments of Senior Loans may occur. As a result, the actual remaining maturity of Senior Loans held may be substantially less than the stated maturities shown. |
| | (3) | | Senior Loans in which the Fund invests generally pay interest at rates which are periodically adjusted by reference to a base short-term, floating lending rate plus an assigned fixed rate. These floating lending rates are generally (i) the lending rate referenced by the London Inter-Bank Offered Rate (“LIBOR”), or (ii) the prime rate offered by one or more major United States banks. |
| | | | Senior Loans may be considered restricted in that the Fund ordinarily is contractually obligated to receive approval from the Agent Bank and/or Borrower prior to the disposition of a Senior Loan. |
| | (4) | | Forward swap contract with an effective date as show in the following table. Effective date represents the date on which both the Fund and counterparty commence interest payment accruals on each forward swap contract. |
| | | | | | |
| Counterparty | | Notional
Amount | | | Effective
Date |
| Bank of America | | 465,000,000 | | HUF | | 10/02/07 |
| Citigroup Inc. | | 15,000,000 | | NOK | | 2/07/08 |
| JPMorgan | | 18,500,000 | | ZAR | | 9/28/07 |
| | 144A | | Investment is exempt from registration under Rule 144A of the Securities Act of 1933, as amended. These investments may only be resold in transactions exempt from registration which are normally those transactions with qualified institutional buyers. |
| | TBA | | To be announced. Maturity date not known prior to the settlement of the transaction. |
| | TBD | | Senior Loan purchased on a when-issued or delayed-delivery basis. Certain details associated with this purchase are not known prior to the settlement date of the transaction. In addition, Senior Loans typically trade without accrued interest and therefore a weighted average coupon rate is not available prior to settlement. At settlement, if still unknown, the Borrower or counterparty will provide the Fund with the final weighted average coupon rate and maturity date. |
| | WI/DD | | Purchased on a when-issued or delayed delivery basis. |
| | BUBOR | | Budapest Inter-Bank Offered Rate |
| | BZDIORA | | Brazil Inter-Bank Deposit Rate Over |
| | JIBA | | South Africa Johannesburg Inter-Bank Agreed Rate |
| | NIBOR | | Norway Inter-Bank Offered Rate |
| | TIIE | | Mexican Peso Inter-Bank Equilibrium Interest Rate |
| | * | | Principal Amount rounds to less than $1,000. |
See accompanying notes to financial statements.
16
Portfolio of Investments (Unaudited)
Nuveen Core Bond Fund
March 31, 2007
| | | | | | | | | | | | |
Principal
Amount (000) | | Description | | Coupon | | Maturity | | Ratings (1) | | Value |
| | | | | | | | | | | | |
| | | CORPORATE BONDS – 28.4% | | | | | | | | | |
| | | | | |
| | | Aerospace & Defense – 0.2% | | | | | | | | | |
| | | | | |
| $ | 12 | | Boeing Capital Corporation | | 5.800% | | 1/15/13 | | A+ | | $ | 12,403 |
| | | | | |
| | 4 | | Honeywell International Inc. | | 7.500% | | 3/01/10 | | A | | | 4,267 |
| | | | | |
| | 8 | | United Technologies Corporation | | 7.500% | | 9/15/29 | | A | | | 9,643 |
| | 24 | | Total Aerospace & Defense | | | | | | | | | 26,313 |
| | | Beverages – 0.1% | | | | | | | | | |
| | | | | |
| | 7 | | Anheuser-Busch Companies, Inc. | | 5.050% | | 10/15/16 | | A | | | 6,796 |
| | | | | |
| | 7 | | Coca-Cola Enterprises Inc. | | 6.750% | | 9/15/28 | | A | | | 7,669 |
| | 14 | | Total Beverages | | | | | | | | | 14,465 |
| | | Building Products – 0.0% | | | | | | | | | |
| | | | | |
| | 4 | | Masco Corporation | | 5.875% | | 7/15/12 | | BBB+ | | | 4,057 |
| | | Capital Markets – 0.2% | | | | | | | | | |
| | | | | |
| | 14 | | Mellon Funding Corporation | | 3.250% | | 4/01/09 | | A+ | | | 13,498 |
| | | | | |
| | 1 | | Merril Lynch & Company | | 3.700% | | 4/21/08 | | AA– | | | 984 |
| | | | | |
| | 10 | | Morgan Stanley Dean Witter & Company | | 8.000% | | 6/15/10 | | Aa3 | | | 10,896 |
| | 25 | | Total Capital Markets | | | | | | | | | 25,378 |
| | | Chemicals – 2.3% | | | | | | | | | |
| | | | | |
| | 6 | | Dow Chemical Company | | 7.375% | | 11/01/29 | | A– | | | 6,697 |
| | | | | |
| | 12 | | E.I. Du Pont de Nemours and Company | | 6.875% | | 10/15/09 | | A | | | 12,544 |
| | | | | |
| | 30 | | Equistar Chemicals LP | | 8.750% | | 2/15/09 | | BB– | | | 31,425 |
| | | | | |
| | 25 | | Lyondell Chemical Company | | 10.875% | | 5/01/09 | | B | | | 25,250 |
| | | | | |
| | 100 | | MacDermid Inc. | | 9.125% | | 7/15/11 | | Ba2 | | | 104,813 |
| | | | | |
| | 30 | | MacDermid, Inc., (WI/DD, settling 4/12/07) | | 9.500% | | 4/15/17 | | CCC+ | | | 30,900 |
| | | | | |
| | 2 | | Praxair, Inc. | | 6.375% | | 4/01/12 | | A | | | 2,108 |
| | | | | |
| | 50 | | Rockwood Specialties Group Inc. | | 10.625% | | 5/15/11 | | B– | | | 53,000 |
| | 255 | | Total Chemicals | | | | | | | | | 266,737 |
| | | Commercial Banks – 1.0% | | | | | | | | | |
| | | | | |
| | 3 | | Bank of America Corporation | | 5.375% | | 6/15/14 | | Aa1 | | | 3,005 |
| | | | | |
| | 3 | | Bank One NA Illinois | | 3.700% | | 1/15/08 | | Aaa | | | 2,967 |
| | | | | |
| | 6 | | Charter One Bank FSB | | 6.375% | | 5/15/12 | | Aa3 | | | 6,378 |
| | | | | |
| | 22 | | Fleet National Bank | | 5.750% | | 1/15/09 | | Aa1 | | | 22,238 |
| | | | | |
| | 2 | | HSBC Bank USA | | 3.875% | | 9/15/09 | | AA | | | 1,942 |
| | | | | |
| | 4 | | Key Bank NA | | 7.000% | | 2/01/11 | | A2 | | | 4,258 |
| | | | | |
| | 25 | | National City Bank | | 6.200% | | 12/15/11 | | A1 | | | 26,051 |
| | | | | |
| | 3 | | National Westminster Bank PLC | | 7.375% | | 10/01/09 | | Aa2 | | | 3,151 |
| | | | | |
| | 16 | | Nationsbank Corporation | | 7.800% | | 9/15/16 | | Aa2 | | | 18,680 |
| | | | | |
| | 3 | | PNC Funding Corporation | | 7.500% | | 11/01/09 | | A2 | | | 3,176 |
| | | | | |
| | 6 | | SunTrust Banks Inc. | | 6.375% | | 4/01/11 | | Aa3 | | | 6,268 |
| | | | | |
| | 9 | | US Bank NA Minnesota | | 6.375% | | 8/01/11 | | AA | | | 9,433 |
| | | | | |
| | 14 | | Wachovia Corporation | | 5.250% | | 8/01/14 | | A+ | | | 13,858 |
| | | | | |
| | 7 | | Wells Fargo & Company | | 5.375% | | 2/07/35 | | AA+ | | | 6,607 |
| | 123 | | Total Commercial Banks | | | | | | | | | 128,012 |
17
Portfolio of Investments (Unaudited)
Nuveen Core Bond Fund (continued)
March 31, 2007
| | | | | | | | | | | | |
Principal
Amount (000) | | Description | | Coupon | | Maturity | | Ratings (1) | | Value |
| | | Commercial Services & Supplies – 1.0% | | | | | | | | | |
| | | | | |
| $ | 30 | | Ahern Rentals Inc. | | 9.250% | | 8/15/13 | | B | | $ | 31,463 |
| | | | | |
| | 50 | | Browning Ferris Industries | | 9.250% | | 5/01/21 | | BB | | | 54,500 |
| | | | | |
| | 30 | | Rental Service Corporation, 144A | | 9.500% | | 12/01/14 | | B– | | | 32,100 |
| | | | | |
| | 4 | | Waste Management, Inc. | | 7.750% | | 5/15/32 | | BBB | | | 4,645 |
| | 114 | | Total Commercial Services & Supplies | | | | | | | | | 122,708 |
| | | Communications Equipment – 0.1% | | | | | | | | | |
| | | | | |
| | 5 | | Cisco Systems, Inc. | | 5.500% | | 2/22/16 | | A+ | | | 5,043 |
| | | | | |
| | 1 | | Motorola, Inc. | | 7.625% | | 11/15/10 | | A– | | | 1,074 |
| | | | | |
| | 3 | | Motorola, Inc. | | 7.500% | | 5/15/25 | | A– | | | 3,301 |
| | 9 | | Total Communications Equipment | | | | | | | | | 9,418 |
| | | Consumer Finance – 0.3% | | | | | | | | | |
| | | | | |
| | 3 | | Household Finance Corporation | | 7.000% | | 5/15/12 | | AA– | | | 3,223 |
| | | | | |
| | 19 | | MBNA Corporation | | 6.125% | | 3/01/13 | | Aa1 | | | 19,813 |
| | | | | |
| | 12 | | SLM Corporation | | 5.375% | | 1/15/13 | | A | | | 12,084 |
| | 34 | | Total Consumer Finance | | | | | | | | | 35,120 |
| | | Containers & Packaging – 0.6% | | | | | | | | | |
| | | | | |
| | 50 | | Caraustar Industries | | 7.375% | | 6/01/09 | | B+ | | | 49,000 |
| | | | | |
| | 30 | | Owens-Brockway Glass Container Inc. | | 8.875% | | 2/15/09 | | Ba2 | | | 30,750 |
| | 80 | | Total Containers & Packaging | | | | | | | | | 79,750 |
| | | Distributors – 0.2% | | | | | | | | | |
| | | | | |
| | 30 | | Ryerson Tull Inc. | | 8.250% | | 12/15/11 | | B– | | | 30,450 |
| | | Diversified Financial Services – 1.9% | | | | | | | | | |
| | | | | |
| | 33 | | Associates Corporation of North America | | 6.250% | | 11/01/08 | | Aa1 | | | 33,574 |
| | | | | |
| | 13 | | CIT Group Inc. | | 5.500% | | 11/30/07 | | A | | | 13,010 |
| | | | | |
| | 17 | | Citigroup Inc. | | 3.625% | | 2/09/09 | | Aa1 | | | 16,598 |
| | | | | |
| | 5 | | Citigroup Inc. | | 6.000% | | 10/31/33 | | Aa2 | | | 4,990 |
| | | | | |
| | 4 | | Citigroup Inc. | | 5.850% | | 12/11/34 | | Aa1 | | | 3,986 |
| | | | | |
| | 57 | | General Electric Capital Corporation | | 8.125% | | 5/15/12 | | AAA | | | 64,554 |
| | | | | |
| | 41 | | Household Financial Corporation | | 8.000% | | 7/15/10 | | AA– | | | 44,475 |
| | | | | |
| | 28 | | JPMorgan Chase & Co. | | 3.500% | | 3/15/09 | | Aa2 | | | 27,156 |
| | | | | |
| | 18 | | Sanwa Finance Aruba AEC | | 8.350% | | 7/15/09 | | A2 | | | 19,207 |
| | 216 | | Total Diversified Financial Services | | | | | | | | | 227,550 |
| | | Diversified Telecommunication Services – 1.4% | | | | | | | | | |
| | | | | |
| | 21 | | BellSouth Corporation | | 6.550% | | 6/15/34 | | A | | | 21,660 |
| | | | | |
| | 6 | | British Telecommunications PLC | | 8.625% | | 12/15/30 | | BBB+ | | | 8,262 |
| | | | | |
| | 12 | | Deutsche Telekom International Finance BV | | 8.000% | | 6/15/10 | | A– | | | 13,017 |
| | | | | |
| | 4 | | Deutsche Telekom International Finance BV | | 8.250% | | 6/15/30 | | A– | | | 4,969 |
| | | | | |
| | 10 | | Embarq Corporation | | 7.995% | | 6/01/36 | | BBB– | | | 10,356 |
| | | | | |
| | 18 | | France Telecom | | 7.750% | | 3/01/11 | | A– | | | 19,627 |
| | | | | |
| | 25 | | GTE Corporation | | 7.510% | | 4/01/09 | | A | | | 26,068 |
| | | | | |
| | 14 | | Sprint Capital Corporation | | 8.375% | | 3/15/12 | | BBB | | | 15,636 |
| | | | | |
| | 40 | | Sprint Capital Corporation | | 6.900% | | 5/01/19 | | BBB | | | 41,508 |
18
| | | | | | | | | | | | |
Principal
Amount (000) | | Description | | Coupon | | Maturity | | Ratings (1) | | Value |
| | | Diversified Telecommunication Services (continued) | | | | | | | | | |
| | | | | |
| $ | 4 | | Sprint Capital Corporation | | 8.750% | | 3/15/32 | | BBB | | $ | 4,731 |
| | | | | |
| | 10 | | Verizon New York Inc., Series B | | 7.375% | | 4/01/32 | | A | | | 10,604 |
| | 164 | | Total Diversified Telecommunication Services | | | | | | | | | 176,438 |
| | | Electric Utilities – 0.7% | | | | | | | | | |
| | | | | |
| | 14 | | Duke Capital LLC | | 5.668% | | 8/15/14 | | Baa1 | | | 13,874 |
| | | | | |
| | 5 | | FirstEnergy Corporation | | 7.375% | | 11/15/31 | | BBB– | | | 5,698 |
| | | | | |
| | 12 | | National Rural Utilities Cooperative Finance Corporation | | 3.875% | | 2/15/08 | | A+ | | | 11,863 |
| | | | | |
| | 8 | | National Rural Utilities Cooperative Finance Corporation | | 5.750% | | 8/28/09 | | A | | | 8,138 |
| | | | | |
| | 11 | | Pacific Gas and Electric Company | | 6.050% | | 3/01/34 | | Baa1 | | | 11,063 |
| | | | | |
| | 10 | | Progress Energy, Inc. | | 7.000% | | 10/30/31 | | BBB | | | 11,102 |
| | | | | |
| | 5 | | PSE&G Power LLC | | 8.625% | | 4/15/31 | | Baa1 | | | 6,366 |
| | | | | |
| | 11 | | Reliant Energy, Centerpoint Energy Inc. | | 7.750% | | 2/15/11 | | BBB | | | 11,904 |
| | | | | |
| | 9 | | Virginia Electric and Power Company | | 4.750% | | 3/01/13 | | Baa1 | | | 8,731 |
| | 85 | | Total Electric Utilities | | | | | | | | | 88,739 |
| | | Electrical Equipment – 0.2% | | | | | | | | | |
| | | | | |
| | 30 | | General Cable Corporation, 144A | | 7.125% | | 4/01/17 | | B+ | | | 30,338 |
| | | Electronic Equipment & Instruments – 0.5% | | | | | | | | | |
| | | | | |
| | 61 | | Arrow Electronics, Inc. | | 6.875% | | 6/01/18 | | BBB– | | | 63,898 |
| | | Energy Equipment & Services – 1.3% | | | | | | | | | |
| | | | | |
| | 50 | | Allis Chalmers Energy Inc., 144A | | 8.500% | | 3/01/17 | | B | | | 49,500 |
| | | | | |
| | 25 | | Calfrac Holdings LP, 144A | | 7.750% | | 2/15/15 | | B1 | | | 24,375 |
| | | | | |
| | 75 | | Hanover Equipment Trust, Senior Secured Note, Series 2003 | | 8.500% | | 9/01/08 | | Ba3 | | | 75,750 |
| | | | | |
| | 10 | | Northwest Pipeline Corporation | | 6.625% | | 12/01/07 | | BB+ | | | 10,075 |
| | 160 | | Total Energy Equipment & Services | | | | | | | | | 159,700 |
| | | Food & Staples Retailing – 0.2% | | | | | | | | | |
| | | | | |
| | 2 | | Kroger Co. | | 7.500% | | 4/01/31 | | Baa2 | | | 2,186 |
| | | | | |
| | 19 | | Meyer Fred Inc., Kroger Inc. | | 7.450% | | 3/01/08 | | Baa2 | | | 19,366 |
| | 21 | | Total Food & Staples Retailing | | | | | | | | | 21,552 |
| | | Food Products – 0.3% | | | | | | | | | |
| | | | | |
| | 3 | | Archer-Daniels-Midland Company | | 7.000% | | 2/01/31 | | A | | | 3,392 |
| | | | | |
| | 2 | | Kellogg Company | | 7.450% | | 4/01/31 | | A3 | | | 2,353 |
| | | | | |
| | 11 | | Kraft Foods Inc. | | 6.250% | | 6/01/12 | | A– | | | 11,443 |
| | | | | |
| | 16 | | Nabisco Inc. | | 7.550% | | 6/15/15 | | A | | | 18,021 |
| | | | | |
| | 3 | | Unilever Capital Corporation | | 5.900% | | 11/15/32 | | A+ | | | 2,924 |
| | 35 | | Total Food Products | | | | | | | | | 38,133 |
| | | Gas Utilities – 0.0% | | | | | | | | | |
| | | | | |
| | 2 | | Consolidated Natural Gas Company | | 5.000% | | 12/01/14 | | Baa1 | | | 1,937 |
| | | Health Care Equipment & Supplies – 0.4% | | | | | | | | | |
| | | | | |
| | 50 | | Invacare Corporation, 144A | | 9.750% | | 2/15/15 | | B2 | | | 50,500 |
| | | Health Care Providers & Services – 0.9% | | | | | | | | | |
| | | | | |
| | 40 | | Amerisource Bergen Corporation | | 5.875% | | 9/15/15 | | BBB– | | | 39,949 |
| | | | | |
| | 18 | | Medco Health Solutions, Inc. | | 7.250% | | 8/15/13 | | BBB | | | 19,492 |
19
Portfolio of Investments (Unaudited)
Nuveen Core Bond Fund (continued)
March 31, 2007
| | | | | | | | | | | | |
Principal
Amount (000) | | Description | | Coupon | | Maturity | | Ratings (1) | | Value |
| | | Health Care Providers & Services (continued) | | | | | | | | | |
| | | | | |
| $ | 50 | | UnitedHealth Group Incorporated | | 5.375% | | 3/15/16 | | A | | $ | 49,718 |
| | 108 | | Total Health Care Providers & Services | | | | | | | | | 109,159 |
| | | Hotels, Restaurants & Leisure – 0.4% | | | | | | | | | |
| | | | | |
| | 20 | | MGM Grand Inc. | | 6.000% | | 10/01/09 | | BB | | | 20,125 |
| | | | | |
| | 30 | | Mohegan Tribal Gaming Authority | | 8.000% | | 4/01/12 | | Ba2 | | | 31,275 |
| | 50 | | Total Hotels, Restaurants & Leisure | | | | | | | | | 51,400 |
| | | Household Durables – 0.7% | | | | | | | | | |
| | | | | |
| | 25 | | Beazer Homes USA, Inc. | | 8.625% | | 5/15/11 | | Ba1 | | | 24,563 |
| | | | | |
| | 25 | | KB Home | | 9.500% | | 2/15/11 | | Ba2 | | | 25,656 |
| | | | | |
| | 12 | | Pulte Homes, Inc. | | 4.875% | | 7/15/09 | | BBB | | | 11,831 |
| | | | | |
| | 25 | | Toll Corporation | | 8.250% | | 2/01/11 | | BB+ | | | 25,625 |
| | 87 | | Total Household Durables | | | | | | | | | 87,675 |
| | | Household Products – 0.2% | | | | | | | | | |
| | | | | |
| | 2 | | Kimberly-Clark Corporation | | 5.000% | | 8/15/13 | | AA– | | | 1,981 |
| | | | | |
| | 20 | | Procter and Gamble Company | | 4.850% | | 12/15/15 | | AA– | | | 19,456 |
| | 22 | | Total Household Products | | | | | | | | | 21,437 |
| | | Industrial Conglomerates – 0.2% | | | | | | | | | |
| | | | | |
| | 7 | | General Electric Company | | 5.000% | | 2/01/13 | | AAA | | | 6,956 |
| | | | | |
| | 20 | | Raychem Corporation, Tyco International Limited | | 7.200% | | 10/15/08 | | BBB+ | | | 20,533 |
| | 27 | | Total Industrial Conglomerates | | | | | | | | | 27,489 |
| | | IT Services – 0.4% | | | | | | | | | |
| | | | | |
| | 50 | | Unisys Corporation | | 7.875% | | 4/01/08 | | B+ | | | 50,500 |
| | | Life Sciences Tools & Services – 0.2% | | | | | | | | | |
| | | | | |
| | 25 | | Fisher Scientific International | | 6.125% | | 7/01/15 | | BBB | | | 25,093 |
| | | Machinery – 0.2% | | | | | | | | | |
| | | | | |
| | 5 | | Caterpillar Inc. | | 7.300% | | 5/01/31 | | A | | | 5,868 |
| | | | | |
| | 15 | | Deere & Company | | 6.950% | | 4/25/14 | | A | | | 16,461 |
| | 20 | | Total Machinery | | | | | | | | | 22,329 |
| | | Media – 1.9% | | | | | | | | | |
| | | | | |
| | 18 | | Cox Communications, Inc. | | 7.750% | | 11/01/10 | | BBB– | | | 19,469 |
| | | | | |
| | 30 | | Dex Media East LLC | | 9.875% | | 11/15/09 | | B1 | | | 31,425 |
| | | | | |
| | 28 | | Gray Television Inc., Term Loan | | 9.250% | | 12/15/11 | | B1 | | | 29,365 |
| | | | | |
| | 13 | | Insight Midwest L.P | | 9.750% | | 10/01/09 | | B | | | 13,244 |
| | | | | |
| | 30 | | Primedia Inc., Senior Notes | | 8.875% | | 5/15/11 | | B | | | 30,975 |
| | | | | |
| | 35 | | Sinclair Broadcasting Group | | 8.000% | | 3/15/12 | | B1 | | | 36,400 |
| | | | | |
| | 22 | | TCI Communications, Inc. | | 8.750% | | 8/01/15 | | BBB+ | | | 26,024 |
| | | | | |
| | 11 | | Time Warner Inc. | | 9.125% | | 1/15/13 | | BBB+ | | | 12,906 |
| | | | | |
| | 14 | | Time Warner Inc. | | 9.150% | | 2/01/23 | | BBB+ | | | 17,477 |
| | | | | |
| | 18 | | Viacom Inc., Senior Notes | | 7.700% | | 7/30/10 | | BBB | | | 19,377 |
| | | | | |
| | 2 | | Walt Disney Company | | 7.000% | | 3/01/32 | | A– | | | 2,301 |
| | 221 | | Total Media | | | | | | | | | 238,963 |
20
| | | | | | | | | | | | |
Principal
Amount (000) | | Description | | Coupon | | Maturity | | Ratings (1) | | Value |
| | | Metals & Mining – 3.4% | | | | | | | | | |
| | | | | |
| $ | 8 | | Alcan Inc. | | 7.250% | | 3/15/31 | | BBB+ | | $ | 8,938 |
| | | | | |
| | 25 | | California Steel Industries Inc. | | 6.125% | | 3/15/14 | | BB– | | | 23,875 |
| | | | | |
| | 30 | | Claymont Steel Inc., 144A | | 8.875% | | 2/15/15 | | B3 | | | 30,000 |
| | | | | |
| | 30 | | Freeport McMoran Copper & Gold, Inc. | | 8.375% | | 4/01/17 | | Ba3 | | | 32,513 |
| | | | | |
| | 30 | | IPSCO Inc., Senior Note | | 8.750% | | 6/01/13 | | BBB– | | | 32,100 |
| | | | | |
| | 30 | | Metals USA Holdings Corporation, Floating Rate Note, 144A (PIK) | | 11.350% | | 1/15/12 | | CCC+ | | | 29,550 |
| | | | | |
| | 30 | | Russel Metals Inc. | | 6.375% | | 3/01/14 | | BB | | | 28,875 |
| | | | | |
| | 100 | | Steel Dynamics, Inc., 144A (WI/DD, settling 4/03/07) | | 6.750% | | 4/01/15 | | Ba2 | | | 100,625 |
| | | | | |
| | 100 | | Steel Dynamics, Inc. | | 9.500% | | 3/15/09 | | BB+ | | | 102,375 |
| | 383 | | Total Metals & Mining | | | | | | | | | 388,851 |
| | | Multiline Retail – 0.6% | | | | | | | | | |
| | | | | |
| | 4 | | Federated Department Stores, Inc. | | 6.625% | | 4/01/11 | | BBB | | | 4,175 |
| | | | | |
| | 8 | | Federated Department Stores, Inc. | | 6.900% | | 4/01/29 | | BBB | | | 8,104 |
| | | | | |
| | 30 | | J.C. Penney Corporation Inc. | | 7.125% | | 11/15/23 | | BBB– | | | 32,965 |
| | | | | |
| | 13 | | Target Corporation | | 7.500% | | 8/15/10 | | A+ | | | 13,980 |
| | | | | |
| | 17 | | Wal-Mart Stores, Inc. | | 6.875% | | 8/10/09 | | AA | | | 17,705 |
| | | | | |
| | 2 | | Wal-Mart Stores, Inc. | | 7.550% | | 2/15/30 | | AA | | | 2,415 |
| | 74 | | Total Multiline Retail | | | | | | | | | 79,344 |
| | | Oil, Gas & Consumable Fuels – 2.0% | | | | | | | | | |
| | | | | |
| | 10 | | Amerada Hess Corporation | | 7.125% | | 3/15/33 | | BBB– | | | 10,851 |
| | | | | |
| | 5 | | Burlington Resources Finance Company | | 7.200% | | 8/15/31 | | A2 | | | 5,809 |
| | | | | |
| | 25 | | Chesapeake Energy Corporation | | 6.250% | | 1/15/18 | | BB | | | 24,813 |
| | | | | |
| | 10 | | Devon Energy Corporation | | 7.950% | | 4/15/32 | | BBB | | | 12,028 |
| | | | | |
| | 10 | | Duke Energy Field Services Corporation | | 7.875% | | 8/16/10 | | BBB | | | 10,811 |
| | | | | |
| | 21 | | Enterprise Products Operating L.P. | | 4.625% | | 10/15/09 | | BBB– | | | 20,738 |
| | | | | |
| | 3 | | Halliburton Company | | 5.500% | | 10/15/10 | | BBB+ | | | 3,035 |
| | | | | |
| | 10 | | Kinder Morgan Energy Partners, L.P. | | 7.300% | | 8/15/33 | | Baa1 | | | 10,835 |
| | | | | |
| | 10 | | Occidental Petroleum Corporation | | 6.750% | | 1/15/12 | | A– | | | 10,729 |
| | | | | |
| | 30 | | OPTI Canada Inc. | | 8.250% | | 12/15/14 | | BB | | | 31,350 |
| | | | | |
| | 10 | | PC Financial Partnership | | 5.000% | | 11/15/14 | | BBB | | | 9,651 |
| | | | | |
| | 11 | | Phillips Petroleum Company | | 8.750% | | 5/25/10 | | A1 | | | 12,218 |
| | | | | |
| | 50 | | Premcor Refining Group Inc. | | 7.500% | | 6/15/15 | | BBB | | | 51,671 |
| | | | | |
| | 10 | | Tosco Corporation | | 8.125% | | 2/15/30 | | A1 | | | 12,720 |
| | | | | |
| | 10 | | Valero Energy Corporation | | 7.500% | | 4/15/32 | | BBB | | | 11,398 |
| | | | | |
| | 10 | | XTO Energy, Inc. | | 6.250% | | 4/15/13 | | BBB | | | 10,407 |
| | 235 | | Total Oil, Gas & Consumable Fuels | | | | | | | | | 249,064 |
| | | Paper & Forest Products – 1.2% | | | | | | | | | |
| | | | | |
| | 50 | | Buckeye Technologies Inc. | | 8.000% | | 10/15/10 | | B | | | 50,000 |
| | | | | |
| | 30 | | Mercer International Inc. | | 9.250% | | 2/15/13 | | B | | | 30,225 |
| | | | | |
| | 30 | | Pope & Talbot Inc. | | 8.375% | | 6/01/13 | | CCC | | | 24,750 |
| | | | | |
| | 35 | | Tembec Industries, Inc. | | 7.750% | | 3/15/12 | | CCC– | | | 21,438 |
| | | | | |
| | 8 | | Westvaco Corporation | | 8.200% | | 1/15/30 | | BBB | | | 8,827 |
| | | | | |
| | 17 | | Weyerhaeuser Company | | 5.950% | | 11/01/08 | | BBB | | | 17,155 |
| | 170 | | Total Paper & Forest Products | | | | | | | | | 152,395 |
21
Portfolio of Investments (Unaudited)
Nuveen Core Bond Fund (continued)
March 31, 2007
| | | | | | | | | | | | |
Principal
Amount (000) | | Description | | Coupon | | Maturity | | Ratings (1) | | Value |
| | | Pharmaceuticals – 1.2% | | | | | | | | | |
| | | | | |
| $ | 120 | | Biovail Corporation International | | 7.875% | | 4/01/10 | | BB– | | $ | 122,363 |
| | | | | |
| | 3 | | Schering-Plough Corporation | | 6.750% | | 12/01/33 | | A– | | | 3,342 |
| | | | | |
| | 20 | | Wyeth | | 5.500% | | 3/15/13 | | A | | | 20,196 |
| | 143 | | Total Pharmaceuticals | | | | | | | | | 145,901 |
| | | Real Estate Investment Trust – 0.2% | | | | | | | | | |
| | | | | |
| | 19 | | Simon Property Group, L.P. | | 6.375% | | 11/15/07 | | A– | | | 19,107 |
| | | Real Estate Management & Development – 0.1% | | | | | | | | | |
| | | | | |
| | 12 | | ERP Operating LP | | 6.625% | | 3/15/12 | | A– | | | 12,785 |
| | | Road & Rail – 0.7% | | | | | | | | | |
| | | | | |
| | 18 | | Burlington Northern Santa Fe Corporation | | 6.750% | | 7/15/11 | | Baa1 | | | 18,975 |
| | | | | |
| | 13 | | Canadian National Railway Company | | 6.250% | | 8/01/34 | | A– | | | 13,458 |
| | | | | |
| | 30 | | Kansas City Southern Railway Company | | 12.500% | | 6/15/12 | | B– | | | 32,310 |
| | | | | |
| | 17 | | Norfolk Southern Corporation | | 7.700% | | 5/15/17 | | BBB+ | | | 18,980 |
| | 78 | | Total Road & Rail | | | | | | | | | 83,723 |
| | | Software – 0.1% | | | | | | | | | |
| | | | | |
| | 14 | | Computer Associates International, Inc. | | 4.750% | | 12/01/09 | | Ba1 | | | 13,820 |
| | | Specialty Retail – 0.0% | | | | | | | | | |
| | | | | |
| | 1 | | Home Depot, Inc. | | 3.750% | | 9/15/09 | | Aa3 | | | 970 |
| | | | | |
| | 1 | | Lowes Companies, Inc. | | 6.500% | | 3/15/29 | | A+ | | | 1,052 |
| | 2 | | Total Specialty Retail | | | | | | | | | 2,022 |
| | | Tobacco – 0.0% | | | | | | | | | |
| | | | | |
| | 2 | | Philip Morris Companies, Inc. | | 7.750% | | 1/15/27 | | Baa1 | | | 2,397 |
| | | Trading Companies & Distributors – 0.3% | | | | | | | | | |
| | | | | |
| | 30 | | Ashtead Capital Inc., 144A | | 9.000% | | 8/15/16 | | B | | | 32,100 |
| | | Wireless Telecommunication Services – 0.6% | | | | | | | | | |
| | | | | |
| | 8 | | American Cellular Corporation Escrow Corporation | | 10.000% | | 8/01/11 | | B3 | | | 8,510 |
| | | | | |
| | 22 | | AT&T/Cingular Wireless Services | | 8.125% | | 5/01/12 | | A | | | 24,791 |
| | | | | |
| | 25 | | Rogers Wireless Communications Inc. | | 6.375% | | 3/01/14 | | Baa3 | | | 25,750 |
| | | | | |
| | 10 | | Telefonica Europe BV | | 7.750% | | 9/15/10 | | BBB+ | | | 10,784 |
| | | | | |
| | 4 | | Vodafone Group PLC | | 7.875% | | 2/15/30 | | A– | | | 4,631 |
| | 69 | | Total Wireless Telecommunication Services | | | | | | | | | 74,466 |
| $ | 3,377 | | Total Corporate Bonds (cost $3,526,255) | | | | | 3,491,213 |
| | | | | |
Principal
Amount (000) | | Description | | Coupon | | Maturity | | Ratings (1) | | Value |
| | | U.S. GOVERNMENT AND AGENCY OBLIGATIONS – 13.9% | | | | | | | | | |
| | | | | |
| | | U.S. Treasury Bonds/Notes – 13.9% | | | | | | | | | |
| | | | | |
| $ | 200 | | United States of America Treasury Bonds/Notes | | 4.500% | | 2/15/36 | | AAA | | $ | 188,625 |
| | | | | |
| | 400 | | United States of America Treasury Bonds/Notes | | 3.375% | | 2/15/08 | | AAA | | | 394,797 |
| | | | | |
| | 175 | | United States of America Treasury Bonds/Notes | | 4.875% | | 2/15/12 | | AAA | | | 177,782 |
| | | | | |
| | 385 | | United States of America Treasury Bonds/Notes | | 4.875% | | 8/15/16 | | AAA | | | 391,226 |
| | | | | |
| | 360 | | United States of America Treasury Bonds/Notes | | 0.000% | | 2/15/15 | | AAA | | | 250,341 |
| | | | | |
| | 50 | | United States of America Treasury Bonds/Notes | | 0.000% | | 5/15/17 | | AAA | | | 30,939 |
22
| | | | | | | | | | | | |
Principal
Amount (000) | | Description | | Coupon | | Maturity | | Ratings (1) | | Value |
| | | U.S. Treasury Bonds/Notes (continued) | | | | | | | | | |
| | | | | |
| $ | 650 | | United States of America Treasury Bonds/Notes | | 0.000% | | 2/15/25 | | AAA | | $ | 267,071 |
| | | | | |
| | 25 | | United States of America Treasury Bonds/Notes | | 0.000% | | 2/15/37 | | AAA | | | 6,090 |
| $ | 2,245 | | Total U.S. Government and Agency Obligations (cost $1,702,895) | | | | | | | | | 1,706,871 |
| | | | | |
Principal
Amount (000) | | Description | | Coupon | | Maturity | | Ratings (1) | | Value |
| | | ASSET-BACKED AND MORTGAGE-BACKED SECURITIES – 53.5% | | | | | |
| | | | | |
| | | Autos – Asset-Backed Securities – 0.4% | | | | | | | | | |
| | | | | |
| $ | 51 | | Daimler Chrysler Auto Trust, Class A3, Series 2005B | | 4.040% | | 9/08/09 | | AAA | | $ | 50,572 |
| | | Cards – Asset-Backed Securities – 2.1% | | | | | | | | | |
| | | | | |
| | 100 | | Bank One Issuance Trust 03-A3 A3 | | 5.430% | | 12/15/10 | | AAA | | | 100,196 |
| | | | | |
| | 160 | | Chase Issuance Trust 05-A3 A | | 5.340% | | 10/17/11 | | AAA | | | 160,215 |
| | 260 | | Total Cards | | | | | | | | | 260,411 |
| | | Home Equity – Asset-Backed Securities – 0.0% | | | | | | | | | |
| | | | | |
| | —* | | Master CI-9 NIM Notes, Series 2005, 144A | | 4.940% | | 3/26/35 | | A+ | | | 285 |
| | | Residentials – Mortgage-Backed Securities – 51.0% | | | | | | | | | |
| | | | | |
| | 147 | | Federal Home Loan Mortgage Corporation Pool 1B3220 (WI/DD) | | 5.965% | | 1/01/37 | | AAA | | | 149,070 |
| | | | | |
| | 379 | | Federal Home Loan Mortgage Corporation Pool 847681 | | 6.263% | | 12/01/36 | | AAA | | | 384,288 |
| | | | | |
| | 63 | | Federal National Mortgage Association Pool 255814 | | 5.500% | | 8/01/35 | | AAA | | | 62,120 |
| | | | | |
| | 802 | | Federal National Mortgage Association Pool 735060 | | 6.000% | | 11/01/34 | | AAA | | | 810,127 |
| | | | | |
| | 385 | | Federal National Mortgage Association Pool 735606 | | 4.443% | | 5/01/35 | | AAA | | | 378,289 |
| | | | | |
| | 394 | | Federal National Mortgage Association Pool 824163 | | 5.500% | | 4/01/35 | | AAA | | | 390,785 |
| | | | | |
| | 394 | | Federal National Mortgage Association Pool 905597 | | 6.098% | | 12/01/36 | | AAA | | | 399,724 |
| | | | | |
| | 600 | | Federal National Mortgage Association Pool (MDR) (TBA) (WI/DD) | | 5.500% | | TBA | | AAA | | | 593,625 |
| | | | | |
| | 1,013 | | Federal National Mortgage Association Pool (MDR) (TBA) (WI/DD) | | 6.000% | | TBA | | AAA | | | 1,020,598 |
| | | | | |
| | 1,100 | | Federal National Mortgage Association Pool (MDR) (TBA) (WI/DD) | | 5.500% | | TBA | | AAA | | | 1,088,657 |
| | | | | |
| | 1,020 | | Federal National Mortgage Association Pool (MDR) (TBA) (WI/DD) | | 5.000% | | TBA | | AAA | | | 985,575 |
| | 6,297 | | Total Residentials | | | | | | | | | 6,262,858 |
| $ | 6,608 | | Total Asset-Backed and Mortgage-Backed Securities (cost $6,593,932) | | | | | | | | | 6,574,126 |
| | | | | |
Principal
Amount (000) | | Description | | Coupon | | Maturity | | Ratings (1) | | Value |
| | | CAPITAL PREFERRED SECURITIES – 0.1% | | | | | | | | | |
| | | | | |
| | | Capital Markets – 0.1% | | | | | | | | | |
| | | | | |
| $ | 8 | | First Union Institutional Capital Securities I | | 8.040% | | 12/01/26 | | A1 | | $ | 8,329 |
| $ | 8 | | Total Capital Preferred Securities (cost $8,651) | | | | | | | | | 8,329 |
| | | | | |
Principal
Amount (000) | | Description | | Coupon | | Maturity | | Ratings (1) | | Value |
| | | SOVEREIGN DEBT – 5.1% | | | | | | | | | |
| | | | | |
| | | Colombia – 0.1% | | | | | | | | | |
| | | | | |
| $ | 10 | | Republic of Colombia | | 8.250% | | 12/22/14 | | BB+ | | $ | 11,405 |
| | | Hungary – 0.5% | | | | | | | | | |
| | | | | |
| | 60 | | Republic of Hungary | | 4.750% | | 2/03/15 | | A2 | | | 58,165 |
23
Portfolio of Investments (Unaudited)
Nuveen Core Bond Fund (continued)
March 31, 2007
| | | | | | | | | | | | |
Principal
Amount (000) | | Description | | Coupon | | Maturity | | Ratings (1) | | Value |
| | | Mexico – 0.6% | | | | | | | | | |
| | | | | |
| $ | 65 | | United Mexican States | | 6.625% | | 3/03/15 | | Baa1 | | $ | 70,361 |
| | | Poland – 0.5% | | | | | | | | | |
| | | | | |
| | 60 | | Republic of Poland | | 5.000% | | 10/19/15 | | A2 | | | 59,430 |
| | | Turkey – 3.4% | | | | | | | | | |
| | | | | |
| | 200 | | Republic of Turkey, Government Bond | | 14.000% | | 1/19/11 | | Ba3 | | | 131,825 |
| | | | | |
| | 400 | | Republic of Turkey, Government Bond | | 10.000% | | 2/15/12 | | BB | | | 296,630 |
| | 600 | | Total Turkey | | | | | | | | | 428,455 |
| $ | 795 | | Total Sovereign Debt (cost $609,050) | | | | | | | | | 627,816 |
| | | | | |
Principal
Amount (000) | | Description | | Weighted
Average
Coupon | | Maturity (2) | | Ratings (1) | | Value |
| | | | | | | | | | | | |
| | | VARIABLE RATE SENIOR LOAN INTERESTS – 4.1% (3) | | | | | | | | | |
| | | | | |
| | | Metals & Mining – 2.0% | | | | | | | | | |
| | | | | |
| $ | 250 | | Freeport-McMoRan Copper & Gold Inc., Bridge Loan, (WI/DD) | | TBD | | TBD | | B1 | | $ | 250,000 |
| | | Oil, Gas & Consumable Fuels – 2.1% | | | | | | | | | |
| | | | | |
| | 250 | | SandRidge Energy | | 8.620% | | 3/07/15 | | B | | | 254,375 |
| $ | 500 | | Total Variable Rate Senior Loan Interests (cost $500,000) | | | | | | | | | 504,375 |
| | | | | |
Principal
Amount (000) | | Description | | Coupon | | Maturity | | | | Value |
| | | | | | | | | | | | |
| | | SHORT-TERM INVESTMENTS – 27.4% | | | | | | | | | |
| | | | | |
| $ | 3,372 | | Repurchase Agreement with Fixed Income Clearing Corporation, dated 3/30/07, repurchase price $3,373,839, collateralized by $3,525,000 U.S. Treasury Bill, 0.000%, due 9/27/07, value $3,440,400 | | 4.900% | | 4/02/07 | | | | $ | 3,372,462 |
| | | Total Short-Term Investments (cost $3,372,462) | | | | | | | | | 3,372,462 |
| | | |
| | | Total Investments (cost $16,313,245) – 132.5% | | | | | | | | | 16,285,192 |
| | | |
| | | | | |
Principal
Amount (000) | | Description | | Coupon | | Maturity | | Ratings (1) | | Value |
| | | | | | | | | | | | |
| | | ASSET-BACKED AND MORTGAGE-BACKED SECURITIES SOLD SHORT – (4.8)% | | | | | | | | | |
| | | | | |
| $ | (600) | | Federal National Mortgage Association Pool 918497 (MDR) (TBA) | | 5.000% | | TBA | | AAA | | $ | (591,937) |
| | | Total Asset-Backed and Mortgage-Backed Securities Sold Short (cost $593,086) | | | | | | | | | (591,937) |
| | | |
| | | Other Assets Less Liabilities – (27.7)% | | | | | | | | | (3,403,698) |
| | | |
| | | Net Assets – 100% | | | | | | | | $ | 12,289,557 |
| | | |
24
Forward Foreign Currency Exchange Contracts outstanding at March 31, 2007:
| | | | | | | | | | | | |
| Currency Contracts to Deliver | | Amount
(Local Currency) | | In Exchange For
Currency | | Amount
(Local Currency) | | Settlement
Date | | Unrealized
Appreciation
(Depreciation)
(U.S. Dollars) | |
| Canadian Dollar | | 125,000 | | U.S. Dollar | | 106,434 | | 4/10/07 | | $ | (1,870 | ) |
| Czech Koruna | | 2,500,000 | | U.S. Dollar | | 117,719 | | 4/12/07 | | | (1,641 | ) |
| Euro | | 6,500 | | Iceland Krona | | 591,825 | | 6/22/07 | | | 109 | |
| Euro | | 38,500 | | Iceland Krona | | 3,505,618 | | 6/22/07 | | | 646 | |
| Euro | | 45,000 | | Iceland Krona | | 4,070,250 | | 6/22/07 | | | 350 | |
| Hungarian Forint | | 22,000,000 | | U.S. Dollar | | 113,198 | | 5/08/07 | | | (5,066 | ) |
| Japanese Yen | | 141,480,000 | | U.S. Dollar | | 1,214,525 | | 6/25/07 | | | 530 | |
| Mexican Peso | | 1,205,000 | | U.S. Dollar | | 107,605 | | 4/19/07 | | | (1,459 | ) |
| New Turkish Lira | | 184,000 | | U.S. Dollar | | 126,635 | | 4/30/07 | | | (4,112 | ) |
| New Turkish Lira | | 179,450 | | U.S. Dollar | | 124,086 | | 5/14/07 | | | (2,744 | ) |
| New Turkish Lira | | 225,000 | | U.S. Dollar | | 153,207 | | 6/01/07 | | | (4,737 | ) |
| New Zealand Dollar | | 152,000 | | U.S. Dollar | | 104,274 | | 4/05/07 | | | (4,271 | ) |
| New Zealand Dollar | | 260,000 | | U.S. Dollar | | 181,171 | | 5/15/07 | | | (3,986 | ) |
| Norwegian Krone | | 747,955 | | U.S. Dollar | | 118,000 | | 4/10/07 | | | (5,089 | ) |
| Norwegian Krone | | 686,950 | | U.S. Dollar | | 112,390 | | 5/08/07 | | | (751 | ) |
| Pound Sterling | | 61,000 | | U.S. Dollar | | 119,444 | | 4/10/07 | | | (592 | ) |
| Pound Sterling | | 61,000 | | U.S. Dollar | | 119,602 | | 4/10/07 | | | (434 | ) |
| Singapore Dollar | | 160,000 | | U.S. Dollar | | 104,541 | | 4/30/07 | | | (1,117 | ) |
| South African Rand | | 785,000 | | U.S. Dollar | | 108,067 | | 4/25/07 | | | 144 | |
| Swedish Krona | | 772,372 | | U.S. Dollar | | 110,000 | | 5/08/07 | | | (845 | ) |
| Swedish Krona | | 800,000 | | U.S. Dollar | | 114,062 | | 6/14/07 | | | (978 | ) |
| Swiss Franc | | 147,000 | | U.S. Dollar | | 119,431 | | 4/10/07 | | | (1,646 | ) |
| Swiss Franc | | 147,000 | | U.S. Dollar | | 120,924 | | 6/14/07 | | | (822 | ) |
| U.S. Dollar | | 106,851 | | New Zealand Dollar | | 152,000 | | 4/05/07 | | | 1,693 | |
| U.S. Dollar | | 107,374 | | Canadian Dollar | | 125,000 | | 4/10/07 | | | 931 | |
| U.S. Dollar | | 118,000 | | Norwegian Krone | | 734,798 | | 4/10/07 | | | 2,924 | |
| U.S. Dollar | | 119,979 | | Pound Sterling | | 61,000 | | 4/10/07 | | | 57 | |
| U.S. Dollar | | 119,994 | | Pound Sterling | | 61,000 | | 4/10/07 | | | 42 | |
| U.S. Dollar | | 121,028 | | Swiss Franc | | 147,000 | | 4/10/07 | | | 49 | |
| U.S. Dollar | | 117,041 | | Czech Koruna | | 2,500,000 | | 4/12/07 | | | 2,319 | |
| U.S. Dollar | | 109,734 | | Mexican Peso | | 1,205,000 | | 4/19/07 | | | (670 | ) |
| U.S. Dollar | | 109,213 | | South African Rand | | 785,000 | | 4/25/07 | | | (1,289 | ) |
| U.S. Dollar | | 59,922 | | Hungarian Forint | | 11,056,200 | | 4/26/07 | | | (437 | ) |
| U.S. Dollar | | 128,501 | | New Turkish Lira | | 184,000 | | 4/30/07 | | | 2,246 | |
| U.S. Dollar | | 105,263 | | Singapore Dollar | | 160,000 | | 4/30/07 | | | 395 | |
| U.S. Dollar | | 111,669 | | Hungarian Forint | | 22,000,000 | | 5/08/07 | | | 6,593 | |
| U.S. Dollar | | 110,000 | | Norwegian Krone | | 686,950 | | 5/08/07 | | | 3,141 | |
| U.S. Dollar | | 111,189 | | Swedish Krona | | 772,372 | | 5/08/07 | | | (344 | ) |
| U.S. Dollar | | 118,621 | | Brazilian Real | | 250,800 | | 5/14/07 | | | 2,398 | |
| U.S. Dollar | | 177,892 | | New Zealand Dollar | | 260,000 | | 5/15/07 | | | 7,264 | |
| U.S. Dollar | | 59,687 | | Hungarian Forint | | 11,340,000 | | 6/14/07 | | | 1,115 | |
| U.S. Dollar | | 59,412 | | South African Rand | | 440,520 | | 6/14/07 | | | 820 | |
| U.S. Dollar | | 60,478 | | South African Rand | | 440,520 | | 6/14/07 | | | (246 | ) |
| U.S. Dollar | | 1,091,685 | | Japanese Yen | | 127,380,000 | | 6/25/07 | | | 1,322 | |
| U.S. Dollar | | 59,497 | | Colombian Peso | | 130,000,000 | | 6/27/07 | | | (770 | ) |
| U.S. Dollar | | 119,452 | | Mexican Peso | | 1,320,000 | | 6/27/07 | | | (429 | ) |
| U.S. Dollar | | 59,051 | | Indian Rupee | | 2,600,000 | | 6/28/07 | | | 26 | |
| | | | | | | | | | | $ | (11,231 | ) |
Interest Rate Swaps outstanding at March 31, 2007:
| | | | | | | | | | | | | | | | | | | |
| Counterparty | | Notional
Amount | | | | Fund
Pay/Receive
Floating Rate | | Floating Rate
Index | | Fixed Rate
(Annualized) | | | Fixed Rate
Payment
Frequency | | Termination
Date | | Unrealized
Appreciation
(Depreciation)
(U.S. Dollars) | |
| Bank of America (4) | | 465,000,000 | | HUF | | Receive | | 6-Month BUBOR | | 7.300 | % | | Annually | | 10/02/08 | | $ | — | |
| Citigroup Inc. (4) | | 15,000,000 | | NOK | | Pay | | 6-Month NIBOR | | 5.460 | | | Annually | | 2/09/09 | | | 1,119 | |
| JPMorgan | | 750,000 | | MXN | | Pay | | 28-Day MXN TIIE | | 10.370 | | | 28-Day | | 5/13/10 | | | 5,138 | |
| JPMorgan (4) | | 18,500,000 | | ZAR | | Pay | | 3-Month JIBA | | 9.050 | | | Quarterly | | 9/29/08 | | | — | |
| Merrill Lynch | | 400,000 | | BRL | | Receive | | 1-Day BZDIORA | | 11.690 | | | Annually | | 1/02/09 | | | (186 | ) |
| Merrill Lynch | | 1,000,000 | | BRL | | Pay | | 1-Day BZDIORA | | 11.690 | | | Annually | | 1/02/17 | | | (199 | ) |
| Morgan Stanley | | 400,000 | | BRL | | Receive | | 1-Day BZDIORA | | 11.790 | | | Annually | | 1/02/09 | | | 202 | |
| Morgan Stanley | | 1,000,000 | | BRL | | Pay | | 1-Day BZDIORA | | 11.850 | | | Annually | | 1/03/17 | | | 1,800 | |
| | | | | | | | | | | | | | | | | | $ | 7,874 | |
25
Portfolio of Investments (Unaudited)
Nuveen Core Bond Fund (continued)
March 31, 2007
Credit Default Swap outstanding at March 31, 2007:
| | | | | | | | | | | | | | | | |
| Counterparty | | Referenced Entity | | Buy/Sell
Protection | | Notional
Amount | | Fixed
Rate | | | Termination
Date | | Unrealized
Appreciation
(Depreciation)
(U.S. Dollars) | |
| Morgan Stanley | | Louisiana-Pacific Corporation | | Buy | | $ | 330,000 | | 1.350 | % | | 12/20/11 | | $ | (3,403 | ) |
Futures Contracts outstanding at March 31, 2007:
| | | | | | | | | | | | | |
| Type | | Contract
Position | | Number of
Contracts | | | Contract
Expiration | | Value at
March 31, 2007
(U.S. Dollars) | | | Unrealized
Appreciation
(Depreciation
(U.S. Dollars) |
| U.S. 5-Year Treasury Note | | Long | | 25 | | | 6/07 | | 2,644,922 | | | $ | 5,784 |
| U.S. 10-Year Treasury Note | | Short | | (5 | ) | | 6/07 | | (540,625 | ) | | | 1,618 |
| | | | | | | | | | | | | $ | 7,402 |
| | (1) | | Ratings: Using the higher of Standard & Poor’s or Moody’s rating. Ratings below BBB by Standard & Poor’s Group or Baa by Moody’s Investor Service, Inc. are considered to be below investment grade. |
| | (2) | | Senior Loans generally are subject to mandatory and/or optional prepayment. Because of these mandatory prepayment conditions and because there may be significant economic incentives for a Borrower to prepay, prepayments of Senior Loans may occur. As a result, the actual remaining maturity of Senior Loans held may be substantially less than the stated maturities shown. |
| | (3) | | Senior Loans in which the Fund invests generally pay interest at rates which are periodically adjusted by reference to a base short-term, floating lending rate plus an assigned fixed rate. These floating lending rates are generally (i) the lending rate referenced by the London Inter-Bank Offered Rate (“LIBOR”), or (ii) the prime rate offered by one or more major United States banks. |
| | | | Senior Loans may be considered restricted in that the Fund ordinarily is contractually obligated to receive approval from the Agent Bank and/or Borrower prior to the disposition of a Senior Loan. |
| | (4) | | Forward Swap Contract with an effective date as show in the following table. Effective date represents the date on which both the Fund and counterparty commence interest payment accruals on each forward swap contract. |
| | | | | | |
| Counterparty | | Notional
Amount | | | | Effective
Date |
| Bank of America | | 465,000,000 | | HUF | | 10/02/07 |
| Citigroup Inc. | | 15,000,000 | | NOK | | 2/07/08 |
| JPMorgan | | 18,500,000 | | ZAR | | 9/28/07 |
| | 144A | | Investment is exempt from registration under Rule 144A of the Securities Act of 1933, as amended. These investments may only be resold in transactions exempt from registration which are normally those transactions with qualified institutional buyers. |
| | MDR | | Denotes investment is subject to dollar roll transactions and deemed purchased on a when-issued basis. |
| | TBA | | To be announced. Maturity date not known prior to the settlement of the transaction. |
| | TBD | | Senior Loan purchased on a when-issued or delayed-delivery basis. Certain details associated with this purchase are not known prior to the settlement date of the transaction. In addition, Senior Loans typically trade without accrued interest and therefore a weighted average coupon rate is not available prior to settlement. At settlement, if still unknown, the Borrower or counterparty will provide the Fund with the final weighted average coupon rate and maturity date. |
| | PIK | | In lieu of cash payment, interest accrued on “Payment in Kind” investment increases principal outstanding. |
| | WI/DD | | Purchased on a when-issued or delayed delivery basis. |
| | BUBOR | | Budapest Inter-Bank Offered Rate |
| | BZDIORA | | Brazil Inter-Bank Deposit Rate Over |
| | JIBA | | South Africa Johannesburg Inter-Bank Agreed Rate |
| | NIBOR | | Norway Inter-Bank Offered Rate |
| | TIIE | | Mexican Peso Inter-Bank Equilibrium Interest Rate |
| | * | | Principal Amount rounds to less than $1,000. |
See accompanying notes to financial statements.
26
Portfolio of Investments (Unaudited)
Nuveen High Yield Bond Fund
March 31, 2007
| | | | | | | | | | | | |
Principal
Amount (000) | | Description | | Coupon | | Maturity | | Ratings (1) | | Value |
| | | | | | | | | | | | |
| | | CORPORATE BONDS – 89.6% | | | | | | | | | |
| | | | | |
| | | Aerospace & Defense – 1.0% | | | | | | | | | |
| | | | | |
| $ | 125 | | Bombardier Inc., Series 144A | | 6.750% | | 5/01/12 | | BB | | $ | 125,000 |
| | | | | |
| | 91 | | DI Finance/DynCorp International, Series B | | 9.500% | | 2/15/13 | | B | | | 97,370 |
| | 216 | | Total Aerospace & Defense | | | | | | | | | 222,370 |
| | | Automobiles – 4.1% | | | | | | | | | |
| | | | | |
| | 400 | | Ford Motor Credit Company | | 4.950% | | 1/15/08 | | B1 | | | 395,285 |
| | | | | |
| | 120 | | Ford Motor Credit Company | | 9.875% | | 8/10/11 | | B1 | | | 127,192 |
| | | | | |
| | 165 | | Ford Motor Credit Company | | 7.000% | | 10/01/13 | | B1 | | | 153,576 |
| | | | | |
| | 250 | | Ford Motor Credit Company | | 8.000% | | 12/15/16 | | B1 | | | 240,957 |
| | 935 | | Total Automobiles | | | | | | | | | 917,010 |
| | | Capital Markets – 0.7% | | | | | | | | | |
| | | | | |
| | 150 | | Yankee Acquistion Corporation | | 8.500% | | 2/15/15 | | B3 | | | 152,625 |
| | | Chemicals – 10.4% | | | | | | | | | |
| | | | | |
| | 100 | | Equistar Chemicals LP/Equistar Funding Corporation | | 10.625% | | 5/01/11 | | BB– | | | 106,000 |
| | | | | |
| | 420 | | Equistar Chemicals LP | | 8.750% | | 2/15/09 | | BB– | | | 439,950 |
| | | | | |
| | 100 | | Lyondell Chemical Company | | 10.875% | | 5/01/09 | | B | | | 101,000 |
| | | | | |
| | 200 | | Lyondell Petro-Chemical Company, Corporate Bonds | | 11.125% | | 7/15/12 | | BB | | | 215,000 |
| | | | | |
| | 470 | | MacDermid Inc. | | 9.125% | | 7/15/11 | | Ba2 | | | 492,621 |
| | | | | |
| | 220 | | MacDermid, Inc., (WI/DD, settling 4/12/07) | | 9.500% | | 4/15/17 | | CCC+ | | | 226,600 |
| | | | | |
| | 100 | | Methanex Corporation | | 8.750% | | 8/15/12 | | BBB– | | | 111,500 |
| | | | | |
| | 200 | | NOVA Chemicals Corporation | | 8.502% | | 11/15/13 | | Ba3 | | | 200,000 |
| | | | | |
| | 45 | | PolyOne Corporation | | 10.625% | | 5/15/10 | | B+ | | | 47,700 |
| | | | | |
| | 350 | | Rockwood Specialties Group Inc. | | 10.625% | | 5/15/11 | | B– | | | 371,000 |
| | 2,205 | | Total Chemicals | | | | | | | | | 2,311,371 |
| | | Commercial Services & Supplies – 3.4% | | | | | | | | | |
| | | | | |
| | 100 | | Ahern Rentals Inc. | | 9.250% | | 8/15/13 | | B | | | 104,875 |
| | | | | |
| | 400 | | Browning Ferris Industries | | 9.250% | | 5/01/21 | | BB | | | 436,000 |
| | | | | |
| | 70 | | Quebecor World Capital Corporation, 144A | | 8.750% | | 3/15/16 | | B+ | | | 71,225 |
| | | | | |
| | 130 | | Rental Service Corporation, 144A | | 9.500% | | 12/01/14 | | B– | | | 139,100 |
| | 700 | | Total Commercial Services & Supplies | | | | | | | | | 751,200 |
| | | Construction Materials – 0.1% | | | | | | | | | |
| | | | | |
| | 40 | | Texas Industries Inc. | | 7.250% | | 7/15/13 | | BB– | | | 41,400 |
| | | Consumer Finance – 2.6% | | | | | | | | | |
| | | | | |
| | 85 | | Ford Motor Credit Company | | 5.625% | | 10/01/08 | | B1 | | | 83,322 |
| | | | | |
| | 500 | | GMAC LLC | | 6.125% | | 1/22/08 | | BB+ | | | 499,499 |
| | 585 | | Total Consumer Finance | | | | | | | | | 582,821 |
| | | Containers & Packaging – 2.9% | | | | | | | | | |
| | | | | |
| | 200 | | Caraustar Industries | | 7.375% | | 6/01/09 | | B+ | | | 196,000 |
| | | | | |
| | 441 | | Owens-Brockway Glass Container Inc. | | 8.875% | | 2/15/09 | | Ba2 | | | 452,025 |
| | 641 | | Total Containers & Packaging | | | | | | | | | 648,025 |
| | | Distributors – 0.7% | | | | | | | | | |
| | | | | |
| | 155 | | Ryerson Tull Inc. | | 8.250% | | 12/15/11 | | B– | | | 157,325 |
27
Portfolio of Investments (Unaudited)
Nuveen High Yield Bond Fund (continued)
March 31, 2007
| | | | | | | | | | | | |
Principal
Amount (000) | | Description | | Coupon | | Maturity | | Ratings (1) | | Value |
| | | Diversified Consumer Services – 1.6% | | | | | | | | | |
| | | | | |
| $ | 100 | | Carriage Services Inc. | | 7.875% | | 1/15/15 | | B1 | | $ | 103,250 |
| | | | | |
| | 250 | | Hawker Beechcraft Acquistion Company, 144A | | 9.750% | | 4/01/17 | | B– | | | 261,875 |
| | 350 | | Total Diversified Consumer Services | | | | | | | | | 365,125 |
| | | Diversified Financial Services – 0.5% | | | | | | | | | |
| | | | | |
| | 100 | | Yankee Acquistion Corporation | | 9.750% | | 2/15/17 | | CCC+ | | | 101,750 |
| | | Diversified Telecommunication Services – 1.8% | | | | | | | | | |
| | | | | |
| | 50 | | Cincinnati Bell Inc. | | 8.375% | | 1/15/14 | | B2 | | | 51,375 |
| | | | | |
| | 100 | | Citizens Communications Company | | 9.000% | | 8/15/31 | | BB+ | | | 110,000 |
| | | | | |
| | 40 | | Hughes Network Systems LLC, 144A | | 9.500% | | 4/15/14 | | B1 | | | 42,300 |
| | | | | |
| | 100 | | Intelsat Limited | | 5.250% | | 11/01/08 | | B | | | 98,875 |
| | | | | |
| | 85 | | Level 3 Communications, 144A | | 9.250% | | 11/01/14 | | B3 | | | 87,763 |
| | 375 | | Total Diversified Telecommunication Services | | | | | | | | | 390,313 |
| | | Electrical Equipment – 1.2% | | | | | | | | | |
| | | | | |
| | 220 | | General Cable Corporation, 144A | | 7.125% | | 4/01/17 | | B+ | | | 222,475 |
| | | | | |
| | 35 | | UCAR Finance Inc. | | 10.250% | | 2/15/12 | | B2 | | | 36,925 |
| | 255 | | Total Electrical Equipment | | | | | | | | | 259,400 |
| | | Energy Equipment & Services – 6.9% | | | | | | | | | |
| | | | | |
| | 450 | | Allis Chalmers Energy Inc., 144A | | 8.500% | | 3/01/17 | | B | | | 445,500 |
| | | | | |
| | 225 | | Calfrac Holdings LP, 144A | | 7.750% | | 2/15/15 | | B1 | | | 219,375 |
| | | | | |
| | 200 | | Complete Production Services Inc., 144A | | 8.000% | | 12/15/16 | | B | | | 206,000 |
| | | | | |
| | 200 | | Geokinetics Inc., 144A | | 11.855% | | 12/15/12 | | B3 | | | 207,000 |
| | | | | |
| | 250 | | Hanover Equipment Trust, Senior Secured Note, Series 2003 | | 8.500% | | 9/01/08 | | Ba3 | | | 252,500 |
| | | | | |
| | 100 | | Seitel Acquisition Corporation | | 9.750% | | 2/15/14 | | B– | | | 101,750 |
| | | | | |
| | 90 | | Targa Resources Inc., Series 144A | | 8.500% | | 11/01/13 | | B– | | | 92,250 |
| | 1,515 | | Total Energy Equipment & Services | | | | | | | | | 1,524,375 |
| | | Food & Staples Retailing – 1.5% | | | | | | | | | |
| | | | | |
| | 50 | | Duane Reade Inc, Floating Rate Note, 4.500% plus three-month LIBOR | | 9.850% | | 12/15/10 | | B3 | | | 51,313 |
| | | | | |
| | 300 | | Duane Reade Inc. | | 9.750% | | 8/01/11 | | Caa3 | | | 290,250 |
| | 350 | | Total Food & Staples Retailing | | | | | | | | | 341,563 |
| | | Food Products – 0.5% | | | | | | | | | |
| | | | | |
| | 100 | | Pinnacle Foods Holding Corporation | | 8.250% | | 12/01/13 | | CCC | | | 109,255 |
| | | Health Care Equipment & Supplies – 0.9% | | | | | | | | | |
| | | | | |
| | 200 | | Invacare Corporation, 144A | | 9.750% | | 2/15/15 | | B2 | | | 202,000 |
| | | Hotels, Restaurants & Leisure – 3.4% | | | | | | | | | |
| | | | | |
| | 125 | | MGM Grand Inc. | | 6.000% | | 10/01/09 | | BB | | | 125,781 |
| | | | | |
| | 100 | | MGM Mirage Inc. | | 6.625% | | 7/15/15 | | BB | | | 96,500 |
| | | | | |
| | 270 | | Mohegan Tribal Gaming Authority | | 8.000% | | 4/01/12 | | Ba2 | | | 281,475 |
| | | | | |
| | 250 | | Wheeling Island Gaming Inc. | | 10.125% | | 12/15/09 | | B | | | 255,000 |
| | 745 | | Total Hotels, Restaurants & Leisure | | | | | | | | | 758,756 |
| | | Household Durables – 1.6% | | | | | | | | | |
| | | | | |
| | 140 | | Beazer Homes USA, Inc. | | 8.625% | | 5/15/11 | | Ba1 | | | 137,550 |
| | | | | |
| | 50 | | KB Home | | 9.500% | | 2/15/11 | | Ba2 | | | 51,313 |
| | | | | |
| | 100 | | Technical Olympic USA Inc. | | 7.500% | | 1/15/15 | | CCC+ | | | 71,250 |
| | | | | |
| | 90 | | Toll Corporation | | 8.250% | | 2/01/11 | | BB+ | | | 92,250 |
| | 380 | | Total Household Durables | | | | | | | | | 352,363 |
28
| | | | | | | | | | | | |
Principal
Amount (000) | | Description | | Coupon | | Maturity | | Ratings (1) | | Value |
| | | Indpendent Power Producers & Energy Traders – 0.4% | | | | | | | | | |
| | | | | |
| $ | 85 | | NRG Energy Inc. | | 7.375% | | 2/01/16 | | B1 | | $ | 87,550 |
| | | Industrial Conglomerates – 0.2% | | | | | | | | | |
| | | | | |
| | 50 | | Covalence Specialty Materials Corporation, 144A | | 10.250% | | 3/01/16 | | B3 | | | 50,250 |
| | | IT Services – 0.9% | | | | | | | | | |
| | | | | |
| | 200 | | Unisys Corporation | | 7.875% | | 4/01/08 | | B+ | | | 202,000 |
| | | Machinery – 1.2% | | | | | | | | | |
| | | | | |
| | 150 | | Case New Holland Inc., Series WI | | 9.250% | | 8/01/11 | | BB | | | 158,250 |
| | | | | |
| | 100 | | Columbus McKinnon Corporation | | 8.875% | | 11/01/13 | | B2 | | | 106,500 |
| | 250 | | Total Machinery | | | | | | | | | 264,750 |
| | | Media – 12.2% | | | | | | | | | |
| | | | | |
| | 100 | | CMP Susquehanna Corporation, 144A | | 9.875% | | 5/15/14 | | B3 | | | 103,000 |
| | | | | |
| | 326 | | Dex Media East LLC | | 9.875% | | 11/15/09 | | B1 | | | 341,485 |
| | | | | |
| | 90 | | Dex Media Inc. | | 9.000% | | 11/15/13 | | B | | | 84,263 |
| | | | | |
| | 100 | | Gray Television Inc., Term Loan | | 9.250% | | 12/15/11 | | B1 | | | 104,875 |
| | | | | |
| | 62 | | Insight Midwest L.P | | 9.750% | | 10/01/09 | | B | | | 63,163 |
| | | | | |
| | 250 | | Mediacom LLC | | 9.500% | | 1/15/13 | | B | | | 258,438 |
| | | | | |
| | 50 | | Paxson Communications Corporation, Floating Rate Note, 144A | | 11.600% | | 1/15/13 | | Caa2 | | | 52,375 |
| | | | | |
| | 300 | | Primedia Inc., Floating Rate Note, 144A | | 10.725% | | 5/15/10 | | B | | | 312,000 |
| | | | | |
| | 220 | | Primedia Inc., Senior Notes | | 8.875% | | 5/15/11 | | B | | | 227,150 |
| | | | | |
| | 200 | | R. H. Donnelley Finance Corp 1 | | 10.875% | | 12/15/12 | | B | | | 217,000 |
| | | | | |
| | 200 | | Radio One, Inc. | | 8.875% | | 7/01/11 | | B1 | | | 207,250 |
| | | | | |
| | 300 | | Readers Digest Association, 144A | | 9.000% | | 2/15/17 | | CCC+ | | | 290,250 |
| | | | | |
| | 430 | | Sinclair Broadcasting Group | | 8.000% | | 3/15/12 | | B1 | | | 447,200 |
| | 2,628 | | Total Media | | | | | | | | | 2,708,449 |
| | | Metals & Mining – 10.4% | | | | | | | | | |
| | | | | |
| | 220 | | Claymont Steel Inc., 144A | | 8.875% | | 2/15/15 | | B3 | | | 220,000 |
| | | | | |
| | 220 | | Freeport McMoran Copper & Gold, Inc. | | 8.375% | | 4/01/17 | | Ba3 | | | 238,425 |
| | | | | |
| | 420 | | IPSCO Inc., Senior Note | | 8.750% | | 6/01/13 | | BBB– | | | 449,400 |
| | | | | |
| | 140 | | Metals USA Holdings Corporation, Floating Rate Note, 144A (PIK) | | 11.350% | | 1/15/12 | | CCC+ | | | 137,900 |
| | | | | |
| | 100 | | Nalco Finance Holdings Inc. | | 9.000% | | 2/01/14 | | B– | | | 88,500 |
| | | | | |
| | 250 | | PNA Intermediate Holding Corporation | | 12.360% | | 2/15/13 | | B– | | | 257,500 |
| | | | | |
| | 100 | | Russel Metals Inc. | | 6.375% | | 3/01/14 | | BB | | | 96,250 |
| | | | | |
| | 400 | | Steel Dynamics, Inc., 144A (WI/DD, settling 4/30/07) | | 6.750% | | 4/01/15 | | Ba2 | | | 402,500 |
| | | | | |
| | 400 | | Steel Dynamics, Inc. | | 9.500% | | 3/15/09 | | BB+ | | | 409,500 |
| | 2,250 | | Total Metals & Mining | | | | | | | | | 2,299,975 |
| | | Multi-Utilities – 2.4% | | | | | | | | | |
| | | | | |
| | 250 | | Aquila, Inc. | | 11.875% | | 7/01/12 | | B | | | 326,875 |
| | | | | |
| | 200 | | Bon-Ton Department Stores Inc. | | 10.250% | | 3/15/14 | | B– | | | 215,750 |
| | 450 | | Total Multi-Utilities | | | | | | | | | 542,625 |
| | | Oil, Gas & Consumable Fuels – 4.9% | | | | | | | | | |
| | | | | |
| | 150 | | Alpha Natural Resources, Inc. | | 10.000% | | 6/01/12 | | B– | | | 162,000 |
| | | | | |
| | 100 | | Chesapeake Energy Corporation | | 6.250% | | 1/15/18 | | BB | | | 99,250 |
| | | | | |
| | 75 | | Compton Petroleum Finance Corporation | | 7.625% | | 12/01/13 | | B | | | 73,688 |
| | | | | |
| | 240 | | Markwest Energy Partners LP, Series B | | 8.500% | | 7/15/16 | | B | | | 251,400 |
29
Portfolio of Investments (Unaudited)
Nuveen High Yield Bond Fund (continued)
March 31, 2007
| | | | | | | | | | | | |
Principal
Amount (000) | | Description | | Coupon | | Maturity | | Ratings (1) | | Value |
| | | Oil, Gas & Consumable Fuels (continued) | | | | | | | | | |
| | | | | |
| $ | 150 | | Massey Energy Company, Global Notes | | 6.625% | | 11/15/10 | | B+ | | $ | 152,250 |
| | | | | |
| | 220 | | OPTI Canada Inc. | | 8.250% | | 12/15/14 | | BB | | | 229,900 |
| | | | | |
| | 110 | | Sabine Pass LNG LP., 144A | | 7.500% | | 11/30/16 | | BB | | | 111,100 |
| | 1,045 | | Total Oil, Gas & Consumable Fuels | | | | | | | | | 1,079,588 |
| | | Paper & Forest Products – 4.4% | | | | | | | | | |
| | | | | |
| | 250 | | Buckeye Technologies Inc. | | 8.000% | | 10/15/10 | | B | | | 250,000 |
| | | | | |
| | 220 | | Mercer International Inc. | | 9.250% | | 2/15/13 | | B | | | 221,650 |
| | | | | |
| | 200 | | Millar Western Forest Products Ltd | | 7.750% | | 11/15/13 | | B2 | | | 183,000 |
| | | | | |
| | 130 | | Pope & Talbot Inc. | | 8.375% | | 6/01/13 | | CCC | | | 107,250 |
| | | | | |
| | 180 | | Tembec Industries, Inc. | | 7.750% | | 3/15/12 | | CCC– | | | 110,250 |
| | | | | |
| | 100 | | Verso Paper Holdings LLC., 144A | | 9.125% | | 8/01/14 | | B | | | 104,500 |
| | 1,080 | | Total Paper & Forest Products | | | | | | | | | 976,650 |
| | | Pharmaceuticals – 2.0% | | | | | | | | | |
| | | | | |
| | 435 | | Biovail Corporation International | | 7.875% | | 4/01/10 | | BB– | | | 443,565 |
| | | Road & Rail – 1.3% | | | | | | | | | |
| | | | | |
| | 270 | | Kansas City Southern Railway Company | | 12.500% | | 6/15/12 | | B– | | | 290,790 |
| | | Specialty Retail – 0.9% | | | | | | | | | |
| | | | | |
| | 200 | | Brookstone Company Inc. | | 12.000% | | 10/15/12 | | B | | | 209,000 |
| | | Textiles, Apparel & Luxury Goods – 1.4% | | | | | | | | | |
| | | | | |
| | 250 | | HanesBrands Inc., Loan | | 8.735% | | 12/15/14 | | B2 | | | 255,938 |
| | | | | |
| | 50 | | Levi Strauss & Company | | 12.250% | | 12/15/12 | | B | | | 55,125 |
| | 300 | | Total Textiles, Apparel & Luxury Goods | | | | | | | | | 311,063 |
| | | Trading Companies & Distributors – 1.0% | | | | | | | | | |
| | | | | |
| | 100 | | Ashtead Capital Inc., 144A | | 9.000% | | 8/15/16 | | B | | | 107,000 |
| | | | | |
| | 100 | | H&E Equipment Limited, 144A | | 8.375% | | 7/15/16 | | B+ | | | 106,750 |
| | 200 | | Total Trading Companies & Distributors | | | | | | | | | 213,750 |
| | | Wireless Telecommunication Services – 0.2% | | | | | | | | | |
| | | | | |
| | 41 | | American Cellular Corporation Escrow Corporation | | 10.000% | | 8/01/11 | | B3 | | | 43,611 |
| $ | 19,481 | | Total Corporate Bonds (cost $19,771,806) | | | | | | | | | 19,912,663 |
| | | | | |
Principal
Amount (000) | | Description | | Weighted
Average
Coupon | | Maturity (2) | | Ratings (1) | | Value |
| | | VARIABLE RATE SENIOR LOAN INTERESTS – 5.7% (3) | | | | | | | | | |
| | | | | |
| | | Metals & Mining – 2.3% | | | | | | | | | |
| | | | | |
| $ | 500 | | Freeport-McMoRan Copper & Gold Inc., Bridge Loan, (WI/DD) | | TBD | | TBD | | B1 | | $ | 500,000 |
| | | Oil, Gas & Consumable Fuels – 3.4% | | | | | | | | | |
| | | | | |
| | 750 | | SandRidge Energy | | 8.620% | | 3/07/15 | | B | | | 763,125 |
| $ | 1,250 | | Total Variable Rate Senior Loan Interests (cost $1,250,000) | | | | | | | | | 1,263,125 |
| | | | | |
Principal
Amount (000) | | Description | | Coupon | | Maturity | | | | Value |
| | | SHORT-TERM INVESTMENTS – 10.4% | | | | | | | | | |
| | | | | |
| $ | 2,310 | | Repurchase Agreement with Fixed Income Clearing Corporation, dated 3/30/07, repurchase price $2,310,821, collateralized by $2,415,000 U.S. Treasury Bill, 0.000%, due 9/27/07, value $2,357,040 | | 4.900% | | 4/02/07 | | | | $ | 2,309,878 |
| | | Total Short-Term Investments (cost $2,309,878) | | | | | | | | | 2,309,878 |
| | | |
| | | Total Investments (cost $23,331,684) – 105.7% | | | | | | | | | 23,485,666 |
| | | |
| | | Other Assets Less Liabilities – (5.7)% | | | | | | | | | (1,264,420) |
| | | |
| | | Net Assets – 100% | | | | | | | | $ | 22,221,246 |
| | | |
30
Credit Default Swap outstanding at March 31, 2007:
| | | | | | | | | | | | | | | | |
| Counterparty | | Referenced Entity | | Buy/Sell
Protection | | Notional
Amount | | Fixed
Rate | | | Termination
Date | | Unrealized
Appreciation
(Depreciation)
(U.S. Dollars) | |
| Morgan Stanley | | Louisiana-Pacific Corporation | | Buy | | $ | 340,000 | | 1.350 | % | | 12/20/11 | | $ | (3,506 | ) |
Total Return Swap outstanding at March 31, 2007:
| | | | | | | | | | | | |
| Counterparty | | Receive Total
Return | | Pay | | Expiration
Date | | Notional
Amount | | Unrealized
Appreciation
(Depreciation) |
| Bear Stearns International, Ltd. | | Lehman Brothers
U.S. High Yield Index | | 1-month USD-LIBOR
less 35 basis points | | 12/01/07 | | $ | 5,000,000 | | $ | 14,600 |
| | (1) | | Ratings: Using the higher of Standard & Poor’s or Moody’s rating. Ratings below BBB by Standard & Poor’s Group or Baa by Moody’s Investor Service, Inc. are considered to be below investment grade. |
| | (2) | | Senior Loans generally are subject to mandatory and/or optional prepayment. Because of these mandatory prepayment conditions and because there may be significant economic incentives for a Borrower to prepay, prepayments of Senior Loans may occur. As a result, the actual remaining maturity of Senior Loans held may be substantially less than the stated maturities shown. |
| | (3) | | Senior Loans in which the Fund invests generally pay interest at rates which are periodically adjusted by reference to a base short-term, floating lending rate plus an assigned fixed rate. These floating lending rates are generally (i) the lending rate referenced by the London Inter-Bank Offered Rate (“LIBOR”), or (ii) the prime rate offered by one or more major United States banks. |
| | | | Senior Loans may be considered restricted in that the Fund ordinarily is contractually obligated to receive approval from the Agent Bank and/or Borrower prior to the disposition of a Senior Loan. |
| | 144A | | Investment is exempt from registration under Rule 144A of the Securities Act of 1933, as amended. These investments may only be resold in transactions exempt from registration which are normally those transactions with qualified institutional buyers. |
| | TBD | | Senior Loan purchased on a when-issued or delayed-delivery basis. Certain details associated with this purchase are not known prior to the settlement date of the transaction. In addition, Senior Loans typically trade without accrued interest and therefore a weighted average coupon rate is not available prior to settlement. At settlement, if still unknown, the Borrower or counterparty will provide the Fund with the final weighted average coupon rate and maturity date. |
| | PIK | | In lieu of cash payment, interest accrued on “Payment in Kind” investment increases principal outstanding. |
| | WI/DD | | Purchased on a when-issued or delayed delivery basis. |
| | USD-LIBOR | | United States Dollar—London Inter-Bank Offered Rate |
See accompanying notes to financial statements.
31
Statement of Assets and Liabilities (Unaudited)
March 31, 2007
| | | | | | | | | | | | |
| | | Short Duration | | | Core | | | High Yield | |
Assets | | | | | | | | | | | | |
Investments, at value (cost $11,668,855, $12,940,783 and $21,021,806, respectively) | | $ | 11,675,068 | | | $ | 12,912,730 | | | $ | 21,175,788 | |
Short-term investments (at cost, which approximates value) | | | 1,107,496 | | | | 3,372,462 | | | | 2,309,878 | |
Cash | | | 4,000 | | | | 4,001 | | | | 8,001 | |
Deposits with brokers for open futures contracts (cost $24,332, $37,184 and $39,183, respectively) | | | 22,658 | | | | 36,076 | | | | 39,183 | |
Unrealized appreciation on forward foreign currency exchange contracts | | | 35,114 | | | | 35,114 | | | | — | |
Unrealized appreciation on interest rate swaps | | | 7,882 | | | | 8,259 | | | | — | |
Receivables: | | | | | | | | | | | | |
Reimbursement from Adviser | | | 3,838 | | | | 26,476 | | | | 26,225 | |
Interest | | | 158,136 | | | | 86,525 | | | | 402,152 | |
Investments sold | | | 594,419 | | | | 733,929 | | | | — | |
Shares sold | | | — | | | | 14,911 | | | | 179,976 | |
Other assets | | | 110 | | | | 8,220 | | | | 111 | |
Total assets | | | 13,608,721 | | | | 17,238,703 | | | | 24,141,314 | |
Liabilities | | | | | | | | | | | | |
Securities sold short, at value (proceeds $593,086, $593,086 and $0, respectively) | | | 591,937 | | | | 591,937 | | | | — | |
Cash overdraft denominated in foreign currencies (cost $1,237, $1,237 and $0, respectively) | | | 1,233 | | | | 1,233 | | | | — | |
Unrealized depreciation on forward foreign currency exchange contracts | | | 46,354 | | | | 46,345 | | | | — | |
Unrealized depreciation on interest rate swaps | | | 385 | | | | 385 | | | | — | |
Unrealized depreciation on credit default swap | | | 3,403 | | | | 3,403 | | | | 3,506 | |
Unrealized depreciation on total return swap | | | — | | | | — | | | | 14,600 | |
Payables: | | | | | | | | | | | | |
Investments purchased | | | 1,556,861 | | | | 4,239,814 | | | | 1,759,041 | |
Variation margin on futures contracts | | | 806 | | | | 747 | | | | — | |
Accrued expenses: | | | | | | | | | | | | |
12b-1 distribution and service fees | | | 1,214 | | | | 1,175 | | | | 6,484 | |
Other | | | 10,796 | | | | 14,152 | | | | 10,295 | |
Dividends payable | | | 43,656 | | | | 49,955 | | | | 126,142 | |
Total liabilities | | | 2,256,645 | | | | 4,949,146 | | | | 1,920,068 | |
Net assets | | $ | 11,352,076 | | | $ | 12,289,557 | | | $ | 22,221,246 | |
Class A Shares | | | | | | | | | | | | |
Net assets | | $ | 230,897 | | | $ | 1,556,094 | | | $ | 5,254,138 | |
Shares outstanding | | | 11,970 | | | | 80,281 | | | | 262,708 | |
Net asset value per share | | $ | 19.29 | | | $ | 19.38 | | | $ | 20.00 | |
Offering price per share (net asset value per share plus
maximum sales charge of 2.00%, 3.75% and 4.75%, respectively, of offering price) | | $ | 19.68 | | | $ | 20.14 | | | $ | 21.00 | |
Class B Shares | | | | | | | | | | | | |
Net assets | | | N/A | | | $ | 126,341 | | | $ | 1,420,505 | |
Shares outstanding | | | N/A | | | | 6,505 | | | | 71,087 | |
Net asset value and offering price per share | | | N/A | | | $ | 19.42 | | | $ | 19.98 | |
Class C Shares | | | | | | | | | | | | |
Net assets | | $ | 1,487,617 | | | $ | 911,517 | | | $ | 5,287,073 | |
Shares outstanding | | | 77,065 | | | | 46,990 | | | | 264,849 | |
Net asset value and offering price per share | | $ | 19.30 | | | $ | 19.40 | | | $ | 19.96 | |
Class R Shares | | | | | | | | | | | | |
Net assets | | $ | 9,633,562 | | | $ | 9,695,605 | | | $ | 10,259,530 | |
Shares outstanding | | | 500,277 | | | | 500,589 | | | | 513,563 | |
Net asset value and offering price per share | | $ | 19.26 | | | $ | 19.37 | | | $ | 19.98 | |
| | | |
Net Assets Consist of: | | | | | | | | | | | | |
Capital paid-in | | $ | 11,714,243 | | | $ | 12,591,800 | | | $ | 22,053,300 | |
Undistributed (Over-distribution of) net investment income | | | (50,824 | ) | | | (38,823 | ) | | | 87,306 | |
Accumulated net realized gain (loss) from investments and derivative transactions | | | (315,059 | ) | | | (236,054 | ) | | | (55,236 | ) |
Net unrealized appreciation (depreciation) of investments and derivative transactions | | | 3,716 | | | | (27,366 | ) | | | 135,876 | |
Net assets | | $ | 11,352,076 | | | $ | 12,289,557 | | | $ | 22,221,246 | |
N/A – Short Duration is not authorized to issue Class B shares.
See accompanying notes to financial statements.
32
Statement of Operations (Unaudited)
Six Months Ended March 31, 2007
| | | | | | | | | | | | |
| | | Short Duration | | | Core | | | High Yield | |
Investment Income | | $ | 273,954 | | | $ | 310,642 | | | $ | 658,781 | |
Expenses | | | | | | | | | | | | |
Management fees | | | 21,100 | | | | 27,864 | | | | 46,510 | |
12b-1 service fees – Class A | | | 362 | | | | 1,425 | | | | 3,260 | |
12b-1 distribution and service fees – Class B | | | N/A | | | | 366 | | | | 3,801 | |
12b-1 refund – Class B | | | — | | | | (98 | ) | | | — | |
12b-1 distribution and service fees – Class C | | | 5,525 | | | | 3,265 | | | | 12,982 | |
Shareholders’ servicing agent fees and expenses | | | 257 | | | | 865 | | | | 7,074 | |
Custodian’s fees and expenses | | | 14,967 | | | | 24,048 | | | | 12,622 | |
Trustees’ fees and expenses | | | 216 | | | | 248 | | | | 253 | |
Professional fees | | | 20,356 | | | | 20,358 | | | | 20,359 | |
Shareholders’ reports – printing and mailing expenses | | | 1,415 | | | | 9,801 | | | | 14,450 | |
Federal and state registration fees | | | 5,277 | | | | 6,918 | | | | 7,320 | |
Other expenses | | | 5,092 | | | | 11,394 | | | | 5,796 | |
Total expenses before custodian fee credit and expense reimbursement | | | 74,567 | | | | 106,454 | | | | 134,427 | |
Custodian fee credit | | | (3,488 | ) | | | (839 | ) | | | (1,978 | ) |
Expense reimbursement | | | (47,579 | ) | | | (73,633 | ) | | | (67,874 | ) |
Net expenses | | | 23,500 | | | | 31,982 | | | | 64,575 | |
Net investment income | | | 250,454 | | | | 278,660 | | | | 594,206 | |
Realized and Unrealized Gain (Loss) | | | | | | | | | | | | |
Net realized gain (loss) from: | | | | | | | | | | | | |
Investments | | | 3,028 | | | | 54,926 | | | | 115,921 | |
Futures | | | (12,191 | ) | | | 1,960 | | | | 13,360 | |
Forwards | | | (20 | ) | | | (16 | ) | | | — | |
Swaps | | | 4,550 | | | | 3,751 | | | | 175,608 | |
Foreign currencies | | | 19,436 | | | | 19,435 | | | | — | |
Change in net unrealized appreciation (depreciation) of: | | | | | | | | | | | | |
Investments | | | 26,943 | | | | (5,270 | ) | | | 189,946 | |
Futures | | | 1,436 | | | | (763 | ) | | | 2,403 | |
Forwards | | | (8,868 | ) | | | (8,859 | ) | | | — | |
Swaps | | | (617 | ) | | | (240 | ) | | | (46,764 | ) |
Foreign currencies | | | (2,030 | ) | | | (1,450 | ) | | | — | |
Net realized and unrealized gain (loss) | | | 31,667 | | | | 63,474 | | | | 450,474 | |
Net increase (decrease) in net assets from operations | | $ | 282,121 | | | $ | 342,134 | | | $ | 1,044,680 | |
N/A – Short Duration is not authorized to issue Class B Shares.
See accompanying notes to financial statements.
33
Statement of Changes in Net Assets (Unaudited)
| | | | | | | | | | | | | | | | | | | | | | | | |
| | | Short Duration | | | Core | | | High Yield | |
| | | Six Months Ended
3/31/07 | | | Year Ended 9/30/06 | | | Six Months Ended
3/31/07 | | | Year Ended
9/30/06 | | | Six Months Ended
3/31/07 | | | Year Ended
9/30/06 | |
Operations | | | | | | | | | | | | | | | | | | | | | | | | |
Net investment income | | $ | 250,454 | | | $ | 392,589 | | | $ | 278,660 | | | $ | 437,044 | | | $ | 594,206 | | | $ | 696,575 | |
Net realized gain (loss) from: | | | | | | | | | | | | | | | | | | | | | | | | |
Investments | | | 3,028 | | | | (94,024 | ) | | | 54,926 | | | | (181,374 | ) | | | 115,921 | | | | (238,364 | ) |
Futures | | | (12,191 | ) | | | (23,133 | ) | | | 1,960 | | | | (21,391 | ) | | | 13,360 | | | | (14,060 | ) |
Forwards | | | (20 | ) | | | (18,180 | ) | | | (16 | ) | | | (20,247 | ) | | | — | | | | — | |
Swaps | | | 4,550 | | | | 24,401 | | | | 3,751 | | | | 24,401 | | | | 175,608 | | | | 82,955 | |
Foreign currencies | | | 19,436 | | | | 4,558 | | | | 19,435 | | | | 6,614 | | | | — | | | | — | |
Change in net unrealized appreciation (depreciation) of: | | | | | | | | | | | | | | | | | | | | | | | | |
Investments | | | 26,943 | | | | 40,963 | | | | (5,270 | ) | | | 38,015 | | | | 189,946 | | | | 199,170 | |
Futures | | | 1,436 | | | | 10,180 | | | | (763 | ) | | | 13,438 | | | | 2,403 | | | | 7,480 | |
Forwards | | | (8,868 | ) | | | (3,384 | ) | | | (8,859 | ) | | | (3,384 | ) | | | — | | | | — | |
Swaps | | | (617 | ) | | | 8,332 | | | | (240 | ) | | | 8,332 | | | | (46,764 | ) | | | 51,164 | |
Foreign currencies | | | (2,030 | ) | | | 360 | | | | (1,450 | ) | | | 394 | | | | — | | | | — | |
Net increase (decrease) in net assets from operations | | | 282,121 | | | | 342,662 | | | | 342,134 | | | | 301,842 | | | | 1,044,680 | | | | 784,920 | |
Distributions to Shareholders | | | | | | | | | | | | | | | | | | | | | | | | |
From undistributed net investment income: | | | | | | | | | | | | | | | | | | | | | | | | |
Class A | | | (6,849 | ) | | | (1,766 | ) | | | (28,785 | ) | | | (4,658 | ) | | | (90,556 | ) | | | (4,135 | ) |
Class B | | | N/A | | | | N/A | | | | (1,493 | ) | | | (409 | ) | | | (23,986 | ) | | | (2,215 | ) |
Class C | | | (21,053 | ) | | | (4,925 | ) | | | (13,639 | ) | | | (422 | ) | | | (80,087 | ) | | | (5,859 | ) |
Class R | | | (230,125 | ) | | | (563,918 | ) | | | (243,879 | ) | | | (515,563 | ) | | | (376,117 | ) | | | (778,572 | ) |
Decrease in net assets from distributions to shareholders | | | (258,027 | ) | | | (570,609 | ) | | | (287,796 | ) | | | (521,052 | ) | | | (570,746 | ) | | | (790,781 | ) |
Fund Share Transactions | | | | | | | | | | | | | | | | | | | | | | | | |
Proceeds from sale of shares | | | 1,739,760 | | | | 1,494,615 | | | | 2,126,743 | | | | 1,579,633 | | | | 11,794,239 | | | | 1,383,527 | |
Proceeds from shares issued to shareholders due to reinvestment of distributions | | | 4,595 | | | | 1,521 | | | | 12,842 | | | | — | | | | 45,318 | | | | 1,856 | |
| | | 1,744,355 | | | | 1,496,136 | | | | 2,139,585 | | | | 1,579,633 | | | | 11,839,557 | | | | 1,385,383 | |
Cost of shares redeemed | | | (1,524,711 | ) | | | — | | | | (1,126,044 | ) | | | (70 | ) | | | (1,117,134 | ) | | | (54,179 | ) |
Net increase (decrease) in net assets from Fund share transactions | | | 219,644 | | | | 1,496,136 | | | | 1,013,541 | | | | 1,579,563 | | | | 10,722,423 | | | | 1,331,204 | |
Net increase (decrease) in net assets | | | 243,738 | | | | 1,268,189 | | | | 1,067,879 | | | | 1,360,353 | | | | 11,196,357 | | | | 1,325,343 | |
Net assets at the beginning of period | | | 11,108,338 | | | | 9,840,149 | | | | 11,221,678 | | | | 9,861,325 | | | | 11,024,889 | | | | 9,699,546 | |
Net assets at the end of period | | $ | 11,352,076 | | | $ | 11,108,338 | | | $ | 12,289,557 | | | $ | 11,221,678 | | | $ | 22,221,246 | | | $ | 11,024,889 | |
Undistributed (Over-distribution of) net investment income at the end of period | | $ | (50,824 | ) | | $ | (43,251 | ) | | $ | (38,823 | ) | | $ | (29,687 | ) | | $ | 87,306 | | | $ | 63,846 | |
N/A – Short Duration is not authorized to issue Class B Shares.
See accompanying notes to financial statements.
34
Notes to Financial Statements (Unaudited)
1. General Information and Significant Accounting Policies
The Nuveen Investment Trust III (the “Trust”) is an open-end management investment company registered under the Investment Company Act of 1940, as amended. The Trust comprises the Nuveen Short Duration Bond Fund (“Short Duration”), Nuveen Core Bond Fund (“Core”) and Nuveen High Yield Bond Fund (“High Yield”) (collectively, the “Funds”). The Trust was organized as a Massachusetts business trust in 1998.
Short Duration ordinarily invests at least 80% of its assets in income producing short-term securities with the objective of providing high current income consistent with minimal fluctuations of principal.
Core ordinarily invests at least 80% of its assets in fixed income securities with the objective of providing total return.
High Yield ordinarily invests at least 80% of its assets in domestic and foreign corporate high yield debt securities, including zero coupon, payment in-kind and convertible bonds with the objective of maximizing total return.
The following is a summary of significant accounting policies followed by the Funds in the preparation of their financial statements in accordance with accounting principles generally accepted in the United States.
Investment Valuation
The prices of bonds and other securities in the Funds’ investment portfolios are generally provided by one or more independent pricing services approved by the Funds’ Board of Trustees. The pricing services typically value exchange-listed securities at the last sales price on that day; and value senior loans, bonds and other securities traded in the over-the-counter market at the mean of the bid and asked prices when current quotations are readily available. Futures contracts are valued using the closing settlement price or, in the absence of such a price, at the mean of the bid and asked prices. Prices of interest rate swaps are provided by and independent pricing service approved by each Fund’s Board of Trustees. Credit default swaps are valued using a market quote provided by a major broker/dealer in such investments. Total return swaps are valued by comparing the return of the underlying index at the valuation date with the value at the original effective date of the contract. The pricing services or, in the absence of a pricing service for a particular investment, the Board of Trustees of the Funds, or its designee, may establish fair market value using a wide variety of market data including yields or prices of investments of comparable quality, type of issue, coupon, maturity and rating, market quotes or indications of value from security dealers, evaluations of anticipated cash flows or collateral, general market conditions and other information and analysis, including the obligor’s credit characteristics considered relevant by the pricing service or the Board of Trustees’ designee. Short-term investments are valued at amortized cost, which approximates market value.
Investment Transactions
Investment transactions are recorded on a trade date basis. Trade date for senior loans purchased in the “primary market” is considered the date on which the loan allocations are determined. Trade date for senior loans purchased in the “secondary market” is the date on which the transaction is entered into. Realized gains and losses from investment transactions are determined on the specific identification method. Investments purchased on a when-issued/delayed delivery basis may have extended settlement periods. Any investments so purchased are subject to market fluctuation during this period. The Funds have instructed the custodian to segregate assets with a current value at least equal to the amount of the when-issued/delayed delivery purchase commitments. At March 31, 2007, Short Duration, Core and High Yield had outstanding when-issued/delayed delivery purchase commitments of $846,715, $4,238,848 and $1,120,000, respectively.
Investment Income
Interest income, which includes the amortization of premiums and accretion of discounts for financial reporting purposes, is recorded on an accrual basis. Investment income also includes paydown gains and losses, if any.
Federal Income Taxes
Each Fund is a separate taxpayer for federal income tax purposes. Each Fund intends to distribute substantially all net investment income and net capital gains to shareholders and to otherwise comply with the requirements of Subchapter M of the Internal Revenue Code applicable to regulated investment companies. Therefore, no federal income tax provision is required.
Dividends and Distributions to Shareholders
Distributions to shareholders are recorded on the ex-dividend date. The amount and timing of distributions are determined in accordance with federal income tax regulations, which may differ from accounting principles generally accepted in the United States.
Dividends from net investment income are declared monthly. Net realized capital gains from investment transactions, if any, are declared and distributed to shareholders not less frequently than annually. Furthermore, capital gains are distributed only to the extent they exceed available capital loss carryforwards.
Flexible Sales Charge Program
Each Fund offers Class A, C and R Shares. Core and High Yield also offer Class B Shares. Class A Shares are generally sold with an up-front sales charge and incur a .25% annual 12b-1 service fee. Class A Share purchases of $1 million or more are sold at net asset value without an up-front sales charge but may be subject to a contingent deferred sales charge (“CDSC”) if redeemed within 18 months of purchase. Class B Shares are sold without an up-front sales charge but incur a .75% annual 12b-1 distribution fee and a
35
Notes to Financial Statements (Unaudited) (continued)
.25% annual 12b-1 service fee. An investor purchasing Class B Shares agrees to pay a CDSC of up to 5% depending upon the length of time the shares are held by the investor (CDSC is reduced to 0% at the end of six years). Class B Shares convert to Class A Shares eight years after purchase. Class C Shares are sold without an up-front sales charge but incur a .75% annual 12b-1 distribution fee and a .25% annual 12b-1 service fee. An investor purchasing Class C Shares agrees to pay a CDSC of 1% if Class C Shares are redeemed within one year of purchase. Class R Shares are not subject to any sales charge or 12b-1 distribution or service fees. Class R Shares are available only under limited circumstances.
Expense Allocation
Expenses of the Funds that are not directly attributable to a specific class of shares are prorated among the classes based on the relative net assets of each class. Expenses directly attributable to a class of shares, which presently only include 12b-1 distribution and service fees, are recorded to the specific class.
Repurchase Agreements
In connection with transactions in repurchase agreements, it is the Funds’ policy that its custodian take possession of the underlying collateral securities, the fair value of which exceeds the principal amount of the repurchase transaction, including accrued interest, at all times. If the seller defaults, and the fair value of the collateral declines, realization of the collateral may be delayed or limited.
Futures Contracts
The Funds are authorized to invest in futures contracts. Upon entering into a futures contract, a Fund is required to deposit with the broker an amount of cash or liquid securities equal to a specified percentage of the contract amount. This is known as the “initial margin.” Subsequent payments (“variation margin”) are made or received by a Fund each day, depending on the daily fluctuation of the value of the contract.
During the period the futures contract is open, changes in the value of the contract are recognized as an unrealized gain or loss by “marking-to-market” on a daily basis to reflect the changes in market value of the contract. When the contract is closed or expired, a Fund records a realized gain or loss equal to the difference between the value of the contract on the closing date and the value of the contract when originally entered into. Cash held by the broker to cover initial margin requirements on open futures contracts is noted in the Statement of Assets and Liabilities. Additionally, the Statement of Assets and Liabilities reflects a receivable and/or payable for the variation margin as of March 31, 2007.
Risks of investments in futures contracts include the possible adverse movement of the securities or indices underlying the contracts, the possibility that there may not be a liquid secondary market for the contracts and/or that a change in the value of the contract may not correlate with a change in the value of the underlying securities.
Swaps Contracts
The Funds are authorized to enter into swap contracts consistent with their investment objectives and policies to obtain a desired return at a lower cost than if the Funds had invested directly in the asset that yielded the desired return. In connection with these contracts, securities in the Funds’ portfolios may be identified as collateral in accordance with the terms of the respective swap contract.
Interest rate swap contracts involve the exchange by a Fund with another party of their respective commitments to pay or receive interest, e.g., an exchange of floating rate payments for fixed rate payments with respect to a specified notional amount of principal.
Total return swap contracts involve commitments to pay interest in exchange for a market-linked return, both based on specified notional amounts. To the extent the total return of the security or index underlying the transaction exceeds or falls short of offsetting the interest rate obligation, a Fund will receive a payment from or make a payment to the counterparty.
Credit default swap contracts involve one party making a stream of payments to another party in exchange for the right to receive a specified return in the event of a default by a third party. The Funds may enter into a credit default contract to seek to maintain a total return on a particular investment or portion of its portfolio, or to take an active long or short position with respect to the likelihood of a particular issuer’s default. As a purchaser of a credit default swap contract, the Fund pays a periodic interest fee on the notional amount to the counterparty. This interest fee is accrued daily as a component of unrealized appreciation or depreciation and is recorded as a realized loss upon payment. Upon occurrence of a specific credit event with respect to the underlying referenced debt obligation, the Fund is obligated to deliver that security, or an equivalent amount of cash, to the counterparty in exchange for receipt of the notional amount from the counterparty. The difference between the value of the security delivered and the notional amount received is recorded as a realized gain. As a seller of a credit default contract, the Fund generally receives a periodic interest fee on the notional amount from the counterparty. This interest fee is accrued daily as a component of unrealized appreciation or depreciation and is recorded as a realized gain upon payment. Upon occurrence of a specific credit event with respect to the underlying referenced debt obligation, the Fund receives that security, or an equivalent amount of cash, from the counterparty in exchange for payment of the notional amount to the counterparty. The difference between the value of the security received and the notional amount paid is recorded as a realized loss.
Swap contracts are valued daily. Unrealized gains are reported as an asset and unrealized losses are reported as a liability on the Statement of Assets and Liabilities. Income received or paid by the Fund on a swap contract is reported as a realized gain or loss on the Statement of Operations. Additionally, realized gains or losses are recorded upon the termination of a swap contract and are
36
equal to the difference between the Fund’s basis in the swap and the proceeds from (or cost of) the closing transaction. Notional principal amounts are used to express the extent of involvement in these transactions, reducing the amounts potentially subject to counterparty credit risk are generally much smaller, except with respect to credit default swaps.
Entering into these contracts involves, to varying degrees, elements of credit, market and documentation risk in excess of the amounts recognized on the Statements of Assets and Liabilities. Such risks involve the possibility that there will be no liquid market for these contracts, that there may be unfavorable changes in interest rates, and default by the counterparty on its obligation to perform or disagree as to the meaning of the contractual terms in the contracts. If there is a default by the counterparty to a swap contract, a Fund will be limited to contractual remedies pursuant to the contracts related to the transaction. There is no assurance that the swap contract counterparties will be able to meet their obligations pursuant to the swap contracts or that, in the event of default, a Fund will succeed in pursuing contractual remedies. A Fund thus assumes the risk that it may be delayed in, or prevented from, obtaining payments owed to it pursuant to the swap contracts. The creditworthiness of the swap contract counterparties is closely monitored in order to minimize this risk.
Dollar Rolls
The Funds are authorized to enter into “dollar rolls” in which a Fund purchases or sells mortgage-backed securities for delivery in the future and simultaneously contracts to sell or repurchase substantially similar (same type, coupon, and maturity) securities on a different specified future date. Dollar rolls are identified as MDRs in the Portfolio of Investments for each of the applicable Funds. During the roll period, the Fund foregoes principal and interest paid on the mortgage-backed securities. The Fund is compensated by fee income or the difference between the current sales price and the lower forward price for the future purchase. Such compensation is amortized over the life of the dollar rolls and included in Investment Income on the Statement of Operations. Dollar rolls are valued daily.
Short Sales
The Funds are authorized to make short sales of debt securities. To secure its obligation to deliver securities sold short, the Funds have instructed the custodian to segregate assets in an equivalent amount of the securities sold short. The Funds are obligated to pay to the parties to which the securities were sold short, interest earned on the debt securities and records such amounts as an expense in the Statement of Operations. Short sales are valued daily and the corresponding unrealized gains or losses are included in “Change in net unrealized appreciation (depreciation) of investments.” High Yield did not engage in selling securities short during the six months ended March 31, 2007.
Foreign Currency Transactions
The Funds are authorized to engage in foreign currency exchange transactions. Each Fund may engage in foreign currency forward, options and futures contracts. To the extent that a Fund invests in contracts that are denominated in a currency other than U.S. dollars, the Fund will be subject to currency risk, which is the risk that an increase in the U.S. dollar relative to the foreign currency will reduce returns or portfolio value. Generally, when the U.S. dollar rises in value against a foreign currency, the Fund’s investments denominated in that currency will lose value because its currency is worth fewer U.S. dollars; the opposite effect occurs if the U.S. dollar falls in relative value. Investments and other assets and liabilities denominated in foreign currencies are converted into U.S. dollars on a spot (i.e. cash) basis at the spot rate prevailing in the foreign currency exchange market at the time of valuation. Purchases and sales of investments and dividend income denominated in foreign currencies are translated into U.S. dollars on the respective dates of such transactions.
The books and records of the Funds are maintained in U.S. dollars. Foreign currencies, investments and other assets and liabilities are translated into U.S. dollars at 4:00 p.m. Eastern time. Investments and income and expenses are translated on the respective dates of such transactions. Net realized foreign currency gains and losses resulting from changes in exchange rates include foreign currency gains and losses between trade date and settlement date of the transactions, foreign currency transactions, and the difference between the amounts of interest and dividends recorded on the books of a Fund and the amounts actually received.
Forward Foreign Currency Exchange Contracts
Generally, each Fund may enter into forward foreign currency exchange contracts only under two circumstances: (i) when a Fund enters into a contract for the purchase or sale of a security denominated in a foreign currency to “lock in” the U.S. exchange rate of the transaction, with such period being a short-dated contract covering the period between transaction date and settlement date; or (ii) when the Adviser believes that the currency of a particular foreign country may experience a substantial movement against the U.S. dollar or against another foreign currency. Forward foreign currency contracts are valued daily at the forward rate. The change in market value is recorded as an unrealized gain or loss by a Fund. When the contract is closed or offset with the same counterparty, a Fund records a realized gain or loss equal to the difference between the value of the contract at the time it was opened and the value at the time it was closed or offset.
Forward foreign currency contracts will generally not be entered into for terms greater than three months. The use of forward foreign currency contracts does not eliminate fluctuations in the underlying prices of a Fund’s investment securities; however, it does establish a rate of exchange that can be achieved in the future. The use of forward foreign currency contracts involves the risk that anticipated currency movements will not be accurately predicted. A forward foreign currency contract would limit the risk of loss due to a decline in the value of a particular currency; however, it also would limit any potential gain that might result should the value of
37
Notes to Financial Statements (Unaudited) (continued)
the currency increase instead of decrease. These contracts may involve market risk in excess of the unrealized gain or loss reflected in the Statements of Assets and Liabilities. In addition, the Funds could be exposed to risks if counterparties to the contracts are unable to meet the terms of their contracts. The counterparty risk exposure is, therefore, closely monitored and contracts are only executed with high credit quality financial institutions. High Yield did not enter into forward foreign currency exchange contracts during the six months ended March 31, 2007.
Custodian Fee Credit
Each Fund has an arrangement with the custodian bank whereby certain custodian fees and expenses are reduced by credits earned on each Fund’s cash on deposit with the bank. Such deposit arrangements are an alternative to overnight investments.
Indemnifications
Under the Trust’s organizational documents, its Officers and Trustees are indemnified against certain liabilities arising out of the performance of their duties to the Trust. In addition, in the normal course of business, the Trust enters into contracts that provide general indemnifications to other parties. The Trust’s maximum exposure under these arrangements is unknown as this would involve future claims that may be made against the Trust that have not yet occurred. However, the Trust has not had prior claims or losses pursuant to these contracts and expects the risk of loss to be remote.
Use of Estimates
The preparation of financial statements in conformity with accounting principles generally accepted in the United States requires management to make estimates and assumptions that affect the reported amounts of assets and liabilities at the date of the financial statements and the reported amounts of increases and decreases in net assets from operations during the reporting period. Actual results may differ from those estimates.
2. Fund Shares
Transactions in Fund shares were as follows:
| | | | | | | | | | | | |
| | | Short Duration |
| | | Six Months Ended
3/31/07 | | | Year Ended 9/30/06 |
| | | Shares | | | Amount | | | Shares | | Amount |
Shares sold: | | | | | | | | | | | | |
Class A | | 63,512 | | | $ | 1,218,775 | | | 22,711 | | $ | 435,417 |
Class C | | 26,460 | | | | 510,986 | | | 55,201 | | | 1,059,198 |
Class R | | 519 | | | | 9,999 | | | — | | | — |
Shares issued to shareholders due to reinvestment
of distributions: | | | | | | | | | | | | |
Class A | | 81 | | | | 1,571 | | | — | | | — |
Class C | | 148 | | | | 2,863 | | | 79 | | | 1,521 |
Class R | | 8 | | | | 161 | | | — | | | — |
| | | 90,728 | | | | 1,744,355 | | | 77,991 | | | 1,496,136 |
Shares redeemed: | | | | | | | | | | | | |
Class A | | (74,459 | ) | | | (1,429,711 | ) | | — | | | — |
Class C | | (4,948 | ) | | | (95,000 | ) | | — | | | — |
Class R | | — | | | | — | | | — | | | — |
| | | (79,407 | ) | | | (1,524,711 | ) | | — | | | — |
Net increase (decrease) | | 11,321 | | | $ | 219,644 | | | 77,991 | | $ | 1,496,136 |
38
| | | | | | | | | | | | | | |
| | | Core | |
| | | Six Months Ended
3/31/07 | | | Year Ended 9/30/06 | |
| | | Shares | | | Amount | | | Shares | | | Amount | |
Shares sold: | | | | | | | | | | | | | | |
Class A | | 67,622 | | | $ | 1,306,061 | | | 66,361 | | | $ | 1,269,561 | |
Class B | | 7,223 | | | | 140,127 | | | 2,503 | | | | 47,876 | |
Class C | | 34,134 | | | | 662,150 | | | 13,648 | | | | 262,196 | |
Class R | | 952 | | | | 18,405 | | | — | | | | — | |
Shares issued to shareholders due to reinvestment
of distributions: | | | | | | | | | | | | | | |
Class A | | 398 | | | | 7,705 | | | — | | | | — | |
Class B | | 13 | | | | 251 | | | — | | | | — | |
Class C | | 240 | | | | 4,652 | | | — | | | | — | |
Class R | | 12 | | | | 234 | | | — | | | | — | |
| | | 110,594 | | | | 2,139,585 | | | 82,512 | | | | 1,579,633 | |
Shares redeemed: | | | | | | | | | | | | | | |
Class A | | (54,225 | ) | | | (1,039,051 | ) | | — | | | | — | |
Class B | | (3,359 | ) | | | (64,692 | ) | | — | | | | — | |
Class C | | (1,153 | ) | | | (22,301 | ) | | (4 | ) | | | (70 | ) |
Class R | | — | | | | — | | | — | | | | — | |
| | | (58,737 | ) | | | (1,126,044 | ) | | (4 | ) | | | (70 | ) |
Net increase (decrease) | | 51,857 | | | $ | 1,013,541 | | | 82,508 | | | $ | 1,579,563 | |
| |
| | | High Yield | |
| | | Six Months Ended
3/31/07 | | | Year Ended 9/30/06 | |
| | | Shares | | | Amount | | | Shares | | | Amount | |
Shares sold: | | | | | | | | | | | | | | |
Class A | | 266,809 | | | $ | 5,274,788 | | | 25,282 | | | $ | 484,937 | |
Class B | | 68,624 | | | | 1,355,638 | | | 11,021 | | | | 210,180 | |
Class C | | 248,016 | | | | 4,903,892 | | | 34,882 | | | | 664,410 | |
Class R | | 13,124 | | | | 259,921 | | | 1,257 | | | | 24,000 | |
Shares issued to shareholders due to reinvestment
of distributions: | | | | | | | | | | | | | | |
Class A | | 1,202 | | | | 23,912 | | | 8 | | | | 159 | |
Class B | | 339 | | | | 6,700 | | | 54 | | | | 1,032 | |
Class C | | 677 | | | | 13,406 | | | 35 | | | | 665 | |
Class R | | 66 | | | | 1,300 | | | — | | | | — | |
| | | 598,857 | | | | 11,839,557 | | | 72,539 | | | | 1,385,383 | |
Shares redeemed: | | | | | | | | | | | | | | |
Class A | | (27,904 | ) | | | (552,187 | ) | | (2,814 | ) | | | (54,179 | ) |
Class B | | (9,076 | ) | | | (178,865 | ) | | — | | | | — | |
Class C | | (18,886 | ) | | | (375,909 | ) | | — | | | | — | |
Class R | | (509 | ) | | | (10,173 | ) | | — | | | | — | |
| | | (56,375 | ) | | | (1,117,134 | ) | | (2,814 | ) | | | (54,179 | ) |
Net increase (decrease) | | 542,482 | | | $ | 10,722,423 | | | 69,725 | | | $ | 1,331,204 | |
3. Investment Transactions
Purchases and sales (including maturities and transactions in securities sold short, but excluding derivative and dollar roll transactions and short-term investments) for the six months ended March 31, 2007, were as follows:
| | | | | | |
| | | Short Duration | | Core | | High Yield |
Purchases: | | | | | | |
Investment securities | | 4,004,396 | | 15,418,000 | | 22,946,669 |
U.S. Government and agency obligations | | 6,457,142 | | 4,986,033 | | 778,795 |
Sales and maturities: | | | | | | |
Investment securities | | 3,974,714 | | 13,036,309 | | 11,418,221 |
U.S. Government and agency obligations | | 6,240,638 | | 6,614,601 | | 1,079,406 |
39
Notes to Financial Statements (Unaudited) (continued)
4. Income Tax Information
The following information is presented on an income tax basis. Differences between amounts for financial statement and federal income tax purposes are primarily due to amortization of premium and timing differences in recognizing certain gains and losses on investment transactions. To the extent that differences arise that are permanent in nature, such amounts are reclassified within the capital accounts on the Statement of Assets and Liabilities presented in the annual report, based on their Federal tax basis treatment; temporary differences do not require reclassification. Temporary and permanent differences do not impact the net asset values of the Funds.
At March 31, 2007, the cost of investments (excluding proceeds received on securities sold short) was as follows:
| | | | | | | | | |
| | | Short
Duration | | Core | | High
Yield |
Cost of investments | | $ | 12,858,663 | | $ | 16,372,637 | | $ | 23,379,597 |
Gross unrealized appreciation and gross unrealized depreciation of investments (excluding securities sold short) at March 31, 2007, were as follows:
| | | | | | | | | | | | |
| | | Short Duration | | | Core | | | High
Yield | |
Gross unrealized: | | | | | | | | | | | | |
Appreciation | | $ | 24,054 | | | $ | 56,920 | | | $ | 260,752 | |
Depreciation | | | (100,153 | ) | | | (144,365 | ) | | | (154,683 | ) |
Net unrealized appreciation (depreciation) of investments | | $ | (76,099 | ) | | $ | (87,445 | ) | | $ | 106,069 | |
The tax components of undistributed net ordinary income and net long-term capital gains at September 30, 2006, the Funds’ last tax year end, were as follows:
| | | | | | | | | |
| | | Short
Duration | | Core | | High
Yield |
Undistributed net ordinary income* | | $ | 60,164 | | $ | 53,378 | | $ | 206,345 |
Undistributed net long-term capital gains | | | — | | | — | | | — |
| * | Net ordinary income consists of net taxable income derived from dividends, interest, and net short-term capital gains, if any. |
The tax character of distributions paid during the Funds’ last tax year ended September 30, 2006, was designated for purposes of the dividends paid deduction as follows:
| | | | | | | | | |
| | | Short
Duration | | Core | | High
Yield |
Distributions from net ordinary income* | | $ | 563,271 | | $ | 516,548 | | $ | 787,009 |
Distributions from net long-term capital gains | | | — | | | — | | | — |
| * | Net ordinary income consists of net taxable income derived from dividends, interest, and net short-term capital gains, if any. |
At September 30, 2006, the Funds’ last tax year end, the Funds had unused capital loss carryforwards available for federal income tax purposes to be applied against future capital gains, if any. If not applied, the carryforwards will expire in the year 2014 as follows:
| | | | | | | | | |
| | | Short
Duration | | Core | | High
Yield |
| | | $ | 194,406 | | $ | 121,502 | | $ | 64,821 |
The Funds elected to defer net realized losses from investments incurred from November 1, 2005 through September 30, 2006 (“post-October losses”) in accordance with federal income tax regulations. Post-October losses are treated as having arisen on the first day of the current tax year:
| | | | | | | | | |
| | | Short
Duration | | Core | | High
Yield |
| | | $ | 132,690 | | $ | 170,253 | | $ | 297,704 |
40
5. Management Fee and Other Transactions with Affiliates
Each Fund’s management fee is separated into two components – a complex-level component, based on the aggregate amount of all fund assets managed by Nuveen Asset Management (the “Adviser”), a wholly owned subsidiary of Nuveen Investments, Inc. (“Nuveen”), and a specific fund-level component, based only on the amount of assets within each individual fund. This pricing structure enables Nuveen fund shareholders to benefit from growth in the assets within each individual fund as well as from growth in the amount of complex-wide assets managed by the Adviser.
For the period December 20, 2004 (commencement of operations) through April 30, 2006 the annual fund-level fee, payable monthly, for each Fund was based upon the average daily net assets of each Fund as follows:
| | | | | | | | | |
| Average Daily Net Assets | | Short Duration Fund-Level Fee Rate | | | Core Fund-Level Fee Rate | | | High Yield Fund-Level Fee Rate | |
For the first $125 million | | .3500 | % | | .4500 | % | | .5500 | % |
For the next $125 million | | .3375 | | | .4375 | | | .5375 | |
For the next $250 million | | .3250 | | | .4250 | | | .5250 | |
For the next $500 million | | .3125 | | | .4125 | | | .5125 | |
For the next $1 billion | | .3000 | | | .4000 | | | .5000 | |
For net assets over $2 billion | | .2750 | | | .3750 | | | .4750 | |
Effective May 1, 2006, the annual fund-level fee, payable monthly, for each Fund is based upon the average daily net assets of each Fund as follows:
| | | | | | | | | |
| Average Daily Net Assets | | Short Duration Fund-Level Fee Rate | | | Core Fund-Level Fee Rate | | | High Yield Fund-Level Fee Rate | |
For the first $125 million | | .2000 | % | | .3000 | % | | .4000 | % |
For the next $125 million | | .1875 | | | .2875 | | | .3875 | |
For the next $250 million | | .1750 | | | .2750 | | | .3750 | |
For the next $500 million | | .1625 | | | .2625 | | | .3625 | |
For the next $1 billion | | .1500 | | | .2500 | | | .3500 | |
For net assets over $2 billion | | .1250 | | | .2250 | | | .3250 | |
The annual complex-level fee, payable monthly, which is additive to the fund-level fee, for all Nuveen sponsored funds in the U.S., is based on the aggregate amount of total fund assets managed as stated in the table below. As of March 31, 2007, the complex-level fee rate was .1834%.
| | | |
| Complex-Level Assets(1) | | Complex-Level Fee Rate | |
For the first $55 billion | | .2000 | % |
For the next $1 billion | | .1800 | |
For the next $1 billion | | .1600 | |
For the next $3 billion | | .1425 | |
For the next $3 billion | | .1325 | |
For the next $3 billion | | .1250 | |
For the next $5 billion | | .1200 | |
For the next $5 billion | | .1175 | |
For the next $15 billion | | .1150 | |
For Managed Assets over $91 billion(2) | | .1400 | |
| (1) | The complex-level fee component of the management fee for the funds is calculated based upon the aggregate Managed Assets (“Managed Assets” means the average daily net assets of each fund including assets attributable to preferred stock issued by or borrowings by the Nuveen funds) of Nuveen-sponsored funds in the U.S. |
| (2) | With respect to the complex-wide Managed Assets over $91 billion, the fee rate or rates that will apply to such assets will be determined at a later date. In the unlikely event that complex-wide Managed Assets reach $91 billion prior to a determination of the complex-level fee rate or rates to be applied to Managed Assets in excess of $91 billion, the complex-level fee rate for such complex-wide Managed Assets shall be .1400% until such time as a different rate or rates is determined. |
The management fee compensates the Adviser for overall investment advisory and administrative services and general office facilities. The Trust pays no compensation directly to those of its Trustees who are affiliated with the Adviser or to its Officers, all of whom receive remuneration for their services to the Trust from the Adviser or its affiliates. The Board of Trustees has adopted a deferred compensation plan for independent Trustees that enables Trustees to elect to defer receipt of all or a portion of the annual compensation they are entitled to receive from certain Nuveen advised Funds. Under the plan, deferred amounts are treated as though equal dollar amounts had been invested in shares of select Nuveen advised Funds.
41
Notes to Financial Statements (Unaudited) (continued)
Prior to May 1, 2006, the Adviser agreed to waive part of its management fees or reimburse certain expenses of each Fund through July 31, 2006, in order to limit total operating expenses (excluding 12b-1 distribution and service fees and extraordinary expenses) from exceeding .65%, .75% and .90% of the average daily net assets of Short Duration, Core and High Yield, respectively. Effective May 1, 2006, the Adviser agreed to reimburse all expenses other than management fees, 12b-1 distribution and service fees, interest expenses and extraordinary expenses for the Funds through January 31, 2008. The Adviser may also voluntarily reimburse additional expenses from time to time. Voluntary reimbursements may be terminated at any time at the Adviser’s discretion.
During the six months ended March 31, 2007, Nuveen Investments, LLC (the “Distributor”), a wholly owned subsidiary of Nuveen, collected sales charges on purchases of Class A Shares, the majority of which were paid out as concessions to authorized dealers as follows:
| | | | | | |
| | | Short
Duration | | Core | | High Yield |
Sales charges collected | | $76,881 | | $2,456 | | $74,326 |
Paid to authorized dealers | | 69,224 | | 2,158 | | 66,991 |
The Distributor also received 12b-1 service fees on Class A Shares, substantially all of which were paid to compensate authorized dealers for providing services to shareholders relating to their investments.
During the six months ended March 31, 2007, the Distributor compensated authorized dealers directly with commission advances at the time of purchase as follows:
| | | | | | | | | |
| | | Short
Duration | | Core | | High Yield |
Commission advances | | $ | — | | $ | 4,347 | | $ | 78,805 |
To compensate for commissions advanced to authorized dealers, all 12b-1 service fees collected on Class B Shares during the first year following a purchase, all 12b-1 distribution fees collected on Class B Shares, and all 12b-1 service and distribution fees collected on Class C Shares during the first year following a purchase are retained by the Distributor. During the six months ended March 31, 2007, the Distributor retained such 12b-1 fees as follows:
| | | | | | | | | |
| | | Short
Duration | | Core | | High Yield |
12b-1 fees retained | | $ | 5,226 | | $ | 1,989 | | $ | 6,648 |
The remaining 12b-1 fees charged to the Funds were paid to compensate authorized dealers for providing services to shareholders relating to their investments.
The Distributor also collected and retained CDSC on share redemptions during the six months ended March 31, 2007, as follows:
| | | | | | | | | |
| | | Short
Duration | | Core | | High Yield |
CDSC retained | | $ | 2,500 | | $ | — | | $ | 860 |
At March 31, 2007, Nuveen owned 499,500 shares of Class R of Short Duration, Core and High Yield. At March 31, 2007, the Adviser owned 125, 125 and 250 shares of Short Duration Class A, C and R, respectively, and 125 shares of each of Core’s and High Yield’s Class A, B, C and R.
6. New Accounting Pronouncements
Financial Accounting Standards Board Interpretation No. 48
On July 13, 2006, the Financial Accounting Standards Board (FASB) released FASB Interpretation No. 48, “Accounting for Uncertainty in Income Taxes,” (FIN 48). FIN 48 provides guidance for how uncertain tax positions should be recognized, measured, presented and disclosed in the financial statements. FIN 48 requires the evaluation of tax positions taken or expected to be taken in the course of preparing the Fund’s tax returns to determine whether the tax positions are “more-likely-than-not” of being sustained by the applicable tax authority. Tax positions not deemed to meet the more-likely-than-not threshold would be recorded as a tax benefit or expense in the current year. Adoption of FIN 48 is required for fiscal years beginning after December 15, 2006, and is to be applied to all open tax years as of the effective date. Recent SEC guidance allows funds to delay implementing FIN 48 into NAV calculations until the fund’s last NAV calculations in the first required financial statement reporting period. As a result, the Funds must begin to incorporate FIN 48 into their NAV calculations by September 28, 2007. At this time, management is continue to evaluate the implications of FIN 48 and does not expect the adoption of FIN 48 will have a significant impact on the net assets or results of operations of the Funds.
42
Financial Accounting Standards Board Statement of Financial Accounting Standards No. 157
In September 2006, the Financial Accounting Standards Board (FASB) issued Statement of Financial Accounting Standards (SFAS) No. 157, “Fair Value Measurements.” This standard establishes a single authoritative definition of fair value, sets out a framework for measuring fair value and requires additional disclosures about fair value measurements. SFAS No. 157 applies to fair value measurements already required or permitted by existing standards. SFAS No. 157 is effective for financial statements issued for fiscal years beginning after November 15, 2007, and interim periods within those fiscal years. The changes to current generally accepted accounting principles from the application of this standard relate to the definition of fair value, the methods used to measure fair value, and the expanded disclosures about fair value measurements. As of March 31, 2007, the Funds do not believe the adoption of SFAS No. 157 will impact the financial statement amounts; however, additional disclosures may be required about the inputs used to develop the measurements and the effect of certain of the measurements included within the Statement of Operations for the period.
7. Subsequent Events
Distributions to Shareholders
The Funds declared dividend distributions from their net investment income which were paid on May 1, 2007, to shareholders of record on April 9, 2007, as follows:
| | | | | | | | | |
| | | Short Duration | | Core | | High Yield |
Dividend per share: | | | | | | | | | |
Class A | | $ | .0730 | | $ | .0775 | | $ | .1200 |
Class B | | | N/A | | | .0655 | | | .1075 |
Class C | | | .0610 | | | .0655 | | | .1075 |
Class R | | | .0770 | | | .0815 | | | .1240 |
N/A – Short Duration is not authorized to issue Class B shares.
43
Financial Highlights (Unaudited)
| | | | | | | | | | | | | | | | | | | | | | | | | | | | | | | | | | | | | | | | | | | | | | | | | | | | | | | |
| Class (Commencement Date) | | | | | | | | | | | | | | | | | | | | | | | | | | | | | | | | | | | | | | | | | | |
| | | | | Investment Operations | | | Less Distributions | | | | | | | | Ratios/Supplemental Data | |
| SHORT DURATION | | | | | | | | | | | | | | | | | | | | | | | | | | | Ratios to Average
Net Assets
Before Credit/
Reimbursement | | | Ratios to Average
Net Assets After
Reimbursement(c) | | | Ratios to Average
Net Assets
After Credit/
Reimbursement(d) | | | | |
Year Ended
September 30, | | Beginning
Net
Asset
Value | | Net
Invest-
ment
Income(a) | | Net
Realized/
Unrealized
Gain
(Loss) | | | Total | | | Net
Invest-
ment
Income | | | Capital
Gains | | Total | | | Ending
Net
Asset
Value | | Total
Return(b) | | | Ending
Net
Assets
(000) | | Expenses | | | Net
Invest-
ment
Income | | | Expenses | | | Net
Invest-
ment
Income | | | Expenses | | | Net
Invest-
ment
Income | | | Portfolio
Turnover
Rate | |
| Class A (12/04) | | | | | | | | | | | | | | | | | | | | | | | | | | | | | | | | | | | | | | | | | | | | | | | | | | | | |
2007(f) | | $ | 19.24 | | $ | .43 | | $ | .06 | | | $ | .49 | | | $ | (.44 | ) | | $ | — | | $ | (.44 | ) | | $ | 19.29 | | 2.55 | % | | $ | 231 | | 1.45 | %* | | 3.49 | %* | | .62 | %* | | 4.32 | %* | | .56 | %* | | 4.38 | %* | | 92 | % |
2006 | | | 19.69 | | | .77 | | | (.14 | ) | | | .63 | | | | (1.08 | ) | | | — | | | (1.08 | ) | | | 19.24 | | 3.29 | | | | 439 | | 3.41 | | | 1.25 | | | .64 | | | 4.02 | | | .61 | | | 4.05 | | | 234 | |
2005(e) | | | 20.00 | | | .43 | | | (.53 | ) | | | (.10 | ) | | | (.21 | ) | | | — | | | (.21 | ) | | | 19.69 | | .66 | | | | 2 | | 1.52 | * | | 2.15 | * | | .91 | * | | 2.75 | * | | .89 | * | | 2.77 | * | | 140 | |
| Class C (12/04) | | | | | | | | | | | | | | | | | | | | | | | | | | | | | | | | | | | | | | | | | | | | | | | | | | | | |
2007(f) | | | 19.26 | | | .35 | | | .05 | | | | .40 | | | | (.36 | ) | | | — | | | (.36 | ) | | | 19.30 | | 2.11 | | | | 1,488 | | 2.25 | * | | 2.71 | * | | 1.38 | * | | 3.58 | * | | 1.32 | * | | 3.65 | * | | 92 | |
2006 | | | 19.69 | | | .63 | | | (.14 | ) | | | .49 | | | | (.92 | ) | | | — | | | (.92 | ) | | | 19.26 | | 2.54 | | | | 1,067 | | 3.52 | | | 1.09 | | | 1.36 | | | 3.25 | | | 1.33 | | | 3.28 | | | 234 | |
2005(e) | | | 20.00 | | | .31 | | | (.48 | ) | | | (.17 | ) | | | (.14 | ) | | | — | | | (.14 | ) | | | 19.69 | | .09 | | | | 2 | | 2.27 | * | | 1.40 | * | | 1.66 | * | | 2.00 | * | | 1.64 | * | | 2.02 | * | | 140 | |
| Class R (12/04) | | | | | | | | | | | | | | | | | | | | | | | | | | | | | | | | | | | | | | | | | | | | | | | | | | | | |
2007(f) | | | 19.21 | | | .45 | | | .06 | | | | .51 | | | | (.46 | ) | | | — | | | (.46 | ) | | | 19.26 | | 2.68 | | | | 9,634 | | 1.25 | * | | 3.74 | * | | .38 | * | | 4.61 | * | | .32 | * | | 4.67 | * | | 92 | |
2006 | | | 19.68 | | | .77 | | | (.11 | ) | | | .66 | | | | (1.13 | ) | | | — | | | (1.13 | ) | | | 19.21 | | 3.46 | | | | 9,602 | | 1.44 | | | 3.07 | | | .53 | | | 3.97 | | | .51 | | | 4.00 | | | 234 | |
2005(e) | | | 20.00 | | | .47 | | | (.56 | ) | | | (.09 | ) | | | (.23 | ) | | | — | | | (.23 | ) | | | 19.68 | | .79 | | | | 9,835 | | 1.27 | * | | 2.40 | * | | .66 | * | | 3.00 | * | | .64 | * | | 3.02 | * | | 140 | |
| (a) | Per share Net Investment Income is calculated using the average daily shares method. |
| (b) | Total returns are calculated on net asset value without any sales charge and are not annualized. |
| (c) | After expense reimbursement from the Adviser. |
| (d) | After custodian fee credit and expense reimbursement. |
| (e) | For the period December 20, 2004 (commencement of operations) through September 30, 2005. |
| (f) | For the six months ended March 31, 2007. |
See accompanying notes to financial statements.
44
| | | | | | | | | | | | | | | | | | | | | | | | | | | | | | | | | | | | | | | | | | | | | | | | | | | | | | | |
| Class (Commencement Date) | | | | | | | | | | | | | | | | | | | | | | | | | | | | | | | | | | | | | | | | | | |
| | | | | Investment Operations | | | Less Distributions | | | | | | Ratios/Supplemental Data | |
| CORE | | | | | | | | | | | | | | | | | | | | | | | | | | | Ratios to Average
Net Assets
Before Credit/
Reimbursement | | | Ratios to Average
Net Assets After
Reimbursement(c) | | | Ratios to Average
Net Assets
After Credit/
Reimbursement(d) | | | | |
Year Ended
September 30, | | Beginning
Net
Asset
Value | | Net
Invest-
ment
Income(a) | | Net
Realized/
Unrealized
Gain
(Loss) | | | Total | | | Net
Invest-
ment
Income | | | Capital
Gains | | Total | | | Ending
Net
Asset
Value | | Total
Return(b) | | | Ending
Net
Assets
(000) | | Expenses | | | Net
Invest-
ment
Income | | | Expenses | | | Net
Invest-
ment
Income | | | Expenses | | | Net
Invest-
ment
Income | | | Portfolio
Turnover
Rate(e) | |
| Class A (12/04) | | | | | | | | | | | | | | | | | | | | | | | | | | | | | | | | | | | | | | | | | | | | | | | | | | | | |
2007(g) | | $ | 19.29 | | $ | .46 | | $ | .09 | | | $ | .55 | | | $ | (.46 | ) | | $ | — | | $ | (.46 | ) | | $ | 19.38 | | 2.89 | % | | $ | 1,556 | | 2.11 | %* | | 3.33 | %* | | .73 | %* | | 4.70 | %* | | .72 | %* | | 4.72 | %* | | 169 | % |
2006 | | | 19.73 | | | .88 | | | (.34 | ) | | | .54 | | | | (.98 | ) | | | — | | | (.98 | ) | | $ | 19.29 | | 2.86 | | | | 1,282 | | 4.46 | | | .90 | | | .75 | | | 4.62 | | | .71 | | | 4.66 | | | 241 | |
2005(f) | | | 20.00 | | | .54 | | | (.55 | ) | | | (.01 | ) | | | (.26 | ) | | | — | | | (.26 | ) | | | 19.73 | | 1.37 | | | | 2 | | 1.76 | * | | 2.69 | * | | 1.02 | * | | 3.43 | * | | 1.00 | * | | 3.46 | * | | 155 | |
| Class B (12/04) | | | | | | | | | | | | | | | | | | | | | | | | | | | | | | | | | | | | | | | | | | | | | | | | | | | | |
2007(g) | | | 19.30 | | | .40 | | | .11 | | | | .51 | | | | (.39 | ) | | | — | | | (.39 | ) | | | 19.42 | | 2.67 | | | | 126 | | 2.64 | * | | 2.71 | * | | 1.22 | * | | 4.14 | * | | 1.20 | * | | 4.15 | * | | 169 | |
2006 | | | 19.73 | | | .74 | | | (.35 | ) | | | .39 | | | | (.82 | ) | | | — | | | (.82 | ) | | | 19.30 | | 2.06 | | | | 51 | | 3.54 | | | 1.68 | | | 1.38 | | | 3.84 | | | 1.34 | | | 3.88 | | | 241 | |
2005(f) | | | 20.00 | | | .42 | | | (.49 | ) | | | (.07 | ) | | | (.20 | ) | | | — | | | (.20 | ) | | | 19.73 | | .81 | | | | 2 | | 2.51 | * | | 1.94 | * | | 1.77 | * | | 2.69 | * | | 1.75 | * | | 2.71 | * | | 155 | |
| Class C (12/04) | | | | | | | | | | | | | | | | | | | | | | | | | | | | | | | | | | | | | | | | | | | | | | | | | | | | |
2007(g) | | | 19.29 | | | .38 | | | .12 | | | | .50 | | | | (.39 | ) | | | — | | | (.39 | ) | | | 19.40 | | 2.62 | | | | 912 | | 2.88 | * | | 2.50 | * | | 1.48 | * | | 3.90 | * | | 1.47 | * | | 3.92 | * | | 169 | |
2006 | | | 19.73 | | | .73 | | | (.35 | ) | | | .38 | | | | (.82 | ) | | | — | | | (.82 | ) | | | 19.29 | | 2.01 | | | | 266 | | 3.65 | | | 1.69 | | | 1.44 | | | 3.90 | | | 1.39 | | | 3.94 | | | 241 | |
2005(f) | | | 20.00 | | | .42 | | | (.49 | ) | | | (.07 | ) | | | (.20 | ) | | | — | | | (.20 | ) | | | 19.73 | | .81 | | | | 2 | | 2.51 | * | | 1.94 | * | | 1.77 | * | | 2.69 | * | | 1.75 | * | | 2.71 | * | | 155 | |
| Class R (12/04) | | | | | | | | | | | | | | | | | | | | | | | | | | | | | | | | | | | | | | | | | | | | | | | | | | | | |
2007(g) | | | 19.26 | | | .47 | | | .13 | | | | .60 | | | | (.49 | ) | | | — | | | (.49 | ) | | | 19.37 | | 3.13 | | | | 9,696 | | 1.74 | * | | 3.65 | * | | .48 | * | | 4.91 | * | | .47 | * | | 4.93 | * | | 169 | |
2006 | | | 19.72 | | | .86 | | | (.29 | ) | | | .57 | | | | (1.03 | ) | | | — | | | (1.03 | ) | | | 19.26 | | 3.03 | | | | 9,623 | | 1.84 | | | 3.24 | | | .63 | | | 4.44 | | | .59 | | | 4.48 | | | 241 | |
2005(f) | | | 20.00 | | | .58 | | | (.58 | ) | | | (.00 | ) | | | (.28 | ) | | | — | | | (.28 | ) | | | 19.72 | | 1.51 | | | | 9,854 | | 1.51 | * | | 2.94 | * | | .77 | * | | 3.68 | * | | .75 | * | | 3.71 | * | | 155 | |
| (a) | Per share Net Investment Income is calculated using the average daily shares method. |
| (b) | Total returns are calculated on net asset value without any sales charge and are not annualized. |
| (c) | After expense reimbursement from the Adviser. |
| (d) | After custodian fee credit and expense reimbursement. |
| (e) | Excluding Dollar Roll transactions. |
| (f) | For the period December 20, 2004 (commencement of operations) through September 30, 2005. |
| (g) | For the six months ended March 31, 2007. |
See accompanying notes to financial statements.
45
Financial Highlights (Unaudited) (continued)
| | | | | | | | | | | | | | | | | | | | | | | | | | | | | | | | | | | | | | | | | | | | | | | | | | | | | | | |
| Class (Commencement Date) | | | | | | | | | | | | | | | | | | | | | | | | | | | | | | | | | | | | | | | | | | |
| | | | | Investment Operations | | | Less Distributions | | | | | | Ratios/Supplemental Data | |
| HIGH YIELD | | | | | | | | | | | | | | | | | | | | | | | | | | | Ratios to Average
Net Assets
Before Credit/
Reimbursement | | | Ratios to Average
Net Assets After
Reimbursement(c) | | | Ratios to Average
Net Assets
After Credit/
Reimbursement(d) | | | | |
Year Ended
September 30, | | Beginning
Net
Asset
Value | | Net
Invest-
ment
Income(a) | | Net
Realized/
Unrealized
Gain
(Loss) | | | Total | | | Net
Invest-
ment
Income | | | Capital
Gains | | Total | | | Ending
Net
Asset
Value | | Total
Return(b) | | | Ending
Net
Assets
(000) | | Expenses | | | Net
Invest-
ment
Income | | | Expenses | | | Net
Invest-
ment
Income | | | Expenses | | | Net
Invest-
ment
Income | | | Portfolio
Turnover
Rate | |
| Class A (12/04) | | | | | | | | | | | | | | | | | | | | | | | | | | | | | | | | | | | | | | | | | | | | | | | | | | | | |
2007(f) | | $ | 19.37 | | $ | .75 | | $ | .60 | | | $ | 1.35 | | | $ | (.72 | ) | | $ | — | | $ | (.72 | ) | | $ | 20.00 | | 7.06 | % | | $ | 5,254 | | 1.83 | %* | | 6.58 | %* | | .83 | %* | | 7.58 | %* | | .81 | %* | | 7.60 | %* | | 88 | % |
2006 | | | 19.39 | | | 1.33 | | | .16 | | | | 1.49 | | | | (1.51 | ) | | | — | | | (1.51 | ) | | | 19.37 | | 8.01 | | | | 438 | | 1.94 | | | 5.87 | | | .85 | | | 6.96 | | | .78 | | | 7.03 | | | 115 | |
2005(e) | | | 20.00 | | | .86 | | | (1.04 | ) | | | (.18 | ) | | | (.43 | ) | | | — | | | (.43 | ) | | | 19.39 | | 1.56 | | | | 2 | | 1.68 | * | | 5.10 | * | | 1.17 | * | | 5.61 | * | | 1.14 | * | | 5.63 | * | | 69 | |
| Class B (12/04) | | | | | | | | | | | | | | | | | | | | | | | | | | | | | | | | | | | | | | | | | | | | | | | | | | | | |
2007(f) | | | 19.36 | | | .67 | | | .60 | | | | 1.27 | | | | (.65 | ) | | | — | | | (.65 | ) | | | 19.98 | | 6.62 | | | | 1,421 | | 2.50 | * | | 5.83 | * | | 1.57 | * | | 6.76 | * | | 1.55 | * | | 6.79 | * | | 88 | |
2006 | | | 19.39 | | | 1.13 | | | .19 | | | | 1.32 | | | | (1.35 | ) | | | — | | | (1.35 | ) | | | 19.36 | | 7.07 | | | | 217 | | 2.69 | | | 4.86 | | | 1.57 | | | 5.97 | | | 1.51 | | | 6.04 | | | 115 | |
2005(e) | | | 20.00 | | | .75 | | | (.99 | ) | | | (.24 | ) | | | (.37 | ) | | | — | | | (.37 | ) | | | 19.39 | | .99 | | | | 2 | | 2.43 | * | | 4.35 | * | | 1.92 | * | | 4.86 | * | | 1.89 | * | | 4.88 | * | | 69 | |
| Class C (12/04) | | | | | | | | | | | | | | | | | | | | | | | | | | | | | | | | | | | | | | | | | | | | | | | | | | | | |
2007(f) | | | 19.35 | | | .68 | | | .58 | | | | 1.26 | | | | (.65 | ) | | | — | | | (.65 | ) | | | 19.96 | | 6.57 | | | | 5,287 | | 2.57 | * | | 5.86 | * | | 1.58 | * | | 6.85 | * | | 1.56 | * | | 6.87 | * | | 88 | |
2006 | | | 19.39 | | | 1.13 | | | .18 | | | | 1.31 | | | | (1.35 | ) | | | — | | | (1.35 | ) | | | 19.35 | | 7.01 | | | | 678 | | 2.69 | | | 4.89 | | | 1.59 | | | 5.99 | | | 1.52 | | | 6.05 | | | 115 | |
2005(e) | | | 20.00 | | | .75 | | | (.99 | ) | | | (.24 | ) | | | (.37 | ) | | | — | | | (.37 | ) | | | 19.39 | | .99 | | | | 2 | | 2.43 | * | | 4.35 | * | | 1.92 | * | | 4.86 | * | | 1.89 | * | | 4.88 | * | | 69 | |
| Class R (12/04) | | | | | | | | | | | | | | | | | | | | | | | | | | | | | | | | | | | | | | | | | | | | | | | | | | | | |
2007(f) | | | 19.35 | | | .75 | | | .62 | | | | 1.37 | | | | (.74 | ) | | | — | | | (.74 | ) | | | 19.98 | | 7.20 | | | | 10,260 | | 1.36 | * | | 6.83 | * | | .58 | * | | 7.61 | * | | .56 | * | | 7.63 | * | | 88 | |
2006 | | | 19.40 | | | 1.37 | | | .14 | | | | 1.51 | | | | (1.56 | ) | | | — | | | (1.56 | ) | | | 19.35 | | 8.14 | | | | 9,692 | | 1.44 | | | 6.39 | | | .76 | | | 7.06 | | | .70 | | | 7.13 | | | 115 | |
2005(e) | | | 20.00 | | | .90 | | | (1.05 | ) | | | (.15 | ) | | | (.45 | ) | | | — | | | (.45 | ) | | | 19.40 | | 1.79 | | | | 9,692 | | 1.43 | * | | 5.35 | * | | .92 | * | | 5.85 | * | | .89 | * | | 5.88 | * | | 69 | |
| (a) | Per share Net Investment Income is calculated using the average daily shares method. |
| (b) | Total returns are calculated on net asset value without any sales charge and are not annualized. |
| (c) | After expense reimbursement from the Adviser. |
| (d) | After custodian fee credit and expense reimbursement. |
| (e) | For the period December 20, 2004 (commencement of operations) through September 30, 2005. |
| (f) | For the six months ended March 31, 2007. |
See accompanying notes to financial statements.
46
Notes
47
Notes
48
Fund Information
| | | | |
| | |
Fund Manager Nuveen Asset Management 333 West Wacker Drive Chicago, IL 60606 | | Legal Counsel Chapman and Cutler LLP Chicago, IL Independent Registered Public Accounting Firm PricewaterhouseCoopers LLP Chicago, IL Custodian State Street Bank & Trust Company Boston, MA | | Transfer Agent and Shareholder Services Boston Financial Data Services, Inc. Nuveen Investor Services P.O. Box 8530 Boston, MA 02266-8530 (800) 257-8787 |
Glossary of Terms Used in this Report
Average Annual Total Return: This is a commonly used method to express an investment’s performance over a particular, usually multi-year time period. It expresses the return that would have been necessary each year to equal the investment’s actual cumulative performance (including change in NAV or offer price and reinvested dividends and capital gains distributions, if any) over the time period being considered.
Average Market Capitalization: The market capitalization of a company is equal to the number of the company’s common shares outstanding multiplied by the current price of the company’s stock. The average market capitalization of a mutual fund’s portfolio gives a measure of the size of the companies in which the fund invests.
Net Asset Value (NAV): A Fund’s NAV is the dollar value of one share in the fund. It is calculated by subtracting the liabilities of the fund from its total assets and then dividing the remainder by the number of shares outstanding. Fund NAVs are calculated at the end of each business day.
NASD Regulation, Inc. provides a Public Disclosure Program which supplies certain information regarding the disciplinary history of NASD members and their associated persons in response to either telephone inquiries at (800) 289-9999 or written inquiries at www.nasdr.com. NASD Regulation, Inc. also provides an investor brochure that includes information describing the Public Disclosure Program.
49
Learn more
about Nuveen Funds at
www.nuveen.com/mf
Nuveen Investments:
SERVING Investors
For GENERATIONS
Since 1898, financial advisors and their clients have relied on Nuveen Investments to provide dependable investment solutions. Over this time, Nuveen Investments has adhered to the belief that the best approach to investing is to apply conservative risk-management principles to help minimize volatility.
Building on this tradition, we today offer a range of high quality equity and fixed-income solutions that can be integral parts of a well-diversified core portfolio. Our clients have come to appreciate this diversity, as well as our continued adherence to proven, long-term investing principles.
We offer many different investing solutions for our clients’ different needs.
Managing approximately $166 billion in assets, as of March 31, 2007, Nuveen Investments offers access to a number of different asset classes and investing solutions through a variety of products. Nuveen Investments markets its capabilities under six distinct brands: NWQ, specializing in value-style equities; Nuveen, managing fixed-income investments; Santa Barbara, committed to growth equities; Tradewinds NWQ, specializing in global value equities; Rittenhouse, focused on “blue-chip” growth equities; and Symphony, with expertise in alternative investments as well as equity and income portfolios.
Find out how we can help you reach your financial goals.
To learn more about the products and services Nuveen Investments offers and for a prospectus, where applicable, talk to your financial advisor, or call us at (800) 257-8787. Please read the information carefully before you invest.
MSA-INV3-0307D
Item 2. Code of Ethics.
Not applicable to this filing.
Item 3. Audit Committee Financial Expert.
Not applicable to this filing.
Item 4. Principal Accountant Fees and Services.
Not applicable to this filing.
Item 5. Audit Committee of Listed Registrants
Not applicable to this registrant.
Item 6. Schedule of Investments
See Portfolio of Investments in Item 1
Item 7. Disclosure of Proxy Voting Policies and Procedures for Closed-End Management Investment Companies
Not applicable to this registrant.
Item 8. Portfolio Managers of Closed-End Management Investment Companies
Not applicable to this registrant.
Item 9. Purchases of Equity Securities by Closed-End Management Investment Company and Affiliated Purchasers
Not applicable to this registrant.
Item 10. Submission of Matters to a Vote of Security Holders
There have been no material changes to the procedures by which shareholders may recommend nominees to the registrant’s Board implemented after the registrant last provided disclosure in response to this Item.
Item 11. Controls and Procedures.
| (a) | The registrant’s principal executive and principal financial officers, or persons performing similar functions, have concluded that the registrant’s disclosure controls and procedures (as defined in Rule 30a-3(c) under the Investment Company Act of 1940, as amended (the “1940 Act”) (17 CFR 270.30a-3(c))) are effective, as of a date within 90 days of the filing date of this report that includes the disclosure required by this paragraph, based on their evaluation of the controls and procedures required by Rule 30a-3(b) under the 1940 Act (17 CFR 270.30a-3(b)) and Rules 13a-15(b) or 15d-15(b) under the Securities Exchange Act of 1934, as amended (the “Exchange Act”) (17 CFR 240.13a-15(b) or 240.15d-15(b)). |
| (b) | There were no changes in the registrant’s internal control over financial reporting (as defined in Rule 30a-3(d) under the 1940 Act (17 CFR 270.30a-3(d)) that occurred during the second fiscal quarter of the period covered by this report that has materially affected, or is reasonably likely to materially affect, the registrant’s internal control over financial reporting. |
Item 12. Exhibits
File the exhibits listed below as part of this Form.
(a)(1) Any code of ethics, or amendment thereto, that is the subject of the disclosure required by Item 2, to the extent that the registrant intends to satisfy the Item 2 requirements through filing of an exhibit: Not applicable to this filing.
(a)(2) A separate certification for each principal executive officer and principal financial officer of the registrant as required by Rule 30a-2(a) under the 1940 Act (17 CFR 270.30a-2(a)) in the exact form set forth below: EX-99.CERT Attached hereto.
(a)(3) Any written solicitation to purchase securities under Rule 23c-1 under the 1940 Act (17 CFR 270.23c-1) sent or given during the period covered by the report by or on behalf of the registrant to 10 or more persons: Not applicable to this registrant.
(b) If the report is filed under Section 13(a) or 15(d) of the Exchange Act, provide the certifications required by Rule 30a-2(b) under the 1940 Act (17 CFR 270.30a-2(b)), Rule 13a-14(b) or Rule 15d-14(b) under the Exchange Act (17 CFR 240.13a-14(b) or 240.15d-14(b)), and Section 1350 of Chapter 63 of Title 18 of the United States Code (18 U.S.C. 1350) as an Exhibit. A certification furnished pursuant to this paragraph will not be deemed “filed” for purposes of Section 18 of the Exchange Act (15 U.S.C. 78r), or otherwise subject to the liability of that section. Such certification will not be deemed to be incorporated by reference into any filing under the Securities Act of 1933 or the Exchange Act, except to the extent that the registration specifically incorporates it by reference. EX-99.906 CERT attached hereto.
SIGNATURES
Pursuant to the requirements of the Securities Exchange Act of 1934 and the Investment Company Act of 1940, the registrant has duly caused this report to be signed on its behalf by the undersigned, thereunto duly authorized.
(Registrant) Nuveen Investment Trust III
| | | | | | |
| By | | (Signature and Title)* | | /s/ Kevin J. McCarthy | | |
| | | | Kevin J. McCarthy Vice President and Secretary | | |
Date June 8, 2007
Pursuant to the requirements of the Securities Exchange Act of 1934 and the Investment Company Act of 1940, this report has been signed below by the following persons on behalf of the registrant and in the capacities and on the dates indicated.
| | | | | | |
| By | | (Signature and Title)* | | /s/ Gifford R. Zimmerman | | |
| | | | Gifford R. Zimmerman Chief Administrative Officer (principal executive officer) | | |
Date June 8, 2007
| | | | | | |
| By | | (Signature and Title)* | | /s/ Stephen D. Foy | | |
| | | | Stephen D. Foy Vice President and Controller (principal financial officer) | | |
Date June 8, 2007
| * | Print the name and title of each signing officer under his or her signature. |