![](https://capedge.com/proxy/8-K/0000107140-21-000045/exhibit99_2slide1.jpg)
December 7, 2021 Second Quarter Fiscal 2022 Earnings Review
![](https://capedge.com/proxy/8-K/0000107140-21-000045/exhibit99_2slide2.jpg)
SAFE HARBOR STATEMENTThis presentation contains certain forward-looking statements concerning the Company's operations, performance, and financial condition. Reliance should not be placed on forward-looking statements, as actual results may differ materially from those in any forward-looking statements. Any such forward-looking statements are based upon many assumptions and estimates that are inherently subject to uncertainties and contingencies, many of which are beyond the control of the Company and are subject to change based on many important factors. Such factors include, but are not limited to: (i) the level of investment in new technologies and products; (ii) subscriber renewal rates for the Company's journals; (iii) the financial stability and liquidity of journal subscription agents; (iv) the consolidation of book wholesalers and retail accounts; (v) the market position and financial stability of key retailers; (vi) the seasonal nature of the Company's educational business and the impact of the used book market; (vii) worldwide economic and political conditions; (viii) the Company's ability to protect its copyrights and other intellectual property worldwide (ix) the ability of the Company to successfully integrate acquired operations and realize expected opportunities; (x) the Company’s ability to realize operating savings over time and in fiscal year 2022 in connection with our multi-year Business Optimization Program; (xi) the impact of COVID-19 on our operations, performance, and financial condition; and (xii) other factors detailed from time to time in the Company's filings with the Securities and Exchange Commission. The Company undertakes no obligation to update or revise any such forward-looking statements to reflect subsequent events or circumstances. NON-GAAP MEASURESIn this presentation, management provides the following non-GAAP performance measures:Adjusted Earnings Per Share (“Adjusted EPS”);Free Cash Flow less Product Development Spending;Adjusted Contribution to Profit (“Adjusted CTP”) and margin;Adjusted EBITDA and margin;Organic revenue; andResults on a constant currency (“CC”) basis.Management believes non-GAAP financial measures, which exclude the impact of restructuring charges and credits and other items, provide supplementary information to support analyzing operating results and earnings and are commonly used by shareholders to measure our performance. Free Cash Flow less Product Development Spending helps assess our ability over the long term to create value for our shareholders. Results on a constant currency basis removes distortion from the effects of foreign currency movements to provide better comparability of our business trends from period to period applying the same foreign currency exchange rates for the current and equivalent prior period. We have not provided our 2022 outlook for the most directly comparable U.S. GAAP financial measures, as they are not available without unreasonable effort due to the high variability, complexity, and low visibility with respect to certain items, including restructuring charges and credits, gains and losses on foreign currency, and other gains and losses. These items are uncertain, depend on various factors, and could be material to our consolidated results computed in accordance with U.S. GAAP.
![](https://capedge.com/proxy/8-K/0000107140-21-000045/exhibit99_2slide3.jpg)
Wiley is enabling discovery, powering education and shaping workforces
![](https://capedge.com/proxy/8-K/0000107140-21-000045/exhibit99_2slide4.jpg)
Second Quarter Summary Revenue+8%$533M GAAP EPS-19%$0.99 Adj. EPS+6%$1.29 Adj. EBITDA+7% $127M Consistent strategies and sharp execution driving revenue growth across segments (+5% organic)Research (+9%, +4% organic)Academic & Professional Learning (+3%)Education Services (+15%)Favorable trends continuing for open research, career-connected education and corporate talent developmentProfessional Development recovery more than offset Education Publishing decline from softness in US college enrollment, easing of pandemic tailwinds, and sale of World Languages portfolioCFO transition – John Kritzmacher to retire after eight years of service; Christina Van Tassell (Dow Jones) joins Wiley as successor All variances at constant currency except GAAP EPS
![](https://capedge.com/proxy/8-K/0000107140-21-000045/exhibit99_2slide5.jpg)
Spotlight on corporate market momentum Corporate Solutions Professional Learning Talent Development +17%Researcher Career CentersScience Databases +15%Corporate Training and LearningProfessional Development Content +67%Recruit, Train, DeployReskilling and Upskilling Q2 YOY revenue growth Research Education
![](https://capedge.com/proxy/8-K/0000107140-21-000045/exhibit99_2slide6.jpg)
Research Publishing & Platforms (millions) Q2 2022 Change Change CC Research Publishing $263 9% 9% Research Platforms $12 15% 15% TOTAL REVENUE* $275 9% 9% ADJUSTED EBITDA $101 10% ADJ. EBITDA MARGIN 37% Continued double-digit growth in open access, platforms and corporate solutionsArticle output +8% driven by HindawiNew read-and-publish agreements with Australia/New Zealand and Virginia consortia; strong pipeline aheadAcquired J&J Editorial, a provider of critical publishing services, to enhance our Partner Solutions growth strategy Q2 EBITDA growth driven by higher revenue Q2Summary *Organic revenue +4% (excluding acquisition and currency impacts)
![](https://capedge.com/proxy/8-K/0000107140-21-000045/exhibit99_2slide7.jpg)
Academic & Professional Learning (millions) Q2 2022 Change Change CC Education Publishing $99 (4%) (5%) Professional Learning $78 16% 15% TOTAL REVENUE $177 4% 3% ADJUSTED EBITDA $59 18% ADJ. EBITDA MARGIN 33% Professional Learning recovery strong as corporations and professionals focus intensely on building the skills and capabilities they need to win Education Publishing decline from softer fall enrollment, easing of pandemic-related tailwinds and sale of World Languages portfolioStrong profit growth and EBITDA margin driven by Professional Learning revenue gains Q2Summary
![](https://capedge.com/proxy/8-K/0000107140-21-000045/exhibit99_2slide8.jpg)
Education Services University Services performance reflects slower enrollment growth (+3%) as compared to the COVID-driven acceleration in prior year; 14 new degree programs signedTalent Development growth accelerating; signed six new corporate clients across industry verticals, went deeper with existing clients, and grew IT talent placements by 130% EBITDA decline as expected due to higher student acquisition costs in University Services and growth investments in Talent Development; Adjusted EBITDA margin of 12% (millions) Q2 2022 Change Change CC University Services $58 3% 3% Talent Development $23 72% 67% TOTAL REVENUE $81 17% 15% ADJUSTED EBITDA $10 (35%) ADJ. EBITDA MARGIN 12% Q2Summary
![](https://capedge.com/proxy/8-K/0000107140-21-000045/exhibit99_2slide9.jpg)
Financial Position and Outlook
![](https://capedge.com/proxy/8-K/0000107140-21-000045/exhibit99_2slide10.jpg)
First Half Review $922 $1,021 Revenue +9% Adjusted EPS +10% Adjusted EBITDA +9% $2.14 $1.91 $202 $222 Strong first half revenue growth in line with expectations (+6% organic)Research +10% (+4% organic)Academic & Professional Learning +5%Education Services +14%H1 earnings increase reflects higher revenue more than offsetting investments in growth initiatives All variances at constant currency. YTD, Wiley recorded favorable FX variances of $19 million in Revenue, $2 million in Adjusted EBITDA and $0.03 in Adjusted EPS.
![](https://capedge.com/proxy/8-K/0000107140-21-000045/exhibit99_2slide11.jpg)
Fiscal 2022 Outlook Reaffirmed Metric (Millions, except EPS) Fiscal 2020 Fiscal 2021 Fiscal 2022 Outlook Revenue $1,831 $1,942 $2,070 to $2,100 Adjusted EBITDA $356 $419 $415 to $435 Adjusted EPS $3.30 $4.00 $4.00 to $4.25 Free Cash Flow $173 $257 $200 to $220
![](https://capedge.com/proxy/8-K/0000107140-21-000045/exhibit99_2slide12.jpg)
Financial Position and Capital Allocation Modest Leverage: Net Debt/EBITDA ratio of 2.1 TTM inclusive of acquisitions vs. 1.9 in the prior yearFree Cash Flow: Use of $126M (even with prior year). FCF historically a use through H1 due to timing of annual journal subscription receipts. Wiley FCF outlook for Fiscal 2022 is between $200M and $220M M&A: $12 million acquisition in Research (J&J Editorial) augments our Partner Solutions growth strategyDividends: Yield at ~2.5% (as of December 6, 2021) Share Repurchases: Acquired ~313K shares YTD for $17M at an average cost of $55.51/share $38M $56M Dividends and Repurchases1H Allocation
![](https://capedge.com/proxy/8-K/0000107140-21-000045/exhibit99_2slide13.jpg)
Wiley is driving impact and sustainability *Sustainalytics - Morningstar December 2, 2021**Wiley Student Outcomes and Accessibility Report 2021 Wiley is considered very low risk for ESG: rated in top 4th percentile (581 out of 14,979 globally rated companies)*Impact aligned with growth strategies: Wiley driving positive social impact through discovery and learning, and job placement and reskillingWiley enables better return on education investment: Wiley partner programs deliver higher graduation rates and lower cost degrees than comparable non-profit online schools**Wiley is reducing its environmental impact: print journal units reduced this year by over 1M, conserving 85M pages of paper and 8,000 trees, and eliminating 1M shipment polybags Low ESG Risk4th percentile*
![](https://capedge.com/proxy/8-K/0000107140-21-000045/exhibit99_2slide14.jpg)
Key Takeaways Strong first half performance driven by consistent strategies and sharp executionFavorable trends continuing for open research, career-connected education and corporate talent developmentWiley driving positive social impact by delivering more cutting-edge knowledge to the world faster and more openly and unlocking career potential for millions of learners; Wiley rated very low risk for ESG Full year outlook reaffirmedThank you, John Kritzmacher, and welcome, Christina Van Tassell
![](https://capedge.com/proxy/8-K/0000107140-21-000045/exhibit99_2slide15.jpg)
Thanks for joining us. IR website at https://investors.wiley.com/Q3 2022 Earnings Call – March 3, 2022Contact us for follow-up at: brian.campbell@wiley.com
![](https://capedge.com/proxy/8-K/0000107140-21-000045/exhibit99_2slide16.jpg)
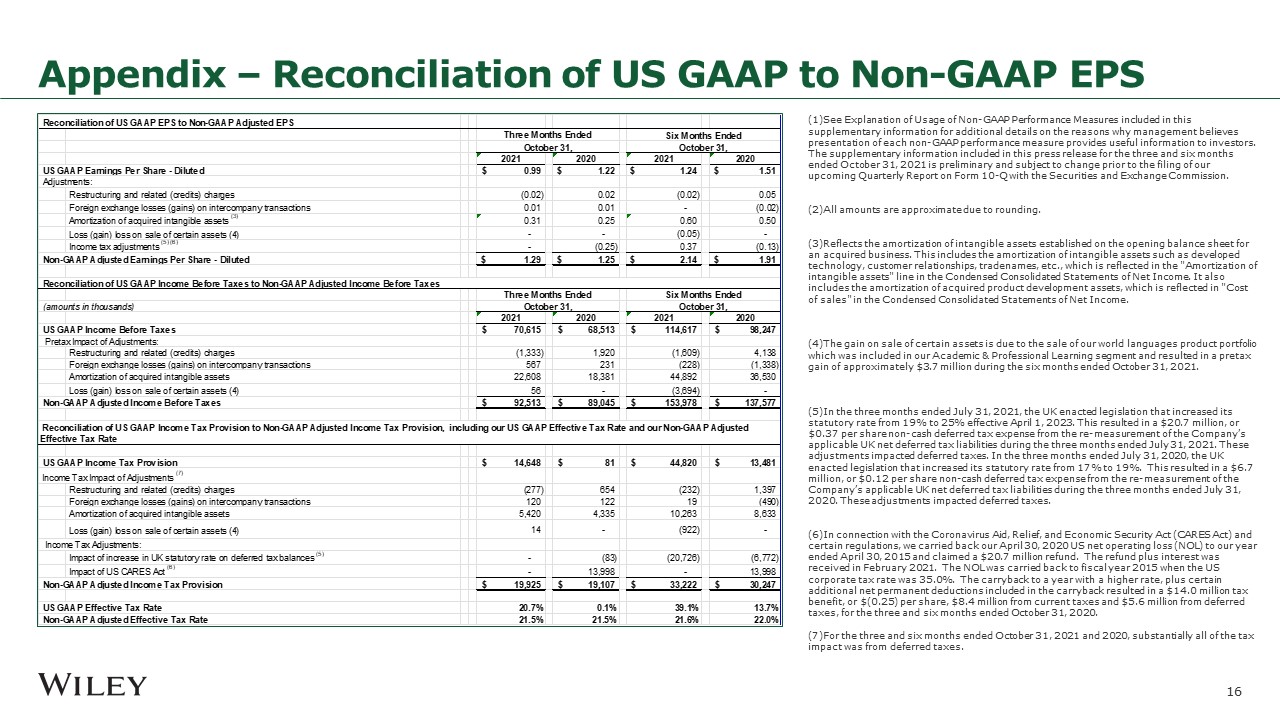
Appendix – Reconciliation of US GAAP to Non-GAAP EPS (1)See Explanation of Usage of Non-GAAP Performance Measures included in this supplementary information for additional details on the reasons why management believes presentation of each non-GAAP performance measure provides useful information to investors. The supplementary information included in this press release for the three and six months ended October 31, 2021 is preliminary and subject to change prior to the filing of our upcoming Quarterly Report on Form 10-Q with the Securities and Exchange Commission. (2)All amounts are approximate due to rounding. (3)Reflects the amortization of intangible assets established on the opening balance sheet for an acquired business. This includes the amortization of intangible assets such as developed technology, customer relationships, tradenames, etc., which is reflected in the "Amortization of intangible assets" line in the Condensed Consolidated Statements of Net Income. It also includes the amortization of acquired product development assets, which is reflected in "Cost of sales" in the Condensed Consolidated Statements of Net Income. (4)The gain on sale of certain assets is due to the sale of our world languages product portfolio which was included in our Academic & Professional Learning segment and resulted in a pretax gain of approximately $3.7 million during the six months ended October 31, 2021. (5)In the three months ended July 31, 2021, the UK enacted legislation that increased its statutory rate from 19% to 25% effective April 1, 2023. This resulted in a $20.7 million, or $0.37 per share non-cash deferred tax expense from the re-measurement of the Company’s applicable UK net deferred tax liabilities during the three months ended July 31, 2021. These adjustments impacted deferred taxes. In the three months ended July 31, 2020, the UK enacted legislation that increased its statutory rate from 17% to 19%. This resulted in a $6.7 million, or $0.12 per share non-cash deferred tax expense from the re-measurement of the Company’s applicable UK net deferred tax liabilities during the three months ended July 31, 2020. These adjustments impacted deferred taxes. (6)In connection with the Coronavirus Aid, Relief, and Economic Security Act (CARES Act) and certain regulations, we carried back our April 30, 2020 US net operating loss (NOL) to our year ended April 30, 2015 and claimed a $20.7 million refund. The refund plus interest was received in February 2021. The NOL was carried back to fiscal year 2015 when the US corporate tax rate was 35.0%. The carryback to a year with a higher rate, plus certain additional net permanent deductions included in the carryback resulted in a $14.0 million tax benefit, or $(0.25) per share, $8.4 million from current taxes and $5.6 million from deferred taxes, for the three and six months ended October 31, 2020. (7)For the three and six months ended October 31, 2021 and 2020, substantially all of the tax impact was from deferred taxes.
![](https://capedge.com/proxy/8-K/0000107140-21-000045/exhibit99_2slide17.jpg)
Appendix – Reconciliation of Net Income to Adjusted EBITDA