QuickLinks -- Click here to rapidly navigate through this document

MEEMIC Holdings, Inc.
March 2002
RAYMOND JAMES
& ASSOCIATES, INC.
Member New York Stock Exchange/SIPC
| • | Overview | 3 | ||
• | Valuation | 9 | ||
• | Comparable Companies | 12 | ||
• | Precedent Transactions | 18 | ||
• | DCF Valuation | 23 |
2
| MEEMIC Holdings, Inc. | |||
| MEMH | |||
| 3/14/02 Stock Price: | $ | 24.23 | |
| Shares Outstanding: | 6,674,335 | ||
| Market Capitalization: | $ | 161,719,137 |
| | 2001 | ||
|---|---|---|---|
| Revenues: | $ | 144,607 | |
| Earnings per Share: | $ | 1.78 | |
| Average Daily Volume: | 2,709 | ||
Situation
- •
- MEEMIC Holdings, Inc. ("MEEMIC") completed its conversion from a mutual to a stock insurance company on July 1, 1999. The conversion raised $66 million in new equity capital for MEEMIC.
- •
- Professionals Group, Inc. ("Professionals") beneficially owned 77.3% of MEEMIC post-conversion, primarily as a result of the conversion of a $21.5 million surplus note (plus accrued interest) and standby purchase of shares in the subscription offering.
- •
- Professionals merged with Medical Assurance, Inc. in June 2001 to form ProAssurance Corporation ("ProAssurance").
- •
- Currently, ProAssurance beneficially owns approximately 81.2% of the diluted shares outstanding of MEEMIC. ProAssurance currently owns approximately 5.6 million shares of MEEMIC.
- •
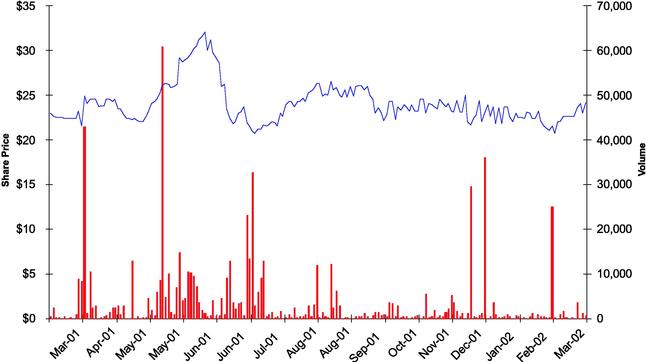
- With fewer than 1.2 million shares in the outstanding float, the market for the Company's stock is illiquid. Daily trading volume averages approximately 3,000 shares.
- •
- MEEMIC is considering a transaction to repurchase all outstanding shares of common stock not owned by ProAssurance.
Advantages of Potential Transaction
Advantages to Company
- •
- Unified management
- •
- Elimination of public ownership costs
- •
- Elimination of related party transactions and perceived conflict of interest
Advantages to Minority
- •
- Liquidity
- •
- Increased value relative to current market
Advantages to Majority
- •
- Potential increases in earnings per share
- •
- Increased flexibility with respect to capital management
- •
- Capture full value of future growth
3
Historical Financial Summary
| | Year Ended December 31, | ||||||||||||||||
|---|---|---|---|---|---|---|---|---|---|---|---|---|---|---|---|---|---|
| | 2001 | 2000 | 1999 | 1998 | 1997 | ||||||||||||
| | (in 000s) | ||||||||||||||||
| Revenues: | |||||||||||||||||
Net Premiums Earned | $ | 133,252 | $ | 118,528 | $ | 93,034 | $ | 64,040 | $ | 67,830 | |||||||
| Net Investment Income | 11,182 | 10,768 | 8,285 | 6,958 | 6,677 | ||||||||||||
| Realized Gain (Loss) | (1,540 | ) | (65 | ) | (20 | ) | 31 | 32 | |||||||||
| Other | 1,713 | 1,713 | 1,877 | 2,111 | 841 | ||||||||||||
| Total Revenues | $ | 144,607 | $ | 130,944 | $ | 103,176 | $ | 73,140 | $ | 75,380 | |||||||
Expenses: | |||||||||||||||||
Loss and Loss Adjustment Expense | $ | 93,702 | $ | 77,227 | $ | 62,858 | $ | 43,452 | $ | 47,302 | |||||||
| Policy Acquisition and Underwriting Expenses | 31,679 | 28,127 | 19,132 | 12,658 | 16,690 | ||||||||||||
| Amortization and Other | 3,027 | 3,098 | 3,845 | 5,582 | 2,087 | ||||||||||||
| Total Expenses | $ | 128,408 | $ | 108,452 | $ | 85,835 | $ | 61,692 | $ | 66,079 | |||||||
Income before Taxes | 16,199 | 22,492 | 17,341 | 11,448 | 9,301 | ||||||||||||
Income Tax | 4,180 | 6,773 | 5,531 | 3,296 | 2,672 | ||||||||||||
| Net Income before Extraordinary | $ | 12,019 | $ | 15,719 | $ | 11,810 | $ | 8,152 | $ | 6,629 | |||||||
Extraordinary Items (net of tax) | — | — | 1,525 | 214 | — | ||||||||||||
| Net Income | $ | 12,019 | $ | 15,719 | $ | 13,335 | $ | 8,366 | $ | 6,629 | |||||||
| Assets | |||||||||||||||||
Cash and Investments | $ | 222,667 | $ | 198,118 | $ | 168,432 | $ | 128,881 | $ | 113,747 | |||||||
| Intangible | 30,496 | 33,420 | 36,344 | 39,268 | 42,149 | ||||||||||||
| Other | 88,520 | 77,936 | 69,873 | 71,181 | 58,962 | ||||||||||||
| Total Assets | $ | 341,683 | $ | 309,474 | $ | 274,649 | $ | 239,330 | $ | 214,858 | |||||||
Liabilities & Equity | |||||||||||||||||
Loss & LAE Reserves | $ | 124,361 | $ | 107,256 | $ | 96,009 | $ | 92,298 | $ | 84,921 | |||||||
| Unearned Premiums | 41,310 | 36,755 | 34,148 | 31,586 | 29,436 | ||||||||||||
| Other | 14,894 | 18,856 | 17,307 | 63,222 | 57,219 | ||||||||||||
| Total Liabilities | $ | 180,565 | $ | 162,867 | $ | 147,464 | $ | 187,106 | $ | 171,576 | |||||||
Shareholders' Equity | $ | 161,118 | $ | 146,607 | $ | 127,185 | $ | 52,224 | $ | 43,282 | |||||||
4
| | Year Ended December 31, | ||||||||||
|---|---|---|---|---|---|---|---|---|---|---|---|
| | 2001 | 2000 | 1999 | 1998 | 1997 | ||||||
| Net Loss & LAE Ratio | 70.3 | % | 65.2 | % | 67.6 | % | 67.8 | % | 69.7 | % | |
| Expense Ratio | 23.8 | % | 23.7 | % | 20.5 | % | 19.8 | % | 24.6 | % | |
| Combined Ratio | 94.1 | % | 88.9 | % | 88.1 | % | 87.6 | % | 94.3 | % | |
Investment Yield | 5.3 | % | 5.8 | % | 5.6 | % | 5.8 | % | 6.5 | % | |
Operating Margin | 11.2 | % | 17.2 | % | 17.7 | % | 19.2 | % | 14.1 | % | |
Return on Average Equity | 7.8 | % | 11.5 | % | 14.9 | % | 17.5 | % | 16.7 | % | |
MEEMIC Strengths and Weaknesses
- •
- Captive, low-cost distribution system
- •
- 10% commission, below industry average
- •
- 90% of business is MEEMIC related
- •
- Attractive customer demographic
- •
- Educators have a lower incidence of accidents and claims
- •
- MEEMIC has approximately 20% of the educators market
- •
- Brand loyalty
- •
- 98.5% retention rate for multi-policy holders
- •
- Experienced management
Strengths
- •
- Single state
- •
- Unproven ability to grow business plan in new geographic markets
- •
- Limited management depth
Weaknesses
5
MEMH Stock Performance
MEEMIC Holdings, Inc. Price/Volume Performance
March 2001—March 2002
6
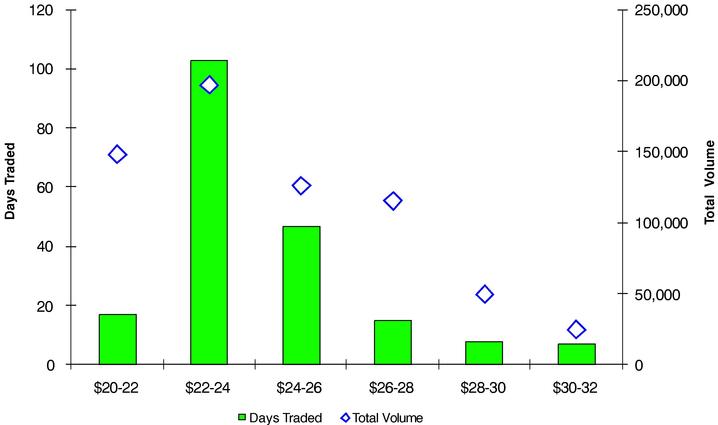
Price Histogram
March 2001—March 2002
7
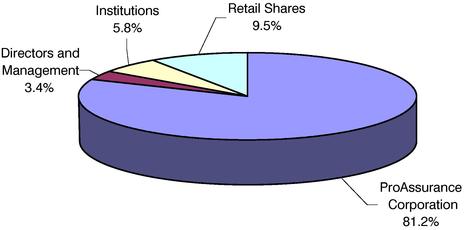
MEMH Ownership (Diluted Shares)
| | Shares | % | ||||
|---|---|---|---|---|---|---|
| ProAssurance Corporation | 5,610,045 | 81.2 | % | |||
Directors and Management: | ||||||
| Thomas Hoeg(1) | 62,700 | 0.9 | % | |||
| James Wood(2) | 40,000 | 0.6 | % | |||
| Lynn Kalinowski(3) | 33,400 | 0.5 | % | |||
| Christine Schmitt(3) | 33,200 | 0.5 | % | |||
| Victor Adamo(3) | 32,700 | 0.5 | % | |||
| William Sabados(3) | 32,700 | 0.5 | % | |||
| John Dodge Jr. | 1,744 | 0.0 | % | |||
| Ann Putallaz | 500 | 0.0 | % | |||
| Directors and Management | 236,944 | 3.4 | % | |||
Institutions: | ||||||
| Fidelity Management | 207,500 | 3.0 | % | |||
| Independence One Capital | 90,950 | 1.3 | % | |||
| Barclays Global Investors | 49,351 | 0.7 | % | |||
| Northern Trust | 23,990 | 0.3 | % | |||
| Others | 52,602 | 0.8 | % | |||
| Institutional Shares | 400,403 | 5.8 | % | |||
Retail Shares | 657,558 | 9.5 | % | |||
Diluted Shares Outstanding(4) | 6,904,950 | 100 | % | |||
- (1)
- Includes 30,000 vested options and 12,700 shares in the Rabbi Trust.
- (2)
- Includes 30,000 vested options.
- (3)
- Includes 20,000 vested options and 12,700 shares in the Rabbi Trust.
- (4)
- Includes 140,000 vested options and 90,950 shares in the Rabbi Trust.
Source: Shareworld Database, the Company
MEMH Ownership
8
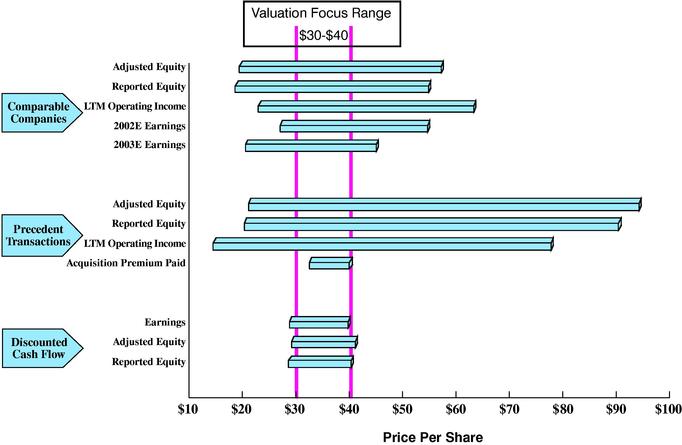
Summary
9
Multiple Comparison
| | MEEMIC Values | ||
|---|---|---|---|
| | (in millions, except stock price) | ||
| Adjusted Equity | $ | 167.9 | |
| Reported Equity | 161.1 | ||
| LTM Operating Income | 13.9 | ||
| 2002E Earnings | 18.7 | ||
| 2003E Earnings | 19.2 | ||
| Stock Price | 24.23 | ||
| | Focus Range Multiples | ||||
|---|---|---|---|---|---|
| | $30 | $40 | |||
| Adjusted Equity | 1.23 | x | 1.64 | x | |
| Reported Equity | 1.29 | x | 1.71 | x | |
| LTM Operating Income | 14.9 | x | 19.9 | x | |
| 2002E Earnings | 11.1 | x | 14.8 | x | |
| 2003E Earnings | 10.8 | x | 14.4 | x | |
| Acquisition Premium | 23.8 | % | 65.1 | % | |
| | Multiples | |||||||
|---|---|---|---|---|---|---|---|---|
| Methodology | ||||||||
| Low | Median | High | ||||||
| Comparable Companies | ||||||||
Adjusted Equity | 0.78 | x | 1.57 | x | 2.33 | x | ||
| Reported Equity | 0.78 | x | 1.57 | x | 2.33 | x | ||
| LTM Operating Income | 11.2 | x | 17.5 | x | 31.2 | x | ||
| 2002E Earnings | 9.8 | x | 13.5 | x | 20.0 | x | ||
| 2003E Earnings | 7.2 | x | 10.8 | x | 16.0 | x | ||
Precedent Transactions | ||||||||
Adjusted Equity | 0.85 | x | 2.13 | x | 3.85 | x | ||
| Reported Equity | 0.85 | x | 2.13 | x | 3.85 | x | ||
| LTM Operating Income | 7.0 | x | 20.8 | x | 38.4 | x | ||
| Acquisition Premium Paid | 32.0 | % | 44.8 | % | 63.3 | % | ||
Discounted Cash Flow | ||||||||
| Adjusted Equity | 1.18 | x | 1.41 | x | 1.67 | x | ||
| Reported Equity | 1.21 | x | 1.44 | x | 1.71 | x | ||
| Earnings | 14.0 | x | 16.6 | x | 19.5 | x | ||
10
Adjustments to MEEMIC Results for Purposes of Analysis
- •
- MEEMIC has established loss reserves approximately 20% above M&R's best estimate. The adjusted equity value used for valuation purposes has been increased by half the difference between these two numbers, or $5.2 million, tax-effected.
- •
- MEEMIC has established a reinsurance liability of $3.7 million relating to contingent reinsurance premiums for policy years 1997 and prior. Due to lack of any substantial loss development, it is becoming very unlikely that these premiums are to be paid, and they have been tax effected and added back to equity for valuation purposes.
- •
- MEEMIC posted a realized loss of $1.5 million in 2Q 2001 on bonds of California power companies. These bonds have since recovered their value after government bailouts and the future gain has been tax-effected and included in adjusted equity.
- •
- The departure of Kevin Clinton and Annette Flood caused a $1.3 million severance payment charge in Q2 2001. This represents a one time occurrence that has been tax effected and added back to operating income for purposes of valuation.
| Reported Book Value at 12/31/01— | $ | 161,118,000 | |||
| Adjustments (tax-effected at 35%) | |||||
| Excess loss reserves— | 3,371,225 | ||||
| Reinsurance payables— | 2,418,320 | ||||
| Unrecognized gain in bond portfolio— | 1,001,000 | ||||
| Adjusted Book Value— | $ | 167,908,545 | |||
| Reported Net Income— | $ | 12,019,000 | |||
| Adjustments (tax-effected at 35%) | |||||
| Realized investment losses— | 1,001,000 | ||||
| Net severance— | 868,400 | ||||
| Net Operating Income— | $ | 13,888,400 | |||
11
Selected Financial Information—GAAP
| | | Income Statement | Balance Sheet | |||||||||||||||||||||||
|---|---|---|---|---|---|---|---|---|---|---|---|---|---|---|---|---|---|---|---|---|---|---|---|---|---|---|
| Company | Latest Quarter Reported | LTM Net Premiums Written | LTM Net Premiums Earned | LTM Net Operating Income(1) | Total Assets | Total Debt | Total Preferred Equity & Other(2) | Total Unadjusted Common Equity(3) | Total Adjusted Common Equity(4) | |||||||||||||||||
| | | ($ in thousands) | ||||||||||||||||||||||||
| Commerce Group, Inc. | 12/01 | $ | 1,078,967 | $ | 1,043,652 | $ | 98,900 | $ | 2,140,082 | $ | 0 | $ | 0 | $ | 812,274 | $ | 799,880 | |||||||||
| Mercury General Corporation | 12/01 | 1,442,886 | 1,380,561 | 101,106 | 2,329,045 | 183,658 | 0 | 1,079,583 | 1,043,231 | |||||||||||||||||
| Harleysville Group Inc. | 12/01 | 747,587 | 729,889 | 45,489 | 2,045,290 | 96,055 | 0 | 590,298 | 546,033 | |||||||||||||||||
| Merchants Group, Inc. | 09/01 | NA | 93,535 | 598 | 299,676 | 0 | 0 | 70,648 | 68,751 | |||||||||||||||||
| Vesta Insurance Group, Inc. | 12/01 | 306,323 | 286,804 | 6,116 | 1,843,136 | 109,396 | 23,250 | 259,307 | 244,490 | |||||||||||||||||
| Selective Insurance Group, Inc. | 12/01 | 925,420 | 883,048 | 21,888 | 2,702,319 | 156,433 | 0 | 591,160 | 493,123 | |||||||||||||||||
| 21st Century Insurance Group | 12/01 | 868,955 | 864,145 | (30,819 | ) | 1,352,016 | 0 | 0 | 659,306 | 647,428 | ||||||||||||||||
| State Auto Financial Corporation | 12/01 | 726,822 | 555,207 | 19,330 | 1,086,566 | 45,500 | 0 | 400,272 | 378,269 | |||||||||||||||||
| Kingsway Financial Services | 09/01 | 591,959 | 468,199 | 22,428 | 1,046,997 | 92,394 | 0 | 319,469 | 263,166 | |||||||||||||||||
Mean | $ | 836,115 | $ | 700,560 | $ | 31,671 | $ | 1,649,459 | $ | 75,937 | $ | 2,583 | $ | 531,369 | $ | 498,263 | ||||||||||
| Median | 808,271 | 729,889 | 21,888 | 1,843,136 | 92,394 | 0 | 590,298 | 493,123 | ||||||||||||||||||
| High | 1,442,886 | 1,380,561 | 101,106 | 2,702,319 | 183,658 | 23,250 | 1,079,583 | 1,043,231 | ||||||||||||||||||
| Low | 306,323 | 93,535 | (30,819 | ) | 299,676 | 0 | 0 | 70,648 | 68,751 | |||||||||||||||||
MEEMIC Holdings, Inc. | 12/01 | $ | 137,743 | $ | 133,252 | $ | 13,888 | $ | 341,683 | $ | 0 | $ | 0 | $ | 161,118 | $ | 167,908 | |||||||||
Source: SNL Database
Operating Performance—GAAP
| Company | Yield on Average Investments & Cash | Net Investment Income Ratio(1) | Loss Ratio | Expense Ratio | Combined Ratio | Operating Ratio(2) | Adjusted Return on Average Common Equity(3) | Total Debt to Total Capital | Liquidity Ratio(4) | ||||||||||
|---|---|---|---|---|---|---|---|---|---|---|---|---|---|---|---|---|---|---|---|
| Commerce Group, Inc. | 6.0 | % | 9.5 | % | 74.5 | % | 24.4 | % | 98.9 | % | 89.4 | % | 12.6 | % | 0.0 | % | 120.3 | % | |
| Mercury General Corporation | 6.1 | % | 8.3 | % | 73.2 | % | 26.4 | % | 99.6 | % | 91.3 | % | 9.9 | % | 14.5 | % | 212.0 | % | |
| Harleysville Group Inc. | 5.1 | % | 11.7 | % | 71.2 | % | 33.0 | % | 104.2 | % | 92.5 | % | 8.6 | % | 14.0 | % | 128.8 | % | |
| Merchants Group, Inc. | 6.4 | % | 14.8 | % | 81.8 | % | 32.3 | % | 114.1 | % | 99.2 | % | 0.9 | % | 0.0 | % | 114.3 | % | |
| Vesta Insurance Group, Inc. | 6.1 | % | 24.1 | % | 59.1 | % | 40.6 | % | 99.7 | % | 75.6 | % | 2.7 | % | 27.9 | % | 92.7 | % | |
| Selective Insurance Group, Inc. | 5.7 | % | 11.0 | % | 74.3 | % | 32.4 | % | 106.7 | % | 95.7 | % | 4.5 | % | 20.9 | % | 101.0 | % | |
| 21st Century Insurance Group | 5.5 | % | 5.2 | % | 88.1 | % | 14.9 | % | 103.0 | % | 97.8 | % | NA | 0.0 | % | 151.0 | % | ||
| State Auto Financial Corporation | 5.5 | % | 8.5 | % | 76.9 | % | 30.1 | % | 107.0 | % | 98.5 | % | 5.2 | % | 10.2 | % | 169.0 | % | |
| Kingsway Financial Services | 4.9 | % | 9.3 | % | 70.6 | % | 28.5 | % | 99.1 | % | 89.3 | % | 7.1 | % | 22.4 | % | 108.3 | % | |
Mean | 5.7 | % | 11.4 | % | 74.4 | % | 29.2 | % | 103.6 | % | 92.1 | % | 6.4 | % | 12.2 | % | 133.0 | % | |
| Median | 5.7 | % | 9.5 | % | 74.3 | % | 30.1 | % | 103.0 | % | 92.5 | % | 6.1 | % | 14.0 | % | 120.3 | % | |
| High | 6.4 | % | 24.1 | % | 88.1 | % | 40.6 | % | 114.1 | % | 99.2 | % | 12.6 | % | 27.9 | % | 212.0 | % | |
| Low | 4.9 | % | 5.2 | % | 59.1 | % | 14.9 | % | 98.9 | % | 75.6 | % | 0.9 | % | 0.0 | % | 92.7 | % | |
MEEMIC Holdings, Inc. | 4.9 | % | 8.4 | % | 70.3 | % | 23.8 | % | 94.1 | % | 85.7 | % | NA | 0.0 | % | 155.0 | % |
- (1)
- (Investment income) / (Net premiums earned).
- (2)
- (Combined ratio) - (Net investment income ratio).
- (3)
- (Net operating earnings) / (Average adjusted common equity).
- (4)
- (Invested assets and cash) / (Policyholder liabilities).
Source: SNL Database
12
| | | | | | | | Multiple of Price to: | | |||||||||||||||||||||
|---|---|---|---|---|---|---|---|---|---|---|---|---|---|---|---|---|---|---|---|---|---|---|---|---|---|---|---|---|---|
| Ticker | Company | 3/14/2002 Closing Stock Price | Shares Out. | Equity Market Value | Latest Quarter Reported | Estimated Long-Term Growth Rate | LTM Net Operating EPS | CY 2002 Est. EPS | CY 2003 Est. EPS | Peg(1) Ratio CY 2002 | Adjusted(2) Common Equity | Common Equity | Indicated Annual Dividend Yield | ||||||||||||||||
| | | (amounts in thousands, except stock price) | |||||||||||||||||||||||||||
| CGI | Commerce Group, Inc. | $ | 39.37 | 33,130 | $ | 1,304,346 | 12/01 | 8.9 | % | 13.3 | 11.9 | 10.9 | 1.22 | 1.63 | 1.61 | 3.10 | % | ||||||||||||
| MCY | Mercury General Corporation | 43.60 | 54,226 | 2,364,254 | 12/01 | 17.3 | % | 23.4 | 18.8 | 16.0 | 0.92 | 2.27 | 2.19 | 2.76 | % | ||||||||||||||
| HGIC | Harleysville Group Inc. | 26.35 | 29,445 | 775,867 | 12/01 | 19.8 | % | 17.2 | 13.4 | 11.2 | 0.57 | 1.42 | 1.31 | 2.32 | % | ||||||||||||||
| MGP | Merchants Group, Inc. | 23.05 | 2,314 | 53,334 | 09/01 | NA | NM | 20.0 | NM | NM | 0.78 | 0.75 | 1.74 | % | |||||||||||||||
| VTA | Vesta Insurance Group, Inc. | 5.48 | 35,323 | 193,570 | 12/01 | 36.4 | % | 11.2 | 9.8 | 7.2 | 0.20 | 0.79 | 0.75 | 1.85 | % | ||||||||||||||
| SIGI | Selective Insurance Group, Inc. | 23.76 | 25,532 | 606,648 | 12/01 | 35.0 | % | 28.6 | 14.6 | 10.8 | 0.31 | 1.23 | 1.03 | 2.53 | % | ||||||||||||||
| TW | 21st Century Insurance Group | 17.65 | 85,362 | 1,506,637 | 12/01 | 59.6 | % | NM | NM | 23.1 | 0.39 | 2.33 | 2.29 | 1.85 | % | ||||||||||||||
| STFC | State Auto Financial Corporation | 15.30 | 38,937 | 595,736 | 12/01 | 22.2 | % | 31.2 | 12.9 | 10.6 | 0.48 | 1.57 | 1.49 | 0.86 | % | ||||||||||||||
| KFS | Kingsway Financial Services | 10.77 | 47,472 | 511,273 | 12/01 | NA | 17.5 | 13.5 | 10.8 | NA | 1.94 | 1.60 | 0.00 | % | |||||||||||||||
Mean | 28.4 | % | 20.4 | x | 14.4 | x | 12.6 | x | 0.58 | x | 1.55 | x | 1.45 | x | 1.9 | % | |||||||||||||
| Median | 22.2 | % | 17.5 | 13.5 | 10.8 | 0.48 | 1.57 | 1.49 | 1.9 | % | |||||||||||||||||||
| High | 59.6 | % | 31.2 | 20.0 | 23.1 | 1.22 | 2.33 | 2.29 | 3.1 | % | |||||||||||||||||||
| Low | 8.9 | % | 11.2 | 9.8 | 7.2 | 0.20 | 0.78 | 0.75 | 0.0 | % | |||||||||||||||||||
MEMH MEEMIC Holdings, Inc. | $ | 24.23 | 6,674 | $ | 161,719 | 12/01 | NA | 12.6 | x | NA | x | NA | x | NA | x | 0.96 | x | 1.00 | x | 0.00 | % | ||||||||
- (1)
- (CY 2002 Est. EPS)/(Estimated long-term growth rate).
- (2)
- Excludes net accumulated other comprehensive income/(loss), foreign currency translations and adjustments to ESOPs.
Source: SNL Database
13
Selected GAAP Financial Data
| | | CGI | MCY | HGIC | MGP | VTA | SIGI | TW | STFC | KFS | | ||||||||||||
|---|---|---|---|---|---|---|---|---|---|---|---|---|---|---|---|---|---|---|---|---|---|---|---|
| Latest twelve months ended | 12/31/01 | 12/31/01 | 12/31/01 | 09/30/01 | 12/31/01 | 12/31/01 | 12/31/01 | 12/31/01 | 09/01/01 | ||||||||||||||
| Latest fiscal year ended | 2001 | 2001 | 2001 | 2000 | 2001 | 2001 | 2001 | 2001 | 2001 | Median | |||||||||||||
| Net premiums written growth | Qtr(s)-Qtr(s) | 7.8 | % | 18.6 | % | 2.1 | % | NA | 80.4 | % | 10.3 | % | 6.6 | % | 211.9 | % | NA | 10.3 | % | ||||
| 1999-00 | 6.9 | % | 13.4 | % | 6.6 | % | 0.0 | % | 45.4 | % | 9.7 | % | 4.4 | % | 77.7 | % | NA | 8.3 | % | ||||
| 1998-99 | 10.6 | % | 5.5 | % | -3.2 | % | -0.1 | % | -13.2 | % | 3.9 | % | 8.2 | % | 3.7 | % | NA | 3.8 | % | ||||
| 1997-98 | 22.4 | % | 5.4 | % | 5.6 | % | 1.8 | % | -42.5 | % | 8.4 | % | -0.6 | % | 7.6 | % | NA | 5.5 | % | ||||
| 1996-97 | 0.5 | % | 5.3 | % | 11.2 | % | -4.2 | % | -19.7 | % | 4.4 | % | -1.9 | % | 12.3 | % | NA | 2.4 | % | ||||
1996-00 CAGR | 9.8 | % | 7.4 | % | 4.9 | % | - -0.6 | % | - -12.7 | % | 6.6 | % | 2.5 | % | 22.2 | % | NA | 5.7 | % | ||||
Net premiums earned growth | Qtr(s)-Qtr(s) | 5.0 | % | 15.6 | % | 8.0 | % | - -2.4 | % | 33.7 | % | 7.4 | % | 2.6 | % | 109.5 | % | NA | 7.7 | % | |||
| 1999-00 | 9.3 | % | 10.5 | % | 6.0 | % | 0.0 | % | 32.2 | % | 7.5 | % | 4.7 | % | 39.5 | % | NA | 8.4 | % | ||||
| 1998-99 | 9.5 | % | 5.1 | % | -2.7 | % | -0.5 | % | -36.9 | % | 2.8 | % | 7.1 | % | 1.5 | % | NA | 2.1 | % | ||||
| 1997-98 | 16.9 | % | 5.9 | % | 6.4 | % | 1.3 | % | -22.0 | % | 10.5 | % | -0.3 | % | 10.1 | % | NA | 6.2 | % | ||||
| 1996-97 | 2.1 | % | 8.8 | % | 6.4 | % | -2.6 | % | -14.7 | % | 6.9 | % | -1.7 | % | 11.3 | % | NA | 4.2 | % | ||||
1996-00 CAGR | 9.3 | % | 7.6 | % | 4.0 | % | - -0.5 | % | - -13.7 | % | 6.9 | % | 2.4 | % | 14.8 | % | NA | 5.4 | % | ||||
Net investment income growth | Qtr(s)-Qtr(s) | - -3.7 | % | 5.6 | % | - -1.2 | % | - -9.3 | % | - -6.2 | % | - -6.8 | % | - -5.3 | % | 47.6 | % | NA | - -4.5 | % | |||
| 1999-00 | 2.9 | % | 7.6 | % | -1.5 | % | 0.0 | % | 39.2 | % | -2.7 | % | -8.8 | % | 21.7 | % | NA | 1.4 | % | ||||
| 1998-99 | 43.7 | % | 7.1 | % | 1.0 | % | 5.8 | % | 70.6 | % | 3.1 | % | -21.4 | % | 13.6 | % | NA | 6.4 | % | ||||
| 1997-98 | -22.1 | % | 3.3 | % | -0.2 | % | -1.0 | % | -6.8 | % | -2.7 | % | -16.6 | % | 5.4 | % | NA | -1.8 | % | ||||
| 1996-97 | 6.8 | % | 10.8 | % | 5.2 | % | 4.0 | % | -19.7 | % | -1.3 | % | 2.3 | % | 4.5 | % | NA | 4.2 | % | ||||
1996-00 CAGR | 5.3 | % | 7.2 | % | 1.1 | % | 2.1 | % | 15.5 | % | - -0.9 | % | - -11.6 | % | 11.1 | % | NA | 3.7 | % | ||||
Operating income growth | Qtr(s)-Qtr(s) | - -44.5 | % | - -11.0 | % | - -18.3 | % | - -1725.5 | % | - -225.1 | % | - -6.0 | % | - -2805.5 | % | - -178.8 | % | NA | - -111.7 | % | |||
1999-00 | - -16.1 | % | - -5.3 | % | 5.7 | % | 0.0 | % | - -36.9 | % | - -8.1 | % | - -288.1 | % | - -56.4 | % | NA | - -12.1 | % | ||||
| 1998-99 | 39.1 | % | -24.5 | % | 27.0 | % | -36.8 | % | -10.1 | % | -31.2 | % | -81.3 | % | 7.6 | % | NA | -17.3 | % | ||||
| 1997-98 | -8.0 | % | -20.7 | % | -36.0 | % | 14.0 | % | -112.7 | % | -37.0 | % | 1.7 | % | 15.6 | % | NA | -14.3 | % | ||||
| 1996-97 | 13.1 | % | 16.5 | % | 6.3 | % | 43.6 | % | -343.6 | % | -16.3 | % | -20.2 | % | -8.8 | % | NA | -1.2 | % | ||||
1996-00 CAGR | 5.0 | % | - -9.8 | % | - -2.2 | % | 0.9 | % | - -35.2 | % | - -24.0 | % | NA | - -16.1 | % | NA | - -9.8 | % | |||||
Invested assets and cash as a % of total assets | LQE | 70.0 | % | NA | 78.9 | % | 76.6 | % | 57.7 | % | 67.4 | % | 65.4 | % | NA | 0.0 | % | NA | |||||
| 2001 | 70.0 | % | NA | 78.9 | % | 76.5 | % | 57.7 | % | 67.4 | % | 65.4 | % | NA | 0.0 | % | NA | ||||||
| 2000 | 71.0 | % | 84.1 | % | 80.5 | % | 76.5 | % | 62.8 | % | 69.4 | % | 68.8 | % | 86.0 | % | 0.0 | % | 71.0 | % | |||
| 1999 | 67.8 | % | 83.1 | % | 80.4 | % | 79.0 | % | 52.9 | % | 68.6 | % | 71.7 | % | 85.8 | % | 0.0 | % | 71.7 | % | |||
| 1998 | 71.6 | % | 84.8 | % | 81.9 | % | 78.4 | % | 47.1 | % | 73.1 | % | 77.6 | % | 85.4 | % | 0.0 | % | 77.6 | % | |||
| 1997 | 70.8 | % | 84.1 | % | 80.7 | % | 76.7 | % | 39.2 | % | 75.1 | % | 75.3 | % | 86.8 | % | 0.0 | % | 75.3 | % | |||
Average | 70.2 | % | 84.0 | % | 80.2 | % | 77.3 | % | 52.9 | % | 70.2 | % | 70.7 | % | 86.0 | % | 0.0 | % | 70.7 | % | |||
Common equity as a % of total assets | LQE | 38.0 | % | NA | 28.9 | % | 23.6 | % | 14.1 | % | 21.9 | % | 48.8 | % | NA | 0.0 | % | NA | |||||
| 2001 | 38.0 | % | NA | 28.9 | % | 24.9 | % | 14.1 | % | 21.9 | % | 48.8 | % | NA | 0.0 | % | NA | ||||||
| 2000 | 37.7 | % | 48.2 | % | 28.0 | % | 24.9 | % | 11.7 | % | 22.5 | % | 53.9 | % | 43.0 | % | 0.0 | % | 28.0 | % | |||
| 1999 | 34.6 | % | 47.7 | % | 26.1 | % | 25.7 | % | 19.1 | % | 22.7 | % | 52.3 | % | 41.8 | % | 0.0 | % | 26.1 | % | |||
| 1998 | 40.2 | % | 48.9 | % | 27.4 | % | 26.2 | % | 11.7 | % | 25.0 | % | 49.3 | % | 47.5 | % | 0.0 | % | 27.4 | % | |||
| 1997 | 37.0 | % | 46.3 | % | 24.8 | % | 24.6 | % | 22.0 | % | 24.5 | % | 24.2 | % | 45.7 | % | 0.0 | % | 24.6 | % | |||
Average | 37.6 | % | 47.8 | % | 27.3 | % | 25.0 | % | 15.4 | % | 23.1 | % | 46.2 | % | 44.5 | % | 0.0 | % | 27.3 | % |
Source: SNL Database
14
GAAP and STAT Financial Data
| | | CGI | MCY | HGIC | MGP | VTA | SIGI | TW | STFC | KFS | | ||||||||||||
|---|---|---|---|---|---|---|---|---|---|---|---|---|---|---|---|---|---|---|---|---|---|---|---|
| Latest twelve months ended | 12/31/01 | 12/31/01 | 12/31/01 | 09/30/01 | 12/31/01 | 12/31/01 | 12/31/01 | 12/31/01 | 09/01/01 | ||||||||||||||
| Latest fiscal year ended | 2001 | 2001 | 2001 | 2000 | 2001 | 2001 | 2001 | 2001 | 2001 | Median | |||||||||||||
| GAAP loss ratio | TTM | 74.5 | % | 73.2 | % | 71.2 | % | 81.8 | % | 59.1 | % | 74.3 | % | 88.1 | % | 76.9 | % | 70.6 | % | 74.3 | % | ||
| 2001 | 74.5 | % | 73.2 | % | 71.2 | % | 75.7 | % | 59.1 | % | 74.3 | % | 96.8 | % | 76.9 | % | NA | 74.4 | % | ||||
| 2000 | 71.0 | % | 72.2 | % | 71.6 | % | 75.7 | % | 57.8 | % | 74.8 | % | 90.8 | % | 68.4 | % | NA | 71.9 | % | ||||
| 1999 | 71.7 | % | 66.4 | % | 74.0 | % | 69.7 | % | 61.5 | % | 74.1 | % | 78.5 | % | 67.5 | % | NA | 70.7 | % | ||||
| 1998 | 71.3 | % | 61.0 | % | 69.9 | % | 69.7 | % | 76.4 | % | 70.2 | % | 81.0 | % | 68.0 | % | NA | 70.1 | % | ||||
| 1997 | 72.0 | % | 63.5 | % | 70.3 | % | 74.6 | % | 57.7 | % | 68.2 | % | 77.3 | % | 65.1 | % | NA | 69.3 | % | ||||
Average | 72.5 | % | 68.2 | % | 71.4 | % | 74.5 | % | 61.9 | % | 72.6 | % | 85.4 | % | 70.5 | % | 70.6 | % | 71.4 | % | |||
GAAP expense ratio | TTM | 24.4 | % | 26.4 | % | 33.0 | % | 32.3 | % | 40.6 | % | 32.4 | % | 14.9 | % | 30.1 | % | 28.5 | % | 30.1 | % | ||
| 2001 | NA | 26.4 | % | 32.8 | % | 32.1 | % | NA | 32.6 | % | 14.9 | % | 30.1 | % | NA | 31.1 | % | ||||||
| 2000 | NA | 26.3 | % | 34.6 | % | 32.1 | % | NA | 33.1 | % | 14.4 | % | 30.0 | % | NA | 31.0 | % | ||||||
| 1999 | NA | 26.8 | % | 34.3 | % | 34.5 | % | 38.3 | % | 32.7 | % | 12.9 | % | 28.5 | % | NA | 32.7 | % | |||||
| 1998 | 27.2 | % | 26.6 | % | 33.7 | % | 35.8 | % | 51.1 | % | 33.3 | % | 10.2 | % | 29.3 | % | NA | 31.3 | % | ||||
| 1997 | 24.4 | % | 25.1 | % | 33.3 | % | 33.4 | % | 34.9 | % | 32.1 | % | 9.4 | % | 29.5 | % | NA | 30.8 | % | ||||
Average | 25.3 | % | 26.3 | % | 33.6 | % | 33.4 | % | 41.2 | % | 32.7 | % | 12.8 | % | 29.6 | % | 28.5 | % | 29.6 | % | |||
GAAP combined ratio | TTM | 98.9 | % | 99.6 | % | 104.2 | % | 114.1 | % | 99.7 | % | 106.7 | % | 103.0 | % | 107.0 | % | 99.1 | % | 103.0 | % | ||
| 2001 | NA | 99.6 | % | 104.0 | % | 107.8 | % | NA | 106.9 | % | 111.7 | % | 107.0 | % | 0.0 | % | 106.9 | % | |||||
| 2000 | NA | 98.5 | % | 106.2 | % | 107.8 | % | NA | 107.9 | % | 105.2 | % | 98.4 | % | 0.0 | % | 105.2 | % | |||||
| 1999 | NA | 93.2 | % | 108.3 | % | 104.2 | % | 99.8 | % | 106.8 | % | 91.4 | % | 96.0 | % | 0.0 | % | 97.9 | % | ||||
| 1998 | 98.5 | % | 87.6 | % | 103.6 | % | 105.5 | % | 127.5 | % | 103.5 | % | 91.2 | % | 97.3 | % | 0.0 | % | 98.5 | % | |||
| 1997 | 96.4 | % | 88.6 | % | 103.6 | % | 108.0 | % | 92.6 | % | 100.3 | % | 86.7 | % | 94.6 | % | 0.0 | % | 94.6 | % | |||
Average | 97.9 | % | 94.5 | % | 105.0 | % | 107.9 | % | 104.9 | % | 105.4 | % | 98.2 | % | 100.1 | % | 16.5 | % | 100.1 | % | |||
GAAP yield on average invested assets and cash | TTM | 6.0 | % | NA | 5.1 | % | 6.4 | % | 6.1 | % | 5.7 | % | 5.5 | % | NA | 0.0 | % | NA | |||||
| 2001 | 6.0 | % | NA | 5.1 | % | 6.5 | % | 6.1 | % | 5.7 | % | 5.5 | % | NA | 0.0 | % | NA | ||||||
| 2000 | 9.1 | % | 6.5 | % | 5.9 | % | 6.5 | % | 5.8 | % | 5.9 | % | 4.6 | % | 6.2 | % | 0.0 | % | 5.9 | % | |||
| 1999 | 5.8 | % | 5.5 | % | 6.4 | % | 6.2 | % | 6.2 | % | 7.2 | % | 5.6 | % | 5.8 | % | 0.0 | % | 5.8 | % | |||
| 1998 | 7.4 | % | 6.1 | % | 6.7 | % | 6.2 | % | 5.0 | % | 5.5 | % | NA | 6.1 | % | 0.0 | % | NA | |||||
| 1997 | 8.6 | % | 7.0 | % | 6.4 | % | 6.3 | % | 7.2 | % | 6.3 | % | NA | 6.4 | % | 0.0 | % | NA | |||||
Average | 7.1 | % | 6.3 | % | 5.9 | % | 6.4 | % | 6.1 | % | 6.1 | % | 5.3 | % | 6.1 | % | 0.0 | % | 6.1 | % | |||
GAAP adjusted return on adjusted common equity | TTM | 12.6 | % | NA | 8.6 | % | 0.9 | % | NA | 4.5 | % | NA | NA | NA | 6.6 | % | |||||||
| 2001 | 12.6 | % | NA | 8.6 | % | 6.0 | % | NA | 4.5 | % | NA | NA | NA | 7.3 | % | ||||||||
| 2000 | 16.1 | % | 10.9 | % | 8.7 | % | 6.0 | % | 5.3 | % | 4.9 | % | NA | 13.0 | % | NA | 8.7 | % | |||||
| 1999 | 14.1 | % | 15.6 | % | 7.3 | % | 9.6 | % | 12.3 | % | 7.0 | % | NA | 12.9 | % | NA | 12.3 | % | |||||
| 1998 | 14.1 | % | 22.0 | % | 12.4 | % | 8.6 | % | -65.6 | % | 11.3 | % | 15.7 | % | 11.8 | % | NA | 12.1 | % | ||||
| 1997 | 13.7 | % | 22.3 | % | 13.3 | % | 6.2 | % | 18.7 | % | 14.6 | % | 36.2 | % | 16.9 | % | NA | 15.8 | % | ||||
Average | 13.9 | % | 17.7 | % | 9.8 | % | 6.2 | % | - -7.3 | % | 7.8 | % | 26.0 | % | 13.6 | % | NA | 11.7 | % | ||||
STAT net premiums written/surplus ratio | 2001 | NA | NA | 1.39 | 1.86 | NA | 1.76 | 2.21 | NA | NA | 1.81 | ||||||||||||
| 2000 | 1.53 | 1.33 | 1.36 | 1.86 | 0.68 | 1.74 | 1.75 | 1.26 | NA | 1.44 | |||||||||||||
| 1999 | 1.76 | 1.41 | 1.44 | 1.77 | 0.89 | 1.57 | 1.32 | 1.39 | NA | 1.43 | |||||||||||||
| 1998 | 1.32 | 1.49 | 1.40 | 1.83 | 1.92 | 1.47 | 1.29 | 1.58 | NA | 1.48 | |||||||||||||
| 1997 | 1.44 | 1.60 | 1.55 | NA | 1.66 | 1.48 | 1.44 | 1.57 | NA | 1.55 | |||||||||||||
Average | 1.51 | 1.46 | 1.43 | 1.83 | 1.29 | 1.60 | 1.60 | 1.45 | NA | 1.48 |
Source: SNL Database
15
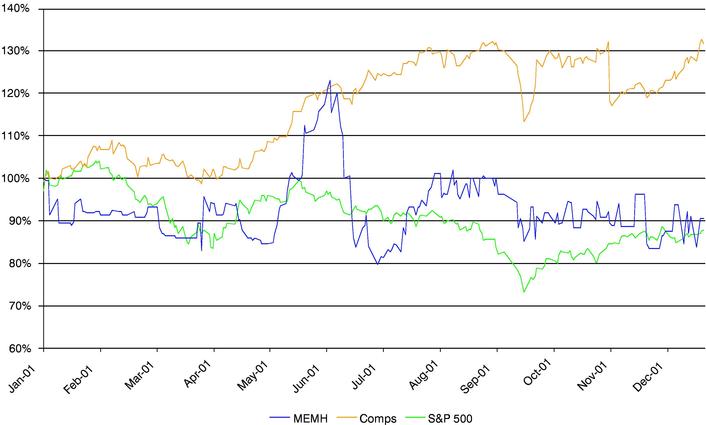
Performance Comparison
Stock Performace 2001
16
P&C Market Overview
- •
- As a result of the September 11th attacks, insurers in a wide swath of P&C markets are raising rates, compounding a hardening of rates that has been building for the past year.
- •
- Historically, when rates harden, insurance stocks usually beat the market. Preliminary indication from one month post attack indicate that investors may respond in line with historical trends.
NET PREMIUMS WRITTEN VS. COMBINED RATIO, 1968 - 2003E
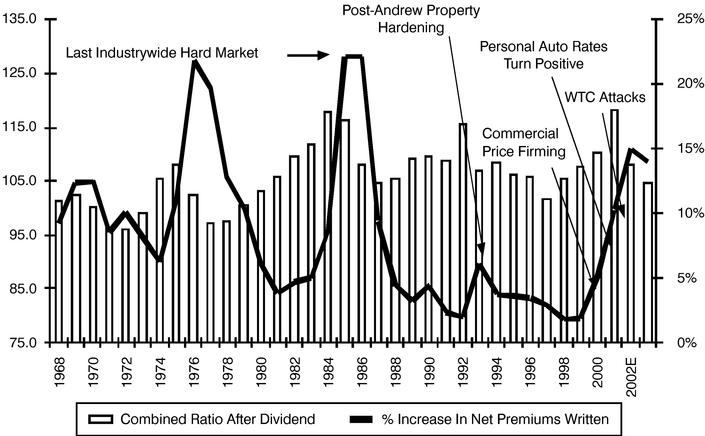
Data from A.M. Best, RJF Estimates
17
Precedent M&A Transactions
| | | | | | Equity Value to: | Transaction Value to: | |||||||||||||||||
|---|---|---|---|---|---|---|---|---|---|---|---|---|---|---|---|---|---|---|---|---|---|---|---|
| | | | | | | | | GAAP Adjusted Common Equity | GAAP Reported Common Equity | | |||||||||||||
| Date Announced | Date Effective | Buyer/Seller | Equity Value ($ in mils) | Debt Assumed ($ in mils) | GAAP Net Income | GAAP Operating Income | STAT Net Income | STAT Surplus | Net Premium Written | ||||||||||||||
| | | | (dollars in millions, sorted according to deal size) | ||||||||||||||||||||
| 7/1/93 | 8/31/93 | St. Paul Companies/Economy Fire & Casualty Company | 420.0 | 0.0 | NA | NA | 18.7 | NA | 1.38 | 1.79 | 1.0 | ||||||||||||
| 11/19/93 | 12/30/93 | GRE Insurance Group/American Ambassador | 100.0 | 0.0 | NA | NA | 13.1 | NA | NA | 1.44 | 1.0 | ||||||||||||
| NA | 12/31/93 | Anthem P&C Holdings, Inc/Federal Kemper Insurance Co | 100.0 | 0.0 | NA | NA | 20.4 | NA | NA | 1.60 | 0.8 | ||||||||||||
| 2/9/95 | 5/22/95 | USF&G Corporation/Victoria Financial Corporation | 59.0 | 0.0 | 34.4 | 30.6 | 22.0 | 2.06 | 2.17 | 2.52 | 1.2 | ||||||||||||
| 4/27/95 | 7/18/95 | Guaranty National Corp./Viking Insurance Company of Wisconsin (Xerox) | 102.7 | 0.0 | NA | NA | 6.5 | NA | NA | 1.18 | 0.7 | ||||||||||||
| NA | 8/31/95 | The Commerce Group, Inc./Western Pioneer Insurance Company | 12.0 | 0.0 | NA | NA | 20.0 | NA | NA | 1.53 | 0.5 | ||||||||||||
| 8/12/95 | 10/3/95 | Trinity Universal Insurance Company (Unitrin)/Milwaukee Insurance Group, Inc. | 94.2 | 0.0 | 20.7 | 20.8 | NM | 1.22 | 1.17 | 1.86 | 0.8 | ||||||||||||
| 8/25/95 | 1/2/96 | Berkshire Hathaway Inc./Geico | 4,727.0 | 0.0 | 17.2 | 20.5 | 17.9 | 3.32 | 2.72 | 4.11 | 1.7 | ||||||||||||
| 2/1/96 | 4/30/96 | GCS Management, Inc. (Goran Capital)/Superior Insurance Company (Fortis, Inc.) | 66.4 | 0.0 | 16.1 | 23.2 | 11.8 | 1.08 | 1.05 | 1.35 | 0.7 | ||||||||||||
18
| 2/8/96 | 7/31/96 | Meridian Insurance Group, Inc./Citizens Security Group, Inc. | 25.0 | 0.0 | NM | NM | 20.6 | 2.14 | 2.08 | 1.87 | 0.8 | ||||||||||||
| 11/5/96 | 1/1/97 | Unitrin, Inc./Union Automobile Indemnity Company | 32.0 | 0.0 | NA | NA | 22.7 | NA | NA | 1.66 | 0.9 | ||||||||||||
| 11/6/96 | 3/7/97 | Progressive Corporation/Midland Financial Group, Inc. | 50.1 | 20.0 | NM | NM | NM | 1.07 | 1.07 | 0.89 | 0.4 | ||||||||||||
| 4/24/97 | 6/30/97 | Vesta Insurance/Anthem Casualty and Shelby Insurance | 238.8 | 0.0 | NM | NM | 19.6 | 2.13 | 2.08 | 1.60 | 0.9 | ||||||||||||
| 6/9/97 | 10/1/97 | Safeco Corporation/American States Financial Corporation | 2,804.8 | 300.0 | 14.7 | 16.5 | 15.7 | 2.25 | 1.98 | 2.57 | 1.9 | ||||||||||||
| 8/28/97 | 10/2/97 | Harleysville Group/Minnesota Fire & Casualty Insurance Company | 35.0 | 0.0 | NA | NA | NM | NA | NA | 1.71 | 0.9 | ||||||||||||
| 6/23/97 | 10/17/97 | General Motors Acceptance Corp./Integon Corp. | 518.8 | 250.0 | NM | NM | NM | 2.88 | 3.00 | 2.11 | 1.0 | ||||||||||||
| 6/30/96 | 11/4/97 | GE Capital Corp./Colonial Penn P&C Group Inc. (Leucadia National Corp.) | 1,018.1 | 0.0 | 20.4 | 22.2 | 19.8 | 2.62 | 2.62 | 2.99 | 2.0 | ||||||||||||
| 9/18/97 | 12/16/97 | Orion Capital Corp./Guaranty National Corp. | 541.4 | 101.1 | 13.9 | 17.1 | 18.2 | 2.19 | 1.94 | 2.13 | 1.2 | ||||||||||||
| 10/20/97 | 12/18/97 | Guaranty National Corp./Unisun Insurance (Amerisure Companies) | 26.0 | 0.0 | NA | NA | 9.6 | NA | NA | 1.37 | 1.2 |
19
| 8/8/97 | 12/23/97 | USF&G Corp. (Fidelity and Guaranty Co.)/Titan Holdings | 231.2 | 50.0 | 15.2 | 15.9 | 16.8 | 1.91 | 1.90 | 2.88 | 1.4 | ||||||||||||
| 10/20/97 | 12/31/97 | General Accident Plc/Canadian General Insurance | 433.2 | 99.6 | NA | NA | NA | NA | 2.43 | NA | 1.3 | ||||||||||||
| 1/27/98 | 04/10/98 | Allstate Corporation/Pembridge Inc. | 266.3 | 20.5 | 26.1 | 38.4 | NA | 3.19 | 2.89 | NA | 1.5 | ||||||||||||
| 11/24/97 | 04/30/98 | Orion Capital Corp./Strickland Insurance Group, Inc. | 40.5 | 9.4 | NA | NA | 11.5 | NA | NA | 2.70 | 1.1 | ||||||||||||
| 10/16/97 | 2/12/98 | Hartford Financial Services Group/Omni Insurance Group | 184.7 | 0.0 | 34.8 | 34.8 | NM | 3.36 | 3.36 | 5.02 | 1.4 | ||||||||||||
| 5/18/98 | 11/12/98 | Nationwide Mutual Insurance Company/Allied Group, Inc. | 1,521.8 | 127.7 | 25.8 | 26.0 | 25.2 | 3.85 | 3.77 | 4.05 | 2.8 | ||||||||||||
| 11/03/98 | 1/29/99 | Commerce Group Inc./Automobile Club Insurance Co. from American Automobile Association | 78.5 | 0.0 | NA | NA | 9.1 | NA | NA | 0.96 | 0.8 | ||||||||||||
| 1/11/99 | 4/8/99 | American Finacial Group, Inc./Worldwide Insurance Co. (Aegon N.V.) | 160.0 | 0.0 | 18.7 | NA | 13.0 | NA | 1.17 | 1.89 | 1.3 | ||||||||||||
| 5/11/99 | 9/1/99 | Millers American Group Inc./Phoenix Indemnity Insurance Co. Acceptance Insurance Cos. | 25.0 | 0.0 | NA | NA | 28.2 | NA | NA | 1.65 | 1.8 | ||||||||||||
| 3/17/99 | 9/24/99 | Motor Club of America/North East Insurance Co. | 10.5 | 0.0 | NM | NM | NM | 1.12 | 1.11 | 1.77 | 0.8 |
20
| 10/25/00 | 6/1/01 | State Automobile Mutual Insurance Company/Meridian Insurance Company | 235.1 | 7.0 | 80.9 | NM | 35.8 | NA | 1.79 | 1.73 | 1.1 | ||||||||||||
| 1/4/00 | NA | Prudential Insurance Company of America/St. Paul Companies | 200.0 | 0.0 | NA | NA | NA | 0.86 | 0.87 | NA | NA | ||||||||||||
| 10/31/00 | 4/10/01 | American National Insurance/ Farm Family Holdings Inc. | 278.9 | 0.0 | 9.2 | 8.9 | 12.6 | NA | 1.25 | 1.15 | NA | ||||||||||||
| 4/18/01 | 7/10/01 | Vesta Insurance Group Inc./ FL Select Ins Holdings Inc. | 64.5 | 0.0 | 9.1 | 7.0 | NA | NA | 1.89 | NA | NA | ||||||||||||
| 2/27/02 | Pending | Kingsway Finl Services Inc./ American Country Holdings Inc. | 24.0 | 10.8 | NM | NM | NM | 0.85 | 0.70 | 0.60 | NA | ||||||||||||
| Average | 23.8 | x | 21.7 | x | 17.8 | x | 2.12 | x | 1.93 | x | 2.0 | x | 1.2 | x | |||||||||
| Median | 18.7 | 20.8 | 18.2 | 2.13 | x | 1.92 | x | 1.8 | 1.1 | ||||||||||||||
| High | 80.9 | 38.4 | 35.8 | 3.85 | x | 3.77 | x | 5.0 | 2.8 | ||||||||||||||
| Low | 9.1 | 7.0 | 6.5 | 0.85 | x | 0.70 | x | 0.6 | 0.4 |
Source: SNL Database, SEC Filings, Press Releases
21
| Month | Average Premium | # of Deals | ||
|---|---|---|---|---|
| February-02 | 32.0 | % | 24 | |
| January-02 | 36.8 | % | 19 | |
| December-01 | 63.3 | % | 17 | |
| November-01 | 47.3 | % | 25 | |
| October-01 | 48.7 | % | 27 | |
| September-01 | 42.0 | % | 26 | |
| August-01 | 36.1 | % | 34 | |
| July-01 | 56.3 | % | 46 | |
| June-01 | 56.4 | % | 44 | |
| May-01 | 41.0 | % | 42 | |
| April-01 | 36.6 | % | 36 | |
| March-01 | 37.4 | % | 31 | |
Highest Average Month | 63.3 | % | ||
| Lowest Average Month | 32.0 | % | ||
| Weighted Average Premium | 44.8 | % |
Note: Includes merger transactions with a deal value greater than $10 million.
Source: Bloomberg L.P.
22
Overview
- •
- Discounted Cash Flow consists of two parts. The first calculates the present value of a stream of future cash flows by applying a discount rate ranging from 12% to 16%. The second part calculates the present value of a terminal value at the end of the fifth year by applying a multiple to net income, and discounting back.
- •
- MEEMIC's cash flow is calculated using dividends available at the end of each year after subtracting the additional surplus required to keep a premiums written to surplus ratio of 2X. MEIA's cash flow is equated to net income.
- •
- The DCF value of cash and investments in the Holding company is assumed to be equal to the current value of the cash.
Per Share value of MEEMIC
| | Multiple of 2006 Net Income | ||||||||||||||
|---|---|---|---|---|---|---|---|---|---|---|---|---|---|---|---|
| Discount Rate | |||||||||||||||
| 11.0x | 12.0x | 13.0x | 14.0x | 15.0x | |||||||||||
| 16% | $ | 17.36 | $ | 18.47 | $ | 19.58 | $ | 20.69 | $ | 21.79 | |||||
| 15% | $ | 18.02 | $ | 19.18 | $ | 20.33 | $ | 21.49 | $ | 22.65 | |||||
| 14% | $ | 18.71 | $ | 19.92 | $ | 21.13 | $ | 22.33 | $ | 23.54 | |||||
| 13% | $ | 19.43 | $ | 20.70 | $ | 21.96 | $ | 23.22 | $ | 24.49 | |||||
| 12% | $ | 20.20 | $ | 21.52 | $ | 22.84 | $ | 24.16 | $ | 25.48 | |||||
Per Share value of MEIA
| | Multiple of 2006 Net Income | ||||||||||||||
|---|---|---|---|---|---|---|---|---|---|---|---|---|---|---|---|
| Discount Rate | |||||||||||||||
| 11.0x | 12.0x | 13.0x | 14.0x | 15.0x | |||||||||||
| 16% | $ | 6.15 | $ | 6.54 | $ | 6.94 | $ | 7.34 | $ | 7.74 | |||||
| 15% | $ | 6.38 | $ | 6.80 | $ | 7.21 | $ | 7.63 | $ | 8.04 | |||||
| 14% | $ | 6.63 | $ | 7.07 | $ | 7.50 | $ | 7.94 | $ | 8.37 | |||||
| 13% | $ | 6.90 | $ | 7.35 | $ | 7.80 | $ | 8.26 | $ | 8.71 | |||||
| 12% | $ | 7.17 | $ | 7.65 | $ | 8.12 | $ | 8.60 | $ | 9.07 | |||||
Median Value
| MEEMIC | $ | 21.13 | ||
| MEIA | $ | 7.50 | ||
| Cash in Holding Company | $ | 4.75 | ||
| Total | $ | 33.38 | ||
23
Summary of Management's Projections
| | Year Ended December 31, | |||||||||||||||
|---|---|---|---|---|---|---|---|---|---|---|---|---|---|---|---|---|
| | 2002 | 2003 | 2004 | 2005 | 2006 | |||||||||||
| Net Premiums Earned | $ | 145,369 | $ | 155,172 | $ | 164,800 | $ | 172,229 | $ | 181,388 | ||||||
Total Revenues | $ | 160,859 | $ | 172,655 | $ | 184,397 | $ | 193,827 | $ | 204,959 | ||||||
Net Income(1) | $ | 18,674 | $ | 19,213 | $ | 21,036 | $ | 22,398 | $ | 23,906 | ||||||
Shareholders' Equity | $ | 177,570 | $ | 196,966 | $ | 222,967 | $ | 244,933 | $ | 271,571 | ||||||
| Net Loss & LAE Ratio | 69.5 | % | 69.5 | % | 69.6 | % | 69.8 | % | 69.8 | % | ||||||
| Expense Ratio | 25.5 | % | 25.5 | % | 25.6 | % | 26.2 | % | 26.2 | % | ||||||
| Combined Ratio | 95.0 | % | 95.0 | % | 95.2 | % | 96.0 | % | 96.0 | % | ||||||
Investment Yield | 6.0 | % | 6.0 | % | 6.0 | % | 6.0 | % | 6.0 | % | ||||||
- (1)
- Assumes no amortization of MEIA intangible except for a $75,000 expense in 2002 for the remainder of a $500,000 intangible with a discrete life.
24
TABLE OF CONTENTS
OVERVIEW
VALUATION
COMPARABLE COMPANIES
NET PREMIUMS WRITTEN VS. COMBINED RATIO, 1968 - 2003E
PRECEDENT TRANSACTIONS
DCF VALUATION