QuickLinks -- Click here to rapidly navigate through this document

MEEMIC Holdings, Inc.
Fairness Opinion Presentation
June 12, 2002
RAYMOND JAMES
& ASSOCIATES, INC.
Member New York Stock Exchange/SIPC
| | | Pages | ||
|---|---|---|---|---|
| • | Overview | 3-8 | ||
• | Valuation | 9-12 | ||
• | Comparable Company Analysis | 13-15 | ||
• | Merger and Acquisition Transactions Analysis | 16-19 | ||
• | DCF Analysis | 20-22 |
2
MEEMIC Holdings, Inc.
MEMH
| 20-Day Stock Price Average Prior to Announcement as of 3/15/02 | $ | 22.46 | |
Shares Outstanding | 6,683,563 | ||
Average Market Capitalization: | $ | 150,112,825 | |
Merger Consideration | $ | 29.00 | |
Implied Equity Value | $ | 193,823,327 |
| Year Ended December 31, 2001 | |||
|---|---|---|---|
| Revenues: | $ | 144,607,000 | |
| Earnings per Share: | $ | 1.78 | |
| Average Daily Volume: | 2,709 | ||
3
Historical Financial Summary—GAAP
| | | Year Ended December 31, | ||||||||||||||||||
|---|---|---|---|---|---|---|---|---|---|---|---|---|---|---|---|---|---|---|---|---|
| | 3 Months Ended March 31, 2002 | |||||||||||||||||||
| | 2001 | 2000 | 1999 | 1998 | 1997 | |||||||||||||||
| | (in 000s) | |||||||||||||||||||
| Revenues: | ||||||||||||||||||||
| Net Premiums Earned | $ | 34,506 | $ | 133,252 | $ | 118,528 | $ | 93,034 | $ | 64,040 | $ | 67,830 | ||||||||
| Net Investment Income | 2,856 | 11,182 | 10,768 | 8,285 | 6,958 | 6,677 | ||||||||||||||
| Realized Gain (Loss) | 0 | (1,540 | ) | (65 | ) | (20 | ) | 31 | 32 | |||||||||||
| Other | 465 | 1,713 | 1,713 | 1,877 | 2,111 | 841 | ||||||||||||||
| Total Revenues | $ | 37,827 | $ | 144,607 | $ | 130,944 | $ | 103,176 | $ | 73,140 | $ | 75,380 | ||||||||
Expenses: | ||||||||||||||||||||
| Loss and Loss Adjustment Expense | $ | 26,549 | $ | 93,702 | $ | 77,227 | $ | 62,858 | $ | 43,452 | $ | 47,302 | ||||||||
| Policy Acquisition and Underwriting Expenses | 7,549 | 31,679 | 28,127 | 19,132 | 12,658 | 16,690 | ||||||||||||||
| Amortization and Other | 89 | 3,027 | 3,098 | 3,845 | 5,582 | 2,087 | ||||||||||||||
| Total Expenses | $ | 34,187 | $ | 128,408 | $ | 108,452 | $ | 85,835 | $ | 61,692 | $ | 66,079 | ||||||||
Income before Taxes | 3,640 | 16,199 | 22,492 | 17,341 | 11,448 | 9,301 | ||||||||||||||
| Income Tax | 939 | 4,180 | 6,773 | 5,531 | 3,296 | 2,672 | ||||||||||||||
Net Income before Extraordinary | $ | 2,701 | $ | 12,019 | $ | 15,719 | $ | 11,810 | $ | 8,152 | $ | 6,629 | ||||||||
Extraordinary Items (net of tax) | — | — | — | 1,525 | 214 | — | ||||||||||||||
| Net Income | $ | 2,701 | $ | 12,019 | $ | 15,719 | $ | 13,335 | $ | 8,366 | $ | 6,629 | ||||||||
Assets | ||||||||||||||||||||
| Cash and Investments | $ | 226,950 | $ | 222,667 | $ | 198,118 | $ | 168,432 | $ | 128,881 | $ | 113,747 | ||||||||
| Intangible | 30,465 | 30,496 | 33,420 | 36,344 | 39,268 | 42,149 | ||||||||||||||
| Other | 91,327 | 88,520 | 77,936 | 69,873 | 71,181 | 58,962 | ||||||||||||||
| Total Assets | $ | 348,742 | $ | 341,683 | $ | 309,474 | $ | 274,649 | $ | 239,330 | $ | 214,858 | ||||||||
Liabilities & Equity | ||||||||||||||||||||
| Loss & LAE Reserves | $ | 127,527 | $ | 124,361 | $ | 107,256 | $ | 96,009 | $ | 92,298 | $ | 84,921 | ||||||||
| Unearned Premiums | 43,796 | 41,310 | 36,755 | 34,148 | 31,586 | 29,436 | ||||||||||||||
| Other | 14,309 | 14,894 | 18,856 | 17,307 | 63,222 | 57,219 | ||||||||||||||
| Total Liabilities | $ | 185,632 | $ | 180,565 | $ | 162,867 | $ | 147,464 | $ | 187,106 | $ | 171,576 | ||||||||
Shareholders' Equity | $ | 163,110 | $ | 161,118 | $ | 146,607 | $ | 127,185 | $ | 52,224 | $ | 43,282 | ||||||||
4
| | | Year Ended December 31, | |||||||||||
|---|---|---|---|---|---|---|---|---|---|---|---|---|---|
| | 3 Months Ended March 31, 2002 | ||||||||||||
| | 2001 | 2000 | 1999 | 1998 | 1997 | ||||||||
| Net Loss & LAE Ratio | 76.9 | % | 70.3 | % | 65.2 | % | 67.6 | % | 67.8 | % | 69.7 | % | |
| Expense Ratio | 21.9 | % | 23.8 | % | 23.7 | % | 20.5 | % | 19.8 | % | 24.6 | % | |
| Combined Ratio | 98.8 | % | 94.1 | % | 88.9 | % | 88.1 | % | 87.6 | % | 94.3 | % | |
Investment Yield | 5.1 | % | 5.3 | % | 5.8 | % | 5.6 | % | 5.8 | % | 6.5 | % | |
Operating Margin | 9.6 | % | 11.2 | % | 17.2 | % | 17.7 | % | 19.2 | % | 14.1 | % | |
Return on Average Equity | 6.7 | % | 7.8 | % | 11.5 | % | 14.9 | % | 17.5 | % | 16.7 | % | |
5
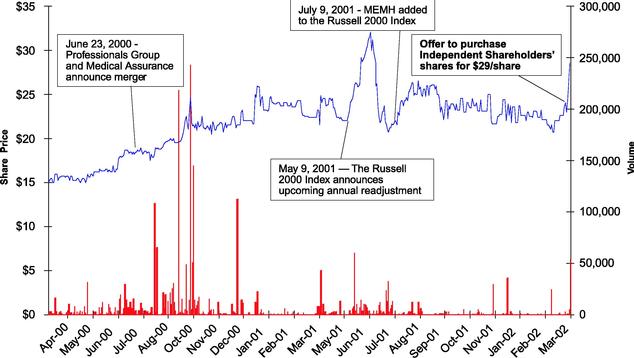
MEMH Stock Performance
MEEMIC Holdings, Inc. Price/Volume Performance
March 20, 2000 — March 18, 2002
6
- •
- All trades above $29 per share in the target period occurred between May 9th and July 9th, 2001. This period coincided with MEEMIC's addition to the Russell 2000 index. Certain mutual funds were required to add MEEMIC to their portfolios at this point, which could account for the temporary spike in price and volume.
Price Histogram
March 19,2001—March 15, 2002
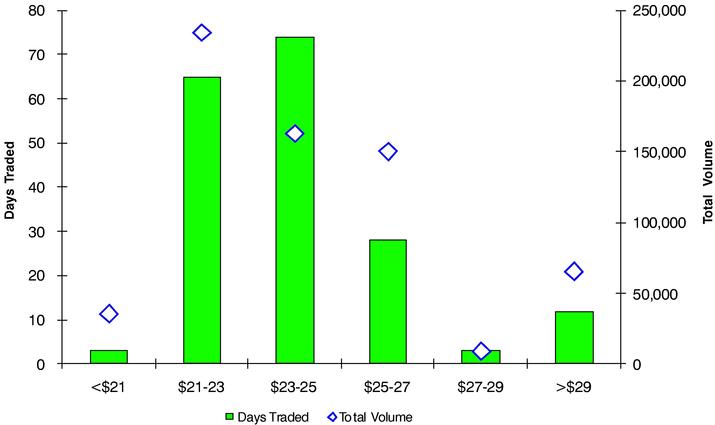
Note: Data represents only days during which trading took place
7
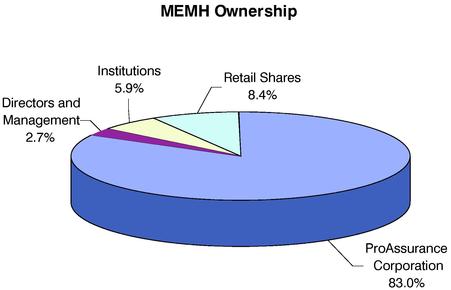
MEMH Ownership (Diluted Shares)
| | Shares | % | ||||
|---|---|---|---|---|---|---|
| ProAssurance Corporation | 5,610,045 | 83.0 | % | |||
Directors and Management: | ||||||
| Thomas Hoeg(1) | 52,355 | 0.8 | % | |||
| James Wood(2) | 29,655 | 0.4 | % | |||
| Lynn Kalinowski(3) | 26,503 | 0.4 | % | |||
| Christine Schmitt(3) | 26,503 | 0.4 | % | |||
| William Sabados(3) | 26,503 | 0.4 | % | |||
| Victor Adamo(4) | 21,928 | 0.3 | % | |||
| John Dodge Jr. | 1,744 | 0.0 | % | |||
| Ann Putallaz | 500 | 0.0 | % | |||
| Directors and Management | 185,693 | 2.7 | % | |||
Institutions: | ||||||
| Fidelity Management | 207,500 | 3.1 | % | |||
| Independence One Capital | 90,950 | 1.3 | % | |||
| Barclays Global Investors | 49,351 | 0.7 | % | |||
| Northern Trust | 23,990 | 0.4 | % | |||
| Others | 52,602 | 0.8 | % | |||
| Institutional Shares | 400,403 | 5.9 | % | |||
Retail Shares | 566,043 | 8.4 | % | |||
Diluted Shares Outstanding(4) | 6,762,184 | 100 | % | |||
- (1)
- Includes 30,000 vested options adjusted using the Treasury method, and 12,700 shares in the Rabbi Trust.
- (2)
- Includes 30,000 vested options adjusted using the Treasury method.
- (3)
- Includes 20,000 vested options adjusted using the Treasury method, and 12,700 shares in the Rabbi Trust.
- (4)
- Includes 12,700 shares in the Rabbi Trust.
- (5)
- Includes 120,000 vested options adjusted using the Treasury method, and 90,950 shares in the Rabbi Trust.
8
Summary
- (1)
- Deals from March 2001 to February 2002 in which a majority owner purchased the remaining outstanding shares from the minority shareholders. Price based on 20-day pre-announcement average.
9
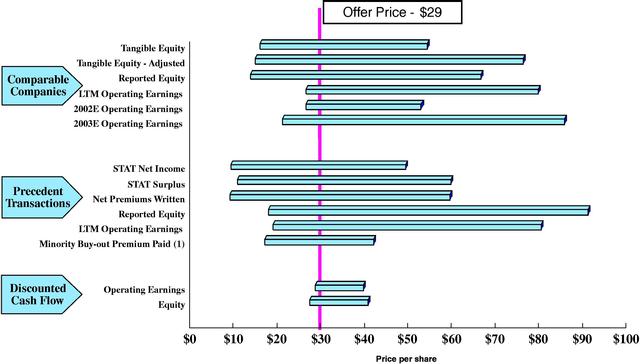
Multiple Comparison
| | Multiples | |||||||
|---|---|---|---|---|---|---|---|---|
| Methodology | ||||||||
| Low | Median | High | ||||||
| Comparable Companies | ||||||||
| Tangible Equity | 0.79 | x | 1.57 | x | 2.72 | x | ||
| Tangible Equity—Adjusted | 0.70 | x | 1.59 | x | 3.64 | x | ||
| Reported Equity | 0.55 | x | 1.51 | x | 2.72 | x | ||
| LTM Operating Earnings | 12.4 | x | 23.8 | x | 37.6 | x | ||
| 2002E Operating Earnings | 10.0 | x | 14.2 | x | 20.1 | x | ||
| 2003E Operating Earnings | 7.3 | x | 11.8 | x | 29.9 | x | ||
Precedent Transactions | ||||||||
| STAT Net Income | 6.5 | x | 18.2 | x | 35.8 | x | ||
| STAT Surplus | 0.89 | x | 1.75 | x | 5.02 | x | ||
| Net Premiums Written | 0.4 | x | 1.0 | x | 2.8 | x | ||
| Reported Equity | 0.73 | x | 1.94 | x | 3.77 | x | ||
| LTM Operating Earnings | 8.9 | x | 21.5 | x | 38.4 | x | ||
| Minority Buy-out Premium Paid(1) | (25.1 | )% | 25.7 | % | 85.4 | % | ||
Discounted Cash Flow | ||||||||
| Operating Earnings | 13.4 | x | 15.9 | x | 18.6 | x | ||
| Equity | 1.11 | x | 1.37 | x | 1.66 | x | ||
- (1)
- Deals from March 2001 to February 2002 in which a majority owner purchased the remaining outstanding shares of the minority. Price based on 20-day pre-announcement average.
| | Offer Multiples | ||
|---|---|---|---|
| | $29.00 | ||
| STAT Net Income | 20.9 | x | |
| STAT Surplus | 2.42 | x | |
| Net Premiums Written | 1.3 | x | |
| Tangible Equity | 1.46 | x | |
| Tangible Equity—Adjusted | 1.76 | x | |
| Reported Equity | 1.19 | x | |
| LTM Operating Earnings | 13.7 | x | |
| 2002E Operating Earnings | 11.1 | x | |
| 2003E Operating Earnings | 10.1 | x | |
| Acquisition Premium (20-Day Average) | 29.1 | % |
| | MEEMIC Values | ||
|---|---|---|---|
| | (in millions, except stock price) | ||
| STAT Net Income | $ | 9.3 | |
| STAT Surplus | 80.1 | ||
| Net Premiums Written | 143.7 | ||
| Tangible Equity | 132.6 | ||
| Tangible Equity—Adjusted | 139.4 | ||
| Reported Equity | 163.1 | ||
| LTM Operating Earnings | 14.1 | ||
| 2002E Operating Earnings | 17.5 | ||
| 2003E Operating Earnings | 19.1 | ||
| 20 Day Average Stock Price | 22.46 | ||
10
Adjustments to MEEMIC Reported Equity for Purposes of Analysis
| Reported Equity at 3/31/02— | $ | 163,110,000 | |||
| Adjustments(1) (tax-effected at 35%) | |||||
| Excess loss reserves— | 3,371,225 | ||||
| Reinsurance payables— | 2,418,320 | ||||
| Unrecognized gain in bond portfolio— | 1,001,000 | ||||
| Adjusted Equity— | $ | 169,900,545 | |||
| Intangible Assets | 30,465,000 | ||||
| Adjusted Tangible Equity— | $ | 139,435,545 | |||
- (1)
- See page 12 for an explanation of adjustments.
Calculation of MEEMIC Excess Capital for Purposes of Analysis
| Adjusted Tangible Equity— | $ | 139,435,545 | ||
LTM 3/31/02 NPW— | $ | 143,695,000 | ||
| Target NPW/Equity Ratio(1) | 2:1 | |||
Target Equity— | $ | 71,847,500 | ||
Excess (Undeployed) Capital— | $ | 67,588,045 | ||
- (1)
- Based on GAAP financial information
Adjustments to MEEMIC Reported Net Income for Purposes of Analysis
| Reported LTM Net Income as of 3/31/02— | $ | 12,257,000 | |||
| Adjustments (tax-effected at 35%) | |||||
| Realized investment losses— | 984,000 | ||||
| Net severance— | 867,400 | ||||
| LTM Operating Earnings— | $ | 14,108,400 | |||
11
Methodology for Adjustments to MEEMIC Reported Results for Purposes of Analysis
- •
- In connection with evaluating implied valuation multiples based on the Merger Consideration, Raymond James deemed that MEEMIC has significant excess capital. Typically, insurance companies receive a valuation multiple only on tangible "deployed" capital and are valued dollar-for-dollar on "excess" capital. In order to determine excess and deployed capital, we judgmentally assumed a net premiums written to GAAP equity ratio of 2:1. The comparable company group has a capital-use ratio ranging from 1.3x to 3.2x, with a mean of 1.8x, compared with MEEMIC's ratio of 1.1x.
- •
- In calculating the ratio of Value to Tangible Equity—Adjusted, Raymond James adjusted each company's capital structure and recomputed Price to Book multiples.
- •
- MEEMIC has established net loss and loss adjustment expense reserves approximately 21%, or $10.4 million above its actuary's best estimate. In order to adjust for potential excess reserves, Raymond James increased reported equity value for valuation purposes by half the amount of the tax-effected difference between MEEMIC's reported net loss and loss adjustment expense reserves at its actuary's best estimate.
- •
- MEEMIC has established a reinsurance liability of $3.7 million relating to contingent reinsurance premiums for policy years 1997 and prior. Due to a lack of any substantial loss development, it is appears unlikely that these premiums are to be paid. For valuation purposes, Raymond James increased reported equity by the tax-effected amount of this liability.
- •
- MEEMIC posted a realized loss of $1.5 million in the second quarter of 2001 on bonds of California-based power companies. These bonds have since recovered their value after government bail-outs and the future gain has been tax-effected and included in adjusted equity for valuation purposes.
- •
- The departure of Kevin Clinton and Annette Flood caused a $1.3 million severance payment charge in the second quarter of 2001. This represents a one-time occurrence that has been tax-effected and added back to LTM operating earnings for purposes of valuation.
12
Selected Financial Information—GAAP
| | | Income Statement | Balance Sheet | ||||||||||||||||||||||||||
|---|---|---|---|---|---|---|---|---|---|---|---|---|---|---|---|---|---|---|---|---|---|---|---|---|---|---|---|---|---|
| Company | Latest Quarter Reported | LTM Net Premiums Written | LTM Net Premiums Earned | LTM Net Operating Income(1) | Total Assets | Total Debt | Total Preferred Equity & Other(2) | Total Common Equity(3) | Total Tangible Equity(4) | Target Equity(5) | |||||||||||||||||||
| | | ($ in thousands) | |||||||||||||||||||||||||||
| Commerce Group, Inc. | 03/02 | $ | 1,137,336 | $ | 1,070,983 | $ | 104,819 | $ | 2,272,482 | $ | 0 | $ | 4,515 | $ | 835,098 | $ | 832,349 | $ | 568,668 | ||||||||||
| Mercury General Corporation | 03/02 | 1,521,175 | 1,443,426 | 108,046 | 2,329,045 | 183,658 | 0 | 1,079,583 | 1,079,583 | 760,588 | |||||||||||||||||||
| Harleysville Group Inc. | 03/02 | 755,207 | 735,120 | 47,270 | 2,232,464 | 96,055 | 0 | 591,011 | 591,011 | 377,604 | |||||||||||||||||||
| Merchants Group, Inc. | 03/02 | 92,654 | 93,662 | 1,109 | 280,698 | 600 | 0 | 65,408 | 65,408 | 46,327 | |||||||||||||||||||
| Vesta Insurance Group, Inc. | 03/02 | 396,208 | 333,200 | 5,690 | 1,970,977 | 104,752 | 22,445 | 257,960 | 123,871 | 198,104 | |||||||||||||||||||
| Selective Insurance Group, Inc. | 03/02 | 966,948 | 904,326 | 24,103 | 2,841,645 | 156,404 | 0 | 593,812 | 547,317 | 483,474 | |||||||||||||||||||
| 21st Century Insurance Group | 03/02 | 855,860 | 864,645 | (23,173 | ) | 1,361,887 | 0 | 0 | 656,840 | 656,840 | 427,930 | ||||||||||||||||||
| State Auto Financial Corporation | 03/02 | 844,057 | 666,482 | 17,373 | 1,086,566 | 45,500 | 0 | 400,272 | 398,260 | 422,029 | |||||||||||||||||||
| Kingsway Financial Services | 03/02 | 774,528 | 654,483 | 25,547 | 1,255,106 | 92,686 | 0 | 354,988 | 305,905 | 387,264 | |||||||||||||||||||
| MEEMIC Holdings, Inc. | 03/02 | $ | 143,695 | $ | 136,585 | $ | 14,108 | $ | 348,742 | $ | 0 | $ | 0 | $ | 163,110 | $ | 132,645 | $ | 71,848 | ||||||||||
- (1)
- Excludes realized gains/(losses) on securities transactions and extraordinary items.
- (2)
- Includes redeemable preferred equity and trust preferred equity.
- (3)
- Common equity NOT adjusted for net accumulated other comprehensive income/(loss), foreign currency translations or ESOPs.
- (4)
- Common Equity less goodwill and other intagibles
- (5)
- Amount of Equity required to support net preiums written at a 2:1 ratio.
Source: SNL Database
Operating Performance—GAAP
| Company | Yield on Average Investments & Cash | Net Investment Income Ratio(1) | Loss Ratio | Expense Ratio | Combined Ratio | Operating Ratio(2) | Return on Average Common Equity(3) | Total Debt to Total Capital | Liquidity Ratio(4) | NPW/ Tangible Equity | |||||||||||
|---|---|---|---|---|---|---|---|---|---|---|---|---|---|---|---|---|---|---|---|---|---|
| Commerce Group, Inc. | 6.3 | % | 9.1 | % | 74.5 | % | 24.4 | % | 98.9 | % | 89.8 | % | 13.0 | % | 0.0 | % | 114.4 | % | 1.4 | x | |
| Mercury General Corporation | 6.1 | % | 8.0 | % | 72.6 | % | 26.4 | % | 99.0 | % | 91.0 | % | 10.2 | % | 14.5 | % | 212.0 | % | 1.4 | ||
| Harleysville Group Inc. | 5.3 | % | 11.7 | % | 70.8 | % | 33.4 | % | 104.2 | % | 92.5 | % | 8.1 | % | 14.0 | % | 127.2 | % | 1.3 | ||
| Merchants Group, Inc. | 5.4 | % | 13.1 | % | 79.3 | % | 32.3 | % | 111.6 | % | 98.5 | % | 1.6 | % | 0.9 | % | 105.7 | % | 1.4 | ||
| Vesta Insurance Group, Inc. | 5.6 | % | 24.1 | % | 60.5 | % | 39.2 | % | 99.7 | % | 75.6 | % | 2.5 | % | 27.2 | % | 84.6 | % | 3.2 | ||
| Selective Insurance Group, Inc. | 5.7 | % | 10.8 | % | 74.1 | % | 32.6 | % | 106.7 | % | 95.9 | % | 4.1 | % | 20.8 | % | 98.3 | % | 1.8 | ||
| 21st Century Insurance Group | 5.5 | % | 5.1 | % | 88.1 | % | 14.9 | % | 103.0 | % | 97.9 | % | NM | 0.0 | % | 149.9 | % | 1.3 | |||
| State Auto Financial Corporation | 5.5 | % | 7.8 | % | 76.3 | % | 30.1 | % | 106.4 | % | 98.6 | % | 4.3 | % | 10.2 | % | 169.0 | % | 2.1 | ||
| Kingsway Financial Services | 5.3 | % | 5.1 | % | 70.6 | % | 28.5 | % | 99.1 | % | 89.3 | % | 14.4 | % | 22.4 | % | 120.6 | % | 2.5 | ||
| Mean | 5.6 | % | 10.5 | % | 74.1 | % | 29.1 | % | 103.2 | % | 92.1 | % | 7.3 | % | 12.2 | % | 131.3 | % | 1.8 | x | |
| Median | 5.5 | % | 9.1 | % | 74.1 | % | 30.1 | % | 103.0 | % | 92.5 | % | 6.2 | % | 14.0 | % | 120.6 | % | 1.4 | ||
| High | 6.3 | % | 24.1 | % | 88.1 | % | 39.2 | % | 111.6 | % | 98.6 | % | 14.4 | % | 27.2 | % | 212.0 | % | 3.2 | ||
| Low | 5.3 | % | 5.1 | % | 60.5 | % | 14.9 | % | 98.9 | % | 75.6 | % | 1.6 | % | 0.0 | % | 84.6 | % | 1.3 | ||
| MEEMIC Holdings, Inc. | 5.1 | % | 8.2 | % | 71.4 | % | 23.3 | % | 94.7 | % | 86.5 | % | 9.0 | % | 0.0 | % | 132.5 | % | 1.1 |
- (1)
- (Investment income)/(Net premiums earned).
- (2)
- (Combined ratio)—(Net investment income ratio).
- (3)
- (Net operating earnings)/(Average common equity).
- (4)
- (Invested assets and cash)/(Policyholder liabilities).
Source: SNL Database
13
Market Valuation—GAAP
| | | | | | | Multiple of Price to: | | ||||||||||||||||||||||
|---|---|---|---|---|---|---|---|---|---|---|---|---|---|---|---|---|---|---|---|---|---|---|---|---|---|---|---|---|---|
| Ticker | Company | 6/10/2002 Closing Stock Price | Shares Out. | Equity Market Value | Est. L-T Growth Rate | LTM Net Operating EPS | CY 2002 Est. EPS | CY 2003 Est. EPS | Peg (1) Ratio CY 2002 | Tangible Equity | Tangible Equity - Adjusted | Common Equity | Indicated Annual Dividend Yield | ||||||||||||||||
| | | (amounts in thousands, except stock price | |||||||||||||||||||||||||||
| CGI | Commerce Group, Inc. | $ | 39.54 | 32,950 | $ | 1,302,861 | 10.0 | % | 12.4 | x | 12.5 | x | 11.8 | x | 1.2 | x | 1.57 | x | 1.83 | x | 1.56 | x | 3.16 | % | |||||
| MCY | Mercury General Corporation | 47.38 | 54,226 | 2,569,228 | 13.5 | % | 23.8 | 20.1 | 16.8 | 1.2 | 2.38 | 2.96 | 2.38 | 2.56 | % | ||||||||||||||
| HGIC | Harleysville Group Inc. | 27.20 | 29,579 | 804,557 | 8.7 | % | 17.0 | 14.2 | 11.8 | 1.4 | 1.36 | 1.57 | 1.36 | 2.35 | % | ||||||||||||||
| MGP | Merchants Group, Inc. | 24.50 | 2,110 | 51,699 | NA | NM | NM | NM | NM | 0.79 | 0.70 | 0.79 | 1.63 | % | |||||||||||||||
| VTA | Vesta Insurance Group, Inc. | 4.01 | 35,323 | 141,645 | 25.0 | % | 24.9 | 10.0 | 7.3 | 0.3 | 1.14 | 1.09 | 0.55 | 2.45 | % | ||||||||||||||
| SIGI | Selective Insurance Group, Inc. | 25.98 | 25,787 | 669,955 | 11.0 | % | 27.8 | 16.2 | 11.5 | 1.0 | 1.22 | 1.25 | 1.13 | 2.30 | % | ||||||||||||||
| TW | 21st Century Insurance Group | 20.93 | 85,369 | 1,786,771 | NA | NM | NM | 29.9 | NM | 2.72 | 3.64 | 2.72 | 1.60 | % | |||||||||||||||
| STFC | State Auto Financial Corporation | 16.75 | 38,980 | 652,919 | 9.2 | % | 37.6 | 18.2 | 12.3 | 1.3 | 1.64 | 1.60 | 1.63 | 0.78 | % | ||||||||||||||
| KFS | Kingsway Financial Services | 11.26 | 47,472 | 534,535 | 31.0 | % | 20.92 | 14.1 | 11.3 | NA | 1.75 | 1.59 | 1.51 | 0.00 | % | ||||||||||||||
| Mean | 15.5 | % | 23.5 | x | 15.0 | x | 14.1 | x | 1.08 | x | 1.62 | 1.80 | x | 1.51 | x | 1.9 | % | ||||||||||||
| Median | 11.0 | % | 23.8 | 14.2 | 11.8 | 1.21 | 1.57 | 1.59 | 1.51 | 2.3 | % | ||||||||||||||||||
| High | 31.0 | % | 37.6 | 20.1 | 29.9 | 1.35 | 2.72 | 3.64 | 2.72 | 3.2 | % | ||||||||||||||||||
| Low | 8.7 | % | 12.4 | 10.0 | 7.3 | 0.29 | 0.79 | 0.70 | 0.55 | 0.0 | % | ||||||||||||||||||
MEMH | MEEMIC Holdings, Inc.(2) | $ | 22.46 | 6,684 | $ | 150,113 | NA | 10.6 | x | 8.6 | x | 7.9 | x | NA | x | 1.13 | x | 1.15 | x | 0.92 | x | 0.00 | % | ||||||
Deal Multiples(3) | $ | 29.00 | 6,684 | $ | 193,823 | NA | 13.7 | 11.1 | 10.1 | NA | 1.46 | 1.76 | 1.19 | 0.00 | % | ||||||||||||||
- (1)
- (CY 2002 Est. EPS)/(Estimated long-term growth rate).
- (2)
- Based on MEEMIC's 20-day average trading day stock price up to and including 3/15/02.
- (3)
- Based on Merger Consideration of $29.00 in cash per share.
Source: SNL Database
14
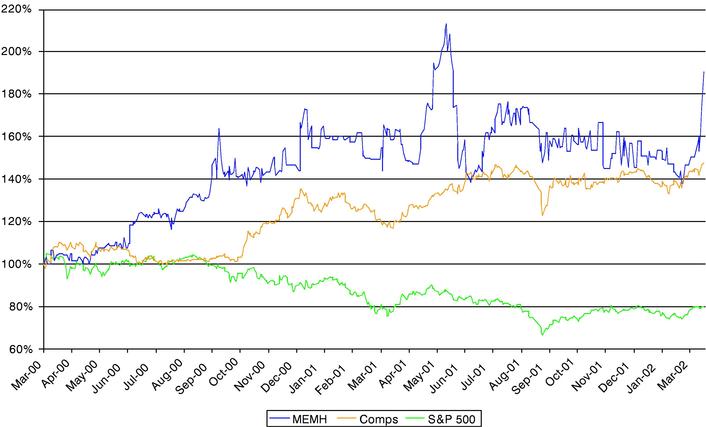
Performance Comparison
Stock Performace
March 20, 2000—March 18, 2002
15
| | | | | | Equity Value to: | Transaction Value to: | |||||||||||||
|---|---|---|---|---|---|---|---|---|---|---|---|---|---|---|---|---|---|---|---|
| | | | | | | | GAAP Reported Common Equity | | |||||||||||
| Date Announced | Date Effective | Buyer/Seller | Equity Value ($ in mils) | Debt Assumed ($ in mils) | GAAP Operating Income | STAT Net Income | STAT Surplus | Net Premium Written | |||||||||||
| 7/1/93 | 8/31/93 | St. Paul Companies/Economy Fire & Casualty Company | 420.0 | 0.0 | NA | 18.7 | 1.38 | 1.79 | 1.0 | ||||||||||
| 11/19/93 | 12/30/93 | GRE Insurance Group/American Ambassador | 100.0 | 0.0 | NA | 13.1 | NA | 1.44 | 1.0 | ||||||||||
| NA | 12/31/93 | Anthem P&C Holdings, Inc/Federal Kemper Insurance Co | 100.0 | 0.0 | NA | 20.4 | NA | 1.60 | 0.8 | ||||||||||
| 2/9/95 | 5/22/95 | USF&G Corporation/Victoria Financial Corporation | 59.0 | 0.0 | 30.6 | 22.0 | 2.17 | 2.52 | 1.2 | ||||||||||
| 4/27/95 | 7/18/95 | Guaranty National Corp./Viking Insurance Company of Wisconsin (Xerox) | 102.7 | 0.0 | NA | 6.5 | NA | 1.18 | 0.7 | ||||||||||
| NA | 8/31/95 | The Commerce Group, Inc./Western Pioneer Insurance Company | 12.0 | 0.0 | NA | 20.0 | NA | 1.53 | 0.5 | ||||||||||
| 8/12/95 | 10/3/95 | Trinity Universal Insurance Company (Unitrin)/Milwaukee Insurance Group, Inc. | 94.2 | 0.0 | 20.8 | NM | 1.17 | 1.86 | 0.8 | ||||||||||
| 8/25/95 | 1/2/96 | Berkshire Hathaway Inc./Geico | 4,727.0 | 0.0 | 20.5 | 17.9 | 2.72 | 4.11 | 1.7 | ||||||||||
| 2/1/96 | 4/30/96 | GCS Management, Inc. (Goran Capital)/Superior Insurance Company (Fortis, Inc.) | 66.4 | 0.0 | 23.2 | 11.8 | 1.05 | 1.35 | 0.7 | ||||||||||
| 2/8/96 | 7/31/96 | Meridian Insurance Group, Inc./Citizens Security Group, Inc. | 25.0 | 0.0 | NM | 20.6 | 2.08 | 1.87 | 0.8 | ||||||||||
| 11/5/96 | 1/1/97 | Unitrin, Inc./Union Automobile Indemnity Company | 32.0 | 0.0 | NA | 22.7 | NA | 1.66 | 0.9 | ||||||||||
16
| 11/6/96 | 3/7/97 | Progressive Corporation/Midland Financial Group, Inc. | 50.1 | 20.0 | NM | NM | 1.07 | 0.89 | 0.4 | ||||||||||
| 4/24/97 | 6/30/97 | Vesta Insurance/Anthem Casualty and Shelby Insurance | 238.8 | 0.0 | NM | 19.6 | 2.08 | 1.60 | 0.9 | ||||||||||
| 6/9/97 | 10/1/97 | Safeco Corporation/American States Financial Corporation | 2,804.8 | 300.0 | 16.5 | 15.7 | 1.98 | 2.57 | 1.9 | ||||||||||
| 8/28/97 | 10/2/97 | Harleysville Group/Minnesota Fire & Casualty Insurance Company | 35.0 | 0.0 | NA | NM | NA | 1.71 | 0.9 | ||||||||||
| 6/23/97 | 10/17/97 | General Motors Acceptance Corp./Integon Corp. | 518.8 | 250.0 | NM | NM | 3.00 | 2.11 | 1.0 | ||||||||||
| 6/30/96 | 11/4/97 | GE Capital Corp./Colonial Penn P&C Group Inc. (Leucadia National Corp.) | 1,018.1 | 0.0 | 22.2 | 19.8 | 2.62 | 2.99 | 2.0 | ||||||||||
| 9/18/97 | 12/16/97 | Orion Capital Corp./Guaranty National Corp. | 541.4 | 101.1 | 17.1 | 18.2 | 1.94 | 2.13 | 1.2 | ||||||||||
| 10/20/97 | 12/18/97 | Guaranty National Corp./Unisun Insurance (Amerisure Companies) | 26.0 | 0.0 | NA | 9.6 | NA | 1.37 | 1.2 | ||||||||||
| 8/8/97 | 12/23/97 | USF&G Corp. (Fidelity and Guaranty Co.)/Titan Holdings | 231.2 | 50.0 | 15.9 | 16.8 | 1.90 | 2.88 | 1.4 | ||||||||||
| 10/20/97 | 12/31/97 | General Accident Plc/Canadian General Insurance | 433.2 | 99.6 | NA | NA | 2.43 | NA | 1.3 | ||||||||||
| 1/27/98 | 04/10/98 | Allstate Corporation/Pembridge Inc. | 266.3 | 20.5 | 38.4 | NA | 2.89 | NA | 1.5 | ||||||||||
| 11/24/97 | 04/30/98 | Orion Capital Corp./Strickland Insurance Group, Inc. | 40.5 | 9.4 | NA | 11.5 | NA | 2.70 | 1.1 | ||||||||||
| 10/16/97 | 2/12/98 | Hartford Financial Services Group/Omni Insurance Group | 184.7 | 0.0 | 34.8 | NM | 3.36 | 5.02 | 1.4 |
17
| 5/18/98 | 11/12/98 | Nationwide Mutual Insurance Company/Allied Group, Inc. | 1,521.8 | 127.7 | 26.0 | 25.2 | 3.77 | 4.05 | 2.8 | ||||||||||
| 11/03/98 | 1/29/99 | Commerce Group Inc./Automobile Club Insurance Co. from American Automobile Association | 78.5 | 0.0 | NA | 9.1 | NA | 0.96 | 0.8 | ||||||||||
| 1/11/99 | 4/8/99 | American Finacial Group, Inc./Worldwide Insurance Co. (Aegon N.V.) | 160.0 | 0.0 | NA | 13.0 | 1.17 | 1.89 | 1.3 | ||||||||||
| 5/11/99 | 9/1/99 | Millers American Group Inc./Phoenix Indemnity Insurance Co. Acceptance Insurance Cos. | 25.0 | 0.0 | NA | 28.2 | NA | 1.65 | 1.8 | ||||||||||
| 3/17/99 | 9/24/99 | Motor Club of America/North East Insurance Co. | 10.5 | 0.0 | NM | NM | 1.11 | 1.77 | 0.8 | ||||||||||
| 10/25/00 | 6/1/01 | State Automobile Mutual Insurance Company/Meridian Insurance Company | 235.1 | 7.0 | NM | 35.8 | 1.79 | 1.73 | 1.1 | ||||||||||
| 1/4/00 | 5/1/00 | Prudential Insurance Company of America/St. Paul Companies | 200.0 | 0.0 | NA | NA | 0.87 | NA | NA | ||||||||||
| 10/31/00 | 4/10/01 | American National Insurance/ Farm Family Holdings Inc. | 278.9 | 0.0 | 8.9 | 12.6 | 1.30 | 1.15 | NA | ||||||||||
| 2/27/02 | 4/5/02 | Kingsway Finl Services Inc./ American Country Holdings Inc. | 24.0 | 10.8 | NM | NM | 0.73 | 0.94 | 0.5 | ||||||||||
| Average | 22.9 | x | 17.8 | x | 1.94 | x | 2.03 | x | 1.1 | x | |||||||||
| Median | 21.5 | 18.2 | 1.94 | 1.75 | 1.0 | ||||||||||||||
| High | 38.4 | 35.8 | 3.77 | 5.02 | 2.8 | ||||||||||||||
| Low | 8.9 | 6.5 | 0.73 | 0.89 | 0.4 | ||||||||||||||
| Deal Multiples | 13.7 | 20.9 | 1.19 | 2.42 | 1.3 | ||||||||||||||
Source: SNL Database, SEC Filings, Press Releases
18
Minority Buy-out Acquisition Premiums
- •
- Raymond James analyzed 19 merger and acquisition transactions with a deal value in excess of $10 million, from March 2001 through February 2002, in which a majority owner purchased the remaining outstanding shares belonging to the minority shareholders.
- •
- The acquisition premium is calculated based on the announced purchase price compared to the seller's average closing stock price over the 20 trading-days prior to announcement. The results are shown below.
| Announce Date | Buyer | Seller | Acquisition Premium | Majority Ownership Before Acquisition | |||||
|---|---|---|---|---|---|---|---|---|---|
| 05/14/01 | Seneca Investments LLC | Agency.com Inc | 69.4 | % | 65.7 | % | |||
| 05/23/01 | Electronic Data Systems Corp | Unigraphics Solutions Inc | 71.8 | % | 86.0 | % | |||
| 06/04/01 | Liberty Mutual Insurance | Liberty Financial Cos Inc | (0.6 | )% | 70.5 | % | |||
| 08/21/01 | Thermo Electron Corp | Spectra-Physics Inc | (4.3 | )% | 80.0 | % | |||
| 08/22/01 | Berkshire Hathaway Inc | Homeservices.com Inc | 38.8 | % | 83.5 | % | |||
| 09/13/01 | MRV Communications Inc | Luminent Inc | (25.1 | )% | 92.3 | % | |||
| 10/01/01 | Management Group | NCH Corp | 25.7 | % | 57.0 | % | |||
| 10/05/01 | MCSi Inc | Zengine Inc | 2.2 | % | 58.5 | % | |||
| 10/08/01 | Investor Group | Blimpie International Inc | 85.4 | % | 58.0 | % | |||
| 10/17/01 | Management Group | Market America Inc | 83.7 | % | 77.0 | % | |||
| 10/23/01 | American Realty Investors Inc | Transcontinental Realty Inv | 49.6 | % | 64.5 | % | |||
| 10/23/01 | American Realty Investors Inc | Income OPP Realty Investors | 23.1 | % | 59.9 | % | |||
| 11/07/01 | Aquila Inc | Aquila Inc/Old | (6.3 | )% | 80.0 | % | |||
| 11/16/01 | Private Investor | Ugly Duckling Corp | 50.2 | % | 56.0 | % | |||
| 02/01/02 | American Real Estate Partners LP | Stratosphere Corp | 13.0 | % | 51.0 | % | |||
| 02/04/02 | Ltd Inc/The | Intimate Brands Inc | 20.1 | % | 84.0 | % | |||
| 02/13/02 | Management buyout group | Deltek Systems Inc | 33.0 | % | 56.7 | % | |||
| 02/15/02 | XCEL Energy Inc | NRG Energy Inc | 1.0 | % | 74.0 | % | |||
| 02/19/02 | Sabre Holdings Corp | Travelocity.com | 27.1 | % | 66.1 | % | |||
| High | 85.4 | % | 92.3 | % | |||||
| Median | 25.7 | % | 66.1 | % | |||||
| Average | 29.4 | % | 69.5 | % | |||||
| Low | (25.1 | )% | 51.0 | % | |||||
| Deal Mulitples | 29.1 | %(1) | 83.0 | % |
- (1)
- Based on the average closing price of MEEMIC common stock over the 20 trading-days prior to and including 3/15/02, of $22.46 per share compared to the Merger Consideration of $29.00 per share.
Source: Bloomberg L.P.
19
Overview
- •
- Discounted Cash Flow consists of two parts. The first calculates the present value of a stream of future cash flows by applying a range of discount rates. Raymond James determined this range of rates by analyzing the WACC for MEEMIC and its comparable companies. Based on adjusted asset Betas for the comparable companies ranging from 0.46 to 1.04, a risk-free rate of 4.7% and an expected risk premium of 11.1%, Raymond James judgmentally determined the range of applicable discount rates to fall between 12% and 16%.
| | Equity Beta Range(1) | ||||||||
|---|---|---|---|---|---|---|---|---|---|
| | 0.46 | 0.68 | 1.04 | ||||||
| Cost of Debt (Kd) (Marginal cost of debt * (1- tax rate)) | |||||||||
| Marginal Cost of Debt(2) | 8.5 | % | 8.5 | % | 8.5 | % | |||
| Tax Rate | 40.0 | % | 40.0 | % | 40.0 | % | |||
| Kd | 5.1 | % | 5.1 | % | 5.1 | % | |||
Debt/Market Capitalization(3) | 0.0 | % | 0.0 | % | 0.0 | % | |||
| Weighted Cost of Debt | 0.0 | % | 0.0 | % | 0.0 | % | |||
Cost of Equity (Ke) (Risk Free Rate + (Beta * Expected Risk Premium)) | |||||||||
| Risk Free Rate(4) | 4.7 | % | 4.7 | % | 4.7 | % | |||
| Beta | 0.46 | 0.68 | 1.04 | ||||||
| Expected Risk Premium(5) | 11.1 | % | 11.1 | % | 11.1 | % | |||
| Ke | 9.8 | % | 12.2 | % | 16.2 | % | |||
| 1—Debt/Market Capitalization | 100.0 | % | 100.0 | % | 100.0 | % | |||
| Weighted Cost of Equity | 9.8 | % | 12.2 | % | 16.2 | % | |||
| Weighted Average Cost of Capital | 9.8 | % | 12.2 | % | 16.2 | % | |||
- (1)
- Asset Betas derived from Bloomberg. Range is low, median and high for comp group.
- (2)
- Cost of Debt assumes interest of 8.5% based on estimated long-term debt costs.
- (3)
- MEEMIC Debt/Market Capitalization.
- (4)
- Based on five-year Treasury Bond yield as of April 2002.
- (5)
- Based on Ibbotson Associates study of micro-capitalization (below $269 million) equity returns over the period from 1926 to 2001.
20
- •
- The second part calculates the present value of a terminal value at the end of the fifth year by applying a multiple to net income, and discounting back at the same discount rates.
- •
- MEEMIC's cash flow is calculated using dividends available at the end of each year after subtracting the additional surplus required to keep a premiums written to surplus ratio of 2X. MEIA's cash flow is equated to net income.
- •
- The DCF value of cash and investments in the Holding company is assumed to be equal to the current value of the cash.
Per Share value of MEEMIC (Insurance Company)
| | Multiple of 2006 Net Income | ||||||||||||||
|---|---|---|---|---|---|---|---|---|---|---|---|---|---|---|---|
| Discount Rate | |||||||||||||||
| 11.0x | 12.0x | 13.0x | 14.0x | 15.0x | |||||||||||
| 16% | $ | 17.26 | $ | 18.35 | $ | 19.44 | $ | 20.52 | $ | 21.61 | |||||
| 15% | $ | 17.91 | $ | 19.04 | $ | 20.18 | $ | 21.32 | $ | 22.45 | |||||
| 14% | $ | 18.59 | $ | 19.78 | $ | 20.96 | $ | 22.15 | $ | 23.34 | |||||
| 13% | $ | 19.31 | $ | 20.55 | $ | 21.79 | $ | 23.03 | $ | 24.27 | |||||
| 12% | $ | 20.06 | $ | 21.36 | $ | 22.65 | $ | 23.95 | $ | 25.25 | |||||
Per Share value of MEIA
| | Multiple of 2006 Net Income | ||||||||||||||
|---|---|---|---|---|---|---|---|---|---|---|---|---|---|---|---|
| Discount Rate | |||||||||||||||
| 11.0x | 12.0x | 13.0x | 14.0x | 15.0x | |||||||||||
| 16% | $ | 6.27 | $ | 6.68 | $ | 7.08 | $ | 7.49 | $ | 7.90 | |||||
| 15% | $ | 6.51 | $ | 6.94 | $ | 7.36 | $ | 7.79 | $ | 8.21 | |||||
| 14% | $ | 6.77 | $ | 7.21 | $ | 7.66 | $ | 8.10 | $ | 8.54 | |||||
| 13% | $ | 7.04 | $ | 7.50 | $ | 7.96 | $ | 8.43 | $ | 8.89 | |||||
| 12% | $ | 7.32 | $ | 7.80 | $ | 8.29 | $ | 8.77 | $ | 9.26 | |||||
MEEMIC Consolidated
| | High | Median | Low | |||||||
|---|---|---|---|---|---|---|---|---|---|---|
| MEEMIC | $ | 25.25 | $ | 20.96 | $ | 17.26 | ||||
| MEIA | 9.26 | 7.66 | 6.27 | |||||||
| Cash in Holding Company | 4.89 | 4.89 | 4.89 | |||||||
| Total | $ | 39.40 | $ | 33.51 | $ | 28.42 | ||||
21
Summary of Management's Projections—GAAP
| | Year Ended December 31, | |||||||||||||||
|---|---|---|---|---|---|---|---|---|---|---|---|---|---|---|---|---|
| | 2002 | 2003 | 2004 | 2005 | 2006 | |||||||||||
| Net Premiums Earned | $ | 145,369 | $ | 155,172 | $ | 164,800 | $ | 172,229 | $ | 181,388 | ||||||
Total Revenues | $ | 160,859 | $ | 172,655 | $ | 184,397 | $ | 193,827 | $ | 204,959 | ||||||
Net Income(1) | $ | 17,468 | $ | 19,112 | $ | 20,926 | $ | 22,264 | $ | 23,789 | ||||||
Shareholders' Equity | $ | 176,364 | $ | 195,658 | $ | 221,550 | $ | 243,381 | $ | 269,903 | ||||||
| Net Loss & LAE Ratio | 69.5 | % | 69.5 | % | 69.6 | % | 69.8 | % | 69.8 | % | ||||||
| Expense Ratio | 25.5 | % | 25.5 | % | 25.6 | % | 26.2 | % | 26.2 | % | ||||||
| Combined Ratio | 95.0 | % | 95.0 | % | 95.2 | % | 96.0 | % | 96.0 | % | ||||||
Investment Yield | 6.0 | % | 6.0 | % | 6.0 | % | 6.0 | % | 6.0 | % | ||||||
- (1)
- Assumes no amortization of MEIA intangible except for a $75,000 expense in 2002 for the remainder of a $500,000 intangible with a discrete life.
22
Table of Contents
Overview
Valuation
COMPARABLE COMPANY ANALYSIS
M & A TRANSACTIONS ANALYSIS
DISCOUNTED CASH FLOW ANALYSIS