Exhibit(c)(4)
Strictly Confidential
Presentation to the Special Committee of:

September 20, 2001
LEHMAN BROTHERS
Table of Contents
| I | Executive Summary | |||
| II | History of Capital Raising and Examining Strategic Alternatives | |||
| III | Overview of HSA / Charter Relationship | |||
| IV | Valuation of Charter-related Assets | |||
| V | Conclusions | |||
| LEHMAN BROTHERS |  |
Executive Summary
| • | High Speed Access Corp. (“HSA” or the “Company”) has requested that Lehman Brothers render to the Special Committee of its Board of Directors (the “Special Committee”) an opinion (the “Opinion”) as to the fairness from a financial point of view to HSA of the consideration to be received in the proposed sale of certain assets of Company’s cable modem business to Charter Communications, Inc. (“Charter”) (the “Proposed Transaction”) | |
| • | Under the terms of the Proposed Transaction, HSA will sell certain assets of Company’s cable modem business to Charter for consideration of (i) $81.1 million in cash as adjusted by the Adjustment Items (as defined in the Agreement) (ii) the cancellation of all of the 75,000 shares of Series D Senior Convertible Preferred Stock ($75.0 million par value) and (iii) the cancellation of the Charter warrants | |
| • | In arriving at our Opinion, we have assumed and relied upon the accuracy and completeness of the financial and other information supplied by the managements of the Company and Charter without assuming any responsibility for independent verification of such information | |
| • | No opinion is expressed by Lehman Brothers as to HSA’s underlying decision to proceed with or effect the Proposed Transaction |
| LEHMAN BROTHERS |  |
1
Executive Summary
In arriving at our Opinion, we have conducted a number of reviews and analyses, including:
| • | Participation with the Special Committee in the exploration of strategic alternatives for the Company (the “Strategic Alternatives Process”) |
| — | Assist with soliciting indications of interest from potential strategic partners regarding a potential business combination | ||
| — | Assist with the analysis of the relative merits of the Charter proposal |
| • | Participation in due diligence in preparation for the Strategic Alternatives Process |
| — | Review of HSA’s operations with the Company’s senior officers | ||
| — | Analysis of business and financial information made available by the Company during due diligence |
| • | Analyses |
| — | Review of recent past and present efforts to raise capital and examine of strategic alternatives for the Company | ||
| — | Review of Charter’s operational and financial relationships with the Company | ||
| — | Analysis of selected publicly traded companies, as they relate to the Charter-related business | ||
| — | Analysis of selected comparable transactions, as they relate to the Charter-related business | ||
| — | Analysis of discounted cash flow values under different scenarios for the Charter-related business | ||
| — | Ability of the Company to meet its future capital requirements | ||
| — | Ability of the Company to satisfy its obligations to its debtholders and preferred stockholders | ||
| — | Assist with the evaluation of potential benefits and risks of the Proposed Transaction |
| • | Internal reviews |
| — | Review and approval of the Opinion and supporting analysis by Lehman Brothers’ Fairness Opinion Committee |
| • | Other |
| — | Draft asset purchase agreement dated September 8, 2001 |
| LEHMAN BROTHERS |  |
2
History of Capital Raising and Examining Strategic Alternatives
Historical Share Price / Volume Summary
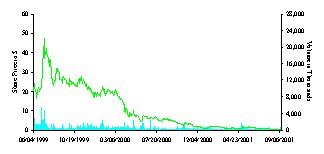
| • | On June 4, 1999, Lehman Brothers served as Lead Manager in the Company’s IPO which raised $198.0 million (including the overallotment option) through the sale of 15 million shares at $13.00 | |
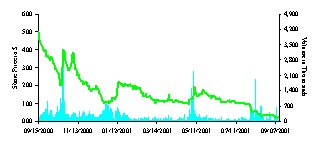
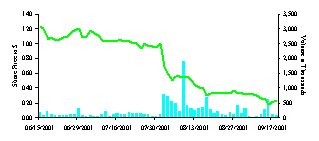
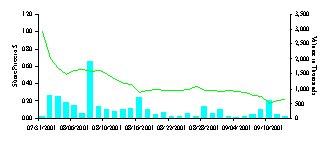
| • | Since its IPO, HSA’s share price has hit a high of $47.69 (July 9, 1999) and is currently trading at $0.22 per share, near its low of $0.18 per share (closing price as of September 10, 2001) |
| SINCE IPO (a) | PAST ONE YEAR | |
 |  | |
| PAST THREE MONTHS | SINCE ANNOUNCEMENT OF CHARTER’S OFFER (b) | |
 |  |
| (a) | IPO 6/4/99. | |
| (b) | Since 7/31/01. |
| LEHMAN BROTHERS |  |
3
History of Capital Raising and Examining Strategic Alternatives
Summary of Past Initiatives
Summary of Initiatives
| Strategic Initiatives | • | Over the last two years, Lehman Brothers has assisted the Company in examining approximately twelve different opportunities relating to either a merger, an acquisition or an investment by strategic investors in order to enhance Company’s business or gain scale | ||||
| • | None of these strategic initiatives were successful | |||||
| • | Lehman Brothers acted as Book-running, Co-Lead Placement Agent in HSA’s $200.0 million private into public equity placement of preferred stock (the “PIPE Transaction”) | |||||
| • | Throughout the PIPE Transaction, Lehman Brothers contacted approximately 200 potential financial investors and approximately 14 potential strategic investors | |||||
| — | Lehman arranged meetings between the Company and 11 potential investors | |||||
| Financing Initiatives | — | No follow-up meetings were requested | ||||
| — | No indications of interest were received from any of the potential financial investors approached | |||||
| • | The Company received a total investment of $75.0 million from Vulcan and Charter in exchange for 75,000 shares of Series D Convertible Preferred Stock (“Series D”) | |||||
| • | Despite an approximately four month-long effort, the Company was unsuccessful in raising the balance of $125.0 million sought through the PIPE Transaction | |||||
| LEHMAN BROTHERS |  |
4
History of Capital Raising and Examining Strategic Alternatives
Summary of the Strategic Alternatives Process
| • | On May 30, 2001, Lehman Brothers was engaged to advise the Special Committee of HSA in the Strategic Alternatives Process | |
| • | Under the direction of the Special Committee, Lehman Brothers contacted over 21 of the most likely potential strategic investors as determined by the Special Committee and Lehman Brothers | |
| • | Lehman Brothers also contacted a number of the financial investors who were approached during the PIPE Transaction | |
| • | None of these financial investors expressed any interest in making an investment in the Company | |
| • | Out of all of the potential strategic investors approached, Charter was the only company to conduct due diligence on HSA and was the only company to make a verbal or written offer around a potential transaction with HSA | |
| • | In addition, since Charter publicly announced its proposal on July 31, 2001, neither the Company, the Special Committee nor Lehman Brothers has received an indication of interest relating to a sale of the Company or all or substantially all of its assets from a party other than Charter |
| LEHMAN BROTHERS |  |
5
History of Capital Raising and Examining Strategic Alternatives
Summary of the Strategic Alternatives Process (cont’d)
| • | The table below is a summary of results of the Strategic Alternatives Process | |
| • | Ultimately, Charter was the only company to conduct due diligence on HSA and was the only company to make a verbal or written offer around a potential transaction with HSA |
| Strategic Transaction Process Overview | ||||
| Step | Total | |||
| Companies Considered | 37 | |||
| Companies Contacted | 21 | |||
| Teaser Requested | 9 | |||
| NDA Executed | 5 | |||
| Descriptive Memo & Financial Model Requested | 4 | |||
| Follow-up Discussions & Due Diligence | 1 (Charter) | |||
| Verbal Indication of Interest | 1 (Charter) | |||
| Written Indication of Interest | 1 (Charter) | |||
| LEHMAN BROTHERS |  |
6
Overview of HSA / Charter Relationship
Certain provisional and contractual arrangements with Charter, all of which have been disclosed in public filings, have directly affected the Company’s strategic and financial decision-making ability including (i) the voting rights of Series D Convertible Preferred Stockholders and (ii) the operational agreement between the Company and Charter
| • | Paul Allen affiliates, Charter and Vulcan, represent the most significant shareholders to the Company |
| — | Combined ownership of 33.5% of basic shares outstanding (July 30, 2001) | ||
| — | Combined ownership of over 49.2% on a fully diluted basis (July 30, 2001) which includes conversion of Charter and Vulcan’s $75.0 million investment in the Company for Series D Convertible Preferred Stock (“Series D”) |
| • | Series D holders have unique rights |
| — | Consent of two-thirds of the Series D holders is required to consummate any significant asset sale or merger | ||
| — | Right to convert Series D shares into HSA common stock and to receive the same consideration received by the common stockholders in the event of a merger |
| • | The 2000 Agreement between HSA and Charter represents a significant portion of the Company’s operations (i.e., subscribers), and Charter has direct influence over the future and the value of this portion of the Company’s operations |
| — | Approximately 87.2% of the Company’s broadband subscribers are Charter subscribers (July 30, 2001) | ||
| — | Charter has the right not to renew the 2000 Agreement when it expires in May 2005 | ||
| — | Charter has the right to terminate the 2000 Agreement as a result of a merger or change of control event |
| LEHMAN BROTHERS |  |
7
Valuation of Charter-related Assets
Terms of the Asset Purchase Agreement
Summary of Terms of the Proposal (Subject to Further Review and Revision)
| The Transaction: | A sale of select cable modem assets of High Speed Access Corp. (“HSA” or the “Company”) to Charter Communications Inc. (“Charter”) | |||||
| Transaction Amount & Type: | (i) $81.1 million in cash as adjusted by the Adjustment Items (as defined in the Agreement) , (ii) the cancellation of 75,000 shares of Series D Preferred Stock ($75.0 million par value) and (iii) the cancellation of the Charter warrants. | |||||
| Economic Terms | • | Holdbacks– At closing, Charter to hold back portion of purchase price | ||||
| — | $750,000 for settlement of working capital balance as it relates to Purchase Price Adjustment below (minimum holdback period = 60 days) | |||||
| — | $4.0 million for use in effectuating settlement of any indemnity claims ( $2.0 million net of any claims will be distributed to the Company after twelve months and any remaining amounts not subject to any claims will be distributed to the Company after 18 months)_; holdback interest bearing | |||||
| • | Purchase Price Adjustment– The cash component of the purchase price shall be reduced by the amount of each of (i) assumed capital lease liabilities, (ii) assumed current liabilities and (iii) penalties relating to the Company’s failure to commence training of customer service representatives , and the cash component of the purchase price shall be increased by the amount of the acquired current assets. | |||||
| • | Management Agreement– In connection with agreeing to enter into a management agreement, Charter has agreed to reimburse HSA for a portion of HSA’s negative cash flow relating to the operation of the acquired businesses in the event that a closing occurs. The amount of reimbursement is currently estimated to be $4.5 million. This reimbursement amount is included in the cash component of the purchase price. Under the management agreement, Charter would have the right to direct various decisions relating to the businesses to be acquired. | |||||
| • | Launch Fees– Any launch fees which Charter has already been paid would be retained by Charter. Other receivables on both sides would be settled by payment at the time of the closing, but the purchase price would be adjusted to the extent of the net cost of settlement. | |||||
| Reps & Warranties | • | Deal with relatively standard reps and warranties. | ||||
| Indemnification | • | Charter will be entitled to eighteen months post closing indemnification for breaches of the majority of the representations and certain covenants intended to be fully performed prior to the closing which Charter will solely secure with a $4.0 million holdback of purchase price. In addition, Charter will be entitled to indemnification for breaches in an amount up to the cash component of the purchase price as follows: (i) 24 months for representations that relate to ERISA environmental, (ii) 90 days after the expiration of the applicable statute of limitations relating to tax and (iii) representations with respect to title will survive indefinitely. | ||||
| Consequential Damages | • | No indemnification for any indirect or consequential damages. | ||||
| Transaction Expenses | • | Fees and Expenses –Charter is not willing to fund any part of HSA’s proxy expenses; HSR filing fee should be shared equally by Charter and HSA. | ||||
| • | Transfer Taxes –Any transfer taxes relating to the assets to be sold to Charter will be paid by Charter. | |||||
| Closing Covenants | • | Charter will require post-closing non-solicitation, confidentiality and cooperation agreements from HSA. | ||||
| Break-up Fee | • | Termination by HSA –Charter should be paid a fee for its out-of-pocket expenses if HSA exercises its fiduciary out to terminate the agreement. In addition, Charter and its advisors should be reimbursed for its out of pocket expenses. | ||||
| • | Termination by Charter –HSA should be reimbursed for its out-of-pocket expenses if Charter fails to perform any of their stated obligations. | |||||
| • | ||||||
| LEHMAN BROTHERS |  |
8
Valuation of Charter-related Assets
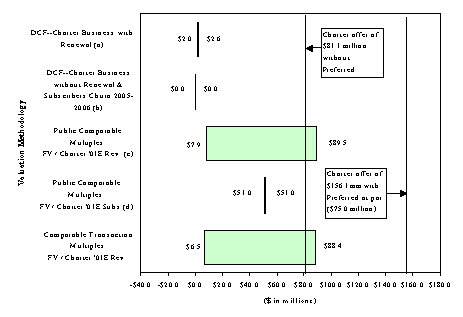
Summary of Valuation Analysis – Charter-related Business Only
| • | The following table is a summary of various valuation methodologies comparing the value of certain Charter assets to be sold to the consideration to be received under two scenarios: |
| (i) | Assuming a purchase price of the select Charter assets of $156.1 million, including the Series D valued at par (i.e., $75.0 million) | ||
| (ii) | Assuming a purchase price of the select Charter assets of $81.1 million and assuming that the Series D has no value representing the scenario in which the Company is liquidated with no proceeds available to pay Series D holders |
Summary of Valuation Analysis – Charter Business Only *
| * | All financial projections per Company estimates. | |
| (a) | Assumes a terminal growth rate of 5.0%-6.0% and WACC of 40.0%. Implied asset value is estimated as of January 1, 2002. | |
| (b) | Assumes no renewal of contract after 2005 and WACC of 40.0%. Asset value shown above to be zero given actual analysis indicates negative asset value. | |
| (c) | Per Company estimates, 2001 revenues for Charter business estimated at $23.3 mm. | |
| (d) | Based off of @Home multiple of $199.8 per subscriber. Charter related business is estimated to have 255,351 subscribers at the end of 2001. |
| LEHMAN BROTHERS |  |
9
Valuation of Charter-related Assets
Discounted Cash Flow Analysis – Assumptions
| • | We considered the value of Charter-related assets under two scenarios: |
| — | Assuming Charter renews the 2000 Agreement in May 2005 and indefinitely thereafter |
| — | Assuming Charter cancels the 2000 Agreement in May 2005 and Charter subscribers churn out of the Company in 2005 and 2006 |
| • | While a discount rate of 20.0% is consistent with Company’s historical discount rate, it is our view that a 20.0% discount rate is not relevant for the following reasons: |
| — | The Company does not currently have sufficient funding to reach cash flow breakeven in its existing businesses |
| — | The Company has been effectively shut out of the capital markets (e.g., failure of the PIPE Transaction) |
| — | The Company has no current prospects for raising the required capital |
| — | Increased perception of risk by investors surrounding broadband service providers |
| • | Therefore, it is our view that a 40.0% discount rate is more appropriate in order to reflect our belief that investors would demand a significantly higher return than 20.0% if the Company attempts to raise additional capital to fund Charter-related business |
| LEHMAN BROTHERS |  |
10
Valuation of Charter-related Assets
Discounted Cash Flow Analysis (cont’d)
| • | Our discounted cash flow analysis based on Company estimates indicates an asset value of approximately $2.0 - $2.6 million assuming the following: |
| — | Charter renews the 2000 Agreement indefinitely |
| — | Perpetuity growth rate range of 5.0% – 6.0% |
| — | WACC = 40.0% based on our estimates of a new investor’s investment return requirements |
CHARTER BUSINESS DCF ANALYSIS — CHARTER RENEWS AGREEMENT
| (Dollars in millions, except per share data) | 2002 | 2003 | 2004 | 2005 | 2006 | |||||||||||||||
EBITDA(a) | ($34.0 | ) | ($12.4 | ) | $ | 1.6 | $ | 21.0 | $ | 39.7 | ||||||||||
Less: Depreciation(a) | ($3.6 | ) | ($5.9 | ) | ($8.0 | ) | ($7.5 | ) | ($8.3 | ) | ||||||||||
EBIT | ($37.6 | ) | ($18.3 | ) | ($6.4 | ) | $ | 13.5 | $ | 31.4 | ||||||||||
Remaining Usable NOLs EOY (b) | ($149.7 | ) | ($168.1 | ) | ($174.4 | ) | ($161.0 | ) | ($129.6 | ) | ||||||||||
Unlevered Taxable Income | $ | 0.0 | $ | 0.0 | $ | 0.0 | $ | 0.0 | $ | 0.0 | ||||||||||
| Less: Unlevered Cash Taxes @ 38.0% | $ | 0.0 | $ | 0.0 | $ | 0.0 | $ | 0.0 | $ | 0.0 | ||||||||||
| After-tax EBIT | ($37.6 | ) | ($18.3 | ) | ($6.4 | ) | $ | 13.5 | $ | 31.4 | ||||||||||
| Plus: Depreciation & Amortization | $ | 3.6 | $ | 5.9 | $ | 8.0 | $ | 7.5 | $ | 8.3 | ||||||||||
Less: CapEx (a) | ($8.6 | ) | ($5.6 | ) | ($8.1 | ) | ($9.1 | ) | ($10.1 | ) | ||||||||||
Less: Change in NWC (a) | ($1.2 | ) | ($5.2 | ) | ($1.1 | ) | ($1.0 | ) | ($0.2 | ) | ||||||||||
Unlevered After-Tax Free Cash Flow | ($43.7 | ) | ($23.1 | ) | ($7.5 | ) | $ | 10.9 | $ | 29.4 | ||||||||||
| Terminal Value @ WACC 40.0% and Growth Rate of 5.0% | — | — | — | — | — | |||||||||||||||
[Additional columns below]
[Continued from above table, first column(s) repeated]
| (Dollars in millions, except per share data) | 2007 | 2008 | 2009 | 2010 | ||||||||||||
EBITDA(a) | $ | 70.8 | $ | 103.7 | $ | 140.3 | $ | 176.5 | ||||||||
Less: Depreciation(a) | ($9.6 | ) | ($10.6 | ) | ($11.6 | ) | ($12.6 | ) | ||||||||
EBIT | $ | 61.2 | $ | 93.1 | $ | 128.7 | $ | 164.0 | ||||||||
Remaining Usable NOLs EOY (b) | ($68.3 | ) | $ | 0.0 | $ | 0.0 | $ | 0.0 | ||||||||
Unlevered Taxable Income | $ | 0.0 | $ | 24.8 | $ | 128.7 | $ | 164.0 | ||||||||
| Less: Unlevered Cash Taxes @ 38.0% | $ | 0.0 | ($9.4 | ) | ($48.9 | ) | ($62.3 | ) | ||||||||
| After-tax EBIT | $ | 61.2 | $ | 83.7 | $ | 79.8 | $ | 101.7 | ||||||||
| Plus: Depreciation & Amortization | $ | 9.6 | $ | 10.6 | $ | 11.6 | $ | 12.6 | ||||||||
Less: CapEx (a) | ($11.1 | ) | ($12.1 | ) | ($13.1 | ) | ($14.1 | ) | ||||||||
Less: Change in NWC (a) | ($2.5 | ) | ($1.9 | ) | ($2.5 | ) | ($1.2 | ) | ||||||||
Unlevered After-Tax Free Cash Flow | $ | 57.2 | $ | 80.3 | $ | 75.9 | $ | 98.9 | ||||||||
| Terminal Value @ WACC 40.0% and Growth Rate of 5.0% | — | — | — | $ | 296.7 | |||||||||||
| (a) | Per Company estimates. | |
| (b) | Total NOLs are estimated by adding NOLs up to the end of 2000 and total EBITDA estimated loss in 2001 based on Company pacing report dated 8/2/01. Charter related NOLs are 85% of Cable Modem NOLs which are allocated based on 2001 revenue share of Cable Modem business. |
| LEHMAN BROTHERS |  |
11
Valuation of Charter-related Assets
Discounted Cash Flow Analysis (cont’d)
| • | Our discounted cash flow analysis based on Company estimates indicates that the Company’s Charter-related assets would have no value under the following assumptions: |
| — | Charter cancels the 2000 Agreement |
| — | Charter subscribers churn out of the Company in 2005 and 2006 |
| — | WACC = 40.0% based on our estimates of a new investor’s investment return requirements |
CHARTER BUSINESS DCF ANALYSIS — CHARTER CANCELS AGREEMENT (c)
| (Dollars in millions, except per share data) | 2002 | 2003 | 2004 | 2005 | ||||||||||||
EBITDA(a) | ($34.7 | ) | ($19.0 | ) | ($8.7 | ) | ($7.7 | ) | ||||||||
Less: Depreciation (a) | ($3.6 | ) | ($6.6 | ) | ($9.5 | ) | ($7.7 | ) | ||||||||
EBIT | ($38.3 | ) | ($25.6 | ) | ($18.2 | ) | ($15.3 | ) | ||||||||
Remaining Usable NOLs EOY (b) | ($150.4 | ) | ($176.0 | ) | ($194.2 | ) | ($209.5 | ) | ||||||||
Unlevered Taxable Income | — | — | — | — | ||||||||||||
| Less: Unlevered Cash Taxes @ 38.0% | — | — | — | — | ||||||||||||
| After-tax EBIT | ($38.3 | ) | ($25.6 | ) | ($18.2 | ) | ($15.3 | ) | ||||||||
| Plus: Depreciation & Amortization | $ | 3.6 | $ | 6.6 | $ | 9.5 | $ | 7.7 | ||||||||
Less: CapEx (a) | ($9.0 | ) | ($8.7 | ) | ($9.9 | ) | (0.0 | ) | ||||||||
Less: Change in NWC (a) | ($1.0 | ) | ($4.6 | ) | ($1.2 | ) | $ | 0.5 | ||||||||
Unlevered After-Tax Free Cash Flow | ($44.6 | ) | ($32.2 | ) | ($19.8 | ) | ($7.2 | ) | ||||||||
| Terminal Value @ WACC of 40.0% and Growth Rate of 0.0% | — | — | — | — | ||||||||||||
[Additional columns below]
[Continued from above table, first column(s) repeated]
| (Dollars in millions, except per share data) | 2006 | 2007 | 2008 | 2009 | 2010 | |||||||||||||||
EBITDA (a) | ($26.2 | ) | — | — | — | — | ||||||||||||||
Less: Depreciation (a) | ($6.5 | ) | — | — | — | — | ||||||||||||||
EBIT | ($32.7 | ) | — | — | — | — | ||||||||||||||
Remaining Usable NOLs EOY (b) | ($242.2 | ) | — | — | — | — | ||||||||||||||
Unlevered Taxable Income | — | — | — | — | — | |||||||||||||||
| Less: Unlevered Cash Taxes @ 38.0% | — | — | — | — | — | |||||||||||||||
| After-tax EBIT | ($32.7 | ) | — | — | — | — | ||||||||||||||
| Plus: Depreciation & Amortization | $ | 6.5 | — | — | — | — | ||||||||||||||
Less: CapEx(a) | (0.0 | ) | — | — | — | — | ||||||||||||||
Less: Change in NWC (a) | $ | 1.4 | — | — | — | — | ||||||||||||||
Unlevered After-Tax Free Cash Flow | ($24.9 | ) | — | — | — | — | ||||||||||||||
| Terminal Value @ WACC of 40.0% and Growth Rate of 0.0% | — | — | — | — | — | |||||||||||||||
| (a) | Per Company estimates. Lehman Brothers has not performed due diligence on these estimates and makes no representations as to their accuracy. Assumes additional depreciation after 2006 will be written down EOY 2006. | |
| (b) | Total NOLs are estimated by adding NOLs up to the end of 2000 and total EBITDA estimated loss in 2001 based on Company pacing report dated 8/2/01. Charter related NOLs are 85% of Cable Modem NOLs which are allocated based on 2001 revenue share of Cable Modem business. NOL benefits are discounted using WACC if there are NOLs left EOY 2006. | |
| (c) | Assumes no renewal of Charter agreement and subscribers churn out the Company in 2005 and 2006. |
| LEHMAN BROTHERS |  |
12
Valuation of Charter-related Assets
Comparable Public Company Analysis
| • | Public comparable OSP / Cable companies are trading at a mean of 2.1x and 1.4x 2001E and 2002E revenues, respectively |
COMPARABLE COMPANIES TRADING ANALYSIS
($ in millions, except per share and subscriber/line data)
| Price | % of | FD Shares | Equity | ||||||||||||||||||
| as of | 52-Week | Outstanding(a) | Market | Net | |||||||||||||||||
| Company | 09/18/2001 | High | (millions) | Value | Debt | ||||||||||||||||
Business ISPs: | |||||||||||||||||||||
AppliedTheory Corp. | $ | 0.28 | 3.2 | % | 28.4 | $ | 7.9 | $ | 37.8 | ||||||||||||
Digex, Incorporated | $ | 5.03 | 7.7 | % | 64.1 | $ | 322.6 | $ | 134.2 | ||||||||||||
Exodus Communications, Inc. | $ | 0.58 | 0.9 | % | 555.9 | $ | 322.4 | $ | 2,825.6 | ||||||||||||
Globix Corp. | $ | 0.78 | 2.8 | % | 42.0 | $ | 32.8 | $ | 517.5 | ||||||||||||
InterNAP Network Services Corp. | $ | 1.32 | 4.0 | % | 150.6 | $ | 198.7 | $ | 0.2 | ||||||||||||
DSL Providers: | |||||||||||||||||||||
DSL.net | $ | 0.21 | 4.2 | % | 64.7 | $ | 13.6 | ($18.7 | ) | ||||||||||||
Network Access Solutions | $ | 0.20 | 3.1 | % | 53.6 | $ | 10.7 | $ | 90.5 | ||||||||||||
Inbuilding Access: | |||||||||||||||||||||
Allied Riser Communications(c) | $ | 0.14 | 1.9 | % | 62.0 | $ | 8.7 | $ | 117.2 | ||||||||||||
Ardent Communications | $ | 0.16 | 1.9 | % | 23.7 | $ | 3.8 | $ | 230.1 | ||||||||||||
Cypress Communications | $ | 1.90 | 3.5 | % | 4.9 | $ | 9.3 | ($46.7 | ) | ||||||||||||
OSPs / Cable: | |||||||||||||||||||||
@Home(d)(e) | $ | 0.38 | 2.1 | % | 410.6 | $ | 156.0 | $ | 1,137.6 | ||||||||||||
[Additional columns below]
[Continued from above table, first column(s) repeated]
| Firm Value as a Multiple of: | |||||||||||||||||||||
| Firm | Run Rate | 2001E | 2002E | 2001E | |||||||||||||||||
| Company | Value | Revenues | Revenues | Revenues | HSD Subs./Lines(b) | ||||||||||||||||
Business ISPs: | |||||||||||||||||||||
AppliedTheory Corp. | $ | 45.7 | 0.6x | 0.3x | 0.3x | ||||||||||||||||
Digex, Incorporated | $ | 456.8 | 2.1x | 1.9x | 1.4x | ||||||||||||||||
Exodus Communications, Inc. | $ | 3,148.0 | 2.5x | 2.4x | 2.0x | ||||||||||||||||
Globix Corp. | $ | 550.3 | 5.3x | 3.8x | 2.6x | ||||||||||||||||
InterNAP Network Services Corp. | $ | 198.9 | 1.7x | 1.6x | 0.9x | ||||||||||||||||
| Mean: | 2.4X | 2.0X | 1.4X | ||||||||||||||||||
| Medium: | 2.1X | 1.9X | 1.4X | ||||||||||||||||||
DSL Providers: | |||||||||||||||||||||
DSL.net | NM | NM | NM | NM | |||||||||||||||||
Network Access Solutions | $ | 101.2 | 3.2x | 1.8x | 0.6x | ||||||||||||||||
| Mean: | 3.2x | 1.8x | 0.6x | ||||||||||||||||||
| Medium: | 3.2x | 1.8x | 0.6x | ||||||||||||||||||
Inbuilding Access: | |||||||||||||||||||||
Allied Riser Communications(c) | $ | 125.8 | 3.7x | 3.0x | 1.7x | ||||||||||||||||
Ardent Communications | $ | 233.8 | 5.3x | 2.2x | 1.6x | ||||||||||||||||
Cypress Communications | NM | NM | NM | NM | |||||||||||||||||
| Mean: | 4.5x | 2.6x | 1.7x | ||||||||||||||||||
| Medium: | 4.5x | 2.6x | 1.7x | ||||||||||||||||||
OSPs / Cable: | |||||||||||||||||||||
@Home(d)(e) | $ | 1,017.2 | 2.3x | 2.1x | NA | $ | 199.8 | ||||||||||||||
| Mean: | 2.3x | 2.1x | NA | $ | 199.8 | ||||||||||||||||
| Medium: | 2.4x | 2.0x | NA | $ | 199.8 | ||||||||||||||||
| Overall Mean and Median | |||||||||||||||||||||
| Mean: | 3.0x | 2.1x | 1.4x | ||||||||||||||||||
| Medium: | 2.5x | 2.1x | 1.5x | ||||||||||||||||||
| (a) | Includes all in-the-money options and warrants. | |
| (b) | HSA HSD subscribers includes total cable and DSL subscribers. DSL providers are valued on basis of access lines rather than subscribers. @Home subscribers include @Home and @Work. | |
| (c) | In July 2001, Company changed name to Ardent Communications from CAIS Internet. | |
| (d) | Firm value for @Home net of Excite, which is assumed to have a Firm value of $1.3 billion. Estimates @Home firm value based on @Home’s 2001E revenue share of 78.6% per Jefferies research dated 6/11/01. Net debt and equity value shown above is for Excite@Home. | |
| (e) | Run rate for @Home is based on Q2A 2001 revenues of consumer access, commercial services and international. |
| LEHMAN BROTHERS |  |
13
Valuation of Charter-related Assets
Private Transaction Analysis
| • | Recent transactions are representative of the declining valuations surrounding broadband and telecommunications companies |
Comparable Companies Transaction Analysis (a)
($ in millions)
| Enterprise Value as a Multiple of: | |||||||||||||||||||||||||
| Acquiror | Announcement | Enterprise | Run Rate | Current Yr. | 1 Yr. Forward | Gross | |||||||||||||||||||
| Acquiree | Date | Value | Revenue | Revenue | Revenue | LQ PPE | |||||||||||||||||||
AT&T Corp. | 3/22/01 | $ | 135.0 | 1.4x | 0.4x | 0.3x | 0.3x | ||||||||||||||||||
| NorthPoint Communications Assets | |||||||||||||||||||||||||
McLeodUSA, Inc. | 10/3/00 | $ | 532.0 | 3.1x | 2.0x | 1.2x | 1.2x | ||||||||||||||||||
| CapRock Communications Corp. | |||||||||||||||||||||||||
WorldCom | 9/5/00 | $ | 2,116.0 | NM | 2.5x | 2.4x | 0.9x | ||||||||||||||||||
| Intermedia Communications (CLEC only) | |||||||||||||||||||||||||
Time Warner Telecom | 8/25/00 | $ | 690.0 | NM | 11.4x | 3.8x | 0.7x | ||||||||||||||||||
| GST Telecommunications Assets | |||||||||||||||||||||||||
| Mean: | 2.2x | 4.1x | 1.9x | ||||||||||||||||||||||
| Median: | 2.2x | 2.2x | 1.8x | ||||||||||||||||||||||
| (a) | Includes transactions happened within the last year given the market condition was drastically different one year ago. |
| LEHMAN BROTHERS |  |
14
Valuation of Charter-related Assets
Funding Gap Analysis
| • | Assuming Charter renews the 2000 Agreement in May 2005, we estimate that the Company would require approximately $56.2 million in order to fund its Charter-related business to cash flow breakeven |
Funding Gap Analysis
| (Dollars in millions, except per share data) | 2002 | 2003 | 2004 | 2005 | ||||||||||||
Cash BOY(a) | $ | 18.2 | — | — | — | |||||||||||
EBITDA(b) | ($34.0 | ) | ($12.4 | ) | $ | 1.6 | $ | 21.0 | ||||||||
| Less: Depreciation | ($3.6 | ) | ($5.9 | ) | ($8.0 | ) | ($7.5 | ) | ||||||||
| EBIT | ($37.6 | ) | ($18.3 | ) | ($6.4 | ) | $ | 13.5 | ||||||||
Remaining Usable NOLs EOY(c) | ($149.7 | ) | ($168.1 | ) | ($174.4 | ) | ($161.0 | ) | ||||||||
| Unlevered Taxable Income | — | — | — | — | ||||||||||||
| Less: Unlevered Cash Taxes @ 38.0% | — | — | — | — | ||||||||||||
| After-tax EBIT | ($37.6 | ) | ($18.3 | ) | ($6.4 | ) | $ | 13.5 | ||||||||
| Plus: Depreciation & Amortization | $ | 3.6 | $ | 5.9 | $ | 8.0 | $ | 7.5 | ||||||||
Less: CapEx(b) | ($8.6 | ) | ($5.6 | ) | ($8.1 | ) | ($9.1 | ) | ||||||||
Less: Change in NWC(b) | ($1.2 | ) | ($5.2 | ) | ($1.1 | ) | ($1.0 | ) | ||||||||
| Unlevered After-Tax Free Cash Flow | ($43.7 | ) | ($23.1 | ) | ($7.5 | ) | $ | 10.9 | ||||||||
Cash EOY | — | — | — | $ | 10.9 | |||||||||||
Funding Need | $ | 25.5 | $ | 23.1 | $ | 7.5 | -- | |||||||||
Cumulative Funding Need | $ | 25.5 | $ | 48.7 | $ | 56.2 | -- | |||||||||
| (a) | Based on Company estimates. Assumes $22.2 million in cash at the end of 11/30/01 and assumes additional $4.0 million burn in December 2001. | |
| (b) | Per Company estimates. | |
| (c) | Total NOLs are estimated by adding NOLs up to the end of 2000 and total EBITDA estimated loss in 2001 based on Company pacing report dated 8/2/01. Charter related NOLs are 85% of Cable Modem NOLs which are allocated based on 2001 revenue share of Cable Modem business. |
| LEHMAN BROTHERS |  |
15
Conclusions
| • | In our opinion, the proposed consideration to be received by HSA in the Proposed Transaction is fair to the Company from a financial point of view based on: |
| — | Results of recent past and present efforts to raise capital and examine of strategic alternatives | ||
| — | Charter’s operational and financial relationships with the Company | ||
| — | Comparable publicly traded company analysis | ||
| — | Comparable transaction analysis | ||
| — | DCF analysis | ||
| — | Future capital requirements | ||
| — | Obligations to debtholders and preferred stockholders | ||
| — | Evaluation of benefits and risks of the transaction |
| LEHMAN BROTHERS |  |
16