Exhibit(c)(6)

 | Presentation to Board of Directors of Charter Communications, Inc. Regarding Acquisition of High Speed Access September 7, 2001 |

Acquisition of High Speed Access
Presentation to Board of Directors of Charter Communications, Inc.
1. Transaction Summary
2. Overview of High Speed Access
3. Transaction Valuation
4. Vulcan Stock Purchase Consideration
Appendix
— WACC and Terminal Multiple Analysis


 | Transaction Summary |

Transaction Summary
Key Terms and Considerations
| Consideration: | Charter offers to purchase certain assets of HSA in return for: | |
| • $81.1 million, consisting of $78.3 million in cash and approximately $2.8 million in assumed | ||
| liabilities, subject to working capital adjustments(a) | ||
| • Cancellation of entire Series D Convertible Preferred Stock | ||
| • Cancellation of Charter’s warrants to acquire HSA stock | ||
| Assets to be Acquired: | Call center, network operating center, intellectual property and other assets relating to the operation of Charter’s high-speed data subscribers | |
| Management Agreement: | Charter will enter into a management agreement with respect to the acquired businesses between signing and closing | |
| Other Key Terms: | Charter will have no obligation under any MSO contracts, including those with Classic, Insight and AOL Time Warner | |
| Charter will have no DSL obligations | ||
| Voting agreements with Vulcan and HSA board members, management and other insiders | ||
| Key Conditions to Closing: | HSA stockholder approval | |
| Regulatory approvals | ||
| Series D Convertible Preferred Stock: | $75 million face value currently owned by Charter ($37 million) and Vulcan ($38 million) | |
| Concurrent Transaction with Vulcan: | Charter will pay Vulcan $8 million in cash for Vulcan’s share of the preferred stock | |
| (a) | Based on management’s estimate of the consideration split between cash and assumed liabilities; split may be subject to change. |

1

Transaction Summary
Operational Rationale
| • | HSA represents approximately 37% of Charter’s data subscriber base |
| • | Continued growth of data subscribers is a key component to Charter’s business objectives |
| • | HSA’s liquidity constraints are a significant concern |
| • | At current burn rate, HSA is projected to run out of cash at the beginning of 2002, and will face difficulty in raising incremental capital | ||
| • | Potential for service to begin to deteriorate as HSA moves to conserve cash |
| • | While Charter and Vulcan would be well-positioned in a bankruptcy liquidation, that scenario would not be optimal for Charter |
| • | Charter may lose data subscribers due to operational turmoil | ||
| • | Would take an indefinite period of time to resolve |
| • | Charter believes it is important to take steps to ensure that its data subscriber base continues to receive quality service |
| • | In addition, Charter can operate assets more efficiently than HSA, generating significant cost savings |

2

 | Overview of High Speed Access |

Overview of High Speed Access
Company Overview
| • | High Speed Access’s primary business is providing high-speed Internet access via cable modems to residential subscribers through partnerships with cable MSOs | |
| • | HSA enters into long-term exclusive contracts with cable system operators such as Charter or Classic Cable to provide a suite of services on a comprehensive “Turnkey” basis or an unbundled “Network Services” (NSA) basis |
| • | Turnkey | ||
| – HSA markets and provisions service and handles all customer interactions | |||
| – HSA provides all necessary headend and modem equipment | |||
| • | NSA | ||
| – MSO markets, provisions and bills for service and handles initial customer calls | |||
| – HSA provides customer support and network monitoring | |||
| – HSA collects flat fee from MSO |
| • | HSA also recently entered a non-exclusive contract to market service to AOL Time Warner’s cable subscribers |
| • | HSA markets service to AOL Time Warner’s subscribers in competition with AOL and other ISPs | ||
| • | HSA “owns” customer and pays fixed fee to AOL Time Warner for use of infrastructure |

3

Overview of High Speed Access
Company Overview (Cont’d)
| • | Other business lines include commercial high-speed data, web hosting and web services, consulting and a recently acquired DSL business |
| • | HSA also offers traditional dial-up ISP services in some markets, although it is in the process of exiting the business |
| • | HSA recently purchased DSL assets from Lucent for $3.1 million |
| • | Assets consist of 73 central office locations, four fully-equipped metro-POPs and access to Western footprint which includes Colorado, Utah, New Mexico and Idaho | ||
| • | Intended to launch commercial DSL service in Colorado by end of year |
| • | Web Hosting and Web services |
| • | Authoring and programming websites, as well as web hosting |
| • | Content and “Enhanced Services" |
| • | Offers Video-on-Demand and Streaming Video end-user solutions |
| • | Consulting |
| • | Fee-based services primarily targeted toward foreign cable operators |

4

Overview of High Speed Access
Liquidity Situation
| • | HSA’s cash burn rate in June was approximately $8.4 million | |
| • | June 30 cash balance of $58.9 million is sufficient to last only into the beginning of 2002 | |
| • | Incremental funds are likely to be difficult to secure |
| • | Charter and Vulcan financed the prior round due to unavailability of funds from third parties on acceptable terms |
| 2001 | 2002 | |||||||||||||||||||||||||||||||
| Jul | Aug | Sep | Oct | Nov | Dec | Jan | Feb | |||||||||||||||||||||||||
| Cash Flows from Operations | ($9,923 | ) | ($5,530 | ) | ($6,237 | ) | ($5,002 | ) | ($5,208 | ) | ($4,459 | ) | ($5,626 | ) | ($8,510 | ) | ||||||||||||||||
| Capital Expenditures | (1,095 | ) | (260 | ) | (274 | ) | (273 | ) | (293 | ) | (648 | ) | (1,219 | ) | (331 | ) | ||||||||||||||||
| Other Cash (Needs)/Sources | 41 | (959 | ) | (959 | ) | (959 | ) | (959 | ) | (959 | ) | (900 | ) | (894 | ) | |||||||||||||||||
| Liquidity at Period End | $ | 47,893 | $ | 41,144 | $ | 33,674 | $ | 27,439 | $ | 20,979 | $ | 14,913 | $ | 7,168 | ($2,567 | ) | ||||||||||||||||
| 2001 | ||||||||||||||||||||||||
| Jul | Aug | Sep | Oct | Nov | Dec | |||||||||||||||||||
| Cash Flows from Operations | ($9,961 | ) | ($5,106 | ) | ($5,446 | ) | ($4,028 | ) | ($4,185 | ) | ($3,845 | ) | ||||||||||||
| Capital Expenditures | (1,010 | ) | (170 | ) | (176 | ) | (171 | ) | (194 | ) | (193 | ) | ||||||||||||
| Other Cash (Needs)/Sources | 50 | (950 | ) | (950 | ) | (950 | ) | (950 | ) | (950 | ) | |||||||||||||
| Liquidity at Period End | $ | 47,949 | $ | 41,723 | $ | 35,152 | $ | 30,002 | $ | 24,673 | $ | 19,685 | ||||||||||||
[Additional columns below]
[Continued from above table, first column(s) repeated]
| 2002 | ||||||||||||
| Jan | Feb | Mar | ||||||||||
| Cash Flows from Operations | ($4,297 | ) | ($6,232 | ) | ($6,453 | ) | ||||||
| Capital Expenditures | (1,047 | ) | (133 | ) | (52 | ) | ||||||
| Other Cash (Needs)/Sources | (942 | ) | (942 | ) | (942 | ) | ||||||
| Liquidity at Period End | $ | 13,399 | $ | 6,091 | ($1,356 | ) | ||||||
| (a) | Source: HSA management projections and HSA 10-Q dated June 30, 2001. | |
| (b) | Assumes HSA decides not to continue with Multiple ISP and DSL business lines after July 31, 2001. |

5

Overview of High Speed Access
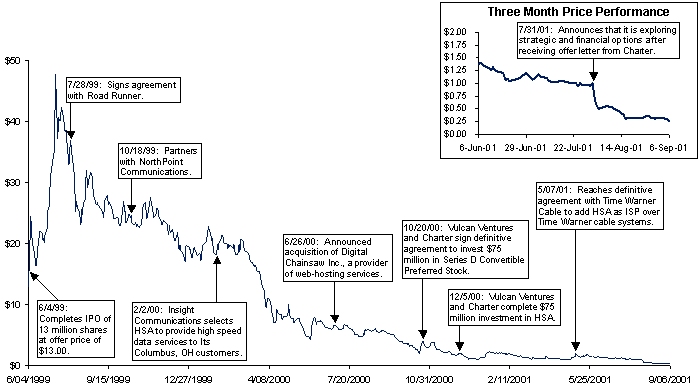
Stock Price Performance Since IPO

6

Overview of High Speed Access
Trading Volume Analysis — Last Six Months(a)


| (a) | As of September 6, 2001. |

7

Overview of High Speed Access
Shareholder Profile
| Economic and Voting Percentage | ||||||||||||||||||
| Common | Fully Diluted | Common | ||||||||||||||||
| Outstanding | Shares(a) | Outstanding | Fully Diluted | |||||||||||||||
Company Management(b) | 249 | 1,544 | 0.4 | % | 2.6 | % | ||||||||||||
| Vulcan Ventures | 20,249 | 20,249 | 34.5 | % | 33.8 | % | ||||||||||||
| Venture Capital Firms/Representatives | 3,115 | 3,115 | 5.3 | % | 5.2 | % | ||||||||||||
Other Corporations(c) | 2,776 | 2,776 | 4.7 | % | 4.6 | % | ||||||||||||
Total Insiders | 26,389 | 27,684 | 45.0 | % | 46.1 | % | ||||||||||||
13f Institutions(d) | ||||||||||||||||||
| Barclays Bank Plc | 315 | 315 | 0.5 | % | 0.5 | % | ||||||||||||
| Security Management Co, LLC | 210 | 210 | 0.4 | % | 0.4 | % | ||||||||||||
| College Retire Securities | 204 | 204 | 0.3 | % | 0.3 | % | ||||||||||||
| Jacobs Levy Equity Mgmt, Inc. | 202 | 202 | 0.3 | % | 0.3 | % | ||||||||||||
| Vanguard Group | 179 | 179 | 0.3 | % | 0.3 | % | ||||||||||||
| All Other 13f Institutions | 1,510 | 1,510 | 2.6 | % | 2.5 | % | ||||||||||||
| Total 13f Institutions | 2,621 | 2,621 | 4.5 | % | 4.4 | % | ||||||||||||
| Retail | 29,687 | 29,687 | 50.6 | % | 49.5 | % | ||||||||||||
Total Shares | 58,697 | 59,992 | 100.0 | % | 100.0 | % | ||||||||||||
| (a) | Includes grants of restricted stock in July 2001, and excludes all out-of-the-money options and warrants. | |
| (b) | Based on proxy dated June 22, 2001. | |
| (c) | Based on HSA management presentation, shares as of April 30, 2001. | |
| (d) | Based on Spectrum as of June 30, 2001. |

8

 | Transaction Value |

Overview of Valuation Methodologies
| • To determine value of assets acquired by Charter, we used several valuation methodologies |
| Method | Description/Comment | |
| 52-Week Trading Range | Utilizes share price to calculate asset value | |
| Public Comparable Companies | DSL and ISP sectors offer closest comparables, however, values have been severely compressed by liquidity concerns | |
| Private Comparable Companies | Recent transactions are most relevant | |
| Break-Up Value | Examines other transactions involving the sale of assets | |
| Discounted Cash Flow: | ||
| HSA Projections | DCF on standalone HSA projections excluding Multiple ISP and DSL businesses | |
| Charter Projections | DCF on the cash flows Charter expects to generate from HSA assets |

9

Transaction Valuation
Overview of Valuation Methodologies (Cont’d)
• In cases where a valuation was calculated for the entire company, we adjusted to arrive at the value of the assets being acquired
| • | Non-cable modem business lines are assumed to have negligible value as there are very limited hard assets and DSL and Multiple ISP businesses have not yet been developed | |||
| • | Asset value is allocated on a per subscriber basis |
| – | Since assets Charter is acquiring account for approximately 86% of HSA subscribers, we believe it is conservative to allocate 86% of HSA asset value to acquired assets |
Transaction Value (Dollars in Millions)
Cash(a) | $ | 78.3 | ||
Assumed Liabilities(a) | 2.8 | |||
| Consideration to Vulcan | 8.0 | |||
Value of Charter Preferred Cancelled(b) | 7.8 | |||
Cancellation of Charter Warrants(c) | 0.1 | |||
Total Transaction Value | $ | 97.0 |
| (a) | Based on management’s estimate of the consideration split between cash and assumed liabilities; split may be subject to change. | |
| (b) | Value based on price paid to Vulcan. | |
| (c) | Assumes 2.6 million warrants, seven year average life, volatility of 60%, strike price of $3.23 per share and current HSA share price of $0.26. |

10

Summary Valuation (Dollars in Millions)
Asset Value Attributable to Charter
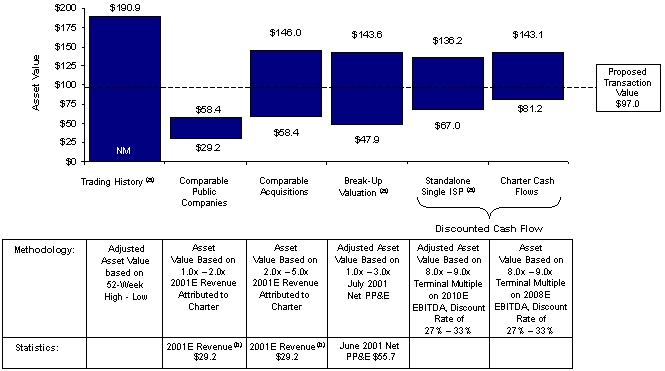
| (a) | Based on 86% of HSA’s total asset value. | |
| (b) | 2001E revenue attributed to the assets Charter plans to acquire from HSA. |

11

Potential Value Impact of Subscriber Loss
| • Valuation calculations do not take into account value of subscribers that could be lost if Charter does not acquire HSA assets | ||
| • Normal customer churn could be impacted by either: |
| • Degradation of service due to liquidity constraints at HSA | |||
| • Technical and operational difficulties of transitioning subscribers to new service provider |
| • Each data subscriber lost has a value impact on Charter |
Illustrative Value Loss to Charter (Dollars in Millions, Except per Subscriber Amounts)
| Percentage of | ||||||||||||||||||||||||
| Charter's HSA | Total | Est. Monthly | Implied Annual | Current 2001 | Estimated Value | |||||||||||||||||||
| Subscribers | Subscribers | Revenue per | Estimated Cash | Cash Flow Loss | EBITDA | Lost To Charter | ||||||||||||||||||
| Lost | Lost | Subscriber | Flow Margin | (mm) | Multiple(a) | (mm) | ||||||||||||||||||
| 10% | 15,582 | $ | 35.00 | 40 | % | $ | 2.6 | 15.2x | $ | 39.7 | ||||||||||||||
| 15% | 23,372 | 35.00 | 40 | % | 3.9 | 15.2x | 59.6 | |||||||||||||||||
| 20% | 31,163 | 35.00 | 40 | % | 5.2 | 15.2x | 79.5 | |||||||||||||||||
| 25% | 38,954 | 35.00 | 40 | % | 6.5 | 15.2x | 99.3 | |||||||||||||||||
| 30% | 46,745 | 35.00 | 40 | % | 7.9 | 15.2x | 119.2 | |||||||||||||||||
| 35% | 54,536 | 35.00 | 40 | % | 9.2 | 15.2x | 139.0 | |||||||||||||||||
| 40% | 62,326 | 35.00 | 40 | % | 10.5 | 15.2x | 158.9 | |||||||||||||||||
| (a) | As of September 6, 2001. |

12

Trading History Valuation
Asset Valuation at 52 Week High/Low (Dollars in Millions, Except Per Share Amounts)
| Percent | Asset Value | |||||||||||||||||||||||||||||||||||||||
| Share | Shares | Market | Asset | Attributable | Attributable | |||||||||||||||||||||||||||||||||||
| Date | Price | Outstanding | Value | Debt | Preferred | Cash | Value | to Charter | to Charter | |||||||||||||||||||||||||||||||
Low | 9/6/01 | $ | 0.26 | 60.0 | $ | 15.6 | $ | 19.0 | $ | 3.9 | ($58.9 | ) | ($20.4 | ) | 86 | % | NM | |||||||||||||||||||||||
High | 9/6/00 | 5.38 | 55.7 | 299.3 | 19.9 | — | (97.2 | ) | 222.0 | 86 | % | 190.9 | ||||||||||||||||||||||||||||
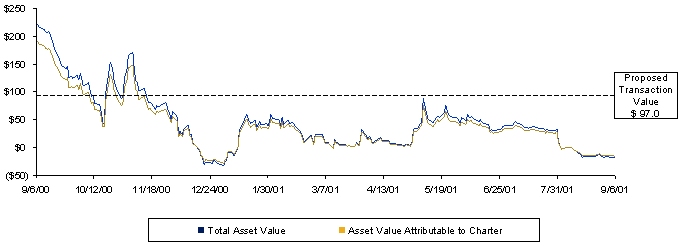
Asset Valuation Over Last Twelve Months (Dollars in Millions)

13

Public Market Valuation (Dollars in Millions)
Public Market Comparables
| Price | Shares | Market | Market | 2001E | 2002E | Market Cap | ||||||||||||||||||||||||||||||
| Company | Ticker | 9/6/01 | Outstanding | Value | Capitalization | Revenue | Revenue | 2001E | 2002E | |||||||||||||||||||||||||||
| Network-Based ISPs Applied Theory | ATHY | $ | 0.22 | 28.6 | $ | 6.3 | $ | 48.2 | $ | 114.0 | NA | 0.4x | NA | |||||||||||||||||||||||
| iBasis | IBAS | 0.94 | 45.2 | 42.5 | 76.0 | 153.3 | 277.9 | 0.5x | 0.3x | |||||||||||||||||||||||||||
| Genuity | GENU | 1.58 | 973.9 | 1,538.8 | 2,409.1 | 1,217.0 | 1,459.0 | 2.0x | 1.7x | |||||||||||||||||||||||||||
| Median | 0.5x | 1.0x | ||||||||||||||||||||||||||||||||||
| Consumer-Based ISPs Earthlink | ELNK | $ | 13.74 | 137.5 | $ | 1,889.8 | $ | 1,912.8 | $ | 1,271.0 | $ | 1,481.0 | 1.5x | 1.3x | ||||||||||||||||||||||
Excite@Home(a) | ATHM | 0.34 | 461.4 | 156.9 | 204.1 | 594.0 | NA | 0.3x | NA | |||||||||||||||||||||||||||
| Prodigy | PRGY | 5.30 | 70.3 | 372.6 | 677.7 | 371.0 | 454.0 | 1.8x | 1.5x | |||||||||||||||||||||||||||
| Median | 1.5x | 1.4x | ||||||||||||||||||||||||||||||||||
| DSL Companies DSL.net | DSLN | 0.26 | 66.7 | 17.3 | NM | 43.1 | 75.4 | NM | NM | |||||||||||||||||||||||||||
| Network Access | NASC | 0.19 | 55.8 | 10.6 | 102.1 | 42.7 | 80.2 | 2.4x | 1.3x | |||||||||||||||||||||||||||
| Median | 2.4x | 1.3x | ||||||||||||||||||||||||||||||||||
Public Market Asset Valuation
| 2001E Revenue | 2001E Revenue | Asset Value | ||||||||||
| Attributed to Charters(b) | Multiple | Attributable to Charter | ||||||||||
Low | $ | 29.2 | 1.0x | $ | 29.2 | |||||||
High | 29.2 | 2.0x | 58.4 | |||||||||
| (a) | Assumes convertible debt and preferred is converted into common shares. | |
| (b) | Source: HSA management. |

14

Private Market Valuation
Comparable Acquisitions
Transaction Value/
Current Year Revenue
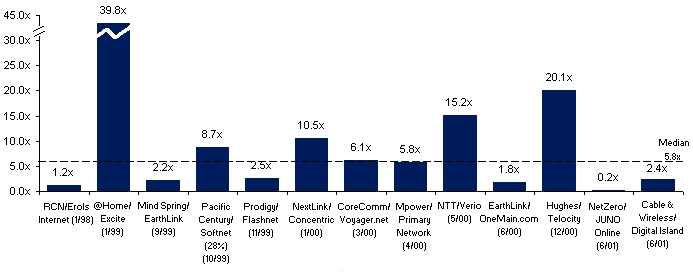
Private Market Asset Valuation (Dollars in Millions)
| 2001E Revenue | 2001E Revenue | Asset Value | ||||||||||
| Attributed to Charter(a) | Multiple | Attributable to Charter | ||||||||||
Low | $ | 29.2 | 2.0x | $ | 58.4 | |||||||
High | 29.2 | 5.0x | 146.0 | |||||||||
| (a) | Source: HSA management. |

15

Break-Up Valuation
Transaction Value/Net PP&E
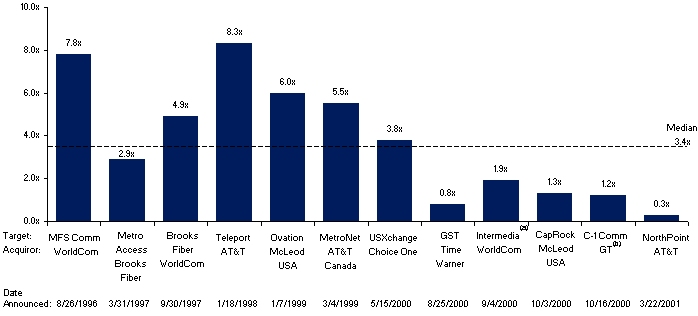
Break-Up Asset Valuation (Dollars in Millions)
| June 2001 | Percent Attributable | Asset Value | ||||||||||||||||||
| Multiple | Net PP&E(c) | Asset Value | to Charter | Attributable to Charter | ||||||||||||||||
Low | 1.0x | $ | 55.7 | $ | 55.7 | 86 | % | $ | 47.9 | |||||||||||
High | 3.0x | 55.7 | 167.0 | 86 | % | 143.6 | ||||||||||||||
| (a) | Assumes acquisition of non-Digex assets. | |
| (b) | Acquisition of C-1 Communications Atlantic Canada assets; represents multiple of gross PP&E. | |
| (c) | Source: HSA 10-Q dated June 30, 2001. |

16

9 Year DCF – HSA Cash Flows (Single ISP) (Dollars in Millions)(a)
Projected Cash Flows
| Last Three | |||||||||||||||||||||
| Months of | |||||||||||||||||||||
| 2001E | 2002E | 2003E | 2004E | 2005E | |||||||||||||||||
| Revenue | $ | 9.5 | $ | 48.6 | $ | 73.7 | $ | 102.7 | $ | 140.5 | |||||||||||
| EBITDA | (13.2 | ) | (40.3 | ) | (23.1 | ) | (8.9 | ) | 13.9 | ||||||||||||
| Capital Expenditures | (0.6 | ) | (3.9 | ) | (0.7 | ) | (1.2 | ) | (1.2 | ) | |||||||||||
| Cash Taxes | — | — | — | — | — | ||||||||||||||||
| Changes in Working Capital | 0.9 | 0.0 | (5.4 | ) | (0.5 | ) | (2.4 | ) | |||||||||||||
| Changes in Other Assets/Liabilities | 0.5 | 1.9 | 1.9 | 1.9 | 0.3 | ||||||||||||||||
Free Cash Flow | ($12.4 | ) | ($42.2 | ) | ($27.3 | ) | ($8.7 | ) | $ | 10.7 | |||||||||||
[Additional columns below]
[Continued from above table, first column(s) repeated]
| 2006E | 2007E | 2008E | 2009E | 2010E | |||||||||||||||||
| Revenue | $ | 184.2 | $ | 234.4 | $ | 290.8 | $ | 350.9 | $ | 413.6 | |||||||||||
| EBITDA | 38.0 | 64.4 | 96.9 | 131.5 | 164.7 | ||||||||||||||||
| Capital Expenditures | (1.0 | ) | (8.1 | ) | (1.5 | ) | (1.8 | ) | (1.9 | ) | |||||||||||
| Cash Taxes | — | — | (27.2 | ) | (51.1 | ) | (65.2 | ) | |||||||||||||
| Changes in Working Capital | (2.0 | ) | (0.4 | ) | (3.5 | ) | (3.3 | ) | (2.0 | ) | |||||||||||
| Changes in Other Assets/Liabilities | — | — | — | — | — | ||||||||||||||||
Free Cash Flow | $ | 35.0 | $ | 55.8 | $ | 64.7 | $ | 75.3 | $ | 95.6 | |||||||||||
DCF Valuation
| Future Value | Low | High | ||||||
| 2010 EBITDA Multiple | 8.0x | 9.0x | ||||||
| 2010 EBITDA | $ | 164.7 | $ | 164.7 | ||||
| Terminal Value | $ | 1,317.7 | $ | 1,482.5 | ||||
| Present Value | ||||||||
| Discount Rate | 33.0 | % | 27.0 | % | ||||
| PV of Interim Cash Flows | ($16.3 | ) | ($4.1 | ) | ||||
| PV of Terminal Value | 94.2 | 162.5 | ||||||
| Firm Value | 77.9 | 158.3 | ||||||
| Percent Attributable to Charter | 86.0 | % | 86.0 | % | ||||
Asset Value Attributable to Charter | $ | 67.0 | $ | 136.2 | ||||
| (a) | Source: HSA management projections; assumes cash flows are discounted back to September 30, 2001. |

17

Transaction Valuation
7 Year DCF – Charter Cash Flows (Dollars in Millions) (a)
Projected Cash Flows
| Last Three | |||||||||||||||||||||||||||||||||
| Months of | |||||||||||||||||||||||||||||||||
| 2001E | 2002E | 2003E | 2004E | 2005E | 2006E | 2007E | 2008E | ||||||||||||||||||||||||||
| Gross Profit Improvement | $ | 9.5 | $ | 29.8 | $ | 45.7 | $ | 68.9 | $ | 97.7 | $ | 133.9 | $ | 176.9 | $ | 226.0 | |||||||||||||||||
| EBITDA | (1.5 | ) | (12.1 | ) | 0.5 | 17.5 | 26.3 | 49.2 | 71.0 | 95.6 | |||||||||||||||||||||||
| Capital Expenditures | (16.3 | ) | (20.0 | ) | (7.4 | ) | (18.7 | ) | (10.2 | ) | (7.4 | ) | (7.4 | ) | (7.4 | ) | |||||||||||||||||
| Cash Taxes | — | — | — | — | — | — | (10.4 | ) | (34.9 | ) | |||||||||||||||||||||||
| Changes in Working Capital | 0.9 | 0.0 | (3.3 | ) | (0.4 | ) | (1.7 | ) | (1.5 | ) | (0.3 | ) | (2.8 | ) | |||||||||||||||||||
Free Cash Flow | ($16.9 | ) | ($32.0 | ) | ($10.3 | ) | ($1.5 | ) | $ | 14.4 | $ | 40.4 | $ | 52.8 | $ | 50.5 | |||||||||||||||||
DCF Valuation
| Future Value | Low | High | ||||||
| 2008 EBITDA Multiple | 8.0x | 9.0x | ||||||
| 2008 EBITDA | $ | 95.6 | $ | 95.6 | ||||
| Terminal Value | $ | 764.8 | $ | 860.4 | ||||
| Present Value | ||||||||
| Discount Rate | 33.0 | % | 27.0 | % | ||||
| PV of Interim Cash Flows | ($15.6 | ) | ($8.9 | ) | ||||
| PV of Terminal Value | 96.7 | 152.1 | ||||||
Asset Value Attributable to Charter | $ | 81.2 | $ | 143.1 | ||||
| (a) | Source: Charter management projections; changes in working capital estimated; assumes cash flows are discounted back to September 30, 2001. |

18

Cost-to-Build Analysis (Dollars in Millions)(a)
Capital Expenditures
| Last Three | ||||||||||||||||||||||||
| Months of | ||||||||||||||||||||||||
| 2001E | 2002E | 2003E | 2004E | 2005E | 2006E | |||||||||||||||||||
| Total Capital Expenditures | $ | 33.2 | $ | 41.9 | $ | 28.0 | $ | 17.4 | $ | 12.8 | $ | 11.4 | ||||||||||||
| Operational Capital Expenditures | 16.3 | 20.0 | 7.4 | 18.7 | 10.2 | 7.4 | ||||||||||||||||||
Capital Expenditures for Build Out | $ | 16.9 | $ | 21.9 | $ | 20.6 | ($1.3 | ) | $ | 2.6 | $ | 4.0 | ||||||||||||
Cost-to-Build Valuation
| Low | High | ||||||||
| Discount Rate | 15.0 | % | 10.0 | % | |||||
| Net Present Value of Incremental Capital Expenditures (b) | $ | 52.3 | $ | 55.7 | |||||
| Plus: Cost to Acquire HSA Contract | 10.0 | 30.0 | |||||||
| Plus: Consulting Fees | 5.0 | 10.0 | |||||||
| Less: Value of Preferred Stock if Converted Before Announcement (c) | (7.4 | ) | (7.4 | ) | |||||
Total Cost-to-Build | $ | 59.9 | $ | 88.4 | |||||
Cost-to-build analysis understates true cost to Charter of building assets. Unquantifiable costs include senior management time and possible interruption of service
| (a) | Source: Charter management estimates. | |
| (b) | Assumes incremental capital expenditures are discounted back to September 30, 2001. | |
| (c) | Assumes Charter converted convertible preferred into common shares and sold at $1.00 per share. |

19

 | Vulcan Stock Purchase Consideration |

Summary of Terms of Convertible Preferred Stock
| Issue Date: | October 2000(a) | |
| Face Amount (Par): | $75 million | |
| Optional Conversion: | At any time, at the option of the holder, at a conversion price of $5.02 (14.9 million shares) | |
| Mandatory | ||
| Redemption: | None | |
| Dividends: | None (entitled to dividends paid on underlying common shares) | |
| Liquidation Preference: | Par value prior to any distributions to junior (common) stockholders; allows preferred shares to be assumed by acquiror or merged company | |
| Voting Rights: | One vote for each share into which preferred stock is convertible | |
| Blocking Rights: | So long as Charter and Vulcan own (i) at least 50% of the Convertible Preferred and (ii) 15% of HSA’s Common Stock, then a 2/3 majority approval by Convertible Preferred shareholders is necessary for (i) sale of 30% or more of assets of firm, (ii) any merger or consolidation following which HSA shareholders would own less than 2/3 of surviving entity, (iii) acquisition greater than $50 million or (iv) issuance of debt or equity over $25 million | |
| Board Seats: | Equal to the percentage of fully diluted stock owned by Vulcan and Charter (rounded down to nearest whole number) Three of eight board seats |
| (a) | Closed December 5, 2000. |

20

Overview of Valuation Methodologies
| • A portion of the consideration for HSA assets will consist of the cancellation of the Series D Convertible Preferred Stock |
| • Charter must first acquire $38 million face value of the preferred stock held by Vulcan |
| • Charter has agreed to purchase Vulcan’s preferred stock for $8 million in cash | ||
| • To evaluate the consideration paid for the Vulcan preferred stock, |
| • We examined the value of the preferred on an as-converted basis; and | |||
| • We also examined the theoretical value of the preferred, which implicitly also includes the value of the call option and liquidation preference of the preferred |
| • Valuation methodologies for HSA’s common stock include: |
| • Current and historical stock prices | |||
| • DCF analysis of HSA as a standalone entity | |||
| • Public and private market valuations of HSA as a standalone entity | |||
| • Estimated liquidation proceeds following sale of HSA assets to Charter |
| • Valuation methodologies do not take into account |
| • Blocking rights of the convertible preferred | |||
| • Potential subscriber loss to Charter in the absence of effecting the broader transactions | |||
| • Cost savings resulting from the asset purchase |

21

Summary Valuation (Dollars in Millions)(a)
Value of Vulcan Preferred Stock
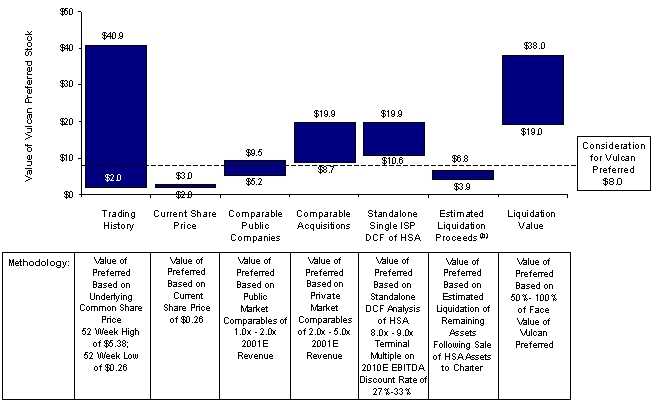
| (a) | Lower-end of value range based on underlying HSA common share value; Upper-end of value range includes theoretical value of optionality and liquidation preference inherent in preferred stock. | |
| (b) | Assumes convertible preferred holders receive per share proceeds equal to common shareholders. |

22

Public & Private Market Valuations
Public Market Valuation (Amounts in Millions, Except Per Share Amounts)
| Low | High | |||||||
2001E HSA Revenue(a) | $ | 34.6 | $ | 34.6 | ||||
| 2001E Revenue Multiple | 1.0x | 2.0x | ||||||
| Enterprise Value | $ | 34.6 | $ | 69.1 | ||||
| Plus: Net Cash (September 30, 2001) | 16.6 | 16.6 | ||||||
| Equity Value | $ | 51.2 | $ | 85.7 | ||||
| Fully Diluted Shares (Including Preferred) | 74.9 | 74.9 | ||||||
| Implied Value Per Share | $ | 0.68 | $ | 1.14 | ||||
Underlying Value of Vulcan Preferred(b) | $ | 5.2 | $ | 8.7 | ||||
Theoretical Value of Vulcan Preferred | $ | 6.1 | $ | 9.5 | ||||
Private Market Valuation (Amounts in Millions, Except Per Share Amounts)
| Low | High | |||||||
2001E HSA Revenue(a) | $ | 34.6 | $ | 34.6 | ||||
| 2001E Revenue Multiple | 2.0x | 5.0x | ||||||
| Enterprise Value | $ | 69.1 | $ | 172.8 | ||||
| Plus: Net Cash (September 30, 2001) | 16.6 | 16.6 | ||||||
| Equity Value | $ | 85.7 | $ | 189.4 | ||||
| Fully Diluted Shares (Including Preferred) | 74.9 | 74.9 | ||||||
| Implied Value Per Share | $ | 1.14 | $ | 2.53 | ||||
Underlying Value of Vulcan Preferred(b) | $ | 8.7 | $ | 19.1 | ||||
Theoretical Value of Vulcan Preferred | $ | 9.5 | $ | 19.9 | ||||
| (a) | Source: HSA management projections. | |
| (b) | Represents $38 million face value of preferred stock convertible into 7.6 million shares of HSA common stock. |

23

Vulcan Stock Purchase Consideration
Standalone HSA DCF Valuation (Single ISP) (Dollars in Millions)(a)
Projected Cash Flows
| Last Three | |||||||||||||||||||||
| Months of | |||||||||||||||||||||
| 2001E | 2002E | 2003E | 2004E | 2005E | |||||||||||||||||
| Revenue | $ | 9.5 | $ | 48.6 | $ | 73.7 | $ | 102.7 | $ | 140.5 | |||||||||||
| EBITDA | (13.2 | ) | (40.3 | ) | (23.1 | ) | (8.9 | ) | 13.9 | ||||||||||||
| Capital Expenditures | (0.6 | ) | (3.9 | ) | (0.7 | ) | (1.2 | ) | (1.2 | ) | |||||||||||
Cash Taxes(b) | — | — | — | — | — | ||||||||||||||||
| Changes in Working Capital | 0.9 | 0.0 | (5.4 | ) | (0.5 | ) | (2.4 | ) | |||||||||||||
| Changes in Other Assets/Liabilities | 0.5 | 1.9 | 1.9 | 1.9 | 0.3 | ||||||||||||||||
Free Cash Flow | ($12.4 | ) | ($42.2 | ) | ($27.3 | ) | ($8.7 | ) | $ | 10.7 | |||||||||||
[Additional columns below]
[Continued from above table, first column(s) repeated]
| 2006E | 2007E | 2008E | 2009E | 2010E | |||||||||||||||||
| Revenue | $ | 184.2 | $ | 234.4 | $ | 290.8 | $ | 350.9 | $ | 413.6 | |||||||||||
| EBITDA | 38.0 | 64.4 | 96.9 | 131.5 | 164.7 | ||||||||||||||||
| Capital Expenditures | (1.0 | ) | (8.1 | ) | (1.5 | ) | (1.8 | ) | (1.9 | ) | |||||||||||
Cash Taxes (b) | — | — | — | — | (36.4 | ) | |||||||||||||||
| Changes in Working Capital | (2.0 | ) | (0.4 | ) | (3.5 | ) | (3.3 | ) | (2.0 | ) | |||||||||||
| Changes in Other Assets/Liabilities | — | — | — | — | — | ||||||||||||||||
Free Cash Flow | $ | 35.0 | $ | 55.8 | $ | 91.9 | $ | 126.4 | $ | 124.5 | |||||||||||
DCF Valuation
| Future Value | Low | High | |||||||
| 2010 EBITDA Multiple | 8.0x | 9.0x | |||||||
| 2010 EBITDA | $ | 164.7 | $ | 164.7 | |||||
| Terminal Value | $ | 1,317.7 | $ | 1,482.5 | |||||
| Present Value | |||||||||
| Discount Rate | 33.0 | % | 27.0 | % | |||||
| PV of Interim Cash Flows | ($5.9 | ) | $ | 11.0 | |||||
| PV of Terminal Value | 94.2 | 162.5 | |||||||
| Firm Value | $ | 88.3 | $ | 173.5 | |||||
| Plus: Net Cash (September 30, 2001) | 16.6 | 16.6 | |||||||
| Equity Value | $ | 105.0 | $ | 190.1 | |||||
| Fully Diluted Shares (Including Preferred) | 74.9 | 74.9 | |||||||
| Implied Value Per Share | $ | 1.40 | $ | 2.54 | |||||
Underlying Value of Vulcan Preferred(c) | $ | 10.6 | $ | 19.2 | |||||
Theoretical Value of Vulcan Preferred | $ | 11.4 | $ | 19.9 | |||||
| (a) | Source: HSA management projections; assumes cash flows are discounted back to September 30, 2001. | |
| (b) | Assumes NOL balance of $267.7 million as of September 30, 2001. | |
| (c) | Represents $38 million face value of preferred stock convertible into 7.6 million shares of HSA common stock. |

24

Vulcan Stock Purchase Consideration
| • Assumes cash distribution is made following satisfaction of net liabilities and payment of shutdown costs |
| • Cash, debt and leases and other liabilities estimated at September 30, 2001 | |||
| • Shutdown costs include estimated severance costs, contract termination fees and other costs of ceasing operations |
| Low | High | |||||||
HSA Estimated Cash (September 30, 2001)(a) | $ | 35.2 | $ | 35.2 | ||||
| Plus: Cash Consideration Paid to HSA by Charter | 78.3 | 78.3 | ||||||
| Cash Available for Liquidation | $ | 113.5 | $ | 113.5 | ||||
Less: Debt & Leases (ex. Charter Acquired Leases)(a) | (15.7 | ) | (15.7 | ) | ||||
Less: Net Working Capital(a) | (9.4 | ) | (9.4 | ) | ||||
Less: Estimated Shutdown Costs(b) | (50.0 | ) | (30.0 | ) | ||||
| Total Residual Proceeds | $ | 38.3 | $ | 58.3 | ||||
| Fully Diluted Shares (Including Preferred) | 74.9 | 74.9 | ||||||
| Implied Value Per Share | $ | 0.51 | $ | 0.78 | ||||
Underlying Value of Vulcan Preferred(c) | $ | 3.9 | $ | 5.9 | ||||
Theoretical Value of Vulcan Preferred | $ | 4.8 | $ | 6.8 | ||||
Analysis assumes convertible preferred holders receive per share proceeds equal to common shareholders
| (a) | Source: HSA management projections. | |
| (b) | Source: Charter management estimates. | |
| (c) | Represents $38 million face value of preferred stock convertible into 7.6 million shares of HSA common stock. |

25

Vulcan Stock Purchase Consideration
(Dollars in Millions, Except per Share Amounts)
| Value if Converted(a) | Theoretical Value of Preferred(b) | |||||||||||||||||||
| HSA | Value to | Value to | Total as % of | |||||||||||||||||
| Share Price | Total Value | Vulcan | Total Value | Vulcan | Face | |||||||||||||||
| $5.38 | $ | 80.4 | $ | 40.7 | $ | 80.8 | $ | 40.9 | 107.7 | % | ||||||||||
| $2.50 | 37.4 | 18.9 | 38.6 | 19.6 | 51.5 | % | ||||||||||||||
| $2.25 | 33.6 | 17.0 | 35.0 | 17.7 | 46.6 | % | ||||||||||||||
| $2.00 | 29.9 | 15.1 | 31.3 | 15.8 | 41.7 | % | ||||||||||||||
| $1.75 | 26.2 | 13.3 | 27.6 | 14.0 | 36.8 | % | ||||||||||||||
| $1.50 | 22.4 | 11.4 | 23.9 | 12.1 | 31.9 | % | ||||||||||||||
| $1.25 | 18.7 | 9.5 | 20.2 | 10.2 | 27.0 | % | ||||||||||||||
| $1.00 | 14.9 | 7.6 | 16.6 | 8.4 | 22.1 | % | ||||||||||||||
| $0.75 | 11.2 | 5.7 | 13.0 | 6.6 | 17.3 | % | ||||||||||||||
| $0.50 | 7.5 | 3.8 | 9.3 | 4.7 | 12.5 | % | ||||||||||||||
| $0.25 | 3.7 | 1.9 | 5.8 | 3.0 | 7.8 | % | ||||||||||||||
| (a) | Assumes convertible preferred is converted into common stock at a conversion price of $5.02 per share or 14.9 million shares. | |
| (b) | Assumes for illustrative purposes a 30-year maturity, credit spread of 600 basis points and volatility of 60%. |

26

 | Appendix |


 | WACC and Terminal Multiple Analysis |


WACC and Terminal Multiple Analysis
Weighted Average Cost of Capital Analysis
DSL Providers (a)
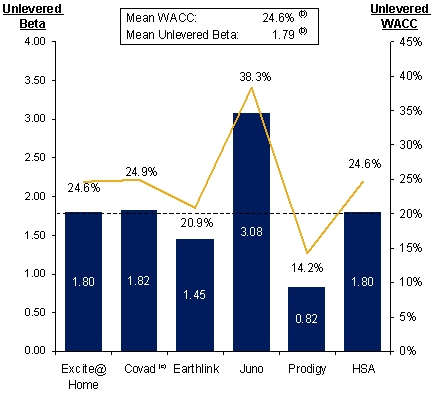
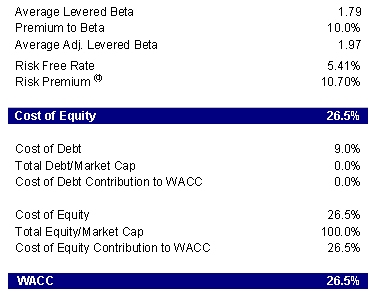
| (a) | Adjusted Beta average of Merrill Lynch Beta Book and Bloomberg. Unlevered beta equals (Levered Beta/(1+((1-Tax Rate)*Debt/Equity)). | |
| (b) | Excludes HSA. | |
| (c) | Pro forma for August 7, 2001 debt restructuring. | |
| (d) | Source: Ibbottson Associates. |

27

WACC and Terminal Multiple Analysis
| 2001 | 2002 | 2003 | 2004 | 2005 | 2006 | 2007 | 2008 | |||||||||||||||||||||||||||||
Revenue Growth | ||||||||||||||||||||||||||||||||||||
| Year-over-Year | ||||||||||||||||||||||||||||||||||||
| Single ISP Standalone | 143 | % | 41 | % | 52 | % | 39 | % | 37 | % | 31 | % | 27 | % | 24 | % | ||||||||||||||||||||
| Charter Cash Flows | — | — | 54 | % | 51 | % | 42 | % | 37 | % | 32 | % | 28 | % | ||||||||||||||||||||||
| 3 Year Lagging CAGR | ||||||||||||||||||||||||||||||||||||
| Single ISP Standalone | — | — | 73 | % | 44 | % | 42 | % | 36 | % | 32 | % | 27 | % | ||||||||||||||||||||||
| Charter Cash Flows | — | — | — | — | 49 | % | 43 | % | 37 | % | 32 | % | ||||||||||||||||||||||||
EBITDA Growth | ||||||||||||||||||||||||||||||||||||
| Year-over-Year | ||||||||||||||||||||||||||||||||||||
| Single ISP Standalone | — | — | — | — | — | 173 | % | 69 | % | 51 | % | |||||||||||||||||||||||||
| Charter Cash Flows | — | — | — | 3,641 | % | 50 | % | 87 | % | 44 | % | 35 | % | |||||||||||||||||||||||
| 3 Year Lagging CAGR | ||||||||||||||||||||||||||||||||||||
| Single ISP Standalone | — | — | — | — | — | — | — | 91 | % | |||||||||||||||||||||||||||
| Charter Cash Flows | — | — | — | — | — | 372 | % | 59 | % | 54 | % | |||||||||||||||||||||||||
| (a) | Single ISP Standalone projections from HSA management; Charter Cash Flow projections from Charter management. |

28