Searchable text section of graphics shown above
[GRAPHIC]
[LOGO]
Goldman, Sachs & Co.
6th Annual Internet Conference
May 26, 2005
CONFIDENTIAL INFORMATION • Property of priceline.com incorporated. All Rights Reserved. 11.18.03
[LOGO]
Priceline.com would like to remind you that this presentation contains forward looking statements, which are made pursuant to the Safe Harbor provisions of the Private Securities Litigation Reform Act of 1995. These forward-looking statements are not guarantees of future performance and are subject to certain risks, uncertainties and assumptions that are difficult to predict; therefore, actual results may differ materially from those expressed, implied or forecasted in any such forward-looking statements.
Expressions of future goals and similar expressions reflecting something other than historical fact are intended to identify forward looking statements. For a list of factors that could cause Priceline.com’s actual results to differ materially from those described in the forward-looking statements, please refer to the risk factors in Priceline.com’s most recent filings with the Securities and Exchange Commission. Unless required by law, Priceline.com undertakes no obligation to update publicly any forward-looking statements, whether as a result of new information, future events or otherwise.
This presentation should be read in conjunction with priceline.com’s audited financial statements and the notes thereto filed with the Securities and Exchange Commission on Form 10-K and quarterly financial statements filed with the Securities and Exchange Commission on Form 10-Q.
2
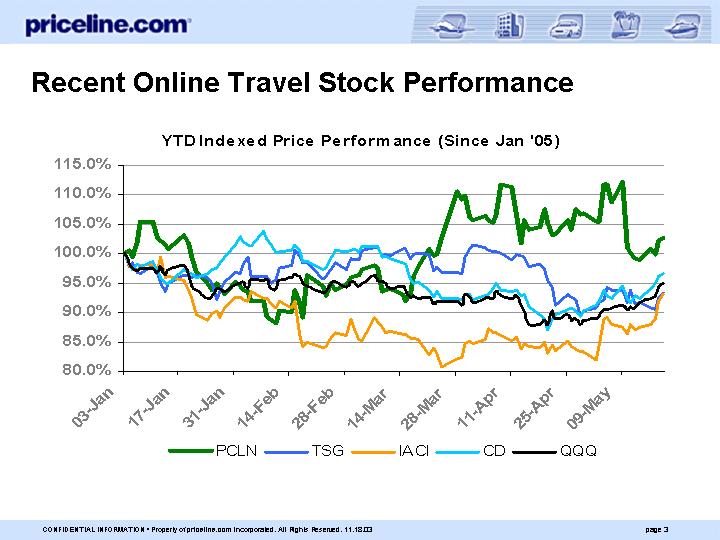
Recent Online Travel Stock Performance
YTD Indexed Price Performance (Since Jan ’05)
[CHART]
3
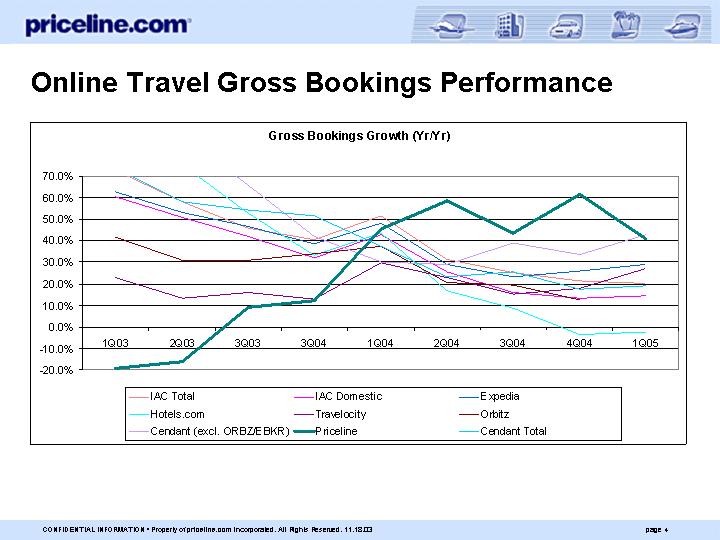
Online Travel Gross Bookings Performance
Gross Bookings Growth (Yr/Yr)
[CHART]
4
Growth Drivers for Priceline.com
1. Online Travel Market Dynamics
2. New Products and Markets
3. Brand Strength
4. Financial Strength
5
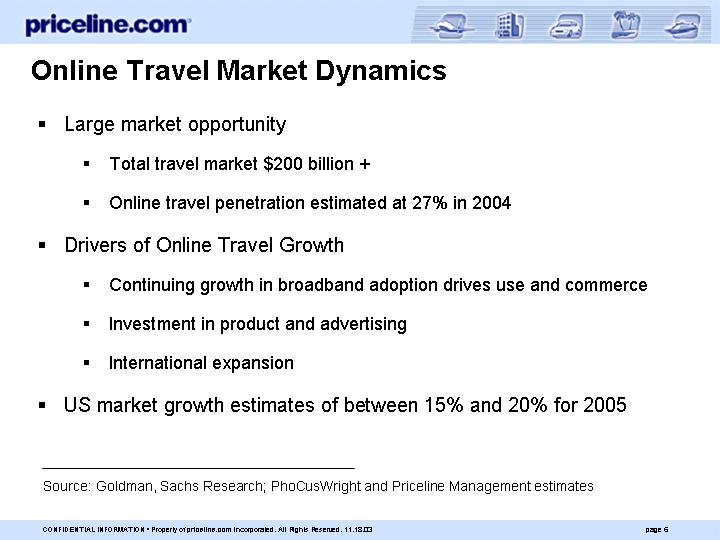
Online Travel Market Dynamics
• Large market opportunity
• Total travel market $200 billion +
• �� Online travel penetration estimated at 27% in 2004
• Drivers of Online Travel Growth
• Continuing growth in broadband adoption drives use and commerce
• Investment in product and advertising
• International expansion
• US market growth estimates of between 15% and 20% for 2005
Source: Goldman, Sachs Research; PhoCusWright and Priceline Management estimates
6
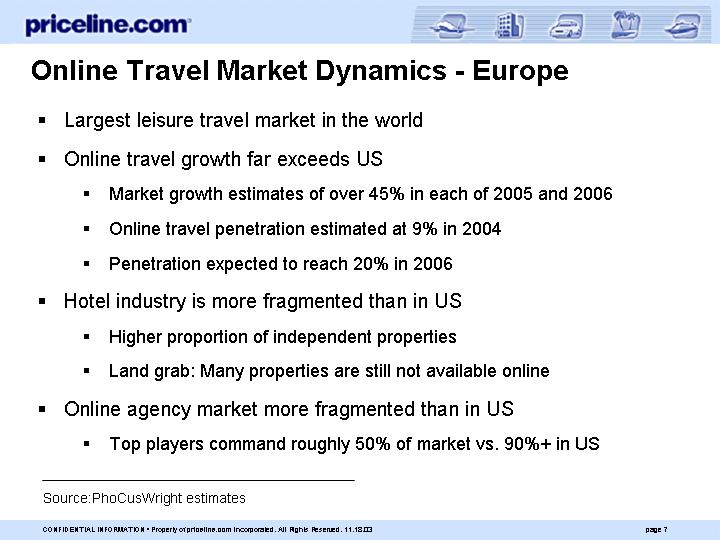
Online Travel Market Dynamics - Europe
• Largest leisure travel market in the world
• Online travel growth far exceeds US
• Market growth estimates of over 45% in each of 2005 and 2006
• Online travel penetration estimated at 9% in 2004
• Penetration expected to reach 20% in 2006
• Hotel industry is more fragmented than in US
• Higher proportion of independent properties
• Land grab: Many properties are still not available online
• Online agency market more fragmented than in US
• Top players command roughly 50% of market vs. 90%+ in US
Source:PhoCusWright estimates
7
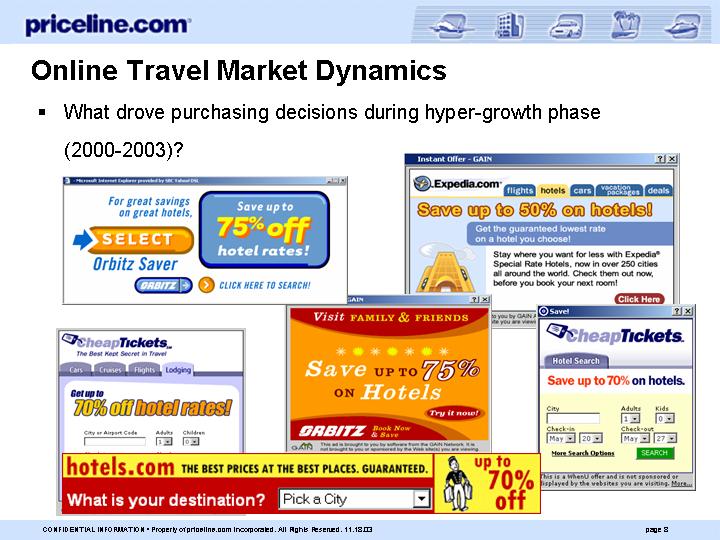
Online Travel Market Dynamics
• What drove purchasing decisions during hyper-growth phase (2000-2003)?
[GRAPHIC]
8
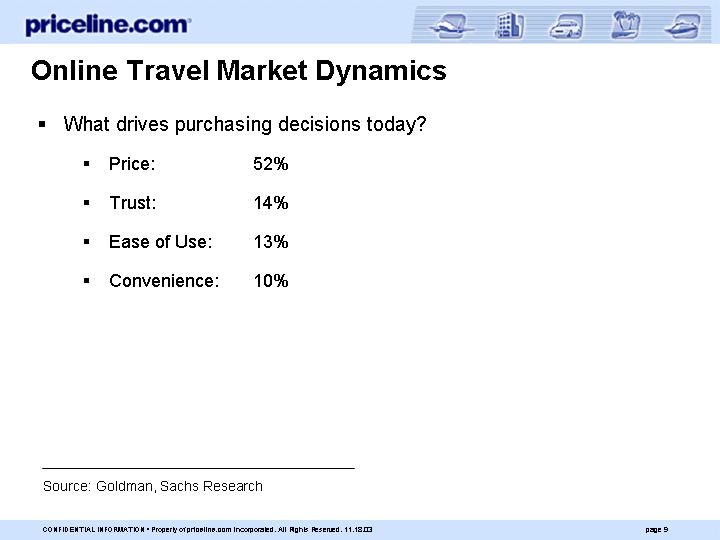
• What drives purchasing decisions today?
• Price: | 52 | % |
| | |
• Trust: | 14 | % |
| | |
• Ease of Use: | 13 | % |
| | |
• Convenience: | 10 | % |
Source: Goldman, Sachs Research
9
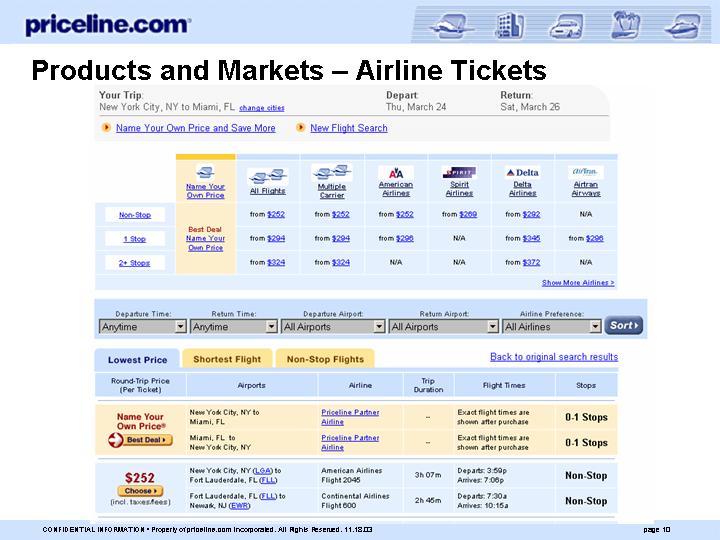
Products and Markets – Airline Tickets
[GRAPHIC]
10
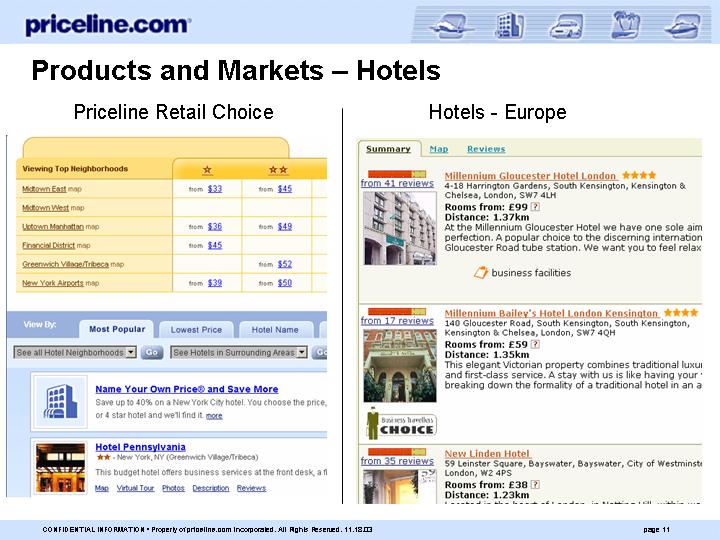
Products and Markets – Hotels
Priceline Retail Choice
[GRAPHIC]
Hotels - - Europe
[GRAPHIC]
11
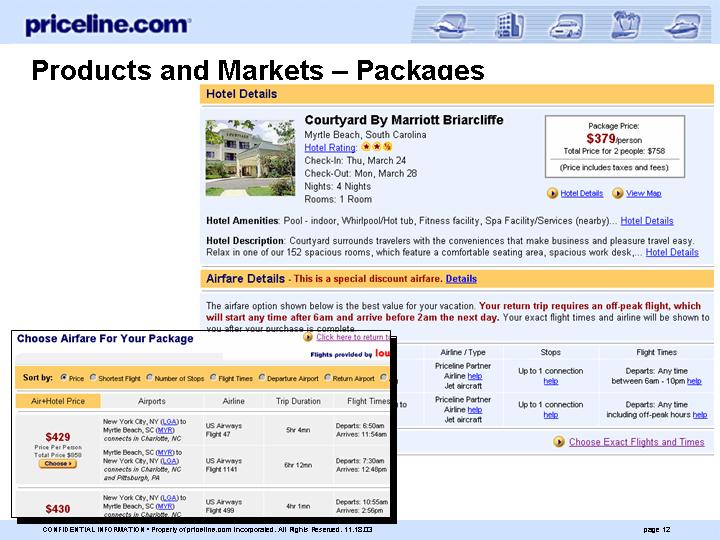
Products and Markets – Packages
[GRAPHIC]
12
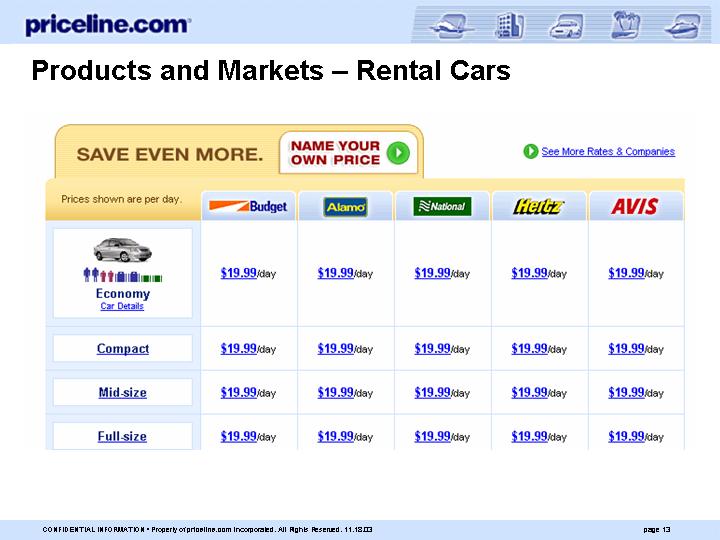
Products and Markets – Rental Cars
[GRAPHIC]
13
Products and Markets
• Full array of disclosed product with competitive inventory and pricing
• Opaque savings:
• Airline tickets: | Up to 30% savings off published |
| |
• Hotels: | Up to 40% savings vs. Expedia, Hotels.com, Travelocity |
| |
• Packages: | Save up to $200 |
| |
• Rental Cars: | Up to 25% savings off published |
14
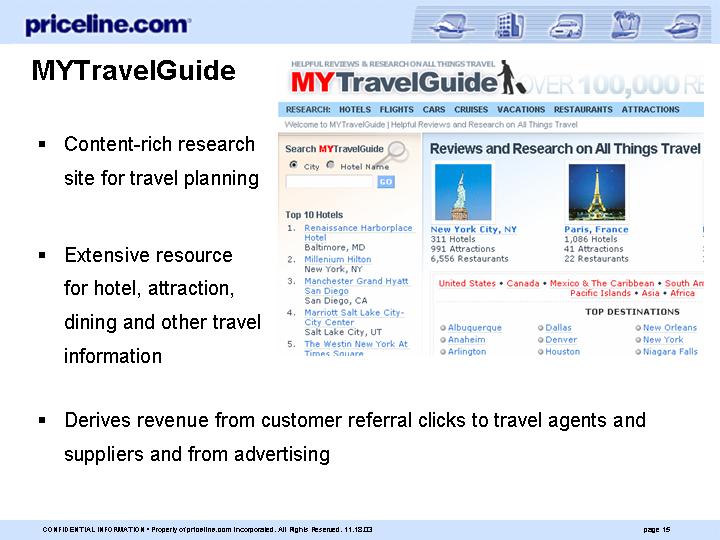
MYTravelGuide
[GRAPHIC]
• Content-rich research site for travel planning
• Extensive resource for hotel, attraction, dining and other travel information
• Derives revenue from customer referral clicks to travel agents and suppliers and from advertising
15
Active Hotels
• Leading European hotel reservation service
• $69M in gross bookings in Q1 2005
• 10,000+ hotels throughout Europe, including UK, France, Spain, Italy and Germany
• Rapid growth in bookings and solid profitability
• Expanding in continental Europe
16
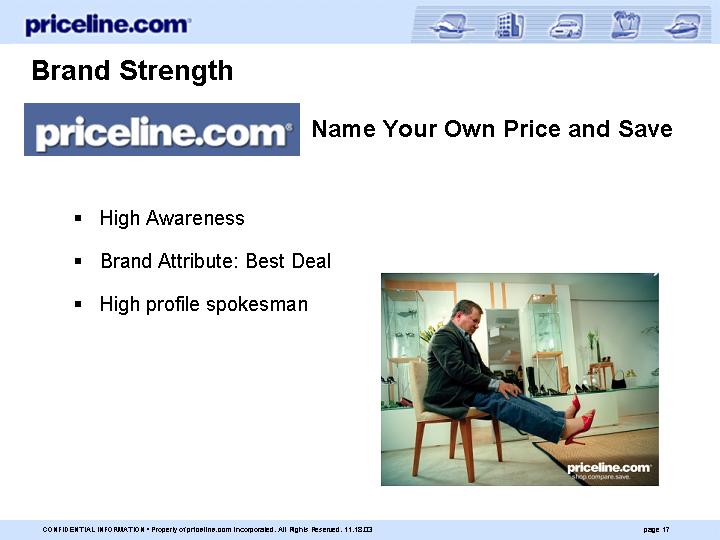
Brand Strength
[LOGO] Name Your Own Price and Save
• High Awareness
• Brand Attribute: Best Deal
• High profile spokesman
[GRAPHIC]
17
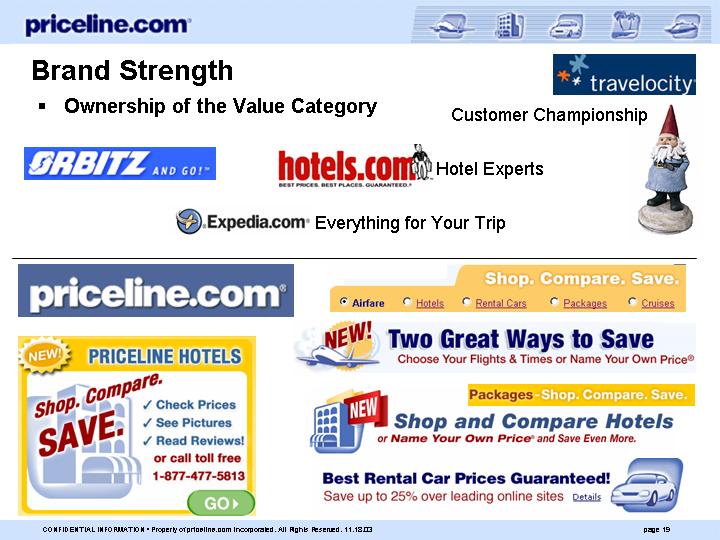
Brand Strength
• Ownership of the Value Category
[LOGO] |
|
Customer Championship | |
|
[LOGO] |
[LOGO] Hotel Experts |
|
[LOGO] |
|
[LOGO] Everything for Your Trip |
[GRAPHIC]
19
• 2004
• Separate positioning for products
• Air: Choice + Savings
• Hotel: Savings
• 2005
• All products have same choice and savings message:
• Shop, Compare and Save
• New advertising campaign featuring William Shatner
• [Run Bed Store and Shoe Store spots]
20
Financial Strength – Investing in the Business
• Income Statement – Pro Forma EPS doubled in 2003 and 2004
• Ad spend up $18M in 2004
• Built new air, hotel, package and rental product offerings
• Balance Sheet
• $225M convertible debt financing
• Acquisitions of Travelweb, Active Hotels and retail URLs
• Cash balance at March 31, 2005 of $266M
21
Summary – Drivers of Growth
• Online Travel Market Dynamics
• Products and Markets
• Brand Strength
• Financial Strength
22