UNITED STATES
SECURITIES AND EXCHANGE COMMISSION
Washington, D.C. 20549
FORM N-CSR
CERTIFIED SHAREHOLDER REPORT OF REGISTERED
MANAGEMENT INVESTMENT COMPANIES
Investment Company Act file number 811-09223
Pioneer Series Trust XIV
(Exact name of registrant as specified in charter)
60 State Street, Boston, MA 02109
(Address of principal executive offices) (ZIP code)
Christopher J. Kelley, Amundi Asset Management, Inc.,
60 State Street, Boston, MA 02109
(Name and address of agent for service)
Registrant’s telephone number, including area code: (617) 742-7825
Date of fiscal year end: September 30, 2023
Date of reporting period: October 1, 2022 through September 30, 2023
Form N-CSR is to be used by management investment companies to file reports with the Commission not later than 10 days after the transmission to stockholders of any report that is required to be transmitted to stockholders under Rule 30e-1 under the Investment Company Act of 1940 (17 CFR 270.30e-1). The Commission may use the information provided on Form N-CSR in its regulatory, disclosure review, inspection, and policymaking roles.
A registrant is required to disclose the information specified by Form N-CSR, and the Commission will make this information public. A registrant is not required to respond to the collection of information contained in Form N-CSR unless the Form displays a currently valid Office of Management and Budget (“OMB”) control number. Please direct comments concerning the accuracy of the information collection burden estimate and any suggestions for reducing the burden to Secretary, Securities and Exchange Commission, 450 Fifth Street, NW, Washington, DC 20549-0609. The OMB has reviewed this collection of information under the clearance requirements of 44 U.S.C. ss. 3507.
ITEM 1. REPORTS TO STOCKHOLDERS.
Pioneer Strategic Income Fund
Annual Report | September 30, 2023
| | | | | |
| A: PSRAX | C: PSRCX | K: STRKX | R: STIRX | Y: STRYX |
visit us: www.amundi.com/us
Pioneer Strategic Income Fund | Annual Report | 9/30/231
President’s Letter
Dear Shareholders,
On February 13, 2023, Amundi US celebrated the 95th anniversary of Pioneer Fund, the second-oldest mutual fund in the United States. We recognized the anniversary with ringing of the closing bell at the New York Stock Exchange, which seemed fitting for this special milestone.
Pioneer Fund was launched on February 13, 1928 by Phil Carret, one of the earliest proponents of value investing and a leading innovator in the asset management industry. Mr. Carret began investing in the 1920s and founded Pioneer Investments (now Amundi US) in 1928, and was one of the first investors to realize he could uncover value through rigorous, innovative, fundamental research techniques.
Consistent with Mr. Carret’s investment approach and employing many of the same techniques utilized in the 1920s, Amundi US's portfolio managers have adapted Mr. Carret’s philosophy to a new age of “active” investing.
The last few years have seen investors face some unprecedented challenges, from a global pandemic that shuttered much of the world’s economy for months, to geopolitical strife, to rising inflation that has reached levels not seen in decades. Now, more than ever, Amundi US believes active management – that is, making active investment decisions across all of our portfolios – can help mitigate risk during periods of market volatility.
At Amundi US, active management begins with our own fundamental, bottom-up research process. Our team of dedicated research analysts and portfolio managers analyzes each security under consideration, communicating frequently with the management teams of the companies and other entities issuing the securities, and working together to identify those securities that we believe best meet our investment criteria for our family of funds. Our risk management approach begins with each security under consideration, as we strive to develop a deep understanding of the potential opportunity, while considering any potential risk factors.
Today, as shareholders, we have many options. It is our view that active management can serve shareholders well, not only when markets are thriving, but also during periods of market stress. As you consider your long-term investment goals, we encourage you to work with your financial professional to develop an investment plan that paves the way for you to pursue both your short-term and long-term goals.
2Pioneer Strategic Income Fund | Annual Report | 9/30/23
We greatly appreciate the trust you have placed in us and look forward to continuing to serve you in the future.
Lisa M. Jones
Head of the Americas, President and CEO of US
Amundi Asset Management US, Inc.
November 2023
Any information in this shareowner report regarding market or economic trends or the factors influencing the Fund’s historical or future performance are statements of opinion as of the date of this report. Past performance is no guarantee of future results.
Pioneer Strategic Income Fund | Annual Report | 9/30/233
Portfolio Management Discussion | 9/30/23
In the following interview, Andrew Feltus and Jonathan Scott discuss the factors that affected the performance of Pioneer Strategic Income Fund during the 12-month period ended September 30, 2023. Mr. Feltus, CFA, Managing Director, Co-Director of High Yield, and a portfolio manager at Amundi Asset Management US, Inc. (Amundi US), and Mr. Scott, a senior vice president, Deputy Director of Multi-Sector Fixed Income, and a portfolio manager at Amundi US, are responsible for the day-to-day management of the Fund, along with Brad Komenda, Managing Director, Director of Investment Grade Corporates, and a portfolio manager at Amundi US, and Kenneth J. Taubes, Executive Vice President, Chief Investment Officer, US, and a portfolio manager at Amundi US.
| Q | How did the Fund perform during the 12-month period ended September 30, 2023? |
| A | Pioneer Strategic Income Fund’s Class A shares returned 1.91% at net asset value during the 12-month period ended September 30, 2023, while the Fund’s benchmark, the Bloomberg US Universal Index (the Bloomberg Index), returned 1.61%. During the same period, the average return of the 355 mutual funds in Morningstar’s Multisector Bond Funds category was 4.95%. |
| Q | How would you describe the market environment for fixed-income investments during the 12-month period ended September 30, 2023? |
| A | The period opened in the wake of a series of aggressive Federal Reserve (Fed) interest-rate increases as the US central bank sought to counter rising levels of inflation, which had peaked at over 9% in June of 2022. The Fed’s determined stance had brought the target for its benchmark federal funds rate from 0.00% – 0.25% in March of 2022, to 3.00% – 3.25% entering October 2022. In addition, the US Treasury yield curve, which had moved notably higher in response to the Fed’s actions, became inverted as the market anticipated a recession. (A yield curve is a line that plots the interest rates, at a set point in time, of bonds having equal credit quality but differing maturity dates. An inverted yield curve means that longer-term rates are lower than shorter-term rates.) |
| | With inflation showing signs of modest easing at the start of the period at the end of September 2022, investors began to |
4Pioneer Strategic Income Fund | Annual Report | 9/30/23
| | anticipate a pivot by the Fed to a more dovish policy stance on monetary policy after several months of interest-rate increases. That optimism led to strong returns for bonds in both October and November 2022, despite the Fed’s increase to the federal funds rate target range of another 75 basis points (bps) in November. (A basis point is equal to 1/100th of a percentage point.) In December, however, after a solid start to the fourth quarter, the market soon turned its attention to the potential recessionary effects of the higher interest-rate regime put in place by the Fed, which led riskier assets, including corporate bonds, to give back some of their gains from earlier in the quarter as the month progressed. In addition, the Fed implemented a more modest 50 bps increase to the federal funds rate target range at its December meeting, leaving the target range at 4.25% – 4.50% at the end of 2022, its highest level since the fall of 2007. |
| | Entering 2023, riskier assets rallied again, amid renewed investor optimism that the Fed and other leading central banks were poised to stop raising interest rates. January 2023 saw Treasury yields pull back from their more recent highs on the outlook for a potential easing of monetary policy. That, in turn, boosted performance for bonds in general. In addition, the reopening of China’s economy as the Chinese government unwound its “Zero-COVID” policy eased concerns about slowing global economic growth. Against that backdrop, areas of the market that had lagged during the 2022 sell-off (such as growth stocks and corporate bonds) outperformed. On February 1, the Fed increased the federal funds rate target again, but this time by a comparatively moderate 25 bps, bringing the target range to 4.50% – 4.75%. |
| | In March, however, the failure of some regional US banks and the collapse of European lender Credit Suisse raised fears of a financial crisis. In response, the Fed implemented a new lending program to support bank liquidity, while market participants began to anticipate decreases in the federal funds rate target range by the Fed before the end of the calendar year. At its March 23 meeting, the Fed went forward with another modest 25 bps increase to the federal funds target, bringing the range to 4.75% ‒ 5.00%. The financial markets viewed that increase as an |
Pioneer Strategic Income Fund | Annual Report | 9/30/235
| | indication that the Fed believed the financial system, overall, remained on solid footing. |
| | With the unemployment rate hovering around record lows, in April the markets welcomed news of 2% first quarter gross domestic product (GDP) growth, driven by continued consumer strength. While high inflation and the strong labor market resulted in the Fed's signaling a higher terminal (ending) federal funds rate of 5.6%, markets were encouraged that the central bank was possibly nearing the end of its rate-hiking cycle. Corporate profits posted declines for both the first and second quarters of 2023, but investors embraced the very high percentage of earnings reports that came in above expectations. |
| | The Fed increased the federal funds target range by 25 bps in early May, bringing the range to 5.00% ‒ 5.25%, before taking a pause at its June meeting. On July 26, 2023, the Fed once again raised the federal funds target range by 25 bps, then the Fed took another pause at its September meeting, leaving the range at 5.25% ‒ 5.50% as of period-end. |
| | Most asset classes sold off in the third quarter of 2023, most notably in September, as US bond yields rose dramatically, driven by the Fed’s “higher for longer” monetary policy, coupled with the negative impact of higher Treasury issuance and increasing concerns about the US government’s budget deficit. In addition, weaker economic growth in China and Europe weighed on market sentiment. The yield on the 10-year Treasury ended September of 2023 at 4.58%, versus 3.83% 12 months earlier. |
| | Given the rise in Treasury yields and softening in investor sentiment towards credit-sensitive securities seen late in the 12-month period, performance for the broad fixed-income markets was muted for the 12 months ended September 30, 2023, as reflected in the Bloomberg Index’s modest return of 1.61%. Interest-rate-sensitive Treasuries were the biggest laggards within the Fund’s benchmark, while high-yield corporate bonds led performance. |
6Pioneer Strategic Income Fund | Annual Report | 9/30/23
| Q | What factors affected the Fund’s performance relative to the benchmark Bloomberg Index during the 12-month period ended September 30, 2023? |
| A | As a multisector fixed-income strategy, the Fund seeks to deliver competitive returns while delivering volatility similar to its benchmark by investing across a diversified range of investment-grade and non-investment-grade global fixed-income asset classes. The investment strategy seeks to add value through both sector allocation and security selection, focusing on “spread” sectors that trade at a yield advantage relative to US Treasuries. These include sectors such as corporate bonds, agency mortgage-backed securities (MBS), securitized credit assets, and emerging markets debt that typically have offered higher risk-adjusted returns than Treasuries as well as greater security selection opportunities. Taking a dynamic approach to sector allocation, we may consider increasing the Fund’s risk profile when we feel markets are offering significant compensation for risk, and reduce risk when markets are offering less attractive value. |
| | The Fund’s overall security selection results contributed positively to benchmark-relative returns for the 12-month period, while positioning with respect to interest rates detracted from relative performance. |
| | Within the Fund’s allocation to investment-grade corporates, exposure to issuers within both the industrials and financials sectors benefited relative performance. Within industrials, a position in an airline manufacturer highlighted positive contributions, along with exposure to energy-related credits as oil prices rose over the course of the period. Holdings of a gold producer also performed well. The Fund’s positioning within financials benefited from a rally in European banks during the first quarter of 2023, as well as from holdings of an aircraft leasing firm. More broadly, a portfolio bias toward higher-quality securities within the Fund’s corporate exposures helped benchmark-relative performance. |
| | Sector allocation results also contributed modestly to the Fund’s relative performance for the 12-month period. Specifically, a significant underweight to Treasuries and an overweight to non-agency MBS aided the Fund’s benchmark-relative results. In |
Pioneer Strategic Income Fund | Annual Report | 9/30/237
| | addition, an approximately 4% portfolio exposure to insurance-linked securities (ILS) benefited the Fund’s relative returns, as did the portfolio’s non-US dollar (USD) exposures, most notably the portfolio’s allocations to the Polish zloty and the Korean won. |
| | During a period in which the Fund outperformed its benchmark, the one key detractor from relative performance was the portfolio's positioning with respect to interest rates. Specifically, the Fund had an above-benchmark stance with respect to duration and corresponding interest-rate sensitivity. That positioning detracted from relative performance as Treasury yields rose. (Duration is a measure of the sensitivity of the price, or the value of principal, of a fixed-income investment to a change in interest rates, expressed as a number of years.) |
| Q | Did the Fund have any investments in derivative securities during the 12-month period ended September 30, 2023? |
| A | Yes, the Fund did have investments in three types of derivatives: Treasury futures, index-based credit-default-swap contracts (CDX), and forward foreign currency contracts (“currency forwards”). We used Treasury futures to help manage portfolio duration. The use of futures had a negative impact on the Fund’s relative results. We used the CDX positions in an effort to manage the Fund’s exposure to credit-sensitive sectors; the CDX used for hedging purposes (short exposure) detracted from the Fund’s relative returns, while longer-exposure CDX helped the Fund’s relative performance. The Fund’s exposure to currency forwards was a technique used as part of our efforts to manage the risks associated with investing the portfolio in non-USD currencies. The tactic had a mixed impact on the Fund's benchmark-relative results, as long exposures helped performance while shorter exposures (hedges) detracted. |
| Q | Did the Fund’s distributions* (or yield) to shareholders change during the 12-month period ended September 30, 2023? |
| A | The Fund’s monthly distribution rate experienced a slight uptick over the 12-month period as interest rates continued to move higher. |
| * | Distributions are not guaranteed. |
8Pioneer Strategic Income Fund | Annual Report | 9/30/23
| Q | What is your investment outlook? |
| A | While recent economic data may show signs consistent with a domestic “soft landing,” in which growth slows but remains positive while inflation is brought under control, we are wary of extrapolating the current growth signals too far into the future. Consumer spending has been waning after a summer boost, business sentiment has been softening, and the still-tight US labor market has been cooling. In addition, higher interest rates and tighter lending conditions are just starting to take their toll on businesses. In a “higher for longer” interest-rate environment, businesses may encounter increasing difficulty with regard to carrying higher interest expenses and eventually rolling over maturing loans. We expect economic growth will slow in the coming quarters, and while it may take into early 2024 to know if the economy has a soft or hard landing, we continue to view the odds of a soft landing as relatively low. |
| | The recent rise in yields has been rapid and significant. Since the Fed’s last rate increase on July 26, 10-year Treasury yields have moved from 3.86% to 4.58%. The rise in long-term Treasury rates is likely not due to higher expected inflation, in our view. Rather, it appears the bond market is currently discounting a “higher for forever” scenario, in which the Fed’s “neutral” rate has increased substantially. |
| | We view longer-term interest rates as fundamentally attractive and well above fair value, but recognize that rates could move higher in the short term as investors reposition in response to recent volatility. In terms of sector exposures, agency MBS appear increasingly attractive to us, following recent spread widening (Credit spreads are commonly defined as the differences in yield between Treasuries and other types of fixed-income securities with similar maturities.) We remain relatively cautious with regard to the portfolio’s exposures to both corporate credit and securitized credit, with a higher-quality bias, given narrower-than-average spreads and elevated prospects for a slowing economy on the horizon. |
Pioneer Strategic Income Fund | Annual Report | 9/30/239
Please refer to the Schedule of Investments on pages 21 - 95 for a full listing of Fund securities.
All investments are subject to risk, including the possible loss of principal. In the past several years, financial markets have experienced increased volatility and heightened uncertainty. The market prices of securities may go up or down, sometimes rapidly or unpredictably, due to general market conditions, such as real or perceived adverse economic, political, or regulatory conditions, recessions, inflation, changes in interest or currency rates, lack of liquidity in the bond markets, the spread of infectious illness or other public health issues, armed conflict including Russia's military invasion of Ukraine, sanctions against Russia, other nations or individuals or companies and possible countermeasures, market disruptions caused by tariffs, trade disputes or other government actions, or adverse investor sentiment. These conditions may continue, recur, worsen or spread.
Until recently, a commonly used reference rate for floating rate securities was LIBOR (London Interbank Offered Rate). Publication of most LIBOR settings has ceased on a representative basis. The impact of the transition from LIBOR on the Fund's transactions and financial markets generally cannot yet be determined.
Investments in high-yield or lower rated securities are subject to greater-than average price volatility, illiquidity and possibility of default.
The market price of securities may fluctuate when interest rates change.When interest rates rise, the prices of fixed-income securities in the Fund will generally fall. Conversely, when interest rates fall, the prices of fixed-income securities in the Fund will generally rise.
Investments in the Fund are subject to possible loss due to the financial failure of issuers of underlying securities and their inability to meet their debt obligations.
Prepayment risk is the chance that an issuer may exercise its right to prepay its security, if falling interest rates prompt the issuer to do so. Forced to reinvest the unanticipated proceeds at lower interest rates, the Fund would experience a decline in income and lose the opportunity for additional price appreciation.
The securities issued by U.S. Government-sponsored entities (e.g., FNMA, Freddie Mac) are neither guaranteed nor issued by the U.S. Government.
The portfolio may invest in mortgage-backed securities, which during times of fluctuating interest rates may increase or decrease more than other fixed income securities. Mortgage-backed securities are also subject to prepayments.
10Pioneer Strategic Income Fund | Annual Report | 9/30/23
Investing in foreign and/or emerging markets securities involves risks relating to interest rates, currency exchange rates, economic, and political conditions.
For more information on this or any Pioneer fund, please visit amundi.com/usinvestors or call 1-800-622-9876. This material must be preceded or accompanied by the Fund's current prospectus or summary prospectus.
Any information in this shareholder report regarding market or economic trends or the factors influencing the Fund’s historical or future performance are statements of opinion as of the date of this report. Past performance is no guarantee of future results.
Pioneer Strategic Income Fund | Annual Report | 9/30/2311
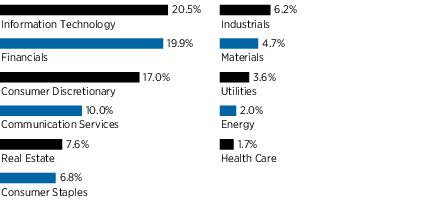
Portfolio Summary | 9/30/23
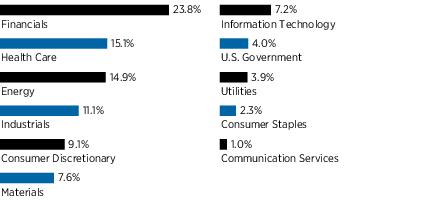
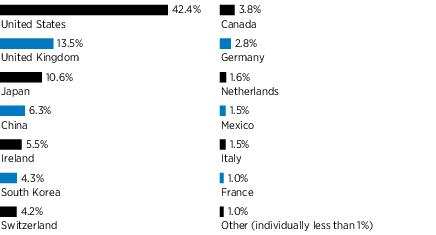
Portfolio Diversification
(As a percentage of total investments)*
+ Amount rounds to less than 0.1%.
10 Largest Holdings
| (As a percentage of total investments)* |
| 1. | U.S. Treasury Notes, 4.50%, 9/30/30 | 5.80% |
| 2. | U.S. Treasury Bonds, 4.375%, 8/15/43 | 2.22 |
| 3. | U.S. Treasury Bills, 10/24/23 | 2.12 |
| 4. | U.S. Treasury Notes, 3.50%, 2/15/33 | 1.93 |
| 5. | U.S. Treasury Bonds, 2.25%, 2/15/52 | 1.20 |
| 6. | Wells Fargo & Co., 7.50% | 1.06 |
| 7. | Federal National Mortgage Association, 6.00%, 10/1/53 | 0.81 |
| 8. | U.S. Treasury Inflation Indexed Bonds, 1.50%, 2/15/53 | 0.77 |
| 9. | Federal National Mortgage Association, 1.50%, 11/1/41 | 0.74 |
| 10. | Federal National Mortgage Association, 2.50%, 10/1/53 (TBA) | 0.70 |
| | |
| * | Excludes short-term investments, TBA Sale Commitments and all derivative contracts except for options purchased. The Fund is actively managed, and current holdings may be different. The holdings listed should not be considered recommendations to buy or sell any securities. |
12Pioneer Strategic Income Fund | Annual Report | 9/30/23
Prices and Distributions | 9/30/23
Net Asset Value per Share
| Class | 9/30/23 | 9/30/22 |
| A | $8.91 | $9.05 |
| C | $8.71 | $8.85 |
| K | $8.92 | $9.07 |
| R | $9.07 | $9.21 |
| Y | $8.91 | $9.05 |
| | | |
Distributions per Share: 10/1/22 - 9/30/23
| Class | Net
Investment
Income | Short-Term
Capital Gains | Long-Term
Capital Gains |
| A | $0.3169 | $— | $— |
| C | $0.2515 | $— | $— |
| K | $0.3609 | $— | $— |
| R | $0.2914 | $— | $— |
| Y | $0.3509 | $— | $— |
Index Definitions
The Bloomberg U.S. Universal Index is an unmanaged index that represents the union of the U.S. Aggregate Index, the U.S. High Yield Corporate Index, the 144A Index, the Eurodollar Index, the Emerging Markets Index, the non-ERISA portion of the CMBS Index, and the CMBS High Yield Index. Municipal debt, private placements and non-dollar-denominated issues are excluded. Indices are unmanaged and their returns assume reinvestment of dividends and do not reflect any fees or expenses. It is not possible to invest directly in an index.
The index defined here pertains to the “Value of $10,000 Investment” and “Value of $5 Million Investment” charts on pages 14 - 18.
Pioneer Strategic Income Fund | Annual Report | 9/30/2313
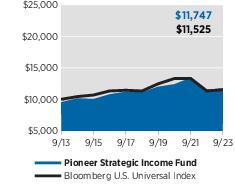
| Performance Update | 9/30/23 | Class A Shares |
Investment Returns
The mountain chart on the right shows the change in value of a $10,000 investment made in Class A shares of Pioneer Strategic Income Fund at public offering price during the periods shown, compared to that of the Bloomberg U.S. Universal Index.
Average Annual Total Returns
(As of September 30, 2023) |
| Period | Net
Asset
Value
(NAV) | Public
Offering
Price
(POP) | Bloomberg
U.S.
Universal
Index |
| 10 Years | 2.09% | 1.62% | 1.43% |
| 5 Years | 1.03 | 0.11 | 0.34 |
| 1 Year | 1.91 | -2.71 | 1.61 |
Expense Ratio
(Per prospectus dated February 1, 2023) |
| Gross |
| 1.03% |
Value of $10,000 Investment
Call 1-800-225-6292 or visit www.amundi.com/us for the most recent month-end performance results. Current performance may be lower or higher than the performance data quoted.
The performance data quoted represents past performance, which is no guarantee of future results. Investment return and principal value will fluctuate, and shares, when redeemed, may be worth more or less than their original cost.
NAV results represent the percent change in net asset value per share. NAV returns would have been lower had sales charges been reflected. POP returns reflect deduction of maximum 4.50% sales charge. All results are historical and assume the reinvestment of dividends and capital gains. Other share classes are available for which performance and expenses will differ.
Performance results reflect any applicable expense waivers in effect during the periods shown. Without such waivers Fund performance would be lower. Waivers may not be in effect for all funds. Certain fee waivers are contractual through a specified period. Otherwise, fee waivers can be rescinded at any time. See the prospectus and financial statements for more information.
The performance table and graph do not reflect the deduction of fees and taxes that a shareowner would pay on Fund distributions or the redemption of Fund shares.
Please refer to the financial highlights for a more current expense ratio.
14Pioneer Strategic Income Fund | Annual Report | 9/30/23
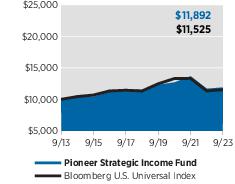
| Performance Update | 9/30/23 | Class C Shares |
Investment Returns
The mountain chart on the right shows the change in value of a $10,000 investment made in Class C shares of Pioneer Strategic Income Fund during the periods shown, compared to that of the Bloomberg U.S. Universal Index.
Average Annual Total Returns
(As of September 30, 2023) |
| Period | If
Held | If
Redeemed | Bloomberg
U.S.
Universal
Index |
| 10 Years | 1.41% | 1.41% | 1.43% |
| 5 Years | 0.36 | 0.36 | 0.34 |
| 1 Year | 1.21 | 0.23 | 1.61 |
Expense Ratio
(Per prospectus dated February 1, 2023) |
| Gross |
| 1.68% |
Value of $10,000 Investment
Call 1-800-225-6292 or visit www.amundi.com/us for the most recent month-end performance results. Current performance may be lower or higher than the performance data quoted.
The performance data quoted represents past performance, which is no guarantee of future results. Investment return and principal value will fluctuate, and shares, when redeemed, may be worth more or less than their original cost.
Class C shares held for less than one year are also subject to a 1% contingent deferred sales charge (CDSC). “If Held” results represent the percent change in net asset value per share. “If Redeemed” returns reflect deduction of the CDSC for the one-year period, assuming a complete redemption of shares at the last price calculated on the last business day of the period, and no CDSC for the five- and 10-year periods. All results are historical and assume the reinvestment of dividends and capital gains. Other share classes are available for which performance and expenses will differ.
Performance results reflect any applicable expense waivers in effect during the periods shown. Without such waivers Fund performance would be lower. Waivers may not be in effect for all funds. Certain fee waivers are contractual through a specified period. Otherwise, fee waivers can be rescinded at any time. See the prospectus and financial statements for more information.
The performance table and graph do not reflect the deduction of fees and taxes that a shareowner would pay on Fund distributions or the redemption of Fund shares.
Please refer to the financial highlights for a more current expense ratio.
Pioneer Strategic Income Fund | Annual Report | 9/30/2315
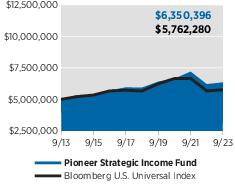
| Performance Update | 9/30/23 | Class K Shares |
Investment Returns
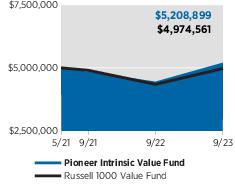
The mountain chart on the right shows the change in value of a $5 million investment made in Class K shares of Pioneer Strategic Income Fund during the periods shown, compared to that of the Bloomberg U.S. Universal Index.
Average Annual Total Returns
(As of September 30, 2023) |
| Period | Net
Asset
Value
(NAV) | Bloomberg
U.S.
Universal
Index |
| 10 Years | 2.52% | 1.43% |
| 5 Years | 1.46 | 0.34 |
| 1 Year | 2.28 | 1.61 |
Expense Ratio
(Per prospectus dated February 1, 2023) |
| Gross | Net |
| 0.61% | 0.59% |
Value of $5 Million Investment
Call 1-800-225-6292 or visit www.amundi.com/us for the most recent month-end performance results. Current performance may be lower or higher than the performance data quoted.
The performance data quoted represents past performance, which is no guarantee of future results. Investment return and principal value will fluctuate, and shares, when redeemed, may be worth more or less than their original cost.
Class K shares are not subject to sales charges and are available for limited groups of eligible investors, including institutional investors. All results are historical and assume the reinvestment of dividends and capital gains. Other share classes are available for which performance and expenses will differ.
The net expense ratio reflects the contractual expense limitation currently in effect through February 1, 2025 for Class K shares. There can be no assurance that Amundi US will extend the expense limitation beyond such time. Please see the prospectus and financial statements for more information.
Performance results shown reflect any applicable expense waivers in effect during the periods shown. Without such waivers Fund performance would be lower. Waivers may not be in effect for all funds. Certain fee waivers are contractual through a specified period. Otherwise, fee waivers can be rescinded at any time. See the prospectus and financial statements for more information.
The performance table and graph do not reflect the deduction of fees and taxes that a shareowner would pay on Fund distributions or the redemption of Fund shares.
Please refer to the financial highlights for more current expense ratios.
16Pioneer Strategic Income Fund | Annual Report | 9/30/23
| Performance Update | 9/30/23 | Class R Shares |
Investment Returns
The mountain chart on the right shows the change in value of a $10,000 investment made in Class R shares of Pioneer Strategic Income Fund during the periods shown, compared to that of the Bloomberg U.S. Universal Index.
Average Annual Total Returns
(As of September 30, 2023) |
| Period | Net
Asset
Value
(NAV) | Bloomberg
U.S.
Universal
Index |
| 10 Years | 1.75% | 1.43% |
| 5 Years | 0.70 | 0.34 |
| 1 Year | 1.60 | 1.61 |
Expense Ratio
(Per prospectus dated February 1, 2023) |
| Gross |
| 1.36% |
Value of $10,000 Investment
Call 1-800-225-6292 or visit www.amundi.com/us for the most recent month-end performance results. Current performance may be lower or higher than the performance data quoted.
The performance data quoted represents past performance, which is no guarantee of future results. Investment return and principal value will fluctuate, and shares, when redeemed, may be worth more or less than their original cost.
Class R shares are not subject to sales charges and are available for limited groups of eligible investors, including institutional investors. All results are historical and assume the reinvestment of dividends and capital gains. Other share classes are available for which performance and expenses will differ.
Performance results reflect any applicable expense waivers in effect during the periods shown. Without such waivers Fund performance would be lower. Waivers may not be in effect for all funds. Certain fee waivers are contractual through a specified period. Otherwise, fee waivers can be rescinded at any time. See the prospectus and financial statements for more information.
The performance table and graph do not reflect the deduction of fees and taxes that a shareowner would pay on Fund distributions or the redemption of Fund shares.
Please refer to the financial highlights for a more current expense ratio.
Pioneer Strategic Income Fund | Annual Report | 9/30/2317
| Performance Update | 9/30/23 | Class Y Shares |
Investment Returns
The mountain chart on the right shows the change in value of a $5 million investment made in Class Y shares of Pioneer Strategic Income Fund during the periods shown, compared to that of the Bloomberg U.S. Universal Index.
Average Annual Total Returns
(As of September 30, 2023) |
| Period | Net
Asset
Value
(NAV) | Bloomberg
U.S.
Universal
Index |
| 10 Years | 2.42% | 1.43% |
| 5 Years | 1.37 | 0.34 |
| 1 Year | 2.28 | 1.61 |
Expense Ratio
(Per prospectus dated February 1, 2023) |
| Gross | Net |
| 0.71% | 0.69% |
Value of $5 Million Investment
Call 1-800-225-6292 or visit www.amundi.com/us for the most recent month-end performance results. Current performance may be lower or higher than the performance data quoted.
The performance data quoted represents past performance, which is no guarantee of future results. Investment return and principal value will fluctuate, and shares, when redeemed, may be worth more or less than their original cost.
Class Y shares are not subject to sales charges and are available for limited groups of eligible investors, including institutional investors. All results are historical and assume the reinvestment of dividends and capital gains. Other share classes are available for which performance and expenses will differ.
Performance results reflect any applicable expense waivers in effect during the periods shown. Without such waivers Fund performance would be lower. Waivers may not be in effect for all funds. Certain fee waivers are contractual through a specified period. Otherwise, fee waivers can be rescinded at any time. See the prospectus and financial statements for more information.
The net expense ratio reflects the contractual expense limitation in effect through February 1, 2025 for Class Y shares. There can be no assurance that Amundi US will extend the expense limitation beyond such time. Please see the prospectus and financial statements for more information.
The performance table and graph do not reflect the deduction of fees and taxes that a shareowner would pay on Fund distributions or the redemption of Fund shares.
Please refer to the financial highlights for more current expense ratios.
18Pioneer Strategic Income Fund | Annual Report | 9/30/23
Comparing Ongoing Fund Expenses
As a shareowner in the Fund, you incur two types of costs:
| (1) | ongoing costs, including management fees, distribution and/or service (12b-1) fees, and other Fund expenses; and |
| (2) | transaction costs, including sales charges (loads) on purchase payments. |
This example is intended to help you understand your ongoing expenses (in dollars) of investing in the Fund and to compare these costs with the ongoing costs of investing in other mutual funds. The example is based on an investment of $1,000 at the beginning of the Fund’s latest six-month period and held throughout the six months.
Using the Tables
Actual Expenses
The first table below provides information about actual account values and actual expenses. You may use the information in this table, together with the amount you invested, to estimate the expenses that you paid over the period as follows:
| (1) | Divide your account value by $1,000
Example: an $8,600 account value ÷ $1,000 = 8.6 |
| (2) | Multiply the result in (1) above by the corresponding share class’s number in the third row under the heading entitled “Expenses Paid During Period” to estimate the expenses you paid on your account during this period. |
Expenses Paid on a $1,000 Investment in Pioneer Strategic Income Fund
Based on actual returns from April 1, 2023 through September 30, 2023.
| Share Class | A | C | K | R | Y |
Beginning Account
Value on 4/1/23 | $1,000.00 | $1,000.00 | $1,000.00 | $1,000.00 | $1,000.00 |
Ending Account Value
(after expenses) on 9/30/23 | $974.40 | $971.30 | $976.70 | $972.60 | $977.30 |
Expenses Paid
During Period* | $5.25 | $8.40 | $2.92 | $6.68 | $3.42 |
| | |
| * | Expenses are equal to the Fund’s annualized expense ratio of 1.06%, 1.70%, 0.59%, 1.35%, and 0.69% for Class A, Class C, Class K, Class R, and Class Y shares, respectively, multiplied by the average account value over the period, multiplied by 183/365 (to reflect the one-half year period). |
Pioneer Strategic Income Fund | Annual Report | 9/30/2319
Comparing Ongoing Fund Expenses (continued)
Hypothetical Example for Comparison Purposes
The table below provides information about hypothetical account values and hypothetical expenses based on the Fund’s actual expense ratio and an assumed rate of return of 5% per year before expenses, which is not the Fund’s actual return. The hypothetical account values and expenses may not be used to estimate the actual ending account balance or expenses you paid for the period.
You may use this information to compare the ongoing costs of investing in the Fund and other funds. To do so, compare this 5% hypothetical example with the 5% hypothetical examples that appear in the shareholder reports of the other funds.
Please note that the expenses shown in the tables are meant to highlight your ongoing costs only and do not reflect any transaction costs, such as sales charges (loads) that are charged at the time of the transaction. Therefore, the table below is useful in comparing ongoing costs only and will not help you determine the relative total costs of owning different funds. In addition, if these transaction costs were included, your costs would have been higher.
Expenses Paid on a $1,000 Investment in Pioneer Strategic Income Fund
Based on a hypothetical 5% return per year before expenses, reflecting the period from April 1, 2023 through September 30, 2023.
| Share Class | A | C | K | R | Y |
Beginning Account
Value on 4/1/23 | $1,000.00 | $1,000.00 | $1,000.00 | $1,000.00 | $1,000.00 |
Ending Account Value
(after expenses) on 9/30/23 | $1,019.75 | $1,016.55 | $1,022.11 | $1,018.30 | $1,021.61 |
Expenses Paid
During Period* | $5.37 | $8.59 | $2.99 | $6.83 | $3.50 |
| | |
| * | Expenses are equal to the Fund’s annualized expense ratio of 1.06%, 1.70%, 0.59%, 1.35%, and 0.69% for Class A, Class C, Class K, Class R, and Class Y shares, respectively, multiplied by the average account value over the period, multiplied by 183/365 (to reflect the one-half year period). |
20Pioneer Strategic Income Fund | Annual Report | 9/30/23
Schedule of Investments | 9/30/23
Principal
Amount
USD ($) | | | | | | Value |
| | UNAFFILIATED ISSUERS — 103.2% | |
| | Senior Secured Floating Rate
Loan Interests — 0.6% of Net Assets*(a) | |
| | Chemicals-Diversified — 0.1% | |
| 1,891,200 | LSF11 A5 HoldCo LLC, Term Loan, 8.931% (Term SOFR + 350 bps), 10/15/28 | $ 1,846,284 |
| | Total Chemicals-Diversified | $1,846,284 |
|
|
| | Electric-Generation — 0.1% | |
| 2,545,000 | Generation Bridge Northeast LLC, Term Loan B, 9.566% (Term SOFR + 425 bps), 8/22/29 | $ 2,548,181 |
| | Total Electric-Generation | $2,548,181 |
|
|
| | Electronic Composition — 0.0%† | |
| 1,347,994 | Energy Acquisition LP, First Lien Initial Term Loan, 9.772% (Term SOFR + 425 bps), 6/26/25 | $ 1,337,674 |
| | Total Electronic Composition | $1,337,674 |
|
|
| | Finance-Special Purpose Banks — 0.0%† | |
| 1,258,784 | Bank of Industry, Ltd., Facility, 11.67% (Term SOFR + 600 bps), 12/11/23 | $ 1,261,459 |
| | Total Finance-Special Purpose Banks | $1,261,459 |
|
|
| | Medical-Wholesale Drug Distribution —
0.1% | |
| 3,150,225 | Owens & Minor, Inc., Term B-1 Loan, 9.166% (Term SOFR + 375 bps), 3/29/29 | $ 3,150,225 |
| | Total Medical-Wholesale Drug Distribution | $3,150,225 |
|
|
| | Metal Processors & Fabrication — 0.2% | |
| 5,710,434 | Grinding Media, Inc. (Molycop, Ltd.), First Lien Initial Term Loan, 9.53% (Term SOFR + 400 bps), 10/12/28 | $ 5,674,744 |
| 1,012,883 | WireCo WorldGroup, Inc., Initial Term Loan, 9.695% (Term SOFR + 425 bps), 11/13/28 | 1,013,516 |
| | Total Metal Processors & Fabrication | $6,688,260 |
|
|
| | Oil-Field Services — 0.0%† | |
| 299,535 | ProFrac Holdings II LLC, Term Loan, 12.78% (Term SOFR + 725 bps), 3/4/25 | $ 300,658 |
| | Total Oil-Field Services | $300,658 |
|
|
The accompanying notes are an integral part of these financial statements.
Pioneer Strategic Income Fund | Annual Report | 9/30/2321
Schedule of Investments | 9/30/23 (continued)
Principal
Amount
USD ($) | | | | | | Value |
| | Recreational Centers — 0.1% | |
| 2,711,800 | Fitness International LLC, Term B Loan, 8.769% (Term SOFR + 325 bps), 4/18/25 | $ 2,700,785 |
| | Total Recreational Centers | $2,700,785 |
|
|
| | Total Senior Secured Floating Rate Loan Interests
(Cost $19,728,306) | $19,833,526 |
|
|
| Shares | | | | | | |
| | Common Stocks — 0.1% of Net Assets | |
| | Automobile Components — 0.0%† | |
| 9,565,478(b) | Ascent CNR Corp., Class A | $ 956,548 |
| | Total Automobile Components | $956,548 |
|
|
| | Household Durables — 0.0%† | |
| 1,018,282(b) | Desarrolladora Homex SAB de CV | $ 701 |
| | Total Household Durables | $701 |
|
|
| | Oil, Gas & Consumable Fuels — 0.0%† | |
| 336(b) | Frontera Energy Corp. | $ 2,673 |
| | Total Oil, Gas & Consumable Fuels | $2,673 |
|
|
| | Paper & Forest Products — 0.0%† | |
| 162,828 | Emerald Plantation Holdings, Ltd. | $ — |
| | Total Paper & Forest Products | $— |
|
|
| | Passenger Airlines — 0.1% | |
| 128,171(b) + | Grupo Aeromexico SAB de CV | $ 1,654,768 |
| | Total Passenger Airlines | $1,654,768 |
|
|
| | Total Common Stocks
(Cost $2,712,800) | $2,614,690 |
|
|
Principal
Amount
USD ($) | | | | | | |
| | Asset Backed Securities — 8.6% of
Net Assets | |
| 500,000 | 321 Henderson Receivables III LLC, Series 2008-1A, Class C, 9.36%, 1/15/48 (144A) | $ 487,720 |
| 500,000 | 321 Henderson Receivables III LLC, Series 2008-1A, Class D, 10.81%, 1/15/50 (144A) | 494,477 |
The accompanying notes are an integral part of these financial statements.
22Pioneer Strategic Income Fund | Annual Report | 9/30/23
Principal
Amount
USD ($) | | | | | | Value |
| | Asset Backed Securities — (continued) | |
| 4,000,000(a) | 522 Funding CLO, Ltd., Series 2019-4A, Class E, 12.588% (3 Month Term SOFR + 726 bps), 4/20/30 (144A) | $ 3,608,132 |
| 4,750,000(a) | 522 Funding CLO, Ltd., Series 2019-5A, Class ER, 12.068% (3 Month Term SOFR + 676 bps), 4/15/35 (144A) | 4,239,907 |
| 3,500,000 | A10 Bridge Asset Financing LLC, Series 2019-B, Class D, 4.523%, 8/15/40 (144A) | 3,292,674 |
| 532,440 | Accelerated Assets LLC, Series 2018-1, Class B, 4.51%, 12/2/33 (144A) | 514,049 |
| 752,677 | Accelerated Assets LLC, Series 2018-1, Class C, 6.65%, 12/2/33 (144A) | 731,158 |
| 1,000,000 | Amur Equipment Finance Receivables X LLC, Series 2022-1A, Class E, 5.02%, 12/20/28 (144A) | 889,437 |
| 1,413,000 | Amur Equipment Finance Receivables XI LLC, Series 2022-2A, Class E, 9.32%, 10/22/29 (144A) | 1,350,830 |
| 5,250,000 | Amur Equipment Finance Receivables XII LLC, Series 2023-1A, Class D, 7.48%, 7/22/30 (144A) | 5,165,877 |
| 3,975,000(a) | Arbor Realty Commercial Real Estate Notes, Ltd., Series 2021-FL3, Class D, 7.647% (1 Month Term SOFR + 231 bps), 8/15/34 (144A) | 3,713,624 |
| 5,400,000(a) | Arbor Realty Commercial Real Estate Notes, Ltd., Series 2021-FL4, Class E, 8.847% (1 Month Term SOFR + 351 bps), 11/15/36 (144A) | 4,947,761 |
| 2,000,000 | Arivo Acceptance Auto Loan Receivables Trust, Series 2022-1A, Class D, 7.38%, 9/17/29 (144A) | 1,835,869 |
| 1,054,000(c) | B2R Mortgage Trust, Series 2015-1, Class D, 4.831%, 5/15/48 (144A) | 1,028,692 |
| 3,295,000(a) | Battalion CLO IX, Ltd., Series 2015-9A, Class ER, 11.82% (3 Month Term SOFR + 651 bps), 7/15/31 (144A) | 2,686,357 |
| 1,600,000(a) | Benefit Street Partners CLO XIX, Ltd., Series 2019-19A, Class D, 9.37% (3 Month Term SOFR + 406 bps), 1/15/33 (144A) | 1,582,141 |
| 3,755,393 | Blackbird Capital Aircraft, Series 2021-1A, Class B, 3.446%, 7/15/46 (144A) | 3,135,753 |
| 3,000,000(a) | Carlyle US CLO, Ltd., Series 2019-4A, Class CR, 8.508% (3 Month Term SOFR + 320 bps), 4/15/35 (144A) | 2,839,596 |
The accompanying notes are an integral part of these financial statements.
Pioneer Strategic Income Fund | Annual Report | 9/30/2323
Schedule of Investments | 9/30/23 (continued)
Principal
Amount
USD ($) | | | | | | Value |
| | Asset Backed Securities — (continued) | |
| 2,150,000 | Cascade MH Asset Trust, Series 2021-MH1, Class B1, 4.573%, 2/25/46 (144A) | $ 1,618,814 |
| 4,000,000(c) | Cascade MH Asset Trust, Series 2021-MH1, Class B3, 7.711%, 2/25/46 (144A) | 2,941,452 |
| 4,250,000(a) | Catskill Park CLO, Ltd., Series 2017-1A, Class D, 11.588% (3 Month Term SOFR + 626 bps), 4/20/29 (144A) | 3,877,564 |
| 1,250,000(c) | CFMT LLC, Series 2021-HB5, Class M4, 5.683%, 2/25/31 (144A) | 1,153,278 |
| 12,000,000(c) | CFMT LLC, Series 2021-HB7, Class M4, 5.072%, 10/27/31 (144A) | 10,804,297 |
| 7,465,000 | Cologix Canadian Issuer LP, Series 2022-1CAN, Class A2, 4.94%, 1/25/52 (144A) | 4,939,129 |
| 2,500,000 | Commercial Equipment Finance LLC, Series 2021-A, Class D, 6.49%, 12/17/29 (144A) | 2,347,813 |
| 70,511 | Commonbond Student Loan Trust, Series 2017-BGS, Class C, 4.44%, 9/25/42 (144A) | 56,920 |
| 4,155,000 | Continental Credit Card ABS LLC, Series 2019-1A, Class C, 6.16%, 8/15/26 (144A) | 4,004,615 |
| 6,550,000 | Continental Finance Credit Card ABS Master Trust, Series 2022-A, Class C, 9.33%, 10/15/30 (144A) | 6,176,348 |
| 3,000,000 | Continental Finance Credit Card ABS Master Trust, Series 2022-A, Class D, 12.42%, 10/15/30 (144A) | 2,784,984 |
| 1,000,000 | Crossroads Asset Trust, Series 2021-A, Class E, 5.48%, 1/20/28 (144A) | 970,269 |
| 2,300,000 | DataBank Issuer, Series 2021-1A, Class C, 4.43%, 2/27/51 (144A) | 1,821,836 |
| 854,906 | Diamond Resorts Owner Trust, Series 2019-1A, Class C, 4.02%, 2/20/32 (144A) | 854,443 |
| 6,000,000 | ExteNet LLC, Series 2019-1A, Class C, 5.219%, 7/25/49 (144A) | 5,690,677 |
| 9,460,000(c) | Finance of America HECM Buyout, Series 2022-HB1, Class M6, 9.317%, 2/25/32 (144A) | 7,362,677 |
| 7,657,186(d) | Finance of America Structured Securities Trust, Series 2021-S2, Class A2, 1.75%, 9/25/71 (144A) | 7,235,349 |
| 14,078,742(d) | Finance of America Structured Securities Trust, Series 2021-S3, Class A2, 2.25%, 12/28/26 (144A) | 12,513,976 |
The accompanying notes are an integral part of these financial statements.
24Pioneer Strategic Income Fund | Annual Report | 9/30/23
Principal
Amount
USD ($) | | | | | | Value |
| | Asset Backed Securities — (continued) | |
| 1,000,000(a) | First Eagle BSL CLO, Ltd., Series 2019-1A, Class C, 9.938% (3 Month Term SOFR + 461 bps), 1/20/33 (144A) | $ 948,673 |
| 3,000,000(a) | First Eagle BSL CLO, Ltd., Series 2019-1A, Class D, 13.288% (3 Month Term SOFR + 796 bps), 1/20/33 (144A) | 2,617,443 |
| 5,500,000 | Four Seas LP, Series 2017-1A, Class A2, 5.927%, 8/28/27 (144A) | 5,024,868 |
| 7,543(c) | Gold Key Resorts LLC, Series 2014-A, Class C, 5.87%, 3/17/31 (144A) | 7,496 |
| 5,022,000(a) | Goldentree Loan Management US CLO 2, Ltd., Series 2017-2A, Class E, 10.288% (3 Month Term SOFR + 496 bps), 11/28/30 (144A) | 4,706,653 |
| 4,250,000(a) | Goldentree Loan Management US CLO 6, Ltd., Series 2019-6A, Class DR, 8.426% (3 Month Term SOFR + 310 bps), 4/20/35 (144A) | 4,029,705 |
| 1,250,000(a) | Gulf Stream Meridian 3, Ltd., Series 2021-IIIA, Class D, 12.32% (3 Month Term SOFR + 701 bps), 4/15/34 (144A) | 1,167,575 |
| 10,000,000 | Hertz Vehicle Financing III LP, Series 2021-2A, Class D, 4.34%, 12/27/27 (144A) | 8,720,462 |
| 9,996,000 | HOA Funding LLC - HOA, Series 2021-1A, Class A2, 4.723%, 8/20/51 (144A) | 8,185,824 |
| 591,860 | Home Partners of America Trust, Series 2019-1, Class F, 4.101%, 9/17/39 (144A) | 513,723 |
| 2,220,000 | HPEFS Equipment Trust, Series 2023-2A, Class D, 6.97%, 7/21/31 (144A) | 2,223,406 |
| 3,175,000(a) | ICG US CLO, Ltd., Series 2016-1A, Class DRR, 13.071% (3 Month Term SOFR + 770 bps), 4/29/34 (144A) | 2,472,017 |
| 2,250,000(a) | ICG US CLO, Ltd., Series 2021-1A, Class E, 11.90% (3 Month Term SOFR + 659 bps), 4/17/34 (144A) | 1,929,951 |
| 352,320 | JG Wentworth XXII LLC, Series 2010-3A, Class A, 3.82%, 12/15/48 (144A) | 348,115 |
| 3,070,000 | JPMorgan Chase Bank N.A. - CACLN, Series 2021-2, Class F, 4.393%, 12/26/28 (144A) | 2,865,892 |
| 4,025,000(a) | MF1, Ltd., Series 2021-FL7, Class D, 7.995% (1 Month Term SOFR + 266 bps), 10/16/36 (144A) | 3,861,601 |
The accompanying notes are an integral part of these financial statements.
Pioneer Strategic Income Fund | Annual Report | 9/30/2325
Schedule of Investments | 9/30/23 (continued)
Principal
Amount
USD ($) | | | | | | Value |
| | Asset Backed Securities — (continued) | |
| 7,500,000(a) | MF1, Ltd., Series 2021-FL7, Class E, 8.245% (1 Month Term SOFR + 291 bps), 10/16/36 (144A) | $ 7,078,980 |
| 2,063,157 | Mosaic Solar Loan Trust, Series 2019-2A, Class D, 6.18%, 9/20/40 (144A) | 1,977,049 |
| 3,189,976 | Mosaic Solar Loan Trust, Series 2021-1A, Class D, 3.71%, 12/20/46 (144A) | 2,679,546 |
| 5,000,000(a) | Neuberger Berman CLO XVII, Ltd., Series 2014-17A, Class ER2, 12.807% (3 Month Term SOFR + 746 bps), 4/22/29 (144A) | 4,623,570 |
| 4,500,000(a) | Newark BSL CLO 1, Ltd., Series 2016-1A, Class DR, 11.869% (3 Month Term SOFR + 651 bps), 12/21/29 (144A) | 3,978,243 |
| 5,950,000 | NMEF Funding LLC, Series 2022-B, Class C, 8.54%, 6/15/29 (144A) | 5,919,307 |
| 1,119,000 | Octane Receivables Trust, Series 2020-1A, Class D, 5.45%, 3/20/28 (144A) | 1,097,176 |
| 1,456,780 | Orange Lake Timeshare Trust, Series 2019-A, Class D, 4.93%, 4/9/38 (144A) | 1,366,105 |
| 1,900,000(a) | Palmer Square Loan Funding, Ltd., Series 2022-1A, Class C, 7.908% (3 Month Term SOFR + 260 bps), 4/15/30 (144A) | 1,825,338 |
| 6,400,000 | PEAR LLC, Series 2021-1, Class B, 0.000%, 1/15/34 (144A) | 4,482,816 |
| 4,300,000 | PG Receivables Finance, Series 2020-1, Class C, 5.44%, 7/20/25 (144A) | 4,294,625 |
| 745,000 | Post Road Equipment Finance, Series 2021-1A, Class E, 4.36%, 3/15/29 (144A) | 735,796 |
| 5,000,000(a) | Race Point VIII CLO, Ltd., Series 2013-8A, Class DR2, 9.141% (3 Month Term SOFR + 376 bps), 2/20/30 (144A) | 4,847,620 |
| 9,600,000 | Republic Finance Issuance Trust, Series 2021-A, Class D, 5.23%, 12/22/31 (144A) | 7,965,501 |
| 3,000,000(c) | RMF Buyout Issuance Trust, Series 2021-HB1, Class M4, 4.704%, 11/25/31 (144A) | 2,510,101 |
| 6,000,000(c) | RMF Buyout Issuance Trust, Series 2021-HB1, Class M5, 6.00%, 11/25/31 (144A) | 4,841,101 |
| 3,750,000(c) | RMF Buyout Issuance Trust, Series 2022-HB1, Class M5, 4.50%, 4/25/32 (144A) | 417,187 |
| 1,500,000 | Rosy Blue Carat SCS, Series 2018-1, Class A1R, 8.481%, 3/15/30 (144A) | 1,509,000 |
The accompanying notes are an integral part of these financial statements.
26Pioneer Strategic Income Fund | Annual Report | 9/30/23
Principal
Amount
USD ($) | | | | | | Value |
| | Asset Backed Securities — (continued) | |
| 9,550,000 | Santander Bank Auto Credit-Linked Notes, Series 2022-B, Class F, 11.91%, 8/16/32 (144A) | $ 9,606,838 |
| 937,798 | Sierra Timeshare Receivables Funding LLC, Series 2019-1A, Class D, 4.75%, 1/20/36 (144A) | 905,687 |
| 846,357 | Sierra Timeshare Receivables Funding LLC, Series 2020-2A, Class D, 6.59%, 7/20/37 (144A) | 810,019 |
| 3,500,000(a) | Signal Peak CLO 2 LLC, Series 2015-1A, Class DR2, 8.438% (3 Month Term SOFR + 311 bps), 4/20/29 (144A) | 3,379,379 |
| 4,750,000(a) | Sound Point CLO XXI, Ltd., Series 2018-3A, Class C, 8.912% (3 Month Term SOFR + 356 bps), 10/26/31 (144A) | 4,268,521 |
| 3,000,000(a) | Sound Point CLO XXVIII, Ltd., Series 2020-3A, Class E, 12.513% (3 Month Term SOFR + 716 bps), 1/25/32 (144A) | 2,661,690 |
| 5,000,000(c) | Towd Point HE Trust, Series 2021-HE1, Class M2, 2.50%, 2/25/63 (144A) | 4,347,983 |
| 2,750,000 | Tricolor Auto Securitization Trust, Series 2021-1A, Class F, 5.08%, 5/15/28 (144A) | 2,663,025 |
| 4,250,000 | Tricon American Homes Trust, Series 2020-SFR2, Class E1, 2.73%, 11/17/39 (144A) | 3,589,461 |
| 1,000,000 | Upstart Securitization Trust, Series 2021-1, Class C, 4.06%, 3/20/31 (144A) | 971,210 |
| 1,294,000 | VFI ABS LLC, Series 2022-1A, Class D, 6.68%, 11/26/29 (144A) | 1,216,611 |
| 736,375 | Westgate Resorts LLC, Series 2020-1A, Class C, 6.213%, 3/20/34 (144A) | 727,384 |
| 2,650,249 | Westgate Resorts LLC, Series 2022-1A, Class C, 2.488%, 8/20/36 (144A) | 2,489,389 |
| 1,673,841 | Westgate Resorts LLC, Series 2022-1A, Class D, 3.838%, 8/20/36 (144A) | 1,555,652 |
| 4,000,000(a) | Whitebox CLO II, Ltd., Series 2020-2A, Class ER, 12.707% (3 Month Term SOFR + 736 bps), 10/24/34 (144A) | 3,833,204 |
| | Total Asset Backed Securities
(Cost $305,374,886) | $274,497,013 |
|
|
| | Collateralized Mortgage
Obligations—11.9% of Net Assets | |
| 5,970,020(c) | Bayview MSR Opportunity Master Fund Trust, Series 2021-2, Class A8, 2.50%, 6/25/51 (144A) | $ 3,566,605 |
The accompanying notes are an integral part of these financial statements.
Pioneer Strategic Income Fund | Annual Report | 9/30/2327
Schedule of Investments | 9/30/23 (continued)
Principal
Amount
USD ($) | | | | | | Value |
| | Collateralized Mortgage
Obligations—(continued) | |
| 2,120,000(a) | Bellemeade Re, Ltd., Series 2019-1A, Class B1, 9.434% (1 Month USD LIBOR + 400 bps), 3/25/29 (144A) | $ 2,144,604 |
| 2,610,806(a) | Bellemeade Re, Ltd., Series 2019-1A, Class M2, 8.134% (1 Month USD LIBOR + 270 bps), 3/25/29 (144A) | 2,628,649 |
| 840,000(a) | Bellemeade Re, Ltd., Series 2020-3A, Class B1, 11.784% (SOFR30A + 646 bps), 10/25/30 (144A) | 881,404 |
| 1,450,000(a) | Bellemeade Re, Ltd., Series 2020-4A, Class B1, 10.434% (1 Month USD LIBOR + 500 bps), 6/25/30 (144A) | 1,479,697 |
| 8,062,000(c) | BINOM Securitization Trust, Series 2022-RPL1, Class M3, 3.00%, 2/25/61 (144A) | 4,940,533 |
| 3,133,312(c) | Brean Asset Backed Securities Trust, Series 2021-RM1, Class A, 1.40%, 10/25/63 (144A) | 2,608,984 |
| 2,588,481 | Brean Asset Backed Securities Trust, Series 2021-RM2, Class M1, 1.75%, 10/25/61 (144A) | 2,066,533 |
| 3,376,042(c) | Cascade Funding Mortgage Trust, Series 2019-RM3, Class C, 4.00%, 6/25/69 (144A) | 2,933,148 |
| 2,577,810(c) | CIM Trust, Series 2021-J2, Class B2, 2.671%, 4/25/51 (144A) | 1,841,000 |
| 3,060,002(c) | CIM Trust, Series 2021-J2, Class B3, 2.671%, 4/25/51 (144A) | 2,066,153 |
| 5,264,850(c) | Citigroup Mortgage Loan Trust, Series 2018-RP3, Class B2, 3.25%, 3/25/61 (144A) | 3,381,546 |
| 8,629,509(c) | Citigroup Mortgage Loan Trust, Series 2021-INV2, Class B1W, 2.989%, 5/25/51 (144A) | 6,433,569 |
| 2,029,190(c) | Citigroup Mortgage Loan Trust, Inc., Series 2018-RP1, Class B2, 3.188%, 9/25/64 (144A) | 1,346,356 |
| 2,670,000(a) | Connecticut Avenue Securities Trust, Series 2020-SBT1, Class 1M2, 9.079% (SOFR30A + 376 bps), 2/25/40 (144A) | 2,779,896 |
| 4,940,000(a) | Connecticut Avenue Securities Trust, Series 2020-SBT1, Class 2M2, 9.079% (SOFR30A + 376 bps), 2/25/40 (144A) | 5,148,359 |
| 16,450,000(a) | Connecticut Avenue Securities Trust, Series 2022-R02, Class 2B1, 9.815% (SOFR30A + 450 bps), 1/25/42 (144A) | 16,820,125 |
The accompanying notes are an integral part of these financial statements.
28Pioneer Strategic Income Fund | Annual Report | 9/30/23
Principal
Amount
USD ($) | | | | | | Value |
| | Collateralized Mortgage
Obligations—(continued) | |
| 503,617(c) | CSFB Mortgage-Backed Pass-Through Certificates, Series 2003-17, Class B1, 5.50%, 6/25/33 | $ 5 |
| 2,638,958(c) | CSMC, Series 2021-RPL2, Class M3, 3.591%, 1/25/60 (144A) | 1,642,269 |
| 8,240,000(a)(e) | Eagle Re, Ltd., Series 2023-1, Class M1B, 9.265% (SOFR30A + 395 bps), 9/26/33 (144A) | 8,240,000 |
| 8,469,085(a)(f) | Federal Home Loan Mortgage Corp. REMICs, Series 4087, Class SB, 0.602% (SOFR30A + 592 bps), 7/15/42 | 611,169 |
| 4,623,860(a)(f) | Federal Home Loan Mortgage Corp. REMICs, Series 4091, Class SH, 1.122% (SOFR30A + 644 bps), 8/15/42 | 445,178 |
| 2,194,433(f) | Federal Home Loan Mortgage Corp. REMICs, Series 4999, Class QI, 4.00%, 5/25/50 | 413,552 |
| 2,684,059(f) | Federal Home Loan Mortgage Corp. REMICs, Series 5067, Class GI, 4.00%, 12/25/50 | 520,366 |
| 115,996 | Federal National Mortgage Association REMICs, Series 2009-36, Class HX, 4.50%, 6/25/29 | 113,939 |
| 2,404,043(a)(f) | Federal National Mortgage Association REMICs, Series 2012-14, Class SP, 1.121% (SOFR30A + 644 bps), 8/25/41 | 147,151 |
| 1,837,230(a)(f) | Federal National Mortgage Association REMICs, Series 2018-43, Class SM, 0.771% (SOFR30A + 609 bps), 6/25/48 | 142,277 |
| 2,121,369(a)(f) | Federal National Mortgage Association REMICs, Series 2019-33, Class S, 0.621% (SOFR30A + 594 bps), 7/25/49 | 106,519 |
| 1,743,647(a)(f) | Federal National Mortgage Association REMICs, Series 2019-41, Class PS, 0.621% (SOFR30A + 594 bps), 8/25/49 | 152,902 |
| 1,684,963(a)(f) | Federal National Mortgage Association REMICs, Series 2019-41, Class SM, 0.621% (SOFR30A + 594 bps), 8/25/49 | 147,987 |
| 1,915,387(f) | Federal National Mortgage Association REMICs, Series 2020-83, Class EI, 4.00%, 11/25/50 | 389,760 |
| 217,117,325(c)(f) | Flagstar Mortgage Trust, Series 2021-4, Class AX1, 0.205%, 6/1/51 (144A) | 2,207,758 |
| 5,655,111(c) | Flagstar Mortgage Trust, Series 2021-7, Class B3, 2.929%, 8/25/51 (144A) | 3,615,483 |
The accompanying notes are an integral part of these financial statements.
Pioneer Strategic Income Fund | Annual Report | 9/30/2329
Schedule of Investments | 9/30/23 (continued)
Principal
Amount
USD ($) | | | | | | Value |
| | Collateralized Mortgage
Obligations—(continued) | |
| 3,585,000(a) | Freddie Mac STACR REMIC Trust, Series 2020-DNA5, Class B1, 10.115% (SOFR30A + 480 bps), 10/25/50 (144A) | $ 3,898,493 |
| 2,910,000(a) | Freddie Mac STACR REMIC Trust, Series 2020-DNA6, Class B1, 8.315% (SOFR30A + 300 bps), 12/25/50 (144A) | 2,860,908 |
| 2,630,000(a) | Freddie Mac STACR REMIC Trust, Series 2020-DNA6, Class B2, 10.965% (SOFR30A + 565 bps), 12/25/50 (144A) | 2,712,187 |
| 1,060,842(a) | Freddie Mac STACR REMIC Trust, Series 2020-HQA2, Class M2, 8.529% (SOFR30A + 321 bps), 3/25/50 (144A) | 1,094,059 |
| 2,670,000(a) | Freddie Mac STACR REMIC Trust, Series 2020-HQA3, Class B2, 15.429% (SOFR30A + 1,011 bps), 7/25/50 (144A) | 3,330,147 |
| 2,869,170(a) | Freddie Mac STACR REMIC Trust, Series 2020-HQA4, Class B1, 10.679% (SOFR30A + 536 bps), 9/25/50 (144A) | 3,096,528 |
| 2,340,000(a) | Freddie Mac STACR REMIC Trust, Series 2021-HQA4, Class B1, 9.065% (SOFR30A + 375 bps), 12/25/41 (144A) | 2,323,930 |
| 9,485,000(a) | Freddie Mac STACR REMIC Trust, Series 2022-DNA2, Class B1, 10.065% (SOFR30A + 475 bps), 2/25/42 (144A) | 9,591,706 |
| 5,510,000(a) | Freddie Mac STACR Trust, Series 2019-HRP1, Class B1, 9.479% (SOFR30A + 416 bps), 2/25/49 (144A) | 5,647,727 |
| 4,110,000(a) | Freddie Mac Structured Agency Credit Risk Debt Notes, Series 2020-HQA5, Class B1, 9.315% (SOFR30A + 400 bps), 11/25/50 (144A) | 4,349,009 |
| 6,250,000(a) | Freddie Mac Structured Agency Credit Risk Debt Notes, Series 2020-HQA5, Class B2, 12.715% (SOFR30A + 740 bps), 11/25/50 (144A) | 6,861,025 |
| 171,915 | Global Mortgage Securitization, Ltd., Series 2004-A, Class B2, 5.25%, 11/25/32 (144A) | 2 |
| 1,090,569 | Government National Mortgage Association, Series 2009-83, Class EB, 4.50%, 9/20/39 | 1,051,912 |
| 35,181 | Government National Mortgage Association, Series 2012-130, Class PA, 3.00%, 4/20/41 | 34,982 |
| 1,957,466(a)(f) | Government National Mortgage Association, Series 2019-103, Class SB, 0.611% (1 Month Term SOFR + 594 bps), 8/20/49 | 139,035 |
The accompanying notes are an integral part of these financial statements.
30Pioneer Strategic Income Fund | Annual Report | 9/30/23
Principal
Amount
USD ($) | | | | | | Value |
| | Collateralized Mortgage
Obligations—(continued) | |
| 9,815,138(f) | Government National Mortgage Association, Series 2019-110, Class PI, 3.50%, 9/20/49 | $ 1,677,675 |
| 16,291,209(a)(f) | Government National Mortgage Association, Series 2019-117, Class SB, 0.000% (1 Month Term SOFR + 331 bps), 9/20/49 | 104,852 |
| 23,424,396(f) | Government National Mortgage Association, Series 2019-128, Class IB, 3.50%, 10/20/49 | 3,720,628 |
| 23,415,442(f) | Government National Mortgage Association, Series 2019-128, Class ID, 3.50%, 10/20/49 | 2,961,360 |
| 10,755,248(f) | Government National Mortgage Association, Series 2019-159, Class CI, 3.50%, 12/20/49 | 1,886,955 |
| 1,896,162(f) | Government National Mortgage Association, Series 2020-15, Class IM, 3.50%, 2/20/50 | 309,359 |
| 4,599,475(f) | Government National Mortgage Association, Series 2020-7, Class CI, 3.50%, 1/20/50 | 1,004,377 |
| 13,609,573(a)(f) | Government National Mortgage Association, Series 2020-9, Class SA, 3.35% (1 Month Term SOFR + 324 bps), 1/20/50 | 131,411 |
| 2,454,122(c) | GS Mortgage-Backed Securities Corp. Trust, Series 2019-PJ3, Class B4, 3.961%, 3/25/50 (144A) | 1,911,235 |
| 1,490,000(c) | GS Mortgage-Backed Securities Corp. Trust, Series 2019-PJ3, Class B5, 3.961%, 3/25/50 (144A) | 773,508 |
| 4,900,000(c) | GS Mortgage-Backed Securities Corp. Trust, Series 2021-RPL1, Class B1, 2.75%, 12/25/60 (144A) | 3,464,402 |
| 9,640,000(c) | GS Mortgage-Backed Securities Corp. Trust, Series 2022-PJ4, Class A33, 3.00%, 9/25/52 (144A) | 6,205,584 |
| 2,516,806(c) | GS Mortgage-Backed Securities Trust, Series 2021-PJ9, Class B3, 2.934%, 2/26/52 (144A) | 1,724,004 |
| 2,865,150(c) | GS Mortgage-Backed Securities Trust, Series 2022-MM1, Class B3, 2.819%, 7/25/52 (144A) | 1,985,522 |
| 4,595,055(c) | GS Mortgage-Backed Securities Trust, Series 2022-PJ1, Class B3, 2.834%, 5/28/52 (144A) | 3,031,270 |
| 1,220,000(a) | Home Re, Ltd., Series 2020-1, Class B1, 12.434% (1 Month USD LIBOR + 700 bps), 10/25/30 (144A) | 1,242,523 |
| 1,477,634(a) | Home Re, Ltd., Series 2020-1, Class M2, 10.684% (1 Month USD LIBOR + 525 bps), 10/25/30 (144A) | 1,492,291 |
The accompanying notes are an integral part of these financial statements.
Pioneer Strategic Income Fund | Annual Report | 9/30/2331
Schedule of Investments | 9/30/23 (continued)
Principal
Amount
USD ($) | | | | | | Value |
| | Collateralized Mortgage
Obligations—(continued) | |
| 75,550,279(c)(f) | Hundred Acre Wood Trust, Series 2021-INV1, Class AX1, 0.226%, 7/25/51 (144A) | $ 815,595 |
| 2,562,912(c) | Hundred Acre Wood Trust, Series 2021-INV1, Class B2, 3.226%, 7/25/51 (144A) | 1,962,418 |
| 4,350,000(c) | Imperial Fund Mortgage Trust, Series 2021-NQM2, Class B2, 4.304%, 9/25/56 (144A) | 2,652,235 |
| 931,000(c) | JP Morgan Mortgage Trust, Series 2018-7FRB, Class B5, 6.644%, 4/25/46 (144A) | 715,480 |
| 138,283,280(c)(f) | JP Morgan Mortgage Trust, Series 2021-10, Class AX1, 0.121%, 12/25/51 (144A) | 808,197 |
| 2,000,000(c) | JP Morgan Mortgage Trust, Series 2021-3, Class A5, 2.50%, 7/25/51 (144A) | 1,237,611 |
| 6,414,101(c) | JP Morgan Mortgage Trust, Series 2021-7, Class B3, 2.803%, 11/25/51 (144A) | 4,184,153 |
| 122,556,932(c)(f) | JP Morgan Mortgage Trust, Series 2021-8, Class AX1, 0.121%, 12/25/51 (144A) | 669,847 |
| 8,227,822(c) | JP Morgan Mortgage Trust, Series 2021-8, Class B3, 2.846%, 12/25/51 (144A) | 5,378,773 |
| 1,977,893(c) | JP Morgan Mortgage Trust, Series 2021-INV1, Class B3, 2.98%, 10/25/51 (144A) | 1,296,109 |
| 1,682,530(c) | JP Morgan Mortgage Trust, Series 2021-INV1, Class B4, 2.98%, 10/25/51 (144A) | 898,225 |
| 3,999,452(c) | JP Morgan Mortgage Trust, Series 2021-INV4, Class B2, 3.214%, 1/25/52 (144A) | 2,896,685 |
| 4,213,708(c) | JP Morgan Mortgage Trust, Series 2021-INV4, Class B3, 3.214%, 1/25/52 (144A) | 2,841,328 |
| 4,592,765(c) | JP Morgan Mortgage Trust, Series 2022-3, Class B3, 3.113%, 8/25/52 (144A) | 3,189,428 |
| 5,650,000(c) | JP Morgan Mortgage Trust, Series 2022-4, Class A5, 3.00%, 10/25/52 (144A) | 3,629,231 |
| 5,468,285(c) | JP Morgan Mortgage Trust, Series 2022-4, Class B3, 3.259%, 10/25/52 (144A) | 3,630,235 |
| 5,846,524(c) | JP Morgan Mortgage Trust, Series 2022-5, Class B3, 2.958%, 9/25/52 (144A) | 3,745,080 |
| 8,483,294(c) | JP Morgan Mortgage Trust, Series 2022-INV1, Class B3, 3.295%, 3/25/52 (144A) | 5,684,822 |
| 5,375,197(a) | JPMorgan Chase Bank N.A. - CHASE, Series 2020-CL1, Class M3, 8.784% (1 Month Term SOFR + 346 bps), 10/25/57 (144A) | 5,399,997 |
| 2,213,437(a) | JPMorgan Chase Bank N.A. - JPMWM, Series 2021-CL1, Class M3, 7.115% (SOFR30A + 180 bps), 3/25/51 (144A) | 2,041,659 |
The accompanying notes are an integral part of these financial statements.
32Pioneer Strategic Income Fund | Annual Report | 9/30/23
Principal
Amount
USD ($) | | | | | | Value |
| | Collateralized Mortgage
Obligations—(continued) | |
| 1,964,036(a) | JPMorgan Chase Bank N.A. - JPMWM, Series 2021-CL1, Class M4, 8.065% (SOFR30A + 275 bps), 3/25/51 (144A) | $ 1,771,370 |
| 1,023,657 | La Hipotecaria El Salvadorian Mortgage Trust, Series 2016-1A, Class A, 3.358%, 1/15/46 (144A) | 921,291 |
| 1,936,994 | La Hipotecaria Mortgage Trust, Series 2019-2A, Class BBB, 4.75%, 9/29/46 (144A) | 1,762,664 |
| 267,520(a) | La Hipotecaria Panamanian Mortgage Trust, Series 2010-1GA, Class A, 2.75% (Panamanian Mortgage Reference Rate - 300 bps), 9/8/39 (144A) | 254,144 |
| 6,302,403 | La Hipotecaria Panamanian Mortgage Trust, Series 2021-1, Class GA, 4.35%, 7/13/52 (144A) | 5,648,529 |
| 3,051,718(c) | Mello Mortgage Capital Acceptance, Series 2021-MTG1, Class B2, 2.646%, 4/25/51 (144A) | 2,078,778 |
| 3,955,678(c) | Mello Mortgage Capital Acceptance, Series 2021-MTG2, Class B2, 2.669%, 6/25/51 (144A) | 2,700,312 |
| 7,999,051(c) | Mello Mortgage Capital Acceptance, Series 2022-INV2, Class B3, 3.53%, 4/25/52 (144A) | 5,480,922 |
| 4,256,642(c) | MFA Trust, Series 2021-AEI2, Class B3, 3.285%, 10/25/51 (144A) | 2,970,296 |
| 7,172,000(c) | MFA Trust, Series 2021-RPL1, Class M2, 2.855%, 7/25/60 (144A) | 5,262,000 |
| 2,942,107(c) | Mill City Mortgage Loan Trust, Series 2017-3, Class B2, 3.25%, 1/25/61 (144A) | 2,172,796 |
| 6,145,000(c) | Mill City Mortgage Loan Trust, Series 2019-GS1, Class M3, 3.25%, 7/25/59 (144A) | 4,669,300 |
| 1,324,090(c) | Morgan Stanley Residential Mortgage Loan Trust, Series 2021-1, Class B3, 2.949%, 3/25/51 (144A) | 914,334 |
| 6,134,321(c) | Morgan Stanley Residential Mortgage Loan Trust, Series 2021-2, Class B2, 2.898%, 5/25/51 (144A) | 4,316,125 |
| 8,152,672(a) | New Residential Mortgage Loan Trust, Series 2020-2A, Class B4A, 6.43% (1 Month USD LIBOR + 250 bps), 10/25/46 (144A) | 7,757,121 |
| 13,903,950(c) | New Residential Mortgage Loan Trust, Series 2020-RPL1, Class B1, 3.881%, 11/25/59 (144A) | 10,151,716 |
The accompanying notes are an integral part of these financial statements.
Pioneer Strategic Income Fund | Annual Report | 9/30/2333
Schedule of Investments | 9/30/23 (continued)
Principal
Amount
USD ($) | | | | | | Value |
| | Collateralized Mortgage
Obligations—(continued) | |
| 3,500,000 | NYMT Loan Trust, Series 2022-CP1, Class M2, 3.514%, 7/25/61 (144A) | $ 2,643,124 |
| 1,748,758(a) | Oaktown Re V, Ltd., Series 2020-2A, Class M2, 10.679% (SOFR30A + 536 bps), 10/25/30 (144A) | 1,780,871 |
| 2,680,710(c) | Oceanview Mortgage Trust, Series 2021-1, Class B2, 2.721%, 5/25/51 (144A) | 1,918,156 |
| 3,069,432(c) | Oceanview Mortgage Trust, Series 2021-1, Class B3A, 3.242%, 6/25/51 (144A) | 2,162,879 |
| 2,477,974(c) | Oceanview Mortgage Trust, Series 2021-3, Class B3, 2.713%, 6/25/51 (144A) | 1,178,095 |
| 1,875,279(c) | PRMI Securitization Trust, Series 2021-1, Class B2, 2.479%, 4/25/51 (144A) | 1,263,634 |
| 3,576,156(c) | PRMI Securitization Trust, Series 2021-1, Class B3, 2.479%, 4/25/51 (144A) | 2,263,887 |
| 2,799,960(c) | Provident Funding Mortgage Trust, Series 2021-1, Class B1, 2.384%, 4/25/51 (144A) | 2,050,412 |
| 2,717,328(c) | Provident Funding Mortgage Trust, Series 2021-2, Class B2, 2.352%, 4/25/51 (144A) | 1,861,242 |
| 2,776,757(c) | Provident Funding Mortgage Trust, Series 2021-INV1, Class B3, 2.782%, 8/25/51 (144A) | 1,934,430 |
| 2,303,829(c) | Provident Funding Mortgage Trust, Series 2021-J1, Class B2, 2.637%, 10/25/51 (144A) | 1,667,775 |
| 3,378,636(c) | Provident Funding Mortgage Trust, Series 2021-J1, Class B3, 2.637%, 10/25/51 (144A) | 2,315,397 |
| 1,460,000(a) | Radnor Re, Ltd., Series 2021-2, Class M2, 10.315% (SOFR30A + 500 bps), 11/25/31 (144A) | 1,510,691 |
| 3,345,892(c) | Rate Mortgage Trust, Series 2021-HB1, Class B2, 2.703%, 12/25/51 (144A) | 2,296,210 |
| 1,829,725(c) | Rate Mortgage Trust, Series 2021-HB1, Class B3, 2.703%, 12/25/51 (144A) | 1,167,078 |
| 4,236,099(c) | Rate Mortgage Trust, Series 2021-J1, Class B2, 2.707%, 7/25/51 (144A) | 3,047,738 |
| 1,732,010(c) | Rate Mortgage Trust, Series 2021-J1, Class B3, 2.707%, 7/25/51 (144A) | 1,049,713 |
| 2,231,134(c) | Rate Mortgage Trust, Series 2021-J3, Class B3, 2.713%, 10/25/51 (144A) | 1,503,324 |
| 1,723,000(c) | Rate Mortgage Trust, Series 2021-J4, Class B4, 2.634%, 11/25/51 (144A) | 585,291 |
The accompanying notes are an integral part of these financial statements.
34Pioneer Strategic Income Fund | Annual Report | 9/30/23
Principal
Amount
USD ($) | | | | | | Value |
| | Collateralized Mortgage
Obligations—(continued) | |
| 3,937,372(c) | Rate Mortgage Trust, Series 2022-J1, Class B3, 2.751%, 1/25/52 (144A) | $ 2,656,275 |
| 1,971,279(c) | RCKT Mortgage Trust, Series 2021-2, Class B3, 2.563%, 6/25/51 (144A) | 1,372,336 |
| 10,150,000(c) | RCKT Mortgage Trust, Series 2022-3, Class A17, 3.00%, 5/25/52 (144A) | 6,392,630 |
| 2,436,205(c) | RCKT Mortgage Trust, Series 2022-3, Class B3, 3.188%, 5/25/52 (144A) | 1,663,490 |
| 3,038,892(c) | Sequoia Mortgage Trust, Series 2021-1, Class B3, 2.66%, 3/25/51 (144A) | 2,098,385 |
| 1,141,883(c) | Sequoia Mortgage Trust, Series 2021-2, Class B4, 2.552%, 4/25/51 (144A) | 511,214 |
| 1,171,204(c) | Sequoia Mortgage Trust, Series 2021-3, Class B4, 2.65%, 5/25/51 (144A) | 533,593 |
| 2,381,575(c) | Sequoia Mortgage Trust, Series 2021-4, Class B4, 2.666%, 6/25/51 (144A) | 1,088,622 |
| 1,494,270(c) | Sequoia Mortgage Trust, Series 2021-5, Class B4, 3.05%, 7/25/51 (144A) | 728,236 |
| 1,783,000(c) | Sequoia Mortgage Trust, Series 2021-9, Class B4, 2.86%, 1/25/52 (144A) | 652,117 |
| 4,100,000(c) | Sequoia Mortgage Trust, Series 2022-1, Class A7, 2.50%, 2/25/52 (144A) | 2,419,126 |
| 2,743,712(c) | Sequoia Mortgage Trust, Series 2022-1, Class B4, 2.946%, 2/25/52 (144A) | 1,051,868 |
| 4,550,000(a) | STACR Trust, Series 2018-HRP2, Class B1, 9.629% (SOFR30A + 431 bps), 2/25/47 (144A) | 4,834,303 |
| 5,000,000(c) | Towd Point Mortgage Trust, Series 2017-1, Class B3, 3.84%, 10/25/56 (144A) | 3,671,449 |
| 6,374,998(c) | Towd Point Mortgage Trust, Series 2017-3, Class B3, 3.897%, 7/25/57 (144A) | 4,869,800 |
| 5,639,000(a) | Towd Point Mortgage Trust, Series 2019-HY1, Class B2, 7.584% (1 Month Term SOFR + 226 bps), 10/25/48 (144A) | 5,307,916 |
| 9,185,805(c) | Towd Point Mortgage Trust, Series 2021-R1, Class A1, 2.918%, 11/30/60 (144A) | 7,470,696 |
| 1,830,000(a) | Triangle Re, Ltd., Series 2021-1, Class B1, 9.934% (1 Month USD LIBOR + 450 bps), 8/25/33 (144A) | 1,846,847 |
| 5,605,651(a) | Triangle Re, Ltd., Series 2021-1, Class M2, 9.334% (1 Month USD LIBOR + 390 bps), 8/25/33 (144A) | 5,632,862 |
| 3,440,510(c) | UWM Mortgage Trust, Series 2021-INV4, Class B2, 3.227%, 12/25/51 (144A) | 2,536,215 |
The accompanying notes are an integral part of these financial statements.
Pioneer Strategic Income Fund | Annual Report | 9/30/2335
Schedule of Investments | 9/30/23 (continued)
Principal
Amount
USD ($) | | | | | | Value |
| | Collateralized Mortgage
Obligations—(continued) | |
| 800,000(c) | Visio Trust, Series 2019-2, Class B1, 3.91%, 11/25/54 (144A) | $ 541,482 |
| 2,250,000(c) | Wells Fargo Mortgage Backed Securities Trust, Series 2022-2, Class A5, 3.00%, 12/25/51 (144A) | 1,442,482 |
| 8,970,000(c) | Wells Fargo Mortgage Backed Securities Trust, Series 2022-2, Class A6, 2.50%, 12/25/51 (144A) | 5,271,168 |
| 8,364,523(c) | Wells Fargo Mortgage Backed Securities Trust, Series 2022-INV1, Class B3, 3.437%, 3/25/52 (144A) | 5,691,606 |
| | Total Collateralized Mortgage Obligations
(Cost $495,444,444) | $379,575,553 |
|
|
| | Commercial Mortgage-Backed
Securities—6.0% of Net Assets | |
| 5,800,000(a) | Alen Mortgage Trust, Series 2021-ACEN, Class E, 9.447% (1 Month Term SOFR + 411 bps), 4/15/34 (144A) | $ 2,991,512 |
| 3,600,000(a) | AREIT Trust, Series 2022-CRE6, Class D, 8.163% (SOFR30A + 285 bps), 1/20/37 (144A) | 3,379,563 |
| 5,158,815(d)(f) | Bayview Commercial Asset Trust, Series 2007-2A, Class IO, 0.000%, 7/25/37 (144A) | — |
| 1,500,000(a) | BDS, Ltd., Series 2020-FL5, Class C, 7.495% (1 Month Term SOFR + 216 bps), 2/16/37 (144A) | 1,456,377 |
| 2,025,000(c) | Benchmark Mortgage Trust, Series 2020-IG3, Class B, 3.391%, 9/15/48 (144A) | 1,096,917 |
| 1,895,412(a) | BSREP Commercial Mortgage Trust, Series 2021-DC, Class G, 9.297% (1 Month Term SOFR + 396 bps), 8/15/38 (144A) | 1,262,435 |
| 9,000,000(a) | BX Trust, Series 2021-ARIA, Class E, 7.691% (1 Month Term SOFR + 236 bps), 10/15/36 (144A) | 8,542,479 |
| 781,417(a) | Capital Funding Mortgage Trust, Series 2020-9, Class A, 8.58% (1 Month Term SOFR + 325 bps), 11/15/23 (144A) | 738,147 |
| 4,425,000(a) | Capital Funding Mortgage Trust, Series 2021-19, Class B, 20.54% (1 Month Term SOFR + 1,521 bps), 11/6/23 (144A) | 4,320,048 |
The accompanying notes are an integral part of these financial statements.
36Pioneer Strategic Income Fund | Annual Report | 9/30/23
Principal
Amount
USD ($) | | | | | | Value |
| | Commercial Mortgage-Backed
Securities—(continued) | |
| 1,500,000(a) | CGDB Commercial Mortgage Trust, Series 2019-MOB, Class F, 7.997% (1 Month Term SOFR + 266 bps), 11/15/36 (144A) | $ 1,385,040 |
| 2,470,000(a) | CLNY Trust, Series 2019-IKPR, Class E, 8.164% (1 Month Term SOFR + 284 bps), 11/15/38 (144A) | 2,218,100 |
| 148,421,147(c)(f) | COMM Mortgage Trust, Series 2014-CR19, Class XA, 1.08%, 8/10/47 | 813,289 |
| 2,485,000(c) | COMM Mortgage Trust, Series 2015-DC1, Class B, 4.035%, 2/10/48 | 2,128,041 |
| 7,650,000(c) | COMM Mortgage Trust, Series 2020-CBM, Class E, 3.754%, 2/10/37 (144A) | 6,977,648 |
| 3,912,000(c) | COMM Mortgage Trust, Series 2020-CBM, Class F, 3.754%, 2/10/37 (144A) | 3,494,859 |
| 3,750,000 | COMM Mortgage Trust, Series 2020-CX, Class A, 2.173%, 11/10/46 (144A) | 2,856,222 |
| 4,083,017(c) | CSAIL Commercial Mortgage Trust, Series 2015-C1, Class C, 4.392%, 4/15/50 | 3,002,808 |
| 2,680,000(c) | CSAIL Commercial Mortgage Trust, Series 2015-C4, Class D, 3.708%, 11/15/48 | 2,159,055 |
| 1,455,000(a) | Freddie Mac Multifamily Structured Credit Risk, Series 2021-MN1, Class B1, 13.065% (SOFR30A + 775 bps), 1/25/51 (144A) | 1,443,650 |
| 2,750,000(a) | Freddie Mac Multifamily Structured Credit Risk, Series 2021-MN1, Class M2, 9.065% (SOFR30A + 375 bps), 1/25/51 (144A) | 2,646,279 |
| 6,000,000(a) | Freddie Mac Multifamily Structured Credit Risk, Series 2021-MN3, Class M2, 9.315% (SOFR30A + 400 bps), 11/25/51 (144A) | 5,693,849 |
| 4,500,000(c) | FREMF Mortgage Trust, Series 2017-KW02, Class B, 3.924%, 12/25/26 (144A) | 4,078,101 |
| 2,800,000(c) | FREMF Mortgage Trust, Series 2017-KW03, Class B, 4.216%, 7/25/27 (144A) | 2,534,888 |
| 2,300,000(c) | FREMF Mortgage Trust, Series 2018-K154, Class B, 4.162%, 11/25/32 (144A) | 1,810,108 |
| 1,875,000(c) | FREMF Mortgage Trust, Series 2018-K157, Class B, 4.446%, 8/25/33 (144A) | 1,549,763 |
| 3,534,000(c) | FREMF Mortgage Trust, Series 2018-KBX1, Class B, 3.693%, 1/25/26 (144A) | 2,996,868 |
| 6,364,000(c) | FREMF Mortgage Trust, Series 2018-KHG1, Class B, 3.947%, 12/25/27 (144A) | 5,614,013 |
| 1,419,704(a) | FREMF Mortgage Trust, Series 2018-KSW4, Class C, 10.426% (SOFR30A + 511 bps), 10/25/28 | 1,280,530 |
The accompanying notes are an integral part of these financial statements.
Pioneer Strategic Income Fund | Annual Report | 9/30/2337
Schedule of Investments | 9/30/23 (continued)
Principal
Amount
USD ($) | | | | | | Value |
| | Commercial Mortgage-Backed
Securities—(continued) | |
| 975,000(c) | FREMF Mortgage Trust, Series 2018-KW07, Class B, 4.223%, 10/25/31 (144A) | $ 795,695 |
| 5,680,025(c) | FREMF Mortgage Trust, Series 2019-KJ24, Class B, 7.60%, 10/25/27 (144A) | 5,155,400 |
| 8,500,000(a) | FREMF Mortgage Trust, Series 2019-KS12, Class C, 12.326% (SOFR30A + 701 bps), 8/25/29 | 8,112,578 |
| 1,184,034(a) | FREMF Mortgage Trust, Series 2020-KF74, Class C, 11.676% (SOFR30A + 636 bps), 1/25/27 (144A) | 1,141,241 |
| 1,491,043(a) | FREMF Mortgage Trust, Series 2020-KF83, Class C, 14.426% (SOFR30A + 911 bps), 7/25/30 (144A) | 1,404,663 |
| 5,000,000(g) | FREMF Mortgage Trust, Series 2021-K131, Class D, 0.000%, 9/25/54 (144A) | 2,280,145 |
| 81,461,927(f) | FREMF Mortgage Trust, Series 2021-K131, Class X2A, 0.10%, 9/25/54 (144A) | 468,887 |
| 18,374,996(f) | FREMF Mortgage Trust, Series 2021-K131, Class X2B, 0.10%, 9/25/54 (144A) | 93,150 |
| 10,000,000(g) | FREMF Mortgage Trust, Series 2021-KG05, Class C, 0.000%, 1/25/31 (144A) | 5,046,617 |
| 123,332,856(f) | FREMF Mortgage Trust, Series 2021-KG05, Class X2A, 0.10%, 1/25/31 (144A) | 638,235 |
| 10,000,000(f) | FREMF Mortgage Trust, Series 2021-KG05, Class X2B, 0.10%, 1/25/31 (144A) | 48,327 |
| 22,580,904(c)(f) | FRESB Mortgage Trust, Series 2020-SB79, Class X1, 1.192%, 7/25/40 | 771,840 |
| 6,000,000(a) | GS Mortgage Securities Corp. Trust, Series 2020-DUNE, Class E, 7.954% (1 Month Term SOFR + 261 bps), 12/15/36 (144A) | 5,683,458 |
| 2,200,000(a) | GS Mortgage Securities Corp. Trust, Series 2021-IP, Class E, 8.997% (1 Month Term SOFR + 366 bps), 10/15/36 (144A) | 1,985,895 |
| 750,000(a) | JP Morgan Chase Commercial Mortgage Securities Trust, Series 2019-MFP, Class E, 7.54% (1 Month Term SOFR + 221 bps), 7/15/36 (144A) | 720,808 |
| 11,650,000(c) | JP Morgan Chase Commercial Mortgage Securities Trust, Series 2020-LOOP, Class F, 3.99%, 12/5/38 (144A) | 6,435,805 |
| 5,600,000 | Key Commercial Mortgage Securities Trust, Series 2019-S2, Class A3, 3.469%, 6/15/52 (144A) | 4,929,032 |
The accompanying notes are an integral part of these financial statements.
38Pioneer Strategic Income Fund | Annual Report | 9/30/23
Principal
Amount
USD ($) | | | | | | Value |
| | Commercial Mortgage-Backed
Securities—(continued) | |
| 7,603,509(a) | Med Trust, Series 2021-MDLN, Class F, 9.446% (1 Month Term SOFR + 411 bps), 11/15/38 (144A) | $ 7,219,428 |
| 1,250,000(c) | Morgan Stanley Bank of America Merrill Lynch Trust, Series 2015-C24, Class C, 4.468%, 5/15/48 | 1,061,138 |
| 3,530,000(c) | Morgan Stanley Bank of America Merrill Lynch Trust, Series 2015-C27, Class D, 3.237%, 12/15/47 (144A) | 2,342,504 |
| 2,000,000 | Morgan Stanley Bank of America Merrill Lynch Trust, Series 2017-C33, Class D, 3.356%, 5/15/50 (144A) | 1,355,744 |
| 3,350,000 | Morgan Stanley Capital I Trust, Series 2014-150E, Class AS, 4.012%, 9/9/32 (144A) | 2,143,999 |
| 1,550,000 | Morgan Stanley Capital I Trust, Series 2016-UBS9, Class D, 3.00%, 3/15/49 (144A) | 1,105,180 |
| 10,995,060(a) | Multifamily Connecticut Avenue Securities Trust, Series 2019-01, Class M10, 8.679% (SOFR30A + 336 bps), 10/25/49 (144A) | 10,709,816 |
| 1,030,000(c) | Natixis Commercial Mortgage Securities Trust, Series 2019-FAME, Class D, 4.544%, 8/15/36 (144A) | 655,113 |
| 3,190,000 | Palisades Center Trust, Series 2016-PLSD, Class A, 2.713%, 4/13/33 (144A) | 1,815,110 |
| 7,050,000(c) | RBS Commercial Funding, Inc. Trust, Series 2013-SMV, Class E, 3.704%, 3/11/31 (144A) | 5,165,442 |
| 5,600,000(a) | Ready Capital Mortgage Financing LLC, Series 2021-FL7, Class D, 8.384% (1 Month Term SOFR + 306 bps), 11/25/36 (144A) | 5,264,563 |
| 2,659,000(c) | Ready Capital Mortgage Trust, Series 2019-5, Class C, 5.054%, 2/25/52 (144A) | 2,440,847 |
| 5,400,000(c) | Ready Capital Mortgage Trust, Series 2019-5, Class E, 5.337%, 2/25/52 (144A) | 3,955,958 |
| 2,443,000(c) | ReadyCap Commercial Mortgage Trust, Series 2019-6, Class C, 4.127%, 10/25/52 (144A) | 1,966,242 |
| 8,350,000 | SLG Office Trust, Series 2021-OVA, Class E, 2.851%, 7/15/41 (144A) | 5,768,262 |
| 8,000,000 | SLG Office Trust, Series 2021-OVA, Class F, 2.851%, 7/15/41 (144A) | 5,349,613 |
| 1,500,000(c) | Soho Trust, Series 2021-SOHO, Class A, 2.786%, 8/10/38 (144A) | 1,028,498 |
The accompanying notes are an integral part of these financial statements.
Pioneer Strategic Income Fund | Annual Report | 9/30/2339
Schedule of Investments | 9/30/23 (continued)
Principal
Amount
USD ($) | | | | | | Value |
| | Commercial Mortgage-Backed
Securities—(continued) | |
| 8,045,000(a) | Taubman Centers Commercial Mortgage Trust, Series 2022-DPM, Class B, 8.264% (1 Month Term SOFR + 293 bps), 5/15/37 (144A) | $ 7,850,675 |
| 67,584,000(c)(f) | UBS Commercial Mortgage Trust, Series 2018-C9, Class XB, 0.49%, 3/15/51 | 1,011,408 |
| 1,101,621(a) | XCALI Mortgage Trust, Series 2020-5, Class A, 8.70% (1 Month Term SOFR + 337 bps), 10/15/23 (144A) | 1,097,616 |
| | Total Commercial Mortgage-Backed Securities
(Cost $233,456,999) | $193,489,521 |
|
|
| | Convertible Corporate Bonds —
0.8% of Net Assets | |
| | Airlines — 0.1% | |
| 5,156,000 | Spirit Airlines, Inc., 1.00%, 5/15/26 | $ 4,287,214 |
| | Total Airlines | $4,287,214 |
|
|
| | Banks — 0.0%† | |
| IDR 15,039,758,000 | PT Bakrie & Brothers Tbk, 10/31/23 | $ 99,259 |
| | Total Banks | $99,259 |
|
|
| | Biotechnology — 0.1% | |
| 3,493,000 | Insmed, Inc., 1.75%, 1/15/25 | $ 3,437,112 |
| | Total Biotechnology | $3,437,112 |
|
|
| | Entertainment — 0.4% | |
| 12,093,000(g) | DraftKings Holdings, Inc., 3/15/28 | $ 9,148,355 |
| 1,892,000 | IMAX Corp., 0.50%, 4/1/26 | 1,764,290 |
| | Total Entertainment | $10,912,645 |
|
|
| | Software — 0.2% | |
| 2,231,000 | Bentley Systems, Inc., 0.375%, 7/1/27 | $ 1,927,584 |
| 4,819,000 | Verint Systems, Inc., 0.25%, 4/15/26 | 4,114,221 |
| | Total Software | $6,041,805 |
|
|
| | Total Convertible Corporate Bonds
(Cost $30,176,770) | $24,778,035 |
|
|
| | Corporate Bonds — 31.9% of Net
Assets | |
| | Aerospace & Defense — 0.7% | |
| 18,950,000 | Boeing Co., 5.805%, 5/1/50 | $ 17,159,552 |
The accompanying notes are an integral part of these financial statements.
40Pioneer Strategic Income Fund | Annual Report | 9/30/23
Principal
Amount
USD ($) | | | | | | Value |
| | Aerospace & Defense — (continued) | |
| 1,800,000 | Bombardier, Inc., 7.50%, 2/1/29 (144A) | $ 1,708,140 |
| 2,200,000 | Triumph Group, Inc., 9.00%, 3/15/28 (144A) | 2,175,373 |
| | Total Aerospace & Defense | $21,043,065 |
|
|
| | Agriculture — 0.2% | |
| 7,305,000 | Amaggi Luxembourg International S.a.r.l., 5.25%, 1/28/28 (144A) | $ 6,693,606 |
| | Total Agriculture | $6,693,606 |
|
|
| | Airlines — 0.9% | |
| 13,313,110(h) | ABRA Global Finance, 11.50% (5.50% PIK or 6.00% Cash), 3/2/28 (144A) | $ 10,662,127 |
| 1,483,300 | American Airlines 2021-1 Class B Pass Through Trust, 3.95%, 7/11/30 | 1,288,828 |
| 11,390,000 | Grupo Aeromexico SAB de CV, 8.50%, 3/17/27 (144A) | 10,666,735 |
| 8,185,000 | VistaJet Malta Finance Plc/Vista Management Holding, Inc., 6.375%, 2/1/30 (144A) | 6,321,725 |
| 1,840,000 | VistaJet Malta Finance Plc/Vista Management Holding, Inc., 7.875%, 5/1/27 (144A) | 1,584,700 |
| | Total Airlines | $30,524,115 |
|
|
| | Auto Manufacturers — 1.1% | |
| 4,312,000 | Ford Motor Co., 5.291%, 12/8/46 | $ 3,278,608 |
| 4,430,000 | Ford Motor Co., 6.10%, 8/19/32 | 4,172,673 |
| 7,600,000 | Ford Motor Credit Co. LLC, 3.625%, 6/17/31 | 6,141,199 |
| 3,700,000 | Ford Motor Credit Co. LLC, 7.35%, 3/6/30 | 3,746,909 |
| 18,000,000 | General Motors Financial Co., Inc., 6.40%, 1/9/33 | 17,578,884 |
| | Total Auto Manufacturers | $34,918,273 |
|
|
| | Auto Parts & Equipment — 0.1% | |
| 1,680,000 | ZF North America Capital, Inc., 6.875%, 4/14/28 (144A) | $ 1,644,798 |
| 2,335,000 | ZF North America Capital, Inc., 7.125%, 4/14/30 (144A) | 2,289,706 |
| | Total Auto Parts & Equipment | $3,934,504 |
|
|
| | Banks — 8.0% | |
| 20,800,000(c) | ABN AMRO Bank NV, 3.324% (5 Year CMT Index + 190 bps), 3/13/37 (144A) | $ 15,305,515 |
| 5,180,000 | Access Bank Plc, 6.125%, 9/21/26 (144A) | 4,355,862 |
The accompanying notes are an integral part of these financial statements.
Pioneer Strategic Income Fund | Annual Report | 9/30/2341
Schedule of Investments | 9/30/23 (continued)
Principal
Amount
USD ($) | | | | | | Value |
| | Banks — (continued) | |
| 3,460,000(c)(i) | Banco Mercantil del Norte SA, 8.375% (10 Year US Treasury Yield Curve Rate T Note Constant Maturity + 776 bps) (144A) | $ 3,274,126 |
| 5,000,000 | Banco Santander S.A., 6.921%, 8/8/33 | 4,777,419 |
| 8,400,000(c) | Banco Santander SA, 3.225% (1 Year CMT Index + 160 bps), 11/22/32 | 6,357,277 |
| 8,258,000(c) | Bank of Nova Scotia, 4.588% (5 Year CMT Index + 205 bps), 5/4/37 | 6,882,644 |
| 14,170,000(c) | Barclays Plc, 5.746% (1 Year CMT Index + 300 bps), 8/9/33 | 13,076,991 |
| 3,915,000(c) | Barclays Plc, 6.224% (SOFR + 298 bps), 5/9/34 | 3,708,638 |
| 5,400,000(c) | Barclays Plc, 7.437% (1 Year CMT Index + 350 bps), 11/2/33 | 5,545,141 |
| 5,608,000(c)(i) | Barclays Plc, 8.00% (5 Year CMT Index + 543 bps) | 5,032,852 |
| 14,450,000(c) | BPCE SA, 3.116% (SOFR + 173 bps), 10/19/32 (144A) | 10,763,098 |
| 7,445,000(c) | BPCE SA, 3.648% (5 Year CMT Index + 190 bps), 1/14/37 (144A) | 5,726,939 |
| KZT 1,923,750,000 | Development Bank of Kazakhstan JSC, 10.75%, 2/12/25 | 3,663,344 |
| KZT 1,210,000,000 | Development Bank of Kazakhstan JSC, 10.95%, 5/6/26 | 2,128,729 |
| 1,520,000 | Freedom Mortgage Corp., 6.625%, 1/15/27 (144A) | 1,335,844 |
| 3,005,000 | Freedom Mortgage Corp., 8.25%, 4/15/25 (144A) | 3,005,619 |
| 890,000 | Freedom Mortgage Corp., 12.25%, 10/1/30 (144A) | 909,713 |
| 1,600,000(c) | ING Groep NV, 4.252% (SOFR + 207 bps), 3/28/33 | 1,381,165 |
| 19,337,000(c)(i) | ING Groep NV, 4.25% (5 Year CMT Index + 286 bps) | 12,466,498 |
| 1,245,000(c) | Intesa Sanpaolo S.p.A., 4.198% (1 Year CMT Index + 260 bps), 6/1/32 (144A) | 917,374 |
| 5,760,000(c) | Intesa Sanpaolo S.p.A., 7.778% (1 Year CMT Index + 390 bps), 6/20/54 (144A) | 5,187,247 |
| 11,104,000(c) | Intesa Sanpaolo S.p.A., 8.248% (1 Year CMT Index + 440 bps), 11/21/33 (144A) | 11,185,142 |
| 10,350,000(c) | Lloyds Banking Group Plc, 4.976% (1 Year CMT Index + 230 bps), 8/11/33 | 9,184,869 |
| 8,231,000(c) | Lloyds Banking Group Plc, 7.953% (1 Year CMT Index + 375 bps), 11/15/33 | 8,513,555 |
The accompanying notes are an integral part of these financial statements.
42Pioneer Strategic Income Fund | Annual Report | 9/30/23
Principal
Amount
USD ($) | | | | | | Value |
| | Banks — (continued) | |
| 5,105,000(c)(i) | Lloyds Banking Group Plc, 8.00% (5 Year CMT Index + 391 bps) | $ 4,576,461 |
| 11,185,000(c) | Macquarie Group, Ltd., 2.871% (SOFR + 153 bps), 1/14/33 (144A) | 8,453,598 |
| 11,355,000(c) | Morgan Stanley, 5.297% (SOFR + 262 bps), 4/20/37 | 10,117,486 |
| 1,930,000(c) | Morgan Stanley, 5.948% (5 Year CMT Index + 243 bps), 1/19/38 | 1,803,925 |
| 16,049,000(c)(i) | Nordea Bank Abp, 3.75% (5 Year CMT Index + 260 bps) (144A) | 11,669,783 |
| 8,000,000(c) | Societe Generale SA, 4.027% (1 Year CMT Index + 190 bps), 1/21/43 (144A) | 5,019,390 |
| 4,635,000(c)(i) | Societe Generale SA, 5.375% (5 Year CMT Index + 451 bps) (144A) | 3,305,103 |
| 10,355,000(c) | Societe Generale SA, 6.221% (1 Year CMT Index + 320 bps), 6/15/33 (144A) | 9,377,616 |
| 800,000(c) | Societe Generale SA, 6.691% (1 Year CMT Index + 295 bps), 1/10/34 (144A) | 776,542 |
| 5,010,000(c)(i)(j) | Sovcombank Via SovCom Capital DAC, 7.60% (5 Year CMT Index + 636 bps) (144A) | 180,986 |
| 13,077,000(c) | Standard Chartered Plc, 3.603% (1 Year CMT Index + 190 bps), 1/12/33 (144A) | 10,039,017 |
| 6,614,000(c) | Standard Chartered Plc, 6.296% (1 Year CMT Index + 258 bps), 7/6/34 (144A) | 6,380,202 |
| 9,276,000(c) | UBS Group AG, 4.988% (1 Year CMT Index + 240 bps), 8/5/33 (144A) | 8,294,389 |
| 2,780,000(c) | UBS Group AG, 6.301% (1 Year CMT Index + 200 bps), 9/22/34 (144A) | 2,715,111 |
| 23,889,000(c) | UniCredit S.p.A., 5.459% (5 Year CMT Index + 475 bps), 6/30/35 (144A) | 20,026,248 |
| 9,395,000(c) | UniCredit S.p.A., 7.296% (5 Year USD Swap Rate + 491 bps), 4/2/34 (144A) | 8,850,380 |
| | Total Banks | $256,271,838 |
|
|
| | Biotechnology — 0.1% | |
| EUR 2,405,000 | Cidron Aida Finco S.a.r.l., 5.00%, 4/1/28 (144A) | $ 2,296,249 |
| | Total Biotechnology | $2,296,249 |
|
|
The accompanying notes are an integral part of these financial statements.
Pioneer Strategic Income Fund | Annual Report | 9/30/2343
Schedule of Investments | 9/30/23 (continued)
Principal
Amount
USD ($) | | | | | | Value |
| | Building Materials — 0.4% | |
| 7,885,000(e) | AmeriTex HoldCo Intermediate LLC, 10.25%, 10/15/28 (144A) | $ 7,796,294 |
| 5,550,000 | Fortune Brands Innovations, Inc., 4.50%, 3/25/52 | 4,088,151 |
| | Total Building Materials | $11,884,445 |
|
|
| | Chemicals — 0.5% | |
| 13,500,000 | OCI NV, 6.70%, 3/16/33 (144A) | $ 12,881,084 |
| 5,055,000 | Trinseo Materials Operating SCA/Trinseo Materials Finance, Inc., 5.125%, 4/1/29 (144A) | 2,637,165 |
| | Total Chemicals | $15,518,249 |
|
|
| | Commercial Services — 1.1% | |
| 5,196,000 | Allied Universal Holdco LLC/Allied Universal Finance Corp., 6.625%, 7/15/26 (144A) | $ 4,923,417 |
| EUR 2,470,000 | Allied Universal Holdco LLC/Allied Universal Finance Corp./Atlas Luxco 4 S.a.r.l., 3.625%, 6/1/28 (144A) | 2,147,883 |
| 1,670,000 | Allied Universal Holdco LLC/Allied Universal Finance Corp./Atlas Luxco 4 S.a.r.l., 4.625%, 6/1/28 (144A) | 1,391,711 |
| 1,025,000 | Allied Universal Holdco LLC/Allied Universal Finance Corp./Atlas Luxco 4 S.a.r.l., 4.625%, 6/1/28 (144A) | 850,952 |
| 5,400,000 | Ashtead Capital, Inc., 5.50%, 8/11/32 (144A) | 4,989,331 |
| 1,920,000 | Ashtead Capital, Inc., 5.95%, 10/15/33 (144A) | 1,822,766 |
| 5,375,000 | Garda World Security Corp., 4.625%, 2/15/27 (144A) | 4,918,448 |
| 3,830,000 | Garda World Security Corp., 6.00%, 6/1/29 (144A) | 3,132,514 |
| 437,000 | Garda World Security Corp., 9.50%, 11/1/27 (144A) | 417,823 |
| 10,716,000 | Prime Security Services Borrower LLC/Prime Finance, Inc., 6.25%, 1/15/28 (144A) | 9,924,822 |
| | Total Commercial Services | $34,519,667 |
|
|
| | Cosmetics/Personal Care — 0.1% | |
| EUR 4,095,000 | Coty, Inc., 5.75%, 9/15/28 (144A) | $ 4,349,579 |
| | Total Cosmetics/Personal Care | $4,349,579 |
|
|
The accompanying notes are an integral part of these financial statements.
44Pioneer Strategic Income Fund | Annual Report | 9/30/23
Principal
Amount
USD ($) | | | | | | Value |
| | Diversified Financial Services — 4.3% | |
| 8,250,000 | AerCap Ireland Capital DAC/AerCap Global Aviation Trust, 3.30%, 1/30/32 | $ 6,558,022 |
| 16,065,000 | Air Lease Corp., 2.875%, 1/15/32 | 12,521,387 |
| 7,310,000 | Air Lease Corp., 3.125%, 12/1/30 | 5,952,264 |
| 2,532,000 | Ally Financial, Inc., 6.70%, 2/14/33 | 2,198,005 |
| 6,750,000(c) | Ally Financial, Inc., 6.992% (SOFR + 326 bps), 6/13/29 | 6,604,837 |
| 7,924,000 | Ally Financial, Inc., 8.00%, 11/1/31 | 8,000,346 |
| 11,445,000 | Avolon Holdings Funding, Ltd., 6.375%, 5/4/28 (144A) | 11,244,758 |
| 9,950,000 | B3 SA - Brasil Bolsa Balcao, 4.125%, 9/20/31 (144A) | 8,234,480 |
| 8,607,000 | Bread Financial Holdings, Inc., 7.00%, 1/15/26 (144A) | 8,060,101 |
| 6,950,000(c) | Capital One Financial Corp., 2.359% (SOFR + 134 bps), 7/29/32 | 4,762,538 |
| 5,911,000(c) | Capital One Financial Corp., 5.817% (SOFR + 260 bps), 2/1/34 | 5,326,988 |
| 14,860,000(c) | Capital One Financial Corp., 6.377% (SOFR + 286 bps), 6/8/34 | 14,023,614 |
| 5,070,000(c) | Charles Schwab Corp., 5.853% (SOFR + 250 bps), 5/19/34 | 4,821,030 |
| 6,660,000(j) | Credito Real SAB de CV SOFOM ER, 8.00%, 1/21/28 (144A) | 699,300 |
| 17,870,600(h) | Global Aircraft Leasing Co., Ltd., 6.50% (7.25% PIK or 6.50% Cash), 9/15/24 (144A) | 17,021,746 |
| 5,575,000 | OneMain Finance Corp., 3.50%, 1/15/27 | 4,773,594 |
| EUR 3,215,000 | Sherwood Financing Plc, 4.50%, 11/15/26 | 2,957,086 |
| GBP 5,170,000 | Sherwood Financing Plc, 6.00%, 11/15/26 (144A) | 5,345,960 |
| 8,705,000 | United Wholesale Mortgage LLC, 5.50%, 4/15/29 (144A) | 7,355,725 |
| | Total Diversified Financial Services | $136,461,781 |
|
|
| | Electric — 0.6% | |
| 7,670,000(c) | Algonquin Power & Utilities Corp., 4.75% (5 Year CMT Index + 325 bps), 1/18/82 | $ 6,251,050 |
| EUR 3,240,000 | ContourGlobal Power Holdings SA, 2.75%, 1/1/26 (144A) | 3,150,505 |
| EUR 1,635,000 | ContourGlobal Power Holdings SA, 3.125%, 1/1/28 (144A) | 1,418,233 |
The accompanying notes are an integral part of these financial statements.
Pioneer Strategic Income Fund | Annual Report | 9/30/2345
Schedule of Investments | 9/30/23 (continued)
Principal
Amount
USD ($) | | | | | | Value |
| | Electric — (continued) | |
| 9,225,000(j) | Light Servicos de Eletricidade SA/Light Energia SA, 4.375%, 6/18/26 (144A) | $ 4,111,423 |
| 4,075,000 | Vistra Operations Co. LLC, 6.95%, 10/15/33 (144A) | 3,996,902 |
| | Total Electric | $18,928,113 |
|
|
| | Electrical Components & Equipments —
0.5% | |
| EUR 7,865,000 | Belden, Inc., 3.375%, 7/15/27 (144A) | $ 7,723,706 |
| EUR 4,585,000 | Belden, Inc., 3.375%, 7/15/31 (144A) | 4,059,096 |
| EUR 6,020,000 | Energizer Gamma Acquisition BV, 3.50%, 6/30/29 (144A) | 5,073,184 |
| | Total Electrical Components & Equipments | $16,855,986 |
|
|
| | Energy-Alternate Sources — 0.0%† | |
| 1,390,180 | Adani Renewable Energy RJ, Ltd./Kodangal Solar Parks Pvt, Ltd./Wardha Solar Maharash, 4.625%, 10/15/39 (144A) | $ 1,010,648 |
| 563,616 | Alta Wind Holdings LLC, 7.00%, 6/30/35 (144A) | 506,091 |
| | Total Energy-Alternate Sources | $1,516,739 |
|
|
| | Engineering & Construction — 0.1% | |
| 1,615,000 | IHS Holding, Ltd., 5.625%, 11/29/26 (144A) | $ 1,328,854 |
| 1,425,000 | IHS Holding, Ltd., 6.25%, 11/29/28 (144A) | 1,080,692 |
| | Total Engineering & Construction | $2,409,546 |
|
|
| | Entertainment — 0.5% | |
| EUR 2,115,000 | Allwyn Entertainment Financing UK Plc, 7.25%, 4/30/30 (144A) | $ 2,255,985 |
| 905,000 | Allwyn Entertainment Financing UK Plc, 7.875%, 4/30/29 (144A) | 914,050 |
| 11,100,000 | Resorts World Las Vegas LLC/RWLV Capital, Inc., 4.625%, 4/16/29 (144A) | 8,860,849 |
| 3,400,000 | Resorts World Las Vegas LLC/RWLV Capital, Inc., 4.625%, 4/6/31 (144A) | 2,534,816 |
| 2,910,000 | Scientific Games Holdings LP/Scientific Games US FinCo, Inc., 6.625%, 3/1/30 (144A) | 2,509,875 |
| | Total Entertainment | $17,075,575 |
|
|
| | Food — 0.8% | |
| 1,458,000 | JBS USA LUX S.A./JBS USA Food Co./JBS USA Finance, Inc., 3.00%, 5/15/32 | $ 1,099,889 |
| 11,860,000 | JBS USA LUX S.A./JBS USA Food Co./JBS USA Finance, Inc., 5.75%, 4/1/33 | 10,846,722 |
The accompanying notes are an integral part of these financial statements.
46Pioneer Strategic Income Fund | Annual Report | 9/30/23
Principal
Amount
USD ($) | | | | | | Value |
| | Food — (continued) | |
| 4,610,000 | JBS USA LUX S.A./JBS USA Food Co./JBS USA Finance, Inc., 6.50%, 12/1/52 | $ 4,127,311 |
| 14,425,000 | Minerva Luxembourg SA, 4.375%, 3/18/31 (144A) | 11,162,788 |
| | Total Food | $27,236,710 |
|
|
| | Forest Products & Paper — 0.0%† | |
| EUR 23,000 | Ahlstrom Holding 3 Oy, 3.625%, 2/4/28 (144A) | $ 20,384 |
| | Total Forest Products & Paper | $20,384 |
|
|
| | Gas — 0.4% | |
| 13,550,000 | KeySpan Gas East Corp., 5.994%, 3/6/33 (144A) | $ 13,076,186 |
| | Total Gas | $13,076,186 |
|
|
| | Hand & Machine Tools — 0.2% | |
| 5,410,000 | Regal Rexnord Corp., 6.30%, 2/15/30 (144A) | $ 5,225,910 |
| | Total Hand & Machine Tools | $5,225,910 |
|
|
| | Healthcare-Services — 0.2% | |
| 4,495,000 | Auna SAA, 6.50%, 11/20/25 (144A) | $ 4,136,125 |
| EUR 3,860,000 | CAB SELAS, 3.375%, 2/1/28 (144A) | 3,403,925 |
| | Total Healthcare-Services | $7,540,050 |
|
|
| | Insurance — 1.1% | |
| 13,080,000(c) | Farmers Insurance Exchange, 4.747% (3 Month USD LIBOR + 323 bps), 11/1/57 (144A) | $ 9,797,380 |
| EUR 2,650,000(c) | Liberty Mutual Group, Inc., 3.625% (5 Year EUR Swap + 370 bps), 5/23/59 (144A) | 2,662,075 |
| 22,651,000 | Liberty Mutual Insurance Co., 7.697%, 10/15/97 (144A) | 22,160,755 |
| | Total Insurance | $34,620,210 |
|
|
| | Internet — 0.1% | |
| EUR 3,257,000 | United Group BV, 5.25%, 2/1/30 (144A) | $ 2,827,565 |
| | Total Internet | $2,827,565 |
|
|
| | Iron & Steel — 0.2% | |
| 248,000 | ATI, Inc., 7.25%, 8/15/30 | $ 246,140 |
| 2,675,000 | Metinvest BV, 7.65%, 10/1/27 (144A) | 1,709,633 |
| 4,375,000 | TMS International Corp., 6.25%, 4/15/29 (144A) | 3,618,144 |
| | Total Iron & Steel | $5,573,917 |
|
|
The accompanying notes are an integral part of these financial statements.
Pioneer Strategic Income Fund | Annual Report | 9/30/2347
Schedule of Investments | 9/30/23 (continued)
Principal
Amount
USD ($) | | | | | | Value |
| | Leisure Time — 0.1% | |
| 1,130,000 | NCL Finance, Ltd., 6.125%, 3/15/28 (144A) | $ 997,225 |
| 1,330,000 | Royal Caribbean Cruises, Ltd., 7.25%, 1/15/30 (144A) | 1,318,153 |
| 300,000 | Viking Ocean Cruises Ship VII, Ltd., 5.625%, 2/15/29 (144A) | 271,500 |
| | Total Leisure Time | $2,586,878 |
|
|
| | Lodging — 0.1% | |
| 3,125,000 | Hilton Grand Vacations Borrower Escrow LLC/Hilton Grand Vacations Borrower Esc, 5.00%, 6/1/29 (144A) | $ 2,710,768 |
| | Total Lodging | $2,710,768 |
|
|
| | Media — 0.5% | |
| 3,910,000 | CCO Holdings LLC/CCO Holdings Capital Corp., 4.50%, 6/1/33 (144A) | $ 2,991,695 |
| 6,000,000 | CCO Holdings LLC/CCO Holdings Capital Corp., 4.75%, 3/1/30 (144A) | 5,036,708 |
| 1,785,000 | CCO Holdings LLC/CCO Holdings Capital Corp., 7.375%, 3/1/31 (144A) | 1,724,004 |
| 6,200,000 | CSC Holdings LLC, 4.625%, 12/1/30 (144A) | 3,296,250 |
| 2,305,000 | CSC Holdings LLC, 5.00%, 11/15/31 (144A) | 1,235,426 |
| 2,034,000(j) | Diamond Sports Group LLC/Diamond Sports Finance Co., 6.625%, 8/15/27 (144A) | 40,680 |
| 4,205,000 | VZ Secured Financing BV, 5.00%, 1/15/32 (144A) | 3,303,256 |
| | Total Media | $17,628,019 |
|
|
| | Mining — 1.1% | |
| 4,776,000 | AngloGold Ashanti Holdings Plc, 3.75%, 10/1/30 | $ 3,845,444 |
| 11,678,000 | Coeur Mining, Inc., 5.125%, 2/15/29 (144A) | 10,020,454 |
| 10,725,000 | First Quantum Minerals, Ltd., 8.625%, 6/1/31 (144A) | 10,673,324 |
| 11,990,000 | IAMGOLD Corp., 5.75%, 10/15/28 (144A) | 9,382,175 |
| | Total Mining | $33,921,397 |
|
|
| | Multi-National — 0.4% | |
| 8,430,000 | Banque Ouest Africaine de Developpement, 4.70%, 10/22/31 (144A) | $ 6,693,420 |
| INR 512,000,000 | European Bank For Reconstruction & Development, 6.25%, 4/11/28 | 5,855,710 |
| | Total Multi-National | $12,549,130 |
|
|
| | Oil & Gas — 2.6% | |
| 14,475,000 | Aker BP ASA, 6.00%, 6/13/33 (144A) | $ 13,989,757 |
The accompanying notes are an integral part of these financial statements.
48Pioneer Strategic Income Fund | Annual Report | 9/30/23
Principal
Amount
USD ($) | | | | | | Value |
| | Oil & Gas — (continued) | |
| 5,785,000 | Baytex Energy Corp., 8.50%, 4/30/30 (144A) | $ 5,853,419 |
| 2,235,000 | CITGO Petroleum Corp., 8.375%, 1/15/29 (144A) | 2,232,095 |
| 7,175,000 | Harbour Energy Plc, 5.50%, 10/15/26 (144A) | 6,690,688 |
| 4,737,000 | International Petroleum Corp., 7.25%, 2/1/27 (144A) | 4,424,358 |
| 3,760,000 | Matador Resources Co., 6.875%, 4/15/28 (144A) | 3,691,729 |
| 7,787,988 | MC Brazil Downstream Trading S.a.r.l, 7.25%, 6/30/31 (144A) | 5,972,530 |
| 8,985,000 | Neptune Energy Bondco Plc, 6.625%, 5/15/25 (144A) | 8,899,642 |
| 4,435,000 | Petroleos Mexicanos, 6.70%, 2/16/32 | 3,291,524 |
| 2,705,000 | Seadrill Finance, Ltd., 8.375%, 8/1/30 (144A) | 2,754,015 |
| 2,217,000 | Shelf Drilling Holdings, Ltd., 8.875%, 11/15/24 (144A) | 2,217,000 |
| 3,063,750 | Transocean, Inc., 8.75%, 2/15/30 (144A) | 3,132,684 |
| 5,635,000 | Tullow Oil Plc, 10.25%, 5/15/26 (144A) | 4,896,815 |
| 5,050,000 | Vermilion Energy, Inc., 6.875%, 5/1/30 (144A) | 4,778,296 |
| 12,895,000 | YPF SA, 6.95%, 7/21/27 (144A) | 10,345,189 |
| | Total Oil & Gas | $83,169,741 |
|
|
| | Oil & Gas Services — 0.2% | |
| 5,595,000 | Enerflex, Ltd., 9.00%, 10/15/27 (144A) | $ 5,525,063 |
| | Total Oil & Gas Services | $5,525,063 |
|
|
| | Pharmaceuticals — 0.5% | |
| 2,424,000 | Par Pharmaceutical, Inc., 7.50%, 4/1/27 (144A) | $ 1,721,040 |
| EUR 1,625,000 | Teva Pharmaceutical Finance Netherlands II BV, 3.75%, 5/9/27 | 1,552,726 |
| EUR 10,400,000 | Teva Pharmaceutical Finance Netherlands II BV, 4.375%, 5/9/30 | 9,377,976 |
| 1,478,000 | Teva Pharmaceutical Finance Netherlands III BV, 4.75%, 5/9/27 | 1,356,114 |
| 1,328,000 | Teva Pharmaceutical Finance Netherlands III BV, 5.125%, 5/9/29 | 1,200,512 |
| 7,025,000 | Tricida, Inc., 3.50%, 5/15/27 | — |
| 7,025,000 | Tricida, Inc., 3.50%, 5/15/27 | — |
| | Total Pharmaceuticals | $15,208,368 |
|
|
The accompanying notes are an integral part of these financial statements.
Pioneer Strategic Income Fund | Annual Report | 9/30/2349
Schedule of Investments | 9/30/23 (continued)
Principal
Amount
USD ($) | | | | | | Value |
| | Pipelines — 1.5% | |
| 5,435,000 | Crestwood Midstream Partners LP/Crestwood Midstream Finance Corp., 7.375%, 2/1/31 (144A) | $ 5,535,276 |
| 5,470,000(c) | Enbridge, Inc., 8.50% (5 Year CMT Index + 443 bps), 1/15/84 | 5,424,987 |
| 1,694,000(c)(i) | Energy Transfer LP, 6.625% (3 Month USD LIBOR + 416 bps) | 1,350,057 |
| 15,058,000(c)(i) | Energy Transfer LP, 7.125% (5 Year CMT Index + 531 bps) | 12,982,570 |
| 15,145,000 | EnLink Midstream Partners LP, 5.45%, 6/1/47 | 11,833,221 |
| 3,862,000 | EnLink Midstream Partners LP, 5.60%, 4/1/44 | 3,205,460 |
| 2,195,000 | Venture Global LNG, Inc., 8.125%, 6/1/28 (144A) | 2,173,364 |
| 5,145,000 | Venture Global LNG, Inc., 8.375%, 6/1/31 (144A) | 5,057,854 |
| | Total Pipelines | $47,562,789 |
|
|
| | REITs — 0.5% | |
| 640,000 | Highwoods Realty LP, 2.60%, 2/1/31 | $ 459,538 |
| 610,000 | Highwoods Realty LP, 3.05%, 2/15/30 | 468,792 |
| 16,561,000 | MPT Operating Partnership LP/MPT Finance Corp., 3.50%, 3/15/31 | 10,341,844 |
| 2,975,000 | Uniti Group LP/Uniti Group Finance, Inc./CSL Capital LLC, 6.50%, 2/15/29 (144A) | 1,947,973 |
| 2,465,000 | Uniti Group LP/Uniti Group Finance, Inc./CSL Capital LLC, 10.50%, 2/15/28 (144A) | 2,414,351 |
| | Total REITs | $15,632,498 |
|
|
| | Retail — 0.2% | |
| EUR 4,500,000 | Food Service Project SA, 5.50%, 1/21/27 (144A) | $ 4,526,880 |
| 3,805,000 | LCM Investments Holdings II LLC, 4.875%, 5/1/29 (144A) | 3,235,034 |
| | Total Retail | $7,761,914 |
|
|
| | Semiconductors — 0.3% | |
| 6,940,000 | Broadcom, Inc., 4.15%, 4/15/32 (144A) | $ 6,022,630 |
| 4,790,000 | Foundry JV Holdco LLC, 5.875%, 1/25/34 (144A) | 4,575,658 |
| | Total Semiconductors | $10,598,288 |
|
|
The accompanying notes are an integral part of these financial statements.
50Pioneer Strategic Income Fund | Annual Report | 9/30/23
Principal
Amount
USD ($) | | | | | | Value |
| | Software — 0.2% | |
| 6,525,000 | AthenaHealth Group, Inc., 6.50%, 2/15/30 (144A) | $ 5,458,210 |
| | Total Software | $5,458,210 |
|
|
| | Telecommunications — 1.1% | |
| 475,000 | Altice France SA, 5.125%, 1/15/29 (144A) | $ 337,737 |
| 1,835,000 | Altice France SA, 5.125%, 7/15/29 (144A) | 1,304,512 |
| 9,874,000 | Altice France SA, 5.50%, 1/15/28 (144A) | 7,605,128 |
| 4,600,000 | CommScope Technologies LLC, 5.00%, 3/15/27 (144A) | 2,610,731 |
| 4,120,000 | CommScope, Inc., 4.75%, 9/1/29 (144A) | 3,030,443 |
| 1,976,217(j) | Digicel International Finance Ltd/Digicel international Holdings, Ltd., 8.00%, 12/31/26 (144A) | 88,930 |
| 2,337,000 | Level 3 Financing, Inc., 10.50%, 5/15/30 (144A) | 2,352,396 |
| EUR 6,915,000 | Lorca Telecom Bondco SA, 4.00%, 9/18/27 (144A) | 6,784,720 |
| 5,570,000 | T-Mobile USA, Inc., 5.75%, 1/15/34 | 5,433,658 |
| 6,900,000 | Total Play Telecomunicaciones SA de CV, 6.375%, 9/20/28 (144A) | 3,414,120 |
| 4,270,000 | Windstream Escrow LLC/Windstream Escrow Finance Corp., 7.75%, 8/15/28 (144A) | 3,393,647 |
| | Total Telecommunications | $36,356,022 |
|
|
| | Transportation — 0.3% | |
| 4,910,000 | Hidrovias International Finance SARL, 4.95%, 2/8/31 (144A) | $ 3,940,447 |
| 3,172,000 | Seaspan Corp., 5.50%, 8/1/29 (144A) | 2,545,228 |
| 2,785,000 | Simpar Europe SA, 5.20%, 1/26/31 (144A) | 2,242,006 |
| 6,290,000(j) | Western Global Airlines LLC, 10.375%, 8/15/25 (144A) | 7,863 |
| | Total Transportation | $8,735,544 |
|
|
| | Trucking & Leasing — 0.1% | |
| 4,555,000 | Penske Truck Leasing Co. LP/PTL Finance Corp., 6.05%, 8/1/28 (144A) | $ 4,497,862 |
| | Total Trucking & Leasing | $4,497,862 |
|
|
| | Total Corporate Bonds
(Cost $1,185,794,717) | $1,021,224,753 |
|
|
The accompanying notes are an integral part of these financial statements.
Pioneer Strategic Income Fund | Annual Report | 9/30/2351
Schedule of Investments | 9/30/23 (continued)
| Shares | | | | | | Value |
| | Convertible Preferred Stock —
1.1% of Net Assets | |
| | Banks — 1.1% | |
| 31,306(i) | Wells Fargo & Co., 7.50% | $ 34,906,190 |
| | Total Banks | $34,906,190 |
|
|
| | Total Convertible Preferred Stock
(Cost $38,724,099) | $34,906,190 |
|
|
Principal
Amount
USD ($) | | | | | | |
| | Insurance-Linked Securities —
4.3% of Net Assets# | |
| | Event Linked Bonds — 1.6% | |
| | Earthquakes – California — 0.1% | |
| 750,000(a) | Phoenician Re, 8.344%, (3 Month U.S. Treasury Bill + 290 bps), 12/14/24 (144A) | $ 737,625 |
| 3,000,000(a) | Ursa Re II, 9.386%, (3 Month U.S. Treasury Bill + 394 bps), 12/7/23 (144A) | 2,989,500 |
| | | | | | | $ 3,727,125 |
|
|
| | Earthquakes – Mexico — 0.0%† | |
| 250,000(a) | International Bank for Reconstruction & Development, 9.087%, (3 Month USD LIBOR + 350 bps), 3/13/24 (144A) | $ 249,325 |
| | Earthquakes – U.S. — 0.0%† | |
| 500,000(a) | Ursa Re, 10.946%, (3 Month U.S. Treasury Bill + 550 bps), 12/6/25 (144A) | $ 504,350 |
| 500,000(c) | Veraison Re, 11.946%, (1 Month U.S. Treasury Bill + 650 bps), 3/9/26 (144A) | 527,400 |
| | | | | | | $ 1,031,750 |
|
|
| | Flood – U.S. — 0.1% | |
| 1,500,000(a) | FloodSmart Re, 17.276%, (3 Month U.S. Treasury Bill + 1,183 bps), 2/25/25 (144A) | $ 1,434,750 |
| 1,000,000(a) | FloodSmart Re, 19.026%, (3 Month U.S. Treasury Bill + 1,358 bps), 3/1/24 (144A) | 998,100 |
| | | | | | | $ 2,432,850 |
|
|
| | Health – U.S. — 0.2% | |
| 250,000(a) | Vitality Re XII, 8.196%, (3 Month U.S. Treasury Bill + 275 bps), 1/7/25 (144A) | $ 245,150 |
| 2,000,000(a) | Vitality Re XIII, 7.446%, (3 Month U.S. Treasury Bill + 200 bps), 1/6/26 (144A) | 1,961,000 |
The accompanying notes are an integral part of these financial statements.
52Pioneer Strategic Income Fund | Annual Report | 9/30/23
Principal
Amount
USD ($) | | | | | | Value |
| | Health – U.S. — (continued) | |
| 2,500,000(a) | Vitality Re XIV, 8.946%, (3 Month U.S. Treasury Bill + 350 bps), 1/5/27 (144A) | $ 2,555,500 |
| 400,000(a) | Vitality Re XIV, 9.946%, (3 Month U.S. Treasury Bill + 450 bps), 1/5/27 (144A) | 399,760 |
| | | | | | | $ 5,161,410 |
|
|
| | Multiperil – U.S. — 0.6% | |
| 900,000(a) | Easton Re Pte, 9.976%, (3 Month U.S. Treasury Bill + 453 bps), 1/8/24 (144A) | $ 901,350 |
| 500,000(a) | Four Lakes Re, 9.716%, (3 Month U.S. Treasury Bill + 427 bps), 1/7/25 (144A) | 483,650 |
| 1,500,000(a) | Four Lakes Re, 12.746%, (3 Month U.S. Treasury Bill + 730 bps), 1/5/24 (144A) | 1,467,000 |
| 1,500,000(a) | Four Lakes Re, 15.606%, (3 Month U.S. Treasury Bill + 1,016 bps), 1/5/24 (144A) | 1,505,250 |
| 500,000(a) | Herbie Re, 15.166%, (3 Month U.S. Treasury Bill + 972 bps), 1/8/25 (144A) | 489,750 |
| 1,750,000(a) | Matterhorn Re, 10.595%, (SOFR + 525 bps), 3/24/25 (144A) | 1,705,200 |
| 750,000(a) | Matterhorn Re, 13.095%, (SOFR + 775 bps), 3/24/25 (144A) | 739,500 |
| 2,900,000(a) | Mystic Re IV, 14.696%, (3 Month U.S. Treasury Bill + 925 bps), 1/8/26 (144A) | 2,964,090 |
| 1,500,000(a) | Residential Re, 11.956%, (3 Month U.S. Treasury Bill + 651 bps), 12/6/24 (144A) | 1,474,350 |
| 1,500,000(a) | Residential Re, 12.446%, (3 Month U.S. Treasury Bill + 700 bps), 12/6/26 (144A) | 1,503,450 |
| 1,250,000(a) | Residential Re, 13.686%, (3 Month U.S. Treasury Bill + 824 bps), 12/6/24 (144A) | 1,241,000 |
| 500,000(a) | Sakura Re, 18.946%, (3 Month U.S. Treasury Bill + 1,350 bps), 1/5/26 (144A) | 530,200 |
| 2,250,000(a) | Sanders Re II, 8.496%, (3 Month U.S. Treasury Bill + 305 bps), 4/7/25 (144A) | 2,131,200 |
| 250,000(a) | Sanders Re III, 11.196%, (3 Month U.S. Treasury Bill + 575 bps), 4/7/27 (144A) | 247,750 |
| 750,000(a) | Sanders Re III, 11.696%, (3 Month U.S. Treasury Bill + 625 bps), 4/7/27 (144A) | 754,575 |
| 750,000(a) | Sussex Re, 13.826%, (3 Month U.S. Treasury Bill + 838 bps), 1/8/25 (144A) | 721,200 |
| | | | | | | $ 18,859,515 |
|
|
The accompanying notes are an integral part of these financial statements.
Pioneer Strategic Income Fund | Annual Report | 9/30/2353
Schedule of Investments | 9/30/23 (continued)
Principal
Amount
USD ($) | | | | | | Value |
| | Multiperil – U.S. & Canada — 0.0%† | |
| 250,000(a) | Matterhorn Re, 11.094%, (SOFR + 575 bps), 12/8/25 (144A) | $ 226,575 |
| 800,000(a) | Mona Lisa Re, 17.946%, (3 Month U.S. Treasury Bill + 1,250 bps), 1/8/26 (144A) | 856,000 |
| 500,000(a) | Northshore Re II, 13.446%, (3 Month U.S. Treasury Bill + 800 bps), 7/8/25 (144A) | 502,250 |
| | | | | | | $ 1,584,825 |
|
|
| | Multiperil – U.S. Regional — 0.2% | |
| 750,000(a) | Aquila Re I, 12.946%, (3 Month U.S. Treasury Bill + 750 bps), 6/8/26 (144A) | $ 762,450 |
| 1,000,000(a) | Kilimanjaro III Re, 5.25%, (3 Month U.S. Treasury Bill + 525 bps), 6/25/25 (144A) | 996,500 |
| 1,000,000(a) | Locke Tavern Re, 4.75%, (3 Month U.S. Treasury Bill + 475 bps), 4/9/26 (144A) | 1,016,800 |
| 2,500,000(a) | Long Point Re IV, 9.696%, (3 Month U.S. Treasury Bill + 425 bps), 6/1/26 (144A) | 2,485,000 |
| | | | | | | $ 5,260,750 |
|
|
| | Multiperil – Worldwide — 0.1% | |
| 1,250,000(a) | Atlas Capital, 12.56%, (SOFR + 725 bps), 6/5/26 (144A) | $ 1,261,750 |
| 500,000(a) | Northshore Re II, 11.196%, (3 Month U.S. Treasury Bill + 575 bps), 1/8/24 (144A) | 498,350 |
| | | | | | | $ 1,760,100 |
|
|
| | Pandemic – U.S — 0.0%† | |
| 1,000,000(a) | Vitality Re XI, 7.246%, (3 Month U.S. Treasury Bill + 180 bps), 1/9/24 (144A) | $ 992,300 |
| | Windstorm – Florida — 0.0%† | |
| 500,000(a) | Integrity Re, 12.516%, (3 Month U.S. Treasury Bill + 707 bps), 6/6/25 (144A) | $ 450,000 |
| | Windstorm – U.S. — 0.2% | |
| 750,000(a) | Alamo Re, 13.946%, (1 Month U.S. Treasury Bill + 850 bps), 6/7/26 (144A) | $ 762,225 |
| 750,000(a) | Bonanza Re, 10.316%, (3 Month U.S. Treasury Bill + 487 bps), 12/23/24 (144A) | 669,975 |
| 250,000(a) | Bonanza Re, 11.196%, (3 Month U.S. Treasury Bill + 575 bps), 3/16/25 (144A) | 175,000 |
| 250,000(a) | Bonanza Re, 13.696%, (3 Month U.S. Treasury Bill + 825 bps), 1/8/26 (144A) | 251,375 |
The accompanying notes are an integral part of these financial statements.
54Pioneer Strategic Income Fund | Annual Report | 9/30/23
Principal
Amount
USD ($) | | | | | | Value |
| | Windstorm – U.S. — (continued) | |
| 1,000,000(a) | Cape Lookout Re, 11.946%, (1 Month U.S. Treasury Bill + 650 bps), 4/28/26 (144A) | $ 1,017,100 |
| 500,000(a) | Gateway Re, 18.446%, (1 Month U.S. Treasury Bill + 1,300 bps), 2/24/26 (144A) | 526,150 |
| 250,000(a) | Gateway Re II, 14.946%, (3 Month U.S. Treasury Bill + 950 bps), 4/27/26 (144A) | 253,125 |
| 2,500,000(a) | Queen Street 2023 Re, 12.946%, (3 Month U.S. Treasury Bill + 750 bps), 12/8/25 (144A) | 2,570,250 |
| | | | | | | $ 6,225,200 |
| |
| |
| | Windstorm – U.S. Regional — 0.0%† | | |
| 750,000(a) | Commonwealth Re, 8.946%, (3 Month U.S. Treasury Bill + 350 bps), 7/8/25 (144A) | $ 753,225 | |
| | Winterstorm – Florida — 0.1% | | |
| 1,250,000(a) | Integrity Re, 17.446%, (1 Month U.S. Treasury Bill + 1,200 bps), 6/6/25 (144A) | $ 1,309,250 | |
| 1,000,000(a) | Lightning Re, 16.446%, (3 Month U.S. Treasury Bill + 1,100 bps), 3/31/26 (144A) | 1,045,100 | |
| | | | | | | $ 2,354,350 | |
| |
| |
| | Total Event Linked Bonds | $ 50,842,725 | |
| |
| |
Face
Amount
USD ($) | | | | | | |
| | Collateralized Reinsurance — 0.8% | |
| | Earthquakes – California — 0.1% | |
| 1,800,000(k) + | Adare Re 2022-2, 9/30/28 | $ 1,987,687 |
| | Multiperil – Massachusetts — 0.0%† | |
| 1,500,000(b)(k) + | Denning Re 2022, 6/30/28 | $ 1,253,858 |
| 400,000(b)(k) + | Portsalon Re 2022, 5/31/28 | 366,768 |
| | | | | | | $ 1,620,626 |
|
|
| | Multiperil – U.S. — 0.5% | |
| 6,000,000(b)(k) + | Ballybunion Re 2020, 2/29/24 | $ 677,844 |
| 3,406,059(b)(k) + | Ballybunion Re 2021-3, 7/31/25 | 76,157 |
| 1,506,560(b)(k) + | Ballybunion Re 2022, 12/31/27 | 28,550 |
| 3,000,000(b)(k) + | Ballybunion Re 2022-2, 5/31/28 | 3,046,530 |
The accompanying notes are an integral part of these financial statements.
Pioneer Strategic Income Fund | Annual Report | 9/30/2355
Schedule of Investments | 9/30/23 (continued)
Face
Amount
USD ($) | | | | | | Value |
| | Multiperil – U.S. — (continued) | |
| 3,500,000(b)(k) + | Ballybunion Re 2022-3, 6/30/28 | $ 3,621,129 |
| 3,000,000(b)(k) + | Ballybunion Re 2023, 12/31/28 | 3,252,458 |
| 4,750,000(b)(k) + | Gamboge Re, 3/31/29 | 4,499,745 |
| | | | | | | $ 15,202,413 |
|
|
| | Multiperil – Worldwide — 0.1% | |
| 1,000,000(b)(k) + | Clarendon Re 2023, 12/31/28 | $ 1,016,025 |
| 140,000(k) + | Limestone Re 2019-2B, 10/1/23 (144A) | 1,186 |
| 1,020,000(k) + | Limestone Re 2020-1, 3/1/24 (144A) | — |
| 480,000(k) + | Limestone Re 2020-1, 3/1/24 (144A) | — |
| 500,000(b)(k) + | Merion Re 2023-1, 12/31/28 | 521,983 |
| 250,000(b)(k) + | Old Head Re 2022, 12/31/27 | 125,000 |
| 250,000(b)(k) + | Old Head Re 2023, 12/31/28 | 238,674 |
| 500,000(b)(k) + | Pine Valley Re 2023, 12/31/28 | — |
| 250,000(b)(k) + | Porthcawl Re 2023, 12/31/28 | 246,018 |
| 300,000(b)(k) + | Walton Health Re 2019, 6/30/24 | 156,475 |
| 2,000,000(b)(k) + | Walton Health Re 2022, 12/15/27 | 384,023 |
| | | | | | | $ 2,689,384 |
|
|
| | Windstorm – Florida — 0.0%† | |
| 1,750,000(b)(k) + | Formby Re 2018, 2/29/24 | $ — |
| 2,200,000(b)(k) + | Portrush Re 2017, 6/15/24 | 220 |
| | | | | | | $ 220 |
|
|
| | Windstorm – North Carolina — 0.1% | |
| 250,000(b)(k) + | Isosceles Re 2023, 4/30/29 | $ 246,750 |
| 1,000,000(b)(k) + | Isosceles Re 2023, 4/30/29 | 992,100 |
| 424,975(b)(k) + | Isosceles Re 2023, 4/30/29 | 420,853 |
| | | | | | | $ 1,659,703 |
|
|
| | Windstorm – U.S. Multistate — 0.0%† | |
| 1,000,000(b)(k) + | White Heron Re 2023, 5/31/29 | $ 1,002,672 |
| | Windstorm – U.S. Regional — 0.0%† | |
| 5,804,192(k) + | Oakmont Re 2020, 4/30/24 | $ — |
| 3,500,000(b)(k) + | Oakmont Re 2022, 4/1/28 | 1,100,769 |
| | | | | | | $ 1,100,769 |
|
|
| | Total Collateralized Reinsurance | $25,263,474 |
|
|
| | Reinsurance Sidecars — 1.9% | |
| | Multiperil – U.S. — 0.0%† | |
| 1,750,000(b)(k) + | Carnoustie Re 2020, 12/31/23 | $ 201,824 |
| 3,000,000(b)(l) + | Harambee Re 2018, 12/31/24 | — |
The accompanying notes are an integral part of these financial statements.
56Pioneer Strategic Income Fund | Annual Report | 9/30/23
Face
Amount
USD ($) | | | | | | Value |
| | Multiperil – U.S. — (continued) | |
| 5,000,000(l) + | Harambee Re 2019, 12/31/24 | $ 6,000 |
| 3,000,000(b)(l) + | Harambee Re 2020, 12/31/23 | 44,700 |
| | | | | | | $ 252,524 |
|
|
| | Multiperil – Worldwide — 1.9% | |
| 250,000(l) + | Alturas Re 2020-3, 9/30/24 | $ — |
| 2,639,535(b)(l) + | Alturas Re 2021-2, 12/31/24 | — |
| 236,951(b)(l) + | Alturas Re 2021-3, 7/31/25 | 20,686 |
| 2,318,301(b)(l) + | Alturas Re 2022-2, 12/31/27 | 528,109 |
| 3,932,000(b)(k) + | Bantry Re 2021, 12/31/24 | 7,864 |
| 3,280,525(b)(k) + | Bantry Re 2022, 12/31/27 | 383,365 |
| 5,000,000(b)(k) + | Bantry Re 2023, 12/31/28 | 5,801,756 |
| 9,947,951(b)(k) + | Berwick Re 2019-1, 12/31/24 | 1,586,698 |
| 2,000,000(b)(k) + | Berwick Re 2020-1, 12/31/23 | 200 |
| 3,500,000(b)(k) + | Berwick Re 2022, 12/31/27 | 67,478 |
| 3,500,000(b)(k) + | Berwick Re 2023, 12/31/28 | 3,815,792 |
| 4,000,000(b)(k) + | Eccleston Re 2023, 11/30/28 | 4,681,467 |
| 700,000(b)(k) + | Eden Re II, 3/22/24 (144A) | 266,000 |
| 524,241(b)(k) + | Eden Re II, 3/21/25 (144A) | 78,898 |
| 880,000(b)(k) + | Eden Re II, 3/20/26 (144A) | 568,718 |
| 3,000,000(b)(k) + | Eden Re II, 3/19/27 (144A) | 3,346,500 |
| 1,250,000(b)(k) + | Gleneagles Re 2021, 12/31/24 | 125 |
| 1,250,000(b)(k) + | Gleneagles Re 2022, 12/31/27 | 617,905 |
| 2,737,878(k) + | Gullane Re 2018, 12/31/24 | 129,294 |
| 5,318,293(b)(k) + | Gullane Re 2023, 12/31/28 | 6,280,511 |
| 500,000(b)(l) + | Lion Rock Re 2020, 1/31/24 | — |
| 500,000(b)(l) + | Lion Rock Re 2021, 12/31/24 | 94,700 |
| 2,545,246(b)(l) + | Lorenz Re 2019, 6/30/24 | 24,943 |
| 8,500,000(k) + | Merion Re 2018-2, 12/31/24 | 424,864 |
| 9,000,000(b)(k) + | Merion Re 2021-2, 12/31/24 | 1,768,500 |
| 6,551,154(b)(k) + | Merion Re 2022-2, 12/31/27 | 6,211,224 |
| 4,250,000(b)(k) + | Pangaea Re 2023-1, 12/31/28 | 4,974,053 |
| 2,500,000(b)(k) + | Pangaea Re 2023-3, 5/31/29 | 2,700,044 |
| 1,000,000(b)(k) + | Phoenix 3 Re 2023-3, 1/4/27 | 1,085,800 |
| 1,515,000(b)(k) + | RosaPenna Re 2022, 6/30/28 | 1,456,832 |
| 360,000(k) + | Sector Re V, 3/1/24 (144A) | 184,536 |
| 3,608(k) + | Sector Re V, 3/1/24 (144A) | 86,472 |
| 155,997(k) + | Sector Re V, 12/1/24 (144A) | 272,371 |
| 150,000(k) + | Sector Re V, 12/1/24 (144A) | 261,900 |
| 55,079(a)(b)(k) + | Sector Re V, 12/1/26 (144A) | 257,175 |
| 2,750(b)(k) + | Sector Re V, 3/1/27 (144A) | 285,996 |
| 9,179(b)(k) + | Sector Re V, 3/1/27 (144A) | 60,402 |
| 2,698,893(b)(k) + | Sector Re V, 12/1/27 (144A) | 3,262,962 |
The accompanying notes are an integral part of these financial statements.
Pioneer Strategic Income Fund | Annual Report | 9/30/2357
Schedule of Investments | 9/30/23 (continued)
Face
Amount
USD ($) | | | | | | Value |
| | Multiperil – Worldwide — (continued) | |
| 3,609,700(k) + | Sussex Re 2020-1, 12/31/24 | $ — |
| 1,000,000(k) + | Sussex Re 2021-1, 12/31/24 | 1,400 |
| 3,000,000(l) + | Thopas Re 2019, 12/31/24 | 23,400 |
| 4,000,000(l) + | Thopas Re 2020, 12/31/23 | — |
| 5,000,000(l) + | Thopas Re 2021, 12/31/24 | 80,500 |
| 3,000,000(l) + | Thopas Re 2022, 12/31/27 | — |
| 3,192,294(b)(l) + | Thopas Re 2023, 12/31/28 | 3,791,488 |
| 2,818,951(l) + | Torricelli Re 2021, 7/31/25 | 121,779 |
| 3,000,000(l) + | Torricelli Re 2022, 6/30/28 | 44,709 |
| 3,250,000(b)(l) + | Torricelli Re 2023, 6/30/29 | 3,554,730 |
| 1,250,000(b)(l) + | Viribus Re 2018, 12/31/24 | — |
| 3,650,000(b)(l) + | Viribus Re 2019, 12/31/24 | 25,915 |
| 4,139,570(b)(l) + | Viribus Re 2020, 12/31/23 | 137,434 |
| 2,500,000(l) + | Viribus Re 2022, 12/31/27 | 91,750 |
| 1,500,000(b)(l) + | Viribus Re 2023, 12/31/28 | 1,913,550 |
| 1,826,168(b)(k) + | Woburn Re 2018, 12/31/24 | 36,219 |
| 3,539,362(b)(k) + | Woburn Re 2019, 12/31/24 | 612,596 |
| | | | | | | $ 62,029,610 |
|
|
| | Total Reinsurance Sidecars | $62,282,134 |
|
|
| | Total Insurance-Linked Securities
(Cost $132,048,577) | $138,388,333 |
|
|
Principal
Amount
USD ($) | | | | | | |
| | Foreign Government Bonds —
3.1% of Net Assets | |
| | Angola — 0.2% | |
| 6,420,000 | Angolan Government International Bond, 8.750%, 4/14/32 (144A) | $ 5,151,164 |
| | Total Angola | $5,151,164 |
|
|
| | Argentina — 0.3% | |
| 351,880 | Argentine Republic Government International Bond, 1.000%, 7/9/29 | $ 97,647 |
| 5,955,800(d) | Argentine Republic Government International Bond, 3.625%, 7/9/35 | 1,469,031 |
| 8,500,000 | Ciudad Autonoma De Buenos Aires, 7.500%, 6/1/27 (144A) | 7,780,830 |
| | Total Argentina | $9,347,508 |
|
|
The accompanying notes are an integral part of these financial statements.
58Pioneer Strategic Income Fund | Annual Report | 9/30/23
Principal
Amount
USD ($) | | | | | | Value |
| | Colombia — 0.1% | |
| 4,800,000 | Colombia Government International Bond, 3.125%, 4/15/31 | $ 3,546,509 |
| | Total Colombia | $3,546,509 |
|
|
| | Egypt — 0.2% | |
| 2,520,000 | Egypt Government International Bond, 5.875%, 2/16/31 (144A) | $ 1,387,098 |
| 5,560,000 | Egypt Government International Bond, 7.053%, 1/15/32 (144A) | 3,186,792 |
| 2,000,000 | Egypt Government International Bond, 8.875%, 5/29/50 (144A) | 1,080,000 |
| | Total Egypt | $5,653,890 |
|
|
| | Ghana — 0.1% | |
| 7,018,000(j) | Ghana Government International Bond, 7.875%, 2/11/35 (144A) | $ 3,112,511 |
| | Total Ghana | $3,112,511 |
|
|
| | Indonesia — 0.4% | |
| IDR 219,632,000,000 | Indonesia Treasury Bond, 6.125%, 5/15/28 | $ 14,002,446 |
| | Total Indonesia | $14,002,446 |
|
|
| | Ivory Coast — 0.4% | |
| EUR 8,965,000 | Ivory Coast Government International Bond, 4.875%, 1/30/32 (144A) | $ 7,203,467 |
| EUR 3,270,000 | Ivory Coast Government International Bond, 5.875%, 10/17/31 (144A) | 2,851,505 |
| 2,500,000 | Ivory Coast Government International Bond, 6.125%, 6/15/33 (144A) | 2,068,850 |
| | Total Ivory Coast | $12,123,822 |
|
|
| | Rwanda — 0.1% | |
| 5,525,000 | Rwanda International Government Bond, 5.500%, 8/9/31 (144A) | $ 4,267,676 |
| | Total Rwanda | $4,267,676 |
|
|
| | Serbia — 0.1% | |
| EUR 6,600,000 | Serbia International Bond, 2.050%, 9/23/36 (144A) | $ 4,120,420 |
| | Total Serbia | $4,120,420 |
|
|
| | Supranational — 0.6% | |
| INR 435,400,000 | International Bank for Reconstruction & Development, 6.500%, 4/17/30 | $ 5,120,131 |
| INR 581,000,000 | International Bank for Reconstruction & Development, 6.850%, 4/24/28 | 6,849,988 |
The accompanying notes are an integral part of these financial statements.
Pioneer Strategic Income Fund | Annual Report | 9/30/2359
Schedule of Investments | 9/30/23 (continued)
Principal
Amount
USD ($) | | | | | | Value |
| | Supranational — (continued) | |
| KZT 1,169,000,000 | International Bank for Reconstruction & Development, 12.500%, 2/21/25 | $ 2,371,007 |
| COP 23,200,000,000 | International Finance Corp., 3.590%, 2/26/26 | 4,707,438 |
| | Total Supranational | $19,048,564 |
|
|
| | Ukraine — 0.1% | |
| EUR 4,490,000(j) | Ukraine Government International Bond, 4.375%, 1/27/32 (144A) | $ 1,110,478 |
| 9,575,000(j) | Ukraine Government International Bond, 7.375%, 9/25/34 (144A) | 2,515,927 |
| | Total Ukraine | $3,626,405 |
|
|
| | Uruguay — 0.2% | |
| UYU 190,614,000 | Uruguay Government International Bond, 9.750%, 7/20/33 | $ 4,969,592 |
| | Total Uruguay | $4,969,592 |
|
|
| | Uzbekistan — 0.3% | |
| UZS 76,270,000,000 | Republic of Uzbekistan International Bond, 14.000%, 7/19/24 (144A) | $ 6,216,057 |
| UZS 33,340,000,000 | Republic of Uzbekistan International Bond, 14.500%, 11/25/23 (144A) | 2,720,877 |
| | Total Uzbekistan | $8,936,934 |
|
|
| | Total Foreign Government Bonds
(Cost $133,426,510) | $97,907,441 |
|
|
| | U.S. Government and Agency
Obligations — 34.3% of Net Assets | |
| 6,205,364 | Federal Home Loan Mortgage Corp., 1.500%, 12/1/41 | $ 4,788,943 |
| 916,747 | Federal Home Loan Mortgage Corp., 1.500%, 1/1/42 | 707,485 |
| 903,441 | Federal Home Loan Mortgage Corp., 1.500%, 1/1/42 | 697,218 |
| 7,143,827 | Federal Home Loan Mortgage Corp., 1.500%, 1/1/42 | 5,513,171 |
| 2,675,724 | Federal Home Loan Mortgage Corp., 1.500%, 2/1/42 | 2,064,960 |
| 4,475,198 | Federal Home Loan Mortgage Corp., 1.500%, 2/1/42 | 3,453,643 |
| 918,946 | Federal Home Loan Mortgage Corp., 1.500%, 3/1/42 | 709,174 |
| 160,864 | Federal Home Loan Mortgage Corp., 2.000%, 2/1/42 | 128,170 |
The accompanying notes are an integral part of these financial statements.
60Pioneer Strategic Income Fund | Annual Report | 9/30/23
Principal
Amount
USD ($) | | | | | | Value |
| | U.S. Government and Agency
Obligations — (continued) | |
| 1,316,781 | Federal Home Loan Mortgage Corp., 2.000%, 3/1/52 | $ 1,004,640 |
| 20,854,143 | Federal Home Loan Mortgage Corp., 2.500%, 5/1/51 | 16,642,679 |
| 112,123 | Federal Home Loan Mortgage Corp., 3.000%, 11/1/47 | 94,927 |
| 710,347 | Federal Home Loan Mortgage Corp., 3.000%, 1/1/52 | 587,782 |
| 1,217,604 | Federal Home Loan Mortgage Corp., 3.000%, 9/1/52 | 1,007,468 |
| 802,816 | Federal Home Loan Mortgage Corp., 3.000%, 4/1/53 | 664,158 |
| 32,317 | Federal Home Loan Mortgage Corp., 3.500%, 1/1/52 | 27,863 |
| 2,486,856 | Federal Home Loan Mortgage Corp., 3.500%, 4/1/52 | 2,157,594 |
| 168,053 | Federal Home Loan Mortgage Corp., 3.500%, 4/1/52 | 144,647 |
| 1,499,963 | Federal Home Loan Mortgage Corp., 3.500%, 4/1/52 | 1,303,887 |
| 1,776,988 | Federal Home Loan Mortgage Corp., 4.000%, 10/1/42 | 1,629,261 |
| 635,232 | Federal Home Loan Mortgage Corp., 4.000%, 4/1/47 | 574,684 |
| 186,054 | Federal Home Loan Mortgage Corp., 4.000%, 6/1/50 | 167,327 |
| 102,157 | Federal Home Loan Mortgage Corp., 4.000%, 4/1/51 | 91,259 |
| 91,350 | Federal Home Loan Mortgage Corp., 4.000%, 9/1/51 | 81,425 |
| 159,308 | Federal Home Loan Mortgage Corp., 4.000%, 6/1/52 | 141,939 |
| 85,731 | Federal Home Loan Mortgage Corp., 4.500%, 10/1/35 | 80,913 |
| 267,714 | Federal Home Loan Mortgage Corp., 4.500%, 7/1/40 | 253,253 |
| 166,168 | Federal Home Loan Mortgage Corp., 4.500%, 11/1/40 | 156,976 |
| 6,146 | Federal Home Loan Mortgage Corp., 4.500%, 9/1/43 | 5,731 |
| 98,872 | Federal Home Loan Mortgage Corp., 4.500%, 10/1/43 | 92,918 |
| 394,092 | Federal Home Loan Mortgage Corp., 4.500%, 11/1/43 | 370,347 |
The accompanying notes are an integral part of these financial statements.
Pioneer Strategic Income Fund | Annual Report | 9/30/2361
Schedule of Investments | 9/30/23 (continued)
Principal
Amount
USD ($) | | | | | | Value |
| | U.S. Government and Agency
Obligations — (continued) | |
| 5,187 | Federal Home Loan Mortgage Corp., 4.500%, 3/1/44 | $ 4,875 |
| 14,529 | Federal Home Loan Mortgage Corp., 4.500%, 5/1/44 | 13,653 |
| 7,081 | Federal Home Loan Mortgage Corp., 5.000%, 5/1/34 | 6,935 |
| 8,778 | Federal Home Loan Mortgage Corp., 5.000%, 11/1/34 | 8,613 |
| 41,696 | Federal Home Loan Mortgage Corp., 5.000%, 12/1/34 | 40,912 |
| 29,139 | Federal Home Loan Mortgage Corp., 5.000%, 7/1/35 | 28,581 |
| 71,554 | Federal Home Loan Mortgage Corp., 5.000%, 9/1/38 | 70,119 |
| 103,987 | Federal Home Loan Mortgage Corp., 5.000%, 9/1/38 | 101,902 |
| 3,616 | Federal Home Loan Mortgage Corp., 5.000%, 10/1/38 | 3,544 |
| 485 | Federal Home Loan Mortgage Corp., 5.000%, 5/1/39 | 472 |
| 1,570,660 | Federal Home Loan Mortgage Corp., 5.000%, 11/1/39 | 1,536,377 |
| 933 | Federal Home Loan Mortgage Corp., 5.000%, 12/1/39 | 907 |
| 404,390 | Federal Home Loan Mortgage Corp., 5.000%, 8/1/50 | 386,020 |
| 1,724,735 | Federal Home Loan Mortgage Corp., 5.000%, 12/1/50 | 1,642,678 |
| 1,147,539 | Federal Home Loan Mortgage Corp., 5.000%, 9/1/52 | 1,103,414 |
| 1,328,134 | Federal Home Loan Mortgage Corp., 5.000%, 10/1/52 | 1,277,065 |
| 115,394 | Federal Home Loan Mortgage Corp., 5.000%, 3/1/53 | 108,946 |
| 925,782 | Federal Home Loan Mortgage Corp., 5.000%, 4/1/53 | 873,912 |
| 6,486,538 | Federal Home Loan Mortgage Corp., 5.000%, 4/1/53 | 6,122,114 |
| 691,282 | Federal Home Loan Mortgage Corp., 5.000%, 4/1/53 | 652,707 |
| 111,265 | Federal Home Loan Mortgage Corp., 5.000%, 4/1/53 | 105,022 |
| 310,617 | Federal Home Loan Mortgage Corp., 5.000%, 4/1/53 | 293,320 |
The accompanying notes are an integral part of these financial statements.
62Pioneer Strategic Income Fund | Annual Report | 9/30/23
Principal
Amount
USD ($) | | | | | | Value |
| | U.S. Government and Agency
Obligations — (continued) | |
| 242,139 | Federal Home Loan Mortgage Corp., 5.000%, 4/1/53 | $ 228,822 |
| 716,907 | Federal Home Loan Mortgage Corp., 5.500%, 6/1/41 | 717,093 |
| 2,083,736 | Federal Home Loan Mortgage Corp., 5.500%, 7/1/49 | 2,045,434 |
| 315,564 | Federal Home Loan Mortgage Corp., 5.500%, 3/1/53 | 305,917 |
| 498,713 | Federal Home Loan Mortgage Corp., 5.500%, 3/1/53 | 482,193 |
| 307,552 | Federal Home Loan Mortgage Corp., 5.500%, 3/1/53 | 297,703 |
| 162,069 | Federal Home Loan Mortgage Corp., 5.500%, 4/1/53 | 156,710 |
| 199,944 | Federal Home Loan Mortgage Corp., 5.500%, 4/1/53 | 193,503 |
| 145,301 | Federal Home Loan Mortgage Corp., 5.500%, 4/1/53 | 140,706 |
| 361,318 | Federal Home Loan Mortgage Corp., 5.500%, 4/1/53 | 350,255 |
| 734,927 | Federal Home Loan Mortgage Corp., 5.500%, 4/1/53 | 711,117 |
| 14,858 | Federal Home Loan Mortgage Corp., 6.000%, 1/1/33 | 14,692 |
| 1,701 | Federal Home Loan Mortgage Corp., 6.000%, 3/1/33 | 1,682 |
| 10,297 | Federal Home Loan Mortgage Corp., 6.000%, 3/1/33 | 10,181 |
| 17,481 | Federal Home Loan Mortgage Corp., 6.000%, 1/1/34 | 17,755 |
| 45,533 | Federal Home Loan Mortgage Corp., 6.000%, 6/1/35 | 45,036 |
| 17,468 | Federal Home Loan Mortgage Corp., 6.000%, 12/1/36 | 17,404 |
| 1,536 | Federal Home Loan Mortgage Corp., 6.000%, 10/1/37 | 1,530 |
| 42,006 | Federal Home Loan Mortgage Corp., 6.000%, 12/1/37 | 42,757 |
| 648,511 | Federal Home Loan Mortgage Corp., 6.000%, 10/1/52 | 646,228 |
| 326,540 | Federal Home Loan Mortgage Corp., 6.000%, 3/1/53 | 327,059 |
| 253,937 | Federal Home Loan Mortgage Corp., 6.000%, 3/1/53 | 252,328 |
The accompanying notes are an integral part of these financial statements.
Pioneer Strategic Income Fund | Annual Report | 9/30/2363
Schedule of Investments | 9/30/23 (continued)
Principal
Amount
USD ($) | | | | | | Value |
| | U.S. Government and Agency
Obligations — (continued) | |
| 189,328 | Federal Home Loan Mortgage Corp., 6.000%, 4/1/53 | $ 189,889 |
| 235,001 | Federal Home Loan Mortgage Corp., 6.000%, 4/1/53 | 232,367 |
| 148,342 | Federal Home Loan Mortgage Corp., 6.000%, 4/1/53 | 146,586 |
| 163,932 | Federal Home Loan Mortgage Corp., 6.000%, 4/1/53 | 162,409 |
| 498,813 | Federal Home Loan Mortgage Corp., 6.000%, 7/1/53 | 492,488 |
| 3,716,178 | Federal Home Loan Mortgage Corp., 6.000%, 7/1/53 | 3,668,675 |
| 17,316,118 | Federal Home Loan Mortgage Corp., 6.000%, 8/1/53 | 17,094,768 |
| 1,541 | Federal Home Loan Mortgage Corp., 6.500%, 9/1/32 | 1,551 |
| 840,671 | Federal Home Loan Mortgage Corp., 6.500%, 1/1/53 | 847,403 |
| 5,423,303 | Federal Home Loan Mortgage Corp., 6.500%, 2/1/53 | 5,583,092 |
| 186,205 | Federal Home Loan Mortgage Corp., 6.500%, 4/1/53 | 188,955 |
| 148,422 | Federal Home Loan Mortgage Corp., 6.500%, 4/1/53 | 149,837 |
| 13,000,000 | Federal Home Loan Mortgage Corp., 6.500%, 10/1/53 | 13,062,798 |
| 31,419,678 | Federal National Mortgage Association, 1.500%, 11/1/41 | 24,252,547 |
| 5,345,954 | Federal National Mortgage Association, 1.500%, 1/1/42 | 4,126,409 |
| 7,262,976 | Federal National Mortgage Association, 1.500%, 2/1/42 | 5,606,070 |
| 2,694,550 | Federal National Mortgage Association, 1.500%, 3/1/42 | 2,079,825 |
| 6,000,000 | Federal National Mortgage Association, 2.000%, 10/15/38 (TBA) | 5,144,414 |
| 10,514,703 | Federal National Mortgage Association, 2.000%, 12/1/41 | 8,360,886 |
| 551,945 | Federal National Mortgage Association, 2.000%, 2/1/42 | 437,362 |
| 195,983 | Federal National Mortgage Association, 2.000%, 2/1/42 | 155,153 |
| 640,047 | Federal National Mortgage Association, 2.000%, 11/1/50 | 496,271 |
The accompanying notes are an integral part of these financial statements.
64Pioneer Strategic Income Fund | Annual Report | 9/30/23
Principal
Amount
USD ($) | | | | | | Value |
| | U.S. Government and Agency
Obligations — (continued) | |
| 328,797 | Federal National Mortgage Association, 2.000%, 1/1/51 | $ 257,660 |
| 5,478,993 | Federal National Mortgage Association, 2.000%, 11/1/51 | 4,244,102 |
| 3,754,637 | Federal National Mortgage Association, 2.000%, 3/1/52 | 2,863,710 |
| 7,000,000 | Federal National Mortgage Association, 2.500%, 10/1/38 (TBA) | 6,167,656 |
| 620,350 | Federal National Mortgage Association, 2.500%, 9/1/50 | 501,924 |
| 1,978,716 | Federal National Mortgage Association, 2.500%, 9/1/50 | 1,597,011 |
| 271,149 | Federal National Mortgage Association, 2.500%, 9/1/50 | 221,196 |
| 183,154 | Federal National Mortgage Association, 2.500%, 10/1/50 | 149,442 |
| 22,826,513 | Federal National Mortgage Association, 2.500%, 5/1/51 | 18,422,559 |
| 5,958,274 | Federal National Mortgage Association, 2.500%, 11/1/51 | 4,802,722 |
| 6,142,844 | Federal National Mortgage Association, 2.500%, 12/1/51 | 4,927,067 |
| 12,472,554 | Federal National Mortgage Association, 2.500%, 1/1/52 | 10,002,344 |
| 1,401,404 | Federal National Mortgage Association, 2.500%, 2/1/52 | 1,128,902 |
| 356,802 | Federal National Mortgage Association, 2.500%, 4/1/52 | 286,625 |
| 29,000,000 | Federal National Mortgage Association, 2.500%, 10/1/53 (TBA) | 23,015,302 |
| 37,660 | Federal National Mortgage Association, 3.000%, 5/1/46 | 31,839 |
| 61,992 | Federal National Mortgage Association, 3.000%, 10/1/46 | 52,408 |
| 178,104 | Federal National Mortgage Association, 3.000%, 11/1/46 | 150,505 |
| 95,302 | Federal National Mortgage Association, 3.000%, 11/1/46 | 80,805 |
| 39,051 | Federal National Mortgage Association, 3.000%, 1/1/47 | 33,016 |
| 37,584 | Federal National Mortgage Association, 3.000%, 3/1/47 | 31,830 |
| 428,213 | Federal National Mortgage Association, 3.000%, 3/1/47 | 358,308 |
The accompanying notes are an integral part of these financial statements.
Pioneer Strategic Income Fund | Annual Report | 9/30/2365
Schedule of Investments | 9/30/23 (continued)
Principal
Amount
USD ($) | | | | | | Value |
| | U.S. Government and Agency
Obligations — (continued) | |
| 1,628,896 | Federal National Mortgage Association, 3.000%, 3/1/47 | $ 1,381,276 |
| 1,028,556 | Federal National Mortgage Association, 3.000%, 4/1/47 | 869,305 |
| 1,814,457 | Federal National Mortgage Association, 3.000%, 5/1/48 | 1,519,524 |
| 10,804,859 | Federal National Mortgage Association, 3.000%, 1/1/52 | 9,055,790 |
| 14,669,661 | Federal National Mortgage Association, 3.000%, 3/1/52 | 12,390,127 |
| 1,968,779 | Federal National Mortgage Association, 3.000%, 6/1/52 | 1,629,243 |
| 3,093,863 | Federal National Mortgage Association, 3.000%, 2/1/57 | 2,535,279 |
| 723,490 | Federal National Mortgage Association, 3.500%, 9/1/45 | 639,262 |
| 665,548 | Federal National Mortgage Association, 3.500%, 6/1/46 | 586,325 |
| 520,516 | Federal National Mortgage Association, 3.500%, 9/1/46 | 461,279 |
| 2,895,187 | Federal National Mortgage Association, 3.500%, 3/1/52 | 2,522,384 |
| 5,534,363 | Federal National Mortgage Association, 3.500%, 3/1/52 | 4,768,684 |
| 559,425 | Federal National Mortgage Association, 3.500%, 4/1/52 | 481,585 |
| 2,281,218 | Federal National Mortgage Association, 3.500%, 4/1/52 | 1,963,410 |
| 962,508 | Federal National Mortgage Association, 3.500%, 4/1/52 | 836,458 |
| 4,082,299 | Federal National Mortgage Association, 3.500%, 5/1/52 | 3,541,796 |
| 481,774 | Federal National Mortgage Association, 3.500%, 5/1/52 | 422,939 |
| 3,766,410 | Federal National Mortgage Association, 3.500%, 6/1/52 | 3,267,215 |
| 1,368,559 | Federal National Mortgage Association, 3.500%, 9/1/55 | 1,201,438 |
| 7,157,696 | Federal National Mortgage Association, 3.500%, 8/1/58 | 6,087,483 |
| 2,972 | Federal National Mortgage Association, 4.000%, 12/1/30 | 2,759 |
| 355,544 | Federal National Mortgage Association, 4.000%, 9/1/37 | 325,560 |
The accompanying notes are an integral part of these financial statements.
66Pioneer Strategic Income Fund | Annual Report | 9/30/23
Principal
Amount
USD ($) | | | | | | Value |
| | U.S. Government and Agency
Obligations — (continued) | |
| 3,683,299 | Federal National Mortgage Association, 4.000%, 10/1/40 | $ 3,372,545 |
| 1,443,386 | Federal National Mortgage Association, 4.000%, 12/1/40 | 1,321,610 |
| 2,113 | Federal National Mortgage Association, 4.000%, 11/1/41 | 1,935 |
| 497,303 | Federal National Mortgage Association, 4.000%, 11/1/41 | 455,341 |
| 4,058,341 | Federal National Mortgage Association, 4.000%, 12/1/41 | 3,715,753 |
| 11,193 | Federal National Mortgage Association, 4.000%, 12/1/41 | 10,290 |
| 1,321,273 | Federal National Mortgage Association, 4.000%, 1/1/42 | 1,209,717 |
| 1,482,426 | Federal National Mortgage Association, 4.000%, 4/1/42 | 1,357,300 |
| 55,392 | Federal National Mortgage Association, 4.000%, 7/1/42 | 50,715 |
| 49,253 | Federal National Mortgage Association, 4.000%, 6/1/44 | 44,967 |
| 18,729 | Federal National Mortgage Association, 4.000%, 6/1/45 | 17,258 |
| 104,823 | Federal National Mortgage Association, 4.000%, 7/1/45 | 95,710 |
| 174,299 | Federal National Mortgage Association, 4.000%, 7/1/50 | 156,086 |
| 31,225 | Federal National Mortgage Association, 4.000%, 10/1/50 | 27,984 |
| 105,057 | Federal National Mortgage Association, 4.000%, 11/1/50 | 94,363 |
| 823,381 | Federal National Mortgage Association, 4.000%, 11/1/50 | 738,424 |
| 423,851 | Federal National Mortgage Association, 4.000%, 12/1/50 | 379,312 |
| 36,351 | Federal National Mortgage Association, 4.000%, 1/1/51 | 32,611 |
| 9,194 | Federal National Mortgage Association, 4.000%, 1/1/51 | 8,256 |
| 182,823 | Federal National Mortgage Association, 4.000%, 1/1/51 | 163,349 |
| 95,707 | Federal National Mortgage Association, 4.000%, 2/1/51 | 85,912 |
| 262,042 | Federal National Mortgage Association, 4.000%, 2/1/51 | 234,407 |
The accompanying notes are an integral part of these financial statements.
Pioneer Strategic Income Fund | Annual Report | 9/30/2367
Schedule of Investments | 9/30/23 (continued)
Principal
Amount
USD ($) | | | | | | Value |
| | U.S. Government and Agency
Obligations — (continued) | |
| 311,499 | Federal National Mortgage Association, 4.000%, 4/1/51 | $ 278,792 |
| 29,393 | Federal National Mortgage Association, 4.000%, 5/1/51 | 26,289 |
| 623,301 | Federal National Mortgage Association, 4.000%, 6/1/51 | 557,035 |
| 157,047 | Federal National Mortgage Association, 4.000%, 7/1/51 | 141,497 |
| 1,787,200 | Federal National Mortgage Association, 4.000%, 7/1/51 | 1,595,493 |
| 97,452 | Federal National Mortgage Association, 4.000%, 8/1/51 | 86,993 |
| 63,500 | Federal National Mortgage Association, 4.000%, 9/1/51 | 56,726 |
| 207,656 | Federal National Mortgage Association, 4.000%, 6/1/52 | 185,014 |
| 37,520 | Federal National Mortgage Association, 4.000%, 7/1/56 | 33,535 |
| 67,572 | Federal National Mortgage Association, 4.000%, 1/1/57 | 60,310 |
| 13,000,000 | Federal National Mortgage Association, 4.500%, 10/15/38 (TBA) | 12,459,242 |
| 1,078,140 | Federal National Mortgage Association, 4.500%, 11/1/40 | 1,017,067 |
| 3,046,201 | Federal National Mortgage Association, 4.500%, 12/1/40 | 2,877,716 |
| 115,640 | Federal National Mortgage Association, 4.500%, 3/1/41 | 108,638 |
| 3,230 | Federal National Mortgage Association, 4.500%, 4/1/41 | 3,052 |
| 1,599,026 | Federal National Mortgage Association, 4.500%, 5/1/41 | 1,510,501 |
| 652,064 | Federal National Mortgage Association, 4.500%, 7/1/41 | 615,966 |
| 2,218,657 | Federal National Mortgage Association, 4.500%, 8/1/41 | 2,092,978 |
| 238,137 | Federal National Mortgage Association, 4.500%, 9/1/41 | 224,643 |
| 32,211 | Federal National Mortgage Association, 4.500%, 3/1/43 | 30,428 |
| 753,995 | Federal National Mortgage Association, 4.500%, 9/1/43 | 712,239 |
| 3,336,549 | Federal National Mortgage Association, 4.500%, 9/1/43 | 3,152,014 |
The accompanying notes are an integral part of these financial statements.
68Pioneer Strategic Income Fund | Annual Report | 9/30/23
Principal
Amount
USD ($) | | | | | | Value |
| | U.S. Government and Agency
Obligations — (continued) | |
| 2,283,282 | Federal National Mortgage Association, 4.500%, 1/1/44 | $ 2,156,983 |
| 1,027,503 | Federal National Mortgage Association, 4.500%, 3/1/44 | 972,064 |
| 9,055,645 | Federal National Mortgage Association, 4.500%, 7/1/44 | 8,507,559 |
| 225,600 | Federal National Mortgage Association, 4.500%, 1/1/47 | 210,811 |
| 1,297,859 | Federal National Mortgage Association, 4.500%, 8/1/47 | 1,217,896 |
| 821,249 | Federal National Mortgage Association, 5.000%, 6/1/35 | 804,679 |
| 263,998 | Federal National Mortgage Association, 5.000%, 7/1/35 | 258,506 |
| 634,151 | Federal National Mortgage Association, 5.000%, 7/1/35 | 621,341 |
| 259,172 | Federal National Mortgage Association, 5.000%, 8/1/35 | 253,943 |
| 84,575 | Federal National Mortgage Association, 5.000%, 5/1/38 | 82,761 |
| 19,000,000 | Federal National Mortgage Association, 5.000%, 10/1/38 (TBA) | 18,501,250 |
| 303,858 | Federal National Mortgage Association, 5.000%, 1/1/39 | 296,002 |
| 190,706 | Federal National Mortgage Association, 5.000%, 7/1/39 | 186,618 |
| 193,534 | Federal National Mortgage Association, 5.000%, 7/1/39 | 189,379 |
| 22,375 | Federal National Mortgage Association, 5.000%, 7/1/39 | 21,567 |
| 540,083 | Federal National Mortgage Association, 5.000%, 6/1/40 | 527,980 |
| 54,792 | Federal National Mortgage Association, 5.000%, 6/1/40 | 53,616 |
| 345,955 | Federal National Mortgage Association, 5.000%, 7/1/40 | 337,586 |
| 200,712 | Federal National Mortgage Association, 5.000%, 10/1/40 | 196,199 |
| 89,769 | Federal National Mortgage Association, 5.000%, 5/1/41 | 86,531 |
| 87,596 | Federal National Mortgage Association, 5.000%, 7/1/41 | 85,719 |
| 121,762 | Federal National Mortgage Association, 5.000%, 12/1/41 | 116,902 |
The accompanying notes are an integral part of these financial statements.
Pioneer Strategic Income Fund | Annual Report | 9/30/2369
Schedule of Investments | 9/30/23 (continued)
Principal
Amount
USD ($) | | | | | | Value |
| | U.S. Government and Agency
Obligations — (continued) | |
| 2,110,277 | Federal National Mortgage Association, 5.000%, 9/1/43 | $ 2,044,948 |
| 6,465,511 | Federal National Mortgage Association, 5.000%, 11/1/44 | 6,326,744 |
| 2,138,532 | Federal National Mortgage Association, 5.000%, 10/1/50 | 2,046,340 |
| 1,826,754 | Federal National Mortgage Association, 5.000%, 6/1/52 | 1,744,081 |
| 4,730,814 | Federal National Mortgage Association, 5.000%, 8/1/52 | 4,464,952 |
| 266,432 | Federal National Mortgage Association, 5.000%, 2/1/53 | 251,629 |
| 439,476 | Federal National Mortgage Association, 5.000%, 2/1/53 | 415,001 |
| 566,378 | Federal National Mortgage Association, 5.000%, 2/1/53 | 534,866 |
| 1,063,698 | Federal National Mortgage Association, 5.000%, 3/1/53 | 1,003,548 |
| 250,341 | Federal National Mortgage Association, 5.000%, 3/1/53 | 236,418 |
| 1,060,026 | Federal National Mortgage Association, 5.000%, 4/1/53 | 1,001,000 |
| 135,023 | Federal National Mortgage Association, 5.000%, 4/1/53 | 127,757 |
| 161,065 | Federal National Mortgage Association, 5.000%, 4/1/53 | 152,116 |
| 806,083 | Federal National Mortgage Association, 5.000%, 4/1/53 | 760,840 |
| 4,775 | Federal National Mortgage Association, 5.500%, 5/1/33 | 4,638 |
| 3,159 | Federal National Mortgage Association, 5.500%, 6/1/33 | 3,095 |
| 11,446 | Federal National Mortgage Association, 5.500%, 7/1/33 | 11,388 |
| 24,604 | Federal National Mortgage Association, 5.500%, 4/1/34 | 24,478 |
| 3,890 | Federal National Mortgage Association, 5.500%, 10/1/35 | 3,858 |
| 46,480 | Federal National Mortgage Association, 5.500%, 12/1/35 | 45,821 |
| 20,230 | Federal National Mortgage Association, 5.500%, 3/1/36 | 19,849 |
| 22,000,000 | Federal National Mortgage Association, 5.500%, 10/15/38 (TBA) | 21,763,672 |
The accompanying notes are an integral part of these financial statements.
70Pioneer Strategic Income Fund | Annual Report | 9/30/23
Principal
Amount
USD ($) | | | | | | Value |
| | U.S. Government and Agency
Obligations — (continued) | |
| 532,396 | Federal National Mortgage Association, 5.500%, 5/1/49 | $ 522,095 |
| 1,709,368 | Federal National Mortgage Association, 5.500%, 4/1/50 | 1,677,948 |
| 3,974,915 | Federal National Mortgage Association, 5.500%, 4/1/50 | 3,901,851 |
| 450,580 | Federal National Mortgage Association, 5.500%, 11/1/52 | 435,982 |
| 1,871,336 | Federal National Mortgage Association, 5.500%, 1/1/53 | 1,816,995 |
| 2,364,811 | Federal National Mortgage Association, 5.500%, 1/1/53 | 2,301,165 |
| 1,089,942 | Federal National Mortgage Association, 5.500%, 1/1/53 | 1,059,227 |
| 1,678,941 | Federal National Mortgage Association, 5.500%, 2/1/53 | 1,624,266 |
| 254,747 | Federal National Mortgage Association, 5.500%, 2/1/53 | 247,534 |
| 594,335 | Federal National Mortgage Association, 5.500%, 2/1/53 | 577,257 |
| 1,067,206 | Federal National Mortgage Association, 5.500%, 3/1/53 | 1,031,818 |
| 1,270,218 | Federal National Mortgage Association, 5.500%, 4/1/53 | 1,229,472 |
| 1,141,582 | Federal National Mortgage Association, 5.500%, 4/1/53 | 1,104,597 |
| 207,877 | Federal National Mortgage Association, 5.500%, 4/1/53 | 202,080 |
| 303,598 | Federal National Mortgage Association, 5.500%, 4/1/53 | 294,400 |
| 591,127 | Federal National Mortgage Association, 5.500%, 4/1/53 | 571,657 |
| 497,267 | Federal National Mortgage Association, 5.500%, 4/1/53 | 481,649 |
| 280,518 | Federal National Mortgage Association, 5.500%, 4/1/53 | 272,011 |
| 1,006,410 | Federal National Mortgage Association, 5.500%, 6/1/53 | 972,975 |
| 226,126 | Federal National Mortgage Association, 5.500%, 6/1/53 | 218,651 |
| 12,010,731 | Federal National Mortgage Association, 5.500%, 8/1/53 | 11,611,562 |
| 13,006,000 | Federal National Mortgage Association, 5.500%, 9/1/53 | 12,573,754 |
The accompanying notes are an integral part of these financial statements.
Pioneer Strategic Income Fund | Annual Report | 9/30/2371
Schedule of Investments | 9/30/23 (continued)
Principal
Amount
USD ($) | | | | | | Value |
| | U.S. Government and Agency
Obligations — (continued) | |
| 2,615,000 | Federal National Mortgage Association, 5.500%, 9/1/53 | $ 2,528,092 |
| 2,779,000 | Federal National Mortgage Association, 5.500%, 9/1/53 | 2,686,642 |
| 6,500,000 | Federal National Mortgage Association, 5.500%, 10/1/53 | 6,283,977 |
| 351 | Federal National Mortgage Association, 6.000%, 3/1/32 | 354 |
| 608 | Federal National Mortgage Association, 6.000%, 10/1/32 | 612 |
| 2,637 | Federal National Mortgage Association, 6.000%, 11/1/32 | 2,605 |
| 7,437 | Federal National Mortgage Association, 6.000%, 12/1/32 | 7,344 |
| 2,777 | Federal National Mortgage Association, 6.000%, 1/1/33 | 2,802 |
| 1,420 | Federal National Mortgage Association, 6.000%, 3/1/33 | 1,435 |
| 9,070 | Federal National Mortgage Association, 6.000%, 5/1/33 | 8,962 |
| 22,246 | Federal National Mortgage Association, 6.000%, 12/1/33 | 22,573 |
| 17,670 | Federal National Mortgage Association, 6.000%, 1/1/34 | 17,886 |
| 98,555 | Federal National Mortgage Association, 6.000%, 6/1/37 | 99,280 |
| 35,648 | Federal National Mortgage Association, 6.000%, 12/1/37 | 36,202 |
| 60,260 | Federal National Mortgage Association, 6.000%, 4/1/38 | 61,254 |
| 13,749 | Federal National Mortgage Association, 6.000%, 7/1/38 | 13,577 |
| 1,688,074 | Federal National Mortgage Association, 6.000%, 1/1/53 | 1,687,863 |
| 536,109 | Federal National Mortgage Association, 6.000%, 1/1/53 | 533,230 |
| 252,672 | Federal National Mortgage Association, 6.000%, 1/1/53 | 251,002 |
| 2,146,564 | Federal National Mortgage Association, 6.000%, 1/1/53 | 2,132,384 |
| 589,933 | Federal National Mortgage Association, 6.000%, 2/1/53 | 583,485 |
| 189,757 | Federal National Mortgage Association, 6.000%, 2/1/53 | 190,202 |
The accompanying notes are an integral part of these financial statements.
72Pioneer Strategic Income Fund | Annual Report | 9/30/23
Principal
Amount
USD ($) | | | | | | Value |
| | U.S. Government and Agency
Obligations — (continued) | |
| 372,836 | Federal National Mortgage Association, 6.000%, 3/1/53 | $ 368,509 |
| 254,887 | Federal National Mortgage Association, 6.000%, 3/1/53 | 252,168 |
| 144,843 | Federal National Mortgage Association, 6.000%, 3/1/53 | 143,355 |
| 197,166 | Federal National Mortgage Association, 6.000%, 3/1/53 | 195,397 |
| 348,260 | Federal National Mortgage Association, 6.000%, 4/1/53 | 344,219 |
| 3,327,729 | Federal National Mortgage Association, 6.000%, 5/1/53 | 3,327,319 |
| 1,862,394 | Federal National Mortgage Association, 6.000%, 5/1/53 | 1,848,047 |
| 199,382 | Federal National Mortgage Association, 6.000%, 6/1/53 | 197,695 |
| 198,082 | Federal National Mortgage Association, 6.000%, 6/1/53 | 197,110 |
| 199,495 | Federal National Mortgage Association, 6.000%, 6/1/53 | 197,625 |
| 199,496 | Federal National Mortgage Association, 6.000%, 6/1/53 | 196,982 |
| 199,496 | Federal National Mortgage Association, 6.000%, 6/1/53 | 197,242 |
| 298,632 | Federal National Mortgage Association, 6.000%, 6/1/53 | 295,395 |
| 338,499 | Federal National Mortgage Association, 6.000%, 6/1/53 | 336,571 |
| 299,130 | Federal National Mortgage Association, 6.000%, 6/1/53 | 296,414 |
| 3,631,786 | Federal National Mortgage Association, 6.000%, 8/1/53 | 3,585,361 |
| 10,100,000 | Federal National Mortgage Association, 6.000%, 9/1/53 | 9,970,890 |
| 1,391,719 | Federal National Mortgage Association, 6.000%, 9/1/53 | 1,373,929 |
| 26,900,000 | Federal National Mortgage Association, 6.000%, 10/1/53 | 26,556,136 |
| 264 | Federal National Mortgage Association, 6.500%, 5/1/31 | 265 |
| 92 | Federal National Mortgage Association, 6.500%, 6/1/31 | 93 |
| 204 | Federal National Mortgage Association, 6.500%, 2/1/32 | 209 |
The accompanying notes are an integral part of these financial statements.
Pioneer Strategic Income Fund | Annual Report | 9/30/2373
Schedule of Investments | 9/30/23 (continued)
Principal
Amount
USD ($) | | | | | | Value |
| | U.S. Government and Agency
Obligations — (continued) | |
| 1,461 | Federal National Mortgage Association, 6.500%, 3/1/32 | $ 1,469 |
| 583 | Federal National Mortgage Association, 6.500%, 8/1/32 | 591 |
| 170,823 | Federal National Mortgage Association, 6.500%, 2/1/53 | 172,857 |
| 1,330,622 | Federal National Mortgage Association, 6.500%, 3/1/53 | 1,350,152 |
| 264,138 | Federal National Mortgage Association, 6.500%, 3/1/53 | 267,950 |
| 943,601 | Federal National Mortgage Association, 6.500%, 3/1/53 | 954,513 |
| 208,034 | Federal National Mortgage Association, 6.500%, 4/1/53 | 210,267 |
| 195,939 | Federal National Mortgage Association, 6.500%, 4/1/53 | 200,167 |
| 220,777 | Federal National Mortgage Association, 6.500%, 4/1/53 | 222,824 |
| 161 | Federal National Mortgage Association, 7.000%, 5/1/28 | 161 |
| 91 | Federal National Mortgage Association, 7.000%, 2/1/29 | 92 |
| 226 | Federal National Mortgage Association, 7.000%, 7/1/31 | 223 |
| 88 | Federal National Mortgage Association, 7.500%, 1/1/28 | 87 |
| 13,300,000 | Government National Mortgage Association, 3.000%, 10/15/53 (TBA) | 11,270,711 |
| 14,281,000 | Government National Mortgage Association, 3.500%, 10/15/53 (TBA) | 12,508,148 |
| 6,000,000 | Government National Mortgage Association, 5.000%, 10/15/53 (TBA) | 5,685,469 |
| 13,000,000 | Government National Mortgage Association, 5.500%, 10/15/53 (TBA) | 12,615,078 |
| 19,000,000 | Government National Mortgage Association, 6.000%, 10/15/53 (TBA) | 18,826,328 |
| 6,000,000 | Government National Mortgage Association, 6.500%, 10/15/53 (TBA) | 6,033,750 |
| 440,886 | Government National Mortgage Association I, 3.500%, 10/15/42 | 396,158 |
| 1,599 | Government National Mortgage Association I, 4.000%, 3/15/39 | 1,486 |
| 2,807 | Government National Mortgage Association I, 4.000%, 4/15/39 | 2,575 |
The accompanying notes are an integral part of these financial statements.
74Pioneer Strategic Income Fund | Annual Report | 9/30/23
Principal
Amount
USD ($) | | | | | | Value |
| | U.S. Government and Agency
Obligations — (continued) | |
| 2,596 | Government National Mortgage Association I, 4.000%, 4/15/39 | $ 2,401 |
| 4,072 | Government National Mortgage Association I, 4.000%, 7/15/39 | 3,730 |
| 3,441 | Government National Mortgage Association I, 4.000%, 1/15/40 | 3,167 |
| 59,597 | Government National Mortgage Association I, 4.000%, 4/15/40 | 54,854 |
| 96,963 | Government National Mortgage Association I, 4.000%, 7/15/40 | 88,772 |
| 64,156 | Government National Mortgage Association I, 4.000%, 8/15/40 | 59,050 |
| 36,020 | Government National Mortgage Association I, 4.000%, 8/15/40 | 32,974 |
| 17,374 | Government National Mortgage Association I, 4.000%, 9/15/40 | 15,990 |
| 20,675 | Government National Mortgage Association I, 4.000%, 10/15/40 | 19,171 |
| 5,004 | Government National Mortgage Association I, 4.000%, 10/15/40 | 4,613 |
| 2,965 | Government National Mortgage Association I, 4.000%, 10/15/40 | 2,744 |
| 2,159 | Government National Mortgage Association I, 4.000%, 11/15/40 | 1,997 |
| 28,567 | Government National Mortgage Association I, 4.000%, 11/15/40 | 26,475 |
| 65,191 | Government National Mortgage Association I, 4.000%, 11/15/40 | 60,000 |
| 67,408 | Government National Mortgage Association I, 4.000%, 11/15/40 | 61,707 |
| 361,289 | Government National Mortgage Association I, 4.000%, 12/15/40 | 332,532 |
| 2,645 | Government National Mortgage Association I, 4.000%, 12/15/40 | 2,435 |
| 2,735 | Government National Mortgage Association I, 4.000%, 12/15/40 | 2,517 |
| 1,125 | Government National Mortgage Association I, 4.000%, 1/15/41 | 1,035 |
| 12,436 | Government National Mortgage Association I, 4.000%, 1/15/41 | 11,513 |
| 19,993 | Government National Mortgage Association I, 4.000%, 1/15/41 | 18,445 |
| 4,965 | Government National Mortgage Association I, 4.000%, 2/15/41 | 4,570 |
The accompanying notes are an integral part of these financial statements.
Pioneer Strategic Income Fund | Annual Report | 9/30/2375
Schedule of Investments | 9/30/23 (continued)
Principal
Amount
USD ($) | | | | | | Value |
| | U.S. Government and Agency
Obligations — (continued) | |
| 234,061 | Government National Mortgage Association I, 4.000%, 2/15/41 | $ 215,420 |
| 23,049 | Government National Mortgage Association I, 4.000%, 3/15/41 | 21,348 |
| 5,496 | Government National Mortgage Association I, 4.000%, 4/15/41 | 5,086 |
| 11,851 | Government National Mortgage Association I, 4.000%, 5/15/41 | 10,893 |
| 4,533 | Government National Mortgage Association I, 4.000%, 5/15/41 | 4,156 |
| 1,097 | Government National Mortgage Association I, 4.000%, 6/15/41 | 1,012 |
| 734 | Government National Mortgage Association I, 4.000%, 6/15/41 | 681 |
| 567,215 | Government National Mortgage Association I, 4.000%, 6/15/41 | 519,236 |
| 13,202 | Government National Mortgage Association I, 4.000%, 7/15/41 | 12,216 |
| 2,725 | Government National Mortgage Association I, 4.000%, 7/15/41 | 2,530 |
| 90,704 | Government National Mortgage Association I, 4.000%, 7/15/41 | 83,926 |
| 49,076 | Government National Mortgage Association I, 4.000%, 7/15/41 | 45,215 |
| 28,008 | Government National Mortgage Association I, 4.000%, 7/15/41 | 25,776 |
| 3,417 | Government National Mortgage Association I, 4.000%, 8/15/41 | 3,134 |
| 36,154 | Government National Mortgage Association I, 4.000%, 8/15/41 | 33,274 |
| 2,464 | Government National Mortgage Association I, 4.000%, 8/15/41 | 2,256 |
| 24,995 | Government National Mortgage Association I, 4.000%, 9/15/41 | 23,005 |
| 4,501 | Government National Mortgage Association I, 4.000%, 9/15/41 | 4,165 |
| 10,917 | Government National Mortgage Association I, 4.000%, 9/15/41 | 10,016 |
| 5,607 | Government National Mortgage Association I, 4.000%, 9/15/41 | 5,188 |
| 74 | Government National Mortgage Association I, 4.000%, 9/15/41 | 69 |
| 177,510 | Government National Mortgage Association I, 4.000%, 9/15/41 | 163,373 |
The accompanying notes are an integral part of these financial statements.
76Pioneer Strategic Income Fund | Annual Report | 9/30/23
Principal
Amount
USD ($) | | | | | | Value |
| | U.S. Government and Agency
Obligations — (continued) | |
| 102,822 | Government National Mortgage Association I, 4.000%, 9/15/41 | $ 94,382 |
| 2,466 | Government National Mortgage Association I, 4.000%, 9/15/41 | 2,287 |
| 2,324 | Government National Mortgage Association I, 4.000%, 10/15/41 | 2,157 |
| 1,754 | Government National Mortgage Association I, 4.000%, 10/15/41 | 1,614 |
| 5,602 | Government National Mortgage Association I, 4.000%, 10/15/41 | 5,168 |
| 5,439 | Government National Mortgage Association I, 4.000%, 10/15/41 | 5,013 |
| 3,438 | Government National Mortgage Association I, 4.000%, 10/15/41 | 3,166 |
| 3,939 | Government National Mortgage Association I, 4.000%, 11/15/41 | 3,645 |
| 82,277 | Government National Mortgage Association I, 4.000%, 11/15/41 | 75,907 |
| 5,613 | Government National Mortgage Association I, 4.000%, 11/15/41 | 5,166 |
| 11,594 | Government National Mortgage Association I, 4.000%, 12/15/41 | 10,585 |
| 4,294 | Government National Mortgage Association I, 4.000%, 12/15/41 | 3,973 |
| 5,376 | Government National Mortgage Association I, 4.000%, 12/15/41 | 4,948 |
| 414,465 | Government National Mortgage Association I, 4.000%, 1/15/42 | 383,489 |
| 1,754 | Government National Mortgage Association I, 4.000%, 2/15/42 | 1,624 |
| 71,125 | Government National Mortgage Association I, 4.000%, 2/15/42 | 65,528 |
| 25,687 | Government National Mortgage Association I, 4.000%, 2/15/42 | 23,565 |
| 991 | Government National Mortgage Association I, 4.000%, 2/15/42 | 909 |
| 4,729 | Government National Mortgage Association I, 4.000%, 2/15/42 | 4,377 |
| 744,621 | Government National Mortgage Association I, 4.000%, 5/15/42 | 685,292 |
| 36,243 | Government National Mortgage Association I, 4.000%, 6/15/42 | 33,642 |
| 28,606 | Government National Mortgage Association I, 4.000%, 6/15/42 | 26,327 |
The accompanying notes are an integral part of these financial statements.
Pioneer Strategic Income Fund | Annual Report | 9/30/2377
Schedule of Investments | 9/30/23 (continued)
Principal
Amount
USD ($) | | | | | | Value |
| | U.S. Government and Agency
Obligations — (continued) | |
| 21,822 | Government National Mortgage Association I, 4.000%, 6/15/42 | $ 20,191 |
| 4,182 | Government National Mortgage Association I, 4.000%, 10/15/42 | 3,873 |
| 235,292 | Government National Mortgage Association I, 4.000%, 4/15/43 | 217,920 |
| 110,749 | Government National Mortgage Association I, 4.000%, 5/15/43 | 102,472 |
| 1,359 | Government National Mortgage Association I, 4.000%, 5/15/43 | 1,244 |
| 22,823 | Government National Mortgage Association I, 4.000%, 6/15/43 | 20,925 |
| 137,092 | Government National Mortgage Association I, 4.000%, 8/15/43 | 126,169 |
| 60,146 | Government National Mortgage Association I, 4.000%, 9/15/43 | 55,475 |
| 3,109 | Government National Mortgage Association I, 4.000%, 9/15/43 | 2,864 |
| 42,885 | Government National Mortgage Association I, 4.000%, 2/15/44 | 39,807 |
| 25,960 | Government National Mortgage Association I, 4.000%, 3/15/44 | 24,062 |
| 623,290 | Government National Mortgage Association I, 4.000%, 3/15/44 | 573,618 |
| 948,852 | Government National Mortgage Association I, 4.000%, 3/15/44 | 873,848 |
| 32,778 | Government National Mortgage Association I, 4.000%, 3/15/44 | 30,327 |
| 16,966 | Government National Mortgage Association I, 4.000%, 3/15/44 | 15,668 |
| 178,525 | Government National Mortgage Association I, 4.000%, 3/15/44 | 165,705 |
| 296,862 | Government National Mortgage Association I, 4.000%, 4/15/44 | 271,742 |
| 183,443 | Government National Mortgage Association I, 4.000%, 4/15/44 | 167,916 |
| 2,291 | Government National Mortgage Association I, 4.000%, 4/15/44 | 2,109 |
| 34,980 | Government National Mortgage Association I, 4.000%, 4/15/44 | 32,364 |
| 69,490 | Government National Mortgage Association I, 4.000%, 5/15/44 | 63,711 |
| 307,105 | Government National Mortgage Association I, 4.000%, 8/15/44 | 281,110 |
The accompanying notes are an integral part of these financial statements.
78Pioneer Strategic Income Fund | Annual Report | 9/30/23
Principal
Amount
USD ($) | | | | | | Value |
| | U.S. Government and Agency
Obligations — (continued) | |
| 13,703 | Government National Mortgage Association I, 4.000%, 8/15/44 | $ 12,509 |
| 322,915 | Government National Mortgage Association I, 4.000%, 8/15/44 | 297,179 |
| 79,409 | Government National Mortgage Association I, 4.000%, 8/15/44 | 72,769 |
| 15,555 | Government National Mortgage Association I, 4.000%, 8/15/44 | �� 14,349 |
| 947,804 | Government National Mortgage Association I, 4.000%, 9/15/44 | 872,256 |
| 66,878 | Government National Mortgage Association I, 4.000%, 9/15/44 | 61,695 |
| 205,755 | Government National Mortgage Association I, 4.000%, 9/15/44 | 190,293 |
| 2,616 | Government National Mortgage Association I, 4.000%, 9/15/44 | 2,407 |
| 55,407 | Government National Mortgage Association I, 4.000%, 9/15/44 | 51,303 |
| 113,497 | Government National Mortgage Association I, 4.000%, 9/15/44 | 105,012 |
| 499,369 | Government National Mortgage Association I, 4.000%, 9/15/44 | 459,562 |
| 58,023 | Government National Mortgage Association I, 4.000%, 9/15/44 | 52,966 |
| 32,795 | Government National Mortgage Association I, 4.000%, 9/15/44 | 30,247 |
| 67,747 | Government National Mortgage Association I, 4.000%, 9/15/44 | 62,347 |
| 587,810 | Government National Mortgage Association I, 4.000%, 9/15/44 | 543,868 |
| 1,354,240 | Government National Mortgage Association I, 4.000%, 9/15/44 | 1,239,590 |
| 29,057 | Government National Mortgage Association I, 4.000%, 10/15/44 | 26,741 |
| 8,412 | Government National Mortgage Association I, 4.000%, 11/15/44 | 7,783 |
| 6,341 | Government National Mortgage Association I, 4.000%, 11/15/44 | 5,815 |
| 31,921 | Government National Mortgage Association I, 4.000%, 11/15/44 | 29,549 |
| 4,150 | Government National Mortgage Association I, 4.000%, 11/15/44 | 3,805 |
| 188,320 | Government National Mortgage Association I, 4.000%, 12/15/44 | 174,410 |
The accompanying notes are an integral part of these financial statements.
Pioneer Strategic Income Fund | Annual Report | 9/30/2379
Schedule of Investments | 9/30/23 (continued)
Principal
Amount
USD ($) | | | | | | Value |
| | U.S. Government and Agency
Obligations — (continued) | |
| 42,774 | Government National Mortgage Association I, 4.000%, 12/15/44 | $ 39,448 |
| 19,325 | Government National Mortgage Association I, 4.000%, 12/15/44 | 17,880 |
| 3,672 | Government National Mortgage Association I, 4.000%, 12/15/44 | 3,362 |
| 58,979 | Government National Mortgage Association I, 4.000%, 12/15/44 | 54,073 |
| 172,154 | Government National Mortgage Association I, 4.000%, 1/15/45 | 157,579 |
| 328,877 | Government National Mortgage Association I, 4.000%, 1/15/45 | 301,032 |
| 57,460 | Government National Mortgage Association I, 4.000%, 1/15/45 | 52,680 |
| 281,360 | Government National Mortgage Association I, 4.000%, 1/15/45 | 257,969 |
| 28,521 | Government National Mortgage Association I, 4.000%, 2/15/45 | 26,473 |
| 98,311 | Government National Mortgage Association I, 4.000%, 2/15/45 | 90,697 |
| 64,135 | Government National Mortgage Association I, 4.000%, 2/15/45 | 59,339 |
| 41,995 | Government National Mortgage Association I, 4.000%, 2/15/45 | 38,502 |
| 131,067 | Government National Mortgage Association I, 4.000%, 2/15/45 | 120,164 |
| 68,055 | Government National Mortgage Association I, 4.000%, 4/15/45 | 63,167 |
| 45,545 | Government National Mortgage Association I, 4.000%, 5/15/45 | 42,139 |
| 15,519 | Government National Mortgage Association I, 4.000%, 7/15/45 | 14,205 |
| 55,381 | Government National Mortgage Association I, 4.000%, 9/15/45 | 51,020 |
| 35,710 | Government National Mortgage Association I, 4.500%, 9/15/33 | 33,945 |
| 47,897 | Government National Mortgage Association I, 4.500%, 10/15/33 | 45,379 |
| 20,431 | Government National Mortgage Association I, 4.500%, 4/15/35 | 19,307 |
| 455,468 | Government National Mortgage Association I, 4.500%, 3/15/38 | 435,599 |
| 165,294 | Government National Mortgage Association I, 4.500%, 1/15/40 | 158,080 |
The accompanying notes are an integral part of these financial statements.
80Pioneer Strategic Income Fund | Annual Report | 9/30/23
Principal
Amount
USD ($) | | | | | | Value |
| | U.S. Government and Agency
Obligations — (continued) | |
| 247,553 | Government National Mortgage Association I, 4.500%, 6/15/40 | $ 235,852 |
| 87,706 | Government National Mortgage Association I, 4.500%, 9/15/40 | 83,791 |
| 411,811 | Government National Mortgage Association I, 4.500%, 11/15/40 | 392,893 |
| 562,982 | Government National Mortgage Association I, 4.500%, 6/15/41 | 539,071 |
| 104,718 | Government National Mortgage Association I, 4.500%, 6/15/41 | 99,362 |
| 154,093 | Government National Mortgage Association I, 4.500%, 7/15/41 | 146,443 |
| 236,846 | Government National Mortgage Association I, 4.500%, 8/15/41 | 224,016 |
| 134,864 | Government National Mortgage Association I, 5.000%, 9/15/33 | 131,557 |
| 48,302 | Government National Mortgage Association I, 5.125%, 10/15/38 | 46,704 |
| 27,895 | Government National Mortgage Association I, 5.500%, 7/15/33 | 27,204 |
| 45,229 | Government National Mortgage Association I, 5.500%, 1/15/34 | 44,368 |
| 35,054 | Government National Mortgage Association I, 5.500%, 4/15/34 | 34,694 |
| 60,087 | Government National Mortgage Association I, 5.500%, 7/15/34 | 59,223 |
| 67,228 | Government National Mortgage Association I, 5.500%, 10/15/34 | 65,435 |
| 43,552 | Government National Mortgage Association I, 5.500%, 1/15/35 | 42,569 |
| 74,209 | Government National Mortgage Association I, 5.500%, 2/15/35 | 73,345 |
| 71,651 | Government National Mortgage Association I, 5.500%, 2/15/35 | 69,645 |
| 12,268 | Government National Mortgage Association I, 5.500%, 6/15/35 | 11,971 |
| 14,155 | Government National Mortgage Association I, 5.500%, 12/15/35 | 13,750 |
| 3 | Government National Mortgage Association I, 5.500%, 2/15/37 | 3 |
| 8,564 | Government National Mortgage Association I, 5.500%, 3/15/37 | 8,317 |
| 40,816 | Government National Mortgage Association I, 5.500%, 3/15/37 | 39,620 |
The accompanying notes are an integral part of these financial statements.
Pioneer Strategic Income Fund | Annual Report | 9/30/2381
Schedule of Investments | 9/30/23 (continued)
Principal
Amount
USD ($) | | | | | | Value |
| | U.S. Government and Agency
Obligations — (continued) | |
| 123,565 | Government National Mortgage Association I, 5.750%, 10/15/38 | $ 121,409 |
| 16,335 | Government National Mortgage Association I, 5.750%, 10/15/38 | 16,156 |
| 32,201 | Government National Mortgage Association I, 6.000%, 8/15/32 | 32,634 |
| 26,730 | Government National Mortgage Association I, 6.000%, 1/15/33 | 27,254 |
| 23,873 | Government National Mortgage Association I, 6.000%, 2/15/33 | 24,342 |
| 41,169 | Government National Mortgage Association I, 6.000%, 2/15/33 | 41,748 |
| 1,819 | Government National Mortgage Association I, 6.000%, 3/15/33 | 1,801 |
| 11,111 | Government National Mortgage Association I, 6.000%, 3/15/33 | 11,104 |
| 30,816 | Government National Mortgage Association I, 6.000%, 3/15/33 | 30,858 |
| 5,878 | Government National Mortgage Association I, 6.000%, 5/15/33 | 5,822 |
| 42,388 | Government National Mortgage Association I, 6.000%, 5/15/33 | 42,040 |
| 41,436 | Government National Mortgage Association I, 6.000%, 5/15/33 | 41,039 |
| 23,739 | Government National Mortgage Association I, 6.000%, 6/15/33 | 23,916 |
| 47,768 | Government National Mortgage Association I, 6.000%, 6/15/33 | 47,901 |
| 54,049 | Government National Mortgage Association I, 6.000%, 7/15/33 | 54,100 |
| 21,250 | Government National Mortgage Association I, 6.000%, 7/15/33 | 21,075 |
| 14,434 | Government National Mortgage Association I, 6.000%, 9/15/33 | 14,296 |
| 57,090 | Government National Mortgage Association I, 6.000%, 11/15/33 | 56,543 |
| 12,891 | Government National Mortgage Association I, 6.000%, 1/15/34 | 12,938 |
| 108,215 | Government National Mortgage Association I, 6.000%, 10/15/37 | 109,147 |
| 128,785 | Government National Mortgage Association I, 6.000%, 7/15/38 | 131,992 |
| 3,004 | Government National Mortgage Association I, 6.500%, 1/15/29 | 3,024 |
The accompanying notes are an integral part of these financial statements.
82Pioneer Strategic Income Fund | Annual Report | 9/30/23
Principal
Amount
USD ($) | | | | | | Value |
| | U.S. Government and Agency
Obligations — (continued) | |
| 344 | Government National Mortgage Association I, 6.500%, 5/15/29 | $ 347 |
| 900 | Government National Mortgage Association I, 6.500%, 10/15/31 | 906 |
| 82 | Government National Mortgage Association I, 6.500%, 12/15/31 | 83 |
| 694 | Government National Mortgage Association I, 6.500%, 2/15/32 | 703 |
| 334 | Government National Mortgage Association I, 6.500%, 3/15/32 | 339 |
| 2,506 | Government National Mortgage Association I, 6.500%, 5/15/32 | 2,603 |
| 1,898 | Government National Mortgage Association I, 6.500%, 6/15/32 | 1,911 |
| 2,252 | Government National Mortgage Association I, 6.500%, 7/15/32 | 2,267 |
| 1,157 | Government National Mortgage Association I, 6.500%, 7/15/32 | 1,164 |
| 826 | Government National Mortgage Association I, 6.500%, 8/15/32 | 831 |
| 10,531 | Government National Mortgage Association I, 6.500%, 8/15/32 | 10,602 |
| 1,278 | Government National Mortgage Association I, 6.500%, 8/15/32 | 1,289 |
| 14,094 | Government National Mortgage Association I, 6.500%, 9/15/32 | 14,186 |
| 23,418 | Government National Mortgage Association I, 6.500%, 9/15/32 | 23,571 |
| 7,478 | Government National Mortgage Association I, 6.500%, 10/15/32 | 7,527 |
| 13,976 | Government National Mortgage Association I, 6.500%, 11/15/32 | 14,124 |
| 17,449 | Government National Mortgage Association I, 6.500%, 7/15/35 | 17,567 |
| 165 | Government National Mortgage Association I, 7.000%, 5/15/29 | 167 |
| 68 | Government National Mortgage Association I, 7.000%, 5/15/29 | 67 |
| 152 | Government National Mortgage Association I, 7.000%, 5/15/31 | 150 |
| 522,374 | Government National Mortgage Association II, 3.500%, 4/20/45 | 464,915 |
| 891,687 | Government National Mortgage Association II, 3.500%, 4/20/45 | 793,624 |
The accompanying notes are an integral part of these financial statements.
Pioneer Strategic Income Fund | Annual Report | 9/30/2383
Schedule of Investments | 9/30/23 (continued)
Principal
Amount
USD ($) | | | | | | Value |
| | U.S. Government and Agency
Obligations — (continued) | |
| 388,352 | Government National Mortgage Association II, 3.500%, 4/20/45 | $ 345,650 |
| 933,054 | Government National Mortgage Association II, 3.500%, 3/20/46 | 830,883 |
| 2,001,123 | Government National Mortgage Association II, 4.000%, 10/20/46 | 1,831,142 |
| 906,040 | Government National Mortgage Association II, 4.000%, 2/20/48 | 820,951 |
| 1,108,977 | Government National Mortgage Association II, 4.000%, 4/20/48 | 1,006,063 |
| 134,194 | Government National Mortgage Association II, 4.500%, 12/20/34 | 127,521 |
| 138,072 | Government National Mortgage Association II, 4.500%, 1/20/35 | 131,205 |
| 107,987 | Government National Mortgage Association II, 4.500%, 3/20/35 | 102,663 |
| 1,042,699 | Government National Mortgage Association II, 4.500%, 9/20/41 | 989,460 |
| 1,464,371 | Government National Mortgage Association II, 4.500%, 9/20/44 | 1,395,474 |
| 644,406 | Government National Mortgage Association II, 4.500%, 10/20/44 | 612,270 |
| 1,262,679 | Government National Mortgage Association II, 4.500%, 11/20/44 | 1,199,737 |
| 1,726,062 | Government National Mortgage Association II, 4.500%, 10/20/52 | 1,595,066 |
| 9,639,818 | Government National Mortgage Association II, 5.000%, 12/20/52 | 9,135,948 |
| 34,039 | Government National Mortgage Association II, 5.500%, 3/20/34 | 33,971 |
| 1,727 | Government National Mortgage Association II, 5.500%, 10/20/37 | 1,686 |
| 2,879,878 | Government National Mortgage Association II, 5.500%, 12/20/52 | 2,798,703 |
| 13,571 | Government National Mortgage Association II, 6.000%, 5/20/32 | 13,817 |
| 49,686 | Government National Mortgage Association II, 6.000%, 10/20/33 | 51,204 |
| 48 | Government National Mortgage Association II, 6.500%, 1/20/28 | 48 |
| 1,008 | Government National Mortgage Association II, 7.000%, 1/20/29 | 1,021 |
| 70,000,000(g) | U.S. Treasury Bills, 10/24/23 | 69,774,293 |
| 64,206,200 | U.S. Treasury Bonds, 2.250%, 2/15/52 | 39,401,539 |
The accompanying notes are an integral part of these financial statements.
84Pioneer Strategic Income Fund | Annual Report | 9/30/23
Principal
Amount
USD ($) | | | | | | Value |
| | U.S. Government and Agency
Obligations — (continued) | |
| 78,239,600(e) | U.S. Treasury Bonds, 4.375%, 8/15/43 | $ 72,995,102 |
| 30,573,737 | U.S. Treasury Inflation Indexed Bonds, 1.500%, 2/15/53 | 25,265,432 |
| 69,170,000 | U.S. Treasury Notes, 3.500%, 2/15/33 | 63,463,475 |
| 190,769,100(e) | U.S. Treasury Notes, 4.500%, 9/30/30 | 190,828,715 |
| | Total U.S. Government and Agency Obligations
(Cost $1,164,262,329) | $1,099,894,083 |
|
|
| | SHORT TERM INVESTMENTS — 0.5% of
Net Assets | |
| | Repurchase Agreements — 0.5% | |
| 15,000,000 | Bank of America, 5.3%, dated 9/29/23, to
be purchased on 10/2/23 for $15,006,625,
collateralized by $15,300,071 U.S. Treasury
Note, 3.875%, 3/31/25 | $ 15,000,000 |
| | | | | | | $ 15,000,000 |
|
|
| | TOTAL SHORT TERM INVESTMENTS
(Cost $15,000,000) | $15,000,000 |
|
|
Number of
Contracts | Description | Counterparty | Amount | Strike
Price | Expiration
Date | |
| | Over The Counter (OTC) Currency Put Options Purchased — 0.0%† | |
| 35,150,000 | Put EUR/Call USD | Citibank NA | EUR 740,169 | EUR 1.02 | 11/30/23 | $ 49,952 |
| 84,500,000 | Put USD/Call JPY | Goldman Sachs & Co. | USD 3,211,592 | USD 125.00 | 1/5/24 | 14,551 |
| 84,500,000 | Put USD/Call JPY | Goldman Sachs & Co. | USD 2,758,080 | USD 141.00 | 1/5/24 | 514,138 |
| | Total Over The Counter (OTC) Currency Put Options Purchased
(Premiums paid $ 6,709,841) | $ 578,641 |
|
|
| | TOTAL OPTIONS PURCHASED
(Premiums paid $ 6,709,841) | $ 578,641 |
|
|
| | TOTAL INVESTMENTS IN UNAFFILIATED ISSUERS — 103.2%
(Cost $3,762,860,278) | $3,302,687,779 |
Principal
Amount
USD ($) | | | | | | |
| | TBA Sales Commitments — (1.4)% of
Net Assets | |
| | U.S. Government and Agency
Obligations — (1.4)% | |
| (7,400,000) | Federal National Mortgage Association, 5.000%, 10/1/53 (TBA) | $ (6,981,438) |
The accompanying notes are an integral part of these financial statements.
Pioneer Strategic Income Fund | Annual Report | 9/30/2385
Schedule of Investments | 9/30/23 (continued)
Principal
Amount
USD ($) | | | | | | Value |
| | U.S. Government and Agency
Obligations — (continued) | |
| (20,800,000) | Federal National Mortgage Association, 5.500%, 10/1/53 (TBA) | $ (20,100,437) |
| (17,000,000) | Federal National Mortgage Association, 6.000%, 10/1/53 (TBA) | (16,776,875) |
| (1,000,000) | Government National Mortgage Association, 4.500%, 10/15/53 (TBA) | (923,789) |
| | TOTAL TBA SALES COMMITMENTS
(Proceeds $45,408,594) | $(44,782,539) |
|
|
Number of
Contracts | Description | Counterparty | Amount | Strike
Price | Expiration
Date | |
| | Over The Counter (OTC) Currency Call Option Written — (0.0)%† | |
| (35,150,000) | Call EUR/Put USD | Citibank NA | EUR 740,169 | EUR 1.10 | 11/30/23 | $ (39,873) |
| | Total Over The Counter (OTC) Currency Call Option Written
(Premiums received $740,169) | $ (39,873) |
|
|
| | OTHER ASSETS AND LIABILITIES — (1.8)% | $ (56,256,177) |
| | net assets — 100.0% | $3,201,609,190 |
| | | | | | | |
| (TBA) | “To Be Announced” Securities. |
| bps | Basis Points. |
| CMT | Constant Maturity Treasury Index. |
| FREMF | Freddie Mac Multifamily Fixed-Rate Mortgage Loans. |
| FRESB | Freddie Mac Multifamily Small Balance Certificates. |
| LIBOR | London Interbank Offered Rate. |
| REIT | Real Estate Investment Trust. |
| REMICs | Real Estate Mortgage Investment Conduits. |
| SOFR | Secured Overnight Financing Rate. |
| SOFR30A | Secured Overnight Financing Rate 30 Day Average. |
| (144A) | The resale of such security is exempt from registration under Rule 144A of the Securities Act of 1933. Such securities may be resold normally to qualified institutional buyers. At September 30, 2023, the value of these securities amounted to $1,611,059,541, or 50.3% of net assets. |
| (a) | Floating rate note. Coupon rate, reference index and spread shown at September 30, 2023. |
| (b) | Non-income producing security. |
| (c) | The interest rate is subject to change periodically. The interest rate and/or reference index and spread shown at September 30, 2023. |
| (d) | Debt obligation initially issued at one coupon which converts to a higher coupon at a specific date. The rate shown is the rate at September 30, 2023. |
The accompanying notes are an integral part of these financial statements.
86Pioneer Strategic Income Fund | Annual Report | 9/30/23
| (e) | Securities purchased on a when-issued basis. Rates do not take effect until settlement date. |
| (f) | Security represents the interest-only portion payments on a pool of underlying mortgages or mortgage-backed securities. |
| (g) | Security issued with a zero coupon. Income is recognized through accretion of discount. |
| (h) | Payment-in-kind (PIK) security which may pay interest in the form of additional principal amount. |
| (i) | Security is perpetual in nature and has no stated maturity date. |
| (j) | Security is in default. |
| (k) | Issued as participation notes. |
| (l) | Issued as preference shares. |
| * | Senior secured floating rate loan interests in which the Fund invests generally pay interest at rates that are periodically re-determined by reference to a base lending rate plus a premium. These base lending rates are generally (i) the lending rate offered by one or more major European banks, such as LIBOR or SOFR, (ii) the prime rate offered by one or more major United States banks, (iii) the rate of a certificate of deposit or (iv) other base lending rates used by commercial lenders. The interest rate shown is the rate accruing at September 30, 2023. |
| + | Security is valued using significant unobservable inputs (Level 3). |
| † | Amount rounds to less than 0.1%. |
| # | Securities are restricted as to resale. |
| Restricted Securities | Acquisition date | Cost | Value |
| Adare Re 2022-2 | 10/20/2022 | $1,800,000 | $ 1,987,687 |
| Alamo Re | 4/12/2023 | 750,000 | 762,225 |
| Alturas Re 2020-3 | 7/1/2020 | — | — |
| Alturas Re 2021-2 | 2/16/2021 | 137,935 | — |
| Alturas Re 2021-3 | 8/16/2021 | 44,213 | 20,686 |
| Alturas Re 2022-2 | 1/18/2022 | 494,609 | 528,109 |
| Aquila Re I | 5/10/2023 | 750,000 | 762,450 |
| Atlas Capital | 5/17/2023 | 1,250,000 | 1,261,750 |
| Ballybunion Re 2020 | 12/31/2019 | 411,732 | 677,844 |
| Ballybunion Re 2021-3 | 8/2/2021 | 71,590 | 76,157 |
| Ballybunion Re 2022 | 3/9/2022 | 2,408 | 28,550 |
| Ballybunion Re 2022-2 | 8/9/2022 | 3,000,000 | 3,046,530 |
| Ballybunion Re 2022-3 | 8/5/2022 | 3,500,000 | 3,621,129 |
| Ballybunion Re 2023 | 3/20/2023 | 3,000,000 | 3,252,458 |
| Bantry Re 2021 | 1/11/2021 | 64,034 | 7,864 |
| Bantry Re 2022 | 2/2/2022 | 243,345 | 383,365 |
| Bantry Re 2023 | 1/12/2023 | 5,000,000 | 5,801,756 |
| Berwick Re 2019-1 | 12/31/2018 | 1,188,696 | 1,586,698 |
| Berwick Re 2020-1 | 9/24/2020 | — | 200 |
| Berwick Re 2022 | 12/28/2021 | 62,578 | 67,478 |
| Berwick Re 2023 | 2/1/2023 | 3,225,964 | 3,815,792 |
| Bonanza Re | 12/15/2020 | 750,000 | 669,975 |
| Bonanza Re | 3/11/2022 | 250,000 | 175,000 |
| Bonanza Re | 1/6/2023 | 250,000 | 251,375 |
The accompanying notes are an integral part of these financial statements.
Pioneer Strategic Income Fund | Annual Report | 9/30/2387
Schedule of Investments | 9/30/23 (continued)
| Restricted Securities | Acquisition date | Cost | Value |
| Cape Lookout Re | 4/14/2023 | $1,000,000 | $ 1,017,100 |
| Carnoustie Re 2020 | 7/16/2020 | 44,162 | 201,824 |
| Clarendon Re 2023 | 3/20/2023 | 916,657 | 1,016,025 |
| Commonwealth Re | 6/15/2022 | 750,000 | 753,225 |
| Denning Re 2022 | 7/11/2022 | 1,166,885 | 1,253,858 |
| Easton Re Pte | 12/15/2020 | 900,000 | 901,350 |
| Eccleston Re 2023 | 7/13/2023 | 4,000,000 | 4,681,467 |
| Eden Re II | 12/23/2019 | 578,472 | 266,000 |
| Eden Re II | 1/25/2021 | 419,183 | 78,898 |
| Eden Re II | 1/21/2022 | 761,001 | 568,718 |
| Eden Re II | 1/17/2023 | 3,000,000 | 3,346,500 |
| FloodSmart Re | 2/16/2021 | 1,000,000 | 998,100 |
| FloodSmart Re | 2/14/2022 | 1,500,000 | 1,434,750 |
| Formby Re 2018 | 7/9/2018 | 5,438 | — |
| Four Lakes Re | 11/5/2020 | 1,500,000 | 1,467,000 |
| Four Lakes Re | 11/5/2020 | 1,500,000 | 1,505,250 |
| Four Lakes Re | 12/15/2021 | 500,000 | 483,650 |
| Gamboge Re | 4/24/2023 | 4,014,656 | 4,499,745 |
| Gateway Re | 2/3/2023 | 500,000 | 526,150 |
| Gateway Re II | 4/13/2023 | 250,000 | 253,125 |
| Gleneagles Re 2021 | 1/13/2021 | 22,875 | 125 |
| Gleneagles Re 2022 | 1/18/2022 | 578,842 | 617,905 |
| Gullane Re 2018 | 3/26/2018 | — | 129,294 |
| Gullane Re 2023 | 1/20/2023 | 5,318,293 | 6,280,511 |
| Harambee Re 2018 | 12/19/2017 | 63,696 | — |
| Harambee Re 2019 | 12/20/2018 | — | 6,000 |
| Harambee Re 2020 | 2/27/2020 | — | 44,700 |
| Herbie Re | 10/19/2020 | 500,000 | 489,750 |
| Integrity Re | 5/9/2022 | 500,000 | 450,000 |
| Integrity Re | 3/23/2023 | 1,250,000 | 1,309,250 |
| International Bank for Reconstruction & Development | 2/28/2020 | 250,000 | 249,325 |
| Isosceles Re 2023 | 8/7/2023 | 234,356 | 246,750 |
| Isosceles Re 2023 | 8/7/2023 | 948,549 | 992,100 |
| Isosceles Re 2023 | 8/7/2023 | 405,947 | 420,853 |
| Kilimanjaro III Re | 6/15/2022 | 1,000,000 | 996,500 |
| Lightning Re | 3/20/2023 | 1,000,000 | 1,045,100 |
| Limestone Re 2019-2B | 6/20/2018 | 1,675 | 1,186 |
| Limestone Re 2020-1 | 12/15/2016 | — | — |
| Limestone Re 2020-1 | 12/27/2019 | — | — |
| Lion Rock Re 2020 | 3/27/2020 | — | — |
| Lion Rock Re 2021 | 3/1/2021 | 204,267 | 94,700 |
| Locke Tavern Re | 3/23/2023 | 1,000,000 | 1,016,800 |
| Long Point Re IV | 5/13/2022 | 2,500,000 | 2,485,000 |
| Lorenz Re 2019 | 7/10/2019 | 423,565 | 24,943 |
| Matterhorn Re | 12/15/2021 | 250,000 | 226,575 |
| Matterhorn Re | 3/10/2022 | 1,750,000 | 1,705,200 |
| Matterhorn Re | 3/10/2022 | 750,000 | 739,500 |
| Merion Re 2018-2 | 12/28/2017 | — | 424,864 |
| Merion Re 2021-2 | 12/28/2020 | 2,448,846 | 1,768,500 |
| Merion Re 2022-2 | 3/1/2022 | 6,551,154 | 6,211,224 |
The accompanying notes are an integral part of these financial statements.
88Pioneer Strategic Income Fund | Annual Report | 9/30/23
| Restricted Securities | Acquisition date | Cost | Value |
| Merion Re 2023-1 | 1/11/2023 | $ 441,808 | $ 521,983 |
| Mona Lisa Re | 12/30/2022 | 800,000 | 856,000 |
| Mystic Re IV | 12/16/2022 | 2,900,000 | 2,964,090 |
| Northshore Re II | 12/2/2020 | 500,000 | 498,350 |
| Northshore Re II | 6/22/2022 | 500,000 | 502,250 |
| Oakmont Re 2020 | 12/3/2020 | — | — |
| Oakmont Re 2022 | 5/9/2022 | 805,153 | 1,100,769 |
| Old Head Re 2022 | 1/6/2022 | 188,288 | 125,000 |
| Old Head Re 2023 | 1/11/2023 | 168,991 | 238,674 |
| Pangaea Re 2023-1 | 1/23/2023 | 4,250,000 | 4,974,053 |
| Pangaea Re 2023-3 | 7/5/2023 | 2,500,000 | 2,700,044 |
| Phoenician Re | 12/1/2021 | 750,000 | 737,625 |
| Phoenix 3 Re 2023-3 | 12/21/2020 | 896,560 | 1,085,800 |
| Pine Valley Re 2023 | 1/24/2023 | 446,865 | — |
| Porthcawl Re 2023 | 1/23/2023 | 197,811 | 246,018 |
| Portrush Re 2017 | 6/12/2017 | 1,687,366 | 220 |
| Portsalon Re 2022 | 7/15/2022 | 323,453 | 366,768 |
| Queen Street 2023 Re | 5/12/2023 | 2,500,000 | 2,570,250 |
| Residential Re | 10/30/2020 | 1,500,000 | 1,474,350 |
| Residential Re | 10/30/2020 | 1,250,000 | 1,241,000 |
| Residential Re | 11/22/2022 | 1,500,000 | 1,503,450 |
| RosaPenna Re 2022 | 8/26/2022 | 1,365,175 | 1,456,832 |
| Sakura Re | 12/22/2022 | 500,000 | 530,200 |
| Sanders Re II | 3/1/2022 | 2,250,000 | 2,131,200 |
| Sanders Re III | 11/30/2022 | 750,000 | 754,575 |
| Sanders Re III | 3/24/2023 | 250,000 | 247,750 |
| Sector Re V | 4/23/2019 | 244,510 | 184,536 |
| Sector Re V | 5/1/2019 | 3,608 | 86,472 |
| Sector Re V | 12/4/2019 | 2,083 | 261,900 |
| Sector Re V | 1/1/2020 | 3,681 | 272,371 |
| Sector Re V | 1/5/2022 | — | 257,175 |
| Sector Re V | 5/19/2022 | 2,750 | 285,996 |
| Sector Re V | 5/19/2022 | 9,179 | 60,402 |
| Sector Re V | 12/30/2022 | 2,698,893 | 3,262,962 |
| Sussex Re | 12/7/2020 | 750,000 | 721,200 |
| Sussex Re 2020-1 | 1/21/2020 | — | — |
| Sussex Re 2021-1 | 1/26/2021 | — | 1,400 |
| Thopas Re 2019 | 12/21/2018 | — | 23,400 |
| Thopas Re 2020 | 12/30/2019 | — | — |
| Thopas Re 2021 | 12/30/2020 | — | 80,500 |
| Thopas Re 2022 | 2/15/2022 | — | — |
| Thopas Re 2023 | 2/15/2023 | 3,192,294 | 3,791,488 |
| Torricelli Re 2021 | 7/2/2021 | — | 121,779 |
| Torricelli Re 2022 | 7/26/2022 | — | 44,709 |
| Torricelli Re 2023 | 7/26/2023 | 3,250,000 | 3,554,730 |
| Ursa Re | 4/12/2023 | 500,000 | 504,350 |
| Ursa Re II | 10/8/2020 | 3,000,000 | 2,989,500 |
| Veraison Re | 12/14/2022 | 500,000 | 527,400 |
| Viribus Re 2018 | 12/22/2017 | 26,397 | — |
| Viribus Re 2019 | 12/27/2018 | — | 25,915 |
| Viribus Re 2020 | 3/12/2020 | 421,904 | 137,434 |
The accompanying notes are an integral part of these financial statements.
Pioneer Strategic Income Fund | Annual Report | 9/30/2389
Schedule of Investments | 9/30/23 (continued)
| Restricted Securities | Acquisition date | Cost | Value |
| Viribus Re 2022 | 4/18/2022 | $ — | $ 91,750 |
| Viribus Re 2023 | 2/2/2023 | 1,500,000 | 1,913,550 |
| Vitality Re XI | 1/31/2020 | 996,243 | 992,300 |
| Vitality Re XII | 9/21/2023 | 245,556 | 245,150 |
| Vitality Re XIII | 1/4/2023 | 1,916,657 | 1,961,000 |
| Vitality Re XIV | 1/25/2023 | 2,500,000 | 2,555,500 |
| Vitality Re XIV | 1/25/2023 | 400,000 | 399,760 |
| Walton Health Re 2019 | 7/18/2019 | 89,456 | 156,475 |
| Walton Health Re 2022 | 7/13/2022 | 99,516 | 384,023 |
| White Heron Re 2023 | 8/30/2023 | 929,902 | 1,002,672 |
| Woburn Re 2018 | 3/20/2018 | 548,504 | 36,219 |
| Woburn Re 2019 | 1/30/2019 | 490,351 | 612,596 |
| Total Restricted Securities | | | $138,388,333 |
| % of Net assets | | | 4.3% |
FORWARD FOREIGN CURRENCY EXCHANGE CONTRACTS
Currency
Purchased | In
Exchange for | Currency
Sold | Deliver | Counterparty | Settlement
Date | Unrealized
Appreciation
(Depreciation) |
| AUD | 38,545,000 | USD | 24,903,192 | Citibank NA | 11/21/23 | $ (75,613) |
| EUR | 16,034,361 | SEK | 185,000,000 | Citibank NA | 10/26/23 | 789,646 |
| SEK | 185,000,000 | EUR | 16,034,361 | Citibank NA | 10/26/23 | (809,591) |
| USD | 14,532,299 | IDR | 223,950,000,000 | Citibank NA | 12/15/23 | 79,704 |
| INR | 1,416,850,000 | USD | 17,222,999 | Goldman Sachs & Co. | 11/2/23 | (207,663) |
| AUD | 26,560,000 | NZD | 28,603,072 | HSBC Bank USA NA | 12/19/23 | 250,880 |
| EUR | 15,100,000 | USD | 16,582,897 | HSBC Bank USA NA | 11/21/23 | (582,130) |
| NZD | 28,603,072 | AUD | 26,560,000 | HSBC Bank USA NA | 12/19/23 | (268,937) |
| USD | 2,132,613 | EUR | 1,935,000 | JPMorgan Chase Bank NA | 10/24/23 | 84,667 |
| USD | 16,049,331 | EUR | 14,746,000 | JPMorgan Chase Bank NA | 11/21/23 | 423,682 |
| EUR | 53,546,500 | USD | 60,040,320 | State Street Bank & Trust Co. | 10/24/23 | (3,368,322) |
| USD | 1,519,067 | EUR | 1,370,000 | State Street Bank & Trust Co. | 10/24/23 | 69,100 |
| USD | 5,662,535 | CAD | 7,465,000 | State Street Bank & Trust Co. | 11/2/23 | 163,834 |
| USD | 4,726,206 | GBP | 3,845,000 | State Street Bank & Trust Co. | 12/14/23 | 32,430 |
| USD | 61,092,497 | EUR | 57,500,000 | State Street Bank & Trust Co. | 12/18/23 | 65,815 |
| TOTAL FORWARD FOREIGN CURRENCY EXCHANGE CONTRACTS | $ (3,352,498) |
The accompanying notes are an integral part of these financial statements.
90Pioneer Strategic Income Fund | Annual Report | 9/30/23
FUTURES CONTRACTS
FIXED INCOME INDEX FUTURES CONTRACTS
Number of
Contracts
Long | Description | Expiration
Date | Notional
Amount | Market
Value | Unrealized
(Depreciation) |
| 252 | U.S. 2 Year Note (CBT) | 12/29/23 | $ 51,269,188 | $ 51,083,156 | $ (186,032) |
| 8,200 | U.S. 5 Year Note (CBT) | 12/29/23 | 870,842,895 | 863,946,916 | (6,895,979) |
| 809 | U.S. 10 Year Ultra Bond (CBT) | 12/19/23 | 91,614,488 | 90,254,063 | (1,360,425) |
| 684 | U.S. Long Bond (CBT) | 12/19/23 | 82,255,371 | 77,826,375 | (4,428,996) |
| 397 | U.S. Ultra Bond (CBT) | 12/19/23 | 50,764,795 | 47,118,938 | (3,645,857) |
| | | | $1,146,746,737 | $1,130,229,448 | $(16,517,289) |
Number of
Contracts
Short | Description | Expiration
Date | Notional
Amount | Market
Value | Unrealized
Appreciation |
| 650 | Euro-Bund | 12/7/23 | $ (90,903,239) | $ (88,403,016) | $ 2,500,223 |
| 138 | U.S. 10 Year Note (CBT) | 12/19/23 | (15,169,992) | (14,912,625) | 257,367 |
| | | | $ (106,073,231) | $ (103,315,641) | $ 2,757,590 |
| TOTAL FUTURES CONTRACTS | $1,040,673,506 | $1,026,913,807 | $(13,759,699) |
The accompanying notes are an integral part of these financial statements.
Pioneer Strategic Income Fund | Annual Report | 9/30/2391
Schedule of Investments | 9/30/23 (continued)
SWAP CONTRACTS
CENTRALLY CLEARED CREDIT DEFAULT SWAP CONTRACTS – BUY PROTECTION
Notional
Amount ($)(1) | Reference
Obligation/Index | Pay/
Receive(2) | Annual
Fixed Rate | Expiration
Date | Premiums
(Received) | Unrealized
Appreciation | Market
Value |
| 533,090,000 | Markit CDX North America High Yield Index Series 41 | Pay | 5.00% | 12/20/28 | $(5,125,616) | $153,071 | $(4,972,545) |
TOTAL CENTRALLY CLEARED CREDIT DEFAULT
SWAP CONTRACTS – BUY PROTECTION | $ (5,125,616) | $ 153,071 | $ (4,972,545) |
| TOTAL SWAP CONTRACTS | | $ (5,125,616) | $ 153,071 | $ (4,972,545) |
| | |
| (1) | The notional amount is the maximum amount that a seller of credit protection would be obligated to pay upon occurrence of a credit event. |
| (2) | Pays quarterly. |
Principal amounts are denominated in U.S. dollars (“USD”) unless otherwise noted.
| AUD | — Australia Dollar |
| CAD | — Canada Dollar |
| COP | — Colombia Peso |
| EUR | — Euro |
| GBP | — Great British Pound |
| IDR | — Indonesian Rupiah |
| INR | — Indian Rupee |
| KZT | — Kazakhstan Tenge |
| NZD | — New Zealand Dollar |
| SEK | — Sweden Krona |
| USD | — United States Dollar |
| UYU | — Uruguay Peso |
| UZS | — Uzbekistan Som |
Purchases and sales of securities (excluding short-term investments) for the year ended September 30, 2023 were as follows:
| | Purchases | Sales |
| Long-Term U.S. Government Securities | $ 593,157,912 | $ 259,041,982 |
| Other Long-Term Securities | $1,002,561,852 | $1,741,627,497 |
The accompanying notes are an integral part of these financial statements.
92Pioneer Strategic Income Fund | Annual Report | 9/30/23
At September 30, 2023, the net unrealized depreciation on investments based on cost for federal tax purposes of $3,748,605,703 was as follows:
| Aggregate gross unrealized appreciation for all investments in which there is an excess of value over tax cost | $ 52,087,418 |
| Aggregate gross unrealized depreciation for all investments in which there is an excess of tax cost over value | (520,129,957) |
| Net unrealized depreciation | $(468,042,539) |
Various inputs are used in determining the value of the Fund's investments. These inputs are summarized in the three broad levels below.
| Level 1 | – | unadjusted quoted prices in active markets for identical securities. |
| Level 2 | – | other significant observable inputs (including quoted prices for similar securities, interest rates, prepayment speeds, credit risks, etc.). See Notes to Financial Statements — Note 1A. |
| Level 3 | – | significant unobservable inputs (including the Adviser's own assumptions in determining fair value of investments). See Notes to Financial Statements — Note 1A. |
The following is a summary of the inputs used as of September 30, 2023, in valuing the Fund's investments:
| | Level 1 | Level 2 | Level 3 | Total |
| Senior Secured Floating Rate Loan Interests | $ — | $ 19,833,526 | $ — | $ 19,833,526 |
| Common Stocks | | | | |
| Automobile Components | — | 956,548 | — | 956,548 |
| Passenger Airlines | — | — | 1,654,768 | 1,654,768 |
| All Other Common Stocks | 3,374 | — | — | 3,374 |
| Asset Backed Securities | — | 274,497,013 | — | 274,497,013 |
| Collateralized Mortgage Obligations | — | 379,575,553 | — | 379,575,553 |
| Commercial Mortgage-Backed Securities | — | 193,489,521 | — | 193,489,521 |
| Convertible Corporate Bonds | — | 24,778,035 | — | 24,778,035 |
| Corporate Bonds | — | 1,021,224,753 | — | 1,021,224,753 |
| Convertible Preferred Stock | 34,906,190 | — | — | 34,906,190 |
| Insurance-Linked Securities | | | | |
| Collateralized Reinsurance | | | | |
| Earthquakes – California | — | — | 1,987,687 | 1,987,687 |
| Multiperil – Massachusetts | — | — | 1,620,626 | 1,620,626 |
| Multiperil – U.S. | — | — | 15,202,413 | 15,202,413 |
| Multiperil – Worldwide | — | — | 2,689,384 | 2,689,384 |
| Windstorm – Florida | — | — | 220 | 220 |
| Windstorm – North Carolina | — | — | 1,659,703 | 1,659,703 |
The accompanying notes are an integral part of these financial statements.
Pioneer Strategic Income Fund | Annual Report | 9/30/2393
Schedule of Investments | 9/30/23 (continued)
| | Level 1 | Level 2 | Level 3 | Total |
| Windstorm – U.S. Multistate | $ — | $ — | $ 1,002,672 | $ 1,002,672 |
| Windstorm – U.S. Regional | — | — | 1,100,769 | 1,100,769 |
| Reinsurance Sidecars | | | | |
| Multiperil – U.S. | — | — | 252,524 | 252,524 |
| Multiperil – Worldwide | — | — | 62,029,610 | 62,029,610 |
| All Other Insurance-Linked Securities | — | 50,842,725 | — | 50,842,725 |
| Foreign Government Bonds | — | 97,907,441 | — | 97,907,441 |
| U.S. Government and Agency Obligations | — | 1,099,894,083 | — | 1,099,894,083 |
| Repurchase Agreements | — | 15,000,000 | — | 15,000,000 |
| Over The Counter (OTC) Currency Put Options Purchased | — | 578,641 | — | 578,641 |
| Total Investments in Securities | $ 34,909,564 | $ 3,178,577,839 | $ 89,200,376 | $ 3,302,687,779 |
| Liabilities | | | | |
| TBA Sales Commitments | $ — | $ (44,782,539) | $ — | $ (44,782,539) |
| Total Liabilities | $ — | $ (44,782,539) | $ — | $ (44,782,539) |
| Other Financial Instruments | | | | |
| Over The Counter (OTC) Currency Call Option Written | $ — | $ (39,873) | $ — | $ (39,873) |
| Net unrealized depreciation on forward foreign currency exchange contracts | — | (3,352,498) | — | (3,352,498) |
| Net unrealized depreciation on futures contracts | (13,759,699) | — | — | (13,759,699) |
| Swap contracts, at value | — | (4,972,545) | — | (4,972,545) |
| Total Other Financial Instruments | $ (13,759,699) | $ (8,364,916) | $ — | $ (22,124,615) |
The accompanying notes are an integral part of these financial statements.
94Pioneer Strategic Income Fund | Annual Report | 9/30/23
The following is a reconciliation of assets valued using significant unobservable inputs (Level 3):
| | Common
Stocks | Insurance-
Linked
Securities | Total |
| Balance as of 9/30/22 | $ 137,204 | $115,676,428 | $115,813,632 |
| Realized gain (loss)(1) | (127,683 ) | (6,037,321 ) | (6,165,004 ) |
| Changed in unrealized appreciation (depreciation)(2) | 693,757 | 7,038,667 | 7,732,424 |
| Return of capital | — | (33,635,614 ) | (33,635,614 ) |
| Purchases | — | 52,794,702 | 52,794,702 |
| Sales | (155,874 ) | (48,291,254 ) | (48,447,128 ) |
| Transfers in to Level 3* | 1,107,364 | — | 1,107,364 |
| Transfers out of Level 3* | — | — | — |
| Balance as of 9/30/23 | $1,654,768 | $ 87,545,608 | $ 89,200,376 |
| (1) | Realized gain (loss) on these securities is included in the realized gain (loss) from investments on the Statement of Operations. |
| (2) | Unrealized appreciation (depreciation) on these securities is included in the change in unrealized appreciation (depreciation) from investments on the Statement of Operations. |
| * | Transfers are calculated on the beginning of period values. During the year ended September 30, 2023, a security valued at $1,107,364 was transferred from Level 1 to Level 3, due to valuing the security using unobservable inputs. There were no other transfers in or out of Level 3 during the period. |
| Net change in unrealized appreciation (depreciation) of Level 3 investments still held and considered Level 3 at September 30, 2023: | $7,627,726 |
The accompanying notes are an integral part of these financial statements.
Pioneer Strategic Income Fund | Annual Report | 9/30/2395
Statement of Assets and Liabilities | 9/30/23
| ASSETS: | |
| Investments in unaffiliated issuers, at value (cost $3,762,860,278) | $3,302,687,779 |
| Cash | 32,196,507 |
| Foreign currencies, at value (cost $18,375,535) | 17,497,408 |
| Forwards collateral | 3,320,000 |
| Futures collateral | 22,477,832 |
| Options Collateral | 220,000 |
| Swaps collateral | 36,014,861 |
| Variation margin for futures contracts | 543,533 |
| Variation margin for centrally cleared swap contracts | 1,412,346 |
| Unrealized appreciation on forward foreign currency exchange contracts | 1,959,758 |
| Receivables — | |
| Investment securities sold | 297,876,681 |
| Fund shares sold | 6,903,889 |
| Interest | 29,001,063 |
| Due from the Adviser | 18,630 |
| Other assets | 87,352 |
| Total assets | $3,752,217,639 |
| LIABILITIES: | |
| Payables — | |
| Investment securities purchased | $ 465,970,177 |
| Fund shares repurchased | 8,189,333 |
| Distributions | 2,461,964 |
| Trustees' fees | 6,182 |
| Interest expense | 80,178 |
| Forward foreign currency exchange contracts | 17,302,012 |
| Collateral due from broker for TBA Securities | 62,174 |
| TBA sale commitments at value (net proceeds received $45,408,594) | 44,782,539 |
| Swap contracts, at value (net premiums received $5,125,616) | 4,972,545 |
| Written options outstanding (net premiums received $740,169) | 39,873 |
| Unrealized depreciation on forward foreign currency exchange contracts | 5,312,256 |
| Reserve for repatriation taxes | 91,631 |
| Management fees | 198,205 |
| Administrative expenses | 107,679 |
| Distribution fees | 24,090 |
| Accrued expenses | 1,007,611 |
| Total liabilities | $ 550,608,449 |
| NET ASSETS: | |
| Paid-in capital | $3,954,824,846 |
| Distributable earnings (loss) | (753,215,656) |
| Net assets | $3,201,609,190 |
| NET ASSET VALUE PER SHARE: | |
| No par value (unlimited number of shares authorized) | |
| Class A (based on $569,497,130/63,951,228 shares) | $ 8.91 |
| Class C (based on $50,393,549/5,788,201 shares) | $ 8.71 |
| Class K (based on $426,932,853/47,847,593 shares) | $ 8.92 |
| Class R (based on $54,791,013/6,041,341 shares) | $ 9.07 |
| Class Y (based on $2,099,994,645/235,646,221 shares) | $ 8.91 |
| MAXIMUM OFFERING PRICE PER SHARE: | |
| Class A (based on $8.91 net asset value per share/100%-4.50% maximum sales charge) | $ 9.33 |
The accompanying notes are an integral part of these financial statements.
96Pioneer Strategic Income Fund | Annual Report | 9/30/23
Statement of Operations FOR THE YEAR ENDED 9/30/23
| INVESTMENT INCOME: | | |
| Interest from unaffiliated issuers (net of foreign taxes withheld $(35,181)) | $ 192,354,148 | |
| Dividends from unaffiliated issuers (net of foreign taxes withheld $10,183) | 14,783,809 | |
| Total Investment Income | | $ 207,137,957 |
| EXPENSES: | | |
| Management fees | $ 19,582,282 | |
| Administrative expenses | 939,003 | |
| Transfer agent fees | | |
| Class A | 1,271,769 | |
| Class C | 54,275 | |
| Class K | 2,809 | |
| Class R | 150,310 | |
| Class Y | 2,213,625 | |
| Distribution fees | | |
| Class A | 1,541,246 | |
| Class C | 605,789 | |
| Class R | 298,736 | |
| Shareowner communications expense | 249,767 | |
| Custodian fees | 105,298 | |
| Registration fees | 178,932 | |
| Professional fees | 355,074 | |
| Printing expense | 50,942 | |
| Officers' and Trustees' fees | 242,340 | |
| Insurance expense | 41,486 | |
| Miscellaneous | 601,113 | |
| Total expenses | | $ 28,484,796 |
| Less fees waived and expenses reimbursed by the Adviser | | (1,687,300) |
| Net expenses | | $ 26,797,496 |
| Net investment income | | $ 180,340,461 |
| REALIZED AND UNREALIZED GAIN (LOSS) ON INVESTMENTS: | | |
| Net realized gain (loss) on: | | |
| Reimbursement by the Adviser | $ 808,575 | |
| Investments in unaffiliated issuers (net of foreign capital gains tax of $14,293) | (148,364,209) | |
| Forward foreign currency exchange contracts | (10,989,161) | |
| Futures contracts | (62,782,436) | |
| Swap contracts | (70,967,407) | |
| Written options | 1,290,128 | |
| Other assets and liabilities denominated in foreign currencies | 4,840,610 | $(286,163,900) |
| Change in net unrealized appreciation (depreciation) on: | | |
| Investments in unaffiliated issuers (net of foreign capital gains tax of $(43,111)) | $ 176,453,484 | |
| TBA sale commitments | 626,055 | |
| Forward foreign currency exchange contracts | 8,998,486 | |
| Futures contracts | 8,256,447 | |
| Swap contracts | (3,816,164) | |
The accompanying notes are an integral part of these financial statements.
Pioneer Strategic Income Fund | Annual Report | 9/30/2397
Statement of Operations (continued)
FOR THE YEAR ENDED 9/30/23
| Written options | (412,030) | |
| Other assets and liabilities denominated in foreign currencies | 1,006,063 | 191,112,341 |
| Net realized and unrealized gain (loss) on investments | | $ (95,051,559) |
| Net increase in net assets resulting from operations | | $ 85,288,902 |
The accompanying notes are an integral part of these financial statements.
98Pioneer Strategic Income Fund | Annual Report | 9/30/23
Statements of Changes in Net Assets
| | Year
Ended
9/30/23 | Year
Ended
9/30/22 |
| FROM OPERATIONS: | | |
| Net investment income (loss) | $ 180,340,461 | $ 160,251,728 |
| Net realized gain (loss) on investments | (286,163,900) | (73,615,659) |
| Change in net unrealized appreciation (depreciation) on investments | 191,112,341 | (719,296,630) |
| Net increase (decrease) in net assets resulting from operations | $ 85,288,902 | $ (632,660,561) |
| DISTRIBUTIONS TO SHAREOWNERS: | | |
| Class A ($0.32 and $0.65 per share, respectively) | $ (21,269,022) | $ (48,818,369) |
| Class C ($0.25 and $0.58 per share, respectively) | (1,689,172) | (5,812,988) |
| Class K ($0.36 and $0.69 per share, respectively) | (16,058,936) | (29,813,091) |
| Class R ($0.29 and $0.62 per share, respectively) | (1,858,632) | (4,713,046) |
| Class Y ($0.35 and $0.68 per share, respectively) | (88,662,729) | (195,193,873) |
| Tax return of capital | | |
| Class A ($— and $0.17 per share, respectively) | $ — | $ (12,417,661) |
| Class C ($— and $0.17 per share, respectively) | — | (1,478,618) |
| Class K ($— and $0.17 per share, respectively) | — | (7,583,393) |
| Class R ($— and $0.17 per share, respectively) | — | (1,198,832) |
| Class Y ($— and $0.17 per share, respectively) | — | (49,650,395) |
| Total distributions to shareowners | $ (129,538,491) | $ (356,680,266) |
| FROM FUND SHARE TRANSACTIONS: | | |
| Net proceeds from sales of shares | $ 962,289,133 | $ 1,349,108,740 |
| Reinvestment of distributions | 106,228,240 | 297,228,295 |
| Cost of shares repurchased | (1,578,816,672) | (1,633,660,142) |
| Net increase (decrease) in net assets resulting from Fund share transactions | $ (510,299,299) | $ 12,676,893 |
| Net decrease in net assets | $ (554,548,888) | $ (976,663,934) |
| NET ASSETS: | | |
| Beginning of year | $ 3,756,158,078 | $ 4,732,822,012 |
| End of year | $ 3,201,609,190 | $ 3,756,158,078 |
The accompanying notes are an integral part of these financial statements.
Pioneer Strategic Income Fund | Annual Report | 9/30/2399
Statements of Changes in Net Assets (continued)
| | Year
Ended
9/30/23
Shares | Year
Ended
9/30/23
Amount | Year
Ended
9/30/22
Shares | Year
Ended
9/30/22
Amount |
| Class A | | | | |
| Shares sold | 8,071,059 | $ 74,018,157 | 9,836,727 | $ 101,540,735 |
| Reinvestment of distributions | 1,930,360 | 17,700,464 | 4,860,254 | 51,146,801 |
| Less shares repurchased | (16,472,728) | (151,099,390) | (19,459,588) | (198,638,745) |
| Net decrease | (6,471,309) | $ (59,380,769) | (4,762,607) | $ (45,951,209) |
| Class C | | | | |
| Shares sold | 618,970 | $ 5,544,184 | 922,724 | $ 9,348,912 |
| Reinvestment of distributions | 170,273 | 1,525,532 | 645,184 | 6,672,398 |
| Less shares repurchased | (3,262,213) | (29,204,573) | (3,432,736) | (34,352,899) |
| Net decrease | (2,472,970) | $ (22,134,857) | (1,864,828) | $ (18,331,589) |
| Class K | | | | |
| Shares sold | 13,002,141 | $ 119,652,979 | 17,480,233 | $ 179,760,809 |
| Reinvestment of distributions | 1,615,746 | 14,843,933 | 3,259,335 | 34,220,532 |
| Less shares repurchased | (11,224,354) | (103,321,780) | (17,088,122) | (171,949,324) |
| Net increase | 3,393,533 | $ 31,175,132 | 3,651,446 | $ 42,032,017 |
| Class R | | | | |
| Shares sold | 959,813 | $ 8,969,688 | 970,206 | $ 10,201,397 |
| Reinvestment of distributions | 198,124 | 1,849,181 | 548,039 | 5,887,344 |
| Less shares repurchased | (1,914,330) | (17,931,749) | (2,850,715) | (30,333,453) |
| Net decrease | (756,393) | $ (7,112,880) | (1,332,470) | $ (14,244,712) |
| Class Y | | | | |
| Shares sold | 82,071,830 | $ 754,104,125 | 102,666,365 | $ 1,048,256,887 |
| Reinvestment of distributions | 7,668,208 | 70,309,130 | 18,980,365 | 199,301,220 |
| Less shares repurchased | (139,150,192) | (1,277,259,180) | (118,209,634) | (1,198,385,721) |
Net increase
(decrease) | (49,410,154) | $ (452,845,925) | 3,437,096 | $ 49,172,386 |
The accompanying notes are an integral part of these financial statements.
100Pioneer Strategic Income Fund | Annual Report | 9/30/23
| | Year
Ended
9/30/23 | Year
Ended
9/30/22 | Year
Ended
9/30/21 | Year
Ended
9/30/20 | Year
Ended
9/30/19 |
| Class A | | | | | |
| Net asset value, beginning of period | $ 9.05 | $ 11.38 | $ 10.91 | $ 10.89 | $ 10.42 |
| Increase (decrease) from investment operations: | | | | | |
| Net investment income (loss) (a) | $ 0.45 | $ 0.35 | $ 0.35 | $ 0.38 | $ 0.36 |
| Net realized and unrealized gain (loss) on investments | (0.27) | (1.86) | 0.52 | (0.02) | 0.42 |
| Net increase (decrease) from investment operations | $ 0.18 | $ (1.51) | $ 0.87 | $ 0.36 | $ 0.78 |
| Distributions to shareowners: | | | | | |
| Net investment income | $ (0.32) | $ (0.12) | $ (0.40) | $ (0.34) | $ (0.27) |
| Net realized gain | — | (0.53) | — | — | — |
| Tax return of capital | — | (0.17) | — | — | (0.04) |
| Total distributions | $ (0.32) | $ (0.82) | $ (0.40) | $ (0.34) | $ (0.31) |
| Net increase (decrease) in net asset value | $ (0.14) | $ (2.33) | $ 0.47 | $ 0.02 | $ 0.47 |
| Net asset value, end of period | $ 8.91 | $ 9.05 | $ 11.38 | $ 10.91 | $ 10.89 |
| Total return (b) | 1.91%(c) | (14.12)% | 8.04% | 3.44% | 7.64% |
| Ratio of net expenses to average net assets | 1.06% | 1.01% | 1.06% | 1.06% | 1.10% |
| Ratio of net investment income (loss) to average net assets | 4.91% | 3.44% | 3.12% | 3.59% | 3.39% |
| Portfolio turnover rate | 51% | 56% | 67% | 69% | 53% |
| Net assets, end of period (in thousands) | $569,497 | $637,356 | $855,856 | $799,974 | $803,174 |
| Ratios with no waiver of fees and assumption of expenses by the Adviser and no reduction for fees paid indirectly: | | | | | |
| Total expenses to average net assets | 1.10% | 1.03% | 1.06% | 1.06% | 1.10% |
| Net investment income (loss) to average net assets | 4.87% | 3.42% | 3.12% | 3.59% | 3.39% |
| (a) | The per-share data presented above is based on the average shares outstanding for the period presented. |
| (b) | Assumes initial investment at net asset value at the beginning of each period, reinvestment of all distributions, the complete redemption of the investment at net asset value at the end of each period and no sales charges. Total return would be reduced if sales charges were taken into account. |
| (c) | For the year ended September 30, 2023, the Fund's total return includes a reimbursement by the Adviser (see Notes to the Financial Statements-Note 1.B). The impact on Class A's total return was 0.11%. |
The accompanying notes are an integral part of these financial statements.
Pioneer Strategic Income Fund | Annual Report | 9/30/23101
Financial Highlights (continued)
| | Year
Ended
9/30/23 | Year
Ended
9/30/22 | Year
Ended
9/30/21 | Year
Ended
9/30/20 | Year
Ended
9/30/19 |
| Class C | | | | | |
| Net asset value, beginning of period | $ 8.85 | $ 11.14 | $ 10.67 | $ 10.66 | $ 10.20 |
| Increase (decrease) from investment operations: | | | | | |
| Net investment income (loss) (a) | $ 0.38 | $ 0.28 | $ 0.27 | $ 0.30 | $ 0.28 |
| Net realized and unrealized gain (loss) on investments | (0.27) | (1.82) | 0.51 | (0.02) | 0.42 |
| Net increase (decrease) from investment operations | $ 0.11 | $ (1.54) | $ 0.78 | $ 0.28 | $ 0.70 |
| Distributions to shareowners: | | | | | |
| Net investment income | $ (0.25) | $ (0.05) | $ (0.31) | $ (0.27) | $ (0.20) |
| Net realized gain | — | (0.53) | — | — | — |
| Tax return of capital | — | (0.17) | — | — | (0.04) |
| Total distributions | $ (0.25) | $ (0.75) | $ (0.31) | $ (0.27) | $ (0.24) |
| Net increase (decrease) in net asset value | $ (0.14) | $ (2.29) | $ 0.47 | $ 0.01 | $ 0.46 |
| Net asset value, end of period | $ 8.71 | $ 8.85 | $ 11.14 | $ 10.67 | $ 10.66 |
| Total return (b) | 1.21%(c) | (14.69)% | 7.37% | 2.67% | 6.96% |
| Ratio of net expenses to average net assets | 1.70% | 1.66% | 1.73% | 1.73% | 1.74% |
| Ratio of net investment income (loss) to average net assets | 4.28% | 2.77% | 2.49% | 2.89% | 2.75% |
| Portfolio turnover rate | 51% | 56% | 67% | 69% | 53% |
| Net assets, end of period (in thousands) | $50,394 | $73,112 | $112,804 | $185,623 | $311,801 |
| Ratios with no waiver of fees and assumption of expenses by the Adviser and no reduction for fees paid indirectly: | | | | | |
| Total expenses to average net assets | 1.74% | 1.68% | 1.73% | 1.73% | 1.74% |
| Net investment income (loss) to average net assets | 4.24% | 2.75% | 2.49% | 2.89% | 2.75% |
| (a) | The per-share data presented above is based on the average shares outstanding for the period presented. |
| (b) | Assumes initial investment at net asset value at the beginning of each period, reinvestment of all distributions, the complete redemption of the investment at net asset value at the end of each period and no sales charges. Total return would be reduced if sales charges were taken into account. |
| (c) | For the year ended September 30, 2023, the Fund's total return includes a reimbursement by the Adviser (see Notes to the Financial Statements-Note 1.B). The impact on Class C's total return was 0.11%. |
The accompanying notes are an integral part of these financial statements.
102Pioneer Strategic Income Fund | Annual Report | 9/30/23
| | Year
Ended
9/30/23 | Year
Ended
9/30/22 | Year
Ended
9/30/21 | Year
Ended
9/30/20 | Year
Ended
9/30/19 |
| Class K | | | | | |
| Net asset value, beginning of period | $ 9.07 | $ 11.40 | $ 10.92 | $ 10.92 | $ 10.44 |
| Increase (decrease) from investment operations: | | | | | |
| Net investment income (loss) (a) | $ 0.49 | $ 0.40 | $ 0.40 | $ 0.43 | $ 0.41 |
| Net realized and unrealized gain (loss) on investments | (0.28) | (1.87) | 0.53 | (0.04) | 0.43 |
| Net increase (decrease) from investment operations | $ 0.21 | $ (1.47) | $ 0.93 | $ 0.39 | $ 0.84 |
| Distributions to shareowners: | | | | | |
| Net investment income | $ (0.36) | $ (0.16) | $ (0.45) | $ (0.39) | $ (0.32) |
| Net realized gain | — | (0.53) | — | — | — |
| Tax return of capital | — | (0.17) | — | — | (0.04) |
| Total distributions | $ (0.36) | $ (0.86) | $ (0.45) | $ (0.39) | $ (0.36) |
| Net increase (decrease) in net asset value | $ (0.15) | $ (2.33) | $ 0.48 | $ — | $ 0.48 |
| Net asset value, end of period | $ 8.92 | $ 9.07 | $ 11.40 | $ 10.92 | $ 10.92 |
| Total return (b) | 2.28%(c) | (13.73)% | 8.58% | 3.73% | 8.19% |
| Ratio of net expenses to average net assets | 0.59% | 0.59% | 0.63% | 0.62% | 0.63% |
| Ratio of net investment income (loss) to average net assets | 5.38% | 3.88% | 3.55% | 4.02% | 3.86% |
| Portfolio turnover rate | 51% | 56% | 67% | 69% | 53% |
| Net assets, end of period (in thousands) | $426,933 | $403,112 | $465,149 | $414,610 | $402,042 |
| Ratios with no waiver of fees and assumption of expenses by the Adviser and no reduction for fees paid indirectly: | | | | | |
| Total expenses to average net assets | 0.64% | 0.61% | 0.63% | 0.62% | 0.63% |
| Net investment income (loss) to average net assets | 5.33% | 3.86% | 3.55% | 4.02% | 3.86% |
| (a) | The per-share data presented above is based on the average shares outstanding for the period presented. |
| (b) | Assumes initial investment at net asset value at the beginning of each period, reinvestment of all distributions and the complete redemption of the investment at net asset value at the end of each period. |
| (c) | For the year ended September 30, 2023, the Fund's total return includes a reimbursement by the Adviser (see Notes to the Financial Statements-Note 1.B). The impact on Class K's total return was less than 0.005%. |
The accompanying notes are an integral part of these financial statements.
Pioneer Strategic Income Fund | Annual Report | 9/30/23103
Financial Highlights (continued)
| | Year
Ended
9/30/23 | Year
Ended
9/30/22 | Year
Ended
9/30/21 | Year
Ended
9/30/20 | Year
Ended
9/30/19 |
| Class R | | | | | |
| Net asset value, beginning of period | $ 9.21 | $ 11.58 | $ 11.09 | $ 11.08 | $ 10.59 |
| Increase (decrease) from investment operations: | | | | | |
| Net investment income (loss) (a) | $ 0.43 | $ 0.32 | $ 0.33 | $ 0.35 | $ 0.33 |
| Net realized and unrealized gain (loss) on investments | (0.28) | (1.90) | 0.52 | (0.03) | 0.44 |
| Net increase (decrease) from investment operations | $ 0.15 | $ (1.58) | $ 0.85 | $ 0.32 | $ 0.77 |
| Distributions to shareowners: | | | | | |
| Net investment income | $ (0.29) | $ (0.09) | $ (0.36) | $ (0.31) | $ (0.24) |
| Net realized gain | — | (0.53) | — | — | — |
| Tax return of capital | — | (0.17) | — | — | (0.04) |
| Total distributions | $ (0.29) | $ (0.79) | $ (0.36) | $ (0.31) | $ (0.28) |
| Net increase (decrease) in net asset value | $ (0.14) | $ (2.37) | $ 0.49 | $ 0.01 | $ 0.49 |
| Net asset value, end of period | $ 9.07 | $ 9.21 | $ 11.58 | $ 11.09 | $ 11.08 |
| Total return (b) | 1.60%(c) | (14.46)% | 7.77% | 3.03% | 7.43% |
| Ratio of net expenses to average net assets | 1.35% | 1.34% | 1.37% | 1.40% | 1.39% |
| Ratio of net investment income (loss) to average net assets | 4.62% | 3.09% | 2.83% | 3.23% | 3.10% |
| Portfolio turnover rate | 51% | 56% | 67% | 69% | 53% |
| Net assets, end of period (in thousands) | $54,791 | $62,624 | $94,136 | $103,585 | $131,214 |
| Ratios with no waiver of fees and assumption of expenses by the Adviser and no reduction for fees paid indirectly: | | | | | |
| Total expenses to average net assets | 1.39% | 1.36% | 1.37% | 1.40% | 1.39% |
| Net investment income (loss) to average net assets | 4.58% | 3.07% | 2.83% | 3.23% | 3.10% |
| (a) | The per-share data presented above is based on the average shares outstanding for the period presented. |
| (b) | Assumes initial investment at net asset value at the beginning of each period, reinvestment of all distributions and the complete redemption of the investment at net asset value at the end of each period. |
| (c) | For the year ended September 30, 2023, the Fund's total return includes a reimbursement by the Adviser (see Notes to the Financial Statements-Note 1.B). The impact on Class R's total return was less than 0.005%. |
The accompanying notes are an integral part of these financial statements.
104Pioneer Strategic Income Fund | Annual Report | 9/30/23
| | Year
Ended
9/30/23 | Year
Ended
9/30/22 | Year
Ended
9/30/21 | Year
Ended
9/30/20 | Year
Ended
9/30/19 |
| Class Y | | | | | |
| Net asset value, beginning of period | $ 9.05 | $ 11.38 | $ 10.91 | $ 10.90 | $ 10.42 |
| Increase (decrease) from investment operations: | | | | | |
| Net investment income (loss) (a) | $ 0.48 | $ 0.39 | $ 0.39 | $ 0.42 | $ 0.40 |
| Net realized and unrealized gain (loss) on investments | (0.27) | (1.87) | 0.51 | (0.03) | 0.42 |
| Net increase (decrease) from investment operations | $ 0.21 | $ (1.48) | $ 0.90 | $ 0.39 | $ 0.82 |
| Distributions to shareowners: | | | | | |
| Net investment income | $ (0.35) | $ (0.15) | $ (0.43) | $ (0.38) | $ (0.30) |
| Net realized gain | — | (0.53) | — | — | — |
| Tax return of capital | — | (0.17) | — | — | (0.04) |
| Total distributions | $ (0.35) | $ (0.85) | $ (0.43) | $ (0.38) | $ (0.34) |
| Net increase (decrease) in net asset value | $ (0.14) | $ (2.33) | $ 0.47 | $ 0.01 | $ 0.48 |
| Net asset value, end of period | $ 8.91 | $ 9.05 | $ 11.38 | $ 10.91 | $ 10.90 |
| Total return (b) | 2.28%(c) | (13.85)% | 8.37% | 3.71% | 8.09% |
| Ratio of net expenses to average net assets | 0.69% | 0.69% | 0.74% | 0.74% | 0.73% |
| Ratio of net investment income (loss) to average net assets | 5.28% | 3.77% | 3.44% | 3.91% | 3.75% |
| Portfolio turnover rate | 51% | 56% | 67% | 69% | 53% |
| Net assets, end of period (in thousands) | $2,099,995 | $2,579,954 | $3,204,878 | $2,896,168 | $3,010,817 |
| Ratios with no waiver of fees and assumption of expenses by the Adviser and no reduction for fees paid indirectly: | | | | | |
| Total expenses to average net assets | 0.74% | 0.71% | 0.74% | 0.74% | 0.73% |
| Net investment income (loss) to average net assets | 5.23% | 3.75% | 3.44% | 3.91% | 3.75% |
| (a) | The per-share data presented above is based on the average shares outstanding for the period presented. |
| (b) | Assumes initial investment at net asset value at the beginning of each period, reinvestment of all distributions and the complete redemption of the investment at net asset value at the end of each period. |
| (c) | For the year ended September 30, 2023, the Fund's total return includes a reimbursement by the Adviser (see Notes to the Financial Statements-Note 1.B). The impact on Class Y's total return was less than 0.005%. |
The accompanying notes are an integral part of these financial statements.
Pioneer Strategic Income Fund | Annual Report | 9/30/23105
Notes to Financial Statements | 9/30/23
1. Organization and Significant Accounting Policies
Pioneer Strategic Income Fund (the “Fund”) is one of five portfolios comprising Pioneer Series Trust XIV (formerly known as Pioneer Strategic Income Fund), a Delaware statutory trust. The Fund is registered under the Investment Company Act of 1940 (the "1940 Act") as a diversified, open-end management investment company. The investment objective of the Fund is to produce a high level of current income.
The Fund offers five classes of shares designated as Class A, Class C, Class K, Class R and Class Y shares. Each class of shares represents an interest in the same portfolio of investments of the Fund and has identical rights (based on relative net asset values) to assets and liquidation proceeds. Share classes can bear different rates of class-specific fees and expenses, such as transfer agent and distribution fees. Differences in class-specific fees and expenses will result in differences in net investment income and, therefore, the payment of different dividends from net investment income earned by each class. The Amended and Restated Declaration of Trust of the Trust gives the Board of Trustees the flexibility to specify either per-share voting or dollar-weighted voting when submitting matters for shareowner approval. Under per-share voting, each share of a class of the Fund is entitled to one vote. Under dollar-weighted voting, a shareowner’s voting power is determined not by the number of shares owned, but by the dollar value of the shares on the record date. Each share class has exclusive voting rights with respect to matters affecting only that class, including with respect to the distribution plan for that class. There is no distribution plan for Class K or Class Y shares.
Amundi Asset Management US, Inc., an indirect, wholly owned subsidiary of Amundi and Amundi’s wholly owned subsidiary, Amundi USA, Inc., serves as the Fund’s investment adviser (the “Adviser”). Amundi Distributor US, Inc., an affiliate of the Adviser, serves as the Fund’s distributor (the “Distributor”).
In March 2020, FASB issued an Accounting Standard Update, ASU 2020-04, Reference Rate Reform (Topic 848) — Facilitation of the Effects of Reference Rate Reform on Financial Reporting (“ASU 2020-04”), which provides optional, temporary relief with respect to the financial reporting of contracts subject to certain types of modifications due to the planned discontinuation of the London Interbank Offered Rate (“LIBOR”) and other LIBOR-based reference rates at the end of 2021. The temporary relief provided by ASU 2020-04 is effective for certain reference rate-related contract modifications that occur during the period from March 12, 2020
106Pioneer Strategic Income Fund | Annual Report | 9/30/23
through December 31, 2023. Management is evaluating the impact of ASU 2020-04 on the Fund's investments, derivatives, debt and other contracts, if applicable, that will undergo reference rate-related modifications as a result of the reference rate reform.
The Fund is required to comply with Rule 18f-4 under the 1940 Act, which governs the use of derivatives by registered investment companies. Rule 18f-4 permits funds to enter into derivatives transactions (as defined in Rule 18f-4) and certain other transactions notwithstanding the restrictions on the issuance of “senior securities” under Section 18 of the 1940 Act. In accordance with Rule 18f-4, the Fund has established and maintains a comprehensive derivatives risk management program, has appointed a derivatives risk manager and complies with a relative or absolute limit on fund leverage risk calculated based on value-at-risk ("VaR").
The Fund is an investment company and follows investment company accounting and reporting guidance under U.S. Generally Accepted Accounting Principles (“U.S. GAAP”). U.S. GAAP requires the management of the Fund to make estimates and assumptions that affect the reported amounts of assets and liabilities, the disclosure of contingent assets and liabilities at the date of the financial statements, and the reported amounts of income, expenses and gain or loss on investments during the reporting period. Actual results could differ from those estimates.
The following is a summary of significant accounting policies followed by the Fund in the preparation of its financial statements:
| A. | Security Valuation |
| | The net asset value of the Fund is computed once daily, on each day the New York Stock Exchange (“NYSE”) is open, as of the close of regular trading on the NYSE. |
| | Fixed-income securities are valued by using prices supplied by independent pricing services, which consider such factors as market prices, market events, quotations from one or more brokers, Treasury spreads, yields, maturities and ratings, or may use a pricing matrix or other fair value methods or techniques to provide an estimated value of the security or instrument. A pricing matrix is a means of valuing a debt security on the basis of current market prices for other debt securities, historical trading patterns in the market for fixed-income securities and/or other factors. Non-U.S. debt securities that are listed on an exchange will be valued at the bid price obtained from an independent third party pricing service. When independent third party pricing services are unable to supply prices, or when prices or market quotations |
Pioneer Strategic Income Fund | Annual Report | 9/30/23107
| | are considered to be unreliable, the value of that security may be determined using quotations from one or more broker-dealers. |
| | Loan interests are valued at the mean between the last available bid and asked prices from one or more brokers or dealers as obtained from Loan Pricing Corporation, an independent third party pricing service. If price information is not available from Loan Pricing Corporation, or if the price information is deemed to be unreliable, price information will be obtained from an alternative loan interest pricing service. If no reliable price quotes are available from either the primary or alternative pricing service, broker quotes will be solicited. |
| | Event-linked bonds are valued at the bid price obtained from an independent third party pricing service. Other insurance-linked securities (including reinsurance sidecars, collateralized reinsurance and industry loss warranties) may be valued at the bid price obtained from an independent pricing service, or through a third party using a pricing matrix, insurance industry valuation models, or other fair value methods or techniques to provide an estimated value of the instrument. |
| | Equity securities that have traded on an exchange are valued by using the last sale price on the principal exchange where they are traded. Equity securities that have not traded on the date of valuation, or securities for which sale prices are not available, generally are valued using the mean between the last bid and asked prices or, if both last bid and asked prices are not available, at the last quoted bid price. Last sale and bid and asked prices are provided by independent third party pricing services. In the case of equity securities not traded on an exchange, prices are typically determined by independent third party pricing services using a variety of techniques and methods. |
| | The value of foreign securities is translated into U.S. dollars based on foreign currency exchange rate quotations supplied by a third party pricing source. Trading in non-U.S. equity securities is substantially completed each day at various times prior to the close of the NYSE. The values of such securities used in computing the net asset value of the Fund's shares are determined as of such times. The Adviser may use a fair value model developed by an independent pricing service to value non-U.S. equity securities. |
| | Options contracts are generally valued at the mean between the last bid and ask prices on the principal exchange where they are traded. Over-the-counter (“OTC”) options and options on swaps (“swaptions”) are valued using prices supplied by independent pricing services, which consider such factors as market prices, market events, quotations from one or more brokers, Treasury spreads, yields, maturities and ratings, or |
108Pioneer Strategic Income Fund | Annual Report | 9/30/23
| | may use a pricing matrix or other fair value methods or techniques to provide an estimated value of the security or instrument. |
| | Forward foreign currency exchange contracts are valued daily using the foreign exchange rate or, for longer term forward contract positions, the spot currency rate and the forward points on a daily basis, in each case provided by a third party pricing service. Contracts whose forward settlement date falls between two quoted days are valued by interpolation. |
| | Futures contracts are generally valued at the closing settlement price established by the exchange on which they are traded. |
| | Swap contracts, including interest rate swaps, caps and floors (other than centrally cleared swap contracts), are valued at the dealer quotations obtained from reputable International Swap Dealers Association members. Centrally cleared swaps are valued at the daily settlement price provided by the central clearing counterparty. |
| | Shares of open-end registered investment companies (including money market mutual funds) are valued at such funds’ net asset value. |
| | Securities or loan interests for which independent pricing services or broker-dealers are unable to supply prices or for which market prices and/or quotations are not readily available or are considered to be unreliable are valued by a fair valuation team comprised of certain personnel of the Adviser. The Adviser is designated as the valuation designee for the Fund pursuant to Rule 2a-5 under the 1940 Act. The Adviser’s fair valuation team is responsible for monitoring developments that may impact fair valued securities. |
| | Inputs used when applying fair value methods to value a security may include credit ratings, the financial condition of the company, current market conditions and comparable securities. The Adviser may use fair value methods if it is determined that a significant event has occurred after the close of the exchange or market on which the security trades and prior to the determination of the Fund's net asset value. Examples of a significant event might include political or economic news, corporate restructurings, natural disasters, terrorist activity or trading halts. Thus, the valuation of the Fund's securities may differ significantly from exchange prices, and such differences could be material. |
| B. | Investment Income and Transactions |
| | Dividend income is recorded on the ex-dividend date, except that certain dividends from foreign securities where the ex-dividend date may have |
Pioneer Strategic Income Fund | Annual Report | 9/30/23109
| | passed are recorded as soon as the Fund becomes aware of the ex-dividend data in the exercise of reasonable diligence. |
| | Interest income, including interest on income-bearing cash accounts, is recorded on the accrual basis. Dividend and interest income are reported net of unrecoverable foreign taxes withheld at the applicable country rates and net of income accrued on defaulted securities. |
| | Interest and dividend income payable by delivery of additional shares is reclassified as PIK (payment-in-kind) income upon receipt and is included in interest and dividend income, respectively. |
| | Principal amounts of mortgage-backed securities are adjusted for monthly paydowns. Premiums and discounts related to certain mortgage-backed securities are amortized or accreted in proportion to the monthly paydowns. All discounts/premiums on purchase prices of debt securities are accreted/amortized for financial reporting purposes over the life of the respective securities, and such accretion/amortization is included in interest income. |
| | Security transactions are recorded as of trade date. Gains and losses on sales of investments are calculated on the identified cost method for both financial reporting and federal income tax purposes. |
| | During the fiscal year ended September 30, 2023, the Fund realized a loss of $808,575 due to an operational error. The Adviser voluntarily reimbursed the Fund for this loss, which is reflected on the Statement of Operations as Reimbursement by the Adviser. |
| C. | Foreign Currency Translation |
| | The books and records of the Fund are maintained in U.S. dollars. Amounts denominated in foreign currencies are translated into U.S. dollars using current exchange rates. |
| | Net realized gains and losses on foreign currency transactions, if any, represent, among other things, the net realized gains and losses on foreign currency exchange contracts, disposition of foreign currencies and the difference between the amount of income accrued and the U.S. dollars actually received. Further, the effects of changes in foreign currency exchange rates on investments are not segregated on the Statement of Operations from the effects of changes in the market prices of those securities, but are included with the net realized and unrealized gain or loss on investments. |
110Pioneer Strategic Income Fund | Annual Report | 9/30/23
| D. | Federal Income Taxes |
| | It is the Fund's policy to comply with the requirements of the Internal Revenue Code applicable to regulated investment companies and to distribute all of its net taxable income and net realized capital gains, if any, to its shareowners. Therefore, no provision for federal income taxes is required. As of September 30, 2023, the Fund did not accrue any interest or penalties with respect to uncertain tax positions, which, if applicable, would be recorded as an income tax expense on the Statement of Operations. Tax returns filed within the prior three years remain subject to examination by federal and state tax authorities. |
| | In determining the daily net asset value, the Fund estimates the reserve for such taxes, if any, associated with investments in certain countries. The estimated reserve for the capital gains is based on the net unrealized appreciation on certain portfolio securities, the holding period of such securities and the related tax rates, tax loss carryforward (if applicable) and other such factors. As of September 30, 2023, the Fund had accrued $91,631 in reserve for repatriation taxes related to capital gains. |
| | The amount and character of income and capital gain distributions to shareowners are determined in accordance with federal income tax rules, which may differ from U.S. GAAP. Distributions in excess of net investment income or net realized gains are temporary over distributions for financial statement purposes resulting from differences in the recognition or classification of income or distributions for financial statement and tax purposes. Capital accounts within the financial statements are adjusted for permanent book/tax differences to reflect tax character, but are not adjusted for temporary differences. |
| | A portion of the dividend income recorded by the Fund is from distributions by publicly traded real estate investment trusts (“REITs”), and such distributions for tax purposes may also consist of capital gains and return of capital. The actual return of capital and capital gains portions of such distributions will be determined by formal notifications from the REITs subsequent to the calendar year-end. Distributions received from the REITs that are determined to be a return of capital are recorded by the Fund as a reduction of the cost basis of the securities held and those determined to be capital gain are reflected as such on the Statement of Operations. |
| | At September 30, 2023, the Fund reclassified $1,574,026 to decrease distributable earnings and $1,574,026 to increase paid-in capital to reflect permanent book/tax differences. These adjustments have no impact on net assets or the results of operations. |
Pioneer Strategic Income Fund | Annual Report | 9/30/23111
| | At September 30, 2023, the Fund was permitted to carry forward indefinitely $121,840,659 of short-term losses and $166,164,139 of long-term losses. |
| | The tax character of distributions paid during the years ended September 30, 2023 and September 30, 2022, was as follows: |
| | 2023 | 2022 |
| Distributions paid from: | | |
| Ordinary income | $129,538,491 | $175,648,822 |
| Long-term capital gains | — | 108,702,546 |
| Tax return of capital | — | 72,328,898 |
| Total | $129,538,491 | $ 356,680,266 |
The following shows the components of distributable earnings (losses) on a federal income tax basis at September 30, 2023:
| | 2023 |
| Distributable earnings/(losses): | |
| Undistributed ordinary income | $ 5,293,645 |
| Capital loss carryforward | (288,004,798) |
| Current year dividend payable | (2,461,964) |
| Net unrealized depreciation | (468,042,539) |
| Total | $(753,215,656) |
The difference between book-basis and tax-basis net unrealized depreciation is attributable to the tax deferral of losses on wash sales, realization for tax purposes of unrealized gains on investments in passive foreign investment companies, the book/tax differences in the adjustments relating to insurance-linked securities, the tax treatment of premium and amortization, accrual of income on securities in default, and the mark to market of futures contracts and swaps.
| E. | Fund Shares |
| | The Fund records sales and repurchases of its shares as of trade date. The Distributor earned $17,792 in underwriting commissions on the sale of Class A shares during the year ended September 30, 2023. |
| F. | Class Allocations |
| | Income, common expenses and realized and unrealized gains and losses are calculated at the Fund level and allocated daily to each class of shares based on its respective percentage of adjusted net assets at the beginning of the day. |
| | Distribution fees are calculated based on the average daily net asset value attributable to Class A, Class C and Class R shares of the Fund, respectively (see Note 5). Class K and Class Y shares do not pay |
112Pioneer Strategic Income Fund | Annual Report | 9/30/23
| | distribution fees. All expenses and fees paid to the Fund's transfer agent for its services are allocated among the classes of shares based on the number of accounts in each class and the ratable allocation of related out-of-pocket expenses (see Note 4). |
| | The Fund declares as daily dividends substantially all of its net investment income. All dividends are paid on a monthly basis. Short-term capital gain distributions, if any, may be declared with the daily dividends. Distributions to shareowners are recorded as of the ex-dividend date. Distributions paid by the Fund with respect to each class of shares are calculated in the same manner and at the same time, except that net investment income dividends to Class A, Class C, Class K, Class R and Class Y shares can reflect different transfer agent and distribution expense rates. |
| G. | Risks |
| | The value of securities held by the Fund may go up or down, sometimes rapidly or unpredictably, due to general market conditions, such as real or perceived adverse economic, political or regulatory conditions, recessions, the spread of infectious illness or other public health issues, inflation, changes in interest rates, armed conflict including Russia's military invasion of Ukraine, sanctions against Russia, other nations or individuals or companies and possible countermeasures, lack of liquidity in the bond markets or adverse investor sentiment. In the past several years, financial markets have experienced increased volatility, depressed valuations, decreased liquidity and heightened uncertainty. These conditions may continue, recur, worsen or spread. Inflation and interest rates have increased and may rise further. These circumstances could adversely affect the value and liquidity of the Fund's investments and negatively impact the Fund's performance. |
| | The long-term impact of the COVID-19 pandemic and its subsequent variants on economies, markets, industries and individual issuers, are not known. Some sectors of the economy and individual issuers have experienced or may experience particularly large losses. Periods of extreme volatility in the financial markets, reduced liquidity of many instruments, increased government debt, inflation, and disruptions to supply chains, consumer demand and employee availability, may continue for some time. Following Russia's invasion of Ukraine, Russian securities lost all, or nearly all, their market value. Other securities or markets could be similarly affected by past or future political, geopolitical or other events or conditions. |
| | Governments and central banks, including the U.S. Federal Reserve, have taken extraordinary and unprecedented actions to support local |
Pioneer Strategic Income Fund | Annual Report | 9/30/23113
| | and global economies and the financial markets. These actions have resulted in significant expansion of public debt, including in the U.S. The consequences of high public debt, including its future impact on the economy and securities markets, may not be known for some time. |
| | The U.S. and other countries are periodically involved in disputes over trade and other matters, which may result in tariffs, investment restrictions and adverse impacts on affected companies and securities. For example, the U.S. has imposed tariffs and other trade barriers on Chinese exports, has restricted sales of certain categories of goods to China, and has established barriers to investments in China. Trade disputes may adversely affect the economies of the U.S. and its trading partners, as well as companies directly or indirectly affected and financial markets generally. If the political climate between the U.S. and China does not improve or continues to deteriorate, if China were to attempt unification of Taiwan by force, or if other geopolitical conflicts develop or get worse, economies, markets and individual securities may be severely affected both regionally and globally, and the value of the Fund's assets may go down. |
| | At times, the Fund’s investments may represent industries or industry sectors that are interrelated or have common risks, making the Fund more susceptible to any economic, political, or regulatory developments or other risks affecting those industries and sectors. |
| | The Fund may invest in mortgage-related and asset-backed securities. The value of mortgage-related and asset-backed securities will be influenced by factors affecting the assets underlying such securities. As a result, during periods of declining asset value, difficult or frozen credit markets, swings in interest rates, or deteriorating economic conditions, mortgage-related and asset-backed securities may decline in value, face valuation difficulties, become more volatile and/or become illiquid. Mortgage-backed securities tend to be more sensitive to changes in interest rate than other types of debt securities. These securities are also subject to prepayment and extension risks. Some of these securities may receive little or no collateral protection from the underlying assets and are thus subject to the risk of default. The risk of such defaults is generally higher in the case of mortgage-backed investments offered by non-governmental issuers and those that include so-called “sub-prime” mortgages. The structure of some of these securities may be complex and there may be less available information than for other types of debt securities. Upon the occurrence of certain triggering events or defaults, the Fund may become the holder of underlying assets at a time when those assets may be difficult to sell or may be sold only at a loss. |
114Pioneer Strategic Income Fund | Annual Report | 9/30/23
| | The Fund may invest in credit risk transfer securities. Credit risk transfer securities are unguaranteed and unsecured debt securities issued by government sponsored enterprises and therefore are not directly linked to or backed by the underlying mortgage loans. As a result, in the event that a government sponsored enterprise fails to pay principal or interest on its credit risk transfer securities or goes through a bankruptcy, insolvency or similar proceeding, holders of such credit risk transfer securities have no direct recourse to the underlying mortgage loans and will generally receive recovery on par with other unsecured note holders in such a scenario. The risks associated with an investment in credit risk transfer securities are different than the risks associated with an investment in mortgage-backed securities issued by Fannie Mae and Freddie Mac, or other government sponsored enterprise or issued by a private issuer, because some or all of the mortgage default or credit risk associated with the underlying mortgage loans is transferred to investors. As a result, investors in these securities could lose some or all of their investment in these securities if the underlying mortgage loans default. |
| | The Fund invests in below-investment-grade (high-yield) debt securities and preferred stocks. Some of these high-yield securities may be convertible into equity securities of the issuer. Debt securities rated below-investment-grade are commonly referred to as “junk bonds” and are considered speculative with respect to the issuer’s capacity to pay interest and repay principal. These securities involve greater risk of loss, are subject to greater price volatility, and may be less liquid and more difficult to value, especially during periods of economic uncertainty or change, than higher rated debt securities. |
| | The market prices of the Fund's fixed income securities may fluctuate significantly when interest rates change. The value of your investment will generally go down when interest rates rise. A rise in rates tends to have a greater impact on the prices of longer term or duration securities. For example, if interest rates increase by 1%, the value of a Fund's portfolio with a portfolio duration of ten years would be expected to decrease by 10%, all other things being equal. In recent years interest rates and credit spreads in the U.S. have been at historic lows. The U.S. Federal Reserve has raised certain interest rates, and interest rates may continue to go up. A general rise in interest rates could adversely affect the price and liquidity of fixed income securities. The maturity of a security may be significantly longer than its effective duration. A security's maturity and other features may be more relevant than its effective duration in determining the security's sensitivity to other factors affecting the issuer or markets generally, such as changes in |
Pioneer Strategic Income Fund | Annual Report | 9/30/23115
| | credit quality or in the yield premium that the market may establish for certain types of securities (sometimes called "credit spread"). In general, the longer its maturity the more a security may be susceptible to these factors. When the credit spread for a fixed income security goes up, or "widens," the value of the security will generally go down. |
| | If an issuer or guarantor of a security held by the Fund or a counterparty to a financial contract with the Fund defaults on its obligation to pay principal and/or interest, has its credit rating downgraded or is perceived to be less creditworthy, or the credit quality or value of any underlying assets declines, the value of your investment will typically decline. Changes in actual or perceived creditworthiness may occur quickly. The Fund could be delayed or hindered in its enforcement of rights against an issuer, guarantor or counterparty. |
| | The Fund’s investments in foreign markets and countries with limited developing markets may subject the Fund to a greater degree of risk than investments in a developed market. These risks include disruptive political or economic conditions, military conflicts and sanctions, terrorism, sustained economic downturns, financial instability, less liquid trading markets, extreme price volatility, currency risks, reduction of government or central bank support, inadequate accounting standards, tariffs, tax disputes or other tax burdens, nationalization or expropriation of assets and the imposition of adverse governmental laws, arbitrary application of laws and regulations or lack of rule of law and investment and repatriation restrictions. Lack of information and less market regulation also may affect the value of these securities. Withholding and other non-U.S. taxes may decrease the Fund’s return. Non-U.S. issuers may be located in parts of the world that have historically been prone to natural disasters. Investing in depositary receipts is subject to many of the same risks as investing directly in non-U.S. issuers. Depositary receipts may involve higher expenses and may trade at a discount (or premium) to the underlying security. |
| | Russia launched a large-scale invasion of Ukraine on February 24, 2022. In response to the military action by Russia, various countries, including the U.S., the United Kingdom, and European Union issued broad-ranging economic sanctions against Russia and Belarus and certain companies and individuals. Since then, Russian securities have lost all, or nearly all, their market value, and many other issuers, securities and markets have been adversely affected. The United States and other countries may impose sanctions on other countries, companies and individuals in light of Russia’s military invasion. The extent and duration of the military action or future escalation of such hostilities, the extent and impact of existing and future sanctions, market disruptions and |
116Pioneer Strategic Income Fund | Annual Report | 9/30/23
| | volatility, and the result of any diplomatic negotiations cannot be predicted. These and any related events could have a significant impact on the value and liquidity of certain Fund investments, on Fund performance and the value of an investment in the Fund, particularly with respect to securities and commodities, such as oil, natural gas and food commodities, as well as other sectors with exposure to Russian issuers or issuers in other countries affected by the invasion, and are likely to have collateral impacts on market sectors globally. |
| | The Fund's investments, payment obligations and financing terms may be based on floating rates, such as LIBOR (London Interbank Offered Rate) or SOFR (Secured Overnight Financing Rate). ICE Benchmark Administration, the administrator of LIBOR, has ceased publication of most LIBOR settings on a representative basis. Actions by regulators have resulted in the establishment of alternative reference rates to LIBOR in most major currencies. In the U.S., a common benchmark replacement is based on the SOFR published by the Federal Reserve Bank of New York, including certain spread adjustments and benchmark replacement conforming changes, although other benchmark replacements (without or without spread adjustments) may be used in certain transactions. The impact of the transition from LIBOR on the Fund's transactions and financial markets generally cannot yet be determined. The transition away from LIBOR may lead to increased volatility and illiquidity in markets for instruments that have relied on LIBOR and may adversely affect the Fund's performance. |
| | With the increased use of technologies such as the Internet to conduct business, the Fund is susceptible to operational, information security and related risks. While the Fund’s Adviser has established business continuity plans in the event of, and risk management systems to prevent, limit or mitigate, such cyber-attacks, there are inherent limitations in such plans and systems, including the possibility that certain risks have not been identified. Furthermore, the Fund cannot control the cybersecurity plans and systems put in place by service providers to the Fund such as the Fund's custodian and accounting agent, and the Fund’s transfer agent. In addition, many beneficial owners of Fund shares hold them through accounts at broker-dealers, retirement platforms and other financial market participants over which neither the Fund nor the Adviser exercises control. Each of these may in turn rely on service providers to them, which are also subject to the risk of cyber-attacks. Cybersecurity failures or breaches at the Adviser or the Fund’s service providers or intermediaries have the ability to cause disruptions and impact business operations, potentially resulting in financial losses, interference with the Fund’s ability to calculate its net |
Pioneer Strategic Income Fund | Annual Report | 9/30/23117
| | asset value, impediments to trading, the inability of Fund shareowners to effect share purchases, redemptions or exchanges or receive distributions, loss of or unauthorized access to private shareowner information and violations of applicable privacy and other laws, regulatory fines, penalties, reputational damage, or additional compliance costs. Such costs and losses may not be covered under any insurance. In addition, maintaining vigilance against cyber-attacks may involve substantial costs over time, and system enhancements may themselves be subject to cyber-attacks. |
| | The Fund’s prospectus contains unaudited information regarding the Fund’s principal risks. Please refer to that document when considering the Fund’s principal risks. |
| H. | Restricted Securities |
| | Restricted Securities are subject to legal or contractual restrictions on resale. Restricted securities generally are resold in transactions exempt from registration under the Securities Act of 1933. Private placement securities are generally considered to be restricted except for those securities traded between qualified institutional investors under the provisions of Rule 144A of the Securities Act of 1933. |
| | Disposal of restricted investments may involve negotiations and expenses, and prompt sale at an acceptable price may be difficult to achieve. Restricted investments held by the Fund at September 30, 2023 are listed in the Schedule of Investments. |
| I. | Insurance-Linked Securities (“ILS”) |
| | The Fund invests in ILS. The Fund could lose a portion or all of the principal it has invested in an ILS, and the right to additional interest or dividend payments with respect to the security, upon the occurrence of one or more trigger events, as defined within the terms of an insurance-linked security. Trigger events, generally, are hurricanes, earthquakes, or other natural events of a specific size or magnitude that occur in a designated geographic region during a specified time period, and/or that involve losses or other metrics that exceed a specific amount. There is no way to accurately predict whether a trigger event will occur, and accordingly, ILS carry significant risk. The Fund is entitled to receive principal, and interest and/or dividend payments so long as no trigger event occurs of the description and magnitude specified by the instrument. In addition to the specified trigger events, ILS may expose the Fund to other risks, including but not limited to issuer (credit) default, adverse regulatory or jurisdictional interpretations and adverse tax consequences. |
118Pioneer Strategic Income Fund | Annual Report | 9/30/23
| | The Fund’s investments in ILS may include event-linked bonds. ILS also may include special purpose vehicles (“SPVs”) or similar instruments structured to comprise a portion of a reinsurer’s catastrophe-oriented business, known as quota share instruments (sometimes referred to as reinsurance sidecars), or to provide reinsurance relating to specific risks to insurance or reinsurance companies through a collateralized instrument, known as collateralized reinsurance. Structured reinsurance investments also may include industry loss warranties (“ILWs”). A traditional ILW takes the form of a bilateral reinsurance contract, but there are also products that take the form of derivatives, collateralized structures, or exchange-traded instruments. |
| | Where the ILS are based on the performance of underlying reinsurance contracts, the Fund has limited transparency into the individual underlying contracts, and therefore must rely upon the risk assessment and sound underwriting practices of the issuer. Accordingly, it may be more difficult for the Adviser to fully evaluate the underlying risk profile of the Fund's structured reinsurance investments, and therefore the Fund's assets are placed at greater risk of loss than if the Adviser had more complete information. Structured reinsurance instruments generally will be considered illiquid securities by the Fund. These securities may be difficult to purchase, sell or unwind. Illiquid securities also may be difficult to value. If the Fund is forced to sell an illiquid asset, the Fund may be forced to sell at a loss. |
| J. | Purchased Options |
| | The Fund may purchase put and call options to seek to increase total return. Purchased call and put options entitle the Fund to buy and sell a specified number of shares or units of a particular security, currency or index at a specified price at a specific date or within a specific period of time. Upon the purchase of a call or put option, the premium paid by the Fund is included on the Statement of Assets and Liabilities as an investment. All premiums are marked-to-market daily, and any unrealized appreciation or depreciation is recorded on the Fund’s Statement of Operations. As the purchaser of an index option, the Fund has the right to receive a cash payment equal to any depreciation in the value of the index below the strike price of the option (in the case of a put) or equal to any appreciation in the value of the index over the strike price of the option (in the case of a call) as of the valuation date of the option. Premiums paid for purchased call and put options which have expired are treated as realized losses on investments on the Statement of Operations. Upon the exercise or closing of a purchased put option, the premium is offset against the proceeds on the sale of the underlying security or financial instrument in order to determine the realized gain |
Pioneer Strategic Income Fund | Annual Report | 9/30/23119
| | or loss on investments. Upon the exercise or closing of a purchased call option, the premium is added to the cost of the security or financial instrument. The risk associated with purchasing options is limited to the premium originally paid. |
| | The average market value of purchased options contracts open during the year ended September 30, 2023 was $2,958,538. Open purchased options contracts at September 30, 2023 are listed in the Schedule of Investments. |
| K. | Option Writing |
| | The Fund may write put and covered call options to seek to increase total return. When an option is written, the Fund receives a premium and becomes obligated to purchase or sell the underlying security at a fixed price, upon the exercise of the option. When the Fund writes an option, an amount equal to the premium received by the Fund is recorded as “Written options outstanding” on the Statement of Assets and Liabilities and is subsequently adjusted to the current value of the option written. Premiums received from writing options that expire unexercised are treated by the Fund on the expiration date as realized gains from investments on the Statement of Operations. The difference between the premium and the amount paid on effecting a closing purchase transaction, including brokerage commissions, is also treated as a realized gain on the Statement of Operations, or, if the premium is less than the amount paid for the closing purchase transaction, as a realized loss on the Statement of Operations. If a call option is exercised, the premium is added to the proceeds from the sale of the underlying security in determining whether the Fund has realized a gain or loss. The Fund as writer of an option bears the market risk of an unfavorable change in the price of the security underlying the written option. |
| | The average market value of written options for the year ended September 30, 2023 was $(656,259). Open written options contracts at September 30, 2023 are listed in the Schedule of Investments. |
| L. | Forward Foreign Currency Exchange Contracts |
| | The Fund may enter into forward foreign currency exchange contracts ("contracts") for the purchase or sale of a specific foreign currency at a fixed price on a future date. All contracts are marked-to-market daily at the applicable exchange rates, and any resulting unrealized appreciation or depreciation is recorded in the Fund's financial statements. The Fund records realized gains and losses at the time a contract is offset by entry into a closing transaction or extinguished by delivery of the currency. Risks may arise upon entering into these contracts from the potential |
120Pioneer Strategic Income Fund | Annual Report | 9/30/23
| | inability of counterparties to meet the terms of the contract and from unanticipated movements in the value of foreign currencies relative to the U.S. dollar (see Note 8). |
| | During the year ended September 30, 2023, the Fund had entered into various forward foreign currency exchange contracts that obligated the Fund to deliver or take delivery of currencies at specified future maturity dates. Alternatively, prior to the settlement date of a forward foreign currency exchange contract, the Fund may close out such contract by entering into an offsetting contract. |
| | The average market value of forward foreign currency exchange contracts open during the year ended September 30, 2023 was $291,738,374 and $285,502,506 for buys and sells, respectively. Open forward foreign currency exchange contracts outstanding at September 30, 2023 are listed in the Schedule of Investments. |
| M. | TBA Purchase and Sales Commitments |
| | The Fund may enter into to-be-announced (TBA) purchase or sale commitments (collectively, TBA transactions), pursuant to which it agrees to purchase or sell, respectively, mortgage-backed securities for a fixed unit price, with payment and delivery at a scheduled future date beyond the customary settlement period for such securities. With TBA transactions, the particular securities to be received or delivered by the Fund are not identified at the trade date; however, the securities must meet specified terms, including issuer, rate, and mortgage term, and be within industry-accepted “good delivery” standards. The Fund may enter into TBA transactions with the intention of taking possession of or relinquishing the underlying securities, may elect to extend the settlement by “rolling” the transaction, and/or may use TBA transactions to gain or reduce interim exposure to underlying securities. Until settlement, the Fund maintains liquid assets sufficient to settle its commitment to purchase a TBA or, in the case of a sale commitment, the Fund maintains an entitlement to the security to be sold. |
| | To mitigate counterparty risk, the Fund has entered into agreements with TBA counterparties that provide for collateral and the right to offset amounts due to or from those counterparties under specified conditions. Subject to minimum transfer amounts, collateral requirements are determined and transfers made based on the net aggregate unrealized gain or loss on all TBA commitments with a particular counterparty. At any time, the Fund’s risk of loss from a particular counterparty related to its TBA commitments is the aggregate unrealized gain on appreciated TBAs in excess of unrealized loss on depreciated TBAs and collateral received, if any, from such |
Pioneer Strategic Income Fund | Annual Report | 9/30/23121
| | counterparty. As of September 30, 2023, no collateral was pledged by the Fund. Collateral received from counterparties totaled $62,174 for TBAs. |
| N. | Futures Contracts |
| | The Fund may enter into futures transactions in order to attempt to hedge against changes in interest rates, securities prices and currency exchange rates or to seek to increase total return. Futures contracts are types of derivatives. |
| | All futures contracts entered into by the Fund are traded on a futures exchange. Upon entering into a futures contract, the Fund is required to deposit with a broker an amount of cash or securities equal to the minimum "initial margin" requirements of the associated futures exchange. The amount of cash deposited with the broker as collateral at September 30, 2023 is recorded as "Futures collateral" on the Statement of Assets and Liabilities. |
| | Subsequent payments for futures contracts ("variation margin") are paid or received by the Fund, depending on the daily fluctuation in the value of the contracts, and are recorded by the Fund as unrealized appreciation or depreciation. Cash received from or paid to the broker related to previous margin movement is held in a segregated account at the broker and is recorded as either "Due from broker for futures" or "Due to broker for futures" on the Statement of Assets and Liabilities. When the contract is closed, the Fund realizes a gain or loss equal to the difference between the opening and closing value of the contract as well as any fluctuation in foreign currency exchange rates where applicable. Futures contracts are subject to market risk, interest rate risk and currency exchange rate risk. Changes in value of the contracts may not directly correlate to the changes in value of the underlying securities. With futures, there is reduced counterparty credit risk to the Fund since futures are exchange-traded and the exchange's clearinghouse, as counterparty to all exchange-traded futures, guarantees the futures against default. |
| | The average notional values of futures contracts long position and futures contracts short position during the year ended September 30, 2023 were $785,377,555 and $130,473,230, respectively. Open futures contracts outstanding at September 30, 2023 are listed in the Schedule of Investments. |
122Pioneer Strategic Income Fund | Annual Report | 9/30/23
| O. | Credit Default Swap Contracts |
| | A credit default swap is a contract between a buyer of protection and a seller of protection against a pre-defined credit event or an underlying reference obligation, which may be a single security or a basket or index of securities. The Fund may buy or sell credit default swap contracts to seek to increase the Fund's income, or to attempt to hedge the risk of default on portfolio securities. A credit default swap index is used to hedge risk or take a position on a basket of credit entities or indices. |
| | As a seller of protection, the Fund would be required to pay the notional (or other agreed-upon) value of the referenced debt obligation to the counterparty in the event of a default by a U.S. or foreign corporate issuer of a debt obligation, which would likely result in a loss to the Fund. In return, the Fund would receive from the counterparty a periodic stream of payments during the term of the contract, provided that no event of default occurred. The maximum exposure of loss to the seller would be the notional value of the credit default swaps outstanding. If no default occurs, the Fund would keep the stream of payments and would have no payment obligation. The Fund may also buy credit default swap contracts in order to hedge against the risk of default of debt securities, in which case the Fund would function as the counterparty referenced above. |
| | As a buyer of protection, the Fund makes an upfront or periodic payment to the protection seller in exchange for the right to receive a contingent payment. An upfront payment made by the Fund, as the protection buyer, is recorded within the "Swap contracts, at value" line item on the Statement of Assets and Liabilities. Periodic payments received or paid by the Fund are recorded as realized gains or losses on the Statement of Operations. |
| | Credit default swap contracts are marked-to-market daily using valuations supplied by independent sources, and the change in value, if any, is recorded within the "Swap contracts, at value" line item on the Statement of Assets and Liabilities. Payments received or made as a result of a credit event or upon termination of the contract are recognized, net of the appropriate amount of the upfront payment, as realized gains or losses on the Statement of Operations. |
| | Credit default swap contracts involving the sale of protection may involve greater risks than if the Fund had invested in the referenced debt instrument directly. Credit default swap contracts are subject to general market risk, liquidity risk, counterparty risk and credit risk. If the Fund is a protection buyer and no credit event occurs, it will lose its investment. If the Fund is a protection seller and a credit event occurs, |
Pioneer Strategic Income Fund | Annual Report | 9/30/23123
| | the value of the referenced debt instrument received by the Fund, together with the periodic payments received, may be less than the amount the Fund pays to the protection buyer, resulting in a loss to the Fund. In addition, obligations under sell protection credit default swaps may be partially offset by net amounts received from settlement of buy protection credit default swaps entered into by the Fund for the same reference obligation with the same counterparty. |
| | The Fund may invest in credit default swap index products ("CDX"). A CDX is a swap on an index of credit default swaps. CDXs allow an investor to manage credit risk or take a position on a basket of credit entities (such as credit default swaps or commercial mortgage-backed securities) in a more efficient manner than transacting in a single-name credit default swap. If a credit event occurs in one of the underlying companies, the protection is paid out via the delivery of the defaulted bond by the buyer of protection in return for a payment of notional value of the defaulted bond by the seller of protection or it may be settled through a cash settlement between the two parties. The underlying company is then removed from the index. If the Fund holds a long position in a CDX, the Fund would indirectly bear its proportionate share of any expenses paid by a CDX. A fund holding a long position in CDXs typically receives income from principal or interest paid on the underlying securities. By investing in CDXs, the Fund could be exposed to liquidity risk, counterparty risk, credit risk of the issuers of the underlying loan obligations and of the CDX markets, and operational risks. If there is a default by the CDX counterparty, the Fund will have contractual remedies pursuant to the agreements related to the transaction. CDXs also bear the risk that the Fund will not be able to meet its obligation to the counterparty. |
| | Certain swap contracts that are cleared through a central clearinghouse are referred to as centrally cleared swaps. All payments made or received by the Fund are pursuant to a centrally cleared swap contract with the central clearing party rather than the original counterparty. Upon entering into a centrally cleared swap contract, the Fund is required to make an initial margin deposit, either in cash or in securities. The daily change in value on open centrally cleared contracts is recorded as "Variation margin for centrally cleared swap contracts" on the Statement of Assets and Liabilities. Cash received from or paid to the broker related to previous margin movement is held in a segregated account at the broker and is recorded as either "Due from broker for swaps" or "Due to broker for swaps" on the Statement of Assets and Liabilities. The |
124Pioneer Strategic Income Fund | Annual Report | 9/30/23
| | amount of cash deposited with a broker as collateral at September 30, 2023 is recorded as "Swaps collateral" on the Statement of Assets and Liabilities. |
| | The average notional values of credit default swap contracts buy protection and credit default swap contracts sell protection open during the year ended September 30, 2023 were $675,292,100 and $12,252,000, respectively. Open credit default swap contracts at September 30, 2023 are listed in the Schedule of Investments. |
2. Management Agreement
The Adviser manages the Fund’s portfolio. Management fees payable under the Fund’s Investment Management Agreement with the Adviser are calculated daily and paid monthly at the annual rate of 0.60% of the Fund’s average daily net assets up to $1 billion, 0.55% on the next $9 billion and 0.50% on assets over $10 billion. For the year ended September 30, 2023, the effective management fee (excluding waivers and/or reimbursements) was equivalent to 0.56% of the Fund’s average daily net assets.
The Adviser has contractually agreed to limit ordinary operating expenses (ordinary operating expenses means all fund expenses other than taxes, brokerage commissions, acquired fund fees and expenses, and extraordinary expenses, such as litigation) to the extent required to reduce Fund expenses to 0.59% and 0.69% of the average daily net assets attributable to Class K and Class Y shares, respectively. These expense limitations are in effect through February 1, 2025. There can be no assurance that the Adviser will extend the expense limitation agreement for a class of shares beyond the date referred to above. Fees waived and expenses reimbursed during the year ended are reflected on the Statement of Operations.
In addition, under the management and administration agreements, certain other services and costs, including accounting, regulatory reporting and insurance premiums, are paid by the Fund as administrative reimbursements. Reflected on the Statement of Assets and Liabilities is $198,205 in management fees payable to the Adviser at September 30, 2023.
3. Compensation of Officers and Trustees
The Fund pays an annual fee to its Trustees. The Adviser reimburses the Fund for fees paid to the Interested Trustees. Except for the chief compliance officer, the Fund does not pay any salary or other compensation to its officers. The Fund pays a portion of the chief compliance officer's compensation for his services as the Fund's chief compliance officer.
Pioneer Strategic Income Fund | Annual Report | 9/30/23125
Amundi US pays the remaining portion of the chief compliance officer's compensation. For the year ended September 30, 2023, the Fund paid $242,340 in Officers' and Trustees' compensation, which is reflected on the Statement of Operations as Officers' and Trustees' fees. At September 30, 2023, on its Statement of Assets and Liabilities, the Fund had a payable for Trustees' fees of $6,182 and a payable for administrative expenses of $107,679, which includes the payable for Officers' compensation.
4. Transfer Agent
BNY Mellon Investment Servicing (US) Inc. serves as the transfer agent to the Fund at negotiated rates. Transfer agent fees and payables shown on the Statement of Operations and the Statement of Assets and Liabilities, respectively, include sub-transfer agent expenses incurred through the Fund’s omnibus relationship contracts.
In addition, the Fund reimbursed the transfer agent for out-of-pocket expenses incurred by the transfer agent related to shareowner communications activities such as proxy and statement mailings, and outgoing phone calls. For the year ended September 30, 2023, such out-of-pocket expenses by class of shares were as follows:
| Shareowner Communications: | |
| Class A | $ 65,894 |
| Class C | 9,748 |
| Class K | 15,610 |
| Class R | 2,940 |
| Class Y | 155,575 |
| Total | $249,767 |
5. Distribution and Service Plans
The Fund has adopted a distribution plan (the “Plan”) pursuant to Rule 12b-1 of the Investment Company Act of 1940 with respect to its Class A, Class C and Class R shares. Pursuant to the Plan, the Fund pays the Distributor 0.25% of the Fund's average daily net assets attributable to Class A shares as compensation for personal services and/or account maintenance services or distribution services with regard to Class A shares. Pursuant to the Plan, the Fund also pays the Distributor 1.00% of the average daily net assets attributable to Class C shares. The fee for Class C shares consists of a 0.25% service fee and a 0.75% distribution fee paid as compensation for personal services and/or account maintenance services or distribution services with regard to Class C shares. Pursuant to the Plan, the Fund further pays the Distributor 0.50% of the average daily net assets attributable to Class R shares for distribution services. Reflected on the Statement of Assets and Liabilities is $24,090 in distribution fees payable to the Distributor at September 30, 2023.
126Pioneer Strategic Income Fund | Annual Report | 9/30/23
The Fund also has adopted a separate service plan for Class R shares (the “Service Plan”). The Service Plan authorizes the Fund to pay securities dealers, plan administrators or other service organizations that agree to provide certain services to retirement plans or plan participants holding shares of the Fund a service fee of up to 0.25% of the Fund’s average daily net assets attributable to Class R shares held by such plans.
In addition, redemptions of Class A and Class C shares may be subject to a contingent deferred sales charge (“CDSC”). A CDSC of 1.00% may be imposed on redemptions of certain net asset value purchases of Class A shares within 12 months of purchase. Redemptions of Class C shares within 12 months of purchase are subject to a CDSC of 1.00% based on the lower of cost or market value of shares being redeemed. Shares purchased as part of an exchange remain subject to any CDSC that applied to the original purchase of those shares. There is no CDSC for Class K, Class R or Class Y shares. Proceeds from the CDSCs are paid to the Distributor. For the year ended September 30, 2023, CDSCs in the amount of $7,881 were paid to the Distributor.
6. Line of Credit Facility
The Fund, along with certain other funds in the Pioneer Family of Funds, participates in a committed, unsecured revolving line of credit (“credit facility”). Borrowings are used solely for temporary or emergency purposes. The Fund may borrow up to the lesser of the amount available under the credit facility or the limits set for borrowing by the Fund’s prospectus and the 1940 Act. The Fund participates in a credit facility in the amount of $380 million. Under such credit facility, depending on the type of loan, interest on borrowings is payable at the Secured Overnight Financing Rate ("SOFR") plus a credit spread. The Fund also pays both an upfront fee and an annual commitment fee to participate in the credit facility. The upfront fee in the amount of 0.15% of the total credit facility and the commitment fee in the amount of 0.30% of the daily unused portion of each lender's commitment are allocated among participating funds based on an allocation schedule set forth in the credit facility. For the year ended September 30, 2023, the Fund had no borrowings under the credit facility.
7. Master Netting Agreements
The Fund has entered into an International Swaps and Derivatives Association, Inc. Master Agreement (“ISDA Master Agreement”) or similar agreement with substantially all of its derivative counterparties. An ISDA Master Agreement is a bilateral agreement between the Fund and a counterparty that governs the trading of certain Over the Counter (“OTC”) derivatives and typically contains, among other things, close-out and set- off provisions which apply upon the occurrence of an event of default
Pioneer Strategic Income Fund | Annual Report | 9/30/23127
and/or a termination event as defined under the relevant ISDA Master Agreement. The ISDA Master Agreement may also give a party the right to terminate all transactions traded under such agreement if, among other things, there is deterioration in the credit quality of the other party.
Upon an event of default or a termination of the ISDA Master Agreement, the non-defaulting party has the right to close-out all transactions under such agreement and to net amounts owed under each transaction to determine one net amount payable by one party to the other. The right to close out and net payments across all transactions under the ISDA Master Agreement could result in a reduction of the Fund’s credit risk to its counterparty equal to any amounts payable by the Fund under the applicable transactions, if any. However, the Fund’s right to set-off may be restricted or prohibited by the bankruptcy or insolvency laws of the particular jurisdiction to which each specific ISDA Master Agreement of each counterparty is subject.
The collateral requirements for derivatives transactions under an ISDA Master Agreement are governed by a credit support annex to the ISDA Master Agreement. Collateral requirements are generally determined at the close of business each day and are typically based on changes in market values for each transaction under an ISDA Master Agreement and netted into one amount for such agreement. Generally, the amount of collateral due from or to a counterparty is subject to threshold (a “minimum transfer amount”) before a transfer is required, which may vary by counterparty. Collateral pledged for the benefit of the Fund and/or counterparty is held in segregated accounts by the Fund’s custodian and cannot be sold, re- pledged, assigned or otherwise used while pledged. Cash that has been segregated to cover the Fund’s collateral obligations, if any, will be reported separately on the Statement of Assets and Liabilities as “Swaps collateral”. Securities pledged by the Fund as collateral, if any, are identified as such in the Schedule of Investments.
128Pioneer Strategic Income Fund | Annual Report | 9/30/23
Financial instruments subject to an enforceable master netting agreement, such as an ISDA Master Agreement, have been offset on the Statement of Assets and Liabilities. The following charts show gross assets and liabilities of the Fund as of September 30, 2023.
| Counterparty | Derivative
Assets
Subject to
Master Netting
Agreement | Derivatives
Available
for Offset | Non-Cash
Collateral
Received (a) | Cash
Collateral
Received (a) | Net Amount
of Derivative
Assets (b) |
| Citibank NA | $ 919,302 | $ (919,302) | $ — | $ — | $ — |
| Goldman Sachs & Co. | 528,689 | (207,663) | — | — | 321,026 |
| HSBC Bank USA NA | 250,880 | (250,880) | — | — | — |
| JPMorgan Chase Bank NA | 508,349 | — | — | — | 508,349 |
| State Street Bank & Trust Co. | 331,179 | (331,179) | — | — | — |
| Total | $2,538,399 | $(1,709,024) | $— | $— | $829,375 |
| Counterparty | Derivative
Liabilities
Subject to
Master Netting
Agreement | Derivatives
Available for
Offset | Non-Cash
Collateral
Pledged (a) | Cash
Collateral
Pledged (a) | Net Amount
of Derivative
Liabilities (c) |
| Citibank NA | $ 925,077 | $ (919,302) | $ — | $ — | $ 5,775 |
| Goldman Sachs & Co. | 207,663 | (207,663) | — | — | — |
| HSBC Bank USA NA | 851,067 | (250,880) | — | — | 600,187 |
JPMorgan Chase
Bank NA | — | — | — | — | — |
| State Street Bank & Trust Co. | 3,368,322 | (331,179) | — | — | 3,037,143 |
| Total | $5,352,129 | $(1,709,024) | $— | $— | $3,643,105 |
(a) The amount presented here may be less than the total amount of collateral received/pledged as the net amount of derivative assets and liabilities cannot be less than $0.
(b) Represents the net amount due from the counterparty in the event of default.
(c) Represents the net amount payable to the counterparty in the event of default.
8. Additional Disclosures about Derivative Instruments and Hedging Activities
The Fund’s use of derivatives may enhance or mitigate the Fund’s exposure to the following risks:
Interest rate risk relates to the fluctuations in the value of interest-bearing securities due to changes in the prevailing levels of market interest rates.
Pioneer Strategic Income Fund | Annual Report | 9/30/23129
Credit risk relates to the ability of the issuer of a financial instrument to make further principal or interest payments on an obligation or commitment that it has to the Fund.
Foreign exchange rate risk relates to fluctuations in the value of an asset or liability due to changes in currency exchange rates.
Equity risk relates to the fluctuations in the value of financial instruments as a result of changes in market prices (other than those arising from interest rate risk or foreign exchange rate risk), whether caused by factors specific to an individual investment, its issuer, or all factors affecting all instruments traded in a market or market segment.
Commodity risk relates to the risk that the value of a commodity or commodity index will fluctuate based on increases or decreases in the commodities market and factors specific to a particular industry or commodity.
The fair value of open derivative instruments (not considered to be hedging instruments for accounting disclosure purposes) by risk exposure at September 30, 2023, was as follows:
Statement of Assets
and Liabilities | Interest
Rate Risk | Credit
Risk | Foreign
Exchange
Rate Risk | Equity
Risk | Commodity
Risk |
| Assets | | | | | |
| Options purchased* | $ — | $ — | $ 578,641 | $ — | $ — |
| Unrealized appreciation on forward foreign currency exchange contracts | — | — | 1,959,758 | — | — |
| Total Value | $ — | $ — | $2,538,399 | $— | $— |
| Liabilities | | | | | |
| Options written | $ — | $ — | $ 39,873 | $ — | $ — |
| Net unrealized depreciation on futures contracts^ | 13,759,699 | — | — | — | — |
| Unrealized depreciation on forward foreign currency exchange contracts | — | — | 5,312,256 | — | — |
| Swap contracts at value | — | 4,972,545 | — | — | — |
| Total Value | $13,759,699 | $4,972,545 | $5,352,129 | $— | $— |
| | |
| * | Reflects the market value of purchased option contracts (see Note 1J). These amounts are included in investments in unaffiliated issuers, at value, on the Statement of Assets and Liabilities. |
| ^ | Includes cumulative unrealized appreciation (depreciation) of futures contracts as reported in the Schedule of Investments. Only net variation margin is reported within the assets and/or liabilities on the Statement of Assets and Liabilities. |
130Pioneer Strategic Income Fund | Annual Report | 9/30/23
The effect of derivative instruments (not considered to be hedging instruments for accounting disclosure purposes) on the Statement of Operations by risk exposure at September 30, 2023 was as follows:
| Statement of Operations | Interest
Rate Risk | Credit
Risk | Foreign
Exchange
Rate Risk | Equity
Risk | Commodity
Risk |
| Net Realized Gain (Loss) on | | | | | |
| Futures contracts | $ (62,782,436) | $ — | $ — | $ — | $ — |
| Forward foreign currency exchange contracts | — | — | (10,989,161) | — | — |
| Options purchased* | — | — | (1,290,128) | — | — |
| Options written | — | — | 1,290,128 | — | — |
| Swap contracts | — | (70,967,407) | — | — | — |
| Total Value | $(62,782,436) | $(70,967,407) | $(10,989,161) | $— | $— |
| Change in Net Unrealized Appreciation (Depreciation) on | | | | | |
| Futures contracts | $ 8,256,447 | $ — | $ — | $ — | $ — |
| Forward foreign currency exchange contracts | — | — | 8,998,486 | — | — |
| Options purchased** | — | — | (12,848,133) | — | — |
| Options written | — | — | (412,030) | — | — |
| Swap contracts | — | (3,816,164) | — | — | — |
| Total Value | $ 8,256,447 | $ (3,816,164) | $ (4,261,677) | $— | $— |
| | |
| * | Reflects the net realized gain (loss) on purchased option contracts (see Note 1J). These amounts are included in net realized gain (loss) on investments in unaffiliated issuers, on the Statement of Operations. |
| ** | Reflects the change in net unrealized appreciation (depreciation) on purchased option contracts (see Note 1J). These amounts are included in change in net unrealized appreciation (depreciation) on investments in unaffiliated issuers, on the Statement of Operations. |
9. Unfunded Loan Commitments
The Fund may enter into unfunded loan commitments. Unfunded loan commitments may be partially or wholly unfunded. During the contractual period, the Fund is obliged to provide funding to the borrower upon demand. A fee is earned by the Fund on the unfunded loan commitment and is recorded as interest income on the Statement of Operations. Unfunded loan commitments are fair valued in accordance with the valuation policy described in Footnote 1A and unrealized appreciation or depreciation, if any, is recorded on the Statement of Assets and Liabilities.
As of September 30, 2023, the Fund had no unfunded loan commitments outstanding.
Pioneer Strategic Income Fund | Annual Report | 9/30/23131
Report of Independent Registered Public Accounting Firm
To the Board of Trustees of Pioneer Series Trust XIV and the Shareholders of Pioneer Strategic Income Fund:
Opinion on the Financial Statements
We have audited the accompanying statement of assets and liabilities of Pioneer Strategic Income Fund (the “Fund”) (one of the funds constituting Pioneer Series Trust XIV (the “Trust”)), including the schedule of investments, as of September 30, 2023, and the related statement of operations for the year then ended, the statements of changes in net assets for each of the two years in the period then ended, the financial highlights for each of the five years in the period then ended and the related notes (collectively referred to as the “financial statements”). In our opinion, the financial statements present fairly, in all material respects, the financial position of the Fund (one of the funds constituting Pioneer Series Trust XIV) at September 30, 2023, the results of its operations for the year then ended, the changes in its net assets for each of the two years in the period then ended, and its financial highlights for each of the five years in the period then ended in conformity with U.S. generally accepted accounting principles.
Basis for Opinion
These financial statements are the responsibility of the Trust’s management. Our responsibility is to express an opinion on the Fund’s financial statements based on our audits. We are a public accounting firm registered with the Public Company Accounting Oversight Board (United States) ("PCAOB") and are required to be independent with respect to the Trust in accordance with the U.S. federal securities laws and the applicable rules and regulations of the Securities and Exchange Commission and the PCAOB.
We conducted our audits in accordance with the standards of the PCAOB. Those standards require that we plan and perform the audit to obtain reasonable assurance about whether the financial statements are free of material misstatement, whether due to error or fraud. The Trust is not required to have, nor were we engaged to perform, an audit of the Trust’s internal control over financial reporting. As part of our audits, we are required to obtain an understanding of internal control over financial reporting, but not for the purpose of expressing an opinion on the effectiveness of the Trust’s internal control over financial reporting. Accordingly, we express no such opinion.
132Pioneer Strategic Income Fund | Annual Report | 9/30/23
Our audits included performing procedures to assess the risks of material misstatement of the financial statements, whether due to error or fraud, and performing procedures that respond to those risks. Such procedures included examining, on a test basis, evidence regarding the amounts and disclosures in the financial statements. Our procedures included confirmation of securities owned as of September 30, 2023, by correspondence with the custodian, brokers and others; when replies were not received from brokers and others, we performed other auditing procedures. Our audits also included evaluating the accounting principles used and significant estimates made by management, as well as evaluating the overall presentation of the financial statements. We believe that our audits provide a reasonable basis for our opinion.
We have served as the auditor of one or more investment companies in the Pioneer family of funds since 2017.
Boston, Massachusetts
November 28, 2023
Pioneer Strategic Income Fund | Annual Report | 9/30/23133
Additional Information (unaudited)
Qualified interest income is exempt from nonresident alien (NRA) tax withholding. The percentage of the Fund’s ordinary income distributions derived from qualified interest income was 64.32%.
134Pioneer Strategic Income Fund | Annual Report | 9/30/23
Approval of Renewal of Investment Management Agreement
Amundi Asset Management US, Inc. (“Amundi US”) serves as the investment adviser to Pioneer Strategic Income Fund (the “Fund”) pursuant to an investment management agreement between Amundi US and the Fund. In order for Amundi US to remain the investment adviser of the Fund, the Trustees of the Fund, including a majority of the Fund’s Independent Trustees, must determine annually whether to renew the investment management agreement for the Fund.
The contract review process began in January 2023 as the Trustees of the Fund agreed on, among other things, an overall approach and timeline for the process. Contract review materials were provided to the Trustees in March 2023, July 2023 and September 2023. In addition, the Trustees reviewed and discussed the Fund’s performance at regularly scheduled meetings throughout the year, and took into account other information related to the Fund provided to the Trustees at regularly scheduled meetings, in connection with the review of the Fund’s investment management agreement.
In March 2023, the Trustees, among other things, discussed the memorandum provided by Fund counsel that summarized the legal standards and other considerations that are relevant to the Trustees in their deliberations regarding the renewal of the investment management agreement, and reviewed and discussed the qualifications of the investment management teams for the Fund, as well as the level of investment by the Fund’s portfolio managers in the Fund. In July 2023, the Trustees, among other things, reviewed the Fund’s management fees and total expense ratios, the financial statements of Amundi US and its parent companies, profitability analyses provided by Amundi US, and analyses from Amundi US as to possible economies of scale. The Trustees also reviewed the profitability of the institutional business of Amundi US as compared to that of Amundi US’s fund management business, and considered the differences between the fees and expenses of the Fund and the fees and expenses of Amundi US’s institutional accounts, as well as the different services provided by Amundi US to the Fund and to the institutional accounts. The Trustees further considered contract review materials, including additional materials received in response to the Trustees’ request, in September 2023.
At a meeting held on September 19, 2023, based on their evaluation of the information provided by Amundi US and third parties, the Trustees of the Fund, including the Independent Trustees voting separately advised by independent counsel, unanimously approved the renewal of the investment
Pioneer Strategic Income Fund | Annual Report | 9/30/23135
management agreement for another year. In approving the renewal of the investment management agreement, the Trustees considered various factors that they determined were relevant, including the factors described below. The Trustees did not identify any single factor as the controlling factor in determining to approve the renewal of the agreement.
Nature, Extent and Quality of Services
The Trustees considered the nature, extent and quality of the services that had been provided by Amundi US to the Fund, taking into account the investment objective and strategy of the Fund. The Trustees also reviewed Amundi US’s investment approach for the Fund and its research process. The Trustees considered Amundi US’ integration of environmental, social and governance (ESG) considerations into its investment research process. The Trustees considered the resources of Amundi US and the personnel of Amundi US who provide investment management services to the Fund. They also reviewed the amount of non-Fund assets managed by the portfolio managers of the Fund. They considered the non-investment resources and personnel of Amundi US that are involved in Amundi US’s services to the Fund, including Amundi US’s compliance, risk management, and legal resources and personnel. The Trustees considered the compliance services being provided to the Fund by Amundi US and how Amundi US has addressed any compliance issues during the past year. The Trustees noted the substantial attention and high priority given by Amundi US’s senior management to the Pioneer Fund complex, including with respect to the increasing regulation to which the Pioneer Funds are subject.
The Trustees considered that Amundi US supervises and monitors the performance of the Fund’s service providers and provides the Fund with personnel (including Fund officers) and other resources that are necessary for the Fund’s business management and operations. The Trustees also considered that, as administrator, Amundi US is responsible for the administration of the Fund’s business and other affairs. The Trustees considered that the Fund reimburses Amundi US its pro rata share of Amundi US’s costs of providing administration services to the Pioneer Funds.
Based on these considerations, the Trustees concluded that the nature, extent and quality of services that had been provided by Amundi US to the Fund were satisfactory and consistent with the terms of the investment management agreement.
Performance of the Fund
In considering the Fund’s performance, the Trustees regularly review and discuss throughout the year data prepared by Amundi US and information
136Pioneer Strategic Income Fund | Annual Report | 9/30/23
comparing the Fund’s performance with the performance of its peer group of funds, as classified by Morningstar, Inc. (Morningstar), and with the performance of the Fund’s benchmark index. They also discuss the Fund’s performance with Amundi US on a regular basis. The Trustees’ regular reviews and discussions were factored into the Trustees’ deliberations concerning the renewal of the investment management agreement.
Management Fee and Expenses
The Trustees considered information showing the fees and expenses of the Fund in comparison to the management fees of its peer group of funds as classified by Morningstar and also to the expense ratios of a peer group of funds selected on the basis of criteria determined by the Independent Trustees for this purpose using data provided by Strategic Insight Mutual Fund Research and Consulting, LLC (Strategic Insight), an independent third party. The peer group comparisons referred to below are organized in quintiles. Each quintile represents one-fifth of the peer group. In all peer group comparisons referred to below, first quintile is most favorable to the Fund’s shareowners. The Trustees noted that they separately review and consider the impact of the Fund’s transfer agency and Fund- and Amundi US-paid expenses for sub-transfer agency and intermediary arrangements, and that the results of the most recent such review were considered in the consideration of the Fund’s expense ratio.
The Trustees considered that the Fund’s management fee for the most recent fiscal year was in the third quintile relative to the management fees paid by other funds in its Morningstar category for the comparable period. The Trustees also considered the breakpoints in the management fee schedule and the reduced fee rates above certain asset levels. The Trustees considered that the expense ratio of the Fund’s Class Y shares for the most recent fiscal year was in the fourth quintile relative to its Strategic Insight peer group for the comparable period. The Trustees noted Amundi US’s explanation of the reasons that the expense ratio of the Fund’s Class Y shares was in the fourth quintile relative to its Strategic Insight peer group. The Trustees noted that Amundi US had agreed to waive fees and/or reimburse expenses in order to limit the ordinary operating expenses of the Fund.
The Trustees reviewed management fees charged by Amundi US to institutional and other clients, including publicly offered European funds sponsored by Amundi US’s affiliates, unaffiliated U.S. registered investment companies (in a sub-advisory capacity), and unaffiliated foreign and domestic separate accounts. The Trustees also considered Amundi US’s costs in providing services to the Fund and Amundi US’s costs in providing services to the other clients and considered the differences in management
Pioneer Strategic Income Fund | Annual Report | 9/30/23137
fees and profit margins for fund and non-fund services. In evaluating the fees associated with Amundi US’s client accounts, the Trustees took into account the respective demands, resources and complexity associated with the Fund and other client accounts. The Trustees noted that, in some instances, the fee rates for those clients were lower than the management fee for the Fund and considered that, under the investment management and administration agreements with the Fund, Amundi US performs additional services for the Fund that it does not provide to those other clients or services that are broader in scope, including oversight of the Fund’s other service providers and activities related to compliance and the extensive regulatory and tax regimes to which the Fund is subject. The Trustees also considered the entrepreneurial risks associated with Amundi US’s management of the Fund.
The Trustees concluded that the management fee payable by the Fund to Amundi US was reasonable in relation to the nature and quality of the services provided by Amundi US.
Profitability
The Trustees considered information provided by Amundi US regarding the profitability of Amundi US with respect to the advisory services provided by Amundi US to the Fund, including the methodology used by Amundi US in allocating certain of its costs to the management of the Fund. The Trustees also considered Amundi US’s profit margin in connection with the overall operation of the Fund. They further reviewed the financial results, including the profit margins, realized by Amundi US from non-fund businesses. The Trustees considered Amundi US’s profit margins in comparison to the limited industry data available and noted that the profitability of any adviser was affected by numerous factors, including its organizational structure and method for allocating expenses. The Trustees concluded that Amundi US’s profitability with respect to the management of the Fund was not unreasonable.
Economies of Scale
The Trustees considered Amundi US’s views relating to economies of scale in connection with the Pioneer Funds as fund assets grow and the extent to which any such economies of scale are shared with the Fund and Fund shareholders. The Trustees noted the breakpoints in the management fee schedule. The Trustees recognize that economies of scale are difficult to identify and quantify, and that, among other factors that may be relevant, are the following: fee levels, expense subsidization, investment by Amundi US in research and analytical capabilities and Amundi US’s commitment and resource allocation to the Fund. The Trustees noted that profitability also may be an indicator of the availability of any economies of scale,
138Pioneer Strategic Income Fund | Annual Report | 9/30/23
although profitability may vary for other reasons including due to reductions in expenses. The Trustees concluded that economies of scale, if any, were being appropriately shared with the Fund.
Other Benefits
The Trustees considered the other benefits that Amundi US enjoys from its relationship with the Fund. The Trustees considered the character and amount of fees paid or to be paid by the Fund, other than under the investment management agreement, for services provided by Amundi US and its affiliates. The Trustees further considered the revenues and profitability of Amundi US’s businesses other than the Fund business. To the extent applicable, the Trustees also considered the benefits to the Fund and to Amundi US and its affiliates from the use of “soft” commission dollars generated by the Fund to pay for research and brokerage services.
The Trustees considered that Amundi US is the principal U.S. asset management business of Amundi, which is one of the largest asset managers globally. Amundi’s worldwide asset management business manages over $2.1 trillion in assets (including the Pioneer Funds). The Trustees considered that Amundi US’s relationship with Amundi creates potential opportunities for Amundi US and Amundi that derive from Amundi US’s relationships with the Fund, including Amundi’s ability to market the services of Amundi US globally. The Trustees noted that Amundi US has access to additional research and portfolio management capabilities as a result of its relationship with Amundi and Amundi’s enhanced global presence that may contribute to an increase in the resources available to Amundi US. The Trustees considered that Amundi US and the Fund receive reciprocal intangible benefits from the relationship, including mutual brand recognition and, for the Fund, direct and indirect access to the resources of a large global asset manager. The Trustees concluded that any such benefits received by Amundi US as a result of its relationship with the Fund were reasonable.
Conclusion
After consideration of the factors described above as well as other factors, the Trustees, including the Independent Trustees, concluded that the investment management agreement for the Fund, including the fees payable thereunder, was fair and reasonable and voted to approve the proposed renewal of the investment management agreement.
Pioneer Strategic Income Fund | Annual Report | 9/30/23139
Statement Regarding Liquidity Risk Management Program
As required by law, the Fund has adopted and implemented a liquidity risk management program (the “Program”) that is designed to assess and manage liquidity risk. Liquidity risk is the risk that the Fund could not meet requests to redeem its shares without significant dilution of remaining investors’ interests in the Fund. The Fund’s Board of Trustees designated a liquidity risk management committee (the “Committee”) consisting of employees of Amundi Asset Management US, Inc. (the “Adviser”) to administer the Program.
The Committee provided the Board of Trustees with a report that addressed the operation of the Program and assessed its adequacy and effectiveness of implementation (the “Report”). The Report covered the period from January 1, 2022 through December 31, 2022 (the “Reporting Period”).
The Report confirmed that, throughout the Reporting Period, the Committee had monitored the Fund’s portfolio liquidity and liquidity risk on an ongoing basis, as described in the Program and in Board reporting throughout the Reporting Period.
The Report discussed the Committee’s annual review of the Program, which addressed, among other things, the following elements of the Program:
The Committee reviewed the Fund’s investment strategy and liquidity of portfolio investments during both normal and reasonably foreseeable stressed conditions. The Committee noted that the Fund’s investment strategy continues to be appropriate for an open-end fund, taking into account, among other things, whether and to what extent the Fund held less liquid and illiquid assets and the extent to which any such investments affected the Fund’s ability to meet redemption requests. In managing and reviewing the Fund’s liquidity risk, the Committee also considered the extent to which the Fund’s investment strategy involves a relatively concentrated portfolio or large positions in particular issuers, the extent to which the Fund uses borrowing for investment purposes, and the extent to which the Fund uses derivatives (including for hedging purposes). The Committee also reviewed the Fund’s short-term and long-term cash flow projections during both normal and reasonably foreseeable stressed conditions. In assessing the Fund’s cash flow projections, the Committee considered, among other factors, historical net redemption activity, redemption policies, ownership concentration, distribution channels, and the degree of certainty associated with the Fund’s short-term and long-term cash flow projections. The Committee also considered the Fund’s holdings of cash and cash equivalents, as well as borrowing arrangements
140Pioneer Strategic Income Fund | Annual Report | 9/30/23
and other funding sources, including, if applicable, the Fund’s participation in a credit facility, as components of the Fund’s ability to meet redemption requests. The Fund has adopted an in-kind redemption policy which may be utilized to meet larger redemption requests.
The Committee reviewed the Program’s liquidity classification methodology for categorizing the Fund’s investments into one of four liquidity buckets. In reviewing the Fund’s investments, the Committee considered, among other factors, whether trading varying portions of a position in a particular portfolio investment or asset class in sizes the Fund would reasonably anticipate trading, would be reasonably expected to significantly affect liquidity.
The Committee performed an analysis to determine whether the Fund is required to maintain a Highly Liquid Investment Minimum, and determined that no such minimum is required because the Fund primarily holds highly liquid investments.
The Report stated that the Committee concluded the Program operates adequately and effectively, in all material respects, to assess and manage the Fund’s liquidity risk throughout the Reporting Period.
Pioneer Strategic Income Fund | Annual Report | 9/30/23 141
Trustees, Officers and Service Providers
Investment Adviser and Administrator
Amundi Asset Management US, Inc.
Custodian and Sub-Administrator
The Bank of New York Mellon Corporation
Independent Registered Public Accounting Firm
Ernst & Young LLP
Principal Underwriter
Amundi Distributor US, Inc.
Legal Counsel
Morgan, Lewis & Bockius LLP
Transfer Agent
BNY Mellon Investment Servicing (US) Inc.
Proxy Voting Policies and Procedures of the Fund are available without charge, upon request, by calling our toll free number (1-800-225-6292). Information regarding how the Fund voted proxies relating to portfolio securities during the most recent 12-month period ended June 30 is publicly available to shareowners at www.amundi.com/us. This information is also available on the Securities and Exchange Commission’s web site at www.sec.gov.
Trustees and Officers
The Fund's Trustees and officers are listed below, together with their principal occupations and other directorships they have held during at least the past five years. Trustees who are interested persons of the Fund within the meaning of the 1940 Act are referred to as Interested Trustees. Trustees who are not interested persons of the Fund are referred to as Independent Trustees. Each of the Trustees serves as a Trustee of each of the 49 U.S. registered investment portfolios for which Amundi US serves as investment adviser (the “Pioneer Funds”). The address for all Trustees and all officers of the Fund is 60 State Street, Boston, Massachusetts 02109.
The Statement of Additional Information of the Fund includes additional information about the Directors and is available, without charge, upon request, by calling 1-800-225-6292.
142Pioneer Strategic Income Fund | Annual Report | 9/30/23
Name, Age and Position
Held With the Fund | Term of Office and
Length of Service | Principal Occupation(s) During At Least The Past Five Years | Other Directorships Held by Trustee
During At Least The Past Five Years |
Thomas J. Perna (72)
Chairman of the Board
and Trustee | Trustee since 2006.
Serves until a successor
trustee is elected or
earlier retirement
or removal. | Private investor (2004 – 2008 and 2013 – present); Chairman (2008 – 2013) and Chief Executive Officer (2008 – 2012), Quadriserv, Inc. (technology products for securities lending industry); and Senior Executive Vice President, The Bank of New York (financial and securities services) (1986 – 2004) | Director, Broadridge Financial Solutions, Inc.
(investor communications and securities
processing provider for financial services industry)
(2009 – present); Director, Quadriserv, Inc. (2005 –
2013); and Commissioner, New Jersey State
Civil Service Commission (2011 – 2015) |
John E. Baumgardner,
Jr. (72)*
Trustee | Trustee since 2019.
Serves until a successor
trustee is elected or
earlier retirement
or removal. | Of Counsel (2019 – present), Partner (1983-2018), Sullivan & Cromwell LLP (law firm). | Chairman, The Lakeville Journal Company, LLC,
(privately-held community newspaper group)
(2015-present) |
Diane Durnin (66)
Trustee | Trustee since 2019.
Serves until a successor
trustee is elected or
earlier retirement
or removal. | Managing Director - Head of Product Strategy and Development, BNY Mellon Investment Management (investment management firm) (2012-2018); Vice Chairman – The Dreyfus Corporation (2005 – 2018): Executive Vice President Head of Product, BNY Mellon Investment Management (2007-2012); Executive Director- Product Strategy, Mellon Asset Management (2005-2007); Executive Vice President Head of Products, Marketing and Client Service, Dreyfus Corporation (investment management firm) (2000-2005); Senior Vice President Strategic Product and Business Development, Dreyfus Corporation (1994-2000) | None |
Pioneer Strategic Income Fund | Annual Report | 9/30/23143
Independent Trustees (continued)
Name, Age and Position
Held With the Fund | Term of Office and
Length of Service | Principal Occupation(s) During At Least The Past Five Years | Other Directorships Held by Trustee
During At Least The Past Five Years |
Benjamin M. Friedman (79)
Trustee | Trustee since 2008.
Serves until a successor
trustee is elected or
earlier retirement
or removal. | William Joseph Maier Professor of Political Economy, Harvard University (1972 – present) | Trustee, Mellon Institutional Funds Investment
Trust and Mellon Institutional Funds Master
Portfolio (oversaw 17 portfolios in fund complex)
(1989 - 2008) |
Craig C. MacKay (60)
Trustee | Trustee since 2021.
Serves until a successor
trustee is elected or
earlier retirement
or removal. | Partner, England & Company, LLC (advisory firm) (2012 – present); Group Head – Leveraged Finance Distribution, Oppenheimer & Company (investment bank) (2006 – 2012); Group Head – Private Finance & High Yield Capital Markets Origination, SunTrust Robinson Humphrey (investment bank) (2003 – 2006); and Founder and Chief Executive Officer, HNY Associates, LLC (investment bank) (1996 – 2003) | Director, Equitable Holdings, Inc. (financial
services holding company) (2022 – present);
Board Member of Carver Bancorp, Inc. (holding
company) and Carver Federal Savings Bank,
NA (2017 – present); Advisory Council Member,
MasterShares ETF (2016 – 2017); Advisory
Council Member, The Deal (financial market
information publisher) (2015 – 2016); Board
Co-Chairman and Chief Executive Officer, Danis
Transportation Company (privately-owned
commercial carrier) (2000 – 2003); Board
Member and Chief Financial Officer, Customer
Access Resources (privately-owned
teleservices company) (1998 – 2000); Board
Member, Federation of Protestant Welfare
Agencies (human services agency) (1993 –
present); and Board Treasurer, Harlem Dowling
Westside Center (foster care agency)
(1999 – 2018) |
144Pioneer Strategic Income Fund | Annual Report | 9/30/23
Name, Age and Position
Held With the Fund | Term of Office and
Length of Service | Principal Occupation(s) During At Least The Past Five Years | Other Directorships Held by Trustee
During At Least The Past Five Years |
Lorraine H. Monchak (67)
Trustee | Trustee since 2017.
(Advisory Trustee from
2014 - 2017). Serves
until a successor trustee
is elected or earlier
retirement or removal. | Chief Investment Officer, 1199 SEIU Funds (healthcare workers union pension funds) (2001 – present); Vice President – International Investments Group, American International Group, Inc. (insurance company) (1993 – 2001); Vice President – Corporate Finance and Treasury Group, Citibank, N.A. (1980 – 1986 and 1990 – 1993); Vice President – Asset/Liability Management Group, Federal Farm Funding Corporation (government-sponsored issuer of debt securities) (1988 – 1990); Mortgage Strategies Group, Shearson Lehman Hutton, Inc. (investment bank) (1987 – 1988); Mortgage Strategies Group, Drexel Burnham Lambert, Ltd. (investment bank) (1986 – 1987) | None |
Marguerite A. Piret (75)
Trustee | Trustee since 1999.
Serves until a successor
trustee is elected or
earlier retirement
or removal. | Chief Financial Officer, American Ag Energy, Inc. (technology for the environment, energy and agriculture) (2019 – present); Chief Operating Officer, North Country Growers LLC (controlled environment agriculture company) (2020 – present); Chief Executive Officer, Green Heat LLC (biofuels company) (2022 – present); President and Chief Executive Officer, Newbury Piret Company (investment banking firm) (1981 – 2019) | Director of New America High Income Fund,
Inc. (closed-end investment company) (2004 –
present); and Member, Board of Governors,
Investment Company Institute (2000 – 2006) |
Pioneer Strategic Income Fund | Annual Report | 9/30/23145
Independent Trustees (continued)
Name, Age and Position
Held With the Fund | Term of Office and
Length of Service | Principal Occupation(s) During At Least The Past Five Years | Other Directorships Held by Trustee
During At Least The Past Five Years |
Fred J. Ricciardi (76)
Trustee | Trustee since 2014.
Serves until a successor
trustee is elected or
earlier retirement
or removal. | Private investor (2020 – present); Consultant (investment company services) (2012 – 2020); Executive Vice President, BNY Mellon (financial and investment company services) (1969 – 2012); Director, BNY International Financing Corp. (financial services) (2002 – 2012); Director, Mellon Overseas Investment Corp. (financial services) (2009 – 2012); Director, Financial Models (technology) (2005-2007); Director, BNY Hamilton Funds, Ireland (offshore investment companies) (2004-2007); Chairman/Director, AIB/BNY Securities Services, Ltd., Ireland (financial services) (1999-2006); Chairman, BNY Alternative Investment Services, Inc. (financial services) (2005-2007) | None |
| * Mr. Baumgardner is Of Counsel to Sullivan & Cromwell LLP, which acts as counsel to the Independent Trustees of each Pioneer Fund. |
146Pioneer Strategic Income Fund | Annual Report | 9/30/23
Name, Age and Position
Held With the Fund | Term of Office and
Length of Service | Principal Occupation(s) During At Least The Past Five Years | Other Directorships Held by Trustee
During At Least The Past Five Years |
Lisa M. Jones (61)**
Trustee, President and Chief
Executive Officer | Trustee since 2017. Serves
until a successor trustee is
elected or earlier retirement
or removal | Director, CEO and President of Amundi US, Inc. (investment management firm) (since September 2014); Director, CEO and President of Amundi Asset Management US, Inc. (since September 2014); Director, CEO and President of Amundi Distributor US, Inc. (since September 2014); Director, CEO and President of Amundi Asset Management US, Inc. (since September 2014); Chair, Amundi US, Inc., Amundi Distributor US, Inc. and Amundi Asset Management US, Inc. (September 2014 – 2018); Managing Director, Morgan Stanley Investment Management (investment management firm) (2010 – 2013); Director of Institutional Business, CEO of International, Eaton Vance Management (investment management firm) (2005 – 2010); Director of Amundi Holdings US, Inc. (since 2017) | Director of Clearwater Analytics (provider
of web-based investment accounting
software for reporting and reconciliation
services) (September 2022 – present) |
Kenneth J. Taubes (65)**
Trustee | Trustee since 2014. Serves
until a successor trustee is
elected or earlier retirement
or removal | Director and Executive Vice President (since 2008) and Chief Investment Officer, U.S. (since 2010) of Amundi US, Inc. (investment management firm); Director and Executive Vice President and Chief Investment Officer, U.S. of Amundi US (since 2008); Executive Vice President and Chief Investment Officer, U.S. of Amundi Asset Management US, Inc. (since 2009); Portfolio Manager of Amundi US (since 1999); Director of Amundi Holdings US, Inc. (since 2017) | None |
| ** Ms. Jones and Mr. Taubes are Interested Trustees because they are officers or directors of the Fund’s investment adviser and certain of its affiliates. |
Pioneer Strategic Income Fund | Annual Report | 9/30/23147
Name, Age and Position
Held With the Fund | Term of Office and
Length of Service | Principal Occupation(s) During At Least The Past Five Years | Other Directorships Held by Officer
During At Least The Past Five Years |
Christopher J. Kelley (58)
Secretary and Chief
Legal Officer | Since 2010. Serves at
the discretion of
the Board | Vice President and Associate General Counsel of Amundi US since January 2008; Secretary and Chief Legal Officer of all of the Pioneer Funds since June 2010; Assistant Secretary of all of the Pioneer Funds from September 2003 to May 2010; Vice President and Senior Counsel of Amundi US from July 2002 to December 2007 | None |
Thomas Reyes (60)
Assistant Secretary | Since 2010. Serves at
the discretion of
the Board | Assistant General Counsel of Amundi US since May 2013 and Assistant Secretary of all the Pioneer Funds since June 2010; Counsel of Amundi US from June 2007 to May 2013 | None |
Heather L. Melito-Dezan (46)
Assistant Secretary | Since 2022. Serves at
the discretion of
the Board | Director - Trustee and Board Relationships of Amundi US since September 2019; Assistant Secretary of Amundi US, Inc. since July 2020: Assistant Secretary of Amundi Asset Management US, Inc. since July 2020: Assistant Secretary of Amundi Distributor US, Inc. since July 2020; Assistant Secretary of all the Pioneer Funds since September 2022; Private practice from 2017 – 2019. | None |
Anthony J. Koenig, Jr. (59)
Treasurer and
Chief Financial and
Accounting Officer | Since 2021. Serves at
the discretion of
the Board | Managing Director, Chief Operations Officer and Fund Treasurer of Amundi US since May 2021; Treasurer of all of the Pioneer Funds since May 2021; Assistant Treasurer of all of the Pioneer Funds from January 2021 to May 2021; and Chief of Staff, US Investment Management of Amundi US from May 2008 to January 2021 | None |
Luis I. Presutti (58)
Assistant Treasurer | Since 2000. Serves at
the discretion of
the Board | Director – Fund Treasury of Amundi US since 1999; and Assistant Treasurer of all of the Pioneer Funds since 1999 | None |
Gary Sullivan (65)
Assistant Treasurer | Since 2002. Serves at
the discretion of
the Board | Senior Manager – Fund Treasury of Amundi US since 2012; and Assistant Treasurer of all of the Pioneer Funds since 2002 | None |
148Pioneer Strategic Income Fund | Annual Report | 9/30/23
Name, Age and Position
Held With the Fund | Term of Office and
Length of Service | Principal Occupation(s) During At Least The Past Five Years | Other Directorships Held by Officer
During At Least The Past Five Years |
Antonio Furtado (41)
Assistant Treasurer | Since 2020. Serves at
the discretion of
the Board | Fund Oversight Manager – Fund Treasury of Amundi US since 2020; Assistant Treasurer of all of the Pioneer Funds since 2020; and Senior Fund Treasury Analyst from 2012 - 2020 | None |
Michael Melnick (52)
Assistant Treasurer | Since 2021. Serves at
the discretion of
the Board | Vice President - Deputy Fund Treasurer of Amundi US since May 2021; Assistant Treasurer of all of the Pioneer Funds since July 2021; Director of Regulatory Reporting of Amundi US from 2001 – 2021; and Director of Tax of Amundi US from 2000 - 2001 | None |
John Malone (52)
Chief Compliance Officer | Since 2018. Serves at
the discretion of
the Board | Managing Director, Chief Compliance Officer of Amundi US Asset Management; Amundi Asset Management US, Inc.; and the Pioneer Funds since September 2018; Chief Compliance Officer of Amundi Distributor US, Inc. since January 2014. | None |
Brandon Austin (51)
Anti-Money Laundering Officer | Since 2022. Serves at
the discretion of
the Board | Director, Financial Security – Amundi Asset Management; Anti-Money Laundering Officer of all the Pioneer Funds since March 2022: Director of Financial Security of Amundi US since July 2021; Vice President, Head of BSA, AML and OFAC, Deputy Compliance Manager, Crédit Agricole Indosuez Wealth Management (investment management firm) (2013 – 2021) | None |
Pioneer Strategic Income Fund | Annual Report | 9/30/23149
How to Contact Amundi
We are pleased to offer a variety of convenient ways for you to contact us for assistance or information.
Call us for:
Account Information, including existing accounts,
new accounts, prospectuses, applications
and service forms
1-800-225-6292
FactFoneSM for automated fund yields, prices,
account information and transactions
1-800-225-4321
| Retirement plans information | 1-800-622-0176 |
Write to us:
Amundi
P.O. Box 534427
Pittsburgh, PA 15253-4427
| Our toll-free fax | 1-800-225-4240 |
| Our internet e-mail address | us.askamundi@amundi.com
(for general questions about Amundi only) |
Visit our web site: www.amundi.com/us
This report must be preceded or accompanied by a prospectus.
The Fund files a complete schedule of portfolio holdings with the Securities and Exchange Commission for the first and third quarters of each fiscal year as an exhibit to its reports on Form N-PORT. Shareholders may view the filed Form N-PORT by visiting the Commission’s web site at https://www.sec.gov.
Amundi Asset Management US, Inc.
60 State Street
Boston, MA 02109
www.amundi.com/us
Securities offered through Amundi Distributor US, Inc.
60 State Street, Boston, MA 02109
Underwriter of Pioneer Mutual Funds, Member SIPC
© 2023 Amundi Asset Management US, Inc. 19437-17-1123
Pioneer Emerging Markets Equity Fund
Annual Report | September 30, 2023
visit us: www.amundi.com/us
Pioneer Emerging Markets Equity Fund | Annual Report | 9/30/231
President’s Letter
Dear Shareholders,
On February 13, 2023, Amundi US celebrated the 95th anniversary of Pioneer Fund, the second-oldest mutual fund in the United States. We recognized the anniversary with ringing of the closing bell at the New York Stock Exchange, which seemed fitting for this special milestone.
Pioneer Fund was launched on February 13, 1928 by Phil Carret, one of the earliest proponents of value investing and a leading innovator in the asset management industry. Mr. Carret began investing in the 1920s and founded Pioneer Investments (now Amundi US) in 1928, and was one of the first investors to realize he could uncover value through rigorous, innovative, fundamental research techniques.
Consistent with Mr. Carret’s investment approach and employing many of the same techniques utilized in the 1920s, Amundi US's portfolio managers have adapted Mr. Carret’s philosophy to a new age of “active” investing.
The last few years have seen investors face some unprecedented challenges, from a global pandemic that shuttered much of the world’s economy for months, to geopolitical strife, to rising inflation that has reached levels not seen in decades. Now, more than ever, Amundi US believes active management – that is, making active investment decisions across all of our portfolios – can help mitigate risk during periods of market volatility.
At Amundi US, active management begins with our own fundamental, bottom-up research process. Our team of dedicated research analysts and portfolio managers analyzes each security under consideration, communicating frequently with the management teams of the companies and other entities issuing the securities, and working together to identify those securities that we believe best meet our investment criteria for our family of funds. Our risk management approach begins with each security under consideration, as we strive to develop a deep understanding of the potential opportunity, while considering any potential risk factors.
Today, as shareholders, we have many options. It is our view that active management can serve shareholders well, not only when markets are thriving, but also during periods of market stress. As you consider your long-term investment goals, we encourage you to work with your financial professional to develop an investment plan that paves the way for you to pursue both your short-term and long-term goals.
2Pioneer Emerging Markets Equity Fund | Annual Report | 9/30/23
We greatly appreciate the trust you have placed in us and look forward to continuing to serve you in the future.
Lisa M. Jones
Head of the Americas, President and CEO of US
Amundi Asset Management US, Inc.
November 2023
Any information in this shareowner report regarding market or economic trends or the factors influencing the Fund’s historical or future performance are statements of opinion as of the date of this report. Past performance is no guarantee of future results.
Pioneer Emerging Markets Equity Fund | Annual Report | 9/30/233
Portfolio Management Discussion | 9/30/23
In the following interview, portfolio managers Patrice Lemonnier and Mickaël Tricot discuss the investment environment for emerging markets equities and the performance of Pioneer Emerging Markets Equity Fund during the 12-month period ended September 30, 2023. Mr. Lemonnier, Head of Emerging Markets Equity and a portfolio manager at Amundi, and Mr. Tricot, Head of Global Emerging Markets Equity and a portfolio manager at Amundi, are responsible for the day-to-day management of the Fund.
| Q | How did the Fund perform during the 12-month period ended September 30, 2023? |
| A | Pioneer Emerging Markets Equity Fund’s Class A shares returned 7.81% at net asset value over the 12-month period ended September 30, 2023, while the Fund’s benchmark, the Morgan Stanley Capital International (MSCI) Emerging Markets Index (the MSCI Index)*, returned 11.70%. During the same period, the average return of the 817 mutual funds in Morningstar’s Diversified Emerging Markets Funds category was 13.97%. |
| Q | How would you describe the investment backdrop for emerging markets equities during the 12-month period ended September 30, 2023? |
| A | Emerging markets stocks produced a solid, double-digit gain for the 12-month period, but the bulk of the positive performance came from the strong rally that occurred in the first three months of the period, between October and December of 2022. Timing played an important role in that rally, as the asset class had experienced a sizable decline over the previous 10 months, due to |
| * | The MSCI information may only be used for your internal use, may not be reproduced or redisseminated in any form and may not be used as a basis for or a component of any financial instruments or products or indices. None of the MSCI information is intended to constitute investment advice or a recommendation to make (or refrain from making) any kind of investment decision and may not be relied on as such. Historical data and analysis should not be taken as an indication or guarantee of any future performance analysis, forecast or prediction. The MSCI information is provided on an “as is” basis and the user of this information assumes the entire risk of any use made of this information. MSCI, each of its affiliates and each other person involved in or related to compiling, computing or creating any MSCI information (collectively, the “MSCI Parties”) expressly disclaims all warranties (including, without limitation, any warranties of originality, accuracy, completeness, timeliness, non-infringement, merchantability and fitness for a particular purpose) with respect to this information. Without limiting any of the foregoing, in no event shall any MSCI Party have any liability for any direct, indirect, special, incidental, punitive, consequential (including, without limitation, lost profits) or any other damages. |
4Pioneer Emerging Markets Equity Fund | Annual Report | 9/30/23
| | concerns about the US Federal Reserve’s (Fed’s) aggressive series of interest-rate increases. By late 2022, however, cooler inflation data prompted investors to look ahead to the point at which the Fed would be finished raising interest rates. The dynamic led to a pronounced decline in the US dollar (USD), which provided an additional boost to emerging markets stock over the final three months of 2022. |
| | The Fund’s benchmark, the MSCI Index, subsequently moved lower in choppy trading following its January 2023 high. Investors began to factor in a “higher for longer” approach to interest-rate policy by the Fed, which dampened sentiment and fueled sizable gains for the USD from July 2023 through the end of the 12-month period. Declining optimism about the outlook for global economic growth also weighed on returns, as did disappointing data out of China, as that country’s economy experienced a tepid rebound after reopening from its COVID-19 lockdowns, and the Chinese property sector emerged, once again, as a source of instability. Despite those headwinds, the MSCI Index finished the 12-month period in positive territory, on the strength of its earlier gains. |
| | Emerging European nations were the top performers over the 12-month period, as the region’s economy held up better than expected through geopolitical issues such as the war in Ukraine, and energy-supply disruptions. Latin America also performed well, with Brazil and Mexico leading the way. Results were mixed across Asia: while Chinese equities underperformed, India and the technology-sensitive stock markets of Taiwan and South Korea posted robust gains. The Middle Eastern markets were notable laggards, as the region gave back ground following its outsized rally prior to the beginning of the reporting period (summer 2022). |
| Q | What were the principal factors that affected the Fund’s benchmark-relative performance during the 12-month period ended September 30, 2023? |
| A | In managing the portfolio, we start with a top-down evaluation of each country in the emerging markets. We view this as a critical step in our process, given the wide divergence in the economic fundamentals and return drivers for individual emerging markets countries. We then analyze the prospects for |
Pioneer Emerging Markets Equity Fund | Annual Report | 9/30/235
| | specific sectors in each country in an attempt to capture another layer of return potential. Finally, we drill down to what we think are the best company ideas in the countries and sectors in which we wish to invest the portfolio’s assets. |
| | During the 12-month period, country allocations were a minor positive factor and benefited the Fund’s benchmark-relative performance, led by an underweight to China and out-of-benchmark positions in some stocks of companies domiciled in the developed markets, but that conduct large portions of their businesses in the emerging markets. A portfolio overweight to India and a zero weighting in Qatar also contributed positively to the Fund’s relative results for the period. On the other hand, the Fund lost some ground versus the benchmark from underweight positions in Poland, Taiwan, and Mexico, together with an overweight to the United Arab Emirates (UAE). |
| | In terms of sector allocation, the Fund’s relative performance lagged due to overweight positions in consumer discretionary and real estate, as well as an underweight to energy. Conversely, a portfolio underweight to the materials sector contributed positively to the Fund’s benchmark-relative results. The portfolio’s cash position, while limited, nonetheless detracted from the Fund’s relative performance, given the positive return for the MSCI Index during the 12-month period. |
| | Stock selection results were a sizable detractor from the Fund’s benchmark-relative returns during the period, with the weakest results occurring in the energy, consumer discretionary, and health care sectors. On the positive side, selection results in the real estate sector aided relative performance. |
| | At the individual stock level, the portfolio’s positions in New Oriental Education & Technology Group (China), Larsen & Toubro (India), and Aldar Properties (UAE) were the leading positive contributors to the Fund’s benchmark-relative returns for the period, while positions in JD.com (China), Saudi National Bank, Fertiglobe (UAE), and Lojas Americanas (Brazil) were the largest detractors from relative performance. |
6Pioneer Emerging Markets Equity Fund | Annual Report | 9/30/23
| Q | Did the Fund have any exposure to derivative securities during the 12-month period ended September 30, 2023? |
| A | No, the Fund had no exposure to derivatives during the reporting period. |
| Q | What are some of the Fund’s largest country-level overweights and underweights, relative to the MSCI Index, as of September 30, 2023? |
| A | Brazilian stocks represented the Fund’s largest country overweight as of period-end. Political uncertainty weighed on the Brazilian market’s performance at various points throughout the 12-month period, but we believe that has already been factored into valuations. We are also optimistic that economic pragmatism will ultimately prevail, and we are positive on the country’s interest-rate outlook. The Fund is also overweight to India, based on our belief that past structural reforms aimed at boosting competitiveness have been showing signs of traction, particularly in the form of rising investment. We view that as an indication that India could be a prime beneficiary of the shift toward a multi-polar world. With that said, we are wary about the short-term outlook for the country with respect to inflation and interest rates. We have seen opportunities in Indonesia as well. We believe the recent passage of laws designed to make the country more attractive for outside investment has provided a solid foundation for growth. In addition, we think Indonesia offers healthy macroeconomic fundamentals and a favorable debt profile. South Korea is another portfolio overweight of note, a reflection of the nation’s robust corporate governance and high exposure to fast-growing industries. |
| | On the other hand, Taiwan is the Fund’s largest underweight relative to the MSCI Index, based on our view that the economy’s reliance on the technology sector may become a headwind if slower global economic growth dampens end-market demand. The Fund is also underweight to Saudi Arabia on the basis of valuation, and to South Africa as well, due to what we view as a lack of needed reforms. Malaysia, which can be vulnerable to slowing economic growth and has a lower representation of bottom-up investment opportunities, is another notable Fund underweight. Finally, the Fund is underweight to China, as we |
Pioneer Emerging Markets Equity Fund | Annual Report | 9/30/237
| | have been concerned about geopolitical risks, instability in the property market, and challenges to the development of new industries. |
| Q | What are some of the Fund’s notable sector overweights and underweights, relative to the MSCI Index, as of September 30, 2023? |
| A | As of September 30, 2023, the Fund is overweight to the real estate sector, where we have seen attractive dividend yields** and valuations. (Dividend yield is a financial ratio, expressed as a percentage, that shows how much a company pays out in dividends each year, relative to its stock price.) We believe the consumer sectors (particularly the durables and retail segments) are also compelling, as companies in those sectors could stand to benefit as households spend a higher proportion of their incomes on discretionary items (such as leisure, travel, and beauty), post-pandemic. In addition, we have seen opportunities in the media and communications industries, where certain companies have continued to benefit from their scales, investment disciplines, and ability to monetize their properties. The portfolio is also overweight to utilities, but we are being very careful with respect to both expectations and valuations for companies in the sector. |
| | With regard to underweights, we have maintained below-benchmark portfolio allocations to the commodity-related sectors (energy and materials), and to financials, which we think may be vulnerable to weaker loan growth and concerns about asset quality. The semiconductor industry (information technology) and health care sector were also key portfolio underweights as of period-end. |
| Q | How would you characterize investment conditions for emerging markets equities heading into the Fund’s new fiscal year? |
| A | We have continued to see some factors that could potentially benefit the performance of emerging markets equities; namely, lower inflation numbers across many countries, a possible change in tone from certain central banks, attractive valuations, and an increasing number of countries starting to benefit from diversification of the global supply chain. Nevertheless, investor |
| ** | Dividends are not guaranteed. |
8Pioneer Emerging Markets Equity Fund | Annual Report | 9/30/23
| | sentiment has been hurt by a weak property market and disappointing economic numbers coming out of China. The nation’s government has remained committed to its policy of avoiding artificial stimulus, as demand in the property area is expected to remain weak. While we believe such stringent policy is prudent, the issue has been raising some concerns and will likely remain a source of short-term volatility. |
| | On a longer-term basis, we continue to think that improvement in capital-expenditure discipline, the lack of major macroeconomic imbalances, and increasing payout ratios remain key factors supporting the performance of emerging market equities. |
Pioneer Emerging Markets Equity Fund | Annual Report | 9/30/239
Please refer to the Schedule of Investments on pages 19 - 28 for a full listing of Fund securities.
All investments are subject to risk, including the possible loss of principal. In the past several years, financial markets have experienced increased volatility and heightened uncertainty. The market prices of securities may go up or down, sometimes rapidly or unpredictably, due to general market conditions, such as real or perceived adverse economic, political, or regulatory conditions, recessions, inflation, changes in interest or currency rates, lack of liquidity in the bond markets, the spread of infectious illness or other public health issues, armed conflict including Russia's military invasion of Ukraine, sanctions against Russia, other nations or individuals or companies and possible countermeasures, market disruptions caused by tariffs, trade disputes or other government actions, or adverse investor sentiment. These conditions may continue, recur, worsen or spread.
Investing in foreign and/or emerging markets securities involves risks relating to interest rates, currency exchange rates, economic, and political conditions.
To the extent the Fund invests in issuers located within specific countries or regions, the Fund may be particularly affected by adverse markets, rates, and events, which may occur in those countries and regions.
The Fund invests in REIT (real estate investment trust) securities, the value of which can fall for a variety of reasons, such as declines in rental income, fluctuating interest rates, poor property management, environmental liabilities, uninsured damage, increased competition, or changes in real estate tax laws.
Investing in other investment companies, including exchange traded funds (ETFs), subjects the Fund to the risks of investing in the underlying securities or assets held by those funds.
For more information on this or any Pioneer fund, please visit amundi.com/usinvestors or call 1-800-622-9876. This material must be preceded or accompanied by the Fund's current prospectus or summary prospectus.
Any information in this shareholder report regarding market or economic trends or the factors influencing the Fund’s historical or future performance are statements of opinion as of the date of this report. Past performance is no guarantee of future results.
10Pioneer Emerging Markets Equity Fund | Annual Report | 9/30/23
Portfolio Summary | 9/30/23
Sector Distribution
(As a percentage of total investments)*
Geographical Distribution
(As a percentage of total investments based on country of domicile)*
Pioneer Emerging Markets Equity Fund | Annual Report | 9/30/2311
10 Largest Holdings
| (As a percentage of total investments)* |
| 1. | Taiwan Semiconductor Manufacturing Co., Ltd.(A.D.R.) | 7.08% |
| 2. | Tencent Holdings, Ltd. | 5.00 |
| 3. | Samsung Electronics Co., Ltd. | 3.59 |
| 4. | Samsung Electronics Co., Ltd. | 2.52 |
| 5. | HDFC Bank, Ltd. | 1.71 |
| 6. | Meituan, Class B (144A) | 1.66 |
| 7. | Bank Central Asia Tbk PT | 1.53 |
| 8. | SK Hynix, Inc. | 1.53 |
| 9. | Axis Bank, Ltd. | 1.51 |
| 10. | Aldar Properties PJSC | 1.34 |
| | |
| * | Excludes short-term investments and all derivative contracts except for options purchased. The Fund is actively managed, and current holdings may be different. The holdings listed should not be considered recommendations to buy or sell any securities. |
Prices and Distributions | 9/30/23
Net Asset Value per Share
| Class | 9/30/23 | 9/30/22 |
| A | $9.77 | $9.41 |
| C | $9.71 | $9.35 |
| Y | $9.79 | $9.43 |
| | | |
Distributions per Share: 10/1/22 - 9/30/23
| Class | Net
Investment
Income | Short-Term
Capital Gains | Long-Term
Capital Gains |
| A | $0.3745 | $— | $— |
| C | $0.2971 | $— | $— |
| Y | $0.4064 | $— | $— |
Index Definitions
The Morgan Stanley Capital International (MSCI) Emerging Markets NR Index measures the free-float weighted equity index that captures large and mid-cap representation across emerging markets countries. The index covers approximately 85% of the free float-adjusted market capitalization in each country. Indices are unmanaged and their returns assume reinvestment of dividends and do not reflect any fees or expenses. It is not possible to invest directly in an index.
The index defined here pertains to the “Value of $10,000 Investment” and “Value of $5 Million Investment” charts on pages 14 - 16.
Pioneer Emerging Markets Equity Fund | Annual Report | 9/30/2313
| Performance Update | 9/30/23 | Class A Shares |
Investment Returns
The mountain chart on the right shows the change in value of a $10,000 investment made in Class A shares of Pioneer Emerging Markets Equity Fund at public offering price during the periods shown, compared to that of the MSCI Emerging Markets NR Index.*
Average Annual Total Returns
(As of September 30, 2023) |
| Period | Net
Asset
Value
(NAV) | Public
Offering
Price
(POP) | MSCI
Emerging
Markets NR
Index |
Life-of-Class
(10/2/19) | 1.65% | 0.16% | 1.27% |
| 1 Year | 7.81 | 1.65 | 11.70 |
Expense Ratio
(Per prospectus dated February 1, 2023) |
| Gross | Net |
| 2.51% | 1.05% |
Value of $10,000 Investment
Call 1-800-225-6292 or visit www.amundi.com/us for the most recent month-end performance results. Current performance may be lower or higher than the performance data quoted.
The performance data quoted represents past performance, which is no guarantee of future results. Investment return and principal value will fluctuate, and shares, when redeemed, may be worth more or less than their original cost.
NAV results represent the percent change in net asset value per share. NAV returns would have been lower had sales charges been reflected. POP returns reflect deduction of maximum 5.75% sales charge. All results are historical and assume the reinvestment of dividends and capital gains. Other share classes are available for which performance and expenses will differ.
Performance results reflect any applicable expense waivers in effect during the periods shown. Without such waivers Fund performance would be lower. Waivers may not be in effect for all funds. Certain fee waivers are contractual through a specified period. Otherwise, fee waivers can be rescinded at any time. See the prospectus and financial statements for more information.
The net expense ratio reflects the contractual expense limitation in effect through February 1, 2024 for Class A shares. There can be no assurance that Amundi will extend the expense limitation beyond such time. Please see the prospectus for more information.
* Performance of Class A shares shown in the graph above is from the inception of Class A shares on 10/2/19 through 9/30/23 . Index information shown in the graph above is from 10/31/19 through 9/30/23.
The performance table and graph do not reflect the deduction of fees and taxes that a shareowner would pay on Fund distributions or the redemption of Fund shares.
Please refer to the financial highlights for more current expense ratios.
14Pioneer Emerging Markets Equity Fund | Annual Report | 9/30/23
| Performance Update | 9/30/23 | Class C Shares |
Investment Returns
The mountain chart on the right shows the change in value of a $10,000 investment made in Class C shares of Pioneer Emerging Markets Equity Fund during the periods shown, compared to that of the MSCI Emerging Markets NR Index.*
Average Annual Total Returns
(As of September 30, 2023) |
| Period | If
Held | If
Redeemed | MSCI
Emerging
Markets NR
Index |
Life-of-Class
(10/2/19) | 0.93% | 0.93% | 1.27% |
| 1 Year | 7.02 | 6.02 | 11.70 |
Expense Ratio
(Per prospectus dated February 1, 2023) |
| Gross | Net |
| 3.22% | 1.80% |
Value of $10,000 Investment
Call 1-800-225-6292 or visit www.amundi.com/us for the most recent month-end performance results. Current performance may be lower or higher than the performance data quoted.
The performance data quoted represents past performance, which is no guarantee of future results. Investment return and principal value will fluctuate, and shares, when redeemed, may be worth more or less than their original cost.
Class C shares held for less than one year are also subject to a 1% contingent deferred sales charge (CDSC). “If Held” results represent the percent change in net asset value per share. “If Redeemed” returns reflect deduction of the CDSC for the one-year period, assuming a complete redemption of shares at the last price calculated on the last business day of the period, and no CDSC for the Life-of-Class period. All results are historical and assume the reinvestment of dividends and capital gains. Other share classes are available for which performance and expenses will differ.
Performance results reflect any applicable expense waivers in effect during the periods shown. Without such waivers Fund performance would be lower. Waivers may not be in effect for all funds. Certain fee waivers are contractual through a specified period. Otherwise, fee waivers can be rescinded at any time. See the prospectus and financial statements for more information.
The net expense ratio reflects the contractual expense limitation in effect through February 1, 2024 for Class C shares. There can be no assurance that Amundi will extend the expense limitation beyond such time. Please see the prospectus for more information.
* Performance of Class C shares shown in the graph above is from the inception of Class C shares on 10/2/19 through 9/30/23. Index information shown in the graph above is from 10/31/19 through 9/30/23.
The performance table and graph do not reflect the deduction of fees and taxes that a shareowner would pay on Fund distributions or the redemption of Fund shares.
Please refer to the financial highlights for more current expense ratios.
Pioneer Emerging Markets Equity Fund | Annual Report | 9/30/2315
| Performance Update | 9/30/23 | Class Y Shares |
Investment Returns
The mountain chart on the right shows the change in value of a $5 million investment made in Class Y shares of Pioneer Emerging Markets Equity Fund during the periods shown, compared to that of the MSCI Emerging Markets NR Index.*
Average Annual Total Returns
(As of September 30, 2023) |
| Period | Net
Asset
Value
(NAV) | MSCI
Emerging
Markets NR
Index |
Life-of-Class
(10/2/19) | 1.95% | 1.27% |
| 1 Year | 8.15 | 11.70 |
Expense Ratio
(Per prospectus dated February 1, 2023) |
| Gross | Net |
| 2.21% | 0.75% |
Value of $5 Million Investment
Call 1-800-225-6292 or visit www.amundi.com/us for the most recent month-end performance results. Current performance may be lower or higher than the performance data quoted.
The performance data quoted represents past performance, which is no guarantee of future results. Investment return and principal value will fluctuate, and shares, when redeemed, may be worth more or less than their original cost.
Class Y shares are not subject to sales charges and are available for limited groups of eligible investors, including institutional investors. All results are historical and assume the reinvestment of dividends and capital gains. Other share classes are available for which performance and expenses will differ.
Performance results reflect any applicable expense waivers in effect during the periods shown. Without such waivers Fund performance would be lower. Waivers may not be in effect for all funds. Certain fee waivers are contractual through a specified period. Otherwise, fee waivers can be rescinded at any time. See the prospectus and financial statements for more information.
The net expense ratio reflects the contractual expense limitation in effect through February 1, 2024 for Class Y shares. There can be no assurance that Amundi US will extend the expense limitation beyond such time. Please see the prospectus and financial statements for more information.
* Performance of Class Y shares shown in the graph above is from the inception of Class Y shares on 10/2/19 through 9/30/23. Index information shown in the graph above is from 10/31/19 through 9/30/23.
The performance table and graph do not reflect the deduction of fees and taxes that a shareowner would pay on Fund distributions or the redemption of Fund shares.
Please refer to the financial highlights for more current expense ratios.
16Pioneer Emerging Markets Equity Fund | Annual Report | 9/30/23
Comparing Ongoing Fund Expenses
As a shareowner in the Fund, you incur two types of costs:
| (1) | ongoing costs, including management fees, distribution and/or service (12b-1) fees, and other Fund expenses; and |
| (2) | transaction costs, including sales charges (loads) on purchase payments. |
This example is intended to help you understand your ongoing expenses (in dollars) of investing in the Fund and to compare these costs with the ongoing costs of investing in other mutual funds. The example is based on an investment of $1,000 at the beginning of the Fund’s latest six-month period and held throughout the six months.
Using the Tables
Actual Expenses
The first table below provides information about actual account values and actual expenses. You may use the information in this table, together with the amount you invested, to estimate the expenses that you paid over the period as follows:
| (1) | Divide your account value by $1,000
Example: an $8,600 account value ÷ $1,000 = 8.6 |
| (2) | Multiply the result in (1) above by the corresponding share class’s number in the third row under the heading entitled “Expenses Paid During Period” to estimate the expenses you paid on your account during this period. |
Expenses Paid on a $1,000 Investment in Pioneer Emerging Markets Equity Fund
Based on actual returns from April 1, 2023 through September 30, 2023.
| Share Class | A | C | Y |
Beginning Account
Value on 4/1/23 | $1,000.00 | $1,000.00 | $1,000.00 |
Ending Account Value
(after expenses) on 9/30/23 | $959.70 | $956.60 | $961.70 |
Expenses Paid
During Period* | $5.35 | $8.83 | $3.88 |
| | |
| * | Expenses are equal to the Fund’s annualized expense ratio of 1.09%, 1.80%, and 0.79% for Class A, Class C, and Class Y shares, respectively, multiplied by the average account value over the period, multiplied by 183/365 (to reflect the partial year period). |
Pioneer Emerging Markets Equity Fund | Annual Report | 9/30/2317
Comparing Ongoing Fund Expenses (continued)
Hypothetical Example for Comparison Purposes
The table below provides information about hypothetical account values and hypothetical expenses based on the Fund’s actual expense ratio and an assumed rate of return of 5% per year before expenses, which is not the Fund’s actual return. The hypothetical account values and expenses may not be used to estimate the actual ending account balance or expenses you paid for the period.
You may use this information to compare the ongoing costs of investing in the Fund and other funds. To do so, compare this 5% hypothetical example with the 5% hypothetical examples that appear in the shareholder reports of the other funds.
Please note that the expenses shown in the tables are meant to highlight your ongoing costs only and do not reflect any transaction costs, such as sales charges (loads) that are charged at the time of the transaction. Therefore, the table below is useful in comparing ongoing costs only and will not help you determine the relative total costs of owning different funds. In addition, if these transaction costs were included, your costs would have been higher.
Expenses Paid on a $1,000 Investment in Pioneer Emerging Markets Equity Fund
Based on a hypothetical 5% return per year before expenses, reflecting the period from April 1, 2023 through September 30, 2023.
| Share Class | A | C | Y |
Beginning Account
Value on 4/1/23 | $1,000.00 | $1,000.00 | $1,000.00 |
Ending Account Value
(after expenses) on 9/30/23 | $1,019.60 | $1,016.04 | $1,021.11 |
Expenses Paid
During Period* | $5.52 | $9.10 | $4.00 |
| | |
| * | Expenses are equal to the Fund’s annualized expense ratio of 1.09%, 1.80%, and 0.79% for Class A, Class C, and Class Y shares, respectively, multiplied by the average account value over the period, multiplied by 183/365 (to reflect the partial year period). |
18Pioneer Emerging Markets Equity Fund | Annual Report | 9/30/23
Schedule of Investments | 9/30/23
| Shares | | | | | | Value |
| | UNAFFILIATED ISSUERS — 98.0% | |
| | Common Stocks — 93.5% of Net Assets | |
| | Automobile Components — 0.3% | |
| 186 | Hyundai Mobis Co., Ltd. | $ 33,137 |
| | Total Automobile Components | $33,137 |
|
|
| | Banks — 14.6% | |
| 12,460 | Abu Dhabi Islamic Bank PJSC | $ 38,188 |
| 53,483(a) | Alpha Services and Holdings S.A. | 70,988 |
| 14,041 | Axis Bank, Ltd. | 174,446 |
| 17,001 | Banco Bradesco S.A. (A.D.R.) | 48,453 |
| 10,286 | Banco do Brasil S.A. | 96,546 |
| 310,200 | Bank Central Asia Tbk PT | 176,975 |
| 168,000 | Bank Negara Indonesia Persero Tbk PT | 112,190 |
| 20,500 | China Merchants Bank Co., Ltd., Class H | 85,054 |
| 51,200 | CIMB Group Holdings Bhd | 59,163 |
| 15,200 | Grupo Financiero Banorte S.A.B de CV, Class O | 127,435 |
| 3,556 | Hana Financial Group, Inc. | 111,830 |
| 1,693 | HDFC Bank, Ltd. (A.D.R.) | 99,904 |
| 10,765 | HDFC Bank, Ltd. | 197,136 |
| 962 | ICICI Bank, Ltd. (A.D.R.) | 22,241 |
| 8,270 | ICICI Bank, Ltd. | 94,578 |
| 2,097 | IndusInd Bank, Ltd. | 36,048 |
| 12,900 | Kasikornbank PCL | 44,734 |
| 535 | Komercni Banka AS | 15,542 |
| 12,273 | Saudi National Bank | 107,420 |
| 22,335 +# | Sberbank of Russia PJSC | 3,029 |
| | Total Banks | $1,721,900 |
|
|
| | Beverages — 2.9% | |
| 1,251 | Coca-Cola Icecek AS | $ 17,938 |
| 3,256 | Embotelladora Andina S.A. (A.D.R.) | 42,165 |
| 612 | Fomento Economico Mexicano S.A.B de CV (A.D.R.) | 66,800 |
| 3,733 | Fomento Economico Mexicano S.A.B de CV | 40,769 |
| 142,000 | Thai Beverage PCL | 59,590 |
| 14,000 | Tsingtao Brewery Co., Ltd., Class H | 113,883 |
| | Total Beverages | $341,145 |
|
|
| | Broadline Retail — 4.7% | |
| 1,494(a) | Alibaba Group Holding, Ltd. (A.D.R.) | $ 129,590 |
| 11,800(a) | Alibaba Group Holding, Ltd. | 127,928 |
| 2,643 | JD.com, Inc. (A.D.R.) | 76,991 |
| 3,314 | JD.com, Inc., Class A | 48,169 |
| 843 | Naspers, Ltd., Class N | 134,528 |
| 11,618 | Woolworths Holdings, Ltd. | 41,531 |
| | Total Broadline Retail | $558,737 |
|
|
The accompanying notes are an integral part of these financial statements.
Pioneer Emerging Markets Equity Fund | Annual Report | 9/30/2319
Schedule of Investments | 9/30/23 (continued)
| Shares | | | | | | Value |
| | Building Products — 0.5% | |
| 41,000 | Xinyi Glass Holdings, Ltd. | $ 53,270 |
| | Total Building Products | $53,270 |
|
|
| | Capital Markets — 0.5% | |
| 23,500 | B3 S.A. - Brasil Bolsa Balcao | $ 57,458 |
| | Total Capital Markets | $57,458 |
|
|
| | Chemicals — 1.3% | |
| 40,445 | Fertiglobe Plc | $ 38,435 |
| 11,900 | Hangzhou Oxygen Plant Group Co., Ltd., Class A | 52,903 |
| 90 | LG Chem, Ltd. | 33,089 |
| 814 | OCI NV | 22,642 |
| | Total Chemicals | $147,069 |
|
|
| | Construction & Engineering — 1.7% | |
| 4,169 | Larsen & Toubro, Ltd. | $ 151,645 |
| 1,965(a) | Samsung Engineering Co., Ltd. | 44,028 |
| | Total Construction & Engineering | $195,673 |
|
|
| | Construction Materials — 0.5% | |
| 2,493 | Grasim Industries, Ltd. | $ 58,366 |
| | Total Construction Materials | $58,366 |
|
|
| | Consumer Staples Distribution & Retail — 1.3% | |
| 20,300 | Atacadao S.A. | $ 35,943 |
| 50,300 | CP All PCL | 83,507 |
| 639 | E-MART, Inc. | 33,329 |
| | Total Consumer Staples Distribution & Retail | $152,779 |
|
|
| | Diversified Consumer Services — 1.4% | |
| 57,000 | China Education Group Holdings, Ltd. | $ 46,235 |
| 1,934(a) | New Oriental Education & Technology Group, Inc. (A.D.R.) | 113,236 |
| | Total Diversified Consumer Services | $159,471 |
|
|
| | Diversified Telecommunication Services — 1.1% | |
| 39,000 | Singapore Telecommunications, Ltd. | $ 68,795 |
| 270,200 | Telkom Indonesia Persero Tbk PT | 65,534 |
| | Total Diversified Telecommunication Services | $134,329 |
|
|
| | Electric Utilities — 1.4% | |
| 8,727 | Enel Chile S.A. (A.D.R.) | $ 25,832 |
| 39,845 | Power Grid Corp. of India, Ltd. | 95,800 |
| 18,800 | Tenaga Nasional Bhd | 39,997 |
| | Total Electric Utilities | $161,629 |
|
|
The accompanying notes are an integral part of these financial statements.
20Pioneer Emerging Markets Equity Fund | Annual Report | 9/30/23
| Shares | | | | | | Value |
| | Electrical Equipment — 0.4% | |
| 14,800 | Zhuzhou CRRC Times Electric Co., Ltd., Class H | $ 51,172 |
| | Total Electrical Equipment | $51,172 |
|
|
| | Electronic Equipment, Instruments & Components — 2.3% | |
| 11,000 | Delta Electronics, Inc. | $ 110,587 |
| 40,000 | Hon Hai Precision Industry Co., Ltd. | 128,947 |
| 6,000 | Taiwan Union Technology Corp. | 25,344 |
| | Total Electronic Equipment, Instruments & Components | $264,878 |
|
|
| | Entertainment — 1.3% | |
| 1,491 | NetEase, Inc. (A.D.R.) | $ 149,338 |
| | Total Entertainment | $149,338 |
|
|
| | Financial Services — 0.4% | |
| 7,976 | Chailease Holding Co., Ltd. | $ 44,724 |
| | Total Financial Services | $44,724 |
|
|
| | Food Products — 2.2% | |
| 3,651 | Almarai Co. JSC | $ 62,024 |
| 76,500 | Indofood CBP Sukses Makmur Tbk PT | 54,801 |
| 26,000 | Tingyi Cayman Islands Holding Corp. | 36,354 |
| 48,000 | Uni-President Enterprises Corp. | 104,361 |
| | Total Food Products | $257,540 |
|
|
| | Ground Transportation — 0.5% | |
| 5,320 | Localiza Rent a Car S.A. | $ 61,979 |
| | Total Ground Transportation | $61,979 |
|
|
| | Health Care Providers & Services — 1.3% | |
| 1,615 | Apollo Hospitals Enterprise, Ltd. | $ 99,977 |
| 91,900 | Bangkok Chain Hospital PCL | 49,721 |
| | Total Health Care Providers & Services | $149,698 |
|
|
| | Hotels, Restaurants & Leisure — 3.8% | |
| 2,112 | Kangwon Land, Inc. | $ 23,585 |
| 1,471(a) | MakeMyTrip, Ltd. | 59,605 |
| 13,220(a) | Meituan, Class B (144A) | 191,919 |
| 2,819(a) | Trip.com Group, Ltd. (A.D.R.) | 98,581 |
| 1,406 | Yum China Holdings, Inc. | 78,342 |
| | Total Hotels, Restaurants & Leisure | $452,032 |
|
|
| | Household Durables — 0.8% | |
| 1,982 | Coway Co., Ltd. | $ 60,516 |
| 9,500 | Ez Tec Empreendimentos e Participacoes S.A. | 35,569 |
| | Total Household Durables | $96,085 |
|
|
The accompanying notes are an integral part of these financial statements.
Pioneer Emerging Markets Equity Fund | Annual Report | 9/30/2321
Schedule of Investments | 9/30/23 (continued)
| Shares | | | | | | Value |
| | Independent Power and Renewable Electricity Producers
— 0.9% | |
| 52,000 | China Longyuan Power Group Corp., Ltd., Class H | $ 45,522 |
| 51,707 | NHPC, Ltd. | 32,637 |
| 136,000 | Xinyi Energy Holdings, Ltd. | 28,844 |
| | Total Independent Power and Renewable Electricity Producers | $107,003 |
|
|
| | Industrial Conglomerates — 1.5% | |
| 2,282 | Bidvest Group, Ltd. | $ 32,732 |
| 10,649 | KOC Holding AS | 56,632 |
| 667 | LG Corp. | 41,303 |
| 599 | Samsung C&T Corp. | 47,661 |
| | Total Industrial Conglomerates | $178,328 |
|
|
| | Insurance — 3.2% | |
| 11,000 | AIA Group, Ltd. | $ 88,980 |
| 28,200 | Caixa Seguridade Participacoes S/A | 62,610 |
| 795 | DB Insurance Co., Ltd. | 52,652 |
| 6,491 | HDFC Life Insurance Co., Ltd. (144A) | 49,818 |
| 8,937 | ICICI Prudential Life Insurance Co., Ltd. (144A) | 60,913 |
| 48,000 | PICC Property & Casualty Co., Ltd., Class H | 61,382 |
| | Total Insurance | $376,355 |
|
|
| | Interactive Media & Services — 5.5% | |
| 255(a) | Baidu, Inc. (A.D.R.) | $ 34,259 |
| 2,000(a) | Baidu, Inc., Class A | 33,713 |
| 14,900 | Tencent Holdings, Ltd. | 577,451 |
| | Total Interactive Media & Services | $645,423 |
|
|
| | IT Services — 2.6% | |
| 5,590 | HCL Technologies, Ltd. | $ 82,924 |
| 3,365 | Infosys, Ltd. (A.D.R.) | 57,575 |
| 4,406 | Infosys, Ltd. | 76,022 |
| 2,127 | Tata Consultancy Services, Ltd. | 90,225 |
| | Total IT Services | $306,746 |
|
|
| | Machinery — 0.7% | |
| 9,775 | Iochpe Maxion S.A. | $ 26,642 |
| 44,000 | Weichai Power Co., Ltd., Class H | 59,701 |
| | Total Machinery | $86,343 |
|
|
| | Marine Transportation — 0.2% | |
| 17,000 | SITC International Holdings Co., Ltd. | $ 28,539 |
| | Total Marine Transportation | $28,539 |
|
|
| | Metals & Mining — 2.8% | |
| 4,083 | Anglogold Ashanti Plc | $ 65,712 |
| 12,454 | Grupo Mexico S.A.B de CV | 58,949 |
The accompanying notes are an integral part of these financial statements.
22Pioneer Emerging Markets Equity Fund | Annual Report | 9/30/23
| Shares | | | | | | Value |
| | Metals & Mining — (continued) | |
| 20,245 | Hindalco Industries, Ltd. | $ 119,643 |
| 125 | Korea Zinc Co., Ltd. | 46,706 |
| 80(a) +# | MMC Norilsk Nickel PJSC | 672 |
| 3,508(a) | Saudi Arabian Mining Co. | 37,757 |
| 48,470 +# | United Co. RUSAL International PJSC | 1,045 |
| | Total Metals & Mining | $330,484 |
|
|
| | Oil, Gas & Consumable Fuels — 0.8% | |
| 2,310(a) +# | Gazprom PJSC | $ 201 |
| 14,254(a) +# | Gazprom PJSC | 1,239 |
| 1,309 +# | LUKOIL PJSC | 4,535 |
| 600 | Petroleo Brasileiro S.A. | 4,523 |
| 4,400(a) | PRIO S.A. | 41,176 |
| 4,423 | Saudi Arabian Oil Co. (144A) | 41,279 |
| 30 +# | Surgutneftegas PJSC | — |
| | Total Oil, Gas & Consumable Fuels | $92,953 |
|
|
| | Personal Care Products — 0.2% | |
| 10,100(a) | Natura & Co. Holding S.A. | $ 29,256 |
| | Total Personal Care Products | $29,256 |
|
|
| | Pharmaceuticals — 0.4% | |
| 3,521 | Cipla, Ltd. | $ 50,293 |
| | Total Pharmaceuticals | $50,293 |
|
|
| | Real Estate Management & Development — 7.5% | |
| 98,660 | Aldar Properties PJSC | $ 154,744 |
| 7,731 | Aliansce Sonae Shopping Centers S.A. | 34,744 |
| 78,000 | Ayala Land, Inc. | 40,581 |
| 27,400 | CapitaLand Investment, Ltd. | 61,939 |
| 22,000 | China Overseas Land & Investment, Ltd. | 45,202 |
| 30,000 | China Resources Land, Ltd. | 118,230 |
| 572,400 | Ciputra Development Tbk PT | 37,770 |
| 12,700 | Corp. Inmobiliaria Vesta S.A.B de CV | 41,895 |
| 8,725 | DLF, Ltd. | 55,725 |
| 52,683 | Emaar Properties PJSC | 115,333 |
| 44,000 | Hang Lung Properties, Ltd. | 59,807 |
| 17,000 | Longfor Group Holdings, Ltd. (144A) | 30,047 |
| 5,000 | Sun Hung Kai Properties, Ltd. | 53,181 |
| 14,800 | Swire Properties, Ltd. | 30,880 |
| | Total Real Estate Management & Development | $880,078 |
|
|
| | Semiconductors & Semiconductor Equipment — 8.8% | |
| 2,082 | SK Hynix, Inc. | $ 176,840 |
The accompanying notes are an integral part of these financial statements.
Pioneer Emerging Markets Equity Fund | Annual Report | 9/30/2323
Schedule of Investments | 9/30/23 (continued)
| Shares | | | | | | Value |
| | Semiconductors & Semiconductor Equipment —
(continued) | |
| 9,400 | Taiwan Semiconductor Manufacturing Co., Ltd. (A.D.R.) | $ 816,860 |
| 56,000 | Xinyi Solar Holdings, Ltd. | 41,651 |
| | Total Semiconductors & Semiconductor Equipment | $1,035,351 |
|
|
| | Specialty Retail — 1.4% | |
| 36,000 | China Meidong Auto Holdings, Ltd. | $ 19,860 |
| 14,015(a) +# | Detsky Mir PJSC (144A) | 507 |
| 131,000 | Topsports International Holdings, Ltd. (144A) | 99,466 |
| 13,300 | Vibra Energia S.A. | 50,061 |
| | Total Specialty Retail | $169,894 |
|
|
| | Technology Hardware, Storage & Peripherals — 4.0% | |
| 8,185 | Samsung Electronics Co., Ltd. | $ 414,693 |
| 46 | Samsung Electronics Co., Ltd. (G.D.R.) (144A) | 57,862 |
| | Total Technology Hardware, Storage & Peripherals | $472,555 |
|
|
| | Textiles, Apparel & Luxury Goods — 4.2% | |
| 955 | Cie Financiere Richemont S.A. | $ 116,639 |
| 3,371 | Fila Holdings Corp. | 90,152 |
| 42,600(a) | Samsonite International S.A. (144A) | 145,774 |
| 4,300 | Shenzhou International Group Holdings, Ltd. | 41,052 |
| 111,000 | Xtep International Holdings, Ltd. | 101,853 |
| | Total Textiles, Apparel & Luxury Goods | $495,470 |
|
|
| | Transportation Infrastructure — 0.5% | |
| 60,000 | Jiangsu Expressway Co., Ltd., Class H | $ 54,059 |
| | Total Transportation Infrastructure | $54,059 |
|
|
| | Water Utilities — 1.2% | |
| 7,872 | Cia de Saneamento Basico do Estado de Sao Paulo (A.D.R.) | $ 95,409 |
| 64,000 | Guangdong Investment, Ltd. | 48,824 |
| | Total Water Utilities | $144,233 |
|
|
| | Wireless Telecommunication Services — 1.9% | |
| 8,962 | Bharti Airtel, Ltd. | $ 99,998 |
| 21,000 | Far EasTone Telecommunications Co., Ltd. | 47,280 |
| 2,102 | SK Telecom Co., Ltd. | 80,918 |
| | Total Wireless Telecommunication Services | $228,196 |
|
|
| | Total Common Stocks
(Cost $10,460,876) | $11,013,968 |
|
|
| | Preferred Stock — 4.5% of Net Assets | |
| | Banks — 0.8% | |
| 12,631(b) | Banco Bradesco S.A. | $ 35,934 |
The accompanying notes are an integral part of these financial statements.
24Pioneer Emerging Markets Equity Fund | Annual Report | 9/30/23
| Shares | | | | | | Value |
| | Banks — (continued) | |
| 31,200(b) | Itausa S.A. | $ 56,174 |
| 21,762(b) +# | Sberbank of Russia PJSC | 2,942 |
| | Total Banks | $95,050 |
|
|
| | Oil, Gas & Consumable Fuels — 1.2% | |
| 20,500(b) | Petroleo Brasileiro S.A. | $ 141,274 |
| | Total Oil, Gas & Consumable Fuels | $141,274 |
|
|
| | Technology Hardware, Storage & Peripherals — 2.5% | |
| 7,194(b) | Samsung Electronics Co., Ltd. | $ 290,441 |
| | Total Technology Hardware, Storage & Peripherals | $290,441 |
|
|
| | Total Preferred Stock
(Cost $562,461) | $526,765 |
|
|
| | Rights/Warrants — 0.0%† of Net Assets | |
| | Banks — 0.0%† | |
| BRL 433(a) | Itausa S.A., 10/6/23 | $ 220 |
| | Total Banks | $220 |
|
|
| | Ground Transportation — 0.0%† | |
| BRL 39(a) | Localiza Rent a Car S.A., 11/7/23 | $ 139 |
| | Total Ground Transportation | $139 |
|
|
| | Total Rights/Warrants
(Cost $—) | $359 |
|
|
| | TOTAL INVESTMENTS IN UNAFFILIATED ISSUERS — 98.0%
(Cost $11,023,337) | $ 11,541,092 |
| | OTHER ASSETS AND LIABILITIES — 2.0% | $ 230,739 |
| | net assets — 100.0% | $11,771,831 |
| | | | | | | |
| (A.D.R.) | American Depositary Receipts. |
| (G.D.R.) | Global Depositary Receipts. |
| (144A) | The resale of such security is exempt from registration under Rule 144A of the Securities Act of 1933. Such securities may be resold normally to qualified institutional buyers. At September 30, 2023, the value of these securities amounted to $677,585, or 5.8% of net assets. |
| (a) | Non-income producing security. |
| (b) | Issued as preference shares. |
| + | Security is valued using significant unobservable inputs (Level 3). |
| † | Amount rounds to less than 0.1%. |
| # | Securities are restricted as to resale. |
The accompanying notes are an integral part of these financial statements.
Pioneer Emerging Markets Equity Fund | Annual Report | 9/30/2325
Schedule of Investments | 9/30/23 (continued)
| Restricted Securities | Acquisition date | Cost | Value |
| Detsky Mir PJSC | 10/1/2019 | $20,368 | $ 507 |
| Gazprom PJSC | 10/1/2019 | 45,761 | 1,239 |
| Gazprom PJSC | 11/16/2020 | 5,453 | 201 |
| LUKOIL PJSC | 9/15/2020 | 96,414 | 4,535 |
| MMC Norilsk Nickel PJSC | 10/1/2019 | 20,493 | 672 |
| Sberbank of Russia PJSC | 10/1/2019 | 67,203 | 2,942 |
| Sberbank of Russia PJSC | 9/15/2020 | 71,103 | 3,029 |
| Surgutneftegas PJSC | 10/1/2019 | 17 | — |
| United Co. RUSAL International PJSC | 3/29/2021 | 30,782 | 1,045 |
| Total Restricted Securities | | | $14,170 |
| % of Net assets | | | 0.1% |
Distribution of investments by country of domicile (excluding short-term investments) as a percentage of total investments in securities, is as follows:
| China | 22.4% |
| India | 16.2% |
| South Korea | 14.2% |
| Taiwan | 11.1% |
| Brazil | 7.9% |
| Hong Kong | 5.0% |
| Indonesia | 3.9% |
| United Arab Emirates | 3.0% |
| Mexico | 2.9% |
| Saudi Arabia | 2.1% |
| Thailand | 2.1% |
| South Africa | 1.8% |
| United States | 1.3% |
| Singapore | 1.1% |
| Switzerland | 1.0% |
| Other (individually less than 1%) | 4.0% |
| | 100.0% |
Principal amounts are denominated in U.S. dollars (“USD”) unless otherwise noted.
Purchases and sales of securities (excluding short-term investments) for the year ended September 30, 2023, aggregated $6,379,996 and $6,389,744, respectively.
The accompanying notes are an integral part of these financial statements.
26Pioneer Emerging Markets Equity Fund | Annual Report | 9/30/23
At September 30, 2023, the net unrealized appreciation on investments based on cost for federal tax purposes of $11,375,666 was as follows:
| Aggregate gross unrealized appreciation for all investments in which there is an excess of value over tax cost | $ 2,133,873 |
| Aggregate gross unrealized depreciation for all investments in which there is an excess of tax cost over value | (1,968,447) |
| Net unrealized appreciation | $ 165,426 |
Various inputs are used in determining the value of the Fund's investments. These inputs are summarized in the three broad levels below.
| Level 1 | – | unadjusted quoted prices in active markets for identical securities. |
| Level 2 | – | other significant observable inputs (including quoted prices for similar securities, interest rates, prepayment speeds, credit risks, etc.). See Notes to Financial Statements — Note 1A. |
| Level 3 | – | significant unobservable inputs (including the Adviser's own assumptions in determining fair value of investments). See Notes to Financial Statements — Note 1A. |
The following is a summary of the inputs used as of September 30, 2023, in valuing the Fund's investments:
| | Level 1 | Level 2 | Level 3 | Total |
| Common Stocks | | | | |
| Automobile Components | $ — | $ 33,137 | $ — | $ 33,137 |
| Banks | 394,579 | 1,324,292 | 3,029 | 1,721,900 |
| Beverages | 149,734 | 191,411 | — | 341,145 |
| Broadline Retail | 206,581 | 352,156 | — | 558,737 |
| Building Products | — | 53,270 | — | 53,270 |
| Capital Markets | 57,458 | — | — | 57,458 |
| Chemicals | — | 147,069 | — | 147,069 |
| Construction & Engineering | — | 195,673 | — | 195,673 |
| Construction Materials | — | 58,366 | — | 58,366 |
| Consumer Staples Distribution & Retail | 35,943 | 116,836 | — | 152,779 |
| Diversified Consumer Services | 113,236 | 46,235 | — | 159,471 |
| Diversified Telecommunication Services | — | 134,329 | — | 134,329 |
| Electric Utilities | 25,832 | 135,797 | — | 161,629 |
| Electrical Equipment | — | 51,172 | — | 51,172 |
| Electronic Equipment, Instruments & Components | — | 264,878 | — | 264,878 |
| Entertainment | 149,338 | — | — | 149,338 |
| Financial Services | — | 44,724 | — | 44,724 |
| Food Products | — | 257,540 | — | 257,540 |
| Ground Transportation | 61,979 | — | — | 61,979 |
| Health Care Providers & Services | — | 149,698 | — | 149,698 |
The accompanying notes are an integral part of these financial statements.
Pioneer Emerging Markets Equity Fund | Annual Report | 9/30/2327
Schedule of Investments | 9/30/23 (continued)
| | Level 1 | Level 2 | Level 3 | Total |
| Hotels, Restaurants & Leisure | $ 236,528 | $ 215,504 | $ — | $ 452,032 |
| Household Durables | 35,569 | 60,516 | — | 96,085 |
| Independent Power and Renewable Electricity Producers | — | 107,003 | — | 107,003 |
| Industrial Conglomerates | — | 178,328 | — | 178,328 |
| Insurance | 62,610 | 313,745 | — | 376,355 |
| Interactive Media & Services | 34,259 | 611,164 | — | 645,423 |
| IT Services | 57,575 | 249,171 | — | 306,746 |
| Machinery | 26,642 | 59,701 | — | 86,343 |
| Marine Transportation | — | 28,539 | — | 28,539 |
| Metals & Mining | 58,949 | 269,818 | 1,717 | 330,484 |
| Oil, Gas & Consumable Fuels | 45,699 | 41,279 | 5,975 | 92,953 |
| Personal Care Products | 29,256 | — | — | 29,256 |
| Pharmaceuticals | — | 50,293 | — | 50,293 |
| Real Estate Management & Development | 76,639 | 803,439 | — | 880,078 |
| Semiconductors & Semiconductor Equipment | 816,860 | 218,491 | — | 1,035,351 |
| Specialty Retail | 50,061 | 119,326 | 507 | 169,894 |
| Technology Hardware, Storage & Peripherals | — | 472,555 | — | 472,555 |
| Textiles, Apparel & Luxury Goods | — | 495,470 | — | 495,470 |
| Transportation Infrastructure | — | 54,059 | — | 54,059 |
| Water Utilities | 95,409 | 48,824 | — | 144,233 |
| Wireless Telecommunication Services | — | 228,196 | — | 228,196 |
| Preferred Stock | | | | |
| Banks | 92,108 | — | 2,942 | 95,050 |
| Oil, Gas & Consumable Fuels | 141,274 | — | — | 141,274 |
| Technology Hardware, Storage & Peripherals | — | 290,441 | — | 290,441 |
| Rights/Warrants | | | | |
| Banks | — | 220 | — | 220 |
| Ground Transportation | 139 | — | — | 139 |
| Total Investments in Securities | $3,054,257 | $ 8,472,665 | $14,170 | $11,541,092 |
During the year ended September 30, 2023, there were no significant transfers in or out of Level 3.
The accompanying notes are an integral part of these financial statements.
28Pioneer Emerging Markets Equity Fund | Annual Report | 9/30/23
Statement of Assets and Liabilities | 9/30/23
| ASSETS: | |
| Investments in unaffiliated issuers, at value (cost $11,023,337) | $11,541,092 |
| Cash | 1,576 |
| Foreign currencies, at value (cost $289,177) | 279,680 |
| Receivables — | |
| Investment securities sold | 58,084 |
| Dividends | 33,923 |
| Due from the Adviser | 3,261 |
| Other assets | 28,759 |
| Total assets | $11,946,375 |
| LIABILITIES: | |
| Payables — | |
| Investment securities purchased | $ 16,994 |
| Professional fees | 72,843 |
| Printing expense | 10,010 |
| Reserve for repatriation taxes | 67,643 |
| Management fees | 768 |
| Administrative expenses | 3,298 |
| Distribution fees | 505 |
| Accrued expenses | 2,483 |
| Total liabilities | $ 174,544 |
| NET ASSETS: | |
| Paid-in capital | $12,451,149 |
| Distributable earnings (loss) | (679,318) |
| Net assets | $11,771,831 |
| NET ASSET VALUE PER SHARE: | |
| No par value (unlimited number of shares authorized) | |
| Class A (based on $4,494,960/460,068 shares) | $ 9.77 |
| Class C (based on $3,517,620/362,212 shares) | $ 9.71 |
| Class Y (based on $3,759,251/383,959 shares) | $ 9.79 |
| MAXIMUM OFFERING PRICE PER SHARE: | |
| Class A (based on $9.77 net asset value per share/100%-5.75% maximum sales charge) | $ 10.37 |
The accompanying notes are an integral part of these financial statements.
Pioneer Emerging Markets Equity Fund | Annual Report | 9/30/23 29
Statement of Operations FOR THE YEAR ENDED 9/30/23
| INVESTMENT INCOME: | | |
| Dividends from unaffiliated issuers (net of foreign taxes withheld $42,434) | $ 370,885 | |
| Total Investment Income | | $ 370,885 |
| EXPENSES: | | |
| Management fees | $ 80,075 | |
| Administrative expenses | 24,691 | |
| Transfer agent fees | | |
| Class A | 1,568 | |
| Class C | 207 | |
| Class Y | 60 | |
| Distribution fees | | |
| Class A | 11,589 | |
| Class C | 36,073 | |
| Shareowner communications expense | 1,687 | |
| Custodian fees | 2,220 | |
| Registration fees | 55,651 | |
| Professional fees | 164,871 | |
| Printing expense | 37,702 | |
| Officers' and Trustees' fees | 8,065 | |
| Insurance expense | 161 | |
| Miscellaneous | 4,502 | |
| Total expenses | | $ 429,122 |
| Less fees waived and expenses reimbursed by the Adviser | | (278,898) |
| Net expenses | | $ 150,224 |
| Net investment income | | $ 220,661 |
| REALIZED AND UNREALIZED GAIN (LOSS) ON INVESTMENTS: | | |
| Net realized gain (loss) on: | | |
| Investments in unaffiliated issuers (net of foreign capital gains tax of $18,005) | $ (547,649) | |
| Other assets and liabilities denominated in foreign currencies | (2,742) | $ (550,391) |
| Change in net unrealized appreciation (depreciation) on: | | |
| Investments in unaffiliated issuers (net of foreign capital gains tax of $17,187) | $1,243,084 | |
| Other assets and liabilities denominated in foreign currencies | 3,733 | $1,246,817 |
| Net realized and unrealized gain (loss) on investments | | $ 696,426 |
| Net increase in net assets resulting from operations | | $ 917,087 |
The accompanying notes are an integral part of these financial statements.
30Pioneer Emerging Markets Equity Fund | Annual Report | 9/30/23
Statements of Changes in Net Assets
| | Year
Ended
9/30/23 | Year
Ended
9/30/22 |
| FROM OPERATIONS: | | |
| Net investment income (loss) | $ 220,661 | $ 338,423 |
| Net realized gain (loss) on investments | (550,391) | (274,979) |
| Change in net unrealized appreciation (depreciation) on investments | 1,246,817 | (4,297,545) |
| Net increase (decrease) in net assets resulting from operations | $ 917,087 | $ (4,234,101) |
| DISTRIBUTIONS TO SHAREOWNERS: | | |
| Class A ($0.37 and $0.46 per share, respectively) | $ (164,070) | $ (202,398) |
| Class C ($0.30 and $0.36 per share, respectively) | (104,237) | (125,905) |
| Class Y ($0.41 and $0.50 per share, respectively) | (188,728) | (224,571) |
| Total distributions to shareowners | $ (457,035) | $ (552,874) |
| FROM FUND SHARE TRANSACTIONS: | | |
| Net proceeds from sales of shares | $ 730,597 | $ 285,574 |
| Reinvestment of distributions | 457,035 | 552,834 |
| Cost of shares repurchased | (1,662,873) | (818,187) |
| Net increase (decrease) in net assets resulting from Fund share transactions | $ (475,241) | $ 20,221 |
| Net decrease in net assets | $ (15,189) | $ (4,766,754) |
| NET ASSETS: | | |
| Beginning of year | $11,787,020 | $16,553,774 |
| End of year | $11,771,831 | $ 11,787,020 |
The accompanying notes are an integral part of these financial statements.
Pioneer Emerging Markets Equity Fund | Annual Report | 9/30/2331
Statements of Changes in Net Assets (continued)
| | Year
Ended
9/30/23
Shares | Year
Ended
9/30/23
Amount | Year
Ended
9/30/22
Shares | Year
Ended
9/30/22
Amount |
| Class A | | | | |
| Shares sold | 66,337 | $ 696,230 | 19,336 | $ 239,458 |
| Reinvestment of distributions | 16,810 | 164,070 | 16,084 | 202,358 |
| Less shares repurchased | (62,346) | (628,806) | (53,311) | (612,793) |
Net increase
(decrease) | 20,801 | $ 231,494 | (17,891) | $(170,977) |
| Class C | | | | |
| Shares sold | 2,813 | $ 27,822 | 3,680 | $ 43,560 |
| Reinvestment of distributions | 10,691 | 104,237 | 10,041 | 125,905 |
| Less shares repurchased | (1,702) | (17,222) | (11,418) | (200,519) |
Net increase
(decrease) | 11,802 | $ 114,837 | 2,303 | $ (31,054) |
| Class Y | | | | |
| Shares sold | 616 | $ 6,545 | 214 | $ 2,556 |
| Reinvestment of distributions | 19,357 | 188,728 | 17,841 | 224,571 |
| Less shares repurchased | (100,365) | (1,016,845) | (461) | (4,875) |
Net increase
(decrease) | (80,392) | $ (821,572) | 17,594 | $ 222,252 |
The accompanying notes are an integral part of these financial statements.
32Pioneer Emerging Markets Equity Fund | Annual Report | 9/30/23
| | Year
Ended
9/30/23 | Year
Ended
9/30/22 | Year
Ended
9/30/21 | 10/2/19* to
9/30/20 |
| Class A | | | | |
| Net asset value, beginning of period | $ 9.41 | $ 13.24 | $11.08 | $10.00 |
| Increase (decrease) from investment operations: | | | | |
| Net investment income (loss) (a) | $ 0.19 | $ 0.28 | $ 0.14 | $ 0.07 |
| Net realized and unrealized gain (loss) on investments | 0.54 | (3.65) | 2.13 | 1.07 |
| Net increase (decrease) from investment operations | $ 0.73 | $ (3.37) | $ 2.27 | $ 1.14 |
| Distributions to shareowners: | | | | |
| Net investment income | $ (0.37) | $ (0.31) | $ (0.11) | $ (0.06) |
| Net realized gain | — | (0.15) | — | — |
| Total distributions | $ (0.37) | $ (0.46) | $ (0.11) | $ (0.06) |
| Net increase (decrease) in net asset value | $ 0.36 | $ (3.83) | $ 2.16 | $ 1.08 |
| Net asset value, end of period | $ 9.77 | $ 9.41 | $13.24 | $11.08 |
| Total return (b) | 7.81% | (26.28)% | 20.55% | 11.43%(c) |
| Ratio of net expenses to average net assets | 1.09% | 1.29% | 1.30% | 1.28%(d) |
| Ratio of net investment income (loss) to average net assets | 1.84% | 2.37% | 1.05% | 0.72%(d) |
| Portfolio turnover rate | 53% | 41% | 37% | 61%(c) |
| Net assets, end of period (in thousands) | $4,495 | $ 4,133 | $6,053 | $4,232 |
| Ratios with no waiver of fees and assumption of expenses by the Adviser and no reduction for fees paid indirectly: | | | | |
| Total expenses to average net assets | 3.29% | 2.71% | 3.60% | 4.45%(d) |
| Net investment income (loss) to average net assets | (0.36)% | 0.95% | (1.25)% | (2.45)%(d) |
| * | Class A commenced operations on October 2, 2019. |
| (a) | The per-share data presented above is based on the average shares outstanding for the period presented. |
| (b) | Assumes initial investment at net asset value at the beginning of each period, reinvestment of all distributions, the complete redemption of the investment at net asset value at the end of each period and no sales charges. Total return would be reduced if sales charges were taken into account. |
| (c) | Not annualized. |
| (d) | Annualized. |
The accompanying notes are an integral part of these financial statements.
Pioneer Emerging Markets Equity Fund | Annual Report | 9/30/2333
Financial Highlights (continued)
| | Year
Ended
9/30/23 | Year
Ended
9/30/22 | Year
Ended
9/30/21 | 10/2/19* to
9/30/20 |
| Class C | | | | |
| Net asset value, beginning of period | $ 9.35 | $ 13.14 | $11.02 | $10.00 |
| Increase (decrease) from investment operations: | | | | |
| Net investment income (loss) (a) | $ 0.11 | $ 0.20 | $ 0.04 | $ (0.00)(b) |
| Net realized and unrealized gain (loss) on investments | 0.55 | (3.63) | 2.13 | 1.06 |
| Net increase (decrease) from investment operations | $ 0.66 | $ (3.43) | $ 2.17 | $ 1.06 |
| Distributions to shareowners: | | | | |
| Net investment income | $ (0.30) | $ (0.21) | $ (0.05) | $ (0.04) |
| Net realized gain | — | (0.15) | — | — |
| Total distributions | $ (0.30) | $ (0.36) | $ (0.05) | $ (0.04) |
| Net increase (decrease) in net asset value | $ 0.36 | $ (3.79) | $ 2.12 | $ 1.02 |
| Net asset value, end of period | $ 9.71 | $ 9.35 | $13.14 | $11.02 |
| Total return (c) | 7.02% | (26.79)% | 19.68% | 10.66%(d) |
| Ratio of net expenses to average net assets | 1.80% | 2.00% | 2.01% | 2.01%(e) |
| Ratio of net investment income (loss) to average net assets | 1.14% | 1.70% | 0.30% | (0.02)%(e) |
| Portfolio turnover rate | 53% | 41% | 37% | 61%(d) |
| Net assets, end of period (in thousands) | $3,518 | $ 3,275 | $4,574 | $3,689 |
| Ratios with no waiver of fees and assumption of expenses by the Adviser and no reduction for fees paid indirectly: | | | | |
| Total expenses to average net assets | 3.99% | 3.42% | 4.30% | 5.17%(e) |
| Net investment income (loss) to average net assets | (1.05)% | 0.28% | (1.99)% | (3.18)%(e) |
| * | Class C commenced operations on October 2, 2019. |
| (a) | The per-share data presented above is based on the average shares outstanding for the period presented. |
| (b) | Amount rounds to less than $0.01 or $(0.01) per share. |
| (c) | Assumes initial investment at net asset value at the beginning of each period, reinvestment of all distributions, the complete redemption of the investment at net asset value at the end of each period and no sales charges. Total return would be reduced if sales charges were taken into account. |
| (d) | Not annualized. |
| (e) | Annualized. |
The accompanying notes are an integral part of these financial statements.
34Pioneer Emerging Markets Equity Fund | Annual Report | 9/30/23
| | Year
Ended
9/30/23 | Year
Ended
9/30/22 | Year
Ended
9/30/21 | 10/2/19* to
9/30/20 |
| Class Y | | | | |
| Net asset value, beginning of period | $ 9.43 | $ 13.27 | $11.10 | $10.00 |
| Increase (decrease) from investment operations: | | | | |
| Net investment income (loss) (a) | $ 0.21 | $ 0.32 | $ 0.18 | $ 0.10 |
| Net realized and unrealized gain (loss) on investments | 0.56 | (3.66) | 2.15 | 1.07 |
| Net increase (decrease) from investment operations | $ 0.77 | $ (3.34) | $ 2.33 | $ 1.17 |
| Distributions to shareowners: | | | | |
| Net investment income | $ (0.41) | $ (0.35) | $ (0.16) | $ (0.07) |
| Net realized gain | — | (0.15) | — | — |
| Total distributions | $ (0.41) | $ (0.50) | $ (0.16) | $ (0.07) |
| Net increase (decrease) in net asset value | $ 0.36 | $ (3.84) | $ 2.17 | $ 1.10 |
| Net asset value, end of period | $ 9.79 | $ 9.43 | $13.27 | $11.10 |
| Total return (b) | 8.15% | (26.10)% | 21.00% | 11.72%(c) |
| Ratio of net expenses to average net assets | 0.79% | 0.99% | 0.99% | 0.99%(d) |
| Ratio of net investment income (loss) to average net assets | 2.12% | 2.70% | 1.30% | 0.99%(d) |
| Portfolio turnover rate | 53% | 41% | 37% | 61%(c) |
| Net assets, end of period (in thousands) | $3,759 | $ 4,379 | $5,927 | $4,893 |
| Ratios with no waiver of fees and assumption of expenses by the Adviser and no reduction for fees paid indirectly: | | | | |
| Total expenses to average net assets | 2.99% | 2.41% | 3.29% | 4.16%(d) |
| Net investment income (loss) to average net assets | (0.08)% | 1.28% | (1.00)% | (2.18)%(d) |
| * | Class Y commenced operations on October 2, 2019. |
| (a) | The per-share data presented above is based on the average shares outstanding for the period presented. |
| (b) | Assumes initial investment at net asset value at the beginning of each period, reinvestment of all distributions and the complete redemption of the investment at net asset value at the end of each period. |
| (c) | Not annualized. |
| (d) | Annualized. |
The accompanying notes are an integral part of these financial statements.
Pioneer Emerging Markets Equity Fund | Annual Report | 9/30/2335
Notes to Financial Statements | 9/30/23
1. Organization and Significant Accounting Policies
Pioneer Emerging Markets Equity Fund (the “Fund”) is one of five portfolios comprising Pioneer Series Trust XIV (the “Trust”), a Delaware statutory trust. The Fund is registered under the Investment Company Act of 1940 (the "1940 Act") as a diversified, open-end management investment company. The Fund’s investment objective is to seek long-term capital growth.
The Fund offers four classes of shares designated as Class A, Class C, Class K and Class Y shares. Class A, Class C and Class Y commenced operations on October 2, 2019. Class K has not yet commenced operations. Each class of shares represents an interest in the same portfolio of investments of the Fund and has identical rights (based on relative net asset values) to assets and liquidation proceeds. Share classes can bear different rates of class-specific fees and expenses, such as transfer agent and distribution fees. Differences in class-specific fees and expenses will result in differences in net investment income and, therefore, the payment of different dividends from net investment income earned by each class. The Amended and Restated Declaration of Trust of the Trust gives the Board of Trustees the flexibility to specify either per-share voting or dollar-weighted voting when submitting matters for shareowner approval. Under per-share voting, each share of a class of the Fund is entitled to one vote. Under dollar-weighted voting, a shareowner’s voting power is determined not by the number of shares owned, but by the dollar value of the shares on the record date. Each share class has exclusive voting rights with respect to matters affecting only that class, including with respect to the distribution plan for that class. There is no distribution plan for Class Y shares.
Amundi Asset Management US, Inc., an indirect, wholly owned subsidiary of Amundi and Amundi’s wholly owned subsidiary, Amundi USA, Inc., serves as the Fund’s investment adviser (the “Adviser”). Amundi Distributor US, Inc., an affiliate of the Adviser, serves as the Fund’s distributor (the “Distributor”).
In March 2020, FASB issued an Accounting Standard Update, ASU 2020-04, Reference Rate Reform (Topic 848) — Facilitation of the Effects of Reference Rate Reform on Financial Reporting (“ASU 2020-04”), which provides optional, temporary relief with respect to the financial reporting of contracts subject to certain types of modifications due to the planned discontinuation of the London Interbank Offered Rate (“LIBOR”) and other LIBOR-based reference rates at the end of 2021. The temporary relief
36Pioneer Emerging Markets Equity Fund | Annual Report | 9/30/23
provided by ASU 2020-04 is effective for certain reference rate-related contract modifications that occur during the period from March 12, 2020 through December 31, 2023. Management is evaluating the impact of ASU 2020-04 on the Fund's investments, derivatives, debt and other contracts, if applicable, that will undergo reference rate-related modifications as a result of the reference rate reform.
The Fund is required to comply with Rule 18f-4 under the 1940 Act, which governs the use of derivatives by registered investment companies. Rule 18f-4 permits funds to enter into derivatives transactions (as defined in Rule 18f-4) and certain other transactions notwithstanding the restrictions on the issuance of “senior securities” under Section 18 of the 1940 Act. Rule 18f-4 requires a fund to establish and maintain a comprehensive derivatives risk management program, appoint a derivatives risk manager and comply with a relative or absolute limit on fund leverage risk calculated based on value-at-risk (“VaR”), unless the fund uses derivatives in only a limited manner (a "limited derivatives user"). The Fund is currently a limited derivatives user for purposes of Rule 18f-4.
The Fund is an investment company and follows investment company accounting and reporting guidance under U.S. Generally Accepted Accounting Principles (“U.S. GAAP”). U.S. GAAP requires the management of the Fund to make estimates and assumptions that affect the reported amounts of assets and liabilities, the disclosure of contingent assets and liabilities at the date of the financial statements, and the reported amounts of income, expenses and gain or loss on investments during the reporting period. Actual results could differ from those estimates.
The following is a summary of significant accounting policies followed by the Fund in the preparation of its financial statements:
| A. | Security Valuation |
| | The net asset value of the Fund is computed once daily, on each day the New York Stock Exchange (“NYSE”) is open, as of the close of regular trading on the NYSE. |
| | Equity securities that have traded on an exchange are valued by using the last sale price on the principal exchange where they are traded. Equity securities that have not traded on the date of valuation, or securities for which sale prices are not available, generally are valued using the mean between the last bid and asked prices or, if both last bid and asked prices are not available, at the last quoted bid price. Last sale and bid and asked prices are provided by independent third party pricing services. In the case of equity securities not traded on an exchange, |
Pioneer Emerging Markets Equity Fund | Annual Report | 9/30/2337
| | prices are typically determined by independent third party pricing services using a variety of techniques and methods. |
| | The principal exchanges and markets for non-U.S. equity securities have closing times prior to the close of the NYSE. However, the value of these securities may be influenced by changes in global markets occurring after the closing times of the local exchanges and markets up to the time the Fund determines its net asset value. Consequently, the Adviser, the Fund's valuation designee, uses a fair value model developed by an independent pricing service to value non-U.S. equity securities. On a daily basis, the pricing service recommends changes, based on a proprietary model, to the closing market prices of each non-U.S. security held by the Fund to reflect the security’s fair value at the time the Fund determines its net asset value. These recommendations are applied in accordance with the Adviser's (the valuation designee's) valuation procedures. |
| | The value of foreign securities is translated into U.S. dollars based on foreign currency exchange rate quotations supplied by a third party pricing source. |
| | Forward foreign currency exchange contracts are valued daily using the foreign exchange rate or, for longer term forward contract positions, the spot currency rate and the forward points on a daily basis, in each case provided by a third party pricing service. Contracts whose forward settlement date falls between two quoted days are valued by interpolation. |
| | Shares of open-end registered investment companies (including money market mutual funds) are valued at such funds’ net asset value. |
| | Securities for which independent pricing services or broker-dealers are unable to supply prices or for which market prices and/or quotations are not readily available or are considered to be unreliable are valued by a fair valuation team comprised of certain personnel of the Adviser. The Adviser is designated as the valuation designee for the Fund pursuant to Rule 2a-5 under the 1940 Act. The Adviser’s fair valuation team is responsible for monitoring developments that may impact fair valued securities. |
| | Inputs used when applying fair value methods to value a security may include credit ratings, the financial condition of the company, current market conditions and comparable securities. The Adviser may use fair value methods if it is determined that a significant event has occurred after the close of the exchange or market on which the security trades and prior to the determination of the Fund's net asset value. Examples |
38Pioneer Emerging Markets Equity Fund | Annual Report | 9/30/23
| | of a significant event might include political or economic news, corporate restructurings, natural disasters, terrorist activity or trading halts. Thus, the valuation of the Fund's securities may differ significantly from exchange prices, and such differences could be material. |
| B. | Investment Income and Transactions |
| | Dividend income is recorded on the ex-dividend date, except that certain dividends from foreign securities where the ex-dividend date may have passed are recorded as soon as the Fund becomes aware of the ex-dividend data in the exercise of reasonable diligence. |
| | Interest income, including interest on income-bearing cash accounts, is recorded on the accrual basis. Dividend and interest income are reported net of unrecoverable foreign taxes withheld at the applicable country rates and net of income accrued on defaulted securities. |
| | Interest and dividend income payable by delivery of additional shares is reclassified as PIK (payment-in-kind) income upon receipt and is included in interest and dividend income, respectively. |
| | Security transactions are recorded as of trade date. Gains and losses on sales of investments are calculated on the identified cost method for both financial reporting and federal income tax purposes. |
| C. | Foreign Currency Translation |
| | The books and records of the Fund are maintained in U.S. dollars. Amounts denominated in foreign currencies are translated into U.S. dollars using current exchange rates. |
| | Net realized gains and losses on foreign currency transactions, if any, represent, among other things, the net realized gains and losses on foreign currency exchange contracts, disposition of foreign currencies and the difference between the amount of income accrued and the U.S. dollars actually received. Further, the effects of changes in foreign currency exchange rates on investments are not segregated on the Statement of Operations from the effects of changes in the market prices of those securities, but are included with the net realized and unrealized gain or loss on investments. |
| D. | Federal Income Taxes |
| | It is the Fund's policy to comply with the requirements of the Internal Revenue Code applicable to regulated investment companies and to distribute all of its net taxable income and net realized capital gains, if |
Pioneer Emerging Markets Equity Fund | Annual Report | 9/30/2339
| | any, to its shareowners. Therefore, no provision for federal income taxes is required. As of September 30, 2023, the Fund did not accrue any interest or penalties with respect to uncertain tax positions, which, if applicable, would be recorded as an income tax expense on the Statement of Operations. Tax returns filed within the prior three years remain subject to examination by federal and state tax authorities. |
| | In determining the daily net asset value, the Fund estimates the reserve for such taxes, if any, associated with investments in certain countries. The estimated reserve for the capital gains is based on the net unrealized appreciation on certain portfolio securities, the holding period of such securities and the related tax rates, tax loss carryforward (if applicable) and other such factors. As of September 30, 2023, the Fund had accrued $67,643 in reserve for repatriation taxes related to capital gains. |
| | The amount and character of income and capital gain distributions to shareowners are determined in accordance with federal income tax rules, which may differ from U.S. GAAP. Distributions in excess of net investment income or net realized gains are temporary over distributions for financial statement purposes resulting from differences in the recognition or classification of income or distributions for financial statement and tax purposes. Capital accounts within the financial statements are adjusted for permanent book/tax differences to reflect tax character, but are not adjusted for temporary differences. |
| | At September 30, 2023, the Fund was permitted to carry forward indefinitely $622,342 of short-term losses and $402,224 of long-term losses. |
| | The tax character of distributions paid during the years ended September 30, 2023 and September 30, 2022, was as follows: |
| | 2023 | 2022 |
| Distributions paid from: | | |
| Ordinary income | $457,035 | $430,964 |
| Long-term capital gains | — | 121,910 |
| Total | $ 457,035 | $552,874 |
The following shows the components of distributable earnings (losses) on a federal income tax basis at September 30, 2023:
| | 2023 |
| Distributable earnings/(losses): | |
| Undistributed ordinary income | $ 179,822 |
| Capital loss carryforward | (1,024,566) |
| Net unrealized appreciation | 165,426 |
| Total | $ (679,318) |
40Pioneer Emerging Markets Equity Fund | Annual Report | 9/30/23
The difference between book-basis and tax-basis net unrealized appreciation is attributable to the tax deferral of losses on wash sales and adjustments relating to passive foreign investment companies.
| E. | Fund Shares |
| | The Fund records sales and repurchases of its shares as of trade date. The Distributor earned $265 in underwriting commissions on the sale of Class A shares during the year ended September 30, 2023. |
| F. | Class Allocations |
| | Income, common expenses and realized and unrealized gains and losses are calculated at the Fund level and allocated daily to each class of shares based on its respective percentage of adjusted net assets at the beginning of the day. |
| | Distribution fees are calculated based on the average daily net asset value attributable to Class A and Class C shares of the Fund, respectively (see Note 5). Class Y shares do not pay distribution fees. All expenses and fees paid to the Fund's transfer agent for its services are allocated among the classes of shares based on the number of accounts in each class and the ratable allocation of related out-of-pocket expenses (see Note 4). |
| | Distributions to shareowners are recorded as of the ex-dividend date. Distributions paid by the Fund with respect to each class of shares are calculated in the same manner and at the same time, except that net investment income dividends to Class A, Class C and Class Y shares can reflect different transfer agent and distribution expense rates. |
| G. | Risks |
| | The value of securities held by the Fund may go up or down, sometimes rapidly or unpredictably, due to general market conditions, such as real or perceived adverse economic, political or regulatory conditions, recessions, the spread of infectious illness or other public health issues, inflation, changes in interest rates, armed conflict including Russia's military invasion of Ukraine, sanctions against Russia, other nations or individuals or companies and possible countermeasures, lack of liquidity in the bond markets or adverse investor sentiment. In the past several years, financial markets have experienced increased volatility, depressed valuations, decreased liquidity and heightened uncertainty. These conditions may continue, recur, worsen or spread. Inflation and interest rates have increased and may rise further. These circumstances could |
Pioneer Emerging Markets Equity Fund | Annual Report | 9/30/2341
| | adversely affect the value and liquidity of the Fund's investments and negatively impact the Fund's performance. |
| | The long-term impact of the COVID-19 pandemic and its subsequent variants on economies, markets, industries and individual issuers, are not known. Some sectors of the economy and individual issuers have experienced or may experience particularly large losses. Periods of extreme volatility in the financial markets, reduced liquidity of many instruments, increased government debt, inflation, and disruptions to supply chains, consumer demand and employee availability, may continue for some time. Following Russia's invasion of Ukraine, Russian securities lost all, or nearly all, their market value. Other securities or markets could be similarly affected by past or future political, geopolitical or other events or conditions. |
| | Governments and central banks, including the U.S. Federal Reserve, have taken extraordinary and unprecedented actions to support local and global economies and the financial markets. These actions have resulted in significant expansion of public debt, including in the U.S. The consequences of high public debt, including its future impact on the economy and securities markets, may not be known for some time. |
| | The U.S. and other countries are periodically involved in disputes over trade and other matters, which may result in tariffs, investment restrictions and adverse impacts on affected companies and securities. For example, the U.S. has imposed tariffs and other trade barriers on Chinese exports, has restricted sales of certain categories of goods to China, and has established barriers to investments in China. Trade disputes may adversely affect the economies of the U.S. and its trading partners, as well as companies directly or indirectly affected and financial markets generally. If the political climate between the U.S. and China does not improve or continues to deteriorate, if China were to attempt unification of Taiwan by force, or if other geopolitical conflicts develop or get worse, economies, markets and individual securities may be severely affected both regionally and globally, and the value of the Fund's assets may go down. |
| | At times, the Fund’s investments may represent industries or industry sectors that are interrelated or have common risks, making the Fund more susceptible to any economic, political, or regulatory developments or other risks affecting those industries and sectors. |
| | Normally, the Fund invests at least 80% of its net assets in the equity securities of emerging market issuers. The Fund’s investments in foreign markets and countries with limited developing markets may subject the Fund to a greater degree of risk than investments in a developed market. |
42Pioneer Emerging Markets Equity Fund | Annual Report | 9/30/23
| | These risks are more pronounced for issuers in emerging markets or to the extent that the Fund invests significantly in one region or country. These risks include disruptive political or economic conditions, military conflicts and sanctions, terrorism, sustained economic downturns, financial instability, less liquid trading markets, extreme price volatility, currency risks, reduction of government or central bank support, inadequate accounting standards, tariffs, tax disputes or other tax burdens, nationalization or expropriation of assets, and the imposition of adverse governmental laws, arbitrary application of laws and regulations or lack of rule of law and investment and repatriation restrictions. Lack of information and less market regulation also may affect the value of these securities. Withholding and other non-U.S. taxes may decrease the Fund’s return. Non-U.S. issuers may be located in parts of the world that have historically been prone to natural disasters. Investing in depositary receipts is subject to many of the same risks as investing directly in non-U.S. issuers. Depositary receipts may involve higher expenses and may trade at a discount (or premium) to the underlying security. |
| | Russia launched a large-scale invasion of Ukraine on February 24, 2022. In response to the military action by Russia, various countries, including the U.S., the United Kingdom, and European Union issued broad-ranging economic sanctions against Russia and Belarus and certain companies and individuals. Since then, Russian securities have lost all, or nearly all, their market value, and many other issuers, securities and markets have been adversely affected. The United States and other countries may impose sanctions on other countries, companies and individuals in light of Russia’s military invasion. The extent and duration of the military action or future escalation of such hostilities, the extent and impact of existing and future sanctions, market disruptions and volatility, and the result of any diplomatic negotiations cannot be predicted. These and any related events could have a significant impact on the value and liquidity of certain Fund investments, on Fund performance and the value of an investment in the Fund, particularly with respect to securities and commodities, such as oil, natural gas and food commodities, as well as other sectors with exposure to Russian issuers or issuers in other countries affected by the invasion, and are likely to have collateral impacts on market sectors globally. |
| | To the extent that the fund invests from time to time more than 25% of its assets in issuers organized or located in a particular geographic region, including but not limited to issuers organized or located in China and other developing market Asia-Pacific countries, the fund may be |
Pioneer Emerging Markets Equity Fund | Annual Report | 9/30/2343
| | particularly affected by adverse securities markets, exchange rates and social, political, regulatory or economic events which may occur in those regions. |
| | Markets in China and other Asian countries are relatively new and undeveloped. China’s economic health is largely dependent upon exports, and may be dependent upon the economies of other Asian countries. Investments in Chinese and other Asian issuers could be adversely affected by changes in government policies, or trade or political disputes with major trading partners, including the U.S. China’s growing trade surplus with the U.S. has given rise to trade disputes and the imposition of tariffs. The U.S. has also restricted the sale of certain goods to China. In addition, the U.S. government has imposed restrictions on U.S. investor participation in certain Chinese investments. If the political climate between the United States and China continues to deteriorate, economies and markets may be adversely affected. These matters could adversely affect China’s economy and also limit investment opportunities for the Fund. The Chinese economy also could be adversely affected by, among other things, supply chain disruptions. The effect of China's recent relaxation of its zero-COVID policy on China's economy and global supply chains may not be fully known for some time. An economic slowdown in China could adversely affect economies of other emerging market countries that trade with China, as well as companies operating in those countries. Economies of Asian countries and Asian issuers could be adversely affected by regional security threats. |
| | In addition, China's long-running conflict over Taiwan's sovereignty, border disputes with many neighbors and historically strained relations with other Asian countries could result in military conflict that could adversely impact the economies of China and other Asian countries, disrupt supply chains, and severely affect global economies and markets. |
| | With the increased use of technologies such as the Internet to conduct business, the Fund is susceptible to operational, information security and related risks. While the Fund’s Adviser has established business continuity plans in the event of, and risk management systems to prevent, limit or mitigate, such cyber-attacks, there are inherent limitations in such plans and systems, including the possibility that certain risks have not been identified. Furthermore, the Fund cannot control the cybersecurity plans and systems put in place by service providers to the Fund such as the Fund's custodian and accounting agent, and the Fund’s transfer agent. In addition, many beneficial owners of Fund shares hold them through accounts at broker-dealers, |
44Pioneer Emerging Markets Equity Fund | Annual Report | 9/30/23
| | retirement platforms and other financial market participants over which neither the Fund nor the Adviser exercises control. Each of these may in turn rely on service providers to them, which are also subject to the risk of cyber-attacks. Cybersecurity failures or breaches at the Adviser or the Fund’s service providers or intermediaries have the ability to cause disruptions and impact business operations, potentially resulting in financial losses, interference with the Fund’s ability to calculate its net asset value, impediments to trading, the inability of Fund shareowners to effect share purchases, redemptions or exchanges or receive distributions, loss of or unauthorized access to private shareowner information and violations of applicable privacy and other laws, regulatory fines, penalties, reputational damage, or additional compliance costs. Such costs and losses may not be covered under any insurance. In addition, maintaining vigilance against cyber-attacks may involve substantial costs over time, and system enhancements may themselves be subject to cyber-attacks. |
| | The Fund’s prospectus contains unaudited information regarding the Fund’s principal risks. Please refer to that document when considering the Fund’s principal risks. |
2. Management Agreement
The Adviser manages the Fund’s portfolio. Effective December 1, 2022, management fees payable under the Fund’s Investment Management Agreement with the Adviser are calculated daily and paid monthly at the annual rate of 0.60% of the fund’s average daily net assets. Prior to December 1, 2022, management fees payable under the Fund’s Investment Management Agreement with the Adviser were equal to 0.80% of the Fund's average daily net assets up to $1 billion and 0.75% of the Fund's average daily net assets over $1 billion. For the year ended September 30, 2023, the effective management fee (excluding waivers and/or assumption of expenses) was equivalent to 0.63% of the Fund’s average daily net assets.
Effective December 1, 2022, the Adviser has contractually agreed to limit ordinary operating expenses (ordinary operating expenses means all fund expenses other than taxes, brokerage commissions, acquired fund fees and expenses and extraordinary expenses, such as litigation) of the Fund to the extent required to reduce Fund expenses to 1.05%, 1.80% and 0.75% of the average daily net assets attributable to Class A, Class C and Class Y shares, respectively. These expense limitations are in effect through February 1, 2024. Prior to December 1, 2022, the Adviser contractually agreed to limit ordinary operating expenses (ordinary operating expenses means all fund expenses other than taxes, brokerage commissions, acquired fund fees and
Pioneer Emerging Markets Equity Fund | Annual Report | 9/30/2345
expenses and extraordinary expenses, such as litigation) of the Fund to the extent required to reduce Fund expenses to 1.30%, 2.05% and 0.99% of the average daily net assets attributable to Class A, Class C and Class Y shares, respectively. There can be no assurance that the Adviser will extend the expense limitation agreement for a class of shares beyond the date referred to above. Fees waived and expenses reimbursed during the year ended September 30, 2023, are reflected on the Statement of Operations.
In addition, under the management and administration agreements, certain other services and costs, including accounting, regulatory reporting and insurance premiums, are paid by the Fund as administrative reimbursements. Reflected on the Statement of Assets and Liabilities is $768 in management fees payable to the Adviser at September 30, 2023.
3. Compensation of Trustees and Officers
The Fund pays an annual fee to its Trustees. The Adviser reimburses the Fund for fees paid to the Interested Trustees. Except for the chief compliance officer, the Fund does not pay any salary or other compensation to its officers. The Fund pays a portion of the chief compliance officer's compensation for his services as the Fund's chief compliance officer. Amundi US pays the remaining portion of the chief compliance officer's compensation. For the year ended September 30, 2023, the Fund paid $8,065 in Officer's and Trustees' compensation, which is reflected on the Statement of Operations as Officers' and Trustees' fees. At September 30, 2023, on its Statement of Assets and Liabilities, the Fund had no payable for Trustees' fees and a payable for administrative expenses of $3,298, which includes the payable for Officers' compensation.
4. Transfer Agent
BNY Mellon Investment Servicing (US) Inc. serves as the transfer agent to the Fund at negotiated rates. Transfer agent fees and payables shown on the Statement of Operations and the Statement of Assets and Liabilities, respectively, include sub-transfer agent expenses incurred through the Fund’s omnibus relationship contracts.
46Pioneer Emerging Markets Equity Fund | Annual Report | 9/30/23
In addition, the Fund reimbursed the transfer agent for out-of-pocket expenses incurred by the transfer agent related to shareowner communications activities such as proxy and statement mailings, and outgoing phone calls. For the year ended September 30, 2023, such out-of-pocket expenses by class of shares were as follows:
| Shareowner Communications: | |
| Class A | $1,438 |
| Class C | 135 |
| Class Y | 114 |
| Total | $1,687 |
5. Distribution Plan
The Fund has adopted a distribution plan (the “Plan”) pursuant to Rule 12b-1 of the Investment Company Act of 1940 with respect to its Class A and Class C shares. Pursuant to the Plan, the Fund pays the Distributor 0.25% of the average daily net assets attributable to Class A shares as compensation for personal services and/or account maintenance services or distribution services with regard to Class A shares. Pursuant to the Plan, the Fund also pays the Distributor 1.00% of the average daily net assets attributable to Class C shares. The fee for Class C shares consists of a 0.25% service fee and a 0.75% distribution fee paid as compensation for personal services and/or account maintenance services or distribution services with regard to Class C shares. Reflected on the Statement of Assets and Liabilities is $505 in distribution fees payable to the Distributor at September 30, 2023.
In addition, redemptions of Class A and Class C shares may be subject to a contingent deferred sales charge (“CDSC”). A CDSC of 1.00% may be imposed on redemptions of certain net asset value purchases of Class A shares within 12 months of purchase. Redemptions of Class C shares within 12 months of purchase are subject to a CDSC of 1.00%, based on the lower of cost or market value of shares being redeemed. Shares purchased as part of an exchange remain subject to any CDSC that applied to the original purchase of those shares. There is no CDSC for Class Y shares. Proceeds from the CDSCs are paid to the Distributor. For the year ended September 30, 2023, CDSCs in the amount of $1 were paid to the Distributor.
6. Line of Credit Facility
The Fund, along with certain other funds in the Pioneer Family of Funds, participates in a committed, unsecured revolving line of credit (“credit facility”). Borrowings are used solely for temporary or emergency purposes. The Fund may borrow up to the lesser of the amount available under the
Pioneer Emerging Markets Equity Fund | Annual Report | 9/30/2347
credit facility or the limits set for borrowing by the Fund’s prospectus and the 1940 Act. The Fund participates in a credit facility in the amount of $380 million. Under such credit facility, depending on the type of loan, interest on borrowings is payable at the Secured Overnight Financing Rate ("SOFR") plus a credit spread. The Fund also pays both an upfront fee and an annual commitment fee to participate in the credit facility. The upfront fee in the amount of 0.15% of the total credit facility and the commitment fee in the amount of 0.30% of the daily unused portion of each lender's commitment are allocated among participating funds based on an allocation schedule set forth in the credit facility. For the year ended September 30, 2023, the Fund had no borrowings under the credit facility.
48Pioneer Emerging Markets Equity Fund | Annual Report | 9/30/23
Report of Independent Registered Public Accounting Firm
To the Board of Trustees of Pioneer Series Trust XIV and the Shareholders of Pioneer Emerging Markets Equity Fund:
Opinion on the Financial Statements
We have audited the accompanying statement of assets and liabilities of Pioneer Emerging Markets Equity Fund (the “Fund”) (one of the funds constituting Pioneer Series Trust XIV (the “Trust”)), including the schedule of investments, as of September 30, 2023, and the related statement of operations for the year then ended, the statements of changes in net assets for each of the two years in the period then ended, the financial highlights for each of the three years in the period then ended and the period from October 2, 2019 (commencement of operations) through September 30, 2020 and the related notes (collectively referred to as the “financial statements”). In our opinion, the financial statements present fairly, in all material respects, the financial position of the Fund (one of the funds constituting Pioneer Series Trust XIV) at September 30, 2023, the results of its operations for the year then ended, the changes in its net assets for each of the two years in the period then ended, and its financial highlights for each of the three years in the period ended and the period from October 2, 2019 (commencement of operations) through September 30, 2020, in conformity with U.S. generally accepted accounting principles.
Basis for Opinion
These financial statements are the responsibility of the Trust’s management. Our responsibility is to express an opinion on the Fund’s financial statements based on our audits. We are a public accounting firm registered with the Public Company Accounting Oversight Board (United States) ("PCAOB") and are required to be independent with respect to the Trust in accordance with the U.S. federal securities laws and the applicable rules and regulations of the Securities and Exchange Commission and the PCAOB.
We conducted our audits in accordance with the standards of the PCAOB. Those standards require that we plan and perform the audit to obtain reasonable assurance about whether the financial statements are free of material misstatement, whether due to error or fraud. The Trust is not required to have, nor were we engaged to perform, an audit of the Trust’s internal control over financial reporting. As part of our audits, we are required to obtain an understanding of internal control over financial reporting, but not for the purpose of expressing an opinion on the
Pioneer Emerging Markets Equity Fund | Annual Report | 9/30/2349
effectiveness of the Trust’s internal control over financial reporting. Accordingly, we express no such opinion.
Our audits included performing procedures to assess the risks of material misstatement of the financial statements, whether due to error or fraud, and performing procedures that respond to those risks. Such procedures included examining, on a test basis, evidence regarding the amounts and disclosures in the financial statements. Our procedures included confirmation of securities owned as of September 30, 2023, by correspondence with the custodian and brokers; when replies were not received from brokers, we performed other auditing procedures. Our audits also included evaluating the accounting principles used and significant estimates made by management, as well as evaluating the overall presentation of the financial statements. We believe that our audits provide a reasonable basis for our opinion.
We have served as the auditor of one or more investment companies in the Pioneer family of funds since 2017.
Boston, Massachusetts
November 28, 2023
50Pioneer Emerging Markets Equity Fund | Annual Report | 9/30/23
Additional Information (unaudited)
For the year ended September 30, 2023, certain dividends paid by the Fund may be subject to a maximum tax rate of 20%, as provided for by the Jobs and Growth Tax Relief Reconciliation Act (the Act) of 2003. The Fund intends to designate up to the maximum amount of such dividends allowable under the Act, as taxed at a maximum rate of 20%. Complete information will be computed and reported in conjunction with your 2023 Form 1099-DIV.
For the fiscal year ended September 30, 2023, the Fund elected to pass through foreign tax credits of $60,439 and recognized foreign source income of $ 407,945.
Pioneer Emerging Markets Equity Fund | Annual Report | 9/30/2351
Approval of Renewal of Investment Management Agreement
Amundi Asset Management US, Inc. (“Amundi US”) serves as the investment adviser to Pioneer Emerging Markets Equity Fund (the “Fund”) pursuant to an investment management agreement between Amundi US and the Fund. In order for Amundi US to remain the investment adviser of the Fund, the Trustees of the Fund, including a majority of the Fund’s Independent Trustees, must determine annually whether to renew the investment management agreement for the Fund.
The contract review process began in January 2023 as the Trustees of the Fund agreed on, among other things, an overall approach and timeline for the process. Contract review materials were provided to the Trustees in March 2023, July 2023 and September 2023. In addition, the Trustees reviewed and discussed the Fund’s performance at regularly scheduled meetings throughout the year, and took into account other information related to the Fund provided to the Trustees at regularly scheduled meetings, in connection with the review of the Fund’s investment management agreement.
In March 2023, the Trustees, among other things, discussed the memorandum provided by Fund counsel that summarized the legal standards and other considerations that are relevant to the Trustees in their deliberations regarding the renewal of the investment management agreement, and reviewed and discussed the qualifications of the investment management teams for the Fund, as well as the level of investment by the Fund’s portfolio managers in the Fund. In July 2023, the Trustees, among other things, reviewed the Fund’s management fees and total expense ratios, the financial statements of Amundi US and its parent companies, profitability analyses provided by Amundi US, and analyses from Amundi US as to possible economies of scale. The Trustees also reviewed the profitability of the institutional business of Amundi US as compared to that of Amundi US’s fund management business, and considered the differences between the fees and expenses of the Fund and the fees and expenses of Amundi US’s institutional accounts, as well as the different services provided by Amundi US to the Fund and to the institutional accounts. The Trustees further considered contract review materials, including additional materials received in response to the Trustees’ request, in September 2023.
At a meeting held on September 19, 2023, based on their evaluation of the information provided by Amundi US and third parties, the Trustees of the Fund, including the Independent Trustees voting separately advised by independent counsel, unanimously approved the renewal of the investment
52Pioneer Emerging Markets Equity Fund | Annual Report | 9/30/23
management agreement for another year. In approving the renewal of the investment management agreement, the Trustees considered various factors that they determined were relevant, including the factors described below. The Trustees did not identify any single factor as the controlling factor in determining to approve the renewal of the agreement.
Nature, Extent and Quality of Services
The Trustees considered the nature, extent and quality of the services that had been provided by Amundi US to the Fund, taking into account the investment objective and strategy of the Fund. The Trustees also reviewed Amundi US’s investment approach for the Fund and its research process. The Trustees considered Amundi US’ integration of environmental, social and governance (ESG) considerations into its investment research process. The Trustees considered the resources of Amundi US and the personnel of Amundi US who provide investment management services to the Fund. They also reviewed the amount of non-Fund assets managed by the portfolio managers of the Fund. They considered the non-investment resources and personnel of Amundi US that are involved in Amundi US’s services to the Fund, including Amundi US’s compliance, risk management, and legal resources and personnel. The Trustees considered the compliance services being provided to the Fund by Amundi US and how Amundi US has addressed any compliance issues during the past year. The Trustees noted the substantial attention and high priority given by Amundi US’s senior management to the Pioneer Fund complex, including with respect to the increasing regulation to which the Pioneer Funds are subject.
The Trustees considered that Amundi US supervises and monitors the performance of the Fund’s service providers and provides the Fund with personnel (including Fund officers) and other resources that are necessary for the Fund’s business management and operations. The Trustees also considered that, as administrator, Amundi US is responsible for the administration of the Fund’s business and other affairs. The Trustees considered that the Fund reimburses Amundi US its pro rata share of Amundi US’s costs of providing administration services to the Pioneer Funds.
Based on these considerations, the Trustees concluded that the nature, extent and quality of services that had been provided by Amundi US to the Fund were satisfactory and consistent with the terms of the investment management agreement.
Performance of the Fund
In considering the Fund’s performance, the Trustees regularly review and discuss throughout the year data prepared by Amundi US and information
Pioneer Emerging Markets Equity Fund | Annual Report | 9/30/2353
comparing the Fund’s performance with the performance of its peer group of funds, as classified by Morningstar, Inc. (Morningstar), and with the performance of the Fund’s benchmark index. They also discuss the Fund’s performance with Amundi US on a regular basis. The Trustees’ regular reviews and discussions were factored into the Trustees’ deliberations concerning the renewal of the investment management agreement.
Management Fee and Expenses
The Trustees considered information showing the fees and expenses of the Fund in comparison to the management fees of its peer group of funds as classified by Morningstar and also to the expense ratios of a peer group of funds selected on the basis of criteria determined by the Independent Trustees for this purpose using data provided by Strategic Insight Mutual Fund Research and Consulting, LLC (Strategic Insight), an independent third party. The peer group comparisons referred to below are organized in quintiles. Each quintile represents one-fifth of the peer group. In all peer group comparisons referred to below, first quintile is most favorable to the Fund’s shareowners. The Trustees noted that they separately review and consider the impact of the Fund’s transfer agency and Fund- and Amundi US-paid expenses for sub-transfer agency and intermediary arrangements, and that the results of the most recent such review were considered in the consideration of the Fund’s expense ratio.
The Trustees considered that the Fund’s management fee for the most recent fiscal year was in the third quintile relative to the management fees paid by other funds in its Morningstar category for the comparable period. The Trustees considered a reduction in the Fund’s management fee that went into effect on December 1, 2022. The Trustees considered that the expense ratio of the Fund’s Class Y shares for the most recent fiscal year was in the second quintile relative to its Strategic Insight peer group for the comparable period. The Trustees noted that Amundi US had agreed to waive fees and/or reimburse expenses in order to limit the ordinary operating expenses of the Fund for the most recent fiscal year, and that such expense limitation arrangement had not been extended for the upcoming fiscal year.
The Trustees reviewed management fees charged by Amundi US to institutional and other clients, including publicly offered European funds sponsored by Amundi US’s affiliates, unaffiliated U.S. registered investment companies (in a sub-advisory capacity), and unaffiliated foreign and domestic separate accounts. The Trustees also considered Amundi US’s costs in providing services to the Fund and Amundi US’s costs in providing services to the other clients and considered the differences in management fees and profit margins for fund and non-fund services. In evaluating the
54Pioneer Emerging Markets Equity Fund | Annual Report | 9/30/23
fees associated with Amundi US’s client accounts, the Trustees took into account the respective demands, resources and complexity associated with the Fund and other client accounts. The Trustees noted that, in some instances, the fee rates for those clients were lower than the management fee for the Fund and considered that, under the investment management and administration agreements with the Fund, Amundi US performs additional services for the Fund that it does not provide to those other clients or services that are broader in scope, including oversight of the Fund’s other service providers and activities related to compliance and the extensive regulatory and tax regimes to which the Fund is subject. The Trustees also considered the entrepreneurial risks associated with Amundi US’s management of the Fund.
The Trustees concluded that the management fee payable by the Fund to Amundi US was reasonable in relation to the nature and quality of the services provided by Amundi US.
Profitability
The Trustees considered information provided by Amundi US regarding the profitability of Amundi US with respect to the advisory services provided by Amundi US to the Fund, including the methodology used by Amundi US in allocating certain of its costs to the management of the Fund. The Trustees also considered Amundi US’s profit margin in connection with the overall operation of the Fund. They further reviewed the financial results, including the profit margins, realized by Amundi US from non-fund businesses. The Trustees considered Amundi US’s profit margins in comparison to the limited industry data available and noted that the profitability of any adviser was affected by numerous factors, including its organizational structure and method for allocating expenses. The Trustees concluded that Amundi US’s profitability with respect to the management of the Fund was not unreasonable.
Economies of Scale
The Trustees considered Amundi US’s views relating to economies of scale in connection with the Pioneer Funds as fund assets grow and the extent to which any such economies of scale are shared with the Fund and Fund shareholders. The Trustees recognize that economies of scale are difficult to identify and quantify, and that, among other factors that may be relevant, are the following: fee levels, expense subsidization, investment by Amundi US in research and analytical capabilities and Amundi US’s commitment and resource allocation to the Fund. The Trustees noted that profitability also may be an indicator of the availability of any economies of scale, although profitability may vary for other reasons including due to
Pioneer Emerging Markets Equity Fund | Annual Report | 9/30/2355
reductions in expenses. The Trustees concluded that economies of scale, if any, were being appropriately shared with the Fund.
Other Benefits
The Trustees considered the other benefits that Amundi US enjoys from its relationship with the Fund. The Trustees considered the character and amount of fees paid or to be paid by the Fund, other than under the investment management agreement, for services provided by Amundi US and its affiliates. The Trustees further considered the revenues and profitability of Amundi US’s businesses other than the Fund business. To the extent applicable, the Trustees also considered the benefits to the Fund and to Amundi US and its affiliates from the use of “soft” commission dollars generated by the Fund to pay for research and brokerage services.
The Trustees considered that Amundi US is the principal U.S. asset management business of Amundi, which is one of the largest asset managers globally. Amundi’s worldwide asset management business manages over $2.1 trillion in assets (including the Pioneer Funds). The Trustees considered that Amundi US’s relationship with Amundi creates potential opportunities for Amundi US and Amundi that derive from Amundi US’s relationships with the Fund, including Amundi’s ability to market the services of Amundi US globally. The Trustees noted that Amundi US has access to additional research and portfolio management capabilities as a result of its relationship with Amundi and Amundi’s enhanced global presence that may contribute to an increase in the resources available to Amundi US. The Trustees considered that Amundi US and the Fund receive reciprocal intangible benefits from the relationship, including mutual brand recognition and, for the Fund, direct and indirect access to the resources of a large global asset manager. The Trustees concluded that any such benefits received by Amundi US as a result of its relationship with the Fund were reasonable.
Conclusion
After consideration of the factors described above as well as other factors, the Trustees, including the Independent Trustees, concluded that the investment management agreement for the Fund, including the fees payable thereunder, was fair and reasonable and voted to approve the proposed renewal of the investment management agreement.
56Pioneer Emerging Markets Equity Fund | Annual Report | 9/30/23
Statement Regarding Liquidity Risk Management Program
As required by law, the Fund has adopted and implemented a liquidity risk management program (the “Program”) that is designed to assess and manage liquidity risk. Liquidity risk is the risk that the Fund could not meet requests to redeem its shares without significant dilution of remaining investors’ interests in the Fund. The Fund’s Board of Trustees designated a liquidity risk management committee (the “Committee”) consisting of employees of Amundi Asset Management US, Inc. (the “Adviser”) to administer the Program.
The Committee provided the Board of Trustees with a report that addressed the operation of the Program and assessed its adequacy and effectiveness of implementation (the “Report”). The Report covered the period from January 1, 2022 through December 31, 2022 (the “Reporting Period”).
The Report confirmed that, throughout the Reporting Period, the Committee had monitored the Fund’s portfolio liquidity and liquidity risk on an ongoing basis, as described in the Program and in Board reporting throughout the Reporting Period.
The Report discussed the Committee’s annual review of the Program, which addressed, among other things, the following elements of the Program:
The Committee reviewed the Fund’s investment strategy and liquidity of portfolio investments during both normal and reasonably foreseeable stressed conditions. The Committee noted that the Fund’s investment strategy continues to be appropriate for an open-end fund, taking into account, among other things, whether and to what extent the Fund held less liquid and illiquid assets and the extent to which any such investments affected the Fund’s ability to meet redemption requests. In managing and reviewing the Fund’s liquidity risk, the Committee also considered the extent to which the Fund’s investment strategy involves a relatively concentrated portfolio or large positions in particular issuers, the extent to which the Fund uses borrowing for investment purposes, and the extent to which the Fund uses derivatives (including for hedging purposes). The Committee also reviewed the Fund’s short-term and long-term cash flow projections during both normal and reasonably foreseeable stressed conditions. In assessing the Fund’s cash flow projections, the Committee considered, among other factors, historical net redemption activity, redemption policies, ownership concentration, distribution channels, and the degree of certainty associated with the Fund’s short-term and long-term cash flow projections. The Committee also considered the Fund’s holdings of cash and cash equivalents, as well as borrowing arrangements
Pioneer Emerging Markets Equity Fund | Annual Report | 9/30/23 57
and other funding sources, including, if applicable, the Fund’s participation in a credit facility, as components of the Fund’s ability to meet redemption requests. The Fund has adopted an in-kind redemption policy which may be utilized to meet larger redemption requests.
The Committee reviewed the Program’s liquidity classification methodology for categorizing the Fund’s investments into one of four liquidity buckets. In reviewing the Fund’s investments, the Committee considered, among other factors, whether trading varying portions of a position in a particular portfolio investment or asset class in sizes the Fund would reasonably anticipate trading, would be reasonably expected to significantly affect liquidity.
The Committee performed an analysis to determine whether the Fund is required to maintain a Highly Liquid Investment Minimum, and determined that no such minimum is required because the Fund primarily holds highly liquid investments.
The Report stated that the Committee concluded the Program operates adequately and effectively, in all material respects, to assess and manage the Fund’s liquidity risk throughout the Reporting Period.
58Pioneer Emerging Markets Equity Fund | Annual Report | 9/30/23
Trustees, Officers and Service Providers
Investment Adviser and Administrator
Amundi Asset Management US, Inc.
Custodian and Sub-Administrator
The Bank of New York Mellon Corporation
Independent Registered Public Accounting Firm
Ernst & Young LLP
Principal Underwriter
Amundi Distributor US, Inc.
Legal Counsel
Morgan, Lewis & Bockius LLP
Transfer Agent
BNY Mellon Investment Servicing (US) Inc.
Proxy Voting Policies and Procedures of the Fund are available without charge, upon request, by calling our toll free number (1-800-225-6292). Information regarding how the Fund voted proxies relating to portfolio securities during the most recent 12-month period ended June 30 is publicly available to shareowners at www.amundi.com/us. This information is also available on the Securities and Exchange Commission’s web site at www.sec.gov.
Trustees and Officers
The Fund's Trustees and officers are listed below, together with their principal occupations and other directorships they have held during at least the past five years. Trustees who are interested persons of the Fund within the meaning of the 1940 Act are referred to as Interested Trustees. Trustees who are not interested persons of the Fund are referred to as Independent Trustees. Each of the Trustees serves as a Trustee of each of the 49 U.S. registered investment portfolios for which Amundi US serves as investment adviser (the “Pioneer Funds”). The address for all Trustees and all officers of the Fund is 60 State Street, Boston, Massachusetts 02109.
The Statement of Additional Information of the Fund includes additional information about the Directors and is available, without charge, upon request, by calling 1-800-225-6292.
60Pioneer Emerging Markets Equity Fund | Annual Report | 9/30/23
Name, Age and Position
Held With the Fund | Term of Office and
Length of Service | Principal Occupation(s) During At Least The Past Five Years | Other Directorships Held by Trustee
During At Least The Past Five Years |
Thomas J. Perna (72)
Chairman of the Board
and Trustee | Trustee since 2019.
Serves until a successor
trustee is elected or
earlier retirement
or removal. | Private investor (2004 – 2008 and 2013 – present); Chairman (2008 – 2013) and Chief Executive Officer (2008 – 2012), Quadriserv, Inc. (technology products for securities lending industry); and Senior Executive Vice President, The Bank of New York (financial and securities services) (1986 – 2004) | Director, Broadridge Financial Solutions, Inc.
(investor communications and securities
processing provider for financial services industry)
(2009 – present); Director, Quadriserv, Inc. (2005 –
2013); and Commissioner, New Jersey State
Civil Service Commission (2011 – 2015) |
John E. Baumgardner,
Jr. (72)*
Trustee | Trustee since 2019.
Serves until a successor
trustee is elected or
earlier retirement
or removal. | Of Counsel (2019 – present), Partner (1983-2018), Sullivan & Cromwell LLP (law firm). | Chairman, The Lakeville Journal Company, LLC,
(privately-held community newspaper group)
(2015-present) |
Diane Durnin (66)
Trustee | Trustee since 2019.
Serves until a successor
trustee is elected or
earlier retirement
or removal. | Managing Director - Head of Product Strategy and Development, BNY Mellon Investment Management (investment management firm) (2012-2018); Vice Chairman – The Dreyfus Corporation (2005 – 2018): Executive Vice President Head of Product, BNY Mellon Investment Management (2007-2012); Executive Director- Product Strategy, Mellon Asset Management (2005-2007); Executive Vice President Head of Products, Marketing and Client Service, Dreyfus Corporation (investment management firm) (2000-2005); Senior Vice President Strategic Product and Business Development, Dreyfus Corporation (1994-2000) | None |
Pioneer Emerging Markets Equity Fund | Annual Report | 9/30/2361
Independent Trustees (continued)
Name, Age and Position
Held With the Fund | Term of Office and
Length of Service | Principal Occupation(s) During At Least The Past Five Years | Other Directorships Held by Trustee
During At Least The Past Five Years |
Benjamin M. Friedman (79)
Trustee | Trustee since 2019.
Serves until a successor
trustee is elected or
earlier retirement
or removal. | William Joseph Maier Professor of Political Economy, Harvard University (1972 – present) | Trustee, Mellon Institutional Funds Investment
Trust and Mellon Institutional Funds Master
Portfolio (oversaw 17 portfolios in fund complex)
(1989 - 2008) |
Craig C. MacKay (60)
Trustee | Trustee since 2021.
Serves until a successor
trustee is elected or
earlier retirement
or removal. | Partner, England & Company, LLC (advisory firm) (2012 – present); Group Head – Leveraged Finance Distribution, Oppenheimer & Company (investment bank) (2006 – 2012); Group Head – Private Finance & High Yield Capital Markets Origination, SunTrust Robinson Humphrey (investment bank) (2003 – 2006); and Founder and Chief Executive Officer, HNY Associates, LLC (investment bank) (1996 – 2003) | Director, Equitable Holdings, Inc. (financial
services holding company) (2022 – present);
Board Member of Carver Bancorp, Inc. (holding
company) and Carver Federal Savings Bank,
NA (2017 – present); Advisory Council Member,
MasterShares ETF (2016 – 2017); Advisory
Council Member, The Deal (financial market
information publisher) (2015 – 2016); Board
Co-Chairman and Chief Executive Officer, Danis
Transportation Company (privately-owned
commercial carrier) (2000 – 2003); Board
Member and Chief Financial Officer, Customer
Access Resources (privately-owned
teleservices company) (1998 – 2000); Board
Member, Federation of Protestant Welfare
Agencies (human services agency) (1993 –
present); and Board Treasurer, Harlem Dowling
Westside Center (foster care agency)
(1999 – 2018) |
62Pioneer Emerging Markets Equity Fund | Annual Report | 9/30/23
Name, Age and Position
Held With the Fund | Term of Office and
Length of Service | Principal Occupation(s) During At Least The Past Five Years | Other Directorships Held by Trustee
During At Least The Past Five Years |
Lorraine H. Monchak (67)
Trustee | Trustee since 2019.
(Advisory Trustee from
2014 - 2017). Serves
until a successor trustee
is elected or earlier
retirement or removal. | Chief Investment Officer, 1199 SEIU Funds (healthcare workers union pension funds) (2001 – present); Vice President – International Investments Group, American International Group, Inc. (insurance company) (1993 – 2001); Vice President Corporate Finance and Treasury Group, Citibank, N.A. (1980 – 1986 and 1990 – 1993); Vice President – Asset/Liability Management Group, Federal Farm Funding Corporation (government-sponsored issuer of debt securities) (1988 – 1990); Mortgage Strategies Group, Shearson Lehman Hutton, Inc. (investment bank) (1987 – 1988); Mortgage Strategies Group, Drexel Burnham Lambert, Ltd. (investment bank) (1986 – 1987) | None |
Marguerite A. Piret (75)
Trustee | Trustee since 2019.
Serves until a successor
trustee is elected or
earlier retirement
or removal. | Chief Financial Officer, American Ag Energy, Inc. (technology for the environment, energy and agriculture) (2019 – present); Chief Operating Officer, North Country Growers LLC (controlled environment agriculture company) (2020 – present); Chief Executive Officer, Green Heat LLC (biofuels company) (2022 – present); President and Chief Executive Officer, Newbury Piret Company (investment banking firm) (1981 – 2019) | Director of New America High Income Fund,
Inc. (closed-end investment company) (2004 –
present); and Member, Board of Governors,
Investment Company Institute (2000 – 2006) |
Pioneer Emerging Markets Equity Fund | Annual Report | 9/30/2363
Independent Trustees (continued)
Name, Age and Position
Held With the Fund | Term of Office and
Length of Service | Principal Occupation(s) During At Least The Past Five Years | Other Directorships Held by Trustee
During At Least The Past Five Years |
Fred J. Ricciardi (76)
Trustee | Trustee since 2019.
Serves until a successor
trustee is elected or
earlier retirement
or removal. | Private investor (2020 – present); Consultant (investment company services) (2012 – 2020); Executive Vice President, BNY Mellon (financial and investment company services) (1969 – 2012); Director, BNY International Financing Corp. (financial services) (2002 – 2012); Director, Mellon Overseas Investment Corp. (financial services) (2009 – 2012); Director, Financial Models (technology) (2005-2007); Director, BNY Hamilton Funds, Ireland (offshore investment companies) (2004-2007); Chairman/Director, AIB/BNY Securities Services, Ltd., Ireland (financial services) (1999-2006); Chairman, BNY Alternative Investment Services, Inc. (financial services) (2005-2007) | None |
| * Mr. Baumgardner is Of Counsel to Sullivan & Cromwell LLP, which acts as counsel to the Independent Trustees of each Pioneer Fund. |
64Pioneer Emerging Markets Equity Fund | Annual Report | 9/30/23
Name, Age and Position
Held With the Fund | Term of Office and
Length of Service | Principal Occupation(s) During At Least The Past Five Years | Other Directorships Held by Trustee
During At Least The Past Five Years |
Lisa M. Jones (61)**
Trustee, President and Chief
Executive Officer | Trustee since 2019. Serves
until a successor trustee is
elected or earlier retirement
or removal | Director, CEO and President of Amundi US, Inc. (investment management firm) (since September 2014); Director, CEO and President of Amundi Asset Management US, Inc. (since September 2014); Director, CEO and President of Amundi Distributor US, Inc. (since September 2014); Director, CEO and President of Amundi Asset Management US, Inc. (since September 2014); Chair, Amundi US, Inc., Amundi Distributor US, Inc. and Amundi Asset Management US, Inc. (September 2014 – 2018); Managing Director, Morgan Stanley Investment Management (investment management firm) (2010 – 2013); Director of Institutional Business, CEO of International, Eaton Vance Management (investment management firm) (2005 – 2010); Director of Amundi Holdings US, Inc. (since 2017) | Director of Clearwater Analytics (provider
of web-based investment accounting
software for reporting and reconciliation
services) (September 2022 – present) |
Kenneth J. Taubes (65)**
Trustee | Trustee since 2019. Serves
until a successor trustee is
elected or earlier retirement
or removal | Director and Executive Vice President (since 2008) and Chief Investment Officer, U.S. (since 2010) of Amundi US, Inc. (investment management firm); Director and Executive Vice President and Chief Investment Officer, U.S. of Amundi US (since 2008); Executive Vice President and Chief Investment Officer, U.S. of Amundi Asset Management US, Inc. (since 2009); Portfolio Manager of Amundi US (since 1999); Director of Amundi Holdings US, Inc. (since 2017) | None |
| ** Ms. Jones and Mr. Taubes are Interested Trustees because they are officers or directors of the Fund’s investment adviser and certain of its affiliates. |
Pioneer Emerging Markets Equity Fund | Annual Report | 9/30/2365
Name, Age and Position
Held With the Fund | Term of Office and
Length of Service | Principal Occupation(s) During At Least The Past Five Years | Other Directorships Held by Officer
During At Least The Past Five Years |
Christopher J. Kelley (58)
Secretary and Chief
Legal Officer | Since 2019. Serves at
the discretion of
the Board | Vice President and Associate General Counsel of Amundi US since January 2008; Secretary and Chief Legal Officer of all of the Pioneer Funds since June 2010; Assistant Secretary of all of the Pioneer Funds from September 2003 to May 2010; Vice President and Senior Counsel of Amundi US from July 2002 to December 2007 | None |
Thomas Reyes (60)
Assistant Secretary | Since 2019. Serves at
the discretion of
the Board | Assistant General Counsel of Amundi US since May 2013 and Assistant Secretary of all the Pioneer Funds since June 2010; Counsel of Amundi US from June 2007 to May 2013 | None |
Heather L. Melito-Dezan (46)
Assistant Secretary | Since 2022. Serves at
the discretion of
the Board | Director - Trustee and Board Relationships of Amundi US since September 2019; Assistant Secretary of Amundi US, Inc. since July 2020: Assistant Secretary of Amundi Asset Management US, Inc. since July 2020: Assistant Secretary of Amundi Distributor US, Inc. since July 2020; Assistant Secretary of all the Pioneer Funds since September 2022; Private practice from 2017 – 2019. | None |
Anthony J. Koenig, Jr. (59)
Treasurer and
Chief Financial and
Accounting Officer | Since 2021. Serves at
the discretion of
the Board | Managing Director, Chief Operations Officer and Fund Treasurer of Amundi US since May 2021; Treasurer of all of the Pioneer Funds since May 2021; Assistant Treasurer of all of the Pioneer Funds from January 2021 to May 2021; and Chief of Staff, US Investment Management of Amundi US from May 2008 to January 2021 | None |
Luis I. Presutti (58)
Assistant Treasurer | Since 2019. Serves at
the discretion of
the Board | Director – Fund Treasury of Amundi US since 1999; and Assistant Treasurer of all of the Pioneer Funds since 1999 | None |
Gary Sullivan (65)
Assistant Treasurer | Since 2019. Serves at
the discretion of
the Board | Senior Manager – Fund Treasury of Amundi US since 2012; and Assistant Treasurer of all of the Pioneer Funds since 2002 | None |
66Pioneer Emerging Markets Equity Fund | Annual Report | 9/30/23
Name, Age and Position
Held With the Fund | Term of Office and
Length of Service | Principal Occupation(s) During At Least The Past Five Years | Other Directorships Held by Officer
During At Least The Past Five Years |
Antonio Furtado (41)
Assistant Treasurer | Since 2020. Serves at
the discretion of
the Board | Fund Oversight Manager – Fund Treasury of Amundi US since 2020; Assistant Treasurer of all of the Pioneer Funds since 2020; and Senior Fund Treasury Analyst from 2012 - 2020 | None |
Michael Melnick (52)
Assistant Treasurer | Since 2021. Serves at
the discretion of
the Board | Vice President - Deputy Fund Treasurer of Amundi US since May 2021; Assistant Treasurer of all of the Pioneer Funds since July 2021; Director of Regulatory Reporting of Amundi US from 2001 – 2021; and Director of Tax of Amundi US from 2000 - 2001 | None |
John Malone (52)
Chief Compliance Officer | Since 2019. Serves at
the discretion of
the Board | Managing Director, Chief Compliance Officer of Amundi US Asset Management; Amundi Asset Management US, Inc.; and the Pioneer Funds since September 2018; Chief Compliance Officer of Amundi Distributor US, Inc. since January 2014. | None |
Brandon Austin (51)
Anti-Money Laundering Officer | Since 2022. Serves at
the discretion of
the Board | Director, Financial Security – Amundi Asset Management; Anti-Money Laundering Officer of all the Pioneer Funds since March 2022: Director of Financial Security of Amundi US since July 2021; Vice President, Head of BSA, AML and OFAC, Deputy Compliance Manager, Crédit Agricole Indosuez Wealth Management (investment management firm) (2013 – 2021) | None |
Pioneer Emerging Markets Equity Fund | Annual Report | 9/30/2367
How to Contact Amundi
We are pleased to offer a variety of convenient ways for you to contact us for assistance or information.
Call us for:
Account Information, including existing accounts,
new accounts, prospectuses, applications
and service forms
1-800-225-6292
FactFoneSM for automated fund yields, prices,
account information and transactions
1-800-225-4321
| Retirement plans information | 1-800-622-0176 |
Write to us:
Amundi
P.O. Box 534427
Pittsburgh, PA 15253-4427
| Our toll-free fax | 1-800-225-4240 |
| Our internet e-mail address | us.askamundi@amundi.com
(for general questions about Amundi only) |
Visit our web site: www.amundi.com/us
This report must be preceded or accompanied by a prospectus.
The Fund files a complete schedule of portfolio holdings with the Securities and Exchange Commission for the first and third quarters of each fiscal year as an exhibit to its reports on Form N-PORT. Shareholders may view the filed Form N-PORT by visiting the Commission’s web site at https://www.sec.gov.
Amundi Asset Management US, Inc.
60 State Street
Boston, MA 02109
www.amundi.com/us
Securities offered through Amundi Distributor US, Inc.
60 State Street, Boston, MA 02109
Underwriter of Pioneer Mutual Funds, Member SIPC
© 2023 Amundi Asset Management US, Inc. 32311-03-1123
Pioneer Global Sustainable Growth Fund
Annual Report | September 30, 2023
visit us: www.amundi.com/us
Pioneer Global Sustainable Growth Fund | Annual Report | 9/30/231
President’s Letter
Dear Shareholders,
On February 13, 2023, Amundi US celebrated the 95th anniversary of Pioneer Fund, the second-oldest mutual fund in the United States. We recognized the anniversary with ringing of the closing bell at the New York Stock Exchange, which seemed fitting for this special milestone.
Pioneer Fund was launched on February 13, 1928 by Phil Carret, one of the earliest proponents of value investing and a leading innovator in the asset management industry. Mr. Carret began investing in the 1920s and founded Pioneer Investments (now Amundi US) in 1928, and was one of the first investors to realize he could uncover value through rigorous, innovative, fundamental research techniques.
Consistent with Mr. Carret’s investment approach and employing many of the same techniques utilized in the 1920s, Amundi US's portfolio managers have adapted Mr. Carret’s philosophy to a new age of “active” investing.
The last few years have seen investors face some unprecedented challenges, from a global pandemic that shuttered much of the world’s economy for months, to geopolitical strife, to rising inflation that has reached levels not seen in decades. Now, more than ever, Amundi US believes active management – that is, making active investment decisions across all of our portfolios – can help mitigate risk during periods of market volatility.
At Amundi US, active management begins with our own fundamental, bottom-up research process. Our team of dedicated research analysts and portfolio managers analyzes each security under consideration, communicating frequently with the management teams of the companies and other entities issuing the securities, and working together to identify those securities that we believe best meet our investment criteria for our family of funds. Our risk management approach begins with each security under consideration, as we strive to develop a deep understanding of the potential opportunity, while considering any potential risk factors.
Today, as shareholders, we have many options. It is our view that active management can serve shareholders well, not only when markets are thriving, but also during periods of market stress. As you consider your long-term investment goals, we encourage you to work with your financial professional to develop an investment plan that paves the way for you to pursue both your short-term and long-term goals.
2Pioneer Global Sustainable Growth Fund | Annual Report | 9/30/23
We greatly appreciate the trust you have placed in us and look forward to continuing to serve you in the future.
Lisa M. Jones
Head of the Americas, President and CEO of US
Amundi Asset Management US, Inc.
November 2023
Any information in this shareowner report regarding market or economic trends or the factors influencing the Fund’s historical or future performance are statements of opinion as of the date of this report. Past performance is no guarantee of future results.
Pioneer Global Sustainable Growth Fund | Annual Report | 9/30/233
Portfolio Management Discussion | 9/30/23
In the following discussion, portfolio managers John Peckham, Brian Chen, and Jeff Sacknowitz discuss the market environment during the 12-month period ended September 30, 2023, and the performance of Pioneer Global Sustainable Growth Fund during the period. Mr. Peckham, a senior vice president and a portfolio manager at Amundi Asset Management US, Inc. (Amundi US), Mr. Chen, a senior vice president and a portfolio manager at Amundi US, and Mr. Sacknowitz, a vice president and a portfolio manager at Amundi US, are responsible for the day-to-day management of the Fund.
| Q | How did the Fund perform during the 12-month period ended September 30, 2023? |
| A | Pioneer Global Sustainable Growth Fund’s Class A shares returned 23.44% at net asset value during the 12-month period ended September 30, 2023, while the Fund’s benchmark, the Morgan Stanley Capital International (MSCI) All Country World (ACWI) Growth Index*, returned 24.41%. During the same 12-month period, the average return of the 356 mutual funds in Morningstar’s Global Large-Stock Growth category was 19.50%. |
| Q | How would you describe the investment backdrop for equities during the 12-month period ended September 30, 2023? |
| A | The period opened in the wake of a series of aggressive Federal Reserve (Fed) interest-rate increases as the US central bank sought to counter rising levels of inflation, which had peaked at over 9% in June of 2022. The Fed’s determined stance had brought the target for its benchmark federal funds rate from 0.00% – 0.25% in March of 2022, to 3.00% – 3.25% entering |
| * | The MSCI information may only be used for your internal use, may not be reproduced or redisseminated in any form and may not be used as a basis for or a component of any financial instruments or products or indices. None of the MSCI information is intended to constitute investment advice or a recommendation to make (or refrain from making) any kind of investment decision and may not be relied on as such. Historical data and analysis should not be taken as an indication or guarantee of any future performance analysis, forecast or prediction. The MSCI information is provided on an “as is” basis and the user of this information assumes the entire risk of any use made of this information. MSCI, each of its affiliates and each other person involved in or related to compiling, computing or creating any MSCI information (collectively, the “MSCI Parties”) expressly disclaims all warranties (including, without limitation, any warranties of originality, accuracy, completeness, timeliness, non-infringement, merchantability and fitness for a particular purpose) with respect to this information. Without limiting any of the foregoing, in no event shall any MSCI Party have any liability for any direct, indirect, special, incidental, punitive, consequential (including, without limitation, lost profits) or any other damages. |
4Pioneer Global Sustainable Growth Fund | Annual Report | 9/30/23
| | October 2022. In addition, the US Treasury yield curve, which had moved notably higher in response to the Fed’s actions, became inverted as the market anticipated a recession. (A yield curve is a line that plots the interest rates, at a set point in time, of bonds having equal credit quality but differing maturity dates. An inverted yield curve means that longer-term rates are lower than shorter-term rates.) |
| | As the fourth quarter of 2022 progressed and inflation showed signs of modest easing, investors’ sentiment for riskier assets, such as equities, improved as the market began to anticipate a pivot by the Fed to a more dovish policy stance, despite another increase of 75 basis points (bps) to the federal funds rate target range in early November 2022. (A basis point is equal to 1/100th of a percentage point.) In December, however, after a solid start to the fourth quarter, the market soon turned its attention to the potential recessionary effects of the higher interest-rate regime put in place by the Fed, which led riskier assets to give back some of their gains from earlier in the quarter as the month progressed. In addition, the Fed implemented a more modest 50 bps increase to the federal funds rate target range at its December meeting, leaving the target range at 4.25% – 4.50% at the end of 2022, its highest level since the fall of 2007. |
| | Entering 2023, riskier assets rallied again, amid renewed investor optimism that the Fed and other leading central banks were poised to stop raising interest rates. January 2023 saw Treasury yields pull back from their more recent highs on the outlook for a potential easing of monetary policy. In addition, the reopening of China’s economy as the Chinese government unwound its “Zero-COVID” policy eased concerns about slowing global economic growth. Against that backdrop, areas of the market that had lagged during the 2022 sell-off (such as growth stocks and corporate bonds) outperformed. On February 1, the Fed increased the federal funds rate target again, but this time by a comparatively moderate 25 bps, bringing the target range to 4.50% – 4.75%. |
| | In March, however, the failure of some regional US banks and the collapse of European lender Credit Suisse raised fears of a financial crisis. In response, the Fed implemented a new lending program to support bank liquidity, while market participants |
Pioneer Global Sustainable Growth Fund | Annual Report | 9/30/235
| | began to anticipate decreases in the federal funds rate target range by the Fed before the end of the calendar year. The prospect of easier monetary policy and the “flight to safety” spurred by banking concerns drove Treasury yields sharply lower. At its March 23 meeting, the Fed went forward with another modest 25 bps increase to the federal funds target, bringing the range to 4.75% ‒ 5.00%. The financial markets viewed that increase as an indication that the Fed believed the financial system, overall, remained on solid footing. |
| | As the period progressed, declining inflation data led investors to expect the monetary tightening by central banks to end at some point in 2023. In addition, surprisingly resilient global economic growth raised hopes that the world economy would experience a “soft landing” rather than a recession. (A soft landing is when economic growth slows but remains positive as inflation is brought under control.) The Fed would implement another increase to the federal funds target range of 25 bps in early May, bringing the range to 5.00% ‒ 5.25%, before taking a pause at its June meeting. On July 26, 2023, the Fed once again raised the federal funds target range by 25 bps, then the Fed took another pause at its September meeting, leaving the range at 5.25% ‒ 5.50% as of period-end. At its September meeting, the Fed did signal the likelihood of another interest-rate increase before year-end. However, the central bank’s “dot plot” displaying Open Market Committee members’ expectations for the trajectory of the federal funds rate signaled only two rate cuts during 2024, a reflection of resilient economic growth and employment data. (The FOMC, or Federal Open Market Committee, dot plot, is a chart that summarizes the FOMC's outlook for the federal funds rate.) |
| | Given the “higher for longer” interest-rate outlook, Treasury yields moved higher and global equities declined towards the end of the 12-month period, with growth-oriented stocks posting the biggest losses. In Europe, investors braced for higher interest rates over a prolonged period, even as economic data such as purchasing manager indices (PMI) sat at contractionary levels. By contrast, Japan’s gross domestic product (GDP) has remained robust, as evidenced by annualized 6% growth as of the end of June. The number exceeded forecasts, as a weaker yen has |
6Pioneer Global Sustainable Growth Fund | Annual Report | 9/30/23
| | boosted activity for Japanese exporters. While inflation has slowed in Japan, core inflation has persisted at above Bank of Japan targets. |
| | For the 12-month period, the Fund’s benchmark, the MSCI ACWI Growth Index, returned 24.41%, outperforming the return of 16.98% for the MSCI All Country World Value Index, as growth stocks outperformed value stocks. |
| Q | What is your investment approach in managing the Fund? |
| A | The Fund’s primary objective is to seek long-term capital growth. We seek to achieve that objective by investing the Fund in a portfolio of stocks of what we believe to be quality growth-oriented companies globally, across any market capitalization. |
| | In managing the Fund, Amundi US adheres to an ESG (environmental, social, and governance) mandate. We seek to invest the portfolio in securities of issuers with above-average potential for earnings and revenue growth, with an emphasis on shares of companies that we believe feature sustainable business models. Amundi US’s investment process includes evaluating individual companies’ ESG practices. In keeping with that focus, Amundi US considers ESG information when evaluating which investments to include in the Fund’s portfolio. Amundi US believes that ESG-related information helps us gain a more complete understanding of a company and its business. |
| | Under normal circumstances, the Fund invests at least 80% of its net assets (plus the amount of borrowings, if any, for investment purposes) in securities of issuers that Amundi US believes adhere to the Fund's ESG criteria. For purposes of the Fund's 80% investment policy, “ESG criteria” is defined as the exclusion of investments issued by companies significantly involved in the production of tobacco products and controversial military weapons consisting of cluster weapons, anti-personnel mines, nuclear weapons, and biological and chemical weapons, and the operation of thermal coal mines. |
Pioneer Global Sustainable Growth Fund | Annual Report | 9/30/237
| Q | What were the principal factors affecting the Fund’s benchmark-relative performance during the 12-month period ended September 30, 2023? |
| A | The Fund’s benchmark-relative performance benefited the most during the 12-month period from positive stock selection results, while sector allocation results were negative and detracted from relative returns. Stock selection results were most beneficial for the Fund within the consumer discretionary, financials, and consumer staples sectors, while selection results lagged the benchmark within the health care and communication services sectors. |
| | Leading individual contributors to the Fund’s benchmark-relative returns for the 12-month period included a position in Germany-based Hensoldt AG, within the industrials sector. Hensoldt develops sensor technologies and other electronics for the defense and aerospace sectors. Sentiment with respect to Hensoldt has benefited from the German government’s announcement of plans to increase defense spending. We have maintained the Fund’s position, given the company’s huge order backlog and even larger project pipeline, which could support future earnings. Within the consumer discretionary sector, a lack of portfolio exposure to electronic vehicle manufacturer Tesla, along with an underweight allocation to online retailer Amazon.com, benefited the Fund’s relative performance. Tesla’s stock performed poorly early in the period on slowing sales and weak financial results. Meanwhile, Amazon, which experienced a sharp rise in revenue growth during the pandemic, has seen growth lag in recent months. Another positive contributor to the Fund’s relative return was a position in semiconductor company AMD (Advanced Micro Devices), which enjoyed some tailwinds in the first quarter of 2023, driven by falling interest rates, which helped technology-oriented large-growth stocks outperform. In addition, growing interest in artificial intelligence (AI) carried the stock price higher as headlines around ChatGPT captured the imagination of investors. We think AMD could potentially benefit from adoption of this technology, given the need for its server chips to work with GPUs. In our view, the company is better positioned than its competitors as AMD has continued to gain market share through the strength of its product set, and so we have continued to hold |
8Pioneer Global Sustainable Growth Fund | Annual Report | 9/30/23
| | the stock in the portfolio. Shares of multinational computer technology company Oracle outperformed and benefited the Fund’s benchmark-relative results, as the company’s CEO surprised investors by announcing new and higher financial targets at Oracle’s annual global conference. In addition, Oracle has demonstrated plenty of room for expense rationalization as the company is focused on healthy operating margins. We continue to hold the stock in the portfolio, as we view Oracle as one of the few software value ideas that we believe can sustain growth, while showing it remains relevant in the Cloud world. |
| | On the downside, a lack of portfolio exposure to semiconductor company NVIDIA weighed most heavily on the Fund’s benchmark-relative performance during the 12-month period, as the stock price was boosted by the prospect of spending on AI. PT Telkom, Indonesia’s largest telecom operator, was another stock in the portfolio which detracted from the Fund’s relative returns. The company’s shares came under pressure on concerns about shrinking consumer discretionary spending, given the Indonesian government’s decision to lower gasoline subsidies. In our view, the consolidation of the Indonesian mobile phone market has resulted in a better pricing environment as the company looks to recognize synergies by consolidating subsidiaries. We believe those catalysts could be more important to PT Telkom’s fundamentals than the short-term concerns over diminished consumption. A lack of portfolio exposure to Facebook parent Meta also proved detrimental to the Fund’s benchmark-relative performance for the 12-month period. The stock performed very poorly in the fourth quarter of 2022, due to concerns over the possible effects on profitability from the company’s massive investment in developing metaverse-related products, against the backdrop of a weak advertising environment. However, Meta’s share price rebounded sharply in the first quarter of 2023 as the company took measures to reduce spending, including laying off more than 10,000 employees. A position in Pfizer was another detractor from the Fund’s relative performance. The stock price declined over the period as management lowered guidance on COVID-19-related revenues for 2023. However, we continue to be encouraged by Pfizer’s progress on its pipeline of drugs in development, which includes some potentially large products. |
Pioneer Global Sustainable Growth Fund | Annual Report | 9/30/239
| | Finally, a position in Generac, which manufactures and sells power generation equipment for residential and commercial markets across the globe, detracted from the Fund’s relative returns. Generac’s stock came under pressure in the fourth quarter of 2022 as management announced preliminary results that revealed a growing inventory problem, given that installation capacity for home generators has severely lagged production. However, we still view Generac as positioned to possibly increase market share within an attractive industry space that offers a secular growth opportunity, and so we have retained the Fund’s position. |
| Q | Did the Fund have any exposure to derivative securities during the 12-month period ended September 30, 2023? |
| A | The Fund held positions in forward foreign currency exchange contracts (currency forwards) during the 12-month period. The currency forwards had a negligible effect on the Fund's performance. |
| Q | How would you characterize your outlook and the Fund’s overall positioning as of September 30, 2023? |
| A | The macroeconomic environment has grown increasingly difficult, and, in our view, a soft landing has become increasingly unlikely while the risk of recession has grown. Slowing economic data has become more evident in Europe, and while US data has been somewhat mixed, higher interest rates have slowed industrial production. However, other parts of the economy, including housing, have held up fairly well, thus further reinforcing the outlook for hawkish Fed monetary policy, which has not yet been fully reflected in equity prices. |
| | Given those challenges, we have maintained a cautious stance, and have continued to adhere to our “all weather” investment process that seeks to invest the Fund in stocks of what we believe are quality companies, featuring attractive valuations. Over the last year, performance leadership within the equity markets has been very concentrated in a small number of stocks supported by investors’ anticipation about the potential of AI. In our view, this is not sustainable, and so we have maintained the portfolio’s underweights to mega-cap growth stocks |
10Pioneer Global Sustainable Growth Fund | Annual Report | 9/30/23
| | characterized by excessive valuations. As a result, the portfolio is underweight to the US, where the mega-cap AI market segment is located. |
| | Furthermore, from a geographic standpoint, some of the Fund’s largest country overweights versus the benchmark continue to be in Northeast Asia, including Korea and Japan, where large valuation discrepancies have remained in place. We have retained the Fund’s overweight to Japan, as we have focused on multinational companies with new managements that appear committed to restructuring their business portfolios and to emphasizing market-leading businesses, while de-emphasizing businesses that are not performing. In our view, this trend, in conjunction with generally strong balance sheets, more shareholder-friendly policies, and extremely low valuations, presents a solid investment opportunity. Moreover, the weaker yen has increased the competitiveness of Japanese exporters. |
| | The top-down investment themes on which we have focused have continued to guide the portfolio towards regions and sectors that we believe can perform well in an environment of higher interest rates, while also reducing cyclicality. For example, we have increased the Fund’s exposure to health care stocks, which have tended to be less sensitive to changes in the macroeconomic environment, while also trading at compelling valuations. In addition, given the global shift towards quantitative tightening by central banks, we have maintained the portfolio’s exposure to what we view as attractively valued over-capitalized banks with a focus on traditional banking services, especially in Europe, where the financial sector appears to be in solid shape. European banks have been generating strong profits, and, given their mix of high profitability and excess capital, have also been able to reward shareholders with significant dividends** and share buybacks. |
| | We are also maintaining an overweight Fund allocation to the energy sector across geographic regions. While commodity prices have been volatile, we view the sector as presenting a structural opportunity for investors. Globally, there has been an underinvestment in fossil fuels, and the OPEC+ nations appear to |
| ** | Dividends are not guaranteed. |
Pioneer Global Sustainable Growth Fund | Annual Report | 9/30/2311
| | be disciplined in keeping a floor on crude oil prices. (The Organization of the Petroleum Exporting Countries Plus, or OPEC+, is a loosely affiliated entity consisting of the 13 OPEC members and 10 of the world's major non-OPEC oil-exporting nations. A price floor is the lowest amount at which a good or service may be sold and still function within the traditional supply-and-demand model.) |
| | In addition to other holdings within the energy sector, we have also maintained the Fund’s exposure to natural gas companies. We expect natural gas prices to receive support over time, given that the commodity could be a key energy source during the transition away from higher-carbon sources such as oil and coal. Finally, the portfolio is underweight to those areas of the market that seem most likely to feel the negative effects of higher rates and inflation, including the utilities and real estate sectors. |
12Pioneer Global Sustainable Growth Fund | Annual Report | 9/30/23
Please refer to the Schedule of Investments on pages 21 - 26 for a full listing of Fund securities.
All investments are subject to risk, including the possible loss of principal. In the past several years, financial markets have experienced increased volatility and heightened uncertainty. The market prices of securities may go up or down, sometimes rapidly or unpredictably, due to general market conditions, such as real or perceived adverse economic, political, or regulatory conditions, recessions, inflation, changes in interest or currency rates, lack of liquidity in the bond markets, the spread of infectious illness or other public health issues, armed conflict including Russia's military invasion of Ukraine, sanctions against Russia, other nations or individuals or companies and possible countermeasures, market disruptions caused by tariffs, trade disputes or other government actions, or adverse investor sentiment. These conditions may continue, recur, worsen or spread.
Investing in foreign and/or emerging markets securities involves risks relating to interest rates, currency exchange rates, economic, and political conditions.
The Fund is subject to currency risk, meaning that the Fund could experience losses based on changes in the exchange rate between non-U.S. currencies and the U.S. dollar.
The Fund generally excludes corporate issuers that do not meet or exceed minimum ESG standards. Excluding specific issuers limits the universe of investments available to the Fund, which may mean forgoing some investment opportunities available to funds without similar ESG standards.
The market price of securities may fluctuate when interest rates change. When interest rates rise, the prices of fixed-income securities in the Fund will generally fall. Conversely, when interest rates fall, the prices of fixed-income securities in the Fund will generally rise.
The Fund may use derivatives, which may have a potentially large impact on Fund performance.
The Fund may invest in IPOs (Initial Public Offerings), which may involve additional risks.
For more information on this or any Pioneer fund, please visit amundi.com/usinvestors or call 1-800-622-9876. This material must be preceded or accompanied by the Fund's current prospectus or summary prospectus.
Any information in this shareholder report regarding market or economic trends or the factors influencing the Fund’s historical or future performance are statements of opinion as of the date of this report. Past performance is no guarantee of future results.
Pioneer Global Sustainable Growth Fund | Annual Report | 9/30/2313
Portfolio Summary | 9/30/23
Sector Distribution
(As a percentage of total investments)*
Geographical Distribution
(As a percentage of total investments based on country of domicile)*
10 Largest Holdings
| (As a percentage of total investments)* |
| 1. | Alphabet, Inc., Class C | 5.70% |
| 2. | Amazon.com, Inc. | 5.38 |
| 3. | Microsoft Corp. | 3.76 |
| 4. | Apple, Inc. | 3.06 |
| 5. | Advanced Micro Devices, Inc. | 3.02 |
| 6. | RELX Plc | 2.92 |
| 7. | Eli Lilly & Co. | 2.84 |
| 8. | Alibaba Group Holding, Ltd. | 2.82 |
| 9. | Samsung Electronics Co., Ltd. | 2.81 |
| 10. | International Business Machines Corp. | 2.70 |
| | |
| * | Excludes short-term investments and all derivative contracts except for options purchased. The Fund is actively managed, and current holdings may be different. The holdings listed should not be considered recommendations to buy or sell any securities. |
14Pioneer Global Sustainable Growth Fund | Annual Report | 9/30/23
Prices and Distributions | 9/30/23
Net Asset Value per Share
| Class | 9/30/23 | 9/30/22 |
| A | $9.68 | $7.86 |
| C | $9.52 | $7.76 |
| Y | $9.70 | $7.87 |
| | | |
Distributions per Share: 10/1/22 - 9/30/23
| Class | Net
Investment
Income | Short-Term
Capital Gains | Long-Term
Capital Gains |
| A | $0.0199 | $— | $— |
| C | $ — | $— | $— |
| Y | $0.0477 | $— | $— |
Index Definitions
The Morgan Stanley Capital International (MSCI) All Country World Growth NR Index measures the free-float weighted equity index that captures large and mid-cap representation across emerging markets countries. The index covers approximately 85% of the free float-adjusted market capitalization in each country. Indices are unmanaged and their returns assume reinvestment of dividends and do not reflect any fees or expenses. It is not possible to invest directly in an index.
The index defined here pertains to the “Value of $10,000 Investment” and “Value of $5 Million Investment” charts on pages 16 - 18.
Pioneer Global Sustainable Growth Fund | Annual Report | 9/30/2315
| Performance Update | 9/30/23 | Class A Shares |
Investment Returns
The mountain chart on the right shows the change in value of a $10,000 investment made in Class A shares of Pioneer Global Sustainable Growth Fund at public offering price during the periods shown, compared to that of the MSCI All Country World Growth NR Index.*
Average Annual Total Returns
(As of September 30, 2023) |
| Period | Net
Asset
Value
(NAV) | Public
Offering
Price
(POP) | MSCI All
Country
World
Growth
NR Index |
Life-of-Class
(5/10/21)* | -1.25% | -3.66% | -2.74% |
| 1 Year | 23.44 | 16.34 | 24.41 |
Expense Ratio
(Per prospectus dated February 1, 2023) |
| Gross | Net |
| 11.71% | 1.00% |
Value of $10,000 Investment
Call 1-800-225-6292 or visit www.amundi.com/us for the most recent month-end performance results. Current performance may be lower or higher than the performance data quoted.
The performance data quoted represents past performance, which is no guarantee of future results. Investment return and principal value will fluctuate, and shares, when redeemed, may be worth more or less than their original cost.
NAV results represent the percent change in net asset value per share. NAV returns would have been lower had sales charges been reflected. POP returns reflect deduction of maximum 5.75% sales charge. All results are historical and assume the reinvestment of dividends and capital gains. Other share classes are available for which performance and expenses will differ.
Performance results reflect any applicable expense waivers in effect during the periods shown. Without such waivers Fund performance would be lower. Waivers may not be in effect for all funds. Certain fee waivers are contractual through a specified period. Otherwise, fee waivers can be rescinded at any time. See the prospectus and financial statements for more information.
The net expense ratio reflects the contractual expense limitation in effect through February 1, 2024 for Class A shares. There can be no assurance that Amundi US will extend the expense limitation beyond such time. Please see the prospectus and financial statements for more information.
* Performance of Class A shares shown in the graph above is from the inception of Class A shares on 5/10/21 through 9/30/23. Index information shown in the graph above is from 5/31/21 through 9/30/23.
The performance table and graph do not reflect the deduction of fees and taxes that a shareowner would pay on Fund distributions or the redemption of Fund shares.
Please refer to the financial highlights for more current expense ratios.
16Pioneer Global Sustainable Growth Fund | Annual Report | 9/30/23
| Performance Update | 9/30/23 | Class C Shares |
Investment Returns
The mountain chart on the right shows the change in value of a $10,000 investment made in Class C shares of Pioneer Global Sustainable Growth Fund during the periods shown, compared to that of the MSCI All Country World Growth NR Index.*
Average Annual Total Returns
(As of September 30, 2023) |
| Period | If
Held | If
Redeemed | MSCI All
Country
World
Growth
NR Index |
Life-of-Class
(5/10/21)* | -2.03% | -2.03% | -2.74% |
| 1 Year | 22.68 | 21.68 | 24.41 |
Expense Ratio
(Per prospectus dated February 1, 2023) |
| Gross | Net |
| 12.43% | 1.75% |
Value of $10,000 Investment
Call 1-800-225-6292 or visit www.amundi.com/us for the most recent month-end performance results. Current performance may be lower or higher than the performance data quoted.
The performance data quoted represents past performance, which is no guarantee of future results. Investment return and principal value will fluctuate, and shares, when redeemed, may be worth more or less than their original cost.
Class C shares held for less than one year are subject to a 1% contingent deferred sales charge (CDSC). “If Held” results represent the percent change in net asset value per share. "If Redeemed" returns reflect the deduction of the CDSC for the one-year period, assuming a complete redemption of shares at the last price calculated on the last business day of the period, and no CDSC for the other time periods. All results are historical and assume the reinvestment of dividends and capital gains. Other share classes are available for which performance and expenses will differ.
Performance results reflect any applicable expense waivers in effect during the periods shown. Without such waivers Fund performance would be lower. Waivers may not be in effect for all funds. Certain fee waivers are contractual through a specified period. Otherwise, fee waivers can be rescinded at any time. See the prospectus and financial statements for more information.
The net expense ratio reflects the contractual expense limitation in effect through February 1, 2024 for Class C shares. There can be no assurance that Amundi US will extend the expense limitation beyond such time. Please see the prospectus for more information.
* Performance of Class C shares shown in the graph above is from the inception of Class A shares on 5/10/21 through 9/30/23. Index information shown in the graph above is from 5/31/21 through 9/30/23.
The performance table and graph do not reflect the deduction of fees and taxes that a shareowner would pay on Fund distributions or the redemption of Fund shares.
Please refer to the financial highlights for more current expense ratios.
Pioneer Global Sustainable Growth Fund | Annual Report | 9/30/2317
| Performance Update | 9/30/23 | Class Y Shares |
Investment Returns
The mountain chart on the right shows the change in value of a $5 million investment made in Class Y shares of Pioneer Global Sustainable Growth Fund during the periods shown, compared to that of the MSCI All Country World Growth NR Index.*
Average Annual Total Returns
(As of September 30, 2023) |
| Period | Net
Asset
Value
(NAV) | MSCI All
Country
World
Growth
NR Index |
Life-of-Class
(5/10/21)* | -1.00% | -2.74% |
| 1 Year | 23.94 | 24.41 |
Expense Ratio
(Per prospectus dated February 1, 2023) |
| Gross | Net |
| 11.40% | 0.70% |
Value of $5 Million Investment
Call 1-800-225-6292 or visit www.amundi.com/us for the most recent month-end performance results. Current performance may be lower or higher than the performance data quoted.
The performance data quoted represents past performance, which is no guarantee of future results. Investment return and principal value will fluctuate, and shares, when redeemed, may be worth more or less than their original cost.
Class Y shares are not subject to sales charges and are available for limited groups of eligible investors, including institutional investors. All results are historical and assume the reinvestment of dividends and capital gains. Other share classes are available for which performance and expenses will differ.
Performance results reflect any applicable expense waivers in effect during the periods shown. Without such waivers Fund performance would be lower. Waivers may not be in effect for all funds. Certain fee waivers are contractual through a specified period. Otherwise, fee waivers can be rescinded at any time. See the prospectus and financial statements for more information.
The net expense ratio reflects the contractual expense limitation in effect through February 1, 2024 for Class Y shares. There can be no assurance that Amundi US will extend the expense limitation beyond such time. Please see the prospectus and financial statements for more information.
* Performance of Class Y shares shown in the graph above is from the inception of Class Y shares on 5/10/21 through 9/30/23. Index information shown in the graph above is from 5/31/21 through 9/30/23.
The performance table and graph do not reflect the deduction of fees and taxes that a shareowner would pay on Fund distributions or the redemption of Fund shares.
Please refer to the financial highlights for more current expense ratios.
18Pioneer Global Sustainable Growth Fund | Annual Report | 9/30/23
Comparing Ongoing Fund Expenses
As a shareowner in the Fund, you incur two types of costs:
| (1) | ongoing costs, including management fees, distribution and/or service (12b-1) fees, and other Fund expenses; and |
| (2) | transaction costs, including sales charges (loads) on purchase payments. |
This example is intended to help you understand your ongoing expenses (in dollars) of investing in the Fund and to compare these costs with the ongoing costs of investing in other mutual funds. The example is based on an investment of $1,000 at the beginning of the Fund’s latest six-month period and held throughout the six months.
Using the Tables
Actual Expenses
The first table below provides information about actual account values and actual expenses. You may use the information in this table, together with the amount you invested, to estimate the expenses that you paid over the period as follows:
| (1) | Divide your account value by $1,000
Example: an $8,600 account value ÷ $1,000 = 8.6 |
| (2) | Multiply the result in (1) above by the corresponding share class’s number in the third row under the heading entitled “Expenses Paid During Period” to estimate the expenses you paid on your account during this period. |
Expenses Paid on a $1,000 Investment in Pioneer Global Sustainable Growth Fund
Based on actual returns from April 1, 2023 through September 30, 2023.
| Share Class | A | C | Y |
Beginning Account
Value on 4/1/23 | $1,000.00 | $1,000.00 | $1,000.00 |
Ending Account Value
(after expenses) on 9/30/23 | $1,015.70 | $1,012.80 | $1,017.80 |
Expenses Paid
During Period* | $5.05 | $8.68 | $3.54 |
| | |
| * | Expenses are equal to the Fund’s annualized expense ratio of 1.00%, 1.72%, and 0.70% for Class A, Class C, and Class Y shares, respectively, multiplied by the average account value over the period, multiplied by 183/365 (to reflect the partial year period). |
Pioneer Global Sustainable Growth Fund | Annual Report | 9/30/2319
Comparing Ongoing Fund Expenses (continued)
Hypothetical Example for Comparison Purposes
The table below provides information about hypothetical account values and hypothetical expenses based on the Fund’s actual expense ratio and an assumed rate of return of 5% per year before expenses, which is not the Fund’s actual return. The hypothetical account values and expenses may not be used to estimate the actual ending account balance or expenses you paid for the period.
You may use this information to compare the ongoing costs of investing in the Fund and other funds. To do so, compare this 5% hypothetical example with the 5% hypothetical examples that appear in the shareholder reports of the other funds.
Please note that the expenses shown in the tables are meant to highlight your ongoing costs only and do not reflect any transaction costs, such as sales charges (loads) that are charged at the time of the transaction. Therefore, the table below is useful in comparing ongoing costs only and will not help you determine the relative total costs of owning different funds. In addition, if these transaction costs were included, your costs would have been higher.
Expenses Paid on a $1,000 Investment in Pioneer Global Sustainable Growth Fund
Based on a hypothetical 5% return per year before expenses, reflecting the period from April 1, 2023 through September 30, 2023.
| Share Class | A | C | Y |
Beginning Account
Value on 4/1/23 | $1,000.00 | $1,000.00 | $1,000.00 |
Ending Account Value
(after expenses) on 9/30/23 | $1,020.05 | $1,016.44 | $1,021.56 |
Expenses Paid
During Period* | $5.06 | $8.69 | $3.55 |
| | |
| * | Expenses are equal to the Fund’s annualized expense ratio of 1.00%, 1.72%, and 0.70% for Class A, Class C, and Class Y shares, respectively, multiplied by the average account value over the period, multiplied by 183/365 (to reflect the partial year period). |
20Pioneer Global Sustainable Growth Fund | Annual Report | 9/30/23
Schedule of Investments | 9/30/23
| Shares | | | | | | Value |
| | UNAFFILIATED ISSUERS — 99.2% | |
| | Common Stocks — 95.3% of Net Assets | |
| | Aerospace & Defense — 2.0% | |
| 1,518 | Hensoldt AG | $ 44,784 |
| | Total Aerospace & Defense | $44,784 |
|
|
| | Banks — 2.1% | |
| 3,908 | FinecoBank Banca Fineco S.p.A. | $ 47,448 |
| | Total Banks | $47,448 |
|
|
| | Beverages — 2.2% | |
| 293 | PepsiCo., Inc. | $ 49,646 |
| | Total Beverages | $49,646 |
|
|
| | Broadline Retail — 8.1% | |
| 5,900(a) | Alibaba Group Holding, Ltd. | $ 63,964 |
| 960(a) | Amazon.com, Inc. | 122,035 |
| | Total Broadline Retail | $185,999 |
|
|
| | Capital Markets — 3.5% | |
| 600 | Euronext NV (144A) | $ 41,755 |
| 353 | Intercontinental Exchange, Inc. | 38,837 |
| | Total Capital Markets | $80,592 |
|
|
| | Communications Equipment — 1.8% | |
| 762 | Cisco Systems, Inc. | $ 40,965 |
| | Total Communications Equipment | $40,965 |
|
|
| | Consumer Staples Distribution & Retail — 2.1% | |
| 1,200 | Seven & i Holdings Co., Ltd. | $ 46,992 |
| | Total Consumer Staples Distribution & Retail | $46,992 |
|
|
| | Electrical Equipment — 2.1% | |
| 183(a) | Generac Holdings, Inc. | $ 19,940 |
| 96 | Rockwell Automation, Inc. | 27,443 |
| | Total Electrical Equipment | $47,383 |
|
|
| | Electronic Equipment, Instruments & Components — 1.1% | |
| 120 | CDW Corp. | $ 24,211 |
| | Total Electronic Equipment, Instruments & Components | $24,211 |
|
|
| | Energy Equipment & Services — 2.2% | |
| 1,441 | Baker Hughes Co. | $ 50,896 |
| | Total Energy Equipment & Services | $50,896 |
|
|
| | Entertainment — 3.4% | |
| 270 | Electronic Arts, Inc. | $ 32,508 |
| 1,100 | Nintendo Co., Ltd. | 45,826 |
| | Total Entertainment | $78,334 |
|
|
The accompanying notes are an integral part of these financial statements.
Pioneer Global Sustainable Growth Fund | Annual Report | 9/30/2321
Schedule of Investments | 9/30/23 (continued)
| Shares | | | | | | Value |
| | Financial Services — 3.2% | |
| 117 | Mastercard, Inc., Class A | $ 46,321 |
| 471(a) | PayPal Holdings, Inc. | 27,535 |
| | Total Financial Services | $73,856 |
|
|
| | Food Products — 2.5% | |
| 2,307 | Associated British Foods Plc | $ 57,986 |
| | Total Food Products | $57,986 |
|
|
| | Health Care Equipment & Supplies — 5.0% | |
| 360(a) | Edwards Lifesciences Corp. | $ 24,941 |
| 500 | Hoya Corp. | 51,527 |
| 2,900 | Olympus Corp. | 37,572 |
| | Total Health Care Equipment & Supplies | $114,040 |
|
|
| | Health Care Providers & Services — 2.1% | |
| 546 | Cardinal Health, Inc. | $ 47,404 |
| | Total Health Care Providers & Services | $47,404 |
|
|
| | Hotels, Restaurants & Leisure — 2.9% | |
| 203 | Amadeus IT Group S.A. | $ 12,233 |
| 360 | Hilton Worldwide Holdings, Inc. | 54,065 |
| | Total Hotels, Restaurants & Leisure | $66,298 |
|
|
| | Household Durables — 1.8% | |
| 500 | Sony Group Corp. | $ 40,901 |
| | Total Household Durables | $40,901 |
|
|
| | Household Products — 1.7% | |
| 563 | Reckitt Benckiser Group Plc | $ 39,787 |
| | Total Household Products | $39,787 |
|
|
| | Insurance — 2.6% | |
| 425 | Progressive Corp. | $ 59,203 |
| | Total Insurance | $59,203 |
|
|
| | Interactive Media & Services — 5.7% | |
| 980(a) | Alphabet, Inc., Class C | $ 129,213 |
| | Total Interactive Media & Services | $129,213 |
|
|
| | IT Services — 4.6% | |
| 639 | Cognizant Technology Solutions Corp., Class A | $ 43,286 |
| 436 | International Business Machines Corp. | 61,171 |
| | Total IT Services | $104,457 |
|
|
| | Life Sciences Tools & Services — 1.9% | |
| 88 | Thermo Fisher Scientific, Inc. | $ 44,543 |
| | Total Life Sciences Tools & Services | $44,543 |
|
|
The accompanying notes are an integral part of these financial statements.
22Pioneer Global Sustainable Growth Fund | Annual Report | 9/30/23
| Shares | | | | | | Value |
| | Pharmaceuticals — 6.0% | |
| 120 | Eli Lilly & Co. | $ 64,456 |
| 677 | Pfizer, Inc. | 22,456 |
| 468 | Sanofi | 50,217 |
| | Total Pharmaceuticals | $137,129 |
|
|
| | Professional Services — 2.9% | |
| 1,962 | RELX Plc | $ 66,168 |
| | Total Professional Services | $66,168 |
|
|
| | Semiconductors & Semiconductor Equipment — 7.9% | |
| 666(a) | Advanced Micro Devices, Inc. | $ 68,478 |
| 48 | ASML Holding NV | 28,187 |
| 552 | Microchip Technology, Inc. | 43,084 |
| 473 | Taiwan Semiconductor Manufacturing Co., Ltd. (A.D.R.) | 41,104 |
| | Total Semiconductors & Semiconductor Equipment | $180,853 |
|
|
| | Software — 4.9% | |
| 270 | Microsoft Corp. | $ 85,253 |
| 136(a) | Salesforce, Inc. | 27,578 |
| | Total Software | $112,831 |
|
|
| | Specialty Retail — 1.5% | |
| 397 | TJX Cos., Inc. | $ 35,285 |
| | Total Specialty Retail | $35,285 |
|
|
| | Technology Hardware, Storage & Peripherals — 5.8% | |
| 405 | Apple, Inc. | $ 69,340 |
| 1,258 | Samsung Electronics Co., Ltd. | 63,737 |
| | Total Technology Hardware, Storage & Peripherals | $133,077 |
|
|
| | Textiles, Apparel & Luxury Goods — 1.7% | |
| 50 | LVMH Moet Hennessy Louis Vuitton SE | $ 37,721 |
| | Total Textiles, Apparel & Luxury Goods | $37,721 |
|
|
| | Total Common Stocks
(Cost $2,059,260) | $2,178,002 |
|
|
The accompanying notes are an integral part of these financial statements.
Pioneer Global Sustainable Growth Fund | Annual Report | 9/30/2323
Schedule of Investments | 9/30/23 (continued)
Principal
Amount
USD ($) | | | | | | Value |
| | U.S. Government and Agency Obligations —
3.9% of Net Assets | |
| 50,000(b) | U.S. Treasury Bills, 10/17/23 | $ 49,890 |
| 40,000(b) | U.S. Treasury Bills, 10/24/23 | 39,871 |
| | Total U.S. Government and Agency Obligations
(Cost $89,748) | $89,761 |
|
|
| | TOTAL INVESTMENTS IN UNAFFILIATED ISSUERS — 99.2%
(Cost $2,149,008) | $2,267,763 |
| | OTHER ASSETS AND LIABILITIES — 0.8% | $ 19,196 |
| | net assets — 100.0% | $2,286,959 |
| | | | | | | |
| (A.D.R.) | American Depositary Receipts. |
| (144A) | The resale of such security is exempt from registration under Rule 144A of the Securities Act of 1933. Such securities may be resold normally to qualified institutional buyers. At September 30, 2023, the value of these securities amounted to $41,755, or 1.8% of net assets. |
| (a) | Non-income producing security. |
| (b) | Security issued with a zero coupon. Income is recognized through accretion of discount. |
Distribution of investments by country of domicile (excluding short-term investments) as a percentage of total investments in securities, is as follows:
| United States | 63.9% |
| Japan | 9.8% |
| United Kingdom | 7.2% |
| France | 3.9% |
| Netherlands | 3.1% |
| China | 2.8% |
| South Korea | 2.8% |
| Italy | 2.1% |
| Germany | 2.0% |
| Taiwan | 1.8% |
| Other (individually less than 1%) | 0.6% |
| | 100.0% |
The accompanying notes are an integral part of these financial statements.
24Pioneer Global Sustainable Growth Fund | Annual Report | 9/30/23
FORWARD FOREIGN CURRENCY EXCHANGE CONTRACTS
Currency
Purchased | In
Exchange for | Currency
Sold | Deliver | Counterparty | Settlement
Date | Unrealized
Appreciation |
| USD | 46,971 | CNY | 338,000 | Goldman Sachs & Co. | 2/21/24 | $71 |
| TOTAL FORWARD FOREIGN CURRENCY EXCHANGE CONTRACTS | $ 71 |
Principal amounts are denominated in U.S. dollars (“USD”) unless otherwise noted.
| CNY | — China Yuan Renminbi |
| USD | — United States Dollar |
Purchases and sales of securities (excluding short-term investments) for the year ended September 30, 2023, aggregated $914,385 and $772,919, respectively.
At September 30, 2023, the net unrealized appreciation on investments based on cost for federal tax purposes of $2,157,146 was as follows:
| Aggregate gross unrealized appreciation for all investments in which there is an excess of value over tax cost | $ 294,557 |
| Aggregate gross unrealized depreciation for all investments in which there is an excess of tax cost over value | (183,869) |
| Net unrealized appreciation | $ 110,688 |
Various inputs are used in determining the value of the Fund's investments. These inputs are summarized in the three broad levels below.
| Level 1 | – | unadjusted quoted prices in active markets for identical securities. |
| Level 2 | – | other significant observable inputs (including quoted prices for similar securities, interest rates, prepayment speeds, credit risks, etc.). See Notes to Financial Statements — Note 1A. |
| Level 3 | – | significant unobservable inputs (including the Adviser's own assumptions in determining fair value of investments). See Notes to Financial Statements — Note 1A. |
The following is a summary of the inputs used as of September 30, 2023, in valuing the Fund's investments:
| | Level 1 | Level 2 | Level 3 | Total |
| Common Stocks | | | | |
| Aerospace & Defense | $ — | $ 44,784 | $— | $ 44,784 |
| Banks | — | 47,448 | — | 47,448 |
| Broadline Retail | 122,035 | 63,964 | — | 185,999 |
| Capital Markets | 38,837 | 41,755 | — | 80,592 |
| Consumer Staples Distribution & Retail | — | 46,992 | — | 46,992 |
| Entertainment | 32,508 | 45,826 | — | 78,334 |
| Food Products | — | 57,986 | — | 57,986 |
The accompanying notes are an integral part of these financial statements.
Pioneer Global Sustainable Growth Fund | Annual Report | 9/30/2325
Schedule of Investments | 9/30/23 (continued)
| | Level 1 | Level 2 | Level 3 | Total |
| Health Care Equipment & Supplies | $ 24,941 | $ 89,099 | $— | $ 114,040 |
| Hotels, Restaurants & Leisure | 54,065 | 12,233 | — | 66,298 |
| Household Durables | — | 40,901 | — | 40,901 |
| Household Products | — | 39,787 | — | 39,787 |
| Pharmaceuticals | 86,912 | 50,217 | — | 137,129 |
| Professional Services | — | 66,168 | — | 66,168 |
| Semiconductors & Semiconductor Equipment | 152,666 | 28,187 | — | 180,853 |
| Technology Hardware, Storage & Peripherals | 69,340 | 63,737 | — | 133,077 |
| Textiles, Apparel & Luxury Goods | — | 37,721 | — | 37,721 |
| All Other Common Stocks | 819,893 | — | — | 819,893 |
| U.S. Government and Agency Obligations | — | 89,761 | — | 89,761 |
| Total Investments in Securities | $1,401,197 | $866,566 | $ — | $2,267,763 |
| Other Financial Instruments | | | | |
| Net unrealized appreciation on forward foreign currency exchange contracts | $ — | $ 71 | $— | $ 71 |
| Total Other Financial Instruments | $ — | $ 71 | $ — | $ 71 |
During the year ended September 30, 2023, there were no transfers in or out of Level 3.
The accompanying notes are an integral part of these financial statements.
26Pioneer Global Sustainable Growth Fund | Annual Report | 9/30/23
Statement of Assets and Liabilities | 9/30/23
| ASSETS: | |
| Investments in unaffiliated issuers, at value (cost $2,149,008) | $2,267,763 |
| Cash | 64,699 |
| Unrealized appreciation on forward foreign currency exchange contracts | 71 |
| Receivables — | |
| Dividends | 1,832 |
| Due from the Adviser | 1,814 |
| Other assets | 16,861 |
| Total assets | $ 2,353,040 |
| LIABILITIES: | |
| Overdraft due to custodian | $ 2 |
| Payables — | |
| Trustees' fees | 2 |
| Professional fees | 55,778 |
| Printing expense | 9,576 |
| Management fees | 163 |
| Administrative expenses | 63 |
| Distribution fees | 90 |
| Accrued expenses | 407 |
| Total liabilities | $ 66,081 |
| NET ASSETS: | |
| Paid-in capital | $2,368,309 |
| Distributable earnings (loss) | (81,350) |
| Net assets | $2,286,959 |
| NET ASSET VALUE PER SHARE: | |
| No par value (unlimited number of shares authorized) | |
| Class A (based on $911,695/94,166 shares) | $ 9.68 |
| Class C (based on $592,526/62,237 shares) | $ 9.52 |
| Class Y (based on $782,738/80,696 shares) | $ 9.70 |
| MAXIMUM OFFERING PRICE PER SHARE: | |
| Class A (based on $9.68 net asset value per share/100%-5.75% maximum sales charge) | $ 10.27 |
The accompanying notes are an integral part of these financial statements.
Pioneer Global Sustainable Growth Fund | Annual Report | 9/30/23 27
Statement of Operations FOR THE YEAR ENDED 9/30/23
| INVESTMENT INCOME: | | |
| Dividends from unaffiliated issuers (net of foreign taxes withheld $2,232) | $ 29,033 | |
| Interest from unaffiliated issuers | 1,757 | |
| Total Investment Income | | $ 30,790 |
| EXPENSES: | | |
| Management fees | $ 13,878 | |
| Administrative expenses | 10,049 | |
| Transfer agent fees | | |
| Class A | 204 | |
| Class C | 25 | |
| Class Y | 11 | |
| Distribution fees | | |
| Class A | 2,035 | |
| Class C | 5,656 | |
| Shareowner communications expense | 372 | |
| Custodian fees | 11 | |
| Registration fees | 52,449 | |
| Professional fees | 96,225 | |
| Printing expense | 33,117 | |
| Officers' and Trustees' fees | 8,011 | |
| Insurance expense | 24 | |
| Miscellaneous | 2,644 | |
| Total expenses | | $ 224,711 |
| Less fees waived and expenses reimbursed by the Adviser | | (201,583) |
| Net expenses | | $ 23,128 |
| Net investment income | | $ 7,662 |
| REALIZED AND UNREALIZED GAIN (LOSS) ON INVESTMENTS: | | |
| Net realized gain (loss) on: | | |
| Investments in unaffiliated issuers | $ (94,141) | |
| Other assets and liabilities denominated in foreign currencies | (374) | $ (94,515) |
| Change in net unrealized appreciation (depreciation) on: | | |
| Investments in unaffiliated issuers | $496,223 | |
| Forward foreign currency exchange contracts | 71 | |
| Other assets and liabilities denominated in foreign currencies | 126 | $ 496,420 |
| Net realized and unrealized gain (loss) on investments | | $ 401,905 |
| Net increase in net assets resulting from operations | | $ 409,567 |
The accompanying notes are an integral part of these financial statements.
28Pioneer Global Sustainable Growth Fund | Annual Report | 9/30/23
Statements of Changes in Net Assets
| | Year
Ended
9/30/23 | Year
Ended
9/30/22 |
| FROM OPERATIONS: | | |
| Net investment income (loss) | $ 7,662 | $ 2,433 |
| Net realized gain (loss) on investments | (94,515) | (97,735) |
| Change in net unrealized appreciation (depreciation) on investments | 496,420 | (350,298) |
| Net increase (decrease) in net assets resulting from operations | $ 409,567 | $ (445,600) |
| DISTRIBUTIONS TO SHAREOWNERS: | | |
| Class A ($0.02 and $— per share, respectively) | $ (1,654) | $ — |
| Class Y ($0.05 and $0.01 per share, respectively) | (3,828) | (632) |
| Total distributions to shareowners | $ (5,482) | $ (632) |
| FROM FUND SHARE TRANSACTIONS: | | |
| Net proceeds from sales of shares | $ 130,467 | $ 63,015 |
| Reinvestment of distributions | 5,482 | 632 |
| Cost of shares repurchased | (7,098) | (19,089) |
| Net increase in net assets resulting from Fund share transactions | $ 128,851 | $ 44,558 |
| Net increase (decrease) in net assets | $ 532,936 | $ (401,674) |
| NET ASSETS: | | |
| Beginning of year | $1,754,023 | $2,155,697 |
| End of year | $2,286,959 | $ 1,754,023 |
| | Year
Ended
9/30/23
Shares | Year
Ended
9/30/23
Amount | Year
Ended
9/30/22
Shares | Year
Ended
9/30/22
Amount |
| Class A | | | | |
| Shares sold | 12,021 | $116,300 | 6,379 | $ 63,015 |
| Reinvestment of distributions | 194 | 1,654 | — | — |
| Less shares repurchased | (775) | (7,098) | (1,876) | (19,089) |
| Net increase | 11,440 | $110,856 | 4,503 | $ 43,926 |
| Class C | | | | |
| Shares sold | 1,253 | $ 12,667 | — | $ — |
| Reinvestment of distributions | — | — | — | — |
| Less shares repurchased | — | — | — | — |
| Net increase | 1,253 | $ 12,667 | — | $ — |
| Class Y | | | | |
| Shares sold | 186 | $ 1,500 | — | $ — |
| Reinvestment of distributions | 450 | 3,828 | 60 | 632 |
| Less shares repurchased | — | — | — | — |
| Net increase | 636 | $ 5,328 | 60 | $ 632 |
The accompanying notes are an integral part of these financial statements.
Pioneer Global Sustainable Growth Fund | Annual Report | 9/30/2329
| | Year
Ended
9/30/23 | Year
Ended
9/30/22 | 5/10/21* to
9/30/21 |
| Class A | | | |
| Net asset value, beginning of period | $ 7.86 | $ 9.84 | $ 10.00 |
| Increase (decrease) from investment operations: | | | |
| Net investment income (loss) (a) | $ 0.04 | $ 0.02 | $ 0.01 |
| Net realized and unrealized gain (loss) on investments | 1.80 | (2.00) | (0.17) |
| Net increase (decrease) from investment operations | $ 1.84 | $ (1.98) | $ (0.16) |
| Distributions to shareowners: | | | |
| Net investment income | $ (0.02) | $ — | $ — |
| Total distributions | $ (0.02) | $ — | $ — |
| Net increase (decrease) in net asset value | $ 1.82 | $ (1.98) | $ (0.16) |
| Net asset value, end of period | $ 9.68 | $ 7.86 | $ 9.84 |
| Total return (b) | 23.44% | (20.12)% | (1.60)%(c) |
| Ratio of net expenses to average net assets | 1.00% | 1.00% | 0.75%(d) |
| Ratio of net investment income (loss) to average net assets | 0.45% | 0.21% | 0.28%(d) |
| Portfolio turnover rate | 38% | 38% | 11%(c) |
| Net assets, end of period (in thousands) | $ 912 | $ 650 | $ 770 |
| Ratios with no waiver of fees and assumption of expenses by the Adviser and no reduction for fees paid indirectly: | | | |
| Total expenses to average net assets | 10.45% | 11.71% | 12.69%(d) |
| Net investment income (loss) to average net assets | (9.00)% | (10.50)% | (11.66)%(d) |
| * | Class A commenced operations on May 10, 2021. |
| (a) | The per-share data presented above is based on the average shares outstanding for the period presented. |
| (b) | Assumes initial investment at net asset value at the beginning of each period, reinvestment of all distributions, the complete redemption of the investment at net asset value at the end of each period and no sales charges. Total return would be reduced if sales charges were taken into account. |
| (c) | Not annualized. |
| (d) | Annualized. |
The accompanying notes are an integral part of these financial statements.
30Pioneer Global Sustainable Growth Fund | Annual Report | 9/30/23
| | Year
Ended
9/30/23 | Year
Ended
9/30/22 | 5/10/21* to
9/30/21 |
| Class C | | | |
| Net asset value, beginning of period | $ 7.76 | $ 9.81 | $ 10.00 |
| Increase (decrease) from investment operations: | | | |
| Net investment income (loss) (a) | $ (0.03) | $ (0.05) | $ (0.03) |
| Net realized and unrealized gain (loss) on investments | 1.79 | (2.00) | (0.16) |
| Net increase (decrease) from investment operations | $ 1.76 | $ (2.05) | $ (0.19) |
| Net increase (decrease) in net asset value | $ 1.76 | $ (2.05) | $ (0.19) |
| Net asset value, end of period | $ 9.52 | $ 7.76 | $ 9.81 |
| Total return (b) | 22.68% | (20.90)% | (1.90)%(c) |
| Ratio of net expenses to average net assets | 1.72% | 1.74% | 1.69%(d) |
| Ratio of net investment income (loss) to average net assets | (0.28)% | (0.53)% | (0.64)%(d) |
| Portfolio turnover rate | 38% | 38% | 11%(c) |
| Net assets, end of period (in thousands) | $ 593 | $ 474 | $ 598 |
| Ratios with no waiver of fees and assumption of expenses by the Adviser and no reduction for fees paid indirectly: | | | |
| Total expenses to average net assets | 11.15% | 12.43% | 13.63%(d) |
| Net investment income (loss) to average net assets | (9.71)% | (11.22)% | (12.58)%(d) |
| * | Class C commenced operations on May 10, 2021. |
| (a) | The per-share data presented above is based on the average shares outstanding for the period presented. |
| (b) | Assumes initial investment at net asset value at the beginning of each period, reinvestment of all distributions, the complete redemption of the investment at net asset value at the end of each period and no sales charges. Total return would be reduced if sales charges were taken into account. |
| (c) | Not annualized. |
| (d) | Annualized. |
The accompanying notes are an integral part of these financial statements.
Pioneer Global Sustainable Growth Fund | Annual Report | 9/30/2331
Financial Highlights (continued)
| | Year
Ended
9/30/23 | Year
Ended
9/30/22 | 5/10/21* to
9/30/21 |
| Class Y | | | |
| Net asset value, beginning of period | $ 7.87 | $ 9.85 | $ 10.00 |
| Increase (decrease) from investment operations: | | | |
| Net investment income (loss) (a) | $ 0.07 | $ 0.05 | $ 0.01 |
| Net realized and unrealized gain (loss) on investments | 1.81 | (2.02) | (0.16) |
| Net increase (decrease) from investment operations | $ 1.88 | $ (1.97) | $ (0.15) |
| Distributions to shareowners: | | | |
| Net investment income | $ (0.05) | $ (0.01) | $ — |
| Total distributions | $ (0.05) | $ (0.01) | $ — |
| Net increase (decrease) in net asset value | $ 1.83 | $ (1.98) | $ (0.15) |
| Net asset value, end of period | $ 9.70 | $ 7.87 | $ 9.85 |
| Total return (b) | 23.94% | (20.04)% | (1.50)%(c) |
| Ratio of net expenses to average net assets | 0.70% | 0.70% | 0.70%(d) |
| Ratio of net investment income (loss) to average net assets | 0.74% | 0.51% | 0.35%(d) |
| Portfolio turnover rate | 38% | 38% | 11%(c) |
| Net assets, end of period (in thousands) | $ 783 | $ 630 | $ 788 |
| Ratios with no waiver of fees and assumption of expenses by the Adviser and no reduction for fees paid indirectly: | | | |
| Total expenses to average net assets | 10.14% | 11.40% | 12.64%(d) |
| Net investment income (loss) to average net assets | (8.70)% | (10.19)% | (11.59)%(d) |
| * | Class Y commenced operations on May 10, 2021. |
| (a) | The per-share data presented above is based on the average shares outstanding for the period presented. |
| (b) | Assumes initial investment at net asset value at the beginning of each period, reinvestment of all distributions and the complete redemption of the investment at net asset value at the end of each period and no sales charges. |
| (c) | Not annualized. |
| (d) | Annualized. |
The accompanying notes are an integral part of these financial statements.
32Pioneer Global Sustainable Growth Fund | Annual Report | 9/30/23
Notes to Financial Statements | 9/30/23
1. Organization and Significant Accounting Policies
Pioneer Global Sustainable Growth Fund (the “Fund”) is one of five portfolios comprising Pioneer Series Trust XIV (the “Trust”), a Delaware statutory trust. The Fund is registered under the Investment Company Act of 1940, as amended (the "1940 Act") as a diversified, open end management investment company. The Fund’s investment objective is to seek long-term capital growth.
The Fund offers three classes of shares designated as Class A, Class C and Class Y shares. Class A, Class C and Class Y commenced operations on May 10, 2021. Each class of shares represents an interest in the same portfolio of investments of the Fund and has identical rights (based on relative net asset values) to assets and liquidation proceeds. Share classes can bear different rates of class-specific fees and expenses, such as transfer agent and distribution fees. Differences in class specific fees and expenses will result in differences in net investment income and, therefore, the payment of different dividends from net investment income earned by each class. The Amended and Restated Declaration of Trust of the Trust gives the Board of Trustees the flexibility to specify either per-share voting or dollar-weighted voting when submitting matters for shareowner approval. Under per-share voting, each share of a class of the Fund is entitled to one vote. Under dollar-weighted voting, a shareowner’s voting power is determined not by the number of shares owned, but by the dollar value of the shares on the record date. Each share class has exclusive voting rights with respect to matters affecting only that class, including with respect to the distribution plan for that class. There is no distribution plan for Class Y shares.
Amundi Asset Management US, Inc., an indirect, wholly owned subsidiary of Amundi and Amundi’s wholly owned subsidiary, Amundi USA, Inc., serves as the Fund’s investment adviser (the “Adviser”). Amundi Distributor US, Inc., an affiliate of the Adviser, serves as the Fund’s distributor (the “Distributor”).
In March 2020, FASB issued an Accounting Standard Update, ASU 2020-04, Reference Rate Reform (Topic 848) — Facilitation of the Effects of Reference Rate Reform on Financial Reporting (“ASU 2020-04”), which provides optional, temporary relief with respect to the financial reporting of contracts subject to certain types of modifications due to the planned discontinuation of the London Interbank Offered Rate (“LIBOR”) and other LIBOR-based reference rates at the end of 2021. The temporary relief provided by ASU 2020-04 is effective for certain reference rate-related
Pioneer Global Sustainable Growth Fund | Annual Report | 9/30/2333
contract modifications that occur during the period from March 12, 2020 through December 31, 2023. Management is evaluating the impact of ASU 2020-04 on the Fund's investments, derivatives, debt and other contracts, if applicable, that will undergo reference rate-related modifications as a result of the reference rate reform.
The Fund is required to comply with Rule 18f-4 under the 1940 Act, which governs the use of derivatives by registered investment companies. Rule 18f-4 permits funds to enter into derivatives transactions (as defined in Rule 18f-4) and certain other transactions notwithstanding the restrictions on the issuance of “senior securities” under Section 18 of the 1940 Act. Rule 18f-4 requires a fund to establish and maintain a comprehensive derivatives risk management program, appoint a derivatives risk manager and comply with a relative or absolute limit on fund leverage risk calculated based on value-at-risk (“VaR”), unless the fund uses derivatives in only a limited manner (a "limited derivatives user"). The Fund is currently a limited derivatives user for purposes of Rule 18f-4.
The Fund is an investment company and follows investment company accounting and reporting guidance under U.S. Generally Accepted Accounting Principles (“U.S. GAAP”). U.S. GAAP requires the management of the Fund to make estimates and assumptions that affect the reported amounts of assets and liabilities, the disclosure of contingent assets and liabilities at the date of the financial statements, and the reported amounts of income, expenses and gain or loss on investments during the reporting period. Actual results could differ from those estimates.
The following is a summary of significant accounting policies followed by the Fund in the preparation of its financial statements:
| A. | Security Valuation |
| | The net asset value of the Fund is computed once daily, on each day the New York Stock Exchange (“NYSE”) is open, as of the close of regular trading on the NYSE. |
| | Equity securities that have traded on an exchange are valued by using the last sale price on the principal exchange where they are traded. Equity securities that have not traded on the date of valuation, or securities for which sale prices are not available, generally are valued using the mean between the last bid and asked prices or, if both last bid and asked prices are not available, at the last quoted bid price. Last sale and bid and asked prices are provided by independent third party pricing services. In the case of equity securities not traded on an exchange, prices are typically determined by independent third party pricing services using a variety of techniques and methods. |
34Pioneer Global Sustainable Growth Fund | Annual Report | 9/30/23
| | The value of foreign securities is translated into U.S. dollars based on foreign currency exchange rate quotations supplied by a third party pricing source. Trading in non-U.S. equity securities is substantially completed each day at various times prior to the close of the NYSE. The values of such securities used in computing the net asset value of the Fund's shares are determined as of such times. The Adviser may use a fair value model developed by an independent pricing service to value non-U.S. equity securities. |
| | Forward foreign currency exchange contracts are valued daily using the foreign exchange rate or, for longer term forward contract positions, the spot currency rate and the forward points on a daily basis, in each case provided by a third party pricing service. Contracts whose forward settlement date falls between two quoted days are valued by interpolation. |
| | Shares of open-end registered investment companies (including money market mutual funds) are valued at such funds’ net asset value. |
| | Securities for which independent pricing services or broker-dealers are unable to supply prices or for which market prices and/or quotations are not readily available or are considered to be unreliable are valued by a fair valuation team comprised of certain personnel of the Adviser. The Adviser is designated as the valuation designee for the Fund pursuant to Rule 2a-5 under the 1940 Act. The Adviser’s fair valuation team is responsible for monitoring developments that may impact fair valued securities. |
| | Inputs used when applying fair value methods to value a security may include credit ratings, the financial condition of the company, current market conditions and comparable securities. The Adviser may use fair value methods if it is determined that a significant event has occurred after the close of the exchange or market on which the security trades and prior to the determination of the Fund's net asset value. Examples of a significant event might include political or economic news, corporate restructurings, natural disasters, terrorist activity or trading halts. Thus, the valuation of the Fund's securities may differ significantly from exchange prices, and such differences could be material. |
| B. | Investment Income and Transactions |
| | Dividend income is recorded on the ex-dividend date, except that certain dividends from foreign securities where the ex-dividend date may have passed are recorded as soon as the Fund becomes aware of the ex-dividend data in the exercise of reasonable diligence. |
Pioneer Global Sustainable Growth Fund | Annual Report | 9/30/2335
| | Interest income, including interest on income-bearing cash accounts, is recorded on the accrual basis. Dividend and interest income are reported net of unrecoverable foreign taxes withheld at the applicable country rates and net of income accrued on defaulted securities. |
| | Interest and dividend income payable by delivery of additional shares is reclassified as PIK (payment-in-kind) income upon receipt and is included in interest and dividend income, respectively. |
| | Security transactions are recorded as of trade date. Gains and losses on sales of investments are calculated on the identified cost method for both financial reporting and federal income tax purposes. |
| C. | Foreign Currency Translation |
| | The books and records of the Fund are maintained in U.S. dollars. Amounts denominated in foreign currencies are translated into U.S. dollars using current exchange rates. |
| | Net realized gains and losses on foreign currency transactions, if any, represent, among other things, the net realized gains and losses on foreign currency exchange contracts, disposition of foreign currencies and the difference between the amount of income accrued and the U.S. dollars actually received. Further, the effects of changes in foreign currency exchange rates on investments are not segregated on the Statement of Operations from the effects of changes in the market prices of those securities, but are included with the net realized and unrealized gain or loss on investments. |
| D. | Federal Income Taxes |
| | It is the Fund's policy to comply with the requirements of the Internal Revenue Code applicable to regulated investment companies and to distribute all of its net taxable income and net realized capital gains, if any, to its shareowners. Therefore, no provision for federal income taxes is required. As of September 30, 2023, the Fund did not accrue any interest or penalties with respect to uncertain tax positions, which, if applicable, would be recorded as an income tax expense on the Statement of Operations. Tax returns filed within the prior three years remain subject to examination by federal and state tax authorities. |
| | The amount and character of income and capital gain distributions to shareowners are determined in accordance with federal income tax rules, which may differ from U.S. GAAP. Distributions in excess of net investment income or net realized gains are temporary over distributions for financial statement purposes resulting from differences in the recognition or classification of income or distributions for financial |
36Pioneer Global Sustainable Growth Fund | Annual Report | 9/30/23
| | statement and tax purposes. Capital accounts within the financial statements are adjusted for permanent book/tax differences to reflect tax character, but are not adjusted for temporary differences. |
| | At September 30, 2023, the Fund was permitted to carry forward indefinitely $75,987 of short-term losses and $119,767 of long-term losses. |
| | The tax character of distributions paid during the years ended September 30, 2023 and September 30, 2022, was as follows: |
| | 2023 | 2022 |
| Distributions paid from: | | |
| Ordinary income | $5,482 | $632 |
| Total | $5,482 | $632 |
The following shows the components of distributable earnings (losses) on a federal income tax basis at September 30, 2023:
| | 2023 |
| Distributable earnings/(losses): | |
| Undistributed ordinary income | $ 3,716 |
| Capital loss carryforward | (195,754) |
| Net unrealized appreciation | 110,688 |
| Total | $ (81,350) |
The differences between book-basis and tax-basis net unrealized depreciation are attributable to the tax deferral of losses on wash sales and the mark to market of forward contracts.
| E. | Fund Shares |
| | The Fund records sales and repurchases of its shares as of trade date. The Distributor earned $38 in underwriting commissions on the sale of Class A shares during the year ended September 30, 2023. |
| F. | Class Allocations |
| | Income, common expenses and realized and unrealized gains and losses are calculated at the Fund level and allocated daily to each class of shares based on its respective percentage of adjusted net assets at the beginning of the day. |
| | Distribution fees are calculated based on the average daily net asset value attributable to Class A and Class C shares of the Fund, respectively (see Note 5). Class Y shares do not pay distribution fees. All expenses and fees paid to the Fund's transfer agent for its services are allocated among the classes of shares based on the number of accounts |
Pioneer Global Sustainable Growth Fund | Annual Report | 9/30/2337
| | in each class and the ratable allocation of related out-of-pocket expenses (see Note 4). |
| | Distributions to shareowners are recorded as of the ex-dividend date. Distributions paid by the Fund with respect to each class of shares are calculated in the same manner and at the same time, except that net investment income dividends to Class A, Class C and Class Y shares can reflect different transfer agent and distribution expense rates. |
| G. | Risks |
| | The value of securities held by the Fund may go up or down, sometimes rapidly or unpredictably, due to general market conditions, such as real or perceived adverse economic, political or regulatory conditions, recessions, the spread of infectious illness or other public health issues, inflation, changes in interest rates, armed conflict including Russia's military invasion of Ukraine, sanctions against Russia, other nations or individuals or companies and possible countermeasures, lack of liquidity in the bond markets or adverse investor sentiment. In the past several years, financial markets have experienced increased volatility, depressed valuations, decreased liquidity and heightened uncertainty. These conditions may continue, recur, worsen or spread. Inflation and interest rates have increased and may rise further. These circumstances could adversely affect the value and liquidity of the Fund's investments and negatively impact the Fund's performance. |
| | The long-term impact of the COVID-19 pandemic and its subsequent variants on economies, markets, industries and individual issuers, are not known. Some sectors of the economy and individual issuers have experienced or may experience particularly large losses. Periods of extreme volatility in the financial markets, reduced liquidity of many instruments, increased government debt, inflation, and disruptions to supply chains, consumer demand and employee availability, may continue for some time. Following Russia's invasion of Ukraine, Russian securities lost all, or nearly all, their market value. Other securities or markets could be similarly affected by past or future political, geopolitical or other events or conditions. |
| | Governments and central banks, including the U.S. Federal Reserve, have taken extraordinary and unprecedented actions to support local and global economies and the financial markets. These actions have resulted in significant expansion of public debt, including in the U.S. The consequences of high public debt, including its future impact on the economy and securities markets, may not be known for some time. |
38Pioneer Global Sustainable Growth Fund | Annual Report | 9/30/23
| | The U.S. and other countries are periodically involved in disputes over trade and other matters, which may result in tariffs, investment restrictions and adverse impacts on affected companies and securities. For example, the U.S. has imposed tariffs and other trade barriers on Chinese exports, has restricted sales of certain categories of goods to China, and has established barriers to investments in China. Trade disputes may adversely affect the economies of the U.S. and its trading partners, as well as companies directly or indirectly affected and financial markets generally. If the political climate between the U.S. and China does not improve or continues to deteriorate, if China were to attempt unification of Taiwan by force, or if other geopolitical conflicts develop or get worse, economies, markets and individual securities may be severely affected both regionally and globally, and the value of the Fund's assets may go down. |
| | At times, the Fund’s investments may represent industries or industry sectors that are interrelated or have common risks, making the Fund more susceptible to any economic, political, or regulatory developments or other risks affecting those industries and sectors. |
| | Under normal circumstances, the Fund invests at least 80% of its net assets (plus the amount of borrowings, if any, for investment purposes) in securities of issuers that the Adviser believes adhere to the Fund’s ESG criteria. The Fund’s ESG criteria exclude securities of issuers in certain industries, and the Adviser considers ESG factors in making investment decisions. Excluding specific issuers limits the universe of investments available to the Fund as compared with other funds that do not consider ESG criteria or ESG factors, which may mean forgoing some investment opportunities available to funds that do not consider ESG criteria or ESG factors. Accordingly, the Fund may underperform other funds that do not utilize an investment strategy that considers ESG criteria or ESG factors. However, the strategy of seeking to identify companies with sustainable business models is believed to provide potential return and risk benefits, including the selection of issuers with fewer ESG-related risks. In considering ESG factors, the Adviser may use third party ESG ratings information that it believes to be reliable, but such information may not be accurate or complete, or may be biased. |
| | The Fund may invest in small- and mid-size companies. Compared to large companies, small- and mid-size companies, and the market for their equity securities, may be more sensitive to changes in earnings results and investor expectations or poor economic or market conditions, including those experienced during a recession, have more limited product lines, operating histories, markets or capital resources, may be dependent upon a limited management group, experience sharper swings |
Pioneer Global Sustainable Growth Fund | Annual Report | 9/30/2339
| | in market values, have limited liquidity, be harder to value or to sell at the times and prices the Adviser thinks appropriate, and offer greater potential for gain and loss. |
| | Normally, the Fund invests at least a minimum percentage of its net assets in issuers located outside of the United States. The Fund’s investments in foreign markets and countries with limited developing markets may subject the Fund to a greater degree of risk than investments in a developed market. These risks include disruptive political or economic conditions, military conflicts and sanctions, terrorism, sustained economic downturns, financial instability, less liquid trading markets, extreme price volatility, currency risks, reduction of government or central bank support, inadequate accounting standards, tariffs, tax disputes or other tax burdens, nationalization or expropriation of assets, and the imposition of adverse governmental laws, arbitrary application of laws and regulations or lack of rule of law and investment and repatriation restrictions. Lack of information and less market regulation also may affect the value of these securities. Withholding and other non-U.S. taxes may decrease the Fund’s return. Non-U.S. issuers may be located in parts of the world that have historically been prone to natural disasters. Investing in depositary receipts is subject to many of the same risks as investing directly in non-U.S. issuers. Depositary receipts may involve higher expenses and may trade at a discount (or premium) to the underlying security. |
| | Russia launched a large-scale invasion of Ukraine on February 24, 2022. In response to the military action by Russia, various countries, including the U.S., the United Kingdom, and European Union issued broad-ranging economic sanctions against Russia and Belarus and certain companies and individuals. Since then, Russian securities have lost all, or nearly all, their market value, and many other issuers, securities and markets have been adversely affected. The United States and other countries may impose sanctions on other countries, companies and individuals in light of Russia’s military invasion. The extent and duration of the military action or future escalation of such hostilities, the extent and impact of existing and future sanctions, market disruptions and volatility, and the result of any diplomatic negotiations cannot be predicted. These and any related events could have a significant impact on the value and liquidity of certain Fund investments, on Fund performance and the value of an investment in the Fund, particularly with respect to securities and commodities, such as oil, natural gas and food commodities, as well as other sectors with exposure to Russian issuers or issuers in other countries affected by the invasion, and are likely to have collateral impacts on market sectors globally. |
40Pioneer Global Sustainable Growth Fund | Annual Report | 9/30/23
| | With the increased use of technologies such as the Internet to conduct business, the Fund is susceptible to operational, information security and related risks. While the Fund’s Adviser has established business continuity plans in the event of, and risk management systems to prevent, limit or mitigate, such cyber-attacks, there are inherent limitations in such plans and systems, including the possibility that certain risks have not been identified. Furthermore, the Fund cannot control the cybersecurity plans and systems put in place by service providers to the Fund such as the Fund's custodian and accounting agent, and the Fund’s transfer agent. In addition, many beneficial owners of Fund shares hold them through accounts at broker-dealers, retirement platforms and other financial market participants over which neither the Fund nor the Adviser exercises control. Each of these may in turn rely on service providers to them, which are also subject to the risk of cyber-attacks. Cybersecurity failures or breaches at the Adviser or the Fund’s service providers or intermediaries have the ability to cause disruptions and impact business operations, potentially resulting in financial losses, interference with the Fund’s ability to calculate its net asset value, impediments to trading, the inability of Fund shareowners to effect share purchases, redemptions or exchanges or receive distributions, loss of or unauthorized access to private shareowner information and violations of applicable privacy and other laws, regulatory fines, penalties, reputational damage, or additional compliance costs. Such costs and losses may not be covered under any insurance. In addition, maintaining vigilance against cyber-attacks may involve substantial costs over time, and system enhancements may themselves be subject to cyber-attacks. |
| | The Fund’s prospectus contains unaudited information regarding the Fund’s principal risks. Please refer to that document when considering the Fund’s principal risks. |
| H. | Forward Foreign Currency Exchange Contracts |
| | The Fund may enter into forward foreign currency exchange contracts ("contracts") for the purchase or sale of a specific foreign currency at a fixed price on a future date. All contracts are marked-to-market daily at the applicable exchange rates, and any resulting unrealized appreciation or depreciation is recorded in the Fund's financial statements. The Fund records realized gains and losses at the time a contract is offset by entry into a closing transaction or extinguished by delivery of the currency. Risks may arise upon entering into these contracts from the potential inability of counterparties to meet the terms of the contract and from unanticipated movements in the value of foreign currencies relative to the U.S. dollar (see Note 7). |
Pioneer Global Sustainable Growth Fund | Annual Report | 9/30/2341
| | During the year ended September 30, 2023, the Fund had entered into various forward foreign currency exchange contracts that obligated the Fund to deliver or take delivery of currencies at specified future maturity dates. Alternatively, prior to the settlement date of a forward foreign currency exchange contract, the Fund may close out such contract by entering into an offsetting contract. |
| | The average market value of forward foreign currency exchange contracts open during the year ended September 30, 2023, was $9,380 for sells. Open forward foreign currency exchange contracts outstanding at September 30, 2023, are listed in the Schedule of Investments. |
2. Management Agreement
The Adviser manages the Fund's portfolio. Management fees payable under the Fund's Investment Management Agreement with the Adviser are calculated daily and paid monthly at the annual rate of 0.65% of the Portfolio’s average daily net assets up to $1 billion and 0.60% of the Fund's average daily net assets over $1 billion. For the year ended September 30, 2023, the effective management fee (excluding waivers and/or assumption of expenses) was equivalent to 0.65% of the Fund’s average daily net assets.
The Adviser has contractually agreed to waive and/or reimburse ordinary operating expenses (ordinary operating expenses means all fund expenses other than taxes, brokerage commissions, acquired fund fees and expenses, and extraordinary expenses, such as litigation) of the Fund to the extent required to reduce Fund expenses to 1.00%, 1.75% and 0.70% of the average daily net assets attributable to Class A, Class C and Class Y Shares, respectively. These expense limitations are in effect through February 1, 2024. There can be no assurance that the Adviser will extend the expense limitation agreement for a class of shares beyond the date referred to above. Fees waived and expenses reimbursed during the year ended September 30, 2023, are reflected on the Statement of Operations.
In addition, under the management and administration agreements, certain other services and costs, including accounting, regulatory reporting and insurance premiums, are paid by the Fund as administrative reimbursements. Reflected on the Statement of Assets and Liabilities is $163 in management fees payable to the Adviser at September 30, 2023.
3. Compensation of Officers and Trustees
The Fund pays an annual fee to its Trustees. The Adviser reimburses the Fund for fees paid to the Interested Trustees. Except for the chief compliance officer, the Fund does not pay any salary or other compensation
42Pioneer Global Sustainable Growth Fund | Annual Report | 9/30/23
to its officers. The Fund pays a portion of the chief compliance officer's compensation for his services as the Fund's chief compliance officer. Amundi US pays the remaining portion of the chief compliance officer's compensation. For the year ended September 30, 2023, the Fund paid $8,011 in Officers' and Trustees' compensation, which is reflected on the Statement of Operations as Officers' and Trustees' fees. At September 30, 2023, on its Statement of Assets and Liabilities, the Fund had a payable for Trustees' fees of $2 and a payable for administrative expenses of $63, which includes the payable for Officers' compensation.
4. Transfer Agent
BNY Mellon Investment Servicing (US) Inc. serves as the transfer agent to the Fund at negotiated rates. Transfer agent fees and payables shown on the Statement of Operations and the Statement of Assets and Liabilities, respectively, include sub-transfer agent expenses incurred through the Fund’s omnibus relationship contracts.
In addition, the Fund reimbursed the transfer agent for out-of-pocket expenses incurred by the transfer agent related to shareowner communications activities such as proxy and statement mailings, and outgoing phone calls. For the year ended September 30, 2023, such out-of-pocket expenses by class of shares were as follows:
| Shareowner Communications: | |
| Class A | $292 |
| Class C | 66 |
| Class Y | 14 |
| Total | $372 |
5. Distribution Plan
The Fund has adopted a distribution plan (the “Plan”) pursuant to Rule 12b-1 under the 1940 Act with respect to its Class A and Class C shares. Pursuant to the Plan, the Fund pays the Distributor 0.25% of the average daily net assets attributable to Class A shares as compensation for personal services and/or account maintenance services or distribution services with regard to Class A shares. Pursuant to the Plan, the Fund also pays the Distributor 1.00% of the average daily net assets attributable to Class C shares. The fee for Class C shares consists of a 0.25% service fee and a 0.75% distribution fee paid as compensation for personal services and/or account maintenance services or distribution services with regard to Class C shares. Reflected on the Statement of Assets and Liabilities is $90 in distribution fees payable to the Distributor at September 30, 2023.
In addition, redemptions of Class A and Class C shares may be subject to a contingent deferred sales charge (“CDSC”). A CDSC of 1.00% may be
Pioneer Global Sustainable Growth Fund | Annual Report | 9/30/2343
imposed on redemptions of certain net asset value purchases of Class A shares within 12 months of purchase. Redemptions of Class C shares within 12 months of purchase are subject to a CDSC of 1.00%, based on the lower of cost or market value of shares being redeemed. Shares purchased as part of an exchange remain subject to any CDSC that applied to the original purchase of those shares. There is no CDSC for Class Y shares. Proceeds from the CDSCs are paid to the Distributor. For the year ended September 30, 2023, CDSCs in the amount of $0 were paid to the Distributor.
6. Master Netting Agreements
The Fund has entered into an International Swaps and Derivatives Association, Inc. Master Agreement (“ISDA Master Agreement”) or similar agreement with substantially all of its derivative counterparties. An ISDA Master Agreement is a bilateral agreement between the Fund and a counterparty that governs the trading of certain Over the Counter (“OTC”) derivatives and typically contains, among other things, close-out and set- off provisions which apply upon the occurrence of an event of default and/or a termination event as defined under the relevant ISDA Master Agreement. The ISDA Master Agreement may also give a party the right to terminate all transactions traded under such agreement if, among other things, there is deterioration in the credit quality of the other party.
Upon an event of default or a termination of the ISDA Master Agreement, the non-defaulting party has the right to close-out all transactions under such agreement and to net amounts owed under each transaction to determine one net amount payable by one party to the other. The right to close out and net payments across all transactions under the ISDA Master Agreement could result in a reduction of the Fund’s credit risk to its counterparty equal to any amounts payable by the Fund under the applicable transactions, if any. However, the Fund’s right to set-off may be restricted or prohibited by the bankruptcy or insolvency laws of the particular jurisdiction to which each specific ISDA Master Agreement of each counterparty is subject.
The collateral requirements for derivatives transactions under an ISDA Master Agreement are governed by a credit support annex to the ISDA Master Agreement. Collateral requirements are generally determined at the close of business each day and are typically based on changes in market values for each transaction under an ISDA Master Agreement and netted into one amount for such agreement. Generally, the amount of collateral due from or to a counterparty is subject to threshold (a “minimum transfer amount”) before a transfer is required, which may vary by counterparty. Collateral pledged for the benefit of the Fund and/or counterparty is held in
44Pioneer Global Sustainable Growth Fund | Annual Report | 9/30/23
segregated accounts by the Fund’s custodian and cannot be sold, re- pledged, assigned or otherwise used while pledged. Cash that has been segregated to cover the Fund’s collateral obligations, if any, will be reported separately on the Statement of Assets and Liabilities as “Swaps collateral”. Securities pledged by the Fund as collateral, if any, are identified as such in the Schedule of Investments.
Financial instruments subject to an enforceable master netting agreement, such as an ISDA Master Agreement, have been offset on the Statement of Assets and Liabilities. The following charts show gross assets and liabilities of the Fund as of September 30, 2023.
| Counterparty | Derivative
Assets
Subject to
Master Netting
Agreement | Derivatives
Available
for Offset | Non-Cash
Collateral
Received(a) | Cash
Collateral
Received(a) | Net Amount
of Derivative
Assets(b) |
Goldman Sachs &
Co. | $71 | $— | $— | $— | $71 |
| Counterparty | Derivative
Liabilities
Subject to
Master Netting
Agreement | Derivatives
Available for
Offset | Non-Cash
Collateral
Pledged(a) | Cash
Collateral
Pledged(a) | Net Amount
of Derivative
Liabilities(c) |
| Goldman Sachs & Co. | $— | $— | $— | $— | $— |
(a) The amount presented here may be less than the total amount of collateral received/pledged, as the net amount of derivative assets and liabilities cannot be less than $0.
(b) Represents the net amount due from the counterparty in the event of default.
(c) Represents the net amount payable to the counterparty in the event of default.
7. Additional Disclosures about Derivative Instruments and Hedging Activities
The Fund’s use of derivatives may enhance or mitigate the Fund’s exposure to the following risks:
Interest rate risk relates to the fluctuations in the value of interest-bearing securities due to changes in the prevailing levels of market interest rates.
Credit risk relates to the ability of the issuer of a financial instrument to make further principal or interest payments on an obligation or commitment that it has to the Fund.
Pioneer Global Sustainable Growth Fund | Annual Report | 9/30/2345
Foreign exchange rate risk relates to fluctuations in the value of an asset or liability due to changes in currency exchange rates.
Equity risk relates to the fluctuations in the value of financial instruments as a result of changes in market prices (other than those arising from interest rate risk or foreign exchange rate risk), whether caused by factors specific to an individual investment, its issuer, or all factors affecting all instruments traded in a market or market segment.
Commodity risk relates to the risk that the value of a commodity or commodity index will fluctuate based on increases or decreases in the commodities market and factors specific to a particular industry or commodity.
The fair value of open derivative instruments (not considered to be hedging instruments for accounting disclosure purposes) by risk exposure at September 30, 2023, was as follows:
Statement of Assets
and Liabilities | Interest
Rate Risk | Credit
Risk | Foreign
Exchange
Rate Risk | Equity
Risk | Commodity
Risk |
| Assets | | | | | |
| Unrealized appreciation on forward foreign currency exchange contracts | $ — | $ — | $71 | $ — | $ — |
| Total Value | $— | $— | $71 | $— | $— |
The effect of derivative instruments (not considered to be hedging instruments for accounting disclosure purposes) on the Statement of Operations by risk exposure at September 30, 2023 was as follows:
| Statement of Operations | Interest
Rate Risk | Credit
Risk | Foreign
Exchange
Rate Risk | Equity
Risk | Commodity
Risk |
| Change in Net Unrealized Appreciation (Depreciation) on | | | | | |
| Forward foreign currency exchange contracts | $ — | $ — | $71 | $ — | $ — |
| Total Value | $— | $— | $71 | $— | $— |
46Pioneer Global Sustainable Growth Fund | Annual Report | 9/30/23
Report of Independent Registered Public Accounting Firm
To the Board of Trustees of Pioneer Series Trust XIV and the Shareholders of Pioneer Global Sustainable Growth Fund:
Opinion on the Financial Statements
We have audited the accompanying statement of assets and liabilities of Pioneer Global Sustainable Growth Fund (the “Fund”) (one of the funds constituting Pioneer Series Trust XIV (the “Trust”)), including the schedule of investments, as of September 30, 2023, and the related statement of operations for the year then ended, the statements of changes in net assets for each of the two years in the period then ended and the financial highlights each of the two years in the period then ended and the period from May 10, 2021 (commencement of operations) through September 30, 2021 and the related notes (collectively referred to as the “financial statements”). In our opinion, the financial statements present fairly, in all material respects, the financial position of the Fund (one of the funds constituting Pioneer Series Trust XIV) at September 30, 2023, and the results of its operations for the year then ended, the changes in its net assets for each of the two years in the period then ended and its financial highlights for each of the two years in the period then ended and the period from May 10, 2021 (commencement of operations) through September 30, 2021, in conformity with U.S. generally accepted accounting principles.
Basis for Opinion
These financial statements are the responsibility of the Trust’s management. Our responsibility is to express an opinion on the Fund’s financial statements based on our audits. We are a public accounting firm registered with the Public Company Accounting Oversight Board (United States) (“PCAOB”) and are required to be independent with respect to the Company in accordance with the U.S. federal securities law and the applicable rules and regulations of the Securities and Exchange Commission and the PCAOB.
We conducted our audits in accordance with the standards of the PCAOB. Those standards require that we plan and perform the audit to obtain reasonable assurance about whether the financial statements are free of material misstatement, whether due to error or fraud. The Trust is not required to have, nor were we engaged to perform, an audits of the Trust’s internal control over financial reporting. As part of our audits, we are required to obtain an understanding of internal control over financial reporting, but not for the purpose of expressing an opinion on the
Pioneer Global Sustainable Growth Fund | Annual Report | 9/30/2347
effectiveness of the Trust’s internal control over financial reporting. Accordingly, we express no such opinion.
Our audits included performing procedures to assess the risks of material misstatement of the financial statements, whether due to error or fraud, and performing procedures that respond to those risks. Such procedures included examining, on a test basis, evidence regarding the amounts and disclosures in the financial statements. Our procedures included confirmation of securities owned as of September 30, 2023, by correspondence with the custodian and brokers; when replies were not received from brokers, we performed other auditing procedures. Our audits also included evaluating the accounting principles used and significant estimates made by management, as well as evaluating the overall presentation of the financial statements. We believe that our audits provide a reasonable basis for our opinion.
We have served as the auditor of one or more investment companies in the Pioneer family of funds since 2017.
Boston, Massachusetts
November 28, 2023
48Pioneer Global Sustainable Growth Fund | Annual Report | 9/30/23
Additional Information (unaudited)
For the year ended September 30, 2023, certain dividends paid by the Fund may be subject to a maximum tax rate of 20%, as provided for by the Jobs and Growth Tax Relief Reconciliation Act (the Act) of 2003. The Fund intends to designate up to the maximum amount of such dividends allowable under the Act, as taxed at a maximum rate of 20%. Complete information will be computed and reported in conjunction with your 2023 Form 1099-DIV.
The qualifying percentage of the Fund’s ordinary income dividends for the purpose of the corporate dividends received deduction was 100.00%.
Pioneer Global Sustainable Growth Fund | Annual Report | 9/30/2349
Approval of Renewal of Investment Management Agreement
Amundi Asset Management US, Inc. (“Amundi US”) serves as the investment adviser to Pioneer Global Sustainable Growth Fund (the “Fund”) pursuant to an investment management agreement between Amundi US and the Fund. In order for Amundi US to remain the investment adviser of the Fund, the Trustees of the Fund, including a majority of the Fund’s Independent Trustees, must determine annually whether to renew the investment management agreement for the Fund.
The contract review process began in January 2023 as the Trustees of the Fund agreed on, among other things, an overall approach and timeline for the process. Contract review materials were provided to the Trustees in March 2023, July 2023 and September 2023. In addition, the Trustees reviewed and discussed the Fund’s performance at regularly scheduled meetings throughout the year, and took into account other information related to the Fund provided to the Trustees at regularly scheduled meetings, in connection with the review of the Fund’s investment management agreement.
In March 2023, the Trustees, among other things, discussed the memorandum provided by Fund counsel that summarized the legal standards and other considerations that are relevant to the Trustees in their deliberations regarding the renewal of the investment management agreement, and reviewed and discussed the qualifications of the investment management teams for the Fund, as well as the level of investment by the Fund’s portfolio managers in the Fund. In July 2023, the Trustees, among other things, reviewed the Fund’s management fees and total expense ratios, the financial statements of Amundi US and its parent companies, profitability analyses provided by Amundi US, and analyses from Amundi US as to possible economies of scale. The Trustees also reviewed the profitability of the institutional business of Amundi US as compared to that of Amundi US’s fund management business, and considered the differences between the fees and expenses of the Fund and the fees and expenses of Amundi US’s institutional accounts, as well as the different services provided by Amundi US to the Fund and to the institutional accounts. The Trustees further considered contract review materials, including additional materials received in response to the Trustees’ request, in September 2023.
At a meeting held on September 19, 2023, based on their evaluation of the information provided by Amundi US and third parties, the Trustees of the Fund, including the Independent Trustees voting separately advised by independent counsel, unanimously approved the renewal of the investment
50Pioneer Global Sustainable Growth Fund | Annual Report | 9/30/23
management agreement for another year. In approving the renewal of the investment management agreement, the Trustees considered various factors that they determined were relevant, including the factors described below. The Trustees did not identify any single factor as the controlling factor in determining to approve the renewal of the agreement.
Nature, Extent and Quality of Services
The Trustees considered the nature, extent and quality of the services that had been provided by Amundi US to the Fund, taking into account the investment objective and strategy of the Fund. The Trustees also reviewed Amundi US’s investment approach for the Fund and its research process. The Trustees considered Amundi US’ integration of environmental, social and governance (ESG) considerations into its investment research process. The Trustees considered the resources of Amundi US and the personnel of Amundi US who provide investment management services to the Fund. They also reviewed the amount of non-Fund assets managed by the portfolio managers of the Fund. They considered the non-investment resources and personnel of Amundi US that are involved in Amundi US’s services to the Fund, including Amundi US’s compliance, risk management, and legal resources and personnel. The Trustees considered the compliance services being provided to the Fund by Amundi US and how Amundi US has addressed any compliance issues during the past year. The Trustees noted the substantial attention and high priority given by Amundi US’s senior management to the Pioneer Fund complex, including with respect to the increasing regulation to which the Pioneer Funds are subject.
The Trustees considered that Amundi US supervises and monitors the performance of the Fund’s service providers and provides the Fund with personnel (including Fund officers) and other resources that are necessary for the Fund’s business management and operations. The Trustees also considered that, as administrator, Amundi US is responsible for the administration of the Fund’s business and other affairs. The Trustees considered that the Fund reimburses Amundi US its pro rata share of Amundi US’s costs of providing administration services to the Pioneer Funds.
Based on these considerations, the Trustees concluded that the nature, extent and quality of services that had been provided by Amundi US to the Fund were satisfactory and consistent with the terms of the investment management agreement.
Performance of the Fund
In considering the Fund’s performance, the Trustees regularly review and discuss throughout the year data prepared by Amundi US and information
Pioneer Global Sustainable Growth Fund | Annual Report | 9/30/2351
comparing the Fund’s performance with the performance of its peer group of funds, as classified by Morningstar, Inc. (Morningstar), and with the performance of the Fund’s benchmark index. They also discuss the Fund’s performance with Amundi US on a regular basis. The Trustees’ regular reviews and discussions were factored into the Trustees’ deliberations concerning the renewal of the investment management agreement.
Management Fee and Expenses
The Trustees considered information showing the fees and expenses of the Fund in comparison to the management fees of its peer group of funds as classified by Morningstar and also to the expense ratios of a peer group of funds selected on the basis of criteria determined by the Independent Trustees for this purpose using data provided by Strategic Insight Mutual Fund Research and Consulting, LLC (Strategic Insight), an independent third party. The peer group comparisons referred to below are organized in quintiles. Each quintile represents one-fifth of the peer group. In all peer group comparisons referred to below, first quintile is most favorable to the Fund’s shareowners. The Trustees noted that they separately review and consider the impact of the Fund’s transfer agency and Fund- and Amundi US-paid expenses for sub-transfer agency and intermediary arrangements, and that the results of the most recent such review were considered in the consideration of the Fund’s expense ratio.
The Trustees considered that the Fund’s management fee for the most recent fiscal year was in the fifth quintile relative to the management fees paid by other funds in its Morningstar category for the comparable period. The Trustees noted Amundi US’s explanation of the reasons that the Fund’s management fee was in the fifth quintile relative to the management fees paid by other funds in its Morningstar category. The Trustees considered that the expense ratio of the Fund’s Class Y shares for the most recent fiscal year was in the first quintile relative to its Strategic Insight peer group for the comparable period. The Trustees noted that Amundi US had agreed to waive fees and/or reimburse expenses in order to limit the ordinary operating expenses of the Fund.
The Trustees reviewed management fees charged by Amundi US to institutional and other clients, including publicly offered European funds sponsored by Amundi US’s affiliates, unaffiliated U.S. registered investment companies (in a sub-advisory capacity), and unaffiliated foreign and domestic separate accounts. The Trustees also considered Amundi US’s costs in providing services to the Fund and Amundi US’s costs in providing services to the other clients and considered the differences in management fees and profit margins for fund and non-fund services. In evaluating the fees associated with Amundi US’s client accounts, the Trustees took into
52Pioneer Global Sustainable Growth Fund | Annual Report | 9/30/23
account the respective demands, resources and complexity associated with the Fund and other client accounts. The Trustees noted that, in some instances, the fee rates for those clients were lower than the management fee for the Fund and considered that, under the investment management and administration agreements with the Fund, Amundi US performs additional services for the Fund that it does not provide to those other clients or services that are broader in scope, including oversight of the Fund’s other service providers and activities related to compliance and the extensive regulatory and tax regimes to which the Fund is subject. The Trustees also considered the entrepreneurial risks associated with Amundi US’s management of the Fund.
The Trustees concluded that the management fee payable by the Fund to Amundi US was reasonable in relation to the nature and quality of the services provided by Amundi US.
Profitability
The Trustees considered information provided by Amundi US regarding the profitability of Amundi US with respect to the advisory services provided by Amundi US to the Fund, including the methodology used by Amundi US in allocating certain of its costs to the management of the Fund. The Trustees also considered Amundi US’s profit margin in connection with the overall operation of the Fund. They further reviewed the financial results, including the profit margins, realized by Amundi US from non-fund businesses. The Trustees considered Amundi US’s profit margins in comparison to the limited industry data available and noted that the profitability of any adviser was affected by numerous factors, including its organizational structure and method for allocating expenses. The Trustees concluded that Amundi US’s profitability with respect to the management of the Fund was not unreasonable.
Economies of Scale
The Trustees considered Amundi US’s views relating to economies of scale in connection with the Pioneer Funds as fund assets grow and the extent to which any such economies of scale are shared with the Fund and Fund shareholders. The Trustees recognize that economies of scale are difficult to identify and quantify, and that, among other factors that may be relevant, are the following: fee levels, expense subsidization, investment by Amundi US in research and analytical capabilities and Amundi US’s commitment and resource allocation to the Fund. The Trustees noted that profitability also may be an indicator of the availability of any economies of scale, although profitability may vary for other reasons including due to reductions in expenses. The Trustees concluded that economies of scale, if any, were being appropriately shared with the Fund.
Pioneer Global Sustainable Growth Fund | Annual Report | 9/30/2353
Other Benefits
The Trustees considered the other benefits that Amundi US enjoys from its relationship with the Fund. The Trustees considered the character and amount of fees paid or to be paid by the Fund, other than under the investment management agreement, for services provided by Amundi US and its affiliates. The Trustees further considered the revenues and profitability of Amundi US’s businesses other than the Fund business. To the extent applicable, the Trustees also considered the benefits to the Fund and to Amundi US and its affiliates from the use of “soft” commission dollars generated by the Fund to pay for research and brokerage services.
The Trustees considered that Amundi US is the principal U.S. asset management business of Amundi, which is one of the largest asset managers globally. Amundi’s worldwide asset management business manages over $2.1 trillion in assets (including the Pioneer Funds). The Trustees considered that Amundi US’s relationship with Amundi creates potential opportunities for Amundi US and Amundi that derive from Amundi US’s relationships with the Fund, including Amundi’s ability to market the services of Amundi US globally. The Trustees noted that Amundi US has access to additional research and portfolio management capabilities as a result of its relationship with Amundi and Amundi’s enhanced global presence that may contribute to an increase in the resources available to Amundi US. The Trustees considered that Amundi US and the Fund receive reciprocal intangible benefits from the relationship, including mutual brand recognition and, for the Fund, direct and indirect access to the resources of a large global asset manager. The Trustees concluded that any such benefits received by Amundi US as a result of its relationship with the Fund were reasonable.
Conclusion
After consideration of the factors described above as well as other factors, the Trustees, including the Independent Trustees, concluded that the investment management agreement for the Fund, including the fees payable thereunder, was fair and reasonable and voted to approve the proposed renewal of the investment management agreement.
54Pioneer Global Sustainable Growth Fund | Annual Report | 9/30/23
Statement Regarding Liquidity Risk Management Program
As required by law, the Fund has adopted and implemented a liquidity risk management program (the “Program”) that is designed to assess and manage liquidity risk. Liquidity risk is the risk that the Fund could not meet requests to redeem its shares without significant dilution of remaining investors’ interests in the Fund. The Fund’s Board of Trustees designated a liquidity risk management committee (the “Committee”) consisting of employees of Amundi Asset Management US, Inc. (the “Adviser”) to administer the Program.
The Committee provided the Board of Trustees with a report that addressed the operation of the Program and assessed its adequacy and effectiveness of implementation (the “Report”). The Report covered the period from January 1, 2022 through December 31, 2022 (the “Reporting Period”).
The Report confirmed that, throughout the Reporting Period, the Committee had monitored the Fund’s portfolio liquidity and liquidity risk on an ongoing basis, as described in the Program and in Board reporting throughout the Reporting Period.
The Report discussed the Committee’s annual review of the Program, which addressed, among other things, the following elements of the Program:
The Committee reviewed the Fund’s investment strategy and liquidity of portfolio investments during both normal and reasonably foreseeable stressed conditions. The Committee noted that the Fund’s investment strategy continues to be appropriate for an open-end fund, taking into account, among other things, whether and to what extent the Fund held less liquid and illiquid assets and the extent to which any such investments affected the Fund’s ability to meet redemption requests. In managing and reviewing the Fund’s liquidity risk, the Committee also considered the extent to which the Fund’s investment strategy involves a relatively concentrated portfolio or large positions in particular issuers, the extent to which the Fund uses borrowing for investment purposes, and the extent to which the Fund uses derivatives (including for hedging purposes). The Committee also reviewed the Fund’s short-term and long-term cash flow projections during both normal and reasonably foreseeable stressed conditions. In assessing the Fund’s cash flow projections, the Committee considered, among other factors, historical net redemption activity, redemption policies, ownership concentration, distribution channels, and the degree of certainty associated with the Fund’s short-term and long-term cash flow projections. The Committee also considered the Fund’s holdings of cash and cash equivalents, as well as borrowing arrangements
Pioneer Global Sustainable Growth Fund | Annual Report | 9/30/23 55
and other funding sources, including, if applicable, the Fund’s participation in a credit facility, as components of the Fund’s ability to meet redemption requests. The Fund has adopted an in-kind redemption policy which may be utilized to meet larger redemption requests.
The Committee reviewed the Program’s liquidity classification methodology for categorizing the Fund’s investments into one of four liquidity buckets. In reviewing the Fund’s investments, the Committee considered, among other factors, whether trading varying portions of a position in a particular portfolio investment or asset class in sizes the Fund would reasonably anticipate trading, would be reasonably expected to significantly affect liquidity.
The Committee performed an analysis to determine whether the Fund is required to maintain a Highly Liquid Investment Minimum, and determined that no such minimum is required because the Fund primarily holds highly liquid investments.
The Report stated that the Committee concluded the Program operates adequately and effectively, in all material respects, to assess and manage the Fund’s liquidity risk throughout the Reporting Period.
56Pioneer Global Sustainable Growth Fund | Annual Report | 9/30/23
Trustees, Officers and Service Providers
Investment Adviser and Administrator
Amundi Asset Management US, Inc.
Custodian and Sub-Administrator
The Bank of New York Mellon Corporation
Independent Registered Public Accounting Firm
Ernst & Young LLP
Principal Underwriter
Amundi Distributor US, Inc.
Legal Counsel
Morgan, Lewis & Bockius LLP
Transfer Agent
BNY Mellon Investment Servicing (US) Inc.
Proxy Voting Policies and Procedures of the Fund are available without charge, upon request, by calling our toll free number (1-800-225-6292). Information regarding how the Fund voted proxies relating to portfolio securities during the most recent 12-month period ended June 30 is publicly available to shareowners at www.amundi.com/us. This information is also available on the Securities and Exchange Commission’s web site at www.sec.gov.
Trustees and Officers
The Fund's Trustees and officers are listed below, together with their principal occupations and other directorships they have held during at least the past five years. Trustees who are interested persons of the Fund within the meaning of the 1940 Act are referred to as Interested Trustees. Trustees who are not interested persons of the Fund are referred to as Independent Trustees. Each of the Trustees serves as a Trustee of each of the 49 U.S. registered investment portfolios for which Amundi US serves as investment adviser (the “Pioneer Funds”). The address for all Trustees and all officers of the Fund is 60 State Street, Boston, Massachusetts 02109.
The Statement of Additional Information of the Fund includes additional information about the Directors and is available, without charge, upon request, by calling 1-800-225-6292.
Pioneer Global Sustainable Growth Fund | Annual Report | 9/30/2357
Name, Age and Position
Held With the Fund | Term of Office and
Length of Service | Principal Occupation(s) DuringAt Least The Past Five Years | Other Directorships Held by Trustee
During At Least The Past Five Years |
Thomas J. Perna (72)
Chairman of the Board
and Trustee | Trustee since 2021.
Serves until a successor
trustee is elected or
earlier retirement
or removal. | Private investor (2004 – 2008 and 2013 – present); Chairman (2008 – 2013) and Chief Executive Officer (2008 – 2012), Quadriserv, Inc. (technology products for securities lending industry); and Senior Executive Vice President, The Bank of New York (financial and securities services) (1986 – 2004) | Director, Broadridge Financial Solutions, Inc.
(investor communications and securities
processing provider for financial services industry)
(2009 – present); Director, Quadriserv, Inc. (2005 –
2013); and Commissioner, New Jersey State
Civil Service Commission (2011 – 2015) |
John E. Baumgardner,
Jr. (72)*
Trustee | Trustee since 2021.
Serves until a successor
trustee is elected or
earlier retirement
or removal. | Of Counsel (2019 – present), Partner (1983-2018), Sullivan & Cromwell LLP (law firm). | Chairman, The Lakeville Journal Company, LLC,
(privately-held community newspaper group)
(2015-present) |
Diane Durnin (66)
Trustee | Trustee since 2021.
Serves until a successor
trustee is elected or
earlier retirement
or removal. | Managing Director - Head of Product Strategy and Development, BNY Mellon Investment Management (investment management firm) (2012-2018); Vice Chairman – The Dreyfus Corporation (2005 – 2018): Executive Vice President Head of Product, BNY Mellon Investment Management (2007-2012); Executive Director- Product Strategy, Mellon Asset Management (2005-2007); Executive Vice President Head of Products, Marketing and Client Service, Dreyfus Corporation (investment management firm) (2000-2005); Senior Vice President Strategic Product and Business Development, Dreyfus Corporation (1994-2000) | None |
58Pioneer Global Sustainable Growth Fund | Annual Report | 9/30/23
Name, Age and Position
Held With the Fund | Term of Office and
Length of Service | Principal Occupation(s) DuringAt Least The Past Five Years | Other Directorships Held by Trustee
During At Least The Past Five Years |
Benjamin M. Friedman (79)
Trustee | Trustee since 2021.
Serves until a successor
trustee is elected or
earlier retirement
or removal. | William Joseph Maier Professor of Political Economy, Harvard University (1972 – present) | Trustee, Mellon Institutional Funds Investment
Trust and Mellon Institutional Funds Master
Portfolio (oversaw 17 portfolios in fund complex)
(1989 - 2008) |
Craig C. MacKay (60)
Trustee | Trustee since 2021.
Serves until a successor
trustee is elected or
earlier retirement
or removal. | Partner, England & Company, LLC (advisory firm) (2012 – present); Group Head – Leveraged Finance Distribution, Oppenheimer & Company (investment bank) (2006 – 2012); Group Head – Private Finance & High Yield Capital Markets Origination, SunTrust Robinson Humphrey (investment bank) (2003 – 2006); and Founder and Chief Executive Officer, HNY Associates, LLC (investment bank) (1996 – 2003) | Director, Equitable Holdings, Inc. (financial
services holding company) (2022 – present);
Board Member of Carver Bancorp, Inc. (holding
company) and Carver Federal Savings Bank,
NA (2017 – present); Advisory Council Member,
MasterShares ETF (2016 – 2017); Advisory
Council Member, The Deal (financial market
information publisher) (2015 – 2016); Board
Co-Chairman and Chief Executive Officer, Danis
Transportation Company (privately-owned
commercial carrier) (2000 – 2003); Board
Member and Chief Financial Officer, Customer
Access Resources (privately-owned
teleservices company) (1998 – 2000); Board
Member, Federation of Protestant Welfare
Agencies (human services agency) (1993 –
present); and Board Treasurer, Harlem Dowling
Westside Center (foster care agency)
(1999 – 2018) |
Pioneer Global Sustainable Growth Fund | Annual Report | 9/30/2359
Independent Trustees (continued)
Name, Age and Position
Held With the Fund | Term of Office and
Length of Service | Principal Occupation(s) DuringAt Least The Past Five Years | Other Directorships Held by Trustee
During At Least The Past Five Years |
Lorraine H. Monchak (67)
Trustee | Trustee since 2021.
(Advisory Trustee from
2014 - 2017). Serves
until a successor trustee
is elected or earlier
retirement or removal. | Chief Investment Officer, 1199 SEIU Funds (healthcare workers union pension funds) (2001 – present); Vice President – International Investments Group, American International Group, Inc. (insurance company) (1993 – 2001); Vice President – Corporate Finance and Treasury Group, Citibank, N.A. (1980 – 1986 and 1990 – 1993); Vice President – Asset/Liability Management Group, Federal Farm Funding Corporation (government-sponsored issuer of debt securities) (1988 – 1990); Mortgage Strategies Group, Shearson Lehman Hutton, Inc. (investment bank) (1987 – 1988); Mortgage Strategies Group, Drexel Burnham Lambert, Ltd. (investment bank) (1986 – 1987) | None |
Marguerite A. Piret (75)
Trustee | Trustee since 2021.
Serves until a successor
trustee is elected or
earlier retirement
or removal. | Chief Financial Officer, American Ag Energy, Inc. (technology for the environment, energy and agriculture) (2019 – present); Chief Operating Officer, North Country Growers LLC (controlled environment agriculture company) (2020 – present); Chief Executive Officer, Green Heat LLC (biofuels company) (2022 – present); President and Chief Executive Officer, Newbury Piret Company (investment banking firm) (1981 – 2019) | Director of New America High Income Fund,
Inc. (closed-end investment company) (2004 –
present); and Member, Board of Governors,
Investment Company Institute (2000 – 2006) |
60Pioneer Global Sustainable Growth Fund | Annual Report | 9/30/23
Name, Age and Position
Held With the Fund | Term of Office and
Length of Service | Principal Occupation(s) DuringAt Least The Past Five Years | Other Directorships Held by Trustee
During At Least The Past Five Years |
Fred J. Ricciardi (76)
Trustee | Trustee since 2021.
Serves until a successor
trustee is elected or
earlier retirement
or removal. | Private investor (2020 – present); Consultant (investment company services) (2012 – 2020); Executive Vice President, BNY Mellon (financial and investment company services) (1969 – 2012); Director, BNY International Financing Corp. (financial services) (2002 – 2012); Director, Mellon Overseas Investment Corp. (financial services) (2009 – 2012); Director, Financial Models (technology) (2005-2007); Director, BNY Hamilton Funds, Ireland (offshore investment companies) (2004-2007); Chairman/Director, AIB/BNY Securities Services, Ltd., Ireland (financial services) (1999-2006); Chairman, BNY Alternative Investment Services, Inc. (financial services) (2005-2007) | None |
| * Mr. Baumgardner is Of Counsel to Sullivan & Cromwell LLP, which acts as counsel to the Independent Trustees of each Pioneer Fund. |
Pioneer Global Sustainable Growth Fund | Annual Report | 9/30/2361
Name, Age and Position
Held With the Fund | Term of Office and
Length of Service | Principal Occupation(s) During At Least The Past Five Years | Other Directorships Held by Trustee
During At Least The Past Five Years |
Lisa M. Jones (61)**
Trustee, President and Chief
Executive Officer | Trustee since 2021. Serves
until a successor trustee is
elected or earlier retirement
or removal | Director, CEO and President of Amundi US, Inc. (investment management firm) (since September 2014); Director, CEO and President of Amundi Asset Management US, Inc. (since September 2014); Director, CEO and President of Amundi Distributor US, Inc. (since September 2014); Director, CEO and President of Amundi Asset Management US, Inc. (since September 2014); Chair, Amundi US, Inc., Amundi Distributor US, Inc. and Amundi Asset Management US, Inc. (September 2014 – 2018); Managing Director, Morgan Stanley Investment Management (investment management firm) (2010 – 2013); Director of Institutional Business, CEO of International, Eaton Vance Management (investment management firm) (2005 – 2010); Director of Amundi Holdings US, Inc. (since 2017) | Director of Clearwater Analytics (provider
of web-based investment accounting
software for reporting and reconciliation
services) (September 2022 – present) |
Kenneth J. Taubes (65)**
Trustee | Trustee since 2021. Serves
until a successor trustee is
elected or earlier retirement
or removal | Director and Executive Vice President (since 2008) and Chief Investment Officer, U.S. (since 2010) of Amundi US, Inc. (investment management firm); Director and Executive Vice President and Chief Investment Officer, U.S. of Amundi US (since 2008); Executive Vice President and Chief Investment Officer, U.S. of Amundi Asset Management US, Inc. (since 2009); Portfolio Manager of Amundi US (since 1999); Director of Amundi Holdings US, Inc. (since 2017) | None |
| ** Ms. Jones and Mr. Taubes are Interested Trustees because they are officers or directors of the Fund’s investment adviser and certain of its affiliates. |
62Pioneer Global Sustainable Growth Fund | Annual Report | 9/30/23
Name, Age and Position
Held With the Fund | Term of Office and
Length of Service | Principal Occupation(s) During At Least The Past Five Years | Other Directorships Held by Officer
During At Least The Past Five Years |
Christopher J. Kelley (58)
Secretary and Chief
Legal Officer | Since 2021. Serves at
the discretion of
the Board | Vice President and Associate General Counsel of Amundi US since January 2008; Secretary and Chief Legal Officer of all of the Pioneer Funds since June 2010; Assistant Secretary of all of the Pioneer Funds from September 2003 to May 2010; Vice President and Senior Counsel of Amundi US from July 2002 to December 2007 | None |
Thomas Reyes (60)
Assistant Secretary | Since 2021. Serves at
the discretion of
the Board | Assistant General Counsel of Amundi US since May 2013 and Assistant Secretary of all the Pioneer Funds since June 2010; Counsel of Amundi US from June 2007 to May 2013 | None |
Heather L. Melito-Dezan (46)
Assistant Secretary | Since 2022. Serves at
the discretion of
the Board | Director - Trustee and Board Relationships of Amundi US since September 2019; Assistant Secretary of Amundi US, Inc. since July 2020: Assistant Secretary of Amundi Asset Management US, Inc. since July 2020: Assistant Secretary of Amundi Distributor US, Inc. since July 2020; Assistant Secretary of all the Pioneer Funds since September 2022; Private practice from 2017 – 2019. | None |
Anthony J. Koenig, Jr. (59)
Treasurer and
Chief Financial and
Accounting Officer | Since 2021. Serves at
the discretion of
the Board | Managing Director, Chief Operations Officer and Fund Treasurer of Amundi US since May 2021; Treasurer of all of the Pioneer Funds since May 2021; Assistant Treasurer of all of the Pioneer Funds from January 2021 to May 2021; and Chief of Staff, US Investment Management of Amundi US from May 2008 to January 2021 | None |
Luis I. Presutti (58)
Assistant Treasurer | Since 2021. Serves at
the discretion of
the Board | Director – Fund Treasury of Amundi US since 1999; and Assistant Treasurer of all of the Pioneer Funds since 1999 | None |
Gary Sullivan (65)
Assistant Treasurer | Since 2021. Serves at
the discretion of
the Board | Senior Manager – Fund Treasury of Amundi US since 2012; and Assistant Treasurer of all of the Pioneer Funds since 2002 | None |
Pioneer Global Sustainable Growth Fund | Annual Report | 9/30/2363
Fund Officers (continued)
Name, Age and Position
Held With the Fund | Term of Office and
Length of Service | Principal Occupation(s) During At Least The Past Five Years | Other Directorships Held by Officer
During At Least The Past Five Years |
Antonio Furtado (41)
Assistant Treasurer | Since 2021. Serves at
the discretion of
the Board | Fund Oversight Manager – Fund Treasury of Amundi US since 2020; Assistant Treasurer of all of the Pioneer Funds since 2020; and Senior Fund Treasury Analyst from 2012 - 2020 | None |
Michael Melnick (52)
Assistant Treasurer | Since 2021. Serves at
the discretion of
the Board | Vice President - Deputy Fund Treasurer of Amundi US since May 2021; Assistant Treasurer of all of the Pioneer Funds since July 2021; Director of Regulatory Reporting of Amundi US from 2001 – 2021; and Director of Tax of Amundi US from 2000 - 2001 | None |
John Malone (52)
Chief Compliance Officer | Since 2021. Serves at
the discretion of
the Board | Managing Director, Chief Compliance Officer of Amundi US Asset Management; Amundi Asset Management US, Inc.; and the Pioneer Funds since September 2018; Chief Compliance Officer of Amundi Distributor US, Inc. since January 2014. | None |
Brandon Austin (51)
Anti-Money Laundering Officer | Since 2022. Serves at
the discretion of
the Board | Director, Financial Security – Amundi Asset Management; Anti-Money Laundering Officer of all the Pioneer Funds since March 2022: Director of Financial Security of Amundi US since July 2021; Vice President, Head of BSA, AML and OFAC, Deputy Compliance Manager, Crédit Agricole Indosuez Wealth Management (investment management firm) (2013 – 2021) | None |
64Pioneer Global Sustainable Growth Fund | Annual Report | 9/30/23
How to Contact Amundi
We are pleased to offer a variety of convenient ways for you to contact us for assistance or information.
Call us for:
Account Information, including existing accounts,
new accounts, prospectuses, applications
and service forms
1-800-225-6292
FactFoneSM for automated fund yields, prices,
account information and transactions
1-800-225-4321
| Retirement plans information | 1-800-622-0176 |
Write to us:
Amundi
P.O. Box 534427
Pittsburgh, PA 15253-4427
| Our toll-free fax | 1-800-225-4240 |
| Our internet e-mail address | us.askamundi@amundi.com
(for general questions about Amundi only) |
Visit our web site: www.amundi.com/us
This report must be preceded or accompanied by a prospectus.
The Fund files a complete schedule of portfolio holdings with the Securities and Exchange Commission for the first and third quarters of each fiscal year as an exhibit to its reports on Form N-PORT. Shareholders may view the filed Form N-PORT by visiting the Commission’s web site at https://www.sec.gov.
Amundi Asset Management US, Inc.
60 State Street
Boston, MA 02109
www.amundi.com/us
Securities offered through Amundi Distributor US, Inc.
60 State Street, Boston, MA 02109
Underwriter of Pioneer Mutual Funds, Member SIPC
© 2023 Amundi Asset Management US, Inc. 32715-02-1123
Pioneer Global Sustainable Value Fund
Annual Report | September 30, 2023
visit us: www.amundi.com/us
Pioneer Global Sustainable Value Fund | Annual Report | 9/30/231
President’s Letter
Dear Shareholders,
On February 13, 2023, Amundi US celebrated the 95th anniversary of Pioneer Fund, the second-oldest mutual fund in the United States. We recognized the anniversary with ringing of the closing bell at the New York Stock Exchange, which seemed fitting for this special milestone.
Pioneer Fund was launched on February 13, 1928 by Phil Carret, one of the earliest proponents of value investing and a leading innovator in the asset management industry. Mr. Carret began investing in the 1920s and founded Pioneer Investments (now Amundi US) in 1928, and was one of the first investors to realize he could uncover value through rigorous, innovative, fundamental research techniques.
Consistent with Mr. Carret’s investment approach and employing many of the same techniques utilized in the 1920s, Amundi US's portfolio managers have adapted Mr. Carret’s philosophy to a new age of “active” investing.
The last few years have seen investors face some unprecedented challenges, from a global pandemic that shuttered much of the world’s economy for months, to geopolitical strife, to rising inflation that has reached levels not seen in decades. Now, more than ever, Amundi US believes active management – that is, making active investment decisions across all of our portfolios – can help mitigate risk during periods of market volatility.
At Amundi US, active management begins with our own fundamental, bottom-up research process. Our team of dedicated research analysts and portfolio managers analyzes each security under consideration, communicating frequently with the management teams of the companies and other entities issuing the securities, and working together to identify those securities that we believe best meet our investment criteria for our family of funds. Our risk management approach begins with each security under consideration, as we strive to develop a deep understanding of the potential opportunity, while considering any potential risk factors.
Today, as shareholders, we have many options. It is our view that active management can serve shareholders well, not only when markets are thriving, but also during periods of market stress. As you consider your long-term investment goals, we encourage you to work with your financial professional to develop an investment plan that paves the way for you to pursue both your short-term and long-term goals.
2Pioneer Global Sustainable Value Fund | Annual Report | 9/30/23
We greatly appreciate the trust you have placed in us and look forward to continuing to serve you in the future.
Lisa M. Jones
Head of the Americas, President and CEO of US
Amundi Asset Management US, Inc.
November 2023
Any information in this shareowner report regarding market or economic trends or the factors influencing the Fund’s historical or future performance are statements of opinion as of the date of this report. Past performance is no guarantee of future results.
Pioneer Global Sustainable Value Fund | Annual Report | 9/30/233
Portfolio Management Discussion | 9/30/23
In the following discussion, portfolio managers John Peckham, Brian Chen, and Jeff Sacknowitz discuss the market environment during the 12-month period ended September 30, 2023, and the performance of Pioneer Global Sustainable Value Fund during the period. Mr. Peckham, a senior vice president and a portfolio manager at Amundi Asset Management US, Inc. (Amundi US), Mr. Chen, a senior vice president and a portfolio manager at Amundi US, and Mr. Sacknowitz, a vice president and a portfolio manager at Amundi US, are responsible for the day-to-day management of the Fund.
| Q | How did the Fund perform during the 12-month period ended September 30, 2023? |
| A | Pioneer Global Sustainable Value Fund’s Class A shares returned 23.82% at net asset value during the 12-month period ended September 30, 2023, while the Fund’s benchmark, the Morgan Stanley Capital International (MSCI) All Country World (ACWI) Value Index*, returned 16.98%. During the same 12-month period, the average return of the 163 mutual funds in Morningstar’s Global Large-Stock Value category was 21.27%. |
| Q | How would you describe the investment backdrop for equities during the 12-month period ended September 30, 2023? |
| A | The period opened in the wake of a series of aggressive Federal Reserve (Fed) interest-rate increases as the US central bank sought to counter rising levels of inflation, which had peaked at over 9% in June of 2022. The Fed’s determined stance had brought the target for its benchmark federal funds rate from 0.00% – 0.25% in March of 2022, to 3.00% – 3.25% entering |
| * | The MSCI information may only be used for your internal use, may not be reproduced or redisseminated in any form and may not be used as a basis for or a component of any financial instruments or products or indices. None of the MSCI information is intended to constitute investment advice or a recommendation to make (or refrain from making) any kind of investment decision and may not be relied on as such. Historical data and analysis should not be taken as an indication or guarantee of any future performance analysis, forecast or prediction. The MSCI information is provided on an “as is” basis and the user of this information assumes the entire risk of any use made of this information. MSCI, each of its affiliates and each other person involved in or related to compiling, computing or creating any MSCI information (collectively, the “MSCI Parties”) expressly disclaims all warranties (including, without limitation, any warranties of originality, accuracy, completeness, timeliness, non-infringement, merchantability and fitness for a particular purpose) with respect to this information. Without limiting any of the foregoing, in no event shall any MSCI Party have any liability for any direct, indirect, special, incidental, punitive, consequential (including, without limitation, lost profits) or any other damages. |
4Pioneer Global Sustainable Value Fund | Annual Report | 9/30/23
| | October 2022. In addition, the US Treasury yield curve, which had moved notably higher in response to the Fed’s actions, became inverted as the market anticipated a recession. (A yield curve is a line that plots the interest rates, at a set point in time, of bonds having equal credit quality but differing maturity dates. An inverted yield curve means that longer-term rates are lower than shorter-term rates.) |
| | As the fourth quarter of 2022 progressed and inflation showed signs of modest easing, investors’ sentiment for riskier assets, such as equities, improved as the market began to anticipate a pivot by the Fed to a more dovish policy stance, despite another increase of 75 basis points (bps) to the federal funds rate target range in early November 2022. (A basis point is equal to 1/100th of a percentage point.) In December, however, after a solid start to the fourth quarter, the market soon turned its attention to the potential recessionary effects of the higher interest-rate regime put in place by the Fed, which led riskier assets to give back some of their gains from earlier in the quarter as the month progressed. In addition, the Fed implemented a more modest 50 bps increase to the federal funds rate target range at its December meeting, leaving the target range at 4.25% – 4.50% at the end of 2022, its highest level since the fall of 2007. |
| | Entering 2023, riskier assets rallied again, amid renewed investor optimism that the Fed and other leading central banks were poised to stop raising interest rates. January 2023 saw Treasury yields pull back from their more recent highs on the outlook for a potential easing of monetary policy. In addition, the reopening of China’s economy as the Chinese government unwound its “Zero-COVID” policy eased concerns about slowing global economic growth. Against that backdrop, areas of the market that had lagged during the 2022 sell-off (such as growth stocks and corporate bonds) outperformed. On February 1, the Fed increased the federal funds rate target again, but this time by a comparatively moderate 25 bps, bringing the target range to 4.50% – 4.75%. |
| | In March, however, the failure of some regional US banks and the collapse of European lender Credit Suisse raised fears of a financial crisis. In response, the Fed implemented a new lending program to support bank liquidity, while market participants |
Pioneer Global Sustainable Value Fund | Annual Report | 9/30/235
| | began to anticipate decreases in the federal funds rate target range by the Fed before the end of the calendar year. The prospect of easier monetary policy and the “flight to safety” spurred by banking concerns drove Treasury yields sharply lower. At its March 23 meeting, the Fed went forward with another modest 25 bps increase to the federal funds target, bringing the range to 4.75% ‒ 5.00%. The financial markets viewed that increase as an indication that the Fed believed the financial system, overall, remained on solid footing. |
| | As the period progressed, declining inflation data led investors to expect the monetary tightening by central banks to end at some point in 2023. In addition, surprisingly resilient global economic growth raised hopes that the world economy would experience a “soft landing” rather than a recession. (A soft landing is when economic growth slows but remains positive as inflation is brought under control.) The Fed would implement another increase to the federal funds target range of 25 bps in early May, bringing the range to 5.00% ‒ 5.25%, before taking a pause at its June meeting. On July 26, 2023, the Fed once again raised the federal funds target range by 25 bps, then the Fed took another pause at its September meeting, leaving the range at 5.25% ‒ 5.50% as of period-end. At its September meeting, the Fed did signal the likelihood of another interest-rate increase before year-end. However, the central bank’s “dot plot” displaying Open Market Committee members’ expectations for the trajectory of the federal funds rate signaled only two rate cuts during 2024, a reflection of resilient economic growth and employment data. (The FOMC, or Federal Open Market Committee, dot plot, is a chart that summarizes the FOMC's outlook for the federal funds rate.) |
| | Given the “higher for longer” interest-rate outlook, Treasury yields moved higher and global equities declined towards the end of the 12-month period, with growth-oriented stocks posting the biggest losses. In Europe, investors braced for higher interest rates over a prolonged period, even as economic data such as purchasing manager indices (PMI) sat at contractionary levels. By contrast, Japan’s gross domestic product (GDP) has remained robust, as evidenced by annualized 6% growth as of the end of June. The number exceeded forecasts, as a weaker yen has |
6Pioneer Global Sustainable Value Fund | Annual Report | 9/30/23
| | boosted activity for Japanese exporters. While inflation has slowed in Japan, core inflation has persisted at above Bank of Japan targets. |
| | For the 12-month period, the Fund’s benchmark, the MSCI ACWI Value Index, returned 16.98%, lagging the return of 24.42% for the MSCI All Country World Growth Index, as growth stocks outperformed value stocks. |
| Q | What is your investment approach in managing the Fund? |
| A | The Fund’s primary objective is to seek long-term capital growth. We seek to achieve that objective by investing the Fund in a portfolio of stocks of what we believe to be quality value-oriented companies globally, across any market capitalization. |
| | In managing the Fund, Amundi US adheres to an ESG (environmental, social, and governance) mandate. We seek to invest the portfolio in securities of issuers with above-average potential for earnings and revenue growth, with an emphasis on shares of companies that we believe feature sustainable business models. Amundi US’s investment process includes evaluating individual companies’ ESG practices. In keeping with that focus, Amundi US considers ESG information when evaluating which investments to include in the Fund’s portfolio. Amundi US believes that ESG-related information helps us gain a more complete understanding of a company and its business. |
| | Under normal circumstances, the Fund invests at least 80% of its net assets (plus the amount of borrowings, if any, for investment purposes) in securities of issuers that Amundi US believes adhere to the Fund's ESG criteria. For purposes of the Fund's 80% investment policy, “ESG criteria” is defined as the exclusion of investments issued by companies significantly involved in the production of tobacco products and controversial military weapons consisting of cluster weapons, anti-personnel mines, nuclear weapons, and biological and chemical weapons, and the operation of thermal coal mines. |
Pioneer Global Sustainable Value Fund | Annual Report | 9/30/237
| Q | What were the principal factors affecting the Fund’s benchmark-relative performance during the 12-month period ended September 30, 2023? |
| A | Stock selection results in the financials, industrials, and consumer staples sectors drove positive contributions to the Fund’s relative performance for the period, while stock selection results within the energy sector weighed most heavily on benchmark-relative returns. Sector allocation results also aided the Fund’s relative performance during the period. A portfolio overweight to energy and an underweight to consumer staples were the largest positive contributors to the Fund’s relative performance from a sector allocation standpoint, while an underweight to information technology weighed on relative results. |
| | In terms of individual positions, leading positive contributors to the Fund’s relative performance included a position in Netherlands-based ABN AMRO, within financials. The bank reported better-than-expected profits while beating consensus forecasts, and its operating income increased. In addition, ABN AMRO’s capital ratios have continued to reflect financial strength. In our view, the company is well positioned to weather the current macroeconomic environment, and higher interest rates could continue to provide support to earnings as net-interest margins improve. A portfolio overweight position in Germany-based Hensoldt AG, within the industrials sector, also contributed positively to the Fund’s relative performance. Hensoldt develops sensor technologies and other electronics for the defense and aerospace sectors. Sentiment with respect to Hensoldt has benefited from the German government’s announcement of plans to increase defense spending. We have maintained the Fund’s position, given the company’s huge order backlog and even larger project pipeline, which could support future earnings. |
| | On the downside, shares of EQT, the largest US natural gas producer, lagged during the period and detracted from the Fund’s relative performance, as soft natural gas prices have weighed on the company’s revenues and earnings. Another detractor from relative returns was the Fund’s position in Pfizer, which develops and markets biopharmaceuticals worldwide. The stock price |
8Pioneer Global Sustainable Value Fund | Annual Report | 9/30/23
| | declined over the period as management lowered guidance on COVID-19-related revenues for 2023. However, we continue to be encouraged by Pfizer’s progress on its pipeline of drugs in development, which includes some potentially large products. |
| Q | Did the Fund have any exposure to derivative securities during the 12-month period ended September 30, 2023? |
| A | No. The Fund had no exposure to derivatives during the period. |
| Q | How would you characterize your outlook and the Fund’s overall positioning as of September 30, 2023? |
| A | The macroeconomic environment has grown increasingly difficult, and, in our view, a soft landing has become increasingly unlikely while the risk of recession has grown. Slowing economic data has become more evident in Europe, and while US data has been somewhat mixed, higher interest rates have slowed industrial production. However, other parts of the economy, including housing, have held up fairly well, thus further reinforcing the outlook for hawkish Fed monetary policy, which has not yet been fully reflected in equity prices. |
| | Given those challenges, we have maintained a cautious stance, and have continued to adhere to our “all weather” investment process that seeks to invest the Fund in stocks of what we believe are quality companies, featuring attractive valuations. Over the last year, performance leadership within the equity markets has been very concentrated in a small number of stocks supported by investors’ anticipation about the potential of artificial intelligence (AI). In our view, this is not sustainable, and so we have maintained the portfolio’s underweights to mega-cap growth stocks characterized by excessive valuations. As a result, the portfolio is underweight to the US, where the mega-cap AI market segment is located. |
| | Furthermore, from a geographic standpoint, some of the Fund’s largest country overweights versus the benchmark continue to be in Northeast Asia, including Korea and Japan, where large valuation discrepancies have remained in place. We have retained the Fund’s overweight to Japan, as we have focused on multinational companies with new managements that appear committed to restructuring their business portfolios and to |
Pioneer Global Sustainable Value Fund | Annual Report | 9/30/239
| | emphasizing market-leading businesses, while de-emphasizing businesses that are not performing. In our view, the trend, in conjunction with generally strong balance sheets, more shareholder-friendly policies, and extremely low valuations, presents a solid investment opportunity. Moreover, the weaker yen has increased the competitiveness of Japanese exporters. |
| | The top-down investment themes on which we have focused have continued to guide the portfolio towards regions and sectors that we believe can perform well in an environment of higher interest rates, while also reducing cyclicality. For example, we have increased the Fund’s exposure to health care stocks, which have tended to be less sensitive to changes in the macroeconomic environment, while also trading at compelling valuations. In addition, given the global shift towards quantitative tightening by central banks, we have maintained the portfolio’s exposure to what we view as attractively valued over-capitalized banks with a focus on traditional banking services, especially in Europe, where the financial sector appears to be in solid shape. European banks have been generating strong profits, and given their mix of high profitability and excess capital, have also been able to reward shareholders with significant dividends** and share buybacks. |
| | We are also maintaining an overweight Fund allocation to the energy sector across geographic regions. While commodity prices have been volatile, we view the sector as presenting a structural opportunity for investors. Globally, there has been an underinvestment in fossil fuels, and the OPEC+ nations appear to be disciplined in keeping a floor on crude oil prices. (The Organization of the Petroleum Exporting Countries Plus, or OPEC+, is a loosely affiliated entity consisting of the 13 OPEC members and 10 of the world's major non-OPEC oil-exporting nations. A price floor is the lowest amount at which a good or service may be sold and still function within the traditional supply-and-demand model.) |
| | In addition to other holdings within the energy sector, we have also maintained the Fund’s exposure to natural gas companies. We expect natural gas prices to receive support over time, given |
| ** | Dividends are not guaranteed. |
10Pioneer Global Sustainable Value Fund | Annual Report | 9/30/23
that the commodity could be a key energy source during the transition away from higher-carbon sources such as oil and coal. Finally, the portfolio is underweight those areas of the market that seem most likely to feel the negative effects of higher rates and inflation, including the utilities and real estate sectors.
Pioneer Global Sustainable Value Fund | Annual Report | 9/30/2311
Please refer to the Schedule of Investments on pages 21 - 27 for a full listing of Fund securities.
All investments are subject to risk, including the possible loss of principal. In the past several years, financial markets have experienced increased volatility and heightened uncertainty. The market prices of securities may go up or down, sometimes rapidly or unpredictably, due to general market conditions, such as real or perceived adverse economic, political, or regulatory conditions, recessions, inflation, changes in interest or currency rates, lack of liquidity in the bond markets, the spread of infectious illness or other public health issues, armed conflict including Russia's military invasion of Ukraine, sanctions against Russia, other nations or individuals or companies and possible countermeasures, market disruptions caused by tariffs, trade disputes or other government actions, or adverse investor sentiment. These conditions may continue, recur, worsen or spread.
Investing in foreign and/or emerging markets securities involves risks relating to interest rates, currency exchange rates, economic, and political conditions.
The Fund is subject to currency risk, meaning that the Fund could experience losses based on changes in the exchange rate between non-U.S. currencies and the U.S. dollar.
The Fund generally excludes corporate issuers that do not meet or exceed minimum ESG standards. Excluding specific issuers limits the universe of investments available to the Fund, which may mean forgoing some investment opportunities available to funds without similar ESG standards.
The market price of securities may fluctuate when interest rates change. When interest rates rise, the prices of fixed-income securities in the Fund will generally fall. Conversely, when interest rates fall, the prices of fixed-income securities in the Fund will generally rise.
The Fund may use derivatives, which may have a potentially large impact on Fund performance.
The Fund may invest in IPOs (Initial Public Offerings), which may involve additional risks.
For more information on this or any Pioneer fund, please visit amundi.com/usinvestors or call 1-800-622-9876. This material must be preceded or accompanied by the Fund's current prospectus or summary prospectus.
Any information in this shareowner report regarding market or economic trends or the factors influencing the Fund’s historical or future performance are statements of opinion as of the date of this report. Past performance is no guarantee of future results.
12Pioneer Global Sustainable Value Fund | Annual Report | 9/30/23
Portfolio Summary | 9/30/23
Sector Distribution
(As a percentage of total investments)*
Geographical Distribution
(As a percentage of total investments based on country of domicile)*
Pioneer Global Sustainable Value Fund | Annual Report | 9/30/2313
Portfolio Summary | 9/30/23 (continued)
10 Largest Holdings
| (As a percentage of total investments)* |
| 1. | Pfizer, Inc. | 3.73% |
| 2. | Occidental Petroleum Corp. | 3.01 |
| 3. | KB Financial Group, Inc.(A.D.R.) | 2.96 |
| 4. | UBS Group AG | 2.95 |
| 5. | Cisco Systems, Inc. | 2.89 |
| 6. | BP Plc(A.D.R.) | 2.65 |
| 7. | Shell Plc (A.D.R.) | 2.52 |
| 8. | Cardinal Health, Inc. | 2.49 |
| 9. | International Business Machines Corp. | 2.48 |
| 10. | AbbVie, Inc. | 2.21 |
| | |
| * | Excludes short-term investments and all derivative contracts except for options purchased. The Fund is actively managed, and current holdings may be different. The holdings listed should not be considered recommendations to buy or sell any securities. |
14Pioneer Global Sustainable Value Fund | Annual Report | 9/30/23
Prices and Distributions | 9/30/23
Net Asset Value per Share
| Class | 9/30/23 | 9/30/22 |
| A | $10.10 | $8.34 |
| C | $10.03 | $8.29 |
| Y | $10.11 | $8.35 |
| | | |
Distributions per Share: 10/1/22 - 9/30/23
| Class | Net
Investment
Income | Short-Term
Capital Gains | Long-Term
Capital Gains |
| A | $0.2127 | $— | $— |
| C | $0.1454 | $— | $— |
| Y | $0.2400 | $— | $— |
Index Definitions
The Morgan Stanley Capital International (MSCI) All Country World Value NR Index measures the free-float weighted equity index that captures large and mid-cap representation across emerging markets countries. The index covers approximately 85% of the free float-adjusted market capitalization in each country. Indices are unmanaged and their returns assume reinvestment of dividends and do not reflect any fees or expenses. It is not possible to invest directly in an index.
The index defined here pertains to the “Value of $10,000 Investment” and “Value of $5 Million Investment” charts on pages 16 - 18.
Pioneer Global Sustainable Value Fund | Annual Report | 9/30/2315
| Performance Update | 9/30/23 | Class A Shares |
Investment Returns
The mountain chart on the right shows the change in value of a $10,000 investment made in Class A shares of Pioneer Global Sustainable Value Fund at public offering price during the periods shown, compared to that of the MSCI All Country World Value NR Index.*
Average Annual Total Returns
(As of September 30, 2023) |
| Period | Net
Asset
Value
(NAV) | Public
Offering
Price
(POP) | MSCI All
Country
World
Value
NR Index |
Life of Class
(5/10/21)* | 1.88% | -0.61% | -0.80% |
| 1 Year | 23.82 | 16.68 | 16.98 |
Expense Ratio
(Per prospectus dated February 1, 2023) |
| Gross | Net |
| 11.90% | 1.00% |
Value of $10,000 Investment
Call 1-800-225-6292 or visit www.amundi.com/us for the most recent month-end performance results. Current performance may be lower or higher than the performance data quoted.
The performance data quoted represents past performance, which is no guarantee of future results. Investment return and principal value will fluctuate, and shares, when redeemed, may be worth more or less than their original cost.
NAV results represent the percent change in net asset value per share. NAV returns would have been lower had sales charges been reflected. POP returns reflect deduction of maximum 5.75% sales charge. All results are historical and assume the reinvestment of dividends and capital gains. Other share classes are available for which performance and expenses will differ.
Performance results reflect any applicable expense waivers in effect during the periods shown. Without such waivers Fund performance would be lower. Waivers may not be in effect for all funds. Certain fee waivers are contractual through a specified period. Otherwise, fee waivers can be rescinded at any time. See the prospectus and financial statements for more information.
The net expense ratio reflects the contractual expense limitation in effect through February 1, 2024 for Class A shares. There can be no assurance that Amundi US will extend the expense limitation beyond such time. Please see the prospectus for more information.
* Performance of Class A shares shown in the graph above is from the inception of Class A shares on 5/10/21 through 9/30/23. Index information shown in the graph above is from 5/31/21 through 9/30/23.
The performance table and graph do not reflect the deduction of fees and taxes that a shareowner would pay on Fund distributions or the redemption of Fund shares.
Please refer to the financial highlights for more current expense ratios.
16Pioneer Global Sustainable Value Fund | Annual Report | 9/30/23
| Performance Update | 9/30/23 | Class C Shares |
Investment Returns
The mountain chart on the right shows the change in value of a $10,000 investment made in Class C shares of Pioneer Global Sustainable Value Fund during the periods shown, compared to that of the MSCI All Country World Value NR Index.*
Average Annual Total Returns
(As of September 30, 2023) |
| Period | If
Held | If
Redeemed | MSCI All
Country
World
Value
NR Index |
Life of Class
(5/10/21)* | 1.12% | 1.12% | -0.80% |
| 1 Year | 22.85 | 21.85 | 16.98 |
Expense Ratio
(Per prospectus dated February 1, 2023) |
| Gross | Net |
| 12.61% | 1.75% |
Value of $10,000 Investment
Call 1-800-225-6292 or visit www.amundi.com/us for the most recent month-end performance results. Current performance may be lower or higher than the performance data quoted.
The performance data quoted represents past performance, which is no guarantee of future results. Investment return and principal value will fluctuate, and shares, when redeemed, may be worth more or less than their original cost.
Class C shares held for less than one year are subject to a 1% contingent deferred sales charge (CDSC). “If Held” results represent the percent change in net asset value per share. "If Redeemed" returns reflect the deduction of the CDSC for the one-year period, assuming a complete redemption of shares at the last price calculated on the last business day of the period, and no CDSC for the other time periods. All results are historical and assume the reinvestment of dividends and capital gains. Other share classes are available for which performance and expenses will differ.
Performance results reflect any applicable expense waivers in effect during the periods shown. Without such waivers Fund performance would be lower. Waivers may not be in effect for all funds. Certain fee waivers are contractual through a specified period. Otherwise, fee waivers can be rescinded at any time. See the prospectus and financial statements for more information.
The net expense ratio reflects the contractual expense limitation in effect through February 1, 2024 for Class C shares. There can be no assurance that Amundi US will extend the expense limitation beyond such time. Please see the prospectus for more information.
* Performance of Class C shares shown in the graph above is from the inception of Class C shares on 5/10/21 through 9/30/23. Index information shown in the graph above is from 5/31/21 through 9/30/23.
The performance table and graph do not reflect the deduction of fees and taxes that a shareowner would pay on Fund distributions or the redemption of Fund shares.
Please refer to the financial highlights for more current expense ratios.
Pioneer Global Sustainable Value Fund | Annual Report | 9/30/2317
| Performance Update | 9/30/23 | Class Y Shares |
Investment Returns
The mountain chart on the right shows the change in value of a $5 million investment made in Class Y shares of Pioneer Global Sustainable Value Fund during the periods shown, compared to that of the MSCI All Country World Value NR Index.*
Average Annual Total Returns
(As of September 30, 2023) |
| Period | Net
Asset
Value
(NAV) | MSCI All
Country
World
Value
NR Index |
Life of Class
(5/10/21)* | 2.14% | -0.80% |
| 1 Year | 24.15 | 16.98 |
Expense Ratio
(Per prospectus dated February 1, 2023) |
| Gross | Net |
| 11.63% | 0.70% |
Value of $5 Million Investment
Call 1-800-225-6292 or visit www.amundi.com/us for the most recent month-end performance results. Current performance may be lower or higher than the performance data quoted.
The performance data quoted represents past performance, which is no guarantee of future results. Investment return and principal value will fluctuate, and shares, when redeemed, may be worth more or less than their original cost.
Class Y shares are not subject to sales charges and are available for limited groups of eligible investors, including institutional investors. All results are historical and assume the reinvestment of dividends and capital gains. Other share classes are available for which performance and expenses will differ.
Performance results reflect any applicable expense waivers in effect during the periods shown. Without such waivers Fund performance would be lower. Waivers may not be in effect for all funds. Certain fee waivers are contractual through a specified period. Otherwise, fee waivers can be rescinded at any time. See the prospectus and financial statements for more information.
The net expense ratio reflects the contractual expense limitation in effect through February 1, 2024 for Class Y shares. There can be no assurance that Amundi US will extend the expense limitation beyond such time. Please see the prospectus and financial statements for more information.
* Performance of Class Y shares shown in the graph above is from the inception of Class Y shares on 5/10/21 through 9/30/23. Index information shown in the graph above is from 5/31/21 through 9/30/23.
The performance table and graph do not reflect the deduction of fees and taxes that a shareowner would pay on Fund distributions or the redemption of Fund shares.
Please refer to the financial highlights for more current expense ratios.
18Pioneer Global Sustainable Value Fund | Annual Report | 9/30/23
Comparing Ongoing Fund Expenses
As a shareowner in the Fund, you incur two types of costs:
| (1) | ongoing costs, including management fees, distribution and/or service (12b-1) fees, and other Fund expenses; and |
| (2) | transaction costs, including sales charges (loads) on purchase payments. |
This example is intended to help you understand your ongoing expenses (in dollars) of investing in the Fund and to compare these costs with the ongoing costs of investing in other mutual funds. The example is based on an investment of $1,000 at the beginning of the Fund’s latest six-month period and held throughout the six months.
Using the Tables
Actual Expenses
The first table below provides information about actual account values and actual expenses. You may use the information in this table, together with the amount you invested, to estimate the expenses that you paid over the period as follows:
| (1) | Divide your account value by $1,000
Example: an $8,600 account value ÷ $1,000 = 8.6 |
| (2) | Multiply the result in (1) above by the corresponding share class’s number in the third row under the heading entitled “Expenses Paid During Period” to estimate the expenses you paid on your account during this period. |
Expenses Paid on a $1,000 Investment in Pioneer Global Sustainable Value Fund
Based on actual returns from April 1, 2023 through September 30, 2023.
| Share Class | A | C | Y |
Beginning Account
Value on 4/1/23 | $1,000.00 | $1,000.00 | $1,000.00 |
Ending Account Value
(after expenses) on 9/30/23 | $1,019.20 | $1,015.20 | $1,020.20 |
Expenses Paid
During Period* | $5.06 | $8.64 | $3.55 |
| | |
| * | Expenses are equal to the Fund’s annualized expense ratio of 1.00%, 1.71%, and 0.70% for Class A, Class C, and Class Y shares, respectively, multiplied by the average account value over the period, multiplied by 183/365 (to reflect the partial year period). |
Pioneer Global Sustainable Value Fund | Annual Report | 9/30/2319
Comparing Ongoing Fund Expenses (continued)
Hypothetical Example for Comparison Purposes
The table below provides information about hypothetical account values and hypothetical expenses based on the Fund’s actual expense ratio and an assumed rate of return of 5% per year before expenses, which is not the Fund’s actual return. The hypothetical account values and expenses may not be used to estimate the actual ending account balance or expenses you paid for the period.
You may use this information to compare the ongoing costs of investing in the Fund and other funds. To do so, compare this 5% hypothetical example with the 5% hypothetical examples that appear in the shareholder reports of the other funds.
Please note that the expenses shown in the tables are meant to highlight your ongoing costs only and do not reflect any transaction costs, such as sales charges (loads) that are charged at the time of the transaction. Therefore, the table below is useful in comparing ongoing costs only and will not help you determine the relative total costs of owning different funds. In addition, if these transaction costs were included, your costs would have been higher.
Expenses Paid on a $1,000 Investment in Pioneer Global Sustainable Value Fund
Based on a hypothetical 5% return per year before expenses, reflecting the period from April 1, 2023 through September 30, 2023.
| Share Class | A | C | Y |
Beginning Account
Value on 4/1/23 | $1,000.00 | $1,000.00 | $1,000.00 |
Ending Account Value
(after expenses) on 9/30/23 | $1,020.05 | $1,016.50 | $1,021.56 |
Expenses Paid
During Period* | $5.06 | $8.64 | $3.55 |
| | |
| * | Expenses are equal to the Fund’s annualized expense ratio of 1.00%, 1.71%, and 0.70% for Class A, Class C, and Class Y shares, respectively, multiplied by the average account value over the period, multiplied by 183/365 (to reflect the partial year period). |
20Pioneer Global Sustainable Value Fund | Annual Report | 9/30/23
Schedule of Investments | 9/30/23
| Shares | | | | | | Value |
| | UNAFFILIATED ISSUERS — 99.1% | |
| | Common Stocks — 95.2% of Net Assets | |
| | Aerospace & Defense — 1.8% | |
| 1,399 | Hensoldt AG | $ 41,273 |
| | Total Aerospace & Defense | $41,273 |
|
|
| | Air Freight & Logistics — 1.1% | |
| 168 | United Parcel Service, Inc., Class B | $ 26,186 |
| | Total Air Freight & Logistics | $26,186 |
|
|
| | Automobile Components — 1.0% | |
| 600 | Bridgestone Corp. | $ 23,385 |
| | Total Automobile Components | $23,385 |
|
|
| | Automobiles — 1.1% | |
| 1,300 | Subaru Corp. | $ 25,253 |
| | Total Automobiles | $25,253 |
|
|
| | Banks — 12.1% | |
| 2,499 | ABN AMRO Bank NV (C.V.A.) (144A) | $ 35,385 |
| 873 | Citizens Financial Group, Inc. | 23,396 |
| 4,100 | Grupo Financiero Banorte S.A.B de CV, Class O | 34,374 |
| 938 | Hana Financial Group, Inc. | 29,499 |
| 1,634 | KB Financial Group, Inc. (A.D.R.) | 67,174 |
| 600 | Sumitomo Mitsui Financial Group, Inc. | 29,414 |
| 844 | Truist Financial Corp. | 24,147 |
| 1,401 | UniCredit S.p.A. | 33,525 |
| | Total Banks | $276,914 |
|
|
| | Biotechnology — 2.2% | |
| 337 | AbbVie, Inc. | $ 50,233 |
| | Total Biotechnology | $50,233 |
|
|
| | Broadline Retail — 3.3% | |
| 4,600(a) | Alibaba Group Holding, Ltd. | $ 49,870 |
| 563 | eBay, Inc. | 24,823 |
| | Total Broadline Retail | $74,693 |
|
|
| | Capital Markets — 5.4% | |
| 587 | Bank of New York Mellon Corp. | $ 25,035 |
| 472 | State Street Corp. | 31,605 |
| 2,708 | UBS Group AG | 66,936 |
| | Total Capital Markets | $123,576 |
|
|
| | Chemicals — 0.5% | |
| 351 | Mosaic Co. | $ 12,496 |
| | Total Chemicals | $12,496 |
|
|
The accompanying notes are an integral part of these financial statements.
Pioneer Global Sustainable Value Fund | Annual Report | 9/30/2321
Schedule of Investments | 9/30/23 (continued)
| Shares | | | | | | Value |
| | Communications Equipment — 2.9% | |
| 1,219 | Cisco Systems, Inc. | $ 65,533 |
| | Total Communications Equipment | $65,533 |
|
|
| | Construction & Engineering — 0.8% | |
| 39,000 | Sinopec Engineering Group Co., Ltd., Class H | $ 17,546 |
| | Total Construction & Engineering | $17,546 |
|
|
| | Construction Materials — 2.2% | |
| 903 | CRH Plc | $ 49,805 |
| | Total Construction Materials | $49,805 |
|
|
| | Consumer Staples Distribution & Retail — 0.0%† | |
| 268 +# | Magnit PJSC | $ 767 |
| | Total Consumer Staples Distribution & Retail | $767 |
|
|
| | Diversified Telecommunication Services — 1.0% | |
| 1,056 | Deutsche Telekom AG | $ 22,175 |
| | Total Diversified Telecommunication Services | $22,175 |
|
|
| | Electric Utilities — 1.9% | |
| 1,307 | FirstEnergy Corp. | $ 44,673 |
| | Total Electric Utilities | $44,673 |
|
|
| | Electrical Equipment — 1.7% | |
| 157(a) | Generac Holdings, Inc. | $ 17,107 |
| 1,800 | Mitsubishi Electric Corp. | 22,253 |
| | Total Electrical Equipment | $39,360 |
|
|
| | Financial Services — 0.9% | |
| 363(a) | PayPal Holdings, Inc. | $ 21,221 |
| | Total Financial Services | $21,221 |
|
|
| | Food Products — 1.3% | |
| 1,171 | Associated British Foods Plc | $ 29,433 |
| | Total Food Products | $29,433 |
|
|
| | Health Care Equipment & Supplies — 2.2% | |
| 367 | Medtronic Plc | $ 28,758 |
| 1,784 | Smith & Nephew Plc | 22,175 |
| | Total Health Care Equipment & Supplies | $50,933 |
|
|
| | Health Care Providers & Services — 4.7% | |
| 652 | Cardinal Health, Inc. | $ 56,607 |
| 90 | Cigna Group | 25,746 |
| 53 | Humana, Inc. | 25,786 |
| | Total Health Care Providers & Services | $108,139 |
|
|
The accompanying notes are an integral part of these financial statements.
22Pioneer Global Sustainable Value Fund | Annual Report | 9/30/23
| Shares | | | | | | Value |
| | Hotels, Restaurants & Leisure — 0.9% | |
| 6,800(a) | Sands China, Ltd. | $ 20,679 |
| | Total Hotels, Restaurants & Leisure | $20,679 |
|
|
| | Household Durables — 2.7% | |
| 2,600 | Panasonic Holdings Corp. | $ 29,236 |
| 2,527 | Persimmon Plc | 33,083 |
| | Total Household Durables | $62,319 |
|
|
| | Household Products — 1.0% | |
| 311 | Reckitt Benckiser Group Plc | $ 21,979 |
| | Total Household Products | $21,979 |
|
|
| | Industrial Conglomerates — 1.1% | |
| 400 | Hitachi, Ltd. | $ 24,798 |
| | Total Industrial Conglomerates | $24,798 |
|
|
| | Insurance — 5.2% | |
| 138 | Chubb, Ltd. | $ 28,729 |
| 307 | Hartford Financial Services Group, Inc. | 21,769 |
| 6,000 | Ping An Insurance Group Co. of China, Ltd., Class H | 33,985 |
| 164 | Willis Towers Watson Plc | 34,270 |
| | Total Insurance | $118,753 |
|
|
| | IT Services — 2.5% | |
| 401 | International Business Machines Corp. | $ 56,260 |
| | Total IT Services | $56,260 |
|
|
| | Machinery — 1.2% | |
| 500 | Mitsubishi Heavy Industries, Ltd. | $ 28,013 |
| | Total Machinery | $28,013 |
|
|
| | Metals & Mining — 4.8% | |
| 2,616 | Barrick Gold Corp. | $ 38,063 |
| 394 | Rio Tinto Plc | 24,750 |
| 1,099 | Teck Resources, Ltd., Class B | 47,356 |
| | Total Metals & Mining | $110,169 |
|
|
| | Multi-Utilities — 2.0% | |
| 1,007 | Dominion Energy, Inc. | $ 44,983 |
| | Total Multi-Utilities | $44,983 |
|
|
| | Oil, Gas & Consumable Fuels — 14.8% | |
| 1,554 | BP Plc (A.D.R.) | $ 60,171 |
| 276 | Chesapeake Energy Corp. | 23,799 |
| 1,932 | Energy Transfer LP | 27,106 |
| 1,900 | Inpex Corp. | 28,514 |
| 875 | Marathon Oil Corp. | 23,406 |
| 1,054 | Occidental Petroleum Corp. | 68,384 |
The accompanying notes are an integral part of these financial statements.
Pioneer Global Sustainable Value Fund | Annual Report | 9/30/2323
Schedule of Investments | 9/30/23 (continued)
| Shares | | | | | | Value |
| | Oil, Gas & Consumable Fuels — (continued) | |
| 1,738 | Permian Resources Corp. | $ 24,262 |
| 748 | Range Resources Corp. | 24,243 |
| 4,480 +# | Rosneft Oil Co. PJSC | 1,248 |
| 890 | Shell Plc (A.D.R.) | 57,298 |
| | Total Oil, Gas & Consumable Fuels | $338,431 |
|
|
| | Pharmaceuticals — 5.8% | |
| 1,341 | GSK Plc | $ 24,242 |
| 2,557 | Pfizer, Inc. | 84,816 |
| 223 | Sanofi | 23,928 |
| | Total Pharmaceuticals | $132,986 |
|
|
| | Technology Hardware, Storage & Peripherals — 1.8% | |
| 42,000 | Lenovo Group, Ltd. | $ 42,198 |
| | Total Technology Hardware, Storage & Peripherals | $42,198 |
|
|
| | Trading Companies & Distributors — 3.3% | |
| 748(a) | AerCap Holdings NV | $ 46,877 |
| 800 | Mitsui & Co., Ltd. | 28,995 |
| | Total Trading Companies & Distributors | $75,872 |
|
|
| | Total Common Stocks
(Cost $2,188,048) | $2,181,034 |
|
|
Principal
Amount
USD ($) | | | | | | |
| | U.S. Government and Agency Obligations —
3.9% of Net Assets | |
| 40,000(b) | U.S. Treasury Bills, 10/3/23 | $ 39,994 |
| 50,000(b) | U.S. Treasury Bills, 10/17/23 | 49,890 |
| | Total U.S. Government and Agency Obligations
(Cost $89,871) | $89,884 |
|
|
| | TOTAL INVESTMENTS IN UNAFFILIATED ISSUERS — 99.1%
(Cost $2,277,919) | $2,270,918 |
| | OTHER ASSETS AND LIABILITIES — 0.9% | $ 20,135 |
| | net assets — 100.0% | $2,291,053 |
| | | | | | | |
The accompanying notes are an integral part of these financial statements.
24Pioneer Global Sustainable Value Fund | Annual Report | 9/30/23
| (A.D.R.) | American Depositary Receipts. |
| (C.V.A.) | Certificaaten van aandelen (Share Certificates). |
| (144A) | The resale of such security is exempt from registration under Rule 144A of the Securities Act of 1933. Such security may be resold normally to qualified institutional buyers. At September 30, 2023, the value of these securities amounted to $35,385, or 1.5% of net assets. |
| (a) | Non-income producing security. |
| (b) | Security issued with a zero coupon. Income is recognized through accretion of discount. |
| + | Security is valued using significant unobservable inputs (Level 3). |
| † | Amount rounds to less than 0.1%. |
| # | Securities are restricted as to resale. |
| Restricted Securities | Acquisition date | Cost | Value |
| Magnit PJSC | 5/10/2021 | $19,543 | $ 767 |
| Rosneft Oil Co. PJSC | 6/23/2021 | 37,564 | 1,248 |
| Total Restricted Securities | | | $2,015 |
| % of Net assets | | | 0.1% |
Distribution of investments by country of domicile (excluding short-term investments) as a percentage of total investments in securities, is as follows:
| United States | 42.4% |
| United Kingdom | 13.5% |
| Japan | 10.6% |
| China | 6.3% |
| Ireland | 5.5% |
| South Korea | 4.3% |
| Switzerland | 4.2% |
| Canada | 3.8% |
| Germany | 2.8% |
| Netherlands | 1.6% |
| Mexico | 1.5% |
| Italy | 1.5% |
| France | 1.0% |
| Other (individually less than 1%) | 1.0% |
| | 100.0% |
Purchases and sales of securities (excluding short-term investments) for the year ended September 30, 2023, aggregated $1,823,670 and $1,767,244, respectively.
The accompanying notes are an integral part of these financial statements.
Pioneer Global Sustainable Value Fund | Annual Report | 9/30/2325
Schedule of Investments | 9/30/23 (continued)
At September 30, 2023, the net unrealized depreciation on investments based on cost for federal tax purposes of $2,282,424 was as follows:
| Aggregate gross unrealized appreciation for all investments in which there is an excess of value over tax cost | $ 252,133 |
| Aggregate gross unrealized depreciation for all investments in which there is an excess of tax cost over value | (263,639) |
| Net unrealized depreciation | $ (11,506) |
Various inputs are used in determining the value of the Fund's investments. These inputs are summarized in the three broad levels below.
| Level 1 | – | unadjusted quoted prices in active markets for identical securities. |
| Level 2 | – | other significant observable inputs (including quoted prices for similar securities, interest rates, prepayment speeds, credit risks, etc.). See Notes to Financial Statements — Note 1A. |
| Level 3 | – | significant unobservable inputs (including the Adviser's own assumptions in determining fair value of investments). See Notes to Financial Statements — Note 1A. |
The following is a summary of the inputs used as of September 30, 2023, in valuing the Fund's investments:
| | Level 1 | Level 2 | Level 3 | Total |
| Common Stocks | | | | |
| Air Freight & Logistics | $ 26,186 | $ — | $ — | $ 26,186 |
| Banks | 149,091 | 127,823 | — | 276,914 |
| Biotechnology | 50,233 | — | — | 50,233 |
| Broadline Retail | 24,823 | 49,870 | — | 74,693 |
| Capital Markets | 56,640 | 66,936 | — | 123,576 |
| Chemicals | 12,496 | — | — | 12,496 |
| Communications Equipment | 65,533 | — | — | 65,533 |
| Consumer Staples Distribution & Retail | — | — | 767 | 767 |
| Electric Utilities | 44,673 | — | — | 44,673 |
| Electrical Equipment | 17,107 | 22,253 | — | 39,360 |
| Financial Services | 21,221 | — | — | 21,221 |
| Health Care Equipment & Supplies | 28,758 | 22,175 | — | 50,933 |
| Health Care Providers & Services | 108,139 | — | — | 108,139 |
| Insurance | 84,768 | 33,985 | — | 118,753 |
| IT Services | 56,260 | — | — | 56,260 |
| Metals & Mining | 85,419 | 24,750 | — | 110,169 |
| Multi-Utilities | 44,983 | — | — | 44,983 |
| Oil, Gas & Consumable Fuels | 308,669 | 28,514 | 1,248 | 338,431 |
| Pharmaceuticals | 84,816 | 48,170 | — | 132,986 |
| Trading Companies & Distributors | 46,877 | 28,995 | — | 75,872 |
The accompanying notes are an integral part of these financial statements.
26Pioneer Global Sustainable Value Fund | Annual Report | 9/30/23
| | Level 1 | Level 2 | Level 3 | Total |
| All Other Common Stocks | $ — | $408,856 | $ — | $ 408,856 |
| U.S. Government and Agency Obligations | — | 89,884 | — | 89,884 |
| Total Investments in Securities | $1,316,692 | $ 952,211 | $ 2,015 | $2,270,918 |
During the year ended September 30, 2023, there were no significant transfers in or out of Level 3.
The accompanying notes are an integral part of these financial statements.
Pioneer Global Sustainable Value Fund | Annual Report | 9/30/2327
Statement of Assets and Liabilities | 9/30/23
| ASSETS: | |
| Investments in unaffiliated issuers, at value (cost $2,277,919) | $2,270,918 |
| Cash | 61,536 |
| Foreign currencies, at value (cost $5) | 5 |
| Receivables — | |
| Dividends | 4,973 |
| Due from the Adviser | 1,459 |
| Other assets | 18,073 |
| Total assets | $2,356,964 |
| LIABILITIES: | |
| Payables — | |
| Trustees' fees | $ 19 |
| Professional fees | 55,829 |
| Printing expense | 9,623 |
| Management fees | 164 |
| Administrative expenses | 61 |
| Distribution fees | 93 |
| Accrued expenses | 122 |
| Total liabilities | $ 65,911 |
| NET ASSETS: | |
| Paid-in capital | $2,267,444 |
| Distributable earnings | 23,609 |
| Net assets | $ 2,291,053 |
| NET ASSET VALUE PER SHARE: | |
| No par value (unlimited number of shares authorized) | |
| Class A (based on $768,925/76,143 shares) | $ 10.10 |
| Class C (based on $657,046/65,511 shares) | $ 10.03 |
| Class Y (based on $865,082/85,554 shares) | $ 10.11 |
| MAXIMUM OFFERING PRICE PER SHARE: | |
| Class A (based on $10.10 net asset value per share/100%-5.75% maximum sales charge) | $ 10.72 |
The accompanying notes are an integral part of these financial statements.
28Pioneer Global Sustainable Value Fund | Annual Report | 9/30/23
Statement of Operations FOR THE YEAR ENDED 9/30/23
| INVESTMENT INCOME: | | |
| Dividends from unaffiliated issuers (net of foreign taxes withheld $7,038) | $ 67,851 | |
| Interest from unaffiliated issuers | 654 | |
| Total Investment Income | | $ 68,505 |
| EXPENSES: | | |
| Management fees | $ 14,556 | |
| Administrative expenses | 10,617 | |
| Transfer agent fees | | |
| Class A | 132 | |
| Class C | 30 | |
| Class Y | 39 | |
| Distribution fees | | |
| Class A | 1,902 | |
| Class C | 6,355 | |
| Shareowner communications expense | 336 | |
| Custodian fees | 83 | |
| Registration fees | 51,074 | |
| Professional fees | 96,791 | |
| Printing expense | 33,865 | |
| Officers' and Trustees' fees | 8,025 | |
| Insurance expense | 25 | |
| Miscellaneous | 2,674 | |
| Total expenses | | $ 226,504 |
| Less fees waived and expenses reimbursed by the Adviser | | (202,117) |
| Net expenses | | $ 24,387 |
| Net investment income | | $ 44,118 |
| REALIZED AND UNREALIZED GAIN (LOSS) ON INVESTMENTS: | | |
| Net realized gain (loss) on: | | |
| Investments in unaffiliated issuers | $ 47,537 | |
| Other assets and liabilities denominated in foreign currencies | (1,317) | $ 46,220 |
| Change in net unrealized appreciation (depreciation) on: | | |
| Investments in unaffiliated issuers | $344,543 | |
| Other assets and liabilities denominated in foreign currencies | 129 | $ 344,672 |
| Net realized and unrealized gain (loss) on investments | | $ 390,892 |
| Net increase in net assets resulting from operations | | $ 435,010 |
The accompanying notes are an integral part of these financial statements.
Pioneer Global Sustainable Value Fund | Annual Report | 9/30/2329
Statements of Changes in Net Assets
| | Year
Ended
9/30/23 | Year
Ended
9/30/22 |
| FROM OPERATIONS: | | |
| Net investment income (loss) | $ 44,118 | $ 42,406 |
| Net realized gain (loss) on investments | 46,220 | (24,798) |
| Change in net unrealized appreciation (depreciation) on investments | 344,672 | (286,667) |
| Net increase (decrease) in net assets resulting from operations | $ 435,010 | $ (269,059) |
| DISTRIBUTIONS TO SHAREOWNERS: | | |
| Class A ($0.21 and $0.12 per share, respectively) | $ (16,032) | $ (7,641) |
| Class C ($0.15 and $0.08 per share, respectively) | (9,079) | (5,016) |
| Class Y ($0.24 and $0.15 per share, respectively) | (20,026) | (12,004) |
| Total distributions to shareowners | $ (45,137) | $ (24,661) |
| FROM FUND SHARE TRANSACTIONS: | | |
| Net proceeds from sales of shares | $ 93,718 | $ 183,746 |
| Reinvestment of distributions | 45,137 | 24,661 |
| Cost of shares repurchased | (81,445) | (17,648) |
| Net increase in net assets resulting from Fund share transactions | $ 57,410 | $ 190,759 |
| Net increase (decrease) in net assets | $ 447,283 | $ (102,961) |
| NET ASSETS: | | |
| Beginning of year | $1,843,770 | $1,946,731 |
| End of year | $ 2,291,053 | $1,843,770 |
| | Year
Ended
9/30/23
Shares | Year
Ended
9/30/23
Amount | Year
Ended
9/30/22
Shares | Year
Ended
9/30/22
Amount |
| Class A | | | | |
| Shares sold | 6,709 | $ 67,098 | 14,532 | $145,446 |
| Reinvestment of distributions | 1,691 | 16,032 | 770 | 7,641 |
| Less shares repurchased | (7,692) | (76,589) | (889) | (8,595) |
| Net increase | 708 | $ 6,541 | 14,413 | $144,492 |
| Class C | | | | |
| Shares sold | 2,107 | $ 21,620 | 1,938 | $ 18,689 |
| Reinvestment of distributions | 960 | 9,079 | 506 | 5,016 |
| Less shares repurchased | — | — | — | 61 |
| Net increase | 3,067 | $ 30,699 | 2,444 | $ 23,766 |
| Class Y | | | | |
| Shares sold | 479 | $ 5,000 | 2,243 | $ 19,611 |
| Reinvestment of distributions | 2,115 | 20,026 | 1,212 | 12,004 |
| Less shares repurchased | (480) | (4,856) | (1,015) | (9,114) |
| Net increase | 2,114 | $ 20,170 | 2,440 | $ 22,501 |
The accompanying notes are an integral part of these financial statements.
30Pioneer Global Sustainable Value Fund | Annual Report | 9/30/23
| | Year
Ended
9/30/23 | Year
Ended
9/30/22 | 5/10/21* to
9/30/21 |
| Class A | | | |
| Net asset value, beginning of period | $ 8.34 | $ 9.64 | $ 10.00 |
| Increase (decrease) from investment operations: | | | |
| Net investment income (loss) (a) | $ 0.20 | $ 0.21 | $ 0.08 |
| Net realized and unrealized gain (loss) on investments | 1.77 | (1.39) | (0.44) |
| Net increase (decrease) from investment operations | $ 1.97 | $ (1.18) | $ (0.36) |
| Distributions to shareowners: | | | |
| Net investment income | $ (0.21) | $ (0.12) | $ — |
| Total distributions | $ (0.21) | $ (0.12) | $ — |
| Net increase (decrease) in net asset value | $ 1.76 | $ (1.30) | $ (0.36) |
| Net asset value, end of period | $10.10 | $ 8.34 | $ 9.64 |
| Total return (b) | 23.82% | (12.40)% | (3.60)%(c) |
| Ratio of net expenses to average net assets | 1.00% | 0.99% | 0.94%(d) |
| Ratio of net investment income (loss) to average net assets | 2.06% | 2.24% | 1.99%(d) |
| Portfolio turnover rate | 81% | 68% | 26%(c) |
| Net assets, end of period (in thousands) | $ 769 | $ 629 | $ 588 |
| Ratios with no waiver of fees and assumption of expenses by the Adviser and no reduction for fees paid indirectly: | | | |
| Total expenses to average net assets | 10.02% | 11.90% | 13.75%(d) |
| Net investment income (loss) to average net assets | (6.96)% | (8.67)% | (10.82)%(d) |
| * | Class A commenced operations on May 10, 2021. |
| (a) | The per-share data presented above is based on the average shares outstanding for the period presented. |
| (b) | Assumes initial investment at net asset value at the beginning of each period, reinvestment of all distributions, the complete redemption of the investment at net asset value at the end of each period and no sales charges. Total return would be reduced if sales charges were taken into account. |
| (c) | Not annualized. |
| (d) | Annualized. |
The accompanying notes are an integral part of these financial statements.
Pioneer Global Sustainable Value Fund | Annual Report | 9/30/2331
Financial Highlights (continued)
| | Year
Ended
9/30/23 | Year
Ended
9/30/22 | 5/10/21* to
9/30/21 |
| Class C | | | |
| Net asset value, beginning of period | $ 8.29 | $ 9.61 | $ 10.00 |
| Increase (decrease) from investment operations: | | | |
| Net investment income (loss) (a) | $ 0.13 | $ 0.13 | $ 0.05 |
| Net realized and unrealized gain (loss) on investments | 1.76 | (1.37) | (0.44) |
| Net increase (decrease) from investment operations | $ 1.89 | $ (1.24) | $ (0.39) |
| Distributions to shareowners: | | | |
| Net investment income | $ (0.15) | $ (0.08) | $ — |
| Total distributions | $ (0.15) | $ (0.08) | $ — |
| Net increase (decrease) in net asset value | $ 1.74 | $ (1.32) | $ (0.39) |
| Net asset value, end of period | $10.03 | $ 8.29 | $ 9.61 |
| Total return (b) | 22.85% | (13.01)% | (3.90)%(c) |
| Ratio of net expenses to average net assets | 1.71% | 1.70% | 1.71%(d) |
| Ratio of net investment income (loss) to average net assets | 1.35% | 1.38% | 1.22%(d) |
| Portfolio turnover rate | 81% | 68% | 26%(c) |
| Net assets, end of period (in thousands) | $ 657 | $ 517 | $ 577 |
| Ratios with no waiver of fees and assumption of expenses by the Adviser and no reduction for fees paid indirectly: | | | |
| Total expenses to average net assets | 10.73% | 12.61% | 14.52%(d) |
| Net investment income (loss) to average net assets | (7.67)% | (9.53)% | (11.59)%(d) |
| * | Class C commenced operations on May 10, 2021. |
| (a) | The per-share data presented above is based on the average shares outstanding for the period presented. |
| (b) | Assumes initial investment at net asset value at the beginning of each period, reinvestment of all distributions, the complete redemption of the investment at net asset value at the end of each period and no sales charges. Total return would be reduced if sales charges were taken into account. |
| (c) | Not annualized. |
| (d) | Annualized. |
The accompanying notes are an integral part of these financial statements.
32Pioneer Global Sustainable Value Fund | Annual Report | 9/30/23
| | Year
Ended
9/30/23 | Year
Ended
9/30/22 | 5/10/21* to
9/30/21 |
| Class Y | | | |
| Net asset value, beginning of period | $ 8.35 | $ 9.65 | $ 10.00 |
| Increase (decrease) from investment operations: | | | |
| Net investment income (loss) (a) | $ 0.23 | $ 0.23 | $ 0.09 |
| Net realized and unrealized gain (loss) on investments | 1.77 | (1.38) | (0.44) |
| Net increase (decrease) from investment operations | $ 2.00 | $ (1.15) | $ (0.35) |
| Distributions to shareowners: | | | |
| Net investment income | $ (0.24) | $ (0.15) | $ — |
| Total distributions | $ (0.24) | $ (0.15) | $ — |
| Net increase (decrease) in net asset value | $ 1.76 | $ (1.30) | $ (0.35) |
| Net asset value, end of period | $10.11 | $ 8.35 | $ 9.65 |
| Total return (b) | 24.15% | (12.18)% | (3.50)%(c) |
| Ratio of net expenses to average net assets | 0.70% | 0.70% | 0.70%(d) |
| Ratio of net investment income (loss) to average net assets | 2.36% | 2.43% | 2.22%(d) |
| Portfolio turnover rate | 81% | 68% | 26%(c) |
| Net assets, end of period (in thousands) | $ 865 | $ 697 | $ 782 |
| Ratios with no waiver of fees and assumption of expenses by the Adviser and no reduction for fees paid indirectly: | | | |
| Total expenses to average net assets | 9.73% | 11.63% | 13.51%(d) |
| Net investment income (loss) to average net assets | (6.67)% | (8.50)% | (10.59)%(d) |
| * | Class Y commenced operations on May 10, 2021. |
| (a) | The per-share data presented above is based on the average shares outstanding for the period presented. |
| (b) | Assumes initial investment at net asset value at the beginning of each period, reinvestment of all distributions and the complete redemption of the investment at net asset value at the end of each period. |
| (c) | Not annualized. |
| (d) | Annualized. |
The accompanying notes are an integral part of these financial statements.
Pioneer Global Sustainable Value Fund | Annual Report | 9/30/2333
Notes to Financial Statements | 9/30/23
1. Organization and Significant Accounting Policies
Pioneer Global Sustainable Value Fund (the “Fund”) is one of five portfolios comprising Pioneer Series Trust XIV (the “Trust”), a Delaware statutory trust. The Fund is registered under the Investment Company Act of 1940, as amended (the "1940 Act") as a diversified, open end management investment company. The Fund’s investment objective is to seek long-term capital growth.
The Fund offers three classes of shares designated as Class A, Class C and Class Y shares. Class A, Class C and Class Y commenced operations on May 10, 2021. Each class of shares represents an interest in the same portfolio of investments of the Fund and has identical rights (based on relative net asset values) to assets and liquidation proceeds. Share classes can bear different rates of class-specific fees and expenses, such as transfer agent and distribution fees. Differences in class specific fees and expenses will result in differences in net investment income and, therefore, the payment of different dividends from net investment income earned by each class. The Amended and Restated Declaration of Trust of the Trust gives the Board of Trustees the flexibility to specify either per-share voting or dollar-weighted voting when submitting matters for shareowner approval. Under per-share voting, each share of a class of the Fund is entitled to one vote. Under dollar-weighted voting, a shareowner’s voting power is determined not by the number of shares owned, but by the dollar value of the shares on the record date. Each share class has exclusive voting rights with respect to matters affecting only that class, including with respect to the distribution plan for that class. There is no distribution plan for Class Y shares.
Amundi Asset Management US, Inc., an indirect, wholly owned subsidiary of Amundi and Amundi’s wholly owned subsidiary, Amundi USA, Inc., serves as the Fund’s investment adviser (the “Adviser”). Amundi Distributor US, Inc., an affiliate of the Adviser, serves as the Fund’s distributor (the “Distributor”).
In March 2020, FASB issued an Accounting Standard Update, ASU 2020-04, Reference Rate Reform (Topic 848) — Facilitation of the Effects of Reference Rate Reform on Financial Reporting (“ASU 2020-04”), which provides optional, temporary relief with respect to the financial reporting of contracts subject to certain types of modifications due to the planned discontinuation of the London Interbank Offered Rate (“LIBOR”) and other LIBOR-based reference rates at the end of 2021. The temporary relief provided by ASU 2020-04 is effective for certain reference rate-related
34Pioneer Global Sustainable Value Fund | Annual Report | 9/30/23
contract modifications that occur during the period from March 12, 2020 through December 31, 2023. Management is evaluating the impact of ASU 2020-04 on the Fund's investments, derivatives, debt and other contracts, if applicable, that will undergo reference rate-related modifications as a result of the reference rate reform.
The Fund is required to comply with Rule 18f-4 under the 1940 Act, which governs the use of derivatives by registered investment companies. Rule 18f-4 permits funds to enter into derivatives transactions (as defined in Rule 18f-4) and certain other transactions notwithstanding the restrictions on the issuance of “senior securities” under Section 18 of the 1940 Act. Rule 18f-4 requires a fund to establish and maintain a comprehensive derivatives risk management program, appoint a derivatives risk manager and comply with a relative or absolute limit on fund leverage risk calculated based on value-at-risk (“VaR”), unless the fund uses derivatives in only a limited manner (a "limited derivatives user"). The Fund is currently a limited derivatives user for purposes of Rule 18f-4.
The Fund is an investment company and follows investment company accounting and reporting guidance under U.S. Generally Accepted Accounting Principles (“U.S. GAAP”). U.S. GAAP requires the management of the Fund to make estimates and assumptions that affect the reported amounts of assets and liabilities, the disclosure of contingent assets and liabilities at the date of the financial statements, and the reported amounts of income, expenses and gain or loss on investments during the reporting period. Actual results could differ from those estimates.
The following is a summary of significant accounting policies followed by the Fund in the preparation of its financial statements:
| A. | Security Valuation |
| | The net asset value of the Fund is computed once daily, on each day the New York Stock Exchange (“NYSE”) is open, as of the close of regular trading on the NYSE. |
| | Equity securities that have traded on an exchange are valued by using the last sale price on the principal exchange where they are traded. Equity securities that have not traded on the date of valuation, or securities for which sale prices are not available, generally are valued using the mean between the last bid and asked prices or, if both last bid and asked prices are not available, at the last quoted bid price. Last sale and bid and asked prices are provided by independent third party pricing services. In the case of equity securities not traded on an exchange, prices are typically determined by independent third party pricing services using a variety of techniques and methods. |
Pioneer Global Sustainable Value Fund | Annual Report | 9/30/2335
| | The value of foreign securities is translated into U.S. dollars based on foreign currency exchange rate quotations supplied by a third party pricing source. Trading in non-U.S. equity securities is substantially completed each day at various times prior to the close of the NYSE. The values of such securities used in computing the net asset value of the Fund's shares are determined as of such times. The Adviser may use a fair value model developed by an independent pricing service to value non-U.S. equity securities. |
| | Forward foreign currency exchange contracts are valued daily using the foreign exchange rate or, for longer term forward contract positions, the spot currency rate and the forward points on a daily basis, in each case provided by a third party pricing service. Contracts whose forward settlement date falls between two quoted days are valued by interpolation. |
| | Shares of open-end registered investment companies (including money market mutual funds) are valued at such funds' net asset value. |
| | Securities for which independent pricing services or broker-dealers are unable to supply prices or for which market prices and/or quotations are not readily available or are considered to be unreliable are valued by a fair valuation team comprised of certain personnel of the Adviser. The Adviser is designated as the valuation designee for the Fund pursuant to Rule 2a-5 under the 1940 Act. The Adviser’s fair valuation team is responsible for monitoring developments that may impact fair valued securities. |
| | Inputs used when applying fair value methods to value a security may include credit ratings, the financial condition of the company, current market conditions and comparable securities. The Adviser may use fair value methods if it is determined that a significant event has occurred after the close of the exchange or market on which the security trades and prior to the determination of the Fund's net asset value. Examples of a significant event might include political or economic news, corporate restructurings, natural disasters, terrorist activity or trading halts. Thus, the valuation of the Fund's securities may differ significantly from exchange prices, and such differences could be material. |
| B. | Investment Income and Transactions |
| | Dividend income is recorded on the ex-dividend date, except that certain dividends from foreign securities where the ex-dividend date may have passed are recorded as soon as the Fund becomes aware of the ex-dividend data in the exercise of reasonable diligence. |
36Pioneer Global Sustainable Value Fund | Annual Report | 9/30/23
| | Interest and dividend income payable by delivery of additional shares is reclassified as PIK (payment-in-kind) income upon receipt and is included in interest and dividend income, respectively. |
| | Security transactions are recorded as of trade date. Gains and losses on sales of investments are calculated on the identified cost method for both financial reporting and federal income tax purposes. |
| C. | Foreign Currency Translation |
| | The books and records of the Fund are maintained in U.S. dollars. Amounts denominated in foreign currencies are translated into U.S. dollars using current exchange rates. |
| | Net realized gains and losses on foreign currency transactions, if any, represent, among other things, the net realized gains and losses on foreign currency exchange contracts, disposition of foreign currencies and the difference between the amount of income accrued and the U.S. dollars actually received. Further, the effects of changes in foreign currency exchange rates on investments are not segregated on the Statement of Operations from the effects of changes in the market prices of those securities, but are included with the net realized and unrealized gain or loss on investments. |
| D. | Federal Income Taxes |
| | It is the Fund's policy to comply with the requirements of the Internal Revenue Code applicable to regulated investment companies and to distribute all of its net taxable income and net realized capital gains, if any, to its shareowners. Therefore, no provision for federal income taxes is required. As of September 30, 2023, the Fund did not accrue any interest or penalties with respect to uncertain tax positions, which, if applicable, would be recorded as an income tax expense on the Statement of Operations. Tax returns filed within the prior three years remain subject to examination by federal and state tax authorities. |
| | The amount and character of income and capital gain distributions to shareowners are determined in accordance with federal income tax rules, which may differ from U.S. GAAP. Distributions in excess of net investment income or net realized gains are temporary over distributions for financial statement purposes resulting from differences in the recognition or classification of income or distributions for financial statement and tax purposes. Capital accounts within the financial statements are adjusted for permanent book/tax differences to reflect tax character, but are not adjusted for temporary differences. |
Pioneer Global Sustainable Value Fund | Annual Report | 9/30/2337
| | At September 30, 2023, the Fund reclassified $4 to increase distributable earnings and $4 to decrease paid-in capital to reflect permanent book/tax differences. These adjustments have no impact on net assets or the results of operations. |
| | At September 30, 2023, the Fund was permitted to carry forward indefinitely $0 of short-term losses and $3,918 of long-term losses. |
| | The tax character of distributions paid during the years ended September 30, 2023 and September 30, 2022, was as follows: |
| | 2023 | 2022 |
| Distributions paid from: | | |
| Ordinary income | $45,137 | $24,661 |
| Total | $45,137 | $24,661 |
The following shows the components of distributable earnings (losses) on a federal income tax basis at September 30, 2023:
| | 2023 |
| Distributable earnings/(losses): | |
| Undistributed ordinary income | $ 41,014 |
| Capital loss carryforward | (3,918) |
| Other book/tax temporary differences | (1,981) |
| Net unrealized depreciation | (11,506) |
| Total | $ 23,609 |
The differences between book-basis and tax-basis net unrealized depreciation are attributable to the tax deferral of losses on wash sales and tax basis differences on partnership holdings.
| E. | Fund Shares |
| | The Fund records sales and repurchases of its shares as of trade date. The Distributor earned $143 in underwriting commissions on the sale of Class A shares during the year ended September 30, 2023. |
| F. | Class Allocations |
| | Income, common expenses and realized and unrealized gains and losses are calculated at the Fund level and allocated daily to each class of shares based on its respective percentage of adjusted net assets at the beginning of the day. |
| | Distribution fees are calculated based on the average daily net asset value attributable to Class A and Class C shares of the Fund, respectively (see Note 5). Class Y shares do not pay distribution fees. All expenses and fees paid to the Fund's transfer agent for its services are |
38Pioneer Global Sustainable Value Fund | Annual Report | 9/30/23
| | allocated among the classes of shares based on the number of accounts in each class and the ratable allocation of related out-of-pocket expenses (see Note 4). |
| | Distributions to shareowners are recorded as of the ex-dividend date. Distributions paid by the Fund with respect to each class of shares are calculated in the same manner and at the same time, except that net investment income dividends to Class A, Class C and Class Y shares can reflect different transfer agent and distribution expense rates. |
| G. | Risks |
| | The value of securities held by the Fund may go up or down, sometimes rapidly or unpredictably, due to general market conditions, such as real or perceived adverse economic, political or regulatory conditions, recessions, the spread of infectious illness or other public health issues, inflation, changes in interest rates, armed conflict including Russia's military invasion of Ukraine, sanctions against Russia, other nations or individuals or companies and possible countermeasures, lack of liquidity in the bond markets or adverse investor sentiment. In the past several years, financial markets have experienced increased volatility, depressed valuations, decreased liquidity and heightened uncertainty. These conditions may continue, recur, worsen or spread. Inflation and interest rates have increased and may rise further. These circumstances could adversely affect the value and liquidity of the Fund's investments and negatively impact the Fund's performance. |
| | The long-term impact of the COVID-19 pandemic and its subsequent variants on economies, markets, industries and individual issuers, are not known. Some sectors of the economy and individual issuers have experienced or may experience particularly large losses. Periods of extreme volatility in the financial markets, reduced liquidity of many instruments, increased government debt, inflation, and disruptions to supply chains, consumer demand and employee availability, may continue for some time. Following Russia's invasion of Ukraine, Russian securities lost all, or nearly all, their market value. Other securities or markets could be similarly affected by past or future political, geopolitical or other events or conditions. |
| | Governments and central banks, including the U.S. Federal Reserve, have taken extraordinary and unprecedented actions to support local and global economies and the financial markets. These actions have resulted in significant expansion of public debt, including in the U.S. The consequences of high public debt, including its future impact on the economy and securities markets, may not be known for some time. |
Pioneer Global Sustainable Value Fund | Annual Report | 9/30/2339
| | The U.S. and other countries are periodically involved in disputes over trade and other matters, which may result in tariffs, investment restrictions and adverse impacts on affected companies and securities. For example, the U.S. has imposed tariffs and other trade barriers on Chinese exports, has restricted sales of certain categories of goods to China, and has established barriers to investments in China. Trade disputes may adversely affect the economies of the U.S. and its trading partners, as well as companies directly or indirectly affected and financial markets generally. If the political climate between the U.S. and China does not improve or continues to deteriorate, if China were to attempt unification of Taiwan by force, or if other geopolitical conflicts develop or get worse, economies, markets and individual securities may be severely affected both regionally and globally, and the value of the Fund's assets may go down. |
| | At times, the Fund’s investments may represent industries or industry sectors that are interrelated or have common risks, making the Fund more susceptible to any economic, political, or regulatory developments or other risks affecting those industries and sectors. |
| | Under normal circumstances, the Fund invests at least 80% of its net assets (plus the amount of borrowings, if any, for investment purposes) in securities of issuers that the Adviser believes adhere to the Fund’s ESG criteria. |
| | The Fund’s ESG criteria exclude securities of issuers in certain industries, and the Adviser considers ESG factors in making investment decisions. Excluding specific issuers limits the universe of investments available to the Fund as compared with other funds that do not consider ESG criteria or ESG factors, which may mean forgoing some investment opportunities available to funds that do not consider ESG criteria or ESG factors. Accordingly, the Fund may underperform other funds that do not utilize an investment strategy that considers ESG criteria or ESG factors. However, the strategy of seeking to identify companies with sustainable business models is believed to provide potential return and risk benefits, including the selection of issuers with fewer ESG-related risks. In considering ESG factors, the Adviser may use third party ESG ratings information that it believes to be reliable, but such information may not be accurate or complete, or may be biased. |
| | The Fund may invest in small- and mid-size companies. Compared to large companies, small- and mid-size companies, and the market for their equity securities, may be more sensitive to changes in earnings results and investor expectations or poor economic or market conditions, including those experienced during a recession, have more limited |
40Pioneer Global Sustainable Value Fund | Annual Report | 9/30/23
| | product lines, operating histories, markets or capital resources, may be dependent upon a limited management group, experience sharper swings in market values, have limited liquidity, be harder to value or to sell at the times and prices the Adviser thinks appropriate, and offer greater potential for gain and loss. |
| | Normally, the Fund invests at least a minimum percentage of its net assets in issuers located outside of the United States. The Fund’s investments in foreign markets and countries with limited developing markets may subject the Fund to a greater degree of risk than investments in a developed market. These risks include disruptive political or economic conditions, military conflicts and sanctions, terrorism, sustained economic downturns, financial instability, less liquid trading markets, extreme price volatility, currency risks, reduction of government or central bank support, inadequate accounting standards, tariffs, tax disputes or other tax burdens, nationalization or expropriation of assets, and the imposition of adverse governmental laws, arbitrary application of laws and regulations or lack of rule of law and investment and repatriation restrictions. Lack of information and less market regulation also may affect the value of these securities. Withholding and other non-U.S. taxes may decrease the Fund’s return. Non-U.S. issuers may be located in parts of the world that have historically been prone to natural disasters. Investing in depositary receipts is subject to many of the same risks as investing directly in non-U.S. issuers. Depositary receipts may involve higher expenses and may trade at a discount (or premium) to the underlying security. |
| | Russia launched a large-scale invasion of Ukraine on February 24, 2022. In response to the military action by Russia, various countries, including the U.S., the United Kingdom, and European Union issued broad-ranging economic sanctions against Russia and Belarus and certain companies and individuals. Since then, Russian securities have lost all, or nearly all, their market value, and many other issuers, securities and markets have been adversely affected. The United States and other countries may impose sanctions on other countries, companies and individuals in light of Russia’s military invasion. The extent and duration of the military action or future escalation of such hostilities, the extent and impact of existing and future sanctions, market disruptions and volatility, and the result of any diplomatic negotiations cannot be predicted. These and any related events could have a significant impact on the value and liquidity of certain Fund investments, on Fund performance and the value of an investment in the Fund, particularly with respect to securities and commodities, such as oil, natural gas and food commodities, as well as other sectors with exposure to Russian |
Pioneer Global Sustainable Value Fund | Annual Report | 9/30/2341
| | issuers or issuers in other countries affected by the invasion, and are likely to have collateral impacts on market sectors globally. |
| | With the increased use of technologies such as the Internet to conduct business, the Fund is susceptible to operational, information security and related risks. While the Fund’s Adviser has established business continuity plans in the event of, and risk management systems to prevent, limit or mitigate, such cyber-attacks, there are inherent limitations in such plans and systems, including the possibility that certain risks have not been identified. Furthermore, the Fund cannot control the cybersecurity plans and systems put in place by service providers to the Fund such as the Fund's custodian and accounting agent, and the Fund’s transfer agent. In addition, many beneficial owners of Fund shares hold them through accounts at broker-dealers, retirement platforms and other financial market participants over which neither the Fund nor the Adviser exercises control. Each of these may in turn rely on service providers to them, which are also subject to the risk of cyber-attacks. Cybersecurity failures or breaches at the Adviser or the Fund’s service providers or intermediaries have the ability to cause disruptions and impact business operations, potentially resulting in financial losses, interference with the Fund’s ability to calculate its net asset value, impediments to trading, the inability of Fund shareowners to effect share purchases, redemptions or exchanges or receive distributions, loss of or unauthorized access to private shareowner information and violations of applicable privacy and other laws, regulatory fines, penalties, reputational damage, or additional compliance costs. Such costs and losses may not be covered under any insurance. In addition, maintaining vigilance against cyber-attacks may involve substantial costs over time, and system enhancements may themselves be subject to cyber-attacks. |
| | The Fund’s prospectus contains unaudited information regarding the Fund’s principal risks. Please refer to that document when considering the Fund’s principal risks. |
2. Management Agreement
The Adviser manages the Fund’s portfolio. Management fees payable under the Fund’s Investment Management Agreement with the Adviser are calculated daily and paid monthly at the annual rate of 0.65% of the Fund’s average daily net assets up to $1 billion and 0.60% of the Fund’s average daily net assets over $1 billion. For the year ended September 30, 2023, the effective management fee (excluding waivers and/or assumption of expenses) was equivalent to 0.65% of the Fund’s average daily net assets.
42Pioneer Global Sustainable Value Fund | Annual Report | 9/30/23
The Adviser has contractually agreed to waive and/or reimburse ordinary operating expenses (ordinary operating expenses means all fund expenses other than taxes, brokerage commissions, acquired fund fees and expenses, and extraordinary expenses, such as litigation) of the Fund to the extent required to reduce Fund expenses to 1.00%, 1.75% and 0.70% of the average daily net assets attributable to Class A, Class C and Class Y shares, respectively. These expense limitations are in effect through February 1, 2024. There can be no assurance that the Adviser will extend the expense limitation agreement for a class of shares beyond the date referred to above. Fees waived and expenses reimbursed during the year ended September 30, 2023 are reflected on the Statement of Operations.
In addition, under the management and administration agreements, certain other services and costs, including accounting, regulatory reporting and insurance premiums, are paid by the Fund as administrative reimbursements. Reflected on the Statement of Assets and Liabilities is $164 in management fees payable to the Adviser at September 30, 2023.
3. Compensation of Officers and Trustees
The Fund pays an annual fee to its Trustees. The Adviser reimburses the Fund for fees paid to the Interested Trustees. Except for the chief compliance officer, the Fund does not pay any salary or other compensation to its officers. The Fund pays a portion of the chief compliance officer's compensation for his services as the Fund's chief compliance officer. Amundi US pays the remaining portion of the chief compliance officer's compensation. For the year ended September 30, 2023, the Fund paid $8,025 in Officers' and Trustees' compensation, which is reflected on the Statement of Operations as Officers' and Trustees' fees. At September 30, 2023, on its Statement of Assets and Liabilities, the Fund had a payable for Trustees' fees of $19 and a payable for administrative expenses of $61, which includes the payable for Officers' compensation.
4. Transfer Agent
BNY Mellon Investment Servicing (US) Inc. serves as the transfer agent to the Fund at negotiated rates. Transfer agent fees and payables shown on the Statement of Operations and the Statement of Assets and Liabilities, respectively, include sub-transfer agent expenses incurred through the Fund’s omnibus relationship contracts.
Pioneer Global Sustainable Value Fund | Annual Report | 9/30/2343
In addition, the Fund reimbursed the transfer agent for out-of-pocket expenses incurred by the transfer agent related to shareowner communications activities such as proxy and statement mailings, and outgoing phone calls. For the year ended September 30, 2023, such out-of-pocket expenses by class of shares were as follows:
| Shareowner Communications: | |
| Class A | $270 |
| Class C | 44 |
| Class Y | 22 |
| Total | $336 |
5. Distribution Plan
The Fund has adopted a distribution plan (the “Plan”) pursuant to Rule 12b-1 of the Investment Company Act of 1940 with respect to its Class A and Class C shares. Pursuant to the Plan, the Fund pays the Distributor 0.25% of the average daily net assets attributable to Class A shares as compensation for personal services and/or account maintenance services or distribution services with regard to Class A shares. Pursuant to the Plan, the Fund also pays the Distributor 1.00% of the average daily net assets attributable to Class C shares. The fee for Class C shares consists of a 0.25% service fee and a 0.75% distribution fee paid as compensation for personal services and/or account maintenance services or distribution services with regard to Class C shares. Reflected on the Statement of Assets and Liabilities is $93 in distribution fees payable to the Distributor at September 30, 2023.
In addition, redemptions of Class A and Class C shares may be subject to a contingent deferred sales charge (“CDSC”). A CDSC of 1.00% may be imposed on redemptions of certain net asset value purchases of Class A shares within 12 months of purchase. Redemptions of Class C shares within 12 months of purchase are subject to a CDSC of 1.00%, based on the lower of cost or market value of shares being redeemed. Shares purchased as part of an exchange remain subject to any CDSC that applied to the original purchase of those shares. There is no CDSC for Class Y shares. Proceeds from the CDSCs are paid to the Distributor. For the year ended September 30, 2023, CDSCs in the amount of $0 were paid to the Distributor.
44Pioneer Global Sustainable Value Fund | Annual Report | 9/30/23
Report of Independent Registered Public Accounting Firm
To the Board of Trustees of Pioneer Series Trust XIV and the Shareowners of Pioneer Global Sustainable Value Fund:
Opinion on the Financial Statements
We have audited the accompanying statement of assets and liabilities of Pioneer Global Sustainable Value Fund (the “Fund”) (one of the funds constituting Pioneer Series Trust XIV (the “Trust”)) including the schedule of investments, as of September 30, 2023, and the related statement of operations for the year then ended, the statements of changes in net assets for each of the two years in the period then ended and the financial highlights each of the two years in the period then ended and the period from May 10, 2021 (commencement of operations) through September 30, 2021 and the related notes (collectively referred to as the “financial statements”). In our opinion, the financial statements present fairly, in all material respects, the financial position of the Fund (one of the funds constituting Pioneer Series Trust XIV) at September 30, 2023, and the results of its operations for the year then ended, the changes in its net assets for each of the two years in the period then ended and its financial highlights for each of the two years in the period then ended and the period from May 10, 2021 (commencement of operations) through September 30, 2021, in conformity with U.S. generally accepted accounting principles.
Basis for Opinion
These financial statements are the responsibility of the Trust’s management. Our responsibility is to express an opinion on the Fund’s financial statements based on our audits. We are a public accounting firm registered with the Public Company Accounting Oversight Board (United States) (“PCAOB”) and are required to be independent with respect to the Company in accordance with the U.S. federal securities law and the applicable rules and regulations of the Securities and Exchange Commission and the PCAOB.
We conducted our audits in accordance with the standards of the PCAOB. Those standards require that we plan and perform the audit to obtain reasonable assurance about whether the financial statements are free of material misstatement, whether due to error or fraud. The Trust is not required to have, nor were we engaged to perform, an audit of the Trust’s internal control over financial reporting. As part of our audits, we are required to obtain an understanding of internal control over financial reporting, but not for the purpose of expressing an opinion on the
Pioneer Global Sustainable Value Fund | Annual Report | 9/30/2345
effectiveness of the Trust’s internal control over financial reporting. Accordingly, we express no such opinion.
Our audits included performing procedures to assess the risks of material misstatement of the financial statements, whether due to error or fraud, and performing procedures that respond to those risks. Such procedures included examining, on a test basis, evidence regarding the amounts and disclosures in the financial statements. Our procedures included confirmation of securities owned as of September 30, 2023, by correspondence with the custodian and brokers; when replies were not received from brokers, we performed other auditing procedures. Our audits also included evaluating the accounting principles used and significant estimates made by management, as well as evaluating the overall presentation of the financial statements. We believe that our audits provide a reasonable basis for our opinion.
We have served as the auditor of one or more investment companies in the Pioneer family of funds since 2017.
Boston, Massachusetts
November 28, 2023
46Pioneer Global Sustainable Value Fund | Annual Report | 9/30/23
Additional Information (unaudited)
For the year ended September 30, 2023, certain dividends paid by the Fund may be subject to a maximum tax rate of 20%, as provided for by the Jobs and Growth Tax Relief Reconciliation Act (the Act) of 2003. The Fund intends to designate up to the maximum amount of such dividends allowable under the Act, as taxed at a maximum rate of 20%. Complete information will be computed and reported in conjunction with your 2023 Form 1099-DIV.
The qualifying percentage of the Fund’s ordinary income dividends for the purpose of the corporate dividends received deduction was 48.08%.
For the fiscal year ended September 30, 2023, the Fund elected to pass through foreign tax credits of $6,916 and recognized foreign source income of $ 49,004.
Pioneer Global Sustainable Value Fund | Annual Report | 9/30/2347
Approval of Renewal of Investment Management Agreement
Amundi Asset Management US, Inc. (“Amundi US”) serves as the investment adviser to Pioneer Global Sustainable Value Fund (the “Fund”) pursuant to an investment management agreement between Amundi US and the Fund. In order for Amundi US to remain the investment adviser of the Fund, the Trustees of the Fund, including a majority of the Fund’s Independent Trustees, must determine annually whether to renew the investment management agreement for the Fund.
The contract review process began in January 2023 as the Trustees of the Fund agreed on, among other things, an overall approach and timeline for the process. Contract review materials were provided to the Trustees in March 2023, July 2023 and September 2023. In addition, the Trustees reviewed and discussed the Fund’s performance at regularly scheduled meetings throughout the year, and took into account other information related to the Fund provided to the Trustees at regularly scheduled meetings, in connection with the review of the Fund’s investment management agreement.
In March 2023, the Trustees, among other things, discussed the memorandum provided by Fund counsel that summarized the legal standards and other considerations that are relevant to the Trustees in their deliberations regarding the renewal of the investment management agreement, and reviewed and discussed the qualifications of the investment management teams for the Fund, as well as the level of investment by the Fund’s portfolio managers in the Fund. In July 2023, the Trustees, among other things, reviewed the Fund’s management fees and total expense ratios, the financial statements of Amundi US and its parent companies, profitability analyses provided by Amundi US, and analyses from Amundi US as to possible economies of scale. The Trustees also reviewed the profitability of the institutional business of Amundi US as compared to that of Amundi US’s fund management business, and considered the differences between the fees and expenses of the Fund and the fees and expenses of Amundi US’s institutional accounts, as well as the different services provided by Amundi US to the Fund and to the institutional accounts. The Trustees further considered contract review materials, including additional materials received in response to the Trustees’ request, in September 2023.
At a meeting held on September 19, 2023, based on their evaluation of the information provided by Amundi US and third parties, the Trustees of the Fund, including the Independent Trustees voting separately advised by independent counsel, unanimously approved the renewal of the investment
48Pioneer Global Sustainable Value Fund | Annual Report | 9/30/23
management agreement for another year. In approving the renewal of the investment management agreement, the Trustees considered various factors that they determined were relevant, including the factors described below. The Trustees did not identify any single factor as the controlling factor in determining to approve the renewal of the agreement.
Nature, Extent and Quality of Services
The Trustees considered the nature, extent and quality of the services that had been provided by Amundi US to the Fund, taking into account the investment objective and strategy of the Fund. The Trustees also reviewed Amundi US’s investment approach for the Fund and its research process. The Trustees considered Amundi US’ integration of environmental, social and governance (ESG) considerations into its investment research process. The Trustees considered the resources of Amundi US and the personnel of Amundi US who provide investment management services to the Fund. They also reviewed the amount of non-Fund assets managed by the portfolio managers of the Fund. They considered the non-investment resources and personnel of Amundi US that are involved in Amundi US’s services to the Fund, including Amundi US’s compliance, risk management, and legal resources and personnel. The Trustees considered the compliance services being provided to the Fund by Amundi US and how Amundi US has addressed any compliance issues during the past year. The Trustees noted the substantial attention and high priority given by Amundi US’s senior management to the Pioneer Fund complex, including with respect to the increasing regulation to which the Pioneer Funds are subject.
The Trustees considered that Amundi US supervises and monitors the performance of the Fund’s service providers and provides the Fund with personnel (including Fund officers) and other resources that are necessary for the Fund’s business management and operations. The Trustees also considered that, as administrator, Amundi US is responsible for the administration of the Fund’s business and other affairs. The Trustees considered that the Fund reimburses Amundi US its pro rata share of Amundi US’s costs of providing administration services to the Pioneer Funds.
Based on these considerations, the Trustees concluded that the nature, extent and quality of services that had been provided by Amundi US to the Fund were satisfactory and consistent with the terms of the investment management agreement.
Performance of the Fund
In considering the Fund’s performance, the Trustees regularly review and discuss throughout the year data prepared by Amundi US and information
Pioneer Global Sustainable Value Fund | Annual Report | 9/30/2349
comparing the Fund’s performance with the performance of its peer group of funds, as classified by Morningstar, Inc. (Morningstar), and with the performance of the Fund’s benchmark index. They also discuss the Fund’s performance with Amundi US on a regular basis. The Trustees’ regular reviews and discussions were factored into the Trustees’ deliberations concerning the renewal of the investment management agreement.
Management Fee and Expenses
The Trustees considered information showing the fees and expenses of the Fund in comparison to the management fees of its peer group of funds as classified by Morningstar and also to the expense ratios of a peer group of funds selected on the basis of criteria determined by the Independent Trustees for this purpose using data provided by Strategic Insight Mutual Fund Research and Consulting, LLC (Strategic Insight), an independent third party. The peer group comparisons referred to below are organized in quintiles. Each quintile represents one-fifth of the peer group. In all peer group comparisons referred to below, first quintile is most favorable to the Fund’s shareowners. The Trustees noted that they separately review and consider the impact of the Fund’s transfer agency and Fund- and Amundi US-paid expenses for sub-transfer agency and intermediary arrangements, and that the results of the most recent such review were considered in the consideration of the Fund’s expense ratio.
The Trustees considered that the Fund’s management fee for the most recent fiscal year was in the fifth quintile relative to the management fees paid by other funds in its Morningstar category for the comparable period. The Trustees noted Amundi US’s explanation of the reasons that the Fund’s management fee was in the fifth quintile relative to the management fees paid by other funds in its Morningstar category. The Trustees considered that the expense ratio of the Fund’s Class Y shares for the most recent fiscal year was in the first quintile relative to its Strategic Insight peer group for the comparable period. The Trustees noted that Amundi US had agreed to waive fees and/or reimburse expenses in order to limit the ordinary operating expenses of the Fund.
The Trustees reviewed management fees charged by Amundi US to institutional and other clients, including publicly offered European funds sponsored by Amundi US’s affiliates, unaffiliated U.S. registered investment companies (in a sub-advisory capacity), and unaffiliated foreign and domestic separate accounts. The Trustees also considered Amundi US’s costs in providing services to the Fund and Amundi US’s costs in providing services to the other clients and considered the differences in management fees and profit margins for fund and non-fund services. In evaluating the fees associated with Amundi US’s client accounts, the
50Pioneer Global Sustainable Value Fund | Annual Report | 9/30/23
Trustees took into account the respective demands, resources and complexity associated with the Fund and other client accounts. The Trustees noted that, in some instances, the fee rates for those clients were lower than the management fee for the Fund and considered that, under the investment management and administration agreements with the Fund, Amundi US performs additional services for the Fund that it does not provide to those other clients or services that are broader in scope, including oversight of the Fund’s other service providers and activities related to compliance and the extensive regulatory and tax regimes to which the Fund is subject. The Trustees also considered the entrepreneurial risks associated with Amundi US’s management of the Fund.
The Trustees concluded that the management fee payable by the Fund to Amundi US was reasonable in relation to the nature and quality of the services provided by Amundi US.
Profitability
The Trustees considered information provided by Amundi US regarding the profitability of Amundi US with respect to the advisory services provided by Amundi US to the Fund, including the methodology used by Amundi US in allocating certain of its costs to the management of the Fund. The Trustees also considered Amundi US’s profit margin in connection with the overall operation of the Fund. They further reviewed the financial results, including the profit margins, realized by Amundi US from non-fund businesses. The Trustees considered Amundi US’s profit margins in comparison to the limited industry data available and noted that the profitability of any adviser was affected by numerous factors, including its organizational structure and method for allocating expenses. The Trustees concluded that Amundi US’s profitability with respect to the management of the Fund was not unreasonable.
Economies of Scale
The Trustees considered Amundi US’s views relating to economies of scale in connection with the Pioneer Funds as fund assets grow and the extent to which any such economies of scale are shared with the Fund and Fund shareholders. The Trustees recognize that economies of scale are difficult to identify and quantify, and that, among other factors that may be relevant, are the following: fee levels, expense subsidization, investment by Amundi US in research and analytical capabilities and Amundi US’s commitment and resource allocation to the Fund. The Trustees noted that profitability also may be an indicator of the availability of any economies of scale, although profitability may vary for other reasons including due to reductions in expenses. The Trustees concluded that economies of scale, if any, were being appropriately shared with the Fund.
Pioneer Global Sustainable Value Fund | Annual Report | 9/30/2351
Other Benefits
The Trustees considered the other benefits that Amundi US enjoys from its relationship with the Fund. The Trustees considered the character and amount of fees paid or to be paid by the Fund, other than under the investment management agreement, for services provided by Amundi US and its affiliates. The Trustees further considered the revenues and profitability of Amundi US’s businesses other than the Fund business. To the extent applicable, the Trustees also considered the benefits to the Fund and to Amundi US and its affiliates from the use of “soft” commission dollars generated by the Fund to pay for research and brokerage services.
The Trustees considered that Amundi US is the principal U.S. asset management business of Amundi, which is one of the largest asset managers globally. Amundi’s worldwide asset management business manages over $2.1 trillion in assets (including the Pioneer Funds). The Trustees considered that Amundi US’s relationship with Amundi creates potential opportunities for Amundi US and Amundi that derive from Amundi US’s relationships with the Fund, including Amundi’s ability to market the services of Amundi US globally. The Trustees noted that Amundi US has access to additional research and portfolio management capabilities as a result of its relationship with Amundi and Amundi’s enhanced global presence that may contribute to an increase in the resources available to Amundi US. The Trustees considered that Amundi US and the Fund receive reciprocal intangible benefits from the relationship, including mutual brand recognition and, for the Fund, direct and indirect access to the resources of a large global asset manager. The Trustees concluded that any such benefits received by Amundi US as a result of its relationship with the Fund were reasonable.
Conclusion
After consideration of the factors described above as well as other factors, the Trustees, including the Independent Trustees, concluded that the investment management agreement for the Fund, including the fees payable thereunder, was fair and reasonable and voted to approve the proposed renewal of the investment management agreement.
52Pioneer Global Sustainable Value Fund | Annual Report | 9/30/23
Statement Regarding Liquidity Risk Management Program
As required by law, the Fund has adopted and implemented a liquidity risk management program (the “Program”) that is designed to assess and manage liquidity risk. Liquidity risk is the risk that the Fund could not meet requests to redeem its shares without significant dilution of remaining investors’ interests in the Fund. The Fund’s Board of Trustees designated a liquidity risk management committee (the “Committee”) consisting of employees of Amundi Asset Management US, Inc. (the “Adviser”) to administer the Program.
The Committee provided the Board of Trustees with a report that addressed the operation of the Program and assessed its adequacy and effectiveness of implementation (the “Report”). The Report covered the period from January 1, 2022 through December 31, 2022 (the “Reporting Period”).
The Report confirmed that, throughout the Reporting Period, the Committee had monitored the Fund’s portfolio liquidity and liquidity risk on an ongoing basis, as described in the Program and in Board reporting throughout the Reporting Period.
The Report discussed the Committee’s annual review of the Program, which addressed, among other things, the following elements of the Program:
The Committee reviewed the Fund’s investment strategy and liquidity of portfolio investments during both normal and reasonably foreseeable stressed conditions. The Committee noted that the Fund’s investment strategy continues to be appropriate for an open-end fund, taking into account, among other things, whether and to what extent the Fund held less liquid and illiquid assets and the extent to which any such investments affected the Fund’s ability to meet redemption requests. In managing and reviewing the Fund’s liquidity risk, the Committee also considered the extent to which the Fund’s investment strategy involves a relatively concentrated portfolio or large positions in particular issuers, the extent to which the Fund uses borrowing for investment purposes, and the extent to which the Fund uses derivatives (including for hedging purposes). The Committee also reviewed the Fund’s short-term and long-term cash flow projections during both normal and reasonably foreseeable stressed conditions. In assessing the Fund’s cash flow projections, the Committee considered, among other factors, historical net redemption activity, redemption policies, ownership concentration, distribution channels, and the degree of certainty associated with the Fund’s short-term and long-term cash flow projections. The Committee also considered the Fund’s holdings of cash and cash equivalents, as well as borrowing arrangements
Pioneer Global Sustainable Value Fund | Annual Report | 9/30/23 53
and other funding sources, including, if applicable, the Fund’s participation in a credit facility, as components of the Fund’s ability to meet redemption requests. The Fund has adopted an in-kind redemption policy which may be utilized to meet larger redemption requests.
The Committee reviewed the Program’s liquidity classification methodology for categorizing the Fund’s investments into one of four liquidity buckets. In reviewing the Fund’s investments, the Committee considered, among other factors, whether trading varying portions of a position in a particular portfolio investment or asset class in sizes the Fund would reasonably anticipate trading, would be reasonably expected to significantly affect liquidity.
The Committee performed an analysis to determine whether the Fund is required to maintain a Highly Liquid Investment Minimum, and determined that no such minimum is required because the Fund primarily holds highly liquid investments.
The Report stated that the Committee concluded the Program operates adequately and effectively, in all material respects, to assess and manage the Fund’s liquidity risk throughout the Reporting Period.
54Pioneer Global Sustainable Value Fund | Annual Report | 9/30/23
Trustees, Officers and Service Providers
Investment Adviser and Administrator
Amundi Asset Management US, Inc.
Custodian and Sub-Administrator
The Bank of New York Mellon Corporation
Independent Registered Public Accounting Firm
Ernst & Young LLP
Principal Underwriter
Amundi Distributor US, Inc.
Legal Counsel
Morgan, Lewis & Bockius LLP
Transfer Agent
BNY Mellon Investment Servicing (US) Inc.
Proxy Voting Policies and Procedures of the Fund are available without charge, upon request, by calling our toll free number (1-800-225-6292). Information regarding how the Fund voted proxies relating to portfolio securities during the most recent 12-month period ended June 30 is publicly available to shareowners at www.amundi.com/us. This information is also available on the Securities and Exchange Commission’s web site at www.sec.gov.
Trustees and Officers
The Fund's Trustees and officers are listed below, together with their principal occupations and other directorships they have held during at least the past five years. Trustees who are interested persons of the Fund within the meaning of the 1940 Act are referred to as Interested Trustees. Trustees who are not interested persons of the Fund are referred to as Independent Trustees. Each of the Trustees serves as a Trustee of each of the 49 U.S. registered investment portfolios for which Amundi US serves as investment adviser (the “Pioneer Funds”). The address for all Trustees and all officers of the Fund is 60 State Street, Boston, Massachusetts 02109.
The Statement of Additional Information of the Fund includes additional information about the Trustees and is available, without charge, upon request, by calling 1-800-225-6292.
Pioneer Global Sustainable Value Fund | Annual Report | 9/30/2355
Name, Age and Position
Held With the Fund | Term of Office and
Length of Service | Principal Occupation(s) DuringAt Least The Past Five Years | Other Directorships Held by Trustee
During At Least The Past Five Years |
Thomas J. Perna (72)
Chairman of the Board
and Trustee | Trustee since 2021.
Serves until a successor
trustee is elected or
earlier retirement
or removal. | Private investor (2004 – 2008 and 2013 – present); Chairman (2008 – 2013) and Chief Executive Officer (2008 – 2012), Quadriserv, Inc. (technology products for securities lending industry); and Senior Executive Vice President, The Bank of New York (financial and securities services) (1986 – 2004) | Director, Broadridge Financial Solutions, Inc.
(investor communications and securities
processing provider for financial services industry)
(2009 – present); Director, Quadriserv, Inc. (2005 –
2013); and Commissioner, New Jersey State
Civil Service Commission (2011 – 2015) |
John E. Baumgardner,
Jr. (72)*
Trustee | Trustee since 2021.
Serves until a successor
trustee is elected or
earlier retirement
or removal. | Of Counsel (2019 – present), Partner (1983-2018), Sullivan & Cromwell LLP (law firm). | Chairman, The Lakeville Journal Company, LLC,
(privately-held community newspaper group)
(2015-present) |
Diane Durnin (66)
Trustee | Trustee since 2021.
Serves until a successor
trustee is elected or
earlier retirement
or removal. | Managing Director - Head of Product Strategy and Development, BNY Mellon Investment Management (investment management firm) (2012-2018); Vice Chairman – The Dreyfus Corporation (2005 – 2018): Executive Vice President Head of Product, BNY Mellon Investment Management (2007-2012); Executive Director- Product Strategy, Mellon Asset Management (2005-2007); Executive Vice President Head of Products, Marketing and Client Service, Dreyfus Corporation (investment management firm) (2000-2005); Senior Vice President Strategic Product and Business Development, Dreyfus Corporation (1994-2000) | None |
56Pioneer Global Sustainable Value Fund | Annual Report | 9/30/23
Name, Age and Position
Held With the Fund | Term of Office and
Length of Service | Principal Occupation(s) DuringAt Least The Past Five Years | Other Directorships Held by Trustee
During At Least The Past Five Years |
Benjamin M. Friedman (79)
Trustee | Trustee since 2021.
Serves until a successor
trustee is elected or
earlier retirement
or removal. | William Joseph Maier Professor of Political Economy, Harvard University (1972 – present) | Trustee, Mellon Institutional Funds Investment
Trust and Mellon Institutional Funds Master
Portfolio (oversaw 17 portfolios in fund complex)
(1989 - 2008) |
Craig C. MacKay (60)
Trustee | Trustee since 2021.
Serves until a successor
trustee is elected or
earlier retirement
or removal. | Partner, England & Company, LLC (advisory firm) (2012 – present); Group Head – Leveraged Finance Distribution, Oppenheimer & Company (investment bank) (2006 – 2012); Group Head – Private Finance & High Yield Capital Markets Origination, SunTrust Robinson Humphrey (investment bank) (2003 – 2006); and Founder and Chief Executive Officer, HNY Associates, LLC (investment bank) (1996 – 2003) | Director, Equitable Holdings, Inc. (financial
services holding company) (2022 – present);
Board Member of Carver Bancorp, Inc. (holding
company) and Carver Federal Savings Bank,
NA (2017 – present); Advisory Council Member,
MasterShares ETF (2016 – 2017); Advisory
Council Member, The Deal (financial market
information publisher) (2015 – 2016); Board
Co-Chairman and Chief Executive Officer, Danis
Transportation Company (privately-owned
commercial carrier) (2000 – 2003); Board
Member and Chief Financial Officer, Customer
Access Resources (privately-owned
teleservices company) (1998 – 2000); Board
Member, Federation of Protestant Welfare
Agencies (human services agency) (1993 –
present); and Board Treasurer, Harlem Dowling
Westside Center (foster care agency)
(1999 – 2018) |
Pioneer Global Sustainable Value Fund | Annual Report | 9/30/2357
Independent Trustees (continued)
Name, Age and Position
Held With the Fund | Term of Office and
Length of Service | Principal Occupation(s) DuringAt Least The Past Five Years | Other Directorships Held by Trustee
During At Least The Past Five Years |
Lorraine H. Monchak (67)
Trustee | Trustee since 2021.
(Advisory Trustee from
2014 - 2017). Serves
until a successor trustee
is elected or earlier
retirement or removal. | Chief Investment Officer, 1199 SEIU Funds (healthcare workers union pension funds) (2001 – present); Vice President – International Investments Group, American International Group, Inc. (insurance company) (1993 – 2001); Vice President – Corporate Finance and Treasury Group, Citibank, N.A. (1980 – 1986 and 1990 – 1993); Vice President – Asset/Liability Management Group, Federal Farm Funding Corporation (government-sponsored issuer of debt securities) (1988 – 1990); Mortgage Strategies Group, Shearson Lehman Hutton, Inc. (investment bank) (1987 – 1988); Mortgage Strategies Group, Drexel Burnham Lambert, Ltd. (investment bank) (1986 – 1987) | None |
Marguerite A. Piret (75)
Trustee | Trustee since 2021.
Serves until a successor
trustee is elected or
earlier retirement
or removal. | Chief Financial Officer, American Ag Energy, Inc. (technology for the environment, energy and agriculture) (2019 – present); Chief Operating Officer,
North Country Growers LLC (controlled environment
agriculture company) (2020 – present); Chief Executive Officer, Green Heat LLC (biofuels company)
(2022 – present); President and Chief Executive
Officer, Newbury Piret Company (investment banking firm) (1981 – 2019) | Director of New America High Income Fund,
Inc. (closed-end investment company) (2004 –
present); and Member, Board of Governors,
Investment Company Institute (2000 – 2006) |
58Pioneer Global Sustainable Value Fund | Annual Report | 9/30/23
Name, Age and Position
Held With the Fund | Term of Office and
Length of Service | Principal Occupation(s) DuringAt Least The Past Five Years | Other Directorships Held by Trustee
During At Least The Past Five Years |
Fred J. Ricciardi (76)
Trustee | Trustee since 2021.
Serves until a successor
trustee is elected or
earlier retirement
or removal. | Private investor (2020 – present); Consultant (investment company services) (2012 – 2020); Executive Vice President, BNY Mellon (financial and investment company services) (1969 – 2012); Director, BNY International Financing Corp. (financial services) (2002 – 2012); Director, Mellon Overseas Investment Corp. (financial services) (2009 – 2012); Director, Financial Models (technology) (2005-2007); Director, BNY Hamilton Funds, Ireland (offshore investment companies) (2004-2007); Chairman/Director, AIB/BNY Securities Services, Ltd., Ireland (financial services) (1999-2006); Chairman, BNY Alternative Investment Services, Inc. (financial services) (2005-2007) | None |
| * Mr. Baumgardner is Of Counsel to Sullivan & Cromwell LLP, which acts as counsel to the Independent Trustees of each Pioneer Fund. |
Pioneer Global Sustainable Value Fund | Annual Report | 9/30/2359
Name, Age and Position
Held With the Fund | Term of Office and
Length of Service | Principal Occupation(s) During At Least The Past Five Years | Other Directorships Held by Trustee
During At Least The Past Five Years |
Lisa M. Jones (61)**
Trustee, President and Chief
Executive Officer | Trustee since 2021. Serves
until a successor trustee is
elected or earlier retirement
or removal | Director, CEO and President of Amundi US, Inc. (investment management firm) (since September 2014); Director, CEO and President of Amundi Asset Management US, Inc. (since September 2014); Director, CEO and President of Amundi Distributor US, Inc. (since September 2014); Director, CEO and President of Amundi Asset Management US, Inc. (since September 2014); Chair, Amundi US, Inc., Amundi Distributor US, Inc. and Amundi Asset Management US, Inc. (September 2014 – 2018); Managing Director, Morgan Stanley Investment Management (investment management firm) (2010 – 2013); Director of Institutional Business, CEO of International, Eaton Vance Management (investment management firm) (2005 – 2010); Director of Amundi Holdings US, Inc. (since 2017) | Director of Clearwater Analytics (provider
of web-based investment accounting
software for reporting and reconciliation
services) (September 2022 – present) |
Kenneth J. Taubes (65)**
Trustee | Trustee since 2021. Serves
until a successor trustee is
elected or earlier retirement
or removal | Director and Executive Vice President (since 2008) and Chief Investment Officer, U.S. (since 2010) of Amundi US, Inc. (investment management firm); Director and Executive Vice President and Chief Investment Officer, U.S. of Amundi US (since 2008); Executive Vice President and Chief Investment Officer, U.S. of Amundi Asset Management US, Inc. (since 2009); Portfolio Manager of Amundi US (since 1999); Director of Amundi Holdings US, Inc. (since 2017) | None |
| ** Ms. Jones and Mr. Taubes are Interested Trustees because they are officers or directors of the Fund’s investment adviser and certain of its affiliates. |
60Pioneer Global Sustainable Value Fund | Annual Report | 9/30/23
Name, Age and Position
Held With the Fund | Term of Office and
Length of Service | Principal Occupation(s) During At Least The Past Five Years | Other Directorships Held by Officer
During At Least The Past Five Years |
Christopher J. Kelley (58)
Secretary and Chief
Legal Officer | Since 2021. Serves at
the discretion of
the Board | Vice President and Associate General Counsel of Amundi US since January 2008; Secretary and Chief Legal Officer of all of the Pioneer Funds since June 2010; Assistant Secretary of all of the Pioneer Funds from September 2003 to May 2010; Vice President and Senior Counsel of Amundi US from July 2002 to December 2007 | None |
Thomas Reyes (60)
Assistant Secretary | Since 2021. Serves at
the discretion of
the Board | Assistant General Counsel of Amundi US since May 2013 and Assistant Secretary of all the Pioneer Funds since June 2010; Counsel of Amundi US from June 2007 to May 2013 | None |
Heather L. Melito-Dezan (46)
Assistant Secretary | Since 2022. Serves at
the discretion of
the Board | Director - Trustee and Board Relationships of Amundi US since September 2019; Assistant Secretary of Amundi US, Inc. since July 2020: Assistant Secretary of Amundi Asset Management US, Inc. since July 2020; Assistant Secretary of Amundi Distributor US, Inc. since July 2020; Assistant Secretary of all the Pioneer Funds since September 2022; Private practice from 2017 – 2019. | None |
Anthony J. Koenig, Jr. (59)
Treasurer and
Chief Financial and
Accounting Officer | Since 2021. Serves at
the discretion of
the Board | Managing Director, Chief Operations Officer and Fund Treasurer of Amundi US since May 2021; Treasurer of all of the Pioneer Funds since May 2021; Assistant Treasurer of all of the Pioneer Funds from January 2021 to May 2021; and Chief of Staff, US Investment Management of Amundi US from May 2008 to January 2021 | None |
Luis I. Presutti (58)
Assistant Treasurer | Since 2021. Serves at
the discretion of
the Board | Director – Fund Treasury of Amundi US since 1999; and Assistant Treasurer of all of the Pioneer Funds since 1999 | None |
Gary Sullivan (65)
Assistant Treasurer | Since 2021. Serves at
the discretion of
the Board | Senior Manager – Fund Treasury of Amundi US since 2012; and Assistant Treasurer of all of the Pioneer Funds since 2002 | None |
Pioneer Global Sustainable Value Fund | Annual Report | 9/30/2361
Fund Officers (continued)
Name, Age and Position
Held With the Fund | Term of Office and
Length of Service | Principal Occupation(s) During At Least The Past Five Years | Other Directorships Held by Officer
During At Least The Past Five Years |
Antonio Furtado (41)
Assistant Treasurer | Since 2021. Serves at
the discretion of
the Board | Fund Oversight Manager – Fund Treasury of Amundi US since 2020; Assistant Treasurer of all of the Pioneer Funds since 2020; and Senior Fund Treasury Analyst from 2012 - 2020 | None |
Michael Melnick (52)
Assistant Treasurer | Since 2021. Serves at
the discretion of
the Board | Vice President - Deputy Fund Treasurer of Amundi US since May 2021; Assistant Treasurer of all of the Pioneer Funds since July 2021; Director of Regulatory Reporting of Amundi US from 2001 – 2021; and Director of Tax of Amundi US from 2000 - 2001 | None |
John Malone (52)
Chief Compliance Officer | Since 2021. Serves at
the discretion of
the Board | Managing Director, Chief Compliance Officer of Amundi US Asset Management; Amundi Asset Management US, Inc.; and the Pioneer Funds since September 2018; Chief Compliance Officer of Amundi Distributor US, Inc. since January 2014. | None |
Brandon Austin (51)
Anti-Money Laundering Officer | Since 2022. Serves at
the discretion of
the Board | Director, Financial Security – Amundi Asset Management; Anti-Money Laundering Officer of all the Pioneer Funds since March 2022: Director of Financial Security of Amundi US since July 2021; Vice President, Head of BSA, AML and OFAC, Deputy Compliance Manager, Crédit Agricole Indosuez Wealth Management (investment management firm) (2013 – 2021) | None |
62Pioneer Global Sustainable Value Fund | Annual Report | 9/30/23
How to Contact Amundi
We are pleased to offer a variety of convenient ways for you to contact us for assistance or information.
Call us for:
Account Information, including existing accounts,
new accounts, prospectuses, applications
and service forms
1-800-225-6292
FactFoneSM for automated fund yields, prices,
account information and transactions
1-800-225-4321
| Retirement plans information | 1-800-622-0176 |
Write to us:
Amundi
P.O. Box 534427
Pittsburgh, PA 15253-4427
| Our toll-free fax | 1-800-225-4240 |
| Our internet e-mail address | us.askamundi@amundi.com
(for general questions about Amundi only) |
Visit our web site: www.amundi.com/us
This report must be preceded or accompanied by a prospectus.
The Fund files a complete schedule of portfolio holdings with the Securities and Exchange Commission for the first and third quarters of each fiscal year as an exhibit to its reports on Form N-PORT. Shareholders may view the filed Form N-PORT by visiting the Commission’s web site at https://www.sec.gov.
Amundi Asset Management US, Inc.
60 State Street
Boston, MA 02109
www.amundi.com/us
Securities offered through Amundi Distributor US, Inc.
60 State Street, Boston, MA 02109
Underwriter of Pioneer Mutual Funds, Member SIPC
© 2023 Amundi Asset Management US, Inc. 32714-02-1123
Pioneer Intrinsic Value Fund
Annual Report | September 30, 2023
visit us: www.amundi.com/us
Pioneer Intrinsic Value Fund | Annual Report | 9/30/231
President’s Letter
Dear Shareholders,
On February 13, 2023, Amundi US celebrated the 95th anniversary of Pioneer Fund, the second-oldest mutual fund in the United States. We recognized the anniversary with ringing of the closing bell at the New York Stock Exchange, which seemed fitting for this special milestone.
Pioneer Fund was launched on February 13, 1928 by Phil Carret, one of the earliest proponents of value investing and a leading innovator in the asset management industry. Mr. Carret began investing in the 1920s and founded Pioneer Investments (now Amundi US) in 1928, and was one of the first investors to realize he could uncover value through rigorous, innovative, fundamental research techniques.
Consistent with Mr. Carret’s investment approach and employing many of the same techniques utilized in the 1920s, Amundi US's portfolio managers have adapted Mr. Carret’s philosophy to a new age of “active” investing.
The last few years have seen investors face some unprecedented challenges, from a global pandemic that shuttered much of the world’s economy for months, to geopolitical strife, to rising inflation that has reached levels not seen in decades. Now, more than ever, Amundi US believes active management – that is, making active investment decisions across all of our portfolios – can help mitigate risk during periods of market volatility.
At Amundi US, active management begins with our own fundamental, bottom-up research process. Our team of dedicated research analysts and portfolio managers analyzes each security under consideration, communicating frequently with the management teams of the companies and other entities issuing the securities, and working together to identify those securities that we believe best meet our investment criteria for our family of funds. Our risk management approach begins with each security under consideration, as we strive to develop a deep understanding of the potential opportunity, while considering any potential risk factors.
Today, as shareholders, we have many options. It is our view that active management can serve shareholders well, not only when markets are thriving, but also during periods of market stress. As you consider your long-term investment goals, we encourage you to work with your financial professional to develop an investment plan that paves the way for you to pursue both your short-term and long-term goals.
2Pioneer Intrinsic Value Fund | Annual Report | 9/30/23
We greatly appreciate the trust you have placed in us and look forward to continuing to serve you in the future.
Lisa M. Jones
Head of the Americas, President and CEO of US
Amundi Asset Management US, Inc.
November 2023
Any information in this shareowner report regarding market or economic trends or the factors influencing the Fund’s historical or future performance are statements of opinion as of the date of this report. Past performance is no guarantee of future results.
Pioneer Intrinsic Value Fund | Annual Report | 9/30/233
Portfolio Management Discussion | 9/30/23
In the following discussion, portfolio managers Sammi Truong and Timothy Stanish discuss the market environment and the performance of Pioneer Intrinsic Value Fund during the 12-month period ended September 30, 2023. Ms. Truong, a vice president and portfolio manager at Amundi Asset Management US, Inc. (Amundi US), and Mr. Stanish, a vice president, EVA (economic value added) analyst, and portfolio manager at Amundi US, are responsible for the day-to-day management of the Fund.
| Q | How did the Fund perform during the 12-month period ended September 30, 2023? |
| A | Pioneer Intrinsic Value Fund’s Class A shares returned 16.64% at net asset value during the 12-month period ended September 30, 2023, while the Fund’s benchmark, the Russell 1000 Value Index (the Russell Index), returned 14.44%. During the same 12-month period, the average return of the 1,221 mutual funds in Morningstar’s Large Value Funds category was 14.87%. |
| Q | How would you describe the investment backdrop for equities during the 12-month period ended September 30, 2023? |
| A | Although market sentiment began to deteriorate late in the period, US equities nonetheless produced a solid, double-digit gain for the full 12 months. Stocks had experienced a protracted downturn in the 10 months prior to the start of the reporting period, in response to the US Federal Reserve’s (Fed’s) aggressive interest-rate increases aimed at combating high inflation. By late 2023, however, inflation began to cool and investors looked ahead to the point at which the Fed could adopt a less-restrictive monetary policy. While the Fed in fact continued to raise interest rates throughout 2023, it slowed its pace of rate hikes in comparison to the prior year. In addition, the markets appeared to grow confident that the Fed would have largely completed its monetary policy tightening by 2024. Investors were further cheered by the fact that both economic growth and corporate profits held up well, compared to the depressed expectations seen in late 2022. |
| | The investment backdrop became less favorable in September and October of 2023, causing the market to finish below its previous highs. Renewed strength in crude oil prices fueled fears that inflation would reaccelerate and the Fed would have to keep rates |
4Pioneer Intrinsic Value Fund | Annual Report | 9/30/23
| | elevated for longer than the markets had been anticipating. In addition, investors appeared to grow concerned that the US economy was finally beginning to slow. Despite the late sell-off, equities closed the 12-month period firmly in positive territory, thanks to their earlier advance. |
| | While value stocks, as measured by the Fund’s benchmark, the Russell Index, performed well and returned 14.44% for the 12-month period, they did not keep pace with the broader market (as measured by the 21.19% return for the Russell 1000 Index). The value category has a lower representation of information technology stocks relative to the growth segment, which prevented value stocks from fully participating in that sector’s robust gain. |
| Q | What were the principal factors that contributed positively to the Fund’s benchmark-relative performance during the 12-month period ended September 30, 2023? |
| A | The Fund’s positioning within the information technology (IT) sector made a large, positive contribution to benchmark-relative results. Benchmark-relative performance benefited from a healthy portfolio overweight to the sector, as IT was the top performer in the Russell Index during the 12-month period. Stock selection results were a further plus, thanks to Fund positions in tech companies with recurring revenues and healthy balance sheets, such as Oracle, Cisco Systems, and International Business Machines (IBM). We believed those stocks offered an attractive valuation discount relative to the faster-growing technology companies, meaning that even a modest improvement in earnings growth could be sufficient to drive an expansion of their price-to-earnings ratios. That indeed proved to be the case, and the Fund’s relative performance benefited accordingly. |
| | Although our investment strategy is bottom-up in nature, our approach can result in overweight or underweight portfolio positions in comparison to the Russell Index. During the past year, that aspect of the Fund’s positioning contributed to benchmark-relative results, thanks to the portfolio’s zero weighting in the real estate sector and an underweight allocation to the utilities sector. Both sectors have tended to have high degrees of interest-rate sensitivity, which was a significant |
Pioneer Intrinsic Value Fund | Annual Report | 9/30/235
| | headwind to their performance over the past 12 months. The Fund also benefited from an overweight to the strong-performing energy sector, which outpaced the broader market by a wide margin. Within energy, a position in ExxonMobil was a key positive contributor to the Fund’s benchmark-relative results. |
| | The industrials sector was another source of relative strength for the Fund during the period, led by a position in Federal Express. The company’s share price fell to its lowest level in more than two years in September 2022, after a weaker-than-expected earnings report. The Fund already had a position in the stock at the time, based in part on our belief that the company’s new management team was poised to turn the business around. We maintained the position following the downturn, and the stock subsequently staged a strong rebound as management’s plan played out in the form of improvements in both efficiencies and earnings. The Fund’s relative returns further benefited from its position in the plane-leasing company AerCap Holdings. We believed AerCap offered a way to capitalize on airlines’ need to expand their fleets at a time in which their debt loads were already elevated in the wake of disruptions from COVID-19. The thesis evolved as we had anticipated, boosting the stock’s valuation from its previously discounted level. |
| | The communication services and consumer discretionary sectors were also areas of strength for the Fund versus the Russell Index during the 12-month period. A position in Comcast was a top performer for the Fund in communication services. We had added the position to the portfolio when the stock was under extreme pressure due to the prospect of rising competition. The share price subsequently rebounded as those concerns proved to be exaggerated. The Fund’s strong showing in the consumer discretionary sector was primarily the result of an investment in the homebuilder Lennar, shares of which rallied on expectations that a mismatch of supply and demand in the housing sector would fuel demand for new construction. |
6Pioneer Intrinsic Value Fund | Annual Report | 9/30/23
| Q | What were the principal factors that detracted from the Fund’s benchmark-relative performance during the 12-month period ended September 30, 2023? |
| A | The Fund’s positioning in the financials sector was a key detractor from benchmark-relative performance for the 12-month period, where returns lagged due to an overweight to an underperforming segment of the market, and from unfavorable stock selection. A position in Charles Schwab was the most notable underperformer for the Fund in the sector, and overall. The stock price fell sharply during the short-lived banking crisis in March 2023, as investors feared the company would face similar deposit outflows as the smaller regional banks. We continue to see value in Charles Schwab, however, given the company’s durable franchise and our view that a stabilization of deposit outflows could lead to improved earnings over time. The Fund’s holdings in regional banks, including M&T Bank and PNC Financial Group, also underperformed during the March 2023 banking sell-off, and lagged for the full 12-month period as a result. |
| | The Fund remained overweight to financials versus the benchmark at the end of September 2023, but to a lesser extent than earlier in the period, due to the combination of interest-rate risk and credit risk that has continued to affect companies in the sector. We also moved the portfolio up the market-capitalization spectrum to emphasize owning stocks of larger financial firms, as we feel such companies have featured more diverse operations as well as the robust balance sheets needed to withstand further challenges. |
| | Stock selection in the health care sector detracted from the Fund’s benchmark-relative results during the period. In the sector, a position in Pfizer lagged due to worries about the company’s loss of exclusivity on some of its key products, but we have retained the Fund’s position, based on our confidence that the company could fill the shortfall through its pipeline of new drugs. Positions in CVS Health and the managed care company Elevance Health (formerly known as Anthem) were additional detractors from the Fund’s relative performance within the health care sector. |
Pioneer Intrinsic Value Fund | Annual Report | 9/30/237
| | The Fund also lost some relative performance in the materials sector from a position in Sealed Air, a maker of packaging solutions that preserve food and protect goods during transit. The company experienced a larger decline in its business than we had expected following the waning effects of COVID-19. A position in Mosaic, a fertilizer producer, also lost ground as a normalization of supply chains led to a decline in fertilizer prices. We continue to like the stock on a long-term basis, as we think the valuation is cheaper than it should be. |
| Q | Did the Fund have any exposure to derivative securities during the 12-month period ended September 30, 2023? |
| A | No. The Fund had no derivatives exposure during the reporting period. |
| Q | How would you characterize the Fund’s overall positioning as of September 30, 2023? |
| A | We gradually shifted to a more defensive portfolio stance over the course of the 12-month period. The shift was not a top-down call on our part, but rather a function of the fact that a number of companies with defensive characteristics saw their share prices fall to what we felt were attractive valuations. The shift, therefore, was consistent with our approach of letting our valuation discipline inform the Fund’s positioning. |
| | More broadly speaking, we think this is a compelling time to be a value investor. The spread between the performance of growth and value stocks has remained high on a trailing basis, thus providing the opportunity, in our opinion, to own shares of good companies with strong balance sheets at discounted prices. We believe such a strategy is a more effective approach than one that attempts to invest in the types of lower-quality stocks that appear more likely to become “value traps.” |
8Pioneer Intrinsic Value Fund | Annual Report | 9/30/23
Please refer to the Schedule of Investments on pages 17 - 21 for a full listing of Fund securities.
All investments are subject to risk, including the possible loss of principal. In the past several years, financial markets have experienced increased volatility and heightened uncertainty. The market prices of securities may go up or down, sometimes rapidly or unpredictably, due to general market conditions, such as real or perceived adverse economic, political, or regulatory conditions, recessions, inflation, changes in interest or currency rates, lack of liquidity in the bond markets, the spread of infectious illness or other public health issues, armed conflict including Russia's military invasion of Ukraine, sanctions against Russia, other nations or individuals or companies and possible countermeasures, market disruptions caused by tariffs, trade disputes or other government actions, or adverse investor sentiment. These conditions may continue, recur, worsen or spread.
Investing in foreign and/or emerging markets securities involves risks relating to interest rates, currency exchange rates, economic, and political conditions.
The Fund invests in REIT (real estate investment trust) securities, the value of which can fall for a variety of reasons, such as declines in rental income, fluctuating interest rates, poor property management, environmental liabilities, uninsured damage, increased competition, or changes in real estate tax laws.
The Fund may invest in IPOs (Initial Public Offerings), which may involve additional risks.
For more information on this or any Pioneer fund, please visit amundi.com/usinvestors or call 1-800-622-9876. This material must be preceded or accompanied by the Fund's current prospectus or summary prospectus.
Any information in this shareholder report regarding market or economic trends or the factors influencing the Fund’s historical or future performance are statements of opinion as of the date of this report. Past performance is no guarantee of future results.
Pioneer Intrinsic Value Fund | Annual Report | 9/30/239
Portfolio Summary | 9/30/23
Sector Distribution
(As a percentage of total investments)*
10 Largest Holdings
| (As a percentage of total investments) |
| 1. | Wells Fargo & Co. | 4.22% |
| 2. | Bank of America Corp. | 3.99 |
| 3. | FedEx Corp. | 3.85 |
| 4. | Shell Plc (A.D.R.) | 3.82 |
| 5. | Comcast Corp., Class A | 3.66 |
| 6. | Cisco Systems, Inc. | 3.59 |
| 7. | Pfizer, Inc. | 3.54 |
| 8. | Exxon Mobil Corp. | 3.44 |
| 9. | AbbVie, Inc. | 3.40 |
| 10. | AerCap Holdings NV | 3.19 |
10Pioneer Intrinsic Value Fund | Annual Report | 9/30/23
Prices and Distributions | 9/30/23
Net Asset Value per Share
| Class | 9/30/23 | 9/30/22 |
| A | $10.05 | $8.77 |
| C | $10.07 | $8.78 |
| Y | $10.06 | $8.78 |
| | | |
Distributions per Share: 10/1/22 - 9/30/23
| Class | Net
Investment
Income | Short-Term
Capital Gains | Long-Term
Capital Gains |
| A | $0.1757 | $— | $— |
| C | $0.0969 | $— | $— |
| Y | $0.2005 | $— | $— |
Index Definition
The Russell 1000 Value Index is an unmanaged measure of the performance of large-cap U.S. value stocks. Indices are unmanaged and their returns assume reinvestment of dividends and do not reflect any fees or expenses. It is not possible to invest directly in an index.
The index defined here pertains to the “Value of $10,000 Investment” and “Value of $5 Million Investment” charts on pages 12 - 14.
Pioneer Intrinsic Value Fund | Annual Report | 9/30/2311
| Performance Update | 9/30/23 | Class A Shares |
Investment Returns
The mountain chart on the right shows the change in value of a $10,000 investment made in Class A shares of Pioneer Intrinsic Value Fund at public offering price during the periods shown, compared to that of the Russell 1000 Value Index.*
Average Annual Total Returns
(As of September 30, 2023) |
| Period | Net
Asset
Value
(NAV) | Public
Offering
Price
(POP) | Russell
1000
Value
Index |
Life of Class
(5/10/21) | 1.49% | -0.98% | -0.40% |
| 1 Year | 16.64 | 9.87 | 14.44 |
Expense Ratio
(Per prospectus dated February 1, 2023) |
| Gross | Net |
| 18.21% | 0.85% |
Value of $10,000 Investment
Call 1-800-225-6292 or visit www.amundi.com/us for the most recent month-end performance results. Current performance may be lower or higher than the performance data quoted.
The performance data quoted represents past performance, which is no guarantee of future results. Investment return and principal value will fluctuate, and shares, when redeemed, may be worth more or less than their original cost.
NAV results represent the percent change in net asset value per share. NAV returns would have been lower had sales charges been reflected. POP returns reflect deduction of maximum 5.75% sales charge. All results are historical and assume the reinvestment of dividends and capital gains. Other share classes are available for which performance and expenses will differ.
Performance results reflect any applicable expense waivers in effect during the periods shown. Without such waivers Fund performance would be lower. Waivers may not be in effect for all funds. Certain fee waivers are contractual through a specified period. Otherwise, fee waivers can be rescinded at any time. See the prospectus and financial statements for more information.
The net expense ratio reflects the contractual expense limitation in effect through February 1, 2024 for Class A shares. There can be no assurance that Amundi US will extend the expense limitation beyond such time. Please see the prospectus for more information.
* Performance of Class A shares shown in the graph above is from the inception of Class A shares on 5/10/21 through 9/30/23. Index information shown in the graph above is from 5/31/21 through 9/30/23.
The performance table and graph do not reflect the deduction of fees and taxes that a shareowner would pay on Fund distributions or the redemption of Fund shares.
Please refer to the financial highlights for more current expense ratios.
12Pioneer Intrinsic Value Fund | Annual Report | 9/30/23
| Performance Update | 9/30/23 | Class C Shares |
Investment Returns
The mountain chart on the right shows the change in value of a $10,000 investment made in Class C shares of Pioneer Intrinsic Value Fund during the periods shown, compared to that of the Russell 1000 Value Index.*
Average Annual Total Returns
(As of September 30, 2023) |
| Period | If
Held | If
Redeemed | Russell
1000
Value
Index |
Life of Class
(5/10/21) | 0.70% | 0.70% | -0.40% |
| 1 Year | 15.81 | 14.81 | 14.44 |
Expense Ratio
(Per prospectus dated February 1, 2023) |
| Gross | Net |
| 18.96% | 1.60% |
Value of $10,000 Investment
Call 1-800-225-6292 or visit www.amundi.com/us for the most recent month-end performance results. Current performance may be lower or higher than the performance data quoted.
The performance data quoted represents past performance, which is no guarantee of future results. Investment return and principal value will fluctuate, and shares, when redeemed, may be worth more or less than their original cost.
Class C shares held for less than one year are subject to a 1% contingent deferred sales charge (CDSC). “If Held” results represent the percent change in net asset value per share. “If Redeemed” returns reflect deduction of the CDSC for the one-year period, assuming a complete redemption of shares at the last price calculated on the last business day of the period, and no CDSC for the other time periods. All results are historical and assume the reinvestment of dividends and capital gains. Other share classes are available for which performance and expenses will differ.
Performance results reflect any applicable expense waivers in effect during the periods shown. Without such waivers Fund performance would be lower. Waivers may not be in effect for all funds. Certain fee waivers are contractual through a specified period. Otherwise, fee waivers can be rescinded at any time. See the prospectus and financial statements for more information.
The net expense ratio reflects the contractual expense limitation in effect through February 1, 2024 for Class C shares. There can be no assurance that Amundi US will extend the expense limitation beyond such time. Please see the prospectus for more information.
* Performance of Class C shares shown in the graph above is from the inception of Class C shares on 5/10/21 through 9/30/23. Index information shown in the graph above is from 5/31/21 through 9/30/23.
The performance table and graph do not reflect the deduction of fees and taxes that a shareowner would pay on Fund distributions or the redemption of Fund shares.
Please refer to the financial highlights for more current expense ratios.
Pioneer Intrinsic Value Fund | Annual Report | 9/30/2313
| Performance Update | 9/30/23 | Class Y Shares |
Investment Returns
The mountain chart on the right shows the change in value of a $5 million investment made in Class Y shares of Pioneer Intrinsic Value Fund during the periods shown, compared to that of the Russell 1000 Value Index.*
Average Annual Total Returns
(As of September 30, 2023) |
| Period | Net
Asset
Value
(NAV) | Russell
1000
Value
Index |
Life of Class
(5/10/21) | 1.72% | -0.40% |
| 1 Year | 16.91 | 14.44 |
Expense Ratio
(Per prospectus dated February 1, 2023) |
| Gross | Net |
| 17.95% | 0.55% |
Value of $5 Million Investment
Call 1-800-225-6292 or visit www.amundi.com/us for the most recent month-end performance results. Current performance may be lower or higher than the performance data quoted.
The performance data quoted represents past performance, which is no guarantee of future results. Investment return and principal value will fluctuate, and shares, when redeemed, may be worth more or less than their original cost.
Class Y shares are not subject to sales charges and are available for limited groups of eligible investors, including institutional investors. All results are historical and assume the reinvestment of dividends and capital gains. Other share classes are available for which performance and expenses will differ.
Performance results reflect any applicable expense waivers in effect during the periods shown. Without such waivers Fund performance would be lower. Waivers may not be in effect for all funds. Certain fee waivers are contractual through a specified period. Otherwise, fee waivers can be rescinded at any time. See the prospectus and financial statements for more information.
The net expense ratio reflects the contractual expense limitation in effect through February 1, 2024 for Class Y shares. There can be no assurance that Amundi US will extend the expense limitation beyond such time. Please see the prospectus and financial statements for more information.
* Performance of Class Y shares shown in the table and graph above is from the inception of Class Y shares on 5/10/21 through 9/30/23. Index information shown in the graph above is from 5/31/21 through 9/30/23.
The performance table and graph do not reflect the deduction of fees and taxes that a shareowner would pay on Fund distributions or the redemption of Fund shares.
Please refer to the financial highlights for more current expense ratios.
14Pioneer Intrinsic Value Fund | Annual Report | 9/30/23
Comparing Ongoing Fund Expenses
As a shareowner in the Fund, you incur two types of costs:
| (1) | ongoing costs, including management fees, distribution and/or service (12b-1) fees, and other Fund expenses; and |
| (2) | transaction costs, including sales charges (loads) on purchase payments. |
This example is intended to help you understand your ongoing expenses (in dollars) of investing in the Fund and to compare these costs with the ongoing costs of investing in other mutual funds. The example is based on an investment of $1,000 at the beginning of the Fund’s latest six-month period and held throughout the six months.
Using the Tables
Actual Expenses
The first table below provides information about actual account values and actual expenses. You may use the information in this table, together with the amount you invested, to estimate the expenses that you paid over the period as follows:
| (1) | Divide your account value by $1,000
Example: an $8,600 account value ÷ $1,000 = 8.6 |
| (2) | Multiply the result in (1) above by the corresponding share class’s number in the third row under the heading entitled “Expenses Paid During Period” to estimate the expenses you paid on your account during this period. |
Expenses Paid on a $1,000 Investment in Pioneer Intrinsic Value Fund
Based on actual returns from April 1, 2023 through September 30, 2023.
| Share Class | A | C | Y |
Beginning Account
Value on 4/1/23 | $1,000.00 | $1,000.00 | $1,000.00 |
Ending Account Value
(after expenses) on 9/30/23 | $1,028.70 | $1,025.50 | $1,029.70 |
Expenses Paid
During Period* | $4.32 | $8.02 | $2.80 |
| | |
| * | Expenses are equal to the Fund’s annualized expense ratio of 0.85%, 1.58%, and 0.55% for Class A, Class C, and Class Y shares, respectively, multiplied by the average account value over the period, multiplied by 183/365 (to reflect the partial year period). |
Pioneer Intrinsic Value Fund | Annual Report | 9/30/2315
Comparing Ongoing Fund Expenses (continued)
Hypothetical Example for Comparison Purposes
The table below provides information about hypothetical account values and hypothetical expenses based on the Fund’s actual expense ratio and an assumed rate of return of 5% per year before expenses, which is not the Fund’s actual return. The hypothetical account values and expenses may not be used to estimate the actual ending account balance or expenses you paid for the period.
You may use this information to compare the ongoing costs of investing in the Fund and other funds. To do so, compare this 5% hypothetical example with the 5% hypothetical examples that appear in the shareholder reports of the other funds.
Please note that the expenses shown in the tables are meant to highlight your ongoing costs only and do not reflect any transaction costs, such as sales charges (loads) that are charged at the time of the transaction. Therefore, the table below is useful in comparing ongoing costs only and will not help you determine the relative total costs of owning different funds. In addition, if these transaction costs were included, your costs would have been higher.
Expenses Paid on a $1,000 Investment in Pioneer Intrinsic Value Fund
Based on a hypothetical 5% return per year before expenses, reflecting the period from April 1, 2023 through September 30, 2023.
| Share Class | A | C | Y |
Beginning Account
Value on 4/1/23 | $1,000.00 | $1,000.00 | $1,000.00 |
Ending Account Value
(after expenses) on 9/30/23 | $1,020.81 | $1,017.15 | $1,022.31 |
Expenses Paid
During Period* | $4.31 | $7.99 | $2.79 |
| | |
| * | Expenses are equal to the Fund’s annualized expense ratio of 0.85%, 1.58%, and 0.55% for Class A, Class C, and Class Y shares, respectively, multiplied by the average account value over the period, multiplied by 183/365 (to reflect the partial year period). |
16Pioneer Intrinsic Value Fund | Annual Report | 9/30/23
Schedule of Investments | 9/30/23
| Shares | | | | | | Value |
| | UNAFFILIATED ISSUERS — 102.9% | |
| | Common Stocks — 99.6% of Net Assets | |
| | Air Freight & Logistics — 3.8% | |
| 225 | FedEx Corp. | $ 59,607 |
| | Total Air Freight & Logistics | $59,607 |
|
|
| | Automobile Components — 1.2% | |
| 145 | Lear Corp. | $ 19,459 |
| | Total Automobile Components | $19,459 |
|
|
| | Banks — 12.2% | |
| 2,260 | Bank of America Corp. | $ 61,879 |
| 483 | Citizens Financial Group, Inc. | 12,944 |
| 193 | JPMorgan Chase & Co. | 27,989 |
| 758 | Truist Financial Corp. | 21,686 |
| 1,601 | Wells Fargo & Co. | 65,417 |
| | Total Banks | $189,915 |
|
|
| | Biotechnology — 3.4% | |
| 354 | AbbVie, Inc. | $ 52,767 |
| | Total Biotechnology | $52,767 |
|
|
| | Broadline Retail — 1.8% | |
| 634 | eBay, Inc. | $ 27,953 |
| | Total Broadline Retail | $27,953 |
|
|
| | Capital Markets — 4.3% | |
| 608 | Charles Schwab Corp. | $ 33,379 |
| 496 | State Street Corp. | 33,212 |
| | Total Capital Markets | $66,591 |
|
|
| | Chemicals — 3.1% | |
| 666 | Dow, Inc. | $ 34,339 |
| 383 | Mosaic Co. | 13,635 |
| | Total Chemicals | $47,974 |
|
|
| | Communications Equipment — 3.6% | |
| 1,034 | Cisco Systems, Inc. | $ 55,588 |
| | Total Communications Equipment | $55,588 |
|
|
| | Consumer Finance — 1.4% | |
| 256 | Discover Financial Services | $ 22,177 |
| | Total Consumer Finance | $22,177 |
|
|
| | Consumer Staples Distribution & Retail — 1.4% | |
| 200 | Target Corp. | $ 22,114 |
| | Total Consumer Staples Distribution & Retail | $22,114 |
|
|
The accompanying notes are an integral part of these financial statements.
Pioneer Intrinsic Value Fund | Annual Report | 9/30/2317
Schedule of Investments | 9/30/23 (continued)
| Shares | | | | | | Value |
| | Containers & Packaging — 0.9% | |
| 419 | Sealed Air Corp. | $ 13,768 |
| | Total Containers & Packaging | $13,768 |
|
|
| | Electric Utilities — 2.6% | |
| 528 | American Electric Power Co., Inc. | $ 39,716 |
| | Total Electric Utilities | $39,716 |
|
|
| | Energy Equipment & Services — 1.2% | |
| 469 | Halliburton Co. | $ 18,994 |
| | Total Energy Equipment & Services | $18,994 |
|
|
| | Food Products — 1.6% | |
| 619 | Campbell Soup Co. | $ 25,429 |
| | Total Food Products | $25,429 |
|
|
| | Health Care Providers & Services — 6.3% | |
| 322 | Cardinal Health, Inc. | $ 27,956 |
| 95 | Elevance Health, Inc. | 41,365 |
| 118 | HCA Healthcare, Inc. | 29,026 |
| | Total Health Care Providers & Services | $98,347 |
|
|
| | Household Durables — 0.9% | |
| 120 | Lennar Corp., Class A | $ 13,468 |
| | Total Household Durables | $13,468 |
|
|
| | Insurance — 5.0% | |
| 101 | Aflac, Inc. | $ 7,752 |
| 501 | American International Group, Inc. | 30,360 |
| 188 | Chubb, Ltd. | 39,138 |
| | Total Insurance | $77,250 |
|
|
| | IT Services — 3.2% | |
| 350 | International Business Machines Corp. | $ 49,105 |
| | Total IT Services | $49,105 |
|
|
| | Machinery — 3.1% | |
| 103 | Deere & Co. | $ 38,870 |
| 114 | Stanley Black & Decker, Inc. | 9,528 |
| | Total Machinery | $48,398 |
|
|
| | Media — 4.5% | |
| 1,278 | Comcast Corp., Class A | $ 56,667 |
| 427 | Fox Corp., Class A | 13,322 |
| | Total Media | $69,989 |
|
|
The accompanying notes are an integral part of these financial statements.
18Pioneer Intrinsic Value Fund | Annual Report | 9/30/23
| Shares | | | | | | Value |
| | Metals & Mining — 2.5% | |
| 549 | Freeport-McMoRan, Inc. | $ 20,472 |
| 69 | Reliance Steel & Aluminum Co. | 18,094 |
| | Total Metals & Mining | $38,566 |
|
|
| | Oil, Gas & Consumable Fuels — 13.7% | |
| 791 | BP Plc (A.D.R.) | $ 30,627 |
| 979 | EQT Corp. | 39,728 |
| 453 | Exxon Mobil Corp. | 53,264 |
| 934 | Range Resources Corp. | 30,271 |
| 920 | Shell Plc (A.D.R.) | 59,230 |
| | Total Oil, Gas & Consumable Fuels | $213,120 |
|
|
| | Pharmaceuticals — 4.2% | |
| 630 | Organon & Co. | $ 10,937 |
| 1,656 | Pfizer, Inc. | 54,929 |
| | Total Pharmaceuticals | $65,866 |
|
|
| | Semiconductors & Semiconductor Equipment — 3.1% | |
| 676 | Intel Corp. | $ 24,032 |
| 367 | Micron Technology, Inc. | 24,967 |
| | Total Semiconductors & Semiconductor Equipment | $48,999 |
|
|
| | Software — 1.3% | |
| 184 | Oracle Corp. | $ 19,489 |
| | Total Software | $19,489 |
|
|
| | Specialty Retail — 2.0% | |
| 12(a) | AutoZone, Inc. | $ 30,480 |
| | Total Specialty Retail | $30,480 |
|
|
| | Technology Hardware, Storage & Peripherals — 2.4% | |
| 2,194 | Hewlett Packard Enterprise Co. | $ 38,110 |
| | Total Technology Hardware, Storage & Peripherals | $38,110 |
|
|
| | Trading Companies & Distributors — 4.9% | |
| 789(a) | AerCap Holdings NV | $ 49,447 |
| 164 | Ferguson Plc | 26,973 |
| | Total Trading Companies & Distributors | $76,420 |
|
|
| | Total Common Stocks
(Cost $1,550,568) | $1,549,659 |
|
|
The accompanying notes are an integral part of these financial statements.
Pioneer Intrinsic Value Fund | Annual Report | 9/30/2319
Schedule of Investments | 9/30/23 (continued)
| Shares | | | | | | Value |
|
| | SHORT TERM INVESTMENTS — 3.3% of Net Assets | |
| | Open-End Fund — 3.3% | |
| 50,694(b) | Dreyfus Government Cash Management,
Institutional Shares, 5.22% | $ 50,694 |
| | | | | | | $ 50,694 |
|
|
| | TOTAL SHORT TERM INVESTMENTS
(Cost $50,694) | $50,694 |
|
|
| | TOTAL INVESTMENTS IN UNAFFILIATED ISSUERS — 102.9%
(Cost $1,601,262) | $ 1,600,353 |
| | OTHER ASSETS AND LIABILITIES — (2.9)% | $ (44,934) |
| | net assets — 100.0% | $1,555,419 |
| | | | | | | |
| (A.D.R.) | American Depositary Receipts. |
| (a) | Non-income producing security. |
| (b) | Rate periodically changes. Rate disclosed is the 7-day yield at September 30, 2023. |
Purchases and sales of securities (excluding short-term investments) for the year ended September 30, 2023, aggregated $525,648 and $317,749, respectively.
At September 30, 2023, the net unrealized depreciation on investments based on cost for federal tax purposes of $1,601,309 was as follows:
| Aggregate gross unrealized appreciation for all investments in which there is an excess of value over tax cost | $ 145,731 |
| Aggregate gross unrealized depreciation for all investments in which there is an excess of tax cost over value | (146,687) |
| Net unrealized depreciation | $ (956) |
The accompanying notes are an integral part of these financial statements.
20Pioneer Intrinsic Value Fund | Annual Report | 9/30/23
Various inputs are used in determining the value of the Fund's investments. These inputs are summarized in the three broad levels below.
| Level 1 | – | unadjusted quoted prices in active markets for identical securities. |
| Level 2 | – | other significant observable inputs (including quoted prices for similar securities, interest rates, prepayment speeds, credit risks, etc.). See Notes to Financial Statements — Note 1A. |
| Level 3 | – | significant unobservable inputs (including the Adviser's own assumptions in determining fair value of investments). See Notes to Financial Statements — Note 1A. |
The following is a summary of the inputs used as of September 30, 2023, in valuing the Fund's investments:
| | Level 1 | Level 2 | Level 3 | Total |
| Common Stocks | $1,549,659 | $— | $— | $1,549,659 |
| Open-End Fund | 50,694 | — | — | 50,694 |
| Total Investments in Securities | $ 1,600,353 | $ — | $ — | $ 1,600,353 |
During the year ended September 30, 2023, there were no transfers in or out of Level 3.
The accompanying notes are an integral part of these financial statements.
Pioneer Intrinsic Value Fund | Annual Report | 9/30/2321
Statement of Assets and Liabilities | 9/30/23
| ASSETS: | |
| Investments in unaffiliated issuers, at value (cost $1,601,262) | $1,600,353 |
| Receivables — | |
| Dividends | 1,424 |
| Due from the Adviser | 2,548 |
| Other assets | 16,933 |
| Total assets | $1,621,258 |
| LIABILITIES: | |
| Payables — | |
| Trustees' fees | $ 22 |
| Professional fees | 57,477 |
| Printing expense | 7,899 |
| Management fees | 77 |
| Administrative expenses | 41 |
| Distribution fees | 68 |
| Accrued expenses | 255 |
| Total liabilities | $ 65,839 |
| NET ASSETS: | |
| Paid-in capital | $1,544,940 |
| Distributable earnings | 10,479 |
| Net assets | $1,555,419 |
| NET ASSET VALUE PER SHARE: | |
| No par value (unlimited number of shares authorized) | |
| Class A (based on $668,428/66,541 shares) | $ 10.05 |
| Class C (based on $447,469/44,451 shares) | $ 10.07 |
| Class Y (based on $439,522/43,671 shares) | $ 10.06 |
| MAXIMUM OFFERING PRICE PER SHARE: | |
| Class A (based on $10.05 net asset value per share/100%-5.75% maximum sales charge) | $ 10.66 |
The accompanying notes are an integral part of these financial statements.
22Pioneer Intrinsic Value Fund | Annual Report | 9/30/23
Statement of Operations FOR THE YEAR ENDED 9/30/23
| INVESTMENT INCOME: | | |
| Dividends from unaffiliated issuers | $41,258 | |
| Total Investment Income | | $ 41,258 |
| EXPENSES: | | |
| Management fees | $ 6,643 | |
| Administrative expenses | 9,774 | |
| Transfer agent fees | | |
| Class A | 126 | |
| Class C | 49 | |
| Class Y | 67 | |
| Distribution fees | | |
| Class A | 1,439 | |
| Class C | 4,444 | |
| Shareowner communications expense | 402 | |
| Registration fees | 52,644 | |
| Professional fees | 94,182 | |
| Printing expense | 29,338 | |
| Officers' and Trustees' fees | 8,029 | |
| Insurance expense | 16 | |
| Miscellaneous | 2,745 | |
| Total expenses | | $ 209,898 |
| Less fees waived and expenses reimbursed by the Adviser | | (195,483) |
| Net expenses | | $ 14,415 |
| Net investment income | | $ 26,843 |
| REALIZED AND UNREALIZED GAIN (LOSS) ON INVESTMENTS: | | |
| Net realized gain (loss) on: | | |
| Investments in unaffiliated issuers | | $ 21,543 |
| Change in net unrealized appreciation (depreciation) on: | | |
| Investments in unaffiliated issuers | | $ 152,088 |
| Net realized and unrealized gain (loss) on investments | | $ 173,631 |
| Net increase in net assets resulting from operations | | $ 200,474 |
The accompanying notes are an integral part of these financial statements.
Pioneer Intrinsic Value Fund | Annual Report | 9/30/2323
Statements of Changes in Net Assets
| | Year
Ended
9/30/23 | Year
Ended
9/30/22 |
| FROM OPERATIONS: | | |
| Net investment income (loss) | $ 26,843 | $ 19,033 |
| Net realized gain (loss) on investments | 21,543 | (29,058) |
| Change in net unrealized appreciation (depreciation) on investments | 152,088 | (113,335) |
| Net increase (decrease) in net assets resulting from operations | $ 200,474 | $ (123,360) |
| DISTRIBUTIONS TO SHAREOWNERS: | | |
| Class A ($0.18 and $0.14 per share, respectively) | $ (8,635) | $ (4,083) |
| Class C ($0.10 and $— per share, respectively) | (4,242) | — |
| Class Y ($0.20 and $0.16 per share, respectively) | (9,396) | (6,486) |
| Total distributions to shareowners | $ (22,273) | $ (10,569) |
| FROM FUND SHARE TRANSACTIONS: | | |
| Net proceeds from sales of shares | $ 283,379 | $ 260,460 |
| Reinvestment of distributions | 22,273 | 10,569 |
| Cost of shares repurchased | (105,490) | (23,514) |
| Net increase in net assets resulting from Fund share transactions | $ 200,162 | $ 247,515 |
| Net increase in net assets | $ 378,363 | $ 113,586 |
| NET ASSETS: | | |
| Beginning of year | $1,177,056 | $1,063,470 |
| End of year | $1,555,419 | $ 1,177,056 |
The accompanying notes are an integral part of these financial statements.
24Pioneer Intrinsic Value Fund | Annual Report | 9/30/23
| | Year
Ended
9/30/23
Shares | Year
Ended
9/30/23
Amount | Year
Ended
9/30/22
Shares | Year
Ended
9/30/22
Amount |
| Class A | | | | |
| Shares sold | 28,310 | $280,979 | 13,668 | $141,161 |
| Reinvestment of distributions | 876 | 8,635 | 391 | 4,083 |
| Less shares repurchased | (6,100) | (62,357) | (711) | (4,362) |
| Net increase | 23,086 | $227,257 | 13,348 | $140,882 |
| Class C | | | | |
| Shares sold | 242 | $ 2,400 | 5,619 | $ 57,027 |
| Reinvestment of distributions | 427 | 4,242 | — | — |
| Less shares repurchased | — | — | — | (3,071) |
| Net increase | 669 | $ 6,642 | 5,619 | $ 53,956 |
| Class Y | | | | |
| Shares sold | — | $ — | 6,267 | $ 62,272 |
| Reinvestment of distributions | 953 | 9,396 | 622 | 6,486 |
| Less shares repurchased | (4,146) | (43,133) | (1,682) | (16,081) |
Net increase
(decrease) | (3,193) | $ (33,737) | 5,207 | $ 52,677 |
The accompanying notes are an integral part of these financial statements.
Pioneer Intrinsic Value Fund | Annual Report | 9/30/2325
| | Year
Ended
9/30/23 | Year
Ended
9/30/22 | 5/10/21* to
9/30/21 |
| Class A | | | |
| Net asset value, beginning of period | $ 8.77 | $ 9.68 | $ 10.00 |
| Increase (decrease) from investment operations: | | | |
| Net investment income (loss) (a) | $ 0.20 | $ 0.17 | $ 0.06 |
| Net realized and unrealized gain (loss) on investments | 1.26 | (0.94) | (0.38) |
| Net increase (decrease) from investment operations | $ 1.46 | $ (0.77) | $ (0.32) |
| Distributions to shareowners: | | | |
| Net investment income | $ (0.18) | $ (0.14) | $ — |
| Total distributions | $ (0.18) | $ (0.14) | $ — |
| Net increase (decrease) in net asset value | $ 1.28 | $ (0.91) | $ (0.32) |
| Net asset value, end of period | $ 10.05 | $ 8.77 | $ 9.68 |
| Total return (b) | 16.64% | (8.23)% | (3.20)%(c) |
| Ratio of net expenses to average net assets | 0.85% | 0.84% | 0.80%(d) |
| Ratio of net investment income (loss) to average net assets | 1.96% | 1.68% | 1.45%(d) |
| Portfolio turnover rate | 22% | 28% | 1%(c) |
| Net assets, end of period (in thousands) | $ 668 | $ 381 | $ 291 |
| Ratios with no waiver of fees and assumption of expenses by the Adviser and no reduction for fees paid indirectly: | | | |
| Total expenses to average net assets | 14.09% | 18.21% | 23.11%(d) |
| Net investment income (loss) to average net assets | (11.28)% | (15.69)% | (20.86)%(d) |
| * | Class A commenced operations on May 10, 2021. |
| (a) | The per-share data presented above is based on the average shares outstanding for the period presented. |
| (b) | Assumes initial investment at net asset value at the beginning of each period, reinvestment of all distributions, the complete redemption of the investment at net asset value at the end of each period and no sales charges. Total return would be reduced if sales charges were taken into account. |
| (c) | Not annualized. |
| (d) | Annualized. |
The accompanying notes are an integral part of these financial statements.
26Pioneer Intrinsic Value Fund | Annual Report | 9/30/23
| | Year
Ended
9/30/23 | Year
Ended
9/30/22 | 5/10/21* to
9/30/21 |
| Class C | | | |
| Net asset value, beginning of period | $ 8.78 | $ 9.65 | $ 10.00 |
| Increase (decrease) from investment operations: | | | |
| Net investment income (loss) (a) | $ 0.12 | $ 0.09 | $ 0.03 |
| Net realized and unrealized gain (loss) on investments | 1.27 | (0.96) | (0.38) |
| Net increase (decrease) from investment operations | $ 1.39 | $ (0.87) | $ (0.35) |
| Distributions to shareowners: | | | |
| Net investment income | $ (0.10) | $ — | $ — |
| Total distributions | $ (0.10) | $ — | $ — |
| Net increase (decrease) in net asset value | $ 1.29 | $ (0.87) | $ (0.35) |
| Net asset value, end of period | $ 10.07 | $ 8.78 | $ 9.65 |
| Total return (b) | 15.81% | (9.02)% | (3.50)%(c) |
| Ratio of net expenses to average net assets | 1.58% | 1.58% | 1.60%(d) |
| Ratio of net investment income (loss) to average net assets | 1.21% | 0.90% | 0.65%(d) |
| Portfolio turnover rate | 22% | 28% | 1%(c) |
| Net assets, end of period (in thousands) | $ 447 | $ 384 | $ 368 |
| Ratios with no waiver of fees and assumption of expenses by the Adviser and no reduction for fees paid indirectly: | | | |
| Total expenses to average net assets | 14.81% | 18.96% | 23.98%(d) |
| Net investment income (loss) to average net assets | (12.02)% | (16.48)% | (21.73)%(d) |
| * | Class C commenced operations on May 10, 2021. |
| (a) | The per-share data presented above is based on the average shares outstanding for the period presented. |
| (b) | Assumes initial investment at net asset value at the beginning of each period, reinvestment of all distributions, the complete redemption of the investment at net asset value at the end of each period and no sales charges. Total return would be reduced if sales charges were taken into account. |
| (c) | Not annualized. |
| (d) | Annualized. |
The accompanying notes are an integral part of these financial statements.
Pioneer Intrinsic Value Fund | Annual Report | 9/30/2327
Financial Highlights (continued)
| | Year
Ended
9/30/23 | Year
Ended
9/30/22 | 5/10/21* to
9/30/21 |
| Class Y | | | |
| Net asset value, beginning of period | $ 8.78 | $ 9.69 | $ 10.00 |
| Increase (decrease) from investment operations: | | | |
| Net investment income (loss) (a) | $ 0.22 | $ 0.20 | $ 0.07 |
| Net realized and unrealized gain (loss) on investments | 1.26 | (0.95) | (0.38) |
| Net increase (decrease) from investment operations | $ 1.48 | $ (0.75) | $ (0.31) |
| Distributions to shareowners: | | | |
| Net investment income | $ (0.20) | $ (0.16) | $ — |
| Total distributions | $ (0.20) | $ (0.16) | $ — |
| Net increase (decrease) in net asset value | $ 1.28 | $ (0.91) | $ (0.31) |
| Net asset value, end of period | $ 10.06 | $ 8.78 | $ 9.69 |
| Total return (b) | 16.91% | (8.04)% | (3.10)%(c) |
| Ratio of net expenses to average net assets | 0.55% | 0.55% | 0.55%(d) |
| Ratio of net investment income (loss) to average net assets | 2.24% | 1.95% | 1.70%(d) |
| Portfolio turnover rate | 22% | 28% | 1%(c) |
| Net assets, end of period (in thousands) | $ 440 | $ 412 | $ 404 |
| Ratios with no waiver of fees and assumption of expenses by the Adviser and no reduction for fees paid indirectly: | | | |
| Total expenses to average net assets | 13.81% | 17.95% | 22.87%(d) |
| Net investment income (loss) to average net assets | (11.02)% | (15.45)% | (20.62)%(d) |
| * | Class Y commenced operations on May 10, 2021. |
| (a) | The per-share data presented above is based on the average shares outstanding for the period presented. |
| (b) | Assumes initial investment at net asset value at the beginning of each period, reinvestment of all distributions and the complete redemption of the investment at net asset value at the end of each period. |
| (c) | Not annualized. |
| (d) | Annualized. |
The accompanying notes are an integral part of these financial statements.
28Pioneer Intrinsic Value Fund | Annual Report | 9/30/23
Notes to Financial Statements | 9/30/23
1. Organization and Significant Accounting Policies
Pioneer Intrinsic Value Fund (the “Fund”) is one of five portfolios comprising Pioneer Series Trust XIV (the "Trust"), a Delaware statutory trust. The Fund is registered under the Investment Company Act of 1940, as amended (the "1940 Act"), as a diversified, open-end management investment company. The Fund’s investment objective is to seek long-term capital growth.
The Fund offers three classes of shares designated as Class A, Class C and Class Y shares. Class A, Class C and Class Y commenced operations on May 10, 2021. Each class of shares represents an interest in the same portfolio of investments of the Fund and has identical rights (based on relative net asset values) to assets and liquidation proceeds. Share classes can bear different rates of class-specific fees and expenses, such as transfer agent and distribution fees. Differences in class-specific fees and expenses will result in differences in net investment income and, therefore, the payment of different dividends from net investment income earned by each class. The Amended and Restated Declaration of Trust of the Trust gives the Board of Trustees the flexibility to specify either per-share voting or dollar-weighted voting when submitting matters for shareowner approval. Under per-share voting, each share of a class of the Fund is entitled to one vote. Under dollar-weighted voting, a shareowner’s voting power is determined not by the number of shares owned, but by the dollar value of the shares on the record date. Each share class has exclusive voting rights with respect to matters affecting only that class, including with respect to the distribution plan for that class. There is no distribution plan for Class Y shares.
Amundi Asset Management US, Inc., an indirect, wholly owned subsidiary of Amundi and Amundi’s wholly owned subsidiary, Amundi USA, Inc., serves as the Fund’s investment adviser (the “Adviser”). Amundi Distributor US, Inc., an affiliate of the Adviser, serves as the Fund’s distributor (the “Distributor”).
In March 2020, FASB issued an Accounting Standard Update, ASU 2020-04, Reference Rate Reform (Topic 848) — Facilitation of the Effects of Reference Rate Reform on Financial Reporting (“ASU 2020-04”), which provides optional, temporary relief with respect to the financial reporting of contracts subject to certain types of modifications due to the planned discontinuation of the London Interbank Offered Rate (“LIBOR”) and other LIBOR-based reference rates at the end of 2021. The temporary relief provided by ASU 2020-04 is effective for certain reference rate-related
Pioneer Intrinsic Value Fund | Annual Report | 9/30/2329
contract modifications that occur during the period from March 12, 2020 through December 31, 2023. Management is evaluating the impact of ASU 2020-04 on the Fund's investments, derivatives, debt and other contracts, if applicable, that will undergo reference rate-related modifications as a result of the reference rate reform.
The Fund is required to comply with Rule 18f-4 under the 1940 Act, which governs the use of derivatives by registered investment companies. Rule 18f-4 permits funds to enter into derivatives transactions (as defined in Rule 18f-4) and certain other transactions notwithstanding the restrictions on the issuance of “senior securities” under Section 18 of the 1940 Act. Rule 18f-4 requires a fund to establish and maintain a comprehensive derivatives risk management program, appoint a derivatives risk manager and comply with a relative or absolute limit on fund leverage risk calculated based on value-at-risk (“VaR”), unless the fund uses derivatives in only a limited manner (a "limited derivatives user"). The Fund is currently a limited derivatives user for purposes of Rule 18f-4.
The Fund is an investment company and follows investment company accounting and reporting guidance under U.S. Generally Accepted Accounting Principles (“U.S. GAAP”). U.S. GAAP requires the management of the Fund to make estimates and assumptions that affect the reported amounts of assets and liabilities, the disclosure of contingent assets and liabilities at the date of the financial statements, and the reported amounts of income, expenses and gain or loss on investments during the reporting period. Actual results could differ from those estimates.
The following is a summary of significant accounting policies followed by the Fund in the preparation of its financial statements:
| A. | Security Valuation |
| | The net asset value of the Fund is computed once daily, on each day the New York Stock Exchange (“NYSE”) is open, as of the close of regular trading on the NYSE. |
| | Equity securities that have traded on an exchange are valued by using the last sale price on the principal exchange where they are traded. Equity securities that have not traded on the date of valuation, or securities for which sale prices are not available, generally are valued using the mean between the last bid and asked prices or, if both last bid and asked prices are not available, at the last quoted bid price. Last sale and bid and asked prices are provided by independent third party pricing services. In the case of equity securities not traded on an exchange, prices are typically determined by independent third party pricing services using a variety of techniques and methods. |
30Pioneer Intrinsic Value Fund | Annual Report | 9/30/23
| | The value of foreign securities is translated into U.S. dollars based on foreign currency exchange rate quotations supplied by a third party pricing source. Trading in non-U.S. equity securities is substantially completed each day at various times prior to the close of the NYSE. The values of such securities used in computing the net asset value of the Fund's shares are determined as of such times. The Adviser may use a fair value model developed by an independent pricing service to value non-U.S. equity securities. |
| | Shares of open-end registered investment companies (including money market mutual funds) are valued at such funds’ net asset value. |
| | Securities for which independent pricing services or broker-dealers are unable to supply prices or for which market prices and/or quotations are not readily available or are considered to be unreliable are valued by a fair valuation team comprised of certain personnel of the Adviser. The Adviser is designated as the valuation designee for the Fund pursuant to Rule 2a-5 under the 1940 Act. The Adviser’s fair valuation team is responsible for monitoring developments that may impact fair valued securities. |
| | Inputs used when applying fair value methods to value a security may include credit ratings, the financial condition of the company, current market conditions and comparable securities. The Adviser may use fair value methods if it is determined that a significant event has occurred after the close of the exchange or market on which the security trades and prior to the determination of the Fund's net asset value. Examples of a significant event might include political or economic news, corporate restructurings, natural disasters, terrorist activity or trading halts. Thus, the valuation of the Fund's securities may differ significantly from exchange prices, and such differences could be material. |
| B. | Investment Income and Transactions |
| | Dividend income is recorded on the ex-dividend date, except that certain dividends from foreign securities where the ex-dividend date may have passed are recorded as soon as the Fund becomes aware of the ex-dividend data in the exercise of reasonable diligence. |
| | Interest and dividend income payable by delivery of additional shares is reclassified as PIK (payment-in-kind) income upon receipt and is included in interest and dividend income, respectively. |
Pioneer Intrinsic Value Fund | Annual Report | 9/30/2331
| | Security transactions are recorded as of trade date. Gains and losses on sales of investments are calculated on the identified cost method for both financial reporting and federal income tax purposes. |
| C. | Foreign Currency Translation |
| | The books and records of the Fund are maintained in U.S. dollars. Amounts denominated in foreign currencies are translated into U.S. dollars using current exchange rates. |
| | Net realized gains and losses on foreign currency transactions, if any, represent, among other things, the net realized gains and losses on foreign currency exchange contracts, disposition of foreign currencies and the difference between the amount of income accrued and the U.S. dollars actually received. Further, the effects of changes in foreign currency exchange rates on investments are not segregated on the Statement of Operations from the effects of changes in the market prices of those securities, but are included with the net realized and unrealized gain or loss on investments. |
| D. | Federal Income Taxes |
| | It is the Fund's policy to comply with the requirements of the Internal Revenue Code applicable to regulated investment companies and to distribute all of its net taxable income and net realized capital gains, if any, to its shareowners. Therefore, no provision for federal income taxes is required. As of September 30, 2023, the Fund did not accrue any interest or penalties with respect to uncertain tax positions, which, if applicable, would be recorded as an income tax expense on the Statement of Operations. Tax returns filed within the prior three years remain subject to examination by federal and state tax authorities. |
| | The amount and character of income and capital gain distributions to shareowners are determined in accordance with federal income tax rules, which may differ from U.S. GAAP. Distributions in excess of net investment income or net realized gains are temporary over distributions for financial statement purposes resulting from differences in the recognition or classification of income or distributions for financial statement and tax purposes. Capital accounts within the financial statements are adjusted for permanent book/tax differences to reflect tax character, but are not adjusted for temporary differences. |
| | At September 30, 2023, the Fund was permitted to carry forward indefinitely $7,468 of short-term losses and $0 of long-term losses. |
32Pioneer Intrinsic Value Fund | Annual Report | 9/30/23
| | The tax character of distributions paid during the years ended September 30, 2023 and September 30, 2022, was as follows: |
| | 2023 | 2022 |
| Distributions paid from: | | |
| Ordinary income | $22,273 | $10,569 |
| Total | $22,273 | $ 10,569 |
The following shows the components of distributable earnings (losses) on a federal income tax basis at September 30, 2023:
| | 2023 |
| Distributable earnings/(losses): | |
| Undistributed ordinary income | $18,903 |
| Capital loss carryforward | (7,468) |
| Net unrealized depreciation | (956) |
| Total | $ 10,479 |
The differences between book-basis and tax-basis net unrealized depreciation are attributable to the tax deferral of losses on wash sales.
| E. | Fund Shares |
| | The Fund records sales and repurchases of its shares as of trade date. The Distributor earned $76 in underwriting commissions on the sale of Class A shares during the year ended September 30, 2023. |
| F. | Class Allocations |
| | Income, common expenses and realized and unrealized gains and losses are calculated at the Fund level and allocated daily to each class of shares based on its respective percentage of adjusted net assets at the beginning of the day. |
| | Distribution fees are calculated based on the average daily net asset value attributable to Class A and Class C shares of the Fund, respectively (see Note 5). Class Y shares do not pay distribution fees. All expenses and fees paid to the Fund's transfer agent for its services are allocated among the classes of shares based on the number of accounts in each class and the ratable allocation of related out-of-pocket expenses (see Note 4). |
| | Distributions to shareowners are recorded as of the ex-dividend date. Distributions paid by the Fund with respect to each class of shares are calculated in the same manner and at the same time, except that net investment income dividends to Class A, Class C and Class Y shares can reflect different transfer agent and distribution expense rates. |
Pioneer Intrinsic Value Fund | Annual Report | 9/30/2333
| G. | Risks |
| | The value of securities held by the Fund may go up or down, sometimes rapidly or unpredictably, due to general market conditions, such as real or perceived adverse economic, political or regulatory conditions, recessions, the spread of infectious illness or other public health issues, inflation, changes in interest rates, armed conflict including Russia's military invasion of Ukraine, sanctions against Russia, other nations or individuals or companies and possible countermeasures, lack of liquidity in the bond markets or adverse investor sentiment. In the past several years, financial markets have experienced increased volatility, depressed valuations, decreased liquidity and heightened uncertainty. These conditions may continue, recur, worsen or spread. Inflation and interest rates have increased and may rise further. These circumstances could adversely affect the value and liquidity of the Fund's investments and negatively impact the Fund's performance. |
| | The long-term impact of the COVID-19 pandemic and its subsequent variants on economies, markets, industries and individual issuers, are not known. Some sectors of the economy and individual issuers have experienced or may experience particularly large losses. Periods of extreme volatility in the financial markets, reduced liquidity of many instruments, increased government debt, inflation, and disruptions to supply chains, consumer demand and employee availability, may continue for some time. Following Russia's invasion of Ukraine, Russian securities lost all, or nearly all, their market value. Other securities or markets could be similarly affected by past or future political, geopolitical or other events or conditions. |
| | Governments and central banks, including the U.S. Federal Reserve, have taken extraordinary and unprecedented actions to support local and global economies and the financial markets. These actions have resulted in significant expansion of public debt, including in the U.S. The consequences of high public debt, including its future impact on the economy and securities markets, may not be known for some time. |
| | The U.S. and other countries are periodically involved in disputes over trade and other matters, which may result in tariffs, investment restrictions and adverse impacts on affected companies and securities. For example, the U.S. has imposed tariffs and other trade barriers on Chinese exports, has restricted sales of certain categories of goods to China, and has established barriers to investments in China. Trade disputes may adversely affect the economies of the U.S. and its trading partners, as well as companies directly or indirectly affected and financial markets generally. If the political climate between the U.S. and |
34Pioneer Intrinsic Value Fund | Annual Report | 9/30/23
| | China does not improve or continues to deteriorate, if China were to attempt unification of Taiwan by force, or if other geopolitical conflicts develop or get worse, economies, markets and individual securities may be severely affected both regionally and globally, and the value of the Fund's assets may go down. |
| | At times, the Fund’s investments may represent industries or industry sectors that are interrelated or have common risks, making the Fund more susceptible to any economic, political, or regulatory developments or other risks affecting those industries and sectors. |
| | The Fund may invest in equity securities of large companies. Large companies may fall out of favor with investors and underperform the overall equity market. |
| | Russia launched a large-scale invasion of Ukraine on February 24, 2022. In response to the military action by Russia, various countries, including the U.S., the United Kingdom, and European Union issued broad-ranging economic sanctions against Russia and Belarus and certain companies and individuals. Since then, Russian securities have lost all, or nearly all, their market value, and many other issuers, securities and markets have been adversely affected. The United States and other countries may impose sanctions on other countries, companies and individuals in light of Russia’s military invasion. The extent and duration of the military action or future escalation of such hostilities, the extent and impact of existing and future sanctions, market disruptions and volatility, and the result of any diplomatic negotiations cannot be predicted. These and any related events could have a significant impact on the value and liquidity of certain Fund investments, on Fund performance and the value of an investment in the Fund, particularly with respect to securities and commodities, such as oil, natural gas and food commodities, as well as other sectors with exposure to Russian issuers or issuers in other countries affected by the invasion, and are likely to have collateral impacts on market sectors globally. |
| | With the increased use of technologies such as the Internet to conduct business, the Fund is susceptible to operational, information security and related risks. While the Fund’s Adviser has established business continuity plans in the event of, and risk management systems to prevent, limit or mitigate, such cyber-attacks, there are inherent limitations in such plans and systems, including the possibility that certain risks have not been identified. Furthermore, the Fund cannot control the cybersecurity plans and systems put in place by service providers to the Fund such as the Fund's custodian and accounting agent, and the Fund’s transfer agent. In addition, many beneficial |
Pioneer Intrinsic Value Fund | Annual Report | 9/30/2335
| | owners of Fund shares hold them through accounts at broker-dealers, retirement platforms and other financial market participants over which neither the Fund nor the Adviser exercises control. Each of these may in turn rely on service providers to them, which are also subject to the risk of cyber-attacks. Cybersecurity failures or breaches at the Adviser or the Fund’s service providers or intermediaries have the ability to cause disruptions and impact business operations, potentially resulting in financial losses, interference with the Fund’s ability to calculate its net asset value, impediments to trading, the inability of Fund shareowners to effect share purchases, redemptions or exchanges or receive distributions, loss of or unauthorized access to private shareowner information and violations of applicable privacy and other laws, regulatory fines, penalties, reputational damage, or additional compliance costs. Such costs and losses may not be covered under any insurance. In addition, maintaining vigilance against cyber-attacks may involve substantial costs over time, and system enhancements may themselves be subject to cyber-attacks. |
| | The Fund’s prospectus contains unaudited information regarding the Fund’s principal risks. Please refer to that document when considering the Fund’s principal risks. |
2. Management Agreement
The Adviser manages the Fund’s portfolio. Management fees payable under the Fund’s Investment Management Agreement with the Adviser are calculated daily and paid monthly at the annual rate of 0.45% of the Fund’s average daily net assets up to $1 billion and 0.40% of the Fund’s average daily net assets over $1 billion. For the year ended September 30, 2023, the effective management fee (excluding waivers and/or assumption of expenses) was equivalent to 0.45% of the Fund’s average daily net assets.
The Adviser has contractually agreed to waive and/or reimburse ordinary operating expenses (ordinary operating expenses means all Fund expenses other than taxes, brokerage commissions, acquired fund fees and expenses, and extraordinary expenses, such as litigation) to the extent required to reduce Fund expenses to 0.85%, 1.60% and 0.55% of the average daily net assets attributable to Class A, Class C and Class Y shares, respectively. These expense limitations are in effect through February 1, 2024. There can be no assurance that the Adviser will extend the expense limitation agreement for a class of shares beyond the date referred to above. Fees waived and expenses reimbursed during the year ended September 30, 2023 are reflected on the Statement of Operations.
36Pioneer Intrinsic Value Fund | Annual Report | 9/30/23
In addition, under the management and administration agreements, certain other services and costs, including accounting, regulatory reporting and insurance premiums, are paid by the Fund as administrative reimbursements. Reflected on the Statement of Assets and Liabilities is $77 in management fees payable to the Adviser at September 30, 2023.
3. Compensation of Officers and Trustees
The Fund pays an annual fee to its Trustees. The Adviser reimburses the Fund for fees paid to the Interested Trustees. Except for the chief compliance officer, the Fund does not pay any salary or other compensation to its officers. The Fund pays a portion of the chief compliance officer's compensation for his services as the Fund's chief compliance officer. Amundi US pays the remaining portion of the chief compliance officer's compensation. For the year ended September 30, 2023, the Fund paid $8,029 in Officers' and Trustees' compensation, which is reflected on the Statement of Operations as Officers' and Trustees' fees. At September 30, 2023, on its Statement of Assets and Liabilities, the Fund had a payable for Trustees' fees of $22 and a payable for administrative expenses of $41, which includes the payable for Officers' compensation.
4. Transfer Agent
BNY Mellon Investment Servicing (US) Inc. serves as the transfer agent to the Fund at negotiated rates. Transfer agent fees and payables shown on the Statement of Operations and the Statement of Assets and Liabilities, respectively, include sub-transfer agent expenses incurred through the Fund’s omnibus relationship contracts.
In addition, the Fund reimbursed the transfer agent for out-of-pocket expenses incurred by the transfer agent related to shareowner communications activities such as proxy and statement mailings, and outgoing phone calls. For the year ended September 30, 2023, such out-of-pocket expenses by class of shares were as follows:
| Shareowner Communications: | |
| Class A | $227 |
| Class C | 88 |
| Class Y | 87 |
| Total | $402 |
5. Distribution Plan
The Fund has adopted a distribution plan (the “Plan”) pursuant to Rule 12b-1 of the Investment Company Act of 1940 with respect to its Class A and Class C shares. Pursuant to the Plan, the Fund pays the Distributor 0.25% of the average daily net assets attributable to Class A
Pioneer Intrinsic Value Fund | Annual Report | 9/30/2337
shares as compensation for personal services and/or account maintenance services or distribution services with regard to Class A shares. Pursuant to the Plan, the Fund also pays the Distributor 1.00% of the average daily net assets attributable to Class C shares. The fee for Class C shares consists of a 0.25% service fee and a 0.75% distribution fee paid as compensation for personal services and/or account maintenance services or distribution services with regard to Class C shares. Reflected on the Statement of Assets and Liabilities is $68 in distribution fees payable to the Distributor at September 30, 2023.
In addition, redemptions of Class A and Class C shares may be subject to a contingent deferred sales charge (“CDSC”). A CDSC of 1.00% may be imposed on redemptions of certain net asset value purchases of Class A shares within 12 months of purchase. Redemptions of Class C shares within 12 months of purchase are subject to a CDSC of 1.00%, based on the lower of cost or market value of shares being redeemed. Shares purchased as part of an exchange remain subject to any CDSC that applied to the original purchase of those shares. There is no CDSC for Class Y shares. Proceeds from the CDSCs are paid to the Distributor. For the year ended September 30, 2023, CDSCs in the amount of $0 were paid to the Distributor.
38Pioneer Intrinsic Value Fund | Annual Report | 9/30/23
Report of Independent Registered Public Accounting Firm
To the Board of Trustees of Pioneer Series Trust XIV and the Shareholders of Pioneer Intrinsic Value Fund:
Opinion on the Financial Statements
We have audited the accompanying statement of assets and liabilities of Pioneer Intrinsic Value Fund (the “Fund”) (one of the funds constituting Pioneer Series Trust XIV (the “Trust”)), including the schedule of investments, as of September 30, 2023, and the related statement of operations for the year then ended, the statements of changes in net assets for each of the two years in the period then ended and the financial highlights each of the two years in the period then ended and the period from May 10, 2021 (commencement of operations) through September 30, 2021 and the related notes (collectively referred to as the “financial statements”). In our opinion, the financial statements present fairly, in all material respects, the financial position of the Fund (one of the funds constituting Pioneer Series Trust XIV) at September 30, 2023, and the results of its operations for the year then ended, the changes in its net assets for each of the two years in the period then ended and its financial highlights for each of the two years in the period then ended and the period from May 10, 2021 (commencement of operations) through September 30, 2021, in conformity with U.S. generally accepted accounting principles.
Basis for Opinion
These financial statements are the responsibility of the Trust’s management. Our responsibility is to express an opinion on the Fund’s financial statements based on our audits. We are a public accounting firm registered with the Public Company Accounting Oversight Board (United States) (“PCAOB”) and are required to be independent with respect to the Company in accordance with the U.S. federal securities law and the applicable rules and regulations of the Securities and Exchange Commission and the PCAOB.
We conducted our audits in accordance with the standards of the PCAOB. Those standards require that we plan and perform the audit to obtain reasonable assurance about whether the financial statements are free of material misstatement, whether due to error or fraud. The Trust is not required to have, nor were we engaged to perform, an audit of the Trust’s internal control over financial reporting. As part of our audits, we are required to obtain an understanding of internal control over financial reporting, but not for the purpose of expressing an opinion on the
Pioneer Intrinsic Value Fund | Annual Report | 9/30/2339
effectiveness of the Trust’s internal control over financial reporting. Accordingly, we express no such opinion.
Our audits included performing procedures to assess the risks of material misstatement of the financial statements, whether due to error or fraud, and performing procedures that respond to those risks. Such procedures included examining, on a test basis, evidence regarding the amounts and disclosures in the financial statements. Our procedures included confirmation of securities owned as of September 30, 2023, by correspondence with the custodian and brokers; when replies were not received from brokers, we performed other auditing procedures. Our audits also included evaluating the accounting principles used and significant estimates made by management, as well as evaluating the overall presentation of the financial statements. We believe that our audits provide a reasonable basis for our opinion.
We have served as the auditor of one or more investment companies in the Pioneer family of funds since 2017.
Boston, Massachusetts
November 28, 2023
40Pioneer Intrinsic Value Fund | Annual Report | 9/30/23
Additional Information (unaudited)
For the year ended September 30, 2023 , certain dividends paid by the Fund may be subject to a maximum tax rate of 20%, as provided for by the Jobs and Growth Tax Relief Reconciliation Act (the Act) of 2003. The Fund intends to designate up to the maximum amount of such dividends allowable under the Act, as taxed at a maximum rate of 20%. Complete information will be computed and reported in conjunction with your 2023 Form 1099-DIV.
The qualifying percentage of the Fund’s ordinary income dividends for the purpose of the corporate dividends received deduction was 100.00%.
Pioneer Intrinsic Value Fund | Annual Report | 9/30/2341
Approval of Renewal of Investment Management Agreement
Amundi Asset Management US, Inc. (“Amundi US”) serves as the investment adviser to Pioneer Intrinsic Value Fund (the “Fund”) pursuant to an investment management agreement between Amundi US and the Fund. In order for Amundi US to remain the investment adviser of the Fund, the Trustees of the Fund, including a majority of the Fund’s Independent Trustees, must determine annually whether to renew the investment management agreement for the Fund.
The contract review process began in January 2023 as the Trustees of the Fund agreed on, among other things, an overall approach and timeline for the process. Contract review materials were provided to the Trustees in March 2023, July 2023 and September 2023. In addition, the Trustees reviewed and discussed the Fund’s performance at regularly scheduled meetings throughout the year, and took into account other information related to the Fund provided to the Trustees at regularly scheduled meetings, in connection with the review of the Fund’s investment management agreement.
In March 2023, the Trustees, among other things, discussed the memorandum provided by Fund counsel that summarized the legal standards and other considerations that are relevant to the Trustees in their deliberations regarding the renewal of the investment management agreement, and reviewed and discussed the qualifications of the investment management teams for the Fund, as well as the level of investment by the Fund’s portfolio managers in the Fund. In July 2023, the Trustees, among other things, reviewed the Fund’s management fees and total expense ratios, the financial statements of Amundi US and its parent companies, profitability analyses provided by Amundi US, and analyses from Amundi US as to possible economies of scale. The Trustees also reviewed the profitability of the institutional business of Amundi US as compared to that of Amundi US’s fund management business, and considered the differences between the fees and expenses of the Fund and the fees and expenses of Amundi US’s institutional accounts, as well as the different services provided by Amundi US to the Fund and to the institutional accounts. The Trustees further considered contract review materials, including additional materials received in response to the Trustees’ request, in September 2023.
At a meeting held on September 19, 2023, based on their evaluation of the information provided by Amundi US and third parties, the Trustees of the Fund, including the Independent Trustees voting separately advised by independent counsel, unanimously approved the renewal of the investment
42Pioneer Intrinsic Value Fund | Annual Report | 9/30/23
management agreement for another year. In approving the renewal of the investment management agreement, the Trustees considered various factors that they determined were relevant, including the factors described below. The Trustees did not identify any single factor as the controlling factor in determining to approve the renewal of the agreement.
Nature, Extent and Quality of Services
The Trustees considered the nature, extent and quality of the services that had been provided by Amundi US to the Fund, taking into account the investment objective and strategy of the Fund. The Trustees also reviewed Amundi US’s investment approach for the Fund and its research process. The Trustees considered Amundi US’ integration of environmental, social and governance (ESG) considerations into its investment research process. The Trustees considered the resources of Amundi US and the personnel of Amundi US who provide investment management services to the Fund. They also reviewed the amount of non-Fund assets managed by the portfolio managers of the Fund. They considered the non-investment resources and personnel of Amundi US that are involved in Amundi US’s services to the Fund, including Amundi US’s compliance, risk management, and legal resources and personnel. The Trustees considered the compliance services being provided to the Fund by Amundi US and how Amundi US has addressed any compliance issues during the past year. The Trustees noted the substantial attention and high priority given by Amundi US’s senior management to the Pioneer Fund complex, including with respect to the increasing regulation to which the Pioneer Funds are subject.
The Trustees considered that Amundi US supervises and monitors the performance of the Fund’s service providers and provides the Fund with personnel (including Fund officers) and other resources that are necessary for the Fund’s business management and operations. The Trustees also considered that, as administrator, Amundi US is responsible for the administration of the Fund’s business and other affairs. The Trustees considered that the Fund reimburses Amundi US its pro rata share of Amundi US’s costs of providing administration services to the Pioneer Funds.
Based on these considerations, the Trustees concluded that the nature, extent and quality of services that had been provided by Amundi US to the Fund were satisfactory and consistent with the terms of the investment management agreement.
Performance of the Fund
In considering the Fund’s performance, the Trustees regularly review and discuss throughout the year data prepared by Amundi US and information
Pioneer Intrinsic Value Fund | Annual Report | 9/30/2343
comparing the Fund’s performance with the performance of its peer group of funds, as classified by Morningstar, Inc. (Morningstar), and with the performance of the Fund’s benchmark index. They also discuss the Fund’s performance with Amundi US on a regular basis. The Trustees’ regular reviews and discussions were factored into the Trustees’ deliberations concerning the renewal of the investment management agreement.
Management Fee and Expenses
The Trustees considered information showing the fees and expenses of the Fund in comparison to the management fees of its peer group of funds as classified by Morningstar and also to the expense ratios of a peer group of funds selected on the basis of criteria determined by the Independent Trustees for this purpose using data provided by Strategic Insight Mutual Fund Research and Consulting, LLC (Strategic Insight), an independent third party. The peer group comparisons referred to below are organized in quintiles. Each quintile represents one-fifth of the peer group. In all peer group comparisons referred to below, first quintile is most favorable to the Fund’s shareowners. The Trustees noted that they separately review and consider the impact of the Fund’s transfer agency and Fund- and Amundi US-paid expenses for sub-transfer agency and intermediary arrangements, and that the results of the most recent such review were considered in the consideration of the Fund’s expense ratio.
The Trustees considered that the Fund’s management fee for the most recent fiscal year was in the fifth quintile relative to the management fees paid by other funds in its Morningstar category for the comparable period. The Trustees noted Amundi US’s explanation of the reasons that the Fund’s management fee was in the fifth quintile relative to the management fees paid by other funds in its Morningstar category. The Trustees considered that the expense ratio of the Fund’s Class Y shares for the most recent fiscal year was in the first quintile relative to its Strategic Insight peer group for the comparable period. The Trustees considered that the expense ratio of the Fund’s Class A shares for the most recent fiscal year was in the first quintile relative to its Strategic Insight peer group for the comparable period. The Trustees noted that Amundi US had agreed to waive fees and/or reimburse expenses in order to limit the ordinary operating expenses of the Fund.
The Trustees reviewed management fees charged by Amundi US to institutional and other clients, including publicly offered European funds sponsored by Amundi US’s affiliates, unaffiliated U.S. registered investment companies (in a sub-advisory capacity), and unaffiliated foreign and domestic separate accounts. The Trustees also considered Amundi US’s costs in providing services to the Fund and Amundi US’s costs in providing
44Pioneer Intrinsic Value Fund | Annual Report | 9/30/23
services to the other clients and considered the differences in management fees and profit margins for fund and non-fund services. In evaluating the fees associated with Amundi US’s client accounts, the Trustees took into account the respective demands, resources and complexity associated with the Fund and other client accounts. The Trustees noted that, in some instances, the fee rates for those clients were lower than the management fee for the Fund and considered that, under the investment management and administration agreements with the Fund, Amundi US performs additional services for the Fund that it does not provide to those other clients or services that are broader in scope, including oversight of the Fund’s other service providers and activities related to compliance and the extensive regulatory and tax regimes to which the Fund is subject. The Trustees also considered the entrepreneurial risks associated with Amundi US’s management of the Fund.
The Trustees concluded that the management fee payable by the Fund to Amundi US was reasonable in relation to the nature and quality of the services provided by Amundi US.
Profitability
The Trustees considered information provided by Amundi US regarding the profitability of Amundi US with respect to the advisory services provided by Amundi US to the Fund, including the methodology used by Amundi US in allocating certain of its costs to the management of the Fund. The Trustees also considered Amundi US’s profit margin in connection with the overall operation of the Fund. They further reviewed the financial results, including the profit margins, realized by Amundi US from non-fund businesses. The Trustees considered Amundi US’s profit margins in comparison to the limited industry data available and noted that the profitability of any adviser was affected by numerous factors, including its organizational structure and method for allocating expenses. The Trustees concluded that Amundi US’s profitability with respect to the management of the Fund was not unreasonable.
Economies of Scale
The Trustees considered Amundi US’s views relating to economies of scale in connection with the Pioneer Funds as fund assets grow and the extent to which any such economies of scale are shared with the Fund and Fund shareholders. The Trustees recognize that economies of scale are difficult to identify and quantify, and that, among other factors that may be relevant, are the following: fee levels, expense subsidization, investment by Amundi US in research and analytical capabilities and Amundi US’s commitment and resource allocation to the Fund. The Trustees noted that profitability also may be an indicator of the availability of any economies of scale,
Pioneer Intrinsic Value Fund | Annual Report | 9/30/2345
although profitability may vary for other reasons including due to reductions in expenses. The Trustees concluded that economies of scale, if any, were being appropriately shared with the Fund.
Other Benefits
The Trustees considered the other benefits that Amundi US enjoys from its relationship with the Fund. The Trustees considered the character and amount of fees paid or to be paid by the Fund, other than under the investment management agreement, for services provided by Amundi US and its affiliates. The Trustees further considered the revenues and profitability of Amundi US’s businesses other than the Fund business. To the extent applicable, the Trustees also considered the benefits to the Fund and to Amundi US and its affiliates from the use of “soft” commission dollars generated by the Fund to pay for research and brokerage services.
The Trustees considered that Amundi US is the principal U.S. asset management business of Amundi, which is one of the largest asset managers globally. Amundi’s worldwide asset management business manages over $2.1 trillion in assets (including the Pioneer Funds). The Trustees considered that Amundi US’s relationship with Amundi creates potential opportunities for Amundi US and Amundi that derive from Amundi US’s relationships with the Fund, including Amundi’s ability to market the services of Amundi US globally. The Trustees noted that Amundi US has access to additional research and portfolio management capabilities as a result of its relationship with Amundi and Amundi’s enhanced global presence that may contribute to an increase in the resources available to Amundi US. The Trustees considered that Amundi US and the Fund receive reciprocal intangible benefits from the relationship, including mutual brand recognition and, for the Fund, direct and indirect access to the resources of a large global asset manager. The Trustees concluded that any such benefits received by Amundi US as a result of its relationship with the Fund were reasonable.
Conclusion
After consideration of the factors described above as well as other factors, the Trustees, including the Independent Trustees, concluded that the investment management agreement for the Fund, including the fees payable thereunder, was fair and reasonable and voted to approve the proposed renewal of the investment management agreement.
46Pioneer Intrinsic Value Fund | Annual Report | 9/30/23
Statement Regarding Liquidity Risk Management Program
As required by law, the Fund has adopted and implemented a liquidity risk management program (the “Program”) that is designed to assess and manage liquidity risk. Liquidity risk is the risk that the Fund could not meet requests to redeem its shares without significant dilution of remaining investors’ interests in the Fund. The Fund’s Board of Trustees designated a liquidity risk management committee (the “Committee”) consisting of employees of Amundi Asset Management US, Inc. (the “Adviser”) to administer the Program.
The Committee provided the Board of Trustees with a report that addressed the operation of the Program and assessed its adequacy and effectiveness of implementation (the “Report”). The Report covered the period from January 1, 2022 through December 31, 2022 (the “Reporting Period”).
The Report confirmed that, throughout the Reporting Period, the Committee had monitored the Fund’s portfolio liquidity and liquidity risk on an ongoing basis, as described in the Program and in Board reporting throughout the Reporting Period.
The Report discussed the Committee’s annual review of the Program, which addressed, among other things, the following elements of the Program:
The Committee reviewed the Fund’s investment strategy and liquidity of portfolio investments during both normal and reasonably foreseeable stressed conditions. The Committee noted that the Fund’s investment strategy continues to be appropriate for an open-end fund, taking into account, among other things, whether and to what extent the Fund held less liquid and illiquid assets and the extent to which any such investments affected the Fund’s ability to meet redemption requests. In managing and reviewing the Fund’s liquidity risk, the Committee also considered the extent to which the Fund’s investment strategy involves a relatively concentrated portfolio or large positions in particular issuers, the extent to which the Fund uses borrowing for investment purposes, and the extent to which the Fund uses derivatives (including for hedging purposes). The Committee also reviewed the Fund’s short-term and long-term cash flow projections during both normal and reasonably foreseeable stressed conditions. In assessing the Fund’s cash flow projections, the Committee considered, among other factors, historical net redemption activity, redemption policies, ownership concentration, distribution channels, and the degree of certainty associated with the Fund’s short-term and long-term cash flow projections. The Committee also considered the Fund’s holdings of cash and cash equivalents, as well as borrowing arrangements
Pioneer Intrinsic Value Fund | Annual Report | 9/30/23 47
and other funding sources, including, if applicable, the Fund’s participation in a credit facility, as components of the Fund’s ability to meet redemption requests. The Fund has adopted an in-kind redemption policy which may be utilized to meet larger redemption requests.
The Committee reviewed the Program’s liquidity classification methodology for categorizing the Fund’s investments into one of four liquidity buckets. In reviewing the Fund’s investments, the Committee considered, among other factors, whether trading varying portions of a position in a particular portfolio investment or asset class in sizes the Fund would reasonably anticipate trading, would be reasonably expected to significantly affect liquidity.
The Committee performed an analysis to determine whether the Fund is required to maintain a Highly Liquid Investment Minimum, and determined that no such minimum is required because the Fund primarily holds highly liquid investments.
The Report stated that the Committee concluded the Program operates adequately and effectively, in all material respects, to assess and manage the Fund’s liquidity risk throughout the Reporting Period.
48Pioneer Intrinsic Value Fund | Annual Report | 9/30/23
Trustees, Officers and Service Providers
Investment Adviser and Administrator
Amundi Asset Management US, Inc.
Custodian and Sub-Administrator
The Bank of New York Mellon Corporation
Independent Registered Public Accounting Firm
Ernst & Young LLP
Principal Underwriter
Amundi Distributor US, Inc.
Legal Counsel
Morgan, Lewis & Bockius LLP
Transfer Agent
BNY Mellon Investment Servicing (US) Inc.
Proxy Voting Policies and Procedures of the Fund are available without charge, upon request, by calling our toll free number (1-800-225-6292). Information regarding how the Fund voted proxies relating to portfolio securities during the most recent 12-month period ended June 30 is publicly available to shareowners at www.amundi.com/us. This information is also available on the Securities and Exchange Commission’s web site at www.sec.gov.
Trustees and Officers
The Fund's Trustees and officers are listed below, together with their principal occupations and other directorships they have held during at least the past five years. Trustees who are interested persons of the Fund within the meaning of the 1940 Act are referred to as Interested Trustees. Trustees who are not interested persons of the Fund are referred to as Independent Trustees. Each of the Trustees serves as a Trustee of each of the 49 U.S. registered investment portfolios for which Amundi US serves as investment adviser (the “Pioneer Funds”). The address for all Trustees and all officers of the Fund is 60 State Street, Boston, Massachusetts 02109.
The Statement of Additional Information of the Fund includes additional information about the Directors and is available, without charge, upon request, by calling 1-800-225-6292.
Pioneer Intrinsic Value Fund | Annual Report | 9/30/2349
Name, Age and Position
Held With the Fund | Term of Office and
Length of Service | Principal Occupation(s) During At Least The Past Five Years | Other Directorships Held by Trustee
During At Least The Past Five Years |
Thomas J. Perna (72)
Chairman of the Board
and Trustee | Trustee since 2021.
Serves until a successor
trustee is elected or
earlier retirement
or removal. | Private investor (2004 – 2008 and 2013 – present); Chairman (2008 – 2013) and Chief Executive Officer (2008 – 2012), Quadriserv, Inc. (technology products for securities lending industry); and Senior Executive Vice President, The Bank of New York (financial and securities services) (1986 – 2004) | Director, Broadridge Financial Solutions, Inc.
(investor communications and securities
processing provider for financial services industry)
(2009 – present); Director, Quadriserv, Inc. (2005 –
2013); and Commissioner, New Jersey State
Civil Service Commission (2011 – 2015) |
John E. Baumgardner,
Jr. (72)*
Trustee | Trustee since 2021.
Serves until a successor
trustee is elected or
earlier retirement
or removal. | Of Counsel (2019 – present), Partner (1983-2018), Sullivan & Cromwell LLP (law firm). | Chairman, The Lakeville Journal Company, LLC,
(privately-held community newspaper group)
(2015-present) |
Diane Durnin (66)
Trustee | Trustee since 2021.
Serves until a successor
trustee is elected or
earlier retirement
or removal. | Managing Director - Head of Product Strategy and Development, BNY Mellon Investment Management (investment management firm) (2012-2018); Vice Chairman – The Dreyfus Corporation (2005 – 2018): Executive Vice President Head of Product, BNY Mellon Investment Management (2007-2012); Executive Director- Product Strategy, Mellon Asset Management (2005-2007); Executive Vice President Head of Products, Marketing and Client Service, Dreyfus Corporation (investment management firm) (2000-2005); Senior Vice President Strategic Product and Business Development, Dreyfus Corporation (1994-2000) | None |
50Pioneer Intrinsic Value Fund | Annual Report | 9/30/23
Name, Age and Position
Held With the Fund | Term of Office and
Length of Service | Principal Occupation(s) During At Least The Past Five Years | Other Directorships Held by Trustee
During At Least The Past Five Years |
Benjamin M. Friedman (79)
Trustee | Trustee since 2021.
Serves until a successor
trustee is elected or
earlier retirement
or removal. | William Joseph Maier Professor of Political Economy, Harvard University (1972 – present) | Trustee, Mellon Institutional Funds Investment
Trust and Mellon Institutional Funds Master
Portfolio (oversaw 17 portfolios in fund complex)
(1989 - 2008) |
Craig C. MacKay (60)
Trustee | Trustee since 2021.
Serves until a successor
trustee is elected or
earlier retirement
or removal. | Partner, England & Company, LLC (advisory firm) (2012 – present); Group Head – Leveraged Finance Distribution, Oppenheimer & Company (investment bank) (2006 – 2012); Group Head – Private Finance & High Yield Capital Markets Origination, SunTrust Robinson Humphrey (investment bank) (2003 – 2006); and Founder and Chief Executive Officer, HNY Associates, LLC (investment bank) (1996 – 2003) | Director, Equitable Holdings, Inc. (financial
services holding company) (2022 – present);
Board Member of Carver Bancorp, Inc. (holding
company) and Carver Federal Savings Bank,
NA (2017 – present); Advisory Council Member,
MasterShares ETF (2016 – 2017); Advisory
Council Member, The Deal (financial market
information publisher) (2015 – 2016); Board
Co-Chairman and Chief Executive Officer, Danis
Transportation Company (privately-owned
commercial carrier) (2000 – 2003); Board
Member and Chief Financial Officer, Customer
Access Resources (privately-owned
teleservices company) (1998 – 2000); Board
Member, Federation of Protestant Welfare
Agencies (human services agency) (1993 –
present); and Board Treasurer, Harlem Dowling
Westside Center (foster care agency)
(1999 – 2018) |
Pioneer Intrinsic Value Fund | Annual Report | 9/30/2351
Independent Trustees (continued)
Name, Age and Position
Held With the Fund | Term of Office and
Length of Service | Principal Occupation(s) During At Least The Past Five Years | Other Directorships Held by Trustee
During At Least The Past Five Years |
Lorraine H. Monchak (67)
Trustee | Trustee since 2021.
(Advisory Trustee from
2014 - 2017). Serves
until a successor trustee
is elected or earlier
retirement or removal. | Chief Investment Officer, 1199 SEIU Funds (healthcare workers union pension funds) (2001 – present); Vice President – International Investments Group, American International Group, Inc. (insurance company) (1993 – 2001); Vice President – Corporate Finance and Treasury Group, Citibank, N.A. (1980 – 1986 and 1990 – 1993); Vice President – Asset/Liability Management Group, Federal Farm Funding Corporation (government-sponsored issuer of debt securities) (1988 – 1990); Mortgage Strategies Group, Shearson Lehman Hutton, Inc. (investment bank) (1987 – 1988); Mortgage Strategies Group, Drexel Burnham Lambert, Ltd. (investment bank) (1986 – 1987) | None |
Marguerite A. Piret (75)
Trustee | Trustee since 2021.
Serves until a successor
trustee is elected or
earlier retirement
or removal. | Chief Financial Officer, American Ag Energy, Inc. (technology for the environment, energy and agriculture) (2019 – present); Chief Operating Officer, North Country Growers LLC (controlled environment agriculture company) (2020 – present); Chief Executive Officer, Green Heat LLC (biofuels company) (2022 – present); President and Chief Executive Officer, Newbury Piret Company (investment banking firm) (1981 – 2019) | Director of New America High Income Fund,
Inc. (closed-end investment company) (2004 –
present); and Member, Board of Governors,
Investment Company Institute (2000 – 2006) |
52Pioneer Intrinsic Value Fund | Annual Report | 9/30/23
Name, Age and Position
Held With the Fund | Term of Office and
Length of Service | Principal Occupation(s) During At Least The Past Five Years | Other Directorships Held by Trustee
During At Least The Past Five Years |
Fred J. Ricciardi (76)
Trustee | Trustee since 2021.
Serves until a successor
trustee is elected or
earlier retirement
or removal. | Private investor (2020 – present); Consultant (investment company services) (2012 – 2020); Executive Vice President, BNY Mellon (financial and investment company services) (1969 – 2012); Director, BNY International Financing Corp. (financial services) (2002 – 2012); Director, Mellon Overseas Investment Corp. (financial services) (2009 – 2012); Director, Financial Models (technology) (2005-2007); Director, BNY Hamilton Funds, Ireland (offshore investment companies) (2004-2007); Chairman/Director, AIB/BNY Securities Services, Ltd., Ireland (financial services) (1999-2006); Chairman, BNY Alternative Investment Services, Inc. (financial services) (2005-2007) | None |
| * Mr. Baumgardner is Of Counsel to Sullivan & Cromwell LLP, which acts as counsel to the Independent Trustees of each Pioneer Fund. |
Pioneer Intrinsic Value Fund | Annual Report | 9/30/2353
Name, Age and Position
Held With the Fund | Term of Office and
Length of Service | Principal Occupation(s) During At Least The Past Five Years | Other Directorships Held by Trustee
During At Least The Past Five Years |
Lisa M. Jones (61)**
Trustee, President and Chief
Executive Officer | Trustee since 2021. Serves
until a successor trustee is
elected or earlier retirement
or removal | Director, CEO and President of Amundi US, Inc. (investment management firm) (since September 2014); Director, CEO and President of Amundi Asset Management US, Inc. (since September 2014); Director, CEO and President of Amundi Distributor US, Inc. (since September 2014); Director, CEO and President of Amundi Asset Management US, Inc. (since September 2014); Chair, Amundi US, Inc., Amundi Distributor US, Inc. and Amundi Asset Management US, Inc. (September 2014 – 2018); Managing Director, Morgan Stanley Investment Management (investment management firm) (2010 – 2013); Director of Institutional Business, CEO of International, Eaton Vance Management (investment management firm) (2005 – 2010); Director of Amundi Holdings US, Inc. (since 2017) | Director of Clearwater Analytics (provider
of web-based investment accounting
software for reporting and reconciliation
services) (September 2022 – present) |
Kenneth J. Taubes (65)**
Trustee | Trustee since 2021. Serves
until a successor trustee is
elected or earlier retirement
or removal | Director and Executive Vice President (since 2008) and Chief Investment Officer, U.S. (since 2010) of Amundi US, Inc. (investment management firm); Director and Executive Vice President and Chief Investment Officer, U.S. of Amundi US (since 2008); Executive Vice President and Chief Investment Officer, U.S. of Amundi Asset Management US, Inc. (since 2009); Portfolio Manager of Amundi US (since 1999); Director of Amundi Holdings US, Inc. (since 2017) | None |
| ** Ms. Jones and Mr. Taubes are Interested Trustees because they are officers or directors of the Fund’s investment adviser and certain of its affiliates. |
54Pioneer Intrinsic Value Fund | Annual Report | 9/30/23
Name, Age and Position
Held With the Fund | Term of Office and
Length of Service | Principal Occupation(s) During At Least The Past Five Years | Other Directorships Held by Officer
During At Least The Past Five Years |
Christopher J. Kelley (58)
Secretary and Chief
Legal Officer | Since 2021. Serves at
the discretion of
the Board | Vice President and Associate General Counsel of Amundi US since January 2008; Secretary and Chief Legal Officer of all of the Pioneer Funds since June 2010; Assistant Secretary of all of the Pioneer Funds from September 2003 to May 2010; Vice President and Senior Counsel of Amundi US from July 2002 to December 2007 | None |
Thomas Reyes (60)
Assistant Secretary | Since 2021. Serves at
the discretion of
the Board | Assistant General Counsel of Amundi US since May 2013 and Assistant Secretary of all the Pioneer Funds since June 2010; Counsel of Amundi US from June 2007 to May 2013 | None |
Heather L. Melito-Dezan (46)
Assistant Secretary | Since 2022. Serves at
the discretion of
the Board | Director - Trustee and Board Relationships of Amundi US since September 2019; Assistant Secretary of Amundi US, Inc. since July 2020: Assistant Secretary of Amundi Asset Management US, Inc. since July 2020: Assistant Secretary of Amundi Distributor US, Inc. since July 2020; Assistant Secretary of all the Pioneer Funds since September 2022; Private practice from 2017 – 2019. | None |
Anthony J. Koenig, Jr. (59)
Treasurer and
Chief Financial and
Accounting Officer | Since 2021. Serves at
the discretion of
the Board | Managing Director, Chief Operations Officer and Fund Treasurer of Amundi US since May 2021; Treasurer of all of the Pioneer Funds since May 2021; Assistant Treasurer of all of the Pioneer Funds from January 2021 to May 2021; and Chief of Staff, US Investment Management of Amundi US from May 2008 to January 2021 | None |
Luis I. Presutti (58)
Assistant Treasurer | Since 2021. Serves at
the discretion of
the Board | Director – Fund Treasury of Amundi US since 1999; and Assistant Treasurer of all of the Pioneer Funds since 1999 | None |
Gary Sullivan (65)
Assistant Treasurer | Since 2021. Serves at
the discretion of
the Board | Senior Manager – Fund Treasury of Amundi US since 2012; and Assistant Treasurer of all of the Pioneer Funds since 2002 | None |
Pioneer Intrinsic Value Fund | Annual Report | 9/30/2355
Fund Officers (continued)
Name, Age and Position
Held With the Fund | Term of Office and
Length of Service | Principal Occupation(s) During At Least The Past Five Years | Other Directorships Held by Officer
During At Least The Past Five Years |
Antonio Furtado (41)
Assistant Treasurer | Since 2021. Serves at
the discretion of
the Board | Fund Oversight Manager – Fund Treasury of Amundi US since 2020; Assistant Treasurer of all of the Pioneer Funds since 2020; and Senior Fund Treasury Analyst from 2012 - 2020 | None |
Michael Melnick (52)
Assistant Treasurer | Since 2021. Serves at
the discretion of
the Board | Vice President - Deputy Fund Treasurer of Amundi US since May 2021; Assistant Treasurer of all of the Pioneer Funds since July 2021; Director of Regulatory Reporting of Amundi US from 2001 – 2021; and Director of Tax of Amundi US from 2000 - 2001 | None |
John Malone (52)
Chief Compliance Officer | Since 2021. Serves at
the discretion of
the Board | Managing Director, Chief Compliance Officer of Amundi US Asset Management; Amundi Asset Management US, Inc.; and the Pioneer Funds since September 2018; Chief Compliance Officer of Amundi Distributor US, Inc. since January 2014. | None |
Brandon Austin (51)
Anti-Money Laundering Officer | Since 2022. Serves at
the discretion of
the Board | Director, Financial Security – Amundi Asset Management; Anti-Money Laundering Officer of all the Pioneer Funds since March 2022: Director of Financial Security of Amundi US since July 2021; Vice President, Head of BSA, AML and OFAC, Deputy Compliance Manager, Crédit Agricole Indosuez Wealth Management (investment management firm) (2013 – 2021) | None |
56Pioneer Intrinsic Value Fund | Annual Report | 9/30/23
How to Contact Amundi
We are pleased to offer a variety of convenient ways for you to contact us for assistance or information.
Call us for:
Account Information, including existing accounts,
new accounts, prospectuses, applications
and service forms
1-800-225-6292
FactFoneSM for automated fund yields, prices,
account information and transactions
1-800-225-4321
| Retirement plans information | 1-800-622-0176 |
Write to us:
Amundi
P.O. Box 534427
Pittsburgh, PA 15253-4427
| Our toll-free fax | 1-800-225-4240 |
| Our internet e-mail address | us.askamundi@amundi.com
(for general questions about Amundi only) |
Visit our web site: www.amundi.com/us
This report must be preceded or accompanied by a prospectus.
The Fund files a complete schedule of portfolio holdings with the Securities and Exchange Commission for the first and third quarters of each fiscal year as an exhibit to its reports on Form N-PORT. Shareholders may view the filed Form N-PORT by visiting the Commission’s web site at https://www.sec.gov.
Amundi Asset Management US, Inc.
60 State Street
Boston, MA 02109
www.amundi.com/us
Securities offered through Amundi Distributor US, Inc.
60 State Street, Boston, MA 02109
Underwriter of Pioneer Mutual Funds, Member SIPC
© 2023 Amundi Asset Management US, Inc. 32713-02-1123
ITEM 2. CODE OF ETHICS.
(a) Disclose whether, as of the end of the period covered by the report, the registrant has adopted a code of ethics that applies to the registrant’s principal executive officer, principal financial officer, principal accounting officer or controller, or persons performing similar functions, regardless of whether these individuals are employed by the registrant or a third party. If the registrant has not adopted such a code of ethics, explain why it has not done so.
The registrant has adopted, as of the end of the period covered by this report, a code of ethics that applies to the registrant’s principal executive officer, principal financial officer, principal accounting officer and controller.
(b) For purposes of this Item, the term “code of ethics” means written standards that are reasonably designed to deter wrongdoing and to promote:
(1) Honest and ethical conduct, including the ethical handling of actual or apparent conflicts of interest between personal and professional relationships;
(2) Full, fair, accurate, timely, and understandable disclosure in reports and documents that a registrant files with, or submits to, the Commission and in other public communications made by the registrant;
(3) Compliance with applicable governmental laws, rules, and regulations;
(4) The prompt internal reporting of violations of the code to an appropriate person or persons identified in the code; and
(5) Accountability for adherence to the code.
(c) The registrant must briefly describe the nature of any amendment, during the period covered by the report, to a provision of its code of ethics that applies to the registrant’s principal executive officer, principal financial officer, principal accounting officer or controller, or persons performing similar functions, regardless of whether these individuals are employed by the registrant or a third party, and that relates to any element of the code of ethics definition enumerated in paragraph (b) of this Item. The registrant must file a copy of any such amendment as an exhibit pursuant to Item 10(a), unless the registrant has elected to satisfy paragraph (f) of this Item by posting its code of ethics on its website pursuant to paragraph (f)(2) of this Item, or by undertaking to provide its code of ethics to any person without charge, upon request, pursuant to paragraph (f)(3) of this Item.
The registrant has made no amendments to the code of ethics during the period covered by this report.
(d) If the registrant has, during the period covered by the report, granted a waiver, including an implicit waiver, from a provision of the code of ethics to the registrant’s principal executive officer, principal financial officer, principal accounting officer or controller, or persons performing similar functions, regardless of whether these individuals are employed by the registrant or a third party, that relates to one or more of the items set forth in paragraph (b) of this Item, the registrant must briefly describe the nature of the waiver, the name of the person to whom the waiver was granted, and the date of the waiver.
Not applicable.
(e) If the registrant intends to satisfy the disclosure requirement under paragraph (c) or (d) of this Item regarding an amendment to, or a waiver from, a provision of its code of ethics that applies to the registrant’s principal executive officer, principal financial officer, principal accounting officer or controller, or persons performing similar functions and that relates to any element of the code of ethics definition enumerated in paragraph (b) of this Item by posting such information on its Internet website, disclose the registrant’s Internet address and such intention.
Not applicable.
(f) The registrant must:
(1) File with the Commission, pursuant to Item 12(a)(1), a copy of its code of ethics that applies to the registrant’s principal executive officer, principal financial officer, principal accounting officer or controller, or persons performing similar functions, as an exhibit to its annual report on this Form N-CSR (see attachment);
(2) Post the text of such code of ethics on its Internet website and disclose, in its most recent report on this Form N-CSR, its Internet address and the fact that it has posted such code of ethics on its Internet website; or
(3) Undertake in its most recent report on this Form N-CSR to provide to any person without charge, upon request, a copy of such code of ethics and explain the manner in which such request may be made. See Item 10(2)
ITEM 3. AUDIT COMMITTEE FINANCIAL EXPERT.
(a) (1) Disclose that the registrant’s Board of Trustees has determined that the registrant either:
(i) Has at least one audit committee financial expert serving on its audit committee; or
(ii) Does not have an audit committee financial expert serving on its audit committee.
The registrant’s Board of Trustees has determined that the registrant has at least one audit committee financial expert.
(2) If the registrant provides the disclosure required by paragraph (a)(1)(i) of this Item, it must disclose the name of the audit committee financial expert and whether that person is “independent.” In order to be considered “independent” for purposes of this Item, a member of an audit committee may not, other than in his or her capacity as a member of the audit committee, the Board of Trustees, or any other board committee:
(i) Accept directly or indirectly any consulting, advisory, or other compensatory fee from the issuer; or
(ii) Be an “interested person” of the investment company as defined in Section 2(a)(19) of the Act (15 U.S.C. 80a-2(a)(19)).
Mr. Fred J. Ricciardi, an independent Trustee, is such an audit committee financial expert.
(3) If the registrant provides the disclosure required by paragraph (a)(1) (ii) of this Item, it must explain why it does not have an audit committee financial expert.
Not applicable.
ITEM 4. PRINCIPAL ACCOUNTANT FEES AND SERVICES.
(a) Disclose, under the caption AUDIT FEES, the aggregate fees billed for each of the last two fiscal years for professional services rendered by the principal accountant for the audit of the registrant’s annual financial statements or services that are normally provided by the accountant in connection with statutory and regulatory filings or engagements for those fiscal years.
The audit fees for the Trust were $226,596 payable to Ernst & Young LLP for the year ended September 30, 2023 and $217,881 for the year ended September 30, 2022.
(b) Disclose, under the caption AUDIT-RELATED FEES, the aggregate fees billed in each of the last two fiscal years for assurance and related services by the principal accountant that are reasonably related to the performance of the audit of the registrant’s financial statements and are not reported under paragraph (a) of this Item. Registrants shall describe the nature of the services comprising the fees disclosed under this category.
The audit-related services fees for the Trust were $19,205 payable to Ernst & Young LLP for the year ended September 30, 2023 and $7,080 for the year ended September 30, 2022.
(c) Disclose, under the caption TAX FEES, the aggregate fees billed in each of the last two fiscal years for professional services rendered by the principal accountant for tax compliance, tax advice, and tax planning. Registrants shall describe the nature of the services comprising the fees disclosed under this category.
The Trust paid aggregate non-audit fees to Ernst & Young LLP for tax services of $55,744 and $53,600 during the fiscal years ended September 30, 2023 and 2022, respectively.
(d) Disclose, under the caption ALL OTHER FEES, the aggregate fees billed in each of the last two fiscal years for products and services provided by the principal accountant, other than the services reported in paragraphs (a) through (c) of this Item. Registrants shall describe the nature of the services comprising the fees disclosed under this category.
There were no other fees in 2023 or 2022.
(e) (1) Disclose the audit committee’s pre-approval policies and procedures described in paragraph (c)(7) of Rule 2-01 of Regulation S-X.
PIONEER FUNDS
APPROVAL OF AUDIT, AUDIT-RELATED, TAX AND OTHER SERVICES
PROVIDED BY THE INDEPENDENT AUDITOR
SECTION I - POLICY PURPOSE AND APPLICABILITY
The Pioneer Funds recognize the importance of maintaining the independence of their outside auditors. Maintaining independence is a shared responsibility involving Amundi Asset Management US, Inc., the audit committee and the independent auditors.
The Funds recognize that a Fund’s independent auditors: 1) possess knowledge of the Funds, 2) are able to incorporate certain services into the scope of the audit, thereby avoiding redundant work, cost and disruption of Fund personnel and processes, and 3) have expertise that has value to the Funds. As a result, there are situations where it is desirable to use the Fund’s independent auditors for services in addition to the annual audit and where the potential for conflicts of interests are minimal. Consequently, this policy, which is intended to comply with Rule 210.2-01(C)(7), sets forth guidelines and procedures to be followed by the Funds when retaining the independent audit firm to perform audit, audit-related tax and other services under those circumstances, while also maintaining independence.
Approval of a service in accordance with this policy for a Fund shall also constitute approval for any other Fund whose pre-approval is required pursuant to Rule 210.2-01(c)(7)(ii).
In addition to the procedures set forth in this policy, any non-audit services that may be provided consistently with Rule 210.2-01 may be approved by the Audit Committee itself and any pre-approval that may be waived in accordance with Rule 210.2-01(c)(7)(i)(C) is hereby waived.
Selection of a Fund’s independent auditors and their compensation shall be determined by the Audit Committee and shall not be subject to this policy.
| | | | |
SECTION II - POLICY |
SERVICE CATEGORY | | SERVICE CATEGORY DESCRIPTION | | SPECIFIC PRE-APPROVED SERVICE
SUBCATEGORIES |
| I. AUDIT SERVICES | | Services that are directly related to performing the independent audit of the Funds | | • Accounting research assistance • SEC consultation, registration statements, and reporting |
| | |
| | | | • Tax accrual related matters |
| | |
| | | | • Implementation of new accounting standards |
| | |
| | | | • Compliance letters (e.g. rating agency letters) |
| | |
| | | | • Regulatory reviews and assistance regarding financial matters |
| | |
| | | | • Semi-annual reviews (if requested) |
| | |
| | | | • Comfort letters for closed end offerings |
| | |
| II. AUDIT-RELATED SERVICES | | Services which are not prohibited under Rule 210.2-01(C)(4) (the “Rule”) and are related extensions of the audit services support the audit, or use the knowledge/expertise gained from the audit procedures as a foundation to complete the project. In most cases, if the Audit-Related Services are not performed by the Audit firm, the scope of the Audit Services would likely increase. The Services are typically well-defined and governed by accounting professional standards (AICPA, SEC, etc.) | | • AICPA attest and agreed-upon procedures • Technology control assessments |
| | • Financial reporting control assessments • Enterprise security architecture assessment |
| | |
AUDIT COMMITTEE APPROVAL POLICY | | AUDIT COMMITTEE REPORTING POLICY |
• “One-time” pre-approval for the audit period for all pre-approved specific service subcategories. Approval of the independent auditors as auditors for a Fund shall constitute pre approval for these services. | | • A summary of all such services and related fees reported at each regularly scheduled Audit Committee meeting. |
| |
• “One-time” pre-approval for the fund fiscal year within a specified dollar limit for all pre-approved specific service subcategories | | • A summary of all such services and related fees (including comparison to specified dollar limits) reported quarterly. |
| | |
• Specific approval is needed to exceed the pre-approved dollar limit for these services (see general Audit Committee approval policy below for details on obtaining specific approvals) | | |
| |
• Specific approval is needed to use the Fund’s auditors for Audit-Related Services not denoted as “pre-approved”, or to add a specific service subcategory as “pre-approved” | | |
SECTION III - POLICY DETAIL, CONTINUED
| | | | |
SERVICE CATEGORY | | SERVICE CATEGORY DESCRIPTION | | SPECIFIC PRE-APPROVED
SERVICE SUBCATEGORIES |
| III. TAX SERVICES | | Services which are not prohibited by the Rule, if an officer of the Fund determines that using the Fund’s auditor to provide these services creates significant synergy in the form of efficiency, minimized disruption, or the ability to maintain a desired level of confidentiality. | | • Tax planning and support • Tax controversy assistance • Tax compliance, tax returns, excise tax returns and support • Tax opinions |
| | |
AUDIT COMMITTEE APPROVAL POLICY | | AUDIT COMMITTEE REPORTING POLICY |
• “One-time” pre-approval for the fund fiscal year within a specified dollar limit | | • A summary of all such services and related fees (including comparison to specified dollar limits) reported quarterly. |
| |
• Specific approval is needed to exceed the pre-approved dollar limits for these services (see general Audit Committee approval policy below for details on obtaining specific approvals) | | |
| |
• Specific approval is needed to use the Fund’s auditors for tax services not denoted as pre-approved, or to add a specific service subcategory as “pre-approved” | | |
SECTION III - POLICY DETAIL, CONTINUED
| | | | |
SERVICE CATEGORY | | SERVICE CATEGORY DESCRIPTION | | SPECIFIC PRE-APPROVED
SERVICE SUBCATEGORIES |
IV. OTHER SERVICES A. SYNERGISTIC, UNIQUE QUALIFICATIONS | | Services which are not prohibited by the Rule, if an officer of the Fund determines that using the Fund’s auditor to provide these services creates significant synergy in the form of efficiency, minimized disruption, the ability to maintain a desired level of confidentiality, or where the Fund’s auditors posses unique or superior qualifications to provide these services, resulting in superior value and results for the Fund. | | • Business Risk Management support • Other control and regulatory compliance projects |
| | |
AUDIT COMMITTEE APPROVAL POLICY | | AUDIT COMMITTEE REPORTING POLICY |
• “One-time” pre-approval for the fund fiscal year within a specified dollar limit | | • A summary of all such services and related fees (including comparison to specified dollar limits) reported quarterly. |
| |
• Specific approval is needed to exceed the pre-approved dollar limits for these services (see general Audit Committee approval policy below for details on obtaining specific approvals) | | |
| |
• Specific approval is needed to use the Fund’s auditors for “Synergistic” or “Unique Qualifications” Other Services not denoted as pre-approved to the left, or to add a specific service subcategory as “pre-approved” | | |
SECTION III - POLICY DETAIL, CONTINUED
| | | | |
SERVICE CATEGORY | | SERVICE CATEGORY DESCRIPTION | | SPECIFIC PROHIBITED
SERVICE SUBCATEGORIES |
| PROHIBITED SERVICES | | Services which result in the auditors losing independence status under the Rule. | | 1. Bookkeeping or other services related to the accounting records or financial statements of the audit client* |
| | |
| | | | 2. Financial information systems design and implementation* |
| | |
| | | | 3. Appraisal or valuation services, fairness* opinions, or contribution-in-kind reports |
| | |
| | | | 4. Actuarial services (i.e., setting actuarial reserves versus actuarial audit work)* |
| | |
| | | | 5. Internal audit outsourcing services* |
| | |
| | | | 6. Management functions or human resources |
| | |
| | | | 7. Broker or dealer, investment advisor, or investment banking services |
| | |
| | | | 8. Legal services and expert services unrelated to the audit |
| | |
| | | | 9. Any other service that the Public Company Accounting Oversight Board determines, by regulation, is impermissible |
| | |
AUDIT COMMITTEE APPROVAL POLICY | | AUDIT COMMITTEE REPORTING POLICY |
• These services are not to be performed with the exception of the(*) services that may be permitted if they would not be subject to audit procedures at the audit client (as defined in rule 2-01(f)(4)) level the firm providing the service. | | • A summary of all services and related fees reported at each regularly scheduled Audit Committee meeting will serve as continual confirmation that has not provided any restricted services. |
GENERAL AUDIT COMMITTEE APPROVAL POLICY:
| | • | | For all projects, the officers of the Funds and the Fund’s auditors will each make an assessment to determine that any proposed projects will not impair independence. |
| | • | | Potential services will be classified into the four non-restricted service categories and the “Approval of Audit, Audit-Related, Tax and Other Services” Policy above will be applied. Any services outside the specific pre-approved service subcategories set forth above must be specifically approved by the Audit Committee. |
| | • | | At least quarterly, the Audit Committee shall review a report summarizing the services by service category, including fees, provided by the Audit firm as set forth in the above policy. |
(2) Disclose the percentage of services described in each of paragraphs (b) through (d) of this Item that were approved by the audit committee pursuant to paragraph (c)(7)(i)(C) of Rule 2-01 of Regulation S-X.
Non-Audit Services
Beginning with non-audit service contracts entered into on or after May 6, 2003, the effective date of the
new SEC pre-approval rules, the Trust’s audit committee is required to pre-approve services to
affiliates defined by SEC rules to the extent that the services are determined to have a direct impact on the operations or financial reporting of the Trust. For the years ended September 30, 2023 and 2022, there were no services provided to an affiliate that required the Trust’s audit committee pre-approval.
(f) If greater than 50 percent, disclose the percentage of hours expended on the principal accountants engagement to audit the registrant’s financial statements for the most recent fiscal year that were attributed to work performed by persons other than the principal accountant’s full-time, permanent employees.
N/A
(g) Disclose the aggregate non-audit fees billed by the registrants accountant for services rendered to the registrant, and rendered to the registrants investment adviser (not including any sub-adviser whose role is primarily portfolio management and is subcontracted with or overseen by another investment adviser), and any entity controlling, controlled by, or under common control with the adviser that provides ongoing services to the registrant for each of the last two fiscal years of the registrant.
The Trust paid aggregate non-audit fees to Ernst & Young LLP for tax services of $55,744 and $53,600 during the fiscal years ended September 30, 2023 and 2022, respectively.
(h) Disclose whether the registrants audit committee of the Board of Trustees has considered whether the provision of non-audit services that were rendered to the registrants investment adviser (not including any subadviser whose role is primarily portfolio management and is subcontracted with or overseen by another investment adviser), and any entity controlling, controlled by, or under common control with the investment adviser that provides ongoing services to the registrant that were not pre-approved pursuant to paragraph (c)(7)(ii) of Rule 2-01 of Regulation S-X is compatible with maintaining the principal accountant’s independence.
The Fund’s audit committee of the Board of Trustees has considered whether the provision of non-audit services that were rendered to the Affiliates (as defined) that were not pre- approved pursuant to paragraph (c)(7)(ii) of Rule 2-01 of Regulation S-X is compatible with maintaining the principal accountant’s independence.
(i) A registrant identified by the Commission pursuant to Section 104(i)(2)(A) of the Sarbanes-Oxley Act of 2002 (15 U.S.C. 7214(i)(2)(A)), as having retained, for the preparation of the audit report on its financial statements included in the Form NCSR, a registered public accounting firm that has a branch or office that is located in a foreign jurisdiction and that the Public Company Accounting Oversight Board has determined it is unable to inspect or investigate completely because of a position taken by an authority in the foreign jurisdiction must electronically submit to the Commission on a supplemental basis documentation that establishes that the registrant is not owned or controlled by a governmental entity in the foreign jurisdiction. The registrant must submit this documentation on or before the due date for this form. A registrant that is owned or controlled by a foreign governmental entity is not required to submit such documentation.
N/A
(j) A registrant that is a foreign issuer, as defined in 17 CFR 240.3b-4, identified by the Commission pursuant to Section 104(i)(2)(A) of the Sarbanes-Oxley Act of 2002 (15 U.S.C. 7214(i)(2)(A)), as having retained, for the preparation of the audit report on its financial statements included in the Form N-CSR, a registered public accounting firm that has a branch or office that is located in a foreign jurisdiction and that the Public Company Accounting Oversight Board has determined it is unable to inspect or investigate completely because of a position taken by an authority in the foreign jurisdiction, for each year in which the registrant is so identified, must provide the below disclosures. Also, any such identified foreign issuer that uses a variable-interest entity or any similar structure that results in additional foreign entities being consolidated in the financial statements of the registrant is required to provide the below disclosures for itself and its consolidated foreign operating entity or entities. A registrant must disclose:
(1) That, for the immediately preceding annual financial statement period, a registered public accounting firm that the PCAOB was unable to inspect or investigate completely, because of a position taken by an authority in the foreign jurisdiction, issued an audit report for the registrant;
N/A
(2) The percentage of shares of the registrant owned by governmental entities in the foreign jurisdiction in which the registrant is incorporated or otherwise organized;
N/A
(3) Whether governmental entities in the applicable foreign jurisdiction with respect to that registered public accounting firm have a controlling financial interest with respect to the registrant; N/A
(4) The name of each official of the Chinese Communist Party who is a member of the board of directors of the registrant or the operating entity with respect to the registrant;
N/A
(5) Whether the articles of incorporation of the registrant (or equivalent organizing document) contains any charter of the Chinese Communist Party, including the text of any such charter.
N/A
ITEM 5. AUDIT COMMITTEE OF LISTED REGISTRANTS
(a) If the registrant is a listed issuer as defined in Rule 10A-3 under the Exchange Act (17 CFR 240.10A-3), state whether or not the registrant has a separately-designated standing audit committee established in accordance with Section 3(a)(58)(A) of the Exchange Act (15 U.S.C. 78c(a)(58)(A)). If the registrant has such a committee, however designated, identify each committee member. If the entire board of directors is acting as the registrant’s audit committee as specified in Section 3(a)(58)(B) of the Exchange Act (15 U.S.C. 78c(a)(58)(B)), so state.
N/A
(b) If applicable, provide the disclosure required by Rule 10A-3(d) under the Exchange Act (17 CFR 240.10A-3(d)) regarding an exemption from the listing standards for audit committees.
N/A
ITEM 6. SCHEDULE OF INVESTMENTS.
File Schedule of Investments in securities of unaffiliated issuers as of the close of the reporting period as set forth in 210.1212 of Regulation S-X [17 CFR 210.12-12], unless the schedule is included as part of the report to shareholders filed under Item 1 of this Form.
Included in Item 1
ITEM 7. DISCLOSURE OF PROXY VOTING POLICIES AND PROCEDURES FOR CLOSED-END MANAGEMENT INVESTMENT COMPANIES.
A closed-end management investment company that is filing an annual report on this Form N-CSR must, unless it invests exclusively in non-voting securities, describe the policies and procedures that it uses to determine how to vote proxies relating to portfolio securities, including the procedures that the company uses when a vote presents a conflict between the interests of its shareholders, on the one hand, and those of the company’s investment adviser; principal underwriter; or any affiliated person (as defined in Section 2(a)(3) of the Investment Company Act of 1940 (15 U.S.C. 80a-2(a)(3)) and the rules thereunder) of the company, its investment adviser, or its principal underwriter, on the other. Include any policies and procedures of the company’s investment adviser, or any other third party, that the company uses, or that are used on the company’s behalf, to determine how to vote proxies relating to portfolio securities.
Not applicable to open-end management investment companies.
ITEM 8. PORTFOLIO MANAGERS OF CLOSED-END MANAGEMENT INVESTMENT COMPANIES.
(a) If the registrant is a closed-end management investment company that is filing an annual report on this Form N-CSR, provide the following information:
(1) State the name, title, and length of service of the person or persons employed by or associated with the registrant or an investment adviser of the registrant who are primarily responsible for the day-to-day management of the registrant’s portfolio (“Portfolio Manager”). Also state each Portfolio Manager’s business experience during the past 5 years.
Not applicable to open-end management investment companies.
ITEM 9. PURCHASES OF EQUITY SECURITIES BY CLOSED-END MANAGEMENT INVESTMENT COMPANY AND AFFILIATED PURCHASERS.
(a) If the registrant is a closed-end management investment company, in the following tabular format, provide the information specified in paragraph (b) of this Item with respect to any purchase made by or on behalf of the registrant or any affiliated purchaser, as defined in Rule 10b-18(a)(3) under the Exchange Act (17 CFR 240.10b-18(a)(3)), of shares or other units of any class of the registrant’s equity securities that is registered by the registrant pursuant to Section 12 of the Exchange Act (15 U.S.C. 781).
Not applicable to open-end management investment companies.
ITEM 10. SUBMISSION OF MATTERS TO A VOTE OF SECURITY HOLDERS.
Describe any material changes to the procedures by which shareholders may recommend nominees to the registrant’s board of directors, where those changes were implemented after the registrant last provided disclosure in response to the requirements of Item 407(c)(2)(iv) of Regulation S-R(17 CFR 229.407)(as required by Item 22(b)(15)) of Schedule 14A (17 CFR 240.14a-101), or this Item.
There have been no material changes to the procedures by which the shareholders may recommend nominees to the registrant’s board of directors since the registrant last provided disclosure in response to the requirements of Item 407(c)(2)(iv) of Regulation S-R of Schedule 14(A) in its definitive proxy statement, or this item.
ITEM 11. CONTROLS AND PROCEDURES.
(a) Disclose the conclusions of the registrant’s principal executive and principal financials officers, or persons performing similar functions, regarding the effectiveness of the registrant’s disclosure controls and procedures (as defined in Rule 30a-3(c) under the Act (17 CFR 270.30a-3(c))) as of a date within 90 days of the filing date of the report that includes the disclosure required by this paragraph, based on the evaluation of these controls and procedures required by Rule 30a-3(b) under the Act (17 CFR 270.30(a)-3(b) and Rules 13a-15(b) or 15d-15(b) under the Exchange Act (17 CFR 240.13a-15(b) or 240.15d-15(b)).
The registrant’s principal executive officer and principal financial officer have concluded that the registrant’s disclosure controls and procedures are effective based on the evaluation of these controls and procedures as of a date within 90 days of the filing date of this report.
(b) Disclose any change in the registrant’s internal control over financial reporting (as defined in Rule 30a-3(d) under the Act (17CFR 270.30a-3(d)) that occurred during the period covered by this report that has materially affected, or is reasonably likely to materially affect, the registrant’s internal control over financial reporting.
There were no significant changes in the registrant’s internal control over financial reporting that occurred during the period covered by this report that have materially affected, or are reasonably likely to materially affect, the registrant’s internal control over financial reporting.
Item 12. Disclosure of Securities Lending Activities for Closed-End Management Investment Companies.
(a) If the registrant is a closed-end management investment company, provide the following dollar amounts of income and compensation related to the securities lending activities of the registrant during its most recent fiscal year:
N/A
(1) Gross income from securities lending activities;
N/A
(2) All fees and/or compensation for each of the following securities lending activities and related services: any share of revenue generated by the securities lending program paid to the securities lending agent(s) (revenue split); fees paid for cash collateral management services (including fees deducted from a pooled cash collateral reinvestment vehicle) that are not included in the revenue split; administrative fees that are not included in the revenue split; fees for indemnification that are not included in the revenue split; rebates paid to borrowers; and any other fees relating to the securities lending program that are not included in the revenue split, including a description of those other fees;
N/A
(3) The aggregate fees/compensation disclosed pursuant to paragraph (2); and
N/A
(4) Net income from securities lending activities (i.e., the dollar amount in paragraph (1) minus the dollar amount in paragraph (3)).
If a fee for a service is included in the revenue split, state that the fee is included in the revenue split.
N/A
(b) If the registrant is a closed-end management investment company, describe the services provided to the registrant by the securities lending agent in the registrants most recent fiscal year.
N/A
ITEM 13. EXHIBITS.
(a) File the exhibits listed below as part of this Form. Letter or number the exhibits in the sequence indicated.
(1) Any code of ethics, or amendment thereto, that is the subject of the disclosure required by Item 2, to the extent that the registrant intends to satisfy the Item 2 requirements through filing of an exhibit.
(2) A separate certification for each principal executive officer and principal financial officer of the registrant as required by Rule 30a-2(a) under the Act (17 CFR 270.30a-2(a)) , exactly as set forth below:
Filed herewith.
(b) Certifications pursuant to Rule 30a-2(b) under the 1940 Act and Section 906 of the Sarbanes-Oxley Act of 2002 are attached hereto.
SIGNATURES
[See General Instruction F]
Pursuant to the requirements of the Securities Exchange Act of 1934 and the Investment Company Act of 1940, the registrant has duly caused this report to be signed on its behalf by the undersigned, thereunto duly authorized.
(Registrant) Pioneer Series Trust XIV
By (Signature and Title)* /s/ Lisa M. Jones
Lisa M. Jones, President and Chief Executive Officer
Date December 7, 2023
Pursuant to the requirements of the Securities Exchange Act of 1934 and the Investment Company Act of 1940, this report has been signed below by the following persons on behalf of the registrant and in the capacities and on the dates indicated.
By (Signature and Title)* /s/ Lisa M. Jones
Lisa M. Jones, President and Chief Executive Officer
Date December 7, 2023
By (Signature and Title)* /s/ Anthony J. Koenig, Jr.
Anthony J. Koenig, Jr., Managing Director, Chief Operations Officer & Treasurer of the Funds
Date December 7, 2023
* Print the name and title of each signing officer under his or her signature.