Pioneer Strategic Income Fund
| | | | | |
| Annual Report | September 30, 2020 |
| |
| A: PSRAX | C: PSRCX | K: STRKX | R: STIRX | Y: STRYX |
Beginning in or after March 2021, as permitted by regulations adopted by the Securities and Exchange Commission, paper copies of the Fund’s shareholder reports like this one will no longer be sent by mail, unless you specifically request paper copies of the reports from the Fund or from your financial intermediary, such as a broker-dealer, bank or insurance company. Instead, the reports will be made available on the Fund’s website, and you will be notified by mail each time a report is posted and provided with a website link to access the report.
If you already elected to receive shareholder reports electronically, you will not be affected by this change and you need not take any action. You may elect to receive shareholder reports and other communications electronically by contacting your financial intermediary or, if you invest directly with the Fund, by calling 1-800-225-6292.
You may elect to receive all future reports in paper free of charge. If you invest directly with the Fund, you can inform the Fund that you wish to continue receiving paper copies of your shareholder reports by calling 1-800-225-6292. If you invest through a financial intermediary, you can contact your financial intermediary to request that you continue to receive paper copies of your shareholder reports. Your election to receive reports in paper will apply to all funds held in your account if you invest through your financial intermediary or all funds held within the Pioneer Fund complex if you invest directly.
visit us: www.amundipioneer.com/us
Pioneer Strategic Income Fund | Annual Report | 9/30/20 1
President’s LetterDear Shareholders,
The new decade has arrived delivering a calendar year that will go down in the history books. The beginning of 2020 seemed to extend the positive market environment of 2019. Then, March roared in like a lion and the COVID-19 pandemic became a global crisis impacting lives and life as we know it. As the fourth quarter of 2020 got underway, it appeared that the long-anticipated “second wave” of COVID-19 cases was occurring, both in some U.S. states and in Europe. In response, some governments began retightening restrictions on both business and personal activities, likely assuring that the “new normal” conditions created by the pandemic will continue well into 2021.
The long-term impact on the global economy from the COVID-19 virus pandemic, while currently unknown, is likely to be considerable. It is clear that several industries have already felt greater effects than others. And the markets, which do not thrive on uncertainty, have been volatile, delivering significantly negative performance in the first quarter, and then recovering most of those losses throughout the rest of the spring and summer. Despite the rebound, volatility has remained elevated, with momentum rising and falling on seemingly every bit of positive or negative news regarding potential COVID-19 vaccines as well as headlines surrounding the U.S. elections.
Our business continuity plan was implemented given the new COVID-19 guidelines, and most of our employees are working remotely. To date, our operating environment has faced no interruption. I am proud of the careful planning that has taken place and confident we can maintain this environment for as long as is prudent. History in the making for a company that first opened its doors way back in 1928.
Since 1928, Amundi’s investment process has been built on a foundation of fundamental research and active management, principles which have guided our investment decisions for more than 90 years. We believe active management – that is, making active investment decisions – can help mitigate the risks during periods of market volatility. As the first several months of 2020 have reminded us, investment risk can arise from a number of factors in today’s global economy, including slower or stagnating growth, changing U.S. Federal Reserve policy, oil price shocks, political and geopolitical factors and, unfortunately, major public health concerns such as a viral pandemic.
2 Pioneer Strategic Income Fund | Annual Report | 9/30/20
At Amundi, active management begins with our own fundamental, bottom-up research process. Our team of dedicated research analysts and portfolio managers analyzes each security under consideration, communicating directly with the management teams of the companies issuing the securities and working together to identify those securities that best meet our investment criteria for our family of funds. Our risk management approach begins with each and every security, as we strive to carefully understand the potential opportunity, while considering any and all risk factors.
Today, as investors, we have many options. It is our view that active management can serve shareholders well, not only when markets are thriving, but also during periods of market stress. As you consider your long-term investment goals, we encourage you to work with your financial professional to develop an investment plan that paves the way for you to pursue both your short-term and long-term goals.
We remain confident that the current crisis, like others in human history, will pass, and we greatly appreciate the trust you have placed in us and look forward to continuing to serve you in the future.
Sincerely,
Lisa M. Jones
Head of the Americas, President and CEO of U.S.
Amundi Pioneer Asset Management USA, Inc.
September 30, 2020
Any information in this shareowner report regarding market or economic trends or the factors influencing the Fund’s historical or future performance are statements of opinion as of the date of this report. Past performance is no guarantee of future results.
Pioneer Strategic Income Fund | Annual Report | 9/30/20 3
Portfolio Management Discussion |
9/30/20 In the following interview, Andrew Feltus and Jonathan Scott discuss the factors that affected the performance of Pioneer Strategic Income Fund during the 12-month period ended September 30, 2020. Mr. Feltus, CFA, Managing Director, Co-Director of High Yield, and a portfolio manager at Amundi Pioneer Asset Management, Inc. (Amundi*), and Mr. Scott, a vice president and a portfolio manager at Amundi, are responsible for the day-to-day management of the Fund, along with Kenneth J. Taubes, Executive Vice President, Chief Investment Officer, U.S., and a portfolio manager at Amundi.
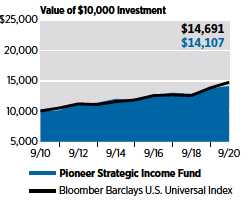
A Pioneer Strategic Income Fund’s Class A shares returned 3.44% at net asset value during the 12-month period ended September 30, 2020, while the Fund’s benchmark, the Bloomberg Barclays U.S. Universal Index (the Bloomberg Barclays Index), returned 6.68%. During the same period, the average return of the 330 mutual funds in Morningstar’s Multisector Bond Funds category was 2.18%.
Q How would you describe the market environment for fixed-income investments during the 12-month period ended September 30, 2020?
A Entering the period in October of 2019, market sentiment received support from an accommodative Federal Reserve (Fed), which had reduced the target range of the federal funds rate by a quarter point in both July and September. Towards the end of 2019, the U.S. and China announced agreement on a “phase one” trade deal, signed in mid-January of 2020. The news of the trade deal provided further support for investors in so-called risk assets.
However, beginning in mid-February 2020, performance in the financial markets slumped as the COVID-19 virus, which first emerged in China but quickly became a global pandemic, drove governments at all levels to enact strict lockdown measures as they attempted to contain the spread of the virus. In many cases, the lockdown measures resulted in the majority of (non-essential) businesses in several U.S. states and in other countries shutting down for weeks and months, causing the global economy to grind to a near halt during March. Oil prices plummeted to 20-year lows
* See Notes to Financial Statements Note 9.
4 Pioneer Strategic Income Fund | Annual Report | 9/30/20
in response to slumping global demand driven by the rapid spread of COVID-19, and due to a supply shock resulting from a price war launched on March 8 between Saudi Arabia and Russia.
In financial markets, uncertainty over the scope and duration of the crisis and the need for cash drove wholesale liquidations across most asset classes and led to a flight-to-safety trade that drove U.S. Treasury yields to historic lows. Significant selling in U.S. dollar (USD) fixed-income sectors eventually stressed markets and created price dislocations in all segments, even Treasury bonds.
The unprecedented shutting down of much of the U.S. economy inspired extraordinary monetary and fiscal policy responses. The Fed jumped into action by dusting off its 2008/2009 policy “playbook” and rapidly rolling out a raft of programs aimed at restoring market liquidity, facilitating credit availability, and bolstering investors’ confidence. The measures included reducing the benchmark federal funds target range to near zero and committing to making unlimited purchases of U.S. Treasuries and agency mortgage-backed securities (MBS), if necessary, as well as providing support for commercial paper issuance, mutual fund liquidity needs, and the issuance of asset-backed securities (ABS). The Fed then entered uncharted waters with the announcement on March 23 of purchasing programs aimed at supporting investment-grade corporate bonds in both the new-issue and secondary markets. Shortly thereafter, Congress and the White House agreed on a large fiscal stimulus package intended to help business and individuals cope with the economic downturn created by COVID-19.
Investors reacted with enthusiasm to the expedient and massive stimulus efforts of policy makers in the wake of the pandemic entering the second quarter of 2020, as many sought to purchase securities in riskier asset classes at the now much wider spreads, in anticipation that the compensation levels would more than offset the taking on of increased default risk. (Credit spreads are commonly defined as the differences in yield between Treasuries and other types of fixed-income securities with similar maturities.) As the second quarter progressed, investors grew increasingly optimistic that steps taken towards re-opening the economy
Pioneer Strategic Income Fund | Annual Report | 9/30/20 5
would support something resembling a “V-shaped” recovery (a sharp, swift rise). The increased optimism resulted in a resurgence of positive sentiment for riskier assets that allowed credit-sensitive areas of the bond market to recover much of their earlier losses over the second quarter, even as rising numbers of COVID-19 cases in a number of states raised concerns.
However, macroeconomic uncertainty bubbled over during September, weighing on investor sentiment and the performance of riskier assets. The market’s focus on heightened macro risks revolved around three key areas: the status of negotiations in Washington over additional fiscal stimulus from the U.S. government, the trajectory of COVID-19 cases, and the November U.S. elections. With respect to the prospects for a second round of stimulus, a partisan dispute over when to appoint Supreme Court Justice Ginsburg’s replacement further hardened the negotiating positions of both parties and lowered the odds of broad fiscal support coming to fruition prior to the November election. Regarding COVID-19 risks, a notable uptick in European cases of the virus reignited concerns that the U.S. remains at risk for a “second wave” of infections as cooler fall temperatures start to drive people back indoors. Aside from the obvious health and safety concerns of a second wave of COVID-19, there also existed the potential for a new round of economic lockdowns looming on the horizon. Lastly, the November elections not only presented the typical uncertainties over the potential outcome, but also featured concerns about a protracted dispute over the election results.
In sector terms, industries viewed as better positioned to weather the COVID-19 crisis, such as food & drug retailers, led returns in the corporate sectors over the 12-month period. In contrast, industries highly dependent on out-of-the-home consumer spending, such as air transportation, finished the 12-month period sharply lower. While energy bonds partially recovered in the second quarter of 2020 as oil prices re-approached the $40 per barrel range, the segment remained well underwater for the full 12-month period.
The positive fixed-income performance for the 12-month period, as reflected by the more than 6.6% return of the Fund’s benchmark, the Bloomberg Barclays Index, received support from the notable decline in
6 Pioneer Strategic Income Fund | Annual Report | 9/30/20
Treasury yields. Within corporates, investment-grade issues outperformed their high-yield counterparts. Meanwhile, returns in the securitized-asset sectors also were positive, though they lagged the performance of investment-grade corporates for the 12-month period.
Q What factors affected the Fund’s performance relative to the benchmark Bloomberg Barclays Index during the 12-month period ended September 30, 2020?
A As a multisector fixed-income investment strategy, in managing the Fund, we seek to deliver solid returns while keeping volatility at a level similar to that of its benchmark by investing the portfolio across a diversified* range of investment-grade and non-investment-grade fixed-income asset classes globally. We strive to add value for the Fund’s shareholders through both sector allocation and security selection, focusing on “spread” sectors, which have tended to trade at a yield advantage relative to U.S. Treasuries. Sectors such as corporate bonds, agency MBS, securitized assets, and emerging markets have typically offered higher risk-adjusted returns than Treasuries as well as greater security selection opportunities. With our dynamic approach to sector allocation, we may increase the Fund’s risk profile when we feel the compensation levels available in the market are enough to offset taking on the increased risk, and may reduce the risk profile if we feel that the values available are less attractive.
The Fund’s benchmark-relative underperformance over the 12-month period owed mainly to a below-benchmark stance with respect to portfolio duration, security selection, and the lower relative quality of the portfolio’s holdings compared to the Bloomberg Barclays Index. (Duration is a measure of the sensitivity of the price, or the value of principal, of a fixed-income investment to a change in interest rates, expressed as a number of years.) In addition, the portfolio’s currency exposures and sector allocations weighed on relative returns.
The Fund’s short-U.S. duration positioning versus the Bloomberg Barclays Index detracted from benchmark-relative results as the Fed lowered the target range for the federal funds rate by 2.25% during the 12-month period, including two emergency rate cuts in March of 2020. In addition, the portfolio’s yield-curve positioning detracted from relative
* Diversification does not assure a profit nor protect against loss.
Pioneer Strategic Income Fund | Annual Report | 9/30/20 7
performance. The yield-curve positioning included Fund underweights to the five-year and 10-year parts of the curve, and an overweight to 30-year part of the curve.
The negative effects of security selection on the Fund’s benchmark-relative returns primarily reflected the underperformance of industrials issues, particularly energy-related holdings, and issues in sectors such as travel and leisure, which struggled significantly due to the COVID-19 crisis. The decline in oil prices over the 12-month period (to the $40 per barrel range), which included an interim drop below $20, created significant headwinds for U.S. energy and production companies.
The lower quality of the portfolio’s holdings within financials, commercial mortgage-backed securities (CMBS), and sovereign bonds also detracted from the Fund’s relative performance. The COVID-19 situation drove the underperformance of the Fund’s subordinated bank exposures within financials, non-benchmark and lower-quality CMBS holdings, and certain emerging markets exposures within South America, Africa, and the Middle East.
The Fund’s non-USD currency positions were another detractor from benchmark-relative returns, as the USD rose against a broad basket of major currencies during the 12-month period. In particular, portfolio allocations to commodity-related currencies, including the Norwegian krone, Mexican peso, and Russian ruble underperformed, along with exposures to the Swedish krona and Colombian peso.
Finally, the portfolio’s allocation to the securitized sectors hurt performance, primarily reflecting the negative effects of holdings of nonagency MBS, as the liquidity-driven sell-off in March drove down returns in the asset class. Likewise, the Fund’s substantial underweight to U.S. Treasuries was a drag on performance as interest rates declined sharply over the 12-month period.
8 Pioneer Strategic Income Fund | Annual Report | 9/30/20
Q Did the Fund have any exposure to derivative securities during the 12-month period ended September 20, 2020? If so, did the derivatives have an effect on the Fund’s performance?
A Yes, the Fund had exposures to three types of derivatives during the 12-month period: Treasury futures, credit-default swaps, and forward foreign currency contracts (“currency forwards”). The exposure to Treasury futures was part of our strategy to maintain a shorter-than-benchmark duration in the portfolio, which had a negative effect on the Fund’s results. We used the investments in credit-default swaps to manage the Fund’s exposure to credit-sensitive sectors; the swaps also had a negative effect on relative returns. The Fund’s allocation to currency forwards was a technique we used to manage the risks among the portfolio’s non-USD currency positions. That tactic generated mixed results from a benchmark-relative perspective, as the hedges helped performance and the longer exposures detracted from returns.
Q Did the Fund’s distributions** (or yield) to shareholders change during the 12-month period ended September 30, 2020?
A The Fund’s yield rose slightly over the 12-month period as spreads in credit-oriented areas of the market widened.
Q What is your investment outlook?
A The government’s first estimate of the third-quarter U.S. gross domestic product growth rate released after the end of the six-month period showed that domestic economic activity rebounded by more than 30% (annualized) during the quarter. Meanwhile, the economy has recovered more than 75% of the output drawdown recorded during the first half of 2020 while the COVID-19 lockdowns were in full force. Though it seems likely that the U.S. economic growth rate may slow from the third quarter to the fourth, we believe economic activity may continue to expand. History has shown that expansions have tended to be self-sustaining unless derailed by an exogenous shock. While additional fiscal stimulus from the federal government could likely accelerate the pace of economic activity, we anticipate growth continuing even without the government’s assistance, as personal savings balances have remained above normal. Although an increase in COVID-19 infections seems likely to occur during the winter months, another round of widespread lockdowns may not be necessary given the improvements in patient-treatment methods seen since the virus first arrived in this country.
** Distributions are not guaranteed.
Pioneer Strategic Income Fund | Annual Report | 9/30/20 9
Our outlook for spread-asset performance has remained positive, and balances out both near-term and medium-term considerations. We appreciate the near-term risks surrounding the uncertainties about the U.S. elections, a potential seasonal increase in COVID-19 infections, and unexpected delays in finding and distributing a safe and effective vaccine for the virus; however, we have framed those risks against asset spreads that, as of quarter-end, generally resided above early-2020 levels. In addition, we believe the medium-term fundamental outlook has remained positive, given continued improvement in COVID-19 treatments, developments regarding the possible approval of a successful vaccine, and accommodative financial conditions, with the latter currently facing little risk of reversal from tighter monetary policy.
With regard to positioning during the six-month period, as credit spreads peaked in March and April, we had increased the Fund’s exposure to longer-duration investment-grade corporates, funding the purchases through sales of high-quality non-agency MBS and short-term corporates. As spreads narrowed over the summer, we reduced the portfolio’s credit risk by trimming fully valued positions in long-term corporates, while maintaining the Fund’s above-benchmark sensitivity to changes in credit spreads.
In currency terms, we have favored Asian emerging markets that have significant exposure to China, as that country has continued to lead the global economic recovery.
10 Pioneer Strategic Income Fund | Annual Report | 9/30/20
Please refer to the Schedule of Investments on pages 22–86 for a full listing of Fund securities.
All investments are subject to risk, including the possible loss of principal. In the past several years, financial markets have experienced increased volatility and heightened uncertainty. The market prices of securities may go up or down, sometimes rapidly or unpredictably, due to general market conditions, such as real or perceived adverse economic, political, or regulatory conditions, recessions, inflation, changes in interest or currency rates, lack of liquidity in the bond markets, the spread of infectious illness or other public health issues or adverse investor sentiment. These conditions may continue, recur, worsen or spread.
Investments in high-yield or lower-rated securities are subject to greater-than-average price volatility, illiquidity and possibility of default.
The Fund’s investments, payment obligations and financing terms may be based on floating rates, such as LIBOR (London Interbank Offered Rate). Plans are underway to phase out the use of LIBOR by the end of 2021. There remains uncertainty regarding the nature of any replacement rate and the impact of the transition from LIBOR on the Fund, issuers of instruments in which the Fund invests, and financial markets generally.
When interest rates rise, the prices of fixed-income securities held by the Fund will generally fall. Conversely, when interest rates fall, the prices of fixed-income securities held by the Fund will generally rise.
Investments in the Fund are subject to possible loss due to the financial failure of issuers of underlying securities and their inability to meet their debt obligations.
Prepayment risk is the chance that an issuer may exercise its right to prepay its security, if falling interest rates prompt the issuer to do so. Forced to reinvest the unanticipated proceeds at lower interest rates, the Fund would experience a decline in income and lose the opportunity for additional price appreciation.
The securities issued by U.S. government-sponsored entities (e.g., FNMA, Freddie Mac) are neither guaranteed nor issued by the U.S. government.
The Fund may invest in mortgage-backed securities, which during times of fluctuating interest rates may increase or decrease more than other fixed-income securities. Mortgage-backed securities are also subject to prepayments.
Pioneer Strategic Income Fund | Annual Report | 9/30/20 11
The Fund may invest in insurance-linked securities. The return of principal and the payment of interest on insurance-linked securities are contingent on the non-occurrence of a predefined “trigger” event that leads to physical or economic loss, such as a hurricane or an aerospace catastrophe. Insurance-linked securities may expose the Fund to other risks, including, but not limited to, issuer (credit) default, adverse regulatory or jurisdictional interpretations and adverse tax consequences.
Investing in foreign and/or emerging markets securities involves risks relating to interest rates, currency exchange rates, economic, and political conditions.
At times, the Fund’s investments may represent industries or industry sectors that are interrelated or have common risks, making the Fund more susceptible to any economic, political, or regulatory developments or other risks affecting those industries and sectors.
These risks may increase share price volatility.
Before investing, consider the product’s investment objectives, risks, charges and expenses. Contact your advisor or Amundi Pioneer Asset Management, Inc., for a prospectus or summary prospectus containing this information. Read it carefully.
Any information in this shareholder report regarding market or economic trends or the factors influencing the Fund’s historical or future performance are statements of opinion as of the date of this report. Past performance is no guarantee of future results.
12 Pioneer Strategic Income Fund | Annual Report | 9/30/20
Portfolio Summary |
9/30/20 Portfolio Diversification
(As a percentage of total investments)*
† Amount rounds to less than 0.1%.
10 Largest Holdings
(As a percentage of total investments)*| | | |
| 1. | U.S. Treasury Inflation Indexed Bonds, 1.0%, 2/15/49 | 1.95% |
| 2. | U.S. Treasury Bills, 10/22/20 | 1.69 |
| 3. | Fannie Mae, 3.5%, 10/1/50 (TBA) | 1.27 |
| 4. | U.S. Treasury Inflation Indexed Bonds, 1.0%, 2/15/48 | 1.05 |
| 5. | Wells Fargo & Co., 7.5% | 0.99 |
| 6. | Anheuser-Busch InBev Worldwide, Inc., 5.55%, 1/23/49 | 0.80 |
| 7. | U.S. Treasury Bills, 10/13/20 | 0.79 |
| 8. | Liberty Mutual Insurance Co., 7.697%, 10/15/97 (144A) | 0.79 |
| 9. | Mexican Bonos, 8.5%, 5/31/29 | 0.72 |
| 10. | Cenovus Energy, Inc., 6.75%, 11/15/39 | 0.64 |
* Excludes temporary cash investments and all derivative contracts except for options purchased. The Fund is actively managed, and current holdings may be different. The holdings listed should not be considered recommendations to buy or sell any securities.
Pioneer Strategic Income Fund | Annual Report | 9/30/20 13
Prices and Distributions |
9/30/20 | | | |
| Net Asset Value per Share | |
| | |
| Class | 9/30/20 | 9/30/19 |
A | $10.91 | $10.89 |
C | $10.67 | $10.66 |
K | $10.92 | $10.92 |
R | $11.09 | $11.08 |
Y | $10.91 | $10.90 |
Distributions per Share: 10/1/19–9/30/20
| | | | | |
| Net Investment | Short-Term | Long-Term | Tax Return |
| Class | Income | Capital Gains | Capital Gains | of Capital |
A | $0.3420 | $ — | $ — | $ — |
C | $0.2657 | $ — | $ — | $ — |
K | $0.3916 | $ — | $ — | $ — |
R | $0.3145 | $ — | $ — | $ — |
Y | $0.3792 | $ — | $ — | $ — |
Index Definitions
The Bloomberg Barclays U.S. Universal Index is an unmanaged index that represents the union of the U.S. Aggregate Index, the U.S. High Yield Corporate Index, the 144A Index, the Eurodollar Index, the Emerging Markets Index, the non-ERISA portion of the CMBS Index, and the CMBS High Yield Index. Municipal debt, private placements and non-dollar-denominated issues are excluded. Index returns are calculated monthly, assume reinvestment of dividends and, unlike Fund returns, do not reflect any fees, expenses or sales charges. It is not possible to invest directly in an index.
The index defined here pertains to the “Value of $10,000 Investment” and “Value of $5 Million Investment” charts on pages 15–19.
14 Pioneer Strategic Income Fund | Annual Report | 9/30/20
| | |
Performance Update | 9/30/20 | Class A Shares |
Investment Returns
The mountain chart on the right shows the change in value of a $10,000 investment made in Class A shares of Pioneer Strategic Income Fund at public offering price during the periods shown, compared to that of the Bloomberg Barclays U.S. Universal Index.
| | | | |
| Average Annual Total Returns |
(As of September 30, 2020) |
| | | Bloomberg |
| Net | Public | Barclays |
| Asset | Offering | U.S.
|
| Value | Price | Universal |
| Period | (NAV) | (POP) | Index |
10 years | 4.20% | 3.73% | 3.92% |
5 years | 4.32 | 3.36 | 4.49 |
1 year | 3.44 | -1.21 | 6.68 |
|
|
| Expense Ratio | | |
(Per prospectus dated February 1, 2020) |
| Gross | | | |
1.10% | | | |
Call 1-800-225-6292 or visit www.amundipioneer.com/us for the most recent month-end performance results. Current performance may be lower or higher than the performance data quoted.
The performance data quoted represents past performance, which is no guarantee of future results. Investment return and principal value will fluctuate, and shares, when redeemed, may be worth more or less than their original cost.
NAV results represent the percent change in net asset value per share. NAV returns would have been lower had sales charges been reflected. POP returns reflect deduction of maximum 4.50% sales charge. All results are historical and assume the reinvestment of dividends and capital gains. Other share classes are available for which performance and expenses will differ.
Performance results reflect any applicable expense waivers in effect during the periods shown. Without such waivers Fund performance would be lower. Waivers may not be in effect for all funds. Certain fee waivers are contractual through a specified period. Otherwise, fee waivers can be rescinded at any time. See the prospectus and financial statements for more information.
The performance table and graph do not reflect the deduction of fees and taxes that a shareowner would pay on Fund distributions or the redemption of Fund shares.
Please refer to the financial highlights for a more current expense ratio.
Pioneer Strategic Income Fund | Annual Report | 9/30/20 15
| | |
Performance Update | 9/30/20 | Class C Shares |
Investment Returns
The mountain chart on the right shows the change in value of a $10,000 investment made in Class C shares of Pioneer Strategic Income Fund during the periods shown, compared to that of the Bloomberg Barclays U.S. Universal Index.
| | | | |
| Average Annual Total Returns |
(As of September 30, 2020)
|
| | | Bloomberg |
| | | Barclays |
| | | U.S. |
| If | If | Universal |
| Period | Held | Redeemed | Index
|
10 years | 3.50% | 3.50% | 3.92% |
5 years | 3.64 | 3.64 | 4.49 |
1 year | 2.67 | 2.67 | 6.68 |
|
|
| Expense Ratio | | |
(Per prospectus dated February 1, 2020) |
| Gross | | | |
1.74% | | | |
Call 1-800-225-6292 or visit www.amundipioneer.com/us for the most recent month-end performance results. Current performance may be lower or higher than the performance data quoted.
The performance data quoted represents past performance, which is no guarantee of future results. Investment return and principal value will fluctuate, and shares, when redeemed, may be worth more or less than their original cost.
Class C shares held for less than one year are also subject to a 1% contingent deferred sales charge (CDSC). “If Held” results represent the percent change in net asset value per share. “If Redeemed” returns would have been lower had sales charges been reflected. All results are historical and assume the reinvestment of dividends and capital gains. Other share classes are available for which performance and expenses will differ.
Performance results reflect any applicable expense waivers in effect during the periods shown. Without such waivers Fund performance would be lower. Waivers may not be in effect for all funds. Certain fee waivers are contractual through a specified period. Otherwise, fee waivers can be rescinded at any time. See the prospectus and financial statements for more information.
The performance table and graph do not reflect the deduction of fees and taxes that a shareowner would pay on Fund distributions or the redemption of Fund shares.
Please refer to the financial highlights for a more current expense ratio.
16 Pioneer Strategic Income Fund | Annual Report | 9/30/20
| | |
Performance Update | 9/30/20 | Class K Shares |
Investment Returns
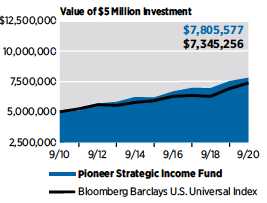
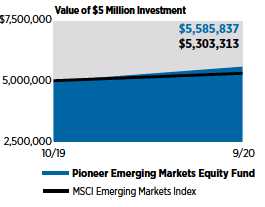
The mountain chart on the right shows the change in value of a $5 million investment made in Class K shares of Pioneer Strategic Income Fund during the periods shown, compared to that of the Bloomberg Barclays U.S. Universal Index.
| | | |
| Average Annual Total Returns |
(As of September 30, 2020) |
| | Bloomberg |
| Net | Barclays |
| Asset | U.S. |
| Value | Universal |
| Period | (NAV) | Index |
10 years | 4.55% | 3.92% |
5 years | 4.75 | 4.49 |
1 year | 3.73 | 6.68 |
|
|
| Expense Ratio | | |
(Per prospectus dated February 1, 2020) |
| Gross | | |
0.63% | | |
Call 1-800-225-6292 or visit www.amundipioneer.com/us for the most recent month-end performance results. Current performance may be lower or higher than the performance data quoted.
The performance data quoted represents past performance, which is no guarantee of future results. Investment return and principal value will fluctuate, and shares, when redeemed, may be worth more or less than their original cost.
The performance shown for Class K shares for the period prior to the commencement of operations of Class K shares on December 20, 2012, is the net asset value performance of the Fund’s Class A shares, which has not been restated to reflect any differences in expenses, including Rule 12b-1 fees applicable to Class A shares. Since fees for Class A shares generally are higher than those of Class K shares, the performance of Class K shares prior to their inception would have been higher than the performance shown. For the period beginning December 20, 2012, the actual performance of Class K shares is reflected. Class K shares are not subject to sales charges and are available for limited groups of eligible investors, including institutional investors. All results are historical and assume the reinvestment of dividends and capital gains. Other share classes are available for which performance and expenses will differ.
Performance results reflect any applicable expense waivers in effect during the periods shown. Without such waivers Fund performance would be lower. Waivers may not be in effect for all funds. Certain fee waivers are contractual through a specified period. Otherwise, fee waivers can be rescinded at any time. See the prospectus and financial statements for more information.
The performance table and graph do not reflect the deduction of fees and taxes that a shareowner would pay on Fund distributions or the redemption of Fund shares.
Please refer to the financial highlights for a more current expense ratio.
Pioneer Strategic Income Fund | Annual Report | 9/30/20 17
| | |
Performance Update | 9/30/20 | Class R Shares |
Investment Returns
The mountain chart on the right shows the change in value of a $10,000 investment made in Class R shares of Pioneer Strategic Income Fund during the periods shown, compared to that of the Bloomberg Barclays U.S. Universal Index.
| | | |
| Average Annual Total Returns |
(As of September 30, 2020) |
| | Bloomberg |
| Net | Barclays |
| Asset | U.S. |
| Value | Universal |
| Period | (NAV) | Index |
10 years | 3.85% | 3.92% |
5 years | 3.99 | 4.49 |
1 year | 3.03 | 6.68 |
|
|
| Expense Ratio | | |
(Per prospectus dated February 1, 2020) |
| Gross | | |
1.39% | | |
Call 1-800-225-6292 or visit www.amundipioneer.com/us for the most recent month-end performance results. Current performance may be lower or higher than the performance data quoted.
The performance data quoted represents past performance, which is no guarantee of future results. Investment return and principal value will fluctuate, and shares, when redeemed, may be worth more or less than their original cost.
Class R shares are not subject to sales charges and are available for limited groups of eligible investors, including institutional investors. All results are historical and assume the reinvestment of dividends and capital gains. Other share classes are available for which performance and expenses will differ.
Performance results reflect any applicable expense waivers in effect during the periods shown. Without such waivers Fund performance would be lower. Waivers may not be in effect for all funds. Certain fee waivers are contractual through a specified period. Otherwise, fee waivers can be rescinded at any time. See the prospectus and financial statements for more information.
The performance table and graph do not reflect the deduction of fees and taxes that a shareowner would pay on Fund distributions or the redemption of Fund shares.
Please refer to the financial highlights for a more current expense ratio.
18 Pioneer Strategic Income Fund | Annual Report | 9/30/20
| | |
Performance Update | 9/30/20 | Class Y Shares |
Investment Returns
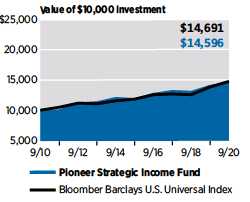
The mountain chart on the right shows the change in value of a $5 million investment made in Class Y shares of Pioneer Strategic Income Fund during the periods shown, compared to that of the Bloomberg Barclays U.S. Universal Index.
| | | |
| Average Annual Total Returns |
(As of September 30, 2020) |
| | Bloomberg |
| Net | Barclays |
| Asset | U.S. |
| Value | Universal |
| Period | (NAV) | Index |
10 years | 4.53% | 3.92% |
5 years | 4.66 | 4.49 |
1 year | 3.71 | 6.68 |
|
|
| Expense Ratio | | |
(Per prospectus dated February 1, 2020) |
| Gross | | |
0.73% | | |
Call 1-800-225-6292 or visit www.amundipioneer.com/us for the most recent month-end performance results. Current performance may be lower or higher than the performance data quoted.
The performance data quoted represents past performance, which is no guarantee of future results. Investment return and principal value will fluctuate, and shares, when redeemed, may be worth more or less than their original cost.
Class Y shares are not subject to sales charges and are available for limited groups of eligible investors, including institutional investors. All results are historical and assume the reinvestment of dividends and capital gains. Other share classes are available for which performance and expenses will differ.
Performance results reflect any applicable expense waivers in effect during the periods shown. Without such waivers Fund performance would be lower. Waivers may not be in effect for all funds. Certain fee waivers are contractual through a specified period. Otherwise, fee waivers can be rescinded at any time. See the prospectus and financial statements for more information.
The performance table and graph do not reflect the deduction of fees and taxes that a shareowner would pay on Fund distributions or the redemption of Fund shares.
Please refer to the financial highlights for a more current expense ratio.
Pioneer Strategic Income Fund | Annual Report | 9/30/20 19
Comparing Ongoing Fund Expenses
As a shareowner in the Fund, you incur two types of costs:
(1) ongoing costs, including management fees, distribution and/or service (12b-1) fees, and other Fund expenses; and
(2) transaction costs, including sales charges (loads) on purchase payments.
This example is intended to help you understand your ongoing expenses (in dollars) of investing in the Fund and to compare these costs with the ongoing costs of investing in other mutual funds. The example is based on an investment of $1,000 at the beginning of the Fund’s latest six-month period and held throughout the six months.
Using the Tables
Actual Expenses
The first table below provides information about actual account values and actual expenses. You may use the information in this table, together with the amount you invested, to estimate the expenses that you paid over the period as follows:
(1) Divide your account value by $1,000
Example: an $8,600 account value ÷ $1,000 = 8.6
(2) Multiply the result in (1) above by the corresponding share class’s number in the third row under the heading entitled “Expenses Paid During Period” to estimate the expenses you paid on your account during this period.
Expenses Paid on a $1,000 Investment in Pioneer Strategic Income Fund
Based on actual returns from April 1, 2020 through September 30, 2020.
| | | | | | |
| Share Class | A | C | K | R | Y |
Beginning Account | $1,000.00 | $1,000.00 | $1,000.00 | $1,000.00 | $1,000.00 |
Value on 4/1/20 | | | | | |
Ending Account Value | $1,216.37 | $1,157.89 | $1,164.07 | $1,159.59 | $1,164.76 |
(after expenses) | | | | | |
on 9/30/20 | | | | | |
Expenses Paid | $5.87 | $9.33 | $3.35 | $7.56 | $4.00 |
During Period* | | | | | |
* Expenses are equal to the Fund’s annualized expense ratio of 1.06%, 1.73%, 0.62%, 1.40%, and 0.74% for Class A, Class C, Class K, Class R and Class Y respectively, multiplied by the average account value over the period, multiplied by 183/366 (to reflect the one-half year period).
20 Pioneer Strategic Income Fund | Annual Report | 9/30/20
Hypothetical Example for Comparison Purposes
The table below provides information about hypothetical account values and hypothetical expenses based on the Fund’s actual expense ratio and an assumed rate of return of 5% per year before expenses, which is not the Fund’s actual return. The hypothetical account values and expenses may not be used to estimate the actual ending account balance or expenses you paid for the period.
You may use this information to compare the ongoing costs of investing in the Fund and other funds. To do so, compare this 5% hypothetical example with the 5% hypothetical examples that appear in the shareholder reports of the other funds.
Please note that the expenses shown in the tables are meant to highlight your ongoing costs only and do not reflect any transaction costs, such as sales charges (loads) that are charged at the time of the transaction. Therefore, the table below is useful in comparing ongoing costs only and will not help you determine the relative total costs of owning different funds. In addition, if these transaction costs were included, your costs would have been higher.
Expenses Paid on a $1,000 Investment in Pioneer Strategic Income Fund
Based on a hypothetical 5% return per year before expenses, reflecting the period from April 1, 2020 through September 30, 2020.
| | | | | | |
| Share Class | A | C | K | R | Y |
Beginning Account | $1,000.00 | $1,000.00 | $1,000.00 | $1,000.00 | $1,000.00 |
Value on 4/1/20 | | | | | |
Ending Account Value | $1,019.70 | $1,016.35 | $1,021.90 | $1,018.00 | $1,021.30 |
(after expenses) | | | | | |
on 9/30/20 | | | | | |
Expenses Paid | $5.35 | $8.72 | $3.13 | $7.06 | $3.74 |
During Period* | | | | | |
* Expenses are equal to the Fund’s annualized expense ratio of 1.06%, 1.73%, 0.62%, 1.40%, and 0.74% for Class A, Class C, Class K, Class R and Class Y respectively, multiplied by the average account value over the period, multiplied by 183/366 (to reflect the one-half year period).
Pioneer Strategic Income Fund | Annual Report | 9/30/20 21
Schedule of Investments |
9/30/20 | | | | |
| Shares | | | Value |
| | | UNAFFILIATED ISSUERS — 100.8% | |
| | COMMON STOCKS — 0.0%† of Net Assets | |
| | | Auto Components — 0.0%† | |
| 1,316 | | Lear Corp. | $ 143,510 |
| | | Total Auto Components | $ 143,510 |
| | | Household Durables — 0.0%† | |
| 1,018,282(a) | | Desarrolladora Homex SAB de CV | $ 1,934 |
| | | Total Household Durables | $ 1,934 |
| | | Oil, Gas & Consumable Fuels — 0.0%† | |
| 9,565,478+^(a) | | Ascent CNR Corp. | $ 286,964 |
| 2,013 | | Frontera Energy Corp. | 3,241 |
| | | Total Oil, Gas & Consumable Fuels | $ 290,205 |
| | | Paper & Forest Products — 0.0%† | |
| 162,828(a) | | Emerald Plantation Holdings, Ltd. | $ 4,071 |
| | | Total Paper & Forest Products | $ 4,071 |
| | | Specialty Retail — 0.0%† | |
| 111,548+^(a) | | Targus Cayman SubCo., Ltd. | $ 147,243 |
| | | Total Specialty Retail | $ 147,243 |
| | | TOTAL COMMON STOCKS | |
| | | (Cost $1,215,239) | $ 586,963 |
| | | CONVERTIBLE PREFERRED STOCKS — 1.4% of | |
| | | Net Assets | |
| | | Banks — 1.4% | |
| 12,114(b) | | Bank of America Corp., 7.25% | $ 18,025,632 |
| 32,750(b) | | Wells Fargo & Co., 7.5% | 43,952,138 |
| | | Total Banks | $ 61,977,770 |
| | TOTAL CONVERTIBLE PREFERRED STOCKS | |
| | | (Cost $57,668,258) | $ 61,977,770 |
| | PREFERRED STOCK — 0.1% of Net Assets | |
| | | Equity Real Estate Investment Trusts (REITs) — 0.1% | |
| 3,250(b) | | Firstar Realty LLC, 8.875% (144A) | $ 3,575,000 |
| | | Total Equity Real Estate Investment Trusts (REITs) | $ 3,575,000 |
| | | TOTAL PREFERRED STOCK | |
| | | (Cost $4,200,625) | $ 3,575,000 |
| Principal | | | |
| Amount | | | |
| USD ($) | | | |
| | ASSET BACKED SECURITIES — 11.7% of | |
| | | Net Assets | |
| 500,000 | | 321 Henderson Receivables III LLC, Series 2008-1A, | |
| | | Class C, 9.36%, 1/15/48 (144A) | $ 627,663 |
| 500,000 | | 321 Henderson Receivables III LLC, Series 2008-1A, | |
| | | Class D, 10.81%, 1/15/50 (144A) | 611,846 |
The accompanying notes are an integral part of these financial statements.
22 Pioneer Strategic Income Fund | Annual Report | 9/30/20
| | | | |
| Principal | | | |
| Amount | | | |
| USD ($) | | | Value |
| | ASSET BACKED SECURITIES — (continued) | |
| 4,000,000(c) | | 522 Funding CLO I, Ltd., Series 2019-4A, Class E, 7.272% | |
| | | (3 Month USD LIBOR + 700 bps), 4/20/30 (144A) | $ 3,597,328 |
| 5,000,000(c) | | 522 Funding CLO I, Ltd., Series 2019-5A, Class E, 7.615% | |
| | | (3 Month USD LIBOR + 734 bps), 1/15/33 (144A) | 4,847,700 |
| 7,500,000 | | A10 Bridge Asset Financing LLC, Series 2019-B, | |
| | | Class A1, 3.085%, 8/15/40 (144A) | 7,758,089 |
| 3,500,000 | | A10 Bridge Asset Financing LLC, Series 2019-B, | |
| | | Class D, 4.523%, 8/15/40 (144A) | 3,487,343 |
| 1,311,024 | | Accelerated Assets LLC, Series 2018-1, Class B, 4.51%, | |
| | | 12/2/33 (144A) | 1,326,190 |
| 1,853,310 | | Accelerated Assets LLC, Series 2018-1, Class C, 6.65%, | |
| | | 12/2/33 (144A) | 1,921,181 |
| 2,188,882 | | Access Point Funding I LLC, Series 2017-A, Class B, | |
| | | 3.97%, 4/15/29 (144A) | 2,201,230 |
| 1,750,000(c) | | AIG CLO, Ltd., Series 2019-2A, Class E, 7.495% | |
| | | (3 Month USD LIBOR + 725 bps), 10/25/32 (144A) | 1,662,112 |
| 750,000 | | Amur Equipment Finance Receivables V LLC, Series | |
| | | 2018-1A, Class E, 5.36%, 4/22/24 (144A) | 765,830 |
| 899,999 | | Amur Equipment Finance Receivables V LLC, Series | |
| | | 2018-1A, Class F, 7.3%, 5/20/26 (144A) | 922,172 |
| 1,513,000 | | Amur Equipment Finance Receivables VI LLC, Series | |
| | | 2018-2A, Class E, 5.45%, 11/20/23 (144A) | 1,514,083 |
| 3,000,000 | | Amur Equipment Finance Receivables VII LLC, Series | |
| | | 2019-1A, Class E, 4.47%, 3/20/25 (144A) | 2,936,963 |
| 2,000,000(c) | | Apidos CLO XXXII, Series 2019-32A, Class E, 7.022% | |
| | | (3 Month USD LIBOR + 675 bps), 1/20/33 (144A) | 1,904,224 |
| 300,000 | | Avid Automobile Receivables Trust, Series 2018-1, | |
| | | Class C, 5.13%, 2/18/25 (144A) | 302,285 |
| 2,040,000 | | Avid Automobile Receivables Trust, Series 2019-1, | |
| | | Class D, 4.03%, 7/15/26 (144A) | 2,096,298 |
| 1,500,000(c) | | Battalion CLO VII, Ltd., Series 2014-7A, Class CRR, | |
| | | 3.203% (3 Month USD LIBOR + 293 bps), 7/17/28 | |
| | | (144A) | 1,450,014 |
| 2,000,000(c) | | Battalion CLO VII, Ltd., Series 2014-7A, Class ERR, | |
| | | 8.853% (3 Month USD LIBOR + 858 bps), 7/17/28 | |
| | | (144A) | 1,783,524 |
| 3,295,000(c) | | Battalion CLO IX, Ltd., Series 2015-9A, Class ER, 6.525% | |
| | | (3 Month USD LIBOR + 625 bps), 7/15/31 (144A) | 2,979,375 |
| 1,550,000 | | BCC Funding XIV LLC, Series 2018-1A, Class D, 4.61%, | |
| | | 8/21/23 (144A) | 1,556,761 |
| 1,500,000(c) | | BDS, Ltd., Series 2020-FL5, Class C, 2.2% (1 Month USD | |
| | | LIBOR + 205 bps), 2/16/37 (144A) | 1,456,645 |
| 1,600,000(c) | | Benefit Street Partners CLO XIX, Ltd., Series 2019-19A, | |
| | | Class D, 4.075% (3 Month USD LIBOR + | |
| | | 380 bps), 1/15/33 (144A) | 1,514,715 |
| 4,000,000(c) | | Benefit Street Partners CLO XIX, Ltd., Series 2019-19A, | |
| | | Class E, 7.295% (3 Month USD LIBOR + | |
| | | 702 bps), 1/15/33 (144A) | 3,788,304 |
The accompanying notes are an integral part of these financial statements.
Pioneer Strategic Income Fund | Annual Report | 9/30/20 23
Schedule of Investments | 9/30/20 (continued)
| | | | |
| Principal | | | |
| Amount | | | |
| USD ($) | | | Value |
| | ASSET BACKED SECURITIES — (continued) | |
| 3,000,000(c) | | Carlyle US CLO, Ltd., Series 2019-4A, Class C, 4.275% | |
| | | (3 Month USD LIBOR + 400 bps), 1/15/33 (144A) | $ 2,909,964 |
| 2,750,000 | | Carvana Auto Receivables Trust, Series 2019-4A, | |
| | | Class E, 4.7%, 10/15/26 (144A) | 2,798,862 |
| 4,250,000(c) | | Catskill Park CLO, Ltd., Series 2017-1A, Class D, 6.272% | |
| | | (3 Month USD LIBOR + 600 bps), 4/20/29 (144A) | 3,799,912 |
| 153,348 | | Commonbond Student Loan Trust, Series 2017-BGS, | |
| | | Class C, 4.44%, 9/25/42 (144A) | 159,606 |
| 129,180 | | Conn’s Receivables Funding LLC, Series 2018-A, Class B, | |
| | | 4.65%, 1/15/23 (144A) | 129,090 |
| 5,084,518 | | Conn’s Receivables Funding LLC, Series 2019-A, Class B, | |
| | | 4.36%, 10/16/23 (144A) | 5,085,291 |
| 2,841,348 | | Conn’s Receivables Funding LLC, Series 2019-A, Class C, | |
| | | 5.29%, 10/16/23 (144A) | 2,789,289 |
| 6,150,000 | | Conn’s Receivables Funding LLC, Series 2019-B, Class C, | |
| | | 4.6%, 6/17/24 (144A) | 6,038,540 |
| 3,155,000 | | Continental Credit Card ABS LLC, Series 2019-1A, | |
| | | Class C, 6.16%, 8/15/26 (144A) | 3,196,722 |
| 3,942,707 | | Diamond Resorts Owner Trust, Series 2019-1A, Class C, | |
| | | 4.02%, 2/20/32 (144A) | 3,870,118 |
| 56,657 | | Drug Royalty III LP 1, Series 2017-1A, Class A2, 3.6%, | |
| | | 4/15/27 (144A) | 56,845 |
| 5,000,000(c) | | Dryden 78 CLO, Ltd., Series 2020-78A, Class E, 7.867% | |
| | | (3 Month USD LIBOR + 660 bps), 4/17/33 (144A) | 4,760,995 |
| 500,000 | | Elm Trust, Series 2018-2A, Class B, 5.584%, | |
| | | 10/20/27 (144A) | 497,295 |
2,000,000
| | Engs Commercial Finance Trust, Series 2016-1A, Class D, | |
| | | 5.22%, 1/22/24 (144A) | 2,005,777 |
| 6,000,000 | | ExteNet LLC, Series 2019-1A, Class C, 5.219%, | |
| | | 7/26/49 (144A) | 5,913,686 |
| 3,100,000 | | Fair Square Issuance Trust, Series 2020-AA, Class D, | |
| | | 6.86%, 9/20/24 (144A) | 2,936,234 |
| 8,529,039 | | Finance of America Structured Securities Trust, Series | |
| | | 2019-A, Class JR2, 2.0%, 3/25/69 | 9,210,511 |
| 7,600,093 | | Finance of America Structured Securities Trust, Series | |
| | | 2019-JR3, Class JR2, 2.0%, 9/25/69 | 7,953,716 |
| 2,250,000(c) | | First Eagle BSL CLO, Ltd., Series 2019-1A, Class C, | |
| | | 4.622% (3 Month USD LIBOR + 435 bps), 1/20/33 | |
| | | (144A) | 2,099,615 |
| 3,000,000(c) | | First Eagle BSL CLO, Ltd., Series 2019-1A, Class D, | |
| | | 7.972% (3 Month USD LIBOR + 770 bps), 1/20/33 | |
| | | (144A) | 2,866,107 |
| 2,050,000(c) | | Fort Washington CLO, Series 2019-1A, Class E, 7.522% | |
| | | (3 Month USD LIBOR + 725 bps), 10/20/32 (144A) | 1,835,714 |
| 5,500,000 | | Four Seas LP, Series 2017-1A, Class A2, 5.927%, | |
| | | 8/28/27 (144A) | 4,739,546 |
| 1,000,000 | | Foursight Capital Automobile Receivables Trust, Series | |
| | | 2018-2, Class F, 6.48%, 6/15/26 (144A) | 1,006,878 |
The accompanying notes are an integral part of these financial statements.
24 Pioneer Strategic Income Fund | Annual Report | 9/30/20
| | | | |
| Principal | | | |
| Amount | | | |
| USD ($) | | | Value |
| | ASSET BACKED SECURITIES — (continued) | |
| 1,800,000 | | Foursight Capital Automobile Receivables Trust, Series | |
| | | 2019-1, Class E, 4.3%, 9/15/25 (144A) | $ 1,846,123 |
| 241,245(d) | | Gold Key Resorts LLC, Series 2014-A, Class C, 5.87%, | |
| | | 3/17/31 (144A) | 242,449 |
| 5,022,000(c) | | Goldentree Loan Management US CLO 2, Ltd., Series | |
| | | 2017-2A, Class E, 4.972% (3 Month USD LIBOR + | |
| | | 470 bps), 11/28/30 (144A) | 4,265,601 |
| 5,230,000(c) | | Goldentree Loan Management US CLO 6, Ltd., Series | |
| | | 2019-6A, Class D, 4.122% (3 Month USD LIBOR + | |
| | | 385 bps), 1/20/33 (144A) | 5,231,914 |
| 3,410,400 | | Hardee’s Funding LLC, Series 2018-1A, Class A2II, | |
| | | 4.959%, 6/20/48 (144A) | 3,526,081 |
| 3,000,000(c) | | Harriman Park CLO, Ltd., Series 2020-1A, Class D, | |
| | | 4.775% (3 Month USD LIBOR + 364 bps), | |
| | | 4/20/31 (144A) | 2,986,917 |
| 2,000,000 | | Hertz Fleet Lease Funding LP, Series 2018-1, Class E, | |
| | | 5.55%, 5/10/32 (144A) | 2,007,680 |
| 10,560,000 | | HOA Funding LLC, Series 2014-1A, Class A2, 4.846%, | |
| | | 8/20/44 (144A) | 9,190,790 |
| 717,441 | | Home Partners of America Trust, Series 2019-1, Class F, | |
| | | 4.101%, 9/17/39 (144A) | 665,617 |
| 3,821,424 | | Icon Brand Holdings LLC, Series 2012-1A, Class A, | |
| | | 4.229%, 1/25/43 (144A) | 2,457,909 |
| 798,908 | | JG Wentworth XXII LLC, Series 2010-3A, Class A, | |
| | | 3.82%, 12/15/48 (144A) | 838,092 |
| 6,450,000 | | Kabbage Funding LLC, Series 2019-1, Class C, 4.611%, | |
| | | 3/15/24 (144A) | 6,096,539 |
| 5,000,000(c) | | Kayne CLO 7, Ltd., Series 2020-7A, Class E, 7.907% | |
| | | (3 Month USD LIBOR + 650 bps), 4/17/33 (144A) | 4,784,010 |
| 5,000,000(c) | | Madison Park Funding XXII, Ltd., Series 2016-22A, | |
| | | Class ER, 6.975% (3 Month USD LIBOR + | |
| | | 670 bps), 1/15/33 (144A) | 4,562,035 |
| 7,000,000(c) | | Madison Park Funding XXXVI, Ltd., Series 2019-36A, | |
| | | Class E, 7.525% (3 Month USD LIBOR + | |
| | | 725 bps), 1/15/33 (144A) | 6,823,145 |
| 3,500,000(c) | | Mariner CLO LLC, Series 2015-1A, Class DR2, 3.122% | |
| | | (3 Month USD LIBOR + 285 bps), 4/20/29 (144A) | 3,323,716 |
| 1,250,000 | | Marlette Funding Trust, Series 2019-1A, Class C, 4.42%, | |
| | | 4/16/29 (144A) | 1,235,763 |
| 8,921,980(d) | | Mill City Mortgage Loan Trust, Series 2018-3, Class M2, | |
| | | 3.25%, 8/25/58 (144A) | 9,196,836 |
| 2,320,054(d) | | Mill City Mortgage Loan Trust, Series 2018-3, Class M3, | |
| | | 3.25%, 8/25/58 (144A) | 2,350,019 |
| 5,930,000 | | Mosaic Solar Loan Trust, Series 2019-2A, Class D, 6.18%, | |
| | | 9/20/40 (144A) | 5,623,396 |
| 5,829,000(d) | | Nationstar HECM Loan Trust, Series 2019-1A, Class M4, | |
| | | 5.804%, 6/25/29 (144A) | 5,830,158 |
The accompanying notes are an integral part of these financial statements.
Pioneer Strategic Income Fund | Annual Report | 9/30/20 25
Schedule of Investments | 9/30/20 (continued)
| | | | |
| Principal | | | |
| Amount | | | |
| USD ($) | | | Value |
| | ASSET BACKED SECURITIES — (continued) | |
| 5,000,000(c) | | Neuberger Berman CLO XVII, Ltd., Series 2014-17A, | |
| | | Class ER2, 7.458% (3 Month USD LIBOR + | |
| | | 720 bps), 4/22/29 (144A) | $ 4,624,600 |
| 4,500,000(c) | | Newark BSL CLO 1, Ltd., Series 2016-1A, Class DR, | |
| | | 6.495% (3 Month USD LIBOR + 625 bps), | |
| | | 12/21/29 (144A) | 4,051,890 |
| 843,570(c) | | Newtek Small Business Loan Trust, Series 2017-1, | |
| | | Class B, 3.148% (1 Month USD LIBOR + | |
| | | 300 bps), 2/25/43 (144A) | 764,730 |
| 4,360,000 | | NMEF Funding LLC, Series 2019-A, Class D, 4.39%, | |
| | | 8/17/26 (144A) | 4,427,160 |
| 2,000,000(c) | | Octagon Investment Partners XXI, Ltd., Series 2014-1A, | |
| | Class DRR, 7.265% (3 Month USD LIBOR + | |
| | | 700 bps), 2/14/31 (144A) | 1,840,432 |
| 1,119,000 | | Octane Receivables Trust, Series 2020-1A, Class D, | |
| | | 5.45%, 3/20/28 (144A) | 1,117,180 |
| 4,462,565 | | Orange Lake Timeshare Trust, Series 2019-A, Class D, | |
| | | 4.93%, 4/9/38 (144A) | 4,395,333 |
| 177,159 | | Oxford Finance Funding LLC, Series 2016-1A, Class A, | |
| | | 3.968%, 6/17/24 (144A) | 177,227 |
| 5,600,000(c) | | Palmer Square Loan Funding, Ltd., Series 2020-1A, | |
| | | Class D, 5.103% (3 Month USD LIBOR + | |
| | | 485 bps), 2/20/28 (144A) | 4,968,208 |
| 4,300,000 | | PG Receivables Finance, Series 2020-1, Class C, 5.44%, | |
| | | 7/20/25 (144A) | 4,160,250 |
| 3,000,000 | | Progress Residential Trust, Series 2018-SFR2, Class A, | |
| | | 3.712%, 8/17/35 (144A) | 3,077,064 |
| 3,430,000 | | Progress Residential Trust, Series 2018-SFR2, Class E, | |
| | | 4.656%, 8/17/35 (144A) | 3,516,946 |
| 4,770,000 | | Progress Residential Trust, Series 2018-SFR3, Class F, | |
| | | 5.368%, 10/17/35 (144A) | 4,903,146 |
| 147,226 | | Purchasing Power Funding LLC, Series 2018-A, Class A, | |
| | | 3.34%, 8/15/22 (144A) | 147,283 |
| 5,000,000(c) | | Race Point VIII CLO, Ltd., Series 2013-8A, Class DR2, | |
| | | 3.753% (3 Month USD LIBOR + 350 bps), | |
| | | 2/20/30 (144A) | 4,670,300 |
| 2,200,000 | | Republic Finance Issuance Trust, Series 2019-A, Class B, | |
| | | 3.93%, 11/22/27 (144A) | 2,173,534 |
| 3,000,000 | | Republic Finance Issuance Trust, Series 2019-A, Class C, | |
| | | 5.1%, 11/22/27 (144A) | 2,835,122 |
| 1,500,000 | | Rosy, Series 2018-1, Class A1, 6.25%, 12/15/25 (144A) | 1,425,000 |
| 2,250,000 | | SCF Equipment Leasing LLC, Series 2018-1A, Class C, | |
| | | 4.21%, 4/20/27 (144A) | 2,304,914 |
| 7,729,399 | | SCF Equipment Leasing LLC, Series 2019-1A, Class E, | |
| | | 5.49%, 4/20/30 (144A) | 7,477,521 |
| 3,862,740 | | Sierra Timeshare Receivables Funding LLC, Series | |
| | | 2019-1A, Class D, 4.75%, 1/20/36 (144A) | 3,877,633 |
| 3,660,460 | | Sierra Timeshare Receivables Funding LLC, Series | |
| | | 2020-2A, Class D, 6.59%, 7/20/37 (144A) | 3,701,180 |
The accompanying notes are an integral part of these financial statements.
26 Pioneer Strategic Income Fund | Annual Report | 9/30/20
| | | | |
| Principal | | | |
| Amount | | | |
| USD ($) | | | Value |
| | ASSET BACKED SECURITIES — (continued) | |
| 5,000,000 | | Small Business Lending Trust, Series 2019-A, Class C, | |
| | 4.31%, 7/15/26 (144A) | $ 3,329,884 |
| 4,750,000(c) | | Sound Point CLO XXI, Ltd., Series 2018-3A, Class C, | |
| | 3.545% (3 Month USD LIBOR + 330 bps), | |
| | 10/26/31 (144A) | 4,281,370 |
| 1,200,000(c) | | Sound Point CLO XXV, Ltd., Series 2019-4A, Class D, | |
| | 4.385% (3 Month USD LIBOR + 411 bps), | |
| | 1/15/33 (144A) | 1,164,534 |
| 7,000,000(c) | | Sound Point CLO XXV, Ltd., Series 2019-4A, Class E, | |
| | 7.895% (3 Month USD LIBOR + 762 bps), | |
| | 1/15/33 (144A) | 6,745,571 |
| 5,000,000 | | SpringCastle America Funding LLC, Series 2020-AA, | |
| | Class A, 1.97%, 9/25/37 (144A) | 5,017,945 |
| 2,918,750 | | STORE Master Funding I LLC, Series 2015-1A, | |
| | Class A1, 3.75%, 4/20/45 (144A) | 2,965,137 |
| 2,200,000(c) | | Symphony CLO XXII, Ltd., Series 2020-22A, Class C, | |
| | 3.464% (3 Month USD LIBOR + 215 bps), | |
| | 4/18/33 (144A) | 2,154,506 |
| 6,600,000(c) | | Symphony CLO XXII, Ltd., Series 2020-22A, Class D, | |
| | 4.464% (3 Month USD LIBOR + 315 bps), | |
| | 4/18/33 (144A) | 6,286,196 |
| 986,000 | | Tidewater Auto Receivables Trust, Series 2018-AA, | |
| | Class E, 5.48%, 10/15/26 (144A) | 1,010,502 |
| 11,300,000(d) | | Towd Point Mortgage Trust, Series 2015-2, Class 1B3, | |
| | 3.628%, 11/25/60 (144A) | 11,301,270 |
| 3,700,000(d) | | Towd Point Mortgage Trust, Series 2015-5, Class M1, | |
| | 3.5%, 5/25/55 (144A) | 3,924,052 |
| 13,841,000(d) | | Towd Point Mortgage Trust, Series 2015-6, Class B1, | |
| | 3.945%, 4/25/55 (144A) | 14,828,939 |
| 5,320,000(d) | | Towd Point Mortgage Trust, Series 2015-6, Class M2, | |
| | 3.75%, 4/25/55 (144A) | 5,766,076 |
| 8,500,000(d) | | Towd Point Mortgage Trust, Series 2016-1, Class B1, | |
| | 4.035%, 2/25/55 (144A) | 9,169,424 |
| 8,105,000(d) | | Towd Point Mortgage Trust, Series 2016-2, Class B2, | |
| | 3.499%, 8/25/55 (144A) | 8,403,818 |
| 5,148,000(d) | | Towd Point Mortgage Trust, Series 2016-3, Class B1, | |
| | 4.111%, 4/25/56 (144A) | 5,502,831 |
| 7,695,000(d) | | Towd Point Mortgage Trust, Series 2016-4, Class B1, | |
| | 3.935%, 7/25/56 (144A) | 8,237,550 |
| 9,202,000(d) | | Towd Point Mortgage Trust, Series 2017-1, Class B2, | |
| | 3.897%, 10/25/56 (144A) | 9,693,901 |
| 9,175,000(d) | | Towd Point Mortgage Trust, Series 2017-2, Class B2, | |
| | 4.18%, 4/25/57 (144A) | 9,904,053 |
| 11,800,000(d) | | Towd Point Mortgage Trust, Series 2017-4, Class B1, | |
| | 3.389%, 6/25/57 (144A) | 12,446,156 |
| 20,235,000(d) | | Towd Point Mortgage Trust, Series 2017-6, Class M1, | |
| | 3.25%, 10/25/57 (144A) | 21,677,626 |
| 8,925,000(d) | | Towd Point Mortgage Trust, Series 2017-6, Class M2, | |
| | 3.25%, 10/25/57 (144A) | 9,397,037 |
The accompanying notes are an integral part of these financial statements.
Pioneer Strategic Income Fund | Annual Report | 9/30/20 27
Schedule of Investments | 9/30/20 (continued)
| | | | |
| Principal | | | |
| Amount | | | |
| USD ($) | | | Value |
| | ASSET BACKED SECURITIES — (continued) | |
| 4,750,000(d) | | Towd Point Mortgage Trust, Series 2018-1, Class B1, | |
| | | 3.89%, 1/25/58 (144A) | $ 4,884,717 |
| 8,000,000(d) | | Towd Point Mortgage Trust, Series 2018-3, Class M1, | |
| | | 3.875%, 5/25/58 (144A) | 8,523,692 |
| 7,500,000(d) | | Towd Point Mortgage Trust, Series 2018-3, Class M2, | |
| | | 3.875%, 5/25/58 (144A) | 7,703,987 |
| 10,000,000(d) | | Towd Point Mortgage Trust, Series 2019-2, Class A2, | |
| | | 3.75%, 12/25/58 (144A) | 10,927,800 |
| 1,500,000 | | Tricon American Homes Trust, Series 2017-SFR2, | |
| | | Class D, 3.672%, 1/17/36 (144A) | 1,548,792 |
| 2,580,000 | | Tricon American Homes Trust, Series 2017-SFR2, | |
| | | Class E, 4.216%, 1/17/36 (144A) | 2,634,341 |
| 2,400,000 | | United Auto Credit Securitization Trust, Series 2018-2, | |
| | | Class F, 6.82%, 6/10/25 (144A) | 2,439,154 |
| 4,250,000 | | United Auto Credit Securitization Trust, Series 2019-1, | |
| | | Class F, 6.05%, 1/12/26 (144A) | 4,322,578 |
| 2,200,000 | | US Auto Funding LLC, Series 2019-1A, Class D, 8.06%, | |
| | | 11/15/25 (144A) | 2,238,686 |
| 4,975,000(c) | | Westcott Park CLO, Ltd., Series 2016-1A, Class ER, | |
| | | 6.672% (3 Month USD LIBOR + 640 bps), | |
| | | 7/20/28 (144A) | 4,622,491 |
| 3,850,086 | | Westgate Resorts LLC, Series 2018-1A, Class C, 4.1%, | |
| | | 12/20/31 (144A) | 3,794,461 |
| 3,847,481 | | Westgate Resorts LLC, Series 2020-1A, Class C, 6.213%, | |
| | | 3/20/34 (144A) | 4,006,625 |
| 3,850,000 | | Westlake Automobile Receivables Trust, Series | |
| | | 2018-3A, Class E, 4.9%, 12/15/23 (144A) | 3,984,010 |
| 4,000,000(c) | | Whitebox CLO II, Ltd., Series 2020-2A, Class E, 8.092% | |
| | | (3 Month USD LIBOR + 785 bps), 10/24/31 (144A) | 3,921,832 |
| 1,022,312 | | WRG Debt Funding II LLC, Series 2017-1, Class A, | |
| | | 4.458%, 3/15/26 (144A) | 1,000,065 |
| 1,270,258 | | WRG Debt Funding II LLC, Series 2017-1, Class B, | |
| | | 5.926%, 3/15/26 (144A) | 1,270,819 |
| | | TOTAL ASSET BACKED SECURITIES | |
| | | (Cost $515,554,816) | $ 514,426,059 |
| | | COLLATERALIZED MORTGAGE OBLIGATIONS — | |
| | | 12.3% of Net Assets | |
| 2,500,000 | | American Homes 4 Rent Trust, Series 2014-SFR2, | |
| | | Class D, 5.149%, 10/17/36 (144A) | $ 2,761,803 |
| 5,000,000 | | American Homes 4 Rent Trust, Series 2014-SFR3, | |
| | | Class C, 4.596%, 12/17/36 (144A) | 5,422,466 |
| 4,100,000 | | American Homes 4 Rent Trust, Series 2014-SFR3, | |
| | | Class D, 5.04%, 12/17/36 (144A) | 4,518,451 |
| 2,950,000 | | American Homes 4 Rent Trust, Series 2015-SFR1, | |
| | | Class C, 4.11%, 4/17/52 (144A) | 3,141,603 |
| 4,629,000(d) | | Angel Oak Mortgage Trust I LLC, Series 2019-1, | |
| | | Class B1, 5.4%, 11/25/48 (144A) | 4,821,361 |
The accompanying notes are an integral part of these financial statements.
28 Pioneer Strategic Income Fund | Annual Report | 9/30/20
| | | | |
| Principal | | | |
| Amount | | | |
| USD ($) | | | Value |
| | | COLLATERALIZED MORTGAGE OBLIGATIONS — | |
| | | (continued) | |
| 4,460,000(d) | | Angel Oak Mortgage Trust I LLC, Series 2019-2, | |
| | | Class B1, 5.016%, 3/25/49 (144A) | $ 4,562,159 |
| 1,054,000(d) | | B2R Mortgage Trust, Series 2015-1, Class D, 4.831%, | |
| | | 5/15/48 (144A) | 1,026,572 |
| 4,400,000(d) | | Bayview Koitere Fund Trust, Series 2017-SPL3, | |
| | | Class B1, 4.25%, 11/28/53 (144A) | 4,706,883 |
| 7,050,000(d) | | Bayview Opportunity Master Fund IVa Trust, Series | |
| | | 2017-RT5, Class B1, 4.0%, 5/28/69 (144A) | 7,633,043 |
| 4,670,000(d) | | Bayview Opportunity Master Fund IVa Trust, Series | |
| | | 2017-SPL5, Class B1, 4.0%, 6/28/57 (144A) | 4,930,346 |
| 2,120,000(c) | | Bellemeade Re, Ltd., Series 2019-1A, Class B1, 4.148% | |
| | | (1 Month USD LIBOR + 400 bps), 3/25/29 (144A) | 1,818,608 |
| 3,550,000(c) | | Bellemeade Re, Ltd., Series 2019-1A, Class M2, 2.848% | |
| | | (1 Month USD LIBOR + 270 bps), 3/25/29 (144A) | 3,302,546 |
| 3,910,000(c) | | Bellemeade Re, Ltd., Series 2019-2A, Class B1, 4.248% | |
| | | (1 Month USD LIBOR + 410 bps), 4/25/29 (144A) | 2,820,076 |
| 5,350,000(c) | | Bellemeade Re, Ltd., Series 2019-2A, Class M2, 3.248% | |
| | | (1 Month USD LIBOR + 310 bps), 4/25/29 (144A) | 5,110,341 |
| 2,994,878(d) | | Cascade Funding Mortgage Trust, Series 2019-RM3, | |
| | | Class C, 4.0%, 6/25/69 (144A) | 2,553,925 |
| 7,479,635(d) | | Chase Home Lending Mortgage Trust, Series 2019-1, | |
| | | Class B1, 3.951%, 3/25/50 (144A) | 7,976,040 |
| 9,590,412(c) | | Chase Mortgage Reference Notes, Series 2020-CL1, | |
| | | Class M2, 2.675% (1 Month USD LIBOR + | |
| | | 250 bps), 10/25/57 (144A) | 9,612,571 |
| 4,000,000(e) | | Colony American Finance, Ltd., Series 2016-1, Class D, | |
| | | 5.972%, 6/15/48 (144A) | 4,100,906 |
| 4,100,000(c) | | Connecticut Avenue Securities Trust, Series 2019-HRP1, | |
| | | Class B1, 9.398% (1 Month USD LIBOR + | |
| | | 925 bps), 11/25/39 (144A) | 3,185,569 |
| 7,460,783(c) | | Connecticut Avenue Securities Trust, Series 2019-R01, | |
| | | Class 2M2, 2.598% (1 Month USD LIBOR + | |
| | | 245 bps), 7/25/31 (144A) | 7,414,065 |
| 6,600,000(c) | | Connecticut Avenue Securities Trust, Series 2019-R02, | |
| | | Class 1B1, 4.298% (1 Month USD LIBOR + | |
| | | 415 bps), 8/25/31 (144A) | 6,302,561 |
| 973,416(c) | | Connecticut Avenue Securities Trust, Series 2019-R02, | |
| | | Class 1M2, 2.448% (1 Month USD LIBOR + | |
| | | 230 bps), 8/25/31 (144A) | 967,930 |
| 4,240,000(c) | | Connecticut Avenue Securities Trust, Series 2019-R03, | |
| | | Class 1B1, 4.248% (1 Month USD LIBOR + | |
| | | 410 bps), 9/25/31 (144A) | 4,070,083 |
| 2,384,783(c) | | Connecticut Avenue Securities Trust, Series 2019-R03, | |
| | | Class 1M2, 2.298% (1 Month USD LIBOR + | |
| | | 215 bps), 9/25/31 (144A) | 2,375,323 |
| 3,580,000(c) | | Connecticut Avenue Securities Trust, Series 2019-R04, | |
| | | Class 2B1, 5.398% (1 Month USD LIBOR + | |
| | | 525 bps), 6/25/39 (144A) | 3,222,678 |
The accompanying notes are an integral part of these financial statements.
Pioneer Strategic Income Fund | Annual Report | 9/30/20 29
Schedule of Investments | 9/30/20 (continued)
| | | | |
| Principal | | | |
| Amount | | | |
| USD ($) | | | Value |
| | | COLLATERALIZED MORTGAGE OBLIGATIONS — | |
| | | (continued) | |
| 5,025,000(c) | | Connecticut Avenue Securities Trust, Series 2019-R05, | |
| | | Class 1B1, 4.248% (1 Month USD LIBOR + | |
| | | 410 bps), 7/25/39 (144A) | $ 4,391,864 |
| 7,180,000(c) | | Connecticut Avenue Securities Trust, Series 2019-R06, | |
| | | Class 2B1, 3.898% (1 Month USD LIBOR + | |
| | | 375 bps), 9/25/39 (144A) | 6,076,466 |
| 7,396,014(c) | | Connecticut Avenue Securities Trust, Series 2019-R06, | |
| | | Class 2M2, 2.248% (1 Month USD LIBOR + | |
| | | 210 bps), 9/25/39 (144A) | 7,335,988 |
| 8,404,431(c) | | Connecticut Avenue Securities Trust, Series 2019-R07, | |
| | | Class 1M2, 2.248% (1 Month USD LIBOR + | |
| | | 210 bps), 10/25/39 (144A) | 8,358,289 |
| 3,920,000(c) | | Connecticut Avenue Securities Trust, Series 2020-SBT1, | |
| | | Class 1M2, 3.798% (1 Month USD LIBOR + | |
| | | 365 bps), 2/25/40 (144A) | 3,645,103 |
| 4,940,000(c) | | Connecticut Avenue Securities Trust, Series 2020-SBT1, | |
| | | Class 2M2, 3.798% (1 Month USD LIBOR + | |
| | | 365 bps), 2/25/40 (144A) | 4,695,231 |
| 876,576(d) | | CSFB Mortgage-Backed Pass-Through Certificates, | |
| | | Series 2003-17, Class B1, 5.5%, 6/25/33 | 410,066 |
| 2,324,435(d) | | CSMC Trust, Series 2013-7, Class B4, 3.518%, | |
| | | 8/25/43 (144A) | 2,339,433 |
| 2,128,644(d) | | CSMC Trust, Series 2013-IVR4, Class B4, 3.467%, | |
| | | 7/25/43 (144A) | 2,104,960 |
| 1,147,301(d) | | CSMC Trust, Series 2013-TH1, Class B4, 3.606%, | |
| | | 2/25/43 (144A) | 1,147,484 |
| 2,066,159(d) | | CSMC Trust, Series 2014-IVR2, Class B4, 3.695%, | |
| | | 4/25/44 (144A) | 2,099,016 |
| 693,146(d) | | CSMC Trust, Series 2015-1, Class B4, 3.93%, | |
| | | 1/25/45 (144A) | 683,852 |
| 1,789,814(d) | | CSMC Trust, Series 2015-3, Class B4, 3.919%, | |
| | | 3/25/45 (144A) | 1,795,632 |
| 8,642,124(d) | | CSMC Trust, Series 2018-J1, Class B3, 3.651%, | |
| | | 2/25/48 (144A) | 8,541,030 |
| 2,444,977(d) | | CSMLT Trust, Series 2015-2, Class B4, 3.882%, | |
| | | 8/25/45 (144A) | 2,349,217 |
| 11,200,000(c) | | Eagle Re, Ltd., Series 2019-1, Class B1, 4.648% | |
| | | (1 Month USD LIBOR + 450 bps), 4/25/29 (144A) | 9,612,244 |
| 2,023,075(d) | | EverBank Mortgage Loan Trust, Series 2013-1, | |
| | | Class B4, 3.5%, 3/25/43 (144A) | 2,093,340 |
| 1,548,974(c) | | Fannie Mae Connecticut Avenue Securities, Series | |
| | | 2018-C06, Class 1M2, 2.148% (1 Month USD LIBOR + | |
| | | 200 bps), 3/25/31 | 1,521,525 |
| 16,013,571(c)(f) | | Federal Home Loan Mortgage Corp. REMICs, Series | |
| | 4087, Class SB, 5.878% (1 Month USD LIBOR + | |
| | | 603 bps), 7/15/42 | 3,300,642 |
The accompanying notes are an integral part of these financial statements.
30 Pioneer Strategic Income Fund | Annual Report | 9/30/20
| | | | |
| Principal | | | |
| Amount | | | |
| USD ($) | | | Value |
| | | COLLATERALIZED MORTGAGE OBLIGATIONS — | |
| | | (continued) | |
| 9,062,185(c)(f) | | Federal Home Loan Mortgage Corp. REMICs, Series | |
| | 4091, Class SH, 6.398% (1 Month USD LIBOR + | |
| | | 655 bps), 8/15/42 | $ 1,991,311 |
| 623,764 | | Federal National Mortgage Association REMICs, Series | |
| | | 2009-36, Class HX, 4.5%, 6/25/29 | 658,426 |
| 7,220,512(c)(f) | | Federal National Mortgage Association REMICs, Series | |
| | | 2012-14, Class SP, 6.402% (1 Month USD LIBOR + | |
| | | 655 bps), 8/25/41 | 974,542 |
| 6,772,840(c)(f) | | Federal National Mortgage Association REMICs, Series | |
| | | 2018-43, Class SM, 6.052% (1 Month USD LIBOR + | |
| | | 620 bps), 6/25/48 | 949,640 |
| 8,900,958(c)(f) | | Federal National Mortgage Association REMICs, Series | |
| | 2019-33, Class S, 5.902% (1 Month USD LIBOR + | |
| | | 605 bps), 7/25/49 | 1,445,713 |
| 6,614,868(c)(f) | | Federal National Mortgage Association REMICs, Series | |
| | | 2019-41, Class PS, 5.902% (1 Month USD LIBOR + | |
| | | 605 bps), 8/25/49 | 1,050,366 |
| 6,209,012(c)(f) | | Federal National Mortgage Association REMICs, Series | |
| | | 2019-41, Class SM, 5.902% (1 Month USD LIBOR + | |
| | | 605 bps), 8/25/49 | 789,569 |
| 8,953,686 | | Finance of America Structured Securities Trust, Series | |
| | | 2018-A, Class JR2, 1.646%, 12/26/68 (144A) | 9,619,880 |
| 10,572,920 | | Finance of America Structured Securities Trust, Series | |
| | | 2019-JR2, Class JR2, 2.0%, 6/25/69 (144A) | 11,329,823 |
| 11,072,956 | | Finance of America Structured Securities Trust, Series | |
| | | 2019-JR4, Class JR2, 2.0%, 11/25/69 (144A) | 11,482,822 |
| 7,472,302 | | Finance of America Structured Securities Trust, Series | |
| | | 2020-JR2, 0.0%, 5/25/50 (144A) | 7,608,120 |
| 1,617,302(d) | | FirstKey Mortgage Trust, Series 2014-1, Class B4, | |
| | | 4.003%, 11/25/44 (144A) | 1,654,970 |
| 6,800,000(c) | | Freddie Mac Stacr Trust, Series 2018-HQA2, Class M2, | |
| | | 2.448% (1 Month USD LIBOR + 230 bps), | |
| | | 10/25/48 (144A) | 6,655,408 |
| 8,080,000(c) | | Freddie Mac Stacr Trust, Series 2019-DNA2, Class B2, | |
| | 10.648% (1 Month USD LIBOR + 1,050 bps), | |
| | | 3/25/49 (144A) | 7,434,705 |
| 3,000,000(c) | | Freddie Mac Stacr Trust, Series 2019-HQA1, Class B1, | |
| | | 4.548% (1 Month USD LIBOR + 440 bps), | |
| | | 2/25/49 (144A) | 2,871,680 |
| 6,700,000(c) | | Freddie Mac Stacr Trust, Series 2019-HQA1, Class B2, | |
| | 12.398% (1 Month USD LIBOR + 1,225 bps), | |
| | | 2/25/49 (144A) | 6,465,786 |
| 5,530,748(c) | | Freddie Mac Stacr Trust, Series 2019-HQA1, Class M2, | |
| | | 2.498% (1 Month USD LIBOR + 235 bps), | |
| | | 2/25/49 (144A) | 5,477,823 |
| 3,740,000(c) | | Freddie Mac Stacr Trust, Series 2019-HQA2, Class B1, | |
| | | 4.248% (1 Month USD LIBOR + 410 bps), | |
| | | 4/25/49 (144A) | 3,562,020 |
The accompanying notes are an integral part of these financial statements.
Pioneer Strategic Income Fund | Annual Report | 9/30/20 31
Schedule of Investments | 9/30/20 (continued)
| | | | |
| Principal | | | |
| Amount | | | |
| USD ($) | | | Value |
| | | COLLATERALIZED MORTGAGE OBLIGATIONS — | |
| | | (continued) | |
| 2,880,000(c) | | Freddie Mac Stacr Trust, Series 2019-HQA2, Class B2, | |
| | | 11.398% (1 Month USD LIBOR + | |
| | | 1,125 bps), 4/25/49 (144A) | $ 2,700,192 |
| 1,561,603(c) | | Freddie Mac Stacr Trust, Series 2019-HQA2, Class M2, | |
| | | 2.198% (1 Month USD LIBOR + 205 bps), | |
| | | 4/25/49 (144A) | 1,536,653 |
| 1,500,000(c) | | Freddie Mac Stacr Trust, Series 2019-HQA3, Class B1, | |
| | | 3.148% (1 Month USD LIBOR + 300 bps), | |
| | | 9/25/49 (144A) | 1,361,528 |
| 5,510,000(c) | | Freddie Mac Stacr Trust, Series 2019-HRP1, Class B1, | |
| | | 4.198% (1 Month USD LIBOR + 405 bps), | |
| | | 2/25/49 (144A) | 4,729,316 |
| 3,900,000(c) | | Freddie Mac Stacr Remic Trust, Series 2020-DNA2, | |
| | | Class B1, 2.648% (1 Month USD LIBOR + 250 bps), | |
| | | 2/25/50 (144A) | 3,372,845 |
| 6,630,000(c) | | Freddie Mac Stacr Remic Trust, Series 2020-DNA4, | |
| | | Class B1, 6.148% (1 Month USD LIBOR + 600 bps), | |
| | | 8/25/50 (144A) | 6,849,584 |
| 4,120,000(c) | | Freddie Mac Stacr Remic Trust, Series 2020-DNA4, | |
| | | Class B2, 10.148% (1 Month USD LIBOR + 1,000 bps), | |
| | | 8/25/50 (144A) | 4,243,588 |
| 6,060,000(c) | | Freddie Mac Stacr Remic Trust, Series 2020-HQA2, | |
| | | Class M2, 3.248% (1 Month USD LIBOR + 310 bps), | |
| | | 3/25/50 (144A) | 5,968,886 |
| 1,880,000(c) | | Freddie Mac Stacr Remic Trust, Series 2020-HQA4, | |
| | | Class B1, 5.402% (1 Month USD LIBOR + 525 bps), | |
| | | 9/25/50 (144A) | 1,893,685 |
| 2,650,000(c) | | Freddie Mac Stacr Remic Trust, Series 2020-HQA4, | |
| | | Class B2, 9.552% (1 Month USD LIBOR + 940 bps), | |
| | | 9/25/50 (144A) | 2,651,843 |
| 171,915 | | Global Mortgage Securitization, Ltd., Series 2004-A, | |
| | | Class B2, 5.25%, 11/25/32 (144A) | 3,429 |
| 553,404 | | Global Mortgage Securitization, Ltd., Series 2005-A, | |
| | | Class B2, 5.25%, 4/25/32 (144A) | 440,379 |
| 2,409,352 | | Government National Mortgage Association, Series | |
| | | 2009-83, Class EB, 4.5%, 9/20/39 | 2,722,267 |
| 1,162,034 | | Government National Mortgage Association, Series | |
| | | 2012-130, Class PA, 3.0%, 4/20/41 | 1,189,154 |
| 17,837,994(c)(f) | | Government National Mortgage Association, Series | |
| | | 2019-90, Class SA, 3.144% (1 Month USD LIBOR + | |
| | | 330 bps), 7/20/49 | 1,654,940 |
| 4,469,368(c)(f) | | Government National Mortgage Association, Series | |
| | | 2019-103, Class SB, 5.894% (1 Month USD LIBOR + | |
| | | 605 bps), 8/20/49 | 869,586 |
| 42,090,608(f) | | Government National Mortgage Association, Series | |
| | | 2019-110, Class PI, 3.5%, 9/20/49 | 3,075,658 |
| 39,104,261(c)(f) | | Government National Mortgage Association, Series | |
| | | 2019-117, Class SB, 3.264% (1 Month USD LIBOR + | |
| | | 342 bps), 9/20/49 | 3,228,503 |
The accompanying notes are an integral part of these financial statements.
32 Pioneer Strategic Income Fund | Annual Report | 9/30/20
| | | | |
| Principal | | | |
| Amount | | | |
| USD ($) | | | Value |
| | | COLLATERALIZED MORTGAGE OBLIGATIONS — | |
| | | (continued) | |
| 39,206,223(c)(f) | | Government National Mortgage Association, Series | |
| | | 2019-121, Class SA, 3.194% (1 Month USD LIBOR + | |
| | | 335 bps), 10/20/49 | $ 3,593,493 |
| 58,923,615(f) | | Government National Mortgage Association, Series | |
| | | 2019-128, Class IB, 3.5%, 10/20/49 | 6,111,210 |
| 104,384,959(f) | | Government National Mortgage Association, Series | |
| | | 2019-128, Class ID, 3.5%, 10/20/49 | 7,818,047 |
| 27,080,077(f) | | Government National Mortgage Association, Series | |
| | | 2019-159, Class CI, 3.5%, 12/20/49 | 2,789,892 |
| 9,162,874(f) | | Government National Mortgage Association, Series | |
| | | 2020-7, Class CI, 3.5%, 1/20/50 | 1,249,965 |
| 29,164,914(c)(f) | | Government National Mortgage Association, Series | |
| | | 2020-9, Class SA, 3.194% (1 Month USD LIBOR + | |
| | | 335 bps), 1/20/50 | 2,648,020 |
| 3,775,136(f) | | Government National Mortgage Association, Series | |
| | | 2020-15, Class IM, 3.5%, 2/20/50 | 525,813 |
| 4,427,623(d) | | GS Mortgage-Backed Securities Trust, Series 2019-PJ1, | |
| | | Class B2, 4.315%, 8/25/49 (144A) | 4,765,703 |
| 2,532,540(d) | | GS Mortgage-Backed Securities Trust, Series 2019-PJ3, | |
| | | Class B4, 4.096%, 3/25/50 (144A) | 2,407,595 |
| 2,497,318(d) | | GS Mortgage-Backed Securities Trust, Series 2020-PJ1, | |
| | | Class B1, 3.667%, 5/25/50 (144A) | 2,668,298 |
| 2,955,406(d) | | GS Mortgage-Backed Securities Trust, Series 2020-PJ1, | |
| | | Class B2, 3.667%, 5/25/50 (144A) | 3,057,647 |
| 6,000,000(d) | | GS Mortgage-Backed Securities Trust, Series 2020-PJ4, | |
| | | Class B2, 3.38%, 1/25/51 (144A) | 6,134,297 |
| 1,700,000(c) | | Home Partners of America Trust, Series 2017-1, | |
| | | Class E, 2.801% (1 Month USD LIBOR + 265 bps), | |
| | | 7/17/34 (144A) | 1,712,241 |
| 1,041,747(c) | | Home Partners of America Trust, Series 2018-1, | |
| | Class A, 1.051% (1 Month USD LIBOR + 90 bps), | |
| | | 7/17/37 (144A) | 1,039,794 |
| 2,851,138(d) | | JP Morgan Mortgage Trust, Series 2014-1, Class B4, | |
| | | 3.723%, 1/25/44 (144A) | 2,912,510 |
| 3,619,561(d) | | JP Morgan Mortgage Trust, Series 2019-2, Class B4, | |
| | | 4.64%, 8/25/49 (144A) | 3,596,712 |
| 5,840,238(d) | | JP Morgan Mortgage Trust, Series 2019-8, Class B2A, | |
| | | 3.19%, 3/25/50 (144A) | 6,051,438 |
| 7,676,036(d) | | JP Morgan Mortgage Trust, Series 2019-LTV3, Class B2, | |
| | | 4.551%, 3/25/50 (144A) | 8,142,998 |
| 3,959,249(d) | | JP Morgan Mortgage Trust, Series 2020-3, Class B1A, | |
| | | 3.042%, 8/25/50 (144A) | 4,004,935 |
| 4,250,000(d) | | JP Morgan Mortgage Trust, Series 2020-7, Class A15, | |
| | | 3.0%, 1/25/51 (144A) | 4,350,439 |
| 3,525,294(d) | | JP Morgan Mortgage Trust, Series 2020-INV1, | |
| | | Class A15, 3.5%, 8/25/50 (144A) | 3,603,372 |
| 8,741,695(d) | | JP Morgan Mortgage Trust, Series 2020-INV2, | |
| | | Class B2A, 3.288%, 10/25/50 (144A) | 8,807,842 |
The accompanying notes are an integral part of these financial statements.
Pioneer Strategic Income Fund | Annual Report | 9/30/20 33
Schedule of Investments | 9/30/20 (continued)
| | | | |
| Principal | | | |
| Amount | | | |
| USD ($) | | | Value |
| | | COLLATERALIZED MORTGAGE OBLIGATIONS — | |
| | | (continued) | |
| 4,000,000(d) | | JP Morgan Mortgage Trust, Series 2020-LTV2, | |
| | | Class A3, 3.0%, 11/25/50 (144A) | $ 4,117,031 |
| 6,500,000(d) | | JP Morgan Mortgage Trust, Series 2020-LTV2, | |
| | | Class A15, 3.0%, 11/25/50 (144A) | 6,649,551 |
| 5,273,191(d) | | JP Morgan Wealth Management, Series 2020-ATR1, | |
| | | Class A3, 3.0%, 2/25/50 (144A) | 5,389,776 |
| 2,312,803(d) | | JP Morgan Wealth Management, Series 2020-ATR1, | |
| | | Class A15, 3.0%, 2/25/50 (144A) | 2,355,264 |
| 1,413,030 | | La Hipotecaria El Salvadorian Mortgage Trust, Series | |
| | | 2016-1A, Class A, 3.358%, 1/15/46 (144A) | 1,545,502 |
| 2,483,068 | | La Hipotecaria Mortgage Trust, Series 2019-2A, | |
| | | Class BBB, 4.75%, 9/29/46 (144A) | 2,546,697 |
| 521,880(c) | | La Hipotecaria Panamanian Mortgage Trust, Series | |
| | | 2010-1GA, Class A, 3.175% (Panamanian Mortgage | |
| | | Reference Rate - 300 bps), 9/8/39 (144A) | 537,863 |
| 1,900,000(d) | | Mill City Mortgage Loan Trust, Series 2019-GS1, | |
| | | Class M1, 3.0%, 7/25/59 (144A) | 2,019,991 |
| 6,145,000(d) | | Mill City Mortgage Loan Trust, Series 2019-GS1, | |
| | | Class M3, 3.25%, 7/25/59 (144A) | 6,194,759 |
| 4,967,044(c) | | New Residential Mortgage Loan Trust, Series 2018-4A, | |
| | | Class B1, 1.198% (1 Month USD LIBOR + | |
| | | 105 bps), 1/25/48 (144A) | 4,706,146 |
| 8,000,000(d) | | New Residential Mortgage Loan Trust, Series | |
| | | 2018-RPL1, Class M2, 3.5%, 12/25/57 (144A) | 8,209,271 |
| 8,400,000(d) | | New Residential Mortgage Loan Trust, Series | |
| | | 2019-RPL2, Class M2, 3.75%, 2/25/59 (144A) | 8,945,761 |
| 11,500,000(d) | | New Residential Mortgage Loan Trust, Series | |
| | | 2020-RPL1, Class B1, 3.937%, 11/25/59 (144A) | 10,983,992 |
| 6,500,000(d) | | New Residential Mortgage Loan Trust, Series | |
| | | 2020-RPL1, Class M2, 3.5%, 11/25/59 (144A) | 6,374,742 |
| 1,000,000(c) | | Oaktown Re II, Ltd., Series 2018-1A, Class B1, 4.198% | |
| | | (1 Month USD LIBOR + 405 bps), 7/25/28 (144A) | 896,171 |
| 4,070,000(c) | | Oaktown Re II, Ltd., Series 2018-1A, Class M2, 2.998% | |
| | | (1 Month USD LIBOR + 285 bps), 7/25/28 (144A) | 3,873,124 |
| 700,000 | | Progress Residential Trust, Series 2017-SFR1, Class C, | |
| | | 3.316%, 8/17/34 (144A) | 710,649 |
| 2,600,000 | | Progress Residential Trust, Series 2017-SFR1, Class E, | |
| | | 4.261%, 8/17/34 (144A) | 2,652,541 |
| 4,147,825(d) | | Provident Funding Mortgage Trust, Series 2019-1, | |
| | | Class B2, 3.326%, 12/25/49 (144A) | 4,308,580 |
| 2,156,476(d) | | Provident Funding Mortgage Trust, Series 2019-1, | |
| | | Class B3, 3.321%, 12/25/49 (144A) | 2,087,363 |
| 3,209,645(d) | | Provident Funding Mortgage Trust, Series 2020-1, | |
| | | Class B1, 3.332%, 2/25/50 (144A) | 3,385,746 |
| 3,470,000(c) | | Radnor Re, Ltd., Series 2019-1, Class B1, 4.598% (1 | |
| | | Month USD LIBOR + 445 bps), 2/25/29 (144A) | 2,963,230 |
The accompanying notes are an integral part of these financial statements.
34 Pioneer Strategic Income Fund | Annual Report | 9/30/20
| | | | |
| Principal | | | |
| Amount | | | |
| USD ($) | | | Value |
| | | COLLATERALIZED MORTGAGE OBLIGATIONS — | |
| | | (continued) | |
| 870,000(c) | | Radnor Re, Ltd., Series 2020-2, Class B1, 7.75% | |
| | | (1 Month USD LIBOR + 760 bps), 10/25/30 (144A) | $ 870,000 |
| 2,540,000(c) | | Radnor Re, Ltd., Series 2020-2, Class M1C, 4.75% | |
| | | (1 Month USD LIBOR + 460 bps), 10/25/30 (144A) | 2,540,000 |
| 2,939 | | RALI Trust, Series 2003-QS14, Class A1, 5.0%, 7/25/18 | 2,645 |
| 1,185,000(d) | | RMF Buyout Issuance Trust, Series 2020-1, Class M5, | |
| | | 6.0%, 2/25/30 (144A) | 1,156,086 |
| 3,574,854(d) | | Sequoia Mortgage Trust, Series 2013-2, Class B4, | |
| | | 3.637%, 2/25/43 | 3,580,693 |
| 1,168,641(d) | | Sequoia Mortgage Trust, Series 2018-CH3, Class A1, | |
| | | 4.5%, 8/25/48 (144A) | 1,225,981 |
| 3,224,972(d) | | Sequoia Mortgage Trust, Series 2018-CH3, Class B2B, | |
| | | 4.826%, 8/25/48 (144A) | 3,512,707 |
| 6,748,608(d) | | Sequoia Mortgage Trust, Series 2018-CH4, Class B1B, | |
| | | 4.974%, 10/25/48 (144A) | 7,408,862 |
| 4,541,885(c) | | STACR Trust, Series 2018-DNA3, Class B1, 4.048% | |
| | | (1 Month USD LIBOR + 390 bps), 9/25/48 (144A) | 4,207,634 |
| 3,550,000(c) | | STACR Trust, Series 2018-HRP2, Class B1, 4.348% | |
| | | (1 Month USD LIBOR + 420 bps), 2/25/47 (144A) | 3,139,014 |
| 15,100,000(d) | | Towd Point Mortgage Trust, Series 2019-4, Class M1, | |
| | | 3.5%, 10/25/59 (144A) | 16,390,605 |
| 1,200,000(d) | | Verus Securitization Trust, Series 2020-2, Class B1, | |
| | | 5.36%, 5/25/60 (144A) | 1,206,129 |
| 250,000(d) | | Verus Securitization Trust, Series 2020-INV1, Class B1, | |
| | | 5.75%, 3/25/60 (144A) | 257,355 |
| 340,000(d) | | Verus Securitization Trust, Series 2020-INV1, Class B2, | |
| | | 6.0%, 3/25/60 (144A) | 336,161 |
| 800,000(d) | | Visio Trust, Series 2019-2, Class B1, 3.91%, | |
| | | 11/25/54 (144A) | 765,754 |
| 1,485,999(d) | | Wells Fargo Mortgage Backed Securities, Series | |
| | | 2020-4, 3.288%, 7/25/50 (144A) | 1,357,963 |
| 1,585,313(d) | | WinWater Mortgage Loan Trust, Series 2015-2, | |
| | | Class B4, 3.904%, 2/20/45 (144A) | 1,639,900 |
| | | TOTAL COLLATERALIZED MORTGAGE OBLIGATIONS | |
| | | (Cost $565,243,208) | $ 540,417,431 |
| | | COMMERCIAL MORTGAGE-BACKED SECURITIES — | |
| | | 5.8% of Net Assets | |
| 8,285,386(e)(f) | | Bayview Commercial Asset Trust, Series 2007-2A, | |
| | | Class IO, 0.0%, 7/25/37 (144A) | $ 1 |
| 1,597,000 | | BBCMS Mortgage Trust, Series 2020-C6, Class D, 2.4%, | |
| | | 2/15/53 (144A) | 1,315,441 |
| 4,500,000 | | Benchmark Mortgage Trust, Series 2018-B5, Class A3, | |
| | | 3.944%, 7/15/51 | 5,278,893 |
| 2,025,000(d) | | Benchmark Mortgage Trust, Series 2020-IG3, Class B, | |
| | | 3.387%, 9/15/48 (144A) | 2,166,647 |
The accompanying notes are an integral part of these financial statements.
Pioneer Strategic Income Fund | Annual Report | 9/30/20 35
Schedule of Investments | 9/30/20 (continued)
| | | | |
| Principal | | | |
| Amount | | | |
| USD ($) | | | Value |
| | | COMMERCIAL MORTGAGE-BACKED SECURITIES — | |
| | | (continued) | |
| 5,000,000(c) | | BTH-13 Mortgage Backed Securities Trust, Series | |
| | | 2018-13, Class A, 2.655% (1 Month USD LIBOR + | |
| | | 250 bps), 8/18/21 (144A) | $ 4,964,303 |
| 3,810,000 | | CD Mortgage Trust, Series 2018-CD7, Class A3, | |
| | | 4.013%, 8/15/51 | 4,468,889 |
| 4,250,000 | | CFCRE Commercial Mortgage Trust, Series 2016-C3, | |
| | | Class A2, 3.597%, 1/10/48 | 4,701,914 |
| 2,500,000 | | CFCRE Commercial Mortgage Trust, Series 2018-TAN, | |
| | | Class D, 6.099%, 2/15/33 (144A) | 2,386,776 |
| 719,000(c) | | CGDB Commercial Mortgage Trust, Series 2019-MOB, | |
| | | Class E, 2.152% (1 Month USD LIBOR + 200 bps), | |
| | | 11/15/36 (144A) | 706,908 |
| 1,500,000(c) | | CGDB Commercial Mortgage Trust, Series 2019-MOB, | |
| | | Class F, 2.702% (1 Month USD LIBOR + 255 bps), | |
| | | 11/15/36 (144A) | 1,466,365 |
| 9,608,538(c) | | CHC Commercial Mortgage Trust, Series 2019-CHC, | |
| | | Class E, 2.502% (1 Month USD LIBOR + 235 bps), | |
| | | 6/15/34 (144A) | 8,200,307 |
| 3,500,000 | | Citigroup Commercial Mortgage Trust, Series 2018-B2, | |
| | | Class A3, 3.744%, 3/10/51 | 4,011,389 |
| 2,470,000(c) | | CLNY Trust, Series 2019-IKPR, Class E, 2.873% (1 Month | |
| | | USD LIBOR + 272 bps), 11/15/38 (144A) | 2,086,369 |
| 3,421,622 | | COMM Mortgage Trust, Series 2012-CR4, Class AM, | |
| | | 3.251%, 10/15/45 | 3,439,416 |
| 2,531,000(d) | | COMM Mortgage Trust, Series 2013-CR11, Class C, | |
| | | 5.285%, 8/10/50 (144A) | 2,500,361 |
| 2,484,000(d) | | COMM Mortgage Trust, Series 2015-CR24, Class D, | |
| | | 3.463%, 8/10/48 | 2,077,227 |
| 5,227,225(d) | | COMM Mortgage Trust, Series 2015-DC1, Class B, | |
| | | 4.035%, 2/10/48 | 5,428,155 |
| 2,342,863 | | COMM Mortgage Trust, Series 2016-CR28, Class AHR, | |
| | | 3.651%, 2/10/49 | 2,505,947 |
| 2,411,000 | | COMM Mortgage Trust, Series 2019-GC44, Class D, 2.5%, | |
| | | 8/15/57 (144A) | 1,937,624 |
| 7,650,000(d) | | COMM Mortgage Trust, Series 2020-CBM, Class E, | |
| | | 3.754%, 2/10/37 (144A) | 6,503,860 |
| 4,412,000(d) | | COMM Mortgage Trust, Series 2020-CBM, Class F, | |
| | | 3.754%, 2/10/37 (144A) | 3,531,975 |
| 7,000,000(c) | | Credit Suisse Mortgage Capital Certificates, Series | |
| | | 2019-ICE4, Class E, 2.302% (1 Month USD LIBOR + | |
| | | 215 bps), 5/15/36 (144A) | 6,903,391 |
| 4,083,017(d) | | CSAIL Commercial Mortgage Trust, Series 2015-C1, | |
| | | Class C, 4.411%, 4/15/50 | 3,745,728 |
| 5,150,000(d) | | CSAIL Commercial Mortgage Trust, Series 2015-C4, | |
| | | Class D, 3.709%, 11/15/48 | 4,090,146 |
| 1,500,000(d) | | CSAIL Commercial Mortgage Trust, Series 2016-C6, | |
| | | Class D, 5.088%, 1/15/49 (144A) | 1,341,883 |
The accompanying notes are an integral part of these financial statements.
36 Pioneer Strategic Income Fund | Annual Report | 9/30/20
| | | | |
| Principal | | | |
| Amount | | | |
| USD ($) | | | Value |
| | | COMMERCIAL MORTGAGE-BACKED SECURITIES — | |
| | | (continued) | |
| 4,106,000 | | DBGS Mortgage Trust, Series 2018-C1, Class 7EB, | |
| | | 5.237%, 9/15/31 (144A) | $ 4,158,156 |
| 4,536,000(d) | | FREMF Mortgage Trust, Series 2015-K45, Class C, | |
| | | 3.713%, 4/25/48 (144A) | 4,741,227 |
| 2,000,000(d) | | FREMF Mortgage Trust, Series 2016-K52, Class B, | |
| | | 4.059%, 1/25/49 (144A) | 2,209,927 |
| 2,340,000(d) | | FREMF Mortgage Trust, Series 2017-K66, Class B, | |
| | | 4.173%, 7/25/27 (144A) | 2,639,703 |
| 4,500,000(d) | | FREMF Mortgage Trust, Series 2017-KW02, Class B, | |
| | | 3.922%, 12/25/26 (144A) | 4,541,081 |
| 2,800,000(d) | | FREMF Mortgage Trust, Series 2017-KW03, Class B, | |
| | | 4.198%, 7/25/27 (144A) | 2,861,977 |
| 2,300,000(d) | | FREMF Mortgage Trust, Series 2018-K154, Class B, | |
| | | 4.159%, 11/25/32 (144A) | 2,135,852 |
| 6,364,000(d) | | FREMF Mortgage Trust, Series 2018-KHG1, Class B, | |
| | | 3.939%, 12/25/27 (144A) | 6,542,643 |
| 3,100,000(d) | | FREMF Mortgage Trust, Series 2018-KW06, Class B, | |
| | | 4.368%, 6/25/28 (144A) | 3,244,753 |
| 975,000(d) | | FREMF Mortgage Trust, Series 2018-KW07, Class B, | |
| | | 4.221%, 10/25/31 (144A) | 973,235 |
| 1,550,000(d) | | FREMF Mortgage Trust, Series 2019-K88, Class C, | |
| | | 4.525%, 2/25/52 (144A) | 1,687,581 |
| 9,708,228(d) | | FREMF Mortgage Trust, Series 2019-KJ24, Class B, | |
| | | 7.6%, 10/25/27 (144A) | 8,139,285 |
| 8,500,000(c) | | FREMF Mortgage Trust, Series 2019-KS12, Class C, | |
| | | 7.045% (1 Month USD LIBOR + 690 bps), 8/25/29 | 6,644,523 |
| 3,900,000(d) | | FREMF Mortgage Trust, Series 2020-K106, Class B, | |
| | | 3.707%, 3/25/53 (144A) | 4,260,732 |
| 6,247,882(c) | | FREMF Mortgage Trust, Series 2020-KF74, Class C, | |
| | | 6.387% (1 Month USD LIBOR + 623 bps), | |
| | | 1/25/27 (144A) | 6,011,028 |
| 6,500,000(c) | | FREMF Mortgage Trust, Series 2020-KF83, Class | |
| | C, 9.157% (1 Month USD LIBOR + 900 bps), | |
| | | 7/25/30 (144A) | 6,287,530 |
| 3,250,000(d) | | FREMF Trust, Series 2018-KW04, Class B, 4.044%, | |
| | | 9/25/28 (144A) | 3,285,094 |
| 1,910,483(c) | | FRESB Mortgage Trust, Series 2017-SB43, Class A5H, | |
| | | 2.79% (1 Month USD LIBOR + 0 bps), 10/25/37 | 1,958,092 |
| 6,000,000(c) | | GS Mortgage Securities Corp. Trust, Series 2020-DUNE, | |
| | | Class E, 2.652% (1 Month USD LIBOR + | |
| | | 250 bps), 12/15/36 (144A) | 5,159,814 |
| 5,200,000(c) | | GS Mortgage Securities Corp. Trust, Series 2020-DUNE, | |
| | | Class G, 4.152% (1 Month USD LIBOR + | |
| | | 400 bps), 12/15/36 (144A) | 4,225,374 |
| 1,800,000(d) | | GS Mortgage Securities Trust, Series 2016-GS4, | |
| | | Class D, 3.233%, 11/10/49 (144A) | 1,245,410 |
| 3,750,000(d) | | JP Morgan Chase Commercial Mortgage Securities | |
| | | Trust, Series 2015-JP1, Class C, 4.87%, 1/15/49 | 3,773,889 |
The accompanying notes are an integral part of these financial statements.
Pioneer Strategic Income Fund | Annual Report | 9/30/20 37
Schedule of Investments | 9/30/20 (continued)
| | | | |
| Principal | | | |
| Amount | | | |
| USD ($) | | | Value |
| | | COMMERCIAL MORTGAGE-BACKED SECURITIES — | |
| | | (continued) | |
| 4,750,000 | | JP Morgan Chase Commercial Mortgage Securities | |
| | Trust, Series 2018-WPT, Class BFX, 4.549%, | |
| | | 7/5/33 (144A) | $ 4,946,497 |
| 3,750,000(c) | | JP Morgan Chase Commercial Mortgage Securities | |
| | | Trust, Series 2019-BKWD, Class E, 2.752% (1 Month | |
| | | USD LIBOR + 260 bps), 9/15/29 (144A) | 3,321,386 |
| 2,590,000(c) | | JP Morgan Chase Commercial Mortgage Securities | |
| | | Trust, Series 2019-MFP, Class D, 1.812% (1 Month USD | |
| | | LIBOR + 166 bps), 7/15/36 (144A) | 2,456,944 |
| 1,500,000(c) | | JP Morgan Chase Commercial Mortgage Securities | |
| | | Trust, Series 2019-MFP, Class E, 2.312% (1 Month USD | |
| | | LIBOR + 216 bps), 7/15/36 (144A) | 1,407,892 |
| 11,650,000(d) | | JP Morgan Chase Commercial Mortgage Securities | |
| | Trust, Series 2020-LOOP, Class F, 3.861%, | |
| | | 12/5/38 (144A) | 8,954,372 |
| 4,250,000 | | JPMDB Commercial Mortgage Securities Trust, Series | |
| | | 2018-C8, Class AS, 4.421%, 6/15/51 | 4,981,540 |
| 5,600,000 | | Key Commercial Mortgage Securities Trust, Series | |
| | | 2019-S2, Class A3, 3.469%, 6/15/52 (144A) | 6,076,058 |
| 3,100,000(c) | | KNDL Mortgage Trust, Series 2019-KNSQ, Class F, | |
| | | 2.152% (1 Month USD LIBOR + 200 bps), | |
| | | 5/15/36 (144A) | 2,918,952 |
| 6,700,000(d) | | Morgan Stanley Bank of America Merrill Lynch Trust, | |
| | | Series 2015-C20, Class C, 4.61%, 2/15/48 | 6,772,694 |
| 1,625,000 | | Morgan Stanley Bank of America Merrill Lynch Trust, | |
| | | Series 2017-C33, Class D, 3.356%, 5/15/50 (144A) | 1,279,449 |
| 3,350,000 | | Morgan Stanley Capital I Trust, Series 2014-150E, | |
| | | Class AS, 4.012%, 9/9/32 (144A) | 3,554,069 |
| 2,140,000 | | Morgan Stanley Capital I Trust, Series 2016-UBS9, | |
| | | Class D, 3.0%, 3/15/49 (144A) | 1,652,646 |
| 2,000,000(d) | | Morgan Stanley Capital I Trust, Series 2018-MP, Class A, | |
| | | 4.418%, 7/11/40 (144A) | 2,153,697 |
| 8,400,000(c) | | Multifamily Connecticut Avenue Securities Trust, | |
| | | Series 2019-01, Class M10, 3.398% (1 Month USD | |
| | | LIBOR + 325 bps), 10/15/49 (144A) | 7,746,678 |
| 1,030,000(d) | | Natixis Commercial Mortgage Securities Trust, Series | |
| | | 2019-FAME, Class D, 4.544%, 8/15/36 (144A) | 893,527 |
| 6,500,000 | | Palisades Center Trust, Series 2016-PLSD, Class A, | |
| | | 2.713%, 4/13/33 (144A) | 5,135,000 |
| 4,450,000(c) | | Ready Capital Mortgage Financing LLC, Series | |
| | | 2019-FL3, Class D, 3.048% (1 Month USD LIBOR + | |
| | | 290 bps), 3/25/34 (144A) | 3,669,995 |
| 2,659,000(d) | | Ready Capital Mortgage Trust, Series 2019-5, Class C, | |
| | | 5.054%, 2/25/52 (144A) | 2,507,253 |
| 5,400,000(d) | | Ready Capital Mortgage Trust, Series 2019-5, Class E, | |
| | | 5.458%, 2/25/52 (144A) | 3,929,969 |
| 2,403,000(d) | | ReadyCap Commercial Mortgage Trust, Series 2019-6, | |
| | | Class C, 4.127%, 10/25/52 (144A) | 2,492,575 |
The accompanying notes are an integral part of these financial statements.
38 Pioneer Strategic Income Fund | Annual Report | 9/30/20
| | | | |
| Principal | | | |
| Amount | | | |
| USD ($) | | | Value |
| | | COMMERCIAL MORTGAGE-BACKED SECURITIES — | |
| | | (continued) | |
| 2,154,483(d) | | Sutherland Commercial Mortgage Loans, Series | |
| | | 2018-SBC7, Class A, 4.72%, 5/25/39 (144A) | $ 2,158,266 |
| 67,584,000(d)(f) | | UBS Commercial Mortgage Trust, Series 2018-C9, | |
| | | Class XB, 0.442%, 3/15/51 | 1,749,405 |
| 4,000,000(c) | | XCALI Mortgage Trust, Series 2020-4, Class A, 4.25% | |
| | | (1 Month USD LIBOR + 325 bps), 9/15/22 (144A) | 4,002,111 |
| | | TOTAL COMMERCIAL MORTGAGE-BACKED SECURITIES | |
| | | (Cost $271,703,536) | $ 257,247,796 |
| | | CONVERTIBLE CORPORATE BONDS — 0.7% of | |
| | | Net Assets | |
| | | Airlines — 0.3% | |
| 7,120,000 | | Air Canada, 4.0%, 7/1/25 (144A) | $ 8,056,992 |
| 2,965,000 | | Southwest Airlines Co., 1.25%, 5/1/25 | 3,869,325 |
| | | Total Airlines | $ 11,926,317 |
| | | Banks — 0.0%† | |
IDR | 15,039,758,000^
| | PT Bakrie & Brothers Tbk, 0.0%, 12/22/22 | $ 101,074 |
| | | Total Banks | $ 101,074 |
| | | Biotechnology — 0.2% | |
| 5,500,000 | | Exact Sciences Corp., 0.375%, 3/1/28 | $ 5,938,686 |
| 6,298,000 | | Insmed, Inc., 1.75%, 1/15/25 | 6,834,706 |
| | | Total Biotechnology | $ 12,773,392 |
| | | Pharmaceuticals — 0.2% | |
| 3,617,000 | | Teva Pharmaceutical Finance Co. LLC, 0.25%, 2/1/26 | $ 3,510,223 |
| 7,025,000 | | Tricida, Inc., 3.5%, 5/15/27 (144A) | 4,223,958 |
| | | Total Pharmaceuticals | $ 7,734,181 |
| | TOTAL CONVERTIBLE CORPORATE BONDS | |
| | | (Cost $31,604,639) | $ 32,534,964 |
| | | CORPORATE BONDS — 43.4% of Net Assets | |
| | | Advertising — 0.1% | |
| 1,455,000 | | Lamar Media Corp., 3.75%, 2/15/28 (144A) | $ 1,447,725 |
| 1,695,000 | | Lamar Media Corp., 4.875%, 1/15/29 (144A) | 1,762,800 |
| 5,830,000 | | Outfront Media Capital LLC/Outfront Media Capital | |
| | | Corp., 6.25%, 6/15/25 (144A) | 6,004,900 |
| | | Total Advertising | $ 9,215,425 |
| | | Aerospace & Defense — 0.9% | |
| 25,979,000 | | Boeing Co., 3.75%, 2/1/50 | $ 23,774,989 |
| 9,700,000 | | Boeing Co., 5.805%, 5/1/50 | 11,734,867 |
| 5,255,000 | | Howmet Aerospace, Inc., 6.875%, 5/1/25 | 5,806,775 |
| | | Total Aerospace & Defense | $ 41,316,631 |
The accompanying notes are an integral part of these financial statements.
Pioneer Strategic Income Fund | Annual Report | 9/30/20 39
Schedule of Investments | 9/30/20 (continued)
| | | | |
| Principal | | | |
| Amount | | | |
| USD ($) | | | Value |
| | | Airlines — 0.2% | |
| 2,810,000 | | Delta Air Lines, Inc./SkyMiles IP, Ltd., 4.75%, | |
| | | 10/20/28 (144A) | $ 2,917,564 |
| 5,645,000 | | Mileage Plus Holdings LLC/Mileage Plus Intellectual | |
| | | Property Assets, Ltd., 6.5%, 6/20/27 (144A) | 5,877,856 |
| | | Total Airlines | $ 8,795,420 |
| | | Apparel — 0.1% | |
| 6,010,000 | | Ralph Lauren Corp., 2.95%, 6/15/30 | $ 6,274,541 |
| | | Total Apparel | $ 6,274,541 |
| | | Auto Manufacturers — 1.3% | |
| 15,325,000 | | Ford Motor Credit Co. LLC, 3.815%, 11/2/27 | $ 14,601,660 |
| 4,875,000 | | Ford Motor Credit Co. LLC, 5.584%, 3/18/24 | 5,071,158 |
| 16,702,000 | | General Motors Co., 6.6%, 4/1/36 | 20,327,348 |
| 3,678,000 | | General Motors Financial Co., Inc., 4.0%, 1/15/25 | 3,929,906 |
| 2,170,000(b)(d) | | General Motors Financial Co., Inc., 5.7% (5 Year CMT | |
| | | Index + 500 bps) | 2,178,137 |
| 6,535,000 | | Nissan Motor Co., Ltd., 4.81%, 9/17/30 (144A) | 6,574,241 |
| | | Total Auto Manufacturers | $ 52,682,450 |
| | | Auto Parts & Equipment — 0.2% | |
| 2,559,000 | | Goodyear Tire & Rubber Co., 9.5%, 5/31/25 | $ 2,776,515 |
| 4,835,000 | | Lear Corp., 3.5%, 5/30/30 | 4,949,623 |
| | | Total Auto Parts & Equipment | $ 7,726,138 |
| | | Banks — 7.3% | |
| 6,400,000(d) | | Banco Continental SA Via Continental Trustees | |
| | | Cayman, Ltd., 7.375% (3 Month USD LIBOR + 680 bps), | |
| | | 10/7/40 (144A) | $ 6,424,064 |
| 8,210,000(d) | | Banco de Credito del Peru, 6.875% (3 Month USD | |
| | | LIBOR + 771 bps), 9/16/26 (144A) | 8,601,124 |
ARS | 78,000,000(c)
| | Banco de la Ciudad de Buenos Aires, 33.627% | |
| | | (BADLARPP + 399 bps), 12/5/22 | 532,602 |
| 7,405,000 | | Banco Internacional del Peru SAA Interbank, 3.375%, | |
| | | 1/18/23 (144A) | 7,664,175 |
| 4,608,000(b)(d) | | Banco Mercantil del Norte SA, 6.75% (5 Year CMT | |
| | | Index + 497 bps) (144A) | 4,538,880 |
| 4,720,000(b)(d) | | Banco Mercantil del Norte SA, 8.375% (5 Year CMT | |
| | | Index + 776 bps) (144A) | 4,932,400 |
| 2,915,000(d) | | Banco Nacional de Comercio Exterior SNC, 3.8% (5 Year | |
| | | CMT Index + 300 bps), 8/11/26 (144A) | 2,907,742 |
| 4,240,000 | | Banco Santander Mexico SA Institucion de Banca | |
| | Multiple Grupo Financiero Santand, 5.375%, | |
| | | 4/17/25 (144A) | 4,719,120 |
| 11,035,000(b)(d) | | Bank of America Corp., 4.3% (3 Month USD | |
| | | LIBOR + 266 bps) | 10,703,950 |
| 9,150,000(b)(d) | | Barclays Plc, 7.75% (5 Year USD Swap Rate + 484 bps) | 9,454,695 |
| 4,625,000(b)(d) | | Barclays Plc, 8.0% (5 Year CMT Index + 567 bps) | 4,925,625 |
| 9,600,000(b)(d) | | BNP Paribas SA, 4.5% (5 Year CMT Index + | |
| | | 294 bps) (144A) | 9,204,000 |
The accompanying notes are an integral part of these financial statements.
40 Pioneer Strategic Income Fund | Annual Report | 9/30/20
| | | | | |
| Principal | | | |
| Amount | | | |
| USD ($) | | | Value |
| | | Banks — (continued) | |
| 9,709,000(b)(d) | | BNP Paribas SA, 6.625% (5 Year USD Swap Rate + | |
| | | 415 bps) (144A) | $ 10,279,404 |
| 14,755,000(b)(d) | | Citigroup, Inc., 4.7% (SOFRRATE + 323 bps) | 14,257,019 |
| 16,758,000(b)(d) | | Credit Suisse Group AG, 5.1% (5 Year CMT Index + | |
| | | 329 bps) (144A) | 16,171,470 |
| 2,405,000(b)(d) | | Credit Suisse Group AG, 5.25% (5 Year CMT Index + | |
| | | 489 bps) (144A) | 2,409,810 |
| 3,915,000(b)(d) | | Credit Suisse Group AG, 6.375% (5 Year CMT Index + | |
| | | 482 bps) (144A) | 4,184,156 |
| 23,240,000(b)(d) | | Danske Bank AS, 6.125% (7 Year USD Swap | |
| | | Rate + 390 bps) | 24,053,400 |
KZT | 1,923,750,000
| | Development Bank of Kazakhstan JSC, | |
| | | 10.75%, 2/12/25 | 4,355,543 |
| 3,842,000 | | Freedom Mortgage Corp., 8.25%, 4/15/25 (144A) | 3,918,014 |
| 1,060,000(b)(d) | | ING Groep NV, 5.75% (5 Year CMT Index + 434 bps) | 1,101,075 |
| 5,649,000(b)(d) | | ING Groep NV, 6.5% (5 Year USD Swap Rate + 445 bps) | 5,997,826 |
| 14,165,000 | | Intesa Sanpaolo S.p.A., 4.7%, 9/23/49 (144A) | 15,867,960 |
EUR | 5,560,000(b)(d) | | Intesa Sanpaolo S.p.A., 7.75% (5 Year EUR Swap | |
| | | Rate + 719 bps) | 7,318,572 |
| 18,243,000(b)(d) | | JPMorgan Chase & Co., 4.6% (SOFRRATE + 313 bps) | 17,878,140 |
| 21,833,000(b)(d) | | JPMorgan Chase & Co., 5.0% (SOFRRATE + 338 bps) | 21,795,367 |
| 14,375,000(b)(d) | | Natwest Group Plc, 8.625% (5 Year USD Swap | |
| | | Rate + 760 bps) | 14,734,375 |
| 3,895,000 | | QNB Finansbank AS, 4.875%, 5/19/22 (144A) | 3,855,450 |
| 10,677,000(b)(d) | | Societe Generale SA, 7.375% (5 Year USD Swap Rate + | |
| | | 624 bps) (144A) | 10,943,925 |
EUR | 15,021,650(b) | | Stichting AK Rabobank Certificaten, 0.0% | 20,938,264 |
| 12,215,000(b)(d) | | Truist Financial Corp., 5.1% (5 Year CMT | |
| | | Index + 435 bps) | 13,203,804 |
| 3,000,000(d) | | Turkiye Garanti Bankasi AS, 6.125% (5 Year USD Swap | |
| | | Rate + 422 bps), 5/24/27 (144A) | 2,690,400 |
| 10,450,000(b)(d) | | UBS Group AG, 7.0% (5 Year USD Swap Rate + | |
| | | 434 bps) (144A) | 11,155,375 |
| 7,340,000(d) | | UniCredit S.p.A., 2.569% (1 Year CMT Index + | |
| | | 230 bps), 9/22/26 (144A) | 7,274,541 |
| 8,500,000(d) | | UniCredit S.p.A., 5.459% (5 Year CMT Index + | |
| | | 475 bps), 6/30/35 (144A) | 8,659,374 |
| 2,200,000 | | Vnesheconombank Via VEB Finance Plc, 5.942%, | |
| | | 11/21/23 (144A) | 2,429,900 |
| 660,000(b)(d) | | Wachovia Capital Trust III, 5.57% (3 Month USD | |
| | | LIBOR + 93 bps) | 659,643 |
| | | Total Banks | $ 320,741,184 |
| | | Beverages — 1.2% | |
| 26,357,000 | | Anheuser-Busch InBev Worldwide, Inc., 5.55%, 1/23/49 | $ 35,433,940 |
| 15,341,000 | | Bacardi, Ltd., 5.3%, 5/15/48 (144A) | 19,228,562 |
| | | Total Beverages | $ 54,662,502 |
The accompanying notes are an integral part of these financial statements.
Pioneer Strategic Income Fund | Annual Report | 9/30/20 41
Schedule of Investments | 9/30/20 (continued)
| | | | | |
| Principal | | | |
| Amount | | | |
| USD ($) | | | Value |
| | | Building Materials — 0.3% | |
| 1,275,000 | | Builders FirstSource, Inc., 5.0%, 3/1/30 (144A) | $ 1,319,625 |
| 5,970,000 | | Cemex SAB de CV, 5.45%, 11/19/29 (144A) | 6,037,162 |
| 905,000 | | Cemex SAB de CV, 7.75%, 4/16/26 (144A) | 953,644 |
| 5,665,000 | | Standard Industries, Inc., 4.375%, 7/15/30 (144A) | 5,808,126 |
| 950,000 | | Standard Industries, Inc., 5.0%, 2/15/27 (144A) | 988,000 |
| 495,000 | | Summit Materials LLC/Summit Materials Finance | |
| | | Corp., 5.25%, 1/15/29 (144A) | 515,419 |
| | | Total Building Materials | $ 15,621,976 |
| | | Chemicals — 1.0% | |
| 2,535,000 | | Avient Corp., 5.75%, 5/15/25 (144A) | $ 2,687,100 |
| 6,655,000 | | Element Solutions, Inc., 3.875%, 9/1/28 (144A) | 6,530,219 |
EUR | 3,150,000 | | INEOS Finance Plc, 2.875%, 5/1/26 (144A) | 3,548,085 |
| 1,207,000 | | NOVA Chemicals Corp., 5.0%, 5/1/25 (144A) | 1,176,825 |
| 2,566,000 | | NOVA Chemicals Corp., 5.25%, 6/1/27 (144A) | 2,415,248 |
EUR | 2,450,000 | | OCI NV, 3.125%, 11/1/24 (144A) | 2,849,378 |
| 470,000 | | OCI NV, 4.625%, 10/15/25 (144A) | 470,000 |
| 3,485,000 | | OCI NV, 5.25%, 11/1/24 (144A) | 3,595,475 |
| 3,239,000 | | OCI NV, 6.625%, 4/15/23 (144A) | 3,349,126 |
EUR | 1,670,000 | | Synthomer Plc, 3.875%, 7/1/25 (144A) | 1,991,152 |
| 4,340,000 | | Tronox, Inc., 6.5%, 5/1/25 (144A) | 4,524,450 |
| 5,330,000 | | Tronox, Inc., 6.5%, 4/15/26 (144A) | 5,330,000 |
| | | Total Chemicals | $ 38,467,058 |
| | | Commercial Services — 1.5% | |
| 5,196,000 | | Allied Universal Holdco LLC/Allied Universal Finance | |
| | | Corp., 6.625%, 7/15/26 (144A) | $ 5,533,740 |
| 4,735,000 | | Brink’s Co., 5.5%, 7/15/25 (144A) | 4,936,237 |
| 12,268,000 | | CoStar Group, Inc., 2.8%, 7/15/30 (144A) | 12,711,878 |
| 8,375,000 | | Garda World Security Corp., 4.625%, 2/15/27 (144A) | 8,416,875 |
| 4,042,000 | | Garda World Security Corp., 9.5%, 11/1/27 (144A) | 4,244,100 |
| 3,795,000 | | Prime Security Services Borrower LLC/Prime Finance, | |
| | | Inc., 5.75%, 4/15/26 (144A) | 4,058,297 |
| 10,716,000 | | Prime Security Services Borrower LLC/Prime Finance, | |
| | | Inc., 6.25%, 1/15/28 (144A) | 10,849,950 |
MXN | 82,250,000 | | Red de Carreteras de Occidente SAPIB de CV, 9.0%, | |
| | | 6/10/28 (144A) | 3,943,254 |
| 4,035,000 | | Sotheby’s, 7.375%, 10/15/27 (144A) | 4,035,000 |
| 4,600,000 | | United Rentals North America, Inc., 4.875%, 1/15/28 | 4,830,000 |
| | | Total Commercial Services | $ 63,559,331 |
| | | Computers — 0.2% | |
| 2,340,000 | | Booz Allen Hamilton, Inc., 3.875%, 9/1/28 (144A) | $ 2,402,127 |
| 2,415,000 | | NCR Corp., 5.0%, 10/1/28 (144A) | 2,416,932 |
| 1,215,000 | | NCR Corp., 5.25%, 10/1/30 (144A) | 1,215,000 |
| 490,000 | | NCR Corp., 8.125%, 4/15/25 (144A) | 541,573 |
| | | Total Computers | $ 6,575,632 |
The accompanying notes are an integral part of these financial statements.
42 Pioneer Strategic Income Fund | Annual Report | 9/30/20
| | | | |
| Principal | | | |
| Amount | | | |
| USD ($) | | | Value |
| | | Cosmetics/Personal Care — 0.1% | |
| 5,445,000 | | Edgewell Personal Care Co., 5.5%, 6/1/28 (144A) | $ 5,729,392 |
| | | Total Cosmetics/Personal Care | $ 5,729,392 |
| | | Diversified Financial Services — 1.0% | |
| 9,395,000 | | Alliance Data Systems Corp., 7.0%, 1/15/26 (144A) | $ 9,348,964 |
| 1,071,000 | | Avolon Holdings Funding, Ltd., 3.95%, 7/1/24 (144A) | 1,016,584 |
| 6,708,000(b)(d) | | Charles Schwab Corp., 5.375% (5 Year CMT | |
| | | Index + 497 bps) | 7,268,453 |
| 16,642,175(g) | | Global Aircraft Leasing Co., Ltd., 6.5% (7.25% PIK 6.50% | |
| | | cash), 9/15/24 (144A) | 9,278,013 |
| 3,495,000 | | Nationstar Mortgage Holdings, Inc., 5.5%, | |
| | | 8/15/28 (144A) | 3,490,631 |
| 1,180,000 | | Nationstar Mortgage Holdings, Inc., 6.0%, | |
| | | 1/15/27 (144A) | 1,202,845 |
| 1,496,000 | | Nationstar Mortgage Holdings, Inc., 9.125%, | |
| | | 7/15/26 (144A) | 1,604,460 |
| 8,473,000 | | Quicken Loans LLC/Quicken Loans Co.-Issuer, Inc., | |
| | | 3.625%, 3/1/29 (144A) | 8,398,861 |
| 4,795,000 | | Quicken Loans LLC/Quicken Loans Co.-Issuer, Inc., | |
| | | 3.875%, 3/1/31 (144A) | 4,735,063 |
| | | Total Diversified Financial Services | $ 46,343,874 |
| | | Electric — 3.1% | |
| 3,625,000 | | Adani Electricity Mumbai, Ltd., 3.949%, 2/12/30 (144A) | $ 3,544,156 |
| 4,142,850 | | Adani Renewable Energy RJ, Ltd./Kodangal Solar | |
| | | Parks Pvt, Ltd./Wardha Solar Maharash, 4.625%, | |
| | | 10/15/39 (144A) | 3,977,136 |
| 4,577,000 | | Adani Transmission, Ltd., 4.25%, 5/21/36 (144A) | 4,555,038 |
| 2,285,000 | | AES Corp., 3.95%, 7/15/30 (144A) | 2,524,834 |
| 1,605,000 | | Calpine Corp., 4.625%, 2/1/29 (144A) | 1,601,991 |
| 1,605,000 | | Calpine Corp., 5.0%, 2/1/31 (144A) | 1,635,976 |
| 13,854,000(b)(d) | | Dominion Energy, Inc., 4.65% (5 Year CMT | |
| | | Index + 299 bps) | 14,046,165 |
| 21,163,000(b)(d) | | Duke Energy Corp., 4.875% (5 Year CMT | |
| | | Index + 339 bps) | 22,386,327 |
| 7,765,000(d) | | Enel S.p.A., 8.75% (5 Year USD Swap Rate + | |
| | | 588 bps), 9/24/73 (144A) | 9,063,153 |
| 246,673 | | Kiowa Power Partners LLC, 5.737%, 3/30/21 (144A) | 248,088 |
| 2,336,000 | | NextEra Energy Operating Partners LP, 4.5%, | |
| | | 9/15/27 (144A) | 2,493,680 |
| 20,059,000 | | NRG Energy, Inc., 4.45%, 6/15/29 (144A) | 22,102,015 |
| 905,000 | | Pattern Energy Operations LP/Pattern Energy | |
| | | Operations, Inc., 4.5%, 8/15/28 (144A) | 938,938 |
| 6,490,000 | | Puget Energy, Inc., 4.1%, 6/15/30 (144A) | 7,244,291 |
| 9,606,000 | | Southern California Edison Co., 3.65%, 2/1/50 | 9,926,240 |
| 7,635,000 | | Southern California Edison Co., 4.875%, 3/1/49 | 9,278,269 |
The accompanying notes are an integral part of these financial statements.
Pioneer Strategic Income Fund | Annual Report | 9/30/20 43
Schedule of Investments | 9/30/20 (continued)
| | | | |
| Principal | | | |
| Amount | | | |
| USD ($) | | | Value |
| | Electric — (continued) | |
| 16,580,000 | | Vistra Operations Co. LLC, 3.7%, 1/30/27 (144A) | $ 17,436,580 |
| 1,913,000 | | Vistra Operations Co. LLC, 4.3%, 7/15/29 (144A) | 2,088,082 |
| | Total Electric | $ 135,090,959 |
| | Electrical Components & Equipment — 0.4% | |
EUR | 7,865,000
| | Belden, Inc., 3.375%, 7/15/27 (144A) | $ 9,100,083 |
| 2,664,000 | | Energizer Holdings, Inc., 4.75%, 6/15/28 (144A) | 2,756,974 |
| 2,450,000 | | WESCO Distribution, Inc., 7.125%, 6/15/25 (144A) | 2,668,785 |
| 1,700,000 | | WESCO Distribution, Inc., 7.25%, 6/15/28 (144A) | 1,862,648 |
| | Total Electrical Components & Equipment | $ 16,388,490 |
| | Electronics — 0.5% | |
| 20,490,000 | | Flex, Ltd., 4.875%, 6/15/29 | $ 23,553,284 |
| 1,850,000 | | Sensata Technologies, Inc., 3.75%, 2/15/31 (144A) | 1,838,438 |
| | Total Electronics | $ 25,391,722 |
| | Energy-Alternate Sources — 0.1% | |
| 781,306 | | Alta Wind Holdings LLC, 7.0%, 6/30/35 (144A) | $ 949,513 |
| 2,095,000 | | TerraForm Power Operating LLC, 4.75%, | |
| | 1/15/30 (144A) | 2,215,463 |
| | Total Energy-Alternate Sources | $ 3,164,976 |
| | Engineering & Construction — 0.3% | |
| 3,915,000 | | KBR, Inc., 4.75%, 9/30/28 (144A) | $ 3,939,469 |
| 7,985,000 | | PowerTeam Services LLC, 9.033%, 12/4/25 (144A) | 8,414,194 |
| | Total Engineering & Construction | $ 12,353,663 |
| | Entertainment — 0.3% | |
| 4,060,000 | | Caesars Entertainment, Inc., 6.25%, 7/1/25 (144A) | $ 4,243,695 |
| 5,571,000 | | International Game Technology Plc, 6.5%, | |
| | 2/15/25 (144A) | 5,926,151 |
| 1,735,000 | | Scientific Games International, Inc., 7.0%, | |
| | 5/15/28 (144A) | 1,739,246 |
| 1,735,000 | | Scientific Games International, Inc., 7.25%, | |
| | 11/15/29 (144A) | 1,761,025 |
| 3,636,000 | | Scientific Games International, Inc., 8.25%, | |
| | 3/15/26 (144A) | 3,796,311 |
| | Total Entertainment | $ 17,466,428 |
| | Environmental Control — 0.3% | |
| 4,020,000 | | Covanta Holding Corp., 5.0%, 9/1/30 | $ 4,057,386 |
| 6,132,000 | | Covanta Holding Corp., 6.0%, 1/1/27 | 6,377,280 |
| 2,323,000 | | Tervita Corp., 7.625%, 12/1/21 (144A) | 2,119,738 |
| | Total Environmental Control | $ 12,554,404 |
The accompanying notes are an integral part of these financial statements.
44 Pioneer Strategic Income Fund | Annual Report | 9/30/20
| | | | | |
| Principal | | | |
| Amount | | | |
| USD ($) | | | Value |
| | | Food — 1.0% | |
| 4,185,000 | | Albertsons Cos., Inc./Safeway, Inc./New Albertsons | |
| | | LP/Albertsons LLC, 3.5%, 3/15/29 (144A) | $ 4,062,066 |
| 3,230,000 | | Albertsons Cos., Inc./Safeway, Inc./New Albertsons | |
| | | LP/Albertsons LLC, 4.875%, 2/15/30 (144A) | 3,367,275 |
| 2,250,000 | | JBS USA LUX SA/JBS USA Finance, Inc., 6.75%, | |
| | | 2/15/28 (144A) | 2,446,695 |
| 4,600,000 | | JBS USA LUX SA/JBS USA Food Co./JBS USA | |
| | | Finance, Inc., 5.5%, 1/15/30 (144A) | 5,006,962 |
| 2,485,000 | | JBS USA LUX SA/JBS USA Food Co./JBS USA | |
| | | Finance, Inc., 6.5%, 4/15/29 (144A) | 2,758,275 |
| 7,401,000 | | Minerva Luxembourg SA, 5.875%, 1/19/28 (144A) | 7,687,789 |
| 1,375,000 | | Minerva Luxembourg SA, 6.5%, 9/20/26 (144A) | 1,426,563 |
| 2,900,000 | | Pilgrim’s Pride Corp., 5.875%, 9/30/27 (144A) | 2,994,250 |
| 7,175,000 | | Smithfield Foods, Inc., 3.0%, 10/15/30 (144A) | 7,190,498 |
| 847,000 | | Smithfield Foods, Inc., 5.2%, 4/1/29 (144A) | 990,843 |
| | | Total Food | $ 37,931,216 |
| | | Forest Products & Paper — 0.7% | |
| 3,770,000 | | Clearwater Paper Corp., 4.75%, 8/15/28 (144A) | $ 3,779,425 |
| 10,035,000 | | International Paper Co., 6.0%, 11/15/41 | 13,794,144 |
| 4,901,000 | | International Paper Co., 7.3%, 11/15/39 | 7,163,833 |
| 3,004,000 | | Inversiones CMPC SA, 3.85%, 1/13/30 (144A) | 3,285,625 |
| | | Total Forest Products & Paper | $ 28,023,027 |
| | | Gas — 0.1% | |
| 3,129,664 | | Nakilat, Inc., 6.267%, 12/31/33 (144A) | $ 3,928,355 |
| | | Total Gas | $ 3,928,355 |
| | | Healthcare-Services — 0.8% | |
| 2,005,000 | | Centene Corp., 4.25%, 12/15/27 | $ 2,098,092 |
| 3,985,000 | | Centene Corp., 4.625%, 12/15/29 | 4,298,460 |
| 8,657,000 | | HCA, Inc., 3.5%, 9/1/30 | 8,820,444 |
EUR | 2,272,000 | | IQVIA, Inc., 2.25%, 1/15/28 (144A) | 2,601,895 |
| 2,225,000 | | LifePoint Health, Inc., 6.75%, 4/15/25 (144A) | 2,341,812 |
| 2,400,000 | | MEDNAX, Inc., 5.25%, 12/1/23 (144A) | 2,430,000 |
| 1,685,000 | | Molina Healthcare, Inc., 4.375%, 6/15/28 (144A) | 1,719,543 |
| 1,572,000 | | RegionalCare Hospital Partners Holdings, Inc./LifePoint | |
| | | Health, Inc., 9.75%, 12/1/26 (144A) | 1,670,250 |
| 3,210,000 | | Tenet Healthcare Corp., 5.125%, 11/1/27 (144A) | 3,297,312 |
| 3,421,000 | | US Renal Care, Inc., 10.625%, 7/15/27 (144A) | 3,626,260 |
| 1,813,000 | | West Street Merger Sub, Inc., 6.375%, 9/1/25 (144A) | 1,848,879 |
| | | Total Healthcare-Services | $ 34,752,947 |
| | | Home Builders — 0.1% | |
| 1,657,000 | | KB Home, 6.875%, 6/15/27 | $ 1,959,402 |
| 2,710,000 | | Meritage Homes Corp., 6.0%, 6/1/25 | 3,022,219 |
| | | Total Home Builders | $ 4,981,621 |
The accompanying notes are an integral part of these financial statements.
Pioneer Strategic Income Fund | Annual Report | 9/30/20 45
Schedule of Investments | 9/30/20 (continued)
| | | | | |
| Principal | | | |
| Amount | | | |
| USD ($) | | | Value |
| | | Housewares — 0.0%† | |
| 775,000 | | CD&R Smokey Buyer, Inc., 6.75%, 7/15/25 (144A) | $ 817,625 |
| | | Total Housewares | $ 817,625 |
| | | Insurance — 2.6% | |
| 14,833,000 | | CNO Financial Group, Inc., 5.25%, 5/30/29 | $ 17,126,911 |
| 7,650,000(d) | | Farmers Exchange Capital III, 5.454% (3 Month USD | |
| | | LIBOR + 345 bps), 10/15/54 (144A) | 9,249,423 |
| 13,080,000(d) | | Farmers Insurance Exchange, 4.747% (3 Month USD | |
| | | LIBOR + 323 bps), 11/1/57 (144A) | 13,327,393 |
EUR | 2,650,000(d) | | Liberty Mutual Group, Inc., 3.625% (5 Year EUR Swap | |
| | | Rate + 370 bps), 5/23/59 (144A) | 3,061,796 |
| 22,651,000 | | Liberty Mutual Insurance Co., 7.697%, 10/15/97 (144A) | 34,958,719 |
| 3,800,000 | | Liberty Mutual Insurance Co., 8.5%, 5/15/25 (144A) | 4,775,063 |
| 10,910,000 | | Nationwide Mutual Insurance Co., 4.35%, | |
| | | 4/30/50 (144A) | 11,687,784 |
| 10,023,000 | | Prudential Financial, Inc., 3.0%, 3/10/40 | 10,750,441 |
| 6,885,000(d) | | Prudential Financial, Inc., 3.7% (5 Year CMT Index + | |
| | | 304 bps), 10/1/50 | 7,024,766 |
| | | Total Insurance | $ 111,962,296 |
| | | Internet — 1.3% | |
| 3,550,000 | | ANGI Group LLC, 3.875%, 8/15/28 (144A) | $ 3,514,500 |
| 17,010,000 | | Booking Holdings, Inc., 4.625%, 4/13/30 | 20,435,701 |
| 14,366,000 | | Expedia Group, Inc., 3.25%, 2/15/30 | 13,841,791 |
| 7,725,000 | | Expedia Group, Inc., 3.8%, 2/15/28 | 7,801,030 |
EUR | 6,515,000 | | Netflix, Inc., 3.625%, 6/15/30 (144A) | 8,264,105 |
| | | Total Internet | $ 53,857,127 |
| | | Iron & Steel — 0.2% | |
| 1,985,000 | | Cleveland-Cliffs, Inc., 6.75%, 3/15/26 (144A) | $ 2,019,737 |
| 1,170,000 | | Cleveland-Cliffs, Inc., 9.875%, 10/17/25 (144A) | 1,306,012 |
| 2,675,000 | | Metinvest BV, 7.65%, 10/1/27 (144A) | 2,595,526 |
| | | Total Iron & Steel | $ 5,921,275 |
| | | Leisure Time — 0.3% | |
| 3,186,000 | | Royal Caribbean Cruises, Ltd., 11.5%, 6/1/25 (144A) | $ 3,695,938 |
| 10,582,000 | | VOC Escrow, Ltd., 5.0%, 2/15/28 (144A) | 9,368,985 |
| | | Total Leisure Time | $ 13,064,923 |
| | | Lodging — 0.6% | |
| 505,000 | | Hilton Domestic Operating Co., Inc., 5.375%, | |
| | | 5/1/25 (144A) | $ 527,371 |
| 555,000 | | Hilton Domestic Operating Co., Inc., 5.75%, | |
| | | 5/1/28 (144A) | 584,831 |
| 18,320,000 | | Marriott International, Inc., 3.5%, 10/15/32 | 18,180,150 |
| 2,659,000 | | Marriott International, Inc., 4.625%, 6/15/30 | 2,847,649 |
The accompanying notes are an integral part of these financial statements.
46 Pioneer Strategic Income Fund | Annual Report | 9/30/20
| | | | |
| Principal | | | |
| Amount | | | |
| USD ($) | | | Value |
| | Lodging — (continued) | |
| 940,000 | | Marriott International, Inc., 5.75%, 5/1/25 | $ 1,049,059 |
| 4,500,000 | | Sands China, Ltd., 4.375%, 6/18/30 (144A) | 4,747,050 |
| | Total Lodging | $ 27,936,110 |
| | Media — 0.5% | |
| 6,000,000 | | CCO Holdings LLC/CCO Holdings Capital Corp., | |
| | 4.75%, 3/1/30 (144A) | $ 6,352,500 |
| 6,200,000 | | CSC Holdings LLC, 4.625%, 12/1/30 (144A) | 6,246,500 |
| 1,345,000 | | CSC Holdings LLC, 5.5%, 4/15/27 (144A) | 1,415,747 |
| 10,590,000 | | Diamond Sports Group LLC/Diamond Sports | |
| | Finance Co., 6.625%, 8/15/27 (144A) | 5,513,419 |
| 7,835,000 | | Gray Television, Inc., 7.0%, 5/15/27 (144A) | 8,494,217 |
| | Total Media | $ 28,022,383 |
| | Mining — 1.7% | |
| 5,810,000 | | Anglo American Capital Plc, 2.625%, 9/10/30 (144A) | $ 5,794,197 |
| 1,650,000 | | Anglo American Capital Plc, 4.0%, 9/11/27 (144A) | 1,821,614 |
| 4,847,000 | | Anglo American Capital Plc, 4.5%, 3/15/28 (144A) | 5,544,727 |
| 3,500,000 | | Anglo American Capital Plc, 4.75%, 4/10/27 (144A) | 4,021,436 |
| 3,405,000 | | AngloGold Ashanti Holdings Plc, 3.75%, 10/1/30 | 3,492,927 |
| 6,744,000 | | First Quantum Minerals, Ltd., 7.25%, 4/1/23 (144A) | 6,735,570 |
| 19,216,000 | | Freeport-McMoRan, Inc., 5.45%, 3/15/43 | 21,306,316 |
| 7,075,000 | | IAMGOLD Corp., 5.75%, 10/15/28 (144A) | 6,880,437 |
| 4,655,000 | | Joseph T Ryerson & Son, Inc., 8.5%, 8/1/28 (144A) | 4,899,387 |
| 6,041,000 | | Novelis Corp., 4.75%, 1/30/30 (144A) | 5,933,591 |
| 1,797,000 | | Rusal Capital, DAC, 4.85%, 2/1/23 (144A) | 1,805,985 |
| 3,550,000 | | Rusal Capital, DAC, 5.125%, 2/2/22 (144A) | 3,573,146 |
| | Total Mining | $ 71,809,333 |
| | Miscellaneous Manufacturers — 0.3% | |
| 5,765,000 | | General Electric Co., 4.25%, 5/1/40 | $ 5,848,936 |
| 6,525,000 | | General Electric Co., 4.35%, 5/1/50 | 6,652,960 |
| | Total Miscellaneous Manufacturers | $ 12,501,896 |
| | Multi-National — 1.2% | |
| 12,922,000 | | Africa Finance Corp., 4.375%, 4/17/26 (144A) | $ 13,897,094 |
| 4,880,000 | | African Export-Import Bank, 3.994%, 9/21/29 (144A) | 5,028,254 |
| 8,430,000 | | Banque Ouest Africaine de Developpement, 4.7%, | |
| | 10/22/31 (144A) | 8,821,152 |
| 2,860,000 | | Banque Ouest Africaine de Developpement, 5.0%, | |
| | 7/27/27 (144A) | 3,079,190 |
IDR | 189,000,300,000
| | European Bank for Reconstruction & Development, | |
| | 6.45%, 12/13/22 | 12,824,839 |
IDR | 113,010,000,000
| | Inter-American Development Bank, 7.875%, 3/14/23 | 7,966,142 |
| | Total Multi-National | $ 51,616,671 |
The accompanying notes are an integral part of these financial statements.
Pioneer Strategic Income Fund | Annual Report | 9/30/20 47
Schedule of Investments | 9/30/20 (continued)
| | | | | |
| Principal | | | |
| Amount | | | |
| USD ($) | | | Value |
| | | Oil & Gas — 2.1% | |
| 5,026,000 | | Apache Corp., 4.25%, 1/15/30 | $ 4,528,049 |
| 11,320,000 | | Apache Corp., 4.375%, 10/15/28 | 10,357,800 |
| 28,023,000 | | Cenovus Energy, Inc., 6.75%, 11/15/39 | 28,172,882 |
| 895,000 | | MEG Energy Corp., 6.5%, 1/15/25 (144A) | 877,923 |
| 3,049,000 | | MEG Energy Corp., 7.0%, 3/31/24 (144A) | 2,835,570 |
| 3,815,000 | | MEG Energy Corp., 7.125%, 2/1/27 (144A) | 3,421,406 |
| 8,985,000 | | Neptune Energy Bondco Plc, 6.625%, 5/15/25 (144A) | 8,013,901 |
| 6,125,000 | | Newfield Exploration Co., 5.625%, 7/1/24 | 5,941,561 |
| 3,095,000 | | PBF Holding Co. LLC/PBF Finance Corp., 9.25%, | |
| | | 5/15/25 (144A) | 3,172,437 |
| 4,667,000 | | Petroleos Mexicanos, 5.35%, 2/12/28 | 4,036,955 |
| 2,814,000 | | Precision Drilling Corp., 7.125%, 1/15/26 (144A) | 1,809,909 |
| 3,952,000 | | Transocean, Inc., 6.8%, 3/15/38 | 523,640 |
| 1,110,000 | | Transocean, Inc., 8.0%, 2/1/27 (144A) | 310,800 |
| 3,585,000 | | Valero Energy Corp., 2.15%, 9/15/27 | 3,570,529 |
| 10,067,000 | | Valero Energy Corp., 6.625%, 6/15/37 | 12,663,157 |
| 4,020,000 | | YPF SA, 6.95%, 7/21/27 (144A) | 2,683,350 |
ARS | 22,175,000 | | YPF SA, 16.5%, 5/9/22 (144A) | 187,764 |
| | | Total Oil & Gas | $ 93,107,633 |
| | | Oil & Gas Services — 0.0%† | |
| 2,027,000 | | USA Compression Partners LP/USA Compression | |
| | | Finance Corp., 6.875%, 9/1/27 | $ 2,010,014 |
| | | Total Oil & Gas Services | $ 2,010,014 |
| | | Packaging & Containers — 0.4% | |
| 10,125,000 | | Ball Corp., 2.875%, 8/15/30 | $ 10,011,094 |
| 7,630,000 | | Greif, Inc., 6.5%, 3/1/27 (144A) | 7,904,527 |
| | | Total Packaging & Containers | $ 17,915,621 |
| | | Pharmaceuticals — 1.0% | |
| 1,831,000 | | Bausch Health Americas, Inc., 8.5%, 1/31/27 (144A) | $ 2,011,811 |
EUR | 2,805,000 | | Bausch Health Cos., Inc., 4.5%, 5/15/23 (144A) | 3,256,206 |
EUR | 8,000,000 | | Bausch Health Cos., Inc., 4.5%, 5/15/23 | 9,286,861 |
| 1,720,000 | | Bausch Health Cos., Inc., 5.0%, 1/30/28 (144A) | 1,670,550 |
| 1,210,000 | | Bausch Health Cos., Inc., 5.25%, 1/30/30 (144A) | 1,191,850 |
| 5,250,000 | | Cardinal Health, Inc., 4.9%, 9/15/45 | 6,073,170 |
| 4,375,082 | | CVS Pass-Through Trust, 5.773%, 1/10/33 (144A) | 5,052,566 |
| 687,450 | | CVS Pass-Through Trust, 6.036%, 12/10/28 | 781,576 |
| 873,740 | | CVS Pass-Through Trust, 8.353%, 7/10/31 (144A) | 1,102,334 |
| 2,424,000 | | Par Pharmaceutical, Inc., 7.5%, 4/1/27 (144A) | 2,539,576 |
EUR | 340,000 | | Teva Pharmaceutical Finance Netherlands II BV, | |
| | | 6.0%, 1/31/25 | 407,376 |
| 13,628,000 | | Teva Pharmaceutical Finance Netherlands III BV, | |
| | | 3.15%, 10/1/26 | 12,022,758 |
| | | Total Pharmaceuticals | $ 45,396,634 |
The accompanying notes are an integral part of these financial statements.
48 Pioneer Strategic Income Fund | Annual Report | 9/30/20
| | | | |
| Principal | | | |
| Amount | | | |
| USD ($) | | | Value |
| | Pipelines — 3.3% | |
| 3,257,000 | | Cameron LNG LLC, 3.302%, 1/15/35 (144A) | $ 3,674,727 |
| 7,358,000 | | Cameron LNG LLC, 3.402%, 1/15/38 (144A) | 7,963,084 |
| 3,435,000 | | Cheniere Energy, Inc., 4.625%, 10/15/28 (144A) | 3,525,169 |
| 2,905,000 | | DCP Midstream Operating LP, 3.875%, 3/15/23 | 2,861,425 |
| 5,495,000 | | DCP Midstream Operating LP, 5.6%, 4/1/44 | 5,007,318 |
| 1,415,000 | | Enable Midstream Partners LP, 4.15%, 9/15/29 | 1,311,854 |
| 7,140,000 | | Enable Midstream Partners LP, 4.4%, 3/15/27 | 6,842,811 |
| 13,625,000 | | Enable Midstream Partners LP, 4.95%, 5/15/28 | 13,302,427 |
| 4,555,000 | | Energy Transfer Operating LP, 6.0%, 6/15/48 | 4,581,369 |
| 1,262,000 | | Energy Transfer Operating LP, 6.125%, 12/15/45 | 1,266,785 |
| 1,694,000(b)(d) | | Energy Transfer Operating LP, 6.625% (3 Month USD | |
| | LIBOR + 416 bps) | 1,151,412 |
| 12,960,000(b)(d) | | Energy Transfer Operating LP, 7.125% (5 Year CMT | |
| | Index + 531 bps) | 10,238,400 |
| 796,000 | | EnLink Midstream LLC, 5.375%, 6/1/29 | 644,760 |
| 15,145,000 | | EnLink Midstream Partners LP, 5.45%, 6/1/47 | 9,541,350 |
| 3,862,000 | | EnLink Midstream Partners LP, 5.6%, 4/1/44 | 2,481,335 |
| 3,600,000 | | Hess Midstream Operations LP, 5.125%, 6/15/28 (144A) | 3,593,232 |
| 7,415,000 | | Kinder Morgan, Inc., 5.05%, 2/15/46 | 8,425,581 |
| 4,224,000 | | Midwest Connector Capital Co. LLC, 4.625%, | |
| | 4/1/29 (144A) | 4,269,105 |
| 9,425,000 | | ONEOK, Inc., 6.875%, 9/30/28 | 11,158,506 |
| 4,405,000(b)(d) | | Plains All American Pipeline LP, 6.125% (3 Month USD | |
| | LIBOR + 411 bps) | 2,794,532 |
| 4,405,000 | | Plains All American Pipeline LP/PAA Finance Corp., | |
| | 4.9%, 2/15/45 | 4,020,199 |
| 4,525,000 | | Sunoco Logistics Partners Operations LP, 5.4%, 10/1/47 | 4,272,355 |
| 3,715,000 | | Sunoco Logistics Partners Operations LP, 6.1%, 2/15/42 | 3,751,184 |
| 5,253,000 | | Williams Cos., Inc., 5.75%, 6/24/44 | 6,187,794 |
| 8,175,000 | | Williams Cos., Inc., 7.5%, 1/15/31 | 10,768,616 |
| 8,690,000 | | Williams Cos., Inc., 7.75%, 6/15/31 | 11,430,727 |
| | Total Pipelines | $ 145,066,057 |
| | Real Estate — 0.3% | |
| 13,000,000(b)(d) | | AT Securities BV, 5.25% (5 Year USD Swap | |
| | Rate + 355 bps) | $ 13,000,000 |
| | Total Real Estate | $ 13,000,000 |
| | REITs — 1.6% | |
| 4,800,000 | | GLP Capital LP/GLP Financing II, Inc., 4.0%, 1/15/30 | $ 4,968,000 |
| 5,648,000 | | Highwoods Realty LP, 2.6%, 2/1/31 | 5,609,237 |
| 4,185,000 | | Highwoods Realty LP, 4.125%, 3/15/28 | 4,617,177 |
| 6,656,000 | | Iron Mountain, Inc., 4.5%, 2/15/31 (144A) | 6,718,566 |
| 12,750,000 | | iStar, Inc., 4.25%, 8/1/25 | 11,897,280 |
| 3,345,000 | | iStar, Inc., 4.75%, 10/1/24 | 3,236,287 |
The accompanying notes are an integral part of these financial statements.
Pioneer Strategic Income Fund | Annual Report | 9/30/20 49
Schedule of Investments | 9/30/20 (continued)
| | | | |
| Principal | | | |
| Amount | | | |
| USD ($) | | | Value |
| | | REITs — (continued) | |
| 3,935,000 | | Lexington Realty Trust, 2.7%, 9/15/30 | $ 4,011,728 |
| 9,521,000 | | MPT Operating Partnership LP/MPT Finance Corp., | |
| | | 4.625%, 8/1/29 | 9,906,315 |
| 4,605,000 | | Simon Property Group LP, 3.25%, 9/13/49 | 4,223,315 |
| 5,720,000 | | Simon Property Group LP, 3.8%, 7/15/50 | 5,807,578 |
| 8,337,000 | | Uniti Group LP/Uniti Fiber Holdings, Inc./CSL Capital | |
| | | LLC, 7.875%, 2/15/25 (144A) | 8,834,761 |
| 892,000 | | VICI Properties LP/VICI Note Co., Inc., 4.125%, | |
| | | 8/15/30 (144A) | 877,505 |
| | | Total REITs | $ 70,707,749 |
| | | Retail — 0.6% | |
| 465,000 | | Asbury Automotive Group, Inc., 4.5%, 3/1/28 (144A) | $ 467,906 |
| 435,000 | | Asbury Automotive Group, Inc., 4.75%, 3/1/30 (144A) | 438,262 |
| 3,510,000 | | AutoNation, Inc., 4.75%, 6/1/30 | 4,135,533 |
| 9,241,000 | | Beacon Roofing Supply, Inc., 4.875%, 11/1/25 (144A) | 9,056,180 |
| 1,080,000 | | Group 1 Automotive, Inc., 4.0%, 8/15/28 (144A) | 1,061,100 |
| 2,980,000 | | Penske Automotive Group, Inc., 3.5%, 9/1/25 | 2,967,857 |
| 9,865,000 | | QVC, Inc., 4.375%, 9/1/28 | 10,062,300 |
| 1,350,000 | | QVC, Inc., 4.75%, 2/15/27 | 1,386,720 |
| | | Total Retail | $ 29,575,858 |
| | | Semiconductors — 0.6% | |
| 2,290,000 | | Broadcom, Inc., 4.3%, 11/15/32 | $ 2,616,075 |
| 18,231,000 | | Broadcom, Inc., 5.0%, 4/15/30 | 21,505,238 |
| | | Total Semiconductors | $ 24,121,313 |
| | | Software — 0.6% | |
| 1,740,000 | | Black Knight InfoServ LLC, 3.625%, 9/1/28 (144A) | $ 1,758,487 |
| 19,791,000 | | Citrix Systems, Inc., 3.3%, 3/1/30 | 21,136,281 |
| 2,610,000 | | Logan Merger Sub, Inc., 5.5%, 9/1/27 (144A) | 2,640,146 |
| | | Total Software | $ 25,534,914 |
| | | Sovereign — 0.0%† | |
| 2,720,802(h) | | Ecuador Social Bond S.a.r.l, 1/30/35 (144A) | $ 1,952,176 |
| | | Total Sovereign | $ 1,952,176 |
| | | Telecommunications — 1.0% | |
| 475,000 | | Altice France SA, 5.125%, 1/15/29 (144A) | $ 473,219 |
| 9,874,000 | | Altice France SA, 5.5%, 1/15/28 (144A) | 9,997,425 |
| 3,010,000 | | CenturyLink, Inc., 4.0%, 2/15/27 (144A) | 3,057,889 |
| 4,600,000 | | CommScope Technologies LLC, 5.0%, 3/15/27 (144A) | 4,416,000 |
| 1,976,217 | | Digicel International Finance, Ltd./Digicel Holdings | |
| | | Bermuda, Ltd., 8.0%, 12/31/26 (144A) | 1,521,687 |
The accompanying notes are an integral part of these financial statements.
50 Pioneer Strategic Income Fund | Annual Report | 9/30/20
| | | | | |
| Principal | | | |
| Amount | | | |
| USD ($) | | | Value |
| | | Telecommunications — (continued) | |
| 4,950,371 | | Digicel International Finance, Ltd./Digicel Holdings | |
| | | Bermuda, Ltd., 8.75%, 5/25/24 (144A) | $ 4,968,935 |
| 2,507,394(g) | | Digicel International Finance, Ltd./Digicel Holdings | |
| | Bermuda, Ltd., 13.0% (7.00% PIK 6.00% cash), | |
| | | 12/31/25 (144A) | 2,287,997 |
| 5,900,000 | | Level 3 Financing, Inc., 4.625%, 9/15/27 (144A) | 6,062,250 |
EUR | 3,460,000 | | Lorca Telecom Bondco, 4.0%, 9/18/27 (144A) | 4,121,772 |
| 1,496,000 | | Millicom International Cellular SA, 6.25%, | |
| | | 3/25/29 (144A) | 1,596,980 |
| 4,425,000 | | MTN Mauritius Investment, Ltd., 6.5%, 10/13/26 (144A) | 4,906,759 |
| 3,745,000 | | Windstream Escrow LLC/Windstream Escrow | |
| | | Finance Corp., 7.75%, 8/15/28 (144A) | 3,679,463 |
| | | Total Telecommunications | $ 47,090,376 |
| | | Transportation — 0.1% | |
| 6,290,000 | | Western Global Airlines LLC, 10.375%, 8/15/25 (144A) | $ 6,415,800 |
| | | Total Transportation | $ 6,415,800 |
| | | TOTAL CORPORATE BONDS | |
| | | (Cost $1,854,814,793) | $1,909,143,146 |
| | | FOREIGN GOVERNMENT BONDS — 4.8% of | |
| | | Net Assets | |
| | | Albania — 0.1% | |
EUR | 3,975,000 | | Albania Government International Bond, 3.5%, | |
| | | 6/16/27 (144A) | $ 4,774,352 |
| | | Total Albania | $ 4,774,352 |
| | | Argentina — 0.3% | |
| 5,955,800(e) | | Argentine Republic Government International | |
| | | Bond, 0.125%, 7/9/35 | $ 2,239,381 |
| 351,880 | | Argentine Republic Government International Bond, | |
| | | 1.0%, 7/9/29 | 160,457 |
| 8,500,000 | | Ciudad Autonoma De Buenos Aires, 7.5%, | |
| | | 6/1/27 (144A) | 6,035,000 |
| 726,648 | | Province of Salta Argentina, 9.5%, 3/16/22 (144A) | 654,003 |
| | | Total Argentina | $ 9,088,841 |
| | | Bahrain — 0.3% | |
| 7,000,000 | | Bahrain Government International Bond, 5.625%, | |
| | | 9/30/31 (144A) | $ 6,821,902 |
| 5,010,000 | | Bahrain Government International Bond, 7.0%, | |
| | | 10/12/28 (144A) | 5,457,989 |
| | | Total Bahrain | $ 12,279,891 |
| | | Colombia — 0.1% | |
| 4,800,000 | | Colombia Government International Bond, | |
| | | 3.125%, 4/15/31 | $ 4,924,848 |
| | | Total Colombia | $ 4,924,848 |
The accompanying notes are an integral part of these financial statements.
Pioneer Strategic Income Fund | Annual Report | 9/30/20 51
Schedule of Investments | 9/30/20 (continued)
| | | | | |
| Principal | | | |
| Amount | | | |
| USD ($) | | | Value |
| | | Dominican Republic — 0.2% | |
| 11,136,000 | | Dominican Republic International Bond, 4.875%, | |
| | | 9/23/32 (144A) | $ 11,074,752 |
| | | Total Dominican Republic | $ 11,074,752 |
| | | Egypt — 0.6% | |
EGP | 197,044,000
| | Egypt Government Bond, 15.7%, 11/7/27 | $ 13,118,745 |
EUR | 5,000,000 | | Egypt Government International Bond, 4.75%, | |
| | | 4/11/25 (144A) | 5,703,268 |
| 5,560,000 | | Egypt Government International Bond, 7.053%, | |
| | | 1/15/32 (144A) | 5,295,900 |
| 2,000,000 | | Egypt Government International Bond, 8.875%, | |
| | | 5/29/50 (144A) | 1,979,120 |
| | | Total Egypt | $ 26,097,033 |
| | | Ghana — 0.4% | |
| 4,780,000 | | Ghana Government International Bond, 7.875%, | |
| | | 2/11/35 (144A) | $ 4,024,282 |
GHS | 66,450,000 | | Republic of Ghana Government Bonds, | |
| | | 20.75%, 1/16/23 | 11,720,593 |
| | | Total Ghana | $ 15,744,875 |
| | | Indonesia — 0.3% | |
IDR
| 219,632,000,000
| | Indonesia Treasury Bond, 6.125%, 5/15/28 | $ 14,199,327 |
| | | Total Indonesia | $ 14,199,327 |
| | | Ivory Coast — 0.1% | |
EUR | 3,270,000 | | Ivory Coast Government International Bond, 5.875%, | |
| | | 10/17/31 (144A) | $ 3,462,938 |
| 2,500,000 | | Ivory Coast Government International Bond, 6.125%, | |
| | | 6/15/33 (144A) | 2,335,350 |
| | | Total Ivory Coast | $ 5,798,288 |
| | | Mexico — 0.9% | |
MXN
| 594,140,000
| | Mexican Bonos, 8.5%, 5/31/29 | $ 31,770,315 |
| 3,210,000 | | Mexico Government International Bond, 3.9%, 4/27/25 | 3,508,530 |
| 4,200,000 | | Mexico Government International Bond, 5.0%, 4/27/51 | 4,704,000 |
| | | Total Mexico | $ 39,982,845 |
| | | Panama — 0.1% | |
| 5,575,000 | | Panama Government International Bond, | |
| | | 2.252%, 9/29/32 | $ 5,616,813 |
| | | Total Panama | $ 5,616,813 |
| | | Peru — 0.0%† | |
| 2,175,000 | | Peruvian Government International Bond, | |
| | | 2.783%, 1/23/31 | $ 2,350,088 |
| | | Total Peru | $ 2,350,088 |
The accompanying notes are an integral part of these financial statements.
52 Pioneer Strategic Income Fund | Annual Report | 9/30/20
| | | | | |
| Principal | | | |
| Amount | | | |
| USD ($) | | | Value |
| | | Philippines — 0.2% | |
EUR | 2,650,000 | | Philippine Government International Bond, | |
| | | 0.7%, 2/3/29 | $ 3,027,638 |
| 2,200,000 | | Philippine Government International Bond, | |
| | | 2.95%, 5/5/45 | 2,326,431 |
| 1,490,000 | | Philippine Government International Bond, | |
| | | 5.0%, 1/13/37 | 1,940,033 |
| | | Total Philippines | $ 7,294,102 |
| | | Russia — 0.4% | |
RUB | 25,000 | | Russian Federal Bond - OFZ, 7.6%, 7/20/22 | $ 338 |
RUB
| 1,326,346,000
| | Russian Federal Bond - OFZ, 8.15%, 2/3/27 | 19,245,160 |
| | | Total Russia | $ 19,245,498 |
| | | Trinidad — 0.1% | |
| 4,440,000 | | Trinidad & Tobago Government International | |
| | | Bond, 4.5%, 6/26/30 (144A) | $ 4,357,860 |
| | | Total Trinidad | $ 4,357,860 |
| | | Tunisia — 0.1% | |
EUR | 3,250,000 | | Banque Centrale de Tunisie International Bond, | |
| | | 6.375%, 7/15/26 (144A) | $ 3,424,087 |
| | | Total Tunisia | $ 3,424,087 |
| | | Ukraine — 0.3% | |
EUR | 4,490,000 | | Ukraine Government International Bond, 4.375%, | |
| | | 1/27/30 (144A) | $ 4,285,396 |
| 9,575,000 | | Ukraine Government International Bond, 7.375%, | |
| | | 9/25/32 (144A) | 8,978,477 |
| | | Total Ukraine | $ 13,263,873 |
| | | Uruguay — 0.3% | |
UYU | 476,113,000
| | Uruguay Government International Bond, 9.875%, | |
| | | 6/20/22 (144A) | $ 11,696,952 |
| | | Total Uruguay | $ 11,696,952 |
| | | TOTAL FOREIGN GOVERNMENT BONDS | |
| | | (Cost $225,142,046) | $ 211,214,325 |
| | | INSURANCE-LINKED SECURITIES — 3.2% of | |
| | | Net Assets# | |
| | | Event-Linked Bonds — 0.5% | |
| | | Earthquakes – California — 0.0%† | |
| 1,800,000(c) | | Ursa Re, 5.847% (3 Month U.S. Treasury Bill + | |
| | | 575 bps), 12/10/22 (144A) | $ 1,798,920 |
| | | Earthquakes – Chile — 0.0%† | |
| 1,950,000(c) | | International Bank for Reconstruction & Development, | |
| | | 2.58% (3 Month USD LIBOR + 250 bps), 2/15/21 (144A) | $ 1,942,200 |
The accompanying notes are an integral part of these financial statements.
Pioneer Strategic Income Fund | Annual Report | 9/30/20 53
Schedule of Investments | 9/30/20 (continued)
| | | | |
| Principal | | | |
| Amount | | | |
| USD ($) | | | Value |
| | Earthquakes – Colombia — 0.0%† | |
| 1,550,000(c) | | International Bank for Reconstruction & Development, | |
| | 3.08% (3 Month USD LIBOR + 300 bps), | |
| | 2/15/21 (144A) | $ 1,543,490 |
| | Earthquakes – Mexico — 0.0%† | |
| 250,000(c) | | International Bank for Reconstruction & Development, | |
| | 3.669% (3 Month USD LIBOR + 350 bps), | |
| | 3/13/24 (144A) | $ 249,725 |
| | Earthquakes – U.S. — 0.0%† | |
| 1,000,000(c) | | Acorn Re, 2.821% (3 Month USD LIBOR + 275 bps), | |
| | 11/10/21 (144A) | $ 1,000,500 |
| | Health – U.S. — 0.0%† | |
| 500,000(c) | | Vitality Re VIII, 1.847% (3 Month U.S. Treasury Bill + | |
| | 175 bps), 1/8/21 (144A) | $ 497,000 |
| 1,500,000(c) | | Vitality Re X, 1.847% (3 Month U.S. Treasury Bill + | |
| | 175 bps), 1/10/23 (144A) | 1,491,750 |
| | | $ 1,988,750 |
| | Multiperil – Europe — 0.0%† | |
EUR | 1,500,000+(c)
| | Lion II Re, 3.57% (3 Month EURIBOR + 357 bps), | |
| | 7/15/21 (144A) | $ 1,744,693 |
| | Multiperil – Florida — 0.0%† | |
| 250,000(c) | | Sanders Re II, 5.5% (3 Month U.S. Treasury Bill + | |
| | 550 bps), 6/7/23 (144A) | $ 254,900 |
| | Multiperil – U.S. — 0.2% | |
| 3,000,000(c) | | Residential Reinsurance 2016, 4.177% (3 Month U.S. | |
| | Treasury Bill + 408 bps), 12/6/20 (144A) | $ 3,000,600 |
| 1,000,000(c) | | Residential Reinsurance 2016, 5.697% (3 Month U.S. | |
| | Treasury Bill + 560 bps), 12/6/20 (144A) | 1,001,900 |
| 250,000(c) | | Sanders Re, 2.975% (6 Month USD LIBOR + 293 bps), | |
| | 12/6/21 (144A) | 246,600 |
| | | $ 4,249,100 |
| | Multiperil – U.S. & Canada — 0.0%† | |
| 1,000,000(c) | | Hypatia, 9.847% (3 Month U.S. Treasury Bill + | |
| | 975 bps), 6/7/23 (144A) | $ 1,046,500 |
| 500,000(c) | | Mona Lisa Re, 8.094% (3 Month U.S. Treasury Bill + | |
| | 800 bps), 1/9/23 (144A) | 508,250 |
| | | $ 1,554,750 |
| | Multiperil – U.S. Regional — 0.1% | |
| 2,600,000(c) | | Longpoint Re III, 2.847% (3 Month U.S. Treasury Bill + | |
| | 275 bps), 6/1/22 (144A) | $ 2,600,260 |
| | Multiperil – Worldwide — 0.1% | |
| 2,000,000(c) | | Galilei Re, 5.924% (6 Month USD LIBOR + 588 bps), | |
| | 1/8/21 (144A) | $ 2,001,000 |
The accompanying notes are an integral part of these financial statements.
54 Pioneer Strategic Income Fund | Annual Report | 9/30/20
| | | | |
| Principal | | | |
| Amount | | | |
| USD ($) | | | Value |
| | Pandemic – U.S. — 0.0%† | |
| 500,000(c) | | Vitality Re XI, 1.897% (3 Month U.S. Treasury Bill + | |
| | 180 bps), 1/9/24 (144A) | $ 496,000 |
| | Pandemic – Worldwide — 0.0%† | |
| 750,000(c) | | Vita Capital VI, 3.084% (6 Month USD LIBOR + | |
| | 290 bps), 1/8/21 (144A) | $ 637,500 |
| | Windstorm – Europe — 0.0%† | |
EUR
| 250,000
| | Windmill II Re, 7/5/24 (144A) | $ 291,866 |
| | Windstorm – U.S. Regional — 0.1% | |
| 1,250,000 | | Matterhorn Re, 12/7/21 (144A) | $ 1,131,500 |
| 250,000(c) | | Matterhorn Re, 7.094% (3 Month U.S. Treasury Bill + | |
| | 700 bps), 12/7/21 (144A) | 254,875 |
| 1,250,000(c) | | Matterhorn Re, 10.094% (3 Month U.S. Treasury Bill + | |
| | 1,000 bps), 12/7/21 (144A) | 1,267,500 |
| 250,000 | | Matterhorn Re, 12/7/20 (144A) | 243,125 |
| | | 2,897,000 |
| | Total Event-Linked Bonds | $ 25,250,654 |
| Face | | | |
| Amount | | | |
| USD ($) | | | |
| | Collateralized Reinsurance — 0.7% | |
| | Earthquakes – California — 0.1% | |
| 2,000,000+(a)(i) | | Adare Re 2020, 1/31/21 | $ 2,085,340 |
| | Multiperil – Massachusetts — 0.1% | |
| 2,537,500+(i) | | Denning Re 2019, 7/31/21 | $ 2,606,552 |
| | Multiperil – U.S. — 0.2% | |
| 6,000,000+(a)(i) | | Ballybunion Re, 2/28/21 | $ 6,112,200 |
| 600,000+(a)(i) | | Dingle Re 2019, 2/1/21 | 612,315 |
| 550,000+(a)(i) | | Dingle Re 2020, 1/31/21 | 558,296 |
| 1,150,000+(a)(i) | | Port Royal Re 2019, 5/31/21 | 1,162,983 |
| | | $ 8,445,794 |
| | Multiperil – U.S. & Canada — 0.1% | |
| 2,000,000+(a)(i) | | Leven Re 2020, 1/31/21 | $ 2,014,328 |
| | Multiperil – U.S. Regional — 0.0%† | |
| 2,000,000+(a)(i) | | Ailsa Re 2019, 6/30/21 | $ 2,049,800 |
| | Multiperil – Worldwide — 0.0%† | |
| 12,000+(i) | | Limestone Re 2016-1, 8/31/21 | $ 35 |
| 86,000+(i) | | Limestone Re 2016-1, 8/31/21 | 249 |
| 140,000+(a)(i) | | Limestone Re 2019-2, 3/1/23 (144A) | 244,160 |
| 20,000+(i) | | Limestone Re 2019-B, 9/9/22 (144A) | 42,884 |
| 1,020,000+(a)(i) | | Limestone Re 2020-1, 3/1/24 (144A) | 1,050,804 |
| 480,000+(a)(i) | | Limestone Re 2020-1B, 3/1/24 (144A) | 494,496 |
The accompanying notes are an integral part of these financial statements.
Pioneer Strategic Income Fund | Annual Report | 9/30/20 55
Schedule of Investments | 9/30/20 (continued)
| | | | |
| Face | | | |
| Amount | | | |
| USD ($) | | | Value |
| | | Multiperil – Worldwide — (continued) | |
| 1,110,000+(a)(i) | | Limestone Re 2020-2, 10/1/24 (144A) | $ 1,127,871 |
| 700,000+(a)(i) | | Old Head Re 2020, 12/31/20 | 665,850 |
| 4,500,000+(a)(i) | | Resilience Re, 4/6/21 (144A) | 450 |
| 850,864+(a)(i) | | Seminole Re 2018, 1/15/21 | 25,252 |
| 608,616+(a)(i) | | Walton Health Re 2018, 6/15/21 | 289,093 |
| 300,000+(a)(i) | | Walton Health Re 2019, 6/30/21 | 300,728 |
| | | | $ 4,241,872 |
| | | Windstorm – Florida — 0.2% | |
| 2,250,000+(i) | | Cedar Re 2020, 6/30/24 | $ 2,219,872 |
| 1,750,000+(a)(i) | | Formby Re 2018, 2/28/21 | 309,603 |
| 2,200,000+(a)(i) | | Portrush Re 2017, 6/15/21 | 1,403,820 |
| | | | $ 3,933,295 |
| | | Windstorm – North Carolina — 0.0%† | |
| 2,000,000+(i) | | Isosceles Re 2020, 4/30/22 | $ 1,989,800 |
| | | Windstorm – U.S. Multistate — 0.0%† | |
| 1,500,000+(i) | | White Heron Re 2020, 6/30/24 | $ 1,479,999 |
| | | Windstorm – U.S. Regional — 0.0%† | |
| 1,000,000+(i) | | Liphook Re 2020, 6/30/24 | $ 994,195 |
| 1,250,000+(a)(i) | | Oakmont Re 2017, 4/30/21 | 36,750 |
| 1,900,000+(a)(i) | | Oakmont Re 2019, 4/30/21 | 1,315,393 |
| | | | 2,346,338 |
| | | Total Collateralized Reinsurance | $ 31,193,118 |
| | | Industry Loss Warranties — 0.1% | |
| | | Windstorm – U.S. — 0.1% | |
| 3,500,000+(i) | | Thaxted Park Re 2020, 12/10/21 | $ 3,513,051 |
| | | Total Industry Loss Warranties | $ 3,513,051 |
| | | Reinsurance Sidecars — 1.9% | |
| | | Multiperil – U.S. — 0.1% | |
| 10,188,000+(a)(i) | | Carnoustie Re 2017, 11/30/21 | $ 1,342,779 |
| 1,000,000+(i) | | Carnoustie Re 2019, 12/31/22 | 1,900 |
| 2,800,000+(a)(i) | | Castle Stuart Re 2018, 12/1/21 | 488,842 |
| 3,000,000+(a)(j) | | Harambee Re 2018, 12/31/21 | 33,600 |
| 5,000,000+(j) | | Harambee Re 2019, 12/31/22 | 57,500 |
| 3,000,000+(a)(j) | | Harambee Re 2020, 12/31/23 | 3,183,900 |
| | | | $ 5,108,521 |
| | | Multiperil – Worldwide — 1.8% | |
| 2,201+(i) | | Alturas Re 2019-1, 3/10/23 (144A) | $ 10,806 |
| 33,410+(i) | | Alturas Re 2019-2, 3/10/22 | 178,286 |
| 550,000+(a)(i) | | Alturas Re 2020-1B, 3/10/23 (144A) | 466,345 |
| 3,000,000+(a)(i) | | Alturas Re 2020-2, 3/10/23 | 3,327,000 |
The accompanying notes are an integral part of these financial statements.
56 Pioneer Strategic Income Fund | Annual Report | 9/30/20
| | | | |
| Face | | | |
| Amount | | | |
| USD ($) | | | Value |
| | Multiperil – Worldwide — (continued) | |
| 250,000+(a)(j) | | Alturas Re 2020-3, 9/30/24 | $ 261,075 |
| 4,000,000+(a)(i) | | Bantry Re 2016, 3/31/21 | 322,400 |
| 3,000,000+(a)(i) | | Bantry Re 2017, 3/31/21 | 708,300 |
| 2,500,000+(a)(i) | | Bantry Re 2018, 12/31/21 | 28,500 |
| 4,000,000+(i) | | Bantry Re 2019, 12/31/22 | 135,855 |
| 3,821,406+(a)(i) | | Bantry Re 2020, 12/31/20 | 4,081,483 |
| 3,605,000+(a)(i) | | Berwick Re 2017-1, 2/1/21 | 119,325 |
| 13,924,181+(a)(i) | | Berwick Re 2018-1, 12/31/21 | 1,694,573 |
| 9,947,951+(a)(i) | | Berwick Re 2019-1, 12/31/22 | 1,188,780 |
| 2,000,000+(a)(i) | | Berwick Re 2020-1, 12/31/23 | 2,145,649 |
| 1,750,000+(j) | | Blue Lotus Re, 12/31/21 | 76,475 |
| 1,750,000+(a)(i) | | Carnoustie Re 2020, 12/31/23 | 1,880,095 |
| 155,000+(i) | | Eden Re II, 3/22/22 (144A) | 100,732 |
| 232,500+(i) | | Eden Re II, 3/22/22 (144A) | 145,460 |
| 73,625+(a)(i) | | Eden Re II, 3/22/23 (144A) | 614,938 |
| 7,000,000+(a)(i) | | Eden Re II, 3/22/24 (144A) | 7,770,000 |
| 6,500,000+(a)(i) | | Gleneagles Re 2016, 11/30/20 | 202,800 |
| 1,500,000+(a)(i) | | Gleneagles Re 2018, 12/31/21 | 177,450 |
| 1,156,688+(i) | | Gleneagles Re 2019, 12/31/22 | 25,849 |
| 1,270,798+(a)(i) | | Gleneagles Re 2020, 12/31/23 | 1,355,306 |
| 2,737,878+(a)(i) | | Gullane Re 2018, 12/31/21 | 2,802,902 |
| 7,000+(i) | | Limestone Re 2018, 3/1/22 | 239,236 |
| 500,000+(j) | | Lion Rock Re 2019, 1/31/21 | 39,100 |
| 500,000+(a)(i) | | Lion Rock Re 2020, 1/31/21 | 555,500 |
| 6,000,000+(a)(j) | | Lorenz Re 2018, 7/1/21 | 164,400 |
| 2,545,246+(a)(j) | | Lorenz Re 2019, 6/30/22 | 246,125 |
| 1,282,713+(a)(j) | | Lorenz Re 2020, 6/30/23 | 1,365,961 |
| 1,717,287+(a)(i) | | Lorenz Re 2020, 6/30/23 | 1,828,739 |
| 8,500,000+(a)(i) | | Merion Re 2018-2, 12/31/21 | 9,158,750 |
| 6,150,000+(i) | | Pangaea Re 2016-2, 11/30/20 | 10,967 |
| 4,750,000+(a)(i) | | Pangaea Re 2018-1, 12/31/21 | 100,009 |
| 7,100,000+(a)(i) | | Pangaea Re 2018-3, 7/1/22 | 147,278 |
| 3,891,425+(a)(i) | | Pangaea Re 2019-1, 2/1/23 | 81,087 |
| 5,220,725+(a)(i) | | Pangaea Re 2019-3, 7/1/23 | 187,794 |
| 3,850,570+(a)(i) | | Pangaea Re 2020-1, 2/1/24 | 4,156,067 |
| 3,500,000+(a)(i) | | Pangaea Re 2020-3, 7/1/24 | 3,618,206 |
| 540,031+(a)(i) | | Sector Re V, 12/1/23 (144A) | 186,799 |
| 1,800,000+(a)(i) | | Sector Re V, 12/1/23 (144A) | 600,939 |
| 3,608+(i) | | Sector Re V, 3/1/24 (144A) | 95,306 |
| 360,000+(a)(i) | | Sector Re V, 3/1/24 (144A) | 151,677 |
| 1,500,000+(a)(i) | | Sector Re V, 12/1/24 (144A) | 1,576,876 |
| 1,559,969+(a)(i) | | Sector Re V, 12/1/24 (144A) | 1,639,919 |
| 540,000+(a)(i) | | Sector Re V, 3/1/25 (144A) | 582,152 |
The accompanying notes are an integral part of these financial statements.
Pioneer Strategic Income Fund | Annual Report | 9/30/20 57
Schedule of Investments | 9/30/20 (continued)
| | | | |
| Face | | | |
| Amount | | | |
| USD ($) | | | Value |
| | | Multiperil – Worldwide — (continued) | |
| 710,000+(a)(i) | | Sector Re V, 3/1/25 (144A) | $ 765,422 |
| 1,696,451+(a)(i) | | Sector Re V, 3/1/25 (144A) | 1,777,356 |
| 5,855,000+(a)(i) | | St. Andrews Re 2017-1, 2/1/21 | 396,969 |
| 2,606,976+(a)(i) | | St. Andrews Re 2017-4, 6/1/21 | 256,526 |
| 3,609,700+(a)(i) | | Sussex Re 2020-1, 12/31/22 | 3,833,502 |
| 1,000,000+(a)(j) | | Thopas Re 2018, 12/31/21 | — |
| 3,000,000+(a)(j) | | Thopas Re 2019, 12/31/22 | 447,600 |
| 4,000,000+(a)(j) | | Thopas Re 2020, 12/31/23 | 4,287,200 |
| 5,750,000+(a)(i) | | Versutus Re 2017, 11/30/21 | — |
| 3,000,000+(a)(i) | | Versutus Re 2018, 12/31/21 | 57,000 |
| 2,647,642+(i) | | Versutus Re 2019-A, 12/31/21 | 118,350 |
| 852,358+(i) | | Versutus Re 2019-B, 12/31/21 | 38,100 |
| 1,250,000+(a)(j) | | Viribus Re 2018, 12/31/21 | 45,500 |
| 3,650,000+(j) | | Viribus Re 2019, 12/31/22 | 146,365 |
| 4,139,570+(a)(j) | | Viribus Re 2020, 12/31/23 | 4,111,007 |
| 1,826,168+(a)(i) | | Woburn Re 2018, 12/31/21 | 168,255 |
| 3,539,362+(a)(i) | | Woburn Re 2019, 12/31/22 | 1,206,006 |
| | | | 74,208,429 |
| | | Total Reinsurance Sidecars | $ 79,316,950 |
| | | TOTAL INSURANCE-LINKED SECURITIES | |
| | | (Cost $140,044,334) | $ 139,273,773 |
| Principal | | | |
| Amount | | | |
| USD ($) | | | |
| | | MUNICIPAL BONDS — 0.3% of Net Assets(k) | |
| | | Municipal General Obligation — 0.2% | |
| 13,525,000(l)(m) | | Commonwealth of Puerto Rico, 8.0%, 7/1/35 | $ 8,520,750 |
| | | Total Municipal General Obligation | $ 8,520,750 |
| | | Municipal Higher Education — 0.1% | |
| 2,300,000 | | Trustees of Amherst College, 3.794%, 11/1/42 | $ 2,596,073 |
| | | Total Municipal Higher Education | $ 2,596,073 |
| | | TOTAL MUNICIPAL BONDS | |
| | | (Cost $11,476,936) | $ 11,116,823 |
| | | SENIOR SECURED FLOATING RATE LOAN | |
| | INTERESTS — 2.2% of Net Assets*(c) | |
| | | Aerospace & Defense — 0.0%† | |
| 342,763 | | United Airlines, Inc., Refinanced Term Loan, 1.895% | |
| | | (LIBOR + 175 bps), 4/1/24 | $ 321,341 |
| | | Total Aerospace & Defense | $ 321,341 |
The accompanying notes are an integral part of these financial statements.
58 Pioneer Strategic Income Fund | Annual Report | 9/30/20
| | | | |
| Principal | | | |
| Amount | | | |
| USD ($) | | | Value |
| | Automobile — 0.1% | |
| 1,633,257 | | American Axle & Manufacturing, Inc., Tranche B | |
| | Term Loan, 3.0% (LIBOR + 225 bps), 4/6/24 | $ 1,572,593 |
| 692,289 | | CWGS Group LLC (aka Camping World, Inc.), Term | |
| | Loan, 3.5% (LIBOR + 275 bps), 11/8/23 | 675,847 |
| 2,543,936 | | Navistar, Inc., Tranche B Term Loan, 3.66% (LIBOR + | |
| | 350 bps), 11/6/24 | 2,530,023 |
| | Total Automobile | $ 4,778,463 |
| | Beverage, Food & Tobacco — 0.1% | |
| 3,990,959 | | JBS USA Lux SA (fka JBS USA LLC), New Term Loan, | |
| | 2.147% (LIBOR + 200 bps), 5/1/26 | $ 3,903,657 |
| | Total Beverage, Food & Tobacco | $ 3,903,657 |
| | Buildings & Real Estate — 0.1% | |
| 94,838 | | Builders FirstSource, Inc., Refinancing Term Loan, | |
| | 4.0% (LIBOR + 300 bps), 2/29/24 | $ 93,613 |
| 2,029,104 | | WireCo WorldGroup, Inc. (WireCo WorldGroup | |
| | Finance LP), First Lien Initial Term Loan, 6.0% (LIBOR + | |
| | 500 bps), 9/29/23 | 1,775,677 |
| | Total Buildings & Real Estate | $ 1,869,290 |
| | Computers & Electronics — 0.0%† | |
| 1,406,696 | | Energy Acquisition LP (aka Electrical Components | |
| | International), First Lien Initial Term Loan, | |
| | 4.397% (LIBOR + 425 bps), 6/26/25 | $ 1,269,544 |
| | Total Computers & Electronics | $ 1,269,544 |
| | Construction & Building — 0.1% | |
| 2,072,261 | | Quikrete Holdings, Inc., First Lien Initial Term Loan, | |
| | 2.647% (LIBOR + 250 bps), 2/1/27 | $ 2,027,902 |
| | Total Construction & Building | $ 2,027,902 |
| | Diversified & Conglomerate Manufacturing — 0.0%† | |
| 1,285,413 | | Pelican Products, Inc., First Lien Term Loan, 4.5% | |
| | (LIBOR + 350 bps), 5/1/25 | $ 1,232,925 |
| | Total Diversified & Conglomerate Manufacturing | $ 1,232,925 |
| | Diversified & Conglomerate Service — 0.1% | |
| 2,332,250 | | DynCorp International, Inc., Term Loan, 7.0% | |
| | (LIBOR + 600 bps), 8/18/25 | $ 2,320,589 |
| 2,148,156 | | Gates Global LLC, Initial B-2 Dollar Term Loan, 3.75% | |
| | (LIBOR + 275 bps), 4/1/24 | 2,120,858 |
| 565,894 | | Intrado Corp., Initial Term B Loan, 5.0% (LIBOR + | |
| | 400 bps), 10/10/24 | 517,591 |
| | Total Diversified & Conglomerate Service | $ 4,959,038 |
| | Electronics — 0.2% | |
| 7,801,588 | | Scientific Games International, Inc., Initial Term B-5 | |
| | Loan, 3.471% (LIBOR + 275 bps), 8/14/24 | $ 7,379,327 |
| | Total Electronics | $ 7,379,327 |
The accompanying notes are an integral part of these financial statements.
Pioneer Strategic Income Fund | Annual Report | 9/30/20 59
Schedule of Investments | 9/30/20 (continued)
| | | | |
| Principal | | | |
| Amount | | | |
| USD ($) | | | Value |
| | | Entertainment & Leisure — 0.1% | |
| 3,810,247 | | Sabre GLBL, Inc. (fka Sabre, Inc.), 2018 Other | |
| | | Term B Loan, 2.147% (LIBOR + 200 bps), 2/22/24 | $ 3,587,984 |
| | | Total Entertainment & Leisure | $ 3,587,984 |
| | | Foreign Government — 0.3% | |
| 12,950,000 | | Government of the Commonwealth of The Bahamas, | |
| | | Term Loan, 5.815% (LIBOR + 550 bps), 8/19/21 | $ 12,691,000 |
| | | Total Foreign Government | $ 12,691,000 |
| | | Healthcare & Pharmaceuticals — 0.2% | |
| 3,623,656 | | Alphabet Holding Co., Inc. (aka Nature’s Bounty), | |
| | First Lien Initial Term Loan, 3.647% (LIBOR + | |
| | | 350 bps), 9/26/24 | $ 3,536,688 |
| 2,346,188 | | Endo Luxembourg Finance Co. I S.a r.l., Initial Term | |
| | | Loan, 5.0% (LIBOR + 425 bps), 4/29/24 | 2,248,570 |
| | | Total Healthcare & Pharmaceuticals | $ 5,785,258 |
| | Healthcare, Education & Childcare — 0.3% | |
| 3,191,976 | | Alliance HealthCare Services, Inc., First Lien Initial Term | |
| | | Loan, 5.5% (LIBOR + 450 bps), 10/24/23 | $ 2,452,500 |
| 1,791,965 | | KUEHG Corp. (fka KC MergerSub, Inc.) (aka KinderCare), | |
| | | Term B-3 Loan, 4.75% (LIBOR + 375 bps), 2/21/25 | 1,644,128 |
| 8,216,182 | | LifePoint Health, Inc. (fka Regionalcare Hospital | |
| | | Partners Holdings, Inc.), First Lien Term B Loan, 3.897% | |
| | | (LIBOR + 375 bps), 11/16/25 | 7,998,782 |
| 1,712,315 | | Select Medical Corp., Tranche B Term Loan, 2.78% | |
| | | (LIBOR + 250 bps), 3/6/25 | 1,673,521 |
| | | Total Healthcare, Education & Childcare | $ 13,768,931 |
| | | Insurance — 0.2% | |
| 479,608 | | Alliant Holdings Intermediate LLC, Initial Term Loan, | |
| | | 2.897% (LIBOR + 275 bps), 5/9/25 | $ 466,689 |
| 6,841,994 | | Confie Seguros Holding II Co., Term B Loan, 5.75% | |
| | | (LIBOR + 475 bps), 4/19/22 | 6,632,458 |
| | | Total Insurance | $ 7,099,147 |
| | | Leisure & Entertainment — 0.0%† | |
| 4,412,764(I) | | 24 Hour Fitness Worldwide, Inc., Term Loan, 3.647% | |
| | | (LIBOR + 350 bps), 5/30/25 | $ 167,685 |
| 2,711,800 | | Fitness International LLC, Term B Loan, 4.25% (LIBOR + | |
| | | 325 bps), 4/18/25 | 1,684,028 |
| | | Total Leisure & Entertainment | $ 1,851,713 |
| | | Machinery — 0.2% | |
| 4,839,458 | | NN, Inc., Tranche B Term Loan, 6.5% (LIBOR + | |
| | | 575 bps), 10/19/22 | $ 4,789,249 |
| 2,114,267 | | Shape Technologies Group, Inc., Initial Term Loan, | |
| | | 3.151% (LIBOR + 300 bps), 4/21/25 | 1,606,843 |
The accompanying notes are an integral part of these financial statements.
60 Pioneer Strategic Income Fund | Annual Report | 9/30/20
| | | | |
| Principal | | | |
| Amount | | | |
| USD ($) | | | Value |
| | Machinery — (continued) | |
| 1,553,913 | | Terex Corp., Incremental US Term Loan, 2.75% | |
| | (LIBOR + 200 bps), 1/31/24 | $ 1,507,296 |
| | Total Machinery | $ 7,903,388 |
| | Metals & Mining — 0.1% | |
| 2,510,480 | | BWay Holding Co., Initial Term Loan, 3.523% (LIBOR + | |
| | 325 bps), 4/3/24 | $ 2,376,325 |
| | Total Metals & Mining | $ 2,376,325 |
| | Retail — 0.1% | |
| 5,659,455 | | Bass Pro Group LLC, Initial Term Loan, 5.75% (LIBOR + | |
| | 500 bps), 9/25/24 | $ 5,626,557 |
| 1,382,500 | | Staples, Inc., 2019 Refinancing New Term B-2 Loan, | |
| | 4.751% (LIBOR + 450 bps), 9/12/24 | 1,305,598 |
| | Total Retail | $ 6,932,155 |
| | Securities & Trusts — 0.0%† | |
| 1,496,742 | | Stonepeak Lonestar Holdings LLC, Initial Term Loan, | |
| | 4.773% (LIBOR + 450 bps), 10/19/26 | $ 1,478,032 |
| | Total Securities & Trusts | $ 1,478,032 |
| | TOTAL SENIOR SECURED FLOATING RATE | |
| | LOAN INTERESTS | |
| | (Cost $98,068,825) | $ 91,215,420 |
| | U.S. GOVERNMENT AND AGENCY | |
| | OBLIGATIONS — 14.9% of Net Assets | |
| 17,750,000 | | Fannie Mae, 1.5%, 10/1/35 (TBA) | $ 18,161,856 |
| 6,930,000 | | Fannie Mae, 2.0%, 11/1/35 (TBA) | 7,202,041 |
| 27,160,000 | | Fannie Mae, 2.0%, 11/1/50 (TBA) | 28,033,752 |
| 6,900,000 | | Fannie Mae, 2.5%, 10/1/50 (TBA) | 7,237,723 |
| 474,385 | | Fannie Mae, 3.0%, 3/1/43 | 515,003 |
| 200,659 | | Fannie Mae, 3.0%, 4/1/45 | 219,959 |
| 112,758 | | Fannie Mae, 3.0%, 5/1/46 | 119,846 |
| 1,133,865 | | Fannie Mae, 3.0%, 5/1/46 | 1,230,582 |
| 119,025 | | Fannie Mae, 3.0%, 10/1/46 | 126,536 |
| 210,261 | | Fannie Mae, 3.0%, 11/1/46 | 221,419 |
| 328,123 | | Fannie Mae, 3.0%, 11/1/46 | 351,011 |
| 71,733 | | Fannie Mae, 3.0%, 1/1/47 | 76,260 |
| 20,187 | | Fannie Mae, 3.0%, 3/1/47 | 22,130 |
| 67,338 | | Fannie Mae, 3.0%, 3/1/47 | 73,231 |
| 462,230 | | Fannie Mae, 3.0%, 3/1/47 | 486,464 |
| 297,961 | | Fannie Mae, 3.0%, 4/1/48 | 326,500 |
| 2,904,260 | | Fannie Mae, 3.0%, 5/1/48 | 3,111,724 |
| 15,446,000 | | Fannie Mae, 3.0%, 10/1/48 (TBA) | 16,180,590 |
| 391,859 | | Fannie Mae, 3.0%, 7/1/49 | 424,909 |
| 564,638 | | Fannie Mae, 3.0%, 7/1/49 | 618,699 |
| 1,119,181 | | Fannie Mae, 3.0%, 9/1/49 | 1,226,333 |
The accompanying notes are an integral part of these financial statements.
Pioneer Strategic Income Fund | Annual Report | 9/30/20 61
Schedule of Investments | 9/30/20 (continued)
| | | | |
| Principal | | | |
| Amount | | | |
| USD ($) | | | Value |
| | U.S. GOVERNMENT AND AGENCY | |
| | OBLIGATIONS — (continued) | |
| 2,967,753 | | Fannie Mae, 3.5%, 7/1/42 | $ 3,217,150 |
| 6,102,712 | | Fannie Mae, 3.5%, 6/1/45 | 6,591,102 |
| 1,830,636 | | Fannie Mae, 3.5%, 9/1/45 | 2,036,684 |
| 6,611,406 | | Fannie Mae, 3.5%, 9/1/45 | 7,190,680 |
| 1,151,781 | | Fannie Mae, 3.5%, 6/1/46 | 1,270,320 |
| 870,017 | | Fannie Mae, 3.5%, 9/1/46 | 968,016 |
| 516,530 | | Fannie Mae, 3.5%, 10/1/46 | 558,857 |
| 289,089 | | Fannie Mae, 3.5%, 7/1/47 | 309,764 |
| 1,293,623 | | Fannie Mae, 3.5%, 4/1/50 | 1,363,626 |
| 53,184,000 | | Fannie Mae, 3.5%, 10/1/50 (TBA) | 56,073,802 |
| 7,115 | | Fannie Mae, 4.0%, 12/1/23 | 7,575 |
| 6,529 | | Fannie Mae, 4.0%, 12/1/30 | 7,119 |
| 470,879 | | Fannie Mae, 4.0%, 9/1/37 | 517,084 |
| 6,292,077 | | Fannie Mae, 4.0%, 10/1/40 | 7,169,958 |
| 2,686,151 | | Fannie Mae, 4.0%, 12/1/40 | 3,058,304 |
| 5,099 | | Fannie Mae, 4.0%, 11/1/41 | 5,631 |
| 1,033,386 | | Fannie Mae, 4.0%, 11/1/41 | 1,141,382 |
| 35,166 | | Fannie Mae, 4.0%, 12/1/41 | 38,690 |
| 1,303,117 | | Fannie Mae, 4.0%, 12/1/41 | 1,418,600 |
| 7,631,014 | | Fannie Mae, 4.0%, 12/1/41 | 8,417,801 |
| 1,024,148 | | Fannie Mae, 4.0%, 1/1/42 | 1,130,541 |
| 2,880,364 | | Fannie Mae, 4.0%, 1/1/42 | 3,183,506 |
| 1,063,450 | | Fannie Mae, 4.0%, 2/1/42 | 1,171,324 |
| 1,984,719 | | Fannie Mae, 4.0%, 2/1/42 | 2,181,409 |
| 205,939 | | Fannie Mae, 4.0%, 4/1/42 | 220,614 |
| 1,648,821 | | Fannie Mae, 4.0%, 4/1/42 | 1,821,089 |
| 2,913,864 | | Fannie Mae, 4.0%, 4/1/42 | 3,220,285 |
| 150,658 | | Fannie Mae, 4.0%, 5/1/42 | 164,738 |
| 3,221,071 | | Fannie Mae, 4.0%, 5/1/42 | 3,505,076 |
| 168,854 | | Fannie Mae, 4.0%, 6/1/42 | 186,526 |
| 80,882 | | Fannie Mae, 4.0%, 7/1/42 | 89,394 |
| 5,501,134 | | Fannie Mae, 4.0%, 8/1/42 | 6,065,577 |
| 144,537 | | Fannie Mae, 4.0%, 10/1/42 | 162,315 |
| 161,532 | | Fannie Mae, 4.0%, 11/1/42 | 172,271 |
| 1,741,598 | | Fannie Mae, 4.0%, 8/1/43 | 1,926,567 |
| 1,000,338 | | Fannie Mae, 4.0%, 11/1/43 | 1,122,966 |
| 1,114,341 | | Fannie Mae, 4.0%, 2/1/44 | 1,250,813 |
| 96,316 | | Fannie Mae, 4.0%, 6/1/44 | 102,838 |
| 231,727 | | Fannie Mae, 4.0%, 10/1/44 | 247,721 |
| 128,586 | | Fannie Mae, 4.0%, 11/1/44 | 137,122 |
| 40,310 | | Fannie Mae, 4.0%, 6/1/45 | 43,336 |
| 150,166 | | Fannie Mae, 4.0%, 7/1/45 | 166,081 |
The accompanying notes are an integral part of these financial statements.
62 Pioneer Strategic Income Fund | Annual Report | 9/30/20
| | | | |
| Principal | | | |
| Amount | | | |
| USD ($) | | | Value |
| | U.S. GOVERNMENT AND AGENCY | |
| | OBLIGATIONS — (continued) | |
| 3,136,651 | | Fannie Mae, 4.0%, 4/1/47 | $ 3,430,137 |
| 4,137,380 | | Fannie Mae, 4.0%, 4/1/47 | 4,509,155 |
| 464,013 | | Fannie Mae, 4.0%, 6/1/47 | 507,526 |
| 1,162,738 | | Fannie Mae, 4.0%, 6/1/47 | 1,255,486 |
| 2,334,687 | | Fannie Mae, 4.0%, 7/1/47 | 2,544,312 |
| 125,130 | | Fannie Mae, 4.0%, 6/1/49 | 140,327 |
| 74,622 | | Fannie Mae, 4.5%, 8/1/40 | 83,655 |
| 2,535,461 | | Fannie Mae, 4.5%, 11/1/40 | 2,851,750 |
| 6,677,817 | | Fannie Mae, 4.5%, 12/1/40 | 7,513,397 |
| 310,466 | | Fannie Mae, 4.5%, 3/1/41 | 349,281 |
| 703,824 | | Fannie Mae, 4.5%, 3/1/41 | 791,101 |
| 6,840 | | Fannie Mae, 4.5%, 4/1/41 | 7,672 |
| 1,586,218 | | Fannie Mae, 4.5%, 5/1/41 | 1,761,364 |
| 3,166,805 | | Fannie Mae, 4.5%, 5/1/41 | 3,577,566 |
| 1,382,621 | | Fannie Mae, 4.5%, 7/1/41 | 1,556,263 |
| 6,005,970 | | Fannie Mae, 4.5%, 8/1/41 | 6,758,208 |
| 310,529 | | Fannie Mae, 4.5%, 9/1/41 | 349,537 |
| 18,503 | | Fannie Mae, 4.5%, 12/1/41 | 20,118 |
| 3,541,397 | | Fannie Mae, 4.5%, 9/1/43 | 3,968,042 |
| 1,479,862 | | Fannie Mae, 4.5%, 11/1/43 | 1,635,227 |
| 1,924,228 | | Fannie Mae, 4.5%, 2/1/44 | 2,124,957 |
| 2,258,227 | | Fannie Mae, 4.5%, 2/1/44 | 2,519,191 |
| 2,700,842 | | Fannie Mae, 4.5%, 2/1/44 | 3,019,264 |
| 598,430 | | Fannie Mae, 4.5%, 1/1/47 | 657,988 |
| 19,641 | | Fannie Mae, 5.0%, 2/1/22 | 20,681 |
| 1,473 | | Fannie Mae, 5.0%, 4/1/22 | 1,551 |
| 4,081 | | Fannie Mae, 5.0%, 6/1/22 | 4,297 |
| 4,631 | | Fannie Mae, 5.0%, 6/1/22 | 4,876 |
| 1,743,636 | | Fannie Mae, 5.0%, 6/1/35 | 2,003,159 |
| 468,381 | | Fannie Mae, 5.0%, 7/1/35 | 534,362 |
| 1,000,045 | | Fannie Mae, 5.0%, 7/1/35 | 1,149,074 |
| 552,405 | | Fannie Mae, 5.0%, 8/1/35 | 634,615 |
| 186,620 | | Fannie Mae, 5.0%, 5/1/38 | 214,487 |
| 609,701 | | Fannie Mae, 5.0%, 1/1/39 | 698,983 |
| 146,616 | | Fannie Mae, 5.0%, 7/1/39 | 165,266 |
| 373,779 | | Fannie Mae, 5.0%, 7/1/39 | 429,943 |
| 392,042 | | Fannie Mae, 5.0%, 7/1/39 | 449,251 |
| 131,700 | | Fannie Mae, 5.0%, 6/1/40 | 151,547 |
| 1,060,304 | | Fannie Mae, 5.0%, 6/1/40 | 1,220,339 |
| 751,745 | | Fannie Mae, 5.0%, 7/1/40 | 865,450 |
| 297,140 | | Fannie Mae, 5.0%, 10/1/40 | 342,339 |
| 217,273 | | Fannie Mae, 5.0%, 5/1/41 | 250,329 |
The accompanying notes are an integral part of these financial statements.
Pioneer Strategic Income Fund | Annual Report | 9/30/20 63
Schedule of Investments | 9/30/20 (continued)
| | | | |
| Principal | | | |
| Amount | | | |
| USD ($) | | | Value |
| | U.S. GOVERNMENT AND AGENCY | |
| | OBLIGATIONS — (continued) | |
| 185,082 | | Fannie Mae, 5.0%, 7/1/41 | $ 211,959 |
| 177,241 | | Fannie Mae, 5.0%, 12/1/41 | 198,785 |
| 4,844,405 | | Fannie Mae, 5.0%, 9/1/43 | 5,393,057 |
| 13,309,137 | | Fannie Mae, 5.0%, 11/1/44 | 15,301,827 |
| 318 | | Fannie Mae, 5.5%, 3/1/21 | 318 |
| 6,012 | | Fannie Mae, 5.5%, 5/1/33 | 6,692 |
| 6,278 | | Fannie Mae, 5.5%, 6/1/33 | 7,289 |
| 24,625 | | Fannie Mae, 5.5%, 7/1/33 | 28,738 |
| 47,476 | | Fannie Mae, 5.5%, 4/1/34 | 54,848 |
| 7,631 | | Fannie Mae, 5.5%, 10/1/35 | 8,969 |
| 58,931 | | Fannie Mae, 5.5%, 12/1/35 | 68,360 |
| 43,181 | | Fannie Mae, 5.5%, 3/1/36 | 50,112 |
| 74,405 | | Fannie Mae, 5.5%, 4/1/36 | 82,576 |
| 669 | | Fannie Mae, 6.0%, 3/1/32 | 785 |
| 1,078 | | Fannie Mae, 6.0%, 10/1/32 | 1,268 |
| 3,425 | | Fannie Mae, 6.0%, 11/1/32 | 3,824 |
| 25,906 | | Fannie Mae, 6.0%, 12/1/32 | 29,195 |
| 5,202 | | Fannie Mae, 6.0%, 1/1/33 | 6,137 |
| 2,750 | | Fannie Mae, 6.0%, 3/1/33 | 3,249 |
| 16,339 | | Fannie Mae, 6.0%, 5/1/33 | 18,284 |
| 38,482 | | Fannie Mae, 6.0%, 12/1/33 | 45,569 |
| 36,366 | | Fannie Mae, 6.0%, 1/1/34 | 43,078 |
| 134,799 | | Fannie Mae, 6.0%, 6/1/37 | 157,425 |
| 61,171 | | Fannie Mae, 6.0%, 12/1/37 | 72,048 |
| 99,128 | | Fannie Mae, 6.0%, 4/1/38 | 116,549 |
| 57,779 | | Fannie Mae, 6.0%, 7/1/38 | 65,465 |
| 122 | | Fannie Mae, 6.5%, 4/1/29 | 136 |
| 605 | | Fannie Mae, 6.5%, 5/1/31 | 681 |
| 163 | | Fannie Mae, 6.5%, 6/1/31 | 186 |
| 345 | | Fannie Mae, 6.5%, 2/1/32 | 388 |
| 1,835 | | Fannie Mae, 6.5%, 3/1/32 | 2,052 |
| 1,083 | | Fannie Mae, 6.5%, 8/1/32 | 1,236 |
| 10,897 | | Fannie Mae, 6.5%, 10/1/32 | 12,187 |
| 439 | | Fannie Mae, 7.0%, 5/1/28 | 505 |
| 220 | | Fannie Mae, 7.0%, 2/1/29 | 257 |
| 284 | | Fannie Mae, 7.0%, 7/1/31 | 292 |
| 370 | | Fannie Mae, 7.5%, 1/1/28 | 403 |
| 703,624 | | Federal Home Loan Mortgage Corp., 3.0%, 4/1/43 | 757,987 |
| 206,172 | | Federal Home Loan Mortgage Corp., 3.0%, 10/1/46 | 226,080 |
| 2,873,855 | | Federal Home Loan Mortgage Corp., 3.0%, 2/1/47 | 3,127,856 |
| 788,950 | | Federal Home Loan Mortgage Corp., 3.0%, 4/1/47 | 849,658 |
| 141,667 | | Federal Home Loan Mortgage Corp., 3.0%, 11/1/47 | 154,307 |
The accompanying notes are an integral part of these financial statements.
64 Pioneer Strategic Income Fund | Annual Report | 9/30/20
| | | | |
| Principal | | | |
| Amount | | | |
| USD ($) | | | Value |
| | U.S. GOVERNMENT AND AGENCY | |
| | OBLIGATIONS — (continued) | |
| 3,760,430 | | Federal Home Loan Mortgage Corp., 4.0%, 10/1/42 | $ 4,156,124 |
| 1,850,934 | | Federal Home Loan Mortgage Corp., 4.0%, 4/1/47 | 2,008,893 |
| 2,399,963 | | Federal Home Loan Mortgage Corp., 4.0%, 4/1/47 | 2,591,729 |
| 356,786 | | Federal Home Loan Mortgage Corp., 4.0%, 5/1/49 | 380,592 |
| 178,207 | | Federal Home Loan Mortgage Corp., 4.5%, 10/1/35 | 197,671 |
| 641,122 | | Federal Home Loan Mortgage Corp., 4.5%, 7/1/40 | 719,748 |
| 381,067 | | Federal Home Loan Mortgage Corp., 4.5%, 11/1/40 | 428,150 |
| 62,480 | | Federal Home Loan Mortgage Corp., 4.5%, 9/1/41 | 69,871 |
| 35,119 | | Federal Home Loan Mortgage Corp., 4.5%, 9/1/43 | 39,387 |
| 242,240 | | Federal Home Loan Mortgage Corp., 4.5%, 10/1/43 | 271,955 |
| 884,018 | | Federal Home Loan Mortgage Corp., 4.5%, 11/1/43 | 990,895 |
| 13,695 | | Federal Home Loan Mortgage Corp., 4.5%, 3/1/44 | 15,302 |
| 40,172 | | Federal Home Loan Mortgage Corp., 4.5%, 5/1/44 | 44,933 |
| 12,067 | | Federal Home Loan Mortgage Corp., 5.0%, 12/1/21 | 12,707 |
| 34,631 | | Federal Home Loan Mortgage Corp., 5.0%, 4/1/23 | 36,497 |
| 14,129 | | Federal Home Loan Mortgage Corp., 5.0%, 5/1/34 | 16,237 |
| 19,895 | | Federal Home Loan Mortgage Corp., 5.0%, 11/1/34 | 22,909 |
| 78,651 | | Federal Home Loan Mortgage Corp., 5.0%, 12/1/34 | 90,441 |
| 66,026 | | Federal Home Loan Mortgage Corp., 5.0%, 7/1/35 | 75,382 |
| 139,898 | | Federal Home Loan Mortgage Corp., 5.0%, 9/1/38 | 160,912 |
| 204,672 | | Federal Home Loan Mortgage Corp., 5.0%, 9/1/38 | 235,417 |
| 7,240 | | Federal Home Loan Mortgage Corp., 5.0%, 10/1/38 | 8,327 |
| 833 | | Federal Home Loan Mortgage Corp., 5.0%, 5/1/39 | 950 |
| 3,332,661 | | Federal Home Loan Mortgage Corp., 5.0%, 11/1/39 | 3,838,881 |
| 1,662 | | Federal Home Loan Mortgage Corp., 5.0%, 12/1/39 | 1,915 |
| 1,424,979 | | Federal Home Loan Mortgage Corp., 5.5%, 6/1/41 | 1,657,091 |
| 53,100 | | Federal Home Loan Mortgage Corp., 6.0%, 1/1/33 | 59,255 |
| 2,433 | | Federal Home Loan Mortgage Corp., 6.0%, 3/1/33 | 2,714 |
| 12,719 | | Federal Home Loan Mortgage Corp., 6.0%, 3/1/33 | 14,208 |
| 31,890 | | Federal Home Loan Mortgage Corp., 6.0%, 1/1/34 | 37,813 |
| 39,938 | | Federal Home Loan Mortgage Corp., 6.0%, 8/1/34 | 44,822 |
| 52,722 | | Federal Home Loan Mortgage Corp., 6.0%, 6/1/35 | 58,827 |
| 27,153 | | Federal Home Loan Mortgage Corp., 6.0%, 12/1/36 | 31,187 |
| 2,389 | | Federal Home Loan Mortgage Corp., 6.0%, 10/1/37 | 2,723 |
| 72,022 | | Federal Home Loan Mortgage Corp., 6.0%, 12/1/37 | 84,766 |
| 1,894 | | Federal Home Loan Mortgage Corp., 6.5%, 9/1/32 | 2,119 |
| 1,274,960 | | Government National Mortgage Association I, | |
| | 3.5%, 10/15/42 | 1,345,801 |
| 4,596 | | Government National Mortgage Association I, | |
| | 4.0%, 3/15/39 | 4,951 |
| 5,754 | | Government National Mortgage Association I, | |
| | 4.0%, 4/15/39 | 6,198 |
| 7,791 | | Government National Mortgage Association I, | |
| | 4.0%, 4/15/39 | 8,414 |
The accompanying notes are an integral part of these financial statements.
Pioneer Strategic Income Fund | Annual Report | 9/30/20 65
Schedule of Investments | 9/30/20 (continued)
| | | | |
| Principal | | | |
| Amount | | | |
| USD ($) | | | Value |
| | U.S. GOVERNMENT AND AGENCY | |
| | OBLIGATIONS — (continued) | |
| 9,694 | | Government National Mortgage Association I, | |
| | 4.0%, 7/15/39 | $ 10,420 |
| 7,730 | | Government National Mortgage Association I, | |
| | 4.0%, 1/15/40 | 8,293 |
| 121,576 | | Government National Mortgage Association I, | |
| | 4.0%, 4/15/40 | 130,907 |
| 228,194 | | Government National Mortgage Association I, | |
| | 4.0%, 7/15/40 | 244,547 |
| 81,104 | | Government National Mortgage Association I, | |
| | 4.0%, 8/15/40 | 88,017 |
| 148,604 | | Government National Mortgage Association I, | |
| | 4.0%, 8/15/40 | 159,921 |
| 35,094 | | Government National Mortgage Association I, | |
| | 4.0%, 9/15/40 | 37,686 |
| 7,119 | | Government National Mortgage Association I, | |
| | 4.0%, 10/15/40 | 7,759 |
| 12,402 | | Government National Mortgage Association I, | |
| | 4.0%, 10/15/40 | 13,262 |
| 43,998 | | Government National Mortgage Association I, | |
| | 4.0%, 10/15/40 | 47,887 |
| 5,575 | | Government National Mortgage Association I, | |
| | 4.0%, 11/15/40 | 5,979 |
| 42,266 | | Government National Mortgage Association I, | |
| | 4.0%, 11/15/40 | 45,555 |
| 143,318 | | Government National Mortgage Association I, | |
| | 4.0%, 11/15/40 | 155,627 |
| 212,114 | | Government National Mortgage Association I, | |
| | 4.0%, 11/15/40 | 230,321 |
| 5,346 | | Government National Mortgage Association I, | |
| | 4.0%, 12/15/40 | 5,734 |
| 6,103 | | Government National Mortgage Association I, | |
| | 4.0%, 12/15/40 | 6,593 |
| 98,843 | | Government National Mortgage Association I, | |
| | 4.0%, 12/15/40 | 104,423 |
| 488,912 | | Government National Mortgage Association I, | |
| | 4.0%, 12/15/40 | 524,838 |
| 5,016 | | Government National Mortgage Association I, | |
| | 4.0%, 1/15/41 | 5,442 |
| 28,332 | | Government National Mortgage Association I, | |
| | 4.0%, 1/15/41 | 30,828 |
| 44,315 | | Government National Mortgage Association I, | |
| | 4.0%, 1/15/41 | 48,035 |
| 12,399 | | Government National Mortgage Association I, | |
| | 4.0%, 2/15/41 | 13,480 |
| 570,649 | | Government National Mortgage Association I, | |
| | 4.0%, 2/15/41 | 619,805 |
The accompanying notes are an integral part of these financial statements.
66 Pioneer Strategic Income Fund | Annual Report | 9/30/20
| | | | |
| Principal | | | |
| Amount | | | |
| USD ($) | | | Value |
| | U.S. GOVERNMENT AND AGENCY | |
| | OBLIGATIONS — (continued) | |
| 46,250 | | Government National Mortgage Association I, | |
| | 4.0%, 3/15/41 | $ 50,202 |
| 7,538 | | Government National Mortgage Association I, | |
| | 4.0%, 4/15/41 | 8,149 |
| 5,004 | | Government National Mortgage Association I, | |
| | 4.0%, 5/15/41 | 5,289 |
| 46,685 | | Government National Mortgage Association I, | |
| | 4.0%, 5/15/41 | 49,323 |
| 49,452 | | Government National Mortgage Association I, | |
| | 4.0%, 5/15/41 | 53,277 |
| 2,340 | | Government National Mortgage Association I, | |
| | 4.0%, 6/15/41 | 2,502 |
| 4,753 | | Government National Mortgage Association I, | |
| | 4.0%, 6/15/41 | 5,059 |
| 1,196,627 | | Government National Mortgage Association I, | |
| | 4.0%, 6/15/41 | 1,296,892 |
| 7,010 | | Government National Mortgage Association I, | |
| | 4.0%, 7/15/41 | 7,564 |
| 10,438 | | Government National Mortgage Association I, | |
| | 4.0%, 7/15/41 | 11,350 |
| 28,277 | | Government National Mortgage Association I, | |
| | 4.0%, 7/15/41 | 30,769 |
| 64,942 | | Government National Mortgage Association I, | |
| | 4.0%, 7/15/41 | 69,948 |
| 120,381 | | Government National Mortgage Association I, | |
| | 4.0%, 7/15/41 | 130,110 |
| 124,677 | | Government National Mortgage Association I, | |
| | 4.0%, 7/15/41 | 135,037 |
| 8,785 | | Government National Mortgage Association I, | |
| | 4.0%, 8/15/41 | 9,553 |
| 9,138 | | Government National Mortgage Association I, | |
| | 4.0%, 8/15/41 | 9,665 |
| 55,373 | | Government National Mortgage Association I, | |
| | 4.0%, 8/15/41 | 59,351 |
| 3,376 | | Government National Mortgage Association I, | |
| | 4.0%, 9/15/41 | 3,583 |
| 4,782 | | Government National Mortgage Association I, | |
| | 4.0%, 9/15/41 | 5,205 |
| 7,203 | | Government National Mortgage Association I, | |
| | 4.0%, 9/15/41 | 7,765 |
| 7,375 | | Government National Mortgage Association I, | |
| | 4.0%, 9/15/41 | 8,025 |
| 24,921 | | Government National Mortgage Association I, | |
| | 4.0%, 9/15/41 | 27,103 |
| 34,790 | | Government National Mortgage Association I, | |
| | 4.0%, 9/15/41 | 37,819 |
The accompanying notes are an integral part of these financial statements.
Pioneer Strategic Income Fund | Annual Report | 9/30/20 67
Schedule of Investments | 9/30/20 (continued)
| | | | |
| Principal | | | |
| Amount | | | |
| USD ($) | | | Value |
| | U.S. GOVERNMENT AND AGENCY | |
| | OBLIGATIONS — (continued) | |
| 208,509 | | Government National Mortgage Association I, | |
| | 4.0%, 9/15/41 | $ 225,605 |
| 383,935 | | Government National Mortgage Association I, | |
| | 4.0%, 9/15/41 | 412,202 |
| 3,020 | | Government National Mortgage Association I, | |
| | 4.0%, 10/15/41 | 3,240 |
| 4,663 | | Government National Mortgage Association I, | |
| | 4.0%, 10/15/41 | 4,935 |
| 6,170 | | Government National Mortgage Association I, | |
| | 4.0%, 10/15/41 | 6,519 |
| 8,377 | | Government National Mortgage Association I, | |
| | 4.0%, 10/15/41 | 9,086 |
| 11,369 | | Government National Mortgage Association I, | |
| | 4.0%, 10/15/41 | 12,011 |
| 4,479 | | Government National Mortgage Association I, | |
| | 4.0%, 11/15/41 | 4,734 |
| 5,330 | | Government National Mortgage Association I, | |
| | 4.0%, 11/15/41 | 5,716 |
| 16,815 | | Government National Mortgage Association I, | |
| | 4.0%, 11/15/41 | 18,234 |
| 91,586 | | Government National Mortgage Association I, | |
| | 4.0%, 11/15/41 | 97,208 |
| 6,870 | | Government National Mortgage Association I, | �� |
| | 4.0%, 12/15/41 | 7,477 |
| 9,702 | | Government National Mortgage Association I, | |
| | 4.0%, 12/15/41 | 10,559 |
| 13,097 | | Government National Mortgage Association I, | |
| | 4.0%, 12/15/41 | 13,836 |
| 17,340 | | Government National Mortgage Association I, | |
| | 4.0%, 1/15/42 | 18,319 |
| 735,980 | | Government National Mortgage Association I, | |
| | 4.0%, 1/15/42 | 801,165 |
| 2,089 | | Government National Mortgage Association I, | |
| | 4.0%, 2/15/42 | 2,209 |
| 4,577 | | Government National Mortgage Association I, | |
| | 4.0%, 2/15/42 | 4,910 |
| 10,163 | | Government National Mortgage Association I, | |
| | 4.0%, 2/15/42 | 11,055 |
| 40,071 | | Government National Mortgage Association I, | |
| | 4.0%, 2/15/42 | 42,781 |
| 96,712 | | Government National Mortgage Association I, | |
| | 4.0%, 2/15/42 | 104,450 |
| 1,159,957 | | Government National Mortgage Association I, | |
| | 4.0%, 5/15/42 | 1,261,465 |
| 50,289 | | Government National Mortgage Association I, | |
| | 4.0%, 6/15/42 | 53,850 |
The accompanying notes are an integral part of these financial statements.
68 Pioneer Strategic Income Fund | Annual Report | 9/30/20
| | | | |
| Principal | | | |
| Amount | | | |
| USD ($) | | | Value |
| | U.S. GOVERNMENT AND AGENCY | |
| | OBLIGATIONS — (continued) | |
| 59,971 | | Government National Mortgage Association I, | |
| | 4.0%, 6/15/42 | $ 64,359 |
| 74,592 | | Government National Mortgage Association I, | |
| | 4.0%, 6/15/42 | 81,277 |
| 11,048 | | Government National Mortgage Association I, | |
| | 4.0%, 10/15/42 | 12,003 |
| 4,629 | | Government National Mortgage Association I, | |
| | 4.0%, 11/15/42 | 4,890 |
| 7,749 | | Government National Mortgage Association I, | |
| | 4.0%, 4/15/43 | 8,234 |
| 903,134 | | Government National Mortgage Association I, | |
| | 4.0%, 4/15/43 | 981,537 |
| 4,203 | | Government National Mortgage Association I, | |
| | 4.0%, 5/15/43 | 4,528 |
| 27,670 | | Government National Mortgage Association I, | |
| | 4.0%, 5/15/43 | 29,441 |
| 123,080 | | Government National Mortgage Association I, | |
| | 4.0%, 5/15/43 | 131,011 |
| 43,380 | | Government National Mortgage Association I, | |
| | 4.0%, 6/15/43 | 45,930 |
| 30,189 | | Government National Mortgage Association I, | |
| | 4.0%, 7/15/43 | 31,908 |
| 28,728 | | Government National Mortgage Association I, | |
| | 4.0%, 8/15/43 | 30,495 |
| 335,830 | | Government National Mortgage Association I, | |
| | 4.0%, 8/15/43 | 364,111 |
| 8,740 | | Government National Mortgage Association I, | |
| | 4.0%, 9/15/43 | 9,441 |
| 71,298 | | Government National Mortgage Association I, | |
| | 4.0%, 9/15/43 | 75,946 |
| 3,664 | | Government National Mortgage Association I, | |
| | 4.0%, 10/15/43 | 3,973 |
| 12,753 | | Government National Mortgage Association I, | |
| | 4.0%, 11/15/43 | 13,839 |
| 73,916 | | Government National Mortgage Association I, | |
| | 4.0%, 2/15/44 | 78,263 |
| 53,373 | | Government National Mortgage Association I, | |
| | 4.0%, 3/15/44 | 57,891 |
| 65,643 | | Government National Mortgage Association I, | |
| | 4.0%, 3/15/44 | 69,416 |
| 86,342 | | Government National Mortgage Association I, | |
| | 4.0%, 3/15/44 | 93,927 |
| 115,644 | | Government National Mortgage Association I, | |
| | 4.0%, 3/15/44 | 123,936 |
| 456,869 | | Government National Mortgage Association I, | |
| | 4.0%, 3/15/44 | 496,029 |
The accompanying notes are an integral part of these financial statements.
Pioneer Strategic Income Fund | Annual Report | 9/30/20 69
Schedule of Investments | 9/30/20 (continued)
| | | | |
| Principal | | | |
| Amount | | | |
| USD ($) | | | Value |
| | U.S. GOVERNMENT AND AGENCY | |
| | OBLIGATIONS — (continued) | |
| 1,097,101 | | Government National Mortgage Association I, | |
| | 4.0%, 3/15/44 | $ 1,179,076 |
| 2,379,111 | | Government National Mortgage Association I, | |
| | 4.0%, 3/15/44 | 2,552,569 |
| 7,603 | | Government National Mortgage Association I, | |
| | 4.0%, 4/15/44 | 8,280 |
| 89,511 | | Government National Mortgage Association I, | |
| | 4.0%, 4/15/44 | 97,007 |
| 407,574 | | Government National Mortgage Association I, | |
| | 4.0%, 4/15/44 | 439,382 |
| 814,709 | | Government National Mortgage Association I, | |
| | 4.0%, 4/15/44 | 873,675 |
| 153,514 | | Government National Mortgage Association I, | |
| | 4.0%, 5/15/44 | 166,507 |
| 64,438 | | Government National Mortgage Association I, | |
| | 4.0%, 8/15/44 | 68,402 |
| 98,122 | | Government National Mortgage Association I, | |
| | 4.0%, 8/15/44 | 105,313 |
| 210,259 | | Government National Mortgage Association I, | |
| | 4.0%, 8/15/44 | 228,700 |
| 632,826 | | Government National Mortgage Association I, | |
| | 4.0%, 8/15/44 | 694,730 |
| 732,498 | | Government National Mortgage Association I, | |
| | 4.0%, 8/15/44 | 786,145 |
| 6,207 | | Government National Mortgage Association I, | |
| | 4.0%, 9/15/44 | 6,761 |
| 19,944 | | Government National Mortgage Association I, | |
| | 4.0%, 9/15/44 | 21,070 |
| 58,013 | | Government National Mortgage Association I, | |
| | 4.0%, 9/15/44 | 61,785 |
| 117,935 | | Government National Mortgage Association I, | |
| | 4.0%, 9/15/44 | 128,459 |
| 143,176 | | Government National Mortgage Association I, | |
| | 4.0%, 9/15/44 | 155,395 |
| 205,133 | | Government National Mortgage Association I, | |
| | 4.0%, 9/15/44 | 221,539 |
| 227,793 | | Government National Mortgage Association I, | |
| | 4.0%, 9/15/44 | 246,273 |
| 392,677 | | Government National Mortgage Association I, | |
| | 4.0%, 9/15/44 | 427,430 |
| 467,536 | | Government National Mortgage Association I, | |
| | 4.0%, 9/15/44 | 506,232 |
| 546,108 | | Government National Mortgage Association I, | |
| | 4.0%, 9/15/44 | 579,527 |
| 942,634 | | Government National Mortgage Association I, | |
| | 4.0%, 9/15/44 | 1,011,588 |
The accompanying notes are an integral part of these financial statements.
70 Pioneer Strategic Income Fund | Annual Report | 9/30/20
| | | | |
| Principal | | | |
| Amount | | | |
| USD ($) | | | Value |
| | U.S. GOVERNMENT AND AGENCY | |
| | OBLIGATIONS — (continued) | |
| 1,261,629 | | Government National Mortgage Association I, | |
| | 4.0%, 9/15/44 | $ 1,367,046 |
| 1,662,848 | | Government National Mortgage Association I, | |
| | 4.0%, 9/15/44 | 1,784,349 |
| 2,483,820 | | Government National Mortgage Association I, | |
| | 4.0%, 9/15/44 | 2,668,734 |
| 55,784 | | Government National Mortgage Association I, | |
| | 4.0%, 10/15/44 | 60,679 |
| 70,498 | | Government National Mortgage Association I, | |
| | 4.0%, 10/15/44 | 75,343 |
| 206,914 | | Government National Mortgage Association I, | |
| | 4.0%, 10/15/44 | 218,834 |
| 15,157 | | Government National Mortgage Association I, | |
| | 4.0%, 11/15/44 | 16,493 |
| 24,350 | | Government National Mortgage Association I, | |
| | 4.0%, 11/15/44 | 26,408 |
| 33,351 | | Government National Mortgage Association I, | |
| | 4.0%, 11/15/44 | 35,292 |
| 153,629 | | Government National Mortgage Association I, | |
| | 4.0%, 11/15/44 | 163,561 |
| 3,972 | | Government National Mortgage Association I, | |
| | 4.0%, 12/15/44 | 4,202 |
| 53,086 | | Government National Mortgage Association I, | |
| | 4.0%, 12/15/44 | 57,478 |
| 69,871 | | Government National Mortgage Association I, | |
| | 4.0%, 12/15/44 | 74,951 |
| 189,532 | | Government National Mortgage Association I, | |
| | 4.0%, 12/15/44 | 201,356 |
| 300,025 | | Government National Mortgage Association I, | |
| | 4.0%, 12/15/44 | 319,031 |
| 429,717 | | Government National Mortgage Association I, | |
| | 4.0%, 12/15/44 | 467,648 |
| 61,968 | | Government National Mortgage Association I, | |
| | 4.0%, 1/15/45 | 65,467 |
| 412,591 | | Government National Mortgage Association I, | |
| | 4.0%, 1/15/45 | 442,975 |
| 821,469 | | Government National Mortgage Association I, | |
| | 4.0%, 1/15/45 | 882,088 |
| 844,184 | | Government National Mortgage Association I, | |
| | 4.0%, 1/15/45 | 919,180 |
| 58,878 | | Government National Mortgage Association I, | |
| | 4.0%, 2/15/45 | 62,202 |
| 74,702 | | Government National Mortgage Association I, | |
| | 4.0%, 2/15/45 | 78,948 |
| 133,054 | | Government National Mortgage Association I, | |
| | 4.0%, 2/15/45 | 144,278 |
The accompanying notes are an integral part of these financial statements.
Pioneer Strategic Income Fund | Annual Report | 9/30/20 71
Schedule of Investments | 9/30/20 (continued)
| | | | |
| Principal | | | |
| Amount | | | |
| USD ($) | | | Value |
| | U.S. GOVERNMENT AND AGENCY | |
| | OBLIGATIONS — (continued) | |
| 184,469 | | Government National Mortgage Association I, | |
| | 4.0%, 2/15/45 | $ 196,762 |
| 284,431 | | Government National Mortgage Association I, | |
| | 4.0%, 2/15/45 | 301,154 |
| 767,441 | | Government National Mortgage Association I, | |
| | 4.0%, 2/15/45 | 833,514 |
| 162,946 | | Government National Mortgage Association I, | |
| | 4.0%, 3/15/45 | 172,144 |
| 173,702 | | Government National Mortgage Association I, | |
| | 4.0%, 4/15/45 | 184,606 |
| 101,568 | | Government National Mortgage Association I, | |
| | 4.0%, 5/15/45 | 110,364 |
| 32,620 | | Government National Mortgage Association I, | |
| | 4.0%, 7/15/45 | 35,394 |
| 150,226 | | Government National Mortgage Association I, | |
| | 4.0%, 9/15/45 | 162,822 |
| 109,006 | | Government National Mortgage Association I, | |
| | 4.5%, 9/15/33 | 120,845 |
| 95,485 | | Government National Mortgage Association I, | |
| | 4.5%, 10/15/33 | 106,361 |
| 69,502 | | Government National Mortgage Association I, | |
| | 4.5%, 4/15/35 | 77,137 |
| 841,321 | | Government National Mortgage Association I, | |
| | 4.5%, 3/15/38 | 929,579 |
| 333,839 | | Government National Mortgage Association I, | |
| | 4.5%, 1/15/40 | 372,941 |
| 514,861 | | Government National Mortgage Association I, | |
| | 4.5%, 6/15/40 | 567,988 |
| 195,337 | | Government National Mortgage Association I, | |
| | 4.5%, 9/15/40 | 217,825 |
| 861,666 | | Government National Mortgage Association I, | |
| | 4.5%, 11/15/40 | 958,368 |
| 237,021 | | Government National Mortgage Association I, | |
| | 4.5%, 6/15/41 | 259,654 |
| 874,443 | | Government National Mortgage Association I, | |
| | 4.5%, 6/15/41 | 972,354 |
| 309,991 | | Government National Mortgage Association I, | |
| | 4.5%, 7/15/41 | 344,824 |
| 1,090,688 | | Government National Mortgage Association I, | |
| | 4.5%, 8/15/41 | 1,201,489 |
| 4,921 | | Government National Mortgage Association I, | |
| | 5.0%, 6/15/21 | 5,036 |
| 260,906 | | Government National Mortgage Association I, | |
| | 5.0%, 9/15/33 | 298,615 |
| 160,773 | | Government National Mortgage Association I, | |
| | 5.125%, 10/15/38 | 176,711 |
The accompanying notes are an integral part of these financial statements.
72 Pioneer Strategic Income Fund | Annual Report | 9/30/20
| | | | |
| Principal | | | |
| Amount | | | |
| USD ($) | | | Value |
| | U.S. GOVERNMENT AND AGENCY | |
| | OBLIGATIONS — (continued) | |
| 45,695 | | Government National Mortgage Association I, | |
| | 5.5%, 7/15/33 | $ 53,444 |
| 83,540 | | Government National Mortgage Association I, | |
| | 5.5%, 1/15/34 | 97,069 |
| 63,132 | | Government National Mortgage Association I, | |
| | 5.5%, 4/15/34 | 71,895 |
| 113,624 | | Government National Mortgage Association I, | |
| | 5.5%, 7/15/34 | 130,440 |
| 101,368 | | Government National Mortgage Association I, | |
| | 5.5%, 10/15/34 | 114,188 |
| 71,841 | | Government National Mortgage Association I, | |
| | 5.5%, 1/15/35 | 84,017 |
| 84,747 | | Government National Mortgage Association I, | |
| | 5.5%, 2/15/35 | 93,650 |
| 173,925 | | Government National Mortgage Association I, | |
| | 5.5%, 2/15/35 | 198,662 |
| 51,830 | | Government National Mortgage Association I, | |
| | 5.5%, 6/15/35 | 59,935 |
| 27,132 | | Government National Mortgage Association I, | |
| | 5.5%, 12/15/35 | 29,979 |
| 6 | | Government National Mortgage Association I, | |
| | 5.5%, 2/15/37 | 7 |
| 13,094 | | Government National Mortgage Association I, | |
| | 5.5%, 3/15/37 | 14,569 |
| 50,446 | | Government National Mortgage Association I, | |
| | 5.5%, 3/15/37 | 55,650 |
| 18,126 | | Government National Mortgage Association I, | |
| | 5.75%, 10/15/38 | 20,219 |
| 137,145 | | Government National Mortgage Association I, | |
| | 5.75%, 10/15/38 | 152,201 |
| 69,009 | | Government National Mortgage Association I, | |
| | 6.0%, 8/15/32 | 82,246 |
| 49,592 | | Government National Mortgage Association I, | |
| | 6.0%, 1/15/33 | 59,001 |
| 36,543 | | Government National Mortgage Association I, | |
| | 6.0%, 2/15/33 | 43,188 |
| 65,559 | | Government National Mortgage Association I, | |
| | 6.0%, 2/15/33 | 78,300 |
| 2,508 | | Government National Mortgage Association I, | |
| | 6.0%, 3/15/33 | 2,802 |
| 22,986 | | Government National Mortgage Association I, | |
| | 6.0%, 3/15/33 | 27,136 |
| 48,018 | | Government National Mortgage Association I, | |
| | 6.0%, 3/15/33 | 56,935 |
| 7,779 | | Government National Mortgage Association I, | |
| | 6.0%, 5/15/33 | 8,666 |
The accompanying notes are an integral part of these financial statements.
Pioneer Strategic Income Fund | Annual Report | 9/30/20 73
Schedule of Investments | 9/30/20 (continued)
| | | | |
| Principal | | | |
| Amount | | | |
| USD ($) | | | Value |
| | U.S. GOVERNMENT AND AGENCY | |
| | OBLIGATIONS — (continued) | |
| 92,487 | | Government National Mortgage Association I, | |
| | 6.0%, 5/15/33 | $ 107,303 |
| 161,745 | | Government National Mortgage Association I, | |
| | 6.0%, 5/15/33 | 181,097 |
| 40,905 | | Government National Mortgage Association I, | |
| | 6.0%, 6/15/33 | 48,845 |
| 102,189 | | Government National Mortgage Association I, | |
| | 6.0%, 6/15/33 | 119,950 |
| 44,126 | | Government National Mortgage Association I, | |
| | 6.0%, 7/15/33 | 50,260 |
| 80,331 | | Government National Mortgage Association I, | |
| | 6.0%, 7/15/33 | 94,132 |
| 7,116 | | Government National Mortgage Association I, | |
| | 6.0%, 9/15/33 | 7,918 |
| 19,729 | | Government National Mortgage Association I, | |
| | 6.0%, 9/15/33 | 21,973 |
| 26,499 | | Government National Mortgage Association I, | |
| | 6.0%, 10/15/33 | 29,519 |
| 133,872 | | Government National Mortgage Association I, | |
| | 6.0%, 11/15/33 | 150,177 |
| 30,196 | | Government National Mortgage Association I, | |
| | 6.0%, 1/15/34 | 35,687 |
| 166,034 | | Government National Mortgage Association I, | |
| | 6.0%, 10/15/37 | 196,356 |
| 220,331 | | Government National Mortgage Association I, | |
| | 6.0%, 7/15/38 | 262,753 |
| 5,551 | | Government National Mortgage Association I, | |
| | 6.5%, 1/15/29 | 6,134 |
| 751 | | Government National Mortgage Association I, | |
| | 6.5%, 5/15/29 | 873 |
| 588 | | Government National Mortgage Association I, | |
| | 6.5%, 10/15/31 | 650 |
| 1,132 | | Government National Mortgage Association I, | |
| | 6.5%, 10/15/31 | 1,251 |
| 231 | | Government National Mortgage Association I, | |
| | 6.5%, 12/15/31 | 273 |
| 1,406 | | Government National Mortgage Association I, | |
| | 6.5%, 2/15/32 | 1,618 |
| 787 | | Government National Mortgage Association I, | |
| | 6.5%, 3/15/32 | 913 |
| 3,090 | | Government National Mortgage Association I, | |
| | 6.5%, 5/15/32 | 3,414 |
| 2,617 | | Government National Mortgage Association I, | |
| | 6.5%, 6/15/32 | 2,892 |
| 2,732 | | Government National Mortgage Association I, | |
| | 6.5%, 6/15/32 | 3,101 |
The accompanying notes are an integral part of these financial statements.
74 Pioneer Strategic Income Fund | Annual Report | 9/30/20
| | | | |
| Principal | | | |
| Amount | | | |
| USD ($) | | | Value |
| | U.S. GOVERNMENT AND AGENCY | |
| | OBLIGATIONS — (continued) | |
| 2,585 | | Government National Mortgage Association I, | |
| | 6.5%, 7/15/32 | $ 2,857 |
| 3,962 | | Government National Mortgage Association I, | |
| | 6.5%, 7/15/32 | 4,522 |
| 1,593 | | Government National Mortgage Association I, | |
| | 6.5%, 8/15/32 | 1,825 |
| 1,642 | | Government National Mortgage Association I, | |
| | 6.5%, 8/15/32 | 1,871 |
| 13,744 | | Government National Mortgage Association I, | |
| | 6.5%, 8/15/32 | 15,840 |
| 31,022 | | Government National Mortgage Association I, | |
| | 6.5%, 9/15/32 | 34,281 |
| 38,951 | | Government National Mortgage Association I, | |
| | 6.5%, 9/15/32 | 43,042 |
| 10,570 | | Government National Mortgage Association I, | |
| | 6.5%, 10/15/32 | 11,681 |
| 25,073 | | Government National Mortgage Association I, | |
| | 6.5%, 11/15/32 | 30,081 |
| 20,031 | | Government National Mortgage Association I, | |
| | 6.5%, 7/15/35 | 23,472 |
| 136 | | Government National Mortgage Association I, | |
| | 7.0%, 5/15/29 | 152 |
| 310 | | Government National Mortgage Association I, | |
| | 7.0%, 5/15/29 | 348 |
| 2,973 | | Government National Mortgage Association I, | |
| | 7.0%, 8/15/29 | 2,984 |
| 193 | | Government National Mortgage Association I, | |
| | 7.0%, 5/15/31 | 193 |
| 824,620 | | Government National Mortgage Association II, | |
| | 3.5%, 4/20/45 | 894,752 |
| 1,206,793 | | Government National Mortgage Association II, | |
| | 3.5%, 4/20/45 | 1,325,123 |
| 1,598,102 | | Government National Mortgage Association II, | |
| | 3.5%, 4/20/45 | 1,759,344 |
| 1,924,994 | | Government National Mortgage Association II, | |
| | 3.5%, 3/20/46 | 2,137,855 |
| 5,264,744 | | Government National Mortgage Association II, | |
| | 4.0%, 10/20/46 | 5,664,914 |
| 1,683,577 | | Government National Mortgage Association II, | |
| | 4.0%, 2/20/48 | 1,864,354 |
| 1,966,013 | | Government National Mortgage Association II, | |
| | 4.0%, 4/20/48 | 2,176,785 |
| 271,603 | | Government National Mortgage Association II, | |
| | 4.5%, 12/20/34 | 298,462 |
| 232,648 | | Government National Mortgage Association II, | |
| | 4.5%, 1/20/35 | 258,507 |
| 212,944 | | Government National Mortgage Association II, | |
| | 4.5%, 3/20/35 | 236,555 |
The accompanying notes are an integral part of these financial statements.
Pioneer Strategic Income Fund | Annual Report | 9/30/20 75
Schedule of Investments | 9/30/20 (continued)
| | | | |
| Principal | | | |
| Amount | | | |
| USD ($) | | | Value |
| | U.S. GOVERNMENT AND AGENCY | |
| | OBLIGATIONS — (continued) | |
| 2,034,749 | | Government National Mortgage Association II, | |
| | 4.5%, 9/20/41 | $ 2,259,324 |
| 3,401,913 | | Government National Mortgage Association II, | |
| | 4.5%, 9/20/44 | 3,580,215 |
| 1,371,048 | | Government National Mortgage Association II, | |
| | 4.5%, 10/20/44 | 1,523,099 |
| 2,821,460 | | Government National Mortgage Association II, | |
| | 4.5%, 11/20/44 | 3,134,278 |
| 64,846 | | Government National Mortgage Association II, | |
| | 5.5%, 3/20/34 | 76,916 |
| 2,115 | | Government National Mortgage Association II, | |
| | 5.5%, 10/20/37 | 2,330 |
| 26,274 | | Government National Mortgage Association II, | |
| | 6.0%, 5/20/32 | 29,659 |
| 93,777 | | Government National Mortgage Association II, | |
| | 6.0%, 10/20/33 | 107,911 |
| 122 | | Government National Mortgage Association II, | |
| | 6.5%, 1/20/28 | 138 |
| 2,418 | | Government National Mortgage Association II, | |
| | 7.0%, 1/20/29 | 2,818 |
| 20,000,000(h) | | U.S. Treasury Bills, 10/6/20 | 19,999,816 |
| 35,000,000(h) | | U.S. Treasury Bills, 10/13/20 | 34,999,111 |
| 75,000,000(h) | | U.S. Treasury Bills, 10/22/20 | 74,996,390 |
| 33,693,118 | | U.S. Treasury Inflation Indexed Bonds, 1.0%, 2/15/48 | 46,543,883 |
| 61,928,472 | | U.S. Treasury Inflation Indexed Bonds, 1.0%, 2/15/49 | 86,545,846 |
| 259,000(n) | | U.S. Treasury Notes, 2.25%, 4/30/21 | 262,253 |
| 319,000(n) | | U.S. Treasury Notes, 2.25%, 7/31/21 | 324,645 |
| | TOTAL U.S. GOVERNMENT AND AGENCY OBLIGATIONS | |
| | (Cost $607,314,998) | $ 657,421,671 |
| Shares | | | |
| | RIGHTS/WARRANTS — 0.0%† of Net Assets | |
| | Oil, Gas & Consumable Fuels — 0.0%† | |
| 1,880,020(o) | | ANR, Inc. | $ 5,640 |
| 365(a)(p) | | Contura Energy, Inc. | 110 |
| | Total Oil, Gas & Consumable Fuels | $ 5,750 |
| | TOTAL RIGHTS/WARRANTS | |
| | (Cost $234,627) | $ 5,750 |
The accompanying notes are an integral part of these financial statements.
76 Pioneer Strategic Income Fund | Annual Report | 9/30/20
| | | | | | | | |
| Number of | | | | | Strike | Expiration | |
| Contracts | | Description | Counterparty | Amount
| Price | Date | Value |
| | | OVER THE COUNTER (OTC) CALL OPTIONS | |
| | | PURCHASED — 0.0% | |
| 209,523^(q) | | Desarrolladora | Bank of
| MXN — | 0.01(r) | 10/23/22 | $ — |
| | | Homex | New York | | | | |
| | | SAB de CV | Mellon Corp. | | | | |
| 209,523^(s) | | Desarrolladora | Bank of
| MXN — | 0.01(r) | 10/23/22 | $ — |
| | | Homex | New York | | | | |
| | | SAB de CV | Mellon Corp. | | | | |
| | | | | | | | $ — |
| | | TOTAL OVER THE COUNTER (OTC) CALL OPTIONS | |
| | | PURCHASED | |
| | | (Premiums paid $—) | $ — |
| | | OVER THE COUNTER (OTC) CURRENCY PUT | |
| | | OPTIONS PURCHASED — 0.0%† | | |
| 36,590,000 | | Put EUR | Bank of | USD569,914 | USD1.11
| 3/8/21 | $ 113,429 |
| | | Call USD | America NA | | | | |
| 18,995,500 | | Put EUR | Bank of | EUR314,365 | EUR1.11
| 6/4/21 | 115,657 |
| | | Call USD | America NA | | | | |
| 37,900,000 | | Put EUR | Goldman | EUR305,260 | EUR1.13
| 12/18/20 | 100,147 |
| | | Call USD | Sachs | | | | |
| | | | International | | | | |
| 44,170,000 | | Put USD | JPMorgan | USD462,107 | USD101.10
| 2/3/21
| 288,828 |
| | | Call JPY | Chase | | | | |
| | | | Bank NA | | | | |
| | | | | | | | $ 618,061 |
| | | TOTAL OVER THE COUNTER (OTC) CURRENCY PUT | |
| | | OPTIONS PURCHASED | |
| | | (Premiums paid $1,651,645)
| $ 618,061 |
| | | TOTAL OPTIONS PURCHASED | |
| | | (Premiums paid $1,651,645) | $ 618,061 |
| | | TOTAL INVESTMENTS IN UNAFFILIATED ISSUERS — 100.8% | |
| | | (Cost $4,385,938,525) | $4,430,774,952 |
The accompanying notes are an integral part of these financial statements.
Pioneer Strategic Income Fund | Annual Report | 9/30/20 77
Schedule of Investments | 9/30/20 (continued)
| | | | | | | |
| Number of | | | | Strike | Expiration | |
| Contracts | | Description | Counterparty | Amount
| Price
| Date | Value |
| | OVER THE COUNTER (OTC) CURRENCY CALL | |
| | OPTIONS WRITTEN — (0.0)%† | |
| (36,590,000) | | Call EUR | Bank of | USD569,914 | USD1.20 | 3/8/21 | $ (402,087) |
| | | Put USD | America NA | | | |
| (18,995,500) | | Call EUR | Bank of | EUR314,365 | EUR1.17 | 6/4/21 | (567,692) |
| | | Put USD | America NA | | | |
| (37,900,000) | | Call EUR | Goldman | EUR305,260 | EUR1.20 | 12/18/20 | (318,206) |
| | | Put USD | Sachs | | | |
| | | | International | | | |
| (44,170,000) | | Call USD | JPMorgan | USD462,107 | USD107.94 | 2/3/21
| (290,639) |
| | Put JPY | Chase | | | |
| | | Bank NA | | | |
| | | | | | $ (1,578,624) |
| | TOTAL OVER THE COUNTER (OTC) CURRENCY CALL | |
| | OPTIONS WRITTEN | | |
| | (Premiums received $(1,651,645)) | | $ (1,578,624) |
| | OTHER ASSETS AND LIABILITIES — (0.8)% | | $ (29,236,480) |
| | NET ASSETS — 100.0% | | $4,399,959,848 |
| | |
bps | Basis Points. |
BADLARPP | Argentine Deposit Rate Badlar Private Banks 30-35 Days. |
CMT | Constant Maturity Treasury Index. |
EURIBOR | Euro Interbank Offered Rate. |
FREMF | Freddie Mac Multifamily Fixed-Rate Mortgage Loans. |
FRESB | Freddie Mac Multifamily SB Certificates. |
LIBOR | London Interbank Offered Rate. |
REIT | Real Estate Investment Trust. |
REMICS | Real Estate Mortgage Investment Conduits. |
SOFRRATE | Secured Overnight Financing Rate. |
(144A) | Security is exempt from registration under Rule 144A of the Securities Act of 1933. Such securities may be resold normally to qualified institutional buyers in a transaction exempt from registration. At September 30, 2020, the value of these securities amounted to $2,262,890,238, or 51.5% of net assets. |
(TBA) | “To Be Announced” Securities. |
† | Amount rounds to less than 0.1%. |
* | Senior secured floating rate loan interests in which the Fund invests generally pay interest at rates that are periodically redetermined by reference to a base lending rate plus a premium. These base lending rates are generally (i) the lending rate offered by one or more major European banks, such as LIBOR, (ii) the prime rate offered by one or more major United States banks, (iii) the rate of a certificate of deposit or (iv) other base lending rates used by commercial lenders. The interest rate shown is the rate accruing at September 30, 2020. |
+ | Security that used significant unobservable inputs to determine its value. |
^ | Security is valued using fair value methods (other than supplied by independent pricing services). |
The accompanying notes are an integral part of these financial statements.
78 Pioneer Strategic Income Fund | Annual Report | 9/30/20
| | |
(a) | Non-income producing security. |
(b) | Security is perpetual in nature and has no stated maturity date. |
(c) | Floating rate note. Coupon rate, reference index and spread shown at September 30, 2020. |
(d) | The interest rate is subject to change periodically. The interest rate and/or reference index and spread shown at September 30, 2020. |
(e) | Debt obligation initially issued at one coupon which converts to a higher coupon at a specific date. The rate shown is the rate at September 30, 2020. |
(f) | Security represents the interest-only portion payments on a pool of underlying mortgages or mortgage-backed securities. |
(g) | Payment-in-kind (PIK) security which may pay interest in the form of additional principal amount. |
(h) | Security issued with a zero coupon. Income is recognized through accretion of discount. |
(i) | Issued as participation notes. |
(j) | Issued as preference shares. |
(k) | Consists of Revenue Bonds unless otherwise indicated. |
(l) | Security is in default. |
(m) | Represents a General Obligation Bond. |
(n) | Security is pledged as collateral for derivative contracts. |
(o) | ANR, Inc. warrants are exercisable into 1,880,020 shares. |
(p) | Contura Energy, Inc. warrants are exercisable into 365 shares. |
(q) | Option does not become effective until underlying company’s outstanding common shares reach a market capitalization of MXN 12.5 billion. |
(r) | Strike price is 1 Mexican Peso (MXN). |
(s) | Option does not become effective until underlying company’s outstanding common shares reach a market capitalization of MXN 15.5 billion. |
# | Securities are restricted as to resale. |
| | | | | | | | |
| Restricted Securities | Acquisition date | | Cost | | | Value | |
| Acorn Re | 7/3/2018 | | $ | 998,560 | | | $ | 1,000,500 | |
| Adare Re 2020 | 12/30/2019 | | | 2,009,000 | | | | 2,085,340 | |
| Ailsa Re 2019 | 6/4/2019 | | | 2,000,000 | | | | 2,049,800 | |
| Alturas Re 2019-1 | 12/20/2018 | | | 2,201 | | | | 10,806 | |
| Alturas Re 2019-2 | 12/19/2018 | | | 33,410 | | | | 178,286 | |
| Alturas Re 2020-1B | 1/1/2020 | | | 550,000 | | | | 466,345 | |
| Alturas Re 2020-2 | 12/23/2019 | | | 3,000,000 | | | | 3,327,000 | |
| Alturas Re 2020-3 | 7/1/2020 | | | 250,000 | | | | 261,075 | |
| Ballybunion Re | 12/31/2019 | | | 6,016,157 | | | | 6,112,200 | |
| Bantry Re 2016 | 2/6/2019 | | | 322,400 | | | | 322,400 | |
| Bantry Re 2017 | 2/6/2019 | | | 708,369 | | | | 708,300 | |
| Bantry Re 2018 | 2/6/2019 | | | 28,446 | | | | 28,500 | |
| Bantry Re 2019 | 2/1/2019 | | | — | | | | 135,855 | |
| Bantry Re 2020 | 2/4/2020 | | | 3,821,406 | | | | 4,081,483 | |
| Berwick Re 2017-1 | 1/5/2017 | | | 119,551 | | | | 119,325 | |
| Berwick Re 2018-1 | 1/10/2018 | | | 2,652,765 | | | | 1,694,573 | |
| Berwick Re 2019-1 | 12/31/2018 | | | 1,188,696 | | | | 1,188,780 | |
| Berwick Re 2020-1 | 9/24/2020 | | | 2,000,000 | | | | 2,145,649 | |
| Blue Lotus Re | 12/20/2017 | | | — | | | | 76,475 | |
| Carnoustie Re 2017 | 1/5/2017 | | | 2,422,271 | | | | 1,342,779 | |
| Carnoustie Re 2019 | 12/31/2018 | | | — | | | | 1,900 | |
| Carnoustie Re 2020 | 7/16/2020 | | | 1,750,000 | | | | 1,880,095 | |
| Castle Stuart Re 2018 | 12/20/2017 | | | 927,322 | | | | 488,842 | |
The accompanying notes are an integral part of these financial statements.
Pioneer Strategic Income Fund | Annual Report | 9/30/20 79
Schedule of Investments | 9/30/20 (continued)
| | | | | | | | |
| Restricted Securities | Acquisition date | | Cost | | | Value | |
| Cedar Re 2020 | 7/31/2020 | | $ | 2,147,396 | | | $ | 2,219,872 | |
| Denning Re 2019 | 7/30/2019 | | | 2,488,328 | | | | 2,606,552 | |
| Dingle Re 2019 | 3/4/2019 | | | 547,135 | | | | 612,315 | |
| Dingle Re 2020 | 2/13/2020 | | | 512,325 | | | | 558,296 | |
| Eden Re II | 12/15/2017 | | | 9,263 | | | | 100,732 | |
| Eden Re II | 1/23/2018 | | | 5,374 | | | | 145,460 | |
| Eden Re II | 1/22/2019 | | | 73,625 | | | | 614,938 | |
| Eden Re II | 12/23/2019 | | | 7,000,000 | | | | 7,770,000 | |
| Formby Re 2018 | 7/9/2018 | | | 259,087 | | | | 309,603 | |
| Galilei Re | 1/4/2017 | | | 2,000,000 | | | | 2,001,000 | |
| Gleneagles Re 2016 | 1/14/2016 | | | — | | | | 202,800 | |
| Gleneagles Re 2018 | 12/27/2017 | | | 120,409 | | | | 177,450 | |
| Gleneagles Re 2019 | 12/31/2018 | | | — | | | | 25,849 | |
| Gleneagles Re 2020 | 6/24/2020 | | | 1,270,798 | | | | 1,355,306 | |
| Gullane Re 2018 | 3/26/2018 | | | 2,609,176 | | | | 2,802,902 | |
| Harambee Re 2018 | 12/19/2017 | | | 234,142 | | | | 33,600 | |
| Harambee Re 2019 | 12/20/2018 | | | — | | | | 57,500 | |
| Harambee Re 2020 | 2/27/2020 | | | 3,000,000 | | | | 3,183,900 | |
| Hypatia | 7/10/2020 | | | 1,000,000 | | | | 1,046,500 | |
| International Bank for Reconstruction & | | | | | | | | | |
| Development | 2/28/2020 | | | 250,000 | | | | 249,725 | |
| International Bank for Reconstruction & | | | | | | | | | |
| Development | 2/2/2018 | | | 1,550,000 | | | | 1,543,490 | |
| International Bank for Reconstruction & | | | | | | | | | |
| Development | 2/2/2018 | | | 1,950,000 | | | | 1,942,200 | |
| Isosceles Re 2020 | 6/8/2020 | | | 1,949,563 | | | | 1,989,800 | |
| Leven Re 2020 | 1/29/2020 | | | 1,926,200 | | | | 2,014,328 | |
| Limestone Re 2016-1 | 12/15/2016 | | | 7,096 | | | | 249 | |
| Limestone Re 2016-1 | 12/15/2016 | | | 990 | | | | 35 | |
| Limestone Re 2018 | 6/20/2018 | | | 7,000 | | | | 239,236 | |
| Limestone Re 2019-2 | 6/20/2018 | | | 140,000 | | | | 244,160 | |
| Limestone Re 2019-B | 12/15/2016 | | | 11,622 | | | | 42,884 | |
| Limestone Re 2020-1 | 12/27/2019 | | | 1,020,000 | | | | 1,050,804 | |
| Limestone Re 2020-1B | 12/15/2016 | | | 480,000 | | | | 494,496 | |
| Limestone Re 2020-2 | 6/20/2018 | | | 1,110,000 | | | | 1,127,871 | |
| Lion II Re | 6/21/2017 | | | 1,671,525 | | | | 1,744,693 | |
| Lion Rock Re 2019 | 12/17/2018 | | | — | | | | 39,100 | |
| Lion Rock Re 2020 | 3/27/2020 | | | 500,000 | | | | 555,500 | |
| Liphook Re 2020 | 7/14/2020 | | | 930,606 | | | | 994,195 | |
| Longpoint Re III | 5/17/2018 | | | 2,600,000 | | | | 2,600,260 | |
| Lorenz Re 2018 | 6/26/2018 | | | 1,609,697 | | | | 164,400 | |
| Lorenz Re 2019 | 7/10/2019 | | | 827,959 | | | | 246,125 | |
| Lorenz Re 2020 | 8/11/2020 | | | 1,282,713 | | | | 1,365,961 | |
| Lorenz Re 2020 | 8/12/2020 | | | 1,717,287 | | | | 1,828,739 | |
| Matterhorn Re | 4/30/2020 | | | 242,422 | | | | 243,125 | |
| Matterhorn Re | 4/30/2020 | | | 250,000 | | | | 254,875 | |
| Matterhorn Re | 6/25/2020 | | | 1,106,707 | | | | 1,131,500 | |
| Matterhorn Re | 6/25/2020 | | | 1,250,000 | | | | 1,267,500 | |
| Merion Re 2018-2 | 12/28/2017 | | | 8,500,000 | | | | 9,158,750 | |
| Mona Lisa Re | 12/30/2019 | | | 500,000 | | | | 508,250 | |
| Oakmont Re 2017 | 5/10/2017 | | | — | | | | 36,750 | |
| Oakmont Re 2019 | 5/21/2019 | | | 1,105,182 | | | | 1,315,393 | |
| Old Head Re 2020 | 1/8/2020 | | | 531,409 | | | | 665,850 | |
| Pangaea Re 2016-2 | 5/31/2016 | | | — | | | | 10,967 | |
| Pangaea Re 2018-1 | 12/26/2017 | | | 679,284 | | | | 100,009 | |
| Pangaea Re 2018-3 | 5/31/2018 | | | 1,710,114 | | | | 147,278 | |
| Pangaea Re 2019-1 | 1/9/2019 | | | 40,855 | | | | 81,087 | |
The accompanying notes are an integral part of these financial statements.
80 Pioneer Strategic Income Fund | Annual Report | 9/30/20
| | | | | | | | |
| Restricted Securities | Acquisition date | | Cost | | | Value | |
| Pangaea Re 2019-3 | 7/25/2019 | | $ | 156,622 | | | $ | 187,794 | |
| Pangaea Re 2020-1 | 1/21/2020 | | | 3,850,570 | | | | 4,156,067 | |
| Pangaea Re 2020-3 | 9/15/2020 | | | 3,500,000 | | | | 3,618,206 | |
| Port Royal Re 2019 | 5/20/2019 | | | 1,058,754 | | | | 1,162,983 | |
| Portrush Re 2017 | 6/12/2017 | | | 1,687,366 | | | | 1,403,820 | |
| Residential Reinsurance 2016 | 6/12/2020 | | | 973,434 | | | | 1,001,900 | |
| Residential Reinsurance 2016 | 11/3/2016 | | | 3,000,000 | | | | 3,000,600 | |
| Resilience Re | 4/13/2017 | | | 14,702 | | | | 450 | |
| Sanders Re | 6/12/2020 | | | 240,308 | | | | 246,600 | |
| Sanders Re II | 5/20/2020 | | | 250,000 | | | | 254,900 | |
| Sector Re V | 5/1/2019 | | | 3,608 | | | | 95,306 | |
| Sector Re V | 4/23/2019 | | | 360,000 | | | | 151,677 | |
| Sector Re V | 12/14/2018 | | | 301,611 | | | | 186,799 | |
| Sector Re V | 4/29/2020 | | | 540,000 | | | | 582,152 | |
| Sector Re V | 12/4/2018 | | | 983,649 | | | | 600,939 | |
| Sector Re V | 4/24/2020 | | | 710,000 | | | | 765,422 | |
| Sector Re V | 12/4/2019 | | | 1,500,000 | | | | 1,576,876 | |
| Sector Re V | 1/1/2020 | | | 1,559,969 | | | | 1,639,919 | |
| Sector Re V | 4/29/2020 | | | 1,696,451 | | | | 1,777,356 | |
| Seminole Re 2018 | 1/2/2018 | | | 11,475 | | | | 25,252 | |
| St. Andrews Re 2017-1 | 1/5/2017 | | | 396,667 | | | | 396,969 | |
| St. Andrews Re 2017-4 | 3/31/2017 | | | — | | | | 256,526 | |
| Sussex Re 2020-1 | 1/21/2020 | | | 3,609,700 | | | | 3,833,502 | |
| Thaxted Park Re 2020 | 5/27/2020 | | | 3,404,695 | | | | 3,513,051 | |
| Thopas Re 2018 | 12/12/2017 | | | 160,148 | | | | — | |
| Thopas Re 2019 | 12/21/2018 | | | 511,492 | | | | 447,600 | |
| Thopas Re 2020 | 12/30/2019 | | | 4,000,000 | | | | 4,287,200 | |
| Ursa Re | 11/20/2019 | | | 1,800,000 | | | | 1,798,920 | |
| Versutus Re 2017 | 1/5/2017 | | | 380,886 | | | | — | |
| Versutus Re 2018 | 1/31/2018 | | | 101,888 | | | | 57,000 | |
| Versutus Re 2019-A | 1/28/2019 | | | — | | | | 118,350 | |
| Versutus Re 2019-B | 12/24/2018 | | | — | | | | 38,100 | |
| Viribus Re 2018 | 12/22/2017 | | | 165,421 | | | | 45,500 | |
| Viribus Re 2019 | 12/27/2018 | | | — | | | | 146,365 | |
| Viribus Re 2020 | 3/12/2020 | | | 4,139,570 | | | | 4,111,007 | |
| Vita Capital VI | 2/12/2020 | | | 749,139 | | | | 637,500 | |
| Vitality Re VIII | 2/13/2020 | | | 499,210 | | | | 497,000 | |
| Vitality Re X | 2/3/2020 | | | 1,498,544 | | | | 1,491,750 | |
| Vitality Re XI | 1/31/2020 | | | 496,428 | | | | 496,000 | |
| Walton Health Re 2018 | 6/25/2018 | | | 499,073 | | | | 289,093 | |
| Walton Health Re 2019 | 7/18/2019 | | | 233,724 | | | | 300,728 | |
| White Heron Re 2020 | 7/21/2020 | | | 1,418,565 | | | | 1,479,999 | |
| Windmill II Re | 6/17/2020 | | | 280,450 | | | | 291,866 | |
| Woburn Re 2018 | 3/20/2018 | | | 680,474 | | | | 168,255 | |
Woburn Re 2019 | 1/30/2019 | | | 1,083,898 | | | | 1,206,006 | |
| Total Restricted Securities | | | | | | | $ | 139,273,773 | |
| % of Net assets | | | | | | | | 3.2 | % |
The accompanying notes are an integral part of these financial statements.
Pioneer Strategic Income Fund | Annual Report | 9/30/20 81
Schedule of Investments | 9/30/20 (continued)
FORWARD FOREIGN CURRENCY EXCHANGE CONTRACTS
| | | | | | | | | | | | | | |
| | | | | | | | | | | | Unrealized | |
| Currency | | In
| | Currency | | | | | | Settlement
| | Appreciation | |
| Purchased | | Exchange for
| | Sold | | Deliver | | | Counterparty | Date
| | (Depreciation) | |
NOK | | | 207,511,411 | | EUR | | | (19,308,955 | ) | | Bank of | 10/6/20 | | $ | (425,499 | ) |
| | | | | | | | | | | America NA | | | | | |
NOK | | | 347,582,322 | | USD | | | (38,188,201 | ) | | Bank of | 10/30/20 | | | (997,719 | ) |
| | | | | | | | | | | America NA | | | | | |
SEK | | | 550,489,630 | | USD | | | (63,100,093 | ) | | Bank of | 10/29/20 | | | (1,644,474 | ) |
| | | | | | | | | | | America NA | | | | | |
AUD | | | 63,343,623 | | USD | | | (45,618,620 | ) | | Bank of | 11/27/20 | | | (245,742 | ) |
| | | | | | | | | | | New York | | | | | |
| | | | | | | | | | | Mellon Corp. | | | | | |
CZK | | | 243,205,000 | | USD | | | (10,570,679 | ) | | Citibank NA | 10/29/20 | | | (38,825 | ) |
EUR | | | 64,926,000 | | USD | | | (75,936,833 | ) | | Citibank NA | 11/24/20 | | | 228,148 | |
RUB | | | 715,350,000 | | USD | | | (9,183,206 | ) | | Citibank NA | 11/24/20 | | | (37,367 | ) |
EGP | | | 88,658,254 | | USD | | | (5,476,112 | ) | | Goldman Sachs | 11/30/20 | | | 71,408 | |
| | | | | | | | | | | International | | | | | |
KRW | | | 26,325,549,644 | | USD | | | (22,178,222 | ) | | Goldman Sachs | 12/8/20 | | | 421,370 | |
| | | | | | | | | | | International | | | | | |
SGD | | | 30,238,341 | | USD | | | (22,172,583 | ) | | Goldman Sachs | 12/8/20 | | | (25,177 | ) |
| | | | | | | | | | | International | | | | | |
USD | | | 17,680,221 | | MXN | | | (393,369,277 | ) | | Goldman Sachs | 10/29/20 | | | (50,870 | ) |
| | | | | | | | | | | International | | | | | |
SEK | | | 231,334,943 | | EUR | | | (22,357,462 | ) | | HSBC Bank | 12/3/20 | | | (397,188 | ) |
| | | | | | | | | | | USA NA | | | | | |
USD | | | 3,626,084 | | EUR | | | (3,053,000 | ) | | HSBC Bank | 10/26/20 | | | 46,755 | |
| | | | | | | | | | | USA NA | | | | | |
EUR | | | 8,500,000 | | USD | | | (10,029,646 | ) | | State Street | 11/24/20 | | | (58,258 | ) |
| | | | | | | | | | | Bank & Trust Co. | | | | | |
USD | | | 1,450,823 | | EUR | | | (1,230,000 | ) | | State Street | 10/26/20 | | | 8,774 | |
| | | | | | | | | | | Bank & Trust Co. | | | | | |
USD | | | 47,741,789 | | EUR | | | (40,304,000 | ) | | State Street | 11/24/20 | | | 460,987 | |
| | | | | | | | | | | Bank & Trust Co. | | | | | |
| TOTAL FORWARD FOREIGN CURRENCY EXCHANGE CONTRACTS | | | $ | (2,683,677 | ) |
FUTURES CONTRACTS
FIXED INCOME INTEREST FUTURES CONTRACTS
| | | | | | | | | | | | | |
| Number of | | | | | | | | | | | Unrealized | |
| Contracts | | | Expiration | | Notional | | | Market | | | Appreciation | |
| Long | | Description | Date | | Amount | | | Value | | | (Depreciation) | |
| | 623 | | U.S. 2 Year | 12/31/20 | | $ | 137,602,414 | | | $ | 137,658,664 | | | $ | 56,250 | |
| | | | Note (CBT) | | | | | | | | | | | | | |
| | 205 | | U.S. 10 Year | 12/21/20 | | | 28,578,328 | | | | 28,603,906 | | | | 25,578 | |
| | | | Note (CBT) | | | | | | | | | | | | | |
| | 894 | | U.S. Ultra | 12/21/20 | | | 201,308,945 | | | | 198,300,375 | | | | (3,008,570 | ) |
| | | | Bond (CBT) | | | | | | | | | | | | | |
| | | | | | | $ | 367,489,687 | | | $ | 364,562,945 | | | $ | (2,926,742 | ) |
The accompanying notes are an integral part of these financial statements.
82 Pioneer Strategic Income Fund | Annual Report | 9/30/20
| | | | | | | | | | | | | |
| Number of | | | | | | | | | | | Unrealized | |
| Contracts | | | Expiration | | Notional | | | Market | | | Appreciation | |
| Short | | Description | Date | | Amount | | | Value | | | (Depreciation) | |
| | 1,563 | | Euro-Bobl | 12/8/20 | | $ | 247,512,065 | | | $ | 247,567,011 | | | $ | (54,946 | ) |
| | 589 | | Euro-Bund | 12/8/20 | | | 120,030,974 | | | | 120,451,990 | | | | (421,016 | ) |
| | 2,397 | | U.S. 10 Year | 12/21/20 | | | 383,883,266 | | | | 383,332,734 | | | | 550,532 | |
| | | | Ultra | | | | | | | | | | | | | |
| | 1,230 | | U.S. Long | 12/21/20 | | | 218,421,586 | | | | 216,825,937 | | | | 1,595,649 | |
| | | | Bond (CBT) | | | | | | | | | | | | | |
| | | | | | | $ | 969,847,891 | | | $ | 968,177,672 | | | $ | 1,670,219 | |
| TOTAL FUTURES CONTRACTS | | $ | (602,358,204 | ) | | $ | (603,614,727 | ) | | $ | (1,256,523 | ) |
SWAP CONTRACT
CENTRALLY CLEARED CREDIT DEFAULT SWAP CONTRACT — SELL PROTECTION
| | | | | | | | |
| Annual | | | | |
| Notional | Reference | Pay/ | Fixed | Expiration | Premiums
| Unrealized | Market |
Amount ($)(1) | Obligation/Index | Receive(2) | Rate | Date | (Received) | Appreciation | Value
|
| 173,815,600 | Markit CDX North | Receive | 5.00% | 6/20/25 | $(1,665,733) | $10,737,167
| $9,071,434 |
| America High Yield | | | | | | |
| Index Series 34 | | | | | | |
TOTAL CENTRALLY CLEARED CREDIT DEFAULT
| | | | |
| SWAP CONTRACT – SELL PROTECTION | | $(1,665,733) | $10,737,167
| $9,071,434 |
TOTAL SWAP CONTRACT
| | $(1,665,733) | $10,737,167
| $9,071,434 |
(1) The notional amount is the maximum amount that a seller of credit protection would be obligated to pay upon occurrence of a credit event.
(2) Receives quarterly.
Principal amounts are denominated in U.S. dollars (“USD”) unless otherwise noted.
ARS — Argentine Peso
AUD — Australian Dollar
CZK — Czech Koruna
EGP — Egyptian Pound
EUR — Euro
GHS — Ghanian Cedi
IDR — Indonesian Rupiah
KRW — Korean Won
KZT — Kazakhstan Tenge
MXN — Mexican Peso
NOK — Norwegian Krone
RUB — Russian Ruble
SEK — Swedish Krona
SGD — Singapore Dollar
UYU — Uruguayan Peso
Purchases and sales of securities (excluding temporary cash investments) for the year ended September 30, 2020 were as follows:
| | | | | | | |
| | Purchases | | | Sales | |
Long-Term U.S. Government Securities | | $ | 88,442,677 | | | $ | 514,952,663 | |
Other Long-Term Securities | | $ | 2,894,830,558 | | | $ | 2,839,583,215 | |
The accompanying notes are an integral part of these financial statements.
Pioneer Strategic Income Fund | Annual Report | 9/30/20 83
Schedule of Investments | 9/30/20 (continued)
The Fund is permitted to engage in purchase and sale transactions (“cross trades”) with certain funds and accounts for which Amundi Pioneer Asset Management, Inc. (the “Adviser”) serves as the Fund’s investment adviser, as set forth in Rule 17a-7 under the Investment Company Act of 1940, pursuant to procedures adopted by the Board of Trustees. Under these procedures, cross trades are effected at current market prices. During the year ended September 30, 2020, the Fund engaged in purchases of $3,277,481 and sales of $9,873,748 pursuant to these procedures, which resulted in a net realized gain/(loss) of $205,533.
At September 30, 2020, the net unrealized appreciation on investments based on cost for federal tax purposes of $4,397,667,652 was as follows:
| | | | |
| Aggregate gross unrealized appreciation for all investments in which | | | |
| there is an excess of value over tax cost | | $ | 230,065,721 | |
| Aggregate gross unrealized depreciation for all investments in which | | | | |
| there is an excess of tax cost over value | | | (193,405,811 | ) |
| Net unrealized appreciation | | $ | 36,659,910 | |
Various inputs are used in determining the value of the Fund’s investments. These inputs are summarized in the three broad levels below.
Level 1 – quoted prices in active markets for identical securities.
Level 2 – other significant observable inputs (including quoted prices for similar securities, interest rates, prepayment speeds, credit risks, etc.). See Notes to Financial Statements —Note 1A.
Level 3 – significant unobservable inputs (including the Fund’s own assumptions in determining fair value of investments). See Notes to Financial Statements — Note 1A.
The following is a summary of the inputs used as of September 30, 2020, in valuing the Fund’s investments:
| | | | | | | | | | | | | |
| | Level 1 | | | Level 2 | | | Level 3 | | | Total | |
Common Stocks | | | | | | | | | | | | |
| Oil, Gas & Consumable | | | | | | | | | | | | |
| Fuels | | $ | 3,241 | | | $ | — | | | $ | 286,964 | | | $ | 290,205 | |
| Paper & Forest Products | | | — | | | | 4,071 | | | | — | | | | 4,071 | |
| Specialty Retail | | | — | | | | — | | | | 147,243 | | | | 147,243 | |
| All Other Common | | | | | | | | | | | | | | | | |
| Stocks | | | 145,444 | | | | — | | | | — | | | | 145,444 | |
Convertible Preferred | | | | | | | | | | | | | | | | |
| Stocks | | | 61,977,770 | | | | — | | | | — | | | | 61,977,770 | |
Preferred Stock | | | — | | | | 3,575,000 | | | | — | | | | 3,575,000 | |
Asset Backed Securities | | | — | | | | 514,426,059 | | | | — | | | | 514,426,059 | |
Collateralized Mortgage | | | | | | | | | | | | | | | | |
| Obligations | | | — | | | | 540,417,431 | | | | — | | | | 540,417,431 | |
Commercial Mortgage- | | | | | | | | | | | | | | | | |
| Backed Securities | | | — | | | | 257,247,796 | | | | — | | | | 257,247,796 | |
Convertible Corporate | | | | | | | | | | | | | | | | |
| Bonds | | | — | | | | 32,534,964 | | | | — | | | | 32,534,964 | |
Corporate Bonds | | | — | | | | 1,909,143,146 | | | | — | | | | 1,909,143,146 | |
Foreign Government | | | | | | | | | | | | | | | | |
| Bonds | | | — | | | | 211,214,325 | | | | — | | | | 211,214,325 | |
Insurance-Linked Securities | | | | | | | | | | | | | | | | |
| Event-Linked Bonds | | | | | | | | | | | | | | | | |
| Multiperil – Europe | | | — | | | | — | | | | 1,744,693 | | | | 1,744,693 | |
The accompanying notes are an integral part of these financial statements.
84 Pioneer Strategic Income Fund | Annual Report | 9/30/20
| | | | | | | | | | | | | |
| | Level 1 | | | Level 2 | | | Level 3 | | | Total | |
| Collateralized | | | | | | | | | | | | |
| Reinsurance | | | | | | | | | | | | |
| Earthquakes – California | | $ | — | | | $ | — | | | $ | 2,085,340 | | | $ | 2,085,340 | |
| Multiperil – Massachusetts | | | — | | | | — | | | | 2,606,552 | | | | 2,606,552 | |
| Multiperil – U.S. | | | — | | | | — | | | | 8,445,794 | | | | 8,445,794 | |
| Multiperil – U.S. & Canada | | | — | | | | — | | | | 2,014,328 | | | | 2,014,328 | |
| Multiperil – U.S. Regional | | | — | | | | — | | | | 2,049,800 | | | | 2,049,800 | |
| Multiperil – Worldwide | | | — | | | | — | | | | 4,241,872 | | | | 4,241,872 | |
| Windstorm – Florida | | | — | | | | — | | | | 3,933,295 | | | | 3,933,295 | |
| Windstorm – North | | | | | | | | | | | | | | | | |
| Carolina | | | — | | | | — | | | | 1,989,800 | | | | 1,989,800 | |
| Windstorm – U.S. | | | | | | | | | | | | | | | | |
| Multistate | | | — | | | | — | | | | 1,479,999 | | | | 1,479,999 | |
| Windstorm – U.S. Regional | | | — | | | | — | | | | 2,346,338 | | | | 2,346,338 | |
| Industry Loss Warranties | | | | | | | | | | | | | | | | |
| Windstorm – U.S. | | | — | | | | — | | | | 3,513,051 | | | | 3,513,051 | |
| Reinsurance Sidecars | | | | | | | | | | | | | | | | |
| Multiperil – U.S. | | | — | | | | — | | | | 5,108,521 | | | | 5,108,521 | |
| Multiperil – Worldwide | | | — | | | | — | | | | 74,208,429 | | | | 74,208,429 | |
| All Other Insurance-Linked | | | | | | | | | | | | | | | | |
| Securities | | | — | | | | 23,505,961 | | | | — | | | | 23,505,961 | |
Municipal Bonds | | | — | | | | 11,116,823 | | | | — | | | | 11,116,823 | |
Senior Secured Floating | | | | | | | | | | | | | | | | |
| Rate Loan Interests | | | — | | | | 91,215,420 | | | | — | | | | 91,215,420 | |
U.S. Government and | | | | | | | | | | | | | | | | |
| Agency Obligations | | | — | | | | 657,421,671 | | | | — | | | | 657,421,671 | |
Rights/Warrants | | | — | | | | 5,750 | | | | — | | | | 5,750 | |
Over The Counter (OTC) | | | | | | | | | | | | | | | | |
| Call Options Purchased | | | — | | | | — | * | | | — | | | | — | * |
Over The Counter (OTC) | | | | | | | | | | | | | | | | |
| Currency Put | | | | | | | | | | | | | | | | |
| Options Purchased | | | — | | | | 618,061 | | | | — | | | | 618,061 | |
| Total Investments | | | | | | | | | | | | | | | | |
| in Securities | | $ | 62,126,455 | | | $ | 4,252,446,478 | | | $ | 116,202,019 | | | $ | 4,430,774,952 | |
| Other Financial Instruments | | | | | | | | | | | | | | | | |
Over The Counter (OTC) | | | | | | | | | | | | | | | | |
| Currency Call | | | | | | | | | | | | | | | | |
| Option Written | | $ | — | | | $ | (1,578,624 | ) | | $ | — | | | $ | (1,578,624 | ) |
Net unrealized depreciation | | | | | | | | | | | | | | | | |
| on forward foreign currency | | | | | | | | | | | | | | | | |
| exchange contracts | | | — | | | | (2,683,677 | ) | | | — | | | | (2,683,677 | ) |
Net unrealized depreciation | | | | | | | | | | | | | | | | |
| on futures contracts | | | (1,256,523 | ) | | | — | | | | — | | | | (1,256,523 | ) |
Swap contracts, at value | | | — | | | | 9,071,434 | | | | — | | | | 9,071,434 | |
| Total Other | | | | | | | | | | | | | | | | |
| Financial Instruments | | $ | (1,256,523 | ) | | $ | 4,809,133 | | | $ | — | | | $ | 3,552,610 | |
* Securities valued at $0.
The accompanying notes are an integral part of these financial statements.
Pioneer Strategic Income Fund | Annual Report | 9/30/20 85
Schedule of Investments | 9/30/20 (continued)
The following is a reconciliation of assets valued using significant unobservable inputs (Level 3):
| | | | | | | | | | | | | | | | | | | |
| | | | | Asset | | | Collateralized | | | | | | Insurance- | | | | |
| | Common | | | Backed | | | Mortgage | | | Corporate | | | Linked | | | | |
| | Stocks | | | Securities | | | Obligations | | | Bonds | | | Securities | | | Total | |
Balance as of | | | | | | | | | | | | | | | | | | |
| 9/30/19 | | $ | 132,742 | | | $ | 12,507,500 | | | $ | 12,246,957 | | | $ | 9,340,892 | | | $ | 128,525,410 | | | $ | 162,753,501 | |
Realized gain | | | | | | | | | | | | | | | | | | | | | | | | |
(loss)(1) | | | — | | | | — | | | | (1,473,026 | ) | | | 76,325 | | | | (4,007,356 | ) | | | (5,404,057 | ) |
Changed in | | | | | | | | | | | | | | | | | | | | | | | | |
| unrealized | | | | | | | | | | | | | | | | | | | | | | | | |
| appreciation | | | | | | | | | | | | | | | | | | | | | | | | |
(depreciation)(2) | | | (1,118,754 | ) | | | — | | | | (4,287 | ) | | | (5,816,195 | ) | | | 775,494 | | | | (6,163,742 | ) |
Accrued | | | | | | | | | | | | | | | | | | | | | | | | |
| discounts/ | | | | | | | | | | | | | | | | | | | | | | | | |
| premiums | | | — | | | | — | | | | 4,064 | | | | (76,317 | ) | | | 48,275 | | | | (23,978 | ) |
Purchases | | | — | | | | — | | | | — | | | | — | | | | 74,655,042 | | | | 74,655,042 | |
Sales | | | (14,603 | ) | | | — | | | | (10,773,708 | ) | | | (3,524,705 | ) | | | (84,229,053 | ) | | | (98,542,069 | ) |
Transfers in to | | | | | | | | | | | | | | | | | | | | | | | | |
| Level 3* | | | 1,434,822 | | | | — | | | | — | | | | — | | | | — | | | | 1,434,822 | |
Transfers out of | | | | | | | | | | | | | | | | | | | | | | | | |
| Level 3* | | | — | | | | (12,507,500 | ) | | | — | | | | — | | | | — | | | | (12,507,500 | ) |
| Balance as | | | | | | | | | | | | | | | | | | | | | | | | |
| of 9/30/20 | | $ | 434,207 | | | $ | — | | | $ | — | | | $ | — | | | $ | 115,767,812 | | | $ | 116,202,019 | |
| | |
(1) | Realized gain (loss) on these securities is included in the realized gain (loss) from investments on the Statement of Operations. |
(2) | Unrealized appreciation (depreciation) on these securities is included in the change in unrealized appreciation (depreciation) from investments on the Statement of Operations. |
* | Transfers are calculated on the beginning of period values. During the year ended September 30, 2020 investments having aggregate value of $12,670,432 were transferred out of Level 3 to Level 2, as there were significant observable inputs available to determine their value. Security valued at $286,964 was transferred from Level 2 to Level 3, due to valuing the security using unobservable inputs. There were no other transfers between Levels 1, 2 and 3. |
| | |
Net change in unrealized appreciation (depreciation) of Level 3 investments still held and considered | |
Level 3 at September 30, 2020: | | $ | 150,568 | |
The accompanying notes are an integral part of these financial statements.
86 Pioneer Strategic Income Fund | Annual Report | 9/30/20
Statement of Assets and Liabilities |
9/30/20 | | | | |
| ASSETS: | | | |
| Investments in unaffiliated issuers, at value (cost $4,385,938,525) | | $ | 4,430,774,952 | |
| Cash | | | 42,902,119 | |
| Foreign currencies, at value (cost $2,542,283) | | | 2,160,993 | |
| Forwards collateral | | | 520,000 | |
| Futures collateral | | | 886,262 | |
| Swaps collateral | | | 19,274,821 | |
| Due from broker for futures | | | 11,411,894 | |
| Variation margin for futures contracts | | | 875,636 | |
| Variation margin for centrally cleared swap contracts | | | 246,951 | |
| Swap contracts, at value (net premiums received $(1,665,733)) | | | 9,071,434 | |
| Receivables — | | | | |
| Investment securities sold | | | 53,962,118 | |
| Fund shares sold | | | 12,802,889 | |
| Dividends | | | 219,566 | |
| Interest | | | 36,426,604 | |
| Other assets | | | 61,052 | |
| Total assets | | $ | 4,621,597,291 | |
| LIABILITIES: | | | | |
| Payables — | | | | |
| Investment securities purchased | | $ | 188,104,247 | |
| Fund shares repurchased | | | 14,879,414 | |
| Distributions | | | 1,792,420 | |
| Trustees’ fees | | | 1,365 | |
| Forwards collateral | | | 300,000 | |
| Due to broker for swaps | | | 8,784,273 | |
| Written options outstanding (net premiums received $(1,651,645)) | | | 1,578,624 | |
| Net unrealized depreciation on forward foreign currency exchange contracts | | | 2,683,677 | |
| Net unrealized depreciation on futures contracts | | | 1,256,523 | |
| Net unrealized depreciation on unfunded loan commitments | | | 303 | |
| Reserve for repatriation taxes | | | 366,031 | |
| Due to affiliates | | | 410,042 | |
| Accrued expenses | | | 1,480,524 | |
| Total liabilities | | $ | 221,637,443 | |
| NET ASSETS: | | | | |
| Paid-in capital | | $ | 4,378,991,016 | |
| Distributable earnings | | | 20,968,832 | |
| Net assets | | $ | 4,399,959,848 | |
| NET ASSET VALUE PER SHARE: | | | | |
No par value (unlimited number of shares authorized) | | | | |
| Class A (based on $799,973,652/73,327,168 shares) | | $ | 10.91 | |
| Class C (based on $185,622,791/17,394,956 shares) | | $ | 10.67 | |
| Class K (based on $414,610,020/37,950,724 shares) | | $ | 10.92 | |
| Class R (based on $103,585,203/9,338,636 shares) | | $ | 11.09 | |
| Class Y (based on $2,896,168,182/265,564,649 shares) | | $ | 10.91 | |
| MAXIMUM OFFERING PRICE PER SHARE: | | | | |
| Class A (based on $10.91 net asset value per share/100%-4.50% | | | | |
| maximum sales charge) | | $ | 11.42 | |
The accompanying notes are an integral part of these financial statements.
Pioneer Strategic Income Fund | Annual Report | 9/30/20 87
Statement of Operations
FOR THE YEAR ENDED 9/30/20
| | | | | | | |
| INVESTMENT INCOME: | | | | | | |
| Interest from unaffiliated issuers (net of foreign taxes | | | | | | |
| withheld $953,206) | | $ | 199,861,885 | | | | |
| Dividends from unaffiliated issuers (net of foreign taxes | | | | | | | |
| withheld $188,937) | | | 7,806,549 | | | | |
| Total investment income | | | | | | $ | 207,668,434 | |
| EXPENSES: | | | | | | | | |
| Management fees | | $ | 25,092,458 | | | | | |
| Administrative expense | | | 1,072,059 | | | | | |
| Transfer agent fees | | | | | | | | |
| Class A | | | 1,367,418 | | | | | |
| Class C | | | 241,213 | | | | | |
| Class K | | | 6,035 | | | | | |
| Class R | | | 313,289 | | | | | |
| Class Y | | | 3,214,338 | | | | | |
| Distribution fees | | | | | | | | |
| Class A | | | 1,927,843 | | | | | |
| Class C | | | 2,563,176 | | | | | |
| Class R | | | 578,683 | | | | | |
| Shareowner communications expense | | | 350,816 | | | | | |
| Custodian fees | | | 376,725 | | | | | |
| Registration fees | | | 167,490 | | | | | |
| Professional fees | | | 248,268 | | | | | |
| Printing expense | | | 99,822 | | | | | |
| Pricing fees | | | 174,138 | | | | | |
| Trustees’ fees | | | 254,211 | | | | | |
| Insurance expense | | | 57,437 | | | | | |
| Miscellaneous | | | 218,729 | | | | | |
| Total expenses | | | | | | $ | 38,324,148 | |
| Net investment income | | | | | | $ | 169,344,286 | |
| REALIZED AND UNREALIZED GAIN (LOSS) ON INVESTMENTS: | | | | | |
| Net realized gain (loss) on: | | | | | | | | |
| Investments in unaffiliated issuers | | $ | 75,920,095 | | | | | |
| Written options | | | 915,214 | | | | | |
| Forward foreign currency exchange contracts | | | 8,015,596 | | | | | |
| Futures contracts | | | (31,790,548 | ) | | | | |
| Swap contracts | | | (9,366,867 | ) | | | | |
| Short sales | | | (13,191 | ) | | | | |
| Other assets and liabilities denominated in foreign currencies | | | (2,413,503 | ) | | $ | 41,266,796 | |
| Change in net unrealized appreciation (depreciation) on: | | | | | | | | |
| Investments in unaffiliated issuers (net of foreign capital | | | | | | | | |
| gains tax of $171,269) | | $ | (95,201,501 | ) | | | | |
| Written options | | | (775,647 | ) | | | | |
| Forward foreign currency exchange contracts | | | 173,642 | | | | | |
| Futures contracts | | | (5,345,773 | ) | | | | |
| Swap contracts | | | 10,820,264 | | | | | |
| Unfunded loan commitments | | | (303 | ) | | | | |
| Other assets and liabilities denominated in | | | | | | | | |
| foreign currencies | | | (288,334 | ) | | $ | (90,617,652 | ) |
| Net realized and unrealized gain (loss) on investments | | | | | | $ | (49,350,856 | ) |
| Net increase in net assets resulting from operations | | | | | | $ | 119,993,430 | |
The accompanying notes are an integral part of these financial statements.
88 Pioneer Strategic Income Fund | Annual Report | 9/30/20
Statements of Changes in Net Assets
| | | | | | | |
| | Year | | | Year | |
| | Ended | | | Ended | |
| | 9/30/20 | | | 9/30/19 | |
| FROM OPERATIONS: | | | | | | |
Net investment income (loss) | | $ | 169,344,286 | | | $ | 166,979,288 | |
Net realized gain (loss) on investments | | | 41,266,796 | | | | (50,558,139 | ) |
Change in net unrealized appreciation (depreciation) | | | | | | | | |
| on investments | | | (90,617,652 | ) | | | 227,095,674 | |
| Net increase in net assets resulting from operations | | $ | 119,993,430 | | | $ | 343,516,823 | |
| DISTRIBUTIONS TO SHAREOWNERS: | | | | | | | | |
| Class A ($0.34 and $0.27 per share, respectively) | | $ | (24,660,237 | ) | | $ | (20,253,203 | ) |
| Class C ($0.27 and $0.20 per share, respectively) | | | (6,454,194 | ) | | | (7,490,533 | ) |
| Class K ($0.39 and $0.32 per share, respectively) | | | (14,676,179 | ) | | | (11,407,975 | ) |
| Class R ($0.31 and $0.24 per share, respectively) | | | (3,330,824 | ) | | | (3,264,951 | ) |
| Class Y ($0.38 and $0.30 per share, respectively) | | | (103,573,428 | ) | | | (84,107,582 | ) |
Tax return of capital: | | | | | | | | |
| Class A ($— and $0.04 per share, respectively) | | | — | | | | (3,162,606 | ) |
| Class C ($— and $0.04 per share, respectively) | | | — | | | | (1,528,015 | ) |
| Class K ($— and $0.04 per share, respectively) | | | — | | | | (1,550,579 | ) |
| Class R ($— and $0.04 per share, respectively) | | | — | | | | (551,165 | ) |
| Class Y ($— and $0.04 per share, respectively) | | | — | | | | (11,632,388 | ) |
| Total distributions to shareowners | | $ | (152,694,862 | ) | | $ | (144,948,997 | ) |
| FROM FUND SHARE TRANSACTIONS: | | | | | | | | |
Net proceeds from sales of shares | | $ | 1,322,110,291 | | | $ | 1,106,273,755 | |
Reinvestment of distributions | | | 125,813,471 | | | | 119,693,854 | |
Cost of shares repurchased | | | (1,674,309,428 | ) | | | (1,849,329,888 | ) |
| Net decrease in net assets resulting from Fund | | | | | | | | |
| share transactions | | $ | (226,385,666 | ) | | $ | (623,362,279 | ) |
| Net decrease in net assets | | $ | (259,087,098 | ) | | $ | (424,794,453 | ) |
| NET ASSETS: | | | | | | | | |
Beginning of year | | $ | 4,659,046,946 | | | $ | 5,083,841,399 | |
End of year | | $ | 4,399,959,848 | | | $ | 4,659,046,946 | |
The accompanying notes are an integral part of these financial statements.
Pioneer Strategic Income Fund | Annual Report | 9/30/20 89
Statements of Changes in Net Assets
(continued)
| | | | | | | | | | | | | |
| | Year Ended | | | Year Ended | | | Year Ended | | | Year Ended | |
| | 9/30/20 | | | 9/30/20 | | | 9/30/19 | | | 9/30/19 | |
| | Shares | | | Amount | | | Shares | | | Amount | |
| Class A | | | | | | | | | | | | |
Shares sold | | | 17,894,552 | | | $ | 191,819,073 | | | | 17,906,959 | | | $ | 190,183,260 | |
Reinvestment of distributions | | | 1,974,424 | | | | 21,080,155 | | | | 1,918,189 | | | | 20,286,957 | |
Less shares repurchased | | | (20,261,286 | ) | | | (214,492,936 | ) | | | (28,774,381 | ) | | | (302,867,990 | ) |
| Net decrease | | | (392,310 | ) | | $ | (1,593,708 | ) | | | (8,949,233 | ) | | $ | (92,397,773 | ) |
| Class C | | | | | | | | | | | | | | | | |
Shares sold | | | 1,954,802 | | | $ | 20,476,627 | | | | 2,750,808 | | | $ | 28,316,524 | |
Reinvestment of distributions | | | 482,311 | | | | 5,039,074 | | | | 690,792 | | | | 7,130,256 | |
Less shares repurchased | | | (14,297,915 | ) | | | (149,756,299 | ) | | | (19,894,900 | ) | | | (205,633,470 | ) |
| Net decrease | | | (11,860,802 | ) | | $ | (124,240,598 | ) | | | (16,453,300 | ) | | $ | (170,186,690 | ) |
| Class K | | | | | | | | | | | | | | | | |
Shares sold | | | 15,342,569 | | | $ | 163,693,231 | | | | 14,582,605 | | | $ | 153,604,827 | |
Reinvestment of distributions | | | 1,195,696 | | | | 12,789,793 | | | | 1,002,006 | | | | 10,626,701 | |
Less shares repurchased | | | (15,414,913 | ) | | | (162,058,515 | ) | | | (15,110,147 | ) | | | (158,910,479 | ) |
| Net increase | | | 1,123,352 | | | $ | 14,424,509 | | | | 474,464 | | | $ | 5,321,049 | |
| Class R | | | | | | | | | | | | | | | | |
Shares sold | | | 2,167,102 | | | $ | 23,612,372 | | | | 2,119,524 | | | $ | 22,657,609 | |
Reinvestment of distributions | | | 297,936 | | | | 3,235,307 | | | | 329,066 | | | | 3,535,303 | |
Less shares repurchased | | | (4,970,929 | ) | | | (53,871,495 | ) | | | (6,465,890 | ) | | | (69,000,186 | ) |
| Net decrease | | | (2,505,891 | ) | | $ | (27,023,816 | ) | | | (4,017,300 | ) | | $ | (42,807,274 | ) |
| Class Y | | | | | | | | | | | | | | | | |
Shares sold | | | 86,449,522 | | | $ | 922,508,988 | | | | 67,383,871 | | | $ | 711,511,535 | |
Reinvestment of distributions | | | 7,836,310 | | | | 83,669,142 | | | | 7,388,058 | | | | 78,114,637 | |
Less shares repurchased | | | (105,061,141 | ) | | | (1,094,130,183 | ) | | | (106,450,728 | ) | | | (1,112,917,763 | ) |
| Net decrease | | | (10,775,309 | ) | | $ | (87,952,053 | ) | | | (31,678,799 | ) | | $ | (323,291,591 | ) |
The accompanying notes are an integral part of these financial statements.
90 Pioneer Strategic Income Fund | Annual Report | 9/30/20
Financial Highlights
| | | | | | | | | | | | | | | | |
| | Year | | | Year | | | Year | | | Year | | | Year | |
| | Ended | | | Ended | | | Ended | | | Ended | | | Ended | |
| | 9/30/20 | | | 9/30/19 | | | 9/30/18 | | | 9/30/17 | | | 9/30/16* | |
| Class A | | | | | | | | | | | | | | | |
Net asset value, beginning of period | | $ | 10.89 | | | $ | 10.42 | | | $ | 10.82 | | | $ | 10.76 | | | $ | 10.36 | |
Increase (decrease) from investment operations: | | | | | | | | | | | | | | | | | | | | |
| Net investment income (loss) (a) | | $ | 0.38 | | | $ | 0.36 | | | $ | 0.35 | | | $ | 0.37 | | | $ | 0.40 | |
| Net realized and unrealized gain (loss) on investments | | | (0.02 | ) | | | 0.42 | | | | (0.42 | ) | | | 0.04 | | | | 0.36 | |
| Net increase (decrease) from investment operations | | $ | 0.36 | | | $ | 0.78 | | | $ | (0.07 | ) | | $ | 0.41 | | | $ | 0.76 | |
Distributions to shareowners: | | | | | | | | | | | | | | | | | | | | |
| Net investment income | | $ | (0.34 | ) | | $ | (0.27 | ) | | $ | (0.31 | ) | | $ | (0.33 | ) | | $ | (0.36 | ) |
| Tax return of capital | | | — | | | | (0.04 | ) | | | (0.02 | ) | | | (0.02 | ) | | | — | |
| Total distributions | | $ | (0.34 | ) | | $ | (0.31 | ) | | $ | (0.33 | ) | | $ | (0.35 | ) | | $ | (0.36 | ) |
| Net increase (decrease) in net asset value | | $ | 0.02 | | | $ | 0.47 | | | $ | (0.40 | ) | | $ | 0.06 | | | $ | 0.40 | |
Net asset value, end of period | | $ | 10.91 | | | $ | 10.89 | | | $ | 10.42 | | | $ | 10.82 | | | $ | 10.76 | |
| Total return (b) | | | 3.44 | % | | | 7.64 | % | | | (0.67 | )% | | | 3.90 | % | | | 7.50 | % |
Ratio of net expenses to average net assets | | | 1.06 | % | | | 1.10 | % | | | 1.03 | % | | | 1.06 | % | | | 1.04 | % |
Ratio of net investment income (loss) to average net assets | | | 3.59 | % | | | 3.39 | % | | | 3.28 | % | | | 3.41 | % | | | 3.80 | % |
Portfolio turnover rate | | | 69 | % | | | 53 | % | | | 44 | % | | | 52 | % | | | 43 | % |
Net assets, end of period (in thousands) | | $ | 799,974 | | | $ | 803,174 | | | $ | 861,517 | | | $ | 1,038,090 | | | $ | 1,289,783 | |
* The Fund was audited by an independent registered public accounting firm other than Ernst & Young LLP.
(a) The per-share data presented above is based on the average shares outstanding for the period presented.
(b) Assumes initial investment at net asset value at the beginning of each period, reinvestment of all distributions, the complete redemption of the investment at net asset value at the end of each period and no sales charges. Total return would be reduced if sales charges were taken into account.
The accompanying notes are an integral part of these financial statements.
Pioneer Strategic Income Fund | Annual Report | 9/30/20 91
Financial Highlights (continued)
| | | | | | | | | | | | | | | | |
| | Year | | | Year | | | Year | | | Year | | | Year | |
| | Ended | | | Ended | | | Ended | | | Ended | | | Ended | |
| | 9/30/20 | | | 9/30/19 | | | 9/30/18 | | | 9/30/17 | | | 9/30/16* | |
| Class C | | | | | | | | | | | | | | | |
Net asset value, beginning of period | | $ | 10.66 | | | $ | 10.20 | | | $ | 10.59 | | | $ | 10.53 | | | $ | 10.13 | |
Increase (decrease) from investment operations: | | | | | | | | | | | | | | | | | | | | |
| Net investment income (loss) (a) | | $ | 0.30 | | | $ | 0.28 | | | $ | 0.27 | | | $ | 0.29 | | | $ | 0.32 | |
| Net realized and unrealized gain (loss) on investments | | | (0.02 | ) | | | 0.42 | | | | (0.41 | ) | | | 0.04 | | | | 0.36 | |
| Net increase (decrease) from investment operations | | $ | 0.28 | | | $ | 0.70 | | | $ | (0.14 | ) | | $ | 0.33 | | | $ | 0.68 | |
Distributions to shareowners: | | | | | | | | | | | | | | | | | | | | |
| Net investment income | | $ | (0.27 | ) | | $ | (0.20 | ) | | $ | (0.23 | ) | | $ | (0.25 | ) | | $ | (0.28 | ) |
| Tax return of capital | | | — | | | | (0.04 | ) | | | (0.02 | ) | | | (0.02 | ) | | | — | |
| Total distributions | | $ | (0.27 | ) | | $ | (0.24 | ) | | $ | (0.25 | ) | | $ | (0.27 | ) | | $ | (0.28 | ) |
| Net increase (decrease) in net asset value | | $ | 0.01 | | | $ | 0.46 | | | $ | (0.39 | ) | | $ | 0.06 | | | $ | 0.40 | |
Net asset value, end of period | | $ | 10.67 | | | $ | 10.66 | | | $ | 10.20 | | | $ | 10.59 | | | $ | 10.53 | |
| Total return (b) | | | 2.67 | % | | | 6.96 | % | | | (1.30 | )% | | | 3.23 | % | | | 6.88 | % |
Ratio of net expenses to average net assets | | | 1.73 | % | | | 1.74 | % | | | 1.69 | % | | | 1.72 | % | | | 1.72 | % |
Ratio of net investment income (loss) to average net assets | | | 2.89 | % | | | 2.75 | % | | | 2.62 | % | | | 2.75 | % | | | 3.12 | % |
Portfolio turnover rate | | | 69 | % | | | 53 | % | | | 44 | % | | | 52 | % | | | 43 | % |
Net assets, end of period (in thousands) | | $ | 185,623 | | | $ | 311,801 | | | $ | 466,033 | | | $ | 697,820 | | | $ | 913,048 | |
* The Fund was audited by an independent registered public accounting firm other than Ernst & Young LLP.
(a) The per-share data presented above is based on the average shares outstanding for the period presented.
(b) Assumes initial investment at net asset value at the beginning of each period, reinvestment of all distributions, the complete redemption of the investment at net asset value at the end of each period and no sales charges. Total return would be reduced if sales charges were taken into account.
The accompanying notes are an integral part of these financial statements.
92 Pioneer Strategic Income Fund | Annual Report | 9/30/20
| | | | | | | | | | | | | | | | |
| | Year | | | Year | | | Year | | | Year | | | Year | |
| | Ended | | | Ended | | | Ended | | | Ended | | | Ended | |
| | 9/30/20 | | | 9/30/19 | | | 9/30/18 | | | 9/30/17 | | | 9/30/16* | |
| Class K | | | | | | | | | | | | | | | |
Net asset value, beginning of period | | $ | 10.92 | | | $ | 10.44 | | | $ | 10.84 | | | $ | 10.78 | | | $ | 10.38 | |
Increase (decrease) from investment operations: | | | | | | | | | | | | | | | | | | | | |
| Net investment income (loss) (a) | | $ | 0.43 | | | $ | 0.41 | | | $ | 0.39 | | | $ | 0.41 | | | $ | 0.44 | |
| Net realized and unrealized gain (loss) on investments | | | (0.04 | ) | | | 0.43 | | | | (0.41 | ) | | | 0.05 | | | | 0.37 | |
| Net increase (decrease) from investment operations | | $ | 0.39 | | | $ | 0.84 | | | $ | (0.02 | ) | | $ | 0.46 | | | $ | 0.81 | |
Distributions to shareowners: | | | | | | | | | | | | | | | | | | | | |
| Net investment income | | $ | (0.39 | ) | | $ | (0.32 | ) | | $ | (0.36 | ) | | $ | (0.38 | ) | | $ | (0.41 | ) |
| Tax return of capital | | | — | | | | (0.04 | ) | | | (0.02 | ) | | | (0.02 | ) | | | — | |
| Total distributions | | $ | (0.39 | ) | | $ | (0.36 | ) | | $ | (0.38 | ) | | $ | (0.40 | ) | | $ | (0.41 | ) |
| Net increase (decrease) in net asset value | | $ | — | | | $ | 0.48 | | | $ | (0.40 | ) | | $ | 0.06 | | | $ | 0.40 | |
Net asset value, end of period | | $ | 10.92 | | | $ | 10.92 | | | $ | 10.44 | | | $ | 10.84 | | | $ | 10.78 | |
| Total return (b) | | | 3.73 | % | | | 8.19 | % | | | (0.23 | )% | | | 4.36 | % | | | 7.96 | % |
Ratio of net expenses to average net assets | | | 0.62 | % | | | 0.63 | % | | | 0.62 | % | | | 0.62 | % | | | 0.62 | % |
Ratio of net investment income (loss) to average net assets | | | 4.02 | % | | | 3.86 | % | | | 3.70 | % | | | 3.83 | % | | | 4.20 | % |
Portfolio turnover rate | | | 69 | % | | | 53 | % | | | 44 | % | | | 52 | % | | | 43 | % |
Net assets, end of period (in thousands) | | $ | 414,610 | | | $ | 402,042 | | | $ | 379,474 | | | $ | 400,888 | | | $ | 267,495 | |
* The Fund was audited by an independent registered public accounting firm other than Ernst & Young LLP.
(a) The per-share data presented above is based on the average shares outstanding for the period presented.
(b) Assumes initial investment at net asset value at the beginning of each period, reinvestment of all distributions and the complete redemption of the investment at net asset value at the end of each period.
The accompanying notes are an integral part of these financial statements.
Pioneer Strategic Income Fund | Annual Report | 9/30/20 93
Financial Highlights (continued)
| | | | | | | | | | | | | | | | |
| | Year | | | Year | | | Year | | | Year | | | Year | |
| | Ended | | | Ended | | | Ended | | | Ended | | | Ended | |
| | 9/30/20 | | | 9/30/19 | | | 9/30/18 | | | 9/30/17 | | | 9/30/16* | |
| Class R | | | | | | | | | | | | | | | |
Net asset value, beginning of period | | $ | 11.08 | | | $ | 10.59 | | | $ | 11.00 | | | $ | 10.93 | | | $ | 10.52 | |
Increase (decrease) from investment operations: | | | | | | | | | | | | | | | | | | | | |
| Net investment income (loss) (a) | | $ | 0.35 | | | $ | 0.33 | | | $ | 0.32 | | | $ | 0.33 | | | $ | 0.37 | |
| Net realized and unrealized gain (loss) on investments | | | (0.03 | ) | | | 0.44 | | | | (0.43 | ) | | | 0.05 | | | | 0.37 | |
| Net increase (decrease) from investment operations | | $ | 0.32 | | | $ | 0.77 | | | $ | (0.11 | ) | | $ | 0.38 | | | $ | 0.74 | |
Distributions to shareowners: | | | | | | | | | | | | | | | | | | | | |
| Net investment income | | $ | (0.31 | ) | | $ | (0.24 | ) | | $ | (0.28 | ) | | $ | (0.29 | ) | | $ | (0.33 | ) |
| Tax return of capital | | | — | | | | (0.04 | ) | | | (0.02 | ) | | | (0.02 | ) | | | — | |
| Total distributions | | $ | (0.31 | ) | | $ | (0.28 | ) | | $ | (0.30 | ) | | $ | (0.31 | ) | | $ | (0.33 | ) |
| Net increase (decrease) in net asset value | | $ | 0.01 | | | $ | 0.49 | | | $ | (0.41 | ) | | $ | 0.07 | | | $ | 0.41 | |
Net asset value, end of period | | $ | 11.09 | | | $ | 11.08 | | | $ | 10.59 | | | $ | 11.00 | | | $ | 10.93 | |
| Total return (b) | | | 3.03 | % | | | 7.43 | % | | | (1.02 | )% | | | 3.57 | % | | | 7.17 | % |
Ratio of net expenses to average net assets | | | 1.40 | % | | | 1.39 | % | | | 1.34 | % | | | 1.41 | % | | | 1.35 | % |
Ratio of net investment income (loss) to average net assets | | | 3.23 | % | | | 3.10 | % | | | 2.97 | % | | | 3.05 | % | | | 3.49 | % |
Portfolio turnover rate | | | 69 | % | | | 53 | % | | | 44 | % | | | 52 | % | | | 43 | % |
Net assets, end of period (in thousands) | | $ | 103,585 | | | $ | 131,214 | | | $ | 168,043 | | | $ | 223,372 | | | $ | 232,545 | |
* The Fund was audited by an independent registered public accounting firm other than Ernst & Young LLP.
(a) The per-share data presented above is based on the average shares outstanding for the period presented.
(b) Assumes initial investment at net asset value at the beginning of each period, reinvestment of all distributions and the complete redemption of the investment at net asset value at the end of each period.
The accompanying notes are an integral part of these financial statements.
94 Pioneer Strategic Income Fund | Annual Report | 9/30/20
| | | | | | | | | | | | | | | | |
| | Year | | | Year | | | Year | | | Year | | | Year | |
| | Ended | | | Ended | | | Ended | | | Ended | | | Ended | |
| | 9/30/20 | | | 9/30/19 | | | 9/30/18 | | | 9/30/17 | | | 9/30/16* | |
| Class Y | | | | | | | | | | | | | | | |
Net asset value, beginning of period | | $ | 10.90 | | | $ | 10.42 | | | $ | 10.82 | | | $ | 10.76 | | | $ | 10.36 | |
Increase (decrease) from investment operations: | | | | | | | | | | | | | | | | | | | | |
| Net investment income (loss) (a) | | $ | 0.42 | | | $ | 0.40 | | | $ | 0.38 | | | $ | 0.40 | | | $ | 0.43 | |
| Net realized and unrealized gain (loss) on investments | | | (0.03 | ) | | | 0.42 | | | | (0.42 | ) | | | 0.05 | | | | 0.36 | |
| Net increase (decrease) from investment operations | | $ | 0.39 | | | $ | 0.82 | | | $ | (0.04 | ) | | $ | 0.45 | | | $ | 0.79 | |
Distributions to shareowners: | | | | | | | | | | | | | | | | | | | | |
| Net investment income | | $ | (0.38 | ) | | $ | (0.30 | ) | | $ | (0.34 | ) | | $ | (0.37 | ) | | $ | (0.39 | ) |
| Tax return of capital | | | — | | | | (0.04 | ) | | | (0.02 | ) | | | (0.02 | ) | | | — | |
| Total distributions | | $ | (0.38 | ) | | $ | (0.34 | ) | | $ | (0.36 | ) | | $ | (0.39 | ) | | $ | (0.39 | ) |
| Net increase (decrease) in net asset value | | $ | 0.01 | | | $ | 0.48 | | | $ | (0.40 | ) | | $ | 0.06 | | | $ | 0.40 | |
Net asset value, end of period | | $ | 10.91 | | | $ | 10.90 | | | $ | 10.42 | | | $ | 10.82 | | | $ | 10.76 | |
| Total return (b) | | | 3.71 | % | | | 8.09 | % | | | (0.34 | )% | | | 4.23 | % | | | 7.84 | % |
Ratio of net expenses to average net assets | | | 0.74 | % | | | 0.73 | % | | | 0.72 | % | | | 0.74 | % | | | 0.73 | % |
Ratio of net investment income (loss) to average net assets | | | 3.91 | % | | | 3.75 | % | | | 3.60 | % | | | 3.72 | % | | | 4.11 | % |
Portfolio turnover rate | | | 69 | % | | | 53 | % | | | 44 | % | | | 52 | % | | | 43 | % |
Net assets, end of period (in thousands) | | $ | 2,896,168 | | | $ | 3,010,817 | | | $ | 3,208,774 | | | $ | 3,560,072 | | | $ | 3,512,802 | |
* The Fund was audited by an independent registered public accounting firm other than Ernst & Young LLP.
(a) The per-share data presented above is based on the average shares outstanding for the period presented.
(b) Assumes initial investment at net asset value at the beginning of each period, reinvestment of all distributions and the complete redemption of the investment at net asset value at the end of each period.
The accompanying notes are an integral part of these financial statements.
Pioneer Strategic Income Fund | Annual Report | 9/30/20 95
Notes to Financial Statements |
9/30/20 1. Organization and Significant Accounting Policies
Pioneer Strategic Income Fund (the “Fund”) is one of two portfolios comprising Pioneer Series Trust XIV, a Delaware statutory trust. The Fund is registered under the Investment Company Act of 1940 as a diversified, open-end management investment company. The investment objective of the Fund is to produce a high level of current income.
The Fund offers five classes of shares designated as Class A, Class C, Class K, Class R and Class Y shares. Each class of shares represents an interest in the same portfolio of investments of the Fund and has identical rights (based on relative net asset values) to assets and liquidation proceeds. Share classes can bear different rates of class-specific fees and expenses, such as transfer agent and distribution fees. Differences in class-specific fees and expenses will result in differences in net investment income and, therefore, the payment of different dividends from net investment income earned by each class. The Amended and Restated Declaration of Trust of the Fund gives the Board of Trustees the flexibility to specify either per-share voting or dollar-weighted voting when submitting matters for shareowner approval. Under per-share voting, each share of a class of the Fund is entitled to one vote. Under dollar-weighted voting, a shareowner’s voting power is determined not by the number of shares owned, but by the dollar value of the shares on the record date. Each share class has exclusive voting rights with respect to matters affecting only that class, including with respect to the distribution plan for that class. There is no distribution plan for Class K and Class Y shares.
Amundi Pioneer Asset Management, Inc., an indirect, wholly owned subsidiary of Amundi and Amundi’s wholly owned subsidiary, Amundi USA, Inc., serves as the Fund’s investment adviser (the “Adviser”). Amundi Pioneer Distributor, Inc., an affiliate of Amundi Pioneer Asset Management, Inc., serves as the Fund’s distributor (the “Distributor”).
During March 2017, the Financial Accounting Standards Board (FASB) issued an Accounting Standard Update, ASU 2017-08, Receivables-Nonrefundable Fees and Other Costs (Subtopic 310-20), Premium Amortization on Purchased Callable Debt Securities (“ASU 2017-08”), which shortens the amortization period for purchased non-contingently callable debt securities held at a premium. ASU 2017-08 specifies that the premium amortization period ends at the earliest call date, for certain purchased non-contingently callable debt securities. ASU 2017-08 is effective for fiscal years, and interim periods within those fiscal years, beginning after December 15, 2018. The
96 Pioneer Strategic Income Fund | Annual Report | 9/30/20
Fund has adopted ASU 2017-08 as of January 1, 2019. The implementation of ASU 2017-08 did not have a material impact on the Fund’s financial statements.
The Fund is an investment company and follows investment company accounting and reporting guidance under U.S. GAAP. U.S. GAAP requires the management of the Fund to make estimates and assumptions that affect the reported amounts of assets and liabilities, the disclosure of contingent assets and liabilities at the date of the financial statements, and the reported amounts of income, expenses and gain or loss on investments during the reporting period. Actual results could differ from those estimates.
The following is a summary of significant accounting policies followed by the Fund in the preparation of its financial statements:
A. Security Valuation
The net asset value of the Fund is computed once daily, on each day the New York Stock Exchange (“NYSE”) is open, as of the close of regular trading on the NYSE.
Fixed-income securities are valued by using prices supplied by independent pricing services, which consider such factors as market prices, market events, quotations from one or more brokers, Treasury spreads, yields, maturities and ratings, or may use a pricing matrix or other fair value methods or techniques to provide an estimated value of the security or instrument. A pricing matrix is a means of valuing a debt security on the basis of current market prices for other debt securities, historical trading patterns in the market for fixed-income securities and/or other factors. Non-U.S. debt securities that are listed on an exchange will be valued at the bid price obtained from an independent third party pricing service. When independent third party pricing services are unable to supply prices, or when prices or market quotations are considered to be unreliable, the value of that security may be determined using quotations from one or more broker-dealers.
Loan interests are valued in accordance with guidelines established by the Board of Trustees at the mean between the last available bid and asked prices from one or more brokers or dealers as obtained from Loan Pricing Corporation, an independent third party pricing service. If price information is not available from Loan Pricing Corporation, or if the price information is deemed to be unreliable, price information will be obtained from an alternative loan interest pricing service. If no reliable price quotes are available from either the primary or alternative pricing service, broker quotes will be solicited.
Pioneer Strategic Income Fund | Annual Report | 9/30/20 97
Event-linked bonds are valued at the bid price obtained from an independent third party pricing service. Other insurance-linked securities (including reinsurance sidecars, collateralized reinsurance and industry loss warranties) may be valued at the bid price obtained from an independent pricing service, or through a third party using a pricing matrix, insurance industry valuation models, or other fair value methods or techniques to provide an estimated value of the instrument.
Equity securities that have traded on an exchange are valued by using the last sale price on the principal exchange where they are traded. Equity securities that have not traded on the date of valuation, or securities for which sale prices are not available, generally are valued using the mean between the last bid and asked prices or, if both last bid and asked prices are not available, at the last quoted bid price. Last sale and bid and asked prices are provided by independent third party pricing services. In the case of equity securities not traded on an exchange, prices are typically determined by independent third party pricing services using a variety of techniques and methods.
The value of foreign securities is translated into U.S. dollars based on foreign currency exchange rate quotations supplied by a third party pricing source. Trading in non-U.S. equity securities is substantially completed each day at various times prior to the close of the NYSE. The values of such securities used in computing the net asset value of the Fund’s shares are determined as of such times. The Fund may use a fair value model developed by an independent pricing service to value non-U.S. equity securities.
Options contracts are generally valued at the mean between the last bid and ask prices on the principal exchange where they are traded. Over-the-counter (“OTC”) options and options on swaps (“swaptions”) are valued using prices supplied by independent pricing services, which consider such factors as market prices, market events, quotations from one or more brokers, Treasury spreads, yields, maturities and ratings, or may use a pricing matrix or other fair value methods or techniques to provide an estimated value of the security or instrument.
Forward foreign currency exchange contracts are valued daily using the foreign exchange rate or, for longer term forward contract positions, the spot currency rate and the forward points on a daily basis, in each case provided by a third party pricing service. Contracts whose forward settlement date falls between two quoted days are valued by interpolation.
Futures contracts are generally valued at the closing settlement price established by the exchange on which they are traded.
98 Pioneer Strategic Income Fund | Annual Report | 9/30/20
Swap contracts, including interest rate swaps, caps and floors (other than centrally cleared swap contracts), are valued at the dealer quotations obtained from reputable International Swap Dealers Association members. Centrally cleared swaps are valued at the daily settlement price provided by the central clearing counterparty.
Repurchase agreements are valued at par. Cash may include overnight time deposits at approved financial institutions.
Securities or loan interests for which independent pricing services or broker-dealers are unable to supply prices or for which market prices and/or quotations are not readily available or are considered to be unreliable are valued by a fair valuation team comprised of certain personnel of the Adviser pursuant to procedures adopted by the Fund’s Board of Trustees. The Adviser’s fair valuation team uses fair value methods approved by the Valuation Committee of the Board of Trustees. The Adviser’s fair valuation team is responsible for monitoring developments that may impact fair valued securities and for discussing and assessing fair values on an ongoing basis, and at least quarterly, with the Valuation Committee of the Board of Trustees.
Inputs used when applying fair value methods to value a security may include credit ratings, the financial condition of the company, current market conditions and comparable securities. The Fund may use fair value methods if it is determined that a significant event has occurred after the close of the exchange or market on which the security trades and prior to the determination of the Fund’s net asset value. Examples of a significant event might include political or economic news, corporate restructurings, natural disasters, terrorist activity or trading halts. Thus, the valuation of the Fund’s securities may differ significantly from exchange prices, and such differences could be material.
At September 30, 2020, five securities were valued using fair value methods (in addition to securities valued using prices supplied by independent pricing services, broker-dealers or using a third party insurance pricing model) representing 0.01% of net assets. The value of these fair valued securities was $535,281.
B. Investment Income and Transactions
Dividend income is recorded on the ex-dividend date, except that certain dividends from foreign securities where the ex-dividend date may have passed are recorded as soon as the Fund becomes aware of the ex-dividend data in the exercise of reasonable diligence.
Pioneer Strategic Income Fund | Annual Report | 9/30/20 99
Interest income, including interest on income-bearing cash accounts, is recorded on the accrual basis. Dividend and interest income are reported net of unrecoverable foreign taxes withheld at the applicable country rates and net of income accrued on defaulted securities.
Interest and dividend income payable by delivery of additional shares is reclassified as PIK (payment-in-kind) income upon receipt and is included in interest and dividend income, respectively.
Principal amounts of mortgage-backed securities are adjusted for monthly paydowns. Premiums and discounts related to certain mortgage-backed securities are amortized or accreted in proportion to the monthly paydowns. All discounts/premiums on purchase prices of debt securities are accreted/amortized for financial reporting purposes over the life of the respective securities, and such accretion/amortization is included in interest income.
Security transactions are recorded as of trade date. Gains and losses on sales of investments are calculated on the identified cost method for both financial reporting and federal income tax purposes.
C. Foreign Currency Translation
The books and records of the Fund are maintained in U.S. dollars. Amounts denominated in foreign currencies are translated into U.S. dollars using current exchange rates.
Net realized gains and losses on foreign currency transactions, if any, represent, among other things, the net realized gains and losses on foreign currency exchange contracts, disposition of foreign currencies and the difference between the amount of income accrued and the U.S. dollars actually received. Further, the effects of changes in foreign currency exchange rates on investments are not segregated on the Statement of Operations from the effects of changes in the market prices of those securities, but are included with the net realized and unrealized gain or loss on investments.
D. Federal Income Taxes
It is the Fund’s policy to comply with the requirements of the Internal Revenue Code applicable to regulated investment companies and to distribute all of its net taxable income and net realized capital gains, if any, to its shareowners. Therefore, no provision for federal income taxes is required. As of September 30, 2020, the Fund did not accrue any interest or penalties with respect to uncertain tax positions, which, if applicable, would be recorded as an income tax expense on the Statement of Operations. Tax returns filed within the prior three years remain subject to examination by federal and state tax authorities.
100 Pioneer Strategic Income Fund | Annual Report | 9/30/20
The Fund does not consider the effect of foreign currency gain/loss when calculating its monthly distribution due to its unpredictable nature over the course of a year and differing treatment for book and tax purposes. As a result, the Fund may report a distribution in excess of its earnings and profits or a tax return of capital at its fiscal year end.
In determining the daily net asset value, the Fund estimates the reserve for the repatriation of taxes, if any, associated with its investments in certain countries. The estimated reserve for capital gains is based on the net unrealized appreciation on certain portfolio securities, the holding period of such securities and the related tax rates, tax loss carryforwards (if applicable) and other such factors. As of September 30, 2020, the Fund had accrued $366,031 in reserve for repatriation taxes related to capital gains.
The amount and character of income and capital gain distributions to shareowners are determined in accordance with federal income tax rules, which may differ from U.S. GAAP. Distributions in excess of net investment income or net realized gains are temporary over distributions for financial statement purposes resulting from differences in the recognition or classification of income or distributions for financial statement and tax purposes. Capital accounts within the financial statements are adjusted for permanent book/tax differences to reflect tax character, but are not adjusted for temporary differences.
At September 30, 2020, the Fund reclassified $1,474,392 to increase distributable earnings and $1,474,392 to decrease paid-in capital to reflect permanent book/tax differences. These adjustments have no impact on net assets or the results of operations.
At September 30, 2020, the Fund was permitted to carry forward indefinitely $20,622,205 of short-term losses and $6,923,722 of long-term losses.
During the year ended September 30, 2020, a capital loss carryforward of $30,470,859 was utilized to offset net realized gains by the Fund.
The tax character of distributions paid during the years ended September 30, 2020 and September 30, 2019, were as follows:
| | | | | | | |
| | 2020 | | | 2019 | |
| Distributions paid from: | | | | | | |
| Ordinary income | | $ | 152,694,862 | | | $ | 126,524,244 | |
| Tax return of capital | | | — | | | | 18,424,753 | |
| Total | | $ | 152,694,862 | | | $ | 144,948,997 | |
Pioneer Strategic Income Fund | Annual Report | 9/30/20 101
The following shows the components of distributable earnings (losses) on a federal income tax basis at September 30, 2020:
| | | | |
| | 2020 | |
| Distributable earnings: | | | |
| Current year dividend payable | | $ | (1,792,429 | ) |
| Capital loss carryforward | | | (27,545,927 | ) |
| Undistributed ordinary income | | | 14,354,034 | |
| Net unrealized appreciation | | | 35,953,154 | |
| Total | | $ | 20,968,832 | |
The difference between book-basis and tax-basis net unrealized appreciation is attributable to the tax deferral of losses on wash sales, adjustments relating to event-linked bonds and credit default swaps, the mark to market on forward foreign currency exchange contracts, futures contracts, credit default swaps, interest on defaulted bonds.
E. Fund Shares
The Fund records sales and repurchases of its shares as of trade date. The Distributor earned $$45,377 in underwriting commissions on the sale of Class A shares during the year ended September 30, 2020.
F. Class Allocations
Income, common expenses and realized and unrealized gains and losses are calculated at the Fund level and allocated daily to each class of shares based on its respective percentage of adjusted net assets at the beginning of the day.
Distribution fees are calculated based on the average daily net asset value attributable to Class A, Class C and Class R shares of the Fund, respectively (see Note 4). Class K and Class Y shares do not pay distribution fees. All expenses and fees paid to the Fund’s transfer agent for its services are allocated among the classes of shares based on the number of accounts in each class and the ratable allocation of related out-of-pocket expenses (see Note 3).
The Fund declares as daily dividends substantially all of its net investment income. All dividends are paid on a monthly basis. Short-term capital gain distributions, if any, may be declared with the daily dividends. Distributions to shareowners are recorded as of the ex-dividend date. Distributions paid by the Fund with respect to each class of shares are calculated in the same manner and at the same time, except that net investment income dividends to Class A, Class C, Class K, Class R and Class Y shares can reflect different transfer agent and distribution expense rates.
102 Pioneer Strategic Income Fund | Annual Report | 9/30/20
G. Risks
The value of securities held by the Fund may go up or down, sometimes rapidly or unpredictably, due to general market conditions, such as real or perceived adverse economic, political or regulatory conditions, recessions, the spread of infectious illness or other public health issues, inflation, changes in interest rates, lack of liquidity in the bond markets or adverse investor sentiment. In the past several years, financial markets have experienced increased volatility, depressed valuations, decreased liquidity and heightened uncertainty. These conditions may continue, recur, worsen or spread. A general rise in interest rates could adversely affect the price and liquidity of fixed-income securities and could also result in increased redemptions from the Fund.
At times, the Fund’s investments may represent industries or industry sectors that are interrelated or have common risks, making the Fund more susceptible to any economic, political, or regulatory developments or other risks affecting those industries and sectors. The Fund’s investments in foreign markets and countries with limited developing markets may subject the Fund to a greater degree of risk than investments in a developed market. These risks include disruptive political or economic conditions and the imposition of adverse governmental laws or currency exchange restrictions.
The Fund invests in below-investment-grade (high-yield) debt securities and preferred stocks. Some of these high-yield securities may be convertible into equity securities of the issuer. Debt securities rated below-investment-grade are commonly referred to as “junk bonds” and are considered speculative. These securities involve greater risk of loss, are subject to greater price volatility, and are less liquid, especially during periods of economic uncertainty or change, than higher rated debt securities.
The fund’s investments, payment obligations and financing terms may be based on floating rates, such as LIBOR (London Interbank Offered Rate). Plans are underway to phase out the use of LIBOR by the end of 2021. There remains uncertainty regarding the nature of any replacement rate and the impact of the transition from LIBOR on the fund, issuers of instruments in which the fund invests, and financial markets generally.
With the increased use of technologies such as the Internet to conduct business, the Fund is susceptible to operational, information security and related risks. While the Fund’s Adviser has established business continuity plans in the event of, and risk management systems to prevent, limit or mitigate, such cyber-attacks, there are inherent limitations in such plans
Pioneer Strategic Income Fund | Annual Report | 9/30/20 103
and systems, including the possibility that certain risks have not been identified. Furthermore, the Fund cannot control the cybersecurity plans and systems put in place by service providers to the Fund such as Brown Brothers Harriman & Co., the Fund’s custodian and accounting agent, and DST Asset Manager Solutions, Inc., the Fund’s transfer agent. In addition, many beneficial owners of Fund shares hold them through accounts at broker-dealers, retirement platforms and other financial market participants over which neither the Fund nor Amundi exercises control. Each of these may in turn rely on service providers to them, which are also subject to the risk of cyber-attacks. Cybersecurity failures or breaches at Amundi or the Fund’s service providers or intermediaries have the ability to cause disruptions and impact business operations, potentially resulting in financial losses, interference with the Fund’s ability to calculate its net asset value, impediments to trading, the inability of Fund shareowners to effect share purchases, redemptions or exchanges or receive distributions, loss of or unauthorized access to private shareowner information and violations of applicable privacy and other laws, regulatory fines, penalties, reputational damage, or additional compliance costs. Such costs and losses may not be covered under any insurance. In addition, maintaining vigilance against cyber-attacks may involve substantial costs over time, and system enhancements may themselves be subject to cyber-attacks.
COVID-19
The respiratory illness COVID-19 caused by a novel coronavirus has resulted in a global pandemic and major disruption to economies and markets around the world, including the United States. Global financial markets have experienced extreme volatility and severe losses, and trading in many instruments has been disrupted. Liquidity for many instruments has been greatly reduced for periods of time. Some interest rates are very low and in some cases yields are negative. Some sectors of the economy and individual issuers have experienced particularly large losses. These circumstances may continue for an extended period of time, and may continue to affect adversely the value and liquidity of the Fund’s investments. The ultimate economic fallout from the pandemic, and the long-term impact on economies, markets, industries and individual issuers, are not known. Governments and central banks, including the Federal Reserve in the U.S., have taken extraordinary and unprecedented actions to support local and global economies and the financial markets. These actions have resulted in significant expansion of public debt, including in the U.S. The impact of these measures, and whether they will be effective to mitigate the
104 Pioneer Strategic Income Fund | Annual Report | 9/30/20
economic and market disruption, will not be known for some time. The consequences of high public debt, including its future impact on the economy and securities markets, likewise may not be known for some time.
The Fund’s prospectus contains unaudited information regarding the Fund’s principal risks. Please refer to that document when considering the Fund’s principal risks.
H. Insurance-Linked Securities (“ILS”)
The Fund invests in ILS. The Fund could lose a portion or all of the principal it has invested in an ILS, and the right to additional interest or dividend payments with respect to the security, upon the occurrence of one or more trigger events, as defined within the terms of an insurance-linked security. Trigger events, generally, are hurricanes, earthquakes, or other natural events of a specific size or magnitude that occur in a designated geographic region during a specified time period, and/or that involve losses or other metrics that exceed a specific amount. There is no way to accurately predict whether a trigger event will occur, and accordingly, ILS carry significant risk. The Fund is entitled to receive principal, and interest and/or dividend payments so long as no trigger event occurs of the description and magnitude specified by the instrument. In addition to the specified trigger events, ILS may expose the Fund to other risks, including but not limited to issuer (credit) default, adverse regulatory or jurisdictional interpretations and adverse tax consequences.
The Fund’s investments in ILS may include event-linked bonds. ILS also may include special purpose vehicles (“SPVs”) or similar instruments structured to comprise a portion of a reinsurer’s catastrophe-oriented business, known as quota share instruments (sometimes referred to as reinsurance sidecars), or to provide reinsurance relating to specific risks to insurance or reinsurance companies through a collateralized instrument, known as collateralized reinsurance. Structured reinsurance investments also may include industry loss warranties (“ILWs”). A traditional ILW takes the form of a bilateral reinsurance contract, but there are also products that take the form of derivatives, collateralized structures, or exchange-traded instruments.
Where the ILS are based on the performance of underlying reinsurance contracts, the Fund has limited transparency into the individual underlying contracts, and therefore must rely upon the risk assessment and sound underwriting practices of the issuer. Accordingly, it may be more difficult for the Adviser to fully evaluate the underlying risk profile of the Fund’s structured reinsurance investments, and therefore the Fund’s assets are placed at greater risk of loss than if the Adviser had more complete
Pioneer Strategic Income Fund | Annual Report | 9/30/20 105
information. Structured reinsurance instruments generally will be considered illiquid securities by the Fund. These securities may be difficult to purchase, sell or unwind. Illiquid securities also may be difficult to value. If the Fund is forced to sell an illiquid asset, the Fund may be forced to sell at a loss.
I. Repurchase Agreements
Repurchase agreements are arrangements under which the Fund purchases securities from a broker-dealer or a bank, called the counterparty, upon the agreement of the counterparty to repurchase the securities from the Fund at a later date, and at a specific price, which is typically higher than the purchase price paid by the Fund. The securities purchased serve as the Fund’s collateral for the obligation of the counterparty to repurchase the securities. The value of the collateral, including accrued interest, is required to be equal to or in excess of the repurchase price. The collateral for all repurchase agreements is held in safekeeping in the customer-only account of the Fund’s custodian or a sub-custodian of the Fund. The Adviser is responsible for determining that the value of the collateral remains at least equal to the repurchase price. In the event of a default by the counterparty, the Fund is entitled to sell the securities, but the Fund may not be able to sell them for the price at which they were purchased, thus causing a loss to the Fund. Additionally, if the counterparty becomes insolvent, there is some risk that the Fund will not have a right to the securities, or the immediate right to sell the securities.
As of and for the year ended September 30, 2020, the Fund had no open repurchase agreements.
J. Purchased Options
The Fund may purchase put and call options to seek to increase total return. Purchased call and put options entitle the Fund to buy and sell a specified number of shares or units of a particular security, currency or index at a specified price at a specific date or within a specific period of time. Upon the purchase of a call or put option, the premium paid by the Fund is included on the Statement of Assets and Liabilities as an investment. All premiums are marked-to-market daily, and any unrealized appreciation or depreciation is recorded on the Fund’s Statement of Operations. As the purchaser of an index option, the Fund has the right to receive a cash payment equal to any depreciation in the value of the index below the strike price of the option (in the case of a put) or equal to any appreciation in the value of the index over the strike price of the option (in the case of a call) as of the valuation date of the option. Premiums paid for purchased call and put options which have expired are treated as realized losses on investments on the Statement of Operations. Upon the exercise or
106 Pioneer Strategic Income Fund | Annual Report | 9/30/20
closing of a purchased put option, the premium is offset against the proceeds on the sale of the underlying security or financial instrument in order to determine the realized gain or loss on investments. Upon the exercise or closing of a purchased call option, the premium is added to the cost of the security or financial instrument. The risk associated with purchasing options is limited to the premium originally paid.
The average market value of purchased options contracts open during the year ended September 30, 2020, was $747,501. Open purchased options at September 30, 2020, are listed in the Schedule of Investments.
K. Option Writing
The Fund may write put and covered call options to seek to increase total return. When an option is written, the Fund receives a premium and becomes obligated to purchase or sell the underlying security at a fixed price, upon the exercise of the option. When the Fund writes an option, an amount equal to the premium received by the Fund is recorded as “Written options outstanding” on the Statement of Assets and Liabilities and is subsequently adjusted to the current value of the option written. Premiums received from writing options that expire unexercised are treated by the Fund on the expiration date as realized gains from investments on the Statement of Operations. The difference between the premium and the amount paid on effecting a closing purchase transaction, including brokerage commissions, is also treated as a realized gain on the Statement of Operations, or, if the premium is less than the amount paid for the closing purchase transaction, as a realized loss on the Statement of Operations. If a call option is exercised, the premium is added to the proceeds from the sale of the underlying security in determining whether the Fund has realized a gain or loss. The Fund as writer of an option bears the market risk of an unfavorable change in the price of the security underlying the written option.
The average market value of written options for the year ended September 30, 2020, was $(590,043). Open written options contracts at September 30, 2020, are listed in the Schedule of Investments.
L. Forward Foreign Currency Exchange Contracts
The Fund may enter into forward foreign currency exchange contracts (“contracts”) for the purchase or sale of a specific foreign currency at a fixed price on a future date. All contracts are marked-to-market daily at the applicable exchange rates, and any resulting unrealized appreciation or depreciation is recorded in the Fund’s financial statements. The Fund records realized gains and losses at the time a contract is offset by entry into a closing transaction or extinguished by delivery of the currency.
Pioneer Strategic Income Fund | Annual Report | 9/30/20 107
Risks may arise upon entering into these contracts from the potential inability of counterparties to meet the terms of the contract and from unanticipated movements in the value of foreign currencies relative to the U.S. dollar (see Note 7).
During the year ended September 30, 2020, the Fund had entered into various forward foreign currency exchange contracts that obligated the Fund to deliver or take delivery of currencies at specified future maturity dates. Alternatively, prior to the settlement date of a forward foreign currency exchange contract, the Fund may close out such contract by entering into an offsetting contract. The amount of cash deposited with the broker as collateral at September 30, 2020, is recorded as “Forwards collateral” on the Statement of Assets and Liabilities.
The average market value of forward foreign currency exchange contracts open during the year ended September 30, 2020, was $200,378,379. Open forward foreign currency exchange contracts outstanding at September 30, 2020, are listed in the Schedule of Investments.
M. Futures Contracts
The Fund may enter into futures transactions in order to attempt to hedge against changes in interest rates, securities prices and currency exchange rates or to seek to increase total return. Futures contracts are types of derivatives. All futures contracts entered into by the Fund are traded on a futures exchange. Upon entering into a futures contract, the Fund is required to deposit with a broker an amount of cash or securities equal to the minimum “initial margin” requirements of the associated futures exchange. The amount of cash deposited with the broker as collateral at September 30, 2020, is recorded as “Futures collateral” on the Statement of Assets and Liabilities.
Subsequent payments for futures contracts (“variation margin”) are paid or received by the Fund, depending on the daily fluctuation in the value of the contracts, and are recorded by the Fund as unrealized appreciation or depreciation. Cash received from or paid to the broker related to previous margin movement is held in a segregated account at the broker and is recorded as either “Due from broker for futures” or “Due to broker for futures” on the Statement of Assets and Liabilities. When the contract is closed, the Fund realizes a gain or loss equal to the difference between the opening and closing value of the contract as well as any fluctuation in foreign currency exchange rates where applicable. Futures contracts are subject to market risk, interest rate risk and currency exchange rate risk. Changes in value of the contracts may not directly correlate to the changes in value of the underlying securities. With futures, there is reduced
108 Pioneer Strategic Income Fund | Annual Report | 9/30/20
counterparty credit risk to the Fund since futures are exchange-traded and the exchange’s clearinghouse, as counterparty to all exchange-traded futures, guarantees the futures against default.
The average market value of futures contracts open during the year ended September 30, 2020, was $(870,298,187). Open futures contracts outstanding at September 30, 2020, are listed in the Schedule of Investments.
N. Credit Default Swap Contracts
A credit default swap is a contract between a buyer of protection and a seller of protection against a pre-defined credit event or an underlying reference obligation, which may be a single security or a basket or index of securities. The Fund may buy or sell credit default swap contracts to seek to increase the Fund’s income, or to attempt to hedge the risk of default on portfolio securities. A credit default swap index is used to hedge risk or take a position on a basket of credit entities or indices.
As a seller of protection, the Fund would be required to pay the notional (or other agreed-upon) value of the referenced debt obligation to the counterparty in the event of a default by a U.S. or foreign corporate issuer of a debt obligation, which would likely result in a loss to the Fund. In return, the Fund would receive from the counterparty a periodic stream of payments during the term of the contract, provided that no event of default occurred. The maximum exposure of loss to the seller would be the notional value of the credit default swaps outstanding. If no default occurs, the Fund would keep the stream of payments and would have no payment obligation. The Fund may also buy credit default swap contracts in order to hedge against the risk of default of debt securities, in which case the Fund would function as the counterparty referenced above.
As a buyer of protection, the Fund makes an upfront or periodic payment to the protection seller in exchange for the right to receive a contingent payment. An upfront payment made by the Fund, as the protection buyer, is recorded within the “Swap contracts, at value” line item on the Statement of Assets and Liabilities. Periodic payments received or paid by the Fund are recorded as realized gains or losses on the Statement of Operations.
Credit default swap contracts are marked-to-market daily using valuations supplied by independent sources, and the change in value, if any, is recorded within the “Swap contracts, at value” line item on the Statement of Assets and Liabilities. Payments received or made as a result of a credit
Pioneer Strategic Income Fund | Annual Report | 9/30/20 109
event or upon termination of the contract are recognized, net of the appropriate amount of the upfront payment, as realized gains or losses on the Statement of Operations.
Credit default swap contracts involving the sale of protection may involve greater risks than if the Fund had invested in the referenced debt instrument directly. Credit default swap contracts are subject to general market risk, liquidity risk, counterparty risk and credit risk. If the Fund is a protection buyer and no credit event occurs, it will lose its investment. If the Fund is a protection seller and a credit event occurs, the value of the referenced debt instrument received by the Fund, together with the periodic payments received, may be less than the amount the Fund pays to the protection buyer, resulting in a loss to the Fund. In addition, obligations under sell protection credit default swaps may be partially offset by net amounts received from settlement of buy protection credit default swaps entered into by the Fund for the same reference obligation with the same counterparty.
Certain swap contracts that are cleared through a central clearinghouse are referred to as centrally cleared swaps. All payments made or received by the Fund are pursuant to a centrally cleared swap contract with the central clearing party rather than the original counterparty. Upon entering into a centrally cleared swap contract, the Fund is required to make an initial margin deposit, either in cash or in securities. The daily change in value on open centrally cleared contracts is recorded as “Variation margin for centrally cleared swap contracts” on the Statement of Assets and Liabilities. Cash received from or paid to the broker related to previous margin movement is held in a segregated account at the broker and is recorded as either “Due from broker for swaps” or “Due to broker for swaps” on the Statement of Assets and Liabilities. The amount of cash deposited with a broker as collateral at September 30, 2020, is recorded as “Swaps collateral” on the Statement of Assets and Liabilities.
The average market value of credit default swap contracts open during the year ended September 30, 2020, was $(2,978,682). Open credit default swap contracts at September 30, 2020, are listed in the Schedule of Investments.
2. Management Agreement
The Adviser manages the Fund’s portfolio. Management fees are calculated daily and paid monthly at the annual rate of 0.60% of the Fund’s average daily net assets up to $1 billion, 0.55% of the next $9 billion of the fund’s average daily net assets 0.50% of the fund’s average daily net assets over $10 billion. For the year ended September 30, 2020, the effective management fee was equivalent to 0.56% of the Fund’s average daily net assets.
110 Pioneer Strategic Income Fund | Annual Report | 9/30/20
In addition, under the management and administration agreements, certain other services and costs, including accounting, regulatory reporting and insurance premiums, are paid by the Fund as administrative reimbursements. Included in “Due to affiliates” reflected on the Statement of Assets and Liabilities is $342,748 in management fees, administrative costs and certain other reimbursements payable to the Adviser at September 30, 2020.
3. Transfer Agent
DST Asset Manager Solutions, Inc. serves as the transfer agent to the Fund at negotiated rates. Transfer agent fees and payables shown on the Statement of Operations and the Statement of Assets and Liabilities, respectively, include sub-transfer agent expenses incurred through the Fund’s omnibus relationship contracts.
In addition, the Fund reimbursed the transfer agent for out-of-pocket expenses incurred by the transfer agent related to shareowner communications activities such as proxy and statement mailings, and outgoing phone calls. For the year ended September 30, 2020, such out-of-pocket expenses by class of shares were as follows:
| | | | |
| Shareowner Communications: | | | |
Class A | | $ | 101,120 | |
Class C | | | 34,967 | |
Class K | | | 9,329 | |
Class R | | | 5,354 | |
Class Y | | | 200,046 | |
| Total | | $ | 350,816 | |
4. Distribution and Service Plans
The Fund has adopted a distribution plan (the “Plan”) pursuant to Rule 12b-1 of the Investment Company Act of 1940 with respect to its Class A, Class C and Class R shares. Pursuant to the Plan, the Fund pays the Distributor 0.25% of the average daily net assets attributable to Class A shares as compensation for personal services and/or account maintenance services or distribution services with regard to Class A shares. Pursuant to the Plan, the Fund also pays the Distributor 1.00% of the average daily net assets attributable to Class C shares. The fee for Class C shares consists of a 0.25% service fee and a 0.75% distribution fee paid as compensation for personal services and/or account maintenance services or distribution services with regard to Class C shares. Pursuant to the Plan, the Fund further pays the Distributor 0.50% of the average daily net assets attributable to Class R
Pioneer Strategic Income Fund | Annual Report | 9/30/20 111
shares for distribution services. Included in “Due to affiliates” reflected on the Statement of Assets and Liabilities is $67,294 in distribution fees payable to the Distributor at September 30, 2020.
The Fund also has adopted a separate service plan for Class R shares (the “Service Plan”). The Service Plan authorizes the Fund to pay securities dealers, plan administrators or other service organizations that agree to provide certain services to retirement plans or plan participants holding shares of the Fund a service fee of up to 0.25% of the Fund’s average daily net assets attributable to Class R shares held by such plans.
In addition, redemptions of Class A and Class C shares may be subject to a contingent deferred sales charge (“CDSC”). A CDSC of 1.00% may be imposed on redemptions of certain net asset value purchases of Class A shares within 12 months of purchase. Redemptions of Class C shares within 12 months of purchase are subject to a CDSC of 1.00%, based on the lower of cost or market value of shares being redeemed. Shares purchased as part of an exchange remain subject to any CDSC that applied to the original purchase of those shares. There is no CDSC for Class K, Class R and Class Y shares. Proceeds from the CDSCs are paid to the Distributor. For the year ended September 30, 2020, CDSCs in the amount of $17,272 were paid to the Distributor.
5. Line of Credit Facility
The Fund, along with certain other funds in the Pioneer Family of Funds (the “Funds”), participates in a committed, unsecured revolving line of credit (“credit facility”). Borrowings are used solely for temporary or emergency purposes. The Fund may borrow up to the lesser of the amount available under the credit facility or the limits set for borrowing by the Fund’s prospectus and the 1940 Act. Effective March 11, 2020, the Fund participates in a facility in the amount of $300 million. Prior to March 11, 2020, the Fund participated in a facility in the amount of $250 million. Under such facility, depending on the type of loan, interest on borrowings is payable at the London Interbank Offered Rate (“LIBOR”) plus a credit spread. The Fund also pays an annual commitment fee to participate in a credit facility. The commitment fee is allocated among participating Funds based on an allocation schedule set forth in the credit agreement. For the year ended September 30, 2020, the Fund had no borrowings under the credit facility.
112 Pioneer Strategic Income Fund | Annual Report | 9/30/20
6. Master Netting Agreements
The Fund has entered into an International Swaps and Derivatives Association, Inc. Master Agreement (“ISDA Master Agreement”) or similar agreement with substantially all its derivative counterparties. An ISDA Master Agreement is a bilateral agreement between the Fund and a counterparty that governs the trading of certain Over the Counter (“OTC”) derivatives and typically contains, among other things, close-out and set-off provisions which apply upon the occurrence of an event of default and/or a termination event as defined under the relevant ISDA Master Agreement. The ISDA Master Agreement may also give a party the right to terminate all transactions traded under such agreement if, among other things, there is deterioration in the credit quality of the other party.
Upon an event of default or a termination of the ISDA Master Agreement, the non-defaulting party has the right to close-out all transactions under such agreement and to net amounts owed under each transaction to determine one net amount payable by one party to the other. The right to close out and net payments across all transactions under the ISDA Master Agreement could result in a reduction of the Fund’s credit risk to its counterparty equal to any amounts payable by the Fund under the applicable transactions, if any. However, the Fund’s right to set-off may be restricted or prohibited by the bankruptcy or insolvency laws of the particular jurisdiction to which each specific ISDA Master Agreement of each counterparty is subject.
The collateral requirements for derivatives transactions under an ISDA Master Agreement are governed by a credit support annex to the ISDA Master Agreement. Collateral requirements are generally determined at the close of business each day and are typically based on changes in market values for each transaction under an ISDA Master Agreement and netted into one amount for such agreement. Generally, the amount of collateral due from or to a counterparty is subject to threshold (a “minimum transfer amount”) before a transfer is required, which may vary by counterparty. Collateral pledged for the benefit of the Fund and/or counterparty is held in segregated accounts by the Fund’s custodian and cannot be sold, re-pledged, assigned or otherwise used while pledged. Cash that has been segregated to cover the Fund’s collateral obligations, if any, will be reported separately on the Statement of Assets and Liabilities as “Swaps collateral”. Securities pledged by the Fund as collateral, if any, are identified as such in the Schedule of Investments.
Pioneer Strategic Income Fund | Annual Report | 9/30/20 113
Financial instruments subject to an enforceable master netting agreement, such as an ISDA Master Agreement, have been offset on the Statement of Assets and Liabilities. The following charts show gross assets and liabilities of the Fund as of September 30, 2020.
| | | | | | | | | | | | | | | | |
| | Derivative | | | | | | | | | | | | | |
| | Assets | | | | | | | | | | | | | |
| | Subject to | | | Derivatives | | | Non-Cash | | | Cash | | | Net Amount | |
| | Master Netting | | | Available | | | Collateral | | | Collateral | | | of Derivative | |
| Counterparty | | Agreement | | | for Offset | | | Received (a) | | | Received (a)
| | | Assets (b) | |
Bank of America NA | | $ | 229,086 | | | $ | (229,086 | ) | | $ | — | | | $ | — | | | $ | — | |
Bank of New York | | | | | | | | | | | | | | | | | | | | |
| Mellon Corp. | | | — | * | | | — | | | | — | | | | — | | | | — | |
Citibank NA | | | 228,148 | | | | (76,192 | ) | | | — | | | | — | | | | 151,956 | |
Goldman Sachs | | | | | | | | | | | | | | | | | | | | |
| International | | | 592,925 | | | | (394,253 | ) | | | — | | | | (198,672 | ) | | | — | |
HSBC Bank NA | | | 46,755 | | | | (46,755 | ) | | | — | | | | — | | | | — | |
JPMorgan Chase | | | | | | | | | | | | | | | | | | | | |
| Bank NA | | | 288,828 | | | | (288,828 | ) | | | — | | | | — | | | | — | |
State Street | | | | | | | | | | | | | | | | | | | | |
Bank & Trust Co. | | | 469,761 | | | | (58,258 | ) | | | — | | | | — | | | | 411,503 | |
| Total | | $ | 1,855,503 | | | $ | (1,093,372 | ) | | $ | — | | | $ | (198,672 | ) | | $ | 563,459 | |
| | |
| | Derivative | | | | | | | | | | | | | | | | | |
| | Liabilities | | | | | | | | | | | | | | | | | |
| | Subject to | | | Derivatives | | | Non-Cash | | | Cash | | | Net Amount | |
| | Master Netting | | | Available | | | Collateral | | | Collateral | | | of Derivative | |
| Counterparty | | Agreement | | | for Offset | | | Pledged (a)
| | | Pledged (a) | | | Liabilities (c) | |
Bank of America NA | | $ | 4,037,471 | | | $ | (229,086 | ) | | $ | — | | | $ | — | | | $ | 3,808,385 | |
Bank of New York | | | | | | | | | | | | | | | | | | | | |
| Mellon Corp. | | | 245,742 | | | | — | * | | | — | | | | (245,742 | ) | | | — | |
Citibank NA | | | 76,192 | | | | (76,192 | ) | | | — | | | | — | | | | — | |
Goldman Sachs | | | | | | | | | | | | | | | | | | | | |
| International | | | 394,253 | | | | (394,253 | ) | | | — | | | | — | | | | — | |
HSBC Bank NA | | | 397,188 | | | | (46,755 | ) | | | — | | | | — | | | | 350,433 | |
JPMorgan Chase | | | | | | | | | | | | | | | | | | | | |
| Bank NA | | | 290,639 | | | | (288,828 | ) | | | — | | | | — | | | | 1,811 | |
State Street | | | | | | | | | | | | | | | | | | | | |
Bank & Trust Co. | | | 58,258 | | | | (58,258 | ) | | | — | | | | — | | | | — | |
| Total | | $ | 5,499,743 | | | $ | (1,093,372 | ) | | $ | — | | | $ | (245,742 | ) | | $ | 4,160,629 | |
* Includes securities that are valued at $0.
(a) The amount presented here may be less than the total amount of collateral received/pledged as the net amount of derivative assets and liabilities cannot be less than $0.
(b) Represents the net amount due from the counterparty in the event of default.
(c) Represents the net amount payable to the counterparty in the event of default.
114 Pioneer Strategic Income Fund | Annual Report | 9/30/20
7. Additional Disclosures about Derivative Instruments and Hedging Activities
The Fund’s use of derivatives may enhance or mitigate the Fund’s exposure to the following risks:
Interest rate risk relates to the fluctuations in the value of interest-bearing securities due to changes in the prevailing levels of market interest rates.
Credit risk relates to the ability of the issuer of a financial instrument to make further principal or interest payments on an obligation or commitment that it has to the Fund.
Foreign exchange rate risk relates to fluctuations in the value of an asset or liability due to changes in currency exchange rates.
Equity risk relates to the fluctuations in the value of financial instruments as a result of changes in market prices (other than those arising from interest rate risk or foreign exchange rate risk), whether caused by factors specific to an individual investment, its issuer, or all factors affecting all instruments traded in a market or market segment.
Commodity risk relates to the risk that the value of a commodity or commodity index will fluctuate based on increases or decreases in the commodities market and factors specific to a particular industry or commodity.
The fair value of open derivative instruments (not considered to be hedging instruments for accounting disclosure purposes) by risk exposure at September 30, 2020, was as follows:
| | | | | | | | | | | | | | | | |
| Statement of Assets and Liabilities | | | | |
| | | | | | | | Foreign | | | | | | | |
| | Interest | | | Credit | | | Exchange | | | Equity | | | Commodity | |
| | Rate Risk | | | Risk | | | Rate Risk | | | Risk | | | Risk | |
| Assets: | | | | | | | | | | | | | | | |
| Options purchased* | | $ | — | | | $ | — | | | $ | 618,061 | | | $ | — | ** | | $ | — | |
Swap contracts, at value | | | — | | | | 9,071,434 | | | | — | | | | — | | | | — | |
| Total Value | | $ | — | | | $ | 9,071,434 | | | $ | 618,061 | | | $ | — | ** | | $ | — | |
| Liabilities | | | | | | | | | | | | | | | | | | | | |
| Written options | | | | | | | | | | | | | | | | | | | | |
| outstanding | | $ | — | | | $ | — | | | $ | 1,578,624 | | | $ | — | | | $ | — | |
| Net unrealized | | | | | | | | | | | | | | | | | | | | |
| depreciation on | | | | | | | | | | | | | | | | | | | | |
| forward foreign | | | | | | | | | | | | | | | | | | | | |
| currency exchange | | | | | | | | | | | | | | | | | | | | |
| contracts | | | — | | | | — | | | | 2,683,677 | | | | — | | | | — | |
| Net unrealized | | | | | | | | | | | | | | | | | | | | |
| depreciation on | | | | | | | | | | | | | | | | | | | | |
futures contracts | | | 1,256,523 | | | | — | | | | — | | | | — | | | | — | |
| Total Value | | $ | 1,256,523 | | | $ | — | | | $ | 4,262,301 | | | $ | — | | | $ | — | |
* Reflects the market value of purchased option contracts (see Note 1J.). These amounts are included in investments in unaffiliated issuers, at value, on the statement of assets and liabilities.
** Includes securities that are valued at $0.
Pioneer Strategic Income Fund | Annual Report | 9/30/20 115
The effect of derivative instruments (not considered to be hedging instruments for accounting disclosure purposes) on the Statement of Operations by risk exposure at September 30, 2020, was as follows:
| | | | | | | | | | | | | | | | |
Statement of Operations
| | | | |
| | | | | | | | Foreign | | | | | | | |
| | Interest | | | Credit | | | Exchange | | | Equity | | | Commodity | |
| | Rate Risk | | | Risk | | | Rate Risk | | | Risk | | | Risk | |
| Net realized gain (loss) on: | | | | | | | | | | | | | | | |
| Options purchased* | | $ | — | | | $ | — | | | $ | (915,214 | ) | | $ | — | | | $ | — | |
| Written options | | | — | | | | — | | | | 915,214 | | | | — | | | | — | |
| Forward foreign | | | | | | | | | | | | | | | | | | | | |
| currency exchange | | | | | | | | | | | | | | | | | | | | |
| contracts | | | — | | | | — | | | | 8,015,596 | | | | — | | | | — | |
| Futures contracts | | | (31,790,548 | ) | | | — | | | | — | | | | — | | | | — | |
Swap contracts | | | — | | | | (9,366,867 | ) | | | — | | | | — | | | | — | |
| Total Value | | $ | (31,790,548 | ) | | $ | (9,366,867 | ) | | $ | 8,015,596 | | | $ | — | | | $ | — | |
| Change in net unrealized | | | | | | | | | | | | | | | | | | | | |
| appreciation | | | | | | | | | | | | | | | | | | | | |
| (depreciation) on: | | | | | | | | | | | | | | | | | | | | |
| Options purchased** | | $ | — | | | $ | — | | | $ | (1,787,909 | ) | | $ | — | *** | | $ | — | |
| Written options | | | — | | | | — | | | | (775,647 | ) | | | — | | | | — | |
| Forward foreign | | | | | | | | | | | | | | | | | | | | |
| currency exchange | | | | | | | | | | | | | | | | | | | | |
| contracts | | | — | | | | — | | | | 173,642 | | | | — | | | | — | |
| Futures contracts | | | (5,345,773 | ) | | | — | | | | — | | | | — | | | | — | |
Swap contracts | | | — | | | | 10,820,264 | | | | — | | | | — | | | | — | |
| Total Value | | $ | (5,345,773 | ) | | $ | 10,820,264 | | | $ | (2,389,914 | ) | | $ | — | *** | | $ | — | |
* Reflects the net realized gain (loss) on purchased option contracts (see Note 1J). These amounts are included in Net realized gain (loss) on investments in unaffiliated issuers, on the Statement of Operations.
** Reflects the change in net unrealized appreciation (depreciation) on purchased option contracts (see Note 1J.). These amounts are included in change in net unrealized appreciation (depreciation) on Investments in unaffiliated issuers, on the statements of operations.
*** Includes securities that are valued at $0.
8. Unfunded Loan Commitments
The Fund may enter into unfunded loan commitments. Unfunded loan commitments may be partially or wholly unfunded. During the contractual period, the Fund is obliged to provide funding to the borrower upon demand. A fee is earned by the Fund on the unfunded loan commitment and is recorded as interest income on the Statement of Operations. Unfunded loan commitments are fair valued in accordance with the valuation policy described in Footnote 1A and unrealized appreciation or depreciation, if any, is recorded on the Statement of Assets and Liabilities.
116 Pioneer Strategic Income Fund | Annual Report | 9/30/20
As of September 30, 2020, the Fund had the following unfunded loan commitment outstanding:
| | | | | | | | | | | | | |
| | | | | | | | | | | Unrealized | |
| Loan | | Principal | | | Cost | | | Value | | | Depreciation | |
Grupo Aeromexico, Sociedad | | | | | | | | | | | | |
| Anonima Bursatil De Capital | | | | | | | | | | | | |
Variable, Senior Secured Tranche 1 | | $ | 1,518,333 | | | $ | 1,503,453 | | | $ | 1,503,150 | | | $ | (303 | ) |
| Total Value | | $ | 1,518,333 | | | $ | 1,503,453 | | | $ | 1,503,150 | | | $ | (303 | ) |
9. Subsequent Event
On November 19, 2020, Amundi Pioneer Asset Management announced it will be rebranding the US business of Amundi as Amundi US effective January 1, 2021. The new brand identity will replace Amundi Pioneer, which was first adopted in July 2017 following the acquisition of Pioneer Investments by Amundi. In connection with these changes, Amundi Pioneer Asset Management. Inc., the investment adviser to the Pioneer funds, will change its name to Amundi Asset Management US, Inc. In addition, Amundi Pioneer Distributor, Inc., the Pioneer funds’ distributor, will change its name to Amundi Distributor US, Inc. The names of the Pioneer funds will not change in connection with this rebranding.
Pioneer Strategic Income Fund | Annual Report | 9/30/20 117
Report of Independent Registered PublicAccounting FirmTo the Board of Trustees of Pioneer Series Trust XIV and the Shareowners of
Pioneer Strategic Income Fund:
Opinion on the Financial Statements
We have audited the accompanying statement of assets and liabilities of Pioneer Strategic Income Fund (the “Fund”) (one of the funds constituting Pioneer Series Trust XIV (the “Trust”)), including the schedule of investments, as of September 30, 2020, and the related statement of operations for the year then ended, the statements of changes in net assets for each of the two years in the period then ended, the financial highlights for each of the four years in the period then ended and the related notes (collectively referred to as the “financial statements”). The financial highlights for the period ended September 30, 2016 were audited by another independent registered public accounting firm whose report, dated November 22, 2016, expressed an unqualified opinion on those financial highlights. In our opinion, the financial statements present fairly, in all material respects, the financial position of the Fund (one of the funds constituting Pioneer Series Trust XIV) at September 30, 2020, the results of its operations for the year then ended, the changes in its net assets for each of the two years in the period then ended, and its financial highlights for each of the four years in the period then ended, in conformity with U.S. generally accepted accounting principles.
Basis for Opinion
These financial statements are the responsibility of the Trust’s management. Our responsibility is to express an opinion on the Fund’s financial statements based on our audits. We are a public accounting firm registered with the Public Company Accounting Oversight Board (United States) (“PCAOB”) and are required to be independent with respect to the Fund in accordance with the U.S. federal securities laws and the applicable rules and regulations of the Securities and Exchange Commission and the PCAOB.
We conducted our audits in accordance with the standards of the PCAOB. Those standards require that we plan and perform the audit to obtain reasonable assurance about whether the financial statements are free of material misstatement, whether due to error or fraud. The Trust is not required to have, nor were we engaged to perform, an audit of the Trust’s internal control over financial reporting. As part of our audits, we are
118 Pioneer Strategic Income Fund | Annual Report | 9/30/20
required to obtain an understanding of internal control over financial reporting, but not for the purpose of expressing an opinion on the effectiveness of the Trust’s internal control over financial reporting. Accordingly, we express no such opinion.
Our audits included performing procedures to assess the risks of material misstatement of the financial statements, whether due to error or fraud, and performing procedures that respond to those risks. Such procedures included examining, on a test basis, evidence regarding the amounts and disclosures in the financial statements. Our procedures included confirmation of securities owned as of September 30, 2020, by correspondence with the custodian and others or by other appropriate auditing procedures where replies from others were not received. Our audits also included evaluating the accounting principles used and significant estimates made by management, as well as evaluating the overall presentation of the financial statements. We believe that our audits provide a reasonable basis for our opinion.
We have served as the auditor of one or more Amundi Pioneer investment companies since 2017.
Boston, Massachusetts
November 25, 2020
Pioneer Strategic Income Fund | Annual Report | 9/30/20 119
Additional Information (unaudited)
The percentages of the Fund’s ordinary income distributions that are exempt from nonresident alien (NRA) tax withholding resulting from qualified interest income was 74.41%.
120 Pioneer Strategic Income Fund | Annual Report | 9/30/20
Statement Regarding Liquidity Risk Management Program
As required by law, the Fund has adopted and implemented a liquidity risk management program (the “Program”) that is designed to assess and manage liquidity risk. Liquidity risk is the risk that the Fund could not meet requests to redeem its shares without significant dilution of remaining investors’ interests in the Fund. The Fund’s Board of Trustees designated a liquidity risk management committee (the “Committee”) consisting of employees of Amundi Pioneer Asset Management, Inc. (the “Adviser”) to administer the Program.
The Committee provided the Board of Trustees with a report that addressed the operation of the Program and assessed its adequacy and effectiveness of implementation (the “Report”). The Report covered the period from December 1, 2018 through March 31, 2020 (the “Reporting Period”).
The Report confirmed that, throughout the Reporting Period, the Committee had monitored the Fund’s portfolio liquidity and liquidity risk on an ongoing basis, as described in the Program and in Board reporting throughout the Reporting Period.
The Report discussed the Committee’s annual review of the Program, which addressed, among other things, the following elements of the Program:
The Committee reviewed the Fund’s investment strategy and liquidity of portfolio investments during both normal and reasonably foreseeable stressed conditions. The Committee noted that the Fund’s investment strategy continues to be appropriate for an open-end fund, taking into account, among other things, whether and to what extent the Fund held less liquid and illiquid assets and the extent to which any such investments affected the Fund’s ability to meet redemption requests. In managing and reviewing the Fund’s liquidity risk, the Committee also considered the extent to which the Fund’s investment strategy involves a relatively concentrated portfolio or large positions in particular issuers, the extent to which the Fund uses borrowing for investment purposes, and the extent to which the Fund uses derivatives (including for hedging purposes). The Committee also reviewed the Fund’s short-term and long-term cash flow projections during both normal and reasonably foreseeable stressed conditions. In assessing the Fund’s cash flow projections, the Committee considered, among other factors, historical net redemption activity, redemption policies, ownership concentration, distribution channels, and the degree of certainty associated with the Fund’s short-term and long-
Pioneer Strategic Income Fund | Annual Report | 9/30/20 121
term cash flow projections. The Committee also considered the Fund’s holdings of cash and cash equivalents, as well as borrowing arrangements and other funding sources, including, if applicable, the Fund’s participation in a credit facility, as components of the Fund’s ability to meet redemption requests. The Fund has adopted an in-kind redemption policy which may be utilized to meet larger redemption requests.
The Committee reviewed the Program’s liquidity classification methodology for categorizing the Fund’s investments into one of four liquidity buckets. In reviewing the Fund’s investments, the Committee considered, among other factors, whether trading varying portions of a position in a particular portfolio investment or asset class in sizes the Fund would reasonably anticipate trading, would be reasonably expected to significantly affect liquidity.
The Committee performed an analysis to determine whether the Fund is required to maintain a Highly Liquid Investment Minimum, and determined that no such minimum is required because the Fund primarily holds highly liquid investments.
The Report stated that the Committee concluded the Program operates adequately and effectively, in all material respects, to assess and manage the Fund’s liquidity risk throughout the Reporting Period.
122 Pioneer Strategic Income Fund | Annual Report | 9/30/20
Approval of Investment Management Agreement
Amundi Pioneer Asset Management, Inc. (“APAM”) serves as the investment adviser to Pioneer Strategic Income Fund (the “Fund”) pursuant to an investment management agreement between APAM and the Fund. In order for APAM to remain the investment adviser of the Fund, the Trustees of the Fund must determine annually whether to renew the investment management agreement for the Fund.
The contract review process began in January 2020 as the Trustees of the Fund agreed on, among other things, an overall approach and timeline for the process. Contract review materials were provided to the Trustees in March 2020, July 2020 and September 2020. In addition, the Trustees reviewed and discussed the Fund’s performance at regularly scheduled meetings throughout the year, and took into account other information related to the Fund provided to the Trustees at regularly scheduled meetings, in connection with the review of the Fund’s investment management agreement.
In March 2020, the Trustees, among other things, discussed the memorandum provided by Fund counsel that summarized the legal standards and other considerations that are relevant to the Trustees in their deliberations regarding the renewal of the investment management agreement, and reviewed and discussed the qualifications of the investment management teams for the Fund, as well as the level of investment by the Fund’s portfolio managers in the Fund. In July 2020, the Trustees, among other things, reviewed the Fund’s management fees and total expense ratios, the financial statements of APAM and its parent companies, profitability analyses provided by APAM, and analyses from APAM as to possible economies of scale. The Trustees also reviewed the profitability of the institutional business of APAM and APAM’s affiliate, Amundi Pioneer Institutional Asset Management, Inc. (“APIAM” and, together with APAM, “Amundi”), as compared to that of APAM’s fund management business, and considered the differences between the fees and expenses of the Fund and the fees and expenses of APAM’s and APIAM’s institutional accounts, as well as the different services provided by APAM to the Fund and by APAM and APIAM to the institutional accounts. The Trustees further considered contract review materials, including additional materials received in response to the Trustees’ request, in September 2020.
At a meeting held on September 15, 2020, based on their evaluation of the information provided by APAM and third parties, the Trustees of the Fund, including the Independent Trustees voting separately, unanimously
Pioneer Strategic Income Fund | Annual Report | 9/30/20 123
approved the renewal of the investment management agreement for another year. In approving the renewal of the investment management agreement, the Trustees considered various factors that they determined were relevant, including the factors described below. The Trustees did not identify any single factor as the controlling factor in determining to approve the renewal of the agreement.
Nature, Extent and Quality of Services
The Trustees considered the nature, extent and quality of the services that had been provided by APAM to the Fund, taking into account the investment objective and strategy of the Fund. The Trustees also reviewed APAM’s investment approach for the Fund and its research process. The Trustees considered the resources of APAM and the personnel of APAM who provide investment management services to the Fund. They also reviewed the amount of non-Fund assets managed by the portfolio managers of the Fund. They considered the non-investment resources and personnel of APAM that are involved in APAM’s services to the Fund, including APAM’s compliance, risk management, and legal resources and personnel. The Trustees noted the substantial attention and high priority given by APAM’s senior management to the Pioneer Fund complex. The Trustees considered the implementation and effectiveness of APAM’s business continuity plan in response to the COVID-19 pandemic.
The Trustees considered that APAM supervises and monitors the performance of the Fund’s service providers and provides the Fund with personnel (including Fund officers) and other resources that are necessary for the Fund’s business management and operations. The Trustees also considered that, as administrator, APAM is responsible for the administration of the Fund’s business and other affairs. The Trustees considered the fees paid to APAM for the provision of administration services.
Based on these considerations, the Trustees concluded that the nature, extent and quality of services that had been provided by APAM to the Fund were satisfactory and consistent with the terms of the investment management agreement.
Performance of the Fund
In considering the Fund’s performance, the Trustees regularly review and discuss throughout the year data prepared by APAM and information comparing the Fund’s performance with the performance of its peer group of funds, as classified by Morningstar, Inc. (Morningstar), and with the performance of the Fund’s benchmark index. They also discuss the Fund’s
124 Pioneer Strategic Income Fund | Annual Report | 9/30/20
performance with APAM on a regular basis. The Trustees’ regular reviews and discussions were factored into the Trustees’ deliberations concerning the renewal of the investment management agreement.
Management Fee and Expenses
The Trustees considered information showing the fees and expenses of the Fund in comparison to the management fees of its peer group of funds as classified by Morningstar and also to the expense ratios of a peer group of funds selected on the basis of criteria determined by the Independent Trustees for this purpose using data provided by Strategic Insight Mutual Fund Research and Consulting, LLC (Strategic Insight), an independent third party. The peer group comparisons referred to below are organized in quintiles. Each quintile represents one-fifth of the peer group. In all peer group comparisons referred to below, first quintile is most favorable to the Fund’s shareowners. The Trustees noted that they separately review and consider the impact of the Fund’s transfer agency and Fund- and APAM-paid expenses for sub-transfer agency and intermediary arrangements, and that the results of the most recent such review were considered in the consideration of the Fund’s expense ratio.
The Trustees considered that the Fund’s management fee for the most recent fiscal year was in the third quintile relative to the management fees paid by other funds in its Morningstar category for the comparable period. The Trustees also considered the breakpoints in the management fee schedule and the reduced fee rates above certain asset levels. The Trustees considered that the expense ratio of the Fund’s Class A shares for the most recent fiscal year was in the fourth quintile relative to its Strategic Insight peer group for the comparable period. The Trustees considered that the expense ratio of the Fund’s Class Y shares for the most recent fiscal year was in the third quintile relative to its Strategic Insight peer group for the comparable period.
The Trustees reviewed management fees charged by APAM and APIAM to institutional and other clients, including publicly offered European funds sponsored by APAM’s affiliates, unaffiliated U.S. registered investment companies (in a sub-advisory capacity), and unaffiliated foreign and domestic separate accounts. The Trustees also considered APAM’s costs in providing services to the Fund and APAM’s and APIAM’s costs in providing services to the other clients and considered the differences in management fees and profit margins for fund and non-fund services. In evaluating the fees associated with APAM’s and APIAM’s client accounts, the Trustees took into account the respective demands, resources and complexity associated with the Fund and other client accounts. The Trustees noted
Pioneer Strategic Income Fund | Annual Report | 9/30/20 125
that, in some instances, the fee rates for those clients were lower than the management fee for the Fund and considered that, under the investment management agreement with the Fund, APAM performs additional services for the Fund that it does not provide to those other clients or services that are broader in scope, including oversight of the Fund’s other service providers and activities related to compliance and the extensive regulatory and tax regimes to which the Fund is subject. The Trustees also considered the entrepreneurial risks associated with APAM’s management of the Fund.
The Trustees concluded that the management fee payable by the Fund to APAM was reasonable in relation to the nature and quality of the services provided by APAM.
Profitability
The Trustees considered information provided by APAM regarding the profitability of APAM with respect to the advisory services provided by APAM to the Fund, including the methodology used by APAM in allocating certain of its costs to the management of the Fund. The Trustees also considered APAM’s profit margin in connection with the overall operation of the Fund. They further reviewed the financial results, including the profit margins, realized by APAM and APIAM from non-fund businesses. The Trustees considered APAM’s profit margins in comparison to the limited industry data available and noted that the profitability of any adviser was affected by numerous factors, including its organizational structure and method for allocating expenses. The Trustees concluded that APAM’s profitability with respect to the management of the Fund was not unreasonable.
Economies of Scale
The Trustees considered APAM’s views relating to economies of scale in connection with the Pioneer Funds as fund assets grow and the extent to which any such economies of scale are shared with the Fund and Fund shareholders. The Trustees noted the breakpoints in the management fee schedule. The Trustees recognize that economies of scale are difficult to identify and quantify, and that, among other factors that may be relevant, are the following: fee levels, expense subsidization, investment by APAM in research and analytical capabilities and APAM’s commitment and resource allocation to the Fund. The Trustees noted that profitability also may be an indicator of the availability of any economies of scale, although profitability may vary for other reasons including due to reductions in expenses. The Trustees concluded that economies of scale, if any, were being appropriately shared with the Fund.
126 Pioneer Strategic Income Fund | Annual Report | 9/30/20
Other Benefits
The Trustees considered the other benefits that APAM enjoys from its relationship with the Fund. The Trustees considered the character and amount of fees paid or to be paid by the Fund, other than under the investment management agreement, for services provided by APAM and its affiliates. The Trustees further considered the revenues and profitability of APAM’s businesses other than the Fund business. To the extent applicable, the Trustees also considered the benefits to the Fund and to APAM and its affiliates from the use of “soft” commission dollars generated by the Fund to pay for research and brokerage services.
The Trustees considered that Amundi is the principal U.S. asset management business of Amundi, which is one of the largest asset managers globally. Amundi’s worldwide asset management business manages over $1.7 trillion in assets (including the Pioneer Funds). The Trustees considered that APAM’s relationship with Amundi creates potential opportunities for APAM, APIAM and Amundi that derive from APAM’s relationships with the Fund, including Amundi’s ability to market the services of APAM globally. The Trustees noted that APAM has access to additional research and portfolio management capabilities as a result of its relationship with Amundi and Amundi’s enhanced global presence that may contribute to an increase in the resources available to APAM. The Trustees considered that APAM and the Fund receive reciprocal intangible benefits from the relationship, including mutual brand recognition and, for the Fund, direct and indirect access to the resources of a large global asset manager. The Trustees concluded that any such benefits received by APAM as a result of its relationship with the Fund were reasonable.
Conclusion
After consideration of the factors described above as well as other factors, the Trustees, including the Independent Trustees, concluded that the investment management agreement for the Fund, including the fees payable thereunder, was fair and reasonable and voted to approve the proposed renewal of the investment management agreement.
Pioneer Strategic Income Fund | Annual Report | 9/30/20 127
Trustees, Officers and Service ProvidersInvestment Adviser and AdministratorAmundi Pioneer Asset Management, Inc.
Custodian and Sub-AdministratorBrown Brothers Harriman & Co.
Independent Registered Public Accounting FirmErnst & Young LLP
Principal UnderwriterAmundi Pioneer Distributor, Inc.
Legal CounselMorgan, Lewis & Bockius LLP
Transfer AgentDST Asset Manager Solutions, Inc.
Proxy Voting Policies and Procedures of the Fund are available without charge, upon request, by calling our toll free number (1-800-225-6292). Information regarding how the Fund voted proxies relating to portfolio securities during the most recent 12-month period ended June 30 is publicly available to shareowners at www.amundipioneer.com/us. This information is also available on the Securities and Exchange Commission’s web site at www.sec.gov.
Trustees and Officers
The Fund’s Trustees and officers are listed below, together with their principal occupations and other directorships they have held during at least the past five years. Trustees who are interested persons of the Fund within the meaning of the 1940 Act are referred to as Interested Trustees. Trustees who are not interested persons of the Fund are referred to as Independent Trustees. Each of the Trustees serves as a Trustee of each of the 45 U.S. registered investment portfolios for which Amundi serves as investment adviser (the “Pioneer Funds”). The address for all Trustees and all officers of the Fund is 60 State Street, Boston, Massachusetts 02109.
The Statement of Additional Information of the Fund includes additional information about the Trustees and is available, without charge, upon request, by calling 1-800-225-6292.
128 Pioneer Strategic Income Fund | Annual Report | 9/30/20
Independent Trustees
| | | | |
| Name, Age and Position | Term of Office and | | Other Directorships |
| Held With the Fund | Length of Service | Principal Occupation | Held by Trustee |
Thomas J. Perna (69) Chairman of the Board and Trustee | Trustee since 2006. Serves until a successor trustee is elected or earlier retirement or removal. | Private investor (2004 – 2008 and 2013 – present); Chairman (2008 – 2013) and Chief Executive Officer (2008 – 2012), Quadriserv, Inc. (technology products for securities lending industry); and Senior Executive Vice President, The Bank of New York (financial and securities services) (1986 – 2004) | Director, Broadridge Financial Solutions, Inc. (investor communications and securities processing provider for financial services industry) (2009 – present); Director, Quadriserv, Inc. (2005 – 2013); and Commissioner, New Jersey State Civil Service Commission (2011 – 2015) |
John E. Baumgardner, Jr. (69) Trustee | Trustee since 2019. Serves until a successor trustee is elected or earlier retirement or removal. | Of Counsel (2019 – present), Partner (1983-2018), Sullivan & Cromwell LLP (law firm). | Chairman, The Lakeville Journal Company, LLC, (privately-held community newspaper group) (2015-present) |
Diane Durnin (63) Trustee | Trustee since 2019. Serves until a successor trustee is elected or earlier retirement or removal.
| Managing Director - Head of Product Strategy and Development, BNY Mellon Investment Management (investment management firm) (2012-2018); Vice Chairman – The Dreyfus Corporation (2005 – 2018): Executive Vice President Head of Product, BNY Mellon Investment Management (2007-2012); Executive Director- Product Strategy, Mellon Asset Management (2005-2007); Executive Vice President Head of Products, Marketing and Client Service, Dreyfus Corporation (investment management firm) (2000-2005); and Senior Vice President Strategic Product and Business Development, Dreyfus Corporation (1994-2000) | None |
Pioneer Strategic Income Fund | Annual Report | 9/30/20 129
Independent Trustees (continued)
| | | | |
| Name, Age and Position | Term of Office and | | Other Directorships |
| Held With the Fund | Length of Service | Principal Occupation | Held by Trustee |
Benjamin M. Friedman (76) Trustee | Trustee since 2008. Serves until a successor trustee is elected or earlier retirement or removal. | William Joseph Maier Professor of Political Economy, Harvard University (1972 – present) | Trustee, Mellon Institutional Funds Investment Trust and Mellon Institutional Funds Master Portfolio (oversaw 17 portfolios in fund complex) (1989 - 2008) |
Lorraine H. Monchak (64) Trustee
| Trustee since 2017. (Advisory Trustee from 2014 - 2017). Serves until a successor trustee is elected or earlier retirement or removal. | Chief Investment Officer, 1199 SEIU Funds (healthcare workers union pension funds) (2001 – present); Vice President – International Investments Group, American International Group, Inc. (insurance company) (1993 – 2001); Vice President – Corporate Finance and Treasury Group, Citibank, N.A. (1980 – 1986 and 1990 – 1993); Vice President – Asset/Liability Management Group, Federal Farm Funding Corporation (government-sponsored issuer of debt securities) (1988 – 1990); Mortgage Strategies Group, Shearson Lehman Hutton, Inc. (investment bank) (1987 – 1988); and Mortgage Strategies Group, Drexel Burnham Lambert, Ltd. (investment bank) (1986 – 1987) | None |
Marguerite A. Piret (72) Trustee | Trustee since 1999. Serves until a successor trustee is elected or earlier retirement or removal. | Chief Financial Officer, American Ag Energy, Inc. (controlled environment and agriculture company) (2016 – present); and President and Chief Executive Officer, Metric Financial Inc. (formerly known as Newbury Piret Company) (investment banking firm) (1981 – 2019) | Director of New America High Income Fund, Inc. (closed-end investment company) (2004 – present); and Member, Board of Governors, Investment Company Institute (2000 – 2006) |
130 Pioneer Strategic Income Fund | Annual Report | 9/30/20
| | | | |
| Name, Age and Position | Term of Office and | | Other Directorships |
| Held With the Fund | Length of Service | Principal Occupation | Held by Trustee |
Fred J. Ricciardi (73) Trustee | Trustee since 2014. Serves until a successor trustee is elected or earlier retirement or removal. | Private investor (2020 – present); Consultant (investment company services) (2012 – 2020); Executive Vice President, BNY Mellon (financial and investment company services) (1969 – 2012); Director, BNY International Financing Corp. (financial services) (2002 – 2012); Director, Mellon Overseas Investment Corp. (financial services) (2009 – 2012); Director, Financial Models (technology) (2005-2007); Director, BNY Hamilton Funds, Ireland (offshore investment companies) (2004-2007); Chairman/Director, AIB/BNY Securities Services, Ltd., Ireland (financial services) (1999-2006); and Chairman, BNY Alternative Investment Services, Inc. (financial services) (2005-2007) | None |
Pioneer Strategic Income Fund | Annual Report | 9/30/20 131
Interested Trustees
| | | | |
| Name, Age and Position | Term of Office and | | Other Directorships |
| Held With the Fund | Length of Service | Principal Occupation | Held by Trustee |
| Lisa M. Jones (58)* | Trustee since 2017. | Director, CEO and President of Amundi Pioneer Asset Management USA, | None |
Trustee, President and | Serves until a successor | Inc. (investment management firm) (since September 2014); Director, CEO | |
Chief Executive Officer | trustee is elected or | and President of Amundi Pioneer Asset Management, Inc. (since September | |
| earlier retirement | 2014); Director, CEO and President of Amundi Pioneer Distributor, Inc. (since | |
| or removal | September 2014); Director, CEO and President of Amundi Pioneer Institutional | |
| | Asset Management, Inc. (since September 2014); Chair, Amundi Pioneer | |
| | Asset Management USA, Inc., Amundi Pioneer Distributor, Inc. and Amundi | |
| | Pioneer Institutional Asset Management, Inc. (September 2014 – 2018); | |
| | Managing Director, Morgan Stanley Investment Management (investment | |
| | management firm) (2010 – 2013); Director of Institutional Business, CEO of | |
| | International, Eaton Vance Management (investment management firm) | |
| | (2005 – 2010); and Director of Amundi USA, Inc. (since 2017) | |
| Kenneth J. Taubes (62)* | Trustee since 2014. | Director and Executive Vice President (since 2008) and Chief Investment | None |
Trustee | Serves until a successor | Officer, U.S. (since 2010) of Amundi Pioneer Asset Management USA, Inc. | |
| trustee is elected or | (investment management firm); Director and Executive Vice President and | |
| earlier retirement | Chief Investment Officer, U.S. of Amundi (since 2008); Executive Vice | |
| or removal | President and Chief Investment Officer, U.S. of Amundi Pioneer Institutional | |
| | Asset Management, Inc. (since 2009); Portfolio Manager of Amundi (since | |
| | 1999); and Director of Amundi USA, Inc. (since 2017) | |
* Ms. Jones and Mr. Taubes are Interested Trustees because they are officers or directors of the Fund’s investment adviser and certain of its affiliates.
132 Pioneer Strategic Income Fund | Annual Report | 9/30/20
Fund Officers
| | | | |
| Name, Age and Position | Term of Office and | | Other Directorships |
| Held With the Fund | Length of Service | Principal Occupation | Held by Officer |
| Christopher J. Kelley (55) | Since 2010. Serves at | Vice President and Associate General Counsel of Amundi since January | None |
Secretary and Chief | the discretion of | 2008; Secretary and Chief Legal Officer of all of the Pioneer Funds since | |
Legal Officer | the Board | June 2010; Assistant Secretary of all of the Pioneer Funds from September | |
| | 2003 to May 2010; and Vice President and Senior Counsel of Amundi from | |
| | July 2002 to December 2007 | |
| Carol B. Hannigan (59) | Since 2010. Serves at | Fund Governance Director of Amundi since December 2006 and Assistant | None |
Assistant Secretary | the discretion of | Secretary of all the Pioneer Funds since June 2010; Manager – Fund | |
| the Board | Governance of Amundi from December 2003 to November 2006; and | |
| | Senior Paralegal of Amundi from January 2000 to November 2003 | |
| Thomas Reyes (57) | Since 2010. Serves at | Assistant General Counsel of Amundi since May 2013 and Assistant Secretary | None |
Assistant Secretary | the discretion of | of all the Pioneer Funds since June 2010; and Counsel of Amundi from June | |
| the Board | 2007 to May 2013 | |
| Mark E. Bradley (60) | Since 2008. Serves at | Vice President – Fund Treasury of Amundi Pioneer; Treasurer of all of the | None |
Treasurer and Chief | the discretion of | Pioneer Funds since March 2008; Deputy Treasurer of Amundi from March | |
Financial and | the Board | 2004 to February 2008; and Assistant Treasurer of all of the Pioneer Funds | |
Accounting Officer | | from March 2004 to February 2008 | |
| Luis I. Presutti (55) | Since 2000. Serves at | Director – Fund Treasury of Amundi; and Assistant Treasurer of all of the | None |
Assistant Treasurer | the discretion of | Pioneer Funds | |
| the Board | | |
| Gary Sullivan (62) | Since 2002. Serves at | Senior Manager – Fund Treasury of Amundi; and Assistant Treasurer of all | None |
Assistant Treasurer | the discretion of | of the Pioneer Funds | |
| the Board | | |
Pioneer Strategic Income Fund | Annual Report | 9/30/20 133
Fund Officers (continued)
| | | | |
| Name, Age and Position | Term of Office and | | Other Directorships |
| Held With the Fund | Length of Service | Principal Occupation | Held by Officer |
| Antonio Furtado (38) | Since 2020. Serves at | Fund Oversight Manager – Fund Treasury of Amundi; and Assistant | None |
Assistant Treasurer | the discretion of | Treasurer of all of the Pioneer Funds | |
| the Board | | |
| John Malone (49) | Since 2018. Serves at | Managing Director, Chief Compliance Officer of Amundi Pioneer Asset | None |
Chief Compliance Officer | the discretion of | Management; Amundi Pioneer Institutional Asset Management, Inc.; and | |
| the Board | the Pioneer Funds since September 2018; and Chief Compliance Officer | |
| | of Amundi Pioneer Distributor, Inc. since January 2014. | |
| Kelly O’Donnell (49) | Since 2006. Serves at | Vice President – Amundi Pioneer Asset Management; and Anti-Money | None |
Anti-Money Laundering | the discretion of | Laundering Officer of all the Pioneer Funds since 2006 | |
Officer | the Board | | |
134 Pioneer Strategic Income Fund | Annual Report | 9/30/20
This page was intentionally left blank.
Pioneer Strategic Income Fund | Annual Report | 9/30/20 135
This page was intentionally left blank.
136 Pioneer Strategic Income Fund | Annual Report | 9/30/20
This page was intentionally left blank.
Pioneer Strategic Income Fund | Annual Report | 9/30/20 137
This page was intentionally left blank.
138 Pioneer Strategic Income Fund | Annual Report | 9/30/20
This page was intentionally left blank.
Pioneer Strategic Income Fund | Annual Report | 9/30/20 139
This page was intentionally left blank.
140 Pioneer Strategic Income Fund | Annual Report | 9/30/20
How to Contact Amundi
We are pleased to offer a variety of convenient ways for you to contact us for assistance or information.
| | | |
| Call us for: | | |
Account Information, including existing accounts, | |
new accounts, prospectuses, applications | |
and service forms | | 1-800-225-6292 |
| | | |
FactFoneSM for automated fund yields, prices, | |
account information and transactions | 1-800-225-4321 |
| | |
| Retirement plans information | | 1-800-622-0176 |
|
| Write to us: | | |
Amundi | | |
P.O. Box 219427 | | |
Kansas City, MO 64121-9427 | | |
| | | |
| Our toll-free fax | | 1-800-225-4240 |
| | | |
| Our internet e-mail address | us.askamundipioneer@amundipioneer.com |
(for general questions about Amundi only) | |
|
| Visit our web site: www.amundipioneer.com/us | |
This report must be preceded or accompanied by a prospectus.
The Fund files a complete schedule of portfolio holdings with the Securities and Exchange Commission for the first and third quarters of each fiscal year as an exhibit to its reports on Form N-PORT. Shareholders may view the filed Form N-PORT by visiting the Commission’s web site at https://www.sec.gov.
Amundi Pioneer Asset Management, Inc.
60 State Street
Boston, MA 02109
www.amundipioneer.com/us
Securities offered through Amundi Pioneer Distributor, Inc.
60 State Street, Boston, MA 02109
Underwriter of Pioneer Mutual Funds, Member SIPC
© 2020 Amundi Pioneer Asset Management 19437-14-1120