UNITED STATES
SECURITIES AND EXCHANGE COMMISSION
Washington, D.C. 20549
FORM N-CSR
CERTIFIED SHAREHOLDER REPORT OF REGISTERED
MANAGEMENT INVESTMENT COMPANIES
Investment Company Act file number 811-09223
Pioneer Series Trust XIV
(Exact name of registrant as specified in charter)
60 State Street, Boston, MA 02109
(Address of principal executive offices) (ZIP code)
Christopher J. Kelley, Amundi Asset Management, Inc.,
60 State Street, Boston, MA 02109
(Name and address of agent for service)
Registrant’s telephone number, including area code: (617) 742-7825
Date of fiscal year end: September 30, 2024
Date of reporting period: October 1, 2023 through March 31, 2024
Form N-CSR is to be used by management investment companies to file reports with the Commission not later than 10 days after the transmission to stockholders of any report that is required to be transmitted to stockholders under Rule 30e-1 under the Investment Company Act of 1940 (17 CFR 270.30e-1). The Commission may use the information provided on Form N-CSR in its regulatory, disclosure review, inspection, and policymaking roles.
A registrant is required to disclose the information specified by Form N-CSR, and the Commission will make this information public. A registrant is not required to respond to the collection of information contained in Form N-CSR unless the Form displays a currently valid Office of Management and Budget (“OMB”) control number. Please direct comments concerning the accuracy of the information collection burden estimate and any suggestions for reducing the burden to Secretary, Securities and Exchange Commission, 450 Fifth Street, NW, Washington, DC 20549-0609. The OMB has reviewed this collection of information under the clearance requirements of 44 U.S.C. ss. 3507.
ITEM 1. REPORTS TO STOCKHOLDERS.
Pioneer Global Sustainable Growth Fund
Semiannual Report | March 31, 2024
IMPORTANT NOTICE – UPCOMING CHANGES TO PIONEER FUNDS ANNUAL & SEMI-ANNUAL REPORTS
The Securities and Exchange Commission (the “SEC”) has adopted rule and form amendments that will result in changes to the design and delivery of annual and semi-annual fund reports (“Reports”). Beginning in July 2024, Reports will be streamlined to highlight key information (“Redesigned Reports”). Certain information currently included in the Reports, including financial statements, will no longer appear in the Reports but will be available online, delivered free of charge to shareholders upon request, and filed with the SEC.
If you previously elected to receive the Fund's Reports electronically, you will continue to receive the Redesigned Reports electronically. Otherwise, you will receive paper copies of the Fund's Redesigned Reports via USPS mail starting in July 2024. If you would like to receive the Fund's Redesigned Reports (and/or other communications) electronically instead of by mail, please contact your financial advisor or, if you are a direct investor, please log into your mutual fund account at amundi.com/usinvestors and select “E-Delivery” under the Profile page. You must be registered for online account access before you can enroll in E-Delivery.
visit us: www.amundi.com/us
Pioneer Global Sustainable Growth Fund | Semiannual Report | 3/31/241
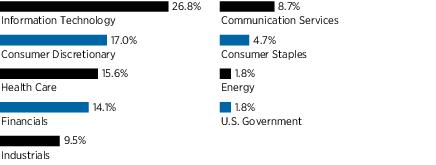
Portfolio Summary | 3/31/24
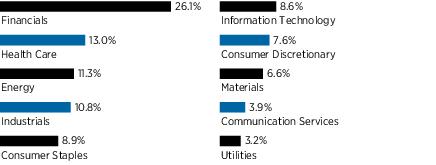
Sector Distribution
(As a percentage of total investments)*
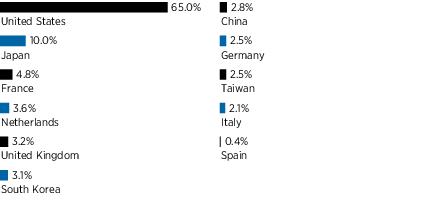
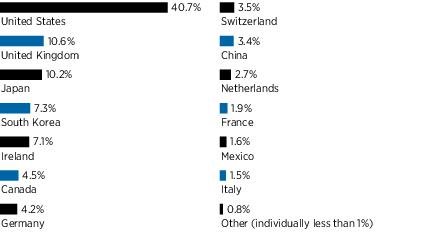
Geographical Distribution
(As a percentage of total investments based on country of domicile)*
10 Largest Holdings
| (As a percentage of total investments)* |
| 1. | Amazon.com, Inc. | 6.32% |
| 2. | Alphabet, Inc., Class C | 5.28 |
| 3. | Microsoft Corp. | 4.23 |
| 4. | Advanced Micro Devices, Inc. | 4.23 |
| 5. | International Business Machines Corp. | 3.54 |
| 6. | Eli Lilly & Co. | 3.31 |
| 7. | Progressive Corp. | 3.30 |
| 8. | RELX Plc | 3.19 |
| 9. | Samsung Electronics Co., Ltd. | 3.11 |
| 10. | Hilton Worldwide Holdings, Inc. | 2.90 |
* Excludes short-term investments and all derivative contracts except for options purchased. The Fund is actively managed, and current holdings may be different. The holdings listed should not be considered recommendations to buy or sell any securities.
2Pioneer Global Sustainable Growth Fund | Semiannual Report | 3/31/24
Prices and Distributions | 3/31/24
Net Asset Value per Share
| Class | 3/31/24 | 9/30/23 |
| A | $11.82 | $9.68 |
| C | $11.62 | $9.52 |
| Y | $11.83 | $9.70 |
| | | |
Distributions per Share: 10/1/23 - 3/31/24
| Class | Net
Investment
Income | Short-Term
Capital Gains | Long-Term
Capital Gains |
| A | $0.0321 | $— | $— |
| C | $ — | $— | $— |
| Y | $0.0589 | $— | $— |
Index Definitions
The Morgan Stanley Capital International (MSCI) All Country World Growth NR Index measures the free-float weighted equity index that captures large and mid-cap representation across emerging markets countries. The index covers approximately 85% of the free float-adjusted market capitalization in each country. Indices are unmanaged and their returns assume reinvestment of dividends and do not reflect any fees or expenses. It is not possible to invest directly in an index.
The index defined here pertains to the “Value of $10,000 Investment” and “Value of $5 Million Investment” charts on pages 4 - 6.
Pioneer Global Sustainable Growth Fund | Semiannual Report | 3/31/243
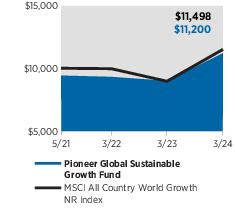
| Performance Update | 3/31/24 | Class A Shares |
Investment Returns
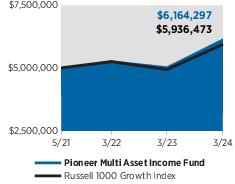
The mountain chart on the right shows the change in value of a $10,000 investment made in Class A shares of Pioneer Global Sustainable Growth Fund at public offering price during the periods shown, compared to that of the MSCI All Country World Growth NR Index.*
Average Annual Total Returns
(As of March 31, 2024) |
| Period | Net
Asset
Value
(NAV) | Public
Offering
Price
(POP) | MSCI All
Country
World
Growth
NR Index |
Life-of-Class
(5/10/21)* | 6.13% | 3.99% | 5.09% |
| 1 Year | 24.40 | 17.26 | 28.21 |
Expense Ratio
(Per prospectus dated February 1, 2024) |
| Gross | Net |
| 10.45% | 1.00% |
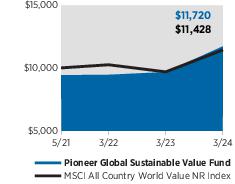
Value of $10,000 Investment
Call 1-800-225-6292 or visit www.amundi.com/us for the most recent month-end performance results. Current performance may be lower or higher than the performance data quoted.
The performance data quoted represents past performance, which is no guarantee of future results. Investment return and principal value will fluctuate, and shares, when redeemed, may be worth more or less than their original cost.
NAV results represent the percent change in net asset value per share. NAV returns would have been lower had sales charges been reflected. POP returns reflect deduction of maximum 5.75% sales charge. All results are historical and assume the reinvestment of dividends and capital gains. Other share classes are available for which performance and expenses will differ.
Performance results reflect any applicable expense waivers in effect during the periods shown. Without such waivers Fund performance would be lower. Waivers may not be in effect for all funds. Certain fee waivers are contractual through a specified period. Otherwise, fee waivers can be rescinded at any time. See the prospectus and financial statements for more information.
The net expense ratio reflects the contractual expense limitation in effect through February 1, 2025 for Class A shares. There can be no assurance that Amundi US will extend the expense limitation beyond such time. Please see the prospectus and financial statements for more information.
* Performance of Class A shares shown in the graph above is from the inception of Class A shares on 5/10/21 through 3/31/24. Index information shown in the graph above is from 5/31/21 through 3/31/24.
The performance table and graph do not reflect the deduction of fees and taxes that a shareholder would pay on Fund distributions or the redemption of Fund shares.
Please refer to the financial highlights for more current expense ratios.
4Pioneer Global Sustainable Growth Fund | Semiannual Report | 3/31/24
| Performance Update | 3/31/24 | Class C Shares |
Investment Returns
The mountain chart on the right shows the change in value of a $10,000 investment made in Class C shares of Pioneer Global Sustainable Growth Fund during the periods shown, compared to that of the MSCI All Country World Growth NR Index.*
Average Annual Total Returns
(As of March 31, 2024) |
| Period | If
Held | If
Redeemed | MSCI All
Country
World
Growth
NR Index |
Life-of-Class
(5/10/21)* | 5.32% | 5.32% | 5.09% |
| 1 Year | 23.62 | 22.62 | 28.21 |
Expense Ratio
(Per prospectus dated February 1, 2024) |
| Gross | Net |
| 11.15% | 1.75% |
Value of $10,000 Investment
Call 1-800-225-6292 or visit www.amundi.com/us for the most recent month-end performance results. Current performance may be lower or higher than the performance data quoted.
The performance data quoted represents past performance, which is no guarantee of future results. Investment return and principal value will fluctuate, and shares, when redeemed, may be worth more or less than their original cost.
Class C shares held for less than one year are subject to a 1% contingent deferred sales charge (CDSC). “If Held” results represent the percent change in net asset value per share. "If Redeemed" returns reflect the deduction of the CDSC for the one-year period, assuming a complete redemption of shares at the last price calculated on the last business day of the period, and no CDSC for the other time periods. All results are historical and assume the reinvestment of dividends and capital gains. Other share classes are available for which performance and expenses will differ.
Performance results reflect any applicable expense waivers in effect during the periods shown. Without such waivers Fund performance would be lower. Waivers may not be in effect for all funds. Certain fee waivers are contractual through a specified period. Otherwise, fee waivers can be rescinded at any time. See the prospectus and financial statements for more information.
The net expense ratio reflects the contractual expense limitation in effect through February 1, 2025 for Class C shares. There can be no assurance that Amundi US will extend the expense limitation beyond such time. Please see the prospectus for more information.
* Performance of Class C shares shown in the graph above is from the inception of Class A shares on 5/10/21 through 3/31/24. Index information shown in the graph above is from 5/31/21 through 3/31/24.
The performance table and graph do not reflect the deduction of fees and taxes that a shareholder would pay on Fund distributions or the redemption of Fund shares.
Please refer to the financial highlights for more current expense ratios.
Pioneer Global Sustainable Growth Fund | Semiannual Report | 3/31/245
| Performance Update | 3/31/24 | Class Y Shares |
Investment Returns
The mountain chart on the right shows the change in value of a $5 million investment made in Class Y shares of Pioneer Global Sustainable Growth Fund during the periods shown, compared to that of the MSCI All Country World Growth NR Index.*
Average Annual Total Returns
(As of March 31, 2024) |
| Period | Net
Asset
Value
(NAV) | MSCI All
Country
World
Growth
NR Index |
Life-of-Class
(5/10/21)* | 6.40% | 5.09% |
| 1 Year | 24.81 | 28.21 |
Expense Ratio
(Per prospectus dated February 1, 2024) |
| Gross | Net |
| 10.14% | 0.70% |
Value of $5 Million Investment
Call 1-800-225-6292 or visit www.amundi.com/us for the most recent month-end performance results. Current performance may be lower or higher than the performance data quoted.
The performance data quoted represents past performance, which is no guarantee of future results. Investment return and principal value will fluctuate, and shares, when redeemed, may be worth more or less than their original cost.
Class Y shares are not subject to sales charges and are available for limited groups of eligible investors, including institutional investors. All results are historical and assume the reinvestment of dividends and capital gains. Other share classes are available for which performance and expenses will differ.
Performance results reflect any applicable expense waivers in effect during the periods shown. Without such waivers Fund performance would be lower. Waivers may not be in effect for all funds. Certain fee waivers are contractual through a specified period. Otherwise, fee waivers can be rescinded at any time. See the prospectus and financial statements for more information.
The net expense ratio reflects the contractual expense limitation in effect through February 1, 2025 for Class Y shares. There can be no assurance that Amundi US will extend the expense limitation beyond such time. Please see the prospectus and financial statements for more information.
* Performance of Class Y shares shown in the graph above is from the inception of Class Y shares on 5/10/21 through 3/31/24. Index information shown in the graph above is from 5/31/21 through 3/31/24.
The performance table and graph do not reflect the deduction of fees and taxes that a shareholder would pay on Fund distributions or the redemption of Fund shares.
Please refer to the financial highlights for more current expense ratios.
6Pioneer Global Sustainable Growth Fund | Semiannual Report | 3/31/24
Comparing Ongoing Fund Expenses
As a shareholder in the Fund, you incur two types of costs:
| (1) | ongoing costs, including management fees, distribution and/or service (12b-1) fees, and other Fund expenses; and |
| (2) | transaction costs, including sales charges (loads) on purchase payments. |
This example is intended to help you understand your ongoing expenses (in dollars) of investing in the Fund and to compare these costs with the ongoing costs of investing in other mutual funds. The example is based on an investment of $1,000 at the beginning of the Fund’s latest six-month period and held throughout the six months.
Using the Tables
Actual Expenses
The first table below provides information about actual account values and actual expenses. You may use the information in this table, together with the amount you invested, to estimate the expenses that you paid over the period as follows:
| (1) | Divide your account value by $1,000
Example: an $8,600 account value ÷ $1,000 = 8.6 |
| (2) | Multiply the result in (1) above by the corresponding share class’s number in the third row under the heading entitled “Expenses Paid During Period” to estimate the expenses you paid on your account during this period. |
Expenses Paid on a $1,000 Investment in Pioneer Global Sustainable Growth Fund
Based on actual returns from October 1, 2023 through March 31, 2024.
| Share Class | A | C | Y |
Beginning Account
Value on 10/1/23 | $1,000.00 | $1,000.00 | $1,000.00 |
Ending Account Value
(after expenses) on 3/31/24 | $1,224.70 | $1,220.60 | $1,226.20 |
Expenses Paid
During Period* | $5.56 | $9.55 | $3.90 |
| | |
| * | Expenses are equal to the Fund’s annualized expense ratio of 1.00%, 1.72%, and 0.70% for Class A, Class C, and Class Y shares, respectively, multiplied by the average account value over the period, multiplied by 183/366 (to reflect the partial year period). |
Pioneer Global Sustainable Growth Fund | Semiannual Report | 3/31/247
Comparing Ongoing Fund Expenses (continued)
Hypothetical Example for Comparison Purposes
The table below provides information about hypothetical account values and hypothetical expenses based on the Fund’s actual expense ratio and an assumed rate of return of 5% per year before expenses, which is not the Fund’s actual return. The hypothetical account values and expenses may not be used to estimate the actual ending account balance or expenses you paid for the period.
You may use this information to compare the ongoing costs of investing in the Fund and other funds. To do so, compare this 5% hypothetical example with the 5% hypothetical examples that appear in the shareholder reports of the other funds.
Please note that the expenses shown in the tables are meant to highlight your ongoing costs only and do not reflect any transaction costs, such as sales charges (loads) that are charged at the time of the transaction. Therefore, the table below is useful in comparing ongoing costs only and will not help you determine the relative total costs of owning different funds. In addition, if these transaction costs were included, your costs would have been higher.
Expenses Paid on a $1,000 Investment in Pioneer Global Sustainable Growth Fund
Based on a hypothetical 5% return per year before expenses, reflecting the period from October 1, 2023 through March 31, 2024.
| Share Class | A | C | Y |
Beginning Account
Value on 10/1/23 | $1,000.00 | $1,000.00 | $1,000.00 |
Ending Account Value
(after expenses) on 3/31/24 | $1,020.00 | $1,016.40 | $1,021.50 |
Expenses Paid
During Period* | $5.05 | $8.67 | $3.54 |
| | |
| * | Expenses are equal to the Fund’s annualized expense ratio of 1.00%, 1.72%, and 0.70% for Class A, Class C, and Class Y shares, respectively, multiplied by the average account value over the period, multiplied by 183/366 (to reflect the partial year period). |
8Pioneer Global Sustainable Growth Fund | Semiannual Report | 3/31/24
Schedule of Investments | 3/31/24
(unaudited)
| Shares | | | | | | Value |
| | UNAFFILIATED ISSUERS — 100.0% | |
| | Common Stocks — 98.2% of Net Assets | |
| | Aerospace & Defense — 2.5% | |
| 1,518 | Hensoldt AG | $ 71,074 |
| | Total Aerospace & Defense | $71,074 |
|
|
| | Banks — 2.1% | |
| 3,908 | FinecoBank Banca Fineco S.p.A. | $ 58,522 |
| | Total Banks | $58,522 |
|
|
| | Beverages — 1.9% | |
| 315 | PepsiCo., Inc. | $ 55,128 |
| | Total Beverages | $55,128 |
|
|
| | Biotechnology — 1.5% | |
| 103(a) | Vertex Pharmaceuticals, Inc. | $ 43,055 |
| | Total Biotechnology | $43,055 |
|
|
| | Broadline Retail — 8.2% | |
| 5,900 | Alibaba Group Holding, Ltd. | $ 53,246 |
| 989(a) | Amazon.com, Inc. | 178,396 |
| | Total Broadline Retail | $231,642 |
|
|
| | Capital Markets — 3.7% | |
| 600 | Euronext NV (144A) | $ 57,067 |
| 353 | Intercontinental Exchange, Inc. | 48,513 |
| | Total Capital Markets | $105,580 |
|
|
| | Consumer Staples Distribution & Retail — 2.3% | |
| 4,500 | Seven & i Holdings Co., Ltd. | $ 65,501 |
| | Total Consumer Staples Distribution & Retail | $65,501 |
|
|
| | Electrical Equipment — 1.8% | |
| 183(a) | Generac Holdings, Inc. | $ 23,083 |
| 96 | Rockwell Automation, Inc. | 27,968 |
| | Total Electrical Equipment | $51,051 |
|
|
| | Electronic Equipment, Instruments & Components — 1.1% | |
| 120 | CDW Corp. | $ 30,694 |
| | Total Electronic Equipment, Instruments & Components | $30,694 |
|
|
| | Energy Equipment & Services — 1.9% | |
| 1,566 | Baker Hughes Co. | $ 52,461 |
| | Total Energy Equipment & Services | $52,461 |
|
|
The accompanying notes are an integral part of these financial statements.
Pioneer Global Sustainable Growth Fund | Semiannual Report | 3/31/249
Schedule of Investments | 3/31/24
(unaudited) (continued)
| Shares | | | | | | Value |
| | Entertainment — 3.4% | |
| 270 | Electronic Arts, Inc. | $ 35,821 |
| 1,100 | Nintendo Co., Ltd. | 60,206 |
| | Total Entertainment | $96,027 |
|
|
| | Financial Services — 5.0% | |
| 813 | Edenred SE | $ 43,342 |
| 117 | Mastercard, Inc., Class A | 56,344 |
| 600(a) | PayPal Holdings, Inc. | 40,194 |
| | Total Financial Services | $139,880 |
|
|
| | Ground Transportation — 2.0% | |
| 728(a) | Uber Technologies, Inc. | $ 56,049 |
| | Total Ground Transportation | $56,049 |
|
|
| | Health Care Equipment & Supplies — 5.1% | |
| 360(a) | Edwards Lifesciences Corp. | $ 34,401 |
| 500 | Hoya Corp. | 62,591 |
| 3,200 | Olympus Corp. | 46,037 |
| | Total Health Care Equipment & Supplies | $143,029 |
|
|
| | Health Care Providers & Services — 2.3% | |
| 585 | Cardinal Health, Inc. | $ 65,462 |
| | Total Health Care Providers & Services | $65,462 |
|
|
| | Hotels, Restaurants & Leisure — 4.3% | |
| 203 | Amadeus IT Group S.A. | $ 13,019 |
| 384 | Hilton Worldwide Holdings, Inc. | 81,911 |
| 650 | Yum China Holdings, Inc. | 25,637 |
| | Total Hotels, Restaurants & Leisure | $120,567 |
|
|
| | Household Durables — 1.5% | |
| 500 | Sony Group Corp. | $ 42,851 |
| | Total Household Durables | $42,851 |
|
|
| | Insurance — 3.3% | |
| 450 | Progressive Corp. | $ 93,069 |
| | Total Insurance | $93,069 |
|
|
| | Interactive Media & Services — 5.3% | |
| 980(a) | Alphabet, Inc., Class C | $ 149,215 |
| | Total Interactive Media & Services | $149,215 |
|
|
| | IT Services — 4.8% | |
| 493 | Cognizant Technology Solutions Corp., Class A | $ 36,132 |
| 524 | International Business Machines Corp. | 100,063 |
| | Total IT Services | $136,195 |
|
|
The accompanying notes are an integral part of these financial statements.
10Pioneer Global Sustainable Growth Fund | Semiannual Report | 3/31/24
| Shares | | | | | | Value |
| | Life Sciences Tools & Services — 1.8% | |
| 88 | Thermo Fisher Scientific, Inc. | $ 51,146 |
| | Total Life Sciences Tools & Services | $51,146 |
|
|
| | Personal Care Products — 0.4% | |
| 73 | Estee Lauder Cos., Inc., Class A | $ 11,253 |
| | Total Personal Care Products | $11,253 |
|
|
| | Pharmaceuticals — 4.9% | |
| 120 | Eli Lilly & Co. | $ 93,355 |
| 468 | Sanofi S.A. | 45,919 |
| | Total Pharmaceuticals | $139,274 |
|
|
| | Professional Services — 3.2% | |
| 2,085 | RELX Plc | $ 90,091 |
| | Total Professional Services | $90,091 |
|
|
| | Semiconductors & Semiconductor Equipment — 9.5% | |
| 662(a) | Advanced Micro Devices, Inc. | $ 119,484 |
| 48 | ASML Holding NV | 46,084 |
| 307 | Microchip Technology, Inc. | 27,541 |
| 100 | Sanken Electric Co., Ltd. | 4,388 |
| 513 | Taiwan Semiconductor Manufacturing Co., Ltd. (A.D.R.) | 69,794 |
| | Total Semiconductors & Semiconductor Equipment | $267,291 |
|
|
| | Software — 5.7% | |
| 284 | Microsoft Corp. | $ 119,485 |
| 136 | Salesforce, Inc. | 40,960 |
| | Total Software | $160,445 |
|
|
| | Specialty Retail — 1.4% | |
| 397 | TJX Cos., Inc. | $ 40,264 |
| | Total Specialty Retail | $40,264 |
|
|
| | Technology Hardware, Storage & Peripherals — 5.7% | |
| 431 | Apple, Inc. | $ 73,908 |
| 1,467 | Samsung Electronics Co., Ltd. | 87,836 |
| | Total Technology Hardware, Storage & Peripherals | $161,744 |
|
|
| | Textiles, Apparel & Luxury Goods — 1.6% | |
| 50 | LVMH Moet Hennessy Louis Vuitton SE | $ 45,222 |
| | Total Textiles, Apparel & Luxury Goods | $45,222 |
|
|
| | Total Common Stocks
(Cost $2,115,728) | $2,773,782 |
|
|
The accompanying notes are an integral part of these financial statements.
Pioneer Global Sustainable Growth Fund | Semiannual Report | 3/31/2411
Schedule of Investments | 3/31/24
(unaudited) (continued)
Principal
Amount
USD ($) | | | | | | Value |
| | U.S. Government and Agency Obligations —
1.8% of Net Assets | |
| 50,000(b) | U.S. Treasury Bills, 4/2/24 | $ 49,993 |
| | Total U.S. Government and Agency Obligations
(Cost $49,992) | $49,993 |
|
|
| | TOTAL INVESTMENTS IN UNAFFILIATED ISSUERS — 100.0%
(Cost $2,165,720) | $2,823,775 |
| | OTHER ASSETS AND LIABILITIES — 0.0%† | $ 1,087 |
| | net assets — 100.0% | $2,824,862 |
| | | | | | | |
| (A.D.R.) | American Depositary Receipts. |
| (144A) | The resale of such security is exempt from registration under Rule 144A of the Securities Act of 1933. Such securities may be resold normally to qualified institutional buyers. At March 31, 2024, the value of these securities amounted to $57,067, or 2.0% of net assets. |
| (a) | Non-income producing security. |
| (b) | Security issued with a zero coupon. Income is recognized through accretion of discount. |
| † | Amount rounds to less than 0.1%. |
Distribution of investments by country of domicile (excluding short-term investments) as a percentage of total investments in securities, is as follows:
| United States | 65.0% |
| Japan | 10.0% |
| France | 4.8% |
| Netherlands | 3.6% |
| United Kingdom | 3.2% |
| South Korea | 3.1% |
| China | 2.8% |
| Germany | 2.5% |
| Taiwan | 2.5% |
| Italy | 2.1% |
| Other (individually less than 1%) | 0.4% |
| | 100.0% |
The accompanying notes are an integral part of these financial statements.
12Pioneer Global Sustainable Growth Fund | Semiannual Report | 3/31/24
FORWARD FOREIGN CURRENCY EXCHANGE CONTRACTS
Currency
Purchased | In
Exchange for | Currency
Sold | Deliver | Counterparty | Settlement
Date | Unrealized
Appreciation |
| USD | 56,513 | CNY | 400,000 | Goldman Sachs & Co. | 8/22/24 | $295 |
| TOTAL FORWARD FOREIGN CURRENCY EXCHANGE CONTRACTS | $ 295 |
Principal amounts are denominated in U.S. dollars (“USD”) unless otherwise noted.
| CNY | — China Yuan Renminbi |
| USD | — United States Dollar |
Purchases and sales of securities (excluding short-term investments) for the six months ended March 31, 2024, aggregated $306,477 and $225,555, respectively.
At March 31, 2024, the net unrealized appreciation on investments based on cost for federal tax purposes of $2,173,858 was as follows:
| Aggregate gross unrealized appreciation for all investments in which there is an excess of value over tax cost | $712,687 |
| Aggregate gross unrealized depreciation for all investments in which there is an excess of tax cost over value | (62,475) |
| Net unrealized appreciation | $650,212 |
Various inputs are used in determining the value of the Fund’s investments. These inputs are summarized in the three broad levels below.
| Level 1 | – | unadjusted quoted prices in active markets for identical securities. |
| Level 2 | – | other significant observable inputs (including quoted prices for similar securities, interest rates, prepayment speeds, credit risks, etc.). See Notes to Financial Statements — Note 1A. |
| Level 3 | – | significant unobservable inputs (including the Adviser’s own assumptions in determining fair value of investments). See Notes to Financial Statements — Note 1A. |
The following is a summary of the inputs used as of March 31, 2024 in valuing the Fund’s investments:
| | Level 1 | Level 2 | Level 3 | Total |
| Common Stocks | | | | |
| Aerospace & Defense | $ — | $ 71,074 | $— | $ 71,074 |
| Banks | — | 58,522 | — | 58,522 |
| Broadline Retail | 178,396 | 53,246 | — | 231,642 |
The accompanying notes are an integral part of these financial statements.
Pioneer Global Sustainable Growth Fund | Semiannual Report | 3/31/2413
Schedule of Investments | 3/31/24
(unaudited) (continued)
| | Level 1 | Level 2 | Level 3 | Total |
| Capital Markets | $ 48,513 | $ 57,067 | $— | $ 105,580 |
| Consumer Staples Distribution & Retail | — | 65,501 | — | 65,501 |
| Entertainment | 35,821 | 60,206 | — | 96,027 |
| Financial Services | 96,538 | 43,342 | — | 139,880 |
| Health Care Equipment & Supplies | 34,401 | 108,628 | — | 143,029 |
| Hotels, Restaurants & Leisure | 81,911 | 38,656 | — | 120,567 |
| Household Durables | — | 42,851 | — | 42,851 |
| Pharmaceuticals | 93,355 | 45,919 | — | 139,274 |
| Professional Services | — | 90,091 | — | 90,091 |
| Semiconductors & Semiconductor Equipment | 216,819 | 50,472 | — | 267,291 |
| Technology Hardware, Storage & Peripherals | 73,908 | 87,836 | — | 161,744 |
| Textiles, Apparel & Luxury Goods | — | 45,222 | — | 45,222 |
| All Other Common Stocks | 995,487 | — | — | 995,487 |
| U.S. Government and Agency Obligations | — | 49,993 | — | 49,993 |
| Total Investments in Securities | $1,855,149 | $ 968,626 | $ — | $2,823,775 |
| Other Financial Instruments | | | | |
| Net unrealized appreciation on forward foreign currency exchange contracts | $ — | $ 295 | $— | $ 295 |
| Total Other Financial Instruments | $ — | $ 295 | $ — | $ 295 |
During the period ended March 31, 2024, there were no transfers in or out of Level 3.
The accompanying notes are an integral part of these financial statements.
14Pioneer Global Sustainable Growth Fund | Semiannual Report | 3/31/24
Statement of Assets and Liabilities | 3/31/24
(unaudited)
| ASSETS: | |
| Investments in unaffiliated issuers, at value (cost $2,165,720) | $2,823,775 |
| Cash | 23,018 |
| Unrealized appreciation on forward foreign currency exchange contracts | 295 |
| Receivables — | |
| Investment securities sold | 14,940 |
| Dividends | 3,751 |
| Due from the Adviser | 1,783 |
| Other assets | 18,724 |
| Total assets | $2,886,286 |
| LIABILITIES: | |
| Overdraft due to custodian | $ 2 |
| Payables — | |
| Trustees’ fees | 1 |
| Professional fees | 37,196 |
| Printing expense | 14,149 |
| Consulting fees | 8,841 |
| Management fees | 300 |
| Administrative expenses | 63 |
| Distribution fees | 165 |
| Accrued expenses | 707 |
| Total liabilities | $ 61,424 |
| NET ASSETS: | |
| Paid-in capital | $2,398,009 |
| Distributable earnings | 426,853 |
| Net assets | $2,824,862 |
| NET ASSET VALUE PER SHARE: | |
| No par value (unlimited number of shares authorized) | |
| Class A (based on $1,142,756/96,676 shares) | $ 11.82 |
| Class C (based on $722,965/62,237 shares) | $ 11.62 |
| Class Y (based on $959,141/81,071 shares) | $ 11.83 |
| MAXIMUM OFFERING PRICE PER SHARE: | |
| Class A (based on $11.82 net asset value per share/100%-5.75% maximum sales charge) | $ 12.54 |
The accompanying notes are an integral part of these financial statements.
Pioneer Global Sustainable Growth Fund | Semiannual Report | 3/31/2415
Statement of Operations (unaudited)
FOR THE SIX MONTHS ENDED 3/31/24
| INVESTMENT INCOME: | | |
| Dividends from unaffiliated issuers (net of foreign taxes withheld $576) | $ 13,722 | |
| Interest from unaffiliated issuers | 1,864 | |
| Total Investment Income | | $ 15,586 |
| EXPENSES: | | |
| Management fees | $ 8,323 | |
| Administrative expenses | 5,236 | |
| Transfer agent fees | | |
| Class A | 144 | |
| Class C | 21 | |
| Class Y | 8 | |
| Distribution fees | | |
| Class A | 1,292 | |
| Class C | 3,287 | |
| Shareholder communications expense | 284 | |
| Registration fees | 15,706 | |
| Professional fees | 39,257 | |
| Printing expense | 7,772 | |
| Pricing fees | 6 | |
| Officers’ and Trustees’ fees | 4,014 | |
| Insurance expense | 18 | |
| Miscellaneous | 527 | |
| Total expenses | | $ 85,895 |
| Less fees waived and expenses reimbursed by the Adviser | | (72,035) |
| Net expenses | | $ 13,860 |
| Net investment income | | $ 1,726 |
| REALIZED AND UNREALIZED GAIN (LOSS) ON INVESTMENTS: | | |
| Net realized gain (loss) on: | | |
| Investments in unaffiliated issuers | $ (24,451) | |
| Forward foreign currency exchange contracts | 16 | |
| Other assets and liabilities denominated in foreign currencies | (723) | $ (25,158) |
| Change in net unrealized appreciation (depreciation) on: | | |
| Investments in unaffiliated issuers | $539,300 | |
| Forward foreign currency exchange contracts | 224 | |
| Other assets and liabilities denominated in foreign currencies | (12) | $539,512 |
| Net realized and unrealized gain (loss) on investments | | $514,354 |
| Net increase in net assets resulting from operations | | $ 516,080 |
The accompanying notes are an integral part of these financial statements.
16Pioneer Global Sustainable Growth Fund | Semiannual Report | 3/31/24
Statements of Changes in Net Assets
| | Six Months
Ended
3/31/24
(unaudited) | Year
Ended
9/30/23 |
| FROM OPERATIONS: | | |
| Net investment income (loss) | $ 1,726 | $ 7,662 |
| Net realized gain (loss) on investments | (25,158) | (94,515) |
| Change in net unrealized appreciation (depreciation) on investments | 539,512 | 496,420 |
| Net increase in net assets resulting from operations | $ 516,080 | $ 409,567 |
| DISTRIBUTIONS TO SHAREHOLDERS: | | |
| Class A ($0.03 and $0.02 per share, respectively) | $ (3,124) | $ (1,654) |
| Class Y ($0.06 and $0.05 per share, respectively) | (4,753) | (3,828) |
| Total distributions to shareholders | $ (7,877) | $ (5,482) |
| FROM FUND SHARE TRANSACTIONS: | | |
| Net proceeds from sales of shares | $ 43,825 | $ 130,467 |
| Reinvestment of distributions | 6,877 | 5,482 |
| Cost of shares repurchased | (21,002) | (7,098) |
| Net increase in net assets resulting from Fund share transactions | $ 29,700 | $ 128,851 |
| Net increase in net assets | $ 537,903 | $ 532,936 |
| NET ASSETS: | | |
| Beginning of period | $2,286,959 | $1,754,023 |
| End of period | $2,824,862 | $2,286,959 |
The accompanying notes are an integral part of these financial statements.
Pioneer Global Sustainable Growth Fund | Semiannual Report | 3/31/2417
Statements of Changes in Net Assets (continued)
| | Six Months
Ended
3/31/24
Shares
(unaudited) | Six Months
Ended
3/31/24
Amount
(unaudited) | Year
Ended
9/30/23
Shares | Year
Ended
9/30/23
Amount |
| Class A | | | | |
| Shares sold | 4,088 | $ 43,825 | 12,021 | $116,300 |
| Reinvestment of distributions | 262 | 2,835 | 194 | 1,654 |
| Less shares repurchased | (1,840) | (21,002) | (775) | (7,098) |
| Net increase | 2,510 | $ 25,658 | 11,440 | $110,856 |
| Class C | | | | |
| Shares sold | — | $ — | 1,253 | $ 12,667 |
| Reinvestment of distributions | — | — | — | — |
| Less shares repurchased | — | — | — | — |
| Net increase | — | $ — | 1,253 | $ 12,667 |
| Class Y | | | | |
| Shares sold | — | $ — | 186 | $ 1,500 |
| Reinvestment of distributions | 375 | 4,042 | 450 | 3,828 |
| Less shares repurchased | — | — | — | — |
| Net increase | 375 | $ 4,042 | 636 | $ 5,328 |
The accompanying notes are an integral part of these financial statements.
18Pioneer Global Sustainable Growth Fund | Semiannual Report | 3/31/24
| | Six Months
Ended
3/31/24
(unaudited) | Year
Ended
9/30/23 | Year
Ended
9/30/22 | 5/10/21* to
9/30/21 |
| Class A | | | | |
| Net asset value, beginning of period | $ 9.68 | $ 7.86 | $ 9.84 | $ 10.00 |
| Increase (decrease) from investment operations: | | | | |
| Net investment income (loss) (a) | $ 0.01 | $ 0.04 | $ 0.02 | $ 0.01 |
| Net realized and unrealized gain (loss) on investments | 2.16 | 1.80 | (2.00) | (0.17) |
| Net increase (decrease) from investment operations | $ 2.17 | $ 1.84 | $ (1.98) | $ (0.16) |
| Distributions to shareholders: | | | | |
| Net investment income | $ (0.03) | $ (0.02) | $ — | $ — |
| Total distributions | $ (0.03) | $ (0.02) | $ — | $ — |
| Net increase (decrease) in net asset value | $ 2.14 | $ 1.82 | $ (1.98) | $ (0.16) |
| Net asset value, end of period | $11.82 | $ 9.68 | $ 7.86 | $ 9.84 |
| Total return (b) | 22.47%(c) | 23.44% | (20.12)% | (1.60)%(c) |
| Ratio of net expenses to average net assets | 1.00%(d) | 1.00% | 1.00% | 0.75%(d) |
| Ratio of net investment income (loss) to average net assets | 0.22%(d) | 0.45% | 0.21% | 0.28%(d) |
| Portfolio turnover rate | 9%(c) | 38% | 38% | 11%(c) |
| Net assets, end of period (in thousands) | $1,143 | $ 912 | $ 650 | $ 770 |
| Ratios with no waiver of fees and assumption of expenses by the Adviser and no reduction for fees paid indirectly: | | | | |
| Total expenses to average net assets | 6.64%(d) | 10.45% | 11.71% | 12.69%(d) |
| Net investment income (loss) to average net assets | (5.42)%(d) | (9.00)% | (10.50)% | (11.66)%(d) |
| * | Class A commenced operations on May 10, 2021. |
| (a) | The per-share data presented above is based on the average shares outstanding for the period presented. |
| (b) | Assumes initial investment at net asset value at the beginning of each period, reinvestment of all distributions, the complete redemption of the investment at net asset value at the end of each period and no sales charges. Total return would be reduced if sales charges were taken into account. |
| (c) | Not annualized. |
| (d) | Annualized. |
The accompanying notes are an integral part of these financial statements.
Pioneer Global Sustainable Growth Fund | Semiannual Report | 3/31/2419
Financial Highlights (continued)
| | Six Months
Ended
3/31/24
(unaudited) | Year
Ended
9/30/23 | Year
Ended
9/30/22 | 5/10/21* to
9/30/21 |
| Class C | | | | |
| Net asset value, beginning of period | $ 9.52 | $ 7.76 | $ 9.81 | $ 10.00 |
| Increase (decrease) from investment operations: | | | | |
| Net investment income (loss) (a) | $ (0.03) | $ (0.03) | $ (0.05) | $ (0.03) |
| Net realized and unrealized gain (loss) on investments | 2.13 | 1.79 | (2.00) | (0.16) |
| Net increase (decrease) from investment operations | $ 2.10 | $ 1.76 | $ (2.05) | $ (0.19) |
| Net increase (decrease) in net asset value | $ 2.10 | $ 1.76 | $ (2.05) | $ (0.19) |
| Net asset value, end of period | $11.62 | $ 9.52 | $ 7.76 | $ 9.81 |
| Total return (b) | 22.06%(c) | 22.68% | (20.90)% | (1.90)%(c) |
| Ratio of net expenses to average net assets | 1.72%(d) | 1.72% | 1.74% | 1.69%(d) |
| Ratio of net investment income (loss) to average net assets | (0.50)%(d) | (0.28)% | (0.53)% | (0.64)%(d) |
| Portfolio turnover rate | 9%(c) | 38% | 38% | 11%(c) |
| Net assets, end of period (in thousands) | $ 723 | $ 593 | $ 474 | $ 598 |
| Ratios with no waiver of fees and assumption of expenses by the Adviser and no reduction for fees paid indirectly: | | | | |
| Total expenses to average net assets | 7.33%(d) | 11.15% | 12.43% | 13.63%(d) |
| Net investment income (loss) to average net assets | (6.11)%(d) | (9.71)% | (11.22)% | (12.58)%(d) |
| * | Class C commenced operations on May 10, 2021. |
| (a) | The per-share data presented above is based on the average shares outstanding for the period presented. |
| (b) | Assumes initial investment at net asset value at the beginning of each period, reinvestment of all distributions, the complete redemption of the investment at net asset value at the end of each period and no sales charges. Total return would be reduced if sales charges were taken into account. |
| (c) | Not annualized. |
| (d) | Annualized. |
The accompanying notes are an integral part of these financial statements.
20Pioneer Global Sustainable Growth Fund | Semiannual Report | 3/31/24
| | Six Months
Ended
3/31/24
(unaudited) | Year
Ended
9/30/23 | Year
Ended
9/30/22 | 5/10/21* to
9/30/21 |
| Class Y | | | | |
| Net asset value, beginning of period | $ 9.70 | $ 7.87 | $ 9.85 | $ 10.00 |
| Increase (decrease) from investment operations: | | | | |
| Net investment income (loss) (a) | $ 0.03 | $ 0.07 | $ 0.05 | $ 0.01 |
| Net realized and unrealized gain (loss) on investments | 2.16 | 1.81 | (2.02) | (0.16) |
| Net increase (decrease) from investment operations | $ 2.19 | $ 1.88 | $ (1.97) | $ (0.15) |
| Distributions to shareholders: | | | | |
| Net investment income | $ (0.06) | $ (0.05) | $ (0.01) | $ — |
| Total distributions | $ (0.06) | $ (0.05) | $ (0.01) | $ — |
| Net increase (decrease) in net asset value | $ 2.13 | $ 1.83 | $ (1.98) | $ (0.15) |
| Net asset value, end of period | $11.83 | $ 9.70 | $ 7.87 | $ 9.85 |
| Total return (b) | 22.62%(c) | 23.94% | (20.04)% | (1.50)%(c) |
| Ratio of net expenses to average net assets | 0.70%(d) | 0.70% | 0.70% | 0.70%(d) |
| Ratio of net investment income (loss) to average net assets | 0.52%(d) | 0.74% | 0.51% | 0.35%(d) |
| Portfolio turnover rate | 9%(c) | 38% | 38% | 11%(c) |
| Net assets, end of period (in thousands) | $ 959 | $ 783 | $ 630 | $ 788 |
| Ratios with no waiver of fees and assumption of expenses by the Adviser and no reduction for fees paid indirectly: | | | | |
| Total expenses to average net assets | 6.32%(d) | 10.14% | 11.40% | 12.64%(d) |
| Net investment income (loss) to average net assets | (5.10)%(d) | (8.70)% | (10.19)% | (11.59)%(d) |
| * | Class Y commenced operations on May 10, 2021. |
| (a) | The per-share data presented above is based on the average shares outstanding for the period presented. |
| (b) | Assumes initial investment at net asset value at the beginning of each period, reinvestment of all distributions and the complete redemption of the investment at net asset value at the end of each period and no sales charges. |
| (c) | Not annualized. |
| (d) | Annualized. |
The accompanying notes are an integral part of these financial statements.
Pioneer Global Sustainable Growth Fund | Semiannual Report | 3/31/2421
Notes to Financial Statements | 3/31/24
(unaudited)
1. Organization and Significant Accounting Policies
Pioneer Global Sustainable Growth Fund (the “Fund”) is one of five portfolios comprising Pioneer Series Trust XIV (the “Trust”), a Delaware statutory trust. The Fund is registered under the Investment Company Act of 1940, as amended (the "1940 Act") as a diversified, open end management investment company. The Fund’s investment objective is to seek long-term capital growth.
The Fund offers three classes of shares designated as Class A, Class C and Class Y shares. Class A, Class C and Class Y commenced operations on May 10, 2021. Each class of shares represents an interest in the same portfolio of investments of the Fund and has identical rights (based on relative net asset values) to assets and liquidation proceeds. Share classes can bear different rates of class-specific fees and expenses, such as transfer agent and distribution fees. Differences in class specific fees and expenses will result in differences in net investment income and, therefore, the payment of different dividends from net investment income earned by each class. The Amended and Restated Declaration of Trust of the Trust gives the Board of Trustees the flexibility to specify either per-share voting or dollar-weighted voting when submitting matters for shareholder approval. Under per-share voting, each share of a class of the Fund is entitled to one vote. Under dollar-weighted voting, a shareholder’s voting power is determined not by the number of shares owned, but by the dollar value of the shares on the record date. Each share class has exclusive voting rights with respect to matters affecting only that class, including with respect to the distribution plan for that class. There is no distribution plan for Class Y shares.
Amundi Asset Management US, Inc., an indirect, wholly owned subsidiary of Amundi and Amundi’s wholly owned subsidiary, Amundi USA, Inc., serves as the Fund’s investment adviser (the “Adviser”). Amundi Distributor US, Inc., an affiliate of the Adviser, serves as the Fund’s distributor (the “Distributor”).
The Fund is required to comply with Rule 18f-4 under the 1940 Act, which governs the use of derivatives by registered investment companies. Rule 18f-4 permits funds to enter into derivatives transactions (as defined in Rule 18f-4) and certain other transactions notwithstanding the restrictions on the issuance of “senior securities” under Section 18 of the 1940 Act. Rule 18f-4 requires a fund to establish and maintain a comprehensive derivatives risk management program, appoint a derivatives
22Pioneer Global Sustainable Growth Fund | Semiannual Report | 3/31/24
risk manager and comply with a relative or absolute limit on fund leverage risk calculated based on value-at-risk (“VaR”), unless the fund uses derivatives in only a limited manner (a "limited derivatives user"). The Fund is currently a limited derivatives user for purposes of Rule 18f-4.
The Fund is an investment company and follows investment company accounting and reporting guidance under U.S. Generally Accepted Accounting Principles (“U.S. GAAP”). U.S. GAAP requires the management of the Fund to make estimates and assumptions that affect the reported amounts of assets and liabilities, the disclosure of contingent assets and liabilities at the date of the financial statements, and the reported amounts of income, expenses and gain or loss on investments during the reporting period. Actual results could differ from those estimates.
The following is a summary of significant accounting policies followed by the Fund in the preparation of its financial statements:
| A. | Security Valuation |
| | The net asset value of the Fund is computed once daily, on each day the New York Stock Exchange (“NYSE”) is open, as of the close of regular trading on the NYSE. |
| | Equity securities that have traded on an exchange are valued by using the last sale price on the principal exchange where they are traded. Equity securities that have not traded on the date of valuation, or securities for which sale prices are not available, generally are valued using the mean between the last bid and asked prices or, if both last bid and asked prices are not available, at the last quoted bid price. Last sale and bid and asked prices are provided by independent third party pricing services. In the case of equity securities not traded on an exchange, prices are typically determined by independent third party pricing services using a variety of techniques and methods. |
| | The value of foreign securities is translated into U.S. dollars based on foreign currency exchange rate quotations supplied by a third party pricing source. Trading in non-U.S. equity securities is substantially completed each day at various times prior to the close of the NYSE. The values of such securities used in computing the net asset value of the Fund’s shares are determined as of such times. The Adviser may use a fair value model developed by an independent pricing service to value non-U.S. equity securities. |
| | Forward foreign currency exchange contracts are valued daily using the foreign exchange rate or, for longer term forward contract positions, the spot currency rate and the forward points on a daily basis, in each case |
Pioneer Global Sustainable Growth Fund | Semiannual Report | 3/31/2423
| | provided by a third party pricing service. Contracts whose forward settlement date falls between two quoted days are valued by interpolation. |
| | Shares of open-end registered investment companies (including money market mutual funds) are valued at such funds’ net asset value. |
| | Securities for which independent pricing services or broker-dealers are unable to supply prices or for which market prices and/or quotations are not readily available or are considered to be unreliable are valued by a fair valuation team comprised of certain personnel of the Adviser. The Adviser is designated as the valuation designee for the Fund pursuant to Rule 2a-5 under the 1940 Act. The Adviser’s fair valuation team is responsible for monitoring developments that may impact fair valued securities. |
| | Inputs used when applying fair value methods to value a security may include credit ratings, the financial condition of the company, current market conditions and comparable securities. The Adviser may use fair value methods if it is determined that a significant event has occurred after the close of the exchange or market on which the security trades and prior to the determination of the Fund’s net asset value. Examples of a significant event might include political or economic news, corporate restructurings, natural disasters, terrorist activity or trading halts. Thus, the valuation of the Fund’s securities may differ significantly from exchange prices, and such differences could be material. |
| B. | Investment Income and Transactions |
| | Dividend income is recorded on the ex-dividend date, except that certain dividends from foreign securities where the ex-dividend date may have passed are recorded as soon as the Fund becomes aware of the ex-dividend data in the exercise of reasonable diligence. |
| | Interest income, including interest on income-bearing cash accounts, is recorded on the accrual basis. Dividend and interest income are reported net of unrecoverable foreign taxes withheld at the applicable country rates and net of income accrued on defaulted securities. |
| | Interest and dividend income payable by delivery of additional shares is reclassified as PIK (payment-in-kind) income upon receipt and is included in interest and dividend income, respectively. |
| | Security transactions are recorded as of trade date. Gains and losses on sales of investments are calculated on the identified cost method for both financial reporting and federal income tax purposes. |
24Pioneer Global Sustainable Growth Fund | Semiannual Report | 3/31/24
| C. | Foreign Currency Translation |
| | The books and records of the Fund are maintained in U.S. dollars. Amounts denominated in foreign currencies are translated into U.S. dollars using current exchange rates. |
| | Net realized gains and losses on foreign currency transactions, if any, represent, among other things, the net realized gains and losses on foreign currency exchange contracts, disposition of foreign currencies and the difference between the amount of income accrued and the U.S. dollars actually received. Further, the effects of changes in foreign currency exchange rates on investments are not segregated on the Statement of Operations from the effects of changes in the market prices of those securities, but are included with the net realized and unrealized gain or loss on investments. |
| D. | Federal Income Taxes |
| | It is the Fund’s policy to comply with the requirements of the Internal Revenue Code applicable to regulated investment companies and to distribute all of its net taxable income and net realized capital gains, if any, to its shareholders. Therefore, no provision for federal income taxes is required. As of March 31, 2024, the Fund did not accrue any interest or penalties with respect to uncertain tax positions, which, if applicable, would be recorded as an income tax expense on the Statement of Operations. Tax returns filed within the prior three years remain subject to examination by federal and state tax authorities. |
| | The amount and character of income and capital gain distributions to shareholders are determined in accordance with federal income tax rules, which may differ from U.S. GAAP. Distributions in excess of net investment income or net realized gains are temporary over distributions for financial statement purposes resulting from differences in the recognition or classification of income or distributions for financial statement and tax purposes. Capital accounts within the financial statements are adjusted for permanent book/tax differences to reflect tax character, but are not adjusted for temporary differences. |
Pioneer Global Sustainable Growth Fund | Semiannual Report | 3/31/2425
| | The tax character of current year distributions payable will be determined at the end of the current taxable year. The tax character of distributions paid during the year ended September 30, 2023 was as follows: |
| | 2023 |
| Distributions paid from: | |
| Ordinary income | $5,482 |
| Total | $5,482 |
The following shows the components of distributable earnings (losses) on a federal income tax basis at September 30, 2023:
| | 2023 |
| Distributable earnings/(losses): | |
| Undistributed ordinary income | $ 3,716 |
| Capital loss carryforward | (195,754) |
| Net unrealized appreciation | 110,688 |
| Total | $ (81,350) |
The differences between book-basis and tax-basis net unrealized appreciation are attributable to the tax deferral of losses on wash sales and the mark to market of forward contracts.
| E. | Fund Shares |
| | The Fund records sales and repurchases of its shares as of trade date. The Distributor earned $12 in underwriting commissions on the sale of Class A shares during the six months ended March 31, 2024. |
| F. | Class Allocations |
| | Income, common expenses and realized and unrealized gains and losses are calculated at the Fund level and allocated daily to each class of shares based on its respective percentage of adjusted net assets at the beginning of the day. |
| | Distribution fees are calculated based on the average daily net asset value attributable to Class A and Class C shares of the Fund, respectively (see Note 5). Class Y shares do not pay distribution fees. All expenses and fees paid to the Fund’s transfer agent for its services are allocated among the classes of shares based on the number of accounts in each class and the ratable allocation of related out-of-pocket expenses (see Note 4). |
| | Distributions to shareholders are recorded as of the ex-dividend date. Distributions paid by the Fund with respect to each class of shares are calculated in the same manner and at the same time, except that net |
26Pioneer Global Sustainable Growth Fund | Semiannual Report | 3/31/24
| | investment income dividends to Class A, Class C and Class Y shares can reflect different transfer agent and distribution expense rates. |
| G. | Risks |
| | The value of securities held by the Fund may go up or down, sometimes rapidly or unpredictably, due to general market conditions, such as real or perceived adverse economic, political or regulatory conditions, recessions, the spread of infectious illness or other public health issues, inflation, changes in interest rates, armed conflict such as between Russia and Ukraine or in the Middle East, sanctions against Russia, other nations or individuals or companies and possible countermeasures, lack of liquidity in the bond markets or adverse investor sentiment. In the past several years, financial markets have experienced increased volatility, depressed valuations, decreased liquidity and heightened uncertainty. These conditions may continue, recur, worsen or spread. Inflation and interest rates have increased and may rise further. These circumstances could adversely affect the value and liquidity of the Fund’s investments and negatively impact the Fund’s performance. |
| | The long-term impact of the COVID-19 pandemic and its subsequent variants on economies, markets, industries and individual issuers, are not known. Some sectors of the economy and individual issuers have experienced or may experience particularly large losses. Periods of extreme volatility in the financial markets, reduced liquidity of many instruments, increased government debt, inflation, and disruptions to supply chains, consumer demand and employee availability, may continue for some time. Following Russia’s invasion of Ukraine, Russian securities lost all, or nearly all, their market value. Other securities or markets could be similarly affected by past or future political, geopolitical or other events or conditions. |
| | Governments and central banks, including the U.S. Federal Reserve, have taken extraordinary and unprecedented actions to support local and global economies and the financial markets. These actions have resulted in significant expansion of public debt, including in the U.S. The consequences of high public debt, including its future impact on the economy and securities markets, may not be known for some time. |
| | The U.S. and other countries are periodically involved in disputes over trade and other matters, which may result in tariffs, investment restrictions and adverse impacts on affected companies and securities. For example, the U.S. has imposed tariffs and other trade barriers on Chinese exports, has restricted sales of certain categories of goods to China, and has established barriers to investments in China. Trade disputes may adversely affect the economies of the U.S. and its trading |
Pioneer Global Sustainable Growth Fund | Semiannual Report | 3/31/2427
| | partners, as well as companies directly or indirectly affected and financial markets generally. If the political climate between the U.S. and China does not improve or continues to deteriorate, if China were to attempt unification of Taiwan by force, or if other geopolitical conflicts develop or get worse, economies, markets and individual securities may be severely affected both regionally and globally, and the value of the Fund’s assets may go down. |
| | At times, the Fund’s investments may represent industries or industry sectors that are interrelated or have common risks, making the Fund more susceptible to any economic, political, or regulatory developments or other risks affecting those industries and sectors. |
| | The Fund may invest in small- and mid-size companies. Compared to large companies, small- and mid-size companies, and the market for their equity securities, may be more sensitive to changes in earnings results and investor expectations or poor economic or market conditions, including those experienced during a recession, have more limited product lines, operating histories, markets or capital resources, may be dependent upon a limited management group, experience sharper swings in market values, have limited liquidity, be harder to value or to sell at the times and prices the Adviser thinks appropriate, and offer greater potential for gain and loss. |
| | Normally, the Fund invests at least a minimum percentage of its net assets in issuers located outside of the U.S.. The Fund’s investments in foreign markets and countries with limited developing markets may subject the Fund to a greater degree of risk than investments in a developed market. These risks include disruptive political or economic conditions, military conflicts and sanctions, terrorism, sustained economic downturns, financial instability, less liquid trading markets, extreme price volatility, currency risks, reduction of government or central bank support, inadequate accounting standards, tariffs, tax disputes or other tax burdens, nationalization or expropriation of assets, and the imposition of adverse governmental laws, arbitrary application of laws and regulations or lack of rule of law and investment and repatriation restrictions. Lack of information and less market regulation also may affect the value of these securities. Withholding and other non-U.S. taxes may decrease the Fund’s return. Non-U.S. issuers may be located in parts of the world that have historically been prone to natural disasters. Investing in depositary receipts is subject to many of the same risks as investing directly in non-U.S. issuers. Depositary receipts may involve higher expenses and may trade at a discount (or premium) to the underlying security. |
28Pioneer Global Sustainable Growth Fund | Semiannual Report | 3/31/24
| | Russia launched a large-scale invasion of Ukraine on February 24, 2022. In response to the military action by Russia, various countries, including the U.S., the United Kingdom, and European Union issued broad-ranging economic sanctions against Russia and Belarus and certain companies and individuals. Since then, Russian securities have lost all, or nearly all, their market value, and many other issuers, securities and markets have been adversely affected. The United States and other countries may impose sanctions on other countries, companies and individuals in light of Russia’s military invasion. The extent and duration of the military action or future escalation of such hostilities, the extent and impact of existing and future sanctions, market disruptions and volatility, and the result of any diplomatic negotiations cannot be predicted. These and any related events could have a significant impact on the value and liquidity of certain Fund investments, on Fund performance and the value of an investment in the Fund, particularly with respect to securities and commodities, such as oil, natural gas and food commodities, as well as other sectors with exposure to Russian issuers or issuers in other countries affected by the invasion, and are likely to have collateral impacts on market sectors globally. |
| | With the increased use of technologies such as the Internet to conduct business, the Fund is susceptible to operational, information security and related risks. While the Fund’s Adviser has established business continuity plans in the event of, and risk management systems to prevent, limit or mitigate, such cyber-attacks, there are inherent limitations in such plans and systems, including the possibility that certain risks have not been identified. Furthermore, the Fund cannot control the cybersecurity plans and systems put in place by service providers to the Fund such as the Fund’s custodian and accounting agent, and the Fund’s transfer agent. In addition, many beneficial owners of Fund shares hold them through accounts at broker-dealers, retirement platforms and other financial market participants over which neither the Fund nor the Adviser exercises control. Each of these may in turn rely on service providers to them, which are also subject to the risk of cyber-attacks. Cybersecurity failures or breaches at the Adviser or the Fund’s service providers or intermediaries have the ability to cause disruptions and impact business operations, potentially resulting in financial losses, interference with the Fund’s ability to calculate its net asset value, impediments to trading, the inability of Fund shareholders to effect share purchases, redemptions or exchanges or receive distributions, loss of or unauthorized access to private shareholder information and violations of applicable privacy and other laws, regulatory fines, penalties, reputational damage, or additional compliance costs. Such costs and losses may not be covered under any |
Pioneer Global Sustainable Growth Fund | Semiannual Report | 3/31/2429
| | insurance. In addition, maintaining vigilance against cyber-attacks may involve substantial costs over time, and system enhancements may themselves be subject to cyber-attacks. |
| | The Fund’s prospectus contains unaudited information regarding the Fund’s principal risks. Please refer to that document when considering the Fund’s principal risks. |
| H. | Forward Foreign Currency Exchange Contracts |
| | The Fund may enter into forward foreign currency exchange contracts ("contracts") for the purchase or sale of a specific foreign currency at a fixed price on a future date. All contracts are marked-to-market daily at the applicable exchange rates, and any resulting unrealized appreciation or depreciation is recorded in the Fund's financial statements. The Fund records realized gains and losses at the time a contract is offset by entry into a closing transaction or extinguished by delivery of the currency. Risks may arise upon entering into these contracts from the potential inability of counterparties to meet the terms of the contract and from unanticipated movements in the value of foreign currencies relative to the U.S. dollar (see Note 7). |
| | During the six months ended March 31, 2024, the Fund had entered into various forward foreign currency exchange contracts that obligated the Fund to deliver or take delivery of currencies at specified future maturity dates. Alternatively, prior to the settlement date of a forward foreign currency exchange contract, the Fund may close out such contract by entering into an offsetting contract. |
| | The average market value of forward foreign currency exchange contracts open during the six months ended March 31, 2024 was $30,179 for sells. Open forward foreign currency exchange contracts outstanding at March 31, 2024 are listed in the Schedule of Investments. |
2. Management Agreement
The Adviser manages the Fund's portfolio. Management fees payable under the Fund's Investment Management Agreement with the Adviser are calculated daily and paid monthly at the annual rate of 0.65% of the Portfolio’s average daily net assets up to $1 billion and 0.60% of the Fund's average daily net assets over $1 billion. For the six months ended March 31, 2024, the effective management fee (excluding waivers and/or assumption of expenses) was equivalent to 0.65% (annualized) of the Fund’s average daily net assets.
The Adviser has contractually agreed to waive and/or reimburse ordinary operating expenses (ordinary operating expenses means all fund expenses
30Pioneer Global Sustainable Growth Fund | Semiannual Report | 3/31/24
other than taxes, brokerage commissions, acquired fund fees and expenses, and extraordinary expenses, such as litigation) of the Fund to the extent required to reduce Fund expenses to 1.00%, 1.75% and 0.70% of the average daily net assets attributable to Class A, Class C and Class Y Shares, respectively. These expense limitations are in effect through February 1, 2025. There can be no assurance that the Adviser will extend the expense limitation agreement for a class of shares beyond the date referred to above. Fees waived and expenses reimbursed during the six months ended March 31, 2024, are reflected on the Statement of Operations.
In addition, under the management and administration agreements, certain other services and costs, including accounting, regulatory reporting and insurance premiums, are paid by the Fund as administrative reimbursements. Reflected on the Statement of Assets and Liabilities is $300 in management fees payable to the Adviser at March 31, 2024.
3. Compensation of Officers and Trustees
The Fund pays an annual fee to its Trustees. The Adviser reimburses the Fund for fees paid to the Interested Trustees. Except for the chief compliance officer, the Fund does not pay any salary or other compensation to its officers. The Fund pays a portion of the chief compliance officer’s compensation for his services as the Fund’s chief compliance officer. Amundi US pays the remaining portion of the chief compliance officer’s compensation. For the six months ended March 31, 2024, the Fund paid $4,014 in Officers’ and Trustees’ compensation, which is reflected on the Statement of Operations as Officers’ and Trustees’ fees. At March 31, 2024, on its Statement of Assets and Liabilities, the Fund had a payable for Trustees’ fees of $1 and a payable for administrative expenses of $63, which includes the payable for Officers’ compensation.
4. Transfer Agent
BNY Mellon Investment Servicing (US) Inc. serves as the transfer agent to the Fund at negotiated rates. Transfer agent fees and payables shown on the Statement of Operations and the Statement of Assets and Liabilities, respectively, include sub-transfer agent expenses incurred through the Fund’s omnibus relationship contracts.
Pioneer Global Sustainable Growth Fund | Semiannual Report | 3/31/2431
In addition, the Fund reimbursed the transfer agent for out-of-pocket expenses incurred by the transfer agent related to shareholder communications activities such as proxy and statement mailings, and outgoing phone calls. For the six months ended March 31, 2024, such out-of-pocket expenses by class of shares were as follows:
| Shareholder Communications: | |
| Class A | $236 |
| Class C | 39 |
| Class Y | 9 |
| Total | $284 |
5. Distribution Plan
The Fund has adopted a distribution plan (the “Plan”) pursuant to Rule 12b-1 under the 1940 Act with respect to its Class A and Class C shares. Pursuant to the Plan, the Fund pays the Distributor 0.25% of the average daily net assets attributable to Class A shares as compensation for personal services and/or account maintenance services or distribution services with regard to Class A shares. Pursuant to the Plan, the Fund also pays the Distributor 1.00% of the average daily net assets attributable to Class C shares. The fee for Class C shares consists of a 0.25% service fee and a 0.75% distribution fee paid as compensation for personal services and/or account maintenance services or distribution services with regard to Class C shares. Reflected on the Statement of Assets and Liabilities is $165 in distribution fees payable to the Distributor at March 31, 2024.
In addition, redemptions of Class A and Class C shares may be subject to a contingent deferred sales charge (“CDSC”). A CDSC of 1.00% may be imposed on redemptions of certain net asset value purchases of Class A shares within 12 months of purchase. Redemptions of Class C shares within 12 months of purchase are subject to a CDSC of 1.00%, based on the lower of cost or market value of shares being redeemed. Shares purchased as part of an exchange remain subject to any CDSC that applied to the original purchase of those shares. There is no CDSC for Class Y shares. Proceeds from the CDSCs are paid to the Distributor. For the six months ended March 31, 2024, no CDSCs were paid to the Distributor.
6. Master Netting Agreements
The Fund has entered into an International Swaps and Derivatives Association, Inc. Master Agreement (“ISDA Master Agreement”) or similar agreement with substantially all of its derivative counterparties. An ISDA Master Agreement is a bilateral agreement between the Fund and a counterparty that governs the trading of certain Over the Counter (“OTC”) derivatives and typically contains, among other things, close-out and set-
32Pioneer Global Sustainable Growth Fund | Semiannual Report | 3/31/24
off provisions which apply upon the occurrence of an event of default and/or a termination event as defined under the relevant ISDA Master Agreement. The ISDA Master Agreement may also give a party the right to terminate all transactions traded under such agreement if, among other things, there is deterioration in the credit quality of the other party.
Upon an event of default or a termination of the ISDA Master Agreement, the non-defaulting party has the right to close-out all transactions under such agreement and to net amounts owed under each transaction to determine one net amount payable by one party to the other. The right to close out and net payments across all transactions under the ISDA Master Agreement could result in a reduction of the Fund’s credit risk to its counterparty equal to any amounts payable by the Fund under the applicable transactions, if any. However, the Fund’s right to set-off may be restricted or prohibited by the bankruptcy or insolvency laws of the particular jurisdiction to which each specific ISDA Master Agreement of each counterparty is subject.
The collateral requirements for derivatives transactions under an ISDA Master Agreement are governed by a credit support annex to the ISDA Master Agreement. Collateral requirements are generally determined at the close of business each day and are typically based on changes in market values for each transaction under an ISDA Master Agreement and netted into one amount for such agreement. Generally, the amount of collateral due from or to a counterparty is subject to threshold (a “minimum transfer amount”) before a transfer is required, which may vary by counterparty. Collateral pledged for the benefit of the Fund and/or counterparty is held in segregated accounts by the Fund’s custodian and cannot be sold, re- pledged, assigned or otherwise used while pledged. Cash that has been segregated to cover the Fund’s collateral obligations, if any, will be reported separately on the Statement of Assets and Liabilities as “Swaps collateral”. Securities pledged by the Fund as collateral, if any, are identified as such in the Schedule of Investments.
Pioneer Global Sustainable Growth Fund | Semiannual Report | 3/31/2433
Financial instruments subject to an enforceable master netting agreement, such as an ISDA Master Agreement, have been offset on the Statement of Assets and Liabilities. The following charts show gross assets and liabilities of the Fund as of March 31, 2024.
| Counterparty | Derivative
Assets
Subject to
Master Netting
Agreement | Derivatives
Available
for Offset | Non-Cash
Collateral
Received
(a) | Cash
Collateral
Received
(a) | Net Amount
of Derivative
Assets
(b) |
| Goldman Sachs & Co. | $295 | $ — | $ — | $ — | $295 |
| Total | $295 | $— | $— | $— | $295 |
| Counterparty | Derivative
Liabilities
Subject to
Master Netting
Agreement | Derivatives
Available for
Offset | Non-Cash
Collateral
Pledged
(a) | Cash
Collateral
Pledged
(a) | Net Amount
of Derivative
Liabilities
(c) |
| Goldman Sachs & Co. | $ — | $ — | $ — | $ — | $ — |
| Total | $— | $— | $— | $— | $— |
(a) The amount presented here may be less than the total amount of collateral received/pledged, as the net amount of derivative assets and liabilities cannot be less than $0.
(b) Represents the net amount due from the counterparty in the event of default.
(c) Represents the net amount payable to the counterparty in the event of default.
7. Additional Disclosures about Derivative Instruments and Hedging Activities
The Fund’s use of derivatives may enhance or mitigate the Fund’s exposure to the following risks:
Interest rate risk relates to the fluctuations in the value of interest-bearing securities due to changes in the prevailing levels of market interest rates.
Credit risk relates to the ability of the issuer of a financial instrument to make further principal or interest payments on an obligation or commitment that it has to the Fund.
Foreign exchange rate risk relates to fluctuations in the value of an asset or liability due to changes in currency exchange rates.
Equity risk relates to the fluctuations in the value of financial instruments as a result of changes in market prices (other than those arising from interest rate risk or foreign exchange rate risk), whether caused by factors
34Pioneer Global Sustainable Growth Fund | Semiannual Report | 3/31/24
specific to an individual investment, its issuer, or all factors affecting all instruments traded in a market or market segment.
Commodity risk relates to the risk that the value of a commodity or commodity index will fluctuate based on increases or decreases in the commodities market and factors specific to a particular industry or commodity.
The fair value of open derivative instruments (not considered to be hedging instruments for accounting disclosure purposes) by risk exposure at March 31, 2024, was as follows:
Statement of Assets
and Liabilities | Interest
Rate Risk | Credit
Risk | Foreign
Exchange
Rate Risk | Equity
Risk | Commodity
Risk |
| Assets | | | | | |
| Unrealized appreciation on forward foreign currency exchange contracts | $ — | $ — | $295 | $ — | $ — |
| Total Value | $— | $— | $295 | $— | $— |
The effect of derivative instruments (not considered to be hedging instruments for accounting disclosure purposes) on the Statement of Operations by risk exposure at March 31, 2024 was as follows:
| Statement of Operations | Interest
Rate Risk | Credit
Risk | Foreign
Exchange
Rate Risk | Equity
Risk | Commodity
Risk |
| Net Realized Gain (Loss) on | | | | | |
| Forward foreign currency exchange contracts | $ — | $ — | $ 16 | $ — | $ — |
| Total Value | $— | $— | $ 16 | $— | $— |
| Change in Net Unrealized Appreciation (Depreciation) on | | | | | |
| Forward foreign currency exchange contracts | $ — | $ — | $224 | $ — | $ — |
| Total Value | $— | $— | $224 | $— | $— |
Pioneer Global Sustainable Growth Fund | Semiannual Report | 3/31/2435
Additional Information
On March 25, 2024, Ernst & Young LLP (the “Prior Auditor”) resigned as the independent registered public accounting firm of Pioneer Global Sustainable Growth Fund (the “Fund”) due to the independence considerations resulting from a change of the independent registered public accounting firm of a related party. The Prior Auditor’s reports on the financial statements of the Fund for the past two fiscal years, the years ended September 30, 2023 and September 30, 2022, did not contain an adverse opinion or disclaimer of opinion, and were not qualified or modified as to uncertainty, audit scope or accounting principles.
During the last two fiscal year-ends and the subsequent interim period through March 25, 2024, there were no (1) disagreements with the Prior Auditor on any matter of accounting principles or practices, financial statement disclosure, or auditing scope or procedure, which disagreements, if not resolved to the Prior Auditor's satisfaction, would have caused it to make reference to that matter in connection with its reports on the Fund's financial statements for such periods; or (2) "reportable events" related to the Fund, as that term is defined in Item 304 (a)(1)(v) of Regulation S-K under the Securities Exchange Act of 1934.
On March 25, 2024, the Audit Committee of the Board approved, and on March 25, 2024, the Board approved, Deloitte & Touche LLP as the independent registered accounting firm of the Fund for fiscal periods ending after March 25, 2024.
36Pioneer Global Sustainable Growth Fund | Semiannual Report | 3/31/24
Trustees, Officers and Service Providers
Trustees
Thomas J. Perna, Chairman
John E. Baumgardner, Jr.
Diane Durnin
Benjamin M. Friedman
Lisa M. Jones
Craig C. MacKay
Lorraine H. Monchak
Marguerite A. Piret*
Fred J. Ricciardi
Officers
Lisa M. Jones, President and
Chief Executive Officer
Marco Pirondini**
Executive Vice President
Anthony J. Koenig, Jr., Treasurer
and Chief Financial and
Accounting Officer
Christopher J. Kelley, Secretary and
Chief Legal Officer
Investment Adviser and Administrator
Amundi Asset Management US, Inc.
Custodian and Sub-Administrator
The Bank of New York Mellon Corporation
Independent Registered Public Accounting Firm
Deloitte & Touche LLP
Principal Underwriter
Amundi Distributor US, Inc.
Legal Counsel
Morgan, Lewis & Bockius LLP
Transfer Agent
BNY Mellon Investment Servicing (US) Inc.
Proxy Voting Policies and Procedures of the Fund are available without charge, upon request, by calling our toll free number (1-800-225-6292). Information regarding how the Fund voted proxies relating to portfolio securities during the most recent 12-month period ended June 30 is publicly available to shareholders at www.amundi.com/us. This information is also available on the Securities and Exchange Commission’s web site at www.sec.gov.
* Ms. Piret became a non-voting Advisory Trustee of the Pioneer Funds effective January 22, 2024.
** Marco Pirondini was appointed to serve as an Executive Vice President of the Fund and Chief Investment Officer of Amundi US, Inc., effective January 1, 2024.
Pioneer Global Sustainable Growth Fund | Semiannual Report | 3/31/2437
How to Contact Amundi
We are pleased to offer a variety of convenient ways for you to contact us for assistance or information.
Call us for:
Account Information, including existing accounts,
new accounts, prospectuses, applications
and service forms
1-800-225-6292
FactFoneSM for automated fund yields, prices,
account information and transactions
1-800-225-4321
| Retirement plans information | 1-800-622-0176 |
Write to us:
Amundi
P.O. Box 534427
Pittsburgh, PA 15253-4427
| Our toll-free fax | 1-800-225-4240 |
| Our internet e-mail address | us.askamundi@amundi.com
(for general questions about Amundi only) |
Visit our web site: www.amundi.com/us
This report must be preceded or accompanied by a prospectus.
The Fund files a complete schedule of portfolio holdings with the Securities and Exchange Commission for the first and third quarters of each fiscal year as an exhibit to its reports on Form N-PORT. Shareholders may view the filed Form N-PORT by visiting the Commission’s web site at https://www.sec.gov.
Amundi Asset Management US, Inc.
60 State Street
Boston, MA 02109
www.amundi.com/us
Securities offered through Amundi Distributor US, Inc.
60 State Street, Boston, MA 02109
Underwriter of Pioneer Mutual Funds, Member SIPC
© 2024 Amundi Asset Management US, Inc. 32973-02-0524
Pioneer Global Sustainable Value Fund
Semiannual Report | March 31, 2024
IMPORTANT NOTICE – UPCOMING CHANGES TO PIONEER FUNDS ANNUAL & SEMI-ANNUAL REPORTS
The Securities and Exchange Commission (the “SEC”) has adopted rule and form amendments that will result in changes to the design and delivery of annual and semi-annual fund reports (“Reports”). Beginning in July 2024, Reports will be streamlined to highlight key information (“Redesigned Reports”). Certain information currently included in the Reports, including financial statements, will no longer appear in the Reports but will be available online, delivered free of charge to shareholders upon request, and filed with the SEC.
If you previously elected to receive the Fund's Reports electronically, you will continue to receive the Redesigned Reports electronically. Otherwise, you will receive paper copies of the Fund's Redesigned Reports via USPS mail starting in July 2024. If you would like to receive the Fund's Redesigned Reports (and/or other communications) electronically instead of by mail, please contact your financial advisor or, if you are a direct investor, please log into your mutual fund account at amundi.com/usinvestors and select “E-Delivery” under the Profile page. You must be registered for online account access before you can enroll in E-Delivery.
visit us: www.amundi.com/us
Pioneer Global Sustainable Value Fund | Semiannual Report | 3/31/241
Portfolio Summary | 3/31/24
Sector Distribution
(As a percentage of total investments)*
Geographical Distribution
(As a percentage of total investments based on country of domicile)*
2Pioneer Global Sustainable Value Fund | Semiannual Report | 3/31/24
10 Largest Holdings
| (As a percentage of total investments)* |
| 1. | Shell Plc (A.D.R.) | 3.24% |
| 2. | CRH Plc | 2.97 |
| 3. | Cardinal Health, Inc. | 2.89 |
| 4. | ABN AMRO Bank NV, (C.V.A.) (144A) | 2.71 |
| 5. | KB Financial Group, Inc.(A.D.R.) | 2.55 |
| 6. | Hensoldt AG | 2.43 |
| 7. | Teck Resources, Ltd., Class B | 2.41 |
| 8. | Persimmon Plc | 2.40 |
| 9. | International Business Machines Corp. | 2.40 |
| 10. | AerCap Holdings NV | 2.19 |
* Excludes short-term investments and all derivative contracts except for options purchased. The Fund is actively managed, and current holdings may be different. The holdings listed should not be considered recommendations to buy or sell any securities.
Pioneer Global Sustainable Value Fund | Semiannual Report | 3/31/243
Prices and Distributions | 3/31/24
Net Asset Value per Share
| Class | 3/31/24 | 9/30/23 |
| A | $11.71 | $10.10 |
| C | $11.67 | $10.03 |
| Y | $11.71 | $10.11 |
| | | |
Distributions per Share: 10/1/23 - 3/31/24
| Class | Net
Investment
Income | Short-Term
Capital Gains | Long-Term
Capital Gains |
| A | $0.2703 | $— | $— |
| C | $0.1996 | $— | $— |
| Y | $0.3009 | $— | $— |
Index Definitions
The Morgan Stanley Capital International (MSCI) All Country World Value NR Index measures the free-float weighted equity index that captures large and mid-cap representation across emerging markets countries. The index covers approximately 85% of the free float-adjusted market capitalization in each country. Indices are unmanaged and their returns assume reinvestment of dividends and do not reflect any fees or expenses. It is not possible to invest directly in an index.
The index defined here pertains to the “Value of $10,000 Investment” and “Value of $5 Million Investment” charts on pages 5 - 7.
4Pioneer Global Sustainable Value Fund | Semiannual Report | 3/31/24
| Performance Update | 3/31/24 | Class A Shares |
Investment Returns
The mountain chart on the right shows the change in value of a $10,000 investment made in Class A shares of Pioneer Global Sustainable Value Fund at public offering price during the periods shown, compared to that of the MSCI All Country World Value NR Index.*
Average Annual Total Returns
(As of March 31, 2024) |
| Period | Net
Asset
Value
(NAV) | Public
Offering
Price
(POP) | MSCI All
Country
World
Value
NR Index |
Life of Class
(5/10/21)* | 7.81% | 5.63% | 4.76% |
| 1 Year | 21.21 | 14.29 | 18.01 |
Expense Ratio
(Per prospectus dated February 1, 2024) |
| Gross | Net |
| 10.02% | 1.00% |
Value of $10,000 Investment
Call 1-800-225-6292 or visit www.amundi.com/us for the most recent month-end performance results. Current performance may be lower or higher than the performance data quoted.
The performance data quoted represents past performance, which is no guarantee of future results. Investment return and principal value will fluctuate, and shares, when redeemed, may be worth more or less than their original cost.
NAV results represent the percent change in net asset value per share. NAV returns would have been lower had sales charges been reflected. POP returns reflect deduction of maximum 5.75% sales charge. All results are historical and assume the reinvestment of dividends and capital gains. Other share classes are available for which performance and expenses will differ.
Performance results reflect any applicable expense waivers in effect during the periods shown. Without such waivers Fund performance would be lower. Waivers may not be in effect for all funds. Certain fee waivers are contractual through a specified period. Otherwise, fee waivers can be rescinded at any time. See the prospectus and financial statements for more information.
The net expense ratio reflects the contractual expense limitation in effect through February 1, 2025 for Class A shares. There can be no assurance that Amundi US will extend the expense limitation beyond such time. Please see the prospectus for more information.
* Performance of Class A shares shown in the graph above is from the inception of Class A shares on 5/10/21 through 3/31/24. Index information shown in the graph above is from 5/31/21 through 3/31/24.
The performance table and graph do not reflect the deduction of fees and taxes that a shareholder would pay on Fund distributions or the redemption of Fund shares.
Please refer to the financial highlights for more current expense ratios.
Pioneer Global Sustainable Value Fund | Semiannual Report | 3/31/245
| Performance Update | 3/31/24 | Class C Shares |
Investment Returns
The mountain chart on the right shows the change in value of a $10,000 investment made in Class C shares of Pioneer Global Sustainable Value Fund during the periods shown, compared to that of the MSCI All Country World Value NR Index.*
Average Annual Total Returns
(As of March 31, 2024) |
| Period | If
Held | If
Redeemed | MSCI All
Country
World
Value
NR Index |
Life of Class
(5/10/21)* | 7.03% | 7.03% | 4.76% |
| 1 Year | 20.37 | 19.37 | 18.01 |
Expense Ratio
(Per prospectus dated February 1, 2024) |
| Gross | Net |
| 10.73% | 1.75% |
Value of $10,000 Investment
Call 1-800-225-6292 or visit www.amundi.com/us for the most recent month-end performance results. Current performance may be lower or higher than the performance data quoted.
The performance data quoted represents past performance, which is no guarantee of future results. Investment return and principal value will fluctuate, and shares, when redeemed, may be worth more or less than their original cost.
Class C shares held for less than one year are subject to a 1% contingent deferred sales charge (CDSC). “If Held” results represent the percent change in net asset value per share. "If Redeemed" returns reflect the deduction of the CDSC for the one-year period, assuming a complete redemption of shares at the last price calculated on the last business day of the period, and no CDSC for the other time periods. All results are historical and assume the reinvestment of dividends and capital gains. Other share classes are available for which performance and expenses will differ.
Performance results reflect any applicable expense waivers in effect during the periods shown. Without such waivers Fund performance would be lower. Waivers may not be in effect for all funds. Certain fee waivers are contractual through a specified period. Otherwise, fee waivers can be rescinded at any time. See the prospectus and financial statements for more information.
The net expense ratio reflects the contractual expense limitation in effect through February 1, 2025 for Class C shares. There can be no assurance that Amundi US will extend the expense limitation beyond such time. Please see the prospectus for more information.
* Performance of Class C shares shown in the graph above is from the inception of Class C shares on 5/10/21 through 3/31/24. Index information shown in the graph above is from 5/31/21 through 3/31/24.
The performance table and graph do not reflect the deduction of fees and taxes that a shareholder would pay on Fund distributions or the redemption of Fund shares.
Please refer to the financial highlights for more current expense ratios.
6Pioneer Global Sustainable Value Fund | Semiannual Report | 3/31/24
| Performance Update | 3/31/24 | Class Y Shares |
Investment Returns
The mountain chart on the right shows the change in value of a $5 million investment made in Class Y shares of Pioneer Global Sustainable Value Fund during the periods shown, compared to that of the MSCI All Country World Value NR Index.*
Average Annual Total Returns
(As of March 31, 2024) |
| Period | Net
Asset
Value
(NAV) | MSCI All
Country
World
Value
NR Index |
Life of Class
(5/10/21)* | 8.11% | 4.76% |
| 1 Year | 21.55 | 18.01 |
Expense Ratio
(Per prospectus dated February 1, 2024) |
| Gross | Net |
| 9.73% | 0.70% |
Value of $5 Million Investment
Call 1-800-225-6292 or visit www.amundi.com/us for the most recent month-end performance results. Current performance may be lower or higher than the performance data quoted.
The performance data quoted represents past performance, which is no guarantee of future results. Investment return and principal value will fluctuate, and shares, when redeemed, may be worth more or less than their original cost.
Class Y shares are not subject to sales charges and are available for limited groups of eligible investors, including institutional investors. All results are historical and assume the reinvestment of dividends and capital gains. Other share classes are available for which performance and expenses will differ.
Performance results reflect any applicable expense waivers in effect during the periods shown. Without such waivers Fund performance would be lower. Waivers may not be in effect for all funds. Certain fee waivers are contractual through a specified period. Otherwise, fee waivers can be rescinded at any time. See the prospectus and financial statements for more information.
The net expense ratio reflects the contractual expense limitation in effect through February 1, 2025 for Class Y shares. There can be no assurance that Amundi US will extend the expense limitation beyond such time. Please see the prospectus and financial statements for more information.
* Performance of Class Y shares shown in the graph above is from the inception of Class Y shares on 5/10/21 through 3/31/24. Index information shown in the graph above is from 5/31/21 through 3/31/24.
The performance table and graph do not reflect the deduction of fees and taxes that a shareholder would pay on Fund distributions or the redemption of Fund shares.
Please refer to the financial highlights for more current expense ratios.
Pioneer Global Sustainable Value Fund | Semiannual Report | 3/31/247
Comparing Ongoing Fund Expenses
As a shareholder in the Fund, you incur two types of costs:
| (1) | ongoing costs, including management fees, distribution and/or service (12b-1) fees, and other Fund expenses; and |
| (2) | transaction costs, including sales charges (loads) on purchase payments. |
This example is intended to help you understand your ongoing expenses (in dollars) of investing in the Fund and to compare these costs with the ongoing costs of investing in other mutual funds. The example is based on an investment of $1,000 at the beginning of the Fund’s latest six-month period and held throughout the six months.
Using the Tables
Actual Expenses
The first table below provides information about actual account values and actual expenses. You may use the information in this table, together with the amount you invested, to estimate the expenses that you paid over the period as follows:
| (1) | Divide your account value by $1,000
Example: an $8,600 account value ÷ $1,000 = 8.6 |
| (2) | Multiply the result in (1) above by the corresponding share class’s number in the third row under the heading entitled “Expenses Paid During Period” to estimate the expenses you paid on your account during this period. |
Expenses Paid on a $1,000 Investment in Pioneer Global Sustainable Value Fund
Based on actual returns from October 1, 2023 through March 31, 2024.
| Share Class | A | C | Y |
Beginning Account
Value on 10/1/23 | $1,000.00 | $1,000.00 | $1,000.00 |
Ending Account Value
(after expenses) on 3/31/24 | $1,189.30 | $1,185.70 | $1,191.50 |
Expenses Paid
During Period* | $5.47 | $9.34 | $3.84 |
| | |
| * | Expenses are equal to the Fund’s annualized expense ratio of 1.00%, 1.71%, and 0.70% for Class A, Class C, and Class Y shares, respectively, multiplied by the average account value over the period, multiplied by 183/366 (to reflect the partial year period). |
8Pioneer Global Sustainable Value Fund | Semiannual Report | 3/31/24
Hypothetical Example for Comparison Purposes
The table below provides information about hypothetical account values and hypothetical expenses based on the Fund’s actual expense ratio and an assumed rate of return of 5% per year before expenses, which is not the Fund’s actual return. The hypothetical account values and expenses may not be used to estimate the actual ending account balance or expenses you paid for the period.
You may use this information to compare the ongoing costs of investing in the Fund and other funds. To do so, compare this 5% hypothetical example with the 5% hypothetical examples that appear in the shareholder reports of the other funds.
Please note that the expenses shown in the tables are meant to highlight your ongoing costs only and do not reflect any transaction costs, such as sales charges (loads) that are charged at the time of the transaction. Therefore, the table below is useful in comparing ongoing costs only and will not help you determine the relative total costs of owning different funds. In addition, if these transaction costs were included, your costs would have been higher.
Expenses Paid on a $1,000 Investment in Pioneer Global Sustainable Value Fund
Based on a hypothetical 5% return per year before expenses, reflecting the period from October 1, 2023 through March 31, 2024.
| Share Class | A | C | Y |
Beginning Account
Value on 10/1/23 | $1,000.00 | $1,000.00 | $1,000.00 |
Ending Account Value
(after expenses) on 3/31/24 | $1,020.00 | $1,016.45 | $1,021.50 |
Expenses Paid
During Period* | $5.05 | $8.62 | $3.54 |
| | |
| * | Expenses are equal to the Fund’s annualized expense ratio of 1.00%, 1.71%, and 0.70% for Class A, Class C, and Class Y shares, respectively, multiplied by the average account value over the period, multiplied by 183/366 (to reflect the partial year period). |
Pioneer Global Sustainable Value Fund | Semiannual Report | 3/31/249
Schedule of Investments | 3/31/24
(unaudited)
| Shares | | | | | | Value |
| | UNAFFILIATED ISSUERS — 100.1% | |
| | Common Stocks — 99.7% of Net Assets | |
| | Aerospace & Defense — 2.4% | |
| 1,404 | Hensoldt AG | $ 65,737 |
| | Total Aerospace & Defense | $65,737 |
|
|
| | Air Freight & Logistics — 0.9% | |
| 168 | United Parcel Service, Inc., Class B | $ 24,970 |
| | Total Air Freight & Logistics | $24,970 |
|
|
| | Automobile Components — 1.0% | |
| 600 | Bridgestone Corp. | $ 26,616 |
| | Total Automobile Components | $26,616 |
|
|
| | Automobiles — 1.1% | |
| 1,300 | Subaru Corp. | $ 29,588 |
| | Total Automobiles | $29,588 |
|
|
| | Banks — 17.0% | |
| 4,283 | ABN AMRO Bank NV (C.V.A.) (144A) | $ 73,475 |
| 1,448 | Bank of America Corp. | 54,908 |
| 873 | Citizens Financial Group, Inc. | 31,681 |
| 4,100 | Grupo Financiero Banorte S.A.B de CV, Class O | 44,047 |
| 1,281 | Hana Financial Group, Inc. | 56,061 |
| 1,325 | KB Financial Group, Inc. (A.D.R.) | 68,993 |
| 600 | Sumitomo Mitsui Financial Group, Inc. | 35,076 |
| 1,100 | UniCredit S.p.A. | 41,744 |
| 942 | Wells Fargo & Co. | 54,598 |
| | Total Banks | $460,583 |
|
|
| | Biotechnology — 2.0% | |
| 303 | AbbVie, Inc. | $ 55,176 |
| | Total Biotechnology | $55,176 |
|
|
| | Broadline Retail — 2.6% | |
| 4,600 | Alibaba Group Holding, Ltd. | $ 41,514 |
| 563 | eBay, Inc. | 29,715 |
| | Total Broadline Retail | $71,229 |
|
|
| | Capital Markets — 4.1% | |
| 531 | Bank of New York Mellon Corp. | $ 30,596 |
| 531 | State Street Corp. | 41,057 |
| 1,316 | UBS Group AG | 40,446 |
| | Total Capital Markets | $112,099 |
|
|
The accompanying notes are an integral part of these financial statements.
10Pioneer Global Sustainable Value Fund | Semiannual Report | 3/31/24
| Shares | | | | | | Value |
| | Chemicals — 1.1% | |
| 278 | LyondellBasell Industries NV, Class A | $ 28,434 |
| | Total Chemicals | $28,434 |
|
|
| | Communications Equipment — 1.5% | |
| 838 | Cisco Systems, Inc. | $ 41,825 |
| | Total Communications Equipment | $41,825 |
|
|
| | Construction Materials — 3.0% | |
| 933 | CRH Plc | $ 80,491 |
| | Total Construction Materials | $80,491 |
|
|
| | Consumer Staples Distribution & Retail — 1.0% | |
| 268 +# | Magnit PJSC | $ 1,121 |
| 1,800 | Seven & i Holdings Co., Ltd. | 26,200 |
| | Total Consumer Staples Distribution & Retail | $27,321 |
|
|
| | Diversified Telecommunication Services — 1.8% | |
| 2,004 | Deutsche Telekom AG | $ 48,648 |
| | Total Diversified Telecommunication Services | $48,648 |
|
|
| | Electric Utilities — 6.2% | |
| 662 | American Electric Power Co., Inc. | $ 56,998 |
| 939 | Eversource Energy | 56,124 |
| 1,401 | FirstEnergy Corp. | 54,107 |
| | Total Electric Utilities | $167,229 |
|
|
| | Electrical Equipment — 3.2% | |
| 400 | Fuji Electric Co., Ltd. | $ 26,820 |
| 239(a) | Generac Holdings, Inc. | 30,147 |
| 1,800 | Mitsubishi Electric Corp. | 30,171 |
| | Total Electrical Equipment | $87,138 |
|
|
| | Financial Services — 2.0% | |
| 789(a) | PayPal Holdings, Inc. | $ 52,855 |
| | Total Financial Services | $52,855 |
|
|
| | Health Care Equipment & Supplies — 3.1% | |
| 601 | Medtronic Plc | $ 52,377 |
| 2,460 | Smith & Nephew Plc | 31,108 |
| | Total Health Care Equipment & Supplies | $83,485 |
|
|
| | Health Care Providers & Services — 3.6% | |
| 699 | Cardinal Health, Inc. | $ 78,218 |
| 56 | Humana, Inc. | 19,416 |
| | Total Health Care Providers & Services | $97,634 |
|
|
The accompanying notes are an integral part of these financial statements.
Pioneer Global Sustainable Value Fund | Semiannual Report | 3/31/2411
Schedule of Investments | 3/31/24
(unaudited) (continued)
| Shares | | | | | | Value |
| | Hotels, Restaurants & Leisure — 0.7% | |
| 6,800(a) | Sands China, Ltd. | $ 19,177 |
| | Total Hotels, Restaurants & Leisure | $19,177 |
|
|
| | Household Durables — 2.4% | |
| 3,925 | Persimmon Plc | $ 65,124 |
| | Total Household Durables | $65,124 |
|
|
| | Industrial Conglomerates — 1.1% | |
| 521(a) | SK Square Co., Ltd. | $ 30,279 |
| | Total Industrial Conglomerates | $30,279 |
|
|
| | Insurance — 4.8% | |
| 212 | Chubb, Ltd. | $ 54,936 |
| 6,000 | Ping An Insurance Group Co. of China, Ltd., Class H | 25,524 |
| 181 | Willis Towers Watson Plc | 49,775 |
| | Total Insurance | $130,235 |
|
|
| | IT Services — 2.4% | |
| 340 | International Business Machines Corp. | $ 64,926 |
| | Total IT Services | $64,926 |
|
|
| | Machinery — 1.3% | |
| 4,000 | Mitsubishi Heavy Industries, Ltd. | $ 36,284 |
| | Total Machinery | $36,284 |
|
|
| | Metals & Mining — 6.6% | |
| 3,389 | Barrick Gold Corp. | $ 56,393 |
| 871 | Newmont Corp. | 31,217 |
| 394 | Rio Tinto Plc | 25,002 |
| 1,425 | Teck Resources, Ltd., Class B | 65,236 |
| | Total Metals & Mining | $177,848 |
|
|
| | Oil, Gas & Consumable Fuels — 9.4% | |
| 381 | Chesapeake Energy Corp. | $ 33,844 |
| 239 | Exxon Mobil Corp. | 27,781 |
| 1,924 | Marathon Oil Corp. | 54,526 |
| 2,784 | Permian Resources Corp. | 49,165 |
| 4,480 +# | Rosneft Oil Co. PJSC | 1,365 |
| 1,311 | Shell Plc (A.D.R.) | 87,890 |
| | Total Oil, Gas & Consumable Fuels | $254,571 |
|
|
| | Pharmaceuticals — 4.3% | |
| 1,341 | GSK Plc | $ 28,801 |
The accompanying notes are an integral part of these financial statements.
12Pioneer Global Sustainable Value Fund | Semiannual Report | 3/31/24
| Shares | | | | | | Value |
| | Pharmaceuticals — (continued) | |
| 1,338 | Pfizer, Inc. | $ 37,129 |
| 509 | Sanofi S.A. | 49,942 |
| | Total Pharmaceuticals | $115,872 |
|
|
| | Semiconductors & Semiconductor Equipment — 2.0% | |
| 319 | QUALCOMM, Inc. | $ 54,007 |
| | Total Semiconductors & Semiconductor Equipment | $54,007 |
|
|
| | Technology Hardware, Storage & Peripherals — 3.5% | |
| 1,200 | FUJIFILM Holdings Corp. | $ 26,958 |
| 22,000 | Lenovo Group, Ltd. | 25,502 |
| 707 | Samsung Electronics Co., Ltd. | 42,331 |
| | Total Technology Hardware, Storage & Peripherals | $94,791 |
|
|
| | Trading Companies & Distributors — 3.6% | |
| 684(a) | AerCap Holdings NV | $ 59,447 |
| 800 | Mitsui & Co., Ltd. | 37,378 |
| | Total Trading Companies & Distributors | $96,825 |
|
|
| | Total Common Stocks
(Cost $2,349,710) | $2,700,997 |
|
|
Principal
Amount
USD ($) | | | | | | |
| | U.S. Government and Agency Obligations —
0.4% of Net Assets | |
| 10,000(b) | U.S. Treasury Bills, 4/2/24 | $ 9,999 |
| | Total U.S. Government and Agency Obligations
(Cost $9,999) | $9,999 |
|
|
| | TOTAL INVESTMENTS IN UNAFFILIATED ISSUERS — 100.1%
(Cost $2,359,709) | $ 2,710,996 |
| | OTHER ASSETS AND LIABILITIES — (0.1)% | $ (1,575) |
| | net assets — 100.0% | $2,709,421 |
| | | | | | | |
The accompanying notes are an integral part of these financial statements.
Pioneer Global Sustainable Value Fund | Semiannual Report | 3/31/2413
Schedule of Investments | 3/31/24
(unaudited) (continued)
| (A.D.R.) | American Depositary Receipts. |
| (C.V.A.) | Certificaaten van aandelen (Share Certificates). |
| (144A) | The resale of such security is exempt from registration under Rule 144A of the Securities Act of 1933. Such security may be resold normally to qualified institutional buyers. At March 31, 2024, the value of these securities amounted to $73,475, or 2.7% of net assets. |
| (a) | Non-income producing security. |
| (b) | Security issued with a zero coupon. Income is recognized through accretion of discount. |
| + | Security is valued using significant unobservable inputs (Level 3). |
| # | Securities are restricted as to resale. |
| Restricted Securities | Acquisition date | Cost | Value |
| Magnit PJSC | 5/10/2021 | $19,543 | $1,121 |
| Rosneft Oil Co. PJSC | 6/23/2021 | 37,564 | 1,365 |
| Total Restricted Securities | | | $2,486 |
| % of Net assets | | | 0.1% |
Distribution of investments by country of domicile (excluding short-term investments) as a percentage of total investments in securities, is as follows:
| United States | 40.7% |
| United Kingdom | 10.6% |
| Japan | 10.2% |
| South Korea | 7.3% |
| Ireland | 7.1% |
| Canada | 4.5% |
| Germany | 4.2% |
| Switzerland | 3.5% |
| China | 3.4% |
| Netherlands | 2.7% |
| France | 1.9% |
| Mexico | 1.6% |
| Italy | 1.5% |
| Other (individually less than 1%) | 0.8% |
| | 100.0% |
Purchases and sales of securities (excluding short-term investments) for the six months ended March 31, 2024, aggregated $1,038,493 and $930,412, respectively.
The accompanying notes are an integral part of these financial statements.
14Pioneer Global Sustainable Value Fund | Semiannual Report | 3/31/24
At March 31, 2024, the net unrealized appreciation on investments based on cost for federal tax purposes of $2,364,214 was as follows:
| Aggregate gross unrealized appreciation for all investments in which there is an excess of value over tax cost | $ 518,953 |
| Aggregate gross unrealized depreciation for all investments in which there is an excess of tax cost over value | (172,171) |
| Net unrealized appreciation | $ 346,782 |
Various inputs are used in determining the value of the Fund’s investments. These inputs are summarized in the three broad levels below.
| Level 1 | – | unadjusted quoted prices in active markets for identical securities. |
| Level 2 | – | other significant observable inputs (including quoted prices for similar securities, interest rates, prepayment speeds, credit risks, etc.). See Notes to Financial Statements — Note 1A. |
| Level 3 | – | significant unobservable inputs (including the Adviser’s own assumptions in determining fair value of investments). See Notes to Financial Statements — Note 1A. |
The following is a summary of the inputs used as of March 31, 2024 in valuing the Fund’s investments:
| | Level 1 | Level 2 | Level 3 | Total |
| Common Stocks | | | | |
| Aerospace & Defense | $ — | $ 65,737 | $ — | $ 65,737 |
| Automobile Components | — | 26,616 | — | 26,616 |
| Automobiles | — | 29,588 | — | 29,588 |
| Banks | 254,227 | 206,356 | — | 460,583 |
| Broadline Retail | 29,715 | 41,514 | — | 71,229 |
| Capital Markets | 71,653 | 40,446 | — | 112,099 |
| Construction Materials | — | 80,491 | — | 80,491 |
| Consumer Staples Distribution & Retail | — | 26,200 | 1,121 | 27,321 |
| Diversified Telecommunication Services | — | 48,648 | — | 48,648 |
| Electrical Equipment | 30,147 | 56,991 | — | 87,138 |
| Health Care Equipment & Supplies | 52,377 | 31,108 | — | 83,485 |
| Hotels, Restaurants & Leisure | — | 19,177 | — | 19,177 |
| Household Durables | — | 65,124 | — | 65,124 |
| Industrial Conglomerates | — | 30,279 | — | 30,279 |
| Insurance | 104,711 | 25,524 | — | 130,235 |
| Machinery | — | 36,284 | — | 36,284 |
| Metals & Mining | 152,846 | 25,002 | — | 177,848 |
| Oil, Gas & Consumable Fuels | 253,206 | — | 1,365 | 254,571 |
| Pharmaceuticals | 37,129 | 78,743 | — | 115,872 |
The accompanying notes are an integral part of these financial statements.
Pioneer Global Sustainable Value Fund | Semiannual Report | 3/31/2415
Schedule of Investments | 3/31/24
(unaudited) (continued)
| | Level 1 | Level 2 | Level 3 | Total |
| Technology Hardware, Storage & Peripherals | $ — | $ 94,791 | $ — | $ 94,791 |
| Trading Companies & Distributors | 59,447 | 37,378 | — | 96,825 |
| All Other Common Stocks | 587,056 | — | — | 587,056 |
| U.S. Government and Agency Obligations | — | 9,999 | — | 9,999 |
| Total Investments in Securities | $1,632,514 | $1,075,996 | $ 2,486 | $2,710,996 |
During the period ended March 31, 2024, there were no transfers in or out of Level 3.
The accompanying notes are an integral part of these financial statements.
16Pioneer Global Sustainable Value Fund | Semiannual Report | 3/31/24
Statement of Assets and Liabilities | 3/31/24
(unaudited)
| ASSETS: | |
| Investments in unaffiliated issuers, at value (cost $2,359,709) | $2,710,996 |
| Cash | 23,539 |
| Foreign currencies, at value (cost $344) | 344 |
| Receivables — | |
| Dividends | 7,502 |
| Due from the Adviser | 1,382 |
| Other assets | 19,612 |
| Total assets | $2,763,375 |
| LIABILITIES: | |
| Payables — | |
| Trustees’ fees | $ 35 |
| Professional fees | 40,548 |
| Printing expense | 11,419 |
| Management fees | 287 |
| Administrative expenses | 57 |
| Distribution fees | 163 |
| Accrued expenses | 1,445 |
| Total liabilities | $ 53,954 |
| NET ASSETS: | |
| Paid-in capital | $2,312,697 |
| Distributable earnings | 396,724 |
| Net assets | $2,709,421 |
| NET ASSET VALUE PER SHARE: | |
| No par value (unlimited number of shares authorized) | |
| Class A (based on $905,904/77,340 shares) | $ 11.71 |
| Class C (based on $776,916/66,583 shares) | $ 11.67 |
| Class Y (based on $1,026,601/87,650 shares) | $ 11.71 |
| MAXIMUM OFFERING PRICE PER SHARE: | |
| Class A (based on $11.71 net asset value per share/100%-5.75% maximum sales charge) | $ 12.42 |
The accompanying notes are an integral part of these financial statements.
Pioneer Global Sustainable Value Fund | Semiannual Report | 3/31/2417
Statement of Operations (unaudited)
FOR THE SIX MONTHS ENDED 3/31/24
| INVESTMENT INCOME: | | |
| Dividends from unaffiliated issuers (net of foreign taxes withheld $1,316) | $ 30,804 | |
| Interest from unaffiliated issuers | 710 | |
| Total Investment Income | | $ 31,514 |
| EXPENSES: | | |
| Management fees | $ 7,876 | |
| Administrative expenses | 5,168 | |
| Transfer agent fees | | |
| Class A | 81 | |
| Class C | 20 | |
| Class Y | 23 | |
| Distribution fees | | |
| Class A | 1,017 | |
| Class C | 3,471 | |
| Shareholder communications expense | 203 | |
| Custodian fees | 54 | |
| Registration fees | 16,049 | |
| Professional fees | 34,062 | |
| Printing expense | 4,916 | |
| Officers’ and Trustees’ fees | 4,028 | |
| Miscellaneous | 1,524 | |
| Total expenses | | $ 78,492 |
| Less fees waived and expenses reimbursed by the Adviser | | (65,276) |
| Net expenses | | $ 13,216 |
| Net investment income | | $ 18,298 |
| REALIZED AND UNREALIZED GAIN (LOSS) ON INVESTMENTS: | | |
| Net realized gain (loss) on: | | |
| Investments in unaffiliated issuers | $ 55,646 | |
| Other assets and liabilities denominated in foreign currencies | 300 | $ 55,946 |
| Change in net unrealized appreciation (depreciation) on: | | |
| Investments in unaffiliated issuers | $358,288 | |
| Other assets and liabilities denominated in foreign currencies | (22) | $358,266 |
| Net realized and unrealized gain (loss) on investments | | $414,212 |
| Net increase in net assets resulting from operations | | $432,510 |
The accompanying notes are an integral part of these financial statements.
18Pioneer Global Sustainable Value Fund | Semiannual Report | 3/31/24
Statements of Changes in Net Assets
| | Six Months
Ended
3/31/24
(unaudited) | Year
Ended
9/30/23 |
| FROM OPERATIONS: | | |
| Net investment income (loss) | $ 18,298 | $ 44,118 |
| Net realized gain (loss) on investments | 55,946 | 46,220 |
| Change in net unrealized appreciation (depreciation) on investments | 358,266 | 344,672 |
| Net increase in net assets resulting from operations | $ 432,510 | $ 435,010 |
| DISTRIBUTIONS TO SHAREHOLDERS: | | |
| Class A ($0.27 and $0.21 per share, respectively) | $ (20,576) | $ (16,032) |
| Class C ($0.20 and $0.15 per share, respectively) | (13,076) | (9,079) |
| Class Y ($0.30 and $0.24 per share, respectively) | (25,743) | (20,026) |
| Total distributions to shareholders | $ (59,395) | $ (45,137) |
| FROM FUND SHARE TRANSACTIONS: | | |
| Net proceeds from sales of shares | $ 3,376 | $ 93,718 |
| Reinvestment of distributions | 51,280 | 45,137 |
| Cost of shares repurchased | (9,403) | (81,445) |
| Net increase in net assets resulting from Fund share transactions | $ 45,253 | $ 57,410 |
| Net increase in net assets | $ 418,368 | $ 447,283 |
| NET ASSETS: | | |
| Beginning of period | $2,291,053 | $1,843,770 |
| End of period | $2,709,421 | $ 2,291,053 |
The accompanying notes are an integral part of these financial statements.
Pioneer Global Sustainable Value Fund | Semiannual Report | 3/31/2419
Statements of Changes in Net Assets (continued)
| | Six Months
Ended
3/31/24
Shares
(unaudited) | Six Months
Ended
3/31/24
Amount
(unaudited) | Year
Ended
9/30/23
Shares | Year
Ended
9/30/23
Amount |
| Class A | | | | |
| Shares sold | 322 | $ 3,376 | 6,709 | $ 67,098 |
| Reinvestment of distributions | 1,720 | 18,057 | 1,691 | 16,032 |
| Less shares repurchased | (845) | (9,403) | (7,692) | (76,589) |
| Net increase | 1,197 | $12,030 | 708 | $ 6,541 |
| Class C | | | | |
| Shares sold | — | $ — | 2,107 | $ 21,620 |
| Reinvestment of distributions | 1,072 | 11,237 | 960 | 9,079 |
| Less shares repurchased | — | — | — | — |
| Net increase | 1,072 | $11,237 | 3,067 | $ 30,699 |
| Class Y | | | | |
| Shares sold | — | $ — | 479 | $ 5,000 |
| Reinvestment of distributions | 2,096 | 21,986 | 2,115 | 20,026 |
| Less shares repurchased | — | — | (480) | (4,856) |
| Net increase | 2,096 | $21,986 | 2,114 | $ 20,170 |
The accompanying notes are an integral part of these financial statements.
20Pioneer Global Sustainable Value Fund | Semiannual Report | 3/31/24
| | Six Months
Ended
3/31/24
(unaudited) | Year
Ended
9/30/23 | Year
Ended
9/30/22 | 5/10/21* to
9/30/21 |
| Class A | | | | |
| Net asset value, beginning of period | $10.10 | $ 8.34 | $ 9.64 | $ 10.00 |
| Increase (decrease) from investment operations: | | | | |
| Net investment income (loss) (a) | $ 0.08 | $ 0.20 | $ 0.21 | $ 0.08 |
| Net realized and unrealized gain (loss) on investments | 1.80 | 1.77 | (1.39) | (0.44) |
| Net increase (decrease) from investment operations | $ 1.88 | $ 1.97 | $ (1.18) | $ (0.36) |
| Distributions to shareholders: | | | | |
| Net investment income | $ (0.27) | $ (0.21) | $ (0.12) | $ — |
| Total distributions | $ (0.27) | $ (0.21) | $ (0.12) | $ — |
| Net increase (decrease) in net asset value | $ 1.61 | $ 1.76 | $ (1.30) | $ (0.36) |
| Net asset value, end of period | $11.71 | $10.10 | $ 8.34 | $ 9.64 |
| Total return (b) | 18.93%(c) | 23.82% | (12.40)% | (3.60)%(c) |
| Ratio of net expenses to average net assets | 1.00%(d) | 1.00% | 0.99% | 0.94%(d) |
| Ratio of net investment income (loss) to average net assets | 1.60%(d) | 2.06% | 2.24% | 1.99%(d) |
| Portfolio turnover rate | 39%(c) | 81% | 68% | 26%(c) |
| Net assets, end of period (in thousands) | $ 906 | $ 769 | $ 629 | $ 588 |
| Ratios with no waiver of fees and assumption of expenses by the Adviser and no reduction for fees paid indirectly: | | | | |
| Total expenses to average net assets | 6.39%(d) | 10.02% | 11.90% | 13.75%(d) |
| Net investment income (loss) to average net assets | (3.79)%(d) | (6.96)% | (8.67)% | (10.82)%(d) |
| * | Class A commenced operations on May 10, 2021. |
| (a) | The per-share data presented above is based on the average shares outstanding for the period presented. |
| (b) | Assumes initial investment at net asset value at the beginning of each period, reinvestment of all distributions, the complete redemption of the investment at net asset value at the end of each period and no sales charges. Total return would be reduced if sales charges were taken into account. |
| (c) | Not annualized. |
| (d) | Annualized. |
The accompanying notes are an integral part of these financial statements.
Pioneer Global Sustainable Value Fund | Semiannual Report | 3/31/2421
Financial Highlights (continued)
| | Six Months
Ended
3/31/24
(unaudited) | Year
Ended
9/30/23 | Year
Ended
9/30/22 | 5/10/21* to
9/30/21 |
| Class C | | | | |
| Net asset value, beginning of period | $10.03 | $ 8.29 | $ 9.61 | $ 10.00 |
| Increase (decrease) from investment operations: | | | | |
| Net investment income (loss) (a) | $ 0.05 | $ 0.13 | $ 0.13 | $ 0.05 |
| Net realized and unrealized gain (loss) on investments | 1.79 | 1.76 | (1.37) | (0.44) |
| Net increase (decrease) from investment operations | $ 1.84 | $ 1.89 | $ (1.24) | $ (0.39) |
| Distributions to shareholders: | | | | |
| Net investment income | $ (0.20) | $ (0.15) | $ (0.08) | $ — |
| Total distributions | $ (0.20) | $ (0.15) | $ (0.08) | $ — |
| Net increase (decrease) in net asset value | $ 1.64 | $ 1.74 | $ (1.32) | $ (0.39) |
| Net asset value, end of period | $11.67 | $10.03 | $ 8.29 | $ 9.61 |
| Total return (b) | 18.57%(c) | 22.85% | (13.01)% | (3.90)%(c) |
| Ratio of net expenses to average net assets | 1.71%(d) | 1.71% | 1.70% | 1.71%(d) |
| Ratio of net investment income (loss) to average net assets | 0.89%(d) | 1.35% | 1.38% | 1.22%(d) |
| Portfolio turnover rate | 39%(c) | 81% | 68% | 26%(c) |
| Net assets, end of period (in thousands) | $ 777 | $ 657 | $ 517 | $ 577 |
| Ratios with no waiver of fees and assumption of expenses by the Adviser and no reduction for fees paid indirectly: | | | | |
| Total expenses to average net assets | 7.09%(d) | 10.73% | 12.61% | 14.52%(d) |
| Net investment income (loss) to average net assets | (4.49)%(d) | (7.67)% | (9.53)% | (11.59)%(d) |
| * | Class C commenced operations on May 10, 2021. |
| (a) | The per-share data presented above is based on the average shares outstanding for the period presented. |
| (b) | Assumes initial investment at net asset value at the beginning of each period, reinvestment of all distributions, the complete redemption of the investment at net asset value at the end of each period and no sales charges. Total return would be reduced if sales charges were taken into account. |
| (c) | Not annualized. |
| (d) | Annualized. |
The accompanying notes are an integral part of these financial statements.
22Pioneer Global Sustainable Value Fund | Semiannual Report | 3/31/24
| | Six Months
Ended
3/31/24
(unaudited) | Year
Ended
9/30/23 | Year
Ended
9/30/22 | 5/10/21* to
9/30/21 |
| Class Y | | | | |
| Net asset value, beginning of period | $10.11 | $ 8.35 | $ 9.65 | $ 10.00 |
| Increase (decrease) from investment operations: | | | | |
| Net investment income (loss) (a) | $ 0.10 | $ 0.23 | $ 0.23 | $ 0.09 |
| Net realized and unrealized gain (loss) on investments | 1.80 | 1.77 | (1.38) | (0.44) |
| Net increase (decrease) from investment operations | $ 1.90 | $ 2.00 | $ (1.15) | $ (0.35) |
| Distributions to shareholders: | | | | |
| Net investment income | $ (0.30) | $ (0.24) | $ (0.15) | $ — |
| Total distributions | $ (0.30) | $ (0.24) | $ (0.15) | $ — |
| Net increase (decrease) in net asset value | $ 1.60 | $ 1.76 | $ (1.30) | $ (0.35) |
| Net asset value, end of period | $11.71 | $10.11 | $ 8.35 | $ 9.65 |
| Total return (b) | 19.15%(c) | 24.15% | (12.18)% | (3.50)%(c) |
| Ratio of net expenses to average net assets | 0.70%(d) | 0.70% | 0.70% | 0.70%(d) |
| Ratio of net investment income (loss) to average net assets | 1.90%(d) | 2.36% | 2.43% | 2.22%(d) |
| Portfolio turnover rate | 39%(c) | 81% | 68% | 26%(c) |
| Net assets, end of period (in thousands) | $1,027 | $ 865 | $ 697 | $ 782 |
| Ratios with no waiver of fees and assumption of expenses by the Adviser and no reduction for fees paid indirectly: | | | | |
| Total expenses to average net assets | 6.09%(d) | 9.73% | 11.63% | 13.51%(d) |
| Net investment income (loss) to average net assets | (3.49)%(d) | (6.67)% | (8.50)% | (10.59)%(d) |
| * | Class Y commenced operations on May 10, 2021. |
| (a) | The per-share data presented above is based on the average shares outstanding for the period presented. |
| (b) | Assumes initial investment at net asset value at the beginning of each period, reinvestment of all distributions and the complete redemption of the investment at net asset value at the end of each period. |
| (c) | Not annualized. |
| (d) | Annualized. |
The accompanying notes are an integral part of these financial statements.
Pioneer Global Sustainable Value Fund | Semiannual Report | 3/31/2423
Notes to Financial Statements | 3/31/24
(unaudited)
1. Organization and Significant Accounting Policies
Pioneer Global Sustainable Value Fund (the “Fund”) is one of five portfolios comprising Pioneer Series Trust XIV (the “Trust”), a Delaware statutory trust. The Fund is registered under the Investment Company Act of 1940, as amended (the "1940 Act") as a diversified, open end management investment company. The Fund’s investment objective is to seek long-term capital growth.
The Fund offers three classes of shares designated as Class A, Class C and Class Y shares. Class A, Class C and Class Y commenced operations on May 10, 2021. Each class of shares represents an interest in the same portfolio of investments of the Fund and has identical rights (based on relative net asset values) to assets and liquidation proceeds. Share classes can bear different rates of class-specific fees and expenses, such as transfer agent and distribution fees. Differences in class specific fees and expenses will result in differences in net investment income and, therefore, the payment of different dividends from net investment income earned by each class. The Amended and Restated Declaration of Trust of the Trust gives the Board of Trustees the flexibility to specify either per-share voting or dollar-weighted voting when submitting matters for shareholder approval. Under per-share voting, each share of a class of the Fund is entitled to one vote. Under dollar-weighted voting, a shareholder’s voting power is determined not by the number of shares owned, but by the dollar value of the shares on the record date. Each share class has exclusive voting rights with respect to matters affecting only that class, including with respect to the distribution plan for that class. There is no distribution plan for Class Y shares.
Amundi Asset Management US, Inc., an indirect, wholly owned subsidiary of Amundi and Amundi’s wholly owned subsidiary, Amundi USA, Inc., serves as the Fund’s investment adviser (the “Adviser”). Amundi Distributor US, Inc., an affiliate of the Adviser, serves as the Fund’s distributor (the “Distributor”).
The Fund is required to comply with Rule 18f-4 under the 1940 Act, which governs the use of derivatives by registered investment companies. Rule 18f-4 permits funds to enter into derivatives transactions (as defined in Rule 18f-4) and certain other transactions notwithstanding the restrictions on the issuance of “senior securities” under Section 18 of the 1940 Act. Rule 18f-4 requires a fund to establish and maintain a comprehensive derivatives risk management program, appoint a derivatives
24Pioneer Global Sustainable Value Fund | Semiannual Report | 3/31/24
risk manager and comply with a relative or absolute limit on fund leverage risk calculated based on value-at-risk (“VaR”), unless the fund uses derivatives in only a limited manner (a "limited derivatives user"). The Fund is currently a limited derivatives user for purposes of Rule 18f-4.
The Fund is an investment company and follows investment company accounting and reporting guidance under U.S. Generally Accepted Accounting Principles (“U.S. GAAP”). U.S. GAAP requires the management of the Fund to make estimates and assumptions that affect the reported amounts of assets and liabilities, the disclosure of contingent assets and liabilities at the date of the financial statements, and the reported amounts of income, expenses and gain or loss on investments during the reporting period. Actual results could differ from those estimates.
The following is a summary of significant accounting policies followed by the Fund in the preparation of its financial statements:
| A. | Security Valuation |
| | The net asset value of the Fund is computed once daily, on each day the New York Stock Exchange (“NYSE”) is open, as of the close of regular trading on the NYSE. |
| | Equity securities that have traded on an exchange are valued by using the last sale price on the principal exchange where they are traded. Equity securities that have not traded on the date of valuation, or securities for which sale prices are not available, generally are valued using the mean between the last bid and asked prices or, if both last bid and asked prices are not available, at the last quoted bid price. Last sale and bid and asked prices are provided by independent third party pricing services. In the case of equity securities not traded on an exchange, prices are typically determined by independent third party pricing services using a variety of techniques and methods. |
| | The value of foreign securities is translated into U.S. dollars based on foreign currency exchange rate quotations supplied by a third party pricing source. Trading in non-U.S. equity securities is substantially completed each day at various times prior to the close of the NYSE. The values of such securities used in computing the net asset value of the Fund’s shares are determined as of such times. The Adviser may use a fair value model developed by an independent pricing service to value non-U.S. equity securities. |
| | Forward foreign currency exchange contracts are valued daily using the foreign exchange rate or, for longer term forward contract positions, the spot currency rate and the forward points on a daily basis, in each case |
Pioneer Global Sustainable Value Fund | Semiannual Report | 3/31/2425
| | provided by a third party pricing service. Contracts whose forward settlement date falls between two quoted days are valued by interpolation. |
| | Shares of open-end registered investment companies (including money market mutual funds) are valued at such funds' net asset value. |
| | Securities for which independent pricing services or broker-dealers are unable to supply prices or for which market prices and/or quotations are not readily available or are considered to be unreliable are valued by a fair valuation team comprised of certain personnel of the Adviser. The Adviser is designated as the valuation designee for the Fund pursuant to Rule 2a-5 under the 1940 Act. The Adviser’s fair valuation team is responsible for monitoring developments that may impact fair valued securities. |
| | Inputs used when applying fair value methods to value a security may include credit ratings, the financial condition of the company, current market conditions and comparable securities. The Adviser may use fair value methods if it is determined that a significant event has occurred after the close of the exchange or market on which the security trades and prior to the determination of the Fund’s net asset value. Examples of a significant event might include political or economic news, corporate restructurings, natural disasters, terrorist activity or trading halts. Thus, the valuation of the Fund’s securities may differ significantly from exchange prices, and such differences could be material. |
| B. | Investment Income and Transactions |
| | Dividend income is recorded on the ex-dividend date, except that certain dividends from foreign securities where the ex-dividend date may have passed are recorded as soon as the Fund becomes aware of the ex-dividend data in the exercise of reasonable diligence. |
| | Interest income, including interest on income-bearing cash accounts, is recorded on the accrual basis. Dividend and interest income are reported net of unrecoverable foreign taxes withheld at the applicable country rates and net of income accrued on defaulted securities. |
| | Interest and dividend income payable by delivery of additional shares is reclassified as PIK (payment-in-kind) income upon receipt and is included in interest and dividend income, respectively. |
| | Security transactions are recorded as of trade date. Gains and losses on sales of investments are calculated on the identified cost method for both financial reporting and federal income tax purposes. |
26Pioneer Global Sustainable Value Fund | Semiannual Report | 3/31/24
| C. | Foreign Currency Translation |
| | The books and records of the Fund are maintained in U.S. dollars. Amounts denominated in foreign currencies are translated into U.S. dollars using current exchange rates. |
| | Net realized gains and losses on foreign currency transactions, if any, represent, among other things, the net realized gains and losses on foreign currency exchange contracts, disposition of foreign currencies and the difference between the amount of income accrued and the U.S. dollars actually received. Further, the effects of changes in foreign currency exchange rates on investments are not segregated on the Statement of Operations from the effects of changes in the market prices of those securities, but are included with the net realized and unrealized gain or loss on investments. |
| D. | Federal Income Taxes |
| | It is the Fund’s policy to comply with the requirements of the Internal Revenue Code applicable to regulated investment companies and to distribute all of its net taxable income and net realized capital gains, if any, to its shareholders. Therefore, no provision for federal income taxes is required. As of March 31, 2024, the Fund did not accrue any interest or penalties with respect to uncertain tax positions, which, if applicable, would be recorded as an income tax expense on the Statement of Operations. Tax returns filed within the prior three years remain subject to examination by federal and state tax authorities. |
| | The amount and character of income and capital gain distributions to shareholders are determined in accordance with federal income tax rules, which may differ from U.S. GAAP. Distributions in excess of net investment income or net realized gains are temporary over distributions for financial statement purposes resulting from differences in the recognition or classification of income or distributions for financial statement and tax purposes. Capital accounts within the financial statements are adjusted for permanent book/tax differences to reflect tax character, but are not adjusted for temporary differences. |
Pioneer Global Sustainable Value Fund | Semiannual Report | 3/31/2427
| | The tax character of current year distributions payable will be determined at the end of the current taxable year. The tax character of distributions paid during the year ended September 30, 2023 was as follows: |
| | 2023 |
| Distributions paid from: | |
| Ordinary income | $45,137 |
| Total | $45,137 |
The following shows the components of distributable earnings (losses) on a federal income tax basis at September 30, 2023:
| | 2023 |
| Distributable earnings/(losses): | |
| Undistributed ordinary income | $ 41,014 |
| Capital loss carryforward | (3,918) |
| Other book/tax temporary differences | (1,981) |
| Net unrealized depreciation | (11,506) |
| Total | $ 23,609 |
The differences between book basis and tax basis net unrealized depreciation are attributable to the tax deferral of losses on wash sales and tax basis differences on partnership holdings.
| E. | Fund Shares |
| | The Fund records sales and repurchases of its shares as of trade date. The Distributor earned $11 in underwriting commissions on the sale of Class A shares during the six months ended March 31, 2024. |
| F. | Class Allocations |
| | Income, common expenses and realized and unrealized gains and losses are calculated at the Fund level and allocated daily to each class of shares based on its respective percentage of adjusted net assets at the beginning of the day. |
| | Distribution fees are calculated based on the average daily net asset value attributable to Class A and Class C shares of the Fund, respectively (see Note 5). Class Y shares do not pay distribution fees. All expenses and fees paid to the Fund’s transfer agent for its services are allocated among the classes of shares based on the number of accounts in each class and the ratable allocation of related out-of-pocket expenses (see Note 4). |
| | Distributions to shareholders are recorded as of the ex-dividend date. Distributions paid by the Fund with respect to each class of shares are |
28Pioneer Global Sustainable Value Fund | Semiannual Report | 3/31/24
| | calculated in the same manner and at the same time, except that net investment income dividends to Class A, Class C and Class Y shares can reflect different transfer agent and distribution expense rates. |
| G. | Risks |
| | The value of securities held by the Fund may go up or down, sometimes rapidly or unpredictably, due to general market conditions, such as real or perceived adverse economic, political or regulatory conditions, recessions, the spread of infectious illness or other public health issues, inflation, changes in interest rates, armed conflict such as between Russia and Ukraine or in the Middle East, sanctions against Russia, other nations or individuals or companies and possible countermeasures, lack of liquidity in the bond markets or adverse investor sentiment. In the past several years, financial markets have experienced increased volatility, depressed valuations, decreased liquidity and heightened uncertainty. These conditions may continue, recur, worsen or spread. Inflation and interest rates have increased and may rise further. These circumstances could adversely affect the value and liquidity of the Fund’s investments and negatively impact the Fund’s performance. |
| | The long-term impact of the COVID-19 pandemic and its subsequent variants on economies, markets, industries and individual issuers, are not known. Some sectors of the economy and individual issuers have experienced or may experience particularly large losses. Periods of extreme volatility in the financial markets, reduced liquidity of many instruments, increased government debt, inflation, and disruptions to supply chains, consumer demand and employee availability, may continue for some time. Following Russia’s invasion of Ukraine, Russian securities lost all, or nearly all, their market value. Other securities or markets could be similarly affected by past or future political, geopolitical or other events or conditions. |
| | Governments and central banks, including the U.S. Federal Reserve, have taken extraordinary and unprecedented actions to support local and global economies and the financial markets. These actions have resulted in significant expansion of public debt, including in the U.S. The consequences of high public debt, including its future impact on the economy and securities markets, may not be known for some time. |
| | The U.S. and other countries are periodically involved in disputes over trade and other matters, which may result in tariffs, investment restrictions and adverse impacts on affected companies and securities. For example, the U.S. has imposed tariffs and other trade barriers on Chinese exports, has restricted sales of certain categories of goods to China, and has established barriers to investments in China. Trade |
Pioneer Global Sustainable Value Fund | Semiannual Report | 3/31/2429
| | disputes may adversely affect the economies of the U.S. and its trading partners, as well as companies directly or indirectly affected and financial markets generally. If the political climate between the U.S. and China does not improve or continues to deteriorate, if China were to attempt unification of Taiwan by force, or if other geopolitical conflicts develop or get worse, economies, markets and individual securities may be severely affected both regionally and globally, and the value of the Fund’s assets may go down. |
| | At times, the Fund’s investments may represent industries or industry sectors that are interrelated or have common risks, making the Fund more susceptible to any economic, political, or regulatory developments or other risks affecting those industries and sectors. |
| | Under normal circumstances, the Fund invests at least 80% of its net assets (plus the amount of borrowings, if any, for investment purposes) in securities of issuers that the Adviser believes adhere to the Fund’s ESG criteria. The Fund’s ESG criteria exclude securities of issuers in certain industries, and the Adviser considers ESG factors in making investment decisions. Excluding specific issuers limits the universe of investments available to the Fund as compared with other funds that do not consider ESG criteria or ESG factors, which may mean forgoing some investment opportunities available to funds that do not consider ESG criteria or ESG factors. Accordingly, the Fund may underperform other funds that do not utilize an investment strategy that considers ESG criteria or ESG factors. However, the strategy of seeking to identify companies with sustainable business models is believed to provide potential return and risk benefits, including the selection of issuers with fewer ESG-related risks. In considering ESG factors, the Adviser may use third party ESG ratings information that it believes to be reliable, but such information may not be accurate or complete, or may be biased. |
| | The Fund may invest in small- and mid-size companies. Compared to large companies, small- and mid-size companies, and the market for their equity securities, may be more sensitive to changes in earnings results and investor expectations or poor economic or market conditions, including those experienced during a recession, have more limited product lines, operating histories, markets or capital resources, may be dependent upon a limited management group, experience sharper swings in market values, have limited liquidity, be harder to value or to sell at the times and prices the Adviser thinks appropriate, and offer greater potential for gain and loss. |
| | Normally, the Fund invests at least a minimum percentage of its net assets in issuers located outside of the U.S.. The Fund’s investments in |
30Pioneer Global Sustainable Value Fund | Semiannual Report | 3/31/24
| | foreign markets and countries with limited developing markets may subject the Fund to a greater degree of risk than investments in a developed market. These risks include disruptive political or economic conditions, military conflicts and sanctions, terrorism, sustained economic downturns, financial instability, less liquid trading markets, extreme price volatility, currency risks, reduction of government or central bank support, inadequate accounting standards, tariffs, tax disputes or other tax burdens, nationalization or expropriation of assets, and the imposition of adverse governmental laws, arbitrary application of laws and regulations or lack of rule of law and investment and repatriation restrictions. Lack of information and less market regulation also may affect the value of these securities. Withholding and other non-U.S. taxes may decrease the Fund’s return. Non-U.S. issuers may be located in parts of the world that have historically been prone to natural disasters. Investing in depositary receipts is subject to many of the same risks as investing directly in non-U.S. issuers. Depositary receipts may involve higher expenses and may trade at a discount (or premium) to the underlying security. |
| | Russia launched a large-scale invasion of Ukraine on February 24, 2022. In response to the military action by Russia, various countries, including the U.S., the United Kingdom, and European Union issued broad-ranging economic sanctions against Russia and Belarus and certain companies and individuals. Since then, Russian securities have lost all, or nearly all, their market value, and many other issuers, securities and markets have been adversely affected. The United States and other countries may impose sanctions on other countries, companies and individuals in light of Russia’s military invasion. The extent and duration of the military action or future escalation of such hostilities, the extent and impact of existing and future sanctions, market disruptions and volatility, and the result of any diplomatic negotiations cannot be predicted. These and any related events could have a significant impact on the value and liquidity of certain Fund investments, on Fund performance and the value of an investment in the Fund, particularly with respect to securities and commodities, such as oil, natural gas and food commodities, as well as other sectors with exposure to Russian issuers or issuers in other countries affected by the invasion, and are likely to have collateral impacts on market sectors globally. |
| | With the increased use of technologies such as the Internet to conduct business, the Fund is susceptible to operational, information security and related risks. While the Fund’s Adviser has established business continuity plans in the event of, and risk management systems to prevent, limit or mitigate, such cyber-attacks, there are inherent |
Pioneer Global Sustainable Value Fund | Semiannual Report | 3/31/2431
| | limitations in such plans and systems, including the possibility that certain risks have not been identified. Furthermore, the Fund cannot control the cybersecurity plans and systems put in place by service providers to the Fund such as the Fund’s custodian and accounting agent, and the Fund’s transfer agent. In addition, many beneficial owners of Fund shares hold them through accounts at broker-dealers, retirement platforms and other financial market participants over which neither the Fund nor the Adviser exercises control. Each of these may in turn rely on service providers to them, which are also subject to the risk of cyber-attacks. Cybersecurity failures or breaches at the Adviser or the Fund’s service providers or intermediaries have the ability to cause disruptions and impact business operations, potentially resulting in financial losses, interference with the Fund’s ability to calculate its net asset value, impediments to trading, the inability of Fund shareholders to effect share purchases, redemptions or exchanges or receive distributions, loss of or unauthorized access to private shareholder information and violations of applicable privacy and other laws, regulatory fines, penalties, reputational damage, or additional compliance costs. Such costs and losses may not be covered under any insurance. In addition, maintaining vigilance against cyber-attacks may involve substantial costs over time, and system enhancements may themselves be subject to cyber-attacks. |
| | The Fund’s prospectus contains unaudited information regarding the Fund’s principal risks. Please refer to that document when considering the Fund’s principal risks. |
2. Management Agreement
The Adviser manages the Fund’s portfolio. Management fees payable under the Fund’s Investment Management Agreement with the Adviser are calculated daily and paid monthly at the annual rate of 0.65% of the Fund’s average daily net assets up to $1 billion and 0.60% of the Fund’s average daily net assets over $1 billion. For the six months ended March 31, 2024, the effective management fee (excluding waivers and/or assumption of expenses) was equivalent to 0.65% (annualized) of the Fund’s average daily net assets.
The Adviser has contractually agreed to waive and/or reimburse ordinary operating expenses (ordinary operating expenses means all fund expenses other than taxes, brokerage commissions, acquired fund fees and expenses, and extraordinary expenses, such as litigation) of the Fund to the extent required to reduce Fund expenses to 1.00%, 1.75% and 0.70% of the average daily net assets attributable to Class A, Class C and Class Y shares, respectively. These expense limitations are in effect through February 1,
32Pioneer Global Sustainable Value Fund | Semiannual Report | 3/31/24
2025. There can be no assurance that the Adviser will extend the expense limitation agreement for a class of shares beyond the date referred to above. Fees waived and expenses reimbursed during the six months ended March 31, 2024 are reflected on the Statement of Operations.
In addition, under the management and administration agreements, certain other services and costs, including accounting, regulatory reporting and insurance premiums, are paid by the Fund as administrative reimbursements. Reflected on the Statement of Assets and Liabilities is $287 in management fees payable to the Adviser at March 31, 2024.
3. Compensation of Officers and Trustees
The Fund pays an annual fee to its Trustees. The Adviser reimburses the Fund for fees paid to the Interested Trustees. Except for the chief compliance officer, the Fund does not pay any salary or other compensation to its officers. The Fund pays a portion of the chief compliance officer’s compensation for his services as the Fund’s chief compliance officer. Amundi US pays the remaining portion of the chief compliance officer’s compensation. For the six months ended March 31, 2024, the Fund paid $4,028 in Officers’ and Trustees’ compensation, which is reflected on the Statement of Operations as Officers’ and Trustees’ fees. At March 31, 2024, on its Statement of Assets and Liabilities, the Fund had a payable for Trustees’ fees of $35 and a payable for administrative expenses of $57, which includes the payable for Officers’ compensation.
4. Transfer Agent
BNY Mellon Investment Servicing (US) Inc. serves as the transfer agent to the Fund at negotiated rates. Transfer agent fees and payables shown on the Statement of Operations and the Statement of Assets and Liabilities, respectively, include sub-transfer agent expenses incurred through the Fund’s omnibus relationship contracts.
In addition, the Fund reimbursed the transfer agent for out-of-pocket expenses incurred by the transfer agent related to shareholder communications activities such as proxy and statement mailings, and outgoing phone calls. For the six months ended March 31, 2024, such out-of-pocket expenses by class of shares were as follows:
| Shareholder Communications: | |
| Class A | $167 |
| Class C | 23 |
| Class Y | 13 |
| Total | $203 |
Pioneer Global Sustainable Value Fund | Semiannual Report | 3/31/2433
5. Distribution Plan
The Fund has adopted a distribution plan (the “Plan”) pursuant to Rule 12b-1 of the Investment Company Act of 1940 with respect to its Class A and Class C shares. Pursuant to the Plan, the Fund pays the Distributor 0.25% of the average daily net assets attributable to Class A shares as compensation for personal services and/or account maintenance services or distribution services with regard to Class A shares. Pursuant to the Plan, the Fund also pays the Distributor 1.00% of the average daily net assets attributable to Class C shares. The fee for Class C shares consists of a 0.25% service fee and a 0.75% distribution fee paid as compensation for personal services and/or account maintenance services or distribution services with regard to Class C shares. Reflected on the Statement of Assets and Liabilities is $163 in distribution fees payable to the Distributor at March 31, 2024.
In addition, redemptions of Class A and Class C shares may be subject to a contingent deferred sales charge (“CDSC”). A CDSC of 1.00% may be imposed on redemptions of certain net asset value purchases of Class A shares within 12 months of purchase. Redemptions of Class C shares within 12 months of purchase are subject to a CDSC of 1.00%, based on the lower of cost or market value of shares being redeemed. Shares purchased as part of an exchange remain subject to any CDSC that applied to the original purchase of those shares. There is no CDSC for Class Y shares. Proceeds from the CDSCs are paid to the Distributor. For the six months ended March 31, 2024, no CDSCs were paid to the Distributor.
34Pioneer Global Sustainable Value Fund | Semiannual Report | 3/31/24
Additional Information
On March 25, 2024, Ernst & Young LLP (the “Prior Auditor”) resigned as the independent registered public accounting firm of Pioneer Global Sustainable Value Fund (the “Fund”) due to the independence considerations resulting from a change of the independent registered public accounting firm of a related party. The Prior Auditor’s reports on the financial statements of the Fund for the past two fiscal years, the years ended September 30, 2023 and September 30, 2022, did not contain an adverse opinion or disclaimer of opinion, and were not qualified or modified as to uncertainty, audit scope or accounting principles.
During the last two fiscal year-ends and the subsequent interim period through March 25, 2024, there were no (1) disagreements with the Prior Auditor on any matter of accounting principles or practices, financial statement disclosure, or auditing scope or procedure, which disagreements, if not resolved to the Prior Auditor's satisfaction, would have caused it to make reference to that matter in connection with its reports on the Fund's financial statements for such periods; or (2) "reportable events" related to the Fund, as that term is defined in Item 304 (a)(1)(v) of Regulation S-K under the Securities Exchange Act of 1934.
On March 25, 2024, the Audit Committee of the Board approved, and on March 25, 2024, the Board approved, Deloitte & Touche LLP as the independent registered accounting firm of the Fund for fiscal periods ending after March 25, 2024.
Pioneer Global Sustainable Value Fund | Semiannual Report | 3/31/2435
Trustees, Officers and Service Providers
Trustees
Thomas J. Perna, Chairman
John E. Baumgardner, Jr.
Diane Durnin
Benjamin M. Friedman
Lisa M. Jones
Craig C. MacKay
Lorraine H. Monchak
Marguerite A. Piret*
Fred J. Ricciardi
Officers
Lisa M. Jones, President and
Chief Executive Officer
Marco Pirondini**
Executive Vice President
Anthony J. Koenig, Jr., Treasurer
and Chief Financial and
Accounting Officer
Christopher J. Kelley, Secretary and
Chief Legal Officer
Investment Adviser and Administrator
Amundi Asset Management US, Inc.
Custodian and Sub-Administrator
The Bank of New York Mellon Corporation
Independent Registered Public Accounting Firm
Deloitte & Touche LLP
Principal Underwriter
Amundi Distributor US, Inc.
Legal Counsel
Morgan, Lewis & Bockius LLP
Transfer Agent
BNY Mellon Investment Servicing (US) Inc.
Proxy Voting Policies and Procedures of the Fund are available without charge, upon request, by calling our toll free number (1-800-225-6292). Information regarding how the Fund voted proxies relating to portfolio securities during the most recent 12-month period ended June 30 is publicly available to shareholders at www.amundi.com/us. This information is also available on the Securities and Exchange Commission’s web site at www.sec.gov.
* Ms. Piret became a non-voting Advisory Trustee of the Pioneer Funds effective January 22, 2024.
** Marco Pirondini was appointed to serve as an Executive Vice President of the Fund and Chief Investment Officer of Amundi US, Inc., effective January 1, 2024.
36Pioneer Global Sustainable Value Fund | Semiannual Report | 3/31/24
How to Contact Amundi
We are pleased to offer a variety of convenient ways for you to contact us for assistance or information.
Call us for:
Account Information, including existing accounts,
new accounts, prospectuses, applications
and service forms
1-800-225-6292
FactFoneSM for automated fund yields, prices,
account information and transactions
1-800-225-4321
| Retirement plans information | 1-800-622-0176 |
Write to us:
Amundi
P.O. Box 534427
Pittsburgh, PA 15253-4427
| Our toll-free fax | 1-800-225-4240 |
| Our internet e-mail address | us.askamundi@amundi.com
(for general questions about Amundi only) |
Visit our web site: www.amundi.com/us
This report must be preceded or accompanied by a prospectus.
The Fund files a complete schedule of portfolio holdings with the Securities and Exchange Commission for the first and third quarters of each fiscal year as an exhibit to its reports on Form N-PORT. Shareholders may view the filed Form N-PORT by visiting the Commission’s web site at https://www.sec.gov.
Amundi Asset Management US, Inc.
60 State Street
Boston, MA 02109
www.amundi.com/us
Securities offered through Amundi Distributor US, Inc.
60 State Street, Boston, MA 02109
Underwriter of Pioneer Mutual Funds, Member SIPC
© 2024 Amundi Asset Management US, Inc. 32974-02-0524
Pioneer Intrinsic Value Fund
Semiannual Report | March 31, 2024
IMPORTANT NOTICE – UPCOMING CHANGES TO PIONEER FUNDS ANNUAL & SEMI-ANNUAL REPORTS
The Securities and Exchange Commission (the “SEC”) has adopted rule and form amendments that will result in changes to the design and delivery of annual and semi-annual fund reports (“Reports”). Beginning in July 2024, Reports will be streamlined to highlight key information (“Redesigned Reports”). Certain information currently included in the Reports, including financial statements, will no longer appear in the Reports but will be available online, delivered free of charge to shareholders upon request, and filed with the SEC.
If you previously elected to receive the Fund's Reports electronically, you will continue to receive the Redesigned Reports electronically. Otherwise, you will receive paper copies of the Fund's Redesigned Reports via USPS mail starting in July 2024. If you would like to receive the Fund's Redesigned Reports (and/or other communications) electronically instead of by mail, please contact your financial advisor or, if you are a direct investor, please log into your mutual fund account at amundi.com/usinvestors and select “E-Delivery” under the Profile page. You must be registered for online account access before you can enroll in E-Delivery.
visit us: www.amundi.com/us
Pioneer Intrinsic Value Fund | Semiannual Report | 3/31/241
Portfolio Summary | 3/31/24
Sector Distribution
(As a percentage of total investments)*
10 Largest Holdings
| (As a percentage of total investments)* |
| 1. | Exxon Mobil Corp. | 4.94% |
| 2. | Wells Fargo & Co. | 4.72 |
| 3. | Deere & Co. | 4.10 |
| 4. | Cisco Systems, Inc. | 3.95 |
| 5. | Bank of America Corp. | 3.93 |
| 6. | United Parcel Service, Inc., Class B | 3.83 |
| 7. | Truist Financial Corp. | 3.57 |
| 8. | International Business Machines Corp. | 3.30 |
| 9. | ConocoPhillips | 3.20 |
| 10. | Coterra Energy, Inc. | 3.10 |
* Excludes short-term investments and all derivative contracts except for options purchased. The Fund is actively managed, and current holdings may be different. The holdings listed should not be considered recommendations to buy or sell any securities.
2Pioneer Intrinsic Value Fund | Semiannual Report | 3/31/24
Prices and Distributions | 3/31/24
Net Asset Value per Share
| Class | 3/31/24 | 9/30/23 |
| A | $11.64 | $10.05 |
| C | $11.70 | $10.07 |
| Y | $11.65 | $10.06 |
| | | |
Distributions per Share: 10/1/23 - 3/31/24
| Class | Net
Investment
Income | Short-Term
Capital Gains | Long-Term
Capital Gains |
| A | $0.2064 | $— | $— |
| C | $0.1308 | $— | $— |
| Y | $0.2348 | $— | $— |
Index Definition
The Russell 1000 Value Index is an unmanaged measure of the performance of large-cap U.S. value stocks. Indices are unmanaged and their returns assume reinvestment of dividends and do not reflect any fees or expenses. It is not possible to invest directly in an index.
The index defined here pertains to the “Value of $10,000 Investment” and “Value of $5 Million Investment” charts on pages 4 - 6.
Pioneer Intrinsic Value Fund | Semiannual Report | 3/31/243
| Performance Update | 3/31/24 | Class A Shares |
Investment Returns
The mountain chart on the right shows the change in value of a $10,000 investment made in Class A shares of Pioneer Intrinsic Value Fund at public offering price during the periods shown, compared to that of the Russell 1000 Value Index.*
Average Annual Total Returns
(As of March 31, 2024) |
| Period | Net
Asset
Value
(NAV) | Public
Offering
Price
(POP) | Russell
1000
Value
Index |
Life of Class
(5/10/21)* | 7.20% | 5.03% | 5.94% |
| 1 Year | 21.43 | 14.41 | 20.27 |
Expense Ratio
(Per prospectus dated February 1, 2024) |
| Gross | Net |
| 14.10% | 0.86% |
Value of $10,000 Investment
Call 1-800-225-6292 or visit www.amundi.com/us for the most recent month-end performance results. Current performance may be lower or higher than the performance data quoted.
The performance data quoted represents past performance, which is no guarantee of future results. Investment return and principal value will fluctuate, and shares, when redeemed, may be worth more or less than their original cost.
NAV results represent the percent change in net asset value per share. NAV returns would have been lower had sales charges been reflected. POP returns reflect deduction of maximum 5.75% sales charge. All results are historical and assume the reinvestment of dividends and capital gains. Other share classes are available for which performance and expenses will differ.
Performance results reflect any applicable expense waivers in effect during the periods shown. Without such waivers Fund performance would be lower. Waivers may not be in effect for all funds. Certain fee waivers are contractual through a specified period. Otherwise, fee waivers can be rescinded at any time. See the prospectus and financial statements for more information.
The net expense ratio reflects the contractual expense limitation in effect through February 1, 2025 for Class A shares. There can be no assurance that Amundi US will extend the expense limitation beyond such time. Please see the prospectus for more information.
* Performance of Class A shares shown in the graph above is from the inception of Class A shares on 5/10/21 through 3/31/24. Index information shown in the graph above is from 5/31/21 through 3/31/24.
The performance table and graph do not reflect the deduction of fees and taxes that a shareholder would pay on Fund distributions or the redemption of Fund shares.
Please refer to the financial highlights for more current expense ratios.
4Pioneer Intrinsic Value Fund | Semiannual Report | 3/31/24
| Performance Update | 3/31/24 | Class C Shares |
Investment Returns
The mountain chart on the right shows the change in value of a $10,000 investment made in Class C shares of Pioneer Intrinsic Value Fund during the periods shown, compared to that of the Russell 1000 Value Index.*
Average Annual Total Returns
(As of March 31, 2024) |
| Period | If
Held | If
Redeemed | Russell
1000
Value
Index |
Life of Class
(5/10/21)* | 6.36% | 6.36% | 5.94% |
| 1 Year | 20.59 | 19.59 | 20.27 |
Expense Ratio
(Per prospectus dated February 1, 2024) |
| Gross | Net |
| 14.82% | 1.61% |
Value of $10,000 Investment
Call 1-800-225-6292 or visit www.amundi.com/us for the most recent month-end performance results. Current performance may be lower or higher than the performance data quoted.
The performance data quoted represents past performance, which is no guarantee of future results. Investment return and principal value will fluctuate, and shares, when redeemed, may be worth more or less than their original cost.
Class C shares held for less than one year are subject to a 1% contingent deferred sales charge (CDSC). “If Held” results represent the percent change in net asset value per share. “If Redeemed” returns reflect deduction of the CDSC for the one-year period, assuming a complete redemption of shares at the last price calculated on the last business day of the period, and no CDSC for the other time periods. All results are historical and assume the reinvestment of dividends and capital gains. Other share classes are available for which performance and expenses will differ.
Performance results reflect any applicable expense waivers in effect during the periods shown. Without such waivers Fund performance would be lower. Waivers may not be in effect for all funds. Certain fee waivers are contractual through a specified period. Otherwise, fee waivers can be rescinded at any time. See the prospectus and financial statements for more information.
The net expense ratio reflects the contractual expense limitation in effect through February 1, 2025 for Class C shares. There can be no assurance that Amundi US will extend the expense limitation beyond such time. Please see the prospectus for more information.
* Performance of Class C shares shown in the graph above is from the inception of Class C shares on 5/10/21 through 3/31/24. Index information shown in the graph above is from 5/31/21 through 3/31/24.
The performance table and graph do not reflect the deduction of fees and taxes that a shareholder would pay on Fund distributions or the redemption of Fund shares.
Please refer to the financial highlights for more current expense ratios.
Pioneer Intrinsic Value Fund | Semiannual Report | 3/31/245
| Performance Update | 3/31/24 | Class Y Shares |
Investment Returns
The mountain chart on the right shows the change in value of a $5 million investment made in Class Y shares of Pioneer Intrinsic Value Fund during the periods shown, compared to that of the Russell 1000 Value Index.*
Average Annual Total Returns
(As of March 31, 2024) |
| Period | Net
Asset
Value
(NAV) | Russell
1000
Value
Index |
Life of Class
(5/10/21)* | 7.49% | 5.94% |
| 1 Year | 21.85 | 20.27 |
Expense Ratio
(Per prospectus dated February 1, 2024) |
| Gross | Net |
| 13.82% | 0.56% |
Value of $5 Million Investment
Call 1-800-225-6292 or visit www.amundi.com/us for the most recent month-end performance results. Current performance may be lower or higher than the performance data quoted.
The performance data quoted represents past performance, which is no guarantee of future results. Investment return and principal value will fluctuate, and shares, when redeemed, may be worth more or less than their original cost.
Class Y shares are not subject to sales charges and are available for limited groups of eligible investors, including institutional investors. All results are historical and assume the reinvestment of dividends and capital gains. Other share classes are available for which performance and expenses will differ.
Performance results reflect any applicable expense waivers in effect during the periods shown. Without such waivers Fund performance would be lower. Waivers may not be in effect for all funds. Certain fee waivers are contractual through a specified period. Otherwise, fee waivers can be rescinded at any time. See the prospectus and financial statements for more information.
The net expense ratio reflects the contractual expense limitation in effect through February 1, 2025 for Class Y shares. There can be no assurance that Amundi US will extend the expense limitation beyond such time. Please see the prospectus and financial statements for more information.
* Performance of Class Y shares shown in the table and graph above is from the inception of Class Y shares on 5/10/21 through 3/31/24. Index information shown in the graph above is from 5/31/21 through 3/31/24.
The performance table and graph do not reflect the deduction of fees and taxes that a shareholder would pay on Fund distributions or the redemption of Fund shares.
Please refer to the financial highlights for more current expense ratios.
6Pioneer Intrinsic Value Fund | Semiannual Report | 3/31/24
Comparing Ongoing Fund Expenses
As a shareholder in the Fund, you incur two types of costs:
| (1) | ongoing costs, including management fees, distribution and/or service (12b-1) fees, and other Fund expenses; and |
| (2) | transaction costs, including sales charges (loads) on purchase payments. |
This example is intended to help you understand your ongoing expenses (in dollars) of investing in the Fund and to compare these costs with the ongoing costs of investing in other mutual funds. The example is based on an investment of $1,000 at the beginning of the Fund’s latest six-month period and held throughout the six months.
Using the Tables
Actual Expenses
The first table below provides information about actual account values and actual expenses. You may use the information in this table, together with the amount you invested, to estimate the expenses that you paid over the period as follows:
| (1) | Divide your account value by $1,000
Example: an $8,600 account value ÷ $1,000 = 8.6 |
| (2) | Multiply the result in (1) above by the corresponding share class’s number in the third row under the heading entitled “Expenses Paid During Period” to estimate the expenses you paid on your account during this period. |
Expenses Paid on a $1,000 Investment in Pioneer Intrinsic Value Fund
Based on actual returns from October 1, 2023 through March 31, 2024.
| Share Class | A | C | Y |
Beginning Account
Value on 10/1/23 | $1,000.00 | $1,000.00 | $1,000.00 |
Ending Account Value
(after expenses) on 3/31/24 | $1,180.50 | $1,175.90 | $1,183.40 |
Expenses Paid
During Period* | $4.63 | $8.59 | $3.00 |
| | |
| * | Expenses are equal to the Fund’s annualized expense ratio of 0.85%, 1.58%, and 0.55% for Class A, Class C, and Class Y shares, respectively, multiplied by the average account value over the period, multiplied by 183/366 (to reflect the partial year period). |
Pioneer Intrinsic Value Fund | Semiannual Report | 3/31/247
Comparing Ongoing Fund Expenses (continued)
Hypothetical Example for Comparison Purposes
The table below provides information about hypothetical account values and hypothetical expenses based on the Fund’s actual expense ratio and an assumed rate of return of 5% per year before expenses, which is not the Fund’s actual return. The hypothetical account values and expenses may not be used to estimate the actual ending account balance or expenses you paid for the period.
You may use this information to compare the ongoing costs of investing in the Fund and other funds. To do so, compare this 5% hypothetical example with the 5% hypothetical examples that appear in the shareholder reports of the other funds.
Please note that the expenses shown in the tables are meant to highlight your ongoing costs only and do not reflect any transaction costs, such as sales charges (loads) that are charged at the time of the transaction. Therefore, the table below is useful in comparing ongoing costs only and will not help you determine the relative total costs of owning different funds. In addition, if these transaction costs were included, your costs would have been higher.
Expenses Paid on a $1,000 Investment in Pioneer Intrinsic Value Fund
Based on a hypothetical 5% return per year before expenses, reflecting the period from October 1, 2023 through March 31, 2024.
| Share Class | A | C | Y |
Beginning Account
Value on 10/1/23 | $1,000.00 | $1,000.00 | $1,000.00 |
Ending Account Value
(after expenses) on 3/31/24 | $1,020.75 | $1,017.10 | $1,022.25 |
Expenses Paid
During Period* | $4.29 | $7.97 | $2.78 |
| | |
| * | Expenses are equal to the Fund’s annualized expense ratio of 0.85%, 1.58%, and 0.55% for Class A, Class C, and Class Y shares, respectively, multiplied by the average account value over the period, multiplied by 183/366 (to reflect the partial year period). |
8Pioneer Intrinsic Value Fund | Semiannual Report | 3/31/24
Schedule of Investments | 3/31/24
(unaudited)
| Shares | | | | | | Value |
| | UNAFFILIATED ISSUERS — 102.1% | |
| | Common Stocks — 101.1% of Net Assets | |
| | Air Freight & Logistics — 3.9% | |
| 493 | United Parcel Service, Inc., Class B | $ 73,275 |
| | Total Air Freight & Logistics | $73,275 |
|
|
| | Automobiles — 2.2% | |
| 3,074 | Ford Motor Co. | $ 40,823 |
| | Total Automobiles | $40,823 |
|
|
| | Banks — 13.8% | |
| 1,986 | Bank of America Corp. | $ 75,309 |
| 769 | Citizens Financial Group, Inc. | 27,907 |
| 1,755 | Truist Financial Corp. | 68,410 |
| 1,559 | Wells Fargo & Co. | 90,360 |
| | Total Banks | $261,986 |
|
|
| | Biotechnology — 3.4% | |
| 131 | AbbVie, Inc. | $ 23,855 |
| 560 | Gilead Sciences, Inc. | 41,020 |
| | Total Biotechnology | $64,875 |
|
|
| | Broadline Retail — 2.1% | |
| 742 | eBay, Inc. | $ 39,163 |
| | Total Broadline Retail | $39,163 |
|
|
| | Capital Markets — 7.2% | |
| 532 | Morgan Stanley | $ 50,093 |
| 451 | Northern Trust Corp. | 40,103 |
| 610 | State Street Corp. | 47,165 |
| | Total Capital Markets | $137,361 |
|
|
| | Chemicals — 4.1% | |
| 468 | LyondellBasell Industries NV, Class A | $ 47,867 |
| 904 | Mosaic Co. | 29,344 |
| | Total Chemicals | $77,211 |
|
|
| | Communications Equipment — 4.0% | |
| 1,514 | Cisco Systems, Inc. | $ 75,564 |
| | Total Communications Equipment | $75,564 |
|
|
| | Consumer Staples Distribution & Retail — 4.3% | |
| 200 | Target Corp. | $ 35,442 |
| 2,140 | Walgreens Boots Alliance, Inc. | 46,417 |
| | Total Consumer Staples Distribution & Retail | $81,859 |
|
|
The accompanying notes are an integral part of these financial statements.
Pioneer Intrinsic Value Fund | Semiannual Report | 3/31/249
Schedule of Investments | 3/31/24
(unaudited) (continued)
| Shares | | | | | | Value |
| | Diversified Telecommunication Services — 2.9% | |
| 1,301 | Verizon Communications, Inc. | $ 54,590 |
| | Total Diversified Telecommunication Services | $54,590 |
|
|
| | Electric Utilities — 3.3% | |
| 261 | Duke Energy Corp. | $ 25,241 |
| 614 | Eversource Energy | 36,699 |
| | Total Electric Utilities | $61,940 |
|
|
| | Financial Services — 2.5% | |
| 699(a) | PayPal Holdings, Inc. | $ 46,826 |
| | Total Financial Services | $46,826 |
|
|
| | Food Products — 4.7% | |
| 1,026 | Kellanova | $ 58,779 |
| 821 | Kraft Heinz Co. | 30,295 |
| | Total Food Products | $89,074 |
|
|
| | Health Care Equipment & Supplies — 2.0% | |
| 436 | Medtronic Plc | $ 37,997 |
| | Total Health Care Equipment & Supplies | $37,997 |
|
|
| | Health Care Providers & Services — 2.1% | |
| 301 | Quest Diagnostics, Inc. | $ 40,066 |
| | Total Health Care Providers & Services | $40,066 |
|
|
| | Household Durables — 1.9% | |
| 304 | Whirlpool Corp. | $ 36,368 |
| | Total Household Durables | $36,368 |
|
|
| | Insurance — 2.9% | |
| 692 | American International Group, Inc. | $ 54,094 |
| | Total Insurance | $54,094 |
|
|
| | IT Services — 3.3% | |
| 331 | International Business Machines Corp. | $ 63,208 |
| | Total IT Services | $63,208 |
|
|
| | Machinery — 4.1% | |
| 191 | Deere & Co. | $ 78,451 |
| | Total Machinery | $78,451 |
|
|
| | Media — 1.1% | |
| 657 | Fox Corp., Class A | $ 20,544 |
| | Total Media | $20,544 |
|
|
The accompanying notes are an integral part of these financial statements.
10Pioneer Intrinsic Value Fund | Semiannual Report | 3/31/24
| Shares | | | | | | Value |
| | Metals & Mining — 2.5% | |
| 642 | Freeport-McMoRan, Inc. | $ 30,187 |
| 503 | Newmont Corp. | 18,027 |
| | Total Metals & Mining | $48,214 |
|
|
| | Oil, Gas & Consumable Fuels — 11.4% | |
| 481 | ConocoPhillips | $ 61,222 |
| 2,128 | Coterra Energy, Inc. | 59,329 |
| 814 | Exxon Mobil Corp. | 94,619 |
| | Total Oil, Gas & Consumable Fuels | $215,170 |
|
|
| | Passenger Airlines — 1.1% | |
| 443 | Delta Air Lines, Inc. | $ 21,206 |
| | Total Passenger Airlines | $21,206 |
|
|
| | Pharmaceuticals — 5.5% | |
| 212 | Johnson & Johnson | $ 33,536 |
| 1,476 | Pfizer, Inc. | 40,959 |
| 628 | Sanofi S.A. (A.D.R.) | 30,521 |
| | Total Pharmaceuticals | $105,016 |
|
|
| | Specialty Retail — 1.6% | |
| 359 | Best Buy Co., Inc. | $ 29,449 |
| | Total Specialty Retail | $29,449 |
|
|
| | Technology Hardware, Storage & Peripherals — 1.4% | |
| 865 | HP, Inc. | $ 26,140 |
| | Total Technology Hardware, Storage & Peripherals | $26,140 |
|
|
| | Trading Companies & Distributors — 1.8% | |
| 395(a) | AerCap Holdings NV | $ 34,329 |
| | Total Trading Companies & Distributors | $34,329 |
|
|
| | Total Common Stocks
(Cost $1,727,399) | $1,914,799 |
|
|
The accompanying notes are an integral part of these financial statements.
Pioneer Intrinsic Value Fund | Semiannual Report | 3/31/2411
Schedule of Investments | 3/31/24
(unaudited) (continued)
| Shares | | | | | | Value |
|
| | SHORT TERM INVESTMENTS — 1.0% of Net Assets | |
| | Open-End Fund — 1.0% | |
| 18,200(b) | Dreyfus Government Cash Management,
Institutional Shares, 5.20% | $ 18,200 |
| | | | | | | $ 18,200 |
|
|
| | TOTAL SHORT TERM INVESTMENTS
(Cost $18,200) | $18,200 |
|
|
| | TOTAL INVESTMENTS IN UNAFFILIATED ISSUERS — 102.1%
(Cost $1,745,599) | $1,932,999 |
| | OTHER ASSETS AND LIABILITIES — (2.1)% | $ (39,156) |
| | net assets — 100.0% | $1,893,843 |
| | | | | | | |
| (A.D.R.) | American Depositary Receipts. |
| (a) | Non-income producing security. |
| (b) | Rate periodically changes. Rate disclosed is the 7-day yield at March 31, 2024. |
Purchases and sales of securities (excluding short-term investments) for the six months ended March 31, 2024, aggregated $1,148,412 and $1,048,538, respectively.
At March 31, 2024, the net unrealized appreciation on investments based on cost for federal tax purposes of $1,745,646 was as follows:
| Aggregate gross unrealized appreciation for all investments in which there is an excess of value over tax cost | $221,181 |
| Aggregate gross unrealized depreciation for all investments in which there is an excess of tax cost over value | (33,828) |
| Net unrealized appreciation | $187,353 |
The accompanying notes are an integral part of these financial statements.
12Pioneer Intrinsic Value Fund | Semiannual Report | 3/31/24
Various inputs are used in determining the value of the Fund’s investments. These inputs are summarized in the three broad levels below.
| Level 1 | – | unadjusted quoted prices in active markets for identical securities. |
| Level 2 | – | other significant observable inputs (including quoted prices for similar securities, interest rates, prepayment speeds, credit risks, etc.). See Notes to Financial Statements — Note 1A. |
| Level 3 | – | significant unobservable inputs (including the Adviser’s own assumptions in determining fair value of investments). See Notes to Financial Statements — Note 1A. |
The following is a summary of the inputs used as of March 31, 2024 in valuing the Fund’s investments:
| | Level 1 | Level 2 | Level 3 | Total |
| Common Stocks | $1,914,799 | $— | $— | $1,914,799 |
| Open-End Fund | 18,200 | — | — | 18,200 |
| Total Investments in Securities | $ 1,932,999 | $ — | $ — | $ 1,932,999 |
During the period ended March 31, 2024, there were no transfers in or out of Level 3.
The accompanying notes are an integral part of these financial statements.
Pioneer Intrinsic Value Fund | Semiannual Report | 3/31/2413
Statement of Assets and Liabilities | 3/31/24
(unaudited)
| ASSETS: | |
| Investments in unaffiliated issuers, at value (cost $1,745,599) | $1,932,999 |
| Cash | 1,149 |
| Receivables — | |
| Fund shares sold | 94 |
| Dividends | 2,036 |
| Due from the Adviser | 2,845 |
| Other assets | 18,176 |
| Total assets | $1,957,299 |
| LIABILITIES: | |
| Payables — | |
| Investment securities purchased | $ 438 |
| Trustees’ fees | 5 |
| Professional fees | 47,160 |
| Printing expense | 14,213 |
| Management fees | 138 |
| Administrative expenses | 39 |
| Distribution fees | 122 |
| Accrued expenses | 1,341 |
| Total liabilities | $ 63,456 |
| NET ASSETS: | |
| Paid-in capital | $1,627,724 |
| Distributable earnings | 266,119 |
| Net assets | $1,893,843 |
| NET ASSET VALUE PER SHARE: | |
| No par value (unlimited number of shares authorized) | |
| Class A (based on $827,094/71,059 shares) | $ 11.64 |
| Class C (based on $549,046/46,912 shares) | $ 11.70 |
| Class Y (based on $517,703/44,442 shares) | $ 11.65 |
| MAXIMUM OFFERING PRICE PER SHARE: | |
| Class A (based on $11.64 net asset value per share/100%-5.75% maximum sales charge) | $ 12.35 |
The accompanying notes are an integral part of these financial statements.
14Pioneer Intrinsic Value Fund | Semiannual Report | 3/31/24
Statement of Operations (unaudited)
FOR THE SIX MONTHS ENDED 3/31/24
| INVESTMENT INCOME: | | |
| Dividends from unaffiliated issuers | $28,379 | |
| Total Investment Income | | $ 28,379 |
| EXPENSES: | | |
| Management fees | $ 3,749 | |
| Administrative expenses | 5,013 | |
| Transfer agent fees | | |
| Class A | 75 | |
| Class C | 25 | |
| Class Y | 11 | |
| Distribution fees | | |
| Class A | 905 | |
| Class C | 2,384 | |
| Shareholder communications expense | 172 | |
| Custodian fees | 7 | |
| Registration fees | 16,328 | |
| Professional fees | 40,019 | |
| Printing expense | 8,035 | |
| Officers’ and Trustees’ fees | 3,992 | |
| Insurance expense | 13 | |
| Miscellaneous | 1,147 | |
| Total expenses | | $ 81,875 |
| Less fees waived and expenses reimbursed by the Adviser | | (73,755) |
| Net expenses | | $ 8,120 |
| Net investment income | | $ 20,259 |
| REALIZED AND UNREALIZED GAIN (LOSS) ON INVESTMENTS: | | |
| Net realized gain (loss) on: | | |
| Investments in unaffiliated issuers | | $ 76,956 |
| Change in net unrealized appreciation (depreciation) on: | | |
| Investments in unaffiliated issuers | | $188,309 |
| Net realized and unrealized gain (loss) on investments | | $265,265 |
| Net increase in net assets resulting from operations | | $285,524 |
The accompanying notes are an integral part of these financial statements.
Pioneer Intrinsic Value Fund | Semiannual Report | 3/31/2415
Statements of Changes in Net Assets
| | Six Months
Ended
3/31/24
(unaudited) | Year
Ended
9/30/23 |
| FROM OPERATIONS: | | |
| Net investment income (loss) | $ 20,259 | $ 26,843 |
| Net realized gain (loss) on investments | 76,956 | 21,543 |
| Change in net unrealized appreciation (depreciation) on investments | 188,309 | 152,088 |
| Net increase in net assets resulting from operations | $ 285,524 | $ 200,474 |
| DISTRIBUTIONS TO SHAREHOLDERS: | | |
| Class A ($0.21 and $0.18 per share, respectively) | $ (13,816) | $ (8,635) |
| Class C ($0.13 and $0.10 per share, respectively) | (5,814) | (4,242) |
| Class Y ($0.23 and $0.20 per share, respectively) | (10,254) | (9,396) |
| Total distributions to shareholders | $ (29,884) | $ (22,273) |
| FROM FUND SHARE TRANSACTIONS: | | |
| Net proceeds from sales of shares | $ 59,890 | $ 283,379 |
| Reinvestment of distributions | 26,873 | 22,273 |
| Cost of shares repurchased | (3,979) | (105,490) |
| Net increase in net assets resulting from Fund share transactions | $ 82,784 | $ 200,162 |
| Net increase in net assets | $ 338,424 | $ 378,363 |
| NET ASSETS: | | |
| Beginning of period | $1,555,419 | $1,177,056 |
| End of period | $1,893,843 | $1,555,419 |
The accompanying notes are an integral part of these financial statements.
16Pioneer Intrinsic Value Fund | Semiannual Report | 3/31/24
| | Six Months
Ended
3/31/24
Shares
(unaudited) | Six Months
Ended
3/31/24
Amount
(unaudited) | Year
Ended
9/30/23
Shares | Year
Ended
9/30/23
Amount |
| Class A | | | | |
| Shares sold | 3,629 | $38,390 | 28,310 | $280,979 |
| Reinvestment of distributions | 1,200 | 12,858 | 876 | 8,635 |
| Less shares repurchased | (311) | (3,451) | (6,100) | (62,357) |
| Net increase | 4,518 | $47,797 | 23,086 | $227,257 |
| Class C | | | | |
| Shares sold | 1,978 | $21,500 | 242 | $ 2,400 |
| Reinvestment of distributions | 483 | 5,220 | 427 | 4,242 |
| Less shares repurchased | — | — | — | — |
| Net increase | 2,461 | $26,720 | 669 | $ 6,642 |
| Class Y | | | | |
| Shares sold | — | $ — | — | $ — |
| Reinvestment of distributions | 820 | 8,795 | 953 | 9,396 |
| Less shares repurchased | (49) | (528) | (4,146) | (43,133) |
Net increase
(decrease) | 771 | $ 8,267 | (3,193) | $ (33,737) |
The accompanying notes are an integral part of these financial statements.
Pioneer Intrinsic Value Fund | Semiannual Report | 3/31/2417
| | Six Months
Ended
3/31/24
(unaudited) | Year
Ended
9/30/23 | Year
Ended
9/30/22 | 5/10/21* to
9/30/21 |
| Class A | | | | |
| Net asset value, beginning of period | $10.05 | $ 8.77 | $ 9.68 | $ 10.00 |
| Increase (decrease) from investment operations: | | | | |
| Net investment income (loss) (a) | $ 0.14 | $ 0.20 | $ 0.17 | $ 0.06 |
| Net realized and unrealized gain (loss) on investments | 1.66 | 1.26 | (0.94) | (0.38) |
| Net increase (decrease) from investment operations | $ 1.80 | $ 1.46 | $ (0.77) | $ (0.32) |
| Distributions to shareholders: | | | | |
| Net investment income | $ (0.21) | $ (0.18) | $ (0.14) | $ — |
| Total distributions | $ (0.21) | $ (0.18) | $ (0.14) | $ — |
| Net increase (decrease) in net asset value | $ 1.59 | $ 1.28 | $ (0.91) | $ (0.32) |
| Net asset value, end of period | $11.64 | $ 10.05 | $ 8.77 | $ 9.68 |
| Total return (b) | 18.05%(c) | 16.64% | (8.23)% | (3.20)%(c) |
| Ratio of net expenses to average net assets | 0.85%(d) | 0.85% | 0.84% | 0.80%(d) |
| Ratio of net investment income (loss) to average net assets | 2.56%(d) | 1.96% | 1.68% | 1.45%(d) |
| Portfolio turnover rate | 63%(c) | 22% | 28% | 1%(c) |
| Net assets, end of period (in thousands) | $ 827 | $ 668 | $ 381 | $ 291 |
| Ratios with no waiver of fees and assumption of expenses by the Adviser and no reduction for fees paid indirectly: | | | | |
| Total expenses to average net assets | 9.71%(d) | 14.09% | 18.21% | 23.11%(d) |
| Net investment income (loss) to average net assets | (6.30)%(d) | (11.28)% | (15.69)% | (20.86)%(d) |
| * | Class A commenced operations on May 10, 2021. |
| (a) | The per-share data presented above is based on the average shares outstanding for the period presented. |
| (b) | Assumes initial investment at net asset value at the beginning of each period, reinvestment of all distributions, the complete redemption of the investment at net asset value at the end of each period and no sales charges. Total return would be reduced if sales charges were taken into account. |
| (c) | Not annualized. |
| (d) | Annualized. |
The accompanying notes are an integral part of these financial statements.
18Pioneer Intrinsic Value Fund | Semiannual Report | 3/31/24
| | Six Months
Ended
3/31/24
(unaudited) | Year
Ended
9/30/23 | Year
Ended
9/30/22 | 5/10/21* to
9/30/21 |
| Class C | | | | |
| Net asset value, beginning of period | $10.07 | $ 8.78 | $ 9.65 | $ 10.00 |
| Increase (decrease) from investment operations: | | | | |
| Net investment income (loss) (a) | $ 0.10 | $ 0.12 | $ 0.09 | $ 0.03 |
| Net realized and unrealized gain (loss) on investments | 1.66 | 1.27 | (0.96) | (0.38) |
| Net increase (decrease) from investment operations | $ 1.76 | $ 1.39 | $ (0.87) | $ (0.35) |
| Distributions to shareholders: | | | | |
| Net investment income | $ (0.13) | $ (0.10) | $ — | $ — |
| Total distributions | $ (0.13) | $ (0.10) | $ — | $ — |
| Net increase (decrease) in net asset value | $ 1.63 | $ 1.29 | $ (0.87) | $ (0.35) |
| Net asset value, end of period | $11.70 | $ 10.07 | $ 8.78 | $ 9.65 |
| Total return (b) | 17.59%(c) | 15.81% | (9.02)% | (3.50)%(c) |
| Ratio of net expenses to average net assets | 1.58%(d) | 1.58% | 1.58% | 1.60%(d) |
| Ratio of net investment income (loss) to average net assets | 1.82%(d) | 1.21% | 0.90% | 0.65%(d) |
| Portfolio turnover rate | 63%(c) | 22% | 28% | 1%(c) |
| Net assets, end of period (in thousands) | $ 549 | $ 447 | $ 384 | $ 368 |
| Ratios with no waiver of fees and assumption of expenses by the Adviser and no reduction for fees paid indirectly: | | | | |
| Total expenses to average net assets | 10.43%(d) | 14.81% | 18.96% | 23.98%(d) |
| Net investment income (loss) to average net assets | (7.03)%(d) | (12.02)% | (16.48)% | (21.73)%(d) |
| * | Class C commenced operations on May 10, 2021. |
| (a) | The per-share data presented above is based on the average shares outstanding for the period presented. |
| (b) | Assumes initial investment at net asset value at the beginning of each period, reinvestment of all distributions, the complete redemption of the investment at net asset value at the end of each period and no sales charges. Total return would be reduced if sales charges were taken into account. |
| (c) | Not annualized. |
| (d) | Annualized. |
The accompanying notes are an integral part of these financial statements.
Pioneer Intrinsic Value Fund | Semiannual Report | 3/31/2419
Financial Highlights (continued)
| | Six Months
Ended
3/31/24
(unaudited) | Year
Ended
9/30/23 | Year
Ended
9/30/22 | 5/10/21* to
9/30/21 |
| Class Y | | | | |
| Net asset value, beginning of period | $10.06 | $ 8.78 | $ 9.69 | $ 10.00 |
| Increase (decrease) from investment operations: | | | | |
| Net investment income (loss) (a) | $ 0.15 | $ 0.22 | $ 0.20 | $ 0.07 |
| Net realized and unrealized gain (loss) on investments | 1.67 | 1.26 | (0.95) | (0.38) |
| Net increase (decrease) from investment operations | $ 1.82 | $ 1.48 | $ (0.75) | $ (0.31) |
| Distributions to shareholders: | | | | |
| Net investment income | $ (0.23) | $ (0.20) | $ (0.16) | $ — |
| Total distributions | $ (0.23) | $ (0.20) | $ (0.16) | $ — |
| Net increase (decrease) in net asset value | $ 1.59 | $ 1.28 | $ (0.91) | $ (0.31) |
| Net asset value, end of period | $11.65 | $ 10.06 | $ 8.78 | $ 9.69 |
| Total return (b) | 18.34%(c) | 16.91% | (8.04)% | (3.10)%(c) |
| Ratio of net expenses to average net assets | 0.55%(d) | 0.55% | 0.55% | 0.55%(d) |
| Ratio of net investment income (loss) to average net assets | 2.85%(d) | 2.24% | 1.95% | 1.70%(d) |
| Portfolio turnover rate | 63%(c) | 22% | 28% | 1%(c) |
| Net assets, end of period (in thousands) | $ 518 | $ 440 | $ 412 | $ 404 |
| Ratios with no waiver of fees and assumption of expenses by the Adviser and no reduction for fees paid indirectly: | | | | |
| Total expenses to average net assets | 9.40%(d) | 13.81% | 17.95% | 22.87%(d) |
| Net investment income (loss) to average net assets | (6.00)%(d) | (11.02)% | (15.45)% | (20.62)%(d) |
| * | Class Y commenced operations on May 10, 2021. |
| (a) | The per-share data presented above is based on the average shares outstanding for the period presented. |
| (b) | Assumes initial investment at net asset value at the beginning of each period, reinvestment of all distributions and the complete redemption of the investment at net asset value at the end of each period. |
| (c) | Not annualized. |
| (d) | Annualized. |
The accompanying notes are an integral part of these financial statements.
20Pioneer Intrinsic Value Fund | Semiannual Report | 3/31/24
Notes to Financial Statements | 3/31/24
(unaudited)
1. Organization and Significant Accounting Policies
Pioneer Intrinsic Value Fund (the “Fund”) is one of five portfolios comprising Pioneer Series Trust XIV (the "Trust"), a Delaware statutory trust. The Fund is registered under the Investment Company Act of 1940, as amended (the "1940 Act"), as a diversified, open-end management investment company. The Fund’s investment objective is to seek long-term capital growth.
The Fund offers three classes of shares designated as Class A, Class C and Class Y shares. Class A, Class C and Class Y commenced operations on May 10, 2021. Each class of shares represents an interest in the same portfolio of investments of the Fund and has identical rights (based on relative net asset values) to assets and liquidation proceeds. Share classes can bear different rates of class-specific fees and expenses, such as transfer agent and distribution fees. Differences in class-specific fees and expenses will result in differences in net investment income and, therefore, the payment of different dividends from net investment income earned by each class. The Amended and Restated Declaration of Trust of the Trust gives the Board of Trustees the flexibility to specify either per-share voting or dollar-weighted voting when submitting matters for shareholder approval. Under per-share voting, each share of a class of the Fund is entitled to one vote. Under dollar-weighted voting, a shareholder’s voting power is determined not by the number of shares owned, but by the dollar value of the shares on the record date. Each share class has exclusive voting rights with respect to matters affecting only that class, including with respect to the distribution plan for that class. There is no distribution plan for Class Y shares.
Amundi Asset Management US, Inc., an indirect, wholly owned subsidiary of Amundi and Amundi’s wholly owned subsidiary, Amundi USA, Inc., serves as the Fund’s investment adviser (the “Adviser”). Amundi Distributor US, Inc., an affiliate of the Adviser, serves as the Fund’s distributor (the “Distributor”).
The Fund is required to comply with Rule 18f-4 under the 1940 Act, which governs the use of derivatives by registered investment companies. Rule 18f-4 permits funds to enter into derivatives transactions (as defined in Rule 18f-4) and certain other transactions notwithstanding the restrictions on the issuance of “senior securities” under Section 18 of the 1940 Act. Rule 18f-4 requires a fund to establish and maintain a comprehensive derivatives risk management program, appoint a derivatives
Pioneer Intrinsic Value Fund | Semiannual Report | 3/31/2421
risk manager and comply with a relative or absolute limit on fund leverage risk calculated based on value-at-risk (“VaR”), unless the fund uses derivatives in only a limited manner (a "limited derivatives user"). The Fund is currently a limited derivatives user for purposes of Rule 18f-4.
The Fund is an investment company and follows investment company accounting and reporting guidance under U.S. Generally Accepted Accounting Principles (“U.S. GAAP”). U.S. GAAP requires the management of the Fund to make estimates and assumptions that affect the reported amounts of assets and liabilities, the disclosure of contingent assets and liabilities at the date of the financial statements, and the reported amounts of income, expenses and gain or loss on investments during the reporting period. Actual results could differ from those estimates.
The following is a summary of significant accounting policies followed by the Fund in the preparation of its financial statements:
| A. | Security Valuation |
| | The net asset value of the Fund is computed once daily, on each day the New York Stock Exchange (“NYSE”) is open, as of the close of regular trading on the NYSE. |
| | Equity securities that have traded on an exchange are valued by using the last sale price on the principal exchange where they are traded. Equity securities that have not traded on the date of valuation, or securities for which sale prices are not available, generally are valued using the mean between the last bid and asked prices or, if both last bid and asked prices are not available, at the last quoted bid price. Last sale and bid and asked prices are provided by independent third party pricing services. In the case of equity securities not traded on an exchange, prices are typically determined by independent third party pricing services using a variety of techniques and methods. |
| | The value of foreign securities is translated into U.S. dollars based on foreign currency exchange rate quotations supplied by a third party pricing source. Trading in non-U.S. equity securities is substantially completed each day at various times prior to the close of the NYSE. The values of such securities used in computing the net asset value of the Fund’s shares are determined as of such times. The Adviser may use a fair value model developed by an independent pricing service to value non-U.S. equity securities. |
| | Shares of open-end registered investment companies (including money market mutual funds) are valued at such funds’ net asset value. |
22Pioneer Intrinsic Value Fund | Semiannual Report | 3/31/24
| | Securities for which independent pricing services or broker-dealers are unable to supply prices or for which market prices and/or quotations are not readily available or are considered to be unreliable are valued by a fair valuation team comprised of certain personnel of the Adviser. The Adviser is designated as the valuation designee for the Fund pursuant to Rule 2a-5 under the 1940 Act. The Adviser’s fair valuation team is responsible for monitoring developments that may impact fair valued securities. |
| | Inputs used when applying fair value methods to value a security may include credit ratings, the financial condition of the company, current market conditions and comparable securities. The Adviser may use fair value methods if it is determined that a significant event has occurred after the close of the exchange or market on which the security trades and prior to the determination of the Fund’s net asset value. Examples of a significant event might include political or economic news, corporate restructurings, natural disasters, terrorist activity or trading halts. Thus, the valuation of the Fund’s securities may differ significantly from exchange prices, and such differences could be material. |
| B. | Investment Income and Transactions |
| | Dividend income is recorded on the ex-dividend date, except that certain dividends from foreign securities where the ex-dividend date may have passed are recorded as soon as the Fund becomes aware of the ex-dividend data in the exercise of reasonable diligence. |
| | Interest and dividend income payable by delivery of additional shares is reclassified as PIK (payment-in-kind) income upon receipt and is included in interest and dividend income, respectively. |
| | Security transactions are recorded as of trade date. Gains and losses on sales of investments are calculated on the identified cost method for both financial reporting and federal income tax purposes. |
| C. | Foreign Currency Translation |
| | The books and records of the Fund are maintained in U.S. dollars. Amounts denominated in foreign currencies are translated into U.S. dollars using current exchange rates. |
| | Net realized gains and losses on foreign currency transactions, if any, represent, among other things, the net realized gains and losses on foreign currency exchange contracts, disposition of foreign currencies and the difference between the amount of income accrued and the U.S. dollars actually received. Further, the effects of changes in foreign |
Pioneer Intrinsic Value Fund | Semiannual Report | 3/31/2423
| | currency exchange rates on investments are not segregated on the Statement of Operations from the effects of changes in the market prices of those securities, but are included with the net realized and unrealized gain or loss on investments. |
| D. | Federal Income Taxes |
| | It is the Fund’s policy to comply with the requirements of the Internal Revenue Code applicable to regulated investment companies and to distribute all of its net taxable income and net realized capital gains, if any, to its shareholders. Therefore, no provision for federal income taxes is required. As of March 31, 2024, the Fund did not accrue any interest or penalties with respect to uncertain tax positions, which, if applicable, would be recorded as an income tax expense on the Statement of Operations. Tax returns filed within the prior three years remain subject to examination by federal and state tax authorities. |
| | The amount and character of income and capital gain distributions to shareholders are determined in accordance with federal income tax rules, which may differ from U.S. GAAP. Distributions in excess of net investment income or net realized gains are temporary over distributions for financial statement purposes resulting from differences in the recognition or classification of income or distributions for financial statement and tax purposes. Capital accounts within the financial statements are adjusted for permanent book/tax differences to reflect tax character, but are not adjusted for temporary differences. |
| | The tax character of current year distributions payable will be determined at the end of the current taxable year. The tax character of distributions paid during the year ended September 30, 2023 was as follows: |
| | 2023 |
| Distributions paid from: | |
| Ordinary income | $22,273 |
| Total | $22,273 |
The following shows the components of distributable earnings (losses) on a federal income tax basis at September 30, 2023:
| | 2023 |
| Distributable earnings/(losses): | |
| Undistributed ordinary income | $18,903 |
| Capital loss carryforward | (7,468) |
| Net unrealized depreciation | (956) |
| Total | $ 10,479 |
24Pioneer Intrinsic Value Fund | Semiannual Report | 3/31/24
The differences between book-basis and tax-basis net unrealized depreciation are attributable to the tax deferral of losses on wash sales.
| E. | Fund Shares |
| | The Fund records sales and repurchases of its shares as of trade date. The Distributor earned $63 in underwriting commissions on the sale of Class A shares during the six months ended March 31, 2024. |
| F. | Class Allocations |
| | Income, common expenses and realized and unrealized gains and losses are calculated at the Fund level and allocated daily to each class of shares based on its respective percentage of adjusted net assets at the beginning of the day. |
| | Distribution fees are calculated based on the average daily net asset value attributable to Class A and Class C shares of the Fund, respectively (see Note 5). Class Y shares do not pay distribution fees. All expenses and fees paid to the Fund’s transfer agent for its services are allocated among the classes of shares based on the number of accounts in each class and the ratable allocation of related out-of-pocket expenses (see Note 4). |
| | Distributions to shareholders are recorded as of the ex-dividend date. Distributions paid by the Fund with respect to each class of shares are calculated in the same manner and at the same time, except that net investment income dividends to Class A, Class C and Class Y shares can reflect different transfer agent and distribution expense rates. |
| G. | Risks |
| | The value of securities held by the Fund may go up or down, sometimes rapidly or unpredictably, due to general market conditions, such as real or perceived adverse economic, political or regulatory conditions, recessions, the spread of infectious illness or other public health issues, inflation, changes in interest rates, armed conflict such as between Russia and Ukraine or in the Middle East, sanctions against Russia, other nations or individuals or companies and possible countermeasures, lack of liquidity in the bond markets or adverse investor sentiment. In the past several years, financial markets have experienced increased volatility, depressed valuations, decreased liquidity and heightened uncertainty. These conditions may continue, recur, worsen or spread. Inflation and interest rates have increased and may rise further. These circumstances could adversely affect the value and liquidity of the Fund’s investments and negatively impact the Fund’s performance. |
Pioneer Intrinsic Value Fund | Semiannual Report | 3/31/2425
| | The long-term impact of the COVID-19 pandemic and its subsequent variants on economies, markets, industries and individual issuers, are not known. Some sectors of the economy and individual issuers have experienced or may experience particularly large losses. Periods of extreme volatility in the financial markets, reduced liquidity of many instruments, increased government debt, inflation, and disruptions to supply chains, consumer demand and employee availability, may continue for some time. Following Russia’s invasion of Ukraine, Russian securities lost all, or nearly all, their market value. Other securities or markets could be similarly affected by past or future political, geopolitical or other events or conditions. |
| | Governments and central banks, including the U.S. Federal Reserve, have taken extraordinary and unprecedented actions to support local and global economies and the financial markets. These actions have resulted in significant expansion of public debt, including in the U.S. The consequences of high public debt, including its future impact on the economy and securities markets, may not be known for some time. |
| | The U.S. and other countries are periodically involved in disputes over trade and other matters, which may result in tariffs, investment restrictions and adverse impacts on affected companies and securities. For example, the U.S. has imposed tariffs and other trade barriers on Chinese exports, has restricted sales of certain categories of goods to China, and has established barriers to investments in China. Trade disputes may adversely affect the economies of the U.S. and its trading partners, as well as companies directly or indirectly affected and financial markets generally. If the political climate between the U.S. and China does not improve or continues to deteriorate, if China were to attempt unification of Taiwan by force, or if other geopolitical conflicts develop or get worse, economies, markets and individual securities may be severely affected both regionally and globally, and the value of the Fund’s assets may go down. |
| | At times, the Fund’s investments may represent industries or industry sectors that are interrelated or have common risks, making the Fund more susceptible to any economic, political, or regulatory developments or other risks affecting those industries and sectors. |
| | The Fund may invest in equity securities of large companies. Large companies may fall out of favor with investors and underperform the overall equity market. |
| | Russia launched a large-scale invasion of Ukraine on February 24, 2022. In response to the military action by Russia, various countries, including the U.S., the United Kingdom, and European Union issued broad-ranging |
26Pioneer Intrinsic Value Fund | Semiannual Report | 3/31/24
| | economic sanctions against Russia and Belarus and certain companies and individuals. Since then, Russian securities have lost all, or nearly all, their market value, and many other issuers, securities and markets have been adversely affected. The United States and other countries may impose sanctions on other countries, companies and individuals in light of Russia’s military invasion. The extent and duration of the military action or future escalation of such hostilities, the extent and impact of existing and future sanctions, market disruptions and volatility, and the result of any diplomatic negotiations cannot be predicted. These and any related events could have a significant impact on the value and liquidity of certain Fund investments, on Fund performance and the value of an investment in the Fund, particularly with respect to securities and commodities, such as oil, natural gas and food commodities, as well as other sectors with exposure to Russian issuers or issuers in other countries affected by the invasion, and are likely to have collateral impacts on market sectors globally. |
| | With the increased use of technologies such as the Internet to conduct business, the Fund is susceptible to operational, information security and related risks. While the Fund’s Adviser has established business continuity plans in the event of, and risk management systems to prevent, limit or mitigate, such cyber-attacks, there are inherent limitations in such plans and systems, including the possibility that certain risks have not been identified. Furthermore, the Fund cannot control the cybersecurity plans and systems put in place by service providers to the Fund such as the Fund’s custodian and accounting agent, and the Fund’s transfer agent. In addition, many beneficial owners of Fund shares hold them through accounts at broker-dealers, retirement platforms and other financial market participants over which neither the Fund nor the Adviser exercises control. Each of these may in turn rely on service providers to them, which are also subject to the risk of cyber-attacks. Cybersecurity failures or breaches at the Adviser or the Fund’s service providers or intermediaries have the ability to cause disruptions and impact business operations, potentially resulting in financial losses, interference with the Fund’s ability to calculate its net asset value, impediments to trading, the inability of Fund shareholders to effect share purchases, redemptions or exchanges or receive distributions, loss of or unauthorized access to private shareholder information and violations of applicable privacy and other laws, regulatory fines, penalties, reputational damage, or additional compliance costs. Such costs and losses may not be covered under any insurance. In addition, maintaining vigilance against cyber-attacks may involve substantial costs over time, and system enhancements may themselves be subject to cyber-attacks. |
Pioneer Intrinsic Value Fund | Semiannual Report | 3/31/2427
| | The Fund’s prospectus contains unaudited information regarding the Fund’s principal risks. Please refer to that document when considering the Fund’s principal risks. |
2. Management Agreement
The Adviser manages the Fund’s portfolio. Management fees payable under the Fund’s Investment Management Agreement with the Adviser are calculated daily and paid monthly at the annual rate of 0.45% of the Fund’s average daily net assets up to $1 billion and 0.40% of the Fund’s average daily net assets over $1 billion. For the six months ended March 31, 2024, the effective management fee (excluding waivers and/or assumption of expenses) was equivalent to 0.45% (annualized) of the Fund’s average daily net assets.
The Adviser has contractually agreed to waive and/or reimburse ordinary operating expenses (ordinary operating expenses means all Fund expenses other than taxes, brokerage commissions, acquired fund fees and expenses, and extraordinary expenses, such as litigation) to the extent required to reduce Fund expenses to 0.85%, 1.60% and 0.55% of the average daily net assets attributable to Class A, Class C and Class Y shares, respectively. These expense limitations are in effect through February 1, 2025. There can be no assurance that the Adviser will extend the expense limitation agreement for a class of shares beyond the date referred to above. Fees waived and expenses reimbursed during the six months ended March 31, 2024 are reflected on the Statement of Operations.
In addition, under the management and administration agreements, certain other services and costs, including accounting, regulatory reporting and insurance premiums, are paid by the Fund as administrative reimbursements. Reflected on the Statement of Assets and Liabilities is $138 in management fees payable to the Adviser at March 31, 2024.
3. Compensation of Officers and Trustees
The Fund pays an annual fee to its Trustees. The Adviser reimburses the Fund for fees paid to the Interested Trustees. Except for the chief compliance officer, the Fund does not pay any salary or other compensation to its officers. The Fund pays a portion of the chief compliance officer’s compensation for his services as the Fund’s chief compliance officer. Amundi US pays the remaining portion of the chief compliance officer’s compensation. For the six months ended March 31, 2024, the Fund paid $3,992 in Officers’ and Trustees’ compensation, which is reflected on the Statement of Operations as Officers’ and Trustees’ fees. At March 31, 2024, on its Statement of Assets and Liabilities, the Fund had a payable for
28Pioneer Intrinsic Value Fund | Semiannual Report | 3/31/24
Trustees’ fees of $5 and a payable for administrative expenses of $39, which includes the payable for Officers’ compensation.
4. Transfer Agent
BNY Mellon Investment Servicing (US) Inc. serves as the transfer agent to the Fund at negotiated rates. Transfer agent fees and payables shown on the Statement of Operations and the Statement of Assets and Liabilities, respectively, include sub-transfer agent expenses incurred through the Fund’s omnibus relationship contracts.
In addition, the Fund reimbursed the transfer agent for out-of-pocket expenses incurred by the transfer agent related to shareholder communications activities such as proxy and statement mailings, and outgoing phone calls. For the six months ended March 31, 2024, such out-of-pocket expenses by class of shares were as follows:
| Shareholder Communications: | |
| Class A | $137 |
| Class C | 42 |
| Class Y | (7) |
| Total | $172 |
5. Distribution Plan
The Fund has adopted a distribution plan (the “Plan”) pursuant to Rule 12b-1 of the Investment Company Act of 1940 with respect to its Class A and Class C shares. Pursuant to the Plan, the Fund pays the Distributor 0.25% of the average daily net assets attributable to Class A shares as compensation for personal services and/or account maintenance services or distribution services with regard to Class A shares. Pursuant to the Plan, the Fund also pays the Distributor 1.00% of the average daily net assets attributable to Class C shares. The fee for Class C shares consists of a 0.25% service fee and a 0.75% distribution fee paid as compensation for personal services and/or account maintenance services or distribution services with regard to Class C shares. Reflected on the Statement of Assets and Liabilities is $122 in distribution fees payable to the Distributor at March 31, 2024.
In addition, redemptions of Class A and Class C shares may be subject to a contingent deferred sales charge (“CDSC”). A CDSC of 1.00% may be imposed on redemptions of certain net asset value purchases of Class A shares within 12 months of purchase. Redemptions of Class C shares within 12 months of purchase are subject to a CDSC of 1.00%, based on the lower of cost or market value of shares being redeemed. Shares purchased as part of an exchange remain subject to any CDSC that applied to the original purchase of those shares. There is no CDSC for Class Y shares. Proceeds
Pioneer Intrinsic Value Fund | Semiannual Report | 3/31/2429
from the CDSCs are paid to the Distributor. For the six months ended March 31, 2024, no CDSCs were paid to the Distributor.
30Pioneer Intrinsic Value Fund | Semiannual Report | 3/31/24
Additional Information
On March 25, 2024, Ernst & Young LLP (the “Prior Auditor”) resigned as the independent registered public accounting firm of Pioneer Intrinsic Value Fund (the “Fund”) due to the independence considerations resulting from a change of the independent registered public accounting firm of a related party. The Prior Auditor’s reports on the financial statements of the Fund for the past two fiscal years, the years ended September 30, 2023 and September 30, 2022, did not contain an adverse opinion or disclaimer of opinion, and were not qualified or modified as to uncertainty, audit scope or accounting principles.
During the last two fiscal year-ends and the subsequent interim period through March 25, 2024, there were no (1) disagreements with the Prior Auditor on any matter of accounting principles or practices, financial statement disclosure, or auditing scope or procedure, which disagreements, if not resolved to the Prior Auditor's satisfaction, would have caused it to make reference to that matter in connection with its reports on the Fund's financial statements for such periods; or (2) "reportable events" related to the Fund, as that term is defined in Item 304 (a)(1)(v) of Regulation S-K under the Securities Exchange Act of 1934.
On March 25, 2024, the Audit Committee of the Board approved, and on March 25, 2024, the Board approved, Deloitte & Touche LLP as the independent registered accounting firm of the Fund for fiscal periods ending after March 25, 2024.
Pioneer Intrinsic Value Fund | Semiannual Report | 3/31/2431
Trustees, Officers and Service Providers
Trustees
Thomas J. Perna, Chairman
John E. Baumgardner, Jr.
Diane Durnin
Benjamin M. Friedman
Lisa M. Jones
Craig C. MacKay
Lorraine H. Monchak
Marguerite A. Piret*
Fred J. Ricciardi
Officers
Lisa M. Jones, President and
Chief Executive Officer
Marco Pirondini**
Executive Vice President
Anthony J. Koenig, Jr., Treasurer
and Chief Financial and
Accounting Officer
Christopher J. Kelley, Secretary and
Chief Legal Officer
Investment Adviser and Administrator
Amundi Asset Management US, Inc.
Custodian and Sub-Administrator
The Bank of New York Mellon Corporation
Independent Registered Public Accounting Firm
Deloitte & Touche LLP
Principal Underwriter
Amundi Distributor US, Inc.
Legal Counsel
Morgan, Lewis & Bockius LLP
Transfer Agent
BNY Mellon Investment Servicing (US) Inc.
Proxy Voting Policies and Procedures of the Fund are available without charge, upon request, by calling our toll free number (1-800-225-6292). Information regarding how the Fund voted proxies relating to portfolio securities during the most recent 12-month period ended June 30 is publicly available to shareholders at www.amundi.com/us. This information is also available on the Securities and Exchange Commission’s web site at www.sec.gov.
* Ms. Piret became a non-voting Advisory Trustee of the Pioneer Funds effective January 22, 2024.
** Marco Pirondini was appointed to serve as an Executive Vice President of the Fund and Chief Investment Officer of Amundi US, Inc., effective January 1, 2024.
32Pioneer Intrinsic Value Fund | Semiannual Report | 3/31/24
How to Contact Amundi
We are pleased to offer a variety of convenient ways for you to contact us for assistance or information.
Call us for:
Account Information, including existing accounts,
new accounts, prospectuses, applications
and service forms
1-800-225-6292
FactFoneSM for automated fund yields, prices,
account information and transactions
1-800-225-4321
| Retirement plans information | 1-800-622-0176 |
Write to us:
Amundi
P.O. Box 534427
Pittsburgh, PA 15253-4427
| Our toll-free fax | 1-800-225-4240 |
| Our internet e-mail address | us.askamundi@amundi.com
(for general questions about Amundi only) |
Visit our web site: www.amundi.com/us
This report must be preceded or accompanied by a prospectus.
The Fund files a complete schedule of portfolio holdings with the Securities and Exchange Commission for the first and third quarters of each fiscal year as an exhibit to its reports on Form N-PORT. Shareholders may view the filed Form N-PORT by visiting the Commission’s web site at https://www.sec.gov.
Amundi Asset Management US, Inc.
60 State Street
Boston, MA 02109
www.amundi.com/us
Securities offered through Amundi Distributor US, Inc.
60 State Street, Boston, MA 02109
Underwriter of Pioneer Mutual Funds, Member SIPC
© 2024 Amundi Asset Management US, Inc. 32975-02-0524
Pioneer Strategic Income Fund
Semiannual Report | March 31, 2024
| | | | | |
| A: PSRAX | C: PSRCX | K: STRKX | R: STIRX | Y: STRYX |
IMPORTANT NOTICE – UPCOMING CHANGES TO PIONEER FUNDS ANNUAL & SEMI-ANNUAL REPORTS
The Securities and Exchange Commission (the “SEC”) has adopted rule and form amendments that will result in changes to the design and delivery of annual and semi-annual fund reports (“Reports”). Beginning in July 2024, Reports will be streamlined to highlight key information (“Redesigned Reports”). Certain information currently included in the Reports, including financial statements, will no longer appear in the Reports but will be available online, delivered free of charge to shareholders upon request, and filed with the SEC.
If you previously elected to receive the Fund's Reports electronically, you will continue to receive the Redesigned Reports electronically. Otherwise, you will receive paper copies of the Fund's Redesigned Reports via USPS mail starting in July 2024. If you would like to receive the Fund's Redesigned Reports (and/or other communications) electronically instead of by mail, please contact your financial advisor or, if you are a direct investor, please log into your mutual fund account at amundi.com/usinvestors and select “E-Delivery” under the Profile page. You must be registered for online account access before you can enroll in E-Delivery.
visit us: www.amundi.com/us
Pioneer Strategic Income Fund | Semiannual Report | 3/31/241
Portfolio Summary | 3/31/24
Portfolio Diversification
(As a percentage of total investments)*
10 Largest Holdings
| (As a percentage of total investments)* |
| 1. | U.S. Treasury Notes, 4.50%, 9/30/30 | 4.68% |
| 2. | Federal National Mortgage Association, 2.50%, 4/1/54 (TBA) | 2.26 |
| 3. | Federal National Mortgage Association, 3.00%, 4/1/54 (TBA) | 1.70 |
| 4. | Federal National Mortgage Association, 6.50%, 4/15/54 (TBA) | 1.65 |
| 5. | U.S. Treasury Bills, 4/9/24 | 1.32 |
| 6. | U.S. Treasury Bonds, 2.25%, 2/15/52 | 1.24 |
| 7. | Federal National Mortgage Association, 1.50%, 3/1/42 | 1.00 |
| 8. | Federal Home Loan Mortgage Corp., 5.50%, 8/1/53 | 0.98 |
| 9. | U.S. Treasury Bonds, 4.375%, 8/15/43 | 0.79 |
| 10. | Federal Home Loan Mortgage Corp., 6.00%, 2/1/54 | 0.79 |
* Excludes short-term investments and all derivative contracts except for options purchased. The Fund is actively managed, and current holdings may be different. The holdings listed should not be considered recommendations to buy or sell any securities.
2Pioneer Strategic Income Fund | Semiannual Report | 3/31/24
Prices and Distributions | 3/31/24
Net Asset Value per Share
| Class | 3/31/24 | 9/30/23 |
| A | $9.41 | $8.91 |
| C | $9.20 | $8.71 |
| K | $9.43 | $8.92 |
| R | $9.58 | $9.07 |
| Y | $9.41 | $8.91 |
| | | |
Distributions per Share: 10/1/23 - 3/31/24
| Class | Net
Investment
Income | Short-Term
Capital Gains | Long-Term
Capital Gains |
| A | $0.1821 | $— | $— |
| C | $0.1490 | $— | $— |
| K | $0.2045 | $— | $— |
| R | $0.1721 | $— | $— |
| Y | $0.1998 | $— | $— |
Index Definitions
The Bloomberg U.S. Universal Index is an unmanaged index that represents the union of the U.S. Aggregate Index, the U.S. High Yield Corporate Index, the 144A Index, the Eurodollar Index, the Emerging Markets Index, the non-ERISA portion of the CMBS Index, and the CMBS High Yield Index. Municipal debt, private placements and non-dollar-denominated issues are excluded. Indices are unmanaged and their returns assume reinvestment of dividends and do not reflect any fees or expenses. It is not possible to invest directly in an index.
The index defined here pertains to the “Value of $10,000 Investment” and “Value of $5 Million Investment” charts on pages 4 - 8.
Pioneer Strategic Income Fund | Semiannual Report | 3/31/243
| Performance Update | 3/31/24 | Class A Shares |
Investment Returns
The mountain chart on the right shows the change in value of a $10,000 investment made in Class A shares of Pioneer Strategic Income Fund at public offering price during the periods shown, compared to that of the Bloomberg U.S. Universal Index.
Average Annual Total Returns
(As of March 31, 2024) |
| Period | Net
Asset
Value
(NAV) | Public
Offering
Price
(POP) | Bloomberg
U.S.
Universal
Index |
| 10 Years | 2.41% | 1.94% | 1.83% |
| 5 Years | 1.92 | 0.98 | 0.69 |
| 1 Year | 4.94 | 0.21 | 2.67 |
Expense Ratio
(Per prospectus dated February 1, 2024) |
| Gross |
| 1.11% |
Value of $10,000 Investment
Call 1-800-225-6292 or visit www.amundi.com/us for the most recent month-end performance results. Current performance may be lower or higher than the performance data quoted.
The performance data quoted represents past performance, which is no guarantee of future results. Investment return and principal value will fluctuate, and shares, when redeemed, may be worth more or less than their original cost.
NAV results represent the percent change in net asset value per share. NAV returns would have been lower had sales charges been reflected. POP returns reflect deduction of maximum 4.50% sales charge. All results are historical and assume the reinvestment of dividends and capital gains. Other share classes are available for which performance and expenses will differ.
Performance results reflect any applicable expense waivers in effect during the periods shown. Without such waivers Fund performance would be lower. Waivers may not be in effect for all funds. Certain fee waivers are contractual through a specified period. Otherwise, fee waivers can be rescinded at any time. See the prospectus and financial statements for more information.
The performance table and graph do not reflect the deduction of fees and taxes that a shareholder would pay on Fund distributions or the redemption of Fund shares.
Please refer to the financial highlights for a more current expense ratio.
4Pioneer Strategic Income Fund | Semiannual Report | 3/31/24
| Performance Update | 3/31/24 | Class C Shares |
Investment Returns
The mountain chart on the right shows the change in value of a $10,000 investment made in Class C shares of Pioneer Strategic Income Fund during the periods shown, compared to that of the Bloomberg U.S. Universal Index.
Average Annual Total Returns
(As of March 31, 2024) |
| Period | If
Held | If
Redeemed | Bloomberg
U.S.
Universal
Index |
| 10 Years | 1.74% | 1.74% | 1.83% |
| 5 Years | 1.26 | 1.26 | 0.69 |
| 1 Year | 4.29 | 3.29 | 2.67 |
Expense Ratio
(Per prospectus dated February 1, 2024) |
| Gross |
| 1.75% |
Value of $10,000 Investment
Call 1-800-225-6292 or visit www.amundi.com/us for the most recent month-end performance results. Current performance may be lower or higher than the performance data quoted.
The performance data quoted represents past performance, which is no guarantee of future results. Investment return and principal value will fluctuate, and shares, when redeemed, may be worth more or less than their original cost.
Class C shares held for less than one year are also subject to a 1% contingent deferred sales charge (CDSC). “If Held” results represent the percent change in net asset value per share. “If Redeemed” returns reflect deduction of the CDSC for the one-year period, assuming a complete redemption of shares at the last price calculated on the last business day of the period, and no CDSC for the five- and 10-year periods. All results are historical and assume the reinvestment of dividends and capital gains. Other share classes are available for which performance and expenses will differ.
Performance results reflect any applicable expense waivers in effect during the periods shown. Without such waivers Fund performance would be lower. Waivers may not be in effect for all funds. Certain fee waivers are contractual through a specified period. Otherwise, fee waivers can be rescinded at any time. See the prospectus and financial statements for more information.
The performance table and graph do not reflect the deduction of fees and taxes that a shareholder would pay on Fund distributions or the redemption of Fund shares.
Please refer to the financial highlights for a more current expense ratio.
Pioneer Strategic Income Fund | Semiannual Report | 3/31/245
| Performance Update | 3/31/24 | Class K Shares |
Investment Returns
The mountain chart on the right shows the change in value of a $5 million investment made in Class K shares of Pioneer Strategic Income Fund during the periods shown, compared to that of the Bloomberg U.S. Universal Index.
Average Annual Total Returns
(As of March 31, 2024) |
| Period | Net
Asset
Value
(NAV) | Bloomberg
U.S.
Universal
Index |
| 10 Years | 2.87% | 1.83% |
| 5 Years | 2.40 | 0.69 |
| 1 Year | 5.56 | 2.67 |
Expense Ratio
(Per prospectus dated February 1, 2024) |
| Gross | Net |
| 0.65% | 0.60% |
Value of $5 Million Investment
Call 1-800-225-6292 or visit www.amundi.com/us for the most recent month-end performance results. Current performance may be lower or higher than the performance data quoted.
The performance data quoted represents past performance, which is no guarantee of future results. Investment return and principal value will fluctuate, and shares, when redeemed, may be worth more or less than their original cost.
Class K shares are not subject to sales charges and are available for limited groups of eligible investors, including institutional investors. All results are historical and assume the reinvestment of dividends and capital gains. Other share classes are available for which performance and expenses will differ.
The net expense ratio reflects the contractual expense limitation in effect through February 1, 2025 for Class K shares. There can be no assurance that Amundi US will extend the expense limitation beyond such time. Please see the prospectus and financial statements for more information.
Performance results shown reflect any applicable expense waivers in effect during the periods shown. Without such waivers Fund performance would be lower. Waivers may not be in effect for all funds. Certain fee waivers are contractual through a specified period. Otherwise, fee waivers can be rescinded at any time. See the prospectus and financial statements for more information.
The performance table and graph do not reflect the deduction of fees and taxes that a shareholder would pay on Fund distributions or the redemption of Fund shares.
Please refer to the financial highlights for more current expense ratios.
6Pioneer Strategic Income Fund | Semiannual Report | 3/31/24
| Performance Update | 3/31/24 | Class R Shares |
Investment Returns
The mountain chart on the right shows the change in value of a $10,000 investment made in Class R shares of Pioneer Strategic Income Fund during the periods shown, compared to that of the Bloomberg U.S. Universal Index.
Average Annual Total Returns
(As of March 31, 2024) |
| Period | Net
Asset
Value
(NAV) | Bloomberg
U.S.
Universal
Index |
| 10 Years | 2.09% | 1.83% |
| 5 Years | 1.62 | 0.69 |
| 1 Year | 4.62 | 2.67 |
Expense Ratio
(Per prospectus dated February 1, 2024) |
| Gross |
| 1.40% |
Value of $10,000 Investment
Call 1-800-225-6292 or visit www.amundi.com/us for the most recent month-end performance results. Current performance may be lower or higher than the performance data quoted.
The performance data quoted represents past performance, which is no guarantee of future results. Investment return and principal value will fluctuate, and shares, when redeemed, may be worth more or less than their original cost.
Class R shares are not subject to sales charges and are available for limited groups of eligible investors, including institutional investors. All results are historical and assume the reinvestment of dividends and capital gains. Other share classes are available for which performance and expenses will differ.
Performance results reflect any applicable expense waivers in effect during the periods shown. Without such waivers Fund performance would be lower. Waivers may not be in effect for all funds. Certain fee waivers are contractual through a specified period. Otherwise, fee waivers can be rescinded at any time. See the prospectus and financial statements for more information.
The performance table and graph do not reflect the deduction of fees and taxes that a shareholder would pay on Fund distributions or the redemption of Fund shares.
Please refer to the financial highlights a more current expense ratio.
Pioneer Strategic Income Fund | Semiannual Report | 3/31/247
| Performance Update | 3/31/24 | Class Y Shares |
Investment Returns
The mountain chart on the right shows the change in value of a $5 million investment made in Class Y shares of Pioneer Strategic Income Fund during the periods shown, compared to that of the Bloomberg U.S. Universal Index.
Average Annual Total Returns
(As of March 31, 2024) |
| Period | Net
Asset
Value
(NAV) | Bloomberg
U.S.
Universal
Index |
| 10 Years | 2.76% | 1.83% |
| 5 Years | 2.29 | 0.69 |
| 1 Year | 5.46 | 2.67 |
Expense Ratio
(Per prospectus dated February 1, 2024) |
| Gross | Net |
| 0.75% | 0.70% |
Value of $5 Million Investment
Call 1-800-225-6292 or visit www.amundi.com/us for the most recent month-end performance results. Current performance may be lower or higher than the performance data quoted.
The performance data quoted represents past performance, which is no guarantee of future results. Investment return and principal value will fluctuate, and shares, when redeemed, may be worth more or less than their original cost.
Class Y shares are not subject to sales charges and are available for limited groups of eligible investors, including institutional investors. All results are historical and assume the reinvestment of dividends and capital gains. Other share classes are available for which performance and expenses will differ.
Performance results reflect any applicable expense waivers in effect during the periods shown. Without such waivers Fund performance would be lower. Waivers may not be in effect for all funds. Certain fee waivers are contractual through a specified period. Otherwise, fee waivers can be rescinded at any time. See the prospectus and financial statements for more information.
The net expense ratio reflects the contractual expense limitation in effect through February 1, 2025 for Class Y shares. There can be no assurance that Amundi US will extend the expense limitation beyond such time. Please see the prospectus and financial statements for more information.
The performance table and graph do not reflect the deduction of fees and taxes that a shareholder would pay on Fund distributions or the redemption of Fund shares.
Please refer to the financial highlights for more current expense ratios.
8Pioneer Strategic Income Fund | Semiannual Report | 3/31/24
Comparing Ongoing Fund Expenses
As a shareholder in the Fund, you incur two types of costs:
| (1) | ongoing costs, including management fees, distribution and/or service (12b-1) fees, and other Fund expenses; and |
| (2) | transaction costs, including sales charges (loads) on purchase payments. |
This example is intended to help you understand your ongoing expenses (in dollars) of investing in the Fund and to compare these costs with the ongoing costs of investing in other mutual funds. The example is based on an investment of $1,000 at the beginning of the Fund’s latest six-month period and held throughout the six months.
Using the Tables
Actual Expenses
The first table below provides information about actual account values and actual expenses. You may use the information in this table, together with the amount you invested, to estimate the expenses that you paid over the period as follows:
| (1) | Divide your account value by $1,000
Example: an $8,600 account value ÷ $1,000 = 8.6 |
| (2) | Multiply the result in (1) above by the corresponding share class’s number in the third row under the heading entitled “Expenses Paid During Period” to estimate the expenses you paid on your account during this period. |
Expenses Paid on a $1,000 Investment in Pioneer Strategic Income Fund
Based on actual returns from October 1, 2023 through March 31, 2024.
| Share Class | A | C | K | R | Y |
Beginning Account
Value on 10/1/23 | $1,000.00 | $1,000.00 | $1,000.00 | $1,000.00 | $1,000.00 |
Ending Account Value
(after expenses) on 3/31/24 | $1,077.10 | $1,073.80 | $1,080.70 | $1,075.70 | $1,079.10 |
Expenses Paid
During Period* | $5.50 | $8.81 | $3.07 | $6.90 | $3.59 |
| | |
| * | Expenses are equal to the Fund’s annualized expense ratio of 1.06%, 1.70%, 0.59%, 1.33%, and 0.69% for Class A, Class C, Class K, Class R, and Class Y shares, respectively, multiplied by the average account value over the period, multiplied by 183/366 (to reflect the one-half year period). |
Pioneer Strategic Income Fund | Semiannual Report | 3/31/249
Comparing Ongoing Fund Expenses (continued)
Hypothetical Example for Comparison Purposes
The table below provides information about hypothetical account values and hypothetical expenses based on the Fund’s actual expense ratio and an assumed rate of return of 5% per year before expenses, which is not the Fund’s actual return. The hypothetical account values and expenses may not be used to estimate the actual ending account balance or expenses you paid for the period.
You may use this information to compare the ongoing costs of investing in the Fund and other funds. To do so, compare this 5% hypothetical example with the 5% hypothetical examples that appear in the shareholder reports of the other funds.
Please note that the expenses shown in the tables are meant to highlight your ongoing costs only and do not reflect any transaction costs, such as sales charges (loads) that are charged at the time of the transaction. Therefore, the table below is useful in comparing ongoing costs only and will not help you determine the relative total costs of owning different funds. In addition, if these transaction costs were included, your costs would have been higher.
Expenses Paid on a $1,000 Investment in Pioneer Strategic Income Fund
Based on a hypothetical 5% return per year before expenses, reflecting the period from October 1, 2023 through March 31, 2024.
| Share Class | A | C | K | R | Y |
Beginning Account
Value on 10/1/23 | $1,000.00 | $1,000.00 | $1,000.00 | $1,000.00 | $1,000.00 |
Ending Account Value
(after expenses) on 3/31/24 | $1,019.70 | $1,016.50 | $1,022.05 | $1,018.35 | $1,021.55 |
Expenses Paid
During Period* | $5.35 | $8.57 | $2.98 | $6.71 | $3.49 |
| | |
| * | Expenses are equal to the Fund’s annualized expense ratio of 1.06%, 1.70%, 0.59%, 1.33%, and 0.69% for Class A, Class C, Class K, Class R, and Class Y shares, respectively, multiplied by the average account value over the period, multiplied by 183/366 (to reflect the one-half year period). |
10Pioneer Strategic Income Fund | Semiannual Report | 3/31/24
Schedule of Investments | 3/31/24
(unaudited)
Principal
Amount
USD ($) | | | | | | Value |
| | UNAFFILIATED ISSUERS — 106.0% | |
| | Senior Secured Floating Rate
Loan Interests — 0.5% of Net Assets*(a) | |
| | Building & Construction Products — 0.0%† | |
| 1,045,000(b) | MIWD Holdco II LLC, Term Loan, 3/20/31 | $ 1,051,205 |
| | Total Building & Construction Products | $1,051,205 |
|
|
| | Chemicals-Diversified — 0.1% | |
| 1,881,600 | LSF11 A5 HoldCo LLC, Term Loan, 8.942% (Term SOFR + 350 bps), 10/15/28 | $ 1,884,539 |
| | Total Chemicals-Diversified | $1,884,539 |
|
|
| | Electric-Generation — 0.1% | |
| 2,489,968 | Generation Bridge Northeast LLC, Term Loan B, 8.826% (Term SOFR + 350 bps), 8/22/29 | $ 2,502,418 |
| | Total Electric-Generation | $2,502,418 |
|
|
| | Electronic Composition — 0.0%† | |
| 302,297 | Energy Acquisition LP, First Lien Initial Term Loan, 9.677% (Term SOFR + 425 bps), 6/26/25 | $ 302,045 |
| | Total Electronic Composition | $302,045 |
|
|
| | Medical-Wholesale Drug Distribution —
0.1% | |
| 3,015,675 | Owens & Minor, Inc., Term B-1 Loan, 9.18% (Term SOFR + 375 bps), 3/29/29 | $ 3,032,638 |
| | Total Medical-Wholesale Drug Distribution | $3,032,638 |
|
|
| | Metal Processors & Fabrication — 0.1% | |
| 2,708,654 | Grinding Media, Inc. (Molycop, Ltd.), First Lien Initial Term Loan, 9.591% (Term SOFR + 400 bps), 10/12/28 | $ 2,701,882 |
| 989,384 | WireCo WorldGroup, Inc., 2023 Refinancing Term Loan, 9.068% (Term SOFR + 375 bps), 11/13/28 | 993,095 |
| | Total Metal Processors & Fabrication | $3,694,977 |
|
|
The accompanying notes are an integral part of these financial statements.
Pioneer Strategic Income Fund | Semiannual Report | 3/31/2411
Schedule of Investments | 3/31/24
(unaudited) (continued)
Principal
Amount
USD ($) | | | | | | Value |
| | Recreational Centers — 0.1% | |
| 2,711,800 | Fitness International LLC, Term B Loan, 10.577% (Term SOFR + 525 bps), 2/12/29 | $ 2,684,682 |
| | Total Recreational Centers | $2,684,682 |
|
|
| | Total Senior Secured Floating Rate Loan Interests
(Cost $15,018,618) | $15,152,504 |
|
|
| Shares | | | | | | |
| | Common Stocks — 0.1% of Net Assets | |
| | Automobile Components — 0.0%† | |
| 95,654(c) | Ascent CNR Corp., Class A | $ 956,540 |
| | Total Automobile Components | $956,540 |
|
|
| | Communications Equipment — 0.0%† | |
| 43,579(c) + | Digicel International Finance Ltd. | $ 152,526 |
| | Total Communications Equipment | $152,526 |
|
|
| | Household Durables — 0.0%† | |
| 1,018,282(c) | Desarrolladora Homex SAB de CV | $ 674 |
| | Total Household Durables | $674 |
|
|
| | Oil, Gas & Consumable Fuels — 0.0%† | |
| 336(c) | Frontera Energy Corp. | $ 2,050 |
| | Total Oil, Gas & Consumable Fuels | $2,050 |
|
|
| | Paper & Forest Products — 0.0%† | |
| 162,828 + | Emerald Plantation Holdings, Ltd. | $ — |
| | Total Paper & Forest Products | $— |
|
|
| | Passenger Airlines — 0.1% | |
| 128,171(c) | Grupo Aeromexico SAB de CV | $ 1,784,811 |
| | Total Passenger Airlines | $1,784,811 |
|
|
| | Total Common Stocks
(Cost $2,527,855) | $2,896,601 |
|
|
The accompanying notes are an integral part of these financial statements.
12Pioneer Strategic Income Fund | Semiannual Report | 3/31/24
Principal
Amount
USD ($) | | | | | | Value |
| | Asset Backed Securities — 8.6% of
Net Assets | |
| 500,000 | 321 Henderson Receivables III LLC, Series 2008-1A, Class C, 9.36%, 1/15/48 (144A) | $ 492,141 |
| 500,000 | 321 Henderson Receivables III LLC, Series 2008-1A, Class D, 10.81%, 1/15/50 (144A) | 499,978 |
| 4,000,000(a) | 522 Funding CLO, Ltd., Series 2019-4A, Class E, 12.579% (3 Month Term SOFR + 726 bps), 4/20/30 (144A) | 3,800,556 |
| 4,750,000(a) | 522 Funding CLO, Ltd., Series 2019-5A, Class ER, 12.074% (3 Month Term SOFR + 676 bps), 4/15/35 (144A) | 4,372,081 |
| 439,869 | Accelerated Assets LLC, Series 2018-1, Class B, 4.51%, 12/2/33 (144A) | 431,367 |
| 621,814 | Accelerated Assets LLC, Series 2018-1, Class C, 6.65%, 12/2/33 (144A) | 610,909 |
| 2,350,000 | Amur Equipment Finance Receivables X LLC, Series 2022-1A, Class E, 5.02%, 12/20/28 (144A) | 2,287,634 |
| 1,413,000 | Amur Equipment Finance Receivables XI LLC, Series 2022-2A, Class E, 9.32%, 10/22/29 (144A) | 1,395,965 |
| 5,250,000 | Amur Equipment Finance Receivables XII LLC, Series 2023-1A, Class D, 7.48%, 7/22/30 (144A) | 5,391,395 |
| 4,910,000 | Amur Equipment Finance Receivables XIII LLC, Series 2024-1A, Class D, 6.57%, 4/21/31 (144A) | 4,973,207 |
| 2,000,000 | Arivo Acceptance Auto Loan Receivables Trust, Series 2022-1A, Class D, 7.38%, 9/17/29 (144A) | 1,873,687 |
| 1,054,000(d) | B2R Mortgage Trust, Series 2015-1, Class D, 4.831%, 5/15/48 (144A) | 1,042,298 |
| 3,295,000(a) | Battalion CLO IX, Ltd., Series 2015-9A, Class ER, 11.826% (3 Month Term SOFR + 651 bps), 7/15/31 (144A) | 2,897,396 |
| 1,600,000(a) | Benefit Street Partners CLO XIX, Ltd., Series 2019-19A, Class D, 9.376% (3 Month Term SOFR + 406 bps), 1/15/33 (144A) | 1,592,016 |
| 3,351,162 | Blackbird Capital Aircraft Lease, Ltd., Series 2021-1A, Class B, 3.446%, 7/15/46 (144A) | 2,915,679 |
The accompanying notes are an integral part of these financial statements.
Pioneer Strategic Income Fund | Semiannual Report | 3/31/2413
Schedule of Investments | 3/31/24
(unaudited) (continued)
Principal
Amount
USD ($) | | | | | | Value |
| | Asset Backed Securities — (continued) | |
| 3,000,000(a) | Carlyle US CLO, Ltd., Series 2019-4A, Class CR, 8.514% (3 Month Term SOFR + 320 bps), 4/15/35 (144A) | $ 2,896,596 |
| 2,150,000 | Cascade MH Asset Trust, Series 2021-MH1, Class B1, 4.573%, 2/25/46 (144A) | 1,765,089 |
| 4,000,000(d) | Cascade MH Asset Trust, Series 2021-MH1, Class B3, 7.569%, 2/25/46 (144A) | 3,157,272 |
| 4,250,000(a) | Catskill Park CLO, Ltd., Series 2017-1A, Class D, 11.579% (3 Month Term SOFR + 626 bps), 4/20/29 (144A) | 4,181,052 |
| 12,000,000(d) | CFMT LLC, Series 2021-HB7, Class M4, 5.072%, 10/27/31 (144A) | 11,279,048 |
| 7,465,000 | Cologix Canadian Issuer LP, Series 2022-1CAN, Class A2, 4.94%, 1/25/52 (144A) | 5,115,196 |
| 2,500,000 | Commercial Equipment Finance LLC, Series 2021-A, Class D, 6.49%, 12/17/29 (144A) | 2,404,458 |
| 70,511 | Commonbond Student Loan Trust, Series 2017-BGS, Class C, 4.44%, 9/25/42 (144A) | 60,957 |
| 4,155,000 | Continental Credit Card ABS LLC, Series 2019-1A, Class C, 6.16%, 8/15/26 (144A) | 4,127,016 |
| 6,550,000 | Continental Finance Credit Card ABS Master Trust, Series 2022-A, Class C, 9.33%, 10/15/30 (144A) | 6,527,807 |
| 3,000,000 | Continental Finance Credit Card ABS Master Trust, Series 2022-A, Class D, 12.42%, 10/15/30 (144A) | 2,953,862 |
| 1,000,000 | Crossroads Asset Trust, Series 2021-A, Class E, 5.48%, 1/20/28 (144A) | 993,516 |
| 2,300,000 | DataBank Issuer, Series 2021-1A, Class C, 4.43%, 2/27/51 (144A) | 1,913,542 |
| 11,400,000 | DataBank Issuer, Series 2024-1A, Class A2, 5.30%, 1/26/54 (144A) | 10,724,064 |
| 6,000,000 | ExteNet LLC, Series 2019-1A, Class C, 5.219%, 7/25/49 (144A) | 5,935,899 |
| 9,460,000(d) | Finance of America HECM Buyout, Series 2022-HB1, Class M6, 9.317%, 2/25/32 (144A) | 7,947,705 |
| 7,459,460(e) | Finance of America Structured Securities Trust, Series 2021-S2, Class A2, 1.75%, 9/25/71 (144A) | 6,801,510 |
The accompanying notes are an integral part of these financial statements.
14Pioneer Strategic Income Fund | Semiannual Report | 3/31/24
Principal
Amount
USD ($) | | | | | | Value |
| | Asset Backed Securities — (continued) | |
| 13,878,157(e) | Finance of America Structured Securities Trust, Series 2021-S3, Class A2, 3.25%, 12/28/26 (144A) | $ 12,666,553 |
| 1,000,000(a) | First Eagle BSL CLO, Ltd., Series 2019-1A, Class C, 9.929% (3 Month Term SOFR + 461 bps), 1/20/33 (144A) | 991,226 |
| 3,000,000(a) | First Eagle BSL CLO, Ltd., Series 2019-1A, Class D, 13.279% (3 Month Term SOFR + 796 bps), 1/20/33 (144A) | 2,791,107 |
| 5,500,000 | Four Seas LP, Series 2017-1A, Class A2, 5.927%, 8/28/27 (144A) | 5,286,538 |
| 4,250,000(a) | Goldentree Loan Management US CLO 6, Ltd., Series 2019-6A, Class DR, 8.418% (3 Month Term SOFR + 310 bps), 4/20/35 (144A) | 4,212,247 |
| 2,885,000 | Granite Park Equipment Leasing LLC, Series 2023-1A, Class E, 7.00%, 6/20/35 (144A) | 2,485,824 |
| 10,000,000 | Hertz Vehicle Financing III LP, Series 2021-2A, Class D, 4.34%, 12/27/27 (144A) | 9,118,744 |
| 9,945,000 | HOA Funding LLC - HOA, Series 2021-1A, Class A2, 4.723%, 8/20/51 (144A) | 7,742,981 |
| 585,178 | Home Partners of America Trust, Series 2019-1, Class F, 4.101%, 9/17/39 (144A) | 518,618 |
| 2,220,000 | HPEFS Equipment Trust, Series 2023-2A, Class D, 6.97%, 7/21/31 (144A) | 2,259,036 |
| 1,020,000 | HPEFS Equipment Trust, Series 2024-1A, Class D, 5.82%, 11/20/31 (144A) | 1,020,802 |
| 3,175,000(a) | ICG US CLO, Ltd., Series 2016-1A, Class DRR, 13.021% (3 Month Term SOFR + 770 bps), 4/29/34 (144A) | 2,615,473 |
| 2,250,000(a) | ICG US CLO, Ltd., Series 2021-1A, Class E, 11.908% (3 Month Term SOFR + 659 bps), 4/17/34 (144A) | 2,005,160 |
| 293,662 | JG Wentworth XXII LLC, Series 2010-3A, Class A, 3.82%, 12/15/48 (144A) | 293,315 |
| 3,070,000 | JPMorgan Chase Bank N.A. - CACLN, Series 2021-2, Class F, 4.393%, 12/26/28 (144A) | 3,017,653 |
| 1,845,000(a) | MF1, Ltd., Series 2021-FL7, Class E, 8.241% (1 Month Term SOFR + 291 bps), 10/16/36 (144A) | 1,692,206 |
The accompanying notes are an integral part of these financial statements.
Pioneer Strategic Income Fund | Semiannual Report | 3/31/2415
Schedule of Investments | 3/31/24
(unaudited) (continued)
Principal
Amount
USD ($) | | | | | | Value |
| | Asset Backed Securities — (continued) | |
| 1,769,558 | Mosaic Solar Loan Trust, Series 2019-2A, Class D, 6.18%, 9/20/40 (144A) | $ 1,708,198 |
| 2,936,805 | Mosaic Solar Loan Trust, Series 2021-1A, Class D, 3.71%, 12/20/46 (144A) | 2,498,138 |
| 5,000,000(a) | Neuberger Berman CLO XVII, Ltd., Series 2014-17A, Class ER2, 12.779% (3 Month Term SOFR + 746 bps), 4/22/29 (144A) | 4,974,020 |
| 4,500,000(a) | Newark BSL CLO 1, Ltd., Series 2016-1A, Class DR, 11.831% (3 Month Term SOFR + 651 bps), 12/21/29 (144A) | 4,288,793 |
| 5,950,000 | NMEF Funding LLC, Series 2022-B, Class C, 8.54%, 6/15/29 (144A) | 5,908,556 |
| 1,119,000 | Octane Receivables Trust, Series 2020-1A, Class D, 5.45%, 3/20/28 (144A) | 1,113,383 |
| 1,900,000(a) | Palmer Square Loan Funding, Ltd., Series 2022-1A, Class C, 7.917% (3 Month Term SOFR + 260 bps), 4/15/30 (144A) | 1,873,780 |
| 6,400,000 | PEAR LLC, Series 2021-1, Class B, 0.000%, 1/15/34 (144A) | 4,845,760 |
| 2,260,000 | Post Road Equipment Finance LLC, Series 2024-1A, Class E, 8.50%, 12/15/31 (144A) | 2,172,583 |
| 5,000,000(a) | Race Point VIII CLO, Ltd., Series 2013-8A, Class DR2, 9.081% (3 Month Term SOFR + 376 bps), 2/20/30 (144A) | 4,960,180 |
| 9,600,000 | Republic Finance Issuance Trust, Series 2021-A, Class D, 5.23%, 12/22/31 (144A) | 8,703,262 |
| 3,000,000(d) | RMF Buyout Issuance Trust, Series 2021-HB1, Class M4, 4.704%, 11/25/31 (144A) | 2,552,108 |
| 6,000,000(d) | RMF Buyout Issuance Trust, Series 2021-HB1, Class M5, 6.00%, 11/25/31 (144A) | 4,944,625 |
| 3,750,000(d) + | RMF Buyout Issuance Trust, Series 2022-HB1, Class M5, 4.50%, 4/25/32 (144A) | 693,750 |
| 1,500,000 | Rosy Blue Carat SCS, Series 2018-1, Class A1R, 8.481%, 3/15/30 (144A) | 1,524,300 |
| 1,250,000(a) | RRX 3, Ltd., Series 2021-3A, Class D, 12.326% (3 Month Term SOFR + 701 bps), 4/15/34 (144A) | 1,235,190 |
| 9,550,000 | Santander Bank Auto Credit-Linked Notes, Series 2022-B, Class F, 11.91%, 8/16/32 (144A) | 9,590,066 |
The accompanying notes are an integral part of these financial statements.
16Pioneer Strategic Income Fund | Semiannual Report | 3/31/24
Principal
Amount
USD ($) | | | | | | Value |
| | Asset Backed Securities — (continued) | |
| 678,923 | Sierra Timeshare Receivables Funding LLC, Series 2020-2A, Class D, 6.59%, 7/20/37 (144A) | $ 659,940 |
| 3,500,000(a) | Signal Peak CLO 2 LLC, Series 2015-1A, Class DR2, 8.429% (3 Month Term SOFR + 311 bps), 4/20/29 (144A) | 3,468,560 |
| 4,750,000(a) | Sound Point CLO XXI, Ltd., Series 2018-3A, Class C, 8.886% (3 Month Term SOFR + 356 bps), 10/26/31 (144A) | 4,470,216 |
| 3,000,000(a) | Sound Point CLO XXVIII, Ltd., Series 2020-3A, Class E, 12.486% (3 Month Term SOFR + 716 bps), 1/25/32 (144A) | 2,867,427 |
| 6,050,000 | Switch ABS Issuer LLC, Series 2024-1A, Class A2, 6.28%, 3/25/54 (144A) | 5,981,600 |
| 5,000,000(d) | Towd Point HE Trust, Series 2021-HE1, Class M2, 2.50%, 2/25/63 (144A) | 4,564,690 |
| 2,750,000 | Tricolor Auto Securitization Trust, Series 2021-1A, Class F, 5.08%, 5/15/28 (144A) | 2,729,722 |
| 4,022,000 | Tricolor Auto Securitization Trust, Series 2024-1A, Class E, 11.91%, 9/17/29 (144A) | 4,043,567 |
| 4,250,000 | Tricon American Homes Trust, Series 2020-SFR2, Class E1, 2.73%, 11/17/39 (144A) | 3,769,082 |
| 639,998 | Upstart Securitization Trust, Series 2021-1, Class C, 4.06%, 3/20/31 (144A) | 633,477 |
| 1,294,000 | VFI ABS LLC, Series 2022-1A, Class D, 6.68%, 11/26/29 (144A) | 1,248,723 |
| 2,540,000 | VFI ABS LLC, Series 2023-1A, Class D, 12.36%, 12/24/30 (144A) | 2,567,177 |
| 344,203 | Westgate Resorts LLC, Series 2020-1A, Class C, 6.213%, 3/20/34 (144A) | 342,213 |
| 2,093,373 | Westgate Resorts LLC, Series 2022-1A, Class C, 2.488%, 8/20/36 (144A) | 1,996,156 |
| 1,322,130 | Westgate Resorts LLC, Series 2022-1A, Class D, 3.838%, 8/20/36 (144A) | 1,255,148 |
| 4,000,000(a) | Whitebox CLO II, Ltd., Series 2020-2A, Class ER, 12.68% (3 Month Term SOFR + 736 bps), 10/24/34 (144A) | 3,997,080 |
| | Total Asset Backed Securities
(Cost $300,134,118) | $280,259,851 |
|
|
The accompanying notes are an integral part of these financial statements.
Pioneer Strategic Income Fund | Semiannual Report | 3/31/2417
Schedule of Investments | 3/31/24
(unaudited) (continued)
Principal
Amount
USD ($) | | | | | | Value |
| | Collateralized Mortgage
Obligations—11.5% of Net Assets | |
| 5,970,020(d) | Bayview MSR Opportunity Master Fund Trust, Series 2021-2, Class A8, 2.50%, 6/25/51 (144A) | $ 3,745,971 |
| 8,062,000(d) | BINOM Securitization Trust, Series 2022-RPL1, Class M3, 3.00%, 2/25/61 (144A) | 5,757,603 |
| 3,126,864(d) | Brean Asset Backed Securities Trust, Series 2021-RM1, Class A, 1.40%, 10/25/63 (144A) | 2,673,648 |
| 2,607,410 | Brean Asset Backed Securities Trust, Series 2021-RM2, Class M1, 1.75%, 10/25/61 (144A) | 2,021,529 |
| 3,432,686(d) | Cascade Funding Mortgage Trust, Series 2019-RM3, Class C, 4.00%, 6/25/69 (144A) | 3,173,833 |
| 3,017,751(d) | CIM Trust, Series 2021-J2, Class B3, 2.673%, 4/25/51 (144A) | 2,292,218 |
| 5,264,850(d) | Citigroup Mortgage Loan Trust, Series 2018-RP3, Class B2, 3.25%, 3/25/61 (144A) | 3,714,728 |
| 8,513,843(d) | Citigroup Mortgage Loan Trust, Series 2021-INV2, Class B1W, 2.988%, 5/25/51 (144A) | 6,895,282 |
| 2,029,190(d) | Citigroup Mortgage Loan Trust, Inc., Series 2018-RP1, Class B2, 3.157%, 9/25/64 (144A) | 1,548,472 |
| 2,670,000(a) | Connecticut Avenue Securities Trust, Series 2020-SBT1, Class 1M2, 9.085% (SOFR30A + 376 bps), 2/25/40 (144A) | 2,827,683 |
| 4,940,000(a) | Connecticut Avenue Securities Trust, Series 2020-SBT1, Class 2M2, 9.085% (SOFR30A + 376 bps), 2/25/40 (144A) | 5,231,743 |
| 16,450,000(a) | Connecticut Avenue Securities Trust, Series 2022-R02, Class 2B1, 9.82% (SOFR30A + 450 bps), 1/25/42 (144A) | 17,288,486 |
| 445,407(d) | CSFB Mortgage-Backed Pass-Through Certificates, Series 2003-17, Class B1, 5.50%, 6/25/33 | 4 |
| 2,638,958(d) | CSMC, Series 2021-RPL2, Class M3, 3.632%, 1/25/60 (144A) | 1,830,872 |
| 8,240,000(a) | Eagle Re, Ltd., Series 2023-1, Class M1B, 9.27% (SOFR30A + 395 bps), 9/26/33 (144A) | 8,513,105 |
| 7,896,064(a)(f) | Federal Home Loan Mortgage Corp. REMICs, Series 4087, Class SB, 0.597% (SOFR30A + 592 bps), 7/15/42 | 736,734 |
The accompanying notes are an integral part of these financial statements.
18Pioneer Strategic Income Fund | Semiannual Report | 3/31/24
Principal
Amount
USD ($) | | | | | | Value |
| | Collateralized Mortgage
Obligations—(continued) | |
| 4,361,976(a)(f) | Federal Home Loan Mortgage Corp. REMICs, Series 4091, Class SH, 1.117% (SOFR30A + 644 bps), 8/15/42 | $ 520,461 |
| 2,085,135(f) | Federal Home Loan Mortgage Corp. REMICs, Series 4999, Class QI, 4.00%, 5/25/50 | 430,498 |
| 2,537,054(f) | Federal Home Loan Mortgage Corp. REMICs, Series 5067, Class GI, 4.00%, 12/25/50 | 518,337 |
| 62,921 | Federal National Mortgage Association REMICs, Series 2009-36, Class HX, 4.50%, 6/25/29 | 62,285 |
| 2,095,489(a)(f) | Federal National Mortgage Association REMICs, Series 2012-14, Class SP, 1.115% (SOFR30A + 644 bps), 8/25/41 | 151,883 |
| 1,745,472(a)(f) | Federal National Mortgage Association REMICs, Series 2018-43, Class SM, 0.765% (SOFR30A + 609 bps), 6/25/48 | 184,425 |
| 2,005,219(a)(f) | Federal National Mortgage Association REMICs, Series 2019-33, Class S, 0.615% (SOFR30A + 594 bps), 7/25/49 | 152,544 |
| 1,628,392(a)(f) | Federal National Mortgage Association REMICs, Series 2019-41, Class PS, 0.615% (SOFR30A + 594 bps), 8/25/49 | 174,946 |
| 1,619,071(a)(f) | Federal National Mortgage Association REMICs, Series 2019-41, Class SM, 0.615% (SOFR30A + 594 bps), 8/25/49 | 178,953 |
| 1,807,280(f) | Federal National Mortgage Association REMICs, Series 2020-83, Class EI, 4.00%, 11/25/50 | 373,542 |
| 211,573,160(d)(f) | Flagstar Mortgage Trust, Series 2021-4, Class AX1, 0.205%, 6/1/51 (144A) | 2,371,143 |
| 5,580,415(d) | Flagstar Mortgage Trust, Series 2021-7, Class B3, 2.928%, 8/25/51 (144A) | 4,266,239 |
| 3,585,000(a) | Freddie Mac STACR REMIC Trust, Series 2020-DNA5, Class B1, 10.12% (SOFR30A + 480 bps), 10/25/50 (144A) | 4,026,915 |
| 2,910,000(a) | Freddie Mac STACR REMIC Trust, Series 2020-DNA6, Class B1, 8.32% (SOFR30A + 300 bps), 12/25/50 (144A) | 3,060,057 |
| 2,630,000(a) | Freddie Mac STACR REMIC Trust, Series 2020-DNA6, Class B2, 10.97% (SOFR30A + 565 bps), 12/25/50 (144A) | 2,881,774 |
The accompanying notes are an integral part of these financial statements.
Pioneer Strategic Income Fund | Semiannual Report | 3/31/2419
Schedule of Investments | 3/31/24
(unaudited) (continued)
Principal
Amount
USD ($) | | | | | | Value |
| | Collateralized Mortgage
Obligations—(continued) | |
| 2,670,000(a) | Freddie Mac STACR REMIC Trust, Series 2020-HQA3, Class B2, 15.435% (SOFR30A + 1,011 bps), 7/25/50 (144A) | $ 3,541,510 |
| 2,678,286(a) | Freddie Mac STACR REMIC Trust, Series 2020-HQA4, Class B1, 10.685% (SOFR30A + 536 bps), 9/25/50 (144A) | 2,952,375 |
| 2,340,000(a) | Freddie Mac STACR REMIC Trust, Series 2021-HQA4, Class B1, 9.07% (SOFR30A + 375 bps), 12/25/41 (144A) | 2,409,985 |
| 9,485,000(a) | Freddie Mac STACR REMIC Trust, Series 2022-DNA2, Class B1, 10.07% (SOFR30A + 475 bps), 2/25/42 (144A) | 10,099,685 |
| 4,110,000(a) | Freddie Mac Structured Agency Credit Risk Debt Notes, Series 2020-HQA5, Class B1, 9.32% (SOFR30A + 400 bps), 11/25/50 (144A) | 4,617,527 |
| 6,250,000(a) | Freddie Mac Structured Agency Credit Risk Debt Notes, Series 2020-HQA5, Class B2, 12.72% (SOFR30A + 740 bps), 11/25/50 (144A) | 7,421,344 |
| 171,915 | Global Mortgage Securitization, Ltd., Series 2004-A, Class B2, 5.25%, 11/25/32 (144A) | 2 |
| 1,031,552 | Government National Mortgage Association, Series 2009-83, Class EB, 4.50%, 9/20/39 | 1,012,441 |
| 1,848,847(a)(f) | Government National Mortgage Association, Series 2019-103, Class SB, 0.607% (1 Month Term SOFR + 594 bps), 8/20/49 | 169,397 |
| 15,587,653(a)(f) | Government National Mortgage Association, Series 2019-117, Class SB, 0.000% (1 Month Term SOFR + 331 bps), 9/20/49 | 179,300 |
| 22,291,199(f) | Government National Mortgage Association, Series 2019-128, Class IB, 3.50%, 10/20/49 | 3,914,856 |
| 22,279,125(f) | Government National Mortgage Association, Series 2019-128, Class ID, 3.50%, 10/20/49 | 3,705,335 |
| 10,250,116(f) | Government National Mortgage Association, Series 2019-159, Class CI, 3.50%, 12/20/49 | 1,756,694 |
| 1,850,468(f) | Government National Mortgage Association, Series 2020-15, Class IM, 3.50%, 2/20/50 | 308,505 |
| 4,440,426(f) | Government National Mortgage Association, Series 2020-7, Class CI, 3.50%, 1/20/50 | 950,187 |
The accompanying notes are an integral part of these financial statements.
20Pioneer Strategic Income Fund | Semiannual Report | 3/31/24
Principal
Amount
USD ($) | | | | | | Value |
| | Collateralized Mortgage
Obligations—(continued) | |
| 13,165,694(a)(f) | Government National Mortgage Association, Series 2020-9, Class SA, 0.01% (1 Month Term SOFR + 324 bps), 1/20/50 | $ 215,280 |
| 2,416,629(d) | GS Mortgage-Backed Securities Corp. Trust, Series 2019-PJ3, Class B4, 3.948%, 3/25/50 (144A) | 2,038,181 |
| 1,490,000(d) | GS Mortgage-Backed Securities Corp. Trust, Series 2019-PJ3, Class B5, 3.948%, 3/25/50 (144A) | 953,063 |
| 4,900,000(d) | GS Mortgage-Backed Securities Corp. Trust, Series 2021-RPL1, Class B1, 2.75%, 12/25/60 (144A) | 3,857,977 |
| 9,640,000(d) | GS Mortgage-Backed Securities Corp. Trust, Series 2022-PJ4, Class A33, 3.00%, 9/25/52 (144A) | 6,463,543 |
| 2,482,575(d) | GS Mortgage-Backed Securities Trust, Series 2021-PJ9, Class B3, 2.93%, 2/26/52 (144A) | 1,956,160 |
| 2,818,975(d) | GS Mortgage-Backed Securities Trust, Series 2022-MM1, Class B3, 2.82%, 7/25/52 (144A) | 2,231,359 |
| 4,529,545(d) | GS Mortgage-Backed Securities Trust, Series 2022-PJ1, Class B3, 2.83%, 5/28/52 (144A) | 3,559,070 |
| 1,920,000(a) | Home Re, Ltd., Series 2023-1, Class M1B, 9.92% (SOFR30A + 460 bps), 10/25/33 (144A) | 1,992,823 |
| 73,367,606(d)(f) | Hundred Acre Wood Trust, Series 2021-INV1, Class AX1, 0.225%, 7/25/51 (144A) | 844,358 |
| 2,523,366(d) | Hundred Acre Wood Trust, Series 2021-INV1, Class B2, 3.225%, 7/25/51 (144A) | 2,100,325 |
| 4,350,000(d) | Imperial Fund Mortgage Trust, Series 2021-NQM2, Class B2, 4.298%, 9/25/56 (144A) | 3,225,221 |
| 931,000(d) | JP Morgan Mortgage Trust, Series 2018-7FRB, Class B5, 6.756%, 4/25/46 (144A) | 742,205 |
| 135,182,596(d)(f) | JP Morgan Mortgage Trust, Series 2021-10, Class AX1, 0.119%, 12/25/51 (144A) | 853,313 |
| 2,000,000(d) | JP Morgan Mortgage Trust, Series 2021-3, Class A5, 2.50%, 7/25/51 (144A) | 1,305,020 |
| 6,330,684(d) | JP Morgan Mortgage Trust, Series 2021-7, Class B3, 2.803%, 11/25/51 (144A) | 4,884,258 |
| 119,600,607(d)(f) | JP Morgan Mortgage Trust, Series 2021-8, Class AX1, 0.117%, 12/25/51 (144A) | 762,239 |
The accompanying notes are an integral part of these financial statements.
Pioneer Strategic Income Fund | Semiannual Report | 3/31/2421
Schedule of Investments | 3/31/24
(unaudited) (continued)
Principal
Amount
USD ($) | | | | | | Value |
| | Collateralized Mortgage
Obligations—(continued) | |
| 8,120,686(d) | JP Morgan Mortgage Trust, Series 2021-8, Class B3, 2.845%, 12/25/51 (144A) | $ 6,276,925 |
| 1,951,091(d) | JP Morgan Mortgage Trust, Series 2021-INV1, Class B3, 2.978%, 10/25/51 (144A) | 1,507,970 |
| 1,659,730(d) | JP Morgan Mortgage Trust, Series 2021-INV1, Class B4, 2.978%, 10/25/51 (144A) | 1,016,397 |
| 4,160,076(d) | JP Morgan Mortgage Trust, Series 2021-INV4, Class B3, 3.215%, 1/25/52 (144A) | 3,257,007 |
| 4,538,482(d) | JP Morgan Mortgage Trust, Series 2022-3, Class B3, 3.106%, 8/25/52 (144A) | 3,473,976 |
| 5,650,000(d) | JP Morgan Mortgage Trust, Series 2022-4, Class A5, 3.00%, 10/25/52 (144A) | 3,791,817 |
| 5,401,655(d) | JP Morgan Mortgage Trust, Series 2022-4, Class B3, 3.254%, 10/25/52 (144A) | 4,282,200 |
| 5,773,933(d) | JP Morgan Mortgage Trust, Series 2022-5, Class B3, 2.958%, 9/25/52 (144A) | 4,445,053 |
| 8,385,673(d) | JP Morgan Mortgage Trust, Series 2022-INV1, Class B3, 3.295%, 3/25/52 (144A) | 6,612,917 |
| 5,072,647(a) | JPMorgan Chase Bank N.A. - CHASE, Series 2020-CL1, Class M3, 8.794% (1 Month Term SOFR + 346 bps), 10/25/57 (144A) | 5,085,670 |
| 2,150,058(a) | JPMorgan Chase Bank N.A. - JPMWM, Series 2021-CL1, Class M3, 7.12% (SOFR30A + 180 bps), 3/25/51 (144A) | 2,100,560 |
| 1,907,797(a) | JPMorgan Chase Bank N.A. - JPMWM, Series 2021-CL1, Class M4, 8.07% (SOFR30A + 275 bps), 3/25/51 (144A) | 1,816,171 |
| 969,207 | La Hipotecaria El Salvadorian Mortgage Trust, Series 2016-1A, Class A, 3.358%, 1/15/46 (144A) | 882,584 |
| 1,844,458 | La Hipotecaria Mortgage Trust, Series 2019-2A, Class BBB, 4.75%, 9/29/46 (144A) | 1,696,901 |
| 226,910(a) | La Hipotecaria Panamanian Mortgage Trust, Series 2010-1GA, Class A, 3.00% (Panamanian Mortgage Reference Rate - 300 bps), 9/8/39 (144A) | 218,401 |
| 6,065,047 | La Hipotecaria Panamanian Mortgage Trust, Series 2021-1, Class GA, 4.35%, 7/13/52 (144A) | 5,350,263 |
| 3,901,661(d) | Mello Mortgage Capital Acceptance, Series 2021-MTG2, Class B2, 2.668%, 6/25/51 (144A) | 3,047,043 |
The accompanying notes are an integral part of these financial statements.
22Pioneer Strategic Income Fund | Semiannual Report | 3/31/24
Principal
Amount
USD ($) | | | | | | Value |
| | Collateralized Mortgage
Obligations—(continued) | |
| 7,915,709(d) | Mello Mortgage Capital Acceptance, Series 2022-INV2, Class B3, 3.529%, 4/25/52 (144A) | $ 6,241,151 |
| 4,209,966(d) | MFA Trust, Series 2021-AEI2, Class B3, 3.285%, 10/25/51 (144A) | 3,350,017 |
| 7,172,000(d) | MFA Trust, Series 2021-RPL1, Class M2, 2.855%, 7/25/60 (144A) | 5,700,238 |
| 2,931,486(d) | Mill City Mortgage Loan Trust, Series 2017-3, Class B2, 3.25%, 1/25/61 (144A) | 2,396,968 |
| 6,145,000(d) | Mill City Mortgage Loan Trust, Series 2019-GS1, Class M3, 3.25%, 7/25/59 (144A) | 5,142,148 |
| 1,305,468(d) | Morgan Stanley Residential Mortgage Loan Trust, Series 2021-1, Class B3, 2.947%, 3/25/51 (144A) | 1,042,501 |
| 7,865,799(a) | New Residential Mortgage Loan Trust, Series 2020-2A, Class B4A, 7.935% (1 Month Term SOFR + 261 bps), 10/25/46 (144A) | 7,597,998 |
| 13,903,950(d) | New Residential Mortgage Loan Trust, Series 2020-RPL1, Class B1, 3.874%, 11/25/59 (144A) | 10,911,449 |
| 3,500,000 | NYMT Loan Trust, Series 2022-CP1, Class M2, 3.514%, 7/25/61 (144A) | 2,849,461 |
| 1,190,862(a) | Oaktown Re V, Ltd., Series 2020-2A, Class M2, 10.685% (SOFR30A + 536 bps), 10/25/30 (144A) | 1,210,645 |
| 3,030,450(d) | Oceanview Mortgage Trust, Series 2021-1, Class B3A, 3.24%, 6/25/51 (144A) | 2,443,015 |
| 2,439,818(d) | Oceanview Mortgage Trust, Series 2021-3, Class B3, 2.712%, 6/25/51 (144A) | 1,452,185 |
| 1,848,223(d) | PRMI Securitization Trust, Series 2021-1, Class B2, 2.478%, 4/25/51 (144A) | 1,424,250 |
| 3,524,562(d) | PRMI Securitization Trust, Series 2021-1, Class B3, 2.478%, 4/25/51 (144A) | 2,677,816 |
| 2,757,896(d) | Provident Funding Mortgage Trust, Series 2021-1, Class B1, 2.383%, 4/25/51 (144A) | 2,171,305 |
| 2,676,142(d) | Provident Funding Mortgage Trust, Series 2021-2, Class B2, 2.352%, 4/25/51 (144A) | 2,055,169 |
| 2,733,843(d) | Provident Funding Mortgage Trust, Series 2021-INV1, Class B3, 2.782%, 8/25/51 (144A) | 2,166,945 |
The accompanying notes are an integral part of these financial statements.
Pioneer Strategic Income Fund | Semiannual Report | 3/31/2423
Schedule of Investments | 3/31/24
(unaudited) (continued)
Principal
Amount
USD ($) | | | | | | Value |
| | Collateralized Mortgage
Obligations—(continued) | |
| 2,265,337(d) | Provident Funding Mortgage Trust, Series 2021-J1, Class B2, 2.637%, 10/25/51 (144A) | $ 1,823,369 |
| 3,322,187(d) | Provident Funding Mortgage Trust, Series 2021-J1, Class B3, 2.637%, 10/25/51 (144A) | 2,639,965 |
| 1,460,000(a) | Radnor Re, Ltd., Series 2021-2, Class M2, 10.32% (SOFR30A + 500 bps), 11/25/31 (144A) | 1,525,970 |
| 1,805,776(d) | Rate Mortgage Trust, Series 2021-HB1, Class B3, 2.702%, 12/25/51 (144A) | 1,386,415 |
| 4,172,489(d) | Rate Mortgage Trust, Series 2021-J1, Class B2, 2.707%, 7/25/51 (144A) | 3,338,901 |
| 1,706,002(d) | Rate Mortgage Trust, Series 2021-J1, Class B3, 2.707%, 7/25/51 (144A) | 1,221,499 |
| 2,200,680(d) | Rate Mortgage Trust, Series 2021-J3, Class B3, 2.713%, 10/25/51 (144A) | 1,732,438 |
| 1,723,000(d) | Rate Mortgage Trust, Series 2021-J4, Class B4, 2.631%, 11/25/51 (144A) | 743,049 |
| 3,884,013(d) | Rate Mortgage Trust, Series 2022-J1, Class B3, 2.75%, 1/25/52 (144A) | 3,056,883 |
| 1,961,857(d) | RCKT Mortgage Trust, Series 2021-2, Class B3, 2.563%, 6/25/51 (144A) | 1,531,254 |
| 10,150,000(d) | RCKT Mortgage Trust, Series 2022-3, Class A17, 3.00%, 5/25/52 (144A) | 6,757,812 |
| 2,426,459(d) | RCKT Mortgage Trust, Series 2022-3, Class B3, 3.188%, 5/25/52 (144A) | 1,935,769 |
| 2,997,193(d) | Sequoia Mortgage Trust, Series 2021-1, Class B3, 2.659%, 3/25/51 (144A) | 2,369,038 |
| 1,490,936(d) | Sequoia Mortgage Trust, Series 2021-5, Class B4, 3.049%, 7/25/51 (144A) | 895,423 |
| 1,783,000(d) | Sequoia Mortgage Trust, Series 2021-9, Class B4, 2.86%, 1/25/52 (144A) | 914,154 |
| 4,100,000(d) | Sequoia Mortgage Trust, Series 2022-1, Class A7, 2.50%, 2/25/52 (144A) | 2,520,942 |
| 2,743,712(d) | Sequoia Mortgage Trust, Series 2022-1, Class B4, 2.947%, 2/25/52 (144A) | 1,435,035 |
| 4,330,000(a) | STACR Trust, Series 2018-HRP2, Class B1, 9.635% (SOFR30A + 431 bps), 2/25/47 (144A) | 4,804,246 |
| 5,000,000(d) | Towd Point Mortgage Trust, Series 2017-1, Class B3, 3.834%, 10/25/56 (144A) | 4,048,284 |
The accompanying notes are an integral part of these financial statements.
24Pioneer Strategic Income Fund | Semiannual Report | 3/31/24
Principal
Amount
USD ($) | | | | | | Value |
| | Collateralized Mortgage
Obligations—(continued) | |
| 6,374,998(d) | Towd Point Mortgage Trust, Series 2017-3, Class B3, 3.914%, 7/25/57 (144A) | $ 5,374,935 |
| 5,639,000(a) | Towd Point Mortgage Trust, Series 2019-HY1, Class B2, 7.594% (1 Month Term SOFR + 226 bps), 10/25/48 (144A) | 5,582,144 |
| 8,985,043(d) | Towd Point Mortgage Trust, Series 2021-R1, Class A1, 2.918%, 11/30/60 (144A) | 7,424,027 |
| 1,830,000(a) | Triangle Re, Ltd., Series 2021-1, Class B1, 9.944% (1 Month Term SOFR + 461 bps), 8/25/33 (144A) | 1,839,483 |
| 1,402,882(a) | Triangle Re, Ltd., Series 2021-1, Class M2, 9.344% (1 Month Term SOFR + 401 bps), 8/25/33 (144A) | 1,406,203 |
| 9,670,000(a) | Triangle Re, Ltd., Series 2023-1, Class M1A, 8.72% (SOFR30A + 340 bps), 11/25/33 (144A) | 9,869,660 |
| 800,000(d) | Visio Trust, Series 2019-2, Class B1, 3.91%, 11/25/54 (144A) | 607,009 |
| 2,250,000(d) | Wells Fargo Mortgage Backed Securities Trust, Series 2022-2, Class A5, 3.00%, 12/25/51 (144A) | 1,495,221 |
| 8,970,000(d) | Wells Fargo Mortgage Backed Securities Trust, Series 2022-2, Class A6, 2.50%, 12/25/51 (144A) | 5,470,937 |
| 8,270,277(d) | Wells Fargo Mortgage Backed Securities Trust, Series 2022-INV1, Class B3, 3.436%, 3/25/52 (144A) | 6,607,119 |
| | Total Collateralized Mortgage Obligations
(Cost $445,254,674) | $374,681,751 |
|
|
| | Commercial Mortgage-Backed
Securities—6.0% of Net Assets | |
| 6,320,000(a) | Alen Mortgage Trust, Series 2021-ACEN, Class E, 9.44% (1 Month Term SOFR + 411 bps), 4/15/34 (144A) | $ 2,953,869 |
| 3,600,000(a) | AREIT Trust, Series 2022-CRE6, Class D, 8.169% (SOFR30A + 285 bps), 1/20/37 (144A) | 3,372,075 |
| 4,858,590(e)(f) + | Bayview Commercial Asset Trust, Series 2007-2A, Class IO, 0.01%, 7/25/37 (144A) | — |
The accompanying notes are an integral part of these financial statements.
Pioneer Strategic Income Fund | Semiannual Report | 3/31/2425
Schedule of Investments | 3/31/24
(unaudited) (continued)
Principal
Amount
USD ($) | | | | | | Value |
| | Commercial Mortgage-Backed
Securities—(continued) | |
| 1,500,000(a) | BDS, Ltd., Series 2020-FL5, Class C, 7.491% (1 Month Term SOFR + 216 bps), 2/16/37 (144A) | $ 1,492,675 |
| 2,025,000(d) | Benchmark Mortgage Trust, Series 2020-IG3, Class B, 3.291%, 9/15/48 (144A) | 1,129,534 |
| 1,895,412(a) | BSREP Commercial Mortgage Trust, Series 2021-DC, Class G, 9.29% (1 Month Term SOFR + 396 bps), 8/15/38 (144A) | 1,164,452 |
| 9,000,000(a) | BX Trust, Series 2021-ARIA, Class E, 7.684% (1 Month Term SOFR + 236 bps), 10/15/36 (144A) | 8,814,375 |
| 4,335,000(a) | Capital Funding Mortgage Trust, Series 2021-19, Class B, 20.54% (1 Month Term SOFR + 1,521 bps), 10/27/24 (144A) | 4,312,720 |
| 1,500,000(a) | CGDB Commercial Mortgage Trust, Series 2019-MOB, Class F, 7.99% (1 Month Term SOFR + 266 bps), 11/15/36 (144A) | 1,361,250 |
| 2,470,000(a) | CLNY Trust, Series 2019-IKPR, Class E, 8.157% (1 Month Term SOFR + 284 bps), 11/15/38 (144A) | 2,182,768 |
| 130,457,654(d)(f) | COMM Mortgage Trust, Series 2014-CR19, Class XA, 0.787%, 8/10/47 | 178,466 |
| 7,650,000(d) | COMM Mortgage Trust, Series 2020-CBM, Class E, 3.633%, 2/10/37 (144A) | 7,242,482 |
| 3,912,000(d) | COMM Mortgage Trust, Series 2020-CBM, Class F, 3.633%, 2/10/37 (144A) | 3,654,454 |
| 3,750,000 | COMM Mortgage Trust, Series 2020-CX, Class A, 2.173%, 11/10/46 (144A) | 3,047,178 |
| 4,083,017(d) | CSAIL Commercial Mortgage Trust, Series 2015-C1, Class C, 4.249%, 4/15/50 | 3,537,393 |
| 2,680,000(d) | CSAIL Commercial Mortgage Trust, Series 2015-C4, Class D, 3.556%, 11/15/48 | 2,406,654 |
| 1,455,000(a) | Freddie Mac Multifamily Structured Credit Risk, Series 2021-MN1, Class B1, 13.07% (SOFR30A + 775 bps), 1/25/51 (144A) | 1,492,267 |
| 2,750,000(a) | Freddie Mac Multifamily Structured Credit Risk, Series 2021-MN1, Class M2, 9.07% (SOFR30A + 375 bps), 1/25/51 (144A) | 2,688,839 |
| 6,000,000(a) | Freddie Mac Multifamily Structured Credit Risk, Series 2021-MN3, Class M2, 9.32% (SOFR30A + 400 bps), 11/25/51 (144A) | 5,885,700 |
| 4,500,000(d) | FREMF Mortgage Trust, Series 2017-KW02, Class B, 3.749%, 12/25/26 (144A) | 4,184,825 |
The accompanying notes are an integral part of these financial statements.
26Pioneer Strategic Income Fund | Semiannual Report | 3/31/24
Principal
Amount
USD ($) | | | | | | Value |
| | Commercial Mortgage-Backed
Securities—(continued) | |
| 2,800,000(d) | FREMF Mortgage Trust, Series 2017-KW03, Class B, 4.068%, 7/25/27 (144A) | $ 2,587,099 |
| 2,300,000(d) | FREMF Mortgage Trust, Series 2018-K154, Class B, 4.024%, 11/25/32 (144A) | 1,956,243 |
| 1,875,000(d) | FREMF Mortgage Trust, Series 2018-K157, Class B, 4.30%, 8/25/33 (144A) | 1,624,180 |
| 3,534,000(d) | FREMF Mortgage Trust, Series 2018-KBX1, Class B, 3.607%, 1/25/26 (144A) | 3,121,696 |
| 6,364,000(d) | FREMF Mortgage Trust, Series 2018-KHG1, Class B, 3.823%, 12/25/27 (144A) | 5,749,238 |
| 1,417,812(a) | FREMF Mortgage Trust, Series 2018-KSW4, Class C, 10.434% (SOFR30A + 511 bps), 10/25/28 | 1,269,421 |
| 975,000(d) | FREMF Mortgage Trust, Series 2018-KW07, Class B, 4.083%, 10/25/31 (144A) | 826,449 |
| 5,363,753(d) | FREMF Mortgage Trust, Series 2019-KJ24, Class B, 7.60%, 10/25/27 (144A) | 4,931,904 |
| 8,500,000(a) | FREMF Mortgage Trust, Series 2019-KS12, Class C, 12.334% (SOFR30A + 701 bps), 8/25/29 | 8,134,906 |
| 927,969(a) | FREMF Mortgage Trust, Series 2020-KF74, Class C, 11.684% (SOFR30A + 636 bps), 1/25/27 (144A) | 839,653 |
| 1,379,318(a) | FREMF Mortgage Trust, Series 2020-KF83, Class C, 14.434% (SOFR30A + 911 bps), 7/25/30 (144A) | 1,292,586 |
| 5,000,000(g) | FREMF Mortgage Trust, Series 2021-K131, Class D, 0.000%, 9/25/54 (144A) | 2,462,916 |
| 81,412,906(f) | FREMF Mortgage Trust, Series 2021-K131, Class X2A, 0.10%, 9/25/54 (144A) | 448,162 |
| 18,374,996(f) | FREMF Mortgage Trust, Series 2021-K131, Class X2B, 0.10%, 9/25/54 (144A) | 90,098 |
| 10,000,000(g) | FREMF Mortgage Trust, Series 2021-KG05, Class C, 0.000%, 1/25/31 (144A) | 5,405,289 |
| 123,310,186(f) | FREMF Mortgage Trust, Series 2021-KG05, Class X2A, 0.10%, 1/25/31 (144A) | 608,166 |
| 10,000,000(f) | FREMF Mortgage Trust, Series 2021-KG05, Class X2B, 0.10%, 1/25/31 (144A) | 46,468 |
| 22,105,093(d)(f) | FRESB Mortgage Trust, Series 2020-SB79, Class X1, 1.082%, 7/25/40 | 813,700 |
| 6,000,000(a) | GS Mortgage Securities Corp. Trust, Series 2020-DUNE, Class E, 8.094% (1 Month Term SOFR + 276 bps), 12/15/36 (144A) | 5,760,663 |
The accompanying notes are an integral part of these financial statements.
Pioneer Strategic Income Fund | Semiannual Report | 3/31/2427
Schedule of Investments | 3/31/24
(unaudited) (continued)
Principal
Amount
USD ($) | | | | | | Value |
| | Commercial Mortgage-Backed
Securities—(continued) | |
| 2,200,000(a) | GS Mortgage Securities Corp. Trust, Series 2021-IP, Class E, 8.99% (1 Month Term SOFR + 366 bps), 10/15/36 (144A) | $ 2,163,775 |
| 750,000(a) | JP Morgan Chase Commercial Mortgage Securities Trust, Series 2019-MFP, Class E, 7.533% (1 Month Term SOFR + 221 bps), 7/15/36 (144A) | 724,252 |
| 11,650,000(d) | JP Morgan Chase Commercial Mortgage Securities Trust, Series 2020-LOOP, Class F, 3.861%, 12/5/38 (144A) | 1,830,122 |
| 5,600,000 | Key Commercial Mortgage Securities Trust, Series 2019-S2, Class A3, 3.469%, 6/15/52 (144A) | 5,138,307 |
| 1,250,000(d) | Morgan Stanley Bank of America Merrill Lynch Trust, Series 2015-C24, Class C, 4.323%, 5/15/48 | 1,126,761 |
| 3,530,000(d) | Morgan Stanley Bank of America Merrill Lynch Trust, Series 2015-C27, Class D, 3.237%, 12/15/47 (144A) | 2,800,000 |
| 2,000,000 | Morgan Stanley Bank of America Merrill Lynch Trust, Series 2017-C33, Class D, 3.356%, 5/15/50 (144A) | 1,575,455 |
| 3,350,000 | Morgan Stanley Capital I Trust, Series 2014-150E, Class AS, 4.012%, 9/9/32 (144A) | 2,816,380 |
| 1,550,000 | Morgan Stanley Capital I Trust, Series 2016-UBS9, Class D, 3.00%, 3/15/49 (144A) | 1,247,013 |
| 10,922,897(a) | Multifamily Connecticut Avenue Securities Trust, Series 2019-01, Class M10, 8.685% (SOFR30A + 336 bps), 10/25/49 (144A) | 10,748,901 |
| 1,030,000(d) | Natixis Commercial Mortgage Securities Trust, Series 2019-FAME, Class D, 4.398%, 8/15/36 (144A) | 615,424 |
| 3,190,000 | Palisades Center Trust, Series 2016-PLSD, Class A, 2.713%, 4/13/33 (144A) | 2,025,650 |
| 7,050,000(d) | RBS Commercial Funding, Inc. Trust, Series 2013-SMV, Class E, 3.584%, 3/11/31 (144A) | 5,171,099 |
| 5,600,000(a) | Ready Capital Mortgage Financing LLC, Series 2021-FL7, Class D, 8.394% (1 Month Term SOFR + 306 bps), 11/25/36 (144A) | 5,342,417 |
| 2,659,000(d) | Ready Capital Mortgage Trust, Series 2019-5, Class C, 5.054%, 2/25/52 (144A) | 2,514,111 |
The accompanying notes are an integral part of these financial statements.
28Pioneer Strategic Income Fund | Semiannual Report | 3/31/24
Principal
Amount
USD ($) | | | | | | Value |
| | Commercial Mortgage-Backed
Securities—(continued) | |
| 5,400,000(d) | Ready Capital Mortgage Trust, Series 2019-5, Class E, 5.303%, 2/25/52 (144A) | $ 4,412,156 |
| 2,443,000(d) | ReadyCap Commercial Mortgage Trust, Series 2019-6, Class C, 4.127%, 10/25/52 (144A) | 2,096,390 |
| 8,350,000 | SLG Office Trust, Series 2021-OVA, Class E, 2.851%, 7/15/41 (144A) | 6,339,726 |
| 8,000,000 | SLG Office Trust, Series 2021-OVA, Class F, 2.851%, 7/15/41 (144A) | 5,833,056 |
| 1,500,000(d) | Soho Trust, Series 2021-SOHO, Class A, 2.697%, 8/10/38 (144A) | 1,002,177 |
| 8,045,000(a) | Taubman Centers Commercial Mortgage Trust, Series 2022-DPM, Class B, 8.257% (1 Month Term SOFR + 293 bps), 5/15/37 (144A) | 8,095,281 |
| 7,000,000(d) | THPT Mortgage Trust, Series 2023-THL, Class B, 7.669%, 12/10/34 (144A) | 7,149,375 |
| 3,500,000(d) | THPT Mortgage Trust, Series 2023-THL, Class C, 8.534%, 12/10/34 (144A) | 3,585,884 |
| 67,584,000(d)(f) | UBS Commercial Mortgage Trust, Series 2018-C9, Class XB, 0.372%, 3/15/51 | 926,002 |
| 899,315(a) | XCALI Mortgage Trust, Series 2020-5, Class A, 8.696% (1 Month Term SOFR + 337 bps), 10/15/24 (144A) | 899,440 |
| | Total Commercial Mortgage-Backed Securities
(Cost $231,881,062) | $195,249,967 |
|
|
| | Convertible Corporate Bonds —
0.6% of Net Assets | |
| | Banks — 0.0%† | |
| IDR 15,039,758,000 | PT Bakrie & Brothers Tbk, 4/28/24 | $ 94,858 |
| | Total Banks | $94,858 |
|
|
| | Entertainment — 0.4% | |
| 12,093,000(g) | DraftKings Holdings, Inc., 3/15/28 | $ 10,430,212 |
| 1,892,000 | IMAX Corp., 0.50%, 4/1/26 | 1,757,290 |
| | Total Entertainment | $12,187,502 |
|
|
The accompanying notes are an integral part of these financial statements.
Pioneer Strategic Income Fund | Semiannual Report | 3/31/2429
Schedule of Investments | 3/31/24
(unaudited) (continued)
Principal
Amount
USD ($) | | | | | | Value |
| | Software — 0.2% | |
| 2,231,000 | Bentley Systems, Inc., 0.375%, 7/1/27 | $ 2,000,839 |
| 4,819,000 | Verint Systems, Inc., 0.25%, 4/15/26 | 4,517,812 |
| | Total Software | $6,518,651 |
|
|
| | Total Convertible Corporate Bonds
(Cost $21,718,901) | $18,801,011 |
|
|
| | Corporate Bonds — 36.0% of Net
Assets | |
| | Advertising — 0.0%† | |
| 1,545,000 | Outfront Media Capital LLC/Outfront Media Capital Corp., 7.375%, 2/15/31 (144A) | $ 1,618,270 |
| | Total Advertising | $1,618,270 |
|
|
| | Aerospace & Defense — 0.1% | |
| 1,800,000 | Bombardier, Inc., 7.50%, 2/1/29 (144A) | $ 1,853,521 |
| | Total Aerospace & Defense | $1,853,521 |
|
|
| | Agriculture — 1.2% | |
| 7,305,000 | Amaggi Luxembourg International S.a.r.l., 5.25%, 1/28/28 (144A) | $ 6,924,673 |
| 18,293,000 | BAT Capital Corp., 6.00%, 2/20/34 | 18,522,492 |
| 13,305,000 | Philip Morris International, Inc., 5.25%, 2/13/34 | 13,187,047 |
| | Total Agriculture | $38,634,212 |
|
|
| | Airlines — 1.0% | |
| 11,823,490(h) | ABRA Global Finance, 11.50% (5.50% PIK + 6.00% Cash), 3/2/28 (144A) | $ 10,939,480 |
| 1,409,950 | American Airlines 2021-1 Class B Pass Through Trust, 3.95%, 7/11/30 | 1,297,017 |
| 1,763,930(a) | Gol Finance S.A., 15.827% (1 Month Term SOFR + 1,050 bps), 1/29/25 (144A) | 1,893,859 |
| 11,390,000 | Grupo Aeromexico SAB de CV, 8.50%, 3/17/27 (144A) | 11,293,172 |
| 8,185,000 | VistaJet Malta Finance Plc/Vista Management Holding, Inc., 6.375%, 2/1/30 (144A) | 6,033,354 |
| | Total Airlines | $31,456,882 |
|
|
| | Auto Manufacturers — 1.7% | |
| 4,430,000 | Ford Motor Co., 6.10%, 8/19/32 | $ 4,488,986 |
| 7,600,000 | Ford Motor Credit Co. LLC, 3.625%, 6/17/31 | 6,571,401 |
| 3,700,000 | Ford Motor Credit Co. LLC, 7.35%, 3/6/30 | 3,944,783 |
The accompanying notes are an integral part of these financial statements.
30Pioneer Strategic Income Fund | Semiannual Report | 3/31/24
Principal
Amount
USD ($) | | | | | | Value |
| | Auto Manufacturers — (continued) | |
| 2,810,000 | General Motors Financial Co., Inc., 5.75%, 2/8/31 | $ 2,840,463 |
| 13,385,000 | General Motors Financial Co., Inc., 6.10%, 1/7/34 | 13,743,622 |
| 18,000,000 | General Motors Financial Co., Inc., 6.40%, 1/9/33 | 18,862,766 |
| 3,400,000 | JB Poindexter & Co., Inc., 8.75%, 12/15/31 (144A) | 3,514,346 |
| | Total Auto Manufacturers | $53,966,367 |
|
|
| | Auto Parts & Equipment — 0.1% | |
| 2,335,000 | ZF North America Capital, Inc., 7.125%, 4/14/30 (144A) | $ 2,460,629 |
| | Total Auto Parts & Equipment | $2,460,629 |
|
|
| | Banks — 11.8% | |
| 20,800,000(d) | ABN AMRO Bank NV, 3.324% (5 Year CMT Index + 190 bps), 3/13/37 (144A) | $ 16,911,697 |
| 5,180,000 | Access Bank Plc, 6.125%, 9/21/26 (144A) | 4,798,234 |
| 9,295,000(d) | Australia & New Zealand Banking Group, Ltd., 5.731% (5 Year CMT Index + 162 bps), 9/18/34 (144A) | 9,248,434 |
| 14,600,000 | Banco Bilbao Vizcaya Argentaria S.A., 5.381%, 3/13/29 | 14,729,687 |
| 3,460,000(d)(i) | Banco Mercantil del Norte S.A., 8.375% (10 Year US Treasury Yield Curve Rate T Note Constant Maturity + 776 bps) (144A) | 3,540,808 |
| 8,400,000(d) | Banco Santander S.A., 3.225% (1 Year CMT Index + 160 bps), 11/22/32 | 6,978,858 |
| 5,000,000 | Banco Santander S.A., 6.921%, 8/8/33 | 5,232,351 |
| 6,400,000 | Banco Santander S.A., 6.938%, 11/7/33 | 7,069,065 |
| 6,870,000(d) | Bank of New York Mellon Corp., 4.975% (SOFR + 109 bps), 3/14/30 | 6,875,912 |
| 8,258,000(d) | Bank of Nova Scotia, 4.588% (5 Year CMT Index + 205 bps), 5/4/37 | 7,485,798 |
| 14,170,000(d) | Barclays Plc, 5.746% (1 Year CMT Index + 300 bps), 8/9/33 | 14,230,327 |
| 3,915,000(d) | Barclays Plc, 6.224% (SOFR + 298 bps), 5/9/34 | 4,037,922 |
| 5,400,000(d) | Barclays Plc, 7.437% (1 Year CMT Index + 350 bps), 11/2/33 | 5,998,087 |
| 5,608,000(d)(i) | Barclays Plc, 8.00% (5 Year CMT Index + 543 bps) | 5,596,442 |
The accompanying notes are an integral part of these financial statements.
Pioneer Strategic Income Fund | Semiannual Report | 3/31/2431
Schedule of Investments | 3/31/24
(unaudited) (continued)
Principal
Amount
USD ($) | | | | | | Value |
| | Banks — (continued) | |
| 5,200,000(d) | BNP Paribas S.A., 5.497% (SOFR + 159 bps), 5/20/30 (144A) | $ 5,211,366 |
| 14,450,000(d) | BPCE S.A., 3.116% (SOFR + 173 bps), 10/19/32 (144A) | 11,841,650 |
| 7,445,000(d) | BPCE S.A., 3.648% (5 Year CMT Index + 190 bps), 1/14/37 (144A) | 6,225,316 |
| 2,910,000(d) | CaixaBank S.A., 6.037% (SOFR + 226 bps), 6/15/35 (144A) | 2,935,913 |
| 2,640,000(d) | Citizens Financial Group, Inc., 5.841% (SOFR + 201 bps), 1/23/30 | 2,636,210 |
| KZT 1,923,750,000 | Development Bank of Kazakhstan JSC, 10.75%, 2/12/25 | 4,163,257 |
| KZT 1,210,000,000 | Development Bank of Kazakhstan JSC, 10.95%, 5/6/26 | 2,470,805 |
| 1,520,000 | Freedom Mortgage Corp., 6.625%, 1/15/27 (144A) | 1,474,822 |
| 890,000 | Freedom Mortgage Corp., 12.25%, 10/1/30 (144A) | 978,808 |
| 1,600,000(d) | ING Groep NV, 4.252% (SOFR + 207 bps), 3/28/33 | 1,482,181 |
| 3,450,000(d) | ING Groep NV, 5.335% (SOFR + 144 bps), 3/19/30 | 3,441,570 |
| 19,337,000(d)(i) | ING Groep NV, 4.25% (5 Year CMT Index + 286 bps) | 14,670,748 |
| 1,245,000(d) | Intesa Sanpaolo S.p.A., 4.198% (1 Year CMT Index + 260 bps), 6/1/32 (144A) | 1,040,876 |
| 5,760,000(d) | Intesa Sanpaolo S.p.A., 7.778% (1 Year CMT Index + 390 bps), 6/20/54 (144A) | 6,142,655 |
| 8,015,000 | Intesa Sanpaolo S.p.A., 7.80%, 11/28/53 (144A) | 9,093,485 |
| 11,104,000(d) | Intesa Sanpaolo S.p.A., 8.248% (1 Year CMT Index + 440 bps), 11/21/33 (144A) | 12,394,301 |
| 9,670,000(d) | KeyCorp, 6.401% (SOFR + 242 bps), 3/6/35 | 9,875,057 |
| 10,350,000(d) | Lloyds Banking Group Plc, 4.976% (1 Year CMT Index + 230 bps), 8/11/33 | 9,967,601 |
| 8,231,000(d) | Lloyds Banking Group Plc, 7.953% (1 Year CMT Index + 375 bps), 11/15/33 | 9,267,157 |
| 5,105,000(d)(i) | Lloyds Banking Group Plc, 8.00% (5 Year CMT Index + 391 bps) | 5,140,051 |
| 11,185,000(d) | Macquarie Group, Ltd., 2.871% (SOFR + 153 bps), 1/14/33 (144A) | 9,302,768 |
| 4,180,000(d) | Morgan Stanley, 5.173% (SOFR + 145 bps), 1/16/30 | 4,183,540 |
The accompanying notes are an integral part of these financial statements.
32Pioneer Strategic Income Fund | Semiannual Report | 3/31/24
Principal
Amount
USD ($) | | | | | | Value |
| | Banks — (continued) | |
| 11,355,000(d) | Morgan Stanley, 5.297% (SOFR + 262 bps), 4/20/37 | $ 10,893,976 |
| 7,605,000(d) | Morgan Stanley, 5.942% (5 Year CMT Index + 180 bps), 2/7/39 | 7,559,127 |
| 1,930,000(d) | Morgan Stanley, 5.948% (5 Year CMT Index + 243 bps), 1/19/38 | 1,933,928 |
| 6,765,000(d) | NatWest Group Plc, 6.475% (5 Year CMT Index + 220 bps), 6/1/34 | 6,876,540 |
| 16,049,000(d)(i) | Nordea Bank Abp, 3.75% (5 Year CMT Index + 260 bps) (144A) | 13,219,833 |
| 6,520,000(d) | PNC Financial Services Group, Inc., 6.875% (SOFR + 228 bps), 10/20/34 | 7,139,593 |
| 4,840,000(d) | Societe Generale S.A., 4.027% (1 Year CMT Index + 190 bps), 1/21/43 (144A) | 3,439,099 |
| 5,010,000(d)(i)(j) | Sovcombank Via SovCom Capital DAC, 7.60% (5 Year CMT Index + 636 bps) (144A) | 180,986 |
| 4,452,000(d) | Standard Chartered Plc, 3.603% (1 Year CMT Index + 190 bps), 1/12/33 (144A) | 3,763,463 |
| 3,000,000(d) | Standard Chartered Plc, 6.097% (1 Year CMT Index + 210 bps), 1/11/35 (144A) | 3,089,370 |
| 7,507,000(d) | Standard Chartered Plc, 6.296% (1 Year CMT Index + 258 bps), 7/6/34 (144A) | 7,856,781 |
| 5,565,000(d) | Truist Financial Corp., 5.435% (SOFR + 162 bps), 1/24/30 | 5,558,509 |
| 5,985,000(d) | Truist Financial Corp., 7.161% (SOFR + 245 bps), 10/30/29 | 6,382,411 |
| 9,276,000(d) | UBS Group AG, 4.988% (1 Year CMT Index + 240 bps), 8/5/33 (144A) | 8,914,786 |
| 2,780,000(d) | UBS Group AG, 6.301% (1 Year CMT Index + 200 bps), 9/22/34 (144A) | 2,910,001 |
| 5,090,000(d)(i) | UBS Group AG, 9.25% (5 Year CMT Index + 476 bps) (144A) | 5,744,253 |
| 23,889,000(d) | UniCredit S.p.A., 5.459% (5 Year CMT Index + 475 bps), 6/30/35 (144A) | 22,433,055 |
| 9,395,000(d) | UniCredit S.p.A., 7.296% (5 Year USD Swap Rate + 491 bps), 4/2/34 (144A) | 9,655,559 |
| 7,250,000(d) | US Bancorp, 5.384% (SOFR + 156 bps), 1/23/30 | 7,282,025 |
| 3,595,000(d)(i)(k) | Yapi ve Kredi Bankasi AS, 9.743% (5 Year CMT Index + 550 bps) (144A) | 3,593,167 |
| | Total Banks | $385,100,221 |
|
|
The accompanying notes are an integral part of these financial statements.
Pioneer Strategic Income Fund | Semiannual Report | 3/31/2433
Schedule of Investments | 3/31/24
(unaudited) (continued)
Principal
Amount
USD ($) | | | | | | Value |
| | Biotechnology — 0.1% | |
| EUR 2,405,000 | Cidron Aida Finco S.a.r.l., 5.00%, 4/1/28 (144A) | $ 2,513,552 |
| | Total Biotechnology | $2,513,552 |
|
|
| | Building Materials — 0.2% | |
| 5,318,000 | AmeriTex HoldCo Intermediate LLC, 10.25%, 10/15/28 (144A) | $ 5,709,703 |
| 2,340,000 | Miter Brands Acquisition Holdco, Inc./MIWD Borrower LLC, 6.75%, 4/1/32 (144A) | 2,347,998 |
| | Total Building Materials | $8,057,701 |
|
|
| | Chemicals — 0.4% | |
| 10,765,000 | Rain Carbon, Inc., 12.25%, 9/1/29 (144A) | $ 11,166,718 |
| 5,055,000 | Trinseo Materials Operating SCA/Trinseo Materials Finance, Inc., 5.125%, 4/1/29 (144A) | 1,465,950 |
| | Total Chemicals | $12,632,668 |
|
|
| | Commercial Services — 0.9% | |
| EUR 2,470,000 | Allied Universal Holdco LLC/Allied Universal Finance Corp./Atlas Luxco 4 S.a.r.l., 3.625%, 6/1/28 (144A) | $ 2,465,169 |
| 1,670,000 | Allied Universal Holdco LLC/Allied Universal Finance Corp./Atlas Luxco 4 S.a.r.l., 4.625%, 6/1/28 (144A) | 1,524,995 |
| 1,025,000 | Allied Universal Holdco LLC/Allied Universal Finance Corp./Atlas Luxco 4 S.a.r.l., 4.625%, 6/1/28 (144A) | 931,691 |
| 5,400,000 | Ashtead Capital, Inc., 5.50%, 8/11/32 (144A) | 5,279,332 |
| 1,920,000 | Ashtead Capital, Inc., 5.95%, 10/15/33 (144A) | 1,941,445 |
| 1,665,000 | Champions Financing, Inc., 8.75%, 2/15/29 (144A) | 1,744,332 |
| 6,170,000 | Element Fleet Management Corp., 5.643%, 3/13/27 (144A) | 6,189,126 |
| 5,375,000 | Garda World Security Corp., 4.625%, 2/15/27 (144A) | 5,150,286 |
| 3,830,000 | Garda World Security Corp., 6.00%, 6/1/29 (144A) | 3,428,019 |
| 437,000 | Garda World Security Corp., 9.50%, 11/1/27 (144A) | 438,051 |
| | Total Commercial Services | $29,092,446 |
|
|
The accompanying notes are an integral part of these financial statements.
34Pioneer Strategic Income Fund | Semiannual Report | 3/31/24
Principal
Amount
USD ($) | | | | | | Value |
| | Diversified Financial Services — 3.7% | |
| 8,250,000 | AerCap Ireland Capital DAC/AerCap Global Aviation Trust, 3.30%, 1/30/32 | $ 7,075,664 |
| 1,266,000 | Ally Financial, Inc., 6.70%, 2/14/33 | 1,279,040 |
| 4,351,000(d) | Ally Financial, Inc., 6.848% (SOFR + 282 bps), 1/3/30 | 4,477,898 |
| 6,750,000(d) | Ally Financial, Inc., 6.992% (SOFR + 326 bps), 6/13/29 | 6,997,829 |
| 7,924,000 | Ally Financial, Inc., 8.00%, 11/1/31 | 8,826,481 |
| 11,445,000 | Avolon Holdings Funding, Ltd., 6.375%, 5/4/28 (144A) | 11,676,082 |
| 6,950,000(d) | Capital One Financial Corp., 2.359% (SOFR + 134 bps), 7/29/32 | 5,355,624 |
| 5,911,000(d) | Capital One Financial Corp., 5.817% (SOFR + 260 bps), 2/1/34 | 5,902,004 |
| 3,010,000(d) | Capital One Financial Corp., 6.051% (SOFR + 226 bps), 2/1/35 | 3,064,503 |
| 14,860,000(d) | Capital One Financial Corp., 6.377% (SOFR + 286 bps), 6/8/34 | 15,432,318 |
| 5,070,000(d) | Charles Schwab Corp., 5.853% (SOFR + 250 bps), 5/19/34 | 5,191,921 |
| 6,660,000(j) | Credito Real SAB de CV SOFOM ER, 8.00%, 1/21/28 (144A) | 889,110 |
| 790,000 | Freedom Mortgage Holdings LLC, 9.25%, 2/1/29 (144A) | 808,523 |
| 15,366,540(h) | Global Aircraft Leasing Co., Ltd., 6.50% (7.25% PIK or 6.50% Cash), 9/15/24 (144A) | 14,615,554 |
| 5,775,000 | OneMain Finance Corp., 4.00%, 9/15/30 | 4,942,511 |
| 2,285,000 | OneMain Finance Corp., 7.875%, 3/15/30 | 2,357,140 |
| 3,830,000 | OneMain Finance Corp., 9.00%, 1/15/29 | 4,064,059 |
| 1,130,000 | PennyMac Financial Services, Inc., 7.875%, 12/15/29 (144A) | 1,161,126 |
| EUR 3,215,000 | Sherwood Financing Plc, 4.50%, 11/15/26 | 3,188,837 |
| GBP 5,170,000 | Sherwood Financing Plc, 6.00%, 11/15/26 (144A) | 5,792,001 |
| 8,705,000 | United Wholesale Mortgage LLC, 5.50%, 4/15/29 (144A) | 8,233,179 |
| | Total Diversified Financial Services | $121,331,404 |
|
|
| | Electric — 0.7% | |
| 7,670,000(d) | Algonquin Power & Utilities Corp., 4.75% (5 Year CMT Index + 325 bps), 1/18/82 | $ 6,761,534 |
| 1,390,000(e) | Algonquin Power & Utilities Corp., 5.365%, 6/15/26 | 1,382,475 |
The accompanying notes are an integral part of these financial statements.
Pioneer Strategic Income Fund | Semiannual Report | 3/31/2435
Schedule of Investments | 3/31/24
(unaudited) (continued)
Principal
Amount
USD ($) | | | | | | Value |
| | Electric — (continued) | |
| EUR 1,635,000 | ContourGlobal Power Holdings S.A., 3.125%, 1/1/28 (144A) | $ 1,636,477 |
| EUR 3,240,000 | ContourGlobal Power Holdings SA, 2.75%, 1/1/26 (144A) | 3,335,556 |
| 9,225,000(j) | Light Servicos de Eletricidade SA/Light Energia SA, 4.375%, 6/18/26 (144A) | 4,404,937 |
| 4,075,000 | Vistra Operations Co. LLC, 6.95%, 10/15/33 (144A) | 4,349,500 |
| | Total Electric | $21,870,479 |
|
|
| | Electrical Components & Equipments —
0.6% | |
| EUR 7,865,000 | Belden, Inc., 3.375%, 7/15/27 (144A) | $ 8,202,328 |
| EUR 4,585,000 | Belden, Inc., 3.375%, 7/15/31 (144A) | 4,552,902 |
| EUR 6,020,000 | Energizer Gamma Acquisition BV, 3.50%, 6/30/29 (144A) | 5,766,998 |
| | Total Electrical Components & Equipments | $18,522,228 |
|
|
| | Energy-Alternate Sources — 0.0%† | |
| 563,617 | Alta Wind Holdings LLC, 7.00%, 6/30/35 (144A) | $ 573,586 |
| | Total Energy-Alternate Sources | $573,586 |
|
|
| | Engineering & Construction — 0.1% | |
| 1,615,000 | IHS Holding, Ltd., 5.625%, 11/29/26 (144A) | $ 1,498,365 |
| 1,425,000 | IHS Holding, Ltd., 6.25%, 11/29/28 (144A) | 1,245,450 |
| | Total Engineering & Construction | $2,743,815 |
|
|
| | Entertainment — 0.6% | |
| EUR 2,115,000 | Allwyn Entertainment Financing UK Plc, 7.25%, 4/30/30 (144A) | $ 2,395,856 |
| 905,000 | Allwyn Entertainment Financing UK Plc, 7.875%, 4/30/29 (144A) | 927,435 |
| 11,100,000 | Resorts World Las Vegas LLC/RWLV Capital, Inc., 4.625%, 4/16/29 (144A) | 10,131,875 |
| 5,300,000 | Resorts World Las Vegas LLC/RWLV Capital, Inc., 4.625%, 4/6/31 (144A) | 4,637,058 |
| 2,910,000 | Scientific Games Holdings LP/Scientific Games US FinCo, Inc., 6.625%, 3/1/30 (144A) | 2,813,229 |
| | Total Entertainment | $20,905,453 |
|
|
| | Food — 0.9% | |
| 1,458,000 | JBS USA LUX S.A./JBS USA Food Co./JBS USA Finance, Inc., 3.00%, 5/15/32 | $ 1,189,088 |
The accompanying notes are an integral part of these financial statements.
36Pioneer Strategic Income Fund | Semiannual Report | 3/31/24
Principal
Amount
USD ($) | | | | | | Value |
| | Food — (continued) | |
| 11,860,000 | JBS USA LUX S.A./JBS USA Food Co./JBS USA Finance, Inc., 5.75%, 4/1/33 | $ 11,684,139 |
| 4,610,000 | JBS USA LUX S.A./JBS USA Food Co./JBS USA Finance, Inc., 6.50%, 12/1/52 | 4,555,150 |
| 14,425,000 | Minerva Luxembourg S.A., 4.375%, 3/18/31 (144A) | 12,059,949 |
| | Total Food | $29,488,326 |
|
|
| | Forest Products & Paper — 0.0%† | |
| EUR 23,000 | Ahlstrom Holding 3 Oy, 3.625%, 2/4/28 (144A) | $ 23,263 |
| | Total Forest Products & Paper | $23,263 |
|
|
| | Gas — 0.4% | |
| 13,550,000 | KeySpan Gas East Corp., 5.994%, 3/6/33 (144A) | $ 13,731,954 |
| | Total Gas | $13,731,954 |
|
|
| | Hand & Machine Tools — 0.2% | |
| 5,410,000 | Regal Rexnord Corp., 6.30%, 2/15/30 (144A) | $ 5,538,260 |
| | Total Hand & Machine Tools | $5,538,260 |
|
|
| | Healthcare-Services — 0.3% | |
| 7,170,800 | Auna SAA, 10.00%, 12/15/29 (144A) | $ 7,442,796 |
| EUR 3,860,000 | CAB SELAS, 3.375%, 2/1/28 (144A) | 3,764,274 |
| | Total Healthcare-Services | $11,207,070 |
|
|
| | Insurance — 1.1% | |
| 4,880,000(d) | Farmers Exchange Capital III, 5.454% (3 Month USD LIBOR + 345 bps), 10/15/54 (144A) | $ 4,024,554 |
| 13,080,000(d) | Farmers Insurance Exchange, 4.747% (3 Month USD LIBOR + 323 bps), 11/1/57 (144A) | 9,678,029 |
| EUR 2,650,000(d) | Liberty Mutual Group, Inc., 3.625% (5 Year EUR Swap + 370 bps), 5/23/59 (144A) | 2,846,087 |
| 16,165,000 | Liberty Mutual Insurance Co., 7.697%, 10/15/97 (144A) | 18,339,134 |
| | Total Insurance | $34,887,804 |
|
|
| | Internet — 0.1% | |
| EUR 3,257,000 | United Group BV, 5.25%, 2/1/30 (144A) | $ 3,382,819 |
| | Total Internet | $3,382,819 |
|
|
The accompanying notes are an integral part of these financial statements.
Pioneer Strategic Income Fund | Semiannual Report | 3/31/2437
Schedule of Investments | 3/31/24
(unaudited) (continued)
Principal
Amount
USD ($) | | | | | | Value |
| | Iron & Steel — 0.6% | |
| 9,595,000 | Cleveland-Cliffs, Inc., 7.00%, 3/15/32 (144A) | $ 9,721,657 |
| 2,675,000 | Metinvest BV, 7.65%, 10/1/27 (144A) | 1,907,990 |
| 7,775,000 | TMS International Corp., 6.25%, 4/15/29 (144A) | 7,096,557 |
| | Total Iron & Steel | $18,726,204 |
|
|
| | Leisure Time — 0.1% | |
| 3,255,000 | NCL Corp., Ltd., 8.125%, 1/15/29 (144A) | $ 3,444,392 |
| 1,130,000 | NCL Finance, Ltd., 6.125%, 3/15/28 (144A) | 1,115,894 |
| 300,000 | Viking Ocean Cruises Ship VII, Ltd., 5.625%, 2/15/29 (144A) | 291,954 |
| | Total Leisure Time | $4,852,240 |
|
|
| | Lodging — 0.2% | |
| 3,125,000 | Hilton Grand Vacations Borrower Escrow LLC/Hilton Grand Vacations Borrower Esc, 5.00%, 6/1/29 (144A) | $ 2,914,380 |
| 3,360,000 | Hilton Grand Vacations Borrower Escrow LLC/Hilton Grand Vacations Borrower Esc, 6.625%, 1/15/32 (144A) | 3,373,564 |
| | Total Lodging | $6,287,944 |
|
|
| | Machinery-Diversified — 0.0%† | |
| 1,325,000(k) | Esab Corp., 6.25%, 4/15/29 (144A) | $ 1,331,205 |
| | Total Machinery-Diversified | $1,331,205 |
|
|
| | Media — 0.5% | |
| 3,910,000 | CCO Holdings LLC/CCO Holdings Capital Corp., 4.50%, 6/1/33 (144A) | $ 3,054,184 |
| 6,000,000 | CCO Holdings LLC/CCO Holdings Capital Corp., 4.75%, 3/1/30 (144A) | 5,151,844 |
| 1,785,000 | CCO Holdings LLC/CCO Holdings Capital Corp., 7.375%, 3/1/31 (144A) | 1,750,519 |
| 6,200,000 | CSC Holdings LLC, 4.625%, 12/1/30 (144A) | 3,148,448 |
| 2,305,000 | CSC Holdings LLC, 5.00%, 11/15/31 (144A) | 1,165,253 |
| 4,205,000 | VZ Secured Financing BV, 5.00%, 1/15/32 (144A) | 3,610,427 |
| | Total Media | $17,880,675 |
|
|
| | Mining — 1.2% | |
| 4,776,000 | AngloGold Ashanti Holdings Plc, 3.75%, 10/1/30 | $ 4,173,544 |
| 11,678,000 | Coeur Mining, Inc., 5.125%, 2/15/29 (144A) | 11,033,225 |
The accompanying notes are an integral part of these financial statements.
38Pioneer Strategic Income Fund | Semiannual Report | 3/31/24
Principal
Amount
USD ($) | | | | | | Value |
| | Mining — (continued) | |
| 10,725,000 | First Quantum Minerals, Ltd., 8.625%, 6/1/31 (144A) | $ 10,425,563 |
| 2,200,000 | First Quantum Minerals, Ltd., 9.375%, 3/1/29 (144A) | 2,279,013 |
| 11,990,000 | IAMGOLD Corp., 5.75%, 10/15/28 (144A) | 11,001,758 |
| | Total Mining | $38,913,103 |
|
|
| | Multi-National — 0.4% | |
| 8,430,000 | Banque Ouest Africaine de Developpement, 4.70%, 10/22/31 (144A) | $ 7,249,463 |
| INR 512,000,000 | European Bank For Reconstruction & Development, 6.25%, 4/11/28 | 5,975,761 |
| | Total Multi-National | $13,225,224 |
|
|
| | Oil & Gas — 2.3% | |
| 3,585,000 | 3R Lux SARL, 9.75%, 2/5/31 (144A) | $ 3,752,247 |
| 14,475,000 | Aker BP ASA, 6.00%, 6/13/33 (144A) | 14,946,577 |
| 3,170,000(k) | Baytex Energy Corp., 7.375%, 3/15/32 (144A) | 3,202,362 |
| 5,785,000 | Baytex Energy Corp., 8.50%, 4/30/30 (144A) | 6,040,629 |
| 2,235,000 | CITGO Petroleum Corp., 8.375%, 1/15/29 (144A) | 2,348,183 |
| 7,175,000 | Harbour Energy Plc, 5.50%, 10/15/26 (144A) | 7,004,483 |
| 7,663,057 | MC Brazil Downstream Trading S.a.r.l, 7.25%, 6/30/31 (144A) | 6,937,536 |
| 4,435,000 | Petroleos Mexicanos, 6.70%, 2/16/32 | 3,688,335 |
| 2,705,000 | Seadrill Finance, Ltd., 8.375%, 8/1/30 (144A) | 2,838,056 |
| 2,902,500 | Transocean, Inc., 8.75%, 2/15/30 (144A) | 3,026,367 |
| 5,635,000 | Tullow Oil Plc, 10.25%, 5/15/26 (144A) | 5,358,454 |
| 5,050,000 | Vermilion Energy, Inc., 6.875%, 5/1/30 (144A) | 4,930,812 |
| 12,895,000 | YPF S.A., 6.95%, 7/21/27 (144A) | 11,646,360 |
| | Total Oil & Gas | $75,720,401 |
|
|
| | Oil & Gas Services — 0.3% | |
| 5,595,000 | Enerflex, Ltd., 9.00%, 10/15/27 (144A) | $ 5,748,685 |
| 3,000,000 | USA Compression Partners LP/USA Compression Finance Corp., 7.125%, 3/15/29 (144A) | 3,037,367 |
| | Total Oil & Gas Services | $8,786,052 |
|
|
The accompanying notes are an integral part of these financial statements.
Pioneer Strategic Income Fund | Semiannual Report | 3/31/2439
Schedule of Investments | 3/31/24
(unaudited) (continued)
Principal
Amount
USD ($) | | | | | | Value |
| | Pharmaceuticals — 0.5% | |
| 2,424,000 | Par Pharmaceutical, Inc., 7.50%, 4/1/27 (144A) | $ 1,589,064 |
| EUR 1,625,000 | Teva Pharmaceutical Finance Netherlands II BV, 3.75%, 5/9/27 | 1,696,495 |
| EUR 10,400,000 | Teva Pharmaceutical Finance Netherlands II BV, 4.375%, 5/9/30 | 10,782,436 |
| 1,478,000 | Teva Pharmaceutical Finance Netherlands III BV, 4.75%, 5/9/27 | 1,430,815 |
| 1,328,000 | Teva Pharmaceutical Finance Netherlands III BV, 5.125%, 5/9/29 | 1,276,183 |
| 7,025,000 + | Tricida, Inc., 5/15/27 | — |
| | Total Pharmaceuticals | $16,774,993 |
|
|
| | Pipelines — 1.0% | |
| 6,338,000(d) | Enbridge, Inc., 8.50% (5 Year CMT Index + 443 bps), 1/15/84 | $ 6,886,459 |
| 1,694,000(d)(i) | Energy Transfer LP, 6.625% (3 Month USD LIBOR + 416 bps) | 1,582,030 |
| 15,145,000 | EnLink Midstream Partners LP, 5.45%, 6/1/47 | 13,180,392 |
| 3,862,000 | EnLink Midstream Partners LP, 5.60%, 4/1/44 | 3,438,528 |
| 655,000 | Venture Global LNG, Inc., 8.125%, 6/1/28 (144A) | 668,222 |
| 5,145,000 | Venture Global LNG, Inc., 8.375%, 6/1/31 (144A) | 5,305,879 |
| 1,540,000 | Venture Global LNG, Inc., 9.50%, 2/1/29 (144A) | 1,659,909 |
| | Total Pipelines | $32,721,419 |
|
|
| | REITs — 0.6% | |
| 1,770,000 | Essex Portfolio LP, 5.50%, 4/1/34 | $ 1,771,960 |
| 640,000 | Highwoods Realty LP, 2.60%, 2/1/31 | 505,741 |
| 610,000 | Highwoods Realty LP, 3.05%, 2/15/30 | 514,365 |
| 16,561,000 | MPT Operating Partnership LP/MPT Finance Corp., 3.50%, 3/15/31 | 11,371,112 |
| 1,020,000 | Starwood Property Trust, Inc., 7.25%, 4/1/29 (144A) | 1,028,118 |
The accompanying notes are an integral part of these financial statements.
40Pioneer Strategic Income Fund | Semiannual Report | 3/31/24
Principal
Amount
USD ($) | | | | | | Value |
| | REITs — (continued) | |
| 2,975,000 | Uniti Group LP/Uniti Group Finance, Inc./CSL Capital LLC, 6.50%, 2/15/29 (144A) | $ 2,305,704 |
| 2,465,000 | Uniti Group LP/Uniti Group Finance, Inc./CSL Capital LLC, 10.50%, 2/15/28 (144A) | 2,555,535 |
| | Total REITs | $20,052,535 |
|
|
| | Retail — 0.7% | |
| 12,900,000 | Darden Restaurants, Inc., 6.30%, 10/10/33 | $ 13,458,858 |
| EUR 4,500,000 | Food Service Project S.A., 5.50%, 1/21/27 (144A) | 4,830,551 |
| 3,805,000 | LCM Investments Holdings II LLC, 4.875%, 5/1/29 (144A) | 3,497,301 |
| | Total Retail | $21,786,710 |
|
|
| | Semiconductors — 0.1% | |
| 4,790,000 | Foundry JV Holdco LLC, 5.875%, 1/25/34 (144A) | $ 4,797,221 |
| | Total Semiconductors | $4,797,221 |
|
|
| | Telecommunications — 1.0% | |
| 475,000 | Altice France S.A., 5.125%, 1/15/29 (144A) | $ 325,282 |
| 1,835,000 | Altice France S.A., 5.125%, 7/15/29 (144A) | 1,240,522 |
| 9,874,000 | Altice France SA, 5.50%, 1/15/28 (144A) | 7,012,941 |
| 4,120,000 | CommScope, Inc., 4.75%, 9/1/29 (144A) | 2,966,400 |
| 2,337,000 | Level 3 Financing, Inc., 10.50%, 5/15/30 (144A) | 2,389,582 |
| EUR 6,915,000 | Lorca Telecom Bondco SA, 4.00%, 9/18/27 (144A) | 7,226,623 |
| 2,225,000(k) | Millicom International Cellular S.A., 7.375%, 4/2/32 (144A) | 2,230,874 |
| 9,900,000 | Total Play Telecomunicaciones SA de CV, 6.375%, 9/20/28 (144A) | 4,862,771 |
| 4,270,000 | Windstream Escrow LLC/Windstream Escrow Finance Corp., 7.75%, 8/15/28 (144A) | 3,952,186 |
| | Total Telecommunications | $32,207,181 |
|
|
| | Transportation — 0.3% | |
| 4,910,000 | Hidrovias International Finance SARL, 4.95%, 2/8/31 (144A) | $ 4,257,797 |
The accompanying notes are an integral part of these financial statements.
Pioneer Strategic Income Fund | Semiannual Report | 3/31/2441
Schedule of Investments | 3/31/24
(unaudited) (continued)
Principal
Amount
USD ($) | | | | | | Value |
| | Transportation — (continued) | |
| 3,172,000 | Seaspan Corp., 5.50%, 8/1/29 (144A) | $ 2,766,037 |
| 2,785,000 | Simpar Europe S.A., 5.20%, 1/26/31 (144A) | 2,434,777 |
| | Total Transportation | $9,458,611 |
|
|
| | Total Corporate Bonds
(Cost $1,227,576,056) | $1,175,114,648 |
|
|
| | Insurance-Linked Securities —
4.0% of Net Assets# | |
| | Event Linked Bonds — 1.9% | |
| | Earthquakes – California — 0.0%† | |
| 750,000(a) | Phoenician Re, 8.26%, (3 Month U.S. Treasury Bill + 290 bps), 12/14/24 (144A) | $ 744,375 |
| | Earthquakes – U.S. — 0.0%† | |
| 500,000(a) | Ursa Re, 10.862%, (3 Month U.S. Treasury Bill + 550 bps), 12/6/25 (144A) | $ 508,350 |
| 500,000(a) | Veraison Re, 11.862%, (1 Month U.S. Treasury Bill + 650 bps), 3/9/26 (144A) | 525,300 |
| | | | | | | $ 1,033,650 |
|
|
| | Flood – U.S. — 0.1% | |
| 1,500,000(a) | FloodSmart Re, 17.192%, (3 Month U.S. Treasury Bill + 1,183 bps), 2/25/25 (144A) | $ 1,467,900 |
| 1,000,000(a) | FloodSmart Re, 19.362%, (3 Month U.S. Treasury Bill + 1,400 bps), 3/12/27 (144A) | 996,500 |
| | | | | | | $ 2,464,400 |
|
|
| | Health – U.S. — 0.2% | |
| 250,000(a) | Vitality Re XII, 8.112%, (3 Month U.S. Treasury Bill + 275 bps), 1/7/25 (144A) | $ 249,050 |
| 2,000,000(a) | Vitality Re XIII, 7.362%, (3 Month U.S. Treasury Bill + 200 bps), 1/6/26 (144A) | 1,984,200 |
| 4,000,000(a) | Vitality Re XIV, 8.862%, (3 Month U.S. Treasury Bill + 350 bps), 1/5/27 (144A) | 4,067,200 |
| 400,000(a) | Vitality Re XIV, 9.862%, (3 Month U.S. Treasury Bill + 450 bps), 1/5/27 (144A) | 412,120 |
| | | | | | | $ 6,712,570 |
|
|
| | Multiperil – U.S. — 0.6% | |
| 500,000(a) | Four Lakes Re, 9.632%, (3 Month U.S. Treasury Bill + 427 bps), 1/7/25 (144A) | $ 484,000 |
The accompanying notes are an integral part of these financial statements.
42Pioneer Strategic Income Fund | Semiannual Report | 3/31/24
Principal
Amount
USD ($) | | | | | | Value |
| | Multiperil – U.S. — (continued) | |
| 250,000(a) | Four Lakes Re, 11.112%, (3 Month U.S. Treasury Bill + 575 bps), 1/7/27 (144A) | $ 254,125 |
| 500,000(a) | Herbie Re, 15.082%, (3 Month U.S. Treasury Bill + 972 bps), 1/8/25 (144A) | 493,700 |
| 2,500,000(a) | High Point Re, 11.112%, (3 Month U.S. Treasury Bill + 575 bps), 1/6/27 (144A) | 2,522,500 |
| 1,750,000(a) | Matterhorn Re, 10.615%, (SOFR + 525 bps), 3/24/25 (144A) | 1,742,825 |
| 750,000(a) | Matterhorn Re, 13.115%, (SOFR + 775 bps), 3/24/25 (144A) | 746,775 |
| 600,000(a) | Mystic Re, 17.362%, (3 Month U.S. Treasury Bill + 1,200 bps), 1/8/27 (144A) | 611,940 |
| 2,900,000(a) | Mystic Re IV, 14.612%, (3 Month U.S. Treasury Bill + 925 bps), 1/8/26 (144A) | 3,019,770 |
| 750,000(a) | Residential Re, 11.112%, (3 Month U.S. Treasury Bill + 575 bps), 12/6/27 (144A) | 751,200 |
| 1,500,000(a) | Residential Re, 11.372%, (3 Month U.S. Treasury Bill + 601 bps), 12/6/24 (144A) | 1,462,950 |
| 1,500,000(a) | Residential Re, 13.052%, (3 Month U.S. Treasury Bill + 769 bps), 12/6/26 (144A) | 1,517,700 |
| 1,500,000(a) | Residential Re, 13.862%, (1 Month U.S. Treasury Bill + 850 bps), 12/6/27 (144A) | 1,491,300 |
| 1,250,000(a) | Residential Re, 14.022%, (3 Month U.S. Treasury Bill + 866 bps), 12/6/24 (144A) | 1,210,250 |
| 750,000(a) | Sanders Re, 11.112%, (3 Month U.S. Treasury Bill + 575 bps), 4/7/28 (144A) | 761,250 |
| 2,250,000(a) | Sanders Re II, 8.412%, (3 Month U.S. Treasury Bill + 305 bps), 4/7/25 (144A) | 2,197,125 |
| 250,000(a) | Sanders Re III, 11.112%, (3 Month U.S. Treasury Bill + 575 bps), 4/7/27 (144A) | 251,325 |
| 750,000(a) | Sanders Re III, 11.612%, (3 Month U.S. Treasury Bill + 625 bps), 4/7/27 (144A) | 761,100 |
| 750,000(a) | Sussex Re, 13.722%, (3 Month U.S. Treasury Bill + 836 bps), 1/8/25 (144A) | 753,300 |
| | | | | | | $ 21,033,135 |
|
|
| | Multiperil – U.S. & Canada — 0.1% | |
| 500,000(a) | Galileo Re, 12.362%, (3 Month U.S. Treasury Bill + 700 bps), 1/8/26 (144A) | $ 513,500 |
The accompanying notes are an integral part of these financial statements.
Pioneer Strategic Income Fund | Semiannual Report | 3/31/2443
Schedule of Investments | 3/31/24
(unaudited) (continued)
Principal
Amount
USD ($) | | | | | | Value |
| | Multiperil – U.S. & Canada — (continued) | |
| 1,000,000(a) | Galileo Re, 12.362%, (3 Month U.S. Treasury Bill + 700 bps), 1/7/28 (144A) | $ 1,041,400 |
| 250,000(a) | Matterhorn Re, 11.111%, (SOFR + 575 bps), 12/8/25 (144A) | 244,425 |
| 800,000(a) | Mona Lisa Re, 17.862%, (3 Month U.S. Treasury Bill + 1,250 bps), 1/8/26 (144A) | 864,560 |
| 500,000(a) | Northshore Re II, 13.362%, (3 Month U.S. Treasury Bill + 800 bps), 7/8/25 (144A) | 520,650 |
| | | | | | | $ 3,184,535 |
|
|
| | Multiperil – U.S. Regional — 0.2% | |
| 750,000(a) | Aquila Re, 12.862%, (3 Month U.S. Treasury Bill + 750 bps), 6/8/26 (144A) | $ 766,350 |
| 1,000,000(a) | Kilimanjaro III Re, 5.25%, (3 Month U.S. Treasury Bill + 525 bps), 6/25/25 (144A) | 1,020,000 |
| 1,000,000(a) | Locke Tavern Re, 4.75%, (3 Month U.S. Treasury Bill + 475 bps), 4/9/26 (144A) | 1,019,200 |
| 2,500,000(a) | Long Point Re IV, 9.612%, (3 Month U.S. Treasury Bill + 425 bps), 6/1/26 (144A) | 2,514,250 |
| | | | | | | $ 5,319,800 |
|
|
| | Multiperil – Worldwide — 0.1% | |
| 1,250,000(a) | Atlas Capital, 12.611%, (SOFR + 725 bps), 6/5/26 (144A) | $ 1,302,875 |
| 500,000(a) | Cat Re 2001, 17.862%, (3 Month U.S. Treasury Bill + 1,250 bps), 1/8/27 (144A) | 526,250 |
| | | | | | | $ 1,829,125 |
|
|
| | Windstorm – Florida — 0.2% | |
| 2,310,000(a) | Everglades Re II, 11.967%, (1 Month U.S. Treasury Bill + 661 bps), 5/14/24 (144A) | $ 2,319,240 |
| 3,000,000(a) | Everglades Re II, 12.987%, (1 Month U.S. Treasury Bill + 763 bps), 5/14/24 (144A) | 3,012,000 |
| 500,000(a) | Integrity Re, 12.432%, (3 Month U.S. Treasury Bill + 707 bps), 6/6/25 (144A) | 350,000 |
| | | | | | | $ 5,681,240 |
|
|
The accompanying notes are an integral part of these financial statements.
44Pioneer Strategic Income Fund | Semiannual Report | 3/31/24
Principal
Amount
USD ($) | | | | | | Value |
| | Windstorm – North Carolina — 0.1% | |
| 500,000(a) | Blue Ridge Re, 10.612%, (3 Month U.S. Treasury Bill + 525 bps), 1/8/27 (144A) | $ 500,450 |
| 1,250,000(a) | Blue Ridge Re, 13.362%, (1 Month U.S. Treasury Bill + 800 bps), 1/8/27 (144A) | 1,278,125 |
| | | | | | | $ 1,778,575 |
|
|
| | Windstorm – Texas — 0.0%† | |
| 1,750,000(a) | Alamo Re, 12.542%, (3 Month U.S. Treasury Bill + 718 bps), 6/7/24 (144A) | $ 1,768,725 |
| | Windstorm – U.S. — 0.2% | |
| 1,000,000(a) | Alamo Re, 13.862%, (1 Month U.S. Treasury Bill + 850 bps), 6/7/26 (144A) | $ 1,029,000 |
| 750,000(a) | Bonanza Re, 10.272%, (3 Month U.S. Treasury Bill + 491 bps), 12/23/24 (144A) | 735,000 |
| 250,000(a) | Bonanza Re, 11.142%, (3 Month U.S. Treasury Bill + 578 bps), 3/16/25 (144A) | 234,525 |
| 250,000(a) | Bonanza Re, 13.612%, (3 Month U.S. Treasury Bill + 825 bps), 1/8/26 (144A) | 253,225 |
| 1,000,000(a) | Cape Lookout Re, 11.862%, (1 Month U.S. Treasury Bill + 650 bps), 4/28/26 (144A) | 1,026,300 |
| 500,000(a) | Gateway Re, 18.362%, (1 Month U.S. Treasury Bill + 1,300 bps), 2/24/26 (144A) | 540,250 |
| 250,000(a) | Gateway Re II, 14.862%, (3 Month U.S. Treasury Bill + 950 bps), 4/27/26 (144A) | 259,300 |
| 2,500,000(a) | Queen Street Re, 12.862%, (3 Month U.S. Treasury Bill + 750 bps), 12/8/25 (144A) | 2,610,000 |
| | | | | | | $ 6,687,600 |
|
|
| | Windstorm – U.S. Multistate — 0.0%† | |
| 250,000(g) | Gateway Re, 0.000%, 12/23/24 (144A) | $ 231,200 |
| 250,000(a) | Gateway Re, 6.862%, (1 Month U.S. Treasury Bill + 150 bps), 7/8/27 (144A) | 249,988 |
| | | | | | | $ 481,188 |
|
|
| | Windstorm – U.S. Regional — 0.0%† | |
| 750,000(a) | Commonwealth Re, 8.90%, (3 Month U.S. Treasury Bill + 354 bps), 7/8/25 (144A) | $ 758,250 |
The accompanying notes are an integral part of these financial statements.
Pioneer Strategic Income Fund | Semiannual Report | 3/31/2445
Schedule of Investments | 3/31/24
(unaudited) (continued)
Principal
Amount
USD ($) | | | | | | Value |
| | Winterstorm – Florida — 0.1% | |
| 1,250,000(a) | Integrity Re, 17.362%, (1 Month U.S. Treasury Bill + 1,200 bps), 6/6/25 (144A) | $ 1,296,625 |
| 1,000,000(a) | Lightning Re, 16.362%, (3 Month U.S. Treasury Bill + 1,100 bps), 3/31/26 (144A) | 1,075,000 |
| | | | | | | $ 2,371,625 |
| |
| |
| | Total Event Linked Bonds | $ 61,848,793 | |
| |
| |
Face
Amount
USD ($) | | | | | | |
| | Collateralized Reinsurance — 0.5% | |
| | Earthquakes – California — 0.0%† | |
| 1,800,000(c)(l) + | Adare Re 2022-2, 9/30/28 | $ 1,812,375 |
| | Multiperil – Massachusetts — 0.0%† | |
| 400,000(c)(l) + | Portsalon Re 2022, 5/31/28 | $ 366,768 |
| | Multiperil – U.S. — 0.4% | |
| 1,506,560(l) + | Ballybunion Re 2022, 12/31/27 | $ — |
| 3,000,000(c)(l) + | Ballybunion Re 2023, 12/31/28 | 2,890,500 |
| 5,000,000(c)(l) + | Emetteur Non Renseigne-PI0047 2024-1, 12/31/29 | 5,124,348 |
| 4,750,000(c)(l) + | Gamboge Re, 3/31/29 | 4,981,800 |
| | | | | | | $ 12,996,648 |
|
|
| | Multiperil – Worldwide — 0.1% | |
| 1,000,000(c)(l) + | Merion Re 2024-1, 12/31/29 | $ 886,309 |
| 250,000(c)(l) + | Old Head Re 2022, 12/31/27 | 125,000 |
| 250,000(c)(l) + | Old Head Re 2024, 12/31/29 | 201,551 |
| 750,000(c)(l) + | Pine Valley Re 2024, 12/31/28 | 643,268 |
| 300,000(c)(l) + | Walton Health Re 2019, 6/30/24 | 75,504 |
| 2,000,000(c)(l) + | Walton Health Re 2022, 12/15/27 | 291,507 |
| | | | | | | $ 2,223,139 |
|
|
| | Windstorm – Florida — 0.0%† | |
| 1,750,000(c)(l) + | Formby Re 2018, 2/28/25 | $ — |
| 2,200,000(c)(l) + | Portrush Re 2017, 6/15/24 | 220 |
| | | | | | | $ 220 |
|
|
| | Windstorm – North Carolina — 0.0%† | |
| 250,000(l) + | Isosceles Re 2023, 4/30/29 | $ 200 |
The accompanying notes are an integral part of these financial statements.
46Pioneer Strategic Income Fund | Semiannual Report | 3/31/24
Face
Amount
USD ($) | | | | | | Value |
| | Windstorm – North Carolina — (continued) | |
| 1,000,000(l) + | Isosceles Re 2023, 4/30/29 | $ — |
| 424,975(l) + | Isosceles Re 2023, 4/30/29 | — |
| | | | | | | $ 200 |
|
|
| | Windstorm – U.S. Multistate — 0.0%† | |
| 1,000,000(l) + | White Heron Re 2023, 5/31/29 | $ 26,028 |
| | Windstorm – U.S. Regional — 0.0%† | |
| 5,804,192(c)(l) + | Oakmont Re 2020, 4/30/24 | $ — |
| | Total Collateralized Reinsurance | $17,425,378 |
|
|
| | Reinsurance Sidecars — 1.6% | |
| | Multiperil – U.S. — 0.0%† | |
| 3,000,000(c)(m) + | Harambee Re 2018, 12/31/24 | $ — |
| 5,000,000(c)(m) + | Harambee Re 2019, 12/31/24 | 9,000 |
| 3,000,000(c)(m) + | Harambee Re 2020, 12/31/24 | 47,400 |
| | | | | | | $ 56,400 |
|
|
| | Multiperil – Worldwide — 1.6% | |
| 250,000(m) + | Alturas Re 2020-3, 9/30/24 | $ — |
| 236,951(c)(m) + | Alturas Re 2021-3, 7/31/25 | 10,047 |
| 2,318,301(c)(m) + | Alturas Re 2022-2, 12/31/27 | 270,314 |
| 3,932,000(c)(l) + | Bantry Re 2021, 12/31/24 | 24,310 |
| 5,000,000(l) + | Bantry Re 2023, 12/31/28 | 113,572 |
| 5,000,000(c)(l) + | Bantry Re 2024, 12/31/29 | 5,197,595 |
| 2,000,000(l) + | Berwick Re 2020-1, 12/31/24 | 14,352 |
| 2,500,000(c)(l) + | Berwick Re 2024-1, 12/31/29 | 2,578,682 |
| 4,000,000(l) + | Eccleston Re 2023, 11/30/28 | 423,677 |
| 524,241(c)(l) + | Eden Re II, 3/21/25 (144A) | 93,210 |
| 880,000(c)(l) + | Eden Re II, 3/20/26 (144A) | 174,830 |
| 30,000(l) + | Eden Re II, 3/19/27 (144A) | 242,890 |
| 2,900,000(c)(l) + | Eden Re II, 3/17/28 (144A) | 2,965,540 |
| 1,250,000(c)(l) + | Gleneagles Re 2021, 12/31/24 | 125 |
| 1,250,000(c)(l) + | Gleneagles Re 2022, 12/31/27 | 594,181 |
| 2,737,878(l) + | Gullane Re 2018, 12/31/24 | — |
| 5,318,293(l) + | Gullane Re 2023, 12/31/28 | 146,869 |
| 5,000,000(c)(l) + | Gullane Re 2024, 12/31/29 | 5,250,578 |
| 500,000(c)(m) + | Lion Rock Re 2020, 1/31/25 | — |
| 500,000(c)(m) + | Lion Rock Re 2021, 12/31/24 | 55,900 |
| 2,545,246(c)(m) + | Lorenz Re 2019, 6/30/24 | 23,671 |
| 9,000,000(c)(l) + | Merion Re 2021-2, 12/31/24 | 1,444,500 |
| 6,551,154(c)(l) + | Merion Re 2022-2, 12/31/27 | 6,211,224 |
| 2,500,000(c)(l) + | Pangaea Re 2023-3, 5/31/29 | 2,871,805 |
The accompanying notes are an integral part of these financial statements.
Pioneer Strategic Income Fund | Semiannual Report | 3/31/2447
Schedule of Investments | 3/31/24
(unaudited) (continued)
Face
Amount
USD ($) | | | | | | Value |
| | Multiperil – Worldwide — (continued) | |
| 2,750,000(c)(l) + | Pangaea Re 2024-1, 12/31/29 | $ 2,841,743 |
| 1,000,000(c)(l) + | Phoenix 3 Re 2023-3, 1/4/27 | 1,145,400 |
| 1,515,000(c)(l) + | RosaPenna Re 2022, 6/30/28 | 1,456,832 |
| 155,997(c)(l) + | Sector Re V, 12/1/24 (144A) | 285,908 |
| 150,000(c)(l) + | Sector Re V, 12/1/24 (144A) | 274,917 |
| 9,179(l) + | Sector Re V, 3/1/27 (144A) | 38,221 |
| 6,362(c)(l) + | Sector Re V, 12/1/27 (144A) | 260,569 |
| 4,000,000(c)(l) + | Sector Re V, 12/1/28 (144A) | 4,362,245 |
| 2,500,000(c)(l) + | Sector Re V, 12/1/28 (144A) | 2,726,403 |
| 3,609,700(c)(l) + | Sussex Re 2020-1, 12/31/24 | 4,693 |
| 1,000,000(l) + | Sussex Re 2021-1, 12/31/24 | 700 |
| 4,000,000(c)(m) + | Thopas Re 2020, 12/31/24 | 800 |
| 5,000,000(m) + | Thopas Re 2021, 12/31/24 | 52,000 |
| 3,000,000(m) + | Thopas Re 2022, 12/31/27 | — |
| 3,192,294(m) + | Thopas Re 2023, 12/31/28 | — |
| 3,192,294(c)(m) + | Thopas Re 2024, 12/31/29 | 3,354,782 |
| 2,818,951(m) + | Torricelli Re 2021, 7/31/25 | 44,547 |
| 3,000,000(m) + | Torricelli Re 2022, 6/30/28 | 38,262 |
| 3,250,000(c)(m) + | Torricelli Re 2023, 6/30/29 | 4,079,722 |
| 1,250,000(c)(m) + | Viribus Re 2018, 12/31/24 | — |
| 3,650,000(m) + | Viribus Re 2019, 12/31/24 | — |
| 4,139,570(c)(m) + | Viribus Re 2020, 12/31/24 | 137,434 |
| 2,500,000(c)(m) + | Viribus Re 2022, 12/31/27 | 91,750 |
| 1,500,000(m) + | Viribus Re 2023, 12/31/28 | 421,350 |
| 250,000(c)(m) + | Viribus Re 2024, 12/31/29 | 250,000 |
| 3,539,362(c)(l) + | Woburn Re 2019, 12/31/24 | 592,560 |
| | | | | | | $ 51,168,710 |
|
|
| | Total Reinsurance Sidecars | $51,225,110 |
|
|
| | Total Insurance-Linked Securities
(Cost $126,297,666) | $130,499,281 |
|
|
The accompanying notes are an integral part of these financial statements.
48Pioneer Strategic Income Fund | Semiannual Report | 3/31/24
Principal
Amount
USD ($) | | | | | | Value |
| | Foreign Government Bonds —
3.5% of Net Assets | |
| | Angola — 0.2% | |
| 6,420,000 | Angolan Government International Bond, 8.750%, 4/14/32 (144A) | $ 5,891,339 |
| | Total Angola | $5,891,339 |
|
|
| | Argentina — 0.3% | |
| 351,880 | Argentine Republic Government International Bond, 1.000%, 7/9/29 | $ 189,417 |
| 5,955,800(e) | Argentine Republic Government International Bond, 3.625%, 7/9/35 | 2,472,173 |
| 8,500,000 | Ciudad Autonoma De Buenos Aires, 7.500%, 6/1/27 (144A) | 8,041,242 |
| | Total Argentina | $10,702,832 |
|
|
| | Colombia — 0.1% | |
| 4,800,000 | Colombia Government International Bond, 3.125%, 4/15/31 | $ 3,830,027 |
| | Total Colombia | $3,830,027 |
|
|
| | Egypt — 0.2% | |
| 2,520,000 | Egypt Government International Bond, 5.875%, 2/16/31 (144A) | $ 2,012,850 |
| 5,560,000 | Egypt Government International Bond, 7.053%, 1/15/32 (144A) | 4,593,728 |
| | Total Egypt | $6,606,578 |
|
|
| | Ghana — 0.1% | |
| 7,018,000(j) | Ghana Government International Bond, 7.875%, 2/11/35 (144A) | $ 3,579,180 |
| | Total Ghana | $3,579,180 |
|
|
| | Indonesia — 0.4% | |
| IDR 219,632,000,000 | Indonesia Treasury Bond, 6.125%, 5/15/28 | $ 13,631,314 |
| | Total Indonesia | $13,631,314 |
|
|
| | Ivory Coast — 0.4% | |
| EUR 8,965,000 | Ivory Coast Government International Bond, 4.875%, 1/30/32 (144A) | $ 8,317,825 |
| EUR 3,270,000 | Ivory Coast Government International Bond, 5.875%, 10/17/31 (144A) | 3,253,021 |
| 2,500,000 | Ivory Coast Government International Bond, 6.125%, 6/15/33 (144A) | 2,250,100 |
| | Total Ivory Coast | $13,820,946 |
|
|
The accompanying notes are an integral part of these financial statements.
Pioneer Strategic Income Fund | Semiannual Report | 3/31/2449
Schedule of Investments | 3/31/24
(unaudited) (continued)
Principal
Amount
USD ($) | | | | | | Value |
| | Mexico — 0.3% | |
| MXN 178,532,100 | Mexican Bonos, 7.750%, 11/23/34 | $ 9,602,040 |
| | Total Mexico | $9,602,040 |
|
|
| | Saudi Arabia — 0.2% | |
| 6,570,000 | Saudi Government International Bond, 5.750%, 1/16/54 (144A) | $ 6,487,875 |
| | Total Saudi Arabia | $6,487,875 |
|
|
| | Serbia — 0.2% | |
| EUR 6,600,000 | Serbia International Bond, 2.050%, 9/23/36 (144A) | $ 4,974,176 |
| | Total Serbia | $4,974,176 |
|
|
| | Supranational — 0.6% | |
| INR 435,400,000 | International Bank for Reconstruction & Development, 6.500%, 4/17/30 | $ 5,097,125 |
| INR 581,000,000 | International Bank for Reconstruction & Development, 6.850%, 4/24/28 | 6,951,087 |
| KZT 1,169,000,000 | International Bank for Reconstruction & Development, 12.500%, 2/21/25 | 2,572,921 |
| COP 23,200,000,000 | International Finance Corp., 3.590%, 2/26/26 | 5,346,939 |
| | Total Supranational | $19,968,072 |
|
|
| | Ukraine — 0.1% | |
| EUR 4,490,000(j) | Ukraine Government International Bond, 4.375%, 1/27/32 (144A) | $ 1,295,780 |
| 9,575,000(j) | Ukraine Government International Bond, 7.375%, 9/25/34 (144A) | 2,752,812 |
| | Total Ukraine | $4,048,592 |
|
|
| | Uruguay — 0.2% | |
| UYU 190,614,000 | Uruguay Government International Bond, 9.750%, 7/20/33 | $ 5,330,237 |
| | Total Uruguay | $5,330,237 |
|
|
| | Uzbekistan — 0.2% | |
| UZS 76,270,000,000 | Republic of Uzbekistan International Bond, 14.000%, 7/19/24 (144A) | $ 5,984,326 |
| | Total Uzbekistan | $5,984,326 |
|
|
| | Total Foreign Government Bonds
(Cost $139,148,977) | $114,457,534 |
|
|
The accompanying notes are an integral part of these financial statements.
50Pioneer Strategic Income Fund | Semiannual Report | 3/31/24
Principal
Amount
USD ($) | | | | | | Value |
| | U.S. Government and Agency
Obligations — 33.4% of Net Assets | |
| 22,495,652 | Federal Home Loan Mortgage Corp., 1.500%, 3/1/42 | $ 18,300,455 |
| 156,611 | Federal Home Loan Mortgage Corp., 2.000%, 2/1/42 | 131,746 |
| 1,276,168 | Federal Home Loan Mortgage Corp., 2.000%, 3/1/52 | 1,010,924 |
| 20,160,157 | Federal Home Loan Mortgage Corp., 2.500%, 5/1/51 | 16,838,078 |
| 109,807 | Federal Home Loan Mortgage Corp., 3.000%, 11/1/47 | 97,669 |
| 884,276 | Federal Home Loan Mortgage Corp., 3.000%, 9/1/51 | 760,946 |
| 702,548 | Federal Home Loan Mortgage Corp., 3.000%, 1/1/52 | 606,765 |
| 1,751,237 | Federal Home Loan Mortgage Corp., 3.000%, 6/1/52 | 1,507,413 |
| 1,242,109 | Federal Home Loan Mortgage Corp., 3.000%, 6/1/52 | 1,068,739 |
| 1,179,433 | Federal Home Loan Mortgage Corp., 3.000%, 9/1/52 | 1,015,103 |
| 793,434 | Federal Home Loan Mortgage Corp., 3.000%, 4/1/53 | 682,874 |
| 31,974 | Federal Home Loan Mortgage Corp., 3.500%, 1/1/52 | 28,752 |
| 2,346,603 | Federal Home Loan Mortgage Corp., 3.500%, 4/1/52 | 2,120,405 |
| 166,598 | Federal Home Loan Mortgage Corp., 3.500%, 4/1/52 | 149,162 |
| 1,409,624 | Federal Home Loan Mortgage Corp., 3.500%, 4/1/52 | 1,280,476 |
| 1,696,329 | Federal Home Loan Mortgage Corp., 4.000%, 10/1/42 | 1,607,254 |
| 626,164 | Federal Home Loan Mortgage Corp., 4.000%, 4/1/47 | 589,969 |
| 184,066 | Federal Home Loan Mortgage Corp., 4.000%, 6/1/50 | 171,896 |
| 101,069 | Federal Home Loan Mortgage Corp., 4.000%, 4/1/51 | 93,985 |
| 90,561 | Federal Home Loan Mortgage Corp., 4.000%, 9/1/51 | 83,959 |
| 157,759 | Federal Home Loan Mortgage Corp., 4.000%, 6/1/52 | 146,315 |
The accompanying notes are an integral part of these financial statements.
Pioneer Strategic Income Fund | Semiannual Report | 3/31/2451
Schedule of Investments | 3/31/24
(unaudited) (continued)
Principal
Amount
USD ($) | | | | | | Value |
| | U.S. Government and Agency
Obligations — (continued) | |
| 555,193 | Federal Home Loan Mortgage Corp., 4.500%, 3/1/47 | $ 542,447 |
| 1,514,852 | Federal Home Loan Mortgage Corp., 5.000%, 11/1/39 | 1,513,545 |
| 967 | Federal Home Loan Mortgage Corp., 5.000%, 5/1/40 | 972 |
| 250,330 | Federal Home Loan Mortgage Corp., 5.000%, 3/1/44 | 251,645 |
| 1,543,706 | Federal Home Loan Mortgage Corp., 5.000%, 12/1/50 | 1,519,837 |
| 114,646 | Federal Home Loan Mortgage Corp., 5.000%, 3/1/53 | 111,946 |
| 29,611 | Federal Home Loan Mortgage Corp., 5.000%, 4/1/53 | 28,914 |
| 110,475 | Federal Home Loan Mortgage Corp., 5.000%, 4/1/53 | 107,952 |
| 307,738 | Federal Home Loan Mortgage Corp., 5.000%, 4/1/53 | 300,833 |
| 670,527 | Federal Home Loan Mortgage Corp., 5.500%, 6/1/41 | 684,460 |
| 1,962,813 | Federal Home Loan Mortgage Corp., 5.500%, 7/1/49 | 1,981,968 |
| 306,395 | Federal Home Loan Mortgage Corp., 5.500%, 3/1/53 | 307,428 |
| 495,348 | Federal Home Loan Mortgage Corp., 5.500%, 3/1/53 | 494,466 |
| 160,788 | Federal Home Loan Mortgage Corp., 5.500%, 4/1/53 | 160,179 |
| 144,466 | Federal Home Loan Mortgage Corp., 5.500%, 4/1/53 | 143,879 |
| 356,596 | Federal Home Loan Mortgage Corp., 5.500%, 4/1/53 | 356,653 |
| 1,191,263 | Federal Home Loan Mortgage Corp., 5.500%, 4/1/53 | 1,188,935 |
| 33,383,461 | Federal Home Loan Mortgage Corp., 5.500%, 8/1/53 | 33,219,700 |
| 20,224,540 | Federal Home Loan Mortgage Corp., 5.500%, 11/1/53 | 20,122,567 |
| 20,216,059 | Federal Home Loan Mortgage Corp., 5.500%, 12/1/53 | 20,114,129 |
| 13,936 | Federal Home Loan Mortgage Corp., 6.000%, 1/1/33 | 14,111 |
The accompanying notes are an integral part of these financial statements.
52Pioneer Strategic Income Fund | Semiannual Report | 3/31/24
Principal
Amount
USD ($) | | | | | | Value |
| | U.S. Government and Agency
Obligations — (continued) | |
| 1,564 | Federal Home Loan Mortgage Corp., 6.000%, 3/1/33 | $ 1,580 |
| 9,855 | Federal Home Loan Mortgage Corp., 6.000%, 3/1/33 | 10,029 |
| 16,082 | Federal Home Loan Mortgage Corp., 6.000%, 1/1/34 | 16,640 |
| 44,198 | Federal Home Loan Mortgage Corp., 6.000%, 6/1/35 | 45,112 |
| 16,966 | Federal Home Loan Mortgage Corp., 6.000%, 12/1/36 | 17,507 |
| 1,492 | Federal Home Loan Mortgage Corp., 6.000%, 10/1/37 | 1,537 |
| 39,703 | Federal Home Loan Mortgage Corp., 6.000%, 12/1/37 | 41,183 |
| 604,002 | Federal Home Loan Mortgage Corp., 6.000%, 10/1/52 | 619,280 |
| 644,297 | Federal Home Loan Mortgage Corp., 6.000%, 2/1/53 | 651,574 |
| 301,096 | Federal Home Loan Mortgage Corp., 6.000%, 3/1/53 | 310,908 |
| 252,343 | Federal Home Loan Mortgage Corp., 6.000%, 3/1/53 | 257,792 |
| 187,658 | Federal Home Loan Mortgage Corp., 6.000%, 4/1/53 | 193,881 |
| 233,115 | Federal Home Loan Mortgage Corp., 6.000%, 4/1/53 | 236,063 |
| 147,519 | Federal Home Loan Mortgage Corp., 6.000%, 4/1/53 | 149,064 |
| 162,928 | Federal Home Loan Mortgage Corp., 6.000%, 4/1/53 | 165,466 |
| 799,518 | Federal Home Loan Mortgage Corp., 6.000%, 5/1/53 | 810,657 |
| 419,098 | Federal Home Loan Mortgage Corp., 6.000%, 7/1/53 | 423,056 |
| 26,750,024 | Federal Home Loan Mortgage Corp., 6.000%, 2/1/54 | 26,991,753 |
| 152,987 | Federal Home Loan Mortgage Corp., 6.000%, 2/1/54 | 157,957 |
| 202,358 | Federal Home Loan Mortgage Corp., 6.000%, 2/1/54 | 207,318 |
| 573,205 | Federal Home Loan Mortgage Corp., 6.000%, 2/1/54 | 580,609 |
The accompanying notes are an integral part of these financial statements.
Pioneer Strategic Income Fund | Semiannual Report | 3/31/2453
Schedule of Investments | 3/31/24
(unaudited) (continued)
Principal
Amount
USD ($) | | | | | | Value |
| | U.S. Government and Agency
Obligations — (continued) | |
| 213,000 | Federal Home Loan Mortgage Corp., 6.000%, 3/1/54 | $ 215,510 |
| 330,954 | Federal Home Loan Mortgage Corp., 6.000%, 3/1/54 | 336,029 |
| 1,475 | Federal Home Loan Mortgage Corp., 6.500%, 9/1/32 | 1,523 |
| 242,292 | Federal Home Loan Mortgage Corp., 6.500%, 1/1/43 | 247,535 |
| 810,099 | Federal Home Loan Mortgage Corp., 6.500%, 1/1/53 | 832,298 |
| 5,075,720 | Federal Home Loan Mortgage Corp., 6.500%, 2/1/53 | 5,356,359 |
| 185,241 | Federal Home Loan Mortgage Corp., 6.500%, 4/1/53 | 192,279 |
| 147,705 | Federal Home Loan Mortgage Corp., 6.500%, 4/1/53 | 151,965 |
| 12,240,860 | Federal Home Loan Mortgage Corp., 6.500%, 10/1/53 | 12,505,739 |
| 200,000 | Federal Home Loan Mortgage Corp., 6.500%, 3/1/54 | 205,901 |
| 41,693,844 | Federal National Mortgage Association, 1.500%, 3/1/42 | 33,939,545 |
| 2,000,000 | Federal National Mortgage Association, 2.000%, 4/15/39 (TBA) | 1,772,092 |
| 10,116,029 | Federal National Mortgage Association, 2.000%, 12/1/41 | 8,493,441 |
| 519,411 | Federal National Mortgage Association, 2.000%, 2/1/42 | 435,807 |
| 191,550 | Federal National Mortgage Association, 2.000%, 2/1/42 | 160,578 |
| 617,812 | Federal National Mortgage Association, 2.000%, 11/1/50 | 499,250 |
| 312,692 | Federal National Mortgage Association, 2.000%, 1/1/51 | 254,994 |
| 5,290,273 | Federal National Mortgage Association, 2.000%, 11/1/51 | 4,267,537 |
| 3,625,536 | Federal National Mortgage Association, 2.000%, 3/1/52 | 2,876,583 |
| 30,000,000 | Federal National Mortgage Association, 2.000%, 4/1/54 (TBA) | 23,729,635 |
| 2,000,000 | Federal National Mortgage Association, 2.500%, 4/15/39 (TBA) | 1,819,543 |
The accompanying notes are an integral part of these financial statements.
54Pioneer Strategic Income Fund | Semiannual Report | 3/31/24
Principal
Amount
USD ($) | | | | | | Value |
| | U.S. Government and Agency
Obligations — (continued) | |
| 249,311 | Federal National Mortgage Association, 2.500%, 9/1/50 | $ 212,301 |
| 179,495 | Federal National Mortgage Association, 2.500%, 10/1/50 | 152,542 |
| 21,774,579 | Federal National Mortgage Association, 2.500%, 5/1/51 | 18,371,581 |
| 594,125 | Federal National Mortgage Association, 2.500%, 5/1/51 | 501,609 |
| 7,664,953 | Federal National Mortgage Association, 2.500%, 11/1/51 | 6,471,901 |
| 18,028,049 | Federal National Mortgage Association, 2.500%, 1/1/52 | 15,118,434 |
| 1,336,285 | Federal National Mortgage Association, 2.500%, 2/1/52 | 1,124,662 |
| 339,864 | Federal National Mortgage Association, 2.500%, 4/1/52 | 285,415 |
| 93,000,000 | Federal National Mortgage Association, 2.500%, 4/1/54 (TBA) | 76,860,809 |
| 37,069 | Federal National Mortgage Association, 3.000%, 5/1/46 | 32,541 |
| 58,685 | Federal National Mortgage Association, 3.000%, 10/1/46 | 51,523 |
| 169,386 | Federal National Mortgage Association, 3.000%, 11/1/46 | 150,485 |
| 92,520 | Federal National Mortgage Association, 3.000%, 11/1/46 | 81,459 |
| 38,336 | Federal National Mortgage Association, 3.000%, 1/1/47 | 33,654 |
| 36,188 | Federal National Mortgage Association, 3.000%, 3/1/47 | 32,150 |
| 422,193 | Federal National Mortgage Association, 3.000%, 3/1/47 | 371,678 |
| 1,542,866 | Federal National Mortgage Association, 3.000%, 3/1/47 | 1,378,418 |
| 980,479 | Federal National Mortgage Association, 3.000%, 4/1/47 | 871,086 |
| 1,734,923 | Federal National Mortgage Association, 3.000%, 5/1/48 | 1,527,379 |
| 187,156 | Federal National Mortgage Association, 3.000%, 8/1/51 | 161,177 |
| 928,240 | Federal National Mortgage Association, 3.000%, 11/1/51 | 798,823 |
The accompanying notes are an integral part of these financial statements.
Pioneer Strategic Income Fund | Semiannual Report | 3/31/2455
Schedule of Investments | 3/31/24
(unaudited) (continued)
Principal
Amount
USD ($) | | | | | | Value |
| | U.S. Government and Agency
Obligations — (continued) | |
| 10,409,811 | Federal National Mortgage Association, 3.000%, 1/1/52 | $ 9,105,794 |
| 14,025,036 | Federal National Mortgage Association, 3.000%, 3/1/52 | 12,362,885 |
| 927,702 | Federal National Mortgage Association, 3.000%, 4/1/52 | 798,352 |
| 1,937,226 | Federal National Mortgage Association, 3.000%, 6/1/52 | 1,667,592 |
| 781,091 | Federal National Mortgage Association, 3.000%, 6/1/52 | 672,187 |
| 67,300,000 | Federal National Mortgage Association, 3.000%, 4/1/54 (TBA) | 57,892,210 |
| 2,986,302 | Federal National Mortgage Association, 3.000%, 2/1/57 | 2,557,326 |
| 651,019 | Federal National Mortgage Association, 3.500%, 1/1/48 | 595,707 |
| 1,144,967 | Federal National Mortgage Association, 3.500%, 5/1/49 | 1,054,421 |
| 2,764,096 | Federal National Mortgage Association, 3.500%, 3/1/52 | 2,508,492 |
| 5,381,708 | Federal National Mortgage Association, 3.500%, 3/1/52 | 4,836,891 |
| 554,175 | Federal National Mortgage Association, 3.500%, 4/1/52 | 496,241 |
| 2,181,713 | Federal National Mortgage Association, 3.500%, 4/1/52 | 1,959,514 |
| 933,096 | Federal National Mortgage Association, 3.500%, 4/1/52 | 847,608 |
| 3,861,289 | Federal National Mortgage Association, 3.500%, 5/1/52 | 3,489,384 |
| 462,409 | Federal National Mortgage Association, 3.500%, 5/1/52 | 421,606 |
| 3,657,519 | Federal National Mortgage Association, 3.500%, 6/1/52 | 3,304,985 |
| 28,000,000 | Federal National Mortgage Association, 3.500%, 4/1/54 (TBA) | 25,056,566 |
| 1,304,620 | Federal National Mortgage Association, 3.500%, 9/1/55 | 1,189,524 |
| 6,844,239 | Federal National Mortgage Association, 3.500%, 8/1/58 | 6,074,359 |
| 2,648 | Federal National Mortgage Association, 4.000%, 12/1/30 | 2,573 |
The accompanying notes are an integral part of these financial statements.
56Pioneer Strategic Income Fund | Semiannual Report | 3/31/24
Principal
Amount
USD ($) | | | | | | Value |
| | U.S. Government and Agency
Obligations — (continued) | |
| 3,477,093 | Federal National Mortgage Association, 4.000%, 10/1/40 | $ 3,311,524 |
| 1,351,936 | Federal National Mortgage Association, 4.000%, 12/1/40 | 1,286,892 |
| 10,911 | Federal National Mortgage Association, 4.000%, 12/1/41 | 10,339 |
| 54,118 | Federal National Mortgage Association, 4.000%, 7/1/42 | 51,275 |
| 7,347,358 | Federal National Mortgage Association, 4.000%, 4/1/44 | 6,961,682 |
| 47,712 | Federal National Mortgage Association, 4.000%, 6/1/44 | 45,001 |
| 18,135 | Federal National Mortgage Association, 4.000%, 6/1/45 | 17,361 |
| 103,179 | Federal National Mortgage Association, 4.000%, 7/1/45 | 97,737 |
| 23,170 | Federal National Mortgage Association, 4.000%, 5/1/51 | 21,550 |
| 3,689,788 | Federal National Mortgage Association, 4.000%, 7/1/51 | 3,439,059 |
| 71,134 | Federal National Mortgage Association, 4.000%, 8/1/51 | 66,051 |
| 1,146,799 | Federal National Mortgage Association, 4.000%, 9/1/51 | 1,070,860 |
| 205,995 | Federal National Mortgage Association, 4.000%, 6/1/52 | 190,948 |
| 36,157 | Federal National Mortgage Association, 4.000%, 7/1/56 | 33,594 |
| 65,666 | Federal National Mortgage Association, 4.000%, 1/1/57 | 60,929 |
| 3,128,251 | Federal National Mortgage Association, 4.500%, 9/1/43 | 3,067,960 |
| 2,125,539 | Federal National Mortgage Association, 4.500%, 1/1/44 | 2,084,569 |
| 221,753 | Federal National Mortgage Association, 4.500%, 1/1/47 | 216,376 |
| 720,946 | Federal National Mortgage Association, 4.500%, 2/1/47 | 703,472 |
| 5,000,000 | Federal National Mortgage Association, 4.500%, 4/1/54 (TBA) | 4,761,112 |
| 771,521 | Federal National Mortgage Association, 5.000%, 6/1/35 | 775,567 |
The accompanying notes are an integral part of these financial statements.
Pioneer Strategic Income Fund | Semiannual Report | 3/31/2457
Schedule of Investments | 3/31/24
(unaudited) (continued)
Principal
Amount
USD ($) | | | | | | Value |
| | U.S. Government and Agency
Obligations — (continued) | |
| 253,761 | Federal National Mortgage Association, 5.000%, 7/1/35 | $ 255,092 |
| 594,167 | Federal National Mortgage Association, 5.000%, 7/1/35 | 597,284 |
| 227,191 | Federal National Mortgage Association, 5.000%, 8/1/35 | 228,381 |
| 283,456 | Federal National Mortgage Association, 5.000%, 1/1/39 | 283,695 |
| 2,000,000 | Federal National Mortgage Association, 5.000%, 4/15/39 (TBA) | 1,996,928 |
| 83,585 | Federal National Mortgage Association, 5.000%, 7/1/41 | 84,025 |
| 1,942,770 | Federal National Mortgage Association, 5.000%, 9/1/43 | 1,934,837 |
| 7,908,923 | Federal National Mortgage Association, 5.000%, 12/1/44 | 7,892,072 |
| 4,598,158 | Federal National Mortgage Association, 5.000%, 8/1/52 | 4,495,668 |
| 261,609 | Federal National Mortgage Association, 5.000%, 2/1/53 | 255,879 |
| 430,271 | Federal National Mortgage Association, 5.000%, 2/1/53 | 420,513 |
| 550,322 | Federal National Mortgage Association, 5.000%, 2/1/53 | 538,531 |
| 1,037,849 | Federal National Mortgage Association, 5.000%, 4/1/53 | 1,014,604 |
| 160,032 | Federal National Mortgage Association, 5.000%, 4/1/53 | 156,520 |
| 795,178 | Federal National Mortgage Association, 5.000%, 4/1/53 | 776,250 |
| 4,548 | Federal National Mortgage Association, 5.500%, 5/1/33 | 4,642 |
| 3,002 | Federal National Mortgage Association, 5.500%, 6/1/33 | 3,009 |
| 10,635 | Federal National Mortgage Association, 5.500%, 7/1/33 | 10,799 |
| 22,610 | Federal National Mortgage Association, 5.500%, 4/1/34 | 23,079 |
| 3,631 | Federal National Mortgage Association, 5.500%, 10/1/35 | 3,688 |
| 45,026 | Federal National Mortgage Association, 5.500%, 12/1/35 | 45,497 |
The accompanying notes are an integral part of these financial statements.
58Pioneer Strategic Income Fund | Semiannual Report | 3/31/24
Principal
Amount
USD ($) | | | | | | Value |
| | U.S. Government and Agency
Obligations — (continued) | |
| 19,621 | Federal National Mortgage Association, 5.500%, 3/1/36 | $ 20,029 |
| 10,000,000 | Federal National Mortgage Association, 5.500%, 4/15/39 (TBA) | 10,077,250 |
| 478,371 | Federal National Mortgage Association, 5.500%, 5/1/49 | 482,893 |
| 1,648,655 | Federal National Mortgage Association, 5.500%, 4/1/50 | 1,664,744 |
| 3,753,769 | Federal National Mortgage Association, 5.500%, 4/1/50 | 3,790,402 |
| 447,395 | Federal National Mortgage Association, 5.500%, 11/1/52 | 446,429 |
| 1,840,079 | Federal National Mortgage Association, 5.500%, 1/1/53 | 1,845,809 |
| 2,309,752 | Federal National Mortgage Association, 5.500%, 1/1/53 | 2,326,361 |
| 1,625,917 | Federal National Mortgage Association, 5.500%, 2/1/53 | 1,621,111 |
| 539,809 | Federal National Mortgage Association, 5.500%, 2/1/53 | 541,271 |
| 1,159,817 | Federal National Mortgage Association, 5.500%, 4/1/53 | 1,157,016 |
| 1,132,793 | Federal National Mortgage Association, 5.500%, 4/1/53 | 1,130,058 |
| 184,751 | Federal National Mortgage Association, 5.500%, 4/1/53 | 185,915 |
| 584,510 | Federal National Mortgage Association, 5.500%, 4/1/53 | 582,904 |
| 471,106 | Federal National Mortgage Association, 5.500%, 4/1/53 | 471,902 |
| 278,607 | Federal National Mortgage Association, 5.500%, 4/1/53 | 278,835 |
| 1,633,599 | Federal National Mortgage Association, 5.500%, 7/1/53 | 1,642,022 |
| 12,518,784 | Federal National Mortgage Association, 5.500%, 9/1/53 | 12,455,663 |
| 2,522,113 | Federal National Mortgage Association, 5.500%, 9/1/53 | 2,509,396 |
| 313 | Federal National Mortgage Association, 6.000%, 3/1/32 | 320 |
| 552 | Federal National Mortgage Association, 6.000%, 10/1/32 | 565 |
The accompanying notes are an integral part of these financial statements.
Pioneer Strategic Income Fund | Semiannual Report | 3/31/2459
Schedule of Investments | 3/31/24
(unaudited) (continued)
Principal
Amount
USD ($) | | | | | | Value |
| | U.S. Government and Agency
Obligations — (continued) | |
| 2,487 | Federal National Mortgage Association, 6.000%, 11/1/32 | $ 2,522 |
| 7,135 | Federal National Mortgage Association, 6.000%, 12/1/32 | 7,239 |
| 2,479 | Federal National Mortgage Association, 6.000%, 1/1/33 | 2,538 |
| 1,288 | Federal National Mortgage Association, 6.000%, 3/1/33 | 1,326 |
| 8,718 | Federal National Mortgage Association, 6.000%, 5/1/33 | 8,905 |
| 20,835 | Federal National Mortgage Association, 6.000%, 12/1/33 | 21,541 |
| 16,258 | Federal National Mortgage Association, 6.000%, 1/1/34 | 16,769 |
| 77,865 | Federal National Mortgage Association, 6.000%, 6/1/37 | 80,237 |
| 34,417 | Federal National Mortgage Association, 6.000%, 12/1/37 | 35,651 |
| 57,643 | Federal National Mortgage Association, 6.000%, 4/1/38 | 59,711 |
| 13,471 | Federal National Mortgage Association, 6.000%, 7/1/38 | 13,676 |
| 1,675,843 | Federal National Mortgage Association, 6.000%, 1/1/53 | 1,725,058 |
| 521,892 | Federal National Mortgage Association, 6.000%, 1/1/53 | 534,129 |
| 516,494 | Federal National Mortgage Association, 6.000%, 2/1/53 | 523,148 |
| 188,033 | Federal National Mortgage Association, 6.000%, 2/1/53 | 194,162 |
| 144,089 | Federal National Mortgage Association, 6.000%, 3/1/53 | 146,114 |
| 178,637 | Federal National Mortgage Association, 6.000%, 3/1/53 | 181,667 |
| 346,460 | Federal National Mortgage Association, 6.000%, 4/1/53 | 350,357 |
| 596,570 | Federal National Mortgage Association, 6.000%, 4/1/53 | 604,639 |
| 3,248,514 | Federal National Mortgage Association, 6.000%, 5/1/53 | 3,341,258 |
| 1,734,682 | Federal National Mortgage Association, 6.000%, 5/1/53 | 1,772,536 |
The accompanying notes are an integral part of these financial statements.
60Pioneer Strategic Income Fund | Semiannual Report | 3/31/24
Principal
Amount
USD ($) | | | | | | Value |
| | U.S. Government and Agency
Obligations — (continued) | |
| 194,082 | Federal National Mortgage Association, 6.000%, 6/1/53 | $ 198,523 |
| 198,333 | Federal National Mortgage Association, 6.000%, 6/1/53 | 201,299 |
| 198,461 | Federal National Mortgage Association, 6.000%, 6/1/53 | 200,342 |
| 198,460 | Federal National Mortgage Association, 6.000%, 6/1/53 | 200,799 |
| 136,046 | Federal National Mortgage Association, 6.000%, 6/1/53 | 137,637 |
| 336,309 | Federal National Mortgage Association, 6.000%, 6/1/53 | 343,934 |
| 289,895 | Federal National Mortgage Association, 6.000%, 6/1/53 | 294,825 |
| 2,493,554 | Federal National Mortgage Association, 6.000%, 8/1/53 | 2,542,850 |
| 9,480,727 | Federal National Mortgage Association, 6.000%, 9/1/53 | 9,567,659 |
| 708,025 | Federal National Mortgage Association, 6.000%, 2/1/54 | 721,377 |
| 9,543,187 | Federal National Mortgage Association, 6.000%, 2/1/54 | 9,629,425 |
| 314,193 | Federal National Mortgage Association, 6.000%, 3/1/54 | 317,032 |
| 502,200 | Federal National Mortgage Association, 6.000%, 3/1/54 | 507,588 |
| 225 | Federal National Mortgage Association, 6.500%, 5/1/31 | 231 |
| 77 | Federal National Mortgage Association, 6.500%, 6/1/31 | 79 |
| 192 | Federal National Mortgage Association, 6.500%, 2/1/32 | 200 |
| 1,390 | Federal National Mortgage Association, 6.500%, 3/1/32 | 1,431 |
| 529 | Federal National Mortgage Association, 6.500%, 8/1/32 | 541 |
| 144,217 | Federal National Mortgage Association, 6.500%, 2/1/53 | 148,858 |
| 1,291,134 | Federal National Mortgage Association, 6.500%, 3/1/53 | 1,337,735 |
| 261,470 | Federal National Mortgage Association, 6.500%, 3/1/53 | 271,415 |
The accompanying notes are an integral part of these financial statements.
Pioneer Strategic Income Fund | Semiannual Report | 3/31/2461
Schedule of Investments | 3/31/24
(unaudited) (continued)
Principal
Amount
USD ($) | | | | | | Value |
| | U.S. Government and Agency
Obligations — (continued) | |
| 862,247 | Federal National Mortgage Association, 6.500%, 3/1/53 | $ 892,058 |
| 176,714 | Federal National Mortgage Association, 6.500%, 4/1/53 | 182,440 |
| 194,585 | Federal National Mortgage Association, 6.500%, 4/1/53 | 203,133 |
| 219,679 | Federal National Mortgage Association, 6.500%, 4/1/53 | 225,978 |
| 199,842 | Federal National Mortgage Association, 6.500%, 2/1/54 | 204,600 |
| 55,000,000 | Federal National Mortgage Association, 6.500%, 4/15/54 (TBA) | 56,189,000 |
| 120 | Federal National Mortgage Association, 7.000%, 5/1/28 | 124 |
| 76 | Federal National Mortgage Association, 7.000%, 2/1/29 | 78 |
| 215 | Federal National Mortgage Association, 7.000%, 7/1/31 | 221 |
| 54 | Federal National Mortgage Association, 7.500%, 1/1/28 | 54 |
| 3,000,000 | Government National Mortgage Association, 2.000%, 4/15/54 (TBA) | 2,457,338 |
| 6,000,000 | Government National Mortgage Association, 2.500%, 4/15/54 (TBA) | 5,109,699 |
| 9,000,000 | Government National Mortgage Association, 6.000%, 4/15/54 (TBA) | 9,078,661 |
| 8,000,000 | Government National Mortgage Association, 6.500%, 4/15/54 (TBA) | 8,133,383 |
| 400,617 | Government National Mortgage Association I, 3.500%, 10/15/42 | 373,013 |
| 1,497 | Government National Mortgage Association I, 4.000%, 3/15/39 | 1,434 |
| 2,722 | Government National Mortgage Association I, 4.000%, 4/15/39 | 2,581 |
| 2,405 | Government National Mortgage Association I, 4.000%, 4/15/39 | 2,300 |
| 3,863 | Government National Mortgage Association I, 4.000%, 7/15/39 | 3,658 |
| 3,340 | Government National Mortgage Association I, 4.000%, 1/15/40 | 3,179 |
| 57,528 | Government National Mortgage Association I, 4.000%, 4/15/40 | 54,750 |
The accompanying notes are an integral part of these financial statements.
62Pioneer Strategic Income Fund | Semiannual Report | 3/31/24
Principal
Amount
USD ($) | | | | | | Value |
| | U.S. Government and Agency
Obligations — (continued) | |
| 93,516 | Government National Mortgage Association I, 4.000%, 7/15/40 | $ 88,536 |
| 60,008 | Government National Mortgage Association I, 4.000%, 8/15/40 | 57,109 |
| 32,137 | Government National Mortgage Association I, 4.000%, 8/15/40 | 30,426 |
| 16,513 | Government National Mortgage Association I, 4.000%, 9/15/40 | 15,716 |
| 19,740 | Government National Mortgage Association I, 4.000%, 10/15/40 | 18,904 |
| 4,856 | Government National Mortgage Association I, 4.000%, 10/15/40 | 4,627 |
| 2,893 | Government National Mortgage Association I, 4.000%, 10/15/40 | 2,767 |
| 2,052 | Government National Mortgage Association I, 4.000%, 11/15/40 | 1,963 |
| 18,640 | Government National Mortgage Association I, 4.000%, 11/15/40 | 17,931 |
| 53,717 | Government National Mortgage Association I, 4.000%, 11/15/40 | 51,120 |
| 57,383 | Government National Mortgage Association I, 4.000%, 11/15/40 | 54,327 |
| 351,323 | Government National Mortgage Association I, 4.000%, 12/15/40 | 334,344 |
| 2,575 | Government National Mortgage Association I, 4.000%, 12/15/40 | 2,451 |
| 2,666 | Government National Mortgage Association I, 4.000%, 12/15/40 | 2,537 |
| 761 | Government National Mortgage Association I, 4.000%, 1/15/41 | 724 |
| 11,737 | Government National Mortgage Association I, 4.000%, 1/15/41 | 11,227 |
| 9,481 | Government National Mortgage Association I, 4.000%, 1/15/41 | 9,022 |
| 4,810 | Government National Mortgage Association I, 4.000%, 2/15/41 | 4,578 |
| 228,644 | Government National Mortgage Association I, 4.000%, 2/15/41 | 217,594 |
| 22,582 | Government National Mortgage Association I, 4.000%, 3/15/41 | 21,602 |
| 3,981 | Government National Mortgage Association I, 4.000%, 4/15/41 | 3,808 |
The accompanying notes are an integral part of these financial statements.
Pioneer Strategic Income Fund | Semiannual Report | 3/31/2463
Schedule of Investments | 3/31/24
(unaudited) (continued)
Principal
Amount
USD ($) | | | | | | Value |
| | U.S. Government and Agency
Obligations — (continued) | |
| 11,594 | Government National Mortgage Association I, 4.000%, 5/15/41 | $ 11,000 |
| 4,448 | Government National Mortgage Association I, 4.000%, 5/15/41 | 4,211 |
| 1,076 | Government National Mortgage Association I, 4.000%, 6/15/41 | 1,024 |
| 720 | Government National Mortgage Association I, 4.000%, 6/15/41 | 689 |
| 553,011 | Government National Mortgage Association I, 4.000%, 6/15/41 | 523,554 |
| 12,506 | Government National Mortgage Association I, 4.000%, 7/15/41 | 11,964 |
| 2,599 | Government National Mortgage Association I, 4.000%, 7/15/41 | 2,486 |
| 88,928 | Government National Mortgage Association I, 4.000%, 7/15/41 | 85,068 |
| 45,304 | Government National Mortgage Association I, 4.000%, 7/15/41 | 43,114 |
| 26,058 | Government National Mortgage Association I, 4.000%, 7/15/41 | 24,799 |
| 3,336 | Government National Mortgage Association I, 4.000%, 8/15/41 | 3,159 |
| 35,386 | Government National Mortgage Association I, 4.000%, 8/15/41 | 33,676 |
| 2,394 | Government National Mortgage Association I, 4.000%, 8/15/41 | 2,266 |
| 24,456 | Government National Mortgage Association I, 4.000%, 9/15/41 | 23,274 |
| 4,408 | Government National Mortgage Association I, 4.000%, 9/15/41 | 4,217 |
| 10,486 | Government National Mortgage Association I, 4.000%, 9/15/41 | 9,948 |
| 5,480 | Government National Mortgage Association I, 4.000%, 9/15/41 | 5,243 |
| 173,190 | Government National Mortgage Association I, 4.000%, 9/15/41 | 164,820 |
| 95,515 | Government National Mortgage Association I, 4.000%, 9/15/41 | 90,569 |
| 2,352 | Government National Mortgage Association I, 4.000%, 9/15/41 | 2,252 |
| 2,279 | Government National Mortgage Association I, 4.000%, 10/15/41 | 2,180 |
The accompanying notes are an integral part of these financial statements.
64Pioneer Strategic Income Fund | Semiannual Report | 3/31/24
Principal
Amount
USD ($) | | | | | | Value |
| | U.S. Government and Agency
Obligations — (continued) | |
| 1,717 | Government National Mortgage Association I, 4.000%, 10/15/41 | $ 1,634 |
| 5,500 | Government National Mortgage Association I, 4.000%, 10/15/41 | 5,234 |
| 4,969 | Government National Mortgage Association I, 4.000%, 10/15/41 | 4,725 |
| 3,325 | Government National Mortgage Association I, 4.000%, 10/15/41 | 3,165 |
| 3,840 | Government National Mortgage Association I, 4.000%, 11/15/41 | 3,673 |
| 80,619 | Government National Mortgage Association I, 4.000%, 11/15/41 | 76,723 |
| 5,450 | Government National Mortgage Association I, 4.000%, 11/15/41 | 5,187 |
| 11,367 | Government National Mortgage Association I, 4.000%, 12/15/41 | 10,705 |
| 4,175 | Government National Mortgage Association I, 4.000%, 12/15/41 | 3,994 |
| 5,266 | Government National Mortgage Association I, 4.000%, 12/15/41 | 5,011 |
| 406,937 | Government National Mortgage Association I, 4.000%, 1/15/42 | 389,273 |
| 1,708 | Government National Mortgage Association I, 4.000%, 2/15/42 | 1,634 |
| 69,776 | Government National Mortgage Association I, 4.000%, 2/15/42 | 66,403 |
| 25,207 | Government National Mortgage Association I, 4.000%, 2/15/42 | 23,914 |
| 970 | Government National Mortgage Association I, 4.000%, 2/15/42 | 918 |
| 4,622 | Government National Mortgage Association I, 4.000%, 2/15/42 | 4,421 |
| 731,141 | Government National Mortgage Association I, 4.000%, 5/15/42 | 695,793 |
| 35,595 | Government National Mortgage Association I, 4.000%, 6/15/42 | 34,049 |
| 23,058 | Government National Mortgage Association I, 4.000%, 6/15/42 | 21,943 |
| 21,409 | Government National Mortgage Association I, 4.000%, 6/15/42 | 20,479 |
| 4,079 | Government National Mortgage Association I, 4.000%, 10/15/42 | 3,902 |
The accompanying notes are an integral part of these financial statements.
Pioneer Strategic Income Fund | Semiannual Report | 3/31/2465
Schedule of Investments | 3/31/24
(unaudited) (continued)
Principal
Amount
USD ($) | | | | | | Value |
| | U.S. Government and Agency
Obligations — (continued) | |
| 230,276 | Government National Mortgage Association I, 4.000%, 4/15/43 | $ 220,279 |
| 103,254 | Government National Mortgage Association I, 4.000%, 5/15/43 | 98,773 |
| 1,333 | Government National Mortgage Association I, 4.000%, 5/15/43 | 1,262 |
| 118,975 | Government National Mortgage Association I, 4.000%, 8/15/43 | 113,223 |
| 58,137 | Government National Mortgage Association I, 4.000%, 9/15/43 | 55,442 |
| 2,956 | Government National Mortgage Association I, 4.000%, 9/15/43 | 2,813 |
| 41,842 | Government National Mortgage Association I, 4.000%, 2/15/44 | 40,026 |
| 24,447 | Government National Mortgage Association I, 4.000%, 3/15/44 | 23,408 |
| 611,207 | Government National Mortgage Association I, 4.000%, 3/15/44 | 581,651 |
| 915,592 | Government National Mortgage Association I, 4.000%, 3/15/44 | 871,314 |
| 32,070 | Government National Mortgage Association I, 4.000%, 3/15/44 | 30,637 |
| 16,711 | Government National Mortgage Association I, 4.000%, 3/15/44 | 15,861 |
| 175,821 | Government National Mortgage Association I, 4.000%, 3/15/44 | 172,527 |
| 253,895 | Government National Mortgage Association I, 4.000%, 4/15/44 | 240,366 |
| 179,645 | Government National Mortgage Association I, 4.000%, 4/15/44 | 170,032 |
| 2,256 | Government National Mortgage Association I, 4.000%, 4/15/44 | 2,143 |
| 34,452 | Government National Mortgage Association I, 4.000%, 4/15/44 | 32,843 |
| 67,951 | Government National Mortgage Association I, 4.000%, 5/15/44 | 64,330 |
| 301,758 | Government National Mortgage Association I, 4.000%, 8/15/44 | 285,550 |
| 13,504 | Government National Mortgage Association I, 4.000%, 8/15/44 | 12,655 |
| 316,969 | Government National Mortgage Association I, 4.000%, 8/15/44 | 301,640 |
The accompanying notes are an integral part of these financial statements.
66Pioneer Strategic Income Fund | Semiannual Report | 3/31/24
Principal
Amount
USD ($) | | | | | | Value |
| | U.S. Government and Agency
Obligations — (continued) | |
| 71,737 | Government National Mortgage Association I, 4.000%, 8/15/44 | $ 67,809 |
| 15,289 | Government National Mortgage Association I, 4.000%, 8/15/44 | 14,492 |
| 913,059 | Government National Mortgage Association I, 4.000%, 9/15/44 | 868,053 |
| 65,774 | Government National Mortgage Association I, 4.000%, 9/15/44 | 62,471 |
| 89,592 | Government National Mortgage Association I, 4.000%, 9/15/44 | 86,075 |
| 2,402 | Government National Mortgage Association I, 4.000%, 9/15/44 | 2,283 |
| 54,509 | Government National Mortgage Association I, 4.000%, 9/15/44 | 51,969 |
| 94,125 | Government National Mortgage Association I, 4.000%, 9/15/44 | 89,922 |
| 491,654 | Government National Mortgage Association I, 4.000%, 9/15/44 | 466,641 |
| 57,183 | Government National Mortgage Association I, 4.000%, 9/15/44 | 53,569 |
| 32,096 | Government National Mortgage Association I, 4.000%, 9/15/44 | 30,607 |
| 66,702 | Government National Mortgage Association I, 4.000%, 9/15/44 | 63,332 |
| 577,841 | Government National Mortgage Association I, 4.000%, 9/15/44 | 552,751 |
| 1,330,847 | Government National Mortgage Association I, 4.000%, 9/15/44 | 1,256,612 |
| 28,542 | Government National Mortgage Association I, 4.000%, 10/15/44 | 27,118 |
| 7,571 | Government National Mortgage Association I, 4.000%, 11/15/44 | 7,211 |
| 6,196 | Government National Mortgage Association I, 4.000%, 11/15/44 | 5,857 |
| 31,450 | Government National Mortgage Association I, 4.000%, 11/15/44 | 29,870 |
| 4,071 | Government National Mortgage Association I, 4.000%, 11/15/44 | 3,844 |
| 138,289 | Government National Mortgage Association I, 4.000%, 12/15/44 | 131,828 |
| 42,155 | Government National Mortgage Association I, 4.000%, 12/15/44 | 39,977 |
The accompanying notes are an integral part of these financial statements.
Pioneer Strategic Income Fund | Semiannual Report | 3/31/2467
Schedule of Investments | 3/31/24
(unaudited) (continued)
Principal
Amount
USD ($) | | | | | | Value |
| | U.S. Government and Agency
Obligations — (continued) | |
| 18,902 | Government National Mortgage Association I, 4.000%, 12/15/44 | $ 18,081 |
| 1,839 | Government National Mortgage Association I, 4.000%, 12/15/44 | 1,736 |
| 58,062 | Government National Mortgage Association I, 4.000%, 12/15/44 | 54,919 |
| 169,578 | Government National Mortgage Association I, 4.000%, 1/15/45 | 160,084 |
| 324,217 | Government National Mortgage Association I, 4.000%, 1/15/45 | 305,730 |
| 56,648 | Government National Mortgage Association I, 4.000%, 1/15/45 | 53,418 |
| 275,098 | Government National Mortgage Association I, 4.000%, 1/15/45 | 260,440 |
| 28,120 | Government National Mortgage Association I, 4.000%, 2/15/45 | 26,679 |
| 96,549 | Government National Mortgage Association I, 4.000%, 2/15/45 | 91,881 |
| 63,217 | Government National Mortgage Association I, 4.000%, 2/15/45 | 60,003 |
| 41,242 | Government National Mortgage Association I, 4.000%, 2/15/45 | 39,001 |
| 129,226 | Government National Mortgage Association I, 4.000%, 2/15/45 | 121,831 |
| 67,092 | Government National Mortgage Association I, 4.000%, 4/15/45 | 63,681 |
| 37,172 | Government National Mortgage Association I, 4.000%, 5/15/45 | 35,328 |
| 15,265 | Government National Mortgage Association I, 4.000%, 7/15/45 | 14,388 |
| 50,620 | Government National Mortgage Association I, 4.000%, 9/15/45 | 47,858 |
| 33,771 | Government National Mortgage Association I, 4.500%, 9/15/33 | 33,032 |
| 45,722 | Government National Mortgage Association I, 4.500%, 10/15/33 | 44,563 |
| 18,982 | Government National Mortgage Association I, 4.500%, 4/15/35 | 18,495 |
| 420,624 | Government National Mortgage Association I, 4.500%, 3/15/38 | 413,917 |
| 151,468 | Government National Mortgage Association I, 4.500%, 1/15/40 | 149,081 |
The accompanying notes are an integral part of these financial statements.
68Pioneer Strategic Income Fund | Semiannual Report | 3/31/24
Principal
Amount
USD ($) | | | | | | Value |
| | U.S. Government and Agency
Obligations — (continued) | |
| 239,060 | Government National Mortgage Association I, 4.500%, 6/15/40 | $ 234,428 |
| 78,283 | Government National Mortgage Association I, 4.500%, 9/15/40 | 77,020 |
| 401,269 | Government National Mortgage Association I, 4.500%, 11/15/40 | 393,820 |
| 544,937 | Government National Mortgage Association I, 4.500%, 6/15/41 | 536,986 |
| 102,853 | Government National Mortgage Association I, 4.500%, 6/15/41 | 100,843 |
| 150,606 | Government National Mortgage Association I, 4.500%, 7/15/41 | 147,261 |
| 229,380 | Government National Mortgage Association I, 4.500%, 8/15/41 | 223,351 |
| 128,577 | Government National Mortgage Association I, 5.000%, 9/15/33 | 129,509 |
| 47,239 | Government National Mortgage Association I, 5.125%, 10/15/38 | 47,922 |
| 26,129 | Government National Mortgage Association I, 5.500%, 7/15/33 | 26,744 |
| 40,618 | Government National Mortgage Association I, 5.500%, 1/15/34 | 41,624 |
| 33,388 | Government National Mortgage Association I, 5.500%, 4/15/34 | 34,215 |
| 56,979 | Government National Mortgage Association I, 5.500%, 7/15/34 | 58,390 |
| 62,657 | Government National Mortgage Association I, 5.500%, 10/15/34 | 63,978 |
| 40,945 | Government National Mortgage Association I, 5.500%, 1/15/35 | 41,959 |
| 70,429 | Government National Mortgage Association I, 5.500%, 2/15/35 | 72,175 |
| 69,174 | Government National Mortgage Association I, 5.500%, 2/15/35 | 70,890 |
| 11,334 | Government National Mortgage Association I, 5.500%, 6/15/35 | 11,615 |
| 13,498 | Government National Mortgage Association I, 5.500%, 12/15/35 | 13,833 |
| 3 | Government National Mortgage Association I, 5.500%, 2/15/37 | 3 |
| 8,270 | Government National Mortgage Association I, 5.500%, 3/15/37 | 8,404 |
The accompanying notes are an integral part of these financial statements.
Pioneer Strategic Income Fund | Semiannual Report | 3/31/2469
Schedule of Investments | 3/31/24
(unaudited) (continued)
Principal
Amount
USD ($) | | | | | | Value |
| | U.S. Government and Agency
Obligations — (continued) | |
| 39,035 | Government National Mortgage Association I, 5.500%, 3/15/37 | $ 40,002 |
| 121,045 | Government National Mortgage Association I, 5.750%, 10/15/38 | 125,071 |
| 16,002 | Government National Mortgage Association I, 5.750%, 10/15/38 | 16,654 |
| 28,255 | Government National Mortgage Association I, 6.000%, 8/15/32 | 28,752 |
| 24,264 | Government National Mortgage Association I, 6.000%, 1/15/33 | 25,055 |
| 21,453 | Government National Mortgage Association I, 6.000%, 2/15/33 | 22,249 |
| 37,784 | Government National Mortgage Association I, 6.000%, 2/15/33 | 38,999 |
| 1,742 | Government National Mortgage Association I, 6.000%, 3/15/33 | 1,768 |
| 9,931 | Government National Mortgage Association I, 6.000%, 3/15/33 | 10,158 |
| 26,587 | Government National Mortgage Association I, 6.000%, 3/15/33 | 27,272 |
| 5,527 | Government National Mortgage Association I, 6.000%, 5/15/33 | 5,603 |
| 18,889 | Government National Mortgage Association I, 6.000%, 5/15/33 | 19,189 |
| 38,104 | Government National Mortgage Association I, 6.000%, 5/15/33 | 38,758 |
| 22,518 | Government National Mortgage Association I, 6.000%, 6/15/33 | 23,137 |
| 44,398 | Government National Mortgage Association I, 6.000%, 6/15/33 | 46,034 |
| 45,367 | Government National Mortgage Association I, 6.000%, 7/15/33 | 46,839 |
| 19,908 | Government National Mortgage Association I, 6.000%, 7/15/33 | 20,388 |
| 13,301 | Government National Mortgage Association I, 6.000%, 9/15/33 | 13,458 |
| 54,728 | Government National Mortgage Association I, 6.000%, 11/15/33 | 55,893 |
| 11,645 | Government National Mortgage Association I, 6.000%, 1/15/34 | 11,961 |
| 105,036 | Government National Mortgage Association I, 6.000%, 10/15/37 | 107,868 |
The accompanying notes are an integral part of these financial statements.
70Pioneer Strategic Income Fund | Semiannual Report | 3/31/24
Principal
Amount
USD ($) | | | | | | Value |
| | U.S. Government and Agency
Obligations — (continued) | |
| 125,486 | Government National Mortgage Association I, 6.000%, 7/15/38 | $ 130,608 |
| 2,527 | Government National Mortgage Association I, 6.500%, 1/15/29 | 2,576 |
| 278 | Government National Mortgage Association I, 6.500%, 5/15/29 | 283 |
| 856 | Government National Mortgage Association I, 6.500%, 10/15/31 | 875 |
| 75 | Government National Mortgage Association I, 6.500%, 12/15/31 | 78 |
| 534 | Government National Mortgage Association I, 6.500%, 2/15/32 | 556 |
| 277 | Government National Mortgage Association I, 6.500%, 3/15/32 | 284 |
| 2,396 | Government National Mortgage Association I, 6.500%, 5/15/32 | 2,438 |
| 1,722 | Government National Mortgage Association I, 6.500%, 6/15/32 | 1,771 |
| 2,154 | Government National Mortgage Association I, 6.500%, 7/15/32 | 2,228 |
| 1,109 | Government National Mortgage Association I, 6.500%, 7/15/32 | 1,143 |
| 789 | Government National Mortgage Association I, 6.500%, 8/15/32 | 811 |
| 9,871 | Government National Mortgage Association I, 6.500%, 8/15/32 | 10,124 |
| 609 | Government National Mortgage Association I, 6.500%, 8/15/32 | 622 |
| 13,492 | Government National Mortgage Association I, 6.500%, 9/15/32 | 13,908 |
| 22,028 | Government National Mortgage Association I, 6.500%, 9/15/32 | 22,744 |
| 6,908 | Government National Mortgage Association I, 6.500%, 10/15/32 | 7,030 |
| 12,872 | Government National Mortgage Association I, 6.500%, 11/15/32 | 13,099 |
| 16,964 | Government National Mortgage Association I, 6.500%, 7/15/35 | 17,487 |
| 116 | Government National Mortgage Association I, 7.000%, 5/15/29 | 118 |
| 62 | Government National Mortgage Association I, 7.000%, 5/15/29 | 62 |
The accompanying notes are an integral part of these financial statements.
Pioneer Strategic Income Fund | Semiannual Report | 3/31/2471
Schedule of Investments | 3/31/24
(unaudited) (continued)
Principal
Amount
USD ($) | | | | | | Value |
| | U.S. Government and Agency
Obligations — (continued) | |
| 144 | Government National Mortgage Association I, 7.000%, 5/15/31 | $ 144 |
| 514,200 | Government National Mortgage Association II, 3.500%, 4/20/45 | 472,845 |
| 874,887 | Government National Mortgage Association II, 3.500%, 4/20/45 | 805,751 |
| 380,607 | Government National Mortgage Association II, 3.500%, 4/20/45 | 349,744 |
| 877,024 | Government National Mortgage Association II, 3.500%, 3/20/46 | 810,091 |
| 1,912,280 | Government National Mortgage Association II, 4.000%, 10/20/46 | 1,819,811 |
| 860,244 | Government National Mortgage Association II, 4.000%, 2/20/48 | 809,071 |
| 1,096,135 | Government National Mortgage Association II, 4.000%, 4/20/48 | 1,030,924 |
| 128,136 | Government National Mortgage Association II, 4.500%, 12/20/34 | 126,425 |
| 115,992 | Government National Mortgage Association II, 4.500%, 1/20/35 | 114,443 |
| 102,777 | Government National Mortgage Association II, 4.500%, 3/20/35 | 101,405 |
| 990,636 | Government National Mortgage Association II, 4.500%, 9/20/41 | 976,161 |
| 1,412,252 | Government National Mortgage Association II, 4.500%, 9/20/44 | 1,394,223 |
| 621,949 | Government National Mortgage Association II, 4.500%, 10/20/44 | 613,623 |
| 1,199,799 | Government National Mortgage Association II, 4.500%, 11/20/44 | 1,183,737 |
| 465,278 | Government National Mortgage Association II, 5.000%, 12/20/52 | 457,430 |
| 31,312 | Government National Mortgage Association II, 5.500%, 3/20/34 | 32,273 |
| 821 | Government National Mortgage Association II, 5.500%, 10/20/37 | 836 |
| 2,726,981 | Government National Mortgage Association II, 5.500%, 12/20/52 | 2,726,974 |
| 12,180 | Government National Mortgage Association II, 6.000%, 5/20/32 | 12,500 |
| 46,237 | Government National Mortgage Association II, 6.000%, 10/20/33 | 48,095 |
The accompanying notes are an integral part of these financial statements.
72Pioneer Strategic Income Fund | Semiannual Report | 3/31/24
Principal
Amount
USD ($) | | | | | | Value |
| | U.S. Government and Agency
Obligations — (continued) | |
| 39 | Government National Mortgage Association II, 6.500%, 1/20/28 | $ 39 |
| 835 | Government National Mortgage Association II, 7.000%, 1/20/29 | 853 |
| 45,000,000(g) | U.S. Treasury Bills, 4/9/24 | 44,947,585 |
| 64,206,200 | U.S. Treasury Bonds, 2.250%, 2/15/52 | 42,233,133 |
| 27,339,600 | U.S. Treasury Bonds, 4.375%, 8/15/43 | 27,014,942 |
| 30,846,362 | U.S. Treasury Inflation Indexed Bonds, 1.500%, 2/15/53 | 26,922,344 |
| 26,000,000 | U.S. Treasury Notes, 4.250%, 2/28/29 | 26,034,531 |
| 155,870,400 | U.S. Treasury Notes, 4.500%, 9/30/30 | 159,286,153 |
| | Total U.S. Government and Agency Obligations
(Cost $1,108,578,390) | $1,091,278,622 |
|
|
| | SHORT TERM INVESTMENTS — 1.7% of
Net Assets | |
| | Repurchase Agreements — 1.4% | |
| 30,000,000 | Bank of America, 5.32%, dated 3/28/24,
to be purchased on 4/1/24 for $30,017,733,
collateralized by $30,600,087 U.S. Treasury
Bond, 4.125%, 8/15/53 | $ 30,000,000 |
| 15,000,000 | Bank of America, 5.33%, dated 3/28/24,
to be purchased on 4/1/24 for $15,008,883,
collateralized by the following:
$6,209,529 Federal National Mortgage
Association, 3.825-3.96%, 10/1/28-2/1/31,
$ 9,090,471 Government National Mortgage
Association, 3.5%-6.5%, 1/15/42-12/20/61 | 15,000,000 |
| | | | | | | $ 45,000,000 |
|
|
| | Foreign Treasury Obligations — 0.3% | |
| EGP 668,125,000(n) | Egypt Treasury Bills, 32.177%, 3/11/25 | $ 11,158,302 |
| | | | | | | $ 11,158,302 |
|
|
| | TOTAL SHORT TERM INVESTMENTS
(Cost $55,433,228) | $56,158,302 |
|
|
The accompanying notes are an integral part of these financial statements.
Pioneer Strategic Income Fund | Semiannual Report | 3/31/2473
Schedule of Investments | 3/31/24
(unaudited) (continued)
Number of
Contracts | Description | Counterparty | Amount | Strike
Price | Expiration
Date | Value |
| | Over The Counter (OTC) Currency Put Option Purchased — 0.1% | |
| 169,000,000 | Put USD/Call JPY | Citibank NA | USD 6,267,365 | USD 137.28 | 1/8/25 | $ 1,904,890 |
| | Total Over The Counter (OTC) Currency Put Option Purchased
(Premiums paid $ 6,267,365) | $ 1,904,890 |
|
|
| | TOTAL OPTIONS PURCHASED
(Premiums paid $ 6,267,365) | $ 1,904,890 |
|
|
| | TOTAL INVESTMENTS IN UNAFFILIATED ISSUERS — 106.0%
(Cost $3,679,836,910) | $3,456,454,962 |
Principal
Amount
USD ($) | | | | | | |
| | TBA Sales Commitments — (3.8)% of
Net Assets | |
| | U.S. Government and Agency
Obligations — (3.8)% | |
| (87,000,000) | Federal National Mortgage Association, 5.500%, 4/1/54 (TBA) | $ (86,568,156) |
| (35,500,000) | Federal National Mortgage Association, 6.000%, 4/1/54 (TBA) | (35,823,190) |
| | TOTAL TBA SALES COMMITMENTS
(Proceeds $122,536,492) | $(122,391,346) |
|
|
Number of
Contracts | Description | Counterparty | Amount | Strike
Price | Expiration
Date | |
| | Over The Counter (OTC) Currency Put Option Written — (0.0)%† | |
| (84,500,000) | Put USD/Call JPY | Citibank NA | USD 3,061,858 | USD 137.28 | 1/8/25 | $ (952,445) |
| | Total Over The Counter (OTC) Currency Put Option Written
(Premiums received $3,061,858) | $ (952,445) |
|
|
| | OTHER ASSETS AND LIABILITIES — (2.2)% | $ (72,116,790) |
| | net assets — 100.0% | $3,260,994,381 |
| | | | | | | |
| (TBA) | “To Be Announced” Securities. |
| bps | Basis Points. |
| CMT | Constant Maturity Treasury Index. |
| FREMF | Freddie Mac Multifamily Fixed-Rate Mortgage Loans. |
| FRESB | Freddie Mac Multifamily Small Balance Certificates. |
| LIBOR | London Interbank Offered Rate. |
| REMICs | Real Estate Mortgage Investment Conduits. |
| SOFR | Secured Overnight Financing Rate. |
The accompanying notes are an integral part of these financial statements.
74Pioneer Strategic Income Fund | Semiannual Report | 3/31/24
| SOFR30A | Secured Overnight Financing Rate 30 Day Average. |
| (144A) | The resale of such security is exempt from registration under Rule 144A of the Securities Act of 1933. Such securities may be resold normally to qualified institutional buyers. At March 31, 2024, the value of these securities amounted to $1,655,845,546, or 50.8% of net assets. |
| (a) | Floating rate note. Coupon rate, reference index and spread shown at March 31, 2024. |
| (b) | This term loan will settle after March 31, 2024, at which time the interest rate will be determined. |
| (c) | Non-income producing security. |
| (d) | The interest rate is subject to change periodically. The interest rate and/or reference index and spread shown at March 31, 2024. |
| (e) | Debt obligation initially issued at one coupon which converts to a higher coupon at a specific date. The rate shown is the rate at March 31, 2024. |
| (f) | Security represents the interest-only portion payments on a pool of underlying mortgages or mortgage-backed securities. |
| (g) | Security issued with a zero coupon. Income is recognized through accretion of discount. |
| (h) | Payment-in-kind (PIK) security which may pay interest in the form of additional principal amount. |
| (i) | Security is perpetual in nature and has no stated maturity date. |
| (j) | Security is in default. |
| (k) | Securities purchased on a when-issued basis. Rates do not take effect until settlement date. |
| (l) | Issued as participation notes. |
| (m) | Issued as preference shares. |
| (n) | Rate shown represents yield-to-maturity. |
| * | Senior secured floating rate loan interests in which the Fund invests generally pay interest at rates that are periodically re-determined by reference to a base lending rate plus a premium. These base lending rates are generally (i) the lending rate offered by one or more major European banks, such as LIBOR or SOFR, (ii) the prime rate offered by one or more major United States banks, (iii) the rate of a certificate of deposit or (iv) other base lending rates used by commercial lenders. The interest rate shown is the rate accruing at March 31, 2024. |
| + | Security is valued using significant unobservable inputs (Level 3). |
| † | Amount rounds to less than 0.1%. |
| # | Securities are restricted as to resale. |
| Restricted Securities | Acquisition date | Cost | Value |
| Adare Re 2022-2 | 10/20/2022 | $1,613,807 | $ 1,812,375 |
| Alamo Re | 4/12/2023 | 1,005,203 | 1,029,000 |
| Alamo Re | 11/15/2023 | 1,757,521 | 1,768,725 |
| Alturas Re 2020-3 | 7/1/2020 | — | — |
| Alturas Re 2021-3 | 8/16/2021 | 26,290 | 10,047 |
| Alturas Re 2022-2 | 1/18/2022 | 141,453 | 270,314 |
The accompanying notes are an integral part of these financial statements.
Pioneer Strategic Income Fund | Semiannual Report | 3/31/2475
Schedule of Investments | 3/31/24
(unaudited) (continued)
| Restricted Securities | Acquisition date | Cost | Value |
| Aquila Re | 5/10/2023 | $ 750,000 | $ 766,350 |
| Atlas Capital | 5/17/2023 | 1,250,000 | 1,302,875 |
| Ballybunion Re 2022 | 3/9/2022 | — | — |
| Ballybunion Re 2023 | 3/20/2023 | 2,547,857 | 2,890,500 |
| Bantry Re 2021 | 1/11/2021 | 41,160 | 24,310 |
| Bantry Re 2023 | 1/12/2023 | — | 113,572 |
| Bantry Re 2024 | 2/1/2024 | 5,000,000 | 5,197,595 |
| Berwick Re 2020-1 | 9/24/2020 | — | 14,352 |
| Berwick Re 2024-1 | 1/10/2024 | 2,500,000 | 2,578,682 |
| Blue Ridge Re | 11/14/2023 | 500,000 | 500,450 |
| Blue Ridge Re | 11/14/2023 | 1,250,000 | 1,278,125 |
| Bonanza Re | 12/15/2020 | 750,000 | 735,000 |
| Bonanza Re | 3/11/2022 | 250,000 | 234,525 |
| Bonanza Re | 1/6/2023 | 250,000 | 253,225 |
| Cape Lookout Re | 4/14/2023 | 1,000,000 | 1,026,300 |
| Cat Re 2001 | 11/14/2023 | 500,000 | 526,250 |
| Commonwealth Re | 6/15/2022 | 750,000 | 758,250 |
| Eccleston Re 2023 | 7/13/2023 | — | 423,677 |
| Eden Re II | 1/25/2021 | 279,105 | 93,210 |
| Eden Re II | 1/21/2022 | 314,753 | 174,830 |
| Eden Re II | 1/17/2023 | — | 242,890 |
| Eden Re II | 1/10/2024 | 2,900,000 | 2,965,540 |
| Emetteur Non Renseigne-PI0047 2024-1 | 1/26/2024 | 5,000,000 | 5,124,348 |
| Everglades Re II | 10/25/2023 | 2,312,449 | 2,319,240 |
| Everglades Re II | 10/25/2023 | 3,010,080 | 3,012,000 |
| FloodSmart Re | 2/14/2022 | 1,500,000 | 1,467,900 |
| FloodSmart Re | 2/29/2024 | 1,000,000 | 996,500 |
| Formby Re 2018 | 7/9/2018 | 5,438 | — |
| Four Lakes Re | 12/15/2021 | 500,000 | 484,000 |
| Four Lakes Re | 12/8/2023 | 250,000 | 254,125 |
| Galileo Re | 12/4/2023 | 1,000,000 | 1,041,400 |
| Galileo Re | 12/4/2023 | 500,000 | 513,500 |
| Gamboge Re | 4/24/2023 | 4,014,656 | 4,981,800 |
| Gateway Re | 2/3/2023 | 500,000 | 540,250 |
| Gateway Re | 3/11/2024 | 250,000 | 249,988 |
| Gateway Re | 3/11/2024 | 231,657 | 231,200 |
| Gateway Re II | 4/13/2023 | 250,000 | 259,300 |
| Gleneagles Re 2021 | 1/13/2021 | 22,875 | 125 |
| Gleneagles Re 2022 | 1/18/2022 | 555,119 | 594,181 |
| Gullane Re 2018 | 3/26/2018 | — | — |
| Gullane Re 2023 | 1/20/2023 | — | 146,869 |
| Gullane Re 2024 | 2/14/2024 | 5,000,000 | 5,250,578 |
| Harambee Re 2018 | 12/19/2017 | 63,696 | — |
| Harambee Re 2019 | 12/20/2018 | — | 9,000 |
| Harambee Re 2020 | 2/27/2020 | — | 47,400 |
| Herbie Re | 10/19/2020 | 500,000 | 493,700 |
| High Point Re | 12/1/2023 | 2,500,000 | 2,522,500 |
| Integrity Re | 5/9/2022 | 500,000 | 350,000 |
The accompanying notes are an integral part of these financial statements.
76Pioneer Strategic Income Fund | Semiannual Report | 3/31/24
| Restricted Securities | Acquisition date | Cost | Value |
| Integrity Re | 3/23/2023 | $1,250,000 | $ 1,296,625 |
| Isosceles Re 2023 | 8/7/2023 | — | 200 |
| Isosceles Re 2023 | 8/7/2023 | — | — |
| Isosceles Re 2023 | 8/7/2023 | — | — |
| Kilimanjaro III Re | 6/15/2022 | 1,000,000 | 1,020,000 |
| Lightning Re | 3/20/2023 | 1,000,000 | 1,075,000 |
| Lion Rock Re 2020 | 3/27/2020 | — | — |
| Lion Rock Re 2021 | 3/1/2021 | 165,491 | 55,900 |
| Locke Tavern Re | 3/23/2023 | 1,000,000 | 1,019,200 |
| Long Point Re IV | 5/13/2022 | 2,500,000 | 2,514,250 |
| Lorenz Re 2019 | 7/10/2019 | 417,107 | 23,671 |
| Matterhorn Re | 12/15/2021 | 250,000 | 244,425 |
| Matterhorn Re | 3/10/2022 | 1,750,000 | 1,742,825 |
| Matterhorn Re | 3/10/2022 | 750,000 | 746,775 |
| Merion Re 2021-2 | 12/28/2020 | 2,448,846 | 1,444,500 |
| Merion Re 2022-2 | 3/1/2022 | 6,551,154 | 6,211,224 |
| Merion Re 2024-1 | 1/11/2024 | 843,568 | 886,309 |
| Mona Lisa Re | 12/30/2022 | 800,000 | 864,560 |
| Mystic Re | 12/12/2023 | 600,000 | 611,940 |
| Mystic Re IV | 12/16/2022 | 2,900,000 | 3,019,770 |
| Northshore Re II | 6/22/2022 | 500,000 | 520,650 |
| Oakmont Re 2020 | 12/3/2020 | — | — |
| Old Head Re 2022 | 1/6/2022 | 188,288 | 125,000 |
| Old Head Re 2024 | 1/5/2024 | 183,891 | 201,551 |
| Pangaea Re 2023-3 | 7/5/2023 | 2,500,000 | 2,871,805 |
| Pangaea Re 2024-1 | 2/27/2024 | 2,750,000 | 2,841,743 |
| Phoenician Re | 12/1/2021 | 750,000 | 744,375 |
| Phoenix 3 Re 2023-3 | 12/21/2020 | 896,560 | 1,145,400 |
| Pine Valley Re 2024 | 1/17/2024 | 621,894 | 643,268 |
| Portrush Re 2017 | 6/12/2017 | 1,687,366 | 220 |
| Portsalon Re 2022 | 7/15/2022 | 323,453 | 366,768 |
| Queen Street Re | 5/12/2023 | 2,500,000 | 2,610,000 |
| Residential Re | 10/30/2020 | 1,500,000 | 1,462,950 |
| Residential Re | 10/30/2020 | 1,250,000 | 1,210,250 |
| Residential Re | 11/22/2022 | 1,500,000 | 1,517,700 |
| Residential Re | 11/7/2023 | 1,500,000 | 1,491,300 |
| Residential Re | 11/7/2023 | 750,000 | 751,200 |
| RosaPenna Re 2022 | 8/26/2022 | 1,365,175 | 1,456,832 |
| Sanders Re | 1/16/2024 | 750,000 | 761,250 |
| Sanders Re II | 3/1/2022 | 2,250,000 | 2,197,125 |
| Sanders Re III | 11/30/2022 | 750,000 | 761,100 |
| Sanders Re III | 3/24/2023 | 250,000 | 251,325 |
| Sector Re V | 12/4/2019 | 1,068 | 274,917 |
| Sector Re V | 1/1/2020 | 2,625 | 285,908 |
| Sector Re V | 5/19/2022 | — | 38,221 |
| Sector Re V | 12/30/2022 | — | 260,569 |
| Sector Re V | 12/4/2023 | 4,000,000 | 4,362,245 |
| Sector Re V | 12/29/2023 | 2,500,000 | 2,726,403 |
| Sussex Re | 12/7/2020 | 750,000 | 753,300 |
The accompanying notes are an integral part of these financial statements.
Pioneer Strategic Income Fund | Semiannual Report | 3/31/2477
Schedule of Investments | 3/31/24
(unaudited) (continued)
| Restricted Securities | Acquisition date | Cost | Value |
| Sussex Re 2020-1 | 1/21/2020 | $ — | $ 4,693 |
| Sussex Re 2021-1 | 1/26/2021 | — | 700 |
| Thopas Re 2020 | 12/30/2019 | — | 800 |
| Thopas Re 2021 | 12/30/2020 | — | 52,000 |
| Thopas Re 2022 | 2/15/2022 | — | — |
| Thopas Re 2023 | 2/15/2023 | — | — |
| Thopas Re 2024 | 2/2/2024 | 3,192,294 | 3,354,782 |
| Torricelli Re 2021 | 7/2/2021 | — | 44,547 |
| Torricelli Re 2022 | 7/26/2022 | — | 38,262 |
| Torricelli Re 2023 | 7/26/2023 | 3,250,000 | 4,079,722 |
| Ursa Re | 4/12/2023 | 500,000 | 508,350 |
| Veraison Re | 12/14/2022 | 500,000 | 525,300 |
| Viribus Re 2018 | 12/22/2017 | 20,734 | — |
| Viribus Re 2019 | 12/27/2018 | — | — |
| Viribus Re 2020 | 3/12/2020 | 421,904 | 137,434 |
| Viribus Re 2022 | 4/18/2022 | — | 91,750 |
| Viribus Re 2023 | 2/2/2023 | — | 421,350 |
| Viribus Re 2024 | 3/19/2024 | 250,000 | 250,000 |
| Vitality Re XII | 9/21/2023 | 247,221 | 249,050 |
| Vitality Re XIII | 1/4/2023 | 1,933,579 | 1,984,200 |
| Vitality Re XIV | 1/25/2023 | 4,006,528 | 4,067,200 |
| Vitality Re XIV | 1/25/2023 | 400,000 | 412,120 |
| Walton Health Re 2019 | 7/18/2019 | 8,486 | 75,504 |
| Walton Health Re 2022 | 7/13/2022 | 7,000 | 291,507 |
| White Heron Re 2023 | 8/30/2023 | — | 26,028 |
| Woburn Re 2019 | 1/30/2019 | 470,315 | 592,560 |
| Total Restricted Securities | | | $130,499,281 |
| % of Net assets | | | 4.0% |
FORWARD FOREIGN CURRENCY EXCHANGE CONTRACTS
Currency
Purchased | In
Exchange for | Currency
Sold | Deliver | Counterparty | Settlement
Date | Unrealized
Appreciation
(Depreciation) |
| AUD | 38,545,000 | USD | 25,306,126 | Bank of America NA | 5/28/24 | $ (144,297) |
| AUD | 26,560,000 | USD | 17,421,129 | Citibank NA | 6/27/24 | (69,897) |
| EUR | 354,000 | USD | 384,403 | Citibank NA | 5/28/24 | (1,565) |
| INR | 1,416,850,000 | USD | 16,971,516 | Citibank NA | 4/30/24 | 4,813 |
| TRY | 242,000,000 | USD | 5,734,597 | Goldman Sachs & Co. | 1/10/25 | (292,105) |
| EUR | 50,241,500 | USD | 54,935,297 | HSBC Bank USA NA | 4/24/24 | (675,497) |
| EUR | 16,300,549 | SEK | 185,000,000 | HSBC Bank USA NA | 4/26/24 | 103,317 |
| SEK | 185,000,000 | EUR | 16,300,549 | HSBC Bank USA NA | 4/26/24 | (406,242) |
| USD | 14,209,124 | IDR | 223,950,000,000 | HSBC Bank USA NA | 6/28/24 | 134,840 |
| AUD | 24,100,000 | USD | 15,929,789 | State Street Bank & Trust Co. | 4/23/24 | (213,675) |
| BRL | 40,000,000 | USD | 7,983,952 | State Street Bank & Trust Co. | 5/9/24 | (40,344) |
| USD | 5,585,183 | CAD | 7,465,000 | State Street Bank & Trust Co. | 5/2/24 | 71,387 |
The accompanying notes are an integral part of these financial statements.
78Pioneer Strategic Income Fund | Semiannual Report | 3/31/24
Currency
Purchased | In
Exchange for | Currency
Sold | Deliver | Counterparty | Settlement
Date | Unrealized
Appreciation
(Depreciation) |
| USD | 4,865,960 | GBP | 3,845,000 | State Street Bank & Trust Co. | 6/27/24 | $ 10,740 |
| USD | 62,557,964 | EUR | 57,500,000 | State Street Bank & Trust Co. | 6/27/24 | 296,077 |
| TOTAL FORWARD FOREIGN CURRENCY EXCHANGE CONTRACTS | $(1,222,448) |
FUTURES CONTRACTS
FIXED INCOME INDEX FUTURES CONTRACTS
Number of
Contracts
Long | Description | Expiration
Date | Notional
Amount | Market
Value | Unrealized
Appreciation
(Depreciation) |
| 366 | U.S. 2 Year Note (CBT) | 6/28/24 | $ 74,907,933 | $ 74,841,282 | $ (66,651) |
| 7,821 | U.S. 5 Year Note (CBT) | 6/28/24 | 834,795,088 | 836,969,242 | 2,174,154 |
| 179 | U.S. 10 Year Note (CBT) | 6/18/24 | 19,886,726 | 19,832,642 | (54,084) |
| 17 | U.S. 10 Year Ultra Bond (CBT) | 6/18/24 | 1,945,216 | 1,948,359 | 3,143 |
| 242 | U.S. Long Bond (CBT) | 6/18/24 | 28,802,421 | 29,145,875 | 343,454 |
| 826 | U.S. Ultra Bond (CBT) | 6/18/24 | 105,243,985 | 106,554,000 | 1,310,015 |
| | | | $1,065,581,369 | $1,069,291,400 | $3,710,031 |
Number of
Contracts
Short | Description | Expiration
Date | Notional
Amount | Market
Value | Unrealized
(Depreciation) |
| 650 | Euro-Bund | 6/6/24 | $ (92,690,300) | $ (93,533,058) | $ (842,758) |
| TOTAL FUTURES CONTRACTS | $972,891,069 | $975,758,342 | $2,867,273 |
SWAP CONTRACTS
CENTRALLY CLEARED CREDIT DEFAULT SWAP CONTRACTS – BUY PROTECTION
Notional
Amount ($)(1) | Reference
Obligation/Index | Pay/
Receive(2) | Annual
Fixed Rate | Expiration
Date | Premiums
(Received) | Unrealized
(Depreciation) | Market
Value |
| 290,337,300 | Markit CDX North America High Yield Index Series 41 | Pay | 5.00% | 12/20/28 | $ (2,523,684) | $(19,437,942) | $(21,961,626) |
The accompanying notes are an integral part of these financial statements.
Pioneer Strategic Income Fund | Semiannual Report | 3/31/2479
Schedule of Investments | 3/31/24
(unaudited) (continued)
Notional
Amount ($)(1) | Reference
Obligation/Index | Pay/
Receive(2) | Annual
Fixed Rate | Expiration
Date | Premiums
(Received) | Unrealized
(Depreciation) | Market
Value |
| 29,670,300 | Markit CDX North America High Yield Index Series 41 | Pay | 5.00% | 12/20/28 | $ (2,010,261) | $ (234,053) | $ (2,244,314) |
| 161,650,000 | Markit CDX North America High Yield Index Series 42 | Pay | 5.00% | 6/20/29 | (11,689,103) | (232,340) | (11,921,443) |
TOTAL CENTRALLY CLEARED CREDIT DEFAULT
SWAP CONTRACTS – BUY PROTECTION | $ (16,223,048) | $ (19,904,335) | $ (36,127,383) |
| | |
| (1) | Pays quarterly. |
| (2) | The notional amount is the maximum amount that a seller of credit protection would be obligated to pay upon occurrence of a credit event. |
Principal amounts are denominated in U.S. dollars (“USD”) unless otherwise noted.
| AUD | — Australia Dollar |
| BRL | — Brazil Real |
| CAD | — Canada Dollar |
| COP | — Colombia Peso |
| EGP | — Egypt Pound |
| EUR | — Euro |
| GBP | — Great British Pound |
| IDR | — Indonesian Rupiah |
| INR | — Indian Rupee |
| KZT | — Kazakhstan Tenge |
| MXN | — Mexican Peso |
| SEK | — Sweden Krona |
| TRY | — Turkish Lira |
| USD | — United States Dollar |
| UYU | — Uruguay Peso |
| UZS | — Uzbekistan Som |
Purchases and sales of securities (excluding short-term investments) for the six months ended March 31, 2024 were as follows:
| | Purchases | Sales |
| Long-Term U.S. Government Securities | $ 25,992,891 | $143,407,772 |
| Other Long-Term Securities | $716,446,337 | $726,101,331 |
The accompanying notes are an integral part of these financial statements.
80Pioneer Strategic Income Fund | Semiannual Report | 3/31/24
At March 31, 2024, the net unrealized depreciation on investments based on cost for federal tax purposes of $3,586,132,748 was as follows:
| Aggregate gross unrealized appreciation for all investments in which there is an excess of value over tax cost | $ 68,592,926 |
| Aggregate gross unrealized depreciation for all investments in which there is an excess of tax cost over value | (339,874,013) |
| Net unrealized depreciation | $(271,281,087) |
Various inputs are used in determining the value of the Fund’s investments. These inputs are summarized in the three broad levels below.
| Level 1 | – | unadjusted quoted prices in active markets for identical securities. |
| Level 2 | – | other significant observable inputs (including quoted prices for similar securities, interest rates, prepayment speeds, credit risks, etc.). See Notes to Financial Statements — Note 1A. |
| Level 3 | – | significant unobservable inputs (including the Adviser’s own assumptions in determining fair value of investments). See Notes to Financial Statements — Note 1A. |
The following is a summary of the inputs used as of March 31, 2024 in valuing the Fund’s investments:
| | Level 1 | Level 2 | Level 3 | Total |
| Senior Secured Floating Rate Loan Interests | $ — | $ 15,152,504 | $ — | $ 15,152,504 |
| Common Stocks | | | | |
| Automobile Components | — | 956,540 | — | 956,540 |
| Communications Equipment | — | — | 152,526 | 152,526 |
| Paper & Forest Products | — | — | —* | —* |
| Passenger Airlines | — | 1,784,811 | — | 1,784,811 |
| All Other Common Stocks | 2,724 | — | — | 2,724 |
| Asset Backed Securities | — | 279,566,101 | 693,750 | 280,259,851 |
| Collateralized Mortgage Obligations | — | 374,681,751 | — | 374,681,751 |
| Commercial Mortgage-Backed Securities | — | 195,249,967 | —* | 195,249,967 |
| Convertible Corporate Bonds | — | 18,801,011 | — | 18,801,011 |
| Corporate Bonds | | | | |
| Pharmaceuticals | — | — | —* | —* |
| All Other Corporate Bonds | — | 1,175,114,648 | — | 1,175,114,648 |
| Insurance-Linked Securities | | | | |
| Collateralized Reinsurance | | | | |
| Earthquakes – California | — | — | 1,812,375 | 1,812,375 |
| Multiperil – Massachusetts | — | — | 366,768 | 366,768 |
The accompanying notes are an integral part of these financial statements.
Pioneer Strategic Income Fund | Semiannual Report | 3/31/2481
Schedule of Investments | 3/31/24
(unaudited) (continued)
| | Level 1 | Level 2 | Level 3 | Total |
| Multiperil – U.S. | $ — | $ — | $12,996,648 | $ 12,996,648 |
| Multiperil – Worldwide | — | — | 2,223,139 | 2,223,139 |
| Windstorm – Florida | — | — | 220 | 220 |
| Windstorm – North Carolina | — | — | 200 | 200 |
| Windstorm – U.S. Multistate | — | — | 26,028 | 26,028 |
| Windstorm – U.S. Regional | — | — | —* | —* |
| Reinsurance Sidecars | | | | |
| Multiperil – U.S. | — | — | 56,400 | 56,400 |
| Multiperil – Worldwide | — | — | 51,168,710 | 51,168,710 |
| All Other Insurance-Linked Securities | — | 61,848,793 | — | 61,848,793 |
| Foreign Government Bonds | — | 114,457,534 | — | 114,457,534 |
| U.S. Government and Agency Obligations | — | 1,091,278,622 | — | 1,091,278,622 |
| Repurchase Agreements | — | 45,000,000 | — | 45,000,000 |
| Foreign Treasury Obligations | — | 11,158,302 | — | 11,158,302 |
| Over The Counter (OTC) Currency Put Option Purchased | — | 1,904,890 | — | 1,904,890 |
| Total Investments in Securities | $ 2,724 | $ 3,386,955,474 | $ 69,496,764 | $ 3,456,454,962 |
| Liabilities | | | | |
| TBA Sales Commitments | $ — | $ (122,391,346) | $ — | $ (122,391,346) |
| Total Liabilities | $ — | $ (122,391,346) | $ — | $ (122,391,346) |
| Other Financial Instruments | | | | |
| Over The Counter (OTC) Currency Put Option Written | $ — | $ (952,445) | $ — | $ (952,445) |
| Net unrealized depreciation on forward foreign currency exchange contracts | — | (1,222,448) | — | (1,222,448) |
| Net unrealized appreciation on futures contracts | 2,867,273 | — | — | 2,867,273 |
| Centrally cleared swap contracts | — | (19,904,335) | — | (19,904,335) |
| Total Other Financial Instruments | $ 2,867,273 | $ (22,079,228) | $ — | $ (19,211,955) |
| * | Securities valued at $0. |
The accompanying notes are an integral part of these financial statements.
82Pioneer Strategic Income Fund | Semiannual Report | 3/31/24
The following is a reconciliation of assets valued using significant unobservable inputs (Level 3):
| | Common
Stocks | Asset
Backed
Securities | Commercial
Mortgage-
Backed
Securities | Corporate
Bonds | Insurance-
Linked
Securities | Total |
| Balance as of 9/30/23 | $ 1,654,768 | $ — | $ — | $ — | $ 87,545,608 | $ 89,200,376 |
| Realized gain (loss)(1) | 40,038 | — | — | — | (1,150,118 ) | (1,110,080 ) |
| Changed in unrealized appreciation (depreciation)(2) | 459,352 | 218,825 | — | — | (2,848,428 ) | (2,170,251 ) |
| Purchases | 39,522 | — | — | — | 34,741,648 | 34,781,170 |
| Return of capital | — | 57,737 | — | — | (26,670,195 ) | (26,612,458 ) |
| Sales | (256,343 ) | — | — | — | (22,968,027 ) | (23,224,370 ) |
| Transfers in to Level 3* | — | 417,188 | —** | —** | — | 417,188 |
| Transfers out of Level 3* | (1,784,811 ) | — | — | — | — | (1,784,811 ) |
| Balance as of 3/31/24 | $ 152,526 | $693,750 | $—** | $—** | $ 68,650,488 | $ 69,496,764 |
| (1) | Realized gain (loss) on these securities is included in the realized gain (loss) from investments on the Statement of Operations. |
| (2) | Unrealized appreciation (depreciation) on these securities is included in the change in unrealized appreciation (depreciation) from investments on the Statement of Operations. |
| * | Transfers are calculated on the beginning of period values. During the period ended March 31, 2024, three securities valued at $417,188 were transferred from Level 2 to Level 3 and a security valued at $0 was transferred from Level 1 to Level 3, due to valuing the securities using significant unobservable inputs; and two securities valued at $1,784,811 were transferred from Level 3 to Level 2, due to valuing the securities using observable inputs. |
| ** | Securities valued at $0. | | |
| Net change in unrealized appreciation (depreciation) of Level 3 investments still held and considered Level 3 at March 31, 2024: | $217,759 |
The accompanying notes are an integral part of these financial statements.
Pioneer Strategic Income Fund | Semiannual Report | 3/31/2483
Statement of Assets and Liabilities | 3/31/24
(unaudited)
| ASSETS: | |
| Investments in unaffiliated issuers, at value (cost $3,679,836,910) | $3,456,454,962 |
| Cash | 23,502,573 |
| Foreign currencies, at value (cost $8,299,212) | 7,246,126 |
| Forwards collateral | 320,000 |
| Futures collateral | 23,296,273 |
| Swaps collateral | 57,953,377 |
| Collateral due from broker for TBA Securities | 429,927 |
| Unrealized appreciation on forward foreign currency exchange contracts | 621,174 |
| Receivables — | |
| Investment securities sold | 216,874,200 |
| Fund shares sold | 5,838,146 |
| Interest | 33,237,506 |
| Due from the Adviser | 24,883 |
| Other assets | 109,208 |
| Total assets | $3,825,908,355 |
| LIABILITIES: | |
| Payables — | |
| Investment securities purchased | $ 390,366,199 |
| Fund shares repurchased | 6,079,247 |
| Distributions | 3,469,019 |
| Trustees’ fees | 4,554 |
| Interest expense | 605,000 |
| Collateral due to broker for options | 1,040,000 |
| Variation margin for centrally cleared swap contracts | 36,127,383 |
| Variation margin for futures contracts | 563,851 |
| TBA sale commitments at value (net proceeds received $122,536,492) | 122,391,346 |
| Written options outstanding (net premiums received $3,061,858) | 952,445 |
| Unrealized depreciation on forward foreign currency exchange contracts | 1,843,622 |
| Reserve for repatriation taxes | 147,993 |
| Management fees | 301,473 |
| Administrative expenses | 86,641 |
| Distribution fees | 34,917 |
| Accrued expenses | 900,284 |
| Total liabilities | $ 564,913,974 |
| NET ASSETS: | |
| Paid-in capital | $3,841,823,618 |
| Distributable earnings (loss) | (580,829,237) |
| Net assets | $ 3,260,994,381 |
| NET ASSET VALUE PER SHARE: | |
| No par value (unlimited number of shares authorized) | |
| Class A (based on $562,445,168/59,789,385 shares) | $ 9.41 |
| Class C (based on $44,784,697/4,869,384 shares) | $ 9.20 |
| Class K (based on $488,711,140/51,848,182 shares) | $ 9.43 |
| Class R (based on $55,466,384/5,789,179 shares) | $ 9.58 |
| Class Y (based on $2,109,586,992/224,128,214 shares) | $ 9.41 |
| MAXIMUM OFFERING PRICE PER SHARE: | |
| Class A (based on $9.41 net asset value per share/100%-4.50% maximum sales charge) | $ 9.85 |
The accompanying notes are an integral part of these financial statements.
84Pioneer Strategic Income Fund | Semiannual Report | 3/31/24
Statement of Operations (unaudited)
FOR THE SIX MONTHS ENDED 3/31/24
| INVESTMENT INCOME: | | |
| Interest from unaffiliated issuers (net of foreign taxes withheld $43,867) | $ 94,720,652 | |
| Dividends from unaffiliated issuers | 10,038,184 | |
| Total Investment Income | | $104,758,836 |
| EXPENSES: | | |
| Management fees | $ 9,054,462 | |
| Administrative expenses | 385,143 | |
| Transfer agent fees | | |
| Class A | 573,403 | |
| Class C | 21,864 | |
| Class K | 1,397 | |
| Class R | 65,596 | |
| Class Y | 1,075,166 | |
| Distribution fees | | |
| Class A | 707,642 | |
| Class C | 239,748 | |
| Class R | 138,954 | |
| Shareholder communications expense | 123,244 | |
| Custodian fees | 17,820 | |
| Registration fees | 52,940 | |
| Professional fees | 173,780 | |
| Printing expense | 40,108 | |
| Pricing fees | 267 | |
| Officers’ and Trustees’ fees | 103,161 | |
| Insurance expense | 29,813 | |
| Miscellaneous | 182,661 | |
| Total expenses | | $ 12,987,169 |
| Less fees waived and expenses reimbursed by the Adviser | | (712,682) |
| Net expenses | | $ 12,274,487 |
| Net investment income | | $ 92,484,349 |
| REALIZED AND UNREALIZED GAIN (LOSS) ON INVESTMENTS: | | |
| Net realized gain (loss) on: | | |
| Investments in unaffiliated issuers | $ (69,908,297) | |
| TBA sale commitments | 155,480 | |
| Forward foreign currency exchange contracts | (1,323,634) | |
| Futures contracts | 2,895,593 | |
| Swap contracts | (20,034,038) | |
| Written options | 740,168 | |
| Other assets and liabilities denominated in foreign currencies | (1,062,351) | $ (88,537,079) |
| Change in net unrealized appreciation (depreciation) on: | | |
| Investments in unaffiliated issuers (net of foreign capital gains tax of $70,093) | $236,720,458 | |
| TBA sale commitments | (480,909) | |
| Forward foreign currency exchange contracts | 2,130,050 | |
| Futures contracts | 16,626,972 | |
| Swap contracts | (20,057,406) | |
The accompanying notes are an integral part of these financial statements.
Pioneer Strategic Income Fund | Semiannual Report | 3/31/2485
Statement of Operations (unaudited) (continued)
FOR THE SIX MONTHS ENDED 3/31/24
| Written options | 1,409,117 | |
| Other assets and liabilities denominated in foreign currencies | 349,360 | 236,697,642 |
| Net realized and unrealized gain (loss) on investments | | $ 148,160,563 |
| Net increase in net assets resulting from operations | | $ 240,644,912 |
The accompanying notes are an integral part of these financial statements.
86Pioneer Strategic Income Fund | Semiannual Report | 3/31/24
Statements of Changes in Net Assets
| | Six Months
Ended
3/31/24
(unaudited) | Year
Ended
9/30/23 |
| FROM OPERATIONS: | | |
| Net investment income (loss) | $ 92,484,349 | $ 180,340,461 |
| Net realized gain (loss) on investments | (88,537,079) | (286,163,900) |
| Change in net unrealized appreciation (depreciation) on investments | 236,697,642 | 191,112,341 |
| Net increase in net assets resulting from operations | $ 240,644,912 | $ 85,288,902 |
| DISTRIBUTIONS TO SHAREHOLDERS: | | |
| Class A ($0.18 and $0.32 per share, respectively) | $ (11,217,910) | $ (21,269,022) |
| Class C ($0.15 and $0.25 per share, respectively) | (794,571) | (1,689,172) |
| Class K ($0.20 and $0.36 per share, respectively) | (10,028,660) | (16,058,936) |
| Class R ($0.17 and $0.29 per share, respectively) | (1,022,405) | (1,858,632) |
| Class Y ($0.20 and $0.35 per share, respectively) | (45,194,947) | (88,662,729) |
| Total distributions to shareholders | $ (68,258,493) | $ (129,538,491) |
| FROM FUND SHARE TRANSACTIONS: | | |
| Net proceeds from sales of shares | $ 429,039,361 | $ 962,289,133 |
| Reinvestment of distributions | 54,463,564 | 106,228,240 |
| Cost of shares repurchased | (596,504,153) | (1,578,816,672) |
| Net decrease in net assets resulting from Fund share transactions | $ (113,001,228) | $ (510,299,299) |
| Net increase (decrease) in net assets | $ 59,385,191 | $ (554,548,888) |
| NET ASSETS: | | |
| Beginning of period | $3,201,609,190 | $ 3,756,158,078 |
| End of period | $ 3,260,994,381 | $ 3,201,609,190 |
The accompanying notes are an integral part of these financial statements.
Pioneer Strategic Income Fund | Semiannual Report | 3/31/2487
Statements of Changes in Net Assets (continued)
| | Six Months
Ended
3/31/24
Shares
(unaudited) | Six Months
Ended
3/31/24
Amount
(unaudited) | Year
Ended
9/30/23
Shares | Year
Ended
9/30/23
Amount |
| Class A | | | | |
| Shares sold | 3,904,428 | $ 35,954,556 | 8,071,059 | $ 74,018,157 |
| Reinvestment of distributions | 998,158 | 9,220,145 | 1,930,360 | 17,700,464 |
| Less shares repurchased | (9,064,429) | (83,174,691) | (16,472,728) | (151,099,390) |
| Net decrease | (4,161,843) | $ (37,999,990) | (6,471,309) | $ (59,380,769) |
| Class C | | | | |
| Shares sold | 265,761 | $ 2,412,632 | 618,970 | $ 5,544,184 |
| Reinvestment of distributions | 77,997 | 703,996 | 170,273 | 1,525,532 |
| Less shares repurchased | (1,262,575) | (11,362,175) | (3,262,213) | (29,204,573) |
| Net decrease | (918,817) | $ (8,245,547) | (2,472,970) | $ (22,134,857) |
| Class K | | | | |
| Shares sold | 9,445,319 | $ 88,344,372 | 13,002,141 | $ 119,652,979 |
| Reinvestment of distributions | 939,676 | 8,700,738 | 1,615,746 | 14,843,933 |
| Less shares repurchased | (6,384,406) | (58,574,703) | (11,224,354) | (103,321,780) |
| Net increase | 4,000,589 | $ 38,470,407 | 3,393,533 | $ 31,175,132 |
| Class R | | | | |
| Shares sold | 509,896 | $ 4,797,959 | 959,813 | $ 8,969,688 |
| Reinvestment of distributions | 106,993 | 1,006,764 | 198,124 | 1,849,181 |
| Less shares repurchased | (869,051) | (8,165,104) | (1,914,330) | (17,931,749) |
| Net decrease | (252,162) | $ (2,360,381) | (756,393) | $ (7,112,880) |
| Class Y | | | | |
| Shares sold | 32,230,253 | $ 297,529,842 | 82,071,830 | $ 754,104,125 |
| Reinvestment of distributions | 3,769,022 | 34,831,921 | 7,668,208 | 70,309,130 |
| Less shares repurchased | (47,517,282) | (435,227,480) | (139,150,192) | (1,277,259,180) |
| Net decrease | (11,518,007) | $(102,865,717) | (49,410,154) | $ (452,845,925) |
The accompanying notes are an integral part of these financial statements.
88Pioneer Strategic Income Fund | Semiannual Report | 3/31/24
| | Six Months
Ended
3/31/24
(unaudited) | Year
Ended
9/30/23 | Year
Ended
9/30/22 | Year
Ended
9/30/21 | Year
Ended
9/30/20 | Year
Ended
9/30/19 |
| Class A | | | | | | |
| Net asset value, beginning of period | $ 8.91 | $ 9.05 | $ 11.38 | $ 10.91 | $ 10.89 | $ 10.42 |
| Increase (decrease) from investment operations: | | | | | | |
| Net investment income (loss) (a) | $ 0.25 | $ 0.45 | $ 0.35 | $ 0.35 | $ 0.38 | $ 0.36 |
| Net realized and unrealized gain (loss) on investments | 0.43 | (0.27) | (1.86) | 0.52 | (0.02) | 0.42 |
| Net increase (decrease) from investment operations | $ 0.68 | $ 0.18 | $ (1.51) | $ 0.87 | $ 0.36 | $ 0.78 |
| Distributions to shareholders: | | | | | | |
| Net investment income | $ (0.18) | $ (0.32) | $ (0.12) | $ (0.40) | $ (0.34) | $ (0.27) |
| Net realized gain | — | — | (0.53) | — | — | — |
| Tax return of capital | — | — | (0.17) | — | — | (0.04) |
| Total distributions | $ (0.18) | $ (0.32) | $ (0.82) | $ (0.40) | $ (0.34) | $ (0.31) |
| Net increase (decrease) in net asset value | $ 0.50 | $ (0.14) | $ (2.33) | $ 0.47 | $ 0.02 | $ 0.47 |
| Net asset value, end of period | $ 9.41 | $ 8.91 | $ 9.05 | $ 11.38 | $ 10.91 | $ 10.89 |
| Total return (b) | 7.71%(c) | 1.91%(d) | (14.12)% | 8.04% | 3.44% | 7.64% |
| Ratio of net expenses to average net assets | 1.06%(e) | 1.06% | 1.01% | 1.06% | 1.06% | 1.10% |
| Ratio of net investment income (loss) to average net assets | 5.49%(e) | 4.91% | 3.44% | 3.12% | 3.59% | 3.39% |
| Portfolio turnover rate | 25%(c) | 51% | 56% | 67% | 69% | 53% |
| Net assets, end of period (in thousands) | $562,445 | $569,497 | $637,356 | $855,856 | $799,974 | $803,174 |
| Ratios with no waiver of fees and assumption of expenses by the Adviser and no reduction for fees paid indirectly: | | | | | | |
| Total expenses to average net assets | 1.09%(e) | 1.10% | 1.03% | 1.06% | 1.06% | 1.10% |
| Net investment income (loss) to average net assets | 5.46%(e) | 4.87% | 3.42% | 3.12% | 3.59% | 3.39% |
| (a) | The per-share data presented above is based on the average shares outstanding for the period presented. |
| (b) | Assumes initial investment at net asset value at the beginning of each period, reinvestment of all distributions, the complete redemption of the investment at net asset value at the end of each period and no sales charges. Total return would be reduced if sales charges were taken into account. |
| (c) | Not annualized. |
| (d) | For the year ended September 30, 2023, the Fund's total return includes a reimbursement by the Adviser. The impact on Class A's total return was 0.11%. |
| (e) | Annualized. |
The accompanying notes are an integral part of these financial statements.
Pioneer Strategic Income Fund | Semiannual Report | 3/31/2489
Financial Highlights (continued)
| | Six Months
Ended
3/31/24
(unaudited) | Year
Ended
9/30/23 | Year
Ended
9/30/22 | Year
Ended
9/30/21 | Year
Ended
9/30/20 | Year
Ended
9/30/19 |
| Class C | | | | | | |
| Net asset value, beginning of period | $ 8.71 | $ 8.85 | $ 11.14 | $ 10.67 | $ 10.66 | $ 10.20 |
| Increase (decrease) from investment operations: | | | | | | |
| Net investment income (loss) (a) | $ 0.22 | $ 0.38 | $ 0.28 | $ 0.27 | $ 0.30 | $ 0.28 |
| Net realized and unrealized gain (loss) on investments | 0.42 | (0.27) | (1.82) | 0.51 | (0.02) | 0.42 |
| Net increase (decrease) from investment operations | $ 0.64 | $ 0.11 | $ (1.54) | $ 0.78 | $ 0.28 | $ 0.70 |
| Distributions to shareholders: | | | | | | |
| Net investment income | $ (0.15) | $ (0.25) | $ (0.05) | $ (0.31) | $ (0.27) | $ (0.20) |
| Net realized gain | — | — | (0.53) | — | — | — |
| Tax return of capital | — | — | (0.17) | — | — | (0.04) |
| Total distributions | $ (0.15) | $ (0.25) | $ (0.75) | $ (0.31) | $ (0.27) | $ (0.24) |
| Net increase (decrease) in net asset value | $ 0.49 | $ (0.14) | $ (2.29) | $ 0.47 | $ 0.01 | $ 0.46 |
| Net asset value, end of period | $ 9.20 | $ 8.71 | $ 8.85 | $ 11.14 | $ 10.67 | $ 10.66 |
| Total return (b) | 7.38%(c) | 1.21%(d) | (14.69)% | 7.37% | 2.67% | 6.96% |
| Ratio of net expenses to average net assets | 1.70%(e) | 1.70% | 1.66% | 1.73% | 1.73% | 1.74% |
| Ratio of net investment income (loss) to average net assets | 4.83%(e) | 4.28% | 2.77% | 2.49% | 2.89% | 2.75% |
| Portfolio turnover rate | 25%(c) | 51% | 56% | 67% | 69% | 53% |
| Net assets, end of period (in thousands) | $44,785 | $50,394 | $73,112 | $112,804 | $185,623 | $311,801 |
| Ratios with no waiver of fees and assumption of expenses by the Adviser and no reduction for fees paid indirectly: | | | | | | |
| Total expenses to average net assets | 1.73%(e) | 1.74% | 1.68% | 1.73% | 1.73% | 1.74% |
| Net investment income (loss) to average net assets | 4.80%(e) | 4.24% | 2.75% | 2.49% | 2.89% | 2.75% |
| (a) | The per-share data presented above is based on the average shares outstanding for the period presented. |
| (b) | Assumes initial investment at net asset value at the beginning of each period, reinvestment of all distributions, the complete redemption of the investment at net asset value at the end of each period and no sales charges. Total return would be reduced if sales charges were taken into account. |
| (c) | Not annualized. |
| (d) | For the year ended September 30, 2023, the Fund's total return includes a reimbursement by the Adviser. The impact on Class C's total return was 0.11%. |
| (e) | Annualized. |
The accompanying notes are an integral part of these financial statements.
90Pioneer Strategic Income Fund | Semiannual Report | 3/31/24
| | Six Months
Ended
3/31/24
(unaudited) | Year
Ended
9/30/23 | Year
Ended
9/30/22 | Year
Ended
9/30/21 | Year
Ended
9/30/20 | Year
Ended
9/30/19 |
| Class K | | | | | | |
| Net asset value, beginning of period | $ 8.92 | $ 9.07 | $ 11.40 | $ 10.92 | $ 10.92 | $ 10.44 |
| Increase (decrease) from investment operations: | | | | | | |
| Net investment income (loss) (a) | $ 0.28 | $ 0.49 | $ 0.40 | $ 0.40 | $ 0.43 | $ 0.41 |
| Net realized and unrealized gain (loss) on investments | 0.43 | (0.28) | (1.87) | 0.53 | (0.04) | 0.43 |
| Net increase (decrease) from investment operations | $ 0.71 | $ 0.21 | $ (1.47) | $ 0.93 | $ 0.39 | $ 0.84 |
| Distributions to shareholders: | | | | | | |
| Net investment income | $ (0.20) | $ (0.36) | $ (0.16) | $ (0.45) | $ (0.39) | $ (0.32) |
| Net realized gain | — | — | (0.53) | — | — | — |
| Tax return of capital | — | — | (0.17) | — | — | (0.04) |
| Total distributions | $ (0.20) | $ (0.36) | $ (0.86) | $ (0.45) | $ (0.39) | $ (0.36) |
| Net increase (decrease) in net asset value | $ 0.51 | $ (0.15) | $ (2.33) | $ 0.48 | $ — | $ 0.48 |
| Net asset value, end of period | $ 9.43 | $ 8.92 | $ 9.07 | $ 11.40 | $ 10.92 | $ 10.92 |
| Total return (b) | 8.07%(c) | 2.28%(d) | (13.73)% | 8.58% | 3.73% | 8.19% |
| Ratio of net expenses to average net assets | 0.59%(e) | 0.59% | 0.59% | 0.63% | 0.62% | 0.63% |
| Ratio of net investment income (loss) to average net assets | 5.97%(e) | 5.38% | 3.88% | 3.55% | 4.02% | 3.86% |
| Portfolio turnover rate | 25%(c) | 51% | 56% | 67% | 69% | 53% |
| Net assets, end of period (in thousands) | $488,711 | $426,933 | $403,112 | $465,149 | $414,610 | $402,042 |
| Ratios with no waiver of fees and assumption of expenses by the Adviser and no reduction for fees paid indirectly: | | | | | | |
| Total expenses to average net assets | 0.63%(e) | 0.64% | 0.61% | 0.63% | 0.62% | 0.63% |
| Net investment income (loss) to average net assets | 5.93%(e) | 5.33% | 3.86% | 3.55% | 4.02% | 3.86% |
| (a) | The per-share data presented above is based on the average shares outstanding for the period presented. |
| (b) | Assumes initial investment at net asset value at the beginning of each period, reinvestment of all distributions and the complete redemption of the investment at net asset value at the end of each period. |
| (c) | Not annualized. |
| (d) | For the year ended September 30, 2023, the Fund's total return includes a reimbursement by the Adviser. The impact on Class K's total return was less than 0.005%. |
| (e) | Annualized. |
The accompanying notes are an integral part of these financial statements.
Pioneer Strategic Income Fund | Semiannual Report | 3/31/2491
Financial Highlights (continued)
| | Six Months
Ended
3/31/24
(unaudited) | Year
Ended
9/30/23 | Year
Ended
9/30/22 | Year
Ended
9/30/21 | Year
Ended
9/30/20 | Year
Ended
9/30/19 |
| Class R | | | | | | |
| Net asset value, beginning of period | $ 9.07 | $ 9.21 | $ 11.58 | $ 11.09 | $ 11.08 | $ 10.59 |
| Increase (decrease) from investment operations: | | | | | | |
| Net investment income (loss) (a) | $ 0.24 | $ 0.43 | $ 0.32 | $ 0.33 | $ 0.35 | $ 0.33 |
| Net realized and unrealized gain (loss) on investments | 0.44 | (0.28) | (1.90) | 0.52 | (0.03) | 0.44 |
| Net increase (decrease) from investment operations | $ 0.68 | $ 0.15 | $ (1.58) | $ 0.85 | $ 0.32 | $ 0.77 |
| Distributions to shareholders: | | | | | | |
| Net investment income | $ (0.17) | $ (0.29) | $ (0.09) | $ (0.36) | $ (0.31) | $ (0.24) |
| Net realized gain | — | — | (0.53) | — | — | — |
| Tax return of capital | — | — | (0.17) | — | — | (0.04) |
| Total distributions | $ (0.17) | $ (0.29) | $ (0.79) | $ (0.36) | $ (0.31) | $ (0.28) |
| Net increase (decrease) in net asset value | $ 0.51 | $ (0.14) | $ (2.37) | $ 0.49 | $ 0.01 | $ 0.49 |
| Net asset value, end of period | $ 9.58 | $ 9.07 | $ 9.21 | $ 11.58 | $ 11.09 | $ 11.08 |
| Total return (b) | 7.57%(c) | 1.60%(d) | (14.46)% | 7.77% | 3.03% | 7.43% |
| Ratio of net expenses to average net assets | 1.33%(e) | 1.35% | 1.34% | 1.37% | 1.40% | 1.39% |
| Ratio of net investment income (loss) to average net assets | 5.21%(e) | 4.62% | 3.09% | 2.83% | 3.23% | 3.10% |
| Portfolio turnover rate | 25%(c) | 51% | 56% | 67% | 69% | 53% |
| Net assets, end of period (in thousands) | $55,466 | $54,791 | $62,624 | $94,136 | $103,585 | $131,214 |
| Ratios with no waiver of fees and assumption of expenses by the Adviser and no reduction for fees paid indirectly: | | | | | | |
| Total expenses to average net assets | 1.37%(e) | 1.39% | 1.36% | 1.37% | 1.40% | 1.39% |
| Net investment income (loss) to average net assets | 5.17%(e) | 4.58% | 3.07% | 2.83% | 3.23% | 3.10% |
| (a) | The per-share data presented above is based on the average shares outstanding for the period presented. |
| (b) | Assumes initial investment at net asset value at the beginning of each period, reinvestment of all distributions and the complete redemption of the investment at net asset value at the end of each period. |
| (c) | Not annualized. |
| (d) | For the year ended September 30, 2023, the Fund's total return includes a reimbursement by the Adviser. The impact on Class R's total return was less than 0.005%. |
| (e) | Annualized. |
The accompanying notes are an integral part of these financial statements.
92Pioneer Strategic Income Fund | Semiannual Report | 3/31/24
| | Six Months
Ended
3/31/24
(unaudited) | Year
Ended
9/30/23 | Year
Ended
9/30/22 | Year
Ended
9/30/21 | Year
Ended
9/30/20 | Year
Ended
9/30/19 |
| Class Y | | | | | | |
| Net asset value, beginning of period | $ 8.91 | $ 9.05 | $ 11.38 | $ 10.91 | $ 10.90 | $ 10.42 |
| Increase (decrease) from investment operations: | | | | | | |
| Net investment income (loss) (a) | $ 0.27 | $ 0.48 | $ 0.39 | $ 0.39 | $ 0.42 | $ 0.40 |
| Net realized and unrealized gain (loss) on investments | 0.43 | (0.27) | (1.87) | 0.51 | (0.03) | 0.42 |
| Net increase (decrease) from investment operations | $ 0.70 | $ 0.21 | $ (1.48) | $ 0.90 | $ 0.39 | $ 0.82 |
| Distributions to shareholders: | | | | | | |
| Net investment income | $ (0.20) | $ (0.35) | $ (0.15) | $ (0.43) | $ (0.38) | $ (0.30) |
| Net realized gain | — | — | (0.53) | — | — | — |
| Tax return of capital | — | — | (0.17) | — | — | (0.04) |
| Total distributions | $ (0.20) | $ (0.35) | $ (0.85) | $ (0.43) | $ (0.38) | $ (0.34) |
| Net increase (decrease) in net asset value | $ 0.50 | $ (0.14) | $ (2.33) | $ 0.47 | $ 0.01 | $ 0.48 |
| Net asset value, end of period | $ 9.41 | $ 8.91 | $ 9.05 | $ 11.38 | $ 10.91 | $ 10.90 |
| Total return (b) | 7.91%(c) | 2.28%(d) | (13.85)% | 8.37% | 3.71% | 8.09% |
| Ratio of net expenses to average net assets | 0.69%(e) | 0.69% | 0.69% | 0.74% | 0.74% | 0.73% |
| Ratio of net investment income (loss) to average net assets | 5.85%(e) | 5.28% | 3.77% | 3.44% | 3.91% | 3.75% |
| Portfolio turnover rate | 25%(c) | 51% | 56% | 67% | 69% | 53% |
| Net assets, end of period (in thousands) | $2,109,587 | $2,099,995 | $2,579,954 | $3,204,878 | $2,896,168 | $3,010,817 |
| Ratios with no waiver of fees and assumption of expenses by the Adviser and no reduction for fees paid indirectly: | | | | | | |
| Total expenses to average net assets | 0.74%(e) | 0.74% | 0.71% | 0.74% | 0.74% | 0.73% |
| Net investment income (loss) to average net assets | 5.80%(e) | 5.23% | 3.75% | 3.44% | 3.91% | 3.75% |
| (a) | The per-share data presented above is based on the average shares outstanding for the period presented. |
| (b) | Assumes initial investment at net asset value at the beginning of each period, reinvestment of all distributions and the complete redemption of the investment at net asset value at the end of each period. |
| (c) | Not annualized. |
| (d) | For the year ended September 30, 2023, the Fund's total return includes a reimbursement by the Adviser. The impact on Class Y's total return was less than 0.005%. |
| (e) | Annualized. |
The accompanying notes are an integral part of these financial statements.
Pioneer Strategic Income Fund | Semiannual Report | 3/31/2493
Notes to Financial Statements | 3/31/24
(unaudited)
1. Organization and Significant Accounting Policies
Pioneer Strategic Income Fund (the “Fund”) is one of five portfolios comprising Pioneer Series Trust XIV (formerly known as Pioneer Strategic Income Fund), a Delaware statutory trust. The Fund is registered under the Investment Company Act of 1940 (the "1940 Act") as a diversified, open-end management investment company. The investment objective of the Fund is to produce a high level of current income.
The Fund offers five classes of shares designated as Class A, Class C, Class K, Class R and Class Y shares. Each class of shares represents an interest in the same portfolio of investments of the Fund and has identical rights (based on relative net asset values) to assets and liquidation proceeds. Share classes can bear different rates of class-specific fees and expenses, such as transfer agent and distribution fees. Differences in class-specific fees and expenses will result in differences in net investment income and, therefore, the payment of different dividends from net investment income earned by each class. The Amended and Restated Declaration of Trust of the Trust gives the Board of Trustees the flexibility to specify either per-share voting or dollar-weighted voting when submitting matters for shareholder approval. Under per-share voting, each share of a class of the Fund is entitled to one vote. Under dollar-weighted voting, a shareholder’s voting power is determined not by the number of shares owned, but by the dollar value of the shares on the record date. Each share class has exclusive voting rights with respect to matters affecting only that class, including with respect to the distribution plan for that class. There is no distribution plan for Class K or Class Y shares.
Amundi Asset Management US, Inc., an indirect, wholly owned subsidiary of Amundi and Amundi’s wholly owned subsidiary, Amundi USA, Inc., serves as the Fund’s investment adviser (the “Adviser”). Amundi Distributor US, Inc., an affiliate of the Adviser, serves as the Fund’s distributor (the “Distributor”).
The Fund is required to comply with Rule 18f-4 under the 1940 Act, which governs the use of derivatives by registered investment companies. Rule 18f-4 permits funds to enter into derivatives transactions (as defined in Rule 18f-4) and certain other transactions notwithstanding the restrictions on the issuance of “senior securities” under Section 18 of the 1940 Act. In accordance with Rule 18f-4, the Fund has established and maintains a comprehensive derivatives risk management program, has
94Pioneer Strategic Income Fund | Semiannual Report | 3/31/24
appointed a derivatives risk manager and complies with a relative or absolute limit on fund leverage risk calculated based on value-at-risk ("VaR").
The Fund is an investment company and follows investment company accounting and reporting guidance under U.S. Generally Accepted Accounting Principles (“U.S. GAAP”). U.S. GAAP requires the management of the Fund to make estimates and assumptions that affect the reported amounts of assets and liabilities, the disclosure of contingent assets and liabilities at the date of the financial statements, and the reported amounts of income, expenses and gain or loss on investments during the reporting period. Actual results could differ from those estimates.
The following is a summary of significant accounting policies followed by the Fund in the preparation of its financial statements:
| A. | Security Valuation |
| | The net asset value of the Fund is computed once daily, on each day the New York Stock Exchange (“NYSE”) is open, as of the close of regular trading on the NYSE. |
| | Fixed income securities are valued by using prices supplied by independent pricing services, which consider such factors as market prices, market events, quotations from one or more brokers, Treasury spreads, yields, maturities and ratings, or may use a pricing matrix or other fair value methods or techniques to provide an estimated value of the security or instrument. A pricing matrix is a means of valuing a debt security on the basis of current market prices for other debt securities, historical trading patterns in the market for fixed income securities and/or other factors. Non-U.S. debt securities that are listed on an exchange will be valued at the bid price obtained from an independent third party pricing service. When independent third party pricing services are unable to supply prices, or when prices or market quotations are considered to be unreliable, the value of that security may be determined using quotations from one or more broker-dealers. |
| | Loan interests are valued at the mean between the last available bid and asked prices from one or more brokers or dealers as obtained from Loan Pricing Corporation, an independent third party pricing service. If price information is not available from Loan Pricing Corporation, or if the price information is deemed to be unreliable, price information will be obtained from an alternative loan interest pricing service. If no reliable price quotes are available from either the primary or alternative pricing service, broker quotes will be solicited. |
Pioneer Strategic Income Fund | Semiannual Report | 3/31/2495
| | Event-linked bonds are valued at the bid price obtained from an independent third party pricing service. Other insurance-linked securities (including reinsurance sidecars, collateralized reinsurance and industry loss warranties) may be valued at the bid price obtained from an independent pricing service, or through a third party using a pricing matrix, insurance industry valuation models, or other fair value methods or techniques to provide an estimated value of the instrument. |
| | Equity securities that have traded on an exchange are valued by using the last sale price on the principal exchange where they are traded. Equity securities that have not traded on the date of valuation, or securities for which sale prices are not available, generally are valued using the mean between the last bid and asked prices or, if both last bid and asked prices are not available, at the last quoted bid price. Last sale and bid and asked prices are provided by independent third party pricing services. In the case of equity securities not traded on an exchange, prices are typically determined by independent third party pricing services using a variety of techniques and methods. |
| | The value of foreign securities is translated into U.S. dollars based on foreign currency exchange rate quotations supplied by a third party pricing source. Trading in non-U.S. equity securities is substantially completed each day at various times prior to the close of the NYSE. The values of such securities used in computing the net asset value of the Fund’s shares are determined as of such times. The Adviser may use a fair value model developed by an independent pricing service to value non-U.S. equity securities. |
| | Options contracts are generally valued at the mean between the last bid and ask prices on the principal exchange where they are traded. Over-the-counter (“OTC”) options and options on swaps (“swaptions”) are valued using prices supplied by independent pricing services, which consider such factors as market prices, market events, quotations from one or more brokers, Treasury spreads, yields, maturities and ratings, or may use a pricing matrix or other fair value methods or techniques to provide an estimated value of the security or instrument. |
| | Forward foreign currency exchange contracts are valued daily using the foreign exchange rate or, for longer term forward contract positions, the spot currency rate and the forward points on a daily basis, in each case provided by a third party pricing service. Contracts whose forward settlement date falls between two quoted days are valued by interpolation. |
| | Futures contracts are generally valued at the closing settlement price established by the exchange on which they are traded. |
96Pioneer Strategic Income Fund | Semiannual Report | 3/31/24
| | Swap contracts, including interest rate swaps, caps and floors (other than centrally cleared swap contracts), are valued at the dealer quotations obtained from reputable International Swap Dealers Association members. Centrally cleared swaps are valued at the daily settlement price provided by the central clearing counterparty. |
| | Shares of open-end registered investment companies (including money market mutual funds) are valued at such funds’ net asset value. |
| | Securities or loan interests for which independent pricing services or broker-dealers are unable to supply prices or for which market prices and/or quotations are not readily available or are considered to be unreliable are valued by a fair valuation team comprised of certain personnel of the Adviser. The Adviser is designated as the valuation designee for the Fund pursuant to Rule 2a-5 under the 1940 Act. The Adviser’s fair valuation team is responsible for monitoring developments that may impact fair valued securities. |
| | Inputs used when applying fair value methods to value a security may include credit ratings, the financial condition of the company, current market conditions and comparable securities. The Adviser may use fair value methods if it is determined that a significant event has occurred after the close of the exchange or market on which the security trades and prior to the determination of the Fund’s net asset value. Examples of a significant event might include political or economic news, corporate restructurings, natural disasters, terrorist activity or trading halts. Thus, the valuation of the Fund’s securities may differ significantly from exchange prices, and such differences could be material. |
| | Repurchase agreements are valued at par. Cash may include overnight time deposits at approved financial institutions. |
| B. | Investment Income and Transactions |
| | Dividend income is recorded on the ex-dividend date, except that certain dividends from foreign securities where the ex-dividend date may have passed are recorded as soon as the Fund becomes aware of the ex-dividend data in the exercise of reasonable diligence. |
| | Interest income, including interest on income-bearing cash accounts, is recorded on the accrual basis. Dividend and interest income are reported net of unrecoverable foreign taxes withheld at the applicable country rates and net of income accrued on defaulted securities. |
Pioneer Strategic Income Fund | Semiannual Report | 3/31/2497
| | Interest and dividend income payable by delivery of additional shares is reclassified as PIK (payment-in-kind) income upon receipt and is included in interest and dividend income, respectively. |
| | Principal amounts of mortgage-backed securities are adjusted for monthly paydowns. Premiums and discounts related to certain mortgage-backed securities are amortized or accreted in proportion to the monthly paydowns. All discounts/premiums on purchase prices of debt securities are accreted/amortized for financial reporting purposes over the life of the respective securities, and such accretion/amortization is included in interest income. |
| | Security transactions are recorded as of trade date. Gains and losses on sales of investments are calculated on the identified cost method for both financial reporting and federal income tax purposes. |
| C. | Foreign Currency Translation |
| | The books and records of the Fund are maintained in U.S. dollars. Amounts denominated in foreign currencies are translated into U.S. dollars using current exchange rates. |
| | Net realized gains and losses on foreign currency transactions, if any, represent, among other things, the net realized gains and losses on foreign currency exchange contracts, disposition of foreign currencies and the difference between the amount of income accrued and the U.S. dollars actually received. Further, the effects of changes in foreign currency exchange rates on investments are not segregated on the Statement of Operations from the effects of changes in the market prices of those securities, but are included with the net realized and unrealized gain or loss on investments. |
| D. | Federal Income Taxes |
| | It is the Fund’s policy to comply with the requirements of the Internal Revenue Code applicable to regulated investment companies and to distribute all of its net taxable income and net realized capital gains, if any, to its shareholders. Therefore, no provision for federal income taxes is required. As of March 31, 2024, the Fund did not accrue any interest or penalties with respect to uncertain tax positions, which, if applicable, would be recorded as an income tax expense on the Statement of Operations. Tax returns filed within the prior three years remain subject to examination by federal and state tax authorities. |
| | In determining the daily net asset value, the Fund estimates the reserve for such taxes, if any, associated with investments in certain countries. The estimated reserve for the capital gains is based on the net unrealized |
98Pioneer Strategic Income Fund | Semiannual Report | 3/31/24
| | appreciation on certain portfolio securities, the holding period of such securities and the related tax rates, tax loss carryforward (if applicable) and other such factors. As of March 31, 2024, the Fund had accrued $147,993 in reserve for repatriation taxes related to capital gains. |
| | The amount and character of income and capital gain distributions to shareholders are determined in accordance with federal income tax rules, which may differ from U.S. GAAP. Distributions in excess of net investment income or net realized gains are temporary over distributions for financial statement purposes resulting from differences in the recognition or classification of income or distributions for financial statement and tax purposes. Capital accounts within the financial statements are adjusted for permanent book/tax differences to reflect tax character, but are not adjusted for temporary differences. |
| | A portion of the dividend income recorded by the Fund is from distributions by publicly traded real estate investment trusts (“REITs”), and such distributions for tax purposes may also consist of capital gains and return of capital. The actual return of capital and capital gains portions of such distributions will be determined by formal notifications from the REITs subsequent to the calendar year-end. Distributions received from the REITs that are determined to be a return of capital are recorded by the Fund as a reduction of the cost basis of the securities held and those determined to be capital gain are reflected as such on the Statement of Operations. |
| | The tax character of current year distributions payable will be determined at the end of the current taxable year. The tax character of distributions paid during the year ended September 30, 2023 was as follows: |
| | 2023 |
| Distributions paid from: | |
| Ordinary income | $129,538,491 |
| Total | $129,538,491 |
The following shows the components of distributable earnings (losses) on a federal income tax basis at September 30, 2023:
| | 2023 |
| Distributable earnings/(losses): | |
| Undistributed ordinary income | $ 5,293,645 |
| Capital loss carryforward | (288,004,798) |
| Current year dividend payable | (2,461,964) |
| Net unrealized depreciation | (468,042,539) |
| Total | $(753,215,656) |
Pioneer Strategic Income Fund | Semiannual Report | 3/31/2499
The difference between book-basis and tax-basis net unrealized depreciation is attributable to the tax deferral of losses on wash sales, realization for tax purposes of unrealized gains on investments in passive foreign investment companies, the book/tax differences in the adjustments relating to insurance-linked securities, the tax treatment of premium and amortization, accrual of income on securities in default, and the mark to market of futures contracts and swaps.
| E. | Fund Shares |
| | The Fund records sales and repurchases of its shares as of trade date. The Distributor earned $9,137 in underwriting commissions on the sale of Class A shares during the six months ended March 31, 2024. |
| F. | Class Allocations |
| | Income, common expenses and realized and unrealized gains and losses are calculated at the Fund level and allocated daily to each class of shares based on its respective percentage of adjusted net assets at the beginning of the day. |
| | Distribution fees are calculated based on the average daily net asset value attributable to Class A, Class C and Class R shares of the Fund, respectively (see Note 5). Class K and Class Y shares do not pay distribution fees. All expenses and fees paid to the Fund’s transfer agent for its services are allocated among the classes of shares based on the number of accounts in each class and the ratable allocation of related out-of-pocket expenses (see Note 4). |
| | The Fund declares as daily dividends substantially all of its net investment income. All dividends are paid on a monthly basis. Short-term capital gain distributions, if any, may be declared with the daily dividends. Distributions to shareholders are recorded as of the ex-dividend date. Distributions paid by the Fund with respect to each class of shares are calculated in the same manner and at the same time, except that net investment income dividends to Class A, Class C, Class K, Class R and Class Y shares can reflect different transfer agent and distribution expense rates. |
| G. | Risks |
| | The value of securities held by the Fund may go up or down, sometimes rapidly or unpredictably, due to general market conditions, such as real or perceived adverse economic, political or regulatory conditions, recessions, the spread of infectious illness or other public health issues, inflation, changes in interest rates, armed conflict such as between |
100Pioneer Strategic Income Fund | Semiannual Report | 3/31/24
| | Russia and Ukraine or in the Middle East, sanctions against Russia, other nations or individuals or companies and possible countermeasures, lack of liquidity in the bond markets or adverse investor sentiment. In the past several years, financial markets have experienced increased volatility, depressed valuations, decreased liquidity and heightened uncertainty. These conditions may continue, recur, worsen or spread. Inflation and interest rates have increased and may rise further. These circumstances could adversely affect the value and liquidity of the Fund’s investments and negatively impact the Fund’s performance. |
| | The long-term impact of the COVID-19 pandemic and its subsequent variants on economies, markets, industries and individual issuers, are not known. Some sectors of the economy and individual issuers have experienced or may experience particularly large losses. Periods of extreme volatility in the financial markets, reduced liquidity of many instruments, increased government debt, inflation, and disruptions to supply chains, consumer demand and employee availability, may continue for some time. Following Russia’s invasion of Ukraine, Russian securities lost all, or nearly all, their market value. Other securities or markets could be similarly affected by past or future political, geopolitical or other events or conditions. |
| | Governments and central banks, including the U.S. Federal Reserve, have taken extraordinary and unprecedented actions to support local and global economies and the financial markets. These actions have resulted in significant expansion of public debt, including in the U.S. The consequences of high public debt, including its future impact on the economy and securities markets, may not be known for some time. |
| | The U.S. and other countries are periodically involved in disputes over trade and other matters, which may result in tariffs, investment restrictions and adverse impacts on affected companies and securities. For example, the U.S. has imposed tariffs and other trade barriers on Chinese exports, has restricted sales of certain categories of goods to China, and has established barriers to investments in China. Trade disputes may adversely affect the economies of the U.S. and its trading partners, as well as companies directly or indirectly affected and financial markets generally. If the political climate between the U.S. and China does not improve or continues to deteriorate, if China were to attempt unification of Taiwan by force, or if other geopolitical conflicts develop or get worse, economies, markets and individual securities may be severely affected both regionally and globally, and the value of the Fund’s assets may go down. |
Pioneer Strategic Income Fund | Semiannual Report | 3/31/24101
| | At times, the Fund’s investments may represent industries or industry sectors that are interrelated or have common risks, making the Fund more susceptible to any economic, political, or regulatory developments or other risks affecting those industries and sectors. |
| | The Fund may invest in mortgage-related and asset-backed securities. The value of mortgage-related and asset-backed securities will be influenced by factors affecting the assets underlying such securities. As a result, during periods of declining asset value, difficult or frozen credit markets, swings in interest rates, or deteriorating economic conditions, mortgage-related and asset-backed securities may decline in value, face valuation difficulties, become more volatile and/or become illiquid. Mortgage-backed securities tend to be more sensitive to changes in interest rate than other types of debt securities. These securities are also subject to prepayment and extension risks. Some of these securities may receive little or no collateral protection from the underlying assets and are thus subject to the risk of default. The risk of such defaults is generally higher in the case of mortgage-backed investments offered by non-governmental issuers and those that include so-called “sub-prime” mortgages. The structure of some of these securities may be complex and there may be less available information than for other types of debt securities. Upon the occurrence of certain triggering events or defaults, the Fund may become the holder of underlying assets at a time when those assets may be difficult to sell or may be sold only at a loss. |
| | The Fund may invest in credit risk transfer securities. Credit risk transfer securities are unguaranteed and unsecured debt securities issued by government sponsored enterprises and therefore are not directly linked to or backed by the underlying mortgage loans. As a result, in the event that a government sponsored enterprise fails to pay principal or interest on its credit risk transfer securities or goes through a bankruptcy, insolvency or similar proceeding, holders of such credit risk transfer securities have no direct recourse to the underlying mortgage loans and will generally receive recovery on par with other unsecured note holders in such a scenario. The risks associated with an investment in credit risk transfer securities are different than the risks associated with an investment in mortgage-backed securities issued by Fannie Mae and Freddie Mac, or other government sponsored enterprise or issued by a private issuer, because some or all of the mortgage default or credit risk associated with the underlying mortgage loans is transferred to investors. As a result, investors in these securities could lose some or all of their investment in these securities if the underlying mortgage loans default. |
102Pioneer Strategic Income Fund | Semiannual Report | 3/31/24
| | The Fund invests in below-investment-grade (high-yield) debt securities and preferred stocks. Some of these high-yield securities may be convertible into equity securities of the issuer. Debt securities rated below-investment-grade are commonly referred to as “junk bonds” and are considered speculative with respect to the issuer’s capacity to pay interest and repay principal. These securities involve greater risk of loss, are subject to greater price volatility, and may be less liquid and more difficult to value, especially during periods of economic uncertainty or change, than higher rated debt securities. |
| | The market prices of the Fund’s fixed income securities may fluctuate significantly when interest rates change. The value of your investment will generally go down when interest rates rise. A rise in rates tends to have a greater impact on the prices of longer term or duration securities. For example, if interest rates increase by 1%, the value of a Fund’s portfolio with a portfolio duration of ten years would be expected to decrease by 10%, all other things being equal. In recent years interest rates and credit spreads in the U.S. have been at historic lows. The U.S. Federal Reserve has raised certain interest rates, and interest rates may continue to go up. A general rise in interest rates could adversely affect the price and liquidity of fixed income securities. The maturity of a security may be significantly longer than its effective duration. A security’s maturity and other features may be more relevant than its effective duration in determining the security’s sensitivity to other factors affecting the issuer or markets generally, such as changes in credit quality or in the yield premium that the market may establish for certain types of securities (sometimes called “credit spread”). In general, the longer its maturity the more a security may be susceptible to these factors. When the credit spread for a fixed income security goes up, or “widens”, the value of the security will generally go down. |
| | If an issuer or guarantor of a security held by the Fund or a counterparty to a financial contract with the Fund defaults on its obligation to pay principal and/or interest, has its credit rating downgraded or is perceived to be less creditworthy, or the credit quality or value of any underlying assets declines, the value of your investment will typically decline. Changes in actual or perceived creditworthiness may occur quickly. The Fund could be delayed or hindered in its enforcement of rights against an issuer, guarantor or counterparty. |
| | The Fund’s investments in foreign markets and countries with limited developing markets may subject the Fund to a greater degree of risk than investments in a developed market. These risks include disruptive political or economic conditions, military conflicts and sanctions, terrorism, sustained economic downturns, financial instability, less |
Pioneer Strategic Income Fund | Semiannual Report | 3/31/24103
| | liquid trading markets, extreme price volatility, currency risks, reduction of government or central bank support, inadequate accounting standards, tariffs, tax disputes or other tax burdens, nationalization or expropriation of assets and the imposition of adverse governmental laws, arbitrary application of laws and regulations or lack of rule of law and investment and repatriation restrictions. Lack of information and less market regulation also may affect the value of these securities. Withholding and other non-U.S. taxes may decrease the Fund’s return. Non-U.S. issuers may be located in parts of the world that have historically been prone to natural disasters. Investing in depositary receipts is subject to many of the same risks as investing directly in non-U.S. issuers. Depositary receipts may involve higher expenses and may trade at a discount (or premium) to the underlying security. |
| | Russia launched a large-scale invasion of Ukraine on February 24, 2022. In response to the military action by Russia, various countries, including the U.S., the United Kingdom, and European Union issued broad-ranging economic sanctions against Russia and Belarus and certain companies and individuals. Since then, Russian securities have lost all, or nearly all, their market value, and many other issuers, securities and markets have been adversely affected. The United States and other countries may impose sanctions on other countries, companies and individuals in light of Russia’s military invasion. The extent and duration of the military action or future escalation of such hostilities, the extent and impact of existing and future sanctions, market disruptions and volatility, and the result of any diplomatic negotiations cannot be predicted. These and any related events could have a significant impact on the value and liquidity of certain Fund investments, on Fund performance and the value of an investment in the Fund, particularly with respect to securities and commodities, such as oil, natural gas and food commodities, as well as other sectors with exposure to Russian issuers or issuers in other countries affected by the invasion, and are likely to have collateral impacts on market sectors globally. |
| | The Fund’s investments, payment obligations and financing terms may be based on floating rates, such as LIBOR (London Interbank Offered Rate) or SOFR (Secured Overnight Financing Rate). ICE Benchmark Administration, the administrator of LIBOR, has ceased publication of most LIBOR settings on a representative basis. Actions by regulators have resulted in the establishment of alternative reference rates to LIBOR in most major currencies. In the U.S., a common benchmark replacement is based on the SOFR published by the Federal Reserve Bank of New York, including certain spread adjustments and benchmark replacement conforming changes, although other benchmark |
104Pioneer Strategic Income Fund | Semiannual Report | 3/31/24
| | replacements (without or without spread adjustments) may be used in certain transactions. The impact of the transition from LIBOR on the Fund’s transactions and financial markets generally cannot yet be determined. The transition away from LIBOR may lead to increased volatility and illiquidity in markets for instruments that have relied on LIBOR and may adversely affect the Fund’s performance. |
| | With the increased use of technologies such as the Internet to conduct business, the Fund is susceptible to operational, information security and related risks. While the Fund’s Adviser has established business continuity plans in the event of, and risk management systems to prevent, limit or mitigate, such cyber-attacks, there are inherent limitations in such plans and systems, including the possibility that certain risks have not been identified. Furthermore, the Fund cannot control the cybersecurity plans and systems put in place by service providers to the Fund such as the Fund’s custodian and accounting agent, and the Fund’s transfer agent. In addition, many beneficial owners of Fund shares hold them through accounts at broker-dealers, retirement platforms and other financial market participants over which neither the Fund nor the Adviser exercises control. Each of these may in turn rely on service providers to them, which are also subject to the risk of cyber-attacks. Cybersecurity failures or breaches at the Adviser or the Fund’s service providers or intermediaries have the ability to cause disruptions and impact business operations, potentially resulting in financial losses, interference with the Fund’s ability to calculate its net asset value, impediments to trading, the inability of Fund shareholders to effect share purchases, redemptions or exchanges or receive distributions, loss of or unauthorized access to private shareholder information and violations of applicable privacy and other laws, regulatory fines, penalties, reputational damage, or additional compliance costs. Such costs and losses may not be covered under any insurance. In addition, maintaining vigilance against cyber-attacks may involve substantial costs over time, and system enhancements may themselves be subject to cyber-attacks. |
| | The Fund’s prospectus contains unaudited information regarding the Fund’s principal risks. Please refer to that document when considering the Fund’s principal risks. |
| H. | Restricted Securities |
| | Restricted Securities are subject to legal or contractual restrictions on resale. Restricted securities generally are resold in transactions exempt from registration under the Securities Act of 1933. Private placement securities are generally considered to be restricted except for those |
Pioneer Strategic Income Fund | Semiannual Report | 3/31/24105
| | securities traded between qualified institutional investors under the provisions of Rule 144A of the Securities Act of 1933. |
| | Disposal of restricted investments may involve negotiations and expenses, and prompt sale at an acceptable price may be difficult to achieve. Restricted investments held by the Fund at March 31, 2024 are listed in the Schedule of Investments. |
| I. | Insurance-Linked Securities (“ILS”) |
| | The Fund invests in ILS. The Fund could lose a portion or all of the principal it has invested in an ILS, and the right to additional interest or dividend payments with respect to the security, upon the occurrence of one or more trigger events, as defined within the terms of an insurance-linked security. Trigger events, generally, are hurricanes, earthquakes, or other natural events of a specific size or magnitude that occur in a designated geographic region during a specified time period, and/or that involve losses or other metrics that exceed a specific amount. There is no way to accurately predict whether a trigger event will occur, and accordingly, ILS carry significant risk. The Fund is entitled to receive principal, and interest and/or dividend payments so long as no trigger event occurs of the description and magnitude specified by the instrument. In addition to the specified trigger events, ILS may expose the Fund to other risks, including but not limited to issuer (credit) default, adverse regulatory or jurisdictional interpretations and adverse tax consequences. |
| | The Fund’s investments in ILS may include event-linked bonds. ILS also may include special purpose vehicles (“SPVs”) or similar instruments structured to comprise a portion of a reinsurer’s catastrophe-oriented business, known as quota share instruments (sometimes referred to as reinsurance sidecars), or to provide reinsurance relating to specific risks to insurance or reinsurance companies through a collateralized instrument, known as collateralized reinsurance. Structured reinsurance investments also may include industry loss warranties (“ILWs”). A traditional ILW takes the form of a bilateral reinsurance contract, but there are also products that take the form of derivatives, collateralized structures, or exchange-traded instruments. |
| | Where the ILS are based on the performance of underlying reinsurance contracts, the Fund has limited transparency into the individual underlying contracts, and therefore must rely upon the risk assessment and sound underwriting practices of the issuer. Accordingly, it may be more difficult for the Adviser to fully evaluate the underlying risk profile of the Fund's structured reinsurance investments, and therefore the Fund's assets are placed at greater risk of loss than if the Adviser had |
106Pioneer Strategic Income Fund | Semiannual Report | 3/31/24
| | more complete information. Structured reinsurance instruments generally will be considered illiquid securities by the Fund. These securities may be difficult to purchase, sell or unwind. Illiquid securities also may be difficult to value. If the Fund is forced to sell an illiquid asset, the Fund may be forced to sell at a loss. |
| J. | Repurchase Agreements |
| | Repurchase agreements are arrangements under which the Fund purchases securities from a broker-dealer or a bank, called the counterparty, upon the agreement of the counterparty to repurchase the securities from the Fund at a later date, and at a specific price, which is typically higher than the purchase price paid by the Fund. The securities purchased serve as the Fund’s collateral for the obligation of the counterparty to repurchase the securities. The value of the collateral, including accrued interest, is required to be equal to or in excess of the repurchase price. The collateral for all repurchase agreements is held in safekeeping in the customer-only account of the Fund’s custodian or a sub-custodian of the Fund. The Adviser is responsible for determining that the value of the collateral remains at least equal to the repurchase price. In the event of a default by the counterparty, the Fund is entitled to sell the securities, but the Fund may not be able to sell them for the price at which they were purchased, thus causing a loss to the Fund. Additionally, if the counterparty becomes insolvent, there is some risk that the Fund will not have a right to the securities, or the immediate right to sell the securities. |
| | Open repurchase agreements at March 31, 2024 are disclosed in the Schedule of Investments. |
| K. | Purchased Options |
| | The Fund may purchase put and call options to seek to increase total return. Purchased call and put options entitle the Fund to buy and sell a specified number of shares or units of a particular security, currency or index at a specified price at a specific date or within a specific period of time. Upon the purchase of a call or put option, the premium paid by the Fund is included on the Statement of Assets and Liabilities as an investment. All premiums are marked-to-market daily, and any unrealized appreciation or depreciation is recorded on the Fund’s Statement of Operations. As the purchaser of an index option, the Fund has the right to receive a cash payment equal to any depreciation in the value of the index below the strike price of the option (in the case of a put) or equal to any appreciation in the value of the index over the strike price of the option (in the case of a call) as of the valuation date of the |
Pioneer Strategic Income Fund | Semiannual Report | 3/31/24107
| | option. Premiums paid for purchased call and put options which have expired are treated as realized losses on investments on the Statement of Operations. Upon the exercise or closing of a purchased put option, the premium is offset against the proceeds on the sale of the underlying security or financial instrument in order to determine the realized gain or loss on investments. Upon the exercise or closing of a purchased call option, the premium is added to the cost of the security or financial instrument. The risk associated with purchasing options is limited to the premium originally paid. |
| | The average market value of purchased options contracts open during the six months ended March 31, 2024 was $982,923. Open purchased options contracts at March 31, 2024 are listed in the Schedule of Investments. |
| L. | Option Writing |
| | The Fund may write put and covered call options to seek to increase total return. When an option is written, the Fund receives a premium and becomes obligated to purchase or sell the underlying security at a fixed price, upon the exercise of the option. When the Fund writes an option, an amount equal to the premium received by the Fund is recorded as “Written options outstanding” on the Statement of Assets and Liabilities and is subsequently adjusted to the current value of the option written. Premiums received from writing options that expire unexercised are treated by the Fund on the expiration date as realized gains from investments on the Statement of Operations. The difference between the premium and the amount paid on effecting a closing purchase transaction, including brokerage commissions, is also treated as a realized gain on the Statement of Operations, or, if the premium is less than the amount paid for the closing purchase transaction, as a realized loss on the Statement of Operations. If a call option is exercised, the premium is added to the proceeds from the sale of the underlying security in determining whether the Fund has realized a gain or loss. The Fund as writer of an option bears the market risk of an unfavorable change in the price of the security underlying the written option. |
| | The average market value of written options for the six months ended March 31, 2024 was $(330,773). Open written options contracts at March 31, 2024 are listed in the Schedule of Investments. |
| M. | Forward Foreign Currency Exchange Contracts |
| | The Fund may enter into forward foreign currency exchange contracts ("contracts") for the purchase or sale of a specific foreign currency at a fixed price on a future date. All contracts are marked-to-market daily at |
108Pioneer Strategic Income Fund | Semiannual Report | 3/31/24
| | the applicable exchange rates, and any resulting unrealized appreciation or depreciation is recorded in the Fund's financial statements. The Fund records realized gains and losses at the time a contract is offset by entry into a closing transaction or extinguished by delivery of the currency. Risks may arise upon entering into these contracts from the potential inability of counterparties to meet the terms of the contract and from unanticipated movements in the value of foreign currencies relative to the U.S. dollar (see Note 8). |
| | During the six months ended March 31, 2024, the Fund had entered into various forward foreign currency exchange contracts that obligated the Fund to deliver or take delivery of currencies at specified future maturity dates. Alternatively, prior to the settlement date of a forward foreign currency exchange contract, the Fund may close out such contract by entering into an offsetting contract. |
| | The average market value of forward foreign currency exchange contracts open during the six months ended March 31, 2024 was $153,769,345 and $116,457,072 for buys and sells, respectively. Open forward foreign currency exchange contracts outstanding at March 31, 2024 are listed in the Schedule of Investments. |
| N. | TBA Purchase and Sales Commitments |
| | The Fund may enter into to-be-announced (TBA) purchase or sale commitments (collectively, TBA transactions), pursuant to which it agrees to purchase or sell, respectively, mortgage-backed securities for a fixed unit price, with payment and delivery at a scheduled future date beyond the customary settlement period for such securities. With TBA transactions, the particular securities to be received or delivered by the Fund are not identified at the trade date; however, the securities must meet specified terms, including issuer, rate, and mortgage term, and be within industry-accepted “good delivery” standards. The Fund may enter into TBA transactions with the intention of taking possession of or relinquishing the underlying securities, may elect to extend the settlement by “rolling” the transaction, and/or may use TBA transactions to gain or reduce interim exposure to underlying securities. Until settlement, the Fund maintains liquid assets sufficient to settle its commitment to purchase a TBA or, in the case of a sale commitment, the Fund maintains an entitlement to the security to be sold. |
| | To mitigate counterparty risk, the Fund has entered into agreements with TBA counterparties that provide for collateral and the right to offset amounts due to or from those counterparties under specified conditions. Subject to minimum transfer amounts, collateral requirements are determined and transfers made based on the net |
Pioneer Strategic Income Fund | Semiannual Report | 3/31/24109
| | aggregate unrealized gain or loss on all TBA commitments with a particular counterparty. At any time, the Fund’s risk of loss from a particular counterparty related to its TBA commitments is the aggregate unrealized gain on appreciated TBAs in excess of unrealized loss on depreciated TBAs and collateral received, if any, from such counterparty. As of March 31, 2024, the amount of cash deposited with a broker as collateral is recorded as "Collateral due from broker for TBA Securities" on the Statement of Assets and Liabilities. Collateral received from counterparties totaled $429,927 for TBAs. |
| O. | Futures Contracts |
| | The Fund may enter into futures transactions in order to attempt to hedge against changes in interest rates, securities prices and currency exchange rates or to seek to increase total return. Futures contracts are types of derivatives. |
| | All futures contracts entered into by the Fund are traded on a futures exchange. Upon entering into a futures contract, the Fund is required to deposit with a broker an amount of cash or securities equal to the minimum "initial margin" requirements of the associated futures exchange. The amount of cash deposited with the broker as collateral at March 31, 2024 is recorded as "Futures collateral" on the Statement of Assets and Liabilities. |
| | Subsequent payments for futures contracts ("variation margin") are paid or received by the Fund, depending on the daily fluctuation in the value of the contracts, and are recorded by the Fund as unrealized appreciation or depreciation. Cash received from or paid to the broker related to previous margin movement is held in a segregated account at the broker and is recorded as either "Due from broker for futures" or "Due to broker for futures" on the Statement of Assets and Liabilities. When the contract is closed, the Fund realizes a gain or loss equal to the difference between the opening and closing value of the contract as well as any fluctuation in foreign currency exchange rates where applicable. Futures contracts are subject to market risk, interest rate risk and currency exchange rate risk. Changes in value of the contracts may not directly correlate to the changes in value of the underlying securities. With futures, there is reduced counterparty credit risk to the Fund since futures are exchange-traded and the exchange's clearinghouse, as counterparty to all exchange-traded futures, guarantees the futures against default. |
| | The average notional values of futures contracts long position and futures contracts short position during the six months ended March 31, |
110Pioneer Strategic Income Fund | Semiannual Report | 3/31/24
| | 2024 were $1,101,176,054 and $98,256,936, respectively. Open futures contracts outstanding at March 31, 2024 are listed in the Schedule of Investments. |
| P. | Credit Default Swap Contracts |
| | A credit default swap is a contract between a buyer of protection and a seller of protection against a pre-defined credit event or an underlying reference obligation, which may be a single security or a basket or index of securities. The Fund may buy or sell credit default swap contracts to seek to increase the Fund's income, or to attempt to hedge the risk of default on portfolio securities. A credit default swap index is used to hedge risk or take a position on a basket of credit entities or indices. |
| | As a seller of protection, the Fund would be required to pay the notional (or other agreed-upon) value of the referenced debt obligation to the counterparty in the event of a default by a U.S. or foreign corporate issuer of a debt obligation, which would likely result in a loss to the Fund. In return, the Fund would receive from the counterparty a periodic stream of payments during the term of the contract, provided that no event of default occurred. The maximum exposure of loss to the seller would be the notional value of the credit default swaps outstanding. If no default occurs, the Fund would keep the stream of payments and would have no payment obligation. The Fund may also buy credit default swap contracts in order to hedge against the risk of default of debt securities, in which case the Fund would function as the counterparty referenced above. |
| | As a buyer of protection, the Fund makes an upfront or periodic payment to the protection seller in exchange for the right to receive a contingent payment. An upfront payment made by the Fund, as the protection buyer, is recorded within the "Swap contracts, at value" line item on the Statement of Assets and Liabilities. Periodic payments received or paid by the Fund are recorded as realized gains or losses on the Statement of Operations. |
| | Credit default swap contracts are marked-to-market daily using valuations supplied by independent sources, and the change in value, if any, is recorded within the "Swap contracts, at value" line item on the Statement of Assets and Liabilities. Payments received or made as a result of a credit event or upon termination of the contract are recognized, net of the appropriate amount of the upfront payment, as realized gains or losses on the Statement of Operations. |
| | Credit default swap contracts involving the sale of protection may involve greater risks than if the Fund had invested in the referenced debt |
Pioneer Strategic Income Fund | Semiannual Report | 3/31/24111
| | instrument directly. Credit default swap contracts are subject to general market risk, liquidity risk, counterparty risk and credit risk. If the Fund is a protection buyer and no credit event occurs, it will lose its investment. If the Fund is a protection seller and a credit event occurs, the value of the referenced debt instrument received by the Fund, together with the periodic payments received, may be less than the amount the Fund pays to the protection buyer, resulting in a loss to the Fund. In addition, obligations under sell protection credit default swaps may be partially offset by net amounts received from settlement of buy protection credit default swaps entered into by the Fund for the same reference obligation with the same counterparty. |
| | The Fund may invest in credit default swap index products ("CDX"). A CDX is a swap on an index of credit default swaps. CDXs allow an investor to manage credit risk or take a position on a basket of credit entities (such as credit default swaps or commercial mortgage-backed securities) in a more efficient manner than transacting in a single-name credit default swap. If a credit event occurs in one of the underlying companies, the protection is paid out via the delivery of the defaulted bond by the buyer of protection in return for a payment of notional value of the defaulted bond by the seller of protection or it may be settled through a cash settlement between the two parties. The underlying company is then removed from the index. If the Fund holds a long position in a CDX, the Fund would indirectly bear its proportionate share of any expenses paid by a CDX. A fund holding a long position in CDXs typically receives income from principal or interest paid on the underlying securities. By investing in CDXs, the Fund could be exposed to liquidity risk, counterparty risk, credit risk of the issuers of the underlying loan obligations and of the CDX markets, and operational risks. If there is a default by the CDX counterparty, the Fund will have contractual remedies pursuant to the agreements related to the transaction. CDXs also bear the risk that the Fund will not be able to meet its obligation to the counterparty. |
| | Certain swap contracts that are cleared through a central clearinghouse are referred to as centrally cleared swaps. All payments made or received by the Fund are pursuant to a centrally cleared swap contract with the central clearing party rather than the original counterparty. Upon entering into a centrally cleared swap contract, the Fund is required to make an initial margin deposit, either in cash or in securities. The daily change in value on open centrally cleared contracts is recorded as "Variation margin for centrally cleared swap contracts" on the Statement of Assets and Liabilities. Cash received from or paid to the broker related to previous margin movement is held in a segregated account at the |
112Pioneer Strategic Income Fund | Semiannual Report | 3/31/24
| | broker and is recorded as either "Due from broker for swaps" or "Due to broker for swaps" on the Statement of Assets and Liabilities. The amount of cash deposited with a broker as collateral at March 31, 2024 is recorded as "Swaps collateral" on the Statement of Assets and Liabilities. |
| | The average notional value of credit default swap contracts buy protection open during the six months ended March 31, 2024 was $497,919,700. Open credit default swap contracts at March 31, 2024 are listed in the Schedule of Investments. |
2. Management Agreement
The Adviser manages the Fund’s portfolio. Management fees payable under the Fund’s Investment Management Agreement with the Adviser are calculated daily and paid monthly at the annual rate of 0.60% of the Fund’s average daily net assets up to $1 billion, 0.55% on the next $9 billion and 0.50% on assets over $10 billion. For the six months ended March 31, 2024, the effective management fee (excluding waivers and/or reimbursements) was equivalent to 0.57% (annualized) of the Fund’s average daily net assets.
The Adviser has contractually agreed to limit ordinary operating expenses (ordinary operating expenses means all fund expenses other than taxes, brokerage commissions, acquired fund fees and expenses, and extraordinary expenses, such as litigation) to the extent required to reduce Fund expenses to 0.59% and 0.69% of the average daily net assets attributable to Class K and Class Y shares, respectively. These expense limitations are in effect through February 1, 2025. There can be no assurance that the Adviser will extend the expense limitation agreement for a class of shares beyond the date referred to above. Fees waived and expenses reimbursed during the six months ended are reflected on the Statement of Operations.
In addition, under the management and administration agreements, certain other services and costs, including accounting, regulatory reporting and insurance premiums, are paid by the Fund as administrative reimbursements. Reflected on the Statement of Assets and Liabilities is $301,473 in management fees payable to the Adviser at March 31, 2024.
3. Compensation of Officers and Trustees
The Fund pays an annual fee to its Trustees. The Adviser reimburses the Fund for fees paid to the Interested Trustees. Except for the chief compliance officer, the Fund does not pay any salary or other compensation to its officers. The Fund pays a portion of the chief compliance officer’s compensation for his services as the Fund’s chief compliance officer.
Pioneer Strategic Income Fund | Semiannual Report | 3/31/24113
Amundi US pays the remaining portion of the chief compliance officer’s compensation. For the six months ended March 31, 2024, the Fund paid $103,161 in Officers’ and Trustees’ compensation, which is reflected on the Statement of Operations as Officers’ and Trustees’ fees. At March 31, 2024, on its Statement of Assets and Liabilities, the Fund had a payable for Trustees’ fees of $4,554 and a payable for administrative expenses of $86,641, which includes the payable for Officers’ compensation.
4. Transfer Agent
BNY Mellon Investment Servicing (US) Inc. serves as the transfer agent to the Fund at negotiated rates. Transfer agent fees and payables shown on the Statement of Operations and the Statement of Assets and Liabilities, respectively, include sub-transfer agent expenses incurred through the Fund’s omnibus relationship contracts.
In addition, the Fund reimbursed the transfer agent for out-of-pocket expenses incurred by the transfer agent related to shareholder communications activities such as proxy and statement mailings, and outgoing phone calls. For the six months ended March 31, 2024, such out-of-pocket expenses by class of shares were as follows:
| Shareholder Communications: | |
| Class A | $ 33,420 |
| Class C | 3,396 |
| Class K | 8,461 |
| Class R | 1,314 |
| Class Y | 76,653 |
| Total | $123,244 |
5. Distribution and Service Plans
The Fund has adopted a distribution plan (the “Plan”) pursuant to Rule 12b-1 of the Investment Company Act of 1940 with respect to its Class A, Class C and Class R shares. Pursuant to the Plan, the Fund pays the Distributor 0.25% of the Fund's average daily net assets attributable to Class A shares as compensation for personal services and/or account maintenance services or distribution services with regard to Class A shares. Pursuant to the Plan, the Fund also pays the Distributor 1.00% of the average daily net assets attributable to Class C shares. The fee for Class C shares consists of a 0.25% service fee and a 0.75% distribution fee paid as compensation for personal services and/or account maintenance services or distribution services with regard to Class C shares. Pursuant to the Plan, the Fund further pays the Distributor 0.50% of the average daily net assets attributable to Class R shares for distribution services. Reflected on the Statement of Assets and Liabilities is $34,917 in distribution fees payable to the Distributor at March 31, 2024.
114Pioneer Strategic Income Fund | Semiannual Report | 3/31/24
The Fund also has adopted a separate service plan for Class R shares (the “Service Plan”). The Service Plan authorizes the Fund to pay securities dealers, plan administrators or other service organizations that agree to provide certain services to retirement plans or plan participants holding shares of the Fund a service fee of up to 0.25% of the Fund’s average daily net assets attributable to Class R shares held by such plans.
In addition, redemptions of Class A and Class C shares may be subject to a contingent deferred sales charge (“CDSC”). A CDSC of 1.00% may be imposed on redemptions of certain net asset value purchases of Class A shares within 12 months of purchase. Redemptions of Class C shares within 12 months of purchase are subject to a CDSC of 1.00% based on the lower of cost or market value of shares being redeemed. Shares purchased as part of an exchange remain subject to any CDSC that applied to the original purchase of those shares. There is no CDSC for Class K, Class R or Class Y shares. Proceeds from the CDSCs are paid to the Distributor. For the six months ended March 31, 2024, CDSCs in the amount of $2,758 were paid to the Distributor.
6. Line of Credit Facility
The Fund, along with certain other funds in the Pioneer Family of Funds, participates in a committed, unsecured revolving line of credit (“credit facility”). Borrowings are used solely for temporary or emergency purposes. The Fund may borrow up to the lesser of the amount available under the credit facility or the limits set for borrowing by the Fund’s prospectus and the 1940 Act. Until January 31, 2024, the Fund participated in a credit facility in the amount of $380 million. Under such credit facility, depending on the type of loan, interest on borrowings was payable at the Secured Overnight Financing Rate ("SOFR") plus a credit spread. The Fund also paid both an upfront fee and an annual commitment fee to participate in the credit facility. The upfront fee in the amount of 0.15% of the total credit facility and the commitment fee in the amount of 0.30% of the daily unused portion of each lender’s commitment were allocated among participating funds based on an allocation schedule set forth in the credit facility. Effective January 31, 2024, the Fund participates in a credit facility in the amount of $250 million, the upfront fee with respect to the credit facility is 0.05% of the total credit facility, and the commitment fee with respect to the credit facility is 0.20% of the daily unused portion of each lender’s commitment. For the six months ended March 31, 2024, the Fund had no borrowings under the credit facility.
7. Master Netting Agreements
The Fund has entered into an International Swaps and Derivatives Association, Inc. Master Agreement (“ISDA Master Agreement”) or similar
Pioneer Strategic Income Fund | Semiannual Report | 3/31/24115
agreement with substantially all of its derivative counterparties. An ISDA Master Agreement is a bilateral agreement between the Fund and a counterparty that governs the trading of certain Over the Counter (“OTC”) derivatives and typically contains, among other things, close-out and set- off provisions which apply upon the occurrence of an event of default and/or a termination event as defined under the relevant ISDA Master Agreement. The ISDA Master Agreement may also give a party the right to terminate all transactions traded under such agreement if, among other things, there is deterioration in the credit quality of the other party.
Upon an event of default or a termination of the ISDA Master Agreement, the non-defaulting party has the right to close-out all transactions under such agreement and to net amounts owed under each transaction to determine one net amount payable by one party to the other. The right to close out and net payments across all transactions under the ISDA Master Agreement could result in a reduction of the Fund’s credit risk to its counterparty equal to any amounts payable by the Fund under the applicable transactions, if any. However, the Fund’s right to set-off may be restricted or prohibited by the bankruptcy or insolvency laws of the particular jurisdiction to which each specific ISDA Master Agreement of each counterparty is subject.
The collateral requirements for derivatives transactions under an ISDA Master Agreement are governed by a credit support annex to the ISDA Master Agreement. Collateral requirements are generally determined at the close of business each day and are typically based on changes in market values for each transaction under an ISDA Master Agreement and netted into one amount for such agreement. Generally, the amount of collateral due from or to a counterparty is subject to threshold (a “minimum transfer amount”) before a transfer is required, which may vary by counterparty. Collateral pledged for the benefit of the Fund and/or counterparty is held in segregated accounts by the Fund’s custodian and cannot be sold, re- pledged, assigned or otherwise used while pledged. Cash that has been segregated to cover the Fund’s collateral obligations, if any, will be reported separately on the Statement of Assets and Liabilities as “Swaps collateral”. Securities pledged by the Fund as collateral, if any, are identified as such in the Schedule of Investments.
116Pioneer Strategic Income Fund | Semiannual Report | 3/31/24
Financial instruments subject to an enforceable master netting agreement, such as an ISDA Master Agreement, have been offset on the Statement of Assets and Liabilities. The following charts show gross assets and liabilities of the Fund as of March 31, 2024.
| Counterparty | Derivative
Assets
Subject to
Master Netting
Agreement | Derivatives
Available
for Offset | Non-Cash
Collateral
Received (a) | Cash
Collateral
Received (a) | Net Amount
of Derivative
Assets (b) |
| Bank of America NA | $ — | $ — | $ — | $ — | $ — |
| Citibank NA | 1,909,703 | (1,023,907) | — | (885,796) | — |
| Goldman Sachs & Co. | — | — | — | — | — |
| HSBC Bank USA NA | 238,157 | (238,157) | — | — | — |
State Street Bank
& Trust Co. | 378,204 | (254,019) | — | — | 124,185 |
| Total | $ 2,526,064 | $(1,516,083) | $— | $(885,796) | $124,185 |
| Counterparty | Derivative
Liabilities
Subject to
Master Netting
Agreement | Derivatives
Available for
Offset | Non-Cash
Collateral
Pledged (a) | Cash
Collateral
Pledged (a) | Net Amount
of Derivative
Liabilities (c) |
| Bank of America NA | $ 144,297 | $ — | $ — | $ — | $ 144,297 |
| Citibank NA | 1,023,907 | (1,023,907) | — | — | — |
| Goldman Sachs & Co. | 292,105 | — | — | — | 292,105 |
| HSBC Bank USA NA | 1,081,739 | (238,157) | — | — | 843,582 |
| State Street Bank & Trust Co. | 254,019 | (254,019) | — | — | — |
| Total | $ 2,796,067 | $(1,516,083) | $— | $— | $1,279,984 |
(a) The amount presented here may be less than the total amount of collateral received/pledged as the net amount of derivative assets and liabilities cannot be less than $0.
(b) Represents the net amount due from the counterparty in the event of default.
(c) Represents the net amount payable to the counterparty in the event of default.
8. Additional Disclosures about Derivative Instruments and Hedging Activities
The Fund’s use of derivatives may enhance or mitigate the Fund’s exposure to the following risks:
Interest rate risk relates to the fluctuations in the value of interest-bearing securities due to changes in the prevailing levels of market interest rates.
Credit risk relates to the ability of the issuer of a financial instrument to make further principal or interest payments on an obligation or commitment that it has to the Fund.
Pioneer Strategic Income Fund | Semiannual Report | 3/31/24117
Foreign exchange rate risk relates to fluctuations in the value of an asset or liability due to changes in currency exchange rates.
Equity risk relates to the fluctuations in the value of financial instruments as a result of changes in market prices (other than those arising from interest rate risk or foreign exchange rate risk), whether caused by factors specific to an individual investment, its issuer, or all factors affecting all instruments traded in a market or market segment.
Commodity risk relates to the risk that the value of a commodity or commodity index will fluctuate based on increases or decreases in the commodities market and factors specific to a particular industry or commodity.
The fair value of open derivative instruments (not considered to be hedging instruments for accounting disclosure purposes) by risk exposure at March 31, 2024, was as follows:
Statement of Assets
and Liabilities | Interest
Rate Risk | Credit
Risk | Foreign
Exchange
Rate Risk | Equity
Risk | Commodity
Risk |
| Assets | | | | | |
| Options purchased* | $ — | $ — | $1,904,890 | $ — | $ — |
| Unrealized appreciation on forward foreign currency exchange contracts | — | — | 621,174 | — | — |
| Net unrealized appreciation on futures contracts^ | 3,830,766 | — | — | — | — |
| Total Value | $ 3,830,766 | $ — | $ 2,526,064 | $— | $— |
| Liabilities | | | | | |
| Options written | $ — | $ — | $ 952,445 | $ — | $ — |
| Net unrealized depreciation on futures contracts^ | 963,493 | — | — | — | — |
| Unrealized depreciation on forward foreign currency exchange contracts | — | — | 1,843,622 | — | — |
| Centrally cleared swap contracts† | — | 19,904,335 | — | — | — |
| Total Value | $ 963,493 | $19,904,335 | $ 2,796,067 | $— | $— |
| | |
| * | Reflects the market value of purchased option contracts (see Note 1J). These amounts are included in investments in unaffiliated issuers, at value, on the Statement of Assets and Liabilities. |
| ^ | Includes cumulative unrealized appreciation (depreciation) of futures contracts as reported in the Schedule of Investments. Only net variation margin is reported within the assets and/or liabilities on the Statement of Assets and Liabilities. |
118Pioneer Strategic Income Fund | Semiannual Report | 3/31/24
| † | Includes cumulative unrealized appreciation (depreciation) of centrally cleared swap contracts as reported in the Schedule of Investments. Only net variation margin is reported within the receivables and/or payables on the Statement of Assets and Liabilities. |
The effect of derivative instruments (not considered to be hedging instruments for accounting disclosure purposes) on the Statement of Operations by risk exposure at March 31, 2024 was as follows:
| Statement of Operations | Interest
Rate Risk | Credit
Risk | Foreign
Exchange
Rate Risk | Equity
Risk | Commodity
Risk |
| Net Realized Gain (Loss) on | | | | | |
| Futures contracts | $ 2,895,593 | $ — | $ — | $ — | $ — |
| Forward foreign currency exchange contracts | — | — | (1,323,634) | — | — |
| Options purchased* | — | — | (6,709,841) | — | — |
| Options written | — | — | 740,168 | — | — |
| Swap contracts | — | (20,034,038) | — | — | — |
| Total Value | $ 2,895,593 | $ (20,034,038) | $(7,293,307) | $— | $— |
| Change in Net Unrealized Appreciation (Depreciation) on | | | | | |
| Futures contracts | $16,626,972 | $ — | $ — | $ — | $ — |
| Forward foreign currency exchange contracts | — | — | 2,130,050 | — | — |
| Options purchased** | — | — | 1,768,725 | — | — |
| Options written | — | — | 1,409,117 | — | — |
| Swap contracts | — | (20,057,406) | — | — | — |
| Total Value | $16,626,972 | $ (20,057,406) | $ 5,307,892 | $— | $— |
| | |
| * | Reflects the net realized gain (loss) on purchased option contracts (see Note 1J). These amounts are included in net realized gain (loss) on investments in unaffiliated issuers, on the Statement of Operations. |
| ** | Reflects the change in net unrealized appreciation (depreciation) on purchased option contracts (see Note 1J). These amounts are included in change in net unrealized appreciation (depreciation) on investments in unaffiliated issuers, on the Statement of Operations. |
9. Unfunded Loan Commitments
The Fund may enter into unfunded loan commitments. Unfunded loan commitments may be partially or wholly unfunded. During the contractual period, the Fund is obliged to provide funding to the borrower upon demand. A fee is earned by the Fund on the unfunded loan commitment and is recorded as interest income on the Statement of Operations. Unfunded loan commitments are fair valued in accordance with the valuation policy described in Note 1A and unrealized appreciation or depreciation, if any, is recorded on the Statement of Assets and Liabilities.
As of March 31, 2024, the Fund had no unfunded loan commitments outstanding.
Pioneer Strategic Income Fund | Semiannual Report | 3/31/24119
Additional Information
On March 25, 2024, Ernst & Young LLP (the “Prior Auditor”) resigned as the independent registered public accounting firm of Pioneer Strategic Income Fund (the “Fund”) due to the independence considerations resulting from a change of the independent registered public accounting firm of a related party. The Prior Auditor’s reports on the financial statements of the Fund for the past two fiscal years, the years ended September 30, 2023 and September 30, 2022, did not contain an adverse opinion or disclaimer of opinion, and were not qualified or modified as to uncertainty, audit scope or accounting principles.
During the last two fiscal year-ends and the subsequent interim period through March 25, 2024, there were no (1) disagreements with the Prior Auditor on any matter of accounting principles or practices, financial statement disclosure, or auditing scope or procedure, which disagreements, if not resolved to the Prior Auditor's satisfaction, would have caused it to make reference to that matter in connection with its reports on the Fund's financial statements for such periods; or (2) "reportable events" related to the Fund, as that term is defined in Item 304 (a)(1)(v) of Regulation S-K under the Securities Exchange Act of 1934.
On March 25, 2024, the Audit Committee of the Board approved, and on March 25, 2024, the Board approved, Deloitte & Touche LLP as the independent registered accounting firm of the Fund for fiscal periods ending after March 25, 2024.
120Pioneer Strategic Income Fund | Semiannual Report | 3/31/24
Trustees, Officers and Service Providers
Trustees
Thomas J. Perna, Chairman
John E. Baumgardner, Jr.
Diane Durnin
Benjamin M. Friedman
Lisa M. Jones
Craig C. MacKay
Lorraine H. Monchak
Marguerite A. Piret*
Fred J. Ricciardi
Officers
Lisa M. Jones, President and
Chief Executive Officer
Marco Pirondini**
Executive Vice President
Anthony J. Koenig, Jr., Treasurer
and Chief Financial and
Accounting Officer
Christopher J. Kelley, Secretary and
Chief Legal Officer
Investment Adviser and Administrator
Amundi Asset Management US, Inc.
Custodian and Sub-Administrator
The Bank of New York Mellon Corporation
Independent Registered Public Accounting Firm
Deloitte & Touche LLP
Principal Underwriter
Amundi Distributor US, Inc.
Legal Counsel
Morgan, Lewis & Bockius LLP
Transfer Agent
BNY Mellon Investment Servicing (US) Inc.
Proxy Voting Policies and Procedures of the Fund are available without charge, upon request, by calling our toll free number (1-800-225-6292). Information regarding how the Fund voted proxies relating to portfolio securities during the most recent 12-month period ended June 30 is publicly available to shareholders at www.amundi.com/us. This information is also available on the Securities and Exchange Commission’s web site at www.sec.gov.
* Ms. Piret became a non-voting Advisory Trustee of the Pioneer Funds effective January 22, 2024.
** Marco Pirondini was appointed to serve as an Executive Vice President of the Fund and Chief Investment Officer of Amundi US, Inc., effective January 1, 2024.
Pioneer Strategic Income Fund | Semiannual Report | 3/31/24121
How to Contact Amundi
We are pleased to offer a variety of convenient ways for you to contact us for assistance or information.
Call us for:
Account Information, including existing accounts,
new accounts, prospectuses, applications
and service forms
1-800-225-6292
FactFoneSM for automated fund yields, prices,
account information and transactions
1-800-225-4321
| Retirement plans information | 1-800-622-0176 |
Write to us:
Amundi
P.O. Box 534427
Pittsburgh, PA 15253-4427
| Our toll-free fax | 1-800-225-4240 |
| Our internet e-mail address | us.askamundi@amundi.com
(for general questions about Amundi only) |
Visit our web site: www.amundi.com/us
This report must be preceded or accompanied by a prospectus.
The Fund files a complete schedule of portfolio holdings with the Securities and Exchange Commission for the first and third quarters of each fiscal year as an exhibit to its reports on Form N-PORT. Shareholders may view the filed Form N-PORT by visiting the Commission’s web site at https://www.sec.gov.
Amundi Asset Management US, Inc.
60 State Street
Boston, MA 02109
www.amundi.com/us
Securities offered through Amundi Distributor US, Inc.
60 State Street, Boston, MA 02109
Underwriter of Pioneer Mutual Funds, Member SIPC
© 2024 Amundi Asset Management US, Inc. 19207-19-0524
ITEM 2. CODE OF ETHICS.
(a) Disclose whether, as of the end of the period covered by the report, the registrant has adopted a code of ethics that applies to the registrant’s principal executive officer, principal financial officer, principal accounting officer or controller, or persons performing similar functions, regardless of whether these individuals are employed by the registrant or a third party. If the registrant has not adopted such a code of ethics, explain why it has not done so.
The registrant has adopted, as of the end of the period covered by this report, a code of ethics that applies to the registrant’s principal executive officer, principal financial officer, principal accounting officer and controller.
(b) For purposes of this Item, the term “code of ethics” means written standards that are reasonably designed to deter wrongdoing and to promote:
(1) Honest and ethical conduct, including the ethical handling of actual or apparent conflicts of interest between personal and professional relationships;
(2) Full, fair, accurate, timely, and understandable disclosure in reports and documents that a registrant files with, or submits to, the Commission and in other public communications made by the registrant;
(3) Compliance with applicable governmental laws, rules, and regulations;
(4) The prompt internal reporting of violations of the code to an appropriate person or persons identified in the code; and
(5) Accountability for adherence to the code.
(c) The registrant must briefly describe the nature of any amendment, during the period covered by the report, to a provision of its code of ethics that applies to the registrant’s principal executive officer, principal financial officer, principal accounting officer or controller, or persons performing similar functions, regardless of whether these individuals are employed by the registrant or a third party, and that relates to any element of the code of ethics definition enumerated in paragraph (b) of this Item. The registrant must file a copy of any such amendment as an exhibit pursuant to Item 10(a), unless the registrant has elected to satisfy paragraph (f) of this Item by posting its code of ethics on its website pursuant to paragraph (f)(2) of this Item, or by undertaking to provide its code of ethics to any person without charge, upon request, pursuant to paragraph (f)(3) of this Item.
The registrant has made no amendments to the code of ethics during the period covered by this report.
(d) If the registrant has, during the period covered by the report, granted a waiver, including an implicit waiver, from a provision of the code of ethics to the registrant’s principal executive officer, principal financial officer, principal accounting officer or controller, or persons performing similar functions, regardless of whether these individuals are employed by the registrant or a third party, that relates to one or more of the items set forth in paragraph (b) of this Item, the registrant must briefly describe the nature of the waiver, the name of the person to whom the waiver was granted, and the date of the waiver.
Not applicable.
(e) If the registrant intends to satisfy the disclosure requirement under paragraph (c) or (d) of this Item regarding an amendment to, or a waiver from, a provision of its code of ethics that applies to the registrant’s principal executive officer, principal financial officer, principal accounting officer or controller, or persons performing similar functions and that relates to any element of the code of ethics definition enumerated in paragraph (b) of this Item by posting such information on its Internet website, disclose the registrant’s Internet address and such intention.
Not applicable.
(f) The registrant must:
(1) File with the Commission, pursuant to Item 12(a)(1), a copy of its code of ethics that applies to the registrant’s principal executive officer, principal financial officer, principal accounting officer or controller, or persons performing similar functions, as an exhibit to its annual report on this Form N-CSR (see attachment);
(2) Post the text of such code of ethics on its Internet website and disclose, in its most recent report on this Form N-CSR, its Internet address and the fact that it has posted such code of ethics on its Internet website; or
(3) Undertake in its most recent report on this Form N-CSR to provide to any person without charge, upon request, a copy of such code of ethics and explain the manner in which such request may be made. See Item 10(2)
ITEM 3. AUDIT COMMITTEE FINANCIAL EXPERT.
(a) (1) Disclose that the registrant’s Board of Trustees has determined that the registrant either:
(i) Has at least one audit committee financial expert serving on its audit committee; or
(ii) Does not have an audit committee financial expert serving on its audit committee.
The registrant’s Board of Trustees has determined that the registrant has at least one audit committee financial expert.
(2) If the registrant provides the disclosure required by paragraph (a)(1)(i) of this Item, it must disclose the name of the audit committee financial expert and whether that person is “independent.” In order to be considered “independent” for purposes of this Item, a member of an audit committee may not, other than in his or her capacity as a member of the audit committee, the Board of Trustees, or any other board committee:
(i) Accept directly or indirectly any consulting, advisory, or other compensatory fee from the issuer; or
(ii) Be an “interested person” of the investment company as defined in Section 2(a)(19) of the Act (15 U.S.C. 80a-2(a)(19)).
Mr. Fred J. Ricciardi, an independent Trustee, is such an audit committee financial expert.
(3) If the registrant provides the disclosure required by paragraph (a)(1) (ii) of this Item, it must explain why it does not have an audit committee financial expert.
Not applicable.
ITEM 4. PRINCIPAL ACCOUNTANT FEES AND SERVICES.
(a) Disclose, under the caption AUDIT FEES, the aggregate fees billed for each of the last two fiscal years for professional services rendered by the principal accountant for the audit of the registrant’s annual financial statements or services that are normally provided by the accountant in connection with statutory and regulatory filings or engagements for those fiscal years.
N/A
(b) Disclose, under the caption AUDIT-RELATED FEES, the aggregate fees billed in each of the last two fiscal years for assurance and related services by the principal accountant that are reasonably related to the performance of the audit of the registrant’s financial statements and are not reported under paragraph (a) of this Item. Registrants shall describe the nature of the services comprising the fees disclosed under this category.
N/A
(c) Disclose, under the caption TAX FEES, the aggregate fees billed in each of the last two fiscal years for professional services rendered by the principal accountant for tax compliance, tax advice, and tax planning. Registrants shall describe the nature of the services comprising the fees disclosed under this category.
N/A
(d) Disclose, under the caption ALL OTHER FEES, the aggregate fees billed in each of the last two fiscal years for products and services provided by the principal accountant, other than the services reported in paragraphs (a) through (c) of this Item. Registrants shall describe the nature of the services comprising the fees disclosed under this category.
N/A
(e) (1) Disclose the audit committee’s pre-approval policies and procedures described in paragraph (c)(7) of Rule 2-01 of Regulation S-X.
PIONEER FUNDS
APPROVAL OF AUDIT, AUDIT-RELATED, TAX AND OTHER SERVICES
PROVIDED BY THE INDEPENDENT AUDITOR
SECTION I - POLICY PURPOSE AND APPLICABILITY
The Pioneer Funds recognize the importance of maintaining the independence of their outside auditors. Maintaining independence is a shared responsibility involving Amundi Asset Management US, Inc., the audit committee and the independent auditors.
The Funds recognize that a Fund’s independent auditors: 1) possess knowledge of the Funds, 2) are able to incorporate certain services into the scope of the audit, thereby avoiding redundant work, cost and disruption of Fund personnel and processes, and 3) have expertise that has value to the Funds. As a result, there are situations where it is desirable to use the Fund’s independent auditors for services in addition to the annual audit and where the potential for conflicts of interests are minimal. Consequently, this policy, which is intended to comply with Rule 210.2-01(C)(7), sets forth guidelines and procedures to be followed by the Funds when retaining the independent audit firm to perform audit, audit-related tax and other services under those circumstances, while also maintaining independence.
Approval of a service in accordance with this policy for a Fund shall also constitute approval for any other Fund whose pre-approval is required pursuant to Rule 210.2-01(c)(7)(ii).
In addition to the procedures set forth in this policy, any non-audit services that may be provided consistently with Rule 210.2-01 may be approved by the Audit Committee itself and any pre-approval that may be waived in accordance with Rule 210.2-01(c)(7)(i)(C) is hereby waived.
Selection of a Fund’s independent auditors and their compensation shall be determined by the Audit Committee and shall not be subject to this policy.
| | | | |
SECTION II - POLICY |
SERVICE CATEGORY | | SERVICE CATEGORY DESCRIPTION | | SPECIFIC PRE-APPROVED SERVICE SUBCATEGORIES |
| I. AUDIT SERVICES | | Services that are directly related to performing the independent audit of the Funds | | • Accounting research assistance • SEC consultation, registration statements, and reporting • Tax accrual related matters • Implementation of new accounting standards • Compliance letters (e.g. rating agency letters) • Regulatory reviews and assistance regarding financial matters • Semi-annual reviews (if requested) • Comfort letters for closed end offerings |
| | |
| II. AUDIT-RELATED SERVICES | | Services which are not prohibited under Rule 210.2-01(C)(4) (the “Rule”) and are related extensions of the audit services support the audit, or use the knowledge/expertise gained from the audit procedures as a foundation to complete the project. In most cases, if the Audit-Related Services are not performed by the Audit firm, the scope of the Audit Services would likely increase. The Services are typically well-defined and governed by accounting professional standards (AICPA, SEC, etc.) | | • AICPA attest and agreed-upon procedures • Technology control assessments • Financial reporting control assessments • Enterprise security architecture assessment |
| | | | |
AUDIT COMMITTEE APPROVAL POLICY | | AUDIT COMMITTEE REPORTING POLICY |
| | | • “One-time” pre-approval for the audit period for all pre-approved specific service subcategories. Approval of the independent auditors as auditors for a Fund shall constitute pre approval for these services. | | • A summary of all such services and related fees reported at each regularly scheduled Audit Committee meeting. |
| | |
| | • “One-time” pre-approval for the fund fiscal year within a specified dollar limit for all pre-approved specific service subcategories | | • A summary of all such services and related fees (including comparison to specified dollar limits) reported quarterly. |
| | | | |
| | • Specific approval is needed to exceed the pre-approved dollar limit for these services (see general Audit Committee approval policy below for details on obtaining specific approvals) • Specific approval is needed to use the Fund’s auditors for Audit-Related Services not denoted as “pre-approved”, or to add a specific service subcategory as “pre-approved” | | |
SECTION III - POLICY DETAIL, CONTINUED
| | | | |
SERVICE CATEGORY | | SERVICE CATEGORY DESCRIPTION | | SPECIFIC PRE-APPROVED SERVICE SUBCATEGORIES |
| III. TAX SERVICES | | Services which are not prohibited by the Rule, if an officer of the Fund determines that using the Fund’s auditor to provide these services creates significant synergy in the form of efficiency, minimized disruption, or the ability to maintain a desired level of confidentiality. | | • Tax planning and support • Tax controversy assistance • Tax compliance, tax returns, excise tax returns and support • Tax opinions |
| | |
AUDIT COMMITTEE APPROVAL POLICY | | AUDIT COMMITTEE REPORTING POLICY |
• “One-time” pre-approval for the fund fiscal year within a specified dollar limit | | • A summary of all such services and related fees (including comparison to specified dollar limits) reported quarterly. |
| |
• Specific approval is needed to exceed the pre-approved dollar limits for these services (see general Audit Committee approval policy below for details on obtaining specific approvals) • Specific approval is needed to use the Fund’s auditors for tax services not denoted as pre-approved, or to add a specific service subcategory as “pre-approved” | | |
SECTION III - POLICY DETAIL, CONTINUED
| | | | |
SERVICE CATEGORY | | SERVICE CATEGORY DESCRIPTION | | SPECIFIC PRE-APPROVED SERVICE SUBCATEGORIES |
IV. OTHER SERVICES A. SYNERGISTIC, UNIQUE QUALIFICATIONS | | Services which are not prohibited by the Rule, if an officer of the Fund determines that using the Fund’s auditor to provide these services creates significant synergy in the form of efficiency, minimized disruption, the ability to maintain a desired level of confidentiality, or where the Fund’s auditors posses unique or superior qualifications to provide these services, resulting in superior value and results for the Fund. | | • Business Risk Management support • Other control and regulatory compliance projects |
|
| | |
AUDIT COMMITTEE APPROVAL POLICY | | AUDIT COMMITTEE REPORTING POLICY |
• “One-time” pre-approval for the fund fiscal year within a specified dollar limit | | • A summary of all such services and related fees (including comparison to specified dollar limits) reported quarterly. |
| |
• Specific approval is needed to exceed the pre-approved dollar limits for these services (see general Audit Committee approval policy below for details on obtaining specific approvals) | | |
| |
• Specific approval is needed to use the Fund’s auditors for “Synergistic” or “Unique Qualifications” Other Services not denoted as pre-approved to the left, or to add a specific service subcategory as “pre-approved” | | |
SECTION III - POLICY DETAIL, CONTINUED
| | | | |
SERVICE CATEGORY | | SERVICE CATEGORY DESCRIPTION | | SPECIFIC PROHIBITED SERVICE SUBCATEGORIES |
| PROHIBITED SERVICES | | Services which result in the auditors losing independence status under the Rule. | | 1. Bookkeeping or other services related to the accounting records or financial statements of the audit client* 2. Financial information systems design and implementation* 3. Appraisal or valuation services, fairness* opinions, or contribution-in-kind reports 4. Actuarial services (i.e., setting actuarial reserves versus actuarial audit work)* 5. Internal audit outsourcing services* 6. Management functions or human resources 7. Broker or dealer, investment advisor, or investment banking services 8. Legal services and expert services unrelated to the audit 9. Any other service that the Public Company Accounting Oversight Board determines, by regulation, is impermissible |
| | |
AUDIT COMMITTEE APPROVAL POLICY | | AUDIT COMMITTEE REPORTING POLICY |
• These services are not to be performed with the exception of the(*) services that may be permitted if they would not be subject to audit procedures at the audit client (as defined in rule 2-01(f)(4)) level the firm providing the service. | | • A summary of all services and related fees reported at each regularly scheduled Audit Committee meeting will serve as continual confirmation that has not provided any restricted services. |
GENERAL AUDIT COMMITTEE APPROVAL POLICY:
| | • | | For all projects, the officers of the Funds and the Fund’s auditors will each make an assessment to determine that any proposed projects will not impair independence. |
| | • | | Potential services will be classified into the four non-restricted service categories and the “Approval of Audit, Audit-Related, Tax and Other Services” Policy above will be applied. Any services outside the specific pre-approved service subcategories set forth above must be specifically approved by the Audit Committee. |
| | • | | At least quarterly, the Audit Committee shall review a report summarizing the services by service category, including fees, provided by the Audit firm as set forth in the above policy. |
(2) Disclose the percentage of services described in each of paragraphs (b) through (d) of this Item that were approved by the audit committee pursuant to paragraph (c)(7)(i)(C) of Rule 2-01 of Regulation S-X.
N/A
(f) If greater than 50 percent, disclose the percentage of hours expended on the principal accountants engagement to audit the registrant’s financial statements for the most recent fiscal year that were attributed to work performed by persons other than the principal accountant’s full-time, permanent employees.
N/A
(g) Disclose the aggregate non-audit fees billed by the registrants accountant for services rendered to the registrant, and rendered to the registrants investment adviser (not including any sub-adviser whose role is primarily portfolio management and is subcontracted with or overseen by another investment adviser), and any entity controlling, controlled by, or under common control with the adviser that provides ongoing services to the registrant for each of the last two fiscal years of the registrant.
N/A
(h) Disclose whether the registrants audit committee of the Board of Trustees has considered whether the provision of non-audit services that were rendered to the registrants investment adviser (not including any subadviser whose role is primarily portfolio management and is subcontracted with or overseen by another investment adviser), and any entity controlling, controlled by, or under common control with the investment adviser that provides ongoing services to the registrant that were not pre-approved pursuant to paragraph (c)(7)(ii) of Rule 2-01 of Regulation S-X is compatible with maintaining the principal accountant’s independence.
The Fund’s audit committee of the Board of Trustees has considered whether the provision of non-audit services that were rendered to the Affiliates (as defined) that were not pre- approved pursuant to paragraph (c)(7)(ii) of Rule 2-01 of Regulation S-X is compatible with maintaining the principal accountant’s independence.
(i) A registrant identified by the Commission pursuant to Section 104(i)(2)(A) of the Sarbanes-Oxley Act of 2002 (15 U.S.C. 7214(i)(2)(A)), as having retained, for the preparation of the audit report on its financial statements included in the Form NCSR, a registered public accounting firm that has a branch or office that is located in a foreign jurisdiction and that the Public Company Accounting Oversight Board has determined it is unable to inspect or investigate completely because of a position taken by an authority in the foreign jurisdiction must electronically submit to the Commission on a supplemental basis documentation that establishes that the registrant is not owned or controlled by a governmental entity in the foreign jurisdiction. The registrant must submit this documentation on or before the due date for this form. A registrant that is owned or controlled by a foreign governmental entity is not required to submit such documentation.
N/A
(j) A registrant that is a foreign issuer, as defined in 17 CFR 240.3b-4, identified by the Commission pursuant to Section 104(i)(2)(A) of the Sarbanes-Oxley Act of 2002 (15 U.S.C. 7214(i)(2)(A)), as having retained, for the preparation of the audit report on its financial statements included in the Form N-CSR, a registered public accounting firm that has a branch or office that is located in a foreign jurisdiction and that the Public Company Accounting Oversight Board has determined it is unable to inspect or investigate completely because of a position taken by an authority in the foreign jurisdiction, for each year in which the registrant is so identified, must provide the below disclosures. Also, any such identified foreign issuer that uses a variable-interest entity or any similar structure that results in additional foreign entities being consolidated in the financial statements of the registrant is required to provide the below disclosures for itself and its consolidated foreign operating entity or entities. A registrant must disclose:
(1) That, for the immediately preceding annual financial statement period, a registered public accounting firm that the PCAOB was unable to inspect or investigate completely, because of a position taken by an authority in the foreign jurisdiction, issued an audit report for the registrant;
N/A
(2) The percentage of shares of the registrant owned by governmental entities in the foreign jurisdiction in which the registrant is incorporated or otherwise organized;
N/A
(3) Whether governmental entities in the applicable foreign jurisdiction with respect to that registered public accounting firm have a controlling financial interest with respect to the registrant; N/A
(4) The name of each official of the Chinese Communist Party who is a member of the board of directors of the registrant or the operating entity with respect to the registrant;
N/A
(5) Whether the articles of incorporation of the registrant (or equivalent organizing document) contains any charter of the Chinese Communist Party, including the text of any such charter.
N/A
ITEM 5. AUDIT COMMITTEE OF LISTED REGISTRANTS
(a) If the registrant is a listed issuer as defined in Rule 10A-3 under the Exchange Act (17 CFR 240.10A-3), state whether or not the registrant has a separately-designated standing audit committee established in accordance with Section 3(a)(58)(A) of the Exchange Act (15 U.S.C. 78c(a)(58)(A)). If the registrant has such a committee, however designated, identify each committee member. If the entire board of directors is acting as the registrant’s audit committee as specified in Section 3(a)(58)(B) of the Exchange Act (15 U.S.C. 78c(a)(58)(B)), so state.
N/A
(b) If applicable, provide the disclosure required by Rule 10A-3(d) under the Exchange Act (17 CFR 240.10A-3(d)) regarding an exemption from the listing standards for audit committees.
N/A
ITEM 6. SCHEDULE OF INVESTMENTS.
File Schedule of Investments in securities of unaffiliated issuers as of the close of the reporting period as set forth in 210.1212 of Regulation S-X [17 CFR 210.12-12], unless the schedule is included as part of the report to shareholders filed under Item 1 of this Form.
Included in Item 1
ITEM 7. DISCLOSURE OF PROXY VOTING POLICIES AND PROCEDURES FOR CLOSED-END MANAGEMENT INVESTMENT COMPANIES.
A closed-end management investment company that is filing an annual report on this Form N-CSR must, unless it invests exclusively in non-voting securities, describe the policies and procedures that it uses to determine how to vote proxies relating to portfolio securities, including the procedures that the company uses when a vote presents a conflict between the interests of its shareholders, on the one hand, and those of the company’s investment adviser; principal underwriter; or any affiliated person (as defined in Section 2(a)(3) of the Investment Company Act of 1940 (15 U.S.C. 80a-2(a)(3)) and the rules thereunder) of the company, its investment adviser, or its principal underwriter, on the other. Include any policies and procedures of the company’s investment adviser, or any other third party, that the company uses, or that are used on the company’s behalf, to determine how to vote proxies relating to portfolio securities.
N/A
ITEM 8. PORTFOLIO MANAGERS OF CLOSED-END MANAGEMENT INVESTMENT COMPANIES.
(a) If the registrant is a closed-end management investment company that is filing an annual report on this Form N-CSR, provide the following information:
(1) State the name, title, and length of service of the person or persons employed by or associated with the registrant or an investment adviser of the registrant who are primarily responsible for the day-to-day management of the registrant’s portfolio (“Portfolio Manager”). Also state each Portfolio Manager’s business experience during the past 5 years.
N/A
ITEM 9. PURCHASES OF EQUITY SECURITIES BY CLOSED-END MANAGEMENT INVESTMENT COMPANY AND AFFILIATED PURCHASERS.
(a) If the registrant is a closed-end management investment company, in the following tabular format, provide the information specified in paragraph (b) of this Item with respect to any purchase made by or on behalf of the registrant or any affiliated purchaser, as defined in Rule 10b-18(a)(3) under the Exchange Act (17 CFR 240.10b-18(a)(3)), of shares or other units of any class of the registrant’s equity securities that is registered by the registrant pursuant to Section 12 of the Exchange Act (15 U.S.C. 781).
N/A
ITEM 10. SUBMISSION OF MATTERS TO A VOTE OF SECURITY HOLDERS.
Describe any material changes to the procedures by which shareholders may recommend nominees to the registrant’s board of directors, where those changes were implemented after the registrant last provided disclosure in response to the requirements of Item 407(c)(2)(iv) of Regulation S-R(17 CFR 229.407)(as required by Item 22(b)(15)) of Schedule 14A (17 CFR 240.14a-101), or this Item.
There have been no material changes to the procedures by which the shareholders may recommend nominees to the registrant’s board of directors since the registrant last provided disclosure in response to the requirements of Item 407(c)(2)(iv) of Regulation S-R of Schedule 14(A) in its definitive proxy statement, or this item.
ITEM 11. CONTROLS AND PROCEDURES.
(a) Disclose the conclusions of the registrant’s principal executive and principal financials officers, or persons performing similar functions, regarding the effectiveness of the registrant’s disclosure controls and procedures (as defined in Rule 30a-3(c) under the Act (17 CFR 270.30a-3(c))) as of a date within 90 days of the filing date of the report that includes the disclosure required by this paragraph, based on the evaluation of these controls and procedures required by Rule 30a-3(b) under the Act (17 CFR 270.30(a)-3(b) and Rules 13a-15(b) or 15d-15(b) under the Exchange Act (17 CFR 240.13a-15(b) or 240.15d-15(b)).
The registrant’s principal executive officer and principal financial officer have concluded that the registrant’s disclosure controls and procedures are effective based on the evaluation of these controls and procedures as of a date within 90 days of the filing date of this report.
(b) Disclose any change in the registrant’s internal control over financial reporting (as defined in Rule 30a-3(d) under the Act (17CFR 270.30a-3(d)) that occurred during the period covered by this report that has materially affected, or is reasonably likely to materially affect, the registrant’s internal control over financial reporting.
There were no significant changes in the registrant’s internal control over financial reporting that occurred during the period covered by this report that have materially affected, or are reasonably likely to materially affect, the registrant’s internal control over financial reporting.
Item 12. Disclosure of Securities Lending Activities for Closed-End Management Investment Companies.
(a) If the registrant is a closed-end management investment company, provide the following dollar amounts of income and compensation related to the securities lending activities of the registrant during its most recent fiscal year:
N/A
(1) Gross income from securities lending activities;
N/A
(2) All fees and/or compensation for each of the following securities lending activities and related services: any share of revenue generated by the securities lending program paid to the securities lending agent(s) (revenue split); fees paid for cash collateral management services (including fees deducted from a pooled cash collateral reinvestment vehicle) that are not included in the revenue split; administrative fees that are not included in the revenue split; fees for indemnification that are not included in the revenue split; rebates paid to borrowers; and any other fees relating to the securities lending program that are not included in the revenue split, including a description of those other fees;
N/A
(3) The aggregate fees/compensation disclosed pursuant to paragraph (2); and
N/A
(4) Net income from securities lending activities (i.e., the dollar amount in paragraph (1) minus the dollar amount in paragraph (3)).
If a fee for a service is included in the revenue split, state that the fee is included in the revenue split.
N/A
(b) If the registrant is a closed-end management investment company, describe the services provided to the registrant by the securities lending agent in the registrants most recent fiscal year.
N/A
ITEM 13. EXHIBITS.
(a) File the exhibits listed below as part of this Form. Letter or number the exhibits in the sequence indicated.
(1) Any code of ethics, or amendment thereto, that is the subject of the disclosure required by Item 2, to the extent that the registrant intends to satisfy the Item 2 requirements through filing of an exhibit.
(2) A separate certification for each principal executive officer and principal financial officer of the registrant as required by Rule 30a-2(a) under the Act (17 CFR 270.30a-2(a)) , exactly as set forth below:
Filed herewith.
(b) Certifications pursuant to Rule 30a-2(b) under the 1940 Act and Section 906 of the Sarbanes-Oxley Act of 2002 are attached hereto.
(3) Not applicable.
(4) Registrant’s Independent Public Accountant, attached as Exhibit 99.ACCT.
SIGNATURES
[See General Instruction F]
Pursuant to the requirements of the Securities Exchange Act of 1934 and the Investment Company Act of 1940, the registrant has duly caused this report to be signed on its behalf by the undersigned, thereunto duly authorized.
|
(Registrant) Pioneer Series Trust XIV |
|
By (Signature and Title)* /s/ Lisa M. Jones |
Lisa M. Jones, Principal Executive Officer |
|
Date June 7, 2024 |
Pursuant to the requirements of the Securities Exchange Act of 1934 and the Investment Company Act of 1940, this report has been signed below by the following persons on behalf of the registrant and in the capacities and on the dates indicated.
|
By (Signature and Title)* /s/ Lisa M. Jones |
Lisa M. Jones, Principal Executive Officer |
|
Date June 7, 2024 |
|
By (Signature and Title)* /s/ Anthony J. Koenig, Jr. |
Anthony J. Koenig, Jr., Principal Financial Officer |
|
Date June 7, 2024 |
| * | Print the name and title of each signing officer under his or her signature. |