UNITED STATES
SECURITIES AND EXCHANGE COMMISSION
Washington, D.C. 20549
FORM N-CSR
CERTIFIED SHAREHOLDER REPORT OF REGISTERED MANAGEMENT INVESTMENT
COMPANIES
Investment Company Act file number 811-00216
Nicholas High Income Fund, Inc.
(Exact Name of Registrant as specified in charter)
700 North Water Street, Milwaukee, Wisconsin 53202
(Address of Principal Executive Offices) (Zip Code)
Jeffrey T. May, Senior Vice President, Secretary and Treasurer
700 North Water Street
Milwaukee, Wisconsin 53202
(Name and Address of Agent for Service)
Registrant's telephone number, including area code: 414-272-4650
Date of fiscal year end: 12/31/2011
Date of reporting period: 06/30/2011
Item 1. Report to Stockholders.
SEMIANNUAL REPORT
June 30, 2011
NICHOLAS HIGH
INCOME FUND, INC.

|
| 700 NORTH WATER STREET |
| MILWAUKEE, WISCONSIN 53202 |
| WWW.NICHOLASFUNDS.COM |
NICHOLAS HIGH INCOME FUND, INC.
August 2011
Report to Fellow Shareholders:
Market Overview
The high yield bull market that started from the lows in March, 2009 has entered its third year. The rebound in the high yield market has been led by lower quality, distressed issues that suffered the most during the downturn in 2008. These lower quality, distressed issues have benefitted most from deep liquidity as it has allowed firms to refinance near-term maturities at lower rates. Companies that issue high yield debt have also experienced fundamental improvement in lowering their cost on debt, improving cash flow and earnings. The combination of better market liquidity, stronger balance sheets and declining default rates against a backdrop of generally low interest rates, has attracted investors back to the high yield asset class. It is our opinion that these factors will continue into the foreseeable future positioning high yield corporate bonds for potentially attractive relative performance during the balance of 2011 and 2012.
Supported by the factors listed above, the high yield sector, using the Bank of America Merrill Lynch (“BAM:”) U.S. High Yield Master II Constrained Index (“BAML HY”) as a proxy, produced a 4.93% total return for the six months and 15.31% for the twelve months ended June 30, 2011. The BAML U.S. High Yield Index for CCC and Lower Rated Bonds earned a total return of 5.53% for the six-month period ended June 30, 2011, while posting an impressive 19.03% over the twelve months ended June 30, 2011. This compares to the BB Rated Corporate Index return of 5.00% and 14.29% over the same periods. This is in contrast to the higher quality BBB-Rated Corporate Bonds and U.S. Treasury & Agency Indices respective returns of 4.00% and 2.22% for the last six months and 8.36% and 2.33%, respectively, over the past year.
The lower quality, distressed issues have led other high yield categories for the greater portion of this rally through June. Spreads began to widen and valuations began to fall in the later part of June because the market began to factor in a growing concern of weaker economic growth, and a lack of progress by the Federal Government to reach a compromise on the debt ceiling and spending cuts. The debt issue held the front page news as ideological differences prevented any concrete agreements on cutting the massive U.S. budget deficit. The deficit and out-of-control Federal Government spending pose the greatest risk to our economy. The impending path to higher deficits is quite clear with probable dire financial ramifications, including greater public spending cuts, higher taxes and higher interest rates. At this point, the current government has effectively kicked the problem down the road and interest rates are falling based on weaker economic growth, but that could change without a credible plan to lower the deficit in future years.
High yield bond valuations finished the period modestly cheap compared to long-term yield spreads. The current spreads and yields for corporate bonds should compel investors to remain in high yield corporate bonds given the current interest rate environment and improving corporate fundamentals. In our opinion, the market we are entering will reward investors for better security selection. Identifying unique,
undervalued corporate securities offering higher potential returns will be the key to market outperformance for the balance of 2011.
In a larger context, we feel the economy is poised for modest growth consistent with historical patterns where growth in highly leveraged economies struggle as the private and public sectors deleverage. Recently there are indications of the private sector making progress to deleverage. Unfortunately, the public sector has not yet gained religion. The process will remain slow and the financial impact will likely be lower interest rates and weaker economic growth for an extended time. We see high yield corporate bonds offering attractive potential returns in this environment. Historically low interest rates, an accommodating Federal Reserve, and an improving economy have proven to be an attractive environment for riskier assets such as high yield bonds in 2011.
Performance
Nicholas High Income Fund – Class I (“Fund”) produced net returns of 4.12% for the six-month period ended June 30, 2011. The Fund continues to deliver solid absolute returns during this robust period for high yield investments.
The returns earned by the Fund are consistent with our investment philosophy and style. The approach has been to identify undervalued securities using rigorous financial analysis to verify that the fundamental outlook is properly aligned with current valuations. An analysis of trends in earnings, EBITDA, leverage and asset coverage are critical for making a sound investment. Security valuation is the primary gatekeeper in deciding whether to add or eliminate a holding from the portfolio. Financially sound companies with fully priced securities do not necessarily represent a good value, while companies that have stumbled financially should not automatically be dismissed as bad investments if we believe the valuations offer a sufficient margin of safety. This process suggests a more conservative approach to investing in high yield bonds, which we believe has the potential to allow for more consistent returns and less downside risk to investors. This was the case during the period 2008 through 2010.
Portfolio Review
The Fund remains positioned with a shorter relative duration compared to the BAML HY Index. At 3.7 years as of period end, the focus is more on generating performance from credit analysis than on interest rate trends. We continue to position the portfolio with a shorter duration which we believe will provide greater stability over interest rate cycles. The Fund maintains a significant weighting in BB/B–rated bonds, which is consistent with our longer-term approach of focusing on companies with strong or improving fundamentals.
We remain committed to the Fund’s long-term strategy which is based on a process that seeks to identify value opportunities in out-of-favor or poorly followed securities of financially sound companies. Opportunities tend to arise over time in securities of companies that fall temporarily out-of-favor due to specific company or industry issues that may taint the issuers. Often times these companies are in a period of transition or restructuring where market sentiment is overly harsh or negative resulting in an undervalued situation. We are keenly aware that a cheap price alone does not guarantee a good investment; therefore, we seek to identify a catalyst we
believe will allow the company and its securities to regain favor and be rewarded with higher valuations. We believe that investing in securities trading below their fair values due to non-fundamental short-term issues, emotion or misunderstanding offers significant long-term potential returns.
Returns for Nicholas High Income Fund, Inc. – Class I and selected indices are provided in the chart below for the periods ended June 30, 2011. The Fund and Morningstar performance data is net of fees, while the BAML Indices are gross of fees.
| | | | | | | | | | | | | | | |
| | | | | | Average Annual Total Return | |
| | | 6 Month | | | 1 | Year | | 3 | Year | | 5 | Year | | 10 | Year |
| Nicholas High Income Fund, Inc. – Class I | | 4.12 | % | | 14.24 | % | | 7.73 | % | | 6.00 | % | | 5.68 | % |
| BAML U.S. High Yield Master II | | | | | | | | | | | | | | | |
| Constrained Index | | 4.93 | % | | 15.31 | % | | 12.55 | % | | 9.33 | % | | 8.91 | % |
| BAML U.S. High Yield BB/B Bond Index | | 4.81 | % | | 14.72 | % | | 10.50 | % | | 8.22 | % | | 7.86 | % |
| Morningstar High Yield Bond | | | | | | | | | | | | | | | |
| Funds Category | | 4.29 | % | | 15.00 | % | | 9.25 | % | | 6.99 | % | | 7.15 | % |
| Ending value of $10,000 invested in | | | | | | | | | | | | | | | |
| Nicholas High Income Fund, Inc. – Class I | $ | 10,412 | | $ | 11, 424 | | $ | 12,503 | | $ | 13,382 | | $ | 17,381 | |
| Fund’s Class I Expense Ratio: 0.74% | | | | | | | | | | | | | | | |
The Fund’s expense ratios for the period ended June 30, 2011 can be found in the financial highlights included within this report.
Performance data quoted represents past performance and is no guarantee of future results. The investment return and principal value of an investment will fluctuate so that an investor’s shares, when redeemed, may be worth more or less than their original cost. Current performance of the Fund may be lower or higher than the performance quoted. Performance data current to the most recent month-end may be obtained by visiting www.nicholasfunds.com/returns.html.
The ending values above illustrate the performance of a hypothetical $10,000 investment made in the Fund over the timeframes listed. Assumes reinvestment of dividends and capital gains, but does not reflect the effect of any applicable sales charge or redemption fees. Returns shown do not reflect the deduction of taxes that a shareholder would pay on Fund distributions or the redemption of Fund shares. These figures do not imply any future performance.
Class N of the Fund commenced operations on February 28, 2005. The annual returns shown for the Class I shares for this Fund would be substantially similar to the Class N because both classes of shares are invested in the same portfolio of securities. Annual returns will differ only to the extent that the classes do not have the same expenses. Please see the respective prospectus for details.
Thank you for your continued investment in the Nicholas High Income Fund.

Lawrence J. Pavelec
Senior Vice President
Portfolio Manager
The information above represents the opinions of the Fund manager, is subject to change, and any forecasts made cannot be guaranteed.
Mutual fund investing involves risk. Principal loss is possible. Investments in debt securities typically decrease in value when interest rates rise. This risk is usually greater for longer-term debt securities. Investment by the Fund in lower-rated and non-rated securities presents a greater risk of loss to principal and interest than higher-rated securities.
Please refer to the schedule of investments in the report for complete Fund holdings information. Fund holdings and sector allocations are subject to change and should not be considered a recommendation to buy or sell any security.
Current and future portfolio holdings are subject to risk.
Index Definitions - You cannot invest directly in an index.
The Bank of America Merrill Lynch U.S. High Yield Master II Index is a market value-weighted index of all domestic and yankee high-yield bonds, including deferred interest bonds and payment-in-kind securities. Issues included in the index have maturities of one year or more and have a credit rating lower than BBB-/Baa3, but are not in default. The Bank of America Merrill Lynch U.S. High Yield Master II Constrained Index limits any individual issuer to a maximum of 2% benchmark exposure.
The Bank of America Merrill Lynch U.S. High Yield Index tracks the performance of US dollar denominated below investment grade corporate debt publicly issued in the US domestic market. Qualifying securities must have at least one year remaining term to final maturity, a fixed coupon schedule and a minimum amount outstanding of $250 million.
The Bank of America Merrill Lynch U.S. High Yield BB Index is a subset of the Bank of America Merrill Lynch U.S. High Yield Index including all securities rated BB1 through BB3.
The Bank of America Merrill Lynch U.S. High Yield BBB Index is a subset of the Bank of America Merrill Lynch U.S. High Yield Index including all securities rated BBB1 through BBB3.
The Bank of America Merrill Lynch U.S. High Yield CCC and Lower Rated Index is a subset of the Merrill Lynch US High Yield Index including all securities rated CCC1 or lower.
The Bank of America Merrill Lynch U.S. Treasury and Agency Index tracks the performance of U.S. dollar denominated U.S. Treasury and non-subordinated U.S. agency debt issued in the U.S. domestic market. Issues included in the index have maturities of one year or more, have an investment grade rating, a fixed coupon schedule and a minimum amount outstanding of $1 billion for sovereigns and $250 million for agencies.
Each Morningstar Category average represents a universe of Funds with similar invest objectives.
Cash Flow - measures the cash generating capability of a company by adding non-cash charges (e.g. depreciation) and interest expense to pretax income.
EBITDA - Earnings Before Interest, Taxes, Depreciation and Amortization.
Must be preceded or accompanied by a prospectus.
The Nicholas Funds are distributed by Quasar Distributors, LLC. (08/11)
Financial Highlights Class I (NCINX)
For a share outstanding throughout each period
| | | | | | | | | | | | | | | | | | |
| | | Six Months | | | | | | | | | | | | | | | | |
| | | Ended | | | | | | | | | | | | | | | | |
| | | 06/30/2011 | | | | | | Years Ended December 31, | | | | |
| | | (unaudited) | | | 2010 | | | 2009 | | | 2008 | | | 2007 | | | 2006 | (1) |
| NET ASSET VALUE, | | | | | | | | | | | | | | | | | | |
| BEGINNING OF PERIOD | $ | 9.52 | | $ | 9.09 | | $ | 7.18 | | $ | 10.18 | | $ | 10.70 | | $ | 10.50 | |
| INCOME (LOSS) FROM | | | | | | | | | | | | | | | | | | |
| INVESTMENT OPERATIONS | | | | | | | | | | | | | | | | | | |
| Net investment income | | .35 | | | .74 | | | .66 | | | .71 | | | .75 | | | .75 | |
| Net gain (loss) on securities | | | | | | | | | | | | | | | | | | |
| (realized and unrealized) | | .04 | | | .41 | | | 1.91 | | | (3.00 | ) | | (.52 | ) | | .20 | |
| Total from | | | | | | | | | | | | | | | | | | |
| investment operations | | .39 | | | 1.15 | | | 2.57 | | | (2.29 | ) | | .23 | | | .95 | |
| LESS DISTRIBUTIONS | | | | | | | | | | | | | | | | | | |
| From net investment income | | (.17 | ) | | (.72 | ) | | (.66 | ) | | (.71 | ) | | (.75 | ) | | (.75 | ) |
| NET ASSET VALUE, | | | | | | | | | | | | | | | | | | |
| END OF PERIOD | $ | 9.74 | | $ | 9.52 | | $ | 9.09 | | $ | 7.18 | | $ | 10.18 | | $ | 10.70 | (2) |
| |
| TOTAL RETURN | | 4.12 | %(3) | | 12.99 | % | | 36.42% | | | (23.26)% | | | 2.13 | % | | 9.26 | % |
| |
| SUPPLEMENTAL DATA: | | | | | | | | | | | | | | | | | | |
| Net assets, end of | | | | | | | | | | | | | | | | | | |
| period (millions) | $ | 92.2 | | $ | 91.6 | | $ | 88.6 | | $ | 65.2 | | $ | 91.9 | | $ | 100.1 | |
| Ratio of expenses | | | | | | | | | | | | | | | | | | |
| to average net assets | | .72% | (4) | | .74 | % | | .73 | % | | .77 | % | | .72 | % | | .71 | % |
| Ratio of net investment income | | | | | | | | | | | | | | | | | | |
| to average net assets | | 7.46 | %(4) | | 7.74 | % | | 8.12 | % | | 7.70 | % | | 6.97 | % | | 6.91 | % |
| Portfolio turnover rate | | 81.11 | %(4) | | 78.23 | % | | 88.33 | % | | 61.42 | % | | 59.14 | % | | 49.85 | % |
| (1) | Per share data for the period presented reflects a reverse stock split of one share for every five shares outstanding effected January 29, 2007, except for the net asset value referenced in footnote 2 of these Class I highlights. |
| (2) | The net asset value reported at the original date prior to the reverse stock split was $2.14 for the year ended December 31, 2006. |
| (3) | Not annualized. |
| (4) | Annualized. |
The accompanying notes to financial statements are an integral part of these highlights.
– 5–
Financial Highlights Class N (NNHIX)
For a share outstanding throughout each period
| | | | | | | | | | | | | | | | | | |
| | | Six Months | | | | | | | | | | | | | | | | |
| | | Ended | | | | | | | | | | | | | | | | |
| | | 06/30/2011 | | | | | | Years Ended December 31, | | | | |
| | | (unaudited) | | | 2010 | | | 2009 | | | 2008 | | | 2007 | | | 2006 | (1) |
| NET ASSET VALUE, | | | | | | | | | | | | | | | | | | |
| BEGINNING OF PERIOD | $ | 9.64 | | $ | 9.18 | | $ | 7.24 | | $ | 10.06 | | $ | 10.60 | | $ | 10.40 | |
| INCOME (LOSS) FROM | | | | | | | | | | | | | | | | | | |
| INVESTMENT OPERATIONS | | | | | | | | | | | | | | | | | | |
| Net investment income | | .35 | | | .69 | | | .63 | | | .52 | | | .71 | | | .70 | |
| Net gain (loss) on securities | | | | | | | | | | | | | | | | | | |
| (realized and unrealized) | | .02 | | | .44 | | | 1.94 | | | (2.82 | ) | | (.54 | ) | | .20 | |
| Total from | | | | | | | | | | | | | | | | | | |
| investment operations | | .37 | | | 1.13 | | | 2.57 | | | (2.30 | ) | | .17 | | | .90 | |
| LESS DISTRIBUTIONS | | | | | | | | | | | | | | | | | | |
| From net investment income | | (.17 | ) | | (.67 | ) | | (.63 | ) | | (.52 | ) | | (.71 | ) | | (.70 | ) |
| NET ASSET VALUE, | | | | | | | | | | | | | | | | | | |
| END OF PERIOD | $ | 9.84 | | $ | 9.64 | | $ | 9.18 | | $ | 7.24 | | $ | 10.06 | | $ | 10.60 | (2) |
| |
| TOTAL RETURN | | 3.79 | %(3) | | 12.56 | % | | 36.15% | | | (23.33)% | | | 1.59 | % | | 9.04 | % |
| |
| SUPPLEMENTAL DATA: | | | | | | | | | | | | | | | | | | |
| Net assets, end of | | | | | | | | | | | | | | | | | | |
| period (millions) | $ | 1.2 | | $ | 3.4 | | $ | 16.2 | | $ | .09 | | $ | .13 | | $ | .13 | |
| Ratio of expenses | | | | | | | | | | | | | | | | | | |
| to average net assets | | 1.08 | %(4) | | 1.06 | % | | 1.06 | % | | 1.06 | % | | 1.07 | % | | 1.07 | % |
| Ratio of net investment income | | | | | | | | | | | | | | | | | | |
| to average net assets | | 7.13 | %(4) | | 7.34 | % | | 7.67 | % | | 6.72 | % | | 6.58 | % | | 6.59 | % |
| Portfolio turnover rate | | 81.11 | %(4) | | 78.23 | % | | 88.33 | % | | 61.42 | % | | 59.14 | % | | 49.85 | % |
| (1) | Per share data for the period presented reflects a reverse stock split of one share for every five shares outstanding effected January 29, 2007, except for the net asset value referenced in footnote 2 of these Class N highlights. |
| (2) | The net asset value reported at the original date prior to the reverse stock split was $2.12 for the year ended December 31, 2006. |
| (3) | Not annualized. |
| (4) | Annualized. |
The accompanying notes to financial statements are an integral part of these highlights.
– 6–
Top Ten Portfolio Issuers
June 30, 2011 (unaudited)
| | |
| | Percentage | |
| Name | of Net Assets | |
| Zayo Group, LLC | 2.36 | % |
| Pinnacle Foods Finance LLC | 2.22 | % |
| CIT Group Inc | 2.14 | % |
| Tesoro Corporation | 1.80 | % |
| Cott Beverages Inc | 1.79 | % |
| CKE Restaurants, Inc | 1.76 | % |
| MGM Resorts International | 1.73 | % |
| SandRidge Energy, Inc | 1.72 | % |
| International Lease Finance Corporation | 1.68 | % |
| Apria Healthcare Group Inc | 1.67 | % |
| Total of top ten | 18.87 | % |
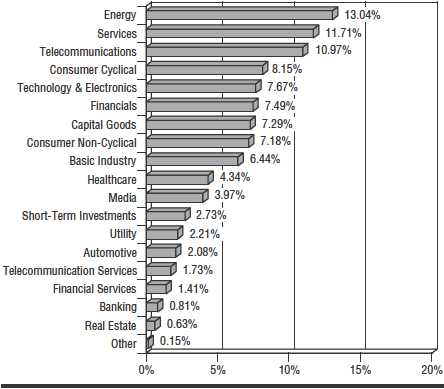
Sector Diversification (As a Percentage of Portfolio)
June 30, 2011 (unaudited)
– 7–
Fund Expenses
For the six month period ended June 30, 2011 (unaudited)
As a shareholder of the Fund, you incur two types of costs: (1) transaction costs and (2) ongoing costs, including management fees and other operating expenses. The following table is intended to help you understand your ongoing costs (in dollars) of investing in the Fund and to compare these costs with those of other mutual funds.
The example is based on an investment of $1,000 made at the beginning of the period and held for the entire period.
The first line of the table below for each share class of the Fund provides information about the actual account values and actual expenses. You may use the information in this line, together with the amount you invested, to estimate the expenses that you paid over the period. Simply divide your account value by $1,000 (for example, an $8,600 account value divided by $1,000 = 8.6), then multiply the result by the number in the first line under the heading entitled “Expenses Paid During Period” to estimate the expenses you paid on your account during this period.
The second line of the table below provides information about hypothetical account values and hypothetical expenses based on the Fund’s actual expense ratios for each class of the Fund and an assumed rate of return of 5% per year before expenses, which are not the Fund’s actual returns. The hypothetical account values and expenses may not be used to estimate the actual ending account balance or expenses you paid for the period. You may use this information to compare the ongoing costs of investing in the Fund with other funds. To do so, compare this 5% hypothetical example with the 5% hypothetical examples that appear in the shareholder reports of other funds.
Please note that the expenses shown in the table are meant to highlight your ongoing costs only and do not reflect any transactional costs, such as wire fees. Therefore, the second line of the table is useful in comparing ongoing costs only, and will not help you determine the relative total costs of owning different funds. In addition, if these transactional costs were included, your costs would have been higher.
| | | | | | |
| Class I | | | | | | |
| | | Beginning | | Ending | | |
| | | Account | | Account | | Expenses Paid |
| | | Value | | Value | | During Period* |
| | | 12/31/10 | | 06/30/11 | | 01/01/11 - 06/30/11 |
| Actual | $ | 1,000.00 | $ | 1,041.20 | $ | 3.60 |
| Hypothetical | | 1,000.00 | | 1,021.47 | | 3.57 |
| (5% return before expenses) | | | | | | |
| * | Expenses are equal to the Class I six-month annualized expense ratio of 0.72%, multiplied by the average account value over the period, multiplied by 179 then divided by 365 to reflect the one- half year period. |
– 8–
Fund Expenses (continued)
For the six month period ended June 30, 2011 (unaudited)
| | | | | | |
| Class N | | | | | | |
| | | Beginning | | Ending | | |
| | | Account | | Account | | Expenses Paid |
| | | Value | | Value | | During Period** |
| | | 12/31/10 | | 06/30/11 | | 01/01/11 - 06/30/11 |
| Actual | $ | 1,000.00 | $ | 1,037.90 | $ | 5.40 |
| Hypothetical | | 1,000.00 | | 1,019.70 | | 5.35 |
| (5% return before expenses) | | | | | | |
| ** | Expenses are equal to the Class N six-month annualized expense ratio of 1.08%, multiplied by the average account value over the period, multiplied by 179 then divided by 365 to reflect the one-half year period. |
– 9–
Schedule of Investments
June 30, 2011 (unaudited)
| | | | |
| | Shares or | | | |
| | Principal | | | |
| | Amount | | | Value |
| NON-CONVERTIBLE BONDS — 90.22% | | |
| | | Automotive – Auto Makers — 0.74% | | |
| $ | 200,000 | Chrysler Group LLC 144A restricted, 8.00%, 06/15/19 | $ | 196,500 |
| | 500,000 | Ford Motor Credit Company LLC 5.00%, 05/15/18 | | 498,290 |
| | | | | 694,790 |
| | | Automotive – Parts & Equipment — 1.30% | | |
| | 450,000 | American Axle & Manufacturing Holdings, Inc. | | |
| | | 144A restricted, 9.25%, 01/15/17 | | 490,500 |
| | 750,000 | Visteon Corporation 144A restricted, 6.75%, 04/15/19 | | 723,750 |
| | | | | 1,214,250 |
| | | Banking — 0.80% | | |
| | 1,000,000 | BAC Capital Trust XIV Fixed to Floating | | |
| | | Rate Securities 5.63%, 12/31/49(1) | | 743,750 |
| | | Basic Industry – Building Materials — 0.53% | | |
| | 500,000 | Associated Materials, LLC 144A restricted, 9.125%, 11/01/17 | | 498,750 |
| | | Basic Industry – Forestry & Paper — 2.81% | | |
| | 1,000,000 | Boise Paper Holdings, L.L.C. 8.00%, 04/01/20 | | 1,050,000 |
| | 1,000,000 | Cascades Inc. 7.75%, 12/15/17 | | 1,042,500 |
| | 500,000 | Potlatch Corporation 144A restricted, 7.50%, 11/01/19 | | 528,125 |
| | | | | 2,620,625 |
| | | Basic Industry – Metal/Mining Excluding Steel — 2.44% | | |
| | 500,000 | Alpha Natural Resources, Inc. 6.00%, 06/01/19 | | 498,750 |
| | 250,000 | American Rock Salt Company LLC 144A restricted, 8.25%, 05/01/18 | | 250,938 |
| | 1,500,000 | FMG Resources Pty Ltd 144A restricted, 7.00%, 11/01/15 | | 1,530,000 |
| | | | | 2,279,688 |
| | | Basic Industry – Steel Producers & Products — 0.55% | | |
| | 500,000 | United States Steel Corporation 7.375%, 04/01/20 | | 513,750 |
| | | Capital Goods – Aerospace & Defense — 1.40% | | |
| | 1,250,000 | ManTech International Corporation 7.25%, 04/15/18 | | 1,306,250 |
| | | Capital Goods – Diversified — 3.09% | | |
| | 500,000 | Actuant Corporation 6.875%, 06/15/17 | | 511,250 |
| | 1,000,000 | Coleman Cable, Inc. 9.00%, 02/15/18 | | 1,045,000 |
| | 350,000 | Mueller Water Products, Inc. 7.375%, 06/01/17 | | 329,000 |
| | 1,000,000 | Park-Ohio Industries, Inc. 144A restricted, 8.125%, 04/01/21 | | 1,000,000 |
| | | | | 2,885,250 |
| | | Capital Goods – Packaging — 2.68% | | |
| | 1,000,000 | Berry Plastics Corporation 9.50%, 05/15/18 | | 992,500 |
| | 1,000,000 | Solo Cup Company 10.50%, 11/01/13 | | 1,040,000 |
| | 500,000 | Solo Cup Company 8.50%, 02/15/14 | | 466,250 |
| | | | | 2,498,750 |
The accompanying notes to financial statements are an integral part of this schedule.
– 10 –
Schedule of Investments (continued)
June 30, 2011 (unaudited)
| | | | |
| | Shares or | | | |
| | Principal | | | |
| | Amount | | | Value |
| | NON-CONVERTIBLE BONDS — 90.22% (continued) | | |
| | | Consumer Cyclical – Apparel & Textiles — 1.63% | | |
| $ | 500,000 | Levi Strauss & Co. 7.625%, 05/15/20 | $ | 500,000 |
| | 1,000,000 | Liz Claiborne, Inc. 144A restricted, 10.50%, 04/15/19 | | 1,020,000 |
| | | | | 1,520,000 |
| | | Consumer Cyclical – Department Stores — 0.50% | | |
| | 500,000 | Sears Holdings Corporation 144A restricted, 6.625%, 10/15/18 | | 463,750 |
| | | Consumer Cyclical – Household & Leisure Products — 0.26% | | |
| | 217,000 | Sealy Mattress Company 144A restricted, 10.875%, 04/15/16 | | 240,870 |
| | | Consumer Cyclical – Restaurants — 3.98% | | |
| | 1,000,000 | Burger King Corporation 9.875%, 10/15/18 | | 1,065,000 |
| | 1,500,000 | CKE Restaurants, Inc. 11.375%, 07/15/18 | | 1,638,750 |
| | 1,000,000 | NPC International, Inc. 9.50%, 05/01/14 | | 1,015,000 |
| | | | | 3,718,750 |
| | | Consumer Cyclical – Specialty Retail — 1.64% | | |
| | 500,000 | Pantry, Inc. (The) 7.75%, 02/15/14 | | 498,750 |
| | 500,000 | Toys “R” Us Property Company II, LLC 8.50%, 12/01/17 | | 522,500 |
| | 500,000 | United Auto Group, Inc. 7.75%, 12/15/16 | | 510,000 |
| | | | | 1,531,250 |
| | | Consumer Non-Cyclical – Beverage — 1.79% | | |
| | 1,600,000 | Cott Beverages Inc. 8.375%, 11/15/17 | | 1,676,000 |
| | | Consumer Non-Cyclical – Food Wholesale — 3.29% | | |
| | 500,000 | Dean Foods Company 7.00%, 06/01/16 | | 495,000 |
| | 500,000 | Blue Merger Sub Inc. 144A restricted, 7.625%, 02/15/19 | | 505,000 |
| | 2,000,000 | Pinnacle Foods Finance LLC 9.25%, 04/01/15 | | 2,075,000 |
| | | | | 3,075,000 |
| | | Consumer Non-Cyclical – Products — 1.97% | | |
| | 350,000 | FGI Operating Company, Inc. 10.25%, 08/01/15 | | 371,875 |
| | 1,350,000 | Libbey Glass Inc. 10.00%, 02/15/15 | | 1,464,750 |
| | | | | 1,836,625 |
| | | Energy – Exploration & Production — 4.58% | | |
| | 1,000,000 | Encore Acquisition Company 9.50%, 05/01/16 | | 1,111,250 |
| | 500,000 | Laredo Petroleum, Inc. 144A restricted, 9.50%, 02/15/19 | | 527,500 |
| | 1,000,000 | SandRidge Energy, Inc. 144A restricted, 9.875%, 05/15/16 | | 1,097,500 |
| | 500,000 | SandRidge Energy, Inc. 144A restricted, 8.00%, 06/01/18 | | 510,000 |
| | 1,000,000 | Stone Energy Corporation 8.625%, 02/01/17 | | 1,030,000 |
| | | | | 4,276,250 |
| | | Energy – Oil Field Equipment & Services — 5.84% | | |
| | 1,000,000 | CHC Helicopter S.A. 144A restricted, 9.25%, 10/15/20 | | 902,500 |
| | 500,000 | Geokinetics Holdings USA, Inc. 9.75%, 12/15/14 | | 480,000 |
The accompanying notes to financial statements are an integral part of this schedule.
– 11 –
Schedule of Investments (continued)
June 30, 2011 (unaudited)
| | | | |
| | Shares or | | | |
| | Principal | | | |
| | Amount | | | Value |
| | NON-CONVERTIBLE BONDS — 90.22% (continued) | | |
| | | Energy – Oil Field Equipment & Services — 5.84% (continued) | | |
| $ | 1,500,000 | Helix Energy Solutions Group, Inc. 144A restricted, 9.50%, 01/15/16 | $ | 1,545,000 |
| | 500,000 | Hercules Offshore, Inc. 144A restricted, 10.50%, 10/15/17 | | 522,500 |
| | 500,000 | Hornbeck Offshore Services, Inc. 6.125%, 12/01/14 | | 495,000 |
| | 925,000 | Parker Drilling Company 9.125%, 04/01/18 | | 975,875 |
| | 500,000 | Pioneer Drilling Company 9.875%, 03/15/18 | | 535,000 |
| | | | | 5,455,875 |
| | | Energy – Oil Refining & Marketing — 2.40% | | |
| | 1,500,000 | Tesoro Corporation 9.75%, 06/01/19 | | 1,676,250 |
| | 500,000 | Western Refining, Inc. 144A restricted, 11.25%, 06/15/17 | | 562,500 |
| | | | | 2,238,750 |
| | | Financial Services – Brokerage — 1.39% | | |
| | 1,250,000 | Oppenheimer Holdings Inc. 144A restricted, 8.75%, 04/15/18 | | 1,296,875 |
| | | Financials – Consumer, Commercial & Lease Financing — 3.82% | | |
| | 2,000,000 | CIT Group Inc. 7.00%, 05/01/17 | | 1,995,000 |
| | 1,000,000 | International Lease Finance Corporation 8.625%, 09/15/15 | | 1,083,750 |
| | 500,000 | International Lease Finance Corporation 6.25%, 05/15/19 | | 488,534 |
| | | | | 3,567,284 |
| | | Healthcare – Facilities — 3.61% | | |
| | 750,000 | American Renal Holdings Inc. 8.375%, 05/15/18 | | 764,062 |
| | 1,000,000 | Apria Healthcare Group Inc. 11.25%, 11/01/14 | | 1,035,000 |
| | 500,000 | Apria Healthcare Group Inc. 12.375%, 11/01/14 | | 520,625 |
| | 1,000,000 | Gentiva Health Services, Inc. 11.50%, 09/01/18 | | 1,055,000 |
| | | | | 3,374,687 |
| | | Healthcare – Medical Products — 0.54% | | |
| | 500,000 | Teleflex Incorporated 6.875%, 06/01/19 | | 506,250 |
| | | Healthcare – Pharmaceuticals — 0.11% | | |
| | 100,000 | Endo Pharmaceuticals Holdings Inc. 144A restricted, 7.00%, 07/15/19 | | 102,500 |
| | | Media – Broadcast — 0.71% | | |
| | 631,000 | Salem Communications Corporation 9.625%, 12/15/16 | | 664,916 |
| | | Media – Cable — 0.53% | | |
| | 500,000 | UPCB Finance III Limited 144A restricted, 6.625%, 07/01/20 | | 493,750 |
| | | Media – Diversified — 1.56% | | |
| | 1,500,000 | Media General, Inc. 11.75%, 02/15/17 | | 1,458,750 |
| | | Media – Printing & Publishing — 1.10% | | |
| | 500,000 | Deluxe Corporation 7.375%, 06/01/15 | | 513,750 |
| | 500,000 | Scholastic Corporation 5.00%, 04/15/13 | | 511,875 |
| | | | | 1,025,625 |
The accompanying notes to financial statements are an integral part of this schedule.
– 12 –
Schedule of Investments (continued)
June 30, 2011 (unaudited)
| | | | |
| | Shares or | | | |
| | Principal | | | |
| | Amount | | | Value |
| | NON-CONVERTIBLE BONDS — 90.22% (continued) | | |
| | | Real Estate – Development & Management — 0.62% | | |
| $ | 500,000 | CB Richard Ellis Services, Inc. 11.625%, 06/15/17 | $ | 579,375 |
| | | Services – Gaming — 1.73% | | |
| | 500,000 | MGM MIRAGE 5.875%, 02/27/14 | | 480,625 |
| | 1,000,000 | MGM Resorts International 10.375%, 05/15/14 | | 1,135,000 |
| | | | | 1,615,625 |
| | | Services – Hotels — 0.51% | | |
| | 500,000 | FelCor Escrow Holdings, L.L.C. 144A restricted, 6.75%, 06/01/19 | | 480,000 |
| | | Services – Railroads — 1.11% | | |
| | 1,000,000 | Florida East Coast Railway Corp. 144A restricted, 8.125%, 02/01/17 | | 1,032,500 |
| | | Services – Support & Services — 5.63% | | |
| | 500,000 | Altegrity, Inc. 144A restricted, 10.50%, 11/01/15 | | 517,500 |
| | 1,000,000 | Avis Budget Car Rental, LLC 9.625%, 03/15/18 | | 1,067,500 |
| | 600,000 | Hertz Corporation (The) 144A restricted, 7.50%, 10/15/18 | | 618,000 |
| | 500,000 | Hertz Corporation (The) 144A restricted, 6.75%, 04/15/19 | | 495,000 |
| | 1,000,000 | Interactive Data Corporation 144A restricted, 10.25%, 08/01/18 | | 1,095,000 |
| | 1,000,000 | Mobile Mini, Inc. 6.875%, 05/01/15 | | 1,017,500 |
| | 500,000 | Travelport LLC 9.00%, 03/01/16 | | 446,250 |
| | | | | 5,256,750 |
| | | Services – Theaters & Entertainment — 1.68% | | |
| | 500,000 | AMC Entertainment Inc. 8.00%, 03/01/14 | | 501,250 |
| | 500,000 | AMC Entertainment Inc. 8.75%, 06/01/19 | | 527,500 |
| | 500,000 | NAI Entertainment Holdings LLC 144A restricted, 8.25%, 12/15/17 | | 536,250 |
| | | | | 1,565,000 |
| | | Services – Transportation Excluding Air & Rail — 0.85% | | |
| | 750,000 | Swift Services Holdings, Inc. 10.00%, 11/15/18 | | 794,062 |
| | | Technology & Electronics – Electronics — 1.06% | | |
| | 1,000,000 | MEMC Electronic Materials, Inc. 144A restricted, 7.75%, 04/01/19 | | 987,500 |
| | | Technology & Electronics – Software & Services — 1.63% | | |
| | 1,500,000 | GXS Worldwide, Inc. 9.75%, 06/15/15 | | 1,518,750 |
| | Technology & Electronics – Telecommunications Equipment — 4.85% | | |
| | 1,500,000 | Avaya Inc. 144A restricted, 7.00%, 04/01/19 | | 1,451,250 |
| | 59,000 | CDW LLC 11.00%, 10/12/15 | | 62,098 |
| | 1,500,000 | CDW LLC 144A restricted, 8.50%, 04/01/19 | | 1,470,000 |
| | 1,500,000 | CommScope, Inc. 144A restricted, 8.25%, 01/15/19 | | 1,545,000 |
| | | | | 4,528,348 |
| | | Telecommunications – Integrated & Services — 8.74% | | |
| | 500,000 | Cincinnati Bell Inc. 8.375%, 10/15/20 | | 498,750 |
| | 1,000,000 | Equinix, Inc. 8.125%, 03/01/18 | | 1,088,750 |
The accompanying notes to financial statements are an integral part of this schedule.
– 13 –
Schedule of Investments (continued)
June 30, 2011 (unaudited)
| | | | |
| | Shares or | | | |
| | Principal | | | |
| | Amount | | | Value |
| | NON-CONVERTIBLE BONDS — 90.22% (continued) | | |
| | | Telecommunications – Integrated & Services — 8.74% (continued) | | |
| $ | 500,000 | Frontier Communications Corporation 8.50%, 04/15/20 | $ | 545,000 |
| | 1,300,000 | Integra Telecom Holdings, Inc. 144A restricted, 10.75%, 04/15/16 | | 1,313,000 |
| | 1,000,000 | Intelsat Jackson Holdings S.A. 144A restricted, 7.25%, 04/01/19 | | 992,500 |
| | 500,000 | PAETEC Holding Corp. 8.875%, 06/30/17 | | 525,000 |
| | 1,000,000 | Windstream Corporation 7.50%, 04/01/23 | | 1,000,000 |
| | 2,000,000 | Zayo Group, LLC 10.25%, 03/15/17 | | 2,200,000 |
| | | | | 8,163,000 |
| | | Telecommunications – Wireless — 2.04% | | |
| | 1,000,000 | Digicel Group Limited 144A restricted, 12.00%, 04/01/14 | | 1,157,500 |
| | 750,000 | Nextel Communications, Inc. 7.375%, 08/01/15 | | 750,000 |
| | | | | 1,907,500 |
| | | Utility – Electric Generation — 2.18% | | |
| | 500,000 | Calpine Corporation 144A restricted, 7.875%, 07/31/20 | | 522,500 |
| | 1,500,000 | Edison Mission Energy 7.50%, 06/15/13 | | 1,509,375 |
| | | | | 2,031,875 |
| | | TOTAL NON-CONVERTIBLE BONDS | | |
| | | (cost $82,111,953) | | 84,239,895 |
| | COMMON STOCKS — 4.14% | | |
| | | Financials – Insurance — 1.01% | | |
| | 80,000 | Old Republic International Corporation | | 940,000 |
| | | Financials – Real Estate — 1.29% | | |
| | 19,500 | Digital Realty Trust, Inc | | 1,204,710 |
| | | Other — 0.15% | | |
| | 1,500 | iShares iBoxx $ High Yield Corporate Bond Fund(2) | | 136,965 |
| | | Telecommunication Services — 1.69% | | |
| | 35,000 | AT&T Inc | | 1,099,350 |
| | 60,000 | Frontier Communications Corporation | | 484,200 |
| | | | | 1,583,550 |
| | | TOTAL COMMON STOCKS | | |
| | | (cost $3,639,387) | | 3,865,225 |
| | CONVERTIBLE PREFERRED STOCK — 1.14% | | |
| | | Financials – Banks — 1.14% | | |
| | 1,000 | Wachovia Corporation 7.50%, Non-Cumulative | | |
| | | Perpetual Convertible Preferred Stock, Series L | | |
| | | (cost $1,007,500) | | 1,060,000 |
The accompanying notes to financial statements are an integral part of this schedule.
– 14 –
Schedule of Investments (continued)
June 30, 2011 (unaudited)
| | | | |
| | Shares or | | | |
| | Principal | | | |
| | Amount | | | Value |
| | PREFERRED STOCKS — 0.11% | | |
| | | Financials – Banks — 0.11% | | |
| | 35,000 | Fannie Mae Fixed-To-Floating Rate | | |
| | | Non-Cumulative Preferred Stock, Series S(3)(4) | $ | 75,250 |
| | 10,000 | Freddie Mac Fixed-to-Floating Rate | | |
| | | Non-Cumulative Perpetual Preferred Stock, Series Z(4)(5) | | 29,500 |
| | | TOTAL PREFERRED STOCKS | | |
| | | (cost $986,350) | | 104,750 |
| SHORT-TERM INVESTMENTS — 2.68% | | |
| | | Commercial Paper — 1.66% | | |
| $ | 750,000 | BMW US Capital, LLC 0.27%, 07/01/11 | | 750,000 |
| | 800,000 | UnitedHealth Group Incorporated 0.30%, 07/01/11 | | 800,000 |
| | | | | 1,550,000 |
| | | Variable Rate Security — 1.02% | | |
| | 955,501 | American Family Financial Services, Inc. 0.10%, 07/01/11(6) | | 955,501 |
| | | TOTAL SHORT-TERM INVESTMENTS | | |
| | | (cost $2,505,501) | | 2,505,501 |
| | | TOTAL INVESTMENTS | | |
| | | (cost $90,250,691) — 98.29% | | 91,775,371 |
| |
| | | OTHER ASSETS, NET OF LIABILITIES — 1.71% | | 1,597,618 |
| | | TOTAL NET ASSETS | | |
| | | (basis of percentages disclosed above) — 100% | $ | 93,372,989 |
| (1) | 5.63% per annum until March 15, 2012, thereafter 3-month LIBOR plus 0.40%; such rate being reset quarterly. |
| (2) | Closed end mutual fund. |
| (3) | The greater of (i) 7.75% per annum and (ii) 3-month LIBOR plus 4.23% per annum; such rate being reset quarterly. |
| (4) | Non-income producing security. |
| (5) | 8.375% per annum until December 31, 2012, thereafter the greater of (i) 7.875% per annum and (ii) 3-month LIBOR plus 4.16% per annum; such rate being reset quarterly. |
| (6) | Subject to a demand feature as defined by the Securities and Exchange Commission. |
The accompanying notes to financial statements are an integral part of this schedule.
– 15 –
Statement of Assets and Liabilities
June 30, 2011 (unaudited)
| | | | |
| ASSETS | | | | |
| Investments in securities at value (cost $90,250,691) | $ | | 91,775,371 | |
| Interest receivable | | | 1,660,211 | |
| Other | | | 7,922 | |
| Total assets | | | 93,443,504 | |
| |
| LIABILITIES | | | | |
| Payables — | | | | |
| Due to adviser — | | | | |
| Management fee | | | 35,973 | |
| Accounting and administrative fee | | | 4,110 | |
| | | | 40,083 | |
| 12b-1 and servicing fee | | | 5,174 | |
| Other payables and accrued expense | | | 25,258 | |
| Total liabilities | | | 70,515 | |
| Total net assets | $ | | 93,372,989 | |
| |
| NET ASSETS CONSIST OF | | | | |
| Paid in capital | $ | | 101,457,110 | |
| Net unrealized appreciation on investments | | | 1,524,680 | |
| Accumulated net realized loss on investments | | | (11,529,297 | ) |
| Accumulated undistributed net investment income | | | 1,920,496 | |
| Total net assets | $ | | 93,372,989 | |
| |
| Class I: | | | | |
| Net assets | | $ | 92,199,650 | |
| Shares outstanding | | | 9,470,737 | |
| NET ASSET VALUE PER SHARE ($.05 par value, 75,000,000 | | | | |
| shares authorized), offering price and redemption price | | $ | 9.74 | |
| Class N: | | | | |
| Net assets | | $ | 1,173,339 | |
| Shares outstanding | | | 119,237 | |
| NET ASSET VALUE PER SHARE ($.05 par value, 25,000,000 | | | | |
| shares authorized), offering price and redemption price | | $ | 9.84 | |
The accompanying notes to financial statements are an integral part of this statement.
– 16 –
| | | |
| Statement of Operations | | | |
| For the six months ended June 30, 2011 (unaudited) | | | |
| |
| INCOME | | | |
| Interest | $ | 3,781,473 | |
| Dividend | | 132,621 | |
| Other | | 145,230 | |
| Total income | | 4,059,324 | |
| |
| EXPENSES | | | |
| Management fee | | 221,827 | |
| Transfer agent fees | | 29,211 | |
| Registration fees | | 24,669 | |
| Accounting and administrative fees | | 24,521 | |
| Audit and tax fees | | 13,850 | |
| Accounting system and pricing service fees | | 13,462 | |
| Directors’ fees | | 8,220 | |
| Printing | | 7,249 | |
| Postage and mailing | | 4,752 | |
| 12b-1 fees – Class N | | 4,739 | |
| Legal fees | | 4,136 | |
| Insurance | | 2,980 | |
| Custodian fees | | 2,606 | |
| Servicing fees – Class N | | 1,896 | |
| Other operating expenses | | 2,036 | |
| Total expenses | | 366,154 | |
| Net investment income | | 3,693,170 | |
| |
| NET REALIZED GAIN ON INVESTMENTS | | 1,841,550 | |
| |
| CHANGE IN NET UNREALIZED APPRECIATION/DEPRECIATION | | | |
| ON INVESTMENTS | | (1,599,184 | ) |
| Net realized and unrealized gain on investments | | 242,366 | |
| Net increase in net assets resulting from operations | $ | 3,935,536 | |
The accompanying notes to financial statements are an integral part of this statement.
– 17 –
Statements of Changes in Net Assets
For the six months ended June 30, 2011 (unaudited)
and the year ended December 31, 2010
| | | | | | |
| | | Six Months | | | | |
| | | Ended | | | | |
| | | 06/30/2011 | | | Year Ended | |
| | | (unaudited) | | | 12/31/2010 | |
| INCREASE (DECREASE) IN | | | | | | |
| NET ASSETS FROM OPERATIONS | | | | | | |
| Net investment income | $ | 3,693,170 | | $ | 7,148,535 | |
| Net realized gain on investments | | 1,841,550 | | | 3,979,950 | |
| Change in net unrealized | | | | | | |
| appreciation/depreciation on investments | | (1,599,184 | ) | | (112,458 | ) |
| Net increase in net assets resulting from operations . | | 3,935,536 | | | 11,016,027 | |
| |
| DISTRIBUTIONS TO SHAREHOLDERS | | | | | | |
| From net investment income – Class I | | (1,745,097 | ) | | (6,760,195 | ) |
| From net investment income – Class N | | (89,875 | ) | | (219,218 | ) |
| Total distributions | | (1,834,972 | ) | | (6,979,413 | ) |
| |
| CAPITAL SHARE TRANSACTIONS | | | | | | |
| Proceeds from shares issued – Class I | | | | | | |
| (890,532 and 989,704 shares, respectively) | | 8,703,839 | | | 9,434,030 | |
| Reinvestment of distributions – Class I | | | | | | |
| (154,627 and 610,163 shares, respectively) | | 1,513,801 | | | 5,754,941 | |
| Cost of shares redeemed – Class I | | | | | | |
| (1,195,175 and 1,721,346 shares, respectively) | | (11,686,041 | ) | | (16,124,679 | ) |
| Proceeds from shares issued – Class N | | | | | | |
| (620,232 and 1,244,543 shares, respectively) | | 6,144,534 | | | 11,769,201 | |
| Reinvestment of distributions – Class N | | | | | | |
| (9,065 and 22,835 shares, respectively) | | 89,746 | | | 218,709 | |
| Cost of shares redeemed – Class N | | | | | | |
| (860,299 and 2,684,424 shares, respectively) | | (8,498,092 | ) | | (24,888,251 | ) |
| Change in net assets derived from | | | | | | |
| capital share transactions | | (3,732,213 | ) | | (13,836,049 | ) |
| Total decrease in net assets | | (1,631,649 | ) | | (9,799,435 | ) |
| |
| NET ASSETS | | | | | | |
| Beginning of period | | 95,004,638 | | | 104,804,073 | |
| End of period (including accumulated | | | | | | |
| undistributed net investment income | | | | | | |
| of $1,920,496 and $62,298, respectively) | $ | 93,372,989 | | $ | 95,004,638 | |
The accompanying notes to financial statements are an integral part of these statements.
– 18 –
Notes to Financial Statements
June 30, 2011 (unaudited)
(1) Summary of Significant Accounting Policies —
Nicholas High Income Fund, Inc. (the “Fund”) is organized as a Maryland corporation
and is registered as an open-end, diversified management investment company under
the Investment Company Act of 1940, as amended. The primary objective of the Fund is
high current income consistent with the preservation and conservation of capital values.
The following is a summary of the significant accounting policies of the Fund:
(a) Equity securities traded on a stock exchange will ordinarily be valued on the basis
of the last sale price on the date of valuation on the securities principal exchange,
or if in the absence of any sale on that day, the closing bid price. For securities
principally traded on the NASDAQ market, the Fund uses the NASDAQ Official
Closing Price. Debt securities, excluding short-term investments, are valued at
their current evaluated bid price as determined by an independent pricing service,
which generates evaluations on the basis of dealer quotes for normal institutional-
sized trading units, issuer analysis, bond market activity and various other factors.
Securities for which market quotations may not be readily available are valued at
their fair value as determined in good faith by procedures adopted by the Board of
Directors. Variable rate demand notes are valued at cost, which approximates
market value. U.S. Treasury Bills and commercial paper are stated at amortized
cost, which approximates market value. The Fund did not maintain any positions in
derivative instruments or engage in hedging activities during the year. Investment
transactions for financial statement purposes are recorded on trade date.
In accordance with Accounting Standards Codification (“ASC”) 820-10, “Fair Value
Measurements and Disclosures” (“ASC 820-10”), fair value is defined as the price
that the Fund would receive upon selling an investment in a timely transaction to an
independent buyer in the principal or most advantageous market of the investment.
ASC 820-10 established a three-tier hierarchy to maximize the use of observable
market data and minimize the use of unobservable inputs and to establish
classification of fair value measurements for disclosure purposes. Inputs refer
broadly to the assumptions that market participants would use in pricing the asset
or liability, including assumptions about risk, for example, the risk inherent in a
particular valuation technique used to measure fair value such as a pricing model
and/or the risk inherent in the inputs to the valuation technique. Inputs may be
observable or unobservable. Observable inputs are inputs that reflect the
assumptions market participants would use in pricing the asset or liability based on
market data obtained from sources independent of the reporting entity.
Unobservable inputs are inputs that reflect the reporting entity’s own assumptions
about the assumptions market participants would use in pricing the asset or liability
based on the best information available in the circumstances. The three-tier
hierarchy of inputs is summarized in the three broad levels listed below.
– 19 –
Notes to Financial Statements (continued)
June 30, 2011 (unaudited)
Level 1 – quoted prices in active markets for identical investments
Level 2 – other significant observable inputs (including quoted prices for
similar investments, interest rates, benchmark yields, bids, offers,
transactions, spreads and other relationships observed in the
markets among market securities, underlying equity of the issuer,
proprietary pricing models, credit risk, etc.)
Level 3 – significant unobservable inputs (including the Fund’s own
assumptions in determining the fair value of investments)
The inputs or methodology used for valuing securities are not necessarily an
indication of the risk associated with investing in those securities.
The following is a summary of the inputs used as of June 30, 2011 in valuing the
Fund’s investments carried at value:
| | |
| | | Investments |
| Valuation Inputs | | in Securities |
| Level 1 – | | |
| Common Stocks(1) | $ | 3,865,225 |
| Convertible Preferred Stock(1) | | 1,060,000 |
| Preferred Stocks(1) | | 104,750 |
| Level 2 – | | |
| Non-Convertible Bonds(1) | | 84,239,895 |
| Commercial Paper | | 1,550,000 |
| Variable Rate Security | | 955,501 |
| Level 3 – | | |
| None | | — |
| Total | $ | 91,775,371 |
| (1) See Schedule of Investments for further detail by industry. | | |
There were no significant transfers between levels during the period ended June 30,
2011 and the Fund did not hold any Level 3 investments during the year.
(b) Net realized gain (loss) on portfolio securities was computed on the basis of
specific identification.
(c) Dividend income is recorded on the ex-dividend date, and interest income is
recognized on an accrual basis. Non-cash dividends, if any, are recorded at value
on date of distribution. Generally, discounts and premiums on long-term debt
security purchases, if any, are amortized over the expected lives of the respective
securities using the effective yield method.
(d) Provision has not been made for federal income taxes or excise taxes since the
Fund has elected to be taxed as a “regulated investment company” and intends to
distribute substantially all net investment income and net realized capital gains on
sales of investments to its shareholders and otherwise comply with the provisions
of Subchapter M of the Internal Revenue Code applicable to regulated investment
companies.
– 20 –
Notes to Financial Statements (continued)
June 30, 2011 (unaudited)
Investment income, net capital gains (losses) and all expenses incurred by the Fund
are allocated based on the relative net assets of each class, except for service fees
and certain other fees and expenses related to one class of shares.
Class N shares are subject to a 0.25% 12b-1 fee and a 0.10% servicing fee, as
described in its prospectus. Income, expenses (other than expenses attributable to
a specific class), and realized and unrealized gains and losses are allocated daily to
each class of shares based upon the relative net asset value of outstanding shares.
(e) Dividends and distributions paid to shareholders are recorded on the ex-dividend
date. Distributions from net investment income are generally declared and paid
quarterly. Distributions of net realized capital gain, if any, are declared and paid at
least annually.
The amount of distributions from net investment income and net realized capital
gain are determined in accordance with federal income tax regulations, which may
differ from U.S. generally accepted accounting principles. Distributions are
determined in accordance with income tax regulations, which may differ from net
investment income and realized gains for financial reporting purposes. Financial
reporting records are adjusted for permanent book to tax differences to reflect tax
character.
The tax character of distributions paid during the six months ended June 30, 2011
and the year ended December 31, 2010 was as follows:
| | | | |
| | | 06/30/2011 | | 12/31/2010 |
| Distributions paid from: | | | | |
| Ordinary income | $ | 1,834,972 | $ | 6,979,413 |
As of June 30, 2011, investment cost for federal tax purposes was $90,250,691
and the tax basis components of net assets were as follows:
| | | |
| Unrealized appreciation | $ | 3,196,303 | |
| Unrealized depreciation | | (1,671,623 | ) |
| Net unrealized appreciation | $ | 1,524,680 | |
There was no difference between the book-basis and tax-basis unrealized
appreciation as of June 30, 2011.
As of June 30, 2011, the Fund had no tax deferral of wash loss sales.
As of the fiscal year ended December 31, 2010, the Fund had capital loss
carryforwards of approximately $13,371,000, which expire as follows: $1,487,000
in 2014, $5,050,000 in 2016 and $6,834,000 in 2017. To the extent the Fund has
future net realized capital gains, distributions of capital gains to shareholders will
be offset by any unused capital loss carryforward.
On December 22, 2010, the Regulated Investment Company Modernization Act of
2010 (the “RIC Act”) was enacted. The RIC Act modernizes several of the federal
income and excise tax provisions related to regulated investment companies
(“RICs”). Under the RIC Act, new capital losses may be carried forward indefinitely,
– 21 –
Notes to Financial Statements (continued)
June 30, 2011 (unaudited)
with the character of the original loss retained. The RIC Act also contains
simplification provisions, which are aimed at preventing disqualification of a RIC for
inadvertent failures to comply with asset diversification and/or qualifying income
tests. The RIC Act exempts RICs from the preferential dividend rule and repealed
the 60-day designation requirement for certain types of pay-through income and
gains. In addition, the RIC Act contains provisions aimed at preserving the
character of distributions made by a fiscal year RIC during the portion of its taxable
year ending after October 31 or December 31. Except for the simplification
provisions related to RIC qualification, the RIC Act is effective for taxable years
beginning after December 22, 2010. Management is currently evaluating the
implications of the RIC Act and the impact of the Funds’ financial statements, if any,
is currently being assessed.
The Fund had no material uncertain tax positions and has not recorded a liability for
unrecognized tax benefits as of June 30, 2011. Also, the Fund recognized no
interest and penalties related to uncertain tax benefits in fiscal 2011. At June 30,
2011, the fiscal years 2007 through 2010 remain open to examination in the Fund’s
major tax jurisdictions.
(f) The preparation of financial statements in conformity with U.S. generally accepted
accounting principles requires management to make estimates and assumptions
that affect the amounts reported in the financial statements and accompanying
notes. Actual results could differ from estimates.
(g) In connection with the preparation of the Fund’s financial statements, management
evaluated subsequent events after the date of the Statement of Assets and
Liabilities of June 30, 2011. There have been no significant subsequent events
since June 30, 2011 that would require adjustment to or additional disclosure in
these financial statements.
(2) Related Parties—
(a) Investment Adviser and Management Agreement —
The Fund has an agreement with Nicholas Company, Inc. (with whom certain
officers and directors of the Fund are affiliated) (the “Adviser”) to serve as
investment adviser and manager. Under the terms of the agreement, a monthly fee
is paid to the Adviser based on an annualized fee of .50% of the average net asset
value up to and including $50 million, .40% of the average net asset value in excess
of $50 million and up to and including $100 million and .30% of the average net
asset value in excess of $100 million. Also, the Adviser may be paid for accounting
and administrative services rendered by its personnel, subject to the following
guidelines: (i) up to five basis points, on an annual basis, of the average net asset
value of the Fund up to and including $2 billion and up to three basis points, on an
annual basis, of the average net asset value of the Fund greater than $2 billion,
based on the average net asset value of the Fund as determined by valuations made
at the close of each business day of each month, and (ii) where the preceding
calculation results in an annual payment of less than $50,000, the Adviser, in its
discretion, may charge the Fund up to $50,000 for such services.
– 22 –
Notes to Financial Statements (continued)
June 30, 2011 (unaudited)
(b) Legal Counsel —
A director of the Adviser is affiliated with a law firm that provides services to the
Fund. The Fund incurred expenses of $1,886 for the period ended June 30, 2011
for legal services rendered by this law firm.
(3) Investment Transactions —
For the period ended June 30, 2011, the cost of purchases and the proceeds from sales
of investment securities, other than short-term obligations, aggregated $37,433,727 and
$37,730,140, respectively.
(4) Concentration of Risk —
The Fund invests primarily in high yield debt securities. The market values of these high
yield debt securities tend to be more sensitive to economic conditions and individual
corporate developments than those of higher rated securities. In addition, the market for
these securities is generally less liquid than for higher rated securities.
– 23 –
| | | | | | | |
| Historical Record(1) | | | | | |
| (unaudited) | | | | | | | |
| |
| | | Net | | Net Investment | | | Growth of an |
| | | Asset Value | | Income Distributions | | | Initial $10,000 |
| | | Per Share | | Per Share | | | Investment(3) |
| Class I | | | | | | | |
| November 21, 1977(2) | $ | 25.50 | $ | — | | $ | 10,000 |
| December 31, 1987 | | 18.20 | | 2.3300 | | | 22,560 |
| December 31, 1988 | | 18.40 | | 1.8550 | | | 25,164 |
| December 31, 1989 | | 17.20 | | 1.9150 | | | 26,155 |
| December 31, 1990 | | 15.05 | | 1.9850 | | | 25,886 |
| December 31, 1991 | | 16.70 | | 1.7300 | | | 31,853 |
| December 31, 1992 | | 16.90 | | 1.4775 | | | 35,143 |
| December 31, 1993 | | 17.60 | | 1.4450 | | | 39,695 |
| December 31, 1994 | | 16.05 | | 1.5050 | | | 39,626 |
| December 31, 1995 | | 17.10 | | 1.4750 | | | 46,029 |
| December 31, 1996 | | 17.65 | | 1.4800 | | | 51,721 |
| December 31, 1997 | | 18.45 | | 1.4515 | | | 58,514 |
| December 31, 1998 | | 16.95 | | 1.5775 | | | 58,788 |
| December 31, 1999 | | 15.30 | | 1.6560 | | | 58,749 |
| December 31, 2000 | | 12.00 | | 1.5300 | | | 51,620 |
| December 31, 2001 | | 11.80 | | 1.2150 | | | 56,144 |
| December 31, 2002 | | 9.65 | | 0.9925 | | | 50,459 |
| December 31, 2003 | | 10.95 | | 0.8450 | | | 61,937 |
| December 31, 2004 | | 11.15 | | 0.8200 | | | 67,915 |
| December 31, 2005 | | 10.50 | | 0.7895 | | | 68,849 |
| December 31, 2006 | | 10.70 | | 0.7455 | | | 75,221 |
| December 31, 2007 | | 10.18 | | 0.7502 | | | 76,820 |
| December 31, 2008 | | 7.18 | | 0.7140 | | | 58,955 |
| December 31, 2009 | | 9.09 | | 0.6581 | | | 80,426 |
| December 31, 2010 | | 9.52 | | 0.7230 | | | 90,876 |
| June 30, 2011 | | 9.74 | | 0.1728 | (a) | | 94,617 |
| |
| Class N | | | | | | | |
| February 28, 2005(2) | $ | 11.20 | $ | — | | $ | 10,000 |
| December 31, 2005 | | 10.40 | | 0.7320 | | | 9,947 |
| December 31, 2006 | | 10.60 | | 0.7140 | | | 10,846 |
| December 31, 2007 | | 10.06 | | 0.7119 | | | 11,018 |
| December 31, 2008 | | 7.24 | | 0.5238 | | | 8,448 |
| December 31, 2009 | | 9.18 | | 0.6323 | | | 11,501 |
| December 31, 2010 | | 9.64 | | 0.6683 | | | 12,946 |
| June 30, 2011 | | 9.84 | | 0.1668 | (a) | | 13,437 |
| (1) | Per share amounts presented for the periods prior to December 31, 2007 in this historical record have been restated or adjusted to reflect a reverse stock split of one share for every five shares outstanding effected on January 29, 2007. |
| (2) | Initial date under Nicholas Company, Inc. management. |
| (3) | Assuming reinvestment of distributions. |
| (a) | Paid on April 27, 2011 to shareholders of record on April 26, 2011. The Fund distributed no capital gains for the time periods listed. |
– 24 –
Approval of Investment Advisory Contract
(unaudited)
In February 2011, the Board of Directors of the Fund renewed the one-year term of the Investment Advisory Agreement by and between the Fund and the Adviser through February 2012. In connection with the renewal of the Investment Advisory Agreement, no changes to the amount or manner of calculation of the management fee or the terms of the agreement were proposed by the Adviser or adopted by the Board. For the fiscal year ended December 31, 2010, the management fee was 0.45% and the Fund’s Class I and Class N total expense ratios (including the management fee) were 0.74% and 1.06%, respectively. In renewing the Investment Advisory Agreement, the Board carefully considered the following factors on an absolute basis and relative to the Fund’s peer group: (i) the Fund’s Class I expense ratio, which was the lowest in its overall peer group; (ii) the Fund’s performance on a short-term and long-term basis; (iii) the Fund’s management fee; and (iv) the range and quality of the services offered by the Adviser. The peer group fund data included high-yield bond funds with similar asset sizes, credit quality and number of holdings. In terms of the peer group data used for performance comparisons, the Fund’s Class I was ranked 10th, 9th, 9th and 11th out of 14 funds for the one-, three-, five- and ten-year periods ending December 31, 2010. The Fund’s Class I had the lowest expense ratio among its peer group and ranked 8th in terms of 12-month yield out of the 14 funds.
The Board considered the range of services to be provided by the Adviser to the Fund under the Advisory Agreement. The Board discussed the nature, extent, and quality of the services to be provided by the Adviser and concluded that the services provided were consistent with the terms of the advisory agreement and the needs of the Fund, and that the services provided were of a high quality.
The Board considered the investment performance of the Fund and the Adviser. Among other things, the Board noted its consideration of the Fund’s performance relative to peer funds. The Board reviewed the actual relative short-term and long-term performance of the Fund. The Board agreed that the Fund demonstrated satisfactory performance relative to its peers. The Board also discussed the extent to which economies of scale would be realized, and whether such economies were reflected in the Fund’s fee levels and concluded that the Adviser had been instrumental in holding down Fund costs, citing consistently low fees.
The Board considered the cost of services provided by the Adviser. The Board also considered the profits realized by the Adviser in connection with the management and distribution of the Fund, as expressed by the Adviser’s management in general terms. The Board expressed the opinion that given the Board’s focus on performance and maintaining a low fee structure that the Adviser’s profits were not relevant.
The Board determined that the Adviser had fully and adequately carried out the terms and conditions of its contract with the Fund. The Board discussed the Fund’s relatively low fees, historical returns and risk profile and management’s strategies to improve the absolute and relative performance of the Fund. The Board expressed satisfaction with the Fund’s performance, management’s control of expenses and the rate of the management fee for the Fund and the overall level of services provided to the Fund by the Adviser.
– 25 –
Information on Proxy Voting
(unaudited)
A description of the policies and procedures that the Fund uses to determine how to vote
proxies relating to portfolio securities is available, without charge, upon request by calling
800-544-6547 (toll-free) or 414-276-0535. It also appears in the Fund’s Statement of
Additional Information, which can be found on the SEC’s website, www.sec.gov. A record of
how the Fund voted its proxies for the most recent twelve-month period ended June 30, also
is available on the Fund’s website, www.nicholasfunds.com, and the SEC’s website,
www.sec.gov.
Quarterly Portfolio Schedule
(unaudited)
The Fund files its complete schedule of investments with the SEC for the first and third
quarters of each fiscal year on Form N-Q. The Fund’s Form N-Q’s are available on the SEC’s
website at www.sec.gov and may be reviewed and copied at the SEC’s Public Reference
Room in Washington, D.C. Information on the operation of the Public Reference Room may
be obtained by calling 800-SEC-0330.
– 26 –
Privacy Policy
(unaudited)
Nicholas High Income Fund, Inc. respects each shareholder’s right to privacy. We are committed to safeguarding the information that you provide us to maintain and execute transactions on your behalf.
We collect the following non-public personal information about you:
| * | Information we receive from you on applications or other forms, whether we receive the form in writing or electronically. This includes, but is not limited to, your name, address, phone number, tax identification number, date of birth, beneficiary information and investment selection. |
| * | Information about your transactions with us and account history with us. This includes, but is not limited to, your account number, balances and cost basis information. This also includes transaction requests made through our transfer agent. |
| * | Other general information that we may obtain about you such as demographic information. |
WE DO NOT SELL ANY NON-PUBLIC PERSONAL INFORMATION ABOUT CURRENT OR FORMER SHAREHOLDERS.
INFORMATION SHARED WITH OUR TRANSFER AGENT, A THIRD PARTY COMPANY, ALSO IS NOT SOLD.
We may share, only as permitted by law, non-public personal information about you with third party companies. Listed below are some examples of third parties to whom we may disclose non-public personal information. While these examples do not cover every circumstance permitted by law, we hope they help you understand how your information may be shared.
We may share non-public personal information about you:
| * | With companies who work for us to service your accounts or to process transactions that you may request. This would include, but is not limited to, our transfer agent to process your transactions, mailing houses to send you required reports and correspondence regarding the Fund and its Adviser, the Nicholas Company, Inc., and our dividend disbursing agent to process fund dividend checks. |
| * | With a party representing you, with your consent, such as your broker or lawyer. |
| * | When required by law, such as in response to a subpoena or other legal process. |
The Fund and its Adviser maintain policies and procedures to safeguard your non-public personal information. Access is restricted to employees who the Adviser determines need the information in order to perform their job duties. To guard your non-public personal information we maintain physical, electronic, and procedural safeguards that comply with federal standards.
In the event that you hold shares of the Fund with a financial intermediary, including, but not limited to, a broker-dealer, bank, or trust company, the privacy policy of your financial intermediary would govern how your non-public personal information would be shared with non-affiliated third parties.
– 27 –
Nicholas Funds Services Offered
(unaudited)
• IRAs
| |
| • Traditional | • SIMPLE |
| • Roth | • SEP |
• Coverdell Education Accounts
• Profit Sharing Plan
• Automatic Investment Plan
• Direct Deposit of Dividend and Capital Gain Distributions
• Systematic Withdrawal Plan with Direct Deposit
• Monthly Automatic Exchange between Funds
• Telephone Redemption
• Telephone Exchange
• 24-hour Automated Account Information (800-544-6547)
• 24-hour Internet Account Access (www.nicholasfunds.com)
Please call a shareholder representative for further information on the above services or with any other questions you may have regarding the Nicholas Funds (800-544-6547).
– 28 –
Directors and Officers
DAVID O. NICHOLAS, President and Director
ROBERT H. BOCK, Director
TIMOTHY P. REILAND, Director
JAY H. ROBERTSON, Director
ALBERT O. NICHOLAS, Executive Vice President
DAVID L. JOHNSON, Executive Vice President
JEFFREY T. MAY, Senior Vice President, Secretary,
Treasurer and Chief Compliance Officer
LAWRENCE J. PAVELEC, Senior Vice President
CANDACE L. LESAK, Vice President
Investment Adviser
NICHOLAS COMPANY, INC.
Milwaukee, Wisconsin
www.nicholasfunds.com
414-276-0535 or 800-544-6547
Transfer Agent
U.S. BANCORP FUND SERVICES, LLC
Milwaukee, Wisconsin
414-276-0535 or 800-544-6547
Distributor
QUASAR DISTRIBUTORS, LLC
Milwaukee, Wisconsin
Custodian
U.S. BANK N.A.
Milwaukee, Wisconsin
Independent Registered Public Accounting Firm
DELOITTE & TOUCHE LLP
Milwaukee, Wisconsin
Counsel
MICHAEL BEST & FRIEDRICH LLP
Milwaukee, Wisconsin
This report is submitted for the information of shareholders of the Fund. It is not authorized for distribution to prospective investors unless preceded or accompanied by an effective prospectus.
Item 2. Code of Ethics.
Applicable only to annual reports.
Item 3. Audit Committee Financial Expert.
Applicable only to annual reports.
Item 4. Principal Accountant Fees and Services.
Applicable only to annual reports.
Item 5. Audit Committee of Listed Registrants.
Not applicable to this filing.
Item 6. Schedule of Investments.
The schedule of investments in securities of unaffiliated issuers is included as part of the report to shareholders filed under Item 1.
Item 7. Disclosure of Proxy Voting Policies and Procedures for Closed-End Management Investment Companies.
Applicable only to annual reports filed by closed-end funds.
Item 8. Portfolio Managers of Closed-End Management Investment Companies.
Applicable only to annual reports filed by closed-end funds.
Item 9. Purchases of Equity Securities by Closed-End Management Investment Companies and Affiliated Purchasers.
Applicable only to closed-end funds.
Item 10. Submission of Matters to a Vote of Security Holders.
Not applicable to this filing.
Item 11. Controls and Procedures.
The Fund's principal executive officer and principal financial officer have concluded that the Fund's disclosure controls and procedures are sufficient to ensure that information required to be disclosed by the Fund in this Form N-CSR was recorded, processed, summarized and reported within the time periods specified in the Securities and Exchange Commission's rules and forms, based upon such officers' evaluation of these controls and procedures as of a date within 90 days of the filing date of the report. There were no significant changes or corrective actions with regard to significant deficiencies or material weaknesses in the Fund's internal controls or in other factors that could significantly affect the Fund's internal controls subsequent to the date of their evaluation.
Item 12. Exhibits.
(a)(1) Code of Ethics -- Any code of ethics, or amendments thereto, that is the subject of the disclosure required by Item 2, to the extent that the registrant intends to satisfy the Item 2 requirements through filing of an exhibit.
Not applicable to this filing.
(a)(2) Certifications of Principal Executive Officer and Principal Financial Officer pursuant to Section 302 of the Sarbannes-Oxley Act of 2002, attached hereto as part of EX-99.CERT.
(a)(3) Any written solicitation to purchase securities under Rule 23c-1 under the Act sent or given during the period covered by the report by or on behalf of the registrant to 10 or more person.
Applicable only to closed-end funds.
(b) Certifications of Principal Executive Officer and Principal Financial Officer pursuant to Section 906 of the Sarbannes-Oxley Act of 2002, attached hereto as part of EX-99.906CERT.
SIGNATURES
Pursuant to the requirements of the Securities Exchange Act of 1934 and the Investment Company Act of 1940, the registrant has duly caused this report to be signed on its behalf by the undersigned, thereunto duly authorized.
(Registrant) Nicholas High Income Fund, Inc.
By: /s/ David O. Nicholas
Name: David O. Nicholas
Title: Principal Executive Officer
Date: 08/30/2011
Pursuant to the requirements of the Securities Exchange Act of 1934 and the Investment Company Act of 1940, this report has been signed by the following persons on behalf of the registrant and in the capacities and on the dates indicated.
By: /s/ David O. Nicholas
Name: David O. Nicholas
Title: Principal Executive Officer
Date: 08/30/2011
By: /s/ Jeffrey T. May
Name: Jeffrey T. May
Title: Principal Financial Officer
Date: 08/30/2011