UNITED STATES
SECURITIES AND EXCHANGE COMMISSION
Washington, D.C. 20549
FORM N-CSRS
CERTIFIED SHAREHOLDER REPORT OF REGISTERED
MANAGEMENT INVESTMENT COMPANIES
INVESTMENT COMPANY ACT FILE NUMBER: 811-09237
| | |
| EXACT NAME OF REGISTRANT AS SPECIFIED IN CHARTER: | | Calamos Advisors Trust |
| |
ADDRESS OF PRINCIPAL EXECUTIVE OFFICES: | | 2020 Calamos Court, Naperville |
| | Illinois 60563-2787 |
| |
NAME AND ADDRESS OF AGENT FOR SERVICE: | | John P. Calamos, Sr., Chairman, |
| | CEO and Co-CIO |
| | Calamos Advisors LLC, |
| | 2020 Calamos Court, |
| | Naperville, Illinois |
| | 60563-2787 |
REGISTRANT’S TELEPHONE NUMBER, INCLUDING AREA CODE: (630) 245-7200
DATE OF FISCAL YEAR END: December 31, 2012
DATE OF REPORTING PERIOD: January 1, 2012 through June 30, 2012
ITEM 1. REPORT TO SHAREHOLDERS.

About Calamos Investments
For more than 30 years, we have helped investors like you manage and build wealth to meet long-term objectives. Because investors have different time horizons, risk tolerances and goals, we offer investment portfolios to suit a variety of asset allocation needs. For example, our mutual funds include equity, fixed income and alternative funds. We offer U.S. funds, as well as global and international choices.
We are dedicated to helping our clients build and protect wealth. We understand when you entrust us with your assets, you also entrust us with your achievements, goals and aspirations. We believe we best honor this trust by making investment decisions guided by integrity, by discipline and by our conscientious research.
We believe that an active, risk-conscious approach is essential for wealth creation. In the 1970s, we pioneered the use of convertible securities as a means to manage risk in volatile markets. We followed with strategies that combine convertibles and stocks, with the aim of participating in equity market upside with potentially less volatility than an all-stock portfolio. In the 1990s, we introduced our first stock fund, which invests in growth companies both large and small.
Across our funds, our investment process seeks to manage risk at multiple levels and draws upon our experience investing through multiple market cycles. In a rapidly changing environment, we believe that this active management is essential.
We are global in our perspective. We believe that globalization offers tremendous opportunities for countries and companies all over the world. In our U.S., global and international portfolios, we seek to capitalize on the potential growth of the global economy.
We believe there are opportunities in all markets. Our history traces back to the 1970s, a period of significant volatility and economic concerns. We have invested through multiple market cycles, each with its own challenges. Out of this experience comes our belief that the flipside of volatility is opportunity.
Letter to Contract Owners

JOHN P. CALAMOS, SR.
CEO/Co-CIO
Dear Contract Holder:
Welcome to your semiannual report for the six-month period ended June 30, 2012. In this report, you will find commentary from the Calamos Investment Management Team, as well as a listing of portfolio holdings, financial statements and highlights, and detailed information about the performance and positioning of the Calamos Growth and Income Portfolio.
Market Review
Entering the semiannual period, our view was that the U.S. economy was not headed for a double dip recession. During the period, improving economic data supported our constructive view. However, even as market sentiment improved and risk appetites increased, the global markets remained volatile. Sovereign debt pressures in the euro zone and the potential for slowing growth in emerging markets were of particular concern.
Overall, for the six-month period, equity markets experienced significant gains. In the U.S., the S&P 500 Index1 returned 9.49% for the period. Convertible securities also enjoyed the six-month rally, as the BofA Merrill Lynch All U.S. Convertible Index2 returned 6.59%.
Opportunities in the Global Economy
While the strong performance over the semiannual period has been a welcome development, we know from experience that volatility can work both ways, and we therefore continue to actively monitor the global economy and the companies we have chosen for the portfolio. We expect slow but positive growth in the U.S. and in the global economy as a whole. We are prepared for ups and downs along the way and anticipate continued volatility in the global financial markets.
We believe the period’s strong showing serves as a timely reminder of the resilience of growth equities as a long-term investment opportunity. Our valuation models show that growth continues to be priced at a large discount. Overall, our view is that equities represent the most compelling investment on an asset class basis. However, as in the past, trying to time when the equity markets will respond positively for a pronounced period is extremely difficult.
We have identified a number of important secular themes that we believe will drive global growth for years to come. The growth of a middle class in many emerging market regions is an exciting trend, and globally focused businesses are in the best position to capitalize on this increasingly prosperous new customer base. In addition, information technology firms—which comprise a substantial portion of the holdings in the Growth and Income
Letter to Contract Owners
Portfolio—represent an excellent opportunity to take advantage of the growing needs of both global consumers and productivity-seeking businesses around the world.
We believe that these prominent secular themes and cyclical factors will provide growth opportunities for companies, particularly those with geographically diversified revenues, strong global brands and healthy balance sheets. We believe that global companies may be less vulnerable to economic weakness in a particular country or region, and we are favoring companies domiciled in developed countries that are capitalizing on many of the growth trends currently available in emerging markets.
Experience has shown us that volatility and uncertainty have always been, and will continue to be, big factors in investing. Yet it is that same experience that has taught us that while we may not be able to control market volatility or anticipate every potential event in the global economy, we can still find investing success over the long term with a disciplined approach that fully takes into account both risks and rewards. We believe that volatility and uncertainty do not constitute an argument to stay out of the markets, but rather a reason to rely on the same comprehensive approach to investing that has served us remarkably well over the past several decades.
As always, we appreciate the trust you have placed in us to manage your assets and help you achieve your financial goals.
Sincerely,

John P. Calamos, Sr.
CEO and Co-CIO,
Calamos Advisors LLC
Before investing, carefully consider a fund’s investment objectives, risks, charges and expenses. Please see the prospectus containing this and other information or call 800.582.6959. Please read the prospectus carefully.
Performance data represents past performance, which is no guarantee of future results. Current performance may be lower or higher than the performance quoted.
| 1 | The S&P 500 Index is an unmanaged index generally considered representative of the U.S. stock market. Source: Lipper, Inc. |
| 2 | The BofA Merrill Lynch All U.S. Convertibles Index represents the U.S. convertible securities market. |
Unmanaged index returns assume reinvestment of any and all distributions and, unlike fund returns, do not reflect fees, expenses or sales charges. Investors cannot invest directly in an index.
Investments in overseas markets pose special risks, including currency fluctuation and political risks. These risks are generally intensified for investments in emerging markets. Countries, regions, and sectors mentioned are presented to illustrate countries, regions, and sectors in which a fund may invest. Fund holdings are subject to change daily. The Funds are actively managed.
The information contained herein is based on internal research derived from various sources and does not purport to be statements of all material facts relating to the securities mentioned. The information contained herein, while not guaranteed as to the accuracy or completeness, has been obtained from sources we believe to be reliable.
There are certain risks involved with investing in convertible securities in addition to market risk, such as call risk, dividend risk, liquidity risk and default risk, that should be carefully considered prior to investing. This information is being provided for informational purposes only and should not be considered investment advice or an offer to buy or sell any security in the portfolio.
This report is intended for informational purposes only and should not be considered investment advice.
| | | | |
| 2 | | CALAMOS GROWTH AND INCOME PORTFOLIO SEMIANNUAL REPORT | | |
Investment Team Discussion
CALAMOS GROWTH AND INCOME PORTFOLIO
INVESTMENT TEAM DISCUSSION
The Calamos Investment Management Team discusses the Portfolio’s performance, strategy and positioning during the six-month period ended June 30, 2012.
Q. What is the Portfolio’s investment strategy?
A. Calamos Growth and Income Portfolio invests in a combination of stocks, convertible securities and bonds of U.S. companies. The Portfolio offers a total return-oriented investment that seeks to maintain a balance of risk and reward through full market cycles. As we focus on managing volatility, we endeavor to participate in a greater portion of equity market upside than downside. We invest in equities, convertible securities and bonds issued primarily by U.S.-based companies. We currently emphasize companies with global presence and geographically diversified revenues that we believe are positioned to capitalize on global economic growth and global secular trends.
Q. Please discuss the Portfolio’s low-volatility* characteristics.
A. We believe the Portfolio’s historical low-volatility characteristics are a by-product of our investment style and focus on participating in equity market upside with less volatility than the market as a whole. Beta is one popular statistic for measuring volatility. Beta considers an investment’s historic volatility versus the market, which is assigned a beta of 1.0. An investment with half the volatility of the market would have a beta of 0.5, while an investment with at beta of 2.0 would have been twice as volatile as the market.
Over the past 10 years, the Portfolio has had a beta of 0.77 versus the S&P 500 Index. The Portfolio has outperformed the broader equity market, as measured by the S&P 500 Index, with less volatility than the equity markets. Please note that past performance does not indicate future results and that beta is one of many measures of risk.
| * | The Portfolio’s historical performance has exhibited lower volatility, as measured by beta and standard deviation, over the life of the Portfolio. The Portfolio’s investment objective does not seek to reduce volatility, and as a result, the Portfolio may experience volatility in some market conditions. (Source for beta and standard deviation data is Morningstar, Inc.) |
| | | | |
| SECTOR WEIGHTINGS | |
Information Technology | | | 33.0 | % |
Health Care | | | 13.1 | |
Energy | | | 10.3 | |
Materials | | | 8.0 | |
Consumer Discretionary | | | 7.6 | |
Financials | | | 6.3 | |
Industrials | | | 5.0 | |
Consumer Staples | | | 3.8 | |
Sector weightings are subject to change daily and are calculated as a percentage of net assets. The table excludes cash or cash equivalents, any government/sovereign bonds or broad based index hedging securities the Portfolio may hold.
Investment Team Discussion
GROWTH OF $10,000 FOR 10 YEAR PERIOD ENDED 6/30/12
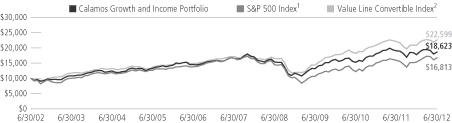
AVERAGE ANNUAL TOTAL RETURN† FOR THE PERIOD ENDED 6/30/12
| | | | | | | | | | | | | | | | | | |
| 6 MONTHS | | | 1 YEAR | | | 3 YEARS | | | 5 YEARS | | | 10 YEARS | |
| | 4.49% | | | | -2.52% | | | | 12.07% | | | | 2.32% | | | | 6.42% | |
| | |
Performance data quoted represents past performance, which is no guarantee of future results. Current performance may be lower or higher than the performance quoted. The principal value and investment return of an investment will fluctuate so that your shares, when redeemed, may be worth more or less than their original cost. Returns are net of all fees and expenses incurred by the Portfolio.
| † | Average annual total return measures net investment income and capital gain or loss from portfolio investments as an annualized average, assuming reinvestment of income and capital gain distributions. Returns do not reflect sales charges, expenses and fees assessed in connection with the variable product. Sales charges, expenses and fees, which are determined by the variable product issuers, will vary and will lower the total return to the contract or policy owner. |
| 1 | The S&P 500 Index is an unmanaged index generally considered representative of the U.S. stock market. Source: Lipper, Inc. |
| 2 | The Value Line Convertible Index is an equally-weighted index of the larger convertibles, representing 90% of the U.S. convertible securities market. Source: Mellon Analytical Solutions, Inc. |
Index returns assume reinvestment of dividends and do not reflect deduction of fees and expenses. It is not possible to invest directly in an index.
Q. What factors influenced performance over the semiannual period?
A. Pursuant to our goal of accessing equity market returns with lower volatility over a full market cycle, the Portfolio is managed in a risk-aware manner. During the semiannual period, the Portfolio participated in equity upside and provided periods of downside resilience, but underperformed the S&P 500 return of 9.49% over the complete period.
In terms of sector performance, the Portfolio’s relative selection within the materials sector detracted the most from performance in the semiannual period. We continue to forecast benefits from strong demand in emerging markets and sustained global reflation efforts, which should support commodity prices.
The Portfolio’s overweight allocation toward the information technology sector contributed to relative performance. We continue to hold conviction in this sector overall due to its high cash flows, strong balance sheets and attractive valuations. The sector also benefits from many long-term themes we have identified, including the demand for the latest connectivity devices, the need for information and entertainment, as well as productivity enhancement in a low-growth economy.
The Portfolio’s relative security selection within the energy sector hampered performance. Despite the weakness in the period, we have a favorable long-term view of the opportunities in the energy sector, particularly as global stimulus and liquidity
| | | | |
| 4 | | CALAMOS GROWTH AND INCOME PORTFOLIO SEMIANNUAL REPORT | | |
Investment Team Discussion
from the world’s central banks persists. We believe the portfolio’s holdings within the sector will benefit from long-term secular themes, such as strong global demand for energy resources, especially within developing economies.
The Portfolio’s underweight to the more defensive utilities sector contributed to relative performance during the period as it was among the weakest performing sector within the S&P 500. We believe other sectors present more attractive growth opportunities and a better combination of risk and reward.
Q. How is the Portfolio positioned?
A. We continue to favor businesses with globally diversified revenues and compelling growth opportunities. After a strong and rapid market advance during the first several months of the period, we believe an enhanced focus on risk management and valuation sensitivity is appropriate. As such, during the period we increased valuation sensitivity and lessened the cyclical exposure in the Portfolio, particularly in sectors such as industrials and materials. We continue to believe reflation exposure will provide good long-term opportunities, given signals from the Federal Reserve and other global central banks that they would remain accommodative and provide a backstop for the markets, if necessary.
With respect to sector positioning, the portfolio is currently positioned with large absolute allocations to the information technology and health care sectors. Details regarding our positioning in technology have been discussed above. Within health care, we favor more innovative companies with identifiable secular demand trends and those relatively less affected by government regulation.
Generally, convertible securities have been attractively valued in the market over the period with a small discount to theoretical value. In addition, in an environment of intermittent volatility, we favored convertibles’ ability to capture a significant degree of underlying equity upside while also providing a measure of downside resilience. With respect to credit quality, we favor a relatively higher quality portfolio.
Q. What is your outlook for growth equities and the Portfolio?
A. The persistent global macroeconomic concerns and periods of intermittent volatility in recent months have particularly focused our attention on the fundamental and risk/reward attributes of the equity and equity-sensitive securities in the Portfolio. Generally speaking, we believe investors are not paying adequately for future corporate growth potential, and this continues to create opportunities for equity exposure. Perhaps a reflection of widespread investor skepticism about future growth prospects, our active and risk-aware approach is uncovering equities and equity-sensitive securities with attractive fundamentals, reasonable valuations and an appropriate blend of upside capture and downside resilience.
Investment Team Discussion
We are favoring large multinational companies with well-diversified revenues, solid balance sheets and global growth opportunities with respect to both secular and cyclical trends. We are focused on opportunities supported by long-term secular trends such as the dynamics of the global emerging middle class, as well as productivity enhancement solutions in an era of low global growth. Specifically, we are favoring equity and equity-sensitive investments in sectors such as technology and health care, where we continue to invest in leading businesses at reasonable valuations. Conversely, we are generally avoiding specific companies most exposed to government expenditures and onerous regulations.
| | | | |
| 6 | | CALAMOS GROWTH AND INCOME PORTFOLIO SEMIANNUAL REPORT | | |
Expense Overview
EXPENSE OVERVIEW
As a contract or policy owner, you incur certain costs. Because the Portfolio is a funding vehicle for annuities, policies and eligible plans, you may also incur sales charges and other fees related to your annuity, policy or eligible plan. In addition, the Portfolio incurs transaction costs and ongoing costs, including management fees, and other fund expenses, such as audit, legal and custodian fees.
The examples in this report are based on an investment of $1,000 made at the beginning of the period and held for the entire period from January 1, 2012 to June 30, 2012. It is intended to help you understand the ongoing cost associated with investing in the Portfolio and to compare these costs with the ongoing costs of investing in other mutual funds.
There are two parts to the examples table:
Actual
In this part of the table, you’ll see the actual expenses you would have paid on a $1,000 investment made at the beginning of the period and held for the entire period from January 1, 2012 to June 30, 2012, the period covered by this report. This table also shows the actual returns, after expenses, you would have earned during that time. This table can help you estimate your own expenses. For example, if you invested $8,600 in the Portfolio, simply divide $8,600 by $1,000, then multiply that result by the figure in the “Actual Expenses per $1,000” row. In this example, you would multiply 8.6 by the figure.
Hypothetical
In this part of the table, you’ll see the hypothetical expenses you would have paid on a $1,000 investment from January 1, 2012 to June 30, 2012 and the hypothetical returns,after expenses, you would have earned during that time. The Securities and Exchange Commission (SEC) hasestablished the guidelines for this table, including the assumed 5% annual rate of return before expenses, which is what you’ll see in the table. Note that this table will not help you determine your own expenses, but will help you compare expenses of the Portfolio to the expenses of other mutual funds.
Please note that the expenses shown in the table are meant to highlight your ongoing costs only and do not include any transactional costs, such as sales charges (loads), redemption fees or exchange fees. Therefore, the second line of the table is useful in comparing ongoing costs only and will not help you determine the relative total costs of owning different funds. In addition, if these transactions costs were included, your costs would have been higher.
Expense Overview
| | | | |
| The actual and hypothetical examples assume a $1,000 investment at the beginning of the period, January 1, 2012 and held through June 30, 2012 | |
Actual Expenses per $1,000* | | $ | 7.17 | |
Actual – Ending Balance | | $ | 1,044.90 | |
| | | | |
Hypothetical Expenses per $1,000* | | $ | 7.07 | |
Hypothetical – Ending Value | | $ | 1,017.85 | |
| | | | |
Annualized expense ratio | | | 1.41% | |
| * | Expenses are equal to the Portfolio’s annualized expense ratio multiplied by the average account value over the period, multiplied by 182/366. |
| | | | |
| 8 | | CALAMOS GROWTH AND INCOME PORTFOLIO SEMIANNUAL REPORT | | |
Schedule of Investments June 30, 2012 (Unaudited)
| | | | | | | | | | |
PRINCIPAL AMOUNT | | | | | | | VALUE | |
| | | | | | | | | | |
| | CONVERTIBLE BONDS (30.9%) | |
| | | | | | Consumer Discretionary (3.0%) | |
| | 140,000 | | | | | International Game Technology 3.250%, 05/01/14 | | $ | 155,225 | |
| | 160,000 | | | | | Liberty Media Corp. (Viacom, CBS Corp. - Class B)§ 3.250%, 03/15/31 | | | 140,600 | |
| | 201,000 | | | | | Omnicom Group, Inc. 0.000%, 07/01/38 | | | 217,583 | |
| | 290,000 | | | | | Priceline.com, Inc.* 1.000%, 03/15/18 | | | 307,037 | |
| | | | | | | | | | |
| | | | | | 820,445 | |
| | | | | | | | | | |
| | | | | | Energy (1.7%) | |
| | 130,000 | | | | | Chesapeake Energy Corp. 2.500%, 05/15/37 | | | 111,963 | |
| | 150,000 | | | | | Helix Energy Solutions Group, Inc. 3.250%, 03/15/32 | | | 156,562 | |
| | | | | | Technip, SA | |
| | 110,900 | | | EUR | | 0.250%, 01/01/17 | | | 150,870 | |
| | 27,100 | | | EUR | | 0.500%, 01/01/16 | | | 33,746 | |
| | | | | | | | | | |
| | | | | | 453,141 | |
| | | | | | | | | | |
| | | | | | Financials (1.2%) | |
| | 110,000 | | | | | Leucadia National Corp. 3.750%, 04/15/14 | | | 120,725 | |
| | 250,000 | | | SGD | | Temasek Financial, Ltd. (Standard Chartered, PLC)§ 0.000%, 10/24/14 | | | 204,757 | |
| | | | | | | | | | |
| | | | | | 325,482 | |
| | | | | | | | | | |
| | | | | | Health Care (7.0%) | |
| | 342,000 | | | | | Amgen, Inc. 0.375%, 02/01/13 | | | 357,390 | |
| | 315,000 | | | | | Gilead Sciences, Inc. 1.625%, 05/01/16 | | | 409,106 | |
| | 125,000 | | | | | Hologic, Inc.‡ 2.000%, 12/15/37 | | | 132,188 | |
| | 150,000 | | | | | Medicines Company* 1.375%, 06/01/17 | | | 153,937 | |
| | | | | | Medicis Pharmaceutical | |
| | 138,000 | | | | | 1.375%, 06/01/17 | | | 137,483 | |
| | 50,000 | | | | | 2.500%, 06/04/32 | | | 62,625 | |
| | 140,000 | | | | | Salix Pharmaceuticals, Ltd.* 1.500%, 03/15/19 | | | 150,500 | |
| | 240,000 | | | | | Shire, PLC 2.750%, 05/09/14 | | | 272,892 | |
| | 200,000 | | | | | Teva Pharmaceutical Industries, Ltd. 0.250%, 02/01/26 | | | 209,500 | |
| | | | | | | | | | |
| | | | | | 1,885,621 | |
| | | | | | | | | | |
| | | | | | | | | | |
PRINCIPAL AMOUNT | | | | | | | VALUE | |
| | | | | | | | | | |
| | | | | | | | | | |
| | | | | | Industrials (1.8%) | |
| | 190,000 | | | | | AGCO Corp. 1.250%, 12/15/36 | | $ | 238,925 | |
| | 250,000 | | | | | Siemens AG 1.050%, 08/16/17 | | | 240,625 | |
| | | | | | | | | | |
| | | | | | 479,550 | |
| | | | | | | | | | |
| | | | | | Information Technology (12.3%) | |
| | 230,000 | | | | | Electronic Arts, Inc.* 0.750%, 07/15/16 | | | 202,400 | |
| | 475,000 | | | | | EMC Corp. 1.750%, 12/01/13 | | | 775,437 | |
| | 330,000 | | | | | Intel Corp. 3.250%, 08/01/39 | | | 445,912 | |
| | | | | | Lam Research Corp. | |
| | 190,000 | | | | | 0.500%, 05/15/16 | | | 182,875 | |
| | 169,000 | | | | | 1.250%, 05/15/18 | | | 167,521 | |
| | 130,000 | | | | | Linear Technology Corp. 3.000%, 05/01/27 | | | 134,875 | |
| | 275,000 | | | | | Microsoft Corp.* 0.000%, 06/15/13 | | | 293,219 | |
| | 360,000 | | | | | Nuance Communications, Inc.* 2.750%, 11/01/31 | | | 399,150 | |
| | 190,000 | | | | | SanDisk Corp. 1.500%, 08/15/17 | | | 196,413 | |
| | 240,000 | | | | | Symantec Corp. 1.000%, 06/15/13 | | | 246,900 | |
| | 275,000 | | | | | TIBCO Software, Inc.* 2.250%, 05/01/32 | | | 272,594 | |
| | | | | | | | | | |
| | | | | | 3,317,296 | |
| | | | | | | | | | |
| | | | | | Materials (3.9%) | |
| | 330,000 | | | | | Goldcorp, Inc. 2.000%, 08/01/14 | | | 373,312 | |
| | | | | | Newmont Mining Corp. | |
| | 210,000 | | | | | 1.250%, 07/15/14 | | | 261,450 | |
| | 200,000 | | | | | 1.625%, 07/15/17 | | | 266,250 | |
| | 135,000 | | | | | Royal Gold, Inc. 2.875%, 06/15/19 | | | 142,088 | |
| | | | | | | | | | |
| | | | | | 1,043,100 | |
| | | | | | | | | | |
| | | | | | TOTAL CONVERTIBLE BONDS (Cost $8,008,935) | | | 8,324,635 | |
| | | | | | | | | | |
| | | | | | | | | | |
| | SYNTHETIC CONVERTIBLE SECURITIES (15.5%) | |
| | Corporate Bonds (5.9%) | |
| | | | | | Consumer Discretionary (2.8%) | |
| | 140,000 | | | | | Dish Network Corp.* 5.875%, 07/15/22 | | | 142,100 | |
| | 140,000 | | | | | Expedia, Inc. 5.950%, 08/15/20 | | | 147,009 | |
| | 140,000 | | | | | Gap, Inc. 5.950%, 04/12/21 | | | 145,458 | |
| | | | | | |
| See accompanying Notes to Schedule of Investments | | | | | 9 | |
Schedule of Investments June 30, 2012 (Unaudited)
| | | | | | | | | | |
PRINCIPAL AMOUNT | | | | | | | VALUE | |
| | | | | | | | | | |
| | 67,000 | | | | | Hanesbrands, Inc. 6.375%, 12/15/20 | | $ | 70,852 | |
| | 100,000 | | | | | J.C. Penney Company, Inc. 7.650%, 08/15/16 | | | 101,375 | |
| | 140,000 | | | | | Limited Brands, Inc. 5.625%, 02/15/22 | | | 144,900 | |
| | | | | | | | | | |
| | | | | | 751,694 | |
| | | | | | | | | | |
| | | | | | Energy (1.3%) | |
| | 150,000 | | | | | Continental Resources, Inc.* 5.000%, 09/15/22 | | | 152,437 | |
| | 65,000 | | | | | Noble Energy, Inc. 4.150%, 12/15/21 | | | 68,534 | |
| | 125,000 | | | | | Oil States International, Inc. 6.500%, 06/01/19 | | | 130,625 | |
| | | | | | | | | | |
| | | | | | 351,596 | |
| | | | | | | | | | |
| | | | | | Financials (0.4%) | |
| | 35,000 | | | | | Legg Mason, Inc.* 5.500%, 05/21/19 | | | 35,463 | |
| | 70,000 | | | | | Neuberger Berman Group LLC* 5.875%, 03/15/22 | | | 73,500 | |
| | | | | | | | | | |
| | | | | | 108,963 | |
| | | | | | | | | | |
| | | | | | Health Care (0.5%) | |
| | 65,000 | | | | | Endo Pharmaceuticals Holdings, Inc. 7.000%, 07/15/19 | | | 71,012 | |
| | 65,000 | | | | | Mylan, Inc.* 6.000%, 11/15/18 | | | 68,738 | |
| | | | | | | | | | |
| | | | | | 139,750 | |
| | | | | | | | | | |
| | | | | | Industrials (0.2%) | |
| | 59,000 | | | | | Actuant Corp.* 5.625%, 06/15/22 | | | 60,918 | |
| | | | | | | | | | |
| | | | | | Information Technology (0.6%) | |
| | 75,000 | | | | | Anixter, Inc. 5.625%, 05/01/19 | | | 77,812 | |
| | 65,000 | | | | | Seagate Technology 6.875%, 05/01/20 | | | 70,200 | |
| | | | | | | | | | |
| | | | | | 148,012 | |
| | | | | | | | | | |
| | | | | | Materials (0.1%) | |
| | 30,000 | | | | | Ball Corp. 5.000%, 03/15/22 | | | 31,238 | |
| | | | | | | | | | |
| | | TOTAL CORPORATE BONDS | | | 1,592,171 | |
| | | | | | | | | | |
| | Sovereign Bonds (9.5%) | |
| | 57,000 | | | BRL | | Federative Republic of Brazil 10.000%, 01/01/14 | | | 291,456 | |
| | | | | | Government of Canada | |
| | 425,000 | | | CAD | | 2.000%, 12/01/14 | | | 426,678 | |
| | 110,000 | | | CAD | | 2.000%, 06/01/16 | | | 111,290 | |
| | | | | | | | | | |
PRINCIPAL AMOUNT | | | | | | | VALUE | |
| | | | | | | | | | |
| | | | | | Government of New Zealand | |
| | 170,000 | | | NZD | | 6.000%, 04/15/15 | | $ | 148,839 | |
| | 160,000 | | | NZD | | 6.500%, 04/15/13 | | | 132,142 | |
| | | | | | Government of Singapore | |
| | 210,000 | | | SGD | | 1.125%, 04/01/16 | | | 171,255 | |
| | 165,000 | | | SGD | | 1.375%, 10/01/14 | | | 133,822 | |
| | 128,000 | | | SGD | | 2.375%, 04/01/17 | | | 110,311 | |
| | | | | | Kingdom of Norway | |
| | 1,400,000 | | | NOK | | 4.250%, 05/19/17 | | | 265,966 | |
| | 650,000 | | | NOK | | 5.000%, 05/15/15 | | | 120,501 | |
| | 635,000 | | | NOK | | 6.500%, 05/15/13 | | | 111,369 | |
| | 3,425,000 | | | SEK | | Kingdom of Sweden 3.000%, 07/12/16 | | | 531,620 | |
| | | | | | | | | | |
| | | TOTAL SOVEREIGN BONDS | | | 2,555,249 | |
| | | | | | | | | | |
NUMBER OF
CONTRACTS | | | | | | | VALUE | |
| | Purchased Options (0.1%)# | |
| | | | | | Energy (0.0%) | |
| | 42 | | | | | Chesapeake Energy Corp. Call, 01/19/13, Strike $30.00 | | | 1,302 | |
| | | | | | | | | | |
| | | | | | Information Technology (0.1%) | |
| | 4 | | | | | Apple, Inc. Call, 01/19/13, Strike $500.00 | | | 42,470 | |
| | | | | | | | | | |
| | | | | | TOTAL PURCHASED OPTIONS | | | 43,772 | |
| | | | | | | | | | |
| | | | | | TOTAL SYNTHETIC CONVERTIBLE SECURITIES (Cost $4,082,865) | | | 4,191,192 | |
| | | | | | | | | | |
| | | | | | | | | | |
NUMBER OF
SHARES | | | | | | | VALUE | |
| | CONVERTIBLE PREFERRED STOCKS (6.2%) | |
| | | | | | Energy (3.2%) | |
| | 9,500 | | | | | Apache Corp. 6.000% | | | 477,280 | |
| | 450 | | | | | Chesapeake Energy Corp.* 5.750% | | | 385,537 | |
| | | | | | | | | | |
| | | | | | | | | 862,817 | |
| | | | | | | | | | |
| | | | | | Financials (1.9%) | |
| | 4,900 | | | | | Affiliated Managers Group, Inc. 5.150% | | | 212,844 | |
| | 270 | | | | | Wells Fargo & Company 7.500% | | | 303,750 | |
| | | | | | | | | | |
| | | | | | | | | 516,594 | |
| | | | | | | | | | |
| | | | | | Industrials (1.1%) | |
| | 5,300 | | | | | United Technologies Corp. 7.500% | | | 279,257 | |
| | | | | | | | | | |
| | | | | | TOTAL CONVERTIBLE
PREFERRED STOCKS (Cost $1,695,020) | | | 1,658,668 | |
| | | | | | | | | | |
| | | | | | | | | | |
| | | | |
| 10 | | CALAMOS GROWTH AND INCOME PORTFOLIO SEMIANNUAL REPORT | | See accompanying Notes to Schedule of Investments |
Schedule of Investments June 30, 2012 (Unaudited)
| | | | | | | | | | |
NUMBER OF
SHARES | | | | | | | VALUE | |
| | | | | | | | | | |
| | COMMON STOCKS (44.0%) | |
| | | | | | Consumer Discretionary (1.8%) | |
| | 2,100 | | | | | Amazon.com, Inc.#~ | | $ | 479,535 | |
| | | | | | | | | | |
| | | | | | Consumer Staples (3.8%) | |
| | 8,850 | | | | | Coca-Cola Company~ | | | 691,981 | |
| | 4,125 | | | | | Mead Johnson Nutrition Company | | | 332,104 | |
| | | | | | | | | | |
| | | | | | | | | 1,024,085 | |
| | | | | | | | | | |
| | | | | | Energy (4.1%) | |
| | 6,500 | | | | | Helmerich & Payne, Inc. | | | 282,620 | |
| | 2,600 | | | | | National Oilwell Varco, Inc. | | | 167,544 | |
| | 3,100 | | | | | Occidental Petroleum Corp. | | | 265,887 | |
| | 5,900 | | | | | Schlumberger, Ltd. | | | 382,969 | |
| | | | | | | | | | |
| | | | | | | | | 1,099,020 | |
| | | | | | | | | | |
| | | | | | Financials (2.8%) | |
| | 2,500 | | | | | Franklin Resources, Inc. | | | 277,475 | |
| | 7,500 | | | | | T. Rowe Price Group, Inc. | | | 472,200 | |
| | | | | | | | | | |
| | | | | | | | | 749,675 | |
| | | | | | | | | | |
| | | | | | Health Care (5.6%) | |
| | 2,900 | | | | | Biogen Idec, Inc.# | | | 418,702 | |
| | 4,400 | | | | | Johnson & Johnson~ | | | 297,264 | |
| | 11,250 | | | | | Merck & Company, Inc. | | | 469,688 | |
| | 2,200 | | | DKK | | Novo Nordisk, A/S - Class B | | | 319,081 | |
| | | | | | | | | | |
| | | | | | | | | 1,504,735 | |
| | | | | | | | | | |
| | | | | | Industrials (1.9%) | |
| | 5,000 | | | | | Dover Corp. | | | 268,050 | |
| | 6,150 | | | | | Eaton Corp. | | | 243,725 | |
| | | | | | | | | | |
| | | | | | | | | 511,775 | |
| | | | | | | | | | |
| | | | | | Information Technology (20.0%) | |
| | 7,250 | | | | | Accenture, PLC - Class A | | | 435,652 | |
| | 17,000 | | | | | Cisco Systems, Inc. | | | 291,890 | |
| | 16,500 | | | | | Dell, Inc.# | | | 206,580 | |
| | 19,175 | | | | | eBay, Inc.#~ | | | 805,542 | |
| | 5,500 | | | | | Intel Corp. | | | 146,575 | |
| | 725 | | | | | MasterCard, Inc. - Class A | | | 311,830 | |
| | 19,405 | | | | | Microsoft Corp. | | | 593,599 | |
| | 27,400 | | | | | Oracle Corp. | | | 813,780 | |
| | 12,500 | | | | | QUALCOMM, Inc. | | | 696,000 | |
| | 4,900 | | | | | SAP, AG | | | 290,864 | |
| | 6,700 | | | | | Teradata Corp.# | | | 482,467 | |
| | 19,200 | | | | | Yahoo!, Inc.# | | | 303,936 | |
| | | | | | | | | | |
| | | | | | | | | 5,378,715 | |
| | | | | | | | | | |
| | | | | | | | | | |
NUMBER OF
SHARES | | | | | | | VALUE | |
| | | | | | | | | | |
| | | | | | | | | | |
| | | | | | Materials (4.0%) | |
| | 10,500 | | | | | Barrick Gold Corp. | | $ | 394,485 | |
| | 3,100 | | | | | Cliffs Natural Resources, Inc. | | | 152,799 | |
| | 2,650 | | | | | Mosaic Company | | | 145,114 | |
| | 25,750 | | | | | Yamana Gold, Inc. | | | 396,550 | |
| | | | | | | | | | |
| | | | | | | | | 1,088,948 | |
| | | | | | | | | | |
| | | | | | TOTAL COMMON STOCKS (Cost $9,890,355) | | | 11,836,488 | |
| | | | | | | | | | |
| | | | | | | | | | |
NUMBER OF
CONTRACTS | | | | | | | VALUE | |
| | PURCHASED OPTION (0.0%)# | |
| | | | | | Consumer Discretionary (0.0%) | |
| | 20 | | | | | Amazon.com, Inc.
Put, 07/21/12, Strike $140.00
(Cost $6,666) | | | 170 | |
| | | | | | | | | | |
| | | | | | | | | | |
NUMBER OF
SHARES | | | | | | | VALUE | |
| | SHORT TERM INVESTMENT (3.5%) | |
| | 931,871 | | | | | Fidelity Prime Money Market Fund - Institutional Class (Cost $931,871) | | | 931,871 | |
| | | | | | | | | | |
| | | | | | | | | | |
| TOTAL INVESTMENTS (100.1%)
(Cost $24,615,712) | | | 26,943,024 | |
| | | | | | | | | | |
| |
| | LIABILITIES, LESS OTHER ASSETS (-0.1%) | | | (37,295 | ) |
| | | | | | | | | | |
| |
| | NET ASSETS (100.0%) | | $ | 26,905,729 | |
| | | | | | | | | | |
FORWARD FOREIGN CURRENCY CONTRACTS
| | | | | | | | | | | | | | | | |
| COUNTERPARTY | | SHORT CONTRACTS | | SETTLEMENT DATE | | LOCAL CURRENCY | | | CURRENT VALUE | | | UNREALIZED GAIN/LOSS | |
| Northern Trust Company | | British Pound Sterling | | 07/19/12 | | | 229,000 | | | $ | 358,634 | | | $ | 4,483 | |
| Citibank N.A. | | Danish Krone | | 07/19/12 | | | 1,664,000 | | | | 283,358 | | | | 9,512 | |
| UBS AG | | European Monetary Unit | | 07/19/12 | | | 490,000 | | | | 620,173 | | | | 20,917 | |
| Barclays Bank PLC | | Swiss Franc | | 07/19/12 | | | 258,000 | | | | 271,921 | | | | 8,748 | |
| | | | | | | | | | | | | | | | |
| | | | | | | | | | | | | | $ | 43,660 | |
| | | | | | | | | | | | | | | | |
| | | | | | | | | | | | | | | | |
| COUNTERPARTY | | LONG CONTRACTS | | SETTLEMENT DATE | | LOCAL CURRENCY | | | CURRENT VALUE | | | UNREALIZED GAIN/LOSS | |
| Citibank N.A. | | Swiss Franc | | 07/19/12 | | | 109,000 | | | $ | 114,881 | | | $ | (1,032 | ) |
| Credit Suisse | | Swiss Franc | | 07/19/12 | | | 59,000 | | | | 62,184 | | | | (168 | ) |
| Credit Suisse | | European Monetary Unit | | 07/19/12 | | | 27,000 | | | | 34,173 | | | | (795 | ) |
| UBS AG | | British Pound Sterling | | 07/19/12 | | | 12,000 | | | | 18,793 | | | | (556 | ) |
| | | | | | | | | | | | | | | | |
| | | | | | | | | | | | | | $ | (2,551 | ) |
| | | | | | | | | | | | | | | | |
| | | | | | |
| See accompanying Notes to Schedule of Investments | | | | | 11 | |
Schedule of Investments June 30, 2012 (Unaudited)
NOTES TO SCHEDULE OF INVESTMENTS
| § | Securities exchangeable or convertible into securities of one or more entities that are different than the issuer. Each entity is identified in the parenthetical. |
| * | Securities issued and sold pursuant to a Rule 144A transaction are excepted from the registration requirement of the Securities Act of 1933, as amended. These securities may only be sold to qualified institutional buyers (“QIBs”), such as the fund. Any resale of these securities must generally be effected through a sale that is registered under the Act or otherwise exempted from such registration requirements. At June 30, 2012, the value of 144A securities that could not be exchanged to the registered form is $2,306,612 or 8.6% of net assets. |
| ‡ | Variable rate or step bond security. The rate shown is the rate in effect at June 30, 2012. |
| # | Non-income producing security. |
| ~ | Security, or portion of security, is segregated as collateral (or potential collateral for future transactions) for written options. The aggregate value of such securities is $551,616. |
FOREIGN CURRENCY ABBREVIATIONS
| | |
| BRL | | Brazilian Real |
| CAD | | Canadian Dollar |
| DKK | | Danish Krone |
| EUR | | European Monetary Unit |
| NOK | | Norwegian Krone |
| NZD | | New Zealand Dollar |
| SEK | | Swedish Krona |
| SGD | | Singapore Dollar |
Note: Value for securities denominated in foreign currencies is shown in U.S. dollars. The principal amount for such securities is shown in the respective foreign currency. The date on options represents the expiration date of the option contract. The option contract may be exercised at any date on or before the date shown.
| | | | |
| 12 | | CALAMOS GROWTH AND INCOME PORTFOLIO SEMIANNUAL REPORT | | See accompanying Notes to Financial Statements |
Statement of Assets and Liabilities June 30, 2012 (Unaudited)
| | | | |
ASSETS | | | | |
Investments in securities, at value (cost $24,615,712) | | $ | 26,943,024 | |
Unrealized appreciation on forward foreign currency contracts | | | 43,934 | |
Receivables: | | | | |
Accrued interest and dividends | | | 105,284 | |
Investments sold | | | 22,051 | |
Portfolio shares sold | | | 318 | |
Prepaid expenses | | | 2,124 | |
Other assets | | | 63,668 | |
| |
Total assets | | | 27,180,403 | |
| |
LIABILITIES | | | | |
Unrealized depreciation on forward foreign currency contracts | | | 2,825 | |
Payables: | | | | |
Investments purchased | | | 73,428 | |
Portfolio shares redeemed | | | 54,880 | |
Affiliates: | | | | |
Investment advisory fees | | | 16,353 | |
Deferred compensation to trustees | | | 63,668 | |
Financial accounting fees | | | 250 | |
Trustees’ fees and officer compensation | | | 179 | |
Other accounts payable and accrued liabilities | | | 63,091 | |
| |
Total liabilities | | | 274,674 | |
| |
NET ASSETS | | $ | 26,905,729 | |
| |
COMPOSITION OF NET ASSETS | | | | |
Paid in capital | | $ | 24,449,166 | |
Undistributed net investment income (loss) | | | (352,282 | ) |
Accumulated net realized gain (loss) on investments, foreign currency transactions and written options | | | 440,712 | |
Unrealized appreciation (depreciation) of investments and foreign currency translations | | | 2,368,133 | |
| |
NET ASSETS | | $ | 26,905,729 | |
| |
Shares outstanding (no par value; unlimited number of shares authorized) | | | 1,940,983 | |
Net asset value and redemption price per share | | $ | 13.86 | |
| |
| | | | | | |
| See accompanying Notes to Financial Statements | | | | | 13 | |
Statement of Operations Six Months Ended June 30, 2012 (Unaudited)
| | | | |
INVESTMENT INCOME | | | | |
Interest | | $ | 215,446 | |
Dividends | | | 155,603 | |
Dividend taxes withheld | | | (2,717 | ) |
| |
Total investment income | | | 368,332 | |
| |
| |
EXPENSES | | | | |
Investment advisory fees | | | 102,256 | |
Audit fees | | | 28,152 | |
Legal fees | | | 18,457 | |
Printing and mailing fees | | | 16,388 | |
Accounting fees | | | 7,382 | |
Trustees’ fees and officer compensation | | | 7,082 | |
Custodian fees | | | 5,949 | |
Transfer agent fees | | | 3,317 | |
Financial accounting fees | | | 1,556 | |
Other | | | 1,833 | |
| |
Total expenses | | | 192,372 | |
| |
NET INVESTMENT INCOME (LOSS) | | | 175,960 | |
| |
| |
REALIZED AND UNREALIZED GAIN (LOSS) | | | | |
Net realized gain (loss) from: | | | | |
Investments, excluding purchased options | | | 475,761 | |
Purchased options | | | 115,914 | |
Foreign currency transactions | | | 29,646 | |
Written options | | | (6,308 | ) |
Change in net unrealized appreciation/(depreciation) on: | | | | |
Investments, excluding purchased options | | | 363,802 | |
Purchased options | | | 22 | |
Foreign currency translations | | | 1,385 | |
Written options | | | (35,903 | ) |
| |
NET GAIN (LOSS) | | | 944,319 | |
| |
NET INCREASE (DECREASE) IN NET ASSETS RESULTING FROM OPERATIONS | | $ | 1,120,279 | |
| |
| | | | |
| 14 | | CALAMOS GROWTH AND INCOME PORTFOLIO SEMIANNUAL REPORT | | See accompanying Notes to Financial Statements |
Statements of Changes in Net Assets
| | | | | | | | |
| | | (UNAUDITED)
SIX MONTHS
ENDED
JUNE 30,
2012 | | | YEAR ENDED DECEMBER 31, 2011 | |
OPERATIONS | | | | | | | | |
Net investment income (loss) | | $ | 175,960 | | | $ | 340,017 | |
Net realized gain (loss) | | | 615,013 | | | | 2,589,567 | |
Change in unrealized appreciation/(depreciation) | | | 329,306 | | | | (3,393,268 | ) |
| |
Net increase (decrease) in net assets resulting from operations | | | 1,120,279 | | | | (463,684 | ) |
| |
| | |
DISTRIBUTIONS TO SHAREHOLDERS | | | | | | | | |
Net investment income | | | (300,032 | ) | | | (400,007 | ) |
| |
Total distributions | | | (300,032 | ) | | | (400,007 | ) |
| |
| | |
CAPITAL SHARE TRANSACTIONS | | | | | | | | |
Issued | | | 2,829,477 | | | | 4,596,499 | |
Issued in reinvestment of distributions | | | 300,032 | | | | 400,007 | |
Redeemed | | | (2,149,271 | ) | | | (5,601,864 | ) |
| |
Net increase (decrease) in net assets from capital share transactions | | | 980,238 | | | | (605,358 | ) |
| |
TOTAL INCREASE (DECREASE) IN NET ASSETS | | | 1,800,485 | | | | (1,469,049 | ) |
| |
| | |
NET ASSETS | | | | | | | | |
Beginning of period | | $ | 25,105,244 | | | $ | 26,574,293 | |
| |
End of period | | | 26,905,729 | | | | 25,105,244 | |
| |
Undistributed net investment income (loss) | | $ | (352,282 | ) | | $ | (228,210 | ) |
| | |
CAPITAL SHARE TRANSACTIONS | | | | | | | | |
Shares issued | | | 199,518 | | | | 324,893 | |
Shares issued in reinvestment of distributions | | | 21,196 | | | | 29,512 | |
Shares redeemed | | | (151,963 | ) | | | (396,387 | ) |
| |
Net increase (decrease) in capital shares outstanding | | | 68,751 | | | | (41,982 | ) |
| |
| | | | | | |
| See accompanying Notes to Financial Statements | | | | | 15 | |
Notes to Financial Statements (Unaudited)
Note 1 – Organization and Significant Accounting Policies
Organization. CALAMOS ADVISORS TRUST (the “Trust”), a Massachusetts business trust organized February 17, 1999, consists of a single series, Calamos Growth and Income Portfolio (the “Portfolio”), and commenced operations on May 19, 1999. The Trust currently offers the Portfolio’s shares to certain life insurance companies for allocation to certain separate accounts established for the purpose of funding qualified and non-qualified variable annuity contracts and variable life insurance contracts. The Portfolio seeks high long-term total return through growth and current income.
Portfolio Valuation. The valuation of the Portfolio’s investments is in accordance with policies and procedures adopted by and under the ultimate supervision of the board of trustees.
Portfolio securities that are traded on U.S. securities exchanges, except option securities, are valued at the last current reported sales price at the time the Portfolio determines its net asset value (“NAV”). Securities traded in the over-the-counter market and quoted on The NASDAQ Stock Market are valued at the NASDAQ Official Closing Price, as determined by NASDAQ, or lacking a NASDAQ Official Closing Price, the last current reported sale price on NASDAQ at the time the Portfolio determines its NAV.
When a last sale or closing price is not available, equity securities, other than option securities, that are traded on a U.S. securities exchange and other equity securities traded in the over-the-counter market are valued at the mean between the most recent bid and asked quotations in accordance with guidelines adopted by the board of trustees. Each option security traded on a U.S. securities exchange is valued at the mid-point of the consolidated bid/ask quote for the option security, also in accordance with guidelines adopted by the board of trustees. Each over-the-counter option that is not traded through the Options Clearing Corporation is valued based on a quotation provided by the counterparty to such option under the ultimate supervision of the board of trustees.
Fixed income securities, certain convertible preferred securities, and non-exchange traded derivatives are normally valued by independent pricing services or by dealers or brokers who make markets in such securities. Valuations of such fixed income securities, certain convertible preferred securities, and non-exchange traded derivatives consider yield or price of equivalent securities of comparable quality, coupon rate, maturity, type of issue, trading characteristics and other market data and do not rely exclusively upon exchange or over-the-counter prices.
Trading on European and Far Eastern exchanges and over-the-counter markets is typically completed at various times before the close of business on each day on which the New York Stock Exchange (“NYSE”) is open. Each security trading on these exchanges or over-the-counter markets may be valued utilizing a systematic fair valuation model provided by an independent pricing service approved by the board of trustees. The valuation of each security that meets certain criteria in relation to the valuation model is systematically adjusted to reflect the impact of movement in the U.S. market after the foreign markets close. Securities that do not meet the criteria, or that are principally traded in other foreign markets, are valued as of the last reported sale price at the time the Portfolio determines its NAV, or when reliable market prices or quotations are not readily available, at the mean between the most recent bid and asked quotations as of the close of the appropriate exchange or other designated time. Trading of foreign securities may not take place on every NYSE business day. In addition, trading may take place in various foreign markets on Saturdays or on other days when the NYSE is not open and on which the Portfolio’s NAV is not calculated.
If the pricing committee determines that the valuation of a security in accordance with the methods described above is not reflective of a fair value for such security, the security is valued at a fair value by the pricing committee, under the ultimate supervision of the board of trustees, following the guidelines and/or procedures adopted by the board of trustees.
The Portfolio also may use fair value pricing, pursuant to guidelines adopted by the board of trustees and under the ultimate supervision of the board of trustees, if trading in the security is halted or if the value of a security it holds is materially affected by events occurring before the Portfolio’s pricing time but after the close of the primary market or exchange on which the security is listed. Those procedures may utilize valuations furnished by pricing services approved by the board of trustees, which may be based on market transactions for comparable securities and various relationships between securities that are generally recognized by institutional traders, a computerized matrix system, or appraisals derived from information concerning the securities or similar securities received from recognized dealers in those securities.
When fair value pricing of securities is employed, the prices of securities used by the Portfolio to calculate its NAV may differ from market quotations or official closing prices. In light of the judgment involved in fair valuations, there can be no assurance that a fair value assigned to a particular security is accurate.
| | | | |
| 16 | | CALAMOS GROWTH AND INCOME PORTFOLIO SEMIANNUAL REPORT | | |
Notes to Financial Statements (Unaudited)
Investment Transactions. Investment transactions are recorded on a trade date basis. Net realized gains and losses from investment transactions are reported on an identified cost basis. Interest income is recognized using the accrual method and includes accretion of original issue and market discount and amortization of premium. Dividend income is recognized on the ex-dividend date, except that certain dividends from foreign securities are recorded as soon as the information becomes available after the ex-dividend date.
Foreign Currency Translation. Values of investments and other assets and liabilities denominated in foreign currencies are translated into U.S. dollars using a rate quoted by a major bank or dealer in the particular currency market, as reported by a recognized quotation dissemination service.
The Portfolio does not isolate that portion of the results of operations resulting from changes in foreign exchange rates on investments from the fluctuations arising from changes in market prices of securities held. Such fluctuations are included with the net realized and unrealized gain or loss from investments.
Reported net realized foreign currency gains or losses arise from disposition of foreign currency, the difference in the foreign exchange rates between the trade and settlement dates on securities transactions, and the difference between the amounts of dividends, interest and foreign withholding taxes recorded on the ex-date or accrual date and the U.S. dollar equivalent of the amounts actually received or paid. Net unrealized foreign exchange gains and losses arise from changes (due to the changes in the exchange rate) in the value of foreign currency and other assets and liabilities denominated in foreign currencies held at period end.
Allocation of Expenses Among Funds. Expenses directly attributable to the Portfolio are charged to the Portfolio; certain other common expenses of Calamos Advisors Trust, Calamos Investment Trust, Calamos Convertible Opportunities and Income Fund, Calamos Convertible and High Income Fund, Calamos Strategic Total Return Fund, Calamos Global Total Return Fund and Calamos Global Dynamic Income Fund are allocated proportionately among each fund to which the expenses relate in relation to the net assets of each fund or on another reasonable basis.
Use of Estimates. The preparation of financial statements in conformity with U.S. generally accepted accounting principles requires management to make estimates and assumptions that affect the amounts reported in the financial statements and accompanying notes. Actual results may differ from those estimates.
Income Taxes. No provision has been made for U.S. income taxes because the Trust’s policy is to continue to qualify as a regulated investment company under the Internal Revenue Code of 1986, as amended, and distribute to shareholders substantially all of the Portfolio’s taxable income and net realized gains.
Dividends and distributions paid to shareholders are recorded on the ex-dividend date. The amount of dividends and distributions from net investment income and net realized capital gains is determined in accordance with federal income tax regulations, which may differ from U.S. generally accepted accounting principles. To the extent these “book/tax” differences are permanent in nature, such amounts are reclassified within the capital accounts based on their federal tax-basis treatment. These differences are primarily due to differing treatments for foreign currency transactions, contingent payment debt instruments and methods of amortizing and accreting for fixed income securities. The financial statements are not adjusted for temporary differences.
The Portfolio recognized no liability for uncertain tax positions. A reconciliation is not provided as the beginning and ending amounts of unrecognized benefits are zero, with no interim additions, reductions or settlements. Tax years 2008 – 2011 remain subject to examination by the U.S. and the State of Illinois tax jurisdictions.
Indemnifications. Under the Trust’s organizational documents, the Trust is obligated to indemnify its officers and trustees against certain liabilities incurred by them by reason of having been an officer or trustee of the Trust. In addition, in the normal course of business, the Trust may enter into contracts that provide general indemnifications to other parties. The Portfolio’s maximum exposure under these arrangements is unknown as this would involve future claims that may be made against the Portfolio that have not yet occurred. Currently, the Portfolio’s management expects the risk of material loss in connection to a potential claim to be remote.
Note 2 – Investment Adviser and Transactions With Affiliates Or Certain Other Parties
Pursuant to an investment advisory agreement with Calamos Advisors LLC (“Calamos Advisors”), the Portfolio pays a monthly investment advisory fee based on the average daily net assets of the Portfolio at the annual rate of 0.75%.
Notes to Financial Statements (Unaudited)
Pursuant to a financial accounting services agreement, during the period the Portfolio paid Calamos Advisors a fee for financial accounting services payable monthly at the annual rate of 0.0175% on the first $1 billion of combined assets, 0.0150% on the next $1 billion of combined assets and 0.0110% on combined assets above $2 billion (for purposes of this calculation “combined assets” means the sum of the total average daily net assets of Calamos Investment Trust and Calamos Advisors Trust and the total average weekly managed assets of Calamos Convertible and High Income Fund, Calamos Strategic Total Return Fund, Calamos Convertible Opportunities and Income Fund, Calamos Global Total Return Fund and Calamos Global Dynamic Income Fund). Financial accounting services include, but are not limited to, the following: managing expenses and expense payment processing; monitoring the calculation of expense accrual amounts; calculating, tracking and reporting tax adjustments on all assets; and monitoring trustee deferred compensation plan accruals and valuations. The Portfolio pays its pro rata share of the financial accounting services fee payable to Calamos Advisors based on its relative portion of combined assets used in calculating the fee.
The Portfolio reimburses Calamos Advisors for a portion of compensation paid to the Trust’s Chief Compliance Officer. This compensation is reported as part of “Trustees’ fees and officer compensation” expense on the Statement of Operations.
Pursuant to an agreement with US Bancorp Fund Services, LLC, the Portfolio’s transfer agent (“US Bancorp”), Calamos Financial Services LLC (“CFS”) provides certain shareholder administrative services to US Bancorp. CFS receives from US Bancorp an annual aggregate fee of $175,000, paid in monthly installments, for providing these services which relate to Calamos Advisors Trust and Calamos Investment Trust. Also, Us Bancorp pays license fees to unaffiliated third parties for CFS’ utilization of certain transfer agent and phone systems in providing the shareholder administrative services. The fees paid to CFS and the payment of license fees to third parties are borne by US Bancorp. The Portfolio has not assumed or incurred any additional expenses in connection with CFS providing these services to US Bancorp, and the transfer agency fees payable by the Portfolio to US Bancorp have not increased as a result thereof.
A trustee and certain officers of the Trust are also officers and directors of CFS and Calamos Advisors. Such trustee and officers serve without direct compensation from the Trust. The Portfolio’s Statement of Additional Information contains additional information about the Portfolio’s trustees and is available upon request without charge by calling our toll free number 800.582.6959.
The Trust has adopted a deferred compensation plan (the “Plan”). Under the Plan, a trustee who is not an “interested person” (as defined in the 1940 Act) and has elected to participate in the Plan (a “participating trustee”) may defer receipt of all or a portion of his compensation from the Trust. The deferred compensation payable to the participating trustee is credited to the trustee’s deferral account as of the business day such compensation would have been paid to the participating trustee. The value of amounts deferred for a participating trustee is determined by reference to the change in value of Class I shares of one or more funds of Calamos Investment Trust designated by the participant. The value of the account increases with contributions to the account or with increases in the value of the measuring shares, and the value of the account decreases with withdrawals from the account or with declines in the value of the measuring shares. Deferred compensation of $63,668 is included in “Other assets” on the Statement of Assets and Liabilities at June 30, 2012. The Portfolio’s obligation to make payments under the Plan is a general obligation of the Portfolio and is included in “Payable for deferred compensation to trustees” on the Statement of Assets and Liabilities at June 30, 2012.
Note 3 – Investments
The cost of purchases and proceeds from sale of long-term investments for the period ended June 30, 2012 were as follows:
| | | | |
| Cost of purchases | | $ | 6,538,284 | |
| Proceeds from sales | | | 5,874,313 | |
The following information is presented on a federal income tax basis as of June 30, 2012. Differences between the cost basis under U.S. generally accepted accounting principles and federal income tax purposes are primarily due to temporary differences.
The cost basis of investments for federal income tax purposes at June 30, 2012 was as follows:
| | | | |
| Cost basis of investments | | $ | 24,595,433 | |
| | | | |
| Gross unrealized appreciation | | | 3,416,976 | |
| Gross unrealized depreciation | | | (1,069,385) | |
| | | | |
| Net unrealized appreciation (depreciation) | | $ | 2,347,591 | |
| | | | |
| | | | |
| 18 | | CALAMOS GROWTH AND INCOME PORTFOLIO SEMIANNUAL REPORT | | |
Notes to Financial Statements (Unaudited)
Note 4 – Income Taxes
The tax character of distributions for the period ended June 30, 2012 will be determined at the end of the Portfolio’s current fiscal year.
Distributions for the fiscal period ended December 31, 2011 were characterized for federal income tax purposes as follows:
| | | | |
| Distribution paid from: | | | | |
| Ordinary income | | $ | 400,007 | |
As of December 31, 2011, the components of accumulated earnings/(loss) on a tax basis were as follows:
| | | | |
| Undistributed ordinary income | | $ | 50,759 | |
| Undistributed capital gains | | | — | |
| | | | |
| Total undistributed earnings | | | 50,759 | |
| Accumulated capital and other losses | | | (386,686 | ) |
| Net unrealized gains/(losses) | | | 2,056,662 | |
| | | | |
| Total accumulated earnings/(losses) | | | 1,720,735 | |
| Other | | | (84,419 | ) |
| Paid-in capital | | | 23,468,928 | |
| | | | |
| Net assets applicable to common shareholders | | $ | 25,105,244 | |
As of December 31, 2011, the Portfolio had capital loss carryforwards which, if not used, will expire as follows:
| | | | |
| 2017 | | $ | (96,258 | ) |
| 2018 | | | (290,428 | ) |
Note 5 – Derivative Instruments
Foreign Currency Risk. The Fund may engage in portfolio hedging with respect to changes in currency exchange rates by entering into forward foreign currency contracts to purchase or sell currencies. A forward foreign currency contract is a commitment to purchase or sell a foreign currency at a future date at a negotiated forward rate. Risks associated with such contracts include, among other things, movement in the value of the foreign currency relative to the U.S. dollar and the ability of the counterparty to perform. The net unrealized gain, if any, represents the credit risk to the Fund on a forward foreign currency contract. The contracts are valued daily at forward foreign exchange rates. The Fund realizes a gain or loss when a position is closed or upon settlement of the contracts.
Equity Risk. The Portfolio may engage in option transactions and in doing so achieves similar objectives to what it would achieve through the sale or purchase of individual securities. A call option, upon payment of a premium, gives the purchaser of the option the right to buy, and the seller of the option the obligation to sell, the underlying security, index or other instrument at the exercise price. A put option gives the purchaser of the option, upon payment of a premium, the right to sell, and the seller the obligation to buy, the underlying security, index, or other instrument at the exercise price.
To seek to offset some of the risk of a potential decline in value of certain long positions, the Portfolio may also purchase put options on individual securities, broad-based securities indexes or certain exchange traded funds (“ETFs”). The Portfolio may also seek to generate income from option premiums by writing (selling) options on a portion of the equity securities (including securities that are convertible into equity securities) in the Portfolio, on broad-based securities indexes, or certain ETFs.
When the Portfolio purchases an option, it pays a premium and an amount equal to that premium is recorded as an asset. When the Portfolio writes an option, it receives a premium and an amount equal to that premium is recorded as a liability. The asset or liability is adjusted daily to reflect the current market value of the option. If an option expires unexercised, the Portfolio realizes a gain or loss to the extent of the premium received or paid. If an option is exercised, the premium received or paid is recorded as an adjustment to the proceeds from the sale or the cost basis of the purchase. The difference between the premium and the amount received or paid on a closing purchase or sale transaction is also treated as a realized gain or loss. The cost of securities acquired through the exercise of call options is increased by premiums paid. The proceeds from securities sold through the exercise of put options are decreased by the premiums paid. Gain or loss on written options and purchased options is presented separately, as net realized gain or loss on written options and net realized gain or loss on purchased options, respectively.
Notes to Financial Statements (Unaudited)
As of June 30, 2012, the Portfolio had outstanding purchased options and/or written options as listed on the Schedule of Investments. For the period ended June 30, 2012 the Portfolio had the following transactions in options written:
| | | | | | | | |
| | | NUMBER OF
CONTRACTS | | | PREMIUMS RECEIVED | |
| Options outstanding at December 31, 2011 | | | 126 | | | $ | 49,811 | |
| Options written | | | 20 | | | | 30,933 | |
| Options closed | | | (146 | ) | | | (80,744 | ) |
| Options exercised | | | — | | | | — | |
| Options expired | | | — | | | | — | |
| | | | |
| Options outstanding at June 30, 2012 | | | — | | | $ | — | |
Below are the types of derivatives in the Portfolio by gross value as of June 30, 2012:
| | | | | | | | | | | | |
| | | ASSETS | | | | | LIABILITIES | | | |
| DERIVATIVE TYPE | | STATEMENT OF ASSETS &
LIABILITIES LOCATION | | VALUE | | | STATEMENT OF ASSETS &
LIABILITIES LOCATION | | VALUE | |
| Foward Foreign Currency contracts | | Unrealized appreciation on forward
foreign currency contracts | | $ | 43,660 | | | Unrealized depreciation on forward
foreign currency contracts | | $ | 2,551 | |
Volume of Derivative Activity for the Six Months Ended June 30, 2012*
| | | | |
| DERIVATIVE TYPE | | VOLUME | |
| Equity: Written Options | | | 20 | |
| Foward Foreign Currency contracts | | | 2,778,696 | |
| * | Activity during the period is measured by opened number of contracts for options written and opened foreign currency contracts with foreign currency exposure measured in U.S. dollar notional. |
Note 6 – Synthetic Convertible Securities
The Portfolio may establish a “synthetic” convertible instrument by combining separate securities that possess the economic characteristics similar to a convertible security, i.e., fixed-income securities (“fixed-income component”), which may be a convertible or non-convertible security and the right to acquire equity securities (“convertible component”). The fixed-income component is achieved by investing in fixed income securities such as bonds, preferred stocks, and money market instruments. The convertible component is achieved by investing in warrants or purchased options to buy common stock at a certain exercise price, or options on a stock index. In establishing a synthetic instrument, the Portfolio may pool a basket of fixed-income securities and a basket of warrants or purchased options that produce the economic characteristics similar to a convertible security. Within each basket of fixed-income securities and warrants or options, different companies may issue the fixed-income and convertible components, which may be purchased separately and at different times.
The Portfolio may also purchase synthetic securities created by other parties, typically investment banks, including convertible structured notes. Convertible structured notes are fixed-income debentures linked to equity. Convertible structured notes have the attributes of a convertible security; however, the investment bank that issued the convertible note assumes the credit risk associated with the investment, rather than the issuer of the underlying common stock into which the note is convertible. Purchasing synthetic convertible securities may offer more flexibility than purchasing a convertible security.
Note 7 – Fair Value Measurements
Various inputs are used to determine the value of the Portfolio’s investments. These inputs are categorized into three broad levels as follows:
| | • | | Level 1 – Prices are determined using inputs from unadjusted quoted prices from active markets (including securities actively traded on a securities exchange) for identical assets. |
| | | | |
| 20 | | CALAMOS GROWTH AND INCOME PORTFOLIO SEMIANNUAL REPORT | | |
Notes to Financial Statements (Unaudited)
| | • | | Level 2 – Prices are determined using significant observable market inputs other than unadjusted quoted prices, including quoted prices of similar securities, fair value adjustments to quoted foreign securities, interest rates, credit risk, prepayment speeds, and other relevant data. |
| | • | | Level 3 – Prices reflect unobservable market inputs (including the Portfolio’s own judgments about assumptions market participants would use in determining fair value) when observable inputs are unavailable. |
Debt securities are valued based upon evaluated prices received from an independent pricing service or from a dealer or broker who makes markets in such securities. Pricing services utilize various observable market data and as such, debt securities are generally categorized as Level 2. The levels are not necessarily an indication of the risk or liquidity of the Portfolio’s investments. Transfers between the levels for investment securities or other financial instruments are measured at the end of the reporting period.
The following is a summary of the inputs used in valuing the Portfolio’s holdings at fair value:
| | | | | | | | | | | | | | | | |
| | | LEVEL 1 | | | LEVEL 2 | | | LEVEL 3 | | | TOTAL | |
| Assets: | | | | | | | | | | | | | | | | |
Convertible Bonds | | $ | — | | | $ | 8,324,635 | | | $ | — | | | $ | 8,324,635 | |
Synthetic Convertible Securities (Corporate Bonds) | | | | | | | 1,592,171 | | | | | | | | 1,592,171 | |
Synthetic Convertible Securities (Sovereign Bonds) | | | | | | | 2,555,249 | | | | | | | | 2,555,249 | |
Synthetic Convertible Securities (Purchased Options) | | | 43,772 | | | | | | | | | | | | 43,772 | |
Convertible Preferred Stocks | | | 1,060,287 | | | | 598,381 | | | | | | | | 1,658,668 | |
Common Stocks | | | 11,517,407 | | | | 319,081 | | | | | | | | 11,836,488 | |
Purchased Option | | | 170 | | | | | | | | | | | | 170 | |
Short Term Investment | | | 931,871 | | | | | | | | | | | | 931,871 | |
Forward Foreign Currency Contracts | | | | | | | 43,660 | | | | | | | | 43,660 | |
| | | | |
| Total | | $ | 13,553,507 | | | $ | 13,433,177 | | | $ | — | | | $ | 26,986,684 | |
| | | | |
| Liabilities: | | | | | | | | | | | | | | | | |
Forward Foreign Currency Contracts | | $ | — | | | $ | 2,551 | | | $ | — | | | $ | 2,551 | |
| | | | |
| Total | | $ | — | | | $ | 2,551 | | | $ | — | | | $ | 2,551 | |
| | | | |
Financial Highlights
Selected data for a share outstanding throughout each period were as follows:
| | | | | | | | | | | | | | | | | | | | | | | | |
| | | (Unaudited)
Six Months
Ended
June 30, | | | Year Ended December 31, | |
| | | 2012 | | | 2011 | | | 2010 | | | 2009 | | | 2008 | | | 2007 | |
Net asset value, beginning of period | | | $13.41 | | | | $13.88 | | | | $12.69 | | | | $9.37 | | | | $14.32 | | | | $14.39 | |
| |
Income from investment operations: | | | 0.09 | (a) | | | 0.18 | (a) | | | 0.21 | (a) | | | 0.26 | (a) | | | 0.18 | (a) | | | | |
Net investment income (loss) | | | | | | | | 0.13 | |
| |
Net realized and unrealized gain (loss) | | | 0.51 | | | | (0.44 | ) | | | 1.23 | | | | 3.36 | | | | (4.60 | ) | | | 1.14 | |
| |
Total from investment operations | | | 0.60 | | | | (0.26 | ) | | | 1.44 | | | | 3.62 | | | | (4.42 | ) | | | 1.27 | |
| |
Distributions: | | | | | | | | | | | | | | | | | | | | | | | | |
Dividends from net investment income | | | (0.15 | ) | | | (0.21 | ) | | | (0.25 | ) | | | (0.30 | ) | | | (0.13 | ) | | | (0.20 | ) |
| |
Dividends from net realized gains | | | — | | | | — | | | | — | | | | — | | | | (0.40 | ) | | | (1.14 | ) |
| |
Total distributions | | | (0.15 | ) | | | (0.21 | ) | | | (0.25 | ) | | | (0.30 | ) | | | (0.53 | ) | | | (1.34 | ) |
| |
Net asset value, end of period | | | $13.86 | | | | $13.41 | | | | $13.88 | | | | $12.69 | | | | $9.37 | | | | $14.32 | |
| |
Ratios and supplemental data: | | | | | | | | | | | | | | | | | | | | | | | | |
Total return(b) | | | 4.49% | | | | (1.87% | ) | | | 11.59% | | | | 39.42% | | | | (31.74% | ) | | | 8.87% | |
| |
Net assets, end of period (000) | | | $26,906 | | | | $25,105 | | | | $26,574 | | | | $25,868 | | | | $21,035 | | | | $36,697 | |
| |
Ratios of net expenses to average net assets | | | 1.41% | (c) | | | 1.41% | | | | 1.43% | | | | 1.30% | | | | 1.18% | | | | 1.16% | |
| |
Ratios of gross expenses to average net assets prior to expense reductions | | | 1.41% | (c) | | | 1.41% | | | | 1.43% | | | | 1.30% | | | | 1.19% | | | | 1.17% | |
| |
Ratios of net investment income (loss) to average net assets | | | 1.29% | (c) | | | 1.27% | | | | 1.62% | | | | 2.46% | | | | 1.53% | | | | 0.90% | |
| |
Portfolio turnover rate | | | 22.6% | | | | 55.9% | | | | 55.1% | | | | 67.0% | | | | 85.2% | | | | 76.8% | |
| |
| (a) | Net investment income allocated based on average shares method. |
| (b) | Total return measures net investment income and capital gain or loss from portfolio investments assuming reinvestment of dividends and capital gains distributions. Total return is not annualized for periods that are less than a full year and does not reflect the deduction of taxes that a shareholder would pay on portfolio distributions or the redemption of portfolio shares. |
| | | | |
| 22 | | CALAMOS GROWTH AND INCOME PORTFOLIO SEMIANNUAL REPORT | | |
Report of Independent Registered Public Accounting Firm
To the Board of Trustees and Shareholders of Calamos Advisors Trust
We have reviewed the accompanying statement of assets and liabilities, including the schedule of investments, of Calamos Advisors Trust (the “Trust”), comprised solely of the Calamos Growth and Income Portfolio (the “Portfolio”), as of June 30, 2012, and the related interim statements of operations and changes in net assets and the financial highlights for the semi-annual period then ended. These interim financial statements and financial highlights are the responsibility of the Trust’s management.
We conducted our review in accordance with standards of the Public Company Accounting Oversight Board (United States). A review of interim financial information consists principally of applying analytical procedures and making inquiries of persons responsible for financial and accounting matters. It is substantially less in scope than an audit conducted in accordance with standards of the Public Company Accounting Oversight Board (United States), the objective of which is the expression of an opinion regarding the financial statements and financial highlights taken as a whole. Accordingly, we do not express such an opinion.
Based on our review, we are not aware of any material modifications that should be made to such interim financial statements and financial highlights for them to be in conformity with accounting principles generally accepted in the United States of America.
We have previously audited, in accordance with the standards of the Public Company Accounting Oversight Board (United States), the statement of changes in net assets of the Portfolio for the year ended December 31, 2011 and the financial highlights for each of the five years then ended, and in our report dated February 6, 2012, we expressed an unqualified opinion on such statement of changes in net assets and financial highlights.

Chicago, Illinois
August 2, 2012
A description of the Calamos Proxy Voting Policies and Procedures is available free of charge upon request by calling 800.582.6959, by visiting the Calamos website at www.calamos.com, by writing Calamos at: Calamos Advisors LLC, Attn: Client Services, 2020 Calamos Court, Naperville, IL 60563. The Portfolio’s proxy voting record for the twelve month period ended June 30, 2012, is also available free of charge upon request by calling or writing Calamos Advisors LLC and by visiting the SEC website at http://www.sec.gov. The Portfolio files a complete list of its portfolio holdings with the SEC for the first and third quarters each fiscal year on Form N-Q. The Form N-Q is available free of charge, upon request, by calling or writing Calamos Advisors LLC or by visiting the SEC website. You may also review or, for a fee, copy the form at the SEC’s Public Reference Room in Washington, D.C. 1.800.SEC.0330.
CALAMOS ADVISORS TRUST
This report, including the audited financial statements contained herein, is submitted for general information for the contract owners of the Portfolio. The report is not authorized for distribution to prospective investors in the Portfolio unless it is accompanied by a currently effective prospectus of the Portfolio, and, after September 30, 2012, updated performance data for the most recently completed calendar quarter.

2020 Calamos Court
Naperville, IL 60563-2787
800.582.6959
www.calamos.com
© 2012 Calamos Holdings LLC. All Rights Reserved.
Calamos®, Calamos Investments®, Investment strategies
for your serious money™ and the Calamos® logo are
registered trademarks of Calamos Holdings LLC.
KCLSAN 2146 2012
ITEM 2. CODE OF ETHICS.
Not applicable.
ITEM 3. AUDIT COMMITTEE FINANCIAL EXPERT.
Not applicable.
ITEM 4. PRINCIPAL ACCOUNTANT FEES AND SERVICES.
Not applicable.
ITEM 5. AUDIT COMMITTEE OF LISTED REGISTRANTS.
Not applicable.
ITEM 6. SCHEDULE OF INVESTMENTS
Included in the Report to Shareholders in Item 1.
ITEM 7. DISCLOSURE OF PROXY VOTING POLICIES AND PROCEDURES FOR CLOSED-END MANAGEMENT INVESTMENT COMPANIES.
Not applicable.
ITEM 8. PORTFOLIO MANAGERS OF CLOSED-END MANAGEMENT INVESTMENT COMPANIES.
Not applicable.
ITEM 9. PURCHASES OF EQUITY SECURITIES BY CLOSED-END MANAGEMENT INVESTMENT COMPANY AND AFFILIATED PURCHASERS.
Not applicable.
ITEM 10. SUBMISSION OF MATTERS TO A VOTE OF SECURITY HOLDERS.
No material changes.
ITEM 11. CONTROLS AND PROCEDURES.
a) The registrant’s principal executive officer and principal financial officer have evaluated the registrant’s disclosure controls and procedures within 90 days of this filing and have concluded that the registrant’s disclosure controls and procedures were effective, as of that date, in ensuring that information required to be disclosed by the registrant in this Form N-CSR was recorded, processed, summarized, and reported timely.
b) There were no changes in the registrant’s internal controls over financial reporting (as defined in Rule 30a-3(d) under the Investment Company Act of 1940) that occurred during the second fiscal quarter of the period covered by this report that has materially affected, or is reasonably likely to materially affect, the registrant’s internal control over financial reporting.
ITEM 12. EXHIBITS.
(a)(1) Code of Ethics — Not applicable.
(a)(2)(i) Certification of Principal Executive Officer.
(a)(2)(ii) Certification of Principal Financial Officer.
SIGNATURES
Pursuant to the requirements of the Securities Exchange Act of 1934 and the Investment Company Act of 1940, the registrant has duly caused this report to be signed on its behalf by the undersigned, thereunto duly authorized.
Calamos Advisors Trust
| | |
| By: | | /s/ John P. Calamos, Sr. |
| Name: John P. Calamos, Sr. |
| Title: Principal Executive Officer |
Date: August 6, 2012
| | |
| By: | | /s/ Nimish S. Bhatt |
| Name: Nimish S. Bhatt |
| Title: Principal Financial Officer |
Date: August 6, 2012
Pursuant to the requirements of the Securities Exchange Act of 1934 and the Investment Company Act of 1940, this report has been signed by the following persons on behalf of the registrant and in the capacities and on the dates indicated.
Calamos Advisors Trust
| | |
| By: | | /s/ John P. Calamos, Sr. |
| Name: John P. Calamos, Sr. |
| Title: Principal Executive Officer |
Date: August 6, 2012
| | |
| By: | | /s/ Nimish S. Bhatt |
| Name: Nimish S. Bhatt |
| Title: Principal Financial Officer |
Date: August 6, 2012