UNITED STATES
SECURITIES AND EXCHANGE COMMISSION
Washington, D.C. 20549
FORM N-CSRS
CERTIFIED SHAREHOLDER REPORT OF REGISTERED
MANAGEMENT INVESTMENT COMPANIES
INVESTMENT COMPANY ACT FILE NUMBER: 811-09237
| | |
| EXACT NAME OF REGISTRANT AS SPECIFIED IN CHARTER: | | Calamos Advisors Trust |
| |
ADDRESS OF PRINCIPAL EXECUTIVE OFFICES: | | 2020 Calamos Court, Naperville |
| | Illinois 60563-2787 |
| |
NAME AND ADDRESS OF AGENT FOR SERVICE: | | John P. Calamos, Sr., Chairman, |
| | CEO and Co-CIO |
| | Calamos Advisors LLC, |
| | 2020 Calamos Court, |
| | Naperville, Illinois |
| | 60563-2787 |
REGISTRANT’S TELEPHONE NUMBER, INCLUDING AREA CODE: (630) 245-7200
DATE OF FISCAL YEAR END: December 31, 2013
DATE OF REPORTING PERIOD: January 1, 2013 through June 30, 2013
ITEM 1. REPORT TO SHAREHOLDERS.

About Calamos Investments
For more than 30 years, we have helped investors like you manage and build wealth to meet long-term objectives. Because investors have different time horizons, risk tolerances and goals, we offer investment portfolios to suit a variety of asset allocation needs. For example, our mutual funds include equity, fixed income and alternative funds. We offer U.S. funds, as well as global and international choices.
We are dedicated to helping our clients build and protect wealth. We understand when you entrust us with your assets, you also entrust us with your achievements, goals and aspirations. We believe we best honor this trust by making investment decisions guided by integrity, by discipline and by our conscientious research.
We believe that an active, risk-conscious approach is essential for wealth creation. In the 1970s, we pioneered the use of convertible securities as a means to manage risk in volatile markets. We followed with strategies that combine convertibles and stocks, with the aim of participating in equity market upside with potentially less volatility than an all-stock portfolio. In the 1990s, we introduced our first stock fund, which invests in growth companies both large and small.
Across our funds, our investment process seeks to manage risk at multiple levels and draws upon our experience investing through multiple market cycles. In a rapidly changing environment, we believe that this active management is essential.
We are global in our perspective. We believe that globalization offers tremendous opportunities for countries and companies all over the world. In our U.S., global and international portfolios, we seek to capitalize on the potential growth of the global economy.
We believe there are opportunities in all markets. Our history traces back to the 1970s, a period of significant volatility and economic concerns. We have invested through multiple market cycles, each with its own challenges. Out of this experience comes our belief that the flipside of volatility is opportunity.
Letter to Contract Owners

JOHN P. CALAMOS, SR.
CEO and Global Co-CIO
Dear Contract Holder:
Welcome to your semiannual report for the six-month period ended June 30, 2013. In this report, you will find commentary from the Calamos Investment Management Team, as well as a listing of portfolio holdings, financial statements and highlights, and detailed information about the performance and positioning of the Calamos Growth and Income Portfolio.
Economic and Market Review
The U.S. stuck to its slow-growth trajectory, adding to its growing string of consecutive quarters of economic expansion. A recovering housing market and rising equity markets contributed to a “wealth effect” that carried through to other areas of the market, including auto sales. Job data has also improved, providing a boost to consumer activity. Although sequestration cast a shadow at the end of the year that carried into 2013, the country managed to avoid the fiscal cliff, and the passage of a new continuing resolution has prevented a Washington shutdown.
U.S. stocks rallied to a double-digit performance, with the S&P 500 Index1 returning an impressive 13.82% for the period. Convertible securities also enjoyed the six-month rally, as the BofA Merrill Lynch All U.S. Convertible Ex-Mandatory Index2 returned 9.78%, prompted by lower-quality higher yielding securities. During the last few weeks of the period, we saw 10-year bond rates increase quite quickly as the Federal Reserve discussed tapering its quantitative easing (QE). Investor speculation about the Fed’s plans contributed to significant intra-day volatility in the equity markets—both upward and downward.
Throughout the reporting period, the search for income remained a primary driver within the equity markets for many investors. Against the backdrop of extremely accommodative policy from the Fed and other central banks, interest rates have fallen to unprecedented lows. Many investors turned to the highest dividend-paying stocks as “fixed income surrogates.” The valuations of a number of these stocks soared. Meanwhile, although the economic recovery continued in the U.S., growth-oriented companies with compelling fundamentals were less favored.
Outlook: Cautious Optimism
Our global outlook remains cautiously optimistic, and we believe, now more than ever, that active management and diversification are crucial to long-term investing success.
Letter to Contract Owners
The U.S. economy looks to be in a mid-cycle phase, which historically has been characterized by saw-toothed markets. We expect market choppiness to continue, reflecting not only Fed-centered anxiety but also global macro uncertainties.
Many are concerned that dialing back quantitative easing will upend the recovery. We believe less Fed intervention could ultimately benefit the U.S. economy, and growth-oriented equities in particular. As we noted, over recent quarters, QE has contributed to significant dislocations in asset prices. As yields on long-term bonds have fallen, investors have turned to high dividend-paying equities as fixed income surrogates. The valuations of some utilities and staples stocks have soared to levels we believe are unsustainable, while growth-oriented companies with better earnings projections have been largely overlooked. A move by the Fed to taper or remove its QE could help spur a shift from an income-oriented stock regime to a growth-oriented stock regime. Historically, cyclical growth equities have performed well during periods of rising rates accompanied by economic growth, while areas like utilities have faced headwinds.
The economic landscape further supports the case that a growth regime may be nearing. The U.S. economy looks to be in a mid-cycle phase—a period historically characterized by healthy, if uneven, economic data. Although this recovery hasn’t been as dramatic as some may have hoped, it has gained traction. We anticipate investors could become increasingly inclined to favor companies with stronger longer-term growth prospects.
We are also encouraged by trends in the U.S. and global convertible markets. Because of their combination of fixed income and equity characteristics, convertibles have often done well during volatile, but upward-moving equity markets. A good number of convertibles have been retired this year and more are likely to follow. However, new issuance has been encouraging, and we believe widening spreads and economic growth bode well for a continuation of this activity.
An Active, Long-Term Perspective
During mid-cycle phases, markets are often quite volatile, as we have seen of late. Given the potential for highly rotational markets, we are actively managing sector exposures in conjunction with our fundamental, bottom-up research.
We recognize that our role is to understand and adapt to the markets we are in, and we believe that our experience, proprietary research and active approach position us well in this regard. We continue to enhance our team and our approach, adding new resources, additional specialized team members and more risk management capabilities.
| | | | |
| 2 | | CALAMOS GROWTH AND INCOME PORTFOLIO SEMIANNUAL REPORT | | |
Letter to Contract Owners
As always, we appreciate the trust you have placed in us to manage your assets and help you achieve your financial goals. We encourage you to visit us at www.calamos.com or contact us at 800.582.6959 with any questions or concerns that are not addressed in this report.
Sincerely,

John P. Calamos, Sr.
CEO and Global Co-CIO,
Calamos Advisors LLC
Before investing, carefully consider a fund’s investment objectives, risks, charges and expenses. Please see the prospectus containing this and other information or call 800.582.6959. Please read the prospectus carefully. Performance data represents past performance, which is no guarantee of future results. Current performance may be lower or higher than the performance quoted.
| 1 | The S&P 500 Index is an unmanaged index generally considered representative of the U.S. stock market. Source: Lipper, Inc. |
| 2 | The BofA Merrill Lynch All U.S. Convertibles Ex-Mandatory Index represents the U.S. convertible securities market. |
Unmanaged index returns assume reinvestment of any and all distributions and, unlike fund returns, do not reflect fees, expenses or sales charges. Investors cannot invest directly in an index.
Investment Team Discussion
| | | | |
| SECTOR WEIGHTINGS | |
Information Technology | | | 23.8 | % |
Financials | | | 14.1 | |
Consumer Discretionary | | | 12.1 | |
Industrials | | | 11.9 | |
Energy | | | 11.8 | |
Health Care | | | 11.0 | |
Consumer Staples | | | 9.6 | |
Utilities | | | 1.4 | |
Materials | | | 1.3 | |
Sector weightings are subject to change daily and are calculated as a percentage of net assets. The table excludes cash or cash equivalents, any government/sovereign bonds or broad based index hedging securities the Portfolio may hold.
CALAMOS GROWTH AND INCOME PORTFOLIO
INVESTMENT TEAM DISCUSSION
The Portfolio’s Investment Team discusses performance, strategy and positioning during the six-month period ended June 30, 2013.
Q. What is the Portfolio’s investment strategy?
A. Calamos Growth and Income Portfolio invests in a combination of stocks, convertible securities and bonds of U.S. companies. The Portfolio offers a total return-oriented investment that seeks to keep a consistent balance of risk and reward through full market cycles. As we focus on managing volatility, we endeavor to participate in a greater portion of equity market upside than downside. We invest in equities, convertible securities and bonds issued primarily by U.S.-based companies. We currently emphasize companies with global presence and geographically diversified revenues that we believe are positioned to capitalize on global economic growth and global secular trends.
Q. Please discuss the Portfolio’s low-volatility* characteristics.
A. We believe the Portfolio’s historical low-volatility characteristics are a by-product of our investment style and focus on participating in equity market upside with less volatility than the market as a whole. Beta is one popular statistic for measuring volatility. Beta considers an investment’s historic volatility versus the market, which is assigned a beta of 1.0. An investment with half the volatility of the market would have a beta of 0.5, while an investment with a beta of 2.0 would have been twice as volatile as the market.
Since its inception, the Portfolio has had a beta of 0.71 versus the S&P 500 Index. The Portfolio has therefore outperformed the broader equity market, as measured by the S&P 500 Index, with less volatility than the equity markets. Please note that past performance does not indicate future results and that beta is one of many measures of risk.
While our strategy is compared to an all-equity benchmark, we typically invest a portion of the Portfolio in securities that exhibit less volatility, such as convertible securities. This tends to offer lower downside capture, which is a critical part of our risk management process, but it can also cause the Portfolio returns to lag the benchmark return during periods of strong market performance. Through this focus on risk management, we have been able to provide investors a less volatile equity investment as measured by beta that has outperformed the passive benchmark in most of the standard time periods going back to inception.
Q. What factors influenced performance over the period?
A. During the six-month period, the Portfolio participated in equity market gains, but trailed the index as more defensive and higher yielding investments outperformed. Our emphasis on higher quality companies with stronger balance sheets, greater capital efficiency and relatively higher growth profiles was not rewarded. The significant differences in sector performance during the period reflected investor preference for dividend yield rather than growth within their equity exposure. While market sentiment generally favored defensives on a sector level, investors did not necessarily reward balance sheet strength and growth attributes for individual companies.
| * | The Portfolio’s historical performance has exhibited lower volatility, as measured by beta and standard deviation, over the life of the Portfolio. The Portfolio’s investment objective does not seek to reduce volatility, and as a result, the Portfolio may experience volatility in some market conditions. (Source for beta and standard deviation data is Morningstar, Inc.) |
| | | | |
| 4 | | CALAMOS GROWTH AND INCOME PORTFOLIO SEMIANNUAL REPORT | | |
Investment Team Discussion
GROWTH OF $10,000 FOR 10-YEAR PERIOD ENDED 6/30/13
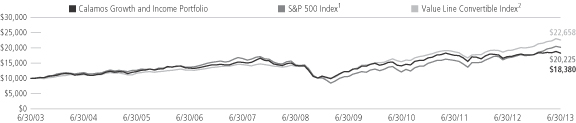
AVERAGE ANNUAL TOTAL RETURN† FOR THE PERIOD ENDED 6/30/13
| | | | | | | | | | | | | | | | | | | | | | | |
| 6 MONTHS | | 1 YEAR | | 3 YEARS | | 5 YEARS | | 10 YEARS |
| | | 3.14% | | | | | 7.03% | | | | | 9.23% | | | | | 5.26% | | | | | 6.28% | |
Performance data quoted represents past performance, which is no guarantee of future results. Current performance may be lower or higher than the performance quoted. The principal value and investment return of an investment will fluctuate so that your shares, when redeemed, may be worth more or less than their original cost. Returns are net of all fees and expenses incurred by the Portfolio.
| † | Average annual total return measures net investment income and capital gain or loss from portfolio investments as an annualized average, assuming reinvestment of income and capital gain distributions. Returns do not reflect sales charges, expenses and fees assessed in connection with the variable product. Sales charges, expenses and fees, which are determined by the variable product issuers, will vary and will lower the total return to the contract or policy owner. |
| 1 | The S&P 500 Index is an unmanaged index generally considered representative of the U.S. stock market. Source: Lipper, Inc. |
| 2 | The Value Line Convertible Index is an equally-weighted index of the larger convertibles, representing 90% of the U.S. convertible securities market. Source: Mellon Analytical Solutions, Inc. |
Index returns assume reinvestment of dividends and do not reflect deduction of fees and expenses. It is not possible to invest directly in an index.
The Portfolio’s overweight allocation and relative security selection in information technology negatively impacted performance during the period. Specifically, positions in the computer storage and systems software industries underperformed the index. Technology sector returns lagged despite its higher overall growth rates and attractive historic valuation relative to the broad market. The growth thesis informing our overweight to information technology remains intact, as consumers and businesses alike demand innovations that enhance mobility, productivity and connectivity.
The Portfolio’s average overweight allocation and selection in materials also detracted value. Specifically, holdings in the gold mining and production industry underperformed the broader market and made the largest negative impact on performance. Gold mining companies were challenged during the period by higher costs of extraction and production, as well as the rising prices of mining infrastructure. While valuations and fundamentals of select companies within the industry remain attractive, we reduced the Portfolio’s exposure to gold mining positions, which were used primarily as a global hedge against financial crises and currency debasement.
Security selection and an underweight position within the consumer discretionary sector also detracted from Portfolio performance. In particular, holdings within the Internet retail industry lagged peers. Although U.S. consumer trends are somewhat mixed, overall retail spending continues to increase. We strive to build positions in companies with well-established brands and global business strategies. Current holdings within the sector extend across a number of industries, some of which include Internet retail, apparel, home improvement, media and leisure.
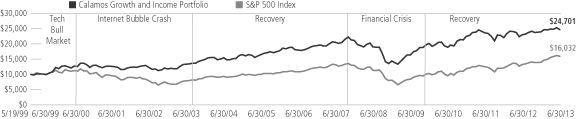
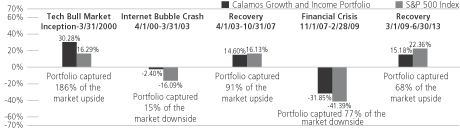
Q. Please describe the Portfolio’s participation in up and down markets since its inception.
A. There are a variety of ways to express up- and down-market capture, whether it’s calculated daily, monthly, quarterly, etc., or as we look at the markets—in longer-term up- and down-market trends. In the chart on the following page, you can see how the Calamos Growth and Income Portfolio performed through a few distinct market periods.
Investment Team Discussion
| | | | | | | | | | | | | | | | | | | | |
| | | 1 YEAR | | | 3 YEARS | | | 5 YEARS | | | 10 YEARS | | | SINCE INCEPTION | |
| Calamos Growth and Income Portfolio | | | 7.03% | | | | 9.23% | | | | 5.26% | | | | 6.28% | | | | 6.61% | |
| S&P 500 Index | | | 20.60% | | | | 18.45% | | | | 7.01% | | | | 7.30% | | | | 3.17% | |
Performance data quoted represents past performance, which is no guarantee of future results. Current performance may be lower or higher than the performance quoted. The principal value and investment return of an investment will fluctuate so that your shares, when redeemed, may be worth more or less than their original cost. Returns are net of all fees and expenses incurred by the Portfolio.
| † | Average annual total return measures net investment income and capital gain or loss from portfolio investments as an annualized average, assuming reinvestment of income and capital gain distributions. Returns do not reflect sales charges, expenses and fees assessed in connection with the variable product. Sales charges, expenses and fees, which are determined by the variable product issuers, will vary and will lower the total return to the contract or policy owner. |
The first phase shows the Portfolio’s participation from its May 19, 1999 inception through March 31, 2000, when the equity market peaked prior to the end of the Internet bubble and the subsequent market crash. The Portfolio participated well during this up-market phase, gaining 30.28%, while the S&P 500 Index gained 16.29%.
The next phase was a sharp market decline from March 31, 2000 through March 31, 2003, as stocks sold off strongly on the heels of the tech bubble burst and the events of September 11, 2001. The Portfolio’s more conservative positioning and lower sensitivity to the equity market served investors well during this period, limiting the loss to only 2.40%, compared to a 16.09% decline in the S&P 500 Index.
After March 31, 2003, the equity market once again began a strong upward move, with the S&P 500 Index climbing 16.13% through the market peak of October 31, 2007. During this period, the Portfolio participated strongly, gaining 14.60% and capturing 91% of the equity market’s rise.
In October 2007, markets peaked as a financial crisis gripped the U.S. and global economy. This induced a selloff, which saw the equity market fall 41.39% through March 1, 2009. The Portfolio was not immune to the liquidity crisis, falling 31.85%, but experiencing only 77% of the equity market’s downside.
In March 2009, markets began to retrench after the 2008 selloff and move upward as central governments in the developed world engaged in stimulative monetary policy, encouraging investors to return to risk assets. While we’ve had some concerns surrounding the risk-on/risk-off nature of equity markets, the Portfolio has gained 15.18%, capturing 68% of the equity market’s gain.
Over the long term, this is how we seek to manage the Calamos Growth and Income Portfolio—attempting to deliver equity-like returns with a greater focus on reducing volatility and managing risk through a full market cycle.
| | | | |
| 6 | | CALAMOS GROWTH AND INCOME PORTFOLIO SEMIANNUAL REPORT | | |
Investment Team Discussion
Q. How is the Portfolio positioned?
A. Given our view of improving economic fundamentals and attractive equity valuations, we have continued to position the Portfolio to reflect a more cautiously optimistic market outlook and have decreased reflation-sensitive exposure in areas such as materials. We have maintained significant investments in higher secular growth businesses, such as those in information technology, health care and the consumer areas. We continue to favor companies with diversified global operations, strong cash flow generation and catalysts for growth and innovation. While our market outlook is cautiously optimistic overall, we also anticipate periods of volatility within markets and therefore maintain a strong focus on risk management.
Among positioning changes during the period, we reduced the Portfolio’s allocation to information technology. This primarily came about through the sale of companies where we had success and decided to realize gains, as well as those where we believed that near-term growth catalysts had deteriorated. Despite these moves, we remain overweight and are committed to the growth opportunities within the sector. We also decreased the Portfolio’s weight in the materials sector. More specifically, we significantly reduced exposure to the gold mining and production industry, which had served as a global hedge against systemic risk and currency debasement.
With respect to key additions, we increased the Portfolio’s exposure to the financials sector during the period, adding weight as a reflection of improved bottom-up company fundamentals and our more constructive equity outlook. We have recently favored opportunities in the asset management industry and select, higher-quality, diversified banks.
We also increased the Portfolio’s holdings in the industrials sector, adding investments across industries including aerospace, industrial machinery and construction. Many companies in the sector are compelling from both valuation and fundamental perspectives, particularly those with global scale and those serving diverse business segments that stand to benefit from the economic recovery.
Q. What is your outlook for growth equities and the Portfolio?
A. The U.S. economy looks to be in a mid-cycle phase—a period historically characterized by healthy, if uneven, economic data. Although this recovery hasn’t been as dramatic as some may have hoped, it has gained traction. We have seen strength in the housing sector, brightening consumer sentiment and contained inflation. Rising equity markets, higher home prices and improving employment support a “wealth effect” that has bolstered discretionary spending. Against this backdrop, we anticipate investors could become increasingly inclined to favor companies with stronger longer-term growth prospects.
During mid-cycle phases, markets are often quite volatile, as we have seen of late. In this environment, we believe active, high-conviction strategies are advantageous. Given the potential for highly rotational markets, we are actively managing sector exposures in conjunction with our fundamental, bottom-up research.
Outside the U.S., we remain concerned about anemic euro zone GDP and tensions between the haves and have-nots, as the bailout/austerity cycle continues to be complex. Within the emerging markets, average growth rates remain well above those in developed economies, but certain tighter monetary policies could pose headwinds for growth. We expect policy uncertainty and market fluctuations to continue, but modest economic growth, attractive valuations and robust secular themes support our active and risk-aware approach to investing in equity and equity-sensitive markets.
We believe long-term government bonds and investment-grade corporate debt should be approached with care. Growth equities, on the other hand, offer valuations that are compelling by many measures. Overall, we remain cautiously optimistic and believe we are well positioned for a shift from an income-oriented market to one with a greater focus on growth.
Expense Overview
EXPENSE OVERVIEW
As a contract or policy owner, you incur certain costs. Because the Portfolio is a funding vehicle for annuities, policies and eligible plans, you may also incur sales charges and other fees related to your annuity, policy or eligible plan. In addition, the Portfolio incurs transaction costs and ongoing costs, including management fees, and other fund expenses, such as audit, legal and custodian fees.
The examples in this report are based on an investment of $1,000 made at the beginning of the period and held for the entire period from January 1, 2013 to June 30, 2013. It is intended to help you understand the ongoing cost associated with investing in the Portfolio and to compare these costs with the ongoing costs of investing in other mutual funds.
There are two parts to the examples table:
Actual
In this part of the table, you’ll see the actual expenses you would have paid on a $1,000 investment made at the beginning of the period and held for the entire period from January 1, 2013 to June 30, 2013, the period covered by this report. This table also shows the actual returns, after expenses, you would have earned during that time. This table can help you estimate your own expenses. For example, if you invested $8,600 in the Portfolio, simply divide $8,600 by $1,000, then multiply that result by the figure in the “Actual Expenses per $1,000” row. In this example, you would multiply 8.6 by the figure.
Hypothetical
In this part of the table, you’ll see the hypothetical expenses you would have paid on a $1,000 investment from January 1, 2013 to June 30, 2013 and the hypothetical returns, after expenses, you would have earned during that time. The Securities and Exchange Commission (SEC) has established the guidelines for this table, including the assumed 5% annual rate of return before expenses, which is what you’ll see in the table. Note that this table will not help you determine your own expenses, but will help you compare expenses of the Portfolio to the expenses of other mutual funds.
Please note that the expenses shown in the table are meant to highlight your ongoing costs only and do not include any transactional costs, such as sales charges (loads), redemption fees or exchange fees. Therefore, the second line of the table is useful in comparing ongoing costs only and will not help you determine the relative total costs of owning different funds. In addition, if these transactions costs were included, your costs would have been higher.
| | | | |
| 8 | | CALAMOS GROWTH AND INCOME PORTFOLIO SEMIANNUAL REPORT | | |
Expense Overview
| | | | |
| The actual and hypothetical examples assume a $1,000 investment at the beginning of the period, January 1, 2013 and held through June 30, 2013. | |
Actual Expenses per $1,000* | | $ | 6.95 | |
Actual – Ending Balance | | $ | 1,031.40 | |
| | | | |
Hypothetical Expenses per $1,000* | | $ | 6.90 | |
Hypothetical – Ending Value | | $ | 1,017.95 | |
| | | | |
Annualized Expense Ratio | | | 1.38% | |
| * | Expenses are equal to the Portfolio’s annualized expense ratio multiplied by the average account value over the period, multiplied by 181/365. |
Schedule of Investments June 30, 2013 (Unaudited)
| | | | | | | | | | |
PRINCIPAL
AMOUNT | | | | | | | VALUE | |
| | CONVERTIBLE BONDS (35.6%) | |
| | | | | | Consumer Discretionary (6.4%) | |
| | 200,000 | | | | | Iconix Brand Group, Inc.*
1.500%, 03/15/18 | | $ | 224,623 | |
| | 145,000 | | | | | Jarden Corp.*
1.875%, 09/15/18 | | | 164,093 | |
| | 270,000 | | | | | Liberty Interactive, LLC (Time Warner Cable, Inc., Time Warner, Inc.)*§
0.750%, 03/30/43 | | | 297,938 | |
| | 60,000 | | | | | MGM Resorts International
4.250%, 04/15/15 | | | 67,203 | |
| | 400,000 | | | | | Priceline.com, Inc.
1.000%, 03/15/18 | | | 465,486 | |
| | | | | | Ryland Group, Inc. | | | | |
| | 135,000 | | | | | 0.250%, 06/01/19 | | | 122,633 | |
| | 45,000 | | | | | 1.625%, 05/15/18 | | | 65,221 | |
| | 150,000 | | | | | Shutterfly, Inc.*
0.250%, 05/15/18 | | | 165,585 | |
| | 70,000 | | | | | Tesla Motors, Inc.
1.500%, 06/01/18 | | | 78,943 | |
| | | | | | | | | | |
| | | | | | | | | 1,651,725 | |
| | | | | | | | | | |
| | | | | | Consumer Staples (0.5%) | |
| | 100,000 | | | EUR | | Marine Harvest, ASA
2.375%, 05/08/18 | | | 131,070 | |
| | | | | | | | | | |
| | | | | | Energy (3.8%) | |
| | 439,800 | | | EUR | | CGGVeritas
1.750%, 01/01/16 | | | 164,501 | |
| | 50,000 | | | | | Exterran Holdings, Inc.
4.250%, 06/15/14 | | | 64,862 | |
| | 150,000 | | | | | Helix Energy Solutions Group, Inc.
3.250%, 03/15/32 | | | 187,895 | |
| | 150,000 | | | | | Hornbeck Offshore Services, Inc.*
1.500%, 09/01/19 | | | 182,235 | |
| | 200,000 | | | | | Subsea 7, SA 1.000%, 10/05/17 | | | 193,551 | |
| | 110,900 | | | EUR | | Technip, SA
0.250%, 01/01/17 | | | 154,436 | |
| | 27,100 | | | EUR | | 0.500%, 01/01/16 | | | 33,385 | |
| | | | | | | | | | |
| | | | | | | | | 980,865 | |
| | | | | | | | | | |
| | | | | | Financials (3.6%) | |
| | 78,000 | | | | | Amtrust Financial Services, Inc.
5.500%, 12/15/21 | | | 109,654 | |
| | 130,000 | | | | | Ares Capital Corp.
5.750%, 02/01/16 | | | 142,361 | |
| | 70,000 | | | | | FXCM, Inc.*
2.250%, 06/15/18 | | | 74,866 | |
| | 100,000 | | | EUR | | Industrivarden, AB
2.500%, 02/27/15 | | | 159,936 | |
| | 90,000 | | | | | Leucadia National Corp.
3.750%, 04/15/14 | | | 112,606 | |
| | | | | | | | | | |
PRINCIPAL
AMOUNT | | | | | | | VALUE | |
| | 250,000 | | | SGD | | Temasek Financial, Ltd. (Standard Chartered, PLC)§
0.000%, 10/24/14 | | $ | 203,027 | |
| | 125,000 | | | | | Walter Investment Management Corp.
4.500%, 11/01/19 | | | 126,136 | |
| | | | | | | | | | |
| | | | | | | | | 928,586 | |
| | | | | | | | | | |
| | | | | | Health Care (6.9%) | |
| | 115,000 | | | | | Gilead Sciences, Inc.
1.625%, 05/01/16 | | | 263,417 | |
| | 225,000 | | | | | Hologic, Inc.‡
2.000%, 12/15/37 | | | 251,804 | |
| | 250,000 | | | | | Illumina, Inc.*
0.250%, 03/15/16 | | | 271,505 | |
| | 57,000 | | | | | Insulet Corp.
3.750%, 06/15/16 | | | 75,683 | |
| | 100,000 | | | | | Medicines Company*
1.375%, 06/01/17 | | | 127,181 | |
| | 140,000 | | | | | Molina Healthcare, Inc.*
1.125%, 01/15/20 | | | 153,572 | |
| | 25,000 | | | | | Pacira Pharmaceuticals, Inc.*
3.250%, 02/01/19 | | | 34,806 | |
| | 200,000 | | | | | Salix Pharmaceuticals, Ltd.
1.500%, 03/15/19 | | | 239,255 | |
| | 70,000 | | | | | Vivus, Inc.*
4.500%, 05/01/20 | | | 69,302 | |
| | 230,000 | | | | | WellPoint, Inc.*
2.750%, 10/15/42 | | | 289,817 | |
| | | | | | | | | | |
| | | | | | | | | 1,776,342 | |
| | | | | | | | | | |
| | | | | | Industrials (4.6%) | |
| | 190,000 | | | | | AGCO Corp.
1.250%, 12/15/36 | | | 237,619 | |
| | 110,000 | | | | | Air Lease Corp.*
3.875%, 12/01/18 | | | 136,912 | |
| | 200,000 | | | EUR | | Deutsche Post, AG
0.600%, 12/06/19 | | | 299,245 | |
| | 500,000 | | | | | Siemens, AG
1.050%, 08/16/17 | | | 515,078 | |
| | | | | | | | | | |
| | | | | | | | | 1,188,854 | |
| | | | | | | | | | |
| | | | | | Information Technology (8.5%) | |
| | 155,000 | | | | | Concur Technologies, Inc.*
0.500%, 06/15/18 | | | 154,634 | |
| | 65,000 | | | | | Cornerstone OnDemand, Inc.*
1.500%, 07/01/18 | | | 68,024 | |
| | 56,000 | | | | | Infinera Corp.*
1.750%, 06/01/18 | | | 62,019 | |
| | 60,000 | | | | | Ixia
3.000%, 12/15/15 | | | 72,429 | |
| | 190,000 | | | | | Lam Research Corp.
0.500%, 05/15/16 | | | 202,936 | |
| | 169,000 | | | | | 1.250%, 05/15/18 | | | 187,801 | |
| | 125,000 | | | | | Linear Technology Corp.
3.000%, 05/01/27 | | | 131,236 | |
| | | | |
| 10 | | CALAMOS GROWTH AND INCOME PORTFOLIO SEMIANNUAL REPORT | | See accompanying Notes to Schedule of Investments |
Schedule of Investments June 30, 2013 (Unaudited)
| | | | | | | | | | |
PRINCIPAL
AMOUNT | | | | | | | VALUE | |
| | 155,000 | | | | | Netsuite, Inc.*
0.250%, 06/01/18 | | $ | 158,377 | |
| | 225,000 | | | | | Nuance Communications, Inc.
2.750%, 08/15/27 | | | 264,523 | |
| | 140,000 | | | | | Salesforce.com, Inc.*
0.250%, 04/01/18 | | | 133,356 | |
| | 400,000 | | | | | SanDisk Corp.
1.500%, 08/15/17 | | | 538,408 | |
| | 70,000 | | | | | Take-Two Interactive Software, Inc.
1.750%, 12/01/16 | | | 77,161 | |
| | 110,000 | | | | | Workday, Inc.*
0.750%, 07/15/18 | | | 112,314 | |
| | 30,000 | | | | | 1.500%, 07/15/20 | | | 30,640 | |
| | | | | | | | | | |
| | | | | | | | | 2,193,858 | |
| | | | | | | | | | |
| | | | | | Materials (1.3%) | |
| | 100,000 | | | | | Glencore Finance Europe, SA
5.000%, 12/31/14 | | | 109,792 | |
| | 120,000 | | | | | RTI International Metals, Inc.
1.625%, 10/15/19 | | | 113,200 | |
| | 120,000 | | | | | Steel Dynamics, Inc.
5.125%, 06/15/14 | | | 129,285 | |
| | | | | | | | | | |
| | | | | | | | | 352,277 | |
| | | | | | | | | | |
| | | | | | TOTAL CONVERTIBLE BONDS
(Cost $8,791,573) | | | 9,203,577 | |
| | | | | | | | | | |
| | SYNTHETIC CONVERTIBLE SECURITIES (5.1%) | |
| | Corporate Bonds (4.0%) | |
| | | | | | Consumer Discretionary (2.0%) | |
| | | | | | DISH Network Corp. | | | | |
| | 70,000 | | | | | 5.875%, 07/15/22 | | | 71,094 | |
| | 70,000 | | | | | 5.125%, 05/01/20* | | | 69,038 | |
| | 140,000 | | | | | Expedia, Inc.
5.950%, 08/15/20 | | | 148,779 | |
| | 67,000 | | | | | Hanesbrands, Inc.
6.375%, 12/15/20 | | | 71,564 | |
| | 140,000 | | | | | L Brands, Inc.
5.625%, 02/15/22 | | | 142,450 | |
| | 20,000 | | | | | PVH Corp.
4.500%, 12/15/22 | | | 19,288 | |
| | | | | | | | | | |
| | | | | | | | | 522,213 | |
| | | | | | | | | | |
| | | | | | Energy (0.7%) | |
| | | | | | Oil States International, Inc. | | | | |
| | 110,000 | | | | | 6.500%, 06/01/19 | | | 114,262 | |
| | 60,000 | | | | | 5.125%, 01/15/23* | | | 62,850 | |
| | | | | | | | | | |
| | | | | | | | | 177,112 | |
| | | | | | | | | | |
| | | | | | Financials (0.3%) | |
| | 70,000 | | | | | Neuberger Berman Group LLC*
5.875%, 03/15/22 | | | 71,837 | |
| | | | | | | | | | |
| | | | | | | | | | |
PRINCIPAL
AMOUNT | | | | | | | VALUE | |
| | | | | | Health Care (0.2%) | |
| | 65,000 | | | | | Endo Health Solutions, Inc.
7.000%, 07/15/19 | | $ | 65,528 | |
| | | | | | | | | | |
| | | | | | Industrials (0.2%) | |
| | 59,000 | | | | | Actuant Corp.
5.625%, 06/15/22 | | | 59,811 | |
| | | | | | | | | | |
| | | | | | Information Technology (0.6%) | |
| | 75,000 | | | | | Anixter, Inc.
5.625%, 05/01/19 | | | 78,094 | |
| | 75,000 | | | | | Brocade Communications Systems, Inc.*
4.625%, 01/15/23 | | | 70,922 | |
| | | | | | | | | | |
| | | | | | | | | 149,016 | |
| | | | | | | | | | |
| | | | | | TOTAL CORPORATE BONDS | | | 1,045,517 | |
| | | | | | | | | | |
NUMBER OF
CONTRACTS | | | | | | | VALUE | |
| | Purchased Options (1.1%) # | | | | |
| | | | | | Consumer Discretionary (0.4%) | |
| | 40 | | | | | Gap, Inc.
Call, 01/17/15, Strike $35.00 | | | 39,600 | |
| | 50 | | | | | Las Vegas Sands Corp.
Call, 01/17/15, Strike $55.00 | | | 37,875 | |
| | 25 | | | | | Under Armour, Inc.
Call, 01/17/15, Strike $62.50 | | | 23,625 | |
| | | | | | | | | | |
| | | | | | | | | 101,100 | |
| | | | | | | | | | |
| | | | | | Energy (0.2%) | |
| | | | | | Continental Resources, Inc. | | | | |
| | 20 | | | | | Call, 01/17/15, Strike $95.00 | | | 23,900 | |
| | 20 | | | | | Call, 01/17/15, Strike $90.00 | | | 28,000 | |
| | | | | | | | | | |
| | | | | | | | | 51,900 | |
| | | | | | | | | | |
| | | | | | Information Technology (0.5%) | |
| | 4 | | | | | Google, Inc.
Call, 01/17/15, Strike $750.00 | | | 75,240 | |
| | 60 | | | | | Salesforce.com, Inc.
Call, 01/18/14, Strike $38.75 | | | 24,000 | |
| | 100 | | | | | Taiwan Semiconductor Manufacturing Company, Ltd.
Call, 01/17/15, Strike $17.50 | | | 25,750 | |
| | | | | | | | | | |
| | | | | | | | | 124,990 | |
| | | | | | | | | | |
| | | | | | TOTAL PURCHASED OPTIONS | | | 277,990 | |
| | | | | | | | | | |
| | | | | | TOTAL SYNTHETIC
CONVERTIBLE SECURITIES
(Cost $1,304,727) | | | 1,323,507 | |
| | | | | | | | | | |
| | | | | | | | | | |
NUMBER OF
SHARES | | | | | | | VALUE | |
| | CONVERTIBLE PREFERRED STOCKS (10.4%) | |
| | | | | | Energy (2.3%) | |
| | 575 | | | | | Chesapeake Energy Corp.*
5.750% | | | 593,475 | |
| | | | | | | | | | |
| | | | | | |
| See accompanying Notes to Schedule of Investments | | | | | 11 | |
Schedule of Investments June 30, 2013 (Unaudited)
| | | | | | | | | | |
NUMBER OF
SHARES | | | | | | | VALUE | |
| | | | | | | | | | |
| | | | | | Financials (3.5%) | |
| | 4,900 | | | | | Affiliated Managers Group, Inc.
5.150% | | $ | 265,519 | |
| | 1,000 | | | | | Fifth Third Bancorp
8.500% | | | 155,870 | |
| | 2,800 | | | | | MetLife, Inc.
5.000% | | | 153,412 | |
| | 270 | | | | | Wells Fargo & Company
7.500% | | | 322,380 | |
| | | | | | | | | | |
| | | | | | | | | 897,181 | |
| | | | | | | | | | |
| | | | | | Industrials (3.2%) | |
| | 1,100 | | | | | Genesee & Wyoming, Inc.
5.000% | | | 131,807 | |
| | 11,900 | | | | | United Technologies Corp.
7.500% | | | 706,384 | |
| | | | | | | | | | |
| | | | | | | | | 838,191 | |
| | | | | | | | | | |
| | | | | | Utilities (1.4%) | |
| | 4,000 | | | | | NextEra Energy, Inc.
5.889% | | | 222,160 | |
| | 2,500 | | | | | PPL Corp.
8.750% | | | 135,050 | |
| | | | | | | | | | |
| | | | | | | | | 357,210 | |
| | | | | | | | | | |
| | | | | | TOTAL CONVERTIBLE
PREFERRED STOCKS
(Cost $2,457,047) | | | 2,686,057 | |
| | | | | | | | | | |
| | | | | | | | | | |
| | COMMON STOCKS (45.9%) | |
| | | | | | Consumer Discretionary (3.3%) | |
| | 2,100 | | | | | Amazon.com, Inc.#~ | | | 583,149 | |
| | 2,750 | | | | | Home Depot, Inc. | | | 213,042 | |
| | 595 | | | | | Tupperware Brands Corp. | | | 46,226 | |
| | | | | | | | | | |
| | | | | | | | | 842,417 | |
| | | | | | | | | | |
| | | | | | Consumer Staples (9.1%) | |
| | 21,500 | | | | | Coca-Cola Company~ | | | 862,365 | |
| | 6,250 | | | | | Companhia de Bebidas das Americas | | | 233,438 | |
| | 3,800 | | | | | ConAgra Foods, Inc. | | | 132,734 | |
| | 2,125 | | | | | Costco Wholesale Corp. | | | 234,961 | |
| | 2,100 | | | | | Kellogg Company | | | 134,883 | |
| | 3,100 | | | | | Lorillard, Inc. | | | 135,408 | |
| | 3,500 | | | | | Philip Morris International, Inc. | | | 303,170 | |
| | 2,500 | | | | | Wal-Mart Stores, Inc. | | | 186,225 | |
| | 3,000 | | | | | Walgreen Company | | | 132,600 | |
| | | | | | | | | | |
| | | | | | | | | 2,355,784 | |
| | | | | | | | | | |
| | | | | | Energy (4.8%) | |
| | 2,100 | | | | | EOG Resources, Inc. | | | 276,528 | |
| | 2,900 | | | | | National Oilwell Varco, Inc. | | | 199,810 | |
| | 3,100 | | | | | Occidental Petroleum Corp. | | | 276,613 | |
| | 6,800 | | | | | Schlumberger, Ltd. | | | 487,288 | |
| | | | | | | | | | |
| | | | | | | | | 1,240,239 | |
| | | | | | | | | | |
| | | | | | | | | | |
NUMBER OF
SHARES | | | | | | | VALUE | |
| | | | | | | | | | |
| | | | | | Financials (6.7%) | |
| | 2,600 | | | | | Citigroup, Inc. | | $ | 124,722 | |
| | 2,500 | | | | | Franklin Resources, Inc. | | | 340,050 | |
| | 915 | | | | | Goldman Sachs Group, Inc. | | | 138,394 | |
| | 6,500 | | | | | JPMorgan Chase & Company | | | 343,135 | |
| | 7,500 | | | | | T. Rowe Price Group, Inc. | | | 548,625 | |
| | 5,800 | | | | | Wells Fargo & Company | | | 239,366 | |
| | | | | | | | | | |
| | | | | | | | | 1,734,292 | |
| | | | | | | | | | |
| | | | | | Health Care (3.9%) | |
| | 1,150 | | | | | Celgene Corp.# | | | 134,446 | |
| | 6,900 | | | | | Johnson & Johnson~ | | | 592,434 | |
| | 6,000 | | | | | Merck & Company, Inc. | | | 278,700 | |
| | | | | | | | | | |
| | | | | | | | | 1,005,580 | |
| | | | | | | | | | |
| | | | | | Industrials (3.9%) | |
| | 2,500 | | | | | Caterpillar, Inc. | | | 206,225 | |
| | 5,000 | | | | | Dover Corp. | | | 388,300 | |
| | 6,150 | | | | | Eaton Corp., PLC | | | 404,731 | |
| | | | | | | | | | |
| | | | | | | | | 999,256 | |
| | | | | | | | | | |
| | | | | | Information Technology (14.2%) | |
| | 7,400 | | | | | Accenture, PLC - Class A | | | 532,504 | |
| | 2,000 | | | | | Apple, Inc. | | | 792,160 | |
| | 12,800 | | | | | Cisco Systems, Inc. | | | 311,168 | |
| | 10,235 | | | | | eBay, Inc.#~ | | | 529,354 | |
| | 520 | | | | | MasterCard, Inc. - Class A | | | 298,740 | |
| | 12,000 | | | | | Oracle Corp. | | | 368,640 | |
| | 9,700 | | | | | QUALCOMM, Inc. | | | 592,476 | |
| | 220 | | | KRW | | Samsung Electronics Company, Ltd. | | | 257,142 | |
| | | | | | | | | | |
| | | | | | | | | 3,682,184 | |
| | | | | | | | | | |
| | | | | | TOTAL COMMON STOCKS
(Cost $9,775,236) | | | 11,859,752 | |
| | | | | | | | | | |
| | | | | | | | | | |
| | SHORT TERM INVESTMENT (3.3%) | |
| | 849,747 | | | | | Fidelity Prime Money Market Fund - Institutional Class
(Cost $849,747) | | | 849,747 | |
| | | | | | | | | | |
| | | | | | TOTAL INVESTMENTS (100.3%)
(Cost $23,178,330) | | | 25,922,640 | |
| | | | | | | | | | |
| |
| | LIABILITIES, LESS OTHER ASSETS (-0.3%) | | | (83,476 | ) |
| | | | | | | | | | |
| |
| | NET ASSETS (100.0%) | | $ | 25,839,164 | |
| | | | | | | | | | |
| | | | |
| 12 | | CALAMOS GROWTH AND INCOME PORTFOLIO SEMIANNUAL REPORT | | See accompanying Notes to Schedule of Investments |
Schedule of Investments June 30, 2013 (Unaudited)
FORWARD FOREIGN CURRENCY CONTRACTS
| | | | | | | | | | | | | | | | |
COUNTER
PARTY | | SHORT CONTRACTS | | SETTLEMENT DATE | | LOCAL CURRENCY | | | CURRENT
VALUE | | | UNREALIZED
GAIN/LOSS | |
| JPMorgan Chase Bank | | Brazilian Real | | 07/18/13 | | | 497,000 | | | $ | 221,929 $ | | | | 26,087 | |
| Northern Trust Company | | Brazilian Real | | 07/18/13 | | | 2,000 | | | | 893 | | | | 64 | |
| Citibank N.A. | | British Pound Sterling | | 07/18/13 | | | 148,000 | | | | 225,076 | | | | 2,926 | |
| Citibank N.A. | | Danish Krone | | 07/18/13 | | | 122,000 | | | | 21,295 | | | | (158 | ) |
| Goldman Sachs Capital Markets LP | | Danish Krone | | 07/18/13 | | | 1,728,000 | | | | 301,615 | | | | 1,516 | |
| Goldman Sachs Capital Markets LP | | European Monetary Unit | | 07/18/13 | | | 63,000 | | | | 82,009 | | | | (679 | ) |
| Northern Trust Company | | European Monetary Unit | | 07/18/13 | | | 1,073,000 | | | | 1,396,758 | | | | 7,895 | |
| Citibank N.A. | | Norwegian Krone | | 07/18/13 | | | 208,000 | | | | 34,224 | | | | 1,271 | |
| Goldman Sachs Capital Markets LP | | Norwegian Krone | | 07/18/13 | | | 780,000 | | | | 128,339 | | | | 7,406 | |
| Northern Trust Company | | Norwegian Krone | | 07/18/13 | | | 533,000 | | | | 87,698 | | | | 4,720 | |
| Northern Trust Company | | South Korean Won | | 07/18/13 | | | 265,841,000 | | | | 232,581 | | | | 4,454 | |
| Bank of America N.A. | | Swedish Krona | | 07/18/13 | | | 128,000 | | | | 19,080 | | | | 261 | |
| Northern Trust Company | | Swedish Krona | | 07/18/13 | | | 912,000 | | | | 135,945 | | | | 6,762 | |
| | | | | | | | | | | | | | | | |
| | | | | | | | | | | | | | | 62,525 | |
| | | | | | | | | | | | | | | | |
| | | | | |
COUNTER
PARTY | | LONG CONTRACTS | | SETTLEMENT DATE | | LOCAL CURRENCY | | | CURRENT
VALUE | | | UNREALIZED
GAIN/LOSS | |
| JPMorgan Chase Bank | | Brazilian Real | | 07/18/13 | | | 32,000 | | | $ | 14,289 | | | $ | (640 | ) |
| Citibank N.A. | | British Pound Sterling | | 07/18/13 | | | 12,000 | | | | 18,249 | | | | (49 | ) |
| Citibank N.A. | | Danish Krone | | 07/18/13 | | | 499,000 | | | | 87,098 | | | | (303 | ) |
| Northern Trust Company | | Danish Krone | | 07/18/13 | | | 1,351,000 | | | | 235,811 | | | | (333 | ) |
| Citibank N.A. | | European Monetary Unit | | 07/18/13 | | | 253,000 | | | | 329,338 | | | | (3,524 | ) |
| UBS AG | | European Monetary Unit | | 07/18/13 | | | 129,000 | | | | 167,923 | | | | (608 | ) |
| Bank of America N.A. | | Norwegian Krone | | 07/18/13 | | | 89,000 | | | | 14,644 | | | | (750 | ) |
| Citibank N.A. | | Norwegian Krone | | 07/18/13 | | | 159,000 | | | | 26,161 | | | | (132 | ) |
| UBS AG | | Norwegian Krone | | 07/18/13 | | | 124,000 | | | | 20,403 | | | | (838 | ) |
| Barclays Bank PLC | | Swedish Krona | | 07/18/13 | | | 128,000 | | | | 19,080 | | | | (479 | ) |
| | | | | | | | | | | | | | | | |
| | | | | | | | | | | | | | $ | (7,656 | ) |
| | | | | | | | | | | | | | | | |
NOTES TO SCHEDULE OF INVESTMENTS
| * | Securities issued and sold pursuant to a Rule 144A transaction are excepted from the registration requirement of the Securities Act of 1933, as amended. These securities may only be sold to qualified institutional buyers (“QIBs”), such as the Portfolio. Any resale of these securities must generally be effected through a sale that is registered under the Act or otherwise exempted from such registration requirements. |
| § | Securities exchangeable or convertible into securities of one or more entities that are different than the issuer. Each entity is identified in the parenthetical. |
| ‡ | Variable rate or step bond security. The rate shown is the rate in effect at June 30, 2013. |
| # | Non-income producing security. |
| ~ | Security, or portion of security, is segregated as collateral (or potential collateral for future transactions) for written options. The aggregate value of such securities is $671,632. |
FOREIGN CURRENCY ABBREVIATIONS
| | |
| EUR | | European Monetary Unit |
| KRW | | South Korean Won |
| SGD | | Singapore Dollar |
Note: Value for securities denominated in foreign currencies is shown in U.S. dollars. The principal amount for such securities is shown in the respective foreign currency. The date on options represents the expiration date of the option contract. The option contract may be exercised at any date on or before the date shown.
| | | | | | |
| See accompanying Notes to Financial Statements | | | | | 13 | |
Statement of Assets and Liabilities June 30, 2013 (Unaudited)
| | | | |
ASSETS | | | | |
Investments in securities, at value (cost $23,178,330) | | $ | 25,922,640 | |
Unrealized appreciation on forward foreign currency contracts | | | 65,622 | |
Receivables: | | | | |
Accrued interest and dividends | | | 71,899 | |
Investments sold | | | 84,205 | |
Portfolio shares sold | | | 2,164 | |
Prepaid expenses | | | 2,128 | |
Other assets | | | 72,504 | |
Total assets | | | 26,221,162 | |
LIABILITIES | | | | |
Unrealized depreciation on forward foreign currency contracts | | | 10,753 | |
Payables: | | | | |
Investments purchased | | | 234,400 | |
Portfolio shares redeemed | | | 1,565 | |
Affiliates: | | | | |
Investment advisory fees | | | 16,136 | |
Deferred compensation to trustees | | | 72,504 | |
Financial accounting fees | | | 247 | |
Trustees’ fees and officer compensation | | | 203 | |
Other accounts payable and accrued liabilities | | | 46,190 | |
Total liabilities | | | 381,998 | |
NET ASSETS | | $ | 25,839,164 | |
COMPOSITION OF NET ASSETS | | | | |
Paid in capital | | $ | 22,249,872 | |
Undistributed net investment income (loss) | | | (62,475 | ) |
Accumulated net realized gain (loss) on investments and foreign currency transactions | | | 852,399 | |
Unrealized appreciation (depreciation) of investments, foreign currency translations and written options | | | 2,799,368 | |
NET ASSETS | | $ | 25,839,164 | |
Shares outstanding (no par value; unlimited number of shares authorized) | | | 1,789,514 | |
Net asset value and redemption price per share | | $ | 14.44 | |
| | | | |
| 14 | | CALAMOS GROWTH AND INCOME PORTFOLIO SEMIANNUAL REPORT | | See accompanying Notes to Financial Statements |
Statement of Operations Six Months Ended June 30, 2013 (Unaudited)
| | | | |
INVESTMENT INCOME | | | | |
Interest | | $ | 178,657 | |
Dividends | | | 187,594 | |
Dividend taxes withheld | | | (1,767 | ) |
Total investment income | | | 364,484 | |
| |
EXPENSES | | | | |
Investment advisory fees | | | 99,847 | |
Audit fees | | | 28,068 | |
Legal fees | | | 14,399 | |
Printing and mailing fees | | | 13,139 | |
Trustees’ fees and officer compensation | | | 7,097 | |
Custodian fees | | | 6,397 | |
Accounting fees | | | 6,382 | |
Transfer agent fees | | | 3,800 | |
Financial accounting fees | | | 1,527 | |
Other | | | 2,926 | |
Total expenses | | | 183,582 | |
NET INVESTMENT INCOME (LOSS) | | | 180,902 | |
| |
REALIZED AND UNREALIZED GAIN (LOSS) | | | | |
Net realized gain (loss) from: | | | | |
Investments, excluding purchased options | | | 988,662 | |
Purchased options | | | (55,472 | ) |
Foreign currency transactions | | | (71,818 | ) |
Written options | | | 12,050 | |
Change in net unrealized appreciation/(depreciation) on: | | | | |
Investments, excluding purchased options | | | (412,466 | ) |
Purchased options | | | 65,535 | |
Foreign currency translations | | | 130,253 | |
Written options | | | 8,905 | |
NET GAIN (LOSS) | | | 665,649 | |
NET INCREASE (DECREASE) IN NET ASSETS RESULTING FROM OPERATIONS | | $ | 846,551 | |
| | | | | | |
| See accompanying Notes to Financial Statements | | | | | 15 | |
Statements of Changes in Net Assets
| | | | | | | | |
| | | (UNAUDITED)
SIX MONTHS ENDED
JUNE 30,
2013 | | | YEAR ENDED
DECEMBER 31,
2012 | |
OPERATIONS | | | | | | | | |
Net investment income (loss) | | $ | 180,902 | | | $ | 398,538 | |
Net realized gain (loss) | | | 873,422 | | | | 763,314 | |
Change in unrealized appreciation/(depreciation) | | | (207,773 | ) | | | 968,314 | |
Net increase (decrease) in net assets resulting from operations | | | 846,551 | | | | 2,130,166 | |
| | |
DISTRIBUTIONS TO SHAREHOLDERS | | | | | | | | |
Net investment income | | | (130,019 | ) | | | (550,059 | ) |
Net realized gains | | | — | | | | (343,663 | ) |
Total distributions | | | (130,019 | ) | | | (893,722 | ) |
| | |
CAPITAL SHARE TRANSACTIONS | | | | | | | | |
Issued | | | 777,421 | | | | 3,833,227 | |
Issued in reinvestment of distributions | | | 130,019 | | | | 893,722 | |
Redeemed | | | (2,429,839 | ) | | | (4,423,606 | ) |
Net increase (decrease) in net assets from capital share transactions | | | (1,522,399 | ) | | | 303,343 | |
TOTAL INCREASE (DECREASE) IN NET ASSETS | | | (805,867 | ) | | | 1,539,787 | |
| | |
NET ASSETS | | | | | | | | |
Beginning of period | | $ | 26,645,031 | | | $ | 25,105,244 | |
End of period | | | 25,839,164 | | | | 26,645,031 | |
Undistributed net investment income (loss) | | $ | (62,475 | ) | | $ | (113,358 | ) |
| | |
CAPITAL SHARE TRANSACTIONS | | | | | | | | |
Shares issued | | | 53,194 | | | | 270,819 | |
Shares issued in reinvestment of distributions | | | 9,017 | | | | 62,725 | |
Shares redeemed | | | (166,459 | ) | | | (312,014 | ) |
Net increase (decrease) in capital shares outstanding | | | (104,248 | ) | | | 21,530 | |
| | | | |
| 16 | | CALAMOS GROWTH AND INCOME PORTFOLIO SEMIANNUAL REPORT | | See accompanying Notes to Financial Statements |
Notes to Financial Statements (Unaudited)
Note 1 – Organization And Significant Accounting Policies
Organization. CALAMOS ADVISORS TRUST (the “Trust”), a Massachusetts business trust organized February 17, 1999, consists of a single series, Calamos Growth and Income Portfolio (the “Portfolio”), and commenced operations on May 19, 1999. The Trust currently offers the Portfolio’s shares to certain life insurance companies for allocation to certain separate accounts established for the purpose of funding qualified and non-qualified variable annuity contracts and variable life insurance contracts. The Portfolio seeks high long-term total return through growth and current income.
Portfolio Valuation. The valuation of the Portfolio’s investments is in accordance with policies and procedures adopted by and under the ultimate supervision of the board of trustees.
Portfolio securities that are traded on U.S. securities exchanges, except option securities, are valued at the official closing price, which is the last current reported sales price on its principle exchange at the time the Portfolio determines its net asset value (“NAV”). Securities traded in the over-the-counter market and quoted on The NASDAQ Stock Market are valued at the NASDAQ Official Closing Price, as determined by NASDAQ, or lacking a NASDAQ Official Closing Price, the last current reported sale price on NASDAQ at the time the Portfolio determines its NAV. When a last sale or closing price is not available, equity securities, other than option securities, that are traded on a U.S. securities exchange and other equity securities traded in the over-the-counter market are valued at the mean between the most recent bid and asked quotations on its principle exchange in accordance with guidelines adopted by the board of trustees. Each option security traded on a U.S. securities exchange is valued at the mid-point of the consolidated bid/ask quote for the option security, also in accordance with guidelines adopted by the board of trustees. Each over-the-counter option that is not traded through the Options Clearing Corporation is valued based on a quotation provided by the counterparty to such option under the ultimate supervision of the board of trustees.
Fixed income securities, certain convertible preferred securities, and non-exchange traded derivatives are normally valued by independent pricing services or by dealers or brokers who make markets in such securities. Valuations of such fixed income securities, certain convertible preferred securities, and non-exchange traded derivatives consider yield or price of equivalent securities of comparable quality, coupon rate, maturity, type of issue, trading characteristics and other market data and do not rely exclusively upon exchange or over-the-counter prices.
Trading on European and Far Eastern exchanges and over-the-counter markets is typically completed at various times before the close of business on each day on which the New York Stock Exchange (“NYSE”) is open. Each security trading on these exchanges or over-the-counter markets may be valued utilizing a systematic fair valuation model provided by an independent pricing service approved by the board of trustees. The valuation of each security that meets certain criteria in relation to the valuation model is systematically adjusted to reflect the impact of movement in the U.S. market after the foreign markets close. Securities that do not meet the criteria, or that are principally traded in other foreign markets, are valued as of the last reported sale price at the time the Portfolio determines its NAV, or when reliable market prices or quotations are not readily available, at the mean between the most recent bid and asked quotations as of the close of the appropriate exchange or other designated time. Trading of foreign securities may not take place on every NYSE business day. In addition, trading may take place in various foreign markets on Saturdays or on other days when the NYSE is not open and on which the Portfolio’s NAV is not calculated.
If the pricing committee determines that the valuation of a security in accordance with the methods described above is not reflective of a fair value for such security, the security is valued at a fair value by the pricing committee, under the ultimate supervision of the board of trustees, following the guidelines and/or procedures adopted by the board of trustees.
The Portfolio also may use fair value pricing, pursuant to guidelines adopted by the board of trustees and under the ultimate supervision of the board of trustees, if trading in the security is halted or if the value of a security it holds is materially affected by events occurring before the Portfolio’s pricing time but after the close of the primary market or exchange on which the security is listed. Those procedures may utilize valuations furnished by pricing services approved by the board of trustees, which may be based on market transactions for comparable securities and various relationships between securities that are generally recognized by institutional traders, a computerized matrix system, or appraisals derived from information concerning the securities or similar securities received from recognized dealers in those securities.
When fair value pricing of securities is employed, the prices of securities used by the Portfolio to calculate its NAV may differ from market quotations or official closing prices. In light of the judgment involved in fair valuations, there can be no assurance that a fair value assigned to a particular security is accurate.
Notes to Financial Statements (Unaudited)
Investment Transactions. Investment transactions are recorded on a trade date basis as of June 30, 2013. Net realized gains and losses from investment transactions are reported on an identified cost basis. Interest income is recognized using the accrual method and includes accretion of original issue and market discount and amortization of premium. Dividend income is recognized on the ex-dividend date, except that certain dividends from foreign securities are recorded as soon as the information becomes available after the ex-dividend date.
Foreign Currency Translation. Values of investments and other assets and liabilities denominated in foreign currencies are translated into U.S. dollars using a rate quoted by a major bank or dealer in the particular currency market, as reported by a recognized quotation dissemination service.
The Portfolio does not isolate that portion of the results of operations resulting from changes in foreign exchange rates on investments from the fluctuations arising from changes in market prices of securities held. Such fluctuations are included with the net realized and unrealized gain or loss from investments.
Reported net realized foreign currency gains or losses arise from disposition of foreign currency, the difference in the foreign exchange rates between the trade and settlement dates on securities transactions, and the difference between the amounts of dividends, interest and foreign withholding taxes recorded on the ex-date or accrual date and the U.S. dollar equivalent of the amounts actually received or paid. Net unrealized foreign exchange gains and losses arise from changes (due to the changes in the exchange rate) in the value of foreign currency and other assets and liabilities denominated in foreign currencies held at period end.
Allocation of Expenses Among Funds. Expenses directly attributable to the Portfolio are charged to the Portfolio; certain other common expenses of Calamos Advisors Trust, Calamos Investment Trust, Calamos Convertible Opportunities and Income Fund, Calamos Convertible and High Income Fund, Calamos Strategic Total Return Fund, Calamos Global Total Return Fund and Calamos Global Dynamic Income Fund are allocated proportionately among the Portfolio and each fund to which the expenses relate in relation to the net assets of each fund or on another reasonable basis.
Use of Estimates. The preparation of financial statements in conformity with U.S. generally accepted accounting principles requires management to make estimates and assumptions that affect the amounts reported in the financial statements and accompanying notes. Actual results may differ from those estimates.
Income Taxes. No provision has been made for U.S. income taxes because the Trust’s policy is to continue to qualify as a regulated investment company under the Internal Revenue Code of 1986, as amended, and distribute to shareholders substantially all of the Portfolio’s taxable income and net realized gains.
Dividends and distributions paid to shareholders are recorded on the ex-dividend date. The amount of dividends and distributions from net investment income and net realized capital gains is determined in accordance with federal income tax regulations, which may differ from U.S. generally accepted accounting principles. To the extent these “book/tax” differences are permanent in nature, such amounts are reclassified within the capital accounts based on their federal tax-basis treatment. These differences are primarily due to differing treatments for foreign currency transactions, contingent payment debt instruments and methods of amortizing and accreting for fixed income securities. The financial statements are not adjusted for temporary differences.
The Portfolio recognized no liability for uncertain tax positions. A reconciliation is not provided as the beginning and ending amounts of unrecognized benefits are zero, with no interim additions, reductions or settlements. Tax years 2010 – 2012 remain subject to examination by the U.S. and the State of Illinois tax jurisdictions.
Indemnifications. Under the Trust’s organizational documents, the Trust is obligated to indemnify its officers and trustees against certain liabilities incurred by them by reason of having been an officer or trustee of the Trust. In addition, in the normal course of business, the Trust may enter into contracts that provide general indemnifications to other parties. The Portfolio’s maximum exposure under these arrangements is unknown as this would involve future claims that may be made against the Portfolio that have not yet occurred. Currently, the Portfolio’s management expects the risk of material loss in connection to a potential claim to be remote.
Note 2 – Investment Adviser and Transactions With Affiliates Or Certain Other Parties
Pursuant to an investment advisory agreement with Calamos Advisors LLC (“Calamos Advisors”), the Portfolio pays a monthly investment advisory fee based on the average daily net assets of the Portfolio at the annual rate of 0.75%.
| | | | |
| 18 | | CALAMOS GROWTH AND INCOME PORTFOLIO SEMIANNUAL REPORT | | |
Notes to Financial Statements (Unaudited)
Pursuant to a financial accounting services agreement, during the period the Portfolio paid Calamos Advisors a fee for financial accounting services payable monthly at the annual rate of 0.0175% on the first $1 billion of combined assets, 0.0150% on the next $1 billion of combined assets and 0.0110% on combined assets above $2 billion (for purposes of this calculation “combined assets” means the sum of the total average daily net assets of Calamos Investment Trust, Calamos Advisors Trust and the total average weekly managed assets of Calamos Convertible and High Income Fund, Calamos Strategic Total Return Fund, Calamos Convertible Opportunities and Income Fund, Calamos Global Total Return Fund and Calamos Global Dynamic Income Fund). Financial accounting services include, but are not limited to, the following: managing expenses and expense payment processing; monitoring the calculation of expense accrual amounts; calculating, tracking and reporting tax adjustments on all assets; and monitoring trustee deferred compensation plan accruals and valuations. The Portfolio pays its pro rata share of the financial accounting services fee payable to Calamos Advisors based on its relative portion of combined assets used in calculating the fee.
The Portfolio reimburses Calamos Advisors for a portion of compensation paid to the Trust’s Chief Compliance Officer. This compensation is reported as part of “Trustees’ fees and officer compensation” expense on the Statement of Operations.
Pursuant to an agreement with US Bancorp Fund Services, LLC, the Portfolio’s transfer agent (“US Bancorp”), Calamos Financial Services LLC (“CFS”) provides certain shareholder administrative services to US Bancorp. CFS receives from US Bancorp an annual aggregate fee of $175,000, paid in monthly installments, for providing these services which relate to Calamos Advisors Trust and Calamos Investment Trust. Also, US Bancorp pays license fees to unaffiliated third parties for CFS’ utilization of certain transfer agent and phone systems in providing the shareholder administrative services. The fees paid to CFS and the payment of license fees to third parties are borne by US Bancorp. The Portfolio has not assumed or incurred any additional expenses in connection with CFS providing these services to US Bancorp, and the transfer agency fees payable by the Portfolio to US Bancorp have not increased as a result thereof.
Certain officers of the Trust are also officers of CFS and Calamos Advisors. Such trustee and officers serve without direct compensation from the Trust. The Portfolio’s Statement of Additional Information contains additional information about the Portfolio’s trustees and is available upon request without charge by calling our toll free number 800.582.6959.
The Trust has adopted a deferred compensation plan (the “Plan”). Under the Plan, a trustee who is not an “interested person” (as defined in the 1940 Act) and has elected to participate in the Plan (a “participating trustee”) may defer receipt of all or a portion of his compensation from the Trust. The deferred compensation payable to the participating trustee is credited to the trustee’s deferral account as of the business day such compensation would have been paid to the participating trustee. The value of amounts deferred for a participating trustee is determined by reference to the change in value of Class I shares of one or more funds of Calamos Investment Trust designated by the participant. The value of the account increases with contributions to the account or with increases in the value of the measuring shares, and the value of the account decreases with withdrawals from the account or with declines in the value of the measuring shares. Deferred compensation of $72,504 is included in “Other assets” on the Statement of Assets and Liabilities at June 30, 2013. The Portfolio’s obligation to make payments under the Plan is a general obligation of the Portfolio and is included in “Payable for deferred compensation to trustees” on the Statement of Assets and Liabilities at June 30, 2013.
Note 3 – Investments
The cost of purchases and proceeds from sale of long-term investments for the period ended June 30, 2013 were as follows:
| | | | |
| Cost of purchases | | $ | 10,530,152 | |
| Proceeds from sales | | | 11,704,147 | |
The following information is presented on a federal income tax basis as of June 30, 2013. Differences between the cost basis under U.S. generally accepted accounting principles and federal income tax purposes are primarily due to temporary differences.
The cost basis of investments for federal income tax purposes at June 30, 2013 was as follows:
| | | | |
| Cost basis of investments | | $ | 23,119,692 | |
| | | | |
| Gross unrealized appreciation | | | 3,523,408 | |
| Gross unrealized depreciation | | | (720,460 | ) |
| | | | |
| Net unrealized appreciation (depreciation) | | $ | 2,802,948 | |
| | | | |
Notes to Financial Statements (Unaudited)
Note 4 – Income Taxes
The tax character of distributions for the period ended June 30, 2013 will be determined at the end of the Portfolio’s current fiscal year.
Distributions for the fiscal period ended December 31, 2012 were characterized for federal income tax purposes as follows:
| | | | |
| Distributions paid from: | | | | |
| Ordinary income | | $ | 550,066 | |
| Long-term capital gains | | | 343,656 | |
As of December 31, 2012, the components of accumulated earnings/(loss) on a tax basis were as follows:
| | | | |
| Undistributed ordinary income | | $ | 64,918 | |
| Undistributed capital gains | | | — | |
| | | | |
| Total undistributed earnings | | | 64,918 | |
| Accumulated capital and other losses | | | — | |
| Net unrealized gains/(losses) | | | 2,801,972 | |
| | | | |
| Total accumulated earnings/(losses) | | | 2,866,890 | |
| Other | | | 5,870 | |
| Paid-in capital | | | 23,772,271 | |
| | | | |
| Net assets applicable to common shareholders | | $ | 26,645,031 | |
| | | | |
The Regulated Investment Company Modernization Act of 2010 (the “Act”) modernized various tax rules for regulated investment companies, and was effective for taxable years beginning after the enactment date of December 22, 2010. One significant change is to the treatment of capital loss carryforwards. Now, any capital losses recognized will retain their character as either short-term or long-term capital losses, will be utilized before the pre-Act capital loss carryforwards, and will be carried forward indefinitely, until applied in offsetting future capital gains.
Note 5 – Derivative Instruments
Foreign Currency Risk. The Portfolio engages in portfolio hedging with respect to changes in currency exchange rates by entering into forward foreign currency contracts to purchase or sell currencies. A forward foreign currency contract is a commitment to purchase or sell a foreign currency at a future date at a negotiated forward rate. Risks associated with such contracts include, among other things, movement in the value of the foreign currency relative to the U.S. dollar and the ability of the counterparty to perform. The Portfolio may enter into an International Swaps and Derivatives Association, Inc. Master Agreement (“ISDA Master Agreement”) or similar agreement with its derivative contract counterparties to facilitate the use of derivatives. An ISDA Master Agreement is a bilateral agreement between the Portfolio and a counterparty that governs the use of derivatives and foreign exchange contracts and typically contains, among other things, collateral posting terms and netting provisions in the event of a default and/or termination event. Under an ISDA Master Agreement, the Portfolio may, under certain circumstances, offset with the counterparty certain derivative financial instrument’s payables and/or receivables with collateral held and/or posted and create one single net payment. The provisions of the ISDA Master Agreement typically permit a single net payment in the event of default (close-out netting) including the bankruptcy or insolvency of the counterparty. Generally, collateral is exchanged between the Portfolio and the counterparty and the amount of collateral due from the Portfolio or to a counterparty has to exceed a minimum transfer amount threshold before a transfer has to be made. To the extent amounts due to the Portfolio from its counterparties are not fully collateralized, contractually or otherwise, the Portfolio bears the risk of loss from counterparty nonperformance. For financial reporting purposes, the Portfolio does not offset derivative assets and derivative liabilities that are subject to netting arrangements in the Statement of Assets and Liabilities. The Portfolio’s net counterparty exposure is reflected in the counterparty table below. The net unrealized gain, if any, represents the credit risk to the Portfolio on a forward foreign currency contract. The contracts are valued daily at forward foreign exchange rates. The Portfolio realizes a gain or loss when a position is closed or upon settlement of the contracts. As of June 30, 2013, the Portfolio had outstanding forward foreign currency contracts as listed on the Schedule of Investments.
Equity Risk. The Portfolio engages in option transactions and in doing so achieves similar objectives to what it would achieve through the sale or purchase of individual securities. A call option, upon payment of a premium, gives the purchaser of the option the right to buy, and the seller of the option the obligation to sell, the underlying security, index or other instrument at the exercise price.
| | | | |
| 20 | | CALAMOS GROWTH AND INCOME PORTFOLIO SEMIANNUAL REPORT | | |
Notes to Financial Statements (Unaudited)
A put option gives the purchaser of the option, upon payment of a premium, the right to sell, and the seller the obligation to buy, the underlying security, index, or other instrument at the exercise price.
To seek to offset some of the risk of a potential decline in value of certain long positions, the Portfolio may also purchase put options on individual securities, broad-based securities indexes or certain exchange traded funds (“ETFs”). The Portfolio may also seek to generate income from option premiums by writing (selling) options on a portion of the equity securities (including securities that are convertible into equity securities) in the Portfolio, on broad-based securities indexes, or certain ETFs.
When the Portfolio purchases an option, it pays a premium and an amount equal to that premium is recorded as an asset. When the Portfolio writes an option, it receives a premium and an amount equal to that premium is recorded as a liability. The asset or liability is adjusted daily to reflect the current market value of the option. If an option expires unexercised, the Portfolio realizes a gain or loss to the extent of the premium received or paid. If an option is exercised, the premium received or paid is recorded as an adjustment to the proceeds from the sale or the cost basis of the purchase. The difference between the premium and the amount received or paid on a closing purchase or sale transaction is also treated as a realized gain or loss. The cost of securities acquired through the exercise of call options is increased by premiums paid. The proceeds from securities sold through the exercise of put options are decreased by the premiums paid. Gain or loss on written options and purchased options is presented separately as net realized gain or loss on written options and net realized gain or loss on purchased options, respectively.
Options written by the Portfolio do not typically give rise to counterparty credit risk since options written obligate the Portfolio and not the counterparty to perform. Exchange traded purchased options have reduced counterparty credit risk to the Portfolio since the exchange’s clearinghouse, as counterparty to such instruments, guarantees against a possible default.
As of June 30, 2013, the Portfolio had outstanding purchased options and/or written options as listed on the Schedule of Investments. For the period ended June 30, 2013, the Portfolio had the following transactions in options written:
| | | | | | | | |
| | | NUMBER OF
CONTRACTS | | | PREMIUMS
RECEIVED | |
| Options outstanding at December 31, 2012 | | | 50 | | | $ | 10,595 | |
| Options written | | | 130 | | | | 23,424 | |
| Options closed | | | (52 | ) | | | (15,828 | ) |
| Options exercised | | | (128 | ) | | | (18,191 | ) |
| Options expired | | | — | | | | — | |
| | | | |
| Options outstanding at June 30, 2013 | | | — | | | $ | — | |
As of June 30, 2013, the Portfolio had outstanding derivative contracts which are reflected on the Statement of Assets and Liabilities as follows:
| | | | | | | | |
| Gross amounts at fair value: | | ASSET
DERIVATIVES | | | LIABILITY
DERIVATIVES | |
| Forward foreign currency contracts (1) | | $ | 65,622 | | | $ | 10,753 | |
| Options purchased (2) | | | 277,990 | | | | | |
| | | | |
| | $ | 343,612 | | | $ | 10,753 | |
| | | | |
| | | | | | | | | | | | | | | | |
| | | GROSS AMOUNTS NOT OFFSET IN THE STATEMENT OF ASSETS AND LIABILITIES | |
| | | GROSS AMOUNTS PRESENTED IN THE STATEMENT OF ASSETS AND LIABILITIES | | | | | | | |
| Counterparty | | ASSETS | | | LIABILITIES | | | COLLATERAL PLEDGED | | | NET AMOUNT
(NOT LESS THAN $0) | |
| Bank of America N.A. | | $ | 261 | | | $ | 750 | | | $ | — | | | $ | — | |
| Barclays Bank PLC | | | | | | | 479 | | | | — | | | | — | |
| Goldman Sachs Capital Markets LP | | | 9,732 | | | | 1,490 | | | | — | | | | 8,242 | |
| Northern Trust Company | | | 25,345 | | | | 1,783 | | | | — | | | | 23,562 | |
| Other derivatives (3) | | | 308,274 | | | | 6,251 | | | | 671,632 | | | | — | |
| | | | |
| | $ | 343,612 | | | $ | 10,753 | | | $ | 671,632 | | | $ | 31,804 | |
| | | | |
| (1) | Generally, the Statement of Assets and Liabilities location for Forward foreign currency contracts is Unrealized appreciation on forward foreign currency contracts for asset derivatives and Unrealized depreciation on forward foreign currency contracts for liability derivatives. |
| (2) | Generally, the Statement of Assets and Liabilities location for Options purchased is Investments in securities. |
| (3) | Other derivates are not subject to a master netting agreement which include exchange traded purchased options and forward foreign currency contracts. Collateral pledged includes a minimum margin amount required for written options. |
Notes to Financial Statements (Unaudited)
For the period ended June 30, 2013, the volume of derivative activity for the Portfolio is reflected below*:
| | | | |
| | | DERIVATIVE TYPE | |
| Forward foreign currency contracts | | $ | 11,397,501 | |
| Options purchased | | | 349 | |
| Options written | | | 130 | |
| * | Activity during the period is measured by opened number of contracts for options purchased or written and opened forward foreign currency contracts (measured in notional). |
Note 6 – Synthetic Convertible Securities
The Portfolio may establish a “synthetic” convertible instrument by combining separate securities that possess the economic characteristics similar to a convertible security, i.e., fixed-income securities (“fixed-income component”), which may be a convertible or non-convertible security and the right to acquire equity securities (“convertible component”). The fixed-income component is achieved by investing in fixed income securities such as bonds, preferred stocks, and money market instruments. The convertible component is achieved by investing in warrants or purchased options to buy common stock at a certain exercise price, or options on a stock index. In establishing a synthetic instrument, the Portfolio may pool a basket of fixed-income securities and a basket of warrants or purchased options that produce the economic characteristics similar to a convertible security. Within each basket of fixed-income securities and warrants or options, different companies may issue the fixed-income and convertible components, which may be purchased separately and at different times.
The Portfolio may also purchase synthetic securities created by other parties, typically investment banks, including convertible structured notes. Convertible structured notes are fixed-income debentures linked to equity. Convertible structured notes have the attributes of a convertible security; however, the investment bank that issued the convertible note assumes the credit risk associated with the investment, rather than the issuer of the underlying common stock into which the note is convertible. Purchasing synthetic convertible securities may offer more flexibility than purchasing a convertible security.
Note 7 – Fair Value Measurements
Various inputs are used to determine the value of the Portfolio’s investments. These inputs are categorized into three broad levels as follows:
| | • | | Level 1 – Prices are determined using inputs from unadjusted quoted prices from active markets (including securities actively traded on a securities exchange) for identical assets. |
| | • | | Level 2 – Prices are determined using significant observable market inputs other than unadjusted quoted prices, including quoted prices of similar securities, fair value adjustments to quoted foreign securities, interest rates, credit risk, prepayment speeds, and other relevant data. |
| | • | | Level 3 – Prices reflect unobservable market inputs (including the Portfolio’s own judgments about assumptions market participants would use in determining fair value) when observable inputs are unavailable. |
Debt securities are valued based upon evaluated prices received from an independent pricing service or from a dealer or broker who makes markets in such securities. Pricing services utilize various observable market data and as such, debt securities are generally categorized as Level 2. The levels are not necessarily an indication of the risk or liquidity of the Portfolio’s investments. Transfers between the levels for investment securities or other financial instruments are measured at the end of the reporting period.
The following is a summary of the inputs used in valuing the Portfolio’s holdings at fair value:
| | | | | | | | | | | | | | | | |
| | | LEVEL 1 | | | LEVEL 2 | | | LEVEL 3 | | | TOTAL | |
| Assets: | | | | | | | | | | | | | | | | |
Convertible Bonds | | $ | — | | | $ | 9,203,577 | | | $ | — | | | $ | 9,203,577 | |
Synthetic Convertible Securities (Corporate Bonds) | | | | | | | 1,045,517 | | | | | | | | 1,045,517 | |
Synthetic Convertible Securities (Purchased Options) | | | 277,990 | | | | | | | | | | | | 277,990 | |
Convertible Preferred Stocks | | | 1,827,063 | | | | 858,994 | | | | | | | | 2,686,057 | |
Common Stocks | | | 11,602,610 | | | | 257,142 | | | | | | | | 11,859,752 | |
Short Term Investment | | | 849,747 | | | | | | | | | | | | 849,747 | |
Forward Foreign Currency Contracts | | | | | | | 65,622 | | | | | | | | 65,622 | |
| | | | |
| Total | | $ | 14,557,410 | | | $ | 11,430,852 | | | $ | — | | | $ | 25,988,262 | |
| | | | |
| Liabilities: | | | | | | | | | | | | | | | | |
Forward Foreign Currency Contracts | | $ | — | | | $ | 10,753 | | | $ | — | | | $ | 10,753 | |
| | | | |
| Total | | $ | — | | | $ | 10,753 | | | $ | — | | | $ | 10,753 | |
| | | | |
| | | | |
| 22 | | CALAMOS GROWTH AND INCOME PORTFOLIO SEMIANNUAL REPORT | | |
Financial Highlights
Selected data for a share outstanding throughout each period were as follows:
| | | | | | | | | | | | | | | | | | | | | | | | |
| | | (Unaudited)
Six Months
Ended
June 30, | | | Year Ended December 31, | |
| | | 2013 | | | 2012 | | | 2011 | | | 2010 | | | 2009 | | | 2008 | |
Net asset value, beginning of period | | | $14.07 | | | | $13.41 | | | | $13.88 | | | | $12.69 | | | | $9.37 | | | | $14.32 | |
Income from investment operations: | | | | | | | | | | | | | | | | | | | | | | | | |
Net investment income (loss)(a) | | | 0.10 | | | | 0.21 | | | | 0.18 | | | | 0.21 | | | | 0.26 | | | | 0.18 | |
Net realized and unrealized gain (loss) | | | 0.34 | | | | 0.92 | | | | (0.44 | ) | | | 1.23 | | | | 3.36 | | | | (4.60 | ) |
Total from investment operations | | | 0.44 | | | | 1.13 | | | | (0.26 | ) | | | 1.44 | | | | 3.62 | | | | (4.42 | ) |
Distributions: | | | | | | | | | | | | | | | | | | | | | | | | |
Dividends from net investment income | | | (0.07 | ) | | | (0.29 | ) | | | (0.21 | ) | | | (0.25 | ) | | | (0.30 | ) | | | (0.13 | ) |
Dividends from net realized gains | | | — | | | | (0.18 | ) | | | — | | | | — | | | | — | | | | (0.40 | ) |
Total distributions | | | (0.07 | ) | | | (0.47 | ) | | | (0.21 | ) | | | (0.25 | ) | | | (0.30 | ) | | | (0.53 | ) |
Net asset value, end of period | | | $14.44 | | | | $14.07 | | | | $13.41 | | | | $13.88 | | | | $12.69 | | | | $9.37 | |
Ratios and supplemental data: | | | | | | | | | | | | | | | | | | | | | | | | |
Total return(b) | | | 3.14% | | | | 8.43% | | | | (1.87% | ) | | | 11.59% | | | | 39.42% | | | | (31.74% | ) |
Net assets, end of period (000) | | | $25,839 | | | | $26,645 | | | | $25,105 | | | | $26,574 | | | | $25,868 | | | | $21,035 | |
Ratio of net expenses to average net assets | | | 1.38% | (c) | | | 1.35% | | | | 1.41% | | | | 1.43% | | | | 1.30% | | | | 1.18% | |
Ratio of gross expenses to average net assets prior to expense reductions | | | 1.38% | (c) | | | 1.35% | | | | 1.41% | | | | 1.43% | | | | 1.30% | | | | 1.19% | |
Ratio of net investment income (loss) to average net assets | | | 1.36% | (c) | | | 1.46% | | | | 1.27% | | | | 1.62% | | | | 2.46% | | | | 1.53% | |
Portfolio turnover rate | | | 41.0% | | | | 44.1% | | | | 55.9% | | | | 55.1% | | | | 67.0% | | | | 85.2% | |
| (a) | Net investment income allocated based on average shares method. |
| (b) | Total return measures net investment income and capital gain or loss from portfolio investments assuming reinvestment of dividends and capital gains distributions. |
Report of Independent Registered Public Accounting Firm
To the Board of Trustees and Shareholders of Calamos Advisors Trust
We have reviewed the accompanying statement of assets and liabilities, including the schedule of investments, of Calamos Advisors Trust (the “Trust”), comprised solely of the Calamos Growth and Income Portfolio (the “Portfolio”), as of June 30, 2013, and the related interim statements of operations and changes in net assets and the financial highlights for the semi-annual period then ended. These interim financial statements and financial highlights are the responsibility of the Trust’s management.
We conducted our review in accordance with standards of the Public Company Accounting Oversight Board (United States). A review of interim financial information consists principally of applying analytical procedures and making inquiries of persons responsible for financial and accounting matters. It is substantially less in scope than an audit conducted in accordance with standards of the Public Company Accounting Oversight Board (United States), the objective of which is the expression of an opinion regarding the financial statements and financial highlights taken as a whole. Accordingly, we do not express such an opinion.
Based on our review, we are not aware of any material modifications that should be made to such interim financial statements and financial highlights for them to be in conformity with accounting principles generally accepted in the United States of America.
We have previously audited, in accordance with the standards of the Public Company Accounting Oversight Board (United States), the statement of changes in net assets of the Portfolio for the year ended December 31, 2012 and the financial highlights for each of the five years then ended, and in our report dated February 13, 2013, we expressed an unqualified opinion on such statement of changes in net assets and financial highlights.

Chicago, Illinois
August 6, 2013
| | | | |
| 24 | | CALAMOS GROWTH AND INCOME PORTFOLIO SEMIANNUAL REPORT | | |
Trustee Approval of the Management Agreement (Unaudited)
The Board of Trustees of Calamos Advisors Trust (“Board”) oversees the Portfolio’s management, and, as required by law, determines annually whether to continue the Trust’s management agreement with Calamos Advisors. Under the management agreement Calamos Advisors serves as the investment manager and administrator for the Trust and the Portfolio. The “Independent Trustees,” who comprise more than 75% of the Board, have never been affiliated with Calamos Advisors.
In connection with its most recent consideration regarding continuation of the management agreement, the Board received and reviewed a substantial amount of information provided by Calamos Advisors in response to detailed requests by the Independent Trustees and their independent legal counsel. During the course of their consideration of the management agreement, the Independent Trustees were advised by their counsel and, in addition to meeting with management of Calamos Advisors, they met separately in executive session with their counsel.
At a meeting on June 21, 2013, based on its evaluation of the information referred to above, and other information, the Board determined that the overall arrangements between the Portfolio and Calamos Advisors were fair and reasonable in light of the nature, extent and quality of the services provided by Calamos Advisors and its affiliates, the fees charged for those services and other matters that the Board considered relevant in the exercise of its business judgment. At that meeting, the Board, including all of the Independent Trustees, approved the continuation of the management agreement through July 31, 2014, subject to possible earlier termination as provided in the agreement.
In connection with its consideration of the management agreement, the Board considered, among other things: (i) the nature, quality and extent of the services provided by Calamos Advisors to the Portfolio, (ii) the investment performance of the Portfolio as well as performance information for comparable funds and other, comparable clients of Calamos Advisors, (iii) the fees and other expenses paid by the Portfolio as well as expense information for comparable funds and for other, comparable clients of Calamos Advisors, (iv) the profitability of Calamos Advisors and its affiliates from their relationship with the Portfolio, (v) whether economies of scale may be realized as the Portfolio grows, and whether such fee levels share economies of scale with Portfolio investors, and (vi) other benefits to Calamos Advisors from its relationship with the Portfolio. In the Board’s deliberations, no single factor was responsible for the Board’s decision to approve continuation of the management agreement, and each Board member may have attributed different weights to the factors considered.
Nature, Extent and Quality of Services. The Board’s consideration of the nature, extent and quality of the services provided by Calamos Advisors to the Portfolio took into account the knowledge gained from the Board’s meetings with Calamos Advisors throughout the prior year. In addition, the Board considered: (i) Calamos Advisors’ long-term history of managing the Portfolio, (ii) the consistency of investment approach, (iii) the background and experience of Calamos Advisors’ investment personnel responsible for managing the Portfolio, and (iv) Calamos Advisors’ performance as administrator of the Portfolio, including, among other things, in the areas of brokerage selection, trade execution, compliance and shareholder communications. The Board also reviewed Calamos Advisors’ resources and key personnel involved in providing investment management services to the Portfolio, including the time that investment personnel devote to the Portfolio. The Board also considered compliance reports about Calamos Advisors from the Portfolio’s Chief Compliance Officer. The Board concluded that the nature, extent and quality of the services provided by Calamos Advisors to the Portfolio were appropriate and consistent with the management agreement, and that the Portfolio was likely to continue to benefit from services provided under its management agreement with Calamos Advisors.
Investment Performance of the Portfolio. The Board considered the Portfolio’s investment performance over various time periods, including how the Portfolio performed compared to the median performance of a group of comparable funds (the Portfolio’s “Universe Median”) selected by Lipper, Inc. (“Lipper”), an independent data service provider. The performance periods considered by the Board ended on March 31, 2013.
The Board considered that the Portfolio outperformed its Universe Median during the five- and ten-year periods, although the Portfolio underperformed its Universe Median during the one- and three-year periods. The Board also considered that the Portfolio consists of three shareholders and that the Adviser has discussed the Portfolio performance and make-up with each of those shareholders.
Costs of Services Provided and Profits Realized by Calamos Advisors. Using information provided by Lipper, the Board evaluated the Portfolio’s actual management fee rate compared to the median management fee rate for other mutual funds similar in size,
Trustee Approval of the Management Agreement (Unaudited)
character and investment strategy (the Portfolio’s “Expense Group”), and the Portfolio’s total expense ratio compared to the median total expense ratio of the Portfolio’s Expense Group.
The Board also reviewed Calamos Advisors’ management fee rates for its institutional separate accounts and for its sub-advised funds (for which Calamos Advisors provides portfolio management services only). The Board took into account Calamos Advisors’ assertion that although, generally, the rates of fees paid by institutional clients were lower than the rates of fees paid by the Portfolio, the differences reflected Calamos Advisors’ greater level of responsibilities and significantly broader scope of services regarding the Portfolio, and the more extensive regulatory obligations and risks associated with managing the Portfolio, and other financial considerations with respect to the Portfolio.
In addition, the Board generally considered Calamos Advisors’ costs, including costs associated with technology, infrastructure and compliance necessary to manage the Portfolio. The Board reviewed Calamos Advisors’ methodology for allocating costs among Calamos Advisors’ lines of business. The Board also considered information regarding the structure of Calamos Advisors’ compensation program for portfolio managers, analysts and certain other employees and the relationship of such compensation to the attraction and retention of quality personnel. Finally, the Board reviewed information on the profitability of Calamos Advisors in serving as the Portfolio’s investment manager. Data was provided to the Board with respect to profitability, both on a pre- and post-marketing cost basis. The Board also reviewed the annual report of Calamos Advisors’ parent company and discussed its corporate structure.
The Board considered that the Portfolio’s management fee is at the median of the Portfolio’s Expense Group. The Board also noted, however, that the Portfolio’s total expense ratio, which reflects the total fees paid by an investor, is higher than the median of the Portfolio’s expense group.
After its review of all the matters addressed, including those outlined above, the Board concluded that the rate of management fee paid by the Portfolio to Calamos Advisors was reasonable in light of the nature, extent and quality of the services provided, and was in the best interests of Portfolio shareholders.
Economies of Scale. The Board considered whether the Portfolio’s management fee shares with shareholders potential economies of scale that may be achieved by Calamos Advisors. The Board concluded that the fee schedule for the Portfolio was appropriate at current asset levels.
Other Benefits Derived from the Relationship with the Portfolio. The Board considered other benefits that accrue to Calamos Advisors and its affiliates from their relationship with the Portfolio. The Board concluded that, other than the services to be provided by Calamos Advisors and its affiliates pursuant to their agreements with the Portfolio and the fees payable by the Portfolio for such services, the Portfolio and Calamos Advisors may potentially benefit from their relationship with each other in other ways.
The Board also considered Calamos Advisors’ use of a portion of the commissions paid by the Portfolio on its portfolio brokerage transactions to obtain research products and services benefiting the Portfolio and/or other clients of Calamos Advisors and concluded, based on reports from the Portfolio’s Chief Compliance Officer, that Calamos Advisors’ use of “soft” commission dollars to obtain research products and services was consistent with regulatory requirements.
After full consideration of the above factors as well as other factors that were instructive in its consideration, the Board, including all of the Independent Trustees, concluded that the continuation through July 31, 2014 of the management agreement for the Portfolio with Calamos Advisors was in the best interest of the Portfolio and its shareholders.
| | | | |
| 26 | | CALAMOS GROWTH AND INCOME PORTFOLIO SEMIANNUAL REPORT | | |
A description of the Calamos Proxy Voting Policies and Procedures is available free of charge upon request by calling 800.582.6959, by visiting the Calamos website at www.calamos.com, by writing Calamos at: Calamos Advisors LLC, Attn: Client Services, 2020 Calamos Court, Naperville, IL 60563. The Portfolio’s proxy voting record for the twelve month period ended June 30, 2013, is also available free of charge upon request by calling or writing Calamos Advisors LLC and by visiting the SEC website at http://www.sec.gov. The Portfolio files a complete list of its portfolio holdings with the SEC for the first and third quarters each fiscal year on Form N-Q. The Form N-Q is available free of charge, upon request, by calling or writing Calamos Advisors LLC or by visiting the SEC website. You may also review or, for a fee, copy the form at the SEC’s Public Reference Room in Washington, D.C. 1.800.SEC.0330.
CALAMOS ADVISORS TRUST
This report, including the audited financial statements contained herein, is submitted for general information for the contract owners of the Portfolio. The report is not authorized for distribution to prospective investors in the Portfolio unless it is accompanied by a currently effective prospectus of the Portfolio, and, after September 30, 2013, updated performance data for the most recently completed calendar quarter.

2020 Calamos Court
Naperville, IL 60563-2787
800.582.6959
www.calamos.com
© Calamos Investments, LLC. All Rights Reserved.
Calamos® and Calamos Investments® are registered trademarks of Calamos Investments, LLC.
KCLSAN 2146 2013
ITEM 2. CODE OF ETHICS.
Not applicable.
ITEM 3. AUDIT COMMITTEE FINANCIAL EXPERT.
Not applicable.
ITEM 4. PRINCIPAL ACCOUNTANT FEES AND SERVICES.
Not applicable.
ITEM 5. AUDIT COMMITTEE OF LISTED REGISTRANTS.
Not applicable.
ITEM 6. SCHEDULE OF INVESTMENTS
Included in the Report to Shareholders in Item 1.
ITEM 7. DISCLOSURE OF PROXY VOTING POLICIES AND PROCEDURES FOR CLOSED-END MANAGEMENT INVESTMENT COMPANIES.
Not applicable.
ITEM 8. PORTFOLIO MANAGERS OF CLOSED-END MANAGEMENT INVESTMENT COMPANIES.
Not applicable.
ITEM 9. PURCHASES OF EQUITY SECURITIES BY CLOSED-END MANAGEMENT INVESTMENT COMPANY AND AFFILIATED PURCHASERS.
Not applicable.
ITEM 10. SUBMISSION OF MATTERS TO A VOTE OF SECURITY HOLDERS.
No material changes.
ITEM 11. CONTROLS AND PROCEDURES.
a) The registrant’s principal executive officer and principal financial officer have evaluated the registrant’s disclosure controls and procedures within 90 days of this filing and have concluded that the registrant’s disclosure controls and procedures were effective, as of that date, in ensuring that information required to be disclosed by the registrant in this Form N-CSR was recorded, processed, summarized, and reported timely.
b) There were no changes in the registrant’s internal controls over financial reporting (as defined in Rule 30a-3(d) under the Investment Company Act of 1940) that occurred during the second fiscal quarter of the period covered by this report that has materially affected, or is reasonably likely to materially affect, the registrant’s internal control over financial reporting.
ITEM 12. EXHIBITS.
(a)(1) Code of Ethics — Not applicable.
(a)(2)(i) Certification of Principal Executive Officer.
(a)(2)(ii) Certification of Principal Financial Officer.
SIGNATURES
Pursuant to the requirements of the Securities Exchange Act of 1934 and the Investment Company Act of 1940, the registrant has duly caused this report to be signed on its behalf by the undersigned, thereunto duly authorized.
Calamos Advisors Trust
| | |
| By: | | /s/ John P. Calamos, Sr. |
| Name: John P. Calamos, Sr. |
| Title: Principal Executive Officer |
Date: August 6, 2013
| | |
| By: | | /s/ Nimish S. Bhatt |
| Name: Nimish S. Bhatt |
| Title: Principal Financial Officer |
Date: August 6, 2013
Pursuant to the requirements of the Securities Exchange Act of 1934 and the Investment Company Act of 1940, this report has been signed by the following persons on behalf of the registrant and in the capacities and on the dates indicated.
Calamos Advisors Trust
| | |
| By: | | /s/ John P. Calamos, Sr. |
| Name: John P. Calamos, Sr. |
| Title: Principal Executive Officer |
Date: August 6, 2013
| | |
| By: | | /s/ Nimish S. Bhatt |
| Name: Nimish S. Bhatt |
| Title: Principal Financial Officer |
Date: August 6, 2013