UNITED STATES SECURITIES AND EXCHANGE COMMISSION
Washington, D.C. 20549
FORM 10-K
| x | | ANNUAL REPORT PURSUANT TO SECTION 13 OR 15(d) OF THE SECURITIES EXCHANGE ACT OF 1934 For the fiscal year ended December 31, 2008 |
or
| ¨ | | TRANSITION REPORT PURSUANT TO SECTION 13 OR 15(d) OF THE SECURITIES EXCHANGE ACT OF 1934 For the transition period from to |
Commission File Number: 1-14925
STANCORP FINANCIAL GROUP, INC.
(Exact name of registrant as specified in its charter)
| | |
| Oregon | | 93-1253576 |
| (State or other jurisdiction of incorporation or organization) | | (I.R.S. Employer Identification No.) |
1100 SW Sixth Avenue, Portland, Oregon, 97204
(Address of principal executive offices, including zip code)
Registrant’s telephone number, including area code: (971) 321-7000
Securities registered pursuant to Section 12(b) of the Act:
| | |
| TITLE OF EACH CLASS | | NAME OF EACH EXCHANGE ON WHICH REGISTERED |
Common Stock | | New York Stock Exchange |
Series A Preferred Share Purchase Rights | | New York Stock Exchange |
Securities registered pursuant to Section 12(g) of the Act: NONE
Indicate by check mark if the registrant is a well-known seasoned issuer, as defined in Rule 405 of the Securities Act. Yes x No ¨
Indicate by check mark if the registrant is not required to file reports pursuant to Section 13 or Section 15(d) of the Act. Yes ¨ No x
Indicate by check mark whether the registrant: (1) has filed all reports required to be filed by Section 13 or 15(d) of the Securities Exchange Act of 1934 during the preceding 12 months (or for such shorter period the registrant was required to file such reports), and (2) has been subject to such filing requirements for the past 90 days. Yes x No ¨
Indicate by check mark if disclosure of delinquent filers pursuant to Item 405 of Regulation S-K is not contained herein, and will not be contained, to the best of registrant’s knowledge, in definitive proxy or information statements incorporated by reference in Part III of the 10-K or any amendment to the Form 10-K. x
Indicate by check mark whether the registrant is a large accelerated filer, an accelerated filer, a non-accelerated filer or a smaller reporting company. See definition of “large accelerated filer,” “accelerated filer” and “smaller reporting company” in Rule 12b-2 of the Exchange Act.
Large accelerated filer x Accelerated filer ¨ Non-accelerated filer ¨ Smaller reporting company ¨
Indicate by check mark whether the registrant is a shell company (as defined in Rule 12b-2 of the Act). Yes ¨ No x
The aggregate market value of the voting and non-voting common equity held by non-affiliates of the registrant as of June 30, 2008, was approximately $2.28 billion based upon the closing price of $46.96 on June 30, 2008. For this purpose, directors and executive officers of the registrant are assumed to be affiliates.
As of February 20, 2009, there were 48,972,080 shares of the registrant’s common stock, no par value, outstanding.
DOCUMENTS INCORPORATED BY REFERENCE
Portions of the registrant’s definitive Proxy Statement for its 2009 Annual Meeting of Shareholders are incorporated by reference in Part III.
| | |
| 2 | | STANCORP FINANCIAL GROUP, INC. |
Part I
As used in this Form 10-K, the terms “StanCorp,” “Company,” “we,” “us” and “our” refer to StanCorp Financial Group, Inc. and its subsidiaries, unless the context otherwise requires.
AVAILABLE INFORMATION
StanCorp files its annual, quarterly and current reports, proxy statements and other information with the United States Securities and Exchange Commission (“SEC”). You may read and copy any document StanCorp files with the SEC at the SEC’s Public Reference Room at 100 F Street, NE, Room 1580, Washington, DC 20549, U.S.A. You may obtain information on the operation of the Public Reference Room by calling the SEC at 1-800-SEC-0330 (or 1-202-551-8090). The SEC maintains an Internet site that contains annual, quarterly and current reports, proxy and information statements and other information regarding issuers that file electronically with the SEC. StanCorp’s electronic SEC filings are available to the public atwww.sec.gov.
StanCorp’s Internet site for investors iswww.stancorpfinancial.com. StanCorp publishes its annual reports on Form 10-K, quarterly reports on Form 10-Q, current reports on Form 8-K and amendments to those reports filed or furnished pursuant to Section 13 or 15(d) of the Securities Exchange Act of 1934 (“Exchange Act”), as amended, on its Internet site free of charge. StanCorp makes these reports available as soon as reasonably practicable after it electronically files such material with, or furnishes it to, the SEC. StanCorp also makes available onwww.stancorpfinancial.com (i) its Corporate Governance Guidelines, (ii) its codes of business ethics (including any waivers granted to executive officers or directors), and (iii) the charters of the audit, organization and compensation, and nominating and corporate governance committees of its board of directors. These documents are also available in print without charge to any person who requests them by writing or telephoning:
Shareholder Relations Department
StanCorp Financial Group, Inc.
1100 SW Sixth Avenue
Portland, OR 97204
(800) 378-8360
FORWARD-LOOKING STATEMENTS
Some of the statements contained or incorporated by reference in this Annual Report on Form 10-K, including those relating to the Company’s strategy, growth prospects
and other statements that are predictive in nature, that depend on or refer to future events or conditions, or that include words such as “expects,” “anticipates,” “intends,” “plans,” “believes,” “estimates,” “seeks” and similar expressions, are forward-looking statements within the meaning of Section 21E of the Securities Exchange Act of 1934 (“Exchange Act”), as amended. These statements are not historical facts but instead represent only management’s expectations, estimates and projections regarding future events. Similarly, these statements are not guarantees of future performance and involve uncertainties that are difficult to predict, which may include, but are not limited to, the factors listed in Part II, Item 7, “Management’s Discussion and Analysis of Financial Condition and Results of Operations—Forward-looking Statements” of this Report. As a provider of financial products and services, our results of operations may vary significantly in response to economic trends, interest rate changes, investment performance, claims experience, operating expenses and pricing. Caution should be used when extrapolating historical results or conditions to future periods.
Our actual results and financial condition may differ materially from the anticipated results and financial condition in any such forward-looking statements. Given these uncertainties or circumstances, readers are cautioned not to place undue reliance on such statements. We assume no obligation to publicly update or revise any forward-looking statements, whether as a result of new information, future events or otherwise.
GENERAL
We are a holding company for our insurance and asset management subsidiaries and are headquartered in Portland, Oregon. Our insurance businesses offer group and individual disability insurance, group life and accidental death and dismemberment (“AD&D”) insurance, and group dental insurance. Through our insurance subsidiaries, we have the authority to underwrite insurance products in all 50 states. Our asset management businesses offer full-service 401(k) plans, 457 plans, defined benefit plans, money purchase pension plans, profit sharing plans, 403(b) plans and non-qualified deferred compensation products and services through an affiliated broker-dealer. Our asset management businesses also offer investment advisory and management services, financial planning services, commercial mortgage loan origination and servicing, individual fixed annuities, group annuity contracts and retirement plan trust products.
Part I
MISSION AND STRATEGY
Our mission is to exceed customers’ needs for financial products and services in growing markets where the application of specialized expertise creates potential for superior shareholder returns. Our vision is to lead the financial services industry in integrity, expertise and customer service. We operate in select financial products and services growth markets and seek to compete on expertise, differentiation and customer service, while maintaining a strong financial position.
StanCorp’s long-term strategy includes:
| | • | | Maintaining strong growth rates in traditional risk acceptance businesses (disability and group life insurance). |
| | • | | Seek opportunities to further penetrate markets with limited presence to expand growth opportunities. |
| | • | | Further diversify our earnings base, and take advantage of market opportunities, demographic trends and capital synergies, by increasing our asset accumulation and asset administration businesses. |
Our ability to accomplish this strategy is dependent on a number of factors, some of which involve risks or uncertainties. See “Competition” and “Key Factors Affecting Results of Operations” below, Item 1A, “Risk Factors,” and Part II, Item 7, “Management’s Discussion and Analysis of Financial Condition and Results of Operations—Forward-looking Statements” of this Report.
DEVELOPMENT OF STANCORP
StanCorp, headquartered in Portland, Oregon, was incorporated under the laws of Oregon in 1998 as a parent holding company and conducts business through its subsidiaries: Standard Insurance Company (“Standard”); The Standard Life Insurance Company of New York; Standard Retirement Services, Inc. (“Standard Retirement Services”); StanCorp Equities, Inc. (“StanCorp Equities”); StanCorp Mortgage Investors, LLC (“StanCorp Mortgage Investors”); StanCorp Investment Advisers, Inc. (“StanCorp Investment Advisers”); and StanCorp Real Estate, LLC (“StanCorp Real Estate”). The Company, through our subsidiaries, has operations throughout the United States.
The Standardis a service mark of StanCorp and its subsidiaries and is used as a brand mark and marketing name by Standard and The Standard Life Insurance Company of New York. Through our subsidiaries, we have the authority to underwrite insurance products in all 50 states.
Standard, a leading provider of group insurance products and services and our largest subsidiary,
underwrites group and individual disability insurance and annuity products, group life and AD&D insurance, and group dental insurance, and provides retirement plan products. Founded in 1906, Standard is domiciled in Oregon, licensed in all states except New York, and licensed in the District of Columbia and the U.S. Territories of Guam and the Virgin Islands.
The Standard Life Insurance Company of New York was organized in 2000 and is licensed to provide group long term and short term disability, life, AD&D and dental insurance in New York.
Standard Retirement Services administers and services StanCorp’s retirement plans group annuity contracts and trust products. Retirement plans products are offered in all 50 states through Standard or Standard Retirement Services.
StanCorp Equities is a limited broker-dealer and member of the Financial Industry Regulatory Authority. StanCorp Equities serves as principal underwriter and distributor for group variable annuity contracts issued by Standard and as the broker of record for certain retirement plans using the trust platform. StanCorp Equities carries no customer accounts but provides supervision and oversight for the distribution of group variable annuity contracts and of the sales activities of all registered representatives employed by StanCorp Equities and its affiliates.
StanCorp Mortgage Investors originates and services fixed-rate commercial mortgage loans for the investment portfolios of our insurance subsidiaries. StanCorp Mortgage Investors also generates additional fee income from the origination and servicing of commercial mortgage loans participated to institutional investors.
StanCorp Investment Advisers is a Securities and Exchange Commission (“SEC”) registered investment adviser providing performance analysis, fund selection support, model portfolios and other investment advisory, financial planning and investment management services to its retirement plans clients, individual investors and subsidiaries of StanCorp.
StanCorp Real Estate is a property management company that owns and manages our Hillsboro, Oregon home office properties and other investment properties and manages the Portland, Oregon home office properties owned by Standard.
MARKET POSITION
Based on mid-year 2008 insurance industry in force premium statistics in the United States, provided by JHA and LIMRA International, we have leading market
| | |
| 4 | | STANCORP FINANCIAL GROUP, INC. |
positions with single digit market share in group long term and short term disability insurance and group life insurance. Based on a 2008 survey by LIMRA International we also have single digit market share for individual disability insurance. The positions are as follows:
| | • | | 4th largest provider of group long term disability insurance. |
| | • | | 5th largest provider of group short term disability insurance. |
| | • | | 8th largest provider of individual disability insurance. |
| | • | | 9th largest provider of group life insurance. |
FINANCIAL STRENGTH RATINGS
Financial strength ratings, which gauge claims paying ability, are an important factor in establishing the competitive position of insurance companies. Ratings are important in maintaining public confidence in our company and in our ability to market our products. Rating organizations continually review the financial performance and condition of insurance companies, including ours. In addition, credit ratings on our 10-year senior notes (“Senior Notes”) and junior subordinated debentures (“Subordinated Debt”) are tied to our financial strength ratings. A ratings downgrade could increase surrender levels for our annuity products, could adversely affect our ability to market our products and could increase costs of future debt issuances. Standard & Poor’s, Moody’s Investors Service, Inc. and A.M. Best Company provide financial strength and credit ratings.
Standard’s financial strength ratings as of February 2009 were:
| | • | | AA- (Very Strong) by Standard & Poor’s—4th of 20 ratings. |
| | • | | A1 (Good) by Moody’s—5th of 21 ratings. |
| | • | | A (Excellent) by A.M. Best—3rd of 13 ratings. |
CREDIT RATINGS
Standard & Poor’s, Moody’s Investors Service, Inc. and A.M. Best Company provide credit ratings on StanCorp’s Senior Notes. As of February 2009, ratings from these agencies were A-, Baa1 and bbb+, respectively. As of February 2009, Standard’s issuer credit rating from A.M. Best was a+.
Standard & Poor’s, Moody’s Investor Services, Inc. and A.M. Best Company also provide credit ratings on StanCorp’s Subordinated Debt. As of February 2009, ratings from these agencies were BBB, Baa2 and bbb-, respectively.
SEGMENTS
We operate through two reportable segments: Insurance Services and Asset Management, as well as an Other category, which includes net capital gains and losses, return on capital not allocated to the product segments, holding company expenses, interest on debt and adjustments made in consolidation and other unallocated expenses. Resources are allocated, and performance is evaluated at the segment level. The Insurance Services segment offers group and individual disability insurance, group life and AD&D insurance, and group dental insurance. The Asset Management segment offers full-service 401(k) plans, 457 plans, defined benefit plans, money purchase pension plans, profit sharing plans, 403(b) plans and non-qualified deferred compensation products and services through an affiliated broker-dealer. This segment also offers investment management and financial planning services, commercial mortgage loan origination and servicing, individual fixed annuities, group annuity contracts and retirement plan trust products.
Total revenues for 2008 were $2.67 billion, and included revenues of $2.46 billion from our Insurance Services segment and $333.2 million from our Asset Management segment. Net capital gains and losses are recorded in our Other category, and net capital losses were $128.8 million for 2008. Excluding net capital losses, revenue for 2008 from our Other category was $6.8 million. See Part II, Item 7, “Management’s Discussion and Analysis of Financial Condition and Results of Operations—Consolidated Results of Operations—Revenues” and Item 8, “Financial Statements and Supplementary Data—Notes to Consolidated Financial Statements—Note 3—Segments” for segment information regarding revenues, expenses and total assets for the years 2008, 2007 and 2006.
Insurance Services Segment
The Insurance Services segment sells disability, life, AD&D and dental insurance products to employer groups ranging in size from two lives to over 661,000 lives, and has about 29,000 group insurance policies in force, covering approximately 7.7 million employees as of December 31, 2008. This segment also sells disability insurance to individuals.
Our group insurance products are sold by sales representatives through independent employee benefit brokers and consultants. The sales representatives, who are employees of the Company, are compensated through salary and incentive compensation programs and are located in 41 field offices in principal metropolitan areas of
Part I
the United States. The field offices also provide sales support and customer service through field administrative staff. The Company’s arrangements with brokers include compensation established at the time of sale (commissions or fees), and, in some situations, also include compensation related to the overall performance of a block of business (performance related compensation). In most cases, the overall performance of a block of business is measured in terms of volume and persistency (customer retention).
Group long term disability insurance contributed 39.6% of 2008 premiums for the segment. Group long term disability insurance provides partial replacement of earnings to insured employees who become disabled for extended periods of time.
The Company’s basic long term disability product covers disabilities that occur during the policy period at both work and elsewhere. In order to receive long term disability benefits, an employee must be continuously disabled beyond a specified waiting period, which generally ranges from 30 to 180 days. The benefits usually are reduced by other income that the disabled employee receives from sources such as social security disability, workers compensation and sick leave. The benefits also may be subject to certain maximum amounts and benefit periods. Historically, approximately 50% of all claims filed under our long term disability policies close within 24 months. However, claims caused by more severe disabling conditions may be paid over much longer periods, including up to normal retirement age or longer.
Generally, group long term disability policies offer rate guarantees for periods from one to three years. While we can prospectively re-price and re-underwrite coverages at the end of these guarantee periods, we must pay benefits with respect to claims incurred during these periods without being able to increase guaranteed premium rates during the same periods.
Group life and AD&D insurance contributed 39.6% of 2008 premiums for the segment. Group life insurance products provide coverage to insured employees for a specified period and have no cash value (amount of cash available to an insured employee on the surrender of, or withdrawal from, the life insurance policy). Coverage is offered to insured employees and their dependents. AD&D insurance is usually provided in conjunction with group life insurance, and is payable after the accidental death or dismemberment of the insured in an amount based on the face amount of the policy or dismemberment schedule.
Group short term disability insurance contributed 10.2% of 2008 premiums for the segment. Our basic short term disability products generally cover only disabilities occurring outside of work. Short term disability insurance generally requires a short waiting period, ranging from one to 30 days, before an insured employee may receive benefits, with maximum benefit periods generally not exceeding 26 weeks. Group short term disability benefits also may be reduced by other income, such as sick leave, that a disabled insured employee may receive.
Group dental insurance contributed 3.6% of 2008 premiums for the segment. Group dental products provide coverage to insured employees and their dependents for preventive, basic and major dental expenses, and also include an option to purchase orthodontia benefits. We offer three dental plans including a traditional plan, a reduced cost plan and a cost containment plan, which are differentiated by levels of service and cost. Standard has a strategic marketing alliance with Ameritas Life Insurance Corp. (“Ameritas”), which offers Standard’s policyholders flexible dental coverage options and access to Ameritas’ nationwide preferred provider organization panel of dentists.
Individual disability insurance contributed 7.0% of 2008 premiums for the segment. The products include non-cancelable disability coverage, which provides insurance at a guaranteed fixed premium rate for the life of the contract, and guaranteed renewable coverage where premium rates are guaranteed for limited periods and subject to change thereafter. This segment also sells business overhead expense coverage, which reimburses covered operating expenses when the insured is disabled, and business equity buy-out coverage, which provides payment for the purchase, by other owners or partners, of the insured’s ownership interest in a business in the event of total disability. Non-cancelable disability insurance policies represented 70.1% of individual disability sales based on annualized new premiums for 2008.
Our individual disability insurance products are sold nationally by sales representatives through master general agents and brokers, primarily to physicians, lawyers, executives, other professionals and small business owners. The compensation paid to master general agents and brokers is based primarily on a percentage of premiums. Master general agents and some brokers are eligible for a bonus based on sales volume and persistency of business they have written.
| | |
| 6 | | STANCORP FINANCIAL GROUP, INC. |
Asset Management Segment
The Asset Management segment offers full-service 401(k) plans, 457 plans, defined benefit plans, money purchase pension plans, profit sharing plans, 403(b) plans and non-qualified deferred compensation products and services through an affiliated broker-dealer. This segment also offers investment management and financial planning services, commercial mortgage loan origination and servicing, individual fixed annuities, group annuity contracts and retirement plan trust products. Beginning in the third quarter of 2006, this segment included the former operations of Invesmart, Inc. (“Invesmart”), a national retirement financial services company. In the third quarter of 2007, this segment also added $1.7 billion of assets under administration acquired from DPA, Inc., a retirement business based in Portland, Oregon.
Investment services for 401(k), defined benefit, and other 401(a) qualified plans and governmental 457 plans are provided through a non-registered group annuity contract with third party brand name mutual funds through a separate account and, for certain plans, a stable value investment option managed by Standard. These plan services also are provided through a trust product offering third party brand name mutual funds. For the trust product offering, plans can choose from any mutual fund that our trading partners are able to trade. Mutual funds offered through the group annuity separate account as of December 31, 2008, are limited to those funds that have been evaluated through a due diligence process. Representative fund companies are: Black Rock Funds, Brandywine Fund, Inc., Davis Funds, Dodge & Cox, Fidelity Investments, Franklin Templeton, T. Rowe Price, and Vanguard Funds.
The 403(b) and non-qualified deferred compensation plan services are provided through a registered group variable annuity contract, with a stable value investment option managed by Standard and separate account investment options from AllianceBernstein, Alger, Allianz Global Investors, American Century Investments, Black Rock Funds, Davis Funds, Delaware Investments Mutual Funds, The Dreyfus Corporation, Federated Investors Funds, Fidelity Investments, Franklin Templeton, GE, Goldman Sachs, Lincoln National Funds, Morgan Stanley Funds, Neuberger & Berman Funds, Pimco Funds, Principal Funds, Royce Funds, T. Rowe Price, Universal Institutional Funds, Inc., Vanguard Funds, Van Kampen Funds and Victory Capital Management. Certain plan services also are provided through a trust product offering third party investment options. Funds offered in our
retirement plans are regularly evaluated for performance, expense ratios, risk statistics, style consistency, industry diversification and management through the investment advisory service we provide to our customers. Funds are added and removed as part of this evaluation process. StanCorp Investment Advisers provides fund performance analysis and selection support to 85% of our group annuity plan sponsors. All group annuity contracts are distributed by StanCorp Equities.
The target market for retirement plans is businesses with $1 million to $25 million in plan assets. Our retirement plans products and services are sold primarily through registered investment advisors, brokers, employee benefit consultants, and other distributors served by our sales representatives throughout the United States. These distributors are compensated usually based on a percentage of the deposits or assets under administration. Compensation is disclosed to the customer by either Standard or Standard Retirement Services. Most of our retirement plan customers receive financial, record keeping and administrative services, although the option is available to receive only financial and record keeping services or financial services alone.
The primary sources of revenue for the retirement plans business include plan administration fees, asset-based fees and investment income on general account assets under administration, a portion of which is credited to policyholders. In addition, premiums and benefits to policyholders reflect the conversion of retirement plan assets into life-contingent annuities, which is an option that can be selected by plan participants at the time of retirement.
In two third-party industry surveys for 2008, The Standard’s retirement plans business was recognized as follows:
| | • | | The Standard earned a total of five Best in Class awards in PLANSPONSOR magazine’s 2008 Defined Contribution Plan Survey. The Standard received one Best in Class award in the under $5 million in assets category, and four additional Best in Class awards in the $5 to $50 million in assets category. |
| | • | | In the Boston Research Group’s 2008 survey of small defined contribution plans (under $5 million in assets). The Standard was rated seventh in terms of overall satisfaction by plan sponsors. Twenty-two providers were included in the survey. |
In July 2007, Standard Retirement Services acquired DPA, Inc., a retirement business based in Portland, Oregon. The acquisition of DPA, Inc. added $1.7 billion to
Part I
assets under administration. Retirement plans assets under administration were $14.47 billion at December 31, 2008.
The individual annuity products sold by this segment are primarily fixed-rate and indexed deferred annuities, although we also market life-contingent immediate annuities. The target market for fixed-rate and indexed annuities is any individual seeking conservative investments to meet their retirement or other financial goals. The fixed-rate annuity product portfolio includes deferred annuities with initial interest rate guarantees generally ranging from one to six years and a full array of single premium immediate annuity income payment options. The Company launched an indexed annuity product in January 2006 and uses over the counter call-spread options to hedge the index performance of the policies.
Fixed-rate annuities are distributed through master general agents, brokers and financial institutions and compensation is primarily based on a percentage of premiums and deposits related to the business sold.
Master general agents are eligible for a bonus based on the volume of annuity business sold by financial institutions and brokers they coordinate.
Most of our annuity business deposits are not recorded as premiums, but rather are recorded as liabilities. Individual fixed annuity deposits earn investment income, a portion of which is credited to policyholders. Annuity premiums consist of premiums on life-contingent annuities, which are a small portion of total sales.
Our investment advisory business, StanCorp Investment Advisers, is a SEC-registered investment adviser providing performance analysis, fund selection support, model portfolios and other investment advisory and investment management services. Our target market is our retirement plan clients, individual investors with $250,000 to $2 million in portfolio assets and the subsidiaries of StanCorp.
Our commercial mortgage loans subsidiary, StanCorp Mortgage Investors, originates, underwrites and services, fixed-rate commercial mortgage loans, generally between $250,000 and $5 million or higher per loan for the investment portfolios of our insurance subsidiaries. It also generates additional fee income from the origination and servicing of commercial mortgage loans participated to institutional investors. The target market for commercial mortgage loans is small retail, office, and industrial properties located throughout the continental United States.
Other
In addition to our two segments, we report our holding company and corporate activity in “Other.” This category
includes net capital gains and losses on investments, return on capital not allocated to the product segments, holding company expenses, interest on debt, unallocated expenses and adjustments made in consolidation.
COMPETITION
Competition for sale of our products comes primarily from other insurers and financial services companies such as banks, broker-dealers and mutual funds. Some competitors have greater financial resources, offer a broader array of products and may have higher financial strength ratings. Pricing is a competitive issue in the markets we serve. We do not seek to compete primarily on price. While we believe our products and service provide superior value to our customers, a significant price difference between our products and those of some of our competitors may result in periods of declining new sales, reduced persistency (customer retention), lower premium growth, and increased sales force attrition. See “Key Factors Affecting Results of Operations—Pricing.”
KEY FACTORS AFFECTING RESULTS OF OPERATIONS
Group insurance is our largest business and represented 92%, 93% and 93% of total premiums for the years ended December 31, 2008, 2007 and 2006, respectively. In addition to competition, three primary factors can have a critical impact on the financial results of our Insurance Services segment operations: claims experience, economic conditions and pricing.
Claims Experience. We have a large and well-diversified group insurance business. However, claims experience can fluctuate widely, particularly from quarter to quarter. The predominant factors affecting claims experience are incidence (number of claims) and severity (length of time a disability claim is paid and the size of the claim). These factors can fluctuate widely within and between our insurance products.
Employment Levels and Benefits. The rate of wage and employment growth can influence premium growth in our group insurance business and impact the growth of assets under administration in our retirement plans business. In our group insurance business premium rates are based, in part, on total salaries covered. For our retirement plans business the growth in wages and employment affect the growth in assets for the retirement plans we administer, which is a primary driver of administrative fee revenue.
In addition, economic conditions can impact demand for the group insurance products we offer, and can increase competition as insurers compete to grow market share as overall market growth declines.
| | |
| 8 | | STANCORP FINANCIAL GROUP, INC. |
Interest Rates and Equity Markets. Our financial results are sensitive to changing interest rates. Changes in interest rates effect product pricing for our insurance businesses because premiums collected today must be invested to provide a return sufficient to meet the future claims of policyholders. For that reason, we closely monitor changes in interest rates and make changes to our pricing, as appropriate. Interest rates also affect the discount rates we use to establish reserves.
For those products in our asset accumulation businesses where deposits are invested in securities managed by the Company, achieving adequate interest rates is important to meet customer obligations. In addition, changes in equity markets also impact assets under administration for our retirement plans business impacting administrative fee revenue.
Pricing. One of the key components of our pricing decisions for many of our insurance products is the investment return available to us. In periods of decreasing interest rates, the returns available to us from our primary investments, fixed maturity securities and commercial mortgage loans, decline. This may require us to increase the price of some of our products in order to maintain our targeted returns. If our competitors do not make similar adjustments to their product pricing or if they have a higher return on investments, our products may be more expensive than those offered by competitors. Alternatively, in periods when interest rates are increasing, we may be able to reduce premium rates, and therefore reduce pricing pressure to customers. Given the negative financial consequences of under-pricing, we believe that our practice of maintaining a disciplined approach to product pricing provides the best long-term pricing stability, stable renewal pricing for our customers, higher levels of persistency, and therefore, the best long-term financial success for our company.
RISK MANAGEMENT
We manage risk through sound product design and underwriting, effective claims management, pricing discipline, distribution expertise, broad diversification of risk by customer geography, industry, size and occupation, maintenance of a strong financial position, maintenance of reinsurance and risk pool arrangements, and sufficient alignment of assets and liabilities to meet financial obligations.
Diversification of Products
We achieve earnings diversification by offering multiple insurance products such as group life, group long term
disability, and individual disability products. These products have differing price, market and risk characteristics. Our strategy is to further diversify our earnings base, and take advantage of market opportunities, demographic trends and capital synergies, by increasing our asset accumulation and asset administration businesses. The Company experienced a decline of 12.0% in assets under administration during 2008. The decrease in assets under administration was primarily due to declining equity markets. The lower levels of assets under administration were partially offset by continued new net deposit growth. The Company recognizes the current volatility in the capital markets and does not provide specific short-term guidance on overall asset growth.
Diversification by Customer Industry, Geography and Size
We seek to diversify risk by customer industry, geography and size measured by the number of insured employees. Over half of our group insurance premiums come from industries we believe to be resistant to the effects a recession may have on employment. These industries include the public sector, education, health care and utilities. Industries we believe are more likely to experience job growth during this recession represent approximately 47% of the U.S. workforce and approximately 69% of our block of group business. Industries we believe are more likely to experience job losses represent approximately 53% of the U.S. workforce, but only approximately 31% of our group business. In force premium distribution by industry, geography and customer size for group long term disability and group life products was as follows as of December 31, 2008:
| | | |
| Customer Industry | |
Public | | 28 | % |
Education | | 20 | |
Professional | | 10 | |
Manufacturing | | 10 | |
Health Care | | 10 | |
Finance | | 7 | |
Retail | | 1 | |
Services | | 2 | |
Utilities | | 1 | |
Other | | 11 | |
Total | | 100 | % |
| | | |
| Customer Geography | |
Northeast | | 15 | % |
Southeast | | 17 | |
Central | | 30 | |
West | | 38 | |
Total | | 100 | % |
Part I
| | | |
| Customer Size (Employees) | |
2-99 | | 13 | % |
100-2,499 | | 38 | |
2,500-7,499 | | 18 | |
7,500 and above | | 31 | |
Total | | 100 | % |
Reinsurance
In order to limit our losses from large exposures, we enter into reinsurance agreements with other insurance companies. We review our retention limits based on size and experience. The maximum retention limit per individual for group life and AD&D is $750,000. Our maximum retention limit for group disability insurance is $15,000 of monthly benefit per individual. During 2007, we increased our maximum retention limit from $5,000 to $5,500 of monthly benefit per individual for individual disability policies with effective dates on or after September 1, 2007. On certain business acquired from Minnesota Life Insurance Company (“Minnesota Life”), we have a maximum retention of $6,000 of monthly benefit per individual.
Standard participates in a reinsurance and third party administration arrangement with Northwestern Mutual Life Insurance (“Northwestern Mutual”) under which Northwestern Mutual group long term and short term disability products are sold using Northwestern Mutual’s agency distribution system. Generally, Standard assumes 60% of the risk, and receives 60% of the premiums for the policies issued. If Standard were to become unable to meet its obligations, Northwestern Mutual would retain the reinsured liabilities. Therefore, in accordance with an agreement with Northwestern Mutual, Standard established a trust for the benefit of Northwestern Mutual with the market value of assets in the trust equal to Northwestern Mutual’s reinsurance receivable from Standard. The market value of assets required to be maintained in the trust at December 31, 2008, was $221.7 million. Premiums assumed by Standard for the Northwestern Mutual business accounted for 3% of the Company’s total premiums for each of the three years 2008, 2007 and 2006. In addition to assuming risk, Standard provides product design, pricing, underwriting, legal support, claims management and other administrative services under the arrangement.
Standard maintains a strategic marketing alliance with Ameritas that offers Standard’s policyholders more flexible dental coverage options and access to Ameritas’ nationwide preferred provider organization panel of dentists. As part of this alliance, Standard and Ameritas entered into a
reinsurance agreement that provides for 21% of the net dental premiums written by Standard and the risk associated with these premiums to be ceded to Ameritas.
In addition to product-specific reinsurance arrangements, we maintain reinsurance coverage for certain catastrophe losses related to group life and AD&D. This agreement excludes nuclear, biological and chemical acts of terrorism. Through a combination of this agreement and our participation in a catastrophe reinsurance pool discussed below, we have coverage of up to $429.0 million per event.
Subsequent to the terrorist events of September 11, 2001, we entered into a catastrophe reinsurance pool with other insurance companies. This pool spreads catastrophe losses on group life and AD&D over 27 participating members. The annual fee paid by the Company in 2008 to participate in the pool was less than $30 thousand. As a member of the pool, we are exposed to maximum potential losses experienced by other participating members of up to $105.2 million for a single event for losses submitted by a single company and a maximum of $263.5 million for a single event for losses submitted by multiple companies. The Company’s percentage share of losses experienced by pool members will change over time as it is a function of our group life and AD&D in force relative to the total group life and AD&D in force for all pool participants. The reinsurance pool includes war or nuclear, biological and chemical acts of terrorism.
The Terrorism Risk Insurance Act of 2002 (“TRIA”), which has been extended through 2014, provides for federal government assistance to property and casualty insurers in the event of material losses due to terrorist acts on behalf of a foreign person or foreign interest. Due to the concentration of risk present in group life insurance and the fact that group life insurance is not covered under TRIA, an occurrence of a significant catastrophe or a change in the on-going nature and availability of reinsurance and catastrophe reinsurance could have a material adverse effect on the Company.
Asset/Liability and Interest Rate Risk Management
See Part II, Item 7, “Management’s Discussion and Analysis of Financial Condition and Results of Operations—Liquidity and Capital Resources—Asset/Liability and Interest Rate Risk Management.”
INVESTMENTS
Investment management is an integral part of our business. Investments are maintained to ensure that asset
| | |
| 10 | | STANCORP FINANCIAL GROUP, INC. |
types and maturities are appropriate for the Company’s policy reserves and other liabilities so that we can meet our obligations to policyholders under a wide variety of economic conditions. A substantial portion of our insurance subsidiaries’ policy liabilities result from long term disability reserves that have proven to be very stable over time, and annuity products on which interest rates can be adjusted periodically, subject to minimum interest rate guarantees. Policyholders or claimants may not withdraw funds from the large block of disability reserves. Instead, claim payments are issued monthly over periods that may extend for many years. Holding these stable long-term reserves makes it possible to allocate a significant portion of invested assets to long-term fixed-rate investments, including commercial mortgage loans. The ability to allocate a significant portion of investments to commercial mortgage loans, combined with StanCorp Mortgage Investors’ unique expertise with respect to its market niche for fixed-rate commercial mortgage loans, allows us to enhance the yield on the overall investment portfolio beyond that available through fixed maturity securities with an equivalent risk profile. See Part II, Item 7, “Management’s Discussion and Analysis of Financial Condition and Results of Operations—Liquidity and Capital Resources—Investing Cash Flows” and Item 8, “Financial Statements and Supplementary Data—Notes to Consolidated Financial Statements.”
REGULATION
State and Federal Laws and Regulations
Standard sells its products in and is regulated by all states except New York, and sells its products and is regulated in the District of Columbia. The Standard Life Insurance Company of New York sells its products in and is regulated by New York. The insurance industry in the United States is subject to extensive regulation. Such regulation relates to, among other things, terms and provisions of insurance policies, market conduct practices, maintenance of capital and payment of distributions, and financial reporting on a statutory basis of accounting.
We market registered group variable annuity products, which are part of a registered investment company under the Investment Company Act of 1940. These products are subject to that act and the rules under which, among other things, regulate the relationship between a registered investment company and its investment adviser.
As registered investment advisers, StanCorp Investment Advisers is subject to regulation under the Investment Advisers Act of 1940. This Act establishes, among other
things, recordkeeping and reporting requirements, disclosure requirements, limitations on transactions between the adviser’s account and an advisory client’s account, limitations on transactions between the accounts of advisory clients, and general anti-fraud prohibitions.
The Sarbanes-Oxley Act of 2002 and rules promulgated by the SEC and the New York Stock Exchange thereunder have imposed substantial regulations and disclosure requirements in the areas of corporate governance (including director independence, director selection and audit committee, corporate governance committee and compensation committee responsibilities), equity compensation plans, auditor independence, pre-approval of auditor fees and services, disclosure of executive compensation and internal control procedures.
Violation of applicable laws and regulations can result in legal or administrative proceedings, which can result in fines, penalties, cease and desist orders or suspension or expulsion of our license to sell insurance in a particular state.
Capital Requirement—Risk-Based Capital
The National Association of Insurance Commissioners has a tool to aid in the assessment of the statutory capital and surplus of life and health insurers. This tool, known as Risk-based Capital (“RBC”), augments statutory minimum capital and surplus requirements. RBC employs a risk-based formula that applies prescribed factors to the various risk elements inherent in an insurer’s business to arrive at minimum capital requirements in proportion to the amount of risk assumed by the insurer. The RBC model determines an appropriate Company Action Level based on the Company’s business and assets. Capital below the Company Action Level RBC would require the Company to prepare and submit an RBC plan to the commissioner of the state of domicile outlining the capital level it plans on maintaining. Capital below the Authorized Control Level, which is 50% of the company action level, is the capital level at which the state of domicile is authorized to take whatever regulatory actions considered necessary to protect the best interest of the policyholders and creditors of the insurer.
State insurance departments require insurance enterprises to maintain minimum levels of capital and surplus. As of December 31, 2008, the insurance subsidiaries’ capital was approximately 314% of the company action level of RBC required by regulators, which is 629% of the authorized control level RBC required by our states of domicile. See Part II, Item 7, “Management’s
Part I
Discussion and Analysis of Financial Condition and Results of Operations—Capital Management.”
EMPLOYEES
At December 31, 2008, StanCorp and its subsidiaries had 3,436 full-time equivalent employees, 69% of which were located in Portland, Oregon and the surrounding metropolitan area. At December 31, 2008, none of the Company’s employees were represented by unions.
Risk factors that may affect our business are as follows:
| | • | | Our reserves for future policy benefits and claims related to our current and future business, as well as reserves related to businesses we may acquire in the future, may prove to be inadequate—For certain of our product lines, we establish and carry as a liability actuarially determined reserves that are calculated to meet our obligations for future policy benefits and claims. These reserves do not represent an exact calculation of our future benefit liabilities but are instead estimates based on assumptions, which can be materially affected by changes in the national or regional economy, changes in social perceptions about work ethics, emerging medical perceptions regarding physiological or psychological causes of disability, emerging or changing health issues and changes in industry regulation. Claims experience on our products can fluctuate widely from period to period. If actual events vary materially from our assumptions used when establishing the reserves to meet our obligations for future policy benefits and claims, we may be required to increase our reserves, which could have a material adverse effect on our business, financial position, results of operations or cash flows. |
| | • | | Differences between actual claims experience and underwriting and reserving assumptions may adversely affect our financial results—Our long term disability products provide coverage for claims incurred during the policy period. Generally, group policies offer rate guarantees for periods from one to three years. While we can prospectively re-price and re-underwrite coverages at the end of these guarantee periods, we must pay benefits with respect to claims incurred during these periods without being able to increase guaranteed premium rates during these periods. Historically, approximately 50% of all claims filed under our long term disability policies close within 24 months. However, claims caused by more severe |
| | disabling conditions may be paid over much longer periods, including, in some cases, up to normal retirement age or longer. Longer duration claims, in addition to a higher volume of claims than we expect, expose us to the possibility that we may pay benefits in excess of the amount that we anticipated when the policy was underwritten. The profitability of our long term disability products is thus subject to volatility resulting from the difference between our actual claims experience and our assumptions at the time of underwriting. |
| | • | | We are exposed to concentration risk on our group life insurance business—Due to the nature of group life insurance coverage, we are subject to geographical concentration risk from the occurrence of a catastrophe. |
| | • | | Catastrophic losses from a disease pandemic could have an adverse effect on us—Our life insurance operations are exposed to the risk of loss from an occurrence of catastrophic mortality caused by a disease pandemic, such as could arise from the avian flu, which could have a material adverse effect on our business, financial position, results of operations or cash flows. |
| | • | | Catastrophic losses from terrorism or other factors could have an adverse effect on us—An occurrence of a significant catastrophic event, including natural disasters, terrorism, or other disasters, or a change in the nature and availability of reinsurance and catastrophe reinsurance, could have a material adverse effect on our business, financial position, results of operations or cash flows. |
| | • | | We may be exposed to disintermediation risk during periods of increasing interest rates—In periods of increasing interest rates, withdrawals of annuity contracts may increase as policyholders seek to invest in investments with higher perceived returns. This process, referred to as disintermediation, may lead to cash outflows. These outflows may require investment assets to be sold at a time when the prices of those assets are adversely affected by the increase in interest rates, which may result in realized investment losses. A significant portion of our investment portfolio consists of commercial mortgage loans, which are relatively illiquid, thus increasing our liquidity risk in the event of disintermediation during a period of rising interest rates. |
| | |
| 12 | | STANCORP FINANCIAL GROUP, INC. |
| | • | | Our profitability may be adversely affected by declining interest rates—During periods of declining interest rates, annuity products may be relatively more attractive investments, resulting in increases in the percentage of policies remaining in force from year to year during a period when our new investments carry lower returns. During these periods, lower returns on our investments could prove inadequate for us to meet contractually guaranteed minimum payments to holders of our annuity products. In addition, the profitability of our life and disability insurance products can be affected by declining interest rates. A factor in pricing our insurance products is prevailing interest rates. Longer duration claims and premium rate guarantee periods can expose us to interest rate risk when portfolio yields are less than those assumed when pricing these products. Mortgages and bonds in our investment portfolio are more likely to be prepaid or redeemed as borrowers seek to borrow at lower interest rates, and we may be required to reinvest those funds in lower interest-bearing investments. |
| | • | | Our investment portfolio is subject to risks of market value fluctuations, defaults, delinquencies and liquidity—Our general account investments primarily consist of fixed maturity securities, commercial mortgage loans and real estate. The market values of our investments vary with changing economic and market conditions and interest rates. In addition, we are subject to default risk on our fixed maturity securities portfolio and its corresponding impact on credit spreads, and delinquency and default risk on our commercial mortgage loans. Due to declining values of fixed maturity securities and the related decline in market activity, our fixed maturity securities portfolio has become less liquid. Our commercial mortgage loans are also relatively illiquid. We may have difficulty selling fixed maturity securities and commercial mortgage loans at attractive prices, in a timely manner, or both if we require significant amounts of cash on short notice. |
| | • | | Our business is subject to significant competition—Each of our business segments faces competition from other insurers and financial services companies, such as banks, broker-dealers, mutual funds, and managed care providers for employer groups, individual consumers and distributors. Since many of our competitors have greater financial resources, offer a broader array of products and, with respect to other |
| | insurers, may have higher financial strength ratings than we do, the possibility exists that any one of our business segments could be adversely affected by competition, which in turn could have a material adverse effect on our business, financial position, results of operations or cash flows. |
| | • | | A significant downgrade in our financial strength ratings may negatively affect our business—Financial strength ratings, which rate our claims paying ability, are important factors in establishing the competitive position of insurance companies. Ratings are important to maintaining public confidence in our company and in our ability to market our products. Rating organizations continually review the financial performance and condition of insurance companies, including our company. A significant ratings downgrade could increase our surrender levels for our annuity products, could adversely affect our ability to market our products, could increase costs of future debt issuances, and could thereby have a material adverse effect on our business, financial position, results of operations or cash flows. |
| | • | | Our profitability may be affected by changes in state and federal regulation—Our business is subject to comprehensive state regulation and supervision throughout the United States. While we cannot predict the impact of potential or future state or federal legislation or regulation on our business, future laws and regulations, or the interpretation thereof, could have a material adverse effect on our business, financial position, results of operations or cash flows. |
| | • | | Our business is subject to litigation risk—In the normal course of business, we are a plaintiff or defendant in actions arising out of our insurance business and investment operations. We are from time to time involved in various governmental and administrative proceedings. While the outcome of any pending or future litigation cannot be predicted, as of the date hereof, we do not believe that any pending litigation will have a material adverse effect on our results of operations and financial condition. However, no assurances can be given that such litigation would not materially and adversely affect our business, financial position, results of operations or cash flows. |
Part I
| | • | | The concentration of our investments in California may subject us to losses resulting from an economic downturn as well as certain catastrophes in this state—Our commercial mortgage loans are concentrated in the western region of the U.S., particularly in California. Due to this concentration, we are exposed to potential losses resulting from the risk of an economic downturn in California as well as to certain catastrophes, such as earthquakes and fires, which may affect the region. Although we diversify our commercial mortgage loan portfolio within California by both location and type of property in an effort to reduce earthquake exposure, such diversification may not eliminate the risk of such losses, which could have a material adverse effect on our business, financial position, results of operations or cash flows. |
| | • | | We may be exposed to environmental liability from our commercial mortgage loan and real estate investments—As a commercial mortgage lender, we customarily conduct environmental assessments prior to making commercial mortgage loans secured by real estate and before taking title through foreclosure to real estate collateralizing delinquent commercial mortgage loans held by us. Based on our environmental assessments, we believe that any compliance costs associated with environmental laws and regulations or any remediation of affected properties would not have a material adverse effect on our results of operations or financial condition. However, we cannot provide assurance that material compliance costs will not be incurred by us. |
| | • | | As a holding company, we depend on the ability of our subsidiaries to transfer funds to us in sufficient amounts to pay dividends to shareholders, make payments on debt securities and meet our other obligations—We are a holding company for our insurance and asset management subsidiaries and do not have any significant operations of our own. Dividends and permitted payments from our subsidiaries are our principal source of cash to pay dividends to shareholders, make payments on debt securities and meet our other obligations. As a result, our ability to pay dividends to shareholders and interest payments on debt securities primarily will depend upon the receipt of dividends and other distributions from our subsidiaries. |
Many of our subsidiaries are non-insurance businesses and have no regulatory restrictions on dividends. Our insurance subsidiaries, however, are regulated by
insurance laws and regulations that limit the maximum amount of dividends, distributions and other payments that they could declare and pay to us without prior approval of the states in which the subsidiaries are domiciled. Under Oregon law, Standard Insurance Company (“Standard”) may pay dividends only from the earned surplus arising from its business. Oregon law gives the Director of the Oregon Department of Consumer and Business Services—Insurances Division (“Oregon Insurance Division”) broad discretion regarding the approval of dividends. Oregon law requires us to receive the prior approval of the Oregon Insurance Division to pay a dividend if such dividend exceeds certain statutory limitations; however, it is at the Oregon Insurance Division’s discretion to request prior approval of dividends at any time. See Part II, Item 7, “Management’s Discussion and Analysis of Financial Condition and Results of Operations—Capital Management—Dividends from Insurance Subsidiaries.”
| | • | | Our ability to refinance debt and raise capital in future years depends not only on contributions from our subsidiaries but also on market conditions and availability of credit in the market—We do not have any significant debt maturities in the short-term. Our 10-year Senior Notes (“Senior Notes”) of $250 million will mature in September 2012, and our junior subordinated debt (“Subordinated Debt”) of $300 million will mature in 2067 with a call option in 2017. We maintain a $200 million senior unsecured revolving credit facility (“Facility”) for general corporate purposes, which will expire on June 15, 2013 and had no outstanding balance on December 31, 2008. The Facility is composed of a syndication of six banks. Commitments from the banks toward the available line of credit range from $10.0 million to $52.5 million per bank. Should a bank from this syndication default, the available line of credit would be reduced by that bank’s commitment toward the line. At no time since the inception of the Facility agreement 2.5 years ago has the company drawn down funds in excess of $25 million on the line. For a full discussion of debt maturities See Part II, Item 8, “Financial Statements and Supplementary Data—Notes to Consolidated Financial Statements—Note 9—Long-Term Debt.” |
| | • | | Our business may be affected by employment and wage levels—Factors in the growth of StanCorp’s group insurance and retirement plans businesses are |
| | |
| 14 | | STANCORP FINANCIAL GROUP, INC. |
| | the employment levels, benefit offerings, and salary and wage growth of its employer groups. Current economic conditions may cause our employer groups to experience lower levels of insured employees, to limit benefit offerings, or to reduce or slow the growth of wage levels. If these outcomes arise they may adversely affect premium levels for our group businesses and revenues in our retirement plans business. |
| | • | | Our profitability may be adversely affected by declining equity markets—Current economic conditions have resulted in a substantial decline in U.S. and global equity markets. The value of equity assets under administration is a significant component from which our administrative fee income is derived and our revenue from administrative fees was reduced as a result of the decreased equity values. Sustained equity market declines could result in further decreases in the value of the assets under administration in our retirement plans, and could further reduce our ability to earn administrative fee income derived from the value of those assets. |
| | • | | Declining equity markets could effect the funding status of Company sponsored pension plans—Our estimates of liabilities and expenses for pension and other post-retirement benefits incorporate significant assumptions including the rate used to discount the future estimated liability, the long-term rate of return on plan assets and assumptions relating to the employee work force. A decline in the rate of return on plan assets or in the discount rate, or a change in workforce assumptions could affect our results of operations or shareholders’ equity in a particular period. We may have to contribute more cash or record higher pension-related expenses in future periods as a result of decreases in the value of investments held by the Company’s plans. |
| | • | | A continuing US recession or continued disruption in global financial markets could adversely affect us—A continuing U.S. recession, or a continued disruption in the global financial markets, present risks and uncertainties that we currently cannot predict. If the current economic downturn conditions continue or worsen we face risks that may include: |
| | • | | Declines in revenues and profitability as a result of lower levels of insured employees by our customers, including loss of employer groups due to business bankruptcy or failure. |
| | • | | Declines in revenues and profitability as a result of lower levels of assets under administration. |
| | • | | Increased pricing pressure and competition as customers seek to reduce benefit costs. |
| | • | | Reduction in value of our general account investment portfolio. |
| | • | | Reductions to our banking group or to our committed credit availability due to combinations or failures of financial institutions. |
| | • | | Increases in corporate tax rates to finance government spending programs. |
| Item 1B. | | Unresolved Staff Comments |
None.
Principal properties owned by Standard Insurance Company (“Standard”) and used by the Company consist of two office buildings in downtown Portland, Oregon: the Standard Insurance Center, with approximately 460,000 square feet; and the Standard Plaza, with approximately 220,000 square feet. Both of our business segments use the facilities described above. The Company also owns two buildings with 72,000 square feet of office space each in Hillsboro, Oregon, which are used by StanCorp Mortgage Investors, LLC and our group insurance claims operations. In addition, Standard leases approximately 160,000 square feet of office space located in downtown Portland, Oregon, for home office and claims operations and 60,000 square feet of offsite storage. The Company leases 67 offices under commitments of varying terms to support its sales and regional processing offices throughout the United States. Management believes that the capacity and types of facilities are suitable and adequate. See Part II, Item 8, “Financial Statements and Supplementary Data—Notes to Consolidated Financial Statements—Note 1 Summary of Significant Accounting Policies—Property and equipment, net.”
| Item 3. | | Legal Proceedings |
In the normal course of business, the Company is involved in various legal actions and other state and federal proceedings. A number of actions or proceedings were pending as of December 31, 2008. In some instances, lawsuits include claims for punitive damages and similar types of relief in unspecified or substantial amounts, in addition to amounts for alleged contractual liability or other compensatory damages. In the opinion of management, the ultimate liability, if any, arising from the
Part I
actions or proceedings is not expected to have a material adverse effect on the Company’s business, financial position, results of operations or cash flows.
| Item 4. | | Submission of Matters to a Vote of Security Holders |
There were no matters submitted to a vote of StanCorp’s shareholders during the fourth quarter of 2008.
| Item 4A. | | Executive Officers of the Registrant |
The information with respect to executive officers is set forth pursuant to General Instruction G of Form 10-K.
The following table sets forth the executive officers of StanCorp:
| | | | |
| Name | | Age (as of
February 27,
2009) | | Position |
Floyd F. Chadee | | 52 | | Senior Vice President and Chief Financial Officer of StanCorp and Standard Insurance Company |
Scott A. Hibbs* | | 47 | | Vice President, Asset Management Group of Standard Insurance Company |
Kim W. Ledbetter*(1) | | 56 | | Senior Vice President, Asset Management Group of Standard Insurance Company |
J. Gregory Ness | | 51 | | President and Chief Operating Officer of StanCorp and Standard Insurance Company |
David M. O’Brien* | | 52 | | Senior Vice President Information Technologies of Standard Insurance Company |
Eric E. Parsons | | 60 | | Chairman and Chief Executive Officer of StanCorp and Standard Insurance Company |
Karen M. Weisz* | | 41 | | Vice President Human Resources and Corporate Services of Standard Insurance Company |
Michael T. Winslow | | 54 | | Senior Vice President and General Counsel of StanCorp and Standard Insurance Company |
| | * | | Denotes an officer of a subsidiary who is not an officer of StanCorp but who is considered an “executive officer” of StanCorp under the regulations of the Securities and Exchange Commission. |
| | (1) | | Mr. Ledbetter retired from his position with the Company effective January 2, 2009. |
Set forth below is biographical information for the executive officers of StanCorp:
Floyd F. Chadee, Ph.D., FSA, has been senior vice president and chief financial officer of StanCorp and Standard Insurance Company (“Standard”) since April 2008. Prior to this position, Mr. Chadee served as senior vice president and chief financial officer at Assurant Employee Benefits, a part of Assurant, Inc., and had been with Assurant Employee Benefits since 1998.
Scott A. Hibbshas been vice president, Asset Management Group of Standard since January 2009. Since September 2007, Mr. Hibbs was a vice president for the Insurance Services group under Mr. Ness, which included responsibility for the individual disability insurance area and The Standard Life Insurance Company of New York. From July 2005 to September 2007 Mr. Hibbs was vice president for the Asset Management group under Mr. Ledbetter, which included responsibility for StanCorp Investment Advisers, Inc. (“StanCorp Investment Advisors”). From July 2004 to July 2005, Mr. Hibbs was vice president of corporate strategy and business development. Prior to July 2004, Mr. Hibbs was assistant vice president of investor relations and financial planning. Mr. Hibbs has been with the Company since 2000.
Kim W. Ledbetter, FSA, CLU, was senior vice president, Asset Management group of Standard from the Company’s segment realignment in January 2006 until January 2, 2009. Mr. Ledbetter retired from Standard on January 2, 2009. From June 2004 to January 2006, Mr. Ledbetter was senior vice president, asset management and individual disability of Standard, which included responsibility for Standard’s investment operations, including StanCorp Mortgage Investors, LLC (“StanCorp Mortgage Investors”), StanCorp Investment Advisers, our real estate department, and the individual insurance and retirement plans divisions. From 1997 to June 2004, Mr. Ledbetter was senior vice president, retirement plans division of Standard.
J. Gregory Ness, LLIF, has been president and chief operating officer of StanCorp and Standard since September 2008. Prior to this appointment, Mr. Ness served as senior vice president, Insurance Services group of Standard since the Company’s segment realignment in January 2006. From April 2004 to January 2006, Mr. Ness was senior vice president, group insurance division of Standard. From 1999 to April 2004, Mr. Ness was senior vice president, investments of Standard.
David M. O’Brien has been senior vice president of information technology at Standard since June 2006,
| | |
| 16 | | STANCORP FINANCIAL GROUP, INC. |
and was designated as an executive officer effective in January 2009. From May 2004 to June 2006, Mr. O’Brien was vice president of information technology. Prior to joining Standard in 2004, Mr. O’Brien served as chief information officer for FEI Company.
Eric E. Parsons has been chairman and chief executive officer of StanCorp and Standard since May 2004. Mr. Parsons has served as chief executive officer since January 2003 and was president from May 2002 until September 2008. Mr. Parsons was senior vice president and chief financial officer of StanCorp from its incorporation until 2002 and was chief financial officer of Standard from 1998 through 2002.
Karen M. Weisz has been vice president of human resources and corporate services for Standard since January
2009. From January 2008 to January 2009, Ms. Weisz was vice president of human resources. Prior to joining Standard, Ms. Weisz served as human resources director of new and emerging platform business groups at Intel Corporation and served Intel in various other human resource functions for more than 12 years.
Michael T. Winslow, JD, has been senior vice president and general counsel of StanCorp and Standard since July 2004. Mr. Winslow has also performed the duties of assistant corporate secretary since February 2007. From 2001 to July 2004, Mr. Winslow was vice president, general counsel and corporate secretary of StanCorp and Standard. Prior to joining StanCorp, Mr. Winslow served as assistant general counsel and chief compliance officer for PacifiCorp.
Part II
| Item 5. | | Market for Registrant’s Common Equity, Related Stockholder Matters and Issuer Purchases of Equity Securities |
StanCorp’s common stock is listed on the New York Stock Exchange under the symbol “SFG.” As of February 23, 2009, there were 38,712 shareholders of record of common stock.
The following tables set forth the high and low sales prices as reported by the New York Stock Exchange at the close of the trading day and cash dividends paid per share of common stock by calendar quarter:
| | | | | | | | | | | | |
| | | 2008 |
| | | 4th Qtr | | 3rd Qtr | | 2nd Qtr | | 1st Qtr |
High | | $ | 50.48 | | $ | 54.00 | | $ | 55.28 | | $ | 51.77 |
Low | | | 23.92 | | | 43.13 | | | 46.96 | | | 42.96 |
Dividend Paid | | | 0.75 | | | — | | | — | | | — |
| | | | | | | | | | | | |
| | | 2007 |
| | | 4th Qtr | | 3rd Qtr | | 2nd Qtr | | 1st Qtr |
High | | $ | 55.13 | | $ | 52.79 | | $ | 52.89 | | $ | 49.82 |
Low | | | 49.28 | | | 41.44 | | | 46.99 | | | 44.88 |
Dividend Paid | | | 0.72 | | | — | | | — | | | — |
The declaration and payment of dividends in the future is subject to the discretion of StanCorp’s board of directors. It is anticipated that annual dividends will be paid in December of each year depending on StanCorp’s financial condition, results of operations, cash requirements, future prospects, regulatory restrictions on the distributions from the insurance subsidiaries, the ability of the insurance subsidiaries to maintain adequate capital and other factors deemed relevant by StanCorp’s board of directors. See Item 7, “Management’s Discussion and Analysis of Financial Condition and Results of Operations—Capital Management.” See also Part I, Item 1A, “Risk Factors.”
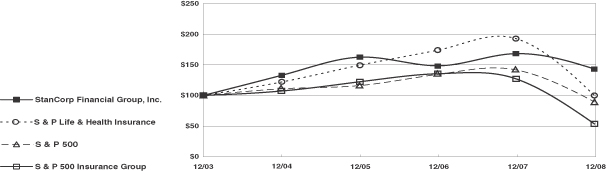
The following graph provides a comparison of the cumulative total shareholder return on the Company’s common stock with the cumulative total return of the Standard & Poor’s (“S&P”) 500 Index, the S&P Life and Health Insurance Index and the S&P Insurance Group Index. The comparison assumes $100 was invested on December 31, 2003, in the Company’s common stock and in each of the foregoing indexes, and assumes the reinvestment of dividends. The graph covers the period of time beginning December 31, 2003, through December 31, 2008.
|
|
Comparison of Five Year Cumulative Total Return Among StanCorp Financial Group, Inc., the S&P 500 Index, the S&P Life & Health Insurance Index and the S&P 500 Insurance Group |
| | |
| 18 | | STANCORP FINANCIAL GROUP, INC. |
From time to time, the board of directors has authorized share repurchase programs. Share repurchases are to be effected in the open market or in negotiated transactions in compliance with the safe harbor provisions of Rule 10b-18 under regulations of the Securities Exchange Act of 1934 (“Exchange Act”). Execution of the share repurchase program is based upon management’s assessment of market conditions for its common stock and other potential growth opportunities. On May 7, 2007, the board of directors authorized a share repurchase program of up to 6.0 million shares of StanCorp common stock. The share repurchase program will be effected in the open market or in negotiated transactions, and it replaced our previous share repurchase program, which had 1.2 million shares remaining that were canceled upon authorization of the new program. On November 3, 2008, the board of directors extended the expiration date of the share repurchase program to December 31, 2009.
During 2008, the Company repurchased 0.5 million shares of common stock at a total cost of $24.9 million for a volume weighted-average price of $47.31 per common share. At December 31, 2008, there were 0.9 million shares remaining under the Company’s current share repurchase program. During 2008, the Company acquired 5,245 shares of common stock from executive officers and directors to cover tax liabilities of these officers and directors resulting from the release of performance-based shares and retention-based shares at a total cost of $0.3 million for a volume weighted-average price of $51.33 per common share. Repurchases are made at market prices on the date of repurchase. Information required by Item 5 with respect to securities authorized for issuance under equity compensation plans is contained in Part III, Item 12 of this Form 10-K.
The following table sets forth share purchases made, for the periods indicated.
| | | | | | | | | |
| | | (a) Total Number of
Shares Purchased | | (b) Average Price
Paid per Share | | (c) Total Number
of Shares Purchased
as Part of Publicly
Announced Plans
or Programs | | (d) Maximum Number
of Shares that May Yet be Purchased Under
the Plans or Programs |
Period: | | | | | | | | | |
October 1-31, 2008 | | 20,000 | | $ | 30.78 | | 20,000 | | 894,800 |
November 1-30, 2008 | | — | | | — | | — | | 894,800 |
December 1-31, 2008 | | — | | | — | | — | | 894,800 |
| | |
| | | | |
| | |
| | | 20,000 | | | 30.78 | | 20,000 | | |
Part II
| Item 6. | | Selected Financial Data |
The following financial data at or for the years ended December 31, should be read in conjunction with Item 7, “Management’s Discussion and Analysis of Financial Condition and Results of Operations” and Item 8, “Financial Statements and Supplementary Data.”
| | | | | | | | | | | | | | | | | | | | |
| (In millions—except share data) | | 2008 | | | 2007 | | | 2006 | | | 2005 | | | 2004 | |
Income Statement Data: | | | | | | | | | | | | | | | | | | | | |
Revenues: | | | | | | | | | | | | | | | | | | | | |
Premiums | | $ | 2,140.2 | | | $ | 2,078.3 | | | $ | 1,935.0 | | | $ | 1,826.5 | | | $ | 1,654.0 | |
Administrative fees | | | 114.6 | | | | 115.2 | | | | 77.1 | | | | 43.3 | | | | 33.7 | |
Net investment income | | | 541.0 | | | | 516.3 | | | | 478.9 | | | | 465.2 | | | | 445.3 | |
Net capital gains (losses) | | | (128.8 | ) | | | (0.6 | ) | | | 1.9 | | | | 2.2 | | | | 11.5 | |
Total Revenues | | | 2,667.0 | | | | 2,709.2 | | | | 2,492.9 | | | | 2,337.2 | | | | 2,144.5 | |
Benefits and expenses: | | | | | | | | | | | | | | | | | | | | |
Benefits to policyholders(1) | | | 1,700.1 | | | | 1,700.6 | | | | 1,610.8 | | | | 1,476.3 | | | | 1,367.7 | |
Operating expenses(2) | | | 686.6 | | | | 636.2 | | | | 554.5 | | | | 517.3 | | | | 467.1 | |
Interest expense | | | 39.2 | | | | 30.7 | | | | 17.9 | | | | 18.0 | | | | 17.7 | |
Total benefits and expenses | | | 2,425.9 | | | | 2,367.5 | | | | 2,183.2 | | | | 2,011.6 | | | | 1,852.5 | |
Income before income taxes | | | 241.1 | | | | 341.7 | | | | 309.7 | | | | 325.6 | | | | 292.0 | |
Income taxes | | | 78.2 | | | | 114.2 | | | | 105.9 | | | | 114.5 | | | | 92.6 | |
Net income | | $ | 162.9 | | | $ | 227.5 | | | $ | 203.8 | | | $ | 211.1 | | | $ | 199.4 | |
Benefit Ratio (% of total premiums): | | | | | | | | | | | | | | | | | | | | |
Group Insurance | | | 73.6 | % | | | 77.4 | % | | | 78.3 | % | | | 75.8 | % | | | 77.4 | % |
Individual Disability | | | 78.7 | | | | 69.3 | | | | 79.4 | | | | 79.2 | | | | 83.2 | |
Per Common Share: | | | | | | | | | | | | | | | | | | | | |
Basic net income | | $ | 3.33 | | | $ | 4.39 | | | $ | 3.77 | | | $ | 3.81 | | | $ | 3.49 | |
Diluted net income | | | 3.30 | | | | 4.35 | | | | 3.73 | | | | 3.76 | | | | 3.45 | |
Market value at year end | | | 41.77 | | | | 50.38 | | | | 45.05 | | | | 49.95 | | | | 41.25 | |
Dividends declared and paid | | | 0.75 | | | | 0.72 | | | | 0.65 | | | | 0.625 | | | | 0.50 | |
Basic weighted-average shares outstanding | | | 48,917,235 | | | | 51,824,050 | | | | 54,079,033 | | | | 55,465,215 | | | | 57,192,206 | |
Diluted weighted-average shares outstanding | | | 49,292,240 | | | | 52,344,950 | | | | 54,688,114 | | | | 56,076,666 | | | | 57,838,188 | |
Ending shares outstanding | | | 48,989,074 | | | | 49,155,131 | | | | 53,592,178 | | | | 54,712,936 | | | | 56,889,678 | |
Balance Sheet Data: | | | | | | | | | | | | | | | | | | | | |
General account assets | | $ | 11,479.3 | | | $ | 10,596.5 | | | $ | 9,806.1 | | | $ | 9,443.1 | | | $ | 8,873.4 | |
Separate account assets | | | 3,075.9 | | | | 4,386.4 | | | | 3,832.5 | | | | 3,007.6 | | | | 2,338.6 | |
Total assets | | $ | 14,555.2 | | | $ | 14,982.9 | | | $ | 13,638.6 | | | $ | 12,450.7 | | | $ | 11,212.0 | |
Long-term debt | | | 561.5 | | | | 562.6 | | | | 261.1 | | | | 260.1 | | | | 258.1 | |
Total liabilities | | | 13,174.9 | | | | 13,553.9 | | | | 12,174.1 | | | | 11,036.9 | | | | 9,810.9 | |
Total equity | | | 1,380.3 | | | | 1,429.0 | | | | 1,464.5 | | | | 1,413.8 | | | | 1,401.1 | |
Statutory Data: | | | | | | | | | | | | | | | | | | | | |
Net gain from operations before federal income taxes and realized capital gains (losses) | | $ | 341.6 | | | $ | 309.3 | | | $ | 271.1 | | | $ | 314.0 | | | $ | 275.8 | |
Net gain from operations after federal income taxes and before capital gains (losses) | | | 235.0 | | | | 197.2 | | | | 172.8 | | | | 207.5 | | | | 191.5 | |
Capital and surplus | | | 1,157.1 | | | | 1,047.8 | | | | 967.5 | | | | 968.7 | | | | 942.5 | |
Asset valuation reserve | | | 78.8 | | | | 102.2 | | | | 96.6 | | | | 88.2 | | | | 73.8 | |
| | (1) | | Includes benefits to policyholders and interest credited. |
| | (2) | | Includes operating expenses, commissions and bonuses, premium taxes, and the net increase in deferred acquisition costs, value of business acquired and intangibles. |
| | |
| 20 | | STANCORP FINANCIAL GROUP, INC. |
| Item 7. | | Management’s Discussion and Analysis of Financial Condition and Results of Operations |
The following management assessment of the financial condition and results of operations should be read in conjunction with the consolidated financial statements and related notes thereto. See Item 8, “Financial Statements and Supplementary Data.” Our consolidated financial statements and certain disclosures made in this Form 10-K have been prepared in accordance with accounting principles generally accepted in the United States of America (“GAAP”) and require us to make estimates and assumptions that affect reported amounts of assets and liabilities and contingent assets and contingent liabilities at the dates of the financial statements and the reported amounts of revenues and expenses during each reporting period. The estimates most susceptible to material changes due to significant judgment are identified as critical accounting policies. The results of these estimates are critical because they affect our profitability and may affect key indicators used to measure the Company’s performance. See “Critical Accounting Policies and Estimates.”
We have made in this Form 10-K, and from time to time may make in our public filings, news releases and oral presentations and discussions, certain statements, which are predictive in nature and not based on historical facts. These statements are “forward-looking” and, accordingly, involve risks and uncertainties that could cause actual results to differ materially from those discussed or implied. Although such forward-looking statements have been made in good faith and are based on reasonable assumptions, there is no assurance that the expected results will be achieved. See “Forward-looking Statements.”
EXECUTIVE SUMMARY
Financial Results Overview
Net income per diluted share was $3.30, $4.35 and $3.73 for the years 2008, 2007 and 2006, respectively. Net income for these same periods was $162.9 million, $227.5 million and $203.8 million, respectively. Results for 2008 reflected after-tax net capital losses of $83.4 million. In addition, declines in equity markets adversely affected the results from our asset management business in 2008. These effects on net income per diluted share were partially offset by premium growth, comparatively favorable claims experience for the group insurance businesses and a 3.1 million reduction in diluted weighted-average shares outstanding resulting primarily from share repurchases.
The increase in net income for 2007 compared to 2006 reflected premium growth and comparatively favorable claims experience in our group insurance and individual disability businesses. Premium growth in the Insurance Services segment was 2.2%, 7.1% and 6.1% for 2008, 2007 and 2006, respectively. For the Insurance Services segment, claims experience for the group insurance products, as indicated by the benefit ratio (benefits to policyholders and interest credited measured as a percentage of premiums), was 73.6%, 77.4% and 78.3% for 2008, 2007 and 2006, respectively.
Outlook for 2009
General economic conditions remain turbulent and reflect a disruption of credit markets and declining equity markets. As a result of current economic conditions, we have experienced a decline in revenues in our retirement plans business due to declines in equity markets and their impact on asset values, which is a key driver in administrative fee revenue. For our group insurance business we have experienced continuing price competition among insurers competing in a group insurance market where fewer large cases have come to market and declines in wage and employment growth have slowed the organic growth of our in force business. While we are not immune to the current economic turbulence, we will continue to focus on our long-term objectives and address challenges that arise with financial discipline and from a position of superior financial strength. We manage for profitability, focusing on good business diversification, disciplined product pricing, sound underwriting, effective claims management and high quality customer service. In 2009, our intent is to preserve the value of our business by continuing to provide excellent value to our customers, to preserve and enhance our financial strength by remaining disciplined in our approach, and to continue to build value for our shareholders despite facing the headwinds of a troubled economy.
For 2009, the Company has established the following expectations, which will affect our annual financial results:
| | • | | Return on average equity, excluding after-tax net capital gains and losses from net income and accumulated other comprehensive income and losses from equity, will be within the target range of 14% to 15%. |
| | • | | Revenues are likely to be relatively flat compared to 2008 given the challenging economic environment. |
| | • | | The annual benefit ratio for the group insurance business will be consistent with the experience of the |
Part II
| | previous five years, during which it has ranged from 73.6% to 78.3%. |
| | • | | Expenses for our employee pension plans will increase by approximately $10 million over 2008 as a result of declines in equity values experienced during 2008. |
| | • | | We will diligently manage operating expenses in response to changing market conditions. One-time costs of $15 million to $20 million will be experienced in 2009 and will be associated with projects designed to enhance our operating efficiencies and reduce our annualized operating expenses by approximately $25 million per year beginning in the second half of 2009. |
CONSOLIDATED RESULTS OF OPERATIONS
Revenues
Revenues consist of premiums, administrative fees, net investment income and net capital gains and losses. Total revenues decreased 1.6% to $2.67 billion for 2008 compared to 2007 and increased 8.7% to $2.71 billion for 2007 compared to 2006. Premium growth in our Insurance Services segment and administrative fee growth in our Asset Management segment are the primary drivers of consolidated revenue growth.
The following table sets forth percentages of premium growth, administrative fee growth and net investment income growth by segment for the years December 31:
| | | | | | | | | |
| | | 2008 | | | 2007 | | | 2006 | |
Premium growth: | | | | | | | | | |
Insurance Services | | 2.2 | % | | 7.1 | % | | 6.1 | % |
Asset Management | | 111.6 | | | 93.4 | | | (24.8 | ) |
Consolidated total premium growth | | 3.0 | | | 7.4 | | | 5.9 | |
Administrative fee growth: | | | | | | | | | |
Insurance Services | | 9.5 | % | | (3.4 | )% | | (1.1 | )% |
Asset Management | | (0.3 | ) | | 51.6 | | | 92.9 | |
Consolidated total administrative fee growth | | (0.5 | ) | | 49.4 | | | 78.1 | |
Net investment income growth: | | | | | | | | | |
Insurance Services | | 3.6 | % | | 4.0 | % | | 3.3 | % |
Asset Management | | 8.0 | | | 12.5 | | | 7.8 | |
Consolidated total net investment income growth | | 4.8 | | | 7.8 | | | 2.9 | |
Consolidated total revenue growth | | (1.6 | )% | | 8.7 | % | | 6.7 | % |
Revenue growth in the Insurance Services and Asset Management segments was offset by net capital losses of $128.8 million in 2008. Net capital losses are reflected in the Other category.
Premiums
Premiums from our Insurance Services segment are the primary driver of consolidated premium growth. The three primary factors that influence premium growth for our
Insurance Services segment are sales, customer retention, and organic growth that is derived from wage and employment growth. Premiums for the Insurance Services segment increased 2.2% to $2.11 billion for 2008 compared to 2007, and 7.1% to $2.06 billion for 2007 compared to 2006. The increase in premiums in 2007 and 2008 was due to strong sales in 2007 in our group insurance businesses. In 2008, sales were partially offset by three large case terminations. Premium growth in 2007 was also affected by a single premium in 2007 of $19.3 million related to a reserve buyout. In addition, premium growth was partially offset by higher experience rated refunds (“ERRs”), which increased by $7.4 million to $44.6 million in 2008. ERRs represent refunds to a limited number of groups with experience rated contracts where refunds are paid within contract terms for favorable claims experience. Premium growth for 2007 was partially offset due to an increase in ERRs of $14.6 million to $37.2 million, compared to $22.6 million for 2006. See “Business Segments—Insurance Services Segment.”
Premiums from our Asset Management segment are primarily generated from life-contingent annuities, which are a single-premium product. Premiums for the Asset Management segment increased 111.6% to $31.1 million for 2008 compared to 2007, and 93.4% to $14.7 million compared to 2006. The increase in premiums during 2008 was due to strong fixed annuity sales as a result of strong demand and higher relative return rates.
Administrative Fees
The primary driver for administrative fee revenue is the level of assets under administration in our Asset Management segment, which is primarily driven by equity market performance. Administrative fees for our Asset Management segment decreased 0.3% to $118.3 million for 2008 compared to 2007 and increased 51.6% to $118.7 million for 2007 compared to 2006. The slight administrative fee decline in 2008 was due to lower levels of assets managed for retirement accounts, which was the result of declining equity markets. This was partially offset by continued new net deposits and increased assets under administration for annuities and commercial mortgage loans. In 2007, administrative fee growth in our Asset Management segment reflected business acquisitions and growth in net deposits in our retirement plans business. In addition, administrative fee growth in 2007 also reflected increased fee revenue related to the origination and servicing of commercial mortgage loans participated to third party investors. Assets under administration were
| | |
| 22 | | STANCORP FINANCIAL GROUP, INC. |
added through the acquisition of DPA, Inc. in July 2007 and Invesmart, Inc. (“Invesmart”) in July 2006. Excluding the administrative fees related to the addition of Invesmart and DPA, Inc., administrative fee growth for the Asset Management segment was 22.9% for 2007 compared to 2006.
Administrative fee revenue from our Insurance Services segment is primarily from insurance products for which we provide only administrative services. Administrative fee revenue from our Insurance Services segment increased 9.5% to $9.2 million for 2008 compared to 2007, and decreased 3.4% to $8.4 million for 2007 compared to 2006.
Net Investment Income
Net investment income increased 4.8% to $541.0 million for 2008 compared to 2007, and 7.8% to $516.3 million for 2007 compared to 2006. Net investment income primarily is affected by changes in levels of invested assets, interest rates, the change in fair value of derivative assets and commercial mortgage loan prepayment fees.
The increase in net investment income for 2008 compared to 2007 was primarily due to an increase of 6.9% to $9.05 billion in average invested assets, primarily resulting from business growth in the first three quarters of 2008, as evidenced by premium growth in our insurance businesses, and growth in average assets under administration for the individual fixed annuities. Average invested assets do not include cash and cash equivalents. The increase in net investment income was partially offset by decreases in the fair value of derivative assets and in commercial mortgage loan prepayment fees. The fair value adjustment to derivative assets resulted in a decrease in net investment income of $11.1 million and $1.0 million for 2008 and 2007, respectively. Commercial mortgage loan prepayment fees decreased $2.4 million for 2008 compared to 2007. The portfolio yield for our fixed maturity securities increased to 5.63% at the end of 2008 from 5.57% at the end of 2007. The portfolio yield for our commercial mortgage loan portfolio increased to 6.39% at the end of 2008, compared to 6.36% at the end of 2007.
The increase in net investment income for 2007 compared to 2006 was primarily due to an increase of 4.9% to $8.47 billion in average invested assets resulting from operations, and an increase in assets related to proceeds of $300 million from junior subordinated debentures (“Subordinated Debt”) issued in May 2007. Average invested assets do not include cash and cash equivalents. Also contributing to the increase was an increase in premiums on called bonds, primarily in the first six months
of 2007. Premiums on called bonds were $2.0 million for 2007, compared to $0.5 million for 2006. The increase in net investment income was partially offset by decreases in the fair value of derivative assets and lower portfolio yield of commercial mortgage loans. The fair value adjustment to derivative assets was a decrease of $1.0 million for 2007, compared to an increase of $0.9 million for 2006. The portfolio yield for commercial mortgage loans decreased to 6.36% at the end of 2007 from 6.40% at the end of 2006. The portfolio yield for fixed maturity securities remained stable at 5.57% at the end of 2007 and 2006.
Commercial mortgage loan prepayment fees were $7.3 million, $9.7 million and $9.8 million for 2008, 2007 and 2006, respectively. Approximately 89% of our commercial mortgage loans contain a provision that requires the borrower to pay a prepayment fee. These prepayment fees assure us that expected cash flows from commercial mortgage loan investments would be protected in the event of prepayment. Since 2001, all new commercial mortgage loans originated by the Company contain this prepayment provision. Almost all of the remaining commercial mortgage loans contain fixed percentage prepayment fees that mitigate prepayments but may not fully protect the Company’s expected cash flow in the event of prepayment.
Net Capital Gains (Losses)
Net capital gains and losses are reported in “Other.” Net capital losses were $128.8 million and $0.6 million for 2008 and 2007, respectively. Net capital gains were $1.9 million for 2006. Net capital gains and losses primarily occur as a result of other-than-temporary impairments or sales of the Company’s assets, neither of which are likely to occur in regular patterns. This lack of a regular pattern was demonstrated by the $128.2 million increase in net capital losses in 2008 over 2007. The net capital losses in 2008 were primarily due to a decline in the market value of certain fixed maturity securities where management determined recovery or the intent to hold the securities was uncertain, which resulted in recording other-than-temporary impairments on those securities. Capital losses in the fourth quarter of 2008 were the result of other-than-temporary impairments in the fixed maturity securities belonging to various economic sectors. Other capital losses recorded in 2008 were primarily the result of other-than-temporary impairments of fixed maturity security holdings of certain bond insurers, financial institutions including Lehman Brothers, AIG, and Washington Mutual and several regional banks.
Part II
Benefits and Expenses
Benefits to Policyholders
Benefits to policyholders are affected by four primary factors: reserves that are established in part based on premium levels, claims experience, assumptions used to establish related reserves and current and future benefits of life-contingent annuities. The predominant factors affecting claims experience are incidence measured by the
number of claims and severity measured as the length of time a disability claim is paid and the size of the claim. The assumptions used to establish the related reserves reflect expected incidence and severity, as well as new investment interest rates and overall portfolio yield, both of which affect the discount rate used to establish reserves. See “Critical Accounting Policies and Estimates—Reserves.”
The following table sets forth benefits to policyholders by segment for the years ended December 31:
| | | | | | | | | | | | | | | | | | |
| (Dollars in millions) | | 2008 | | Percent
change | | | 2007 | | Percent
change | | | 2006 | | Percent
change | |
Benefits to policyholders: | | | | | | | | | | | | | | | | | | |
Insurance Services | | $ | 1,549.7 | | (1.3 | )% | | $ | 1,569.4 | | 4.8 | % | | $ | 1,497.1 | | 9.0 | % |
Asset Management | | | 39.7 | | 77.2 | | | | 22.4 | | 40.0 | | | | 16.0 | | (17.5 | ) |
Total benefits to policyholders | | $ | 1,589.4 | | (0.2 | ) | | $ | 1,591.8 | | 5.2 | | | $ | 1,513.1 | | 8.7 | |
The slight decrease in benefits to policyholders for 2008 compared to 2007 was primarily due to comparatively favorable claims experience in our group insurance business and slowing business growth in the fourth quarter evidenced by decreased premiums in the fourth quarter of 2008. Favorable claims experience was offset by business growth in the first three quarters of the year, as evidenced by premium growth in those quarters, in both the Insurance Services and Asset Management segments.
The increase in benefits to policyholders for 2007 compared to 2006 resulted from business growth as evidenced by premium growth, partially offset by comparatively favorable claims experience in our group insurance and individual disability insurance businesses. See “Business Segments—Insurance Services Segment—Benefits and Expenses—Benefits to Policyholders.”
Interest Credited
Interest credited represents interest paid to policyholders on retirement plan general account assets and individual fixed annuity deposits in the asset management segment and interest paid on life insurance proceeds on deposit in the insurance services segment. The primary factors that affect interest credited are growth in general account assets under management, new investment interest rates and overall portfolio yield (which influence our interest crediting rate for our customers), and customer retention. In addition, interest credited associated with our indexed annuity product may fluctuate from quarter to quarter due to changes in interest rates and equity market volatility.
Consolidated interest credited increased by $1.9 million to $110.7 million for 2008, compared to $108.8 million for
2007. The increase reflects significant growth in individual fixed-rate annuity deposits of $760.7 million, or a 58.7% increase over balances at December 31, 2007.
The increase in interest credited for 2007 compared to 2006 resulted primarily from growth in general account assets in our retirement plans and individual fixed annuities businesses. Growth in interest credited was affected by higher Statement of Financial Accounting Standards (“SFAS”) No. 133 liability accruals for our small block of indexed annuities. In 2007, interest credited was increased by $1.6 million due to the effects of this valuation. In addition, benefits to policyholders for the Asset Management segment increased in 2007 compared to 2006 due to an increase in life-contingent annuity sales for our individual fixed annuities business.
Growth in general account assets for our retirement plans and individual fixed annuities businesses was 28.0% for 2008 compared to 2007, and 6.4% for 2007 compared to 2006. See “Business Segments—Asset Management Segment—Benefits and Expenses—Interest Credited.”
Operating Expenses
Operating expenses increased 7.9% to $469.2 million for 2008 compared to 2007, and 17.4% to $434.8 million for 2007 compared to 2006. The increased operating expenses for 2008 compared to 2007 were due to business growth in the first three quarters of the year, technology infrastructure costs related to the integration of group annuity and trust product platforms used to administer our retirement plans business, and additional incentive compensation accruals reflecting strong results in our Insurance Services Segment.
| | |
| 24 | | STANCORP FINANCIAL GROUP, INC. |
In comparing 2007 to 2006, the increase in operating expenses was primarily due to the integration of Invesmart since 2007 included a full year of Invesmart expenses compared to a half year of expenses in 2006. The additional increase in operating expenses was also due to business growth as evidenced by growth in assets under administration and up-front costs related to the consolidation of some of our trust and insurance platforms. In addition, we acquired DPA, Inc. during the third quarter of 2007. DPA, Inc. is a retirement plan business based in Portland, Oregon. Operating expenses for DPA, Inc. during 2007 were approximately $1.9 million. There were also additional costs related to the installation of a large group life and long term disability policy that contributed approximately $8.5 million to the overall increase in operating expenses for 2007. The installation of the large policy included capitalized software and system costs that will be depreciated and amortized through 2012. The depreciation and amortization costs will add approximately $3.0 million per year to operating expenses for the next five years.
Operating expense growth is typically influenced by business growth as evidenced by premium and administrative fee growth. Premium and administrative fee growth for 2008 was 2.8% compared to 2007, and for 2007 was 9.0% compared to 2006. See “Business Segments—Insurance Services Segment and Asset Management Segment.”
Commissions and Bonuses
Commissions and bonuses primarily represent sales-based compensation, which can vary depending on the product, the structure of the commission program and other factors such as customer retention, sales, growth in assets under administration and the profitability of business in each of our segments. Commissions and bonuses increased 14.9% to $227.6 million for 2008 compared to 2007, and 7.8% to $198.0 million for 2007 compared to 2006.
The increases for 2008 compared to 2007 were primarily due to premium growth in our insurance businesses and strong individual annuity sales in 2008. In comparing 2007 to 2006, the increases were due to premium growth and persistency for our Insurance Services segment and growth in assets under administration for our Asset Management segment. In addition, commissions and bonuses increased due to operations from the Invesmart acquisition in the third quarter of 2006. Excluding the Invesmart acquisition,
growth in commissions and bonuses was 7.6% for 2007 compared to 2006.
Net Change in Deferred Acquisition Costs (“DAC”), Value of Business Acquired (“VOBA”) and Intangibles
We defer certain commissions, bonuses and operating expenses, which are considered acquisition costs. These costs are then amortized into expenses over a period not to exceed the life of the related policies, which for group insurance contracts is the initial premium rate guarantee period, which averages 2.5 years. VOBA primarily represents the discounted future profits of business assumed through reinsurance agreements. A portion of VOBA is amortized each year to achieve matching against expected gross profits. The Company’s intangibles, consisting of customer lists and marketing agreements, are also subject to amortization. Customer lists were acquired through the purchase of Invesmart, DPA, Inc. and several small investment advisory firms. The customer lists are amortized over 10 years. The amortization for the marketing agreement with the Minnesota Life Insurance Company (“Minnesota Life”) is up to 25 years. See “Critical Accounting Policies and Estimates—DAC, VOBA and Other Intangible Assets.” The net deferral for DAC, VOBA and intangibles for 2008 increased $14.5 million compared to 2007 and decreased $1.0 million for 2007 compared to 2006. The large increase in 2008 was due to large individual annuity sales. In addition, a cumulative effect adjustment of $39.4 million after-tax was recorded as a reduction to retained earnings as of January 1, 2007, as a result of the adoption of Statement of Position (“SOP”) 05-1,Accounting by Insurance Enterprises for Deferred Acquisition Costs in Connection With Modifications or Exchanges of Insurance Contracts.
Income Taxes
Income taxes may differ from the amount computed by applying the federal corporate tax rate of 35% to pre-tax income because of the net result of permanent differences between book and taxable income and because of the inclusion of state and local income taxes, net of the federal tax benefit. The combined federal and state effective tax rates were 32.4%, 33.4% and 34.2% for 2008, 2007 and 2006, respectively. The lower effective income tax rate in 2008 compared to 2007 was primarily the result of the favorable resolution of prior year tax matters. At December 31, 2008, the years open for audit by the Internal Revenue Service (“IRS”) are 2005 through 2008. The federal statute of limitations for the 2004 tax year
Part II
expired in September 2008. See Item 8, “Financial Statements and Supplementary Data—Notes to Consolidated Financial Statements—Note 10—Income Taxes” for more information on the change in the effective tax rate.
BUSINESS SEGMENTS
StanCorp operates through two reportable segments: Insurance Services and Asset Management, as well as an Other category, which includes net capital gains and losses, return on capital not allocated to the product segments, holding company expenses, unallocated expenses and adjustments made in consolidation. Resources are allocated, and performance is evaluated at the segment level. The Insurance Services segment offers group and individual disability insurance, group life and accidental death and dismemberment (“AD&D”) insurance, and group dental insurance. The Asset Management segment offers full-service 401(k) plans, 457 plans, defined benefit plans, money purchase pension plans, profit sharing plans, 403(b) plans and non-qualified deferred compensation products and services through an affiliated broker-dealer. This segment also offers investment advisory and management services, financial planning services, commercial mortgage loan origination and servicing, individual fixed annuities, group annuity contracts and retirement plan trust products. It also includes the former operations of Invesmart, a provider of retirement plan services, and investment advisory and management services, acquired in July 2006. The administration and servicing operations for the retirement plans group annuity contracts for the trust product is provided by Standard Retirement Services, Inc. (“Standard Retirement Services.”)
The following table sets forth segment revenues measured as a percentage of total revenues, excluding net capital gains and losses:
| | | | | | | | | |
| | | 2008 | | | 2007 | | | 2006 | |
Insurance Services | | 87.8 | % | | 88.5 | % | | 90.3 | % |
Asset Management | | 11.9 | | | 11.2 | | | 9.5 | |
Insurance Services Segment
The Insurance Services segment is our largest segment and substantially influences our consolidated financial results. Income before income taxes for the Insurance Services segment was $366.4 million, $322.6 million and $282.4 million for 2008, 2007 and 2006, respectively. Results for 2008 reflected favorable claims experience in our group insurance business that was partially offset by unfavorable claims experience in our individual disability business compared to 2007. Results for 2008 also reflected
premium growth due in part to premiums from several large case sales generated in 2007 offset by three large case terminations in 2008. Income before income taxes for this segment for 2007 was affected by premium growth and comparatively favorable claims experience in our group insurance and individual disability businesses. Income before income taxes for 2006 for this segment was affected by premium growth, comparatively less favorable claims experience in our group insurance products and operating expense growth less than premium growth.
The following are key indicators that management uses to manage and assess the performance of the Insurance Services segment:
| | | | | | | | | | | | |
| (Dollars in millions) | | 2008 | | | 2007 | | | 2006 | |
Premiums: | | | | | | | | | | | | |
Group life and AD&D | | $ | 850.3 | | | $ | 807.2 | | | $ | 735.0 | |
Group long term disability | | | 862.9 | | | | 869.8 | | | | 809.9 | |
Group short term disability | | | 215.5 | | | | 219.5 | | | | 211.1 | |
Group dental | | | 75.8 | | | | 70.8 | | | | 72.9 | |
Experience rated refunds | | | (44.6 | ) | | | (37.2 | ) | | | (22.6 | ) |
Individual disability | | | 149.2 | | | | 133.5 | | | | 121.1 | |
Total premiums | | $ | 2,109.1 | | | $ | 2,063.6 | | | $ | 1,927.4 | |
Group insurance sales (annualized new premiums) reported at contract effective date | | $ | 292.5 | | | $ | 408.8 | | | $ | 317.8 | |
Individual disability sales (annualized new premiums) | | | 26.4 | | | | 23.9 | | | | 21.5 | |
Group insurance benefit ratio (% of premiums) | | | 73.6 | % | | | 77.4 | % | | | 78.3 | % |
Individual disability benefit ratio (% of premiums) | | | 78.7 | | | | 69.3 | | | | 79.4 | |
Segment operating expense ratio (% of premiums) | | | 16.0 | | | | 15.2 | | | | 15.1 | |
Revenues
Revenues for the Insurance Services segment increased 2.4% to $2.46 billion for 2008 compared to 2007, primarily due to premium growth of 2.2% and increased net investment income in our group insurance business. Revenues for the Insurance Services segment increased 6.6% to $2.40 billion for 2007 compared to 2006, primarily due to increased premiums and increased net investment income in our insurance businesses.
Premiums
Premiums for the Insurance Services segment increased 2.2% for 2008 compared to 2007, and 7.1% for 2007 compared to 2006. Premiums for 2007 included a single reserve buyout of $19.3 million. Premium growth for 2008 compared to 2007, adjusted for the single reserve buyout of $19.3 million, was 3.2%. The primary factors that affect premium growth for the Insurance Services segment are
| | |
| 26 | | STANCORP FINANCIAL GROUP, INC. |
sales and persistency for all of our insurance products and organic growth in our group insurance product lines due to employment and wage rate growth from existing group policyholders.
Sales. Sales of our group insurance products reported as annualized new premiums were $292.5 million, $408.8 million, and $317.8 million for 2008, 2007 and 2006, respectively. The group insurance market continues to reflect a price-competitive sales environment, and we are currently seeing fewer large cases come to market, which can have a substantial impact on premium growth. Sales activity for small and medium sized groups remains stable. Sales in 2007 included a few large accounts and a single premium sale of $19.3 million related to a reserve buyout. Excluding the single premium sale of $19.3 million in the 2007, sales declined 24.9% for 2008 compared to 2007.
Persistency. Annual persistency for our group insurance products has historically exceeded industry averages. We believe this demonstrates our commitment to customer service and pricing discipline for new sales. Our premium growth of 2.2% for 2008 incorporates three large case terminations that occurred in 2008. Premium growth for 2008 was supported by persistency in our group insurance product lines at 82.9%, compared to 87.4% for 2007. Persistency remained relatively strong in 2008 despite the three large case terminations. Persistency in our individual disability products remains favorable. A significant portion of our in force individual disability policies are non-cancelable.
Organic Growth. A portion of our premium growth in our group insurance in force business is affected by employment and wage rate growth. Organic growth is also affected by changes in price per insured and the average age of employees. Unfavorable economic conditions in 2008 resulted in rapidly rising unemployment, particularly in the second half of the year and slower wage growth throughout 2008, and adversely affected the organic growth in our group insurance businesses.
In addition to the factors listed above, premiums for 2008 included $3.7 million received related to the termination of reinsurance on a small block of reinsured individual disability policies and claims. Offsetting the premiums received in this termination of reinsurance were $3.9 million in additional reserves assumed. The termination of these agreements was made primarily for the purpose of gaining administrative efficiencies.
Premium growth was offset by ERRs of $44.6 million, $37.2 million and $22.6 million for 2008, 2007 and 2006,
respectively. ERRs, which are refunds to certain group contract holders based on claims experience, can fluctuate widely from quarter to quarter depending on the underlying experience of specific contracts.
Net Investment Income
Net investment income for the Insurance Services segment increased 3.6% to $337.5 million for 2008 compared to 2007, and 4.0% to $325.8 million for 2007 compared to 2006. The increase in net investment income for 2008 was primarily due to growth in average invested assets due to business growth, as evidenced by premium growth. The increase in net investment income for 2007 compared to 2006 was primarily affected by growth in average invested assets due to premium growth and by additional income related to premiums on called bonds for this segment of $1.2 million for 2007 compared to $0.3 million for 2006. See “Consolidated Results of Operations—Revenues—Net Investment Income.”
Benefits and Expenses
Benefits to Policyholders (including interest credited)
Three primary factors drive benefits to policyholders: reserves that are established in part based on premium level, claims experience and the assumptions used to establish related reserves. The predominant factors affecting claims experience are claims incidence, measured by the number of claims, and claims severity, measured as the length of time a disability claim is paid and the size of the claim. The assumptions used to establish the related reserves reflect claims incidence and claims severity, in addition to new-money investment interest rates and overall portfolio yield, as both affect the discount rate used to establish reserves.
Benefits to policyholders, including interest credited, for the Insurance Services segment decreased 1.6% to $1.56 billion for 2008 compared to 2007, and increased 5.0% to $1.59 billion for 2007 compared to 2006. The decrease in 2008 primarily resulted from favorable claims experience, offset by business growth in the first three quarters of the year as evidenced by premium growth. The increase from 2006 to 2007 primarily resulted from business growth as evidenced by premium growth, offset by favorable claims experience. Premiums for the Insurance Services segment increased 2.2% for 2008 compared to 2007, and 7.1% for 2007 compared to 2006.
Because premium growth is one of the primary factors that drive benefits to policyholders, the benefit ratio,
Part II
calculated as benefits to policyholders and interest credited as a percentage of premiums, is utilized to provide a measurement of claims normalized for premium growth. The benefit ratio for our group insurance product lines for 2008 was 73.6%, compared to 77.4% for 2007 and 78.3% for 2006. The benefit ratio for 2008 was below the Company’s estimated annual range for 2008 of 77.5% to 79.5%. Claims experience can fluctuate widely from quarter to quarter. We have not experienced an increase in claims incidence in our group long term or group short term disability business during the current economic downturn.
In 2007, we adopted a new group life waiver table, the Society of Actuaries Table 2005, to be used in the calculation of reserves for group life waiver claims incurred in 2007 and later. Adoption of this table resulted in a reduction of $26.7 million and $15.5 million in reserves established for new 2008 and 2007 group life waiver claims, respectively, compared to the reserves that would have been established using the prior table.
The benefit ratio for our individual disability business was 78.7% for 2008, compared to 69.3% for 2007 and 79.4% for 2006. The increase in the benefit ratio for 2008 compared to 2007 primarily reflected less favorable claims experience. The benefit ratio for individual disability for 2008 included $3.7 million of premiums and $3.9 million in additional reserves related to the termination of reinsurance on a small block of reinsured policies and claims. Excluding the effects of this termination of reinsurance, the benefit ratio would have been 78.0% for 2008. Due to the relatively smaller size of our individual disability business, claims experience can fluctuate more widely from quarter to quarter than that of our group insurance business.
In 2006, we adjusted the claim termination rate assumptions for a small block of individual disability claims in light of a recently released industry table. This resulted in an increase in reserves of $6.0 million. These assumptions were further refined in 2007 and 2008 and resulted in an additional increase in reserves of $7.4 million and $2.5 million, respectively. Our block of business is relatively small, and, as a result, we view a blend of the new industry table and our own experience as a more appropriate method for establishing reserve levels compared solely to our own experience. We will continue to monitor the credibility of our developing experience and, if necessary, will adjust our reserves accordingly.
While we generally expect the individual disability benefit ratio to trend down over the long-term to reflect
the growth in the business outside of the large block of disability business assumed in 2000 from Minnesota Life, and the corresponding shift in revenues from net investment income to premiums, we recognize the individual disability insurance block of business is a smaller block of business and its benefit ratio will fluctuate more over the short-term. The anticipated decrease year to year in the expected benefit ratio does not necessarily indicate an increase in profitability; rather it reflects a change in the mix of revenues from the business.
The discount rate used for the fourth quarter of 2008 for newly established long term disability claim reserves increased to 5.75% from 5.25%, which had been in effect since the second quarter of 2008. The increase in the discount rate used for the fourth quarter reflected significantly higher new money rates during the quarter. The discount rate used in the fourth quarter of 2007 for newly established long term disability claim reserves was 5.35%, which decreased from 5.50% used during the first three quarters of 2007.
If investment rates prove to be lower than provided for in the margin between the new money investment rate and the reserve discount rate, we could be required to increase reserves, which could cause expense for benefits to policyholders to increase. The margin at December 31, 2008, in our overall block of business for group insurance between invested asset yield and weighted-average reserve discount rate was 45 basis points. See “Liquidity and Capital Resources.”
Operating Expenses
Operating expenses in the Insurance Services segment increased 8.0% to $338.4 million for 2008 compared to 2007, and 7.3% to $313.2 million for 2007 compared to 2006. Operating expenses as a percentage of premiums were 16.0%, 15.2% and 15.1% for 2008, 2007 and 2006, respectively. The increase in operating expenses for 2008 compared to 2007 was primarily due to increased variable compensation accruals and the administrative costs on new group insurance business resulting from a few large case sales that occurred in 2007. The increase in operating expenses in 2007 was primarily due to business growth as evidenced by premium growth and additional costs related to strong sales in our group insurance business.
Efficiency projects that took place during 2008 are expected to help reduce our annual run rate for operating expenses beginning in the second half of 2009.
| | |
| 28 | | STANCORP FINANCIAL GROUP, INC. |
Asset Management Segment
Income before income taxes for the Asset Management segment decreased 18.6% to $34.9 million for 2008 compared to 2007, and increased 11.7% to $42.9 million for 2007 compared to 2006. The decrease in 2008 compared to 2007 reflected the impact of declining equity markets on revenues in our retirement plans business. In addition, expense levels for the segment were higher due to integration and infrastructure work in the retirement plans business. The increase in 2007 compared to 2006 was primarily due to fees earned from higher assets under administration. Revenues grew 9.7% for 2008 compared to 2007, and 28.0% for 2007 compared to 2006. During the third quarter of 2007, the Company acquired DPA, Inc., a retirement business based in Portland, Oregon, which added $1.7 billion to the Company’s total assets under administration.
Following are key indicators that management uses to manage and assess the performance of the Asset Management segment:
| | | | | | | | | | | | |
| (Dollars in millions) | | 2008 | | | 2007 | | | 2006 | |
Premiums: | | | | | | | | | | | | |
Retirement plans | | $ | 1.6 | | | $ | 0.8 | | | $ | 1.3 | |
Individual annuities | | | 29.5 | | | | 13.9 | | | | 6.3 | |
Total premiums | | $ | 31.1 | | | $ | 14.7 | | | $ | 7.6 | |
Administrative fees: | | | | | | | | | | | | |
Retirement plans | | $ | 95.2 | | | $ | 100.1 | | | $ | 63.7 | |
Other financial services business | | | 23.1 | | | | 18.6 | | | | 14.6 | |
Total administrative fees | | $ | 118.3 | | | $ | 118.7 | | | $ | 78.3 | |
Net investment income: | | | | | | | | | | | | |
Retirement plans | | $ | 85.3 | | | $ | 83.4 | | | $ | 74.0 | |
Individual annuities | | | 79.9 | | | | 70.0 | | | | 68.5 | |
Other financial services income | | | 18.6 | | | | 16.8 | | | | 8.8 | |
Total net investment income | | $ | 183.8 | | | $ | 170.2 | | | $ | 151.3 | |
Sales (Individual annuity deposits) | | $ | 895.4 | | | $ | 210.7 | | | $ | 214.2 | |
Interest credited (% of net investment income): | | | | | | | | | | | | |
Retirement plans | | | 57.0 | % | | | 54.9 | % | | | 54.5 | % |
Individual annuities | | | 64.2 | | | | 67.0 | | | | 64.4 | |
Retirement plans: | | | | | | | | | | | | |
Operating expenses (% of average assets under administration) | | | 0.62 | % | | | 0.56 | % | | | 0.59 | % |
| | | | | | | | | |
| December 31 (Dollars in millions) | | 2008 | | 2007 | | 2006 |
Assets under administration: | | | | | | | | | |
Retirement plans general account | | $ | 1,479.8 | | $ | 1,467.1 | | $ | 1,361.9 |
Retirement plans separate account | | | 3,075.9 | | | 4,386.4 | | | 3,832.5 |
Total retirement plans insurance products | | | 4,555.7 | | | 5,853.5 | | | 5,194.4 |
Retirement plans trust products | | | 9,911.6 | | | 12,872.1 | | | 11,045.6 |
Individual fixed annuities | | | 2,056.6 | | | 1,295.9 | | | 1,234.9 |
Commercial mortgage loans under administration for other investors | | | 2,526.2 | | | 1,899.4 | | | 1,407.0 |
Other | | | 644.7 | | | 447.3 | | | 137.5 |
Total assets under administration | | $ | 19,694.8 | | $ | 22,368.2 | | $ | 19,019.4 |
Revenues
Revenues from the retirement plans business include plan and trust administration fees, fees on equity investments held in separate account assets and other assets under administration, and investment income on general account assets under administration. Premiums and benefits to policyholders reflect the conversion of retirement plan assets into life-contingent annuities, which can be selected by plan participants at the time of retirement, including the sale of immediate annuities. Most of the sales for this segment are recorded as deposits and are therefore not reflected as premiums. Individual fixed annuity deposits earn investment income, a portion of which is credited to policyholders.
Revenues for the Asset Management segment increased 9.7% to $333.2 million for 2008 compared to 2007, and 28.0% to $303.6 million for 2007 compared to 2006. The increase in revenues for 2008 was primarily due to sales growth in our life-contingent individual fixed annuities business. Revenues in 2008 were also affected by increased contract administration fees in our investment advisory business and increased fee revenue related to the origination and servicing of commercial mortgage loans for third parties. Individual fixed annuity sales were $895.4 million in 2008, or 325.0% higher than in 2007 and reflected strong current demand, strong growth in our distribution channels and less competition from banks and alternative investments. Revenue growth for 2008 was partially offset by a decrease in revenues in the retirement plans business reflecting the impact of declining equity markets.
Premiums
Premiums for the Asset Management segment are generated from life-contingent annuities, which are a single-premium product. Premiums and benefits to policyholders reflect both the sale of immediate annuities by our individual annuity business and the conversion of retirement plan assets into life-contingent annuities, which can be selected by plan participants at the time of retirement. Premiums for the segment can vary significantly from quarter to quarter due to low sales volume of life-contingent annuities and the varying size of single premiums. Premiums for the Asset Management segment were $31.1 million, $14.7 million and $7.6 million for 2008, 2007 and 2006, respectively. The large increase in premiums in 2008 was due to strong life-contingent fixed annuity sales as a result of strong current demand and higher relative return rates.
Part II
Administrative Fees
Administrative fees for the Asset Management segment include both asset-based and plan-based fees related to our retirement plans and investment advisory businesses and fees related to the origination and servicing of commercial mortgage loans. The primary driver for administrative fee revenue is the level of assets under administration, which is primarily driven by equity market performance. Administrative fees for the Asset Management segment were $118.3 million, $118.7 million and $78.3 million for 2008, 2007 and 2006, respectively. The slight administrative fee decline in 2008 was due to declining values of assets managed for retirement accounts and was a result of declining equity markets. This was offset by increased administrative fees from commercial mortgage loan servicing and our investment advisory business. Administrative fee revenue for 2008 also included the addition of DPA, Inc. a Portland based retirement plans business acquired in the third quarter of 2007, which added approximately $5.1 million and $2.6 million in administrative fees for 2008 and 2007, respectively.
Average assets under administration for this segment, including retirement plans, individual fixed annuities and commercial mortgage loans managed for third party investors, were $21.03 billion, $20.69 billion and $12.78 billion for 2008, 2007 and 2006, respectively. Although average assets under administration increased for 2008 compared to 2007, the balance of our assets under administration decreased significantly in the second half of 2008 due to decreased assets under administration in our retirement plan business in conjunction with the declines in equity markets, partially offset by new net customer deposits and increased assets under administration for annuities and commercial mortgage loans. Assets under administration for this segment were $19.69 million at December 31, 2008. The increase in average assets under administration for 2007 compared to 2006 was primarily due to the acquisition of Invesmart in the third quarter of 2006, to continued deposit growth, good customer retention, strong commercial mortgage loan originations for other investors, equity market appreciation in the retirement plans business and to $1.7 billion acquired through the third quarter 2007 acquisition of DPA, Inc., a retirement plans business based in Portland, Oregon. Administrative fee growth for 2007 included $2.6 million in administrative fee revenue from the DPA, Inc. business acquired in the third quarter of 2007.
StanCorp Mortgage Investors, LLC (“StanCorp Mortgage Investors”) originated $1.37 billion, $1.45 billion and $942.8 million of commercial mortgage loans for 2008, 2007 and 2006, respectively. The decrease in originations in 2008 was due to reduced demand in the fourth quarter of 2008 from borrowers because of higher interest rates. While originations decreased from 2007, originations in 2008 were still strong due to overall favorable interest rate conditions accompanied by increased demand for fixed-rate commercial mortgage loans. The strong originations also reflected a less competitive origination market, partially due to decreased competition from securitized lenders. Commercial mortgage loans managed for other investors increased 33.0% from December 31, 2007 to December 31, 2008, and 35.0% from December 31, 2006 to December 31, 2007.
Net Investment Income
Net investment income for the Asset Management segment increased 8.0% to $183.8 million for 2008, compared to $170.2 million for 2007. The increase was primarily reflective of increases in average retirement plan general account and individual annuity assets under administration in 2008. The increase was partially offset by decreases in commercial mortgage loan prepayment fees and in the fair value of derivative instruments in 2008. Average retirement plan general account assets under administration increased 4.2% to $1.47 billion for 2008 compared to 2007. Average individual annuity assets under administration increased 32.5% to $1.68 billion for 2008 compared to 2007. The significant increases in average individual annuity assets under administration were due to very strong individual annuity sales in 2008. Commercial mortgage loan prepayment fees decreased $2.4 million for 2008 compared to 2007. The fair value of derivative instruments decreased $11.1 million for 2008, compared to a decrease in the fair value of $1.0 million for 2007. See Part II, Item 8, “Financial Statements and Supplementary Data—Notes to Consolidated Financial Statements—Note 7—Derivative Financial Instruments.” Excluding the effect of changes in the derivative instruments, net investment income increased 13.8% to $194.9 million for 2008 compared to 2007.
Net investment income for the Asset Management segment increased 12.5% to $170.2 million for 2007 compared to 2006. The increase was primarily due to an increase of 9.8% to $1.41 billion in average general account assets under administration and an increase in
| | |
| 30 | | STANCORP FINANCIAL GROUP, INC. |
commercial mortgage loan commitment fees of $3.9 million for 2007 compared to 2006 as a result of the increase in commercial mortgage loan originations. Partially offsetting the increase in net investment income was a decrease in the fair value of derivative assets of $1.0 million, compared to an increase of $0.9 million for 2006 and lower yields on commercial mortgage loans.
Benefits and Expenses
Benefits to Policyholders
Benefits to policyholders for the Asset Management segment represents current and future benefits on life-contingent annuities, which vary with life-contingent annuity sales. Benefits to policyholders for the Asset Management segment increased $17.3 million to $39.7 million for 2008 compared to 2007 and increased $6.4 million to $22.4 million for 2007 compared to 2006. Changes in the level of benefits to policyholders will correlate to changes in premium levels because these annuities primarily are single-premium life-contingent annuity products with a significant portion of all premium payments established as reserves. As evidence of this, Asset Management segment premiums increased to $31.1 million from $14.7 million for 2008 compared to 2007, and increased to $14.7 million from $7.6 million for 2007 compared to 2006.
Interest Credited
Interest credited represents interest paid to policyholders on retirement plan general account assets and individual fixed annuity deposits. Interest credited for the Asset Management segment increased 7.8% to $99.9 million for 2008 compared to 2007, and increased 9.8% to $92.7 million for 2007 compared to 2006. The increase in interest credited for 2008 compared to 2007 primarily reflects significant growth in individual fixed-rate annuity assets under administration of $760.7 million, or a 58.7% increase over balances at December 31, 2007. The increase in interest credited was partially offset by a decline in the S&P 500 index, which is used in valuing the indexed annuities. Interest credited on indexed annuities was reduced by $9.2 million for 2008, compared to an increase in interest credited of $1.6 million for 2007 primarily due to changes in the S&P 500 Index.
For 2007, interest credited to retirement plan customers increased primarily due to an increase in the interest-crediting rate to retirement plan customers and increases in average balances. Interest credited to individual fixed annuity deposits included the indexed annuity products first offered in 2006. The interest credited to the indexed
annuities increased $4.3 million for 2007 compared to 2006 primarily due to increases in the S&P 500 Index and average balances.
Average assets under administration for individual fixed annuities increased 32.5% for 2008 compared to 2007, and 6.4% for 2007 compared to 2006. Interest credited also includes changes in fair value of index-based interest guarantees. See Item 8 “Financial Statements and Supplementary Data—Notes to Consolidated Financial Statements—Note 7—Derivative Financial Instruments.”
Operating Expenses
Operating expenses for the Asset Management segment increased 9.3% to $131.4 million for 2008 compared to 2007. The increases in operating expenses for this segment were primarily due to planned technology infrastructure costs related to completing the integration of our group annuity and trust product administrative platforms used to administer our retirement plans business. In addition, we acquired DPA, Inc., a retirement plans business based in Portland, Oregon in the third quarter of 2007. Operating expenses for 2008 included approximately $3.6 million in expenses related to the operations of DPA.
Infrastructure and integration projects that were completed during 2008 are expected to help with operating expense efficiency in 2009.
Operating expenses for the Asset Management segment increased 52.9% to $120.2 million for 2007 compared to 2006. The increase in operating expenses for this segment was due to business growth as evidenced by growth in assets under administration, the integration of Invesmart, which included a full year of expenses in 2007 compared to a half year of expenses in 2006, up-front costs related to the consolidation of our trust product and group annuity platforms and $1.9 million of expenses in 2007 related to the operations of DPA, Inc.
Other
In addition to our two segments, we report our holding company and corporate activity in the Other category. This category includes net capital gains and losses, return on capital not allocated to the product segments, holding company expenses, interest on debt, other unallocated expenses and adjustments made in consolidation.
The Other category reported a loss before income taxes of $160.2 million for 2008, compared to a loss before income taxes of $23.8 million for 2007 and a loss before income taxes of $11.1 million for 2006. The net capital losses in 2008 were primarily due to a decline in the market value of fixed maturity securities, which resulted in
Part II
recording other-than-temporary impairments and net losses on sales of some of these securities. Net capital losses in the fourth quarter of 2008 were primarily the result of other-than-temporary impairments in the fixed maturity securities of various economic sectors and sales of some of the holdings in these sectors. In the third quarter of 2008, we recorded capital losses that were the result of other-than-temporary impairments of fixed maturity security holdings of certain financial institutions including Lehman Brothers, AIG, and Washington Mutual and the sale of holdings in several regional banks. Other-than-temporary impairments of debt security holdings of certain bond insurers were recorded in the second quarter of 2008. The additional loss for 2008 included additional interest expense of $8.6 million for the comparable periods primarily related to the $300 million Subordinated Debt issued in May 2007. Contributing to the loss before income taxes for 2007 compared to 2006 was an increase in interest expense of $12.8 million primarily related to the Subordinated Debt. The interest expense was partially offset by an increase in net investment income of $6.1 million to $20.3 million for 2007. The increase in net investment income is primarily due to increased levels of invested assets attributed to the proceeds received through the Subordinated Debt issuance. In addition, 2007 included $3.0 million in pre-tax severance costs due to the departure of the chief financial officer in the second quarter. See “Liquidity and Capital Resources—Financing Cash Flows.”
LIQUIDITY AND CAPITAL RESOURCES
Asset/Liability and Interest Rate Risk Management
Asset/Liability management is a part of our risk management structure. The risks we assume related to asset/liability mismatches vary with economic conditions. The primary sources of economic risk are interest-rate related and include changes in interest rate term risk, credit risk, and liquidity risk. It is generally management’s objective to align the characteristics of assets and liabilities so that our financial obligations can be met under a wide variety of economic conditions. From time to time, management may choose to liquidate certain investments and reinvest in different investments so that the likelihood of meeting our financial obligations is increased. See “—Investing Cash Flows.”
We manage interest rate risk, in part, through asset/liability analyses. In keeping with presently accepted actuarial standards, the Company has made adequate provisions for the anticipated cash flows required to meet
contractual obligations and related expenses, through the use of statutory reserves and related items at December 31, 2008.
Our financial instruments are exposed to financial market volatility and potential disruptions in the market that may result in certain financial instruments becoming less valuable. Financial market volatility includes interest rate risk. We have analyzed the estimated loss in fair value of certain market sensitive financial assets held at December 31, 2008 and 2007, using a hypothetical 10% increase in interest rates and related qualitative information on how we manage interest rate risk. The interest rate sensitivity analysis was based upon our fixed maturity securities and commercial mortgage loans held at December 31, 2008 and 2007. Interest rate sensitivity of our financial assets was measured assuming a parallel shift in interest rates. All security yields were increased by 10% of the year-end 10-year U.S. Government Treasury bond yield, or 0.23% and 0.40% for the 2008 and 2007 analyses, respectively. The change in fair value of each security was estimated as the change in the option adjusted value of each security. Option adjusted values were computed using our payment models and provisions for the effects of possible future changes in interest rates. The analyses did not explicitly provide for the possibility of non-parallel shifts in the yield curve, which would involve discount rates for different maturities being increased by different amounts. The actual change in fair value of our financial assets can be significantly different from that estimated by the model. The hypothetical reduction in the fair value of our financial assets that resulted from the model was estimated to be $78 million and $180 million at December 31, 2008 and 2007, respectively.
Additionally, a cash management process is in place that anticipates short-term cash needs. Depending upon capital market conditions anticipated, cash needs may be covered by liquid asset holdings or a draw upon our line of credit. In almost all cases, borrowed funds can be retired from normal operating cash flows in conjunction with adjustments to long-term investing practice within half a year. For more information about our line of credit, see “—Financing Cash Flows,” and Part I, Item 1A, “Risk Factors.”
As a percentage of our fixed maturity investments, callable bonds were 2.43% at December 31, 2008. Since 2001, all commercial mortgage loans originated by us contain a provision requiring the borrower to pay a prepayment fee to assure that our expected cash flow from
| | |
| 32 | | STANCORP FINANCIAL GROUP, INC. |
commercial mortgage loan investments would be protected in the event of prepayment. Approximately 89% of our commercial mortgage loan portfolio contains this prepayment provision. Almost all of the remaining commercial mortgage loans contain fixed percentage prepayment fees that mitigate prepayments but may not fully protect our expected cash flow in the event of prepayment.
Operating Cash Flows
Net cash provided by operations is net income adjusted for non-cash items and accruals and was $361.8 million, $485.7 million and $390.1 million for 2008, 2007 and 2006, respectively.
Investing Cash Flows
We maintain a diversified investment portfolio primarily consisting of fixed maturity securities and fixed-rate commercial mortgage loans. Investing cash inflows primarily consist of the proceeds of investments sold, matured or repaid. Investing cash outflows primarily consist of payments for investments acquired or originated.
The insurance laws of the states of domicile and other states in which the insurance subsidiaries conduct business regulate the investment portfolios of the insurance subsidiaries. Relevant laws and regulations generally limit investments to bonds and other fixed maturity securities, mortgage loans, common and preferred stock and real estate. Decisions to acquire and dispose of investments are made in accordance with guidelines adopted and modified from time to time by the insurance subsidiaries’ boards of directors. Each investment transaction requires the approval of one or more members of senior investment staff, with increasingly higher approval authorities required for transactions that are more significant. Transactions are reported quarterly to the finance and operations committee of the board of directors for Standard and to the board of directors for The Standard Life Insurance Company of New York.
Net cash used in investing activities was $1.03 billion, $597.0 million and $749.3 million for 2008, 2007 and 2006, respectively. The increase in net cash used in investing activities from 2008 compared to 2007 was primarily due to increased investments from growth in the individual annuity business. The decrease in the net use of cash in investing activities from 2007 compared to 2006 was primarily due to the July 2006 purchase of Invesmart. Invesmart was a national retirement financial services company and is now part of our Asset Management
segment. There were no similar sized acquisitions during 2007 or 2008. Also contributing to the decrease in cash used for 2007 was a $606.9 million increase in proceeds from investments sold, matured or repaid. This increase was partially offset by a $495.5 million increase in cash used by the combination of new mortgage originations, purchases of fixed maturity securities, and purchases of real estate investments. Partially offsetting the overall decrease in investing cash used for acquisitions was the Company’s increased use of cash for short-term investments. The increased use of cash for short-term investments was primarily due to the investment of cash received through the Subordinated Debt offering in May 2007.
Our target investment portfolio allocation is approximately 60% fixed maturity securities and 40% commercial mortgage loans. At December 31, 2008, our portfolio consisted of 55.5% fixed maturity securities, 43.6% commercial mortgage loans, 0.9% real estate.
Fixed Maturity Securities
Our fixed maturity securities totaled $5.20 billion at December 31, 2008. We believe that we maintain prudent diversification across industries, issuers and maturities. Our corporate bond industry diversification targets are based on the Merrill Investment Grade Credit Index, which is reasonably reflective of the mix of issuers broadly available in the market. We also target a specified level of government, agency and municipal securities in our portfolio for credit quality and additional liquidity. The overall credit quality of our fixed maturity securities investment portfolio was A (Standard & Poor’s) at December 31, 2008. The percentage of fixed maturity securities below investment-grade was 4.9% and 4.1% at December 31, 2008 and 2007, respectively. At December 31, 2008, fixed maturity securities on our watch list totaled $329.5 million in market value and $439.0 million in book value after other-than temporary impairments. The Company recorded other-than-temporary impairments of $104.9 million during 2008, primarily due to a significant decline in the market value of fixed maturity securities during the deteriorating economic environment.
While the amount of impairments on our fixed maturity securities were much higher in 2008 than in recent years, the percent of the impairments compared to the total fixed maturity security portfolio at the beginning of the year was only 2.1%. In addition, sales in 2008 to remove holdings with potential liquidity concerns leave the portfolio in a better position for the future. Based upon our review, we
Part II
believe the remaining holdings in the portfolio are with companies that have good liquidity and manageable debt maturities. We also did not have any direct exposure to sub-prime or Alt-A mortgages in our fixed maturity securities portfolio at December 31, 2008. We expect our improved portfolio leaves us in a better position to weather an extended economic downturn.
At December 31, 2008, our fixed maturity securities portfolio had gross unrealized capital gains of $136.9 million and gross unrealized capital losses of $258.7 million. Unrealized gains and losses primarily result from holding fixed maturity securities with interest rates higher or lower, respectively, than those currently available at the reporting date.
Commercial Mortgage Loans
StanCorp Mortgage Investors originates and services fixed-rate commercial mortgage loans for the investment portfolios of our insurance subsidiaries and generates additional fee income from the origination and servicing of commercial mortgage loans participated to institutional investors.
Commercial mortgage loan originations for internal and external investors were $1.37 billion, $1.45 billion and $942.8 million for 2008, 2007 and 2006, respectively. The level of commercial mortgage loan originations in any year is influenced by market conditions as we respond to changes in interest rates, available spreads and borrower demand.
At December 31, 2008, StanCorp Mortgage Investors serviced $4.08 billion in commercial mortgage loans for subsidiaries of StanCorp and $2.53 billion for other institutional investors, compared to $3.66 billion serviced for subsidiaries of StanCorp and $1.90 billion for other institutional investors at December 31, 2007.
The average loan to value ratio for the overall portfolio was approximately 59.2% at December 31, 2008. The loan to value ratio is calculated with stabilized net operating income and market capitalization rates after a thorough annual analysis by our underwriting and servicing staff of current rent rolls and operating history for each of the loans in the portfolio. The average loan size retained by the Company in the portfolio was approximately $0.8 million at December 31, 2008. We have the contractual ability to pursue personal recourse on most of the loans.
Capitalized commercial mortgage loan servicing rights associated with commercial loans serviced for other institutional investors were $7.6 million and $5.7 million at December 31, 2008 and 2007, respectively.
At December 31, 2008, there were 7 commercial mortgage loans totaling $7.8 million in our portfolio that were more than sixty days delinquent, of which 4 commercial mortgage loans with a total balance of $3.9 million were in the process of foreclosure. We had a net balance of restructured loans of $6.2 million at December 31, 2008, and a commercial mortgage loan loss reserve of $6.8 million. In 2008, commercial mortgage loans foreclosed or acquired through a deed in lieu and transferred to real estate were $6.8 million. In March 2008, StanCorp Mortgage Investors purchased two loans from a third party lender related to a current borrower. These loans, which had an aggregate obligation to the previous lender of $31.9 million, were purchased at a discounted price of $25.0 million. The portfolio of loans with this current borrower had a total aggregate obligation of $97.0 million and a book value of $90.2 million at December 31, 2008. At December 31, 2008, we did not have any direct exposure to sub-prime or Alt-A mortgages in our commercial mortgage loans portfolio.
The performance of our commercial mortgage loan portfolio may fluctuate in the future and due to the current state of the economy, we expect that there will be increased delinquencies in the coming year. However, we feel that our business approach of intensively underwriting high quality loans will help us keep problem loans to a reasonable level. We have steadfastly avoided the types of structured products that do not meet an adequate level of transparency for good decision making. When we undertake mortgage risk, we do so directly through loans that we originate and underwrite ourselves rather than in packaged products such as commercial mortgage-backed securities. Given that we service the loans in our portfolios ourselves, we are prepared to deal with them promptly and proactively. Should the delinquency rate or loss performance of our commercial mortgage loan portfolio increase significantly, the increase could have a material adverse effect on our business, financial position, results of operations or cash flows.
At December 31, 2008, our commercial mortgage loan portfolio was collateralized by properties with the following characteristics:
| | • | | 49.2% retail properties. |
| | • | | 17.3% industrial properties. |
| | • | | 18.6% office properties. |
| | • | | 4.5% commercial properties. |
| | • | | 7.5% hotel/motel properties. |
| | • | | 2.9% apartment and agricultural properties. |
| | |
| 34 | | STANCORP FINANCIAL GROUP, INC. |
At December 31, 2008, our commercial mortgage loan portfolio was diversified regionally as follows:
Commercial mortgage loans in California accounted for 27.7% of our commercial mortgage loan portfolio at December 31, 2008. The next largest concentration by state is 10%. Through this concentration in California, we are exposed to potential losses from an economic downturn in California as well as to certain catastrophes, such as earthquakes and fires, which may affect certain areas of the state. We require borrowers to maintain fire insurance coverage to provide reimbursement for any losses due to fire. We diversify our commercial mortgage loan portfolio within California by both location and type of property in an effort to reduce certain catastrophe and economic exposure. However, diversification may not always eliminate the risk of such losses. Historically, the delinquency rate of our California-based commercial mortgage loans has been substantially below the industry average and consistent with our experience in other states. In addition, when new loans are underwritten, we do not require earthquake insurance for properties on which we make commercial mortgage loans but do consider the potential for earthquake loss based upon seismic surveys and structural information specific to each property. We do not expect a catastrophe or earthquake damage in California to have a material adverse effect on our business, financial position, results of operations or cash flows. Currently, our California exposure is largely in Los Angeles County, San Diego County and the Bay Area Counties. We have a smaller concentration of commercial mortgage loans on the Inland Empire and the San Joaquin Valley where there has been greater economic decline. If economic conditions in California continue to decline, we could experience a higher delinquency rate on the portion of our commercial mortgage loan portfolio located in California, which could have a material adverse effect on our business, financial position, results of operations or cash flows.
Under the laws of certain states, environmental contamination of a property may result in a lien on the property to secure recovery of the costs of cleanup. In some states, such a lien has priority over the lien of an existing mortgage against such property. As a commercial mortgage lender, we customarily conduct environmental assessments prior to making commercial mortgage loans secured by
real estate and before taking title through foreclosure on real estate collateralizing delinquent commercial mortgage loans held by us. Based on our environmental assessments, we believe that any compliance costs associated with environmental laws and regulations or any remediation of affected properties would not have a material adverse effect on our business, financial position, results of operations or cash flows. However, we cannot provide assurance that material compliance costs will not be incurred by us.
In the normal course of business, we commit to fund commercial mortgage loans generally up to 90 days in advance. At December 31, 2008, the Company had outstanding commitments to fund commercial mortgage loans totaling $96.9 million, with fixed interest rates ranging from 6.50% to 7.25%. These commitments generally have fixed expiration dates. A small percentage of commitments expire due to the borrower’s failure to deliver the requirements of the commitment by the expiration date. In these cases, we will retain the commitment fee and good faith deposit. Alternatively, if we terminate a commitment due to the disapproval of a commitment requirement, the commitment fee and good faith deposit may be refunded to the borrower, less an administrative fee.
Financing Cash Flows
Financing cash flows primarily consist of policyholder fund deposits and withdrawals, borrowings and repayments on the line of credit, borrowings and repayments on long-term debt, repurchases of common stock and dividends paid on common stock. Net cash provided by financing activities was $741.9 million, $261.1 million and $362.0 million for 2008, 2007 and 2006, respectively.
The primary drivers of financing cash flows for 2008 were the growth in individual annuity deposits due to increased individual annuity sales and reduced share repurchases in 2008 compared to 2007. In 2007, proceeds from the issuance of a $300 million hybrid debt offering provided the primary contribution to proceeds from financing activities partially offset by an accelerated share repurchase program. The decrease for 2007 compared to 2006 resulted from several offsetting factors. Cash inflows from a $300 million Subordinated Debt offering in May 2007 were offset by increased repurchases of common stock, the elimination of cash inflows from a third party minority interest in a limited liability company that was dissolved in December 2006 and slightly slower growth in policyholder fund deposits, net of withdrawals. The Company repurchased common stock at a total cost of
Part II
$24.9 million, $235.6 million and $70.1 million for 2008, 2007 and 2006, respectively.
On June 15, 2006, the Company established a five-year, $200 million senior unsecured revolving credit facility (“Facility”). On June 15, 2008, the Facility was amended to extend the expiration date by one year to June 15, 2013. The Facility will remain at $200 million through June 15, 2012, and will decrease to $165 million thereafter until final maturity on June 15, 2013. Borrowings under the Facility will continue to be used to provide for the working capital and general corporate purposes of the Company and its subsidiaries and the issuance of letters of credit.
Under the agreement, StanCorp is subject to customary covenants that take into consideration the impact of material transactions, changes to the business, compliance with legal requirements and financial performance. The two financial covenants are based on our total debt to total capitalization ratio and consolidated net worth. Under the two financial covenants, the Company is required to maintain a debt to capitalization ratio that does not exceed 35% and a consolidated net worth that is equal to at least $1.04 billion. The financial covenants exclude the unrealized gains and losses related to fixed maturity securities that are held in accumulated other comprehensive income (loss). At December 31, 2008, the Company had a debt to total capitalization ratio of 27.8% and consolidated net worth of $1.47 billion. The Company believes it will continue to meet the financial covenants in the future. The Facility is subject to performance pricing based upon our total debt to total capitalization ratio and includes interest based on a Eurodollar margin, plus facility and utilization fees. At December 31, 2008, StanCorp was in compliance with all covenants under the Facility and had no outstanding balance on the Facility.
On September 25, 2002, we completed an initial public debt offering of $250 million of 6.875%, 10-year senior notes (“Senior Notes”), pursuant to the shelf registration statement. The principal amount of the Senior Notes is payable at maturity and interest is payable semi-annually in April and October.
On May 29, 2007, the Company completed a public debt offering of $300 million of 6.90%, Subordinated Debt. The Subordinated Debt has a final maturity on June 1, 2067, is non-callable at par for the first 10 years and is subject to a replacement capital covenant. The covenant limits replacement of the Subordinated Debt for the first 40 years to be redeemable after year 10 and only with securities that
carry equity-like characteristics that are the same as or
more equity-like than the Subordinated Debt. The principal amount of the Subordinated Debt is payable at final maturity. Interest is payable semi-annually at 6.90% in June and December for the first 10 years and quarterly thereafter at a floating rate equal to three-month LIBOR plus 2.51%. StanCorp has the option to defer interest payments for up to five years. StanCorp is currently not deferring interest on the subordinated debt. StanCorp used approximately $30 million of the proceeds from the sale of the Subordinated Debt to fund the acquisition by StanCorp Real Estate, LLC (“Stancorp Real Estate”) (a wholly owned subsidiary) of certain real estate assets from Standard. Since the Subordinated Debt was issued in May 2007, the Company has repurchased approximately 5.1 million shares of common stock at a repurchase price of $247.6 million.
On May 7, 2007, the board of directors authorized a new repurchase program for up to 6.0 million shares of StanCorp common stock, which replaced the Company’s prior share repurchase program. We repurchased 0.5 million shares of common stock at a total cost of $24.9 million during 2008, compared to 4.8 million shares at a total cost of $235.6 million for 2007. Of the 4.8 million shares repurchased in 2007, 0.2 million shares were repurchased under the previous repurchase program. At December 31, 2008, there were 0.9 million shares remaining under the current repurchase program.
CAPITAL MANAGEMENT
State insurance departments require insurance enterprises to maintain minimum levels of capital and surplus. Our insurance subsidiaries’ target is generally to maintain capital at 300% of the company action level of Risk-based Capital (“RBC”) required by regulators, which is 600% of the authorized control level RBC required by our states of domicile. The insurance subsidiaries held capital at 314% of the company action level RBC at December 31, 2008. At December 31, 2008, statutory capital, adjusted to exclude asset valuation reserves, for our regulated insurance subsidiaries totaled $1.23 billion.
The levels of capital in excess of targeted RBC we generate vary inversely in relation to our levels of premium growth. As premium growth increases, capital is utilized to fund additional reserve requirements, meet increased regulatory capital requirements based on premium, and cover certain acquisition costs associated with policy issuance, leaving less available capital beyond our target levels. Higher levels of premium growth can result in increased utilization of capital beyond that which is
| | |
| 36 | | STANCORP FINANCIAL GROUP, INC. |
generated by the business, and at very high levels of premium growth, we could generate the need for capital infusions. At lower levels of premium growth, additional capital produced by the business exceeds the capital utilized to meet these requirements, which can result in additional capital above our targeted RBC level. At our expected growth rate, in 2009, we anticipate generating between $150 and $200 million of capital in excess of our 300% RBC target. In addition to the capital carried on the insurance subsidiaries, our non-insurance subsidiaries also hold capital in excess of regulatory requirements.
Capital above our target level is first utilized to maintain amounts sufficient to fund holding company operating expenses, interest on our debt and our annual dividend to shareholders, with remaining capital available to fund growth and enhance the return to investors.
We will continue to maintain our three priorities, in the following order, for the use of this capital:
| | • | | Fund acquisitions that are consistent with our mission and meet our return objectives. |
| | • | | Provide a return to shareholders, via share repurchases and dividends. |
We had debt to total capitalization ratios of 26.9% and 28.6% at December 31, 2008 and 2007, respectively. The decrease in our debt to total capitalization ratio was primarily due to an increase in equity excluding accumulated other comprehensive loss. Certain rating agencies recognize a portion of the Subordinated Debt as equity. Standard & Poor’s currently recognizes the Subordinated Debt as 100% equity, while Moody’s and AM Best currently recognize 75% of the Subordinated Debt as equity. Debt to total capitalization after the 75% equity credit was 16.2% at December 31, 2008. Our ratio of earnings to fixed charges, including interest credited to policyholders, was 2.5x and 3.3x for 2008 and 2007, respectively. Our ratio of earnings to fixed charges, excluding interest credited to policyholders, was 6.2x and 12.8x for 2008 and 2007, respectively.
Dividends from Insurance Subsidiary
StanCorp’s ability to pay dividends to its shareholders, repurchase its shares and meet its obligations substantially depends upon the receipt of distributions from its subsidiaries, including Standard. Standard’s ability to pay dividends to StanCorp is affected by factors deemed relevant by Standard’s board of directors. One factor considered by the board is the ability to maintain adequate RBC according to Oregon statute. Under Oregon law,
Standard may pay dividends only from the earned surplus arising from its business. If the proposed dividend exceeds certain statutory limitations, Standard must receive the prior approval of the Director of the Oregon Department of Consumer and Business Services—Insurance Division (“Oregon Insurance Division”). The current statutory limitations are the greater of (a) 10% of Standard’s combined capital and surplus as of December 31 of the preceding year, or (b) the net gain from operations after dividends to policyholders and federal income taxes before realized capital gains or losses for the 12-month period ended on the preceding December 31. In each case, the limitation must be determined under statutory accounting practices. Oregon law gives the Oregon Insurance Division broad discretion to decline requests for dividends in excess of these limits. There are no regulatory restrictions on dividends from non-insurance subsidiaries of StanCorp.
During 2008 and 2007, Standard paid dividends to StanCorp totaling $60.0 million and $155.0 million, respectively. The reduction in dividends paid to StanCorp from Standard for 2008 compared to 2007 reflected a decision to maintain capital in Standard at or above 300% of the company action level RBC. Prior to 2008, capital for Standard was targeted to be at or above 275% of the company action level RBC. At December 31, 2008, capital in the insurance subsidiaries was 314% of the company action level RBC.
Dividends to Shareholders
On November 3, 2008, the board of directors of StanCorp declared an annual cash dividend of $0.75 per share, calculated and payable on a per share basis. The dividend was payable on December 5, 2008, to shareholders of record on November 14, 2008. The declaration and payment of dividends in the future is subject to the discretion of StanCorp’s board of directors. It is anticipated that annual dividends will be paid in December of each year depending on StanCorp’s financial condition, results of operations, cash requirements, future prospects, regulatory restrictions on distributions from the insurance subsidiaries, the ability of the insurance subsidiaries to maintain adequate capital and other factors deemed relevant by the board of directors. In addition, the declaration and payment of dividends would be restricted if StanCorp elects to defer interest payments on its Subordinated Debt. If elected, the restriction would be in place during the deferral period, which cannot exceed five years. StanCorp has paid dividends each year since its initial public offering in 1999.
Part II
Share Repurchases
From time to time, the board of directors has authorized share repurchase programs. Share repurchases will be made in the open market or in negotiated transactions in compliance with the safe harbor provisions of Rule 10b-18 under regulations of the Securities Exchange Act of 1934 (the “Exchange Act”). Execution of the share repurchase program is based upon management’s assessment of market conditions for its common stock and other potential growth opportunities.
On May 7, 2007, the board of directors authorized a share repurchase program of up to 6.0 million shares of StanCorp common stock. The share repurchase program will be effected in the open market or in negotiated transactions. The share repurchase program replaced our previous share repurchase program, which had 1.2 million shares remaining that were canceled upon authorization of the new program. On November 3, 2008, the board of directors extended the expiration date of the Company’s share repurchase program to December 31, 2009.
During 2008, we repurchased 0.5 million shares of common stock at a total cost of $24.9 million for a volume weighted-average price of $47.31 per common share. At December 31, 2008, there were 0.9 million shares remaining under the current share repurchase program. In addition, during 2008, we acquired 5,245 shares of common stock from executive officers and directors to cover tax liabilities of these officers and directors resulting from the release of performance-based shares and retention-based shares at a total cost of $0.3 million for a volume weighted-average price of $51.33 per common share, which reflects the market price on the transaction dates.
FINANCIAL STRENGTH RATINGS
Financial strength ratings, which gauge claims paying ability, are an important factor in establishing the competitive position of insurance companies. Ratings are important in maintaining public confidence in our company and in our ability to market our products. Rating organizations continually review the financial performance and condition of insurance companies, including ours. In addition, credit ratings on our Senior Notes and Subordinated Debt are tied to our financial strength ratings. A ratings downgrade could increase surrender levels for our annuity products, could adversely affect our ability to market our products and could increase costs of future debt issuances. Standard & Poor’s, Moody’s Investors Service, Inc. and A.M. Best Company provide
financial strength and credit ratings. Despite the recent volatility in the economy, we do not currently anticipate financial strength ratings downgrades. We believe our well-managed underwriting and claims operations, our high quality invested asset portfolios and our strong capital position will continue to support our claims paying ability during the current recession. See “Liquidity and Capital Resources—Asset/Liability and Interest Rate Risk Management,” and “Capital Management.”
Standard’s financial strength ratings as of February 2009 were:
| | • | | AA- (Very Strong) by Standard & Poor’s—4th of 20 ratings. |
| | • | | A1 (Good) by Moody’s—5th of 21 ratings. |
| | • | | A (Excellent) by A.M. Best—3rd of 13 ratings. |
CREDIT RATINGS
Standard & Poor’s, Moody’s Investors Service, Inc. and A.M. Best Company provide credit ratings on StanCorp’s Senior Notes. As of February 2009, ratings from these agencies were A-, Baa1 and bbb+, respectively. As of February 2009, A.M. Best Company affirmed an issuer credit rating of a+ for Standard.
Standard & Poor’s, Moody’s Investor Services, Inc. and A.M. Best Company also provide credit ratings on StanCorp’s Subordinated Debt. As of February 2009, ratings from these agencies were BBB, Baa2 and bbb-, respectively.
Despite the recent volatility in the economy, we do not currently anticipate credit ratings downgrades. We believe our well-managed underwriting and claims operations, our high quality invested asset portfolios and our strong capital position will continue to support our ability to maintain a strong credit standing during the current recession. See “Liquidity and Capital Resources—Asset/Liability and Interest Rate Risk Management” and “Capital Management.” In addition, we remain well within our line of credit financial covenant restrictions. See “Liquidity and Capital Resources—Financing Cash Flows.”
CONTINGENCIES AND LITIGATION
See Item 8, “Financial Statements and Supplementary Data—Notes to Consolidated Financial Statements—Note 19—Commitments and Contingencies.”
OFF-BALANCE SHEET ARRANGEMENTS
See discussion of loan commitments, “Liquidity and Capital Resources—Investing Cash Flows—Commercial Mortgage Loans.”
| | |
| 38 | | STANCORP FINANCIAL GROUP, INC. |
CONTRACTUAL OBLIGATIONS
The Company’s financing obligations generally include debts, lease payment obligations and commitments to fund commercial mortgage loans. The remaining obligations reflect the long-term portion of other liabilities and the Company’s obligations under our insurance and annuity product contracts.
The following table summarizes the Company’s contractual obligations as of December 31, 2008:
| | | | | | | | | | | | | | | |
| | | Payments due by period |
| (In millions) | | Total | | Less
than 1
Year | | 1 to 3
Years | | 3 to 5
Years | | More
than 5
Years |
Contractual Obligations: | | | | | | | | | | | | |
Short-term debt and capital lease obligations | | $ | 3.7 | | $ | 3.7 | | $ | — | | $ | — | | $ | — |
Long-term debt and capital lease obligations | | | 561.5 | | | — | | | 4.8 | | | 251.1 | | | 305.6 |
Interest on long-term debt obligations | | | 249.7 | | | 38.5 | | | 76.9 | | | 59.4 | | | 74.9 |
Operating lease obligations | | | 51.9 | | | 14.7 | | | 23.6 | | | 13.0 | | | 0.6 |
Funding requirements for commercial mortgage loans | | | 96.9 | | | 96.9 | | | — | | | — | | | — |
Purchase obligations | | | 2.7 | | | 1.4 | | | 1.1 | | | 0.2 | | | — |
Insurance obligations(1) | | | 7,187.6 | | | 1,140.9 | | | 1,088.2 | | | 864.6 | | | 4,093.9 |
Policyholder fund obligations(2) | | | 3,710.0 | | | 3,333.2 | | | 58.2 | | | 48.6 | | | 270.0 |
Separate account liabilities(3) | | | 3,075.9 | | | 3,075.9 | | | — | | | — | | | — |
Other short-term and long-term obligations according to GAAP | | | 505.1 | | | 13.6 | | | 26.1 | | | 26.6 | | | 438.8 |
Total | | $ | 15,445.0 | | $ | 7,718.8 | | $ | 1,278.9 | | $ | 1,263.5 | | $ | 5,183.8 |
| | (1) | | The estimated payments expected to be due by period for insurance obligations reflect future estimated cash payments, for pending and future potential claims, to be made to policyholders and others for future policy benefits, policyholders’ account balances, policyholders’ dividends, and reinsurance payables. These future estimated net cash payments are based on mortality, morbidity, lapse and other assumptions comparable with our experience, consider future premium receipts on current polices in force, and assume market growth and interest crediting consistent with assumptions used in amortizing deferred acquisition costs and value of business acquired. These net cash payments are undiscounted with respect to interest and, as a result, the sum of the net cash payments shown for all years in the table of $7.19 billion exceeds the corresponding liability amount of $5.29 billion included in the Consolidated Financial Statements as of December 31, 2008. We have made significant assumptions to determine the future estimated net cash payments related to the underlying policies and contracts. Due to the significance of the assumptions used, actual net cash payments will differ, possibly materially, from these estimates. |
| | (2) | | While historical withdrawal patterns indicate withdrawal primarily occurs in periods in excess of one year, policyholder fund obligations of $2.93 billion have been included in the less than one year column of the table as they may be withdrawn upon request. These net cash payments are undiscounted with respect to interest but reflect an offsetting effect due to reinsurance receivables and, as a result, the sum of the net cash payments shown for all years in the table of $3.71 billion differs from the |
| | corresponding liability amount of $3.94 billion included in the Consolidated Financial Statements as of December 31, 2008. Due to the significance of the assumptions used, actual net cash payments will differ, possibly materially, from these estimates. |
| | (3) | | Separate account liabilities are legally insulated from general account obligations, and it is generally expected these liabilities will be fully funded by separate account assets and their related cash flows. While historical withdrawal patterns indicate withdrawal primarily occurs in periods in excess of one year, separate account liabilities of $3.08 billion have been included in the less than one year column of the table as they may be withdrawn upon request. |
The Company’s long-term debt obligations consisted primarily of the $250 million 6.875%, Senior Notes and the $300 million 6.90% Subordinated Debt. See “Note 9—Long-Term Debt” for additional information.
In the normal course of business, the Company commits to fund commercial mortgage loans generally up to 90 days in advance. At December 31, 2008, the Company had outstanding commitments to fund commercial mortgage loans totaling $96.9 million, with fixed interest rates ranging from 6.50% to 7.25%. These commitments generally have fixed expiration dates. A small percentage of commitments expire due to the borrower’s failure to deliver the requirements of the commitment by the expiration date. In these cases, the Company will retain the commitment fee and good faith deposit. Alternatively, if we terminate a commitment due to the disapproval of a commitment requirement, the commitment fee and deposit may be refunded to the borrower, less an administrative fee.
The purchase obligations in the table are related to non-cancelable telecommunication obligations, software maintenance agreements and other contractual obligations, all expiring in various years through 2012.
The insurance obligations in the table are actuarial estimates of the cash required to meet our obligations for future policy benefits and claims. These estimates do not represent an exact calculation of our future benefit liabilities, but are instead based on assumptions, which involve a number of factors, including mortality, morbidity, recovery, the consumer price index, reinsurance arrangements and other sources of income for people on claim. Assumptions may vary by age and gender and, for individual policies, occupation class of the claimant; time elapsed since disablement; and contract provisions and limitations. Certain of these factors could be materially affected by changes in social perceptions about work ethics, emerging medical perceptions and legal interpretations regarding physiological or psychological causes of disability, emerging or changing health issues and changes in industry regulation. Changes in one or more of these factors or incorrect assumptions, could cause actual results
Part II
to be materially different from the information presented in the table.
Policyholder fund obligations include payments based on currently scheduled withdrawals and annuity benefit payments stemming from liabilities shown on the balance sheet as policyholder funds.
Other long-term obligations reflected in the Company’s balance sheet at December 31, 2008, consisted of a $14.8 million tax reimbursement liability related to the block of life insurance business sold to Protective Life in 2001, $9.7 million in capital commitments related to our low-income housing investments, $293.5 million in expected benefit payments for supplemental, home office, and field office retirement plans, $177.5 million in expected benefit payments for the postretirement benefit plan, $8.9 million liability for deferred compensation plan and $0.7 million of accrued guarantee association payments.
QUARTERLY FINANCIAL INFORMATION (Unaudited)
The following tables set forth select unaudited financial information by calendar quarter for the years indicated:
| | | | | | | | | | | | | | | | |
| | | 2008 | |
| (In millions—except share data) | | 4th
Qtr | | | 3rd
Qtr | | | 2nd
Qtr | | | 1st
Qtr | |
Premiums | | $ | 528.0 | | | $ | 528.7 | | | $ | 543.0 | | | $ | 540.5 | |
Administrative fees | | | 26.0 | | | | 29.8 | | | | 30.9 | | | | 27.9 | |
Net investment income | | | 138.8 | | | | 136.8 | | | | 136.6 | | | | 128.8 | |
Net capital losses | | | (54.0 | ) | | | (48.8 | ) | | | (21.6 | ) | | | (4.4 | ) |
Total Revenues | | | 638.8 | | | | 646.5 | | | | 688.9 | | | | 692.8 | |
Benefits to policyholders | | | 388.9 | | | | 379.6 | | | | 409.2 | | | | 411.7 | |
Net income | | | 24.0 | | | | 40.2 | | | | 48.4 | | | | 50.3 | |
Net income per common share: | | | | | | | | | | | | | | | | |
Basic | | $ | 0.49 | | | $ | 0.82 | | | $ | 0.99 | | | $ | 1.03 | |
Diluted | | | 0.49 | | | | 0.82 | | | | 0.98 | | | | 1.02 | |
| | | | | | | | | | | | | | |
| | | 2007 |
| (In millions—except share data) | | 4th
Qtr | | | 3rd
Qtr | | | 2nd
Qtr | | 1st
Qtr |
Premiums | | $ | 546.0 | | | $ | 522.2 | | | $ | 518.1 | | $ | 492.0 |
Administrative fees | | | 30.1 | | | | 30.2 | | | | 28.4 | | | 26.5 |
Net investment income | | | 131.0 | | | | 131.3 | | | | 130.7 | | | 123.3 |
Net capital gains (losses) | | | (1.8 | ) | | | (0.4 | ) | | | 0.7 | | | 0.9 |
Total Revenues | | | 705.3 | | | | 683.3 | | | | 677.9 | | | 642.7 |
Benefits to policyholders | | | 410.5 | | | | 389.4 | | | | 409.9 | | | 382.0 |
Net income | | | 60.5 | | | | 66.6 | | | | 52.1 | | | 48.3 |
Net income per common share: | | | | | | | | | | | | | | |
Basic | | $ | 1.22 | | | $ | 1.30 | | | $ | 0.98 | | $ | 0.90 |
Diluted | | | 1.21 | | | | 1.29 | | | | 0.97 | | | 0.90 |
INSOLVENCY ASSESSMENTS
Insolvency regulations exist in many of the jurisdictions in which our subsidiaries do business. Such regulations may
require insurance companies operating within the jurisdiction to participate in guaranty associations. The associations levy assessments against their members for the purpose of paying benefits due to policyholders of impaired or insolvent insurance companies. Association assessments levied against us from January 1, 2006, through December 31, 2008, aggregated $0.6 million. At December 31, 2008, we maintained a reserve of $0.7 million for future assessments with respect to currently impaired, insolvent or failed insurers.
STATUTORY FINANCIAL ACCOUNTING
Standard and The Standard Life Insurance Company of New York prepare their statutory financial statements in accordance with accounting practices prescribed or permitted by their states of domicile. Prescribed statutory accounting practices include state laws, regulations, and general administrative rules, as well as the Statements of Statutory Accounting Practices set forth in publications of the National Association of Insurance Commissioners (“NAIC”).
Statutory accounting practices differ in some respects from GAAP. The principal statutory practices that differ from GAAP are:
| | • | | Bonds and commercial mortgage loans are reported principally at adjusted carrying value and amortized cost, respectively . |
| | • | | Asset valuation and the interest maintenance reserves are provided as prescribed by the NAIC. |
| | • | | Certain assets designated as non-admitted, principally deferred tax assets, furniture, equipment, and unsecured receivables, are not recognized as assets, resulting in a charge to statutory surplus. |
| | • | | Annuity considerations with life contingencies, or purchase rate guarantees, are recognized as revenue when received. |
| | • | | Reserves for life and disability policies and contracts are reported net of ceded reinsurance and calculated based on statutory requirements, including required discount rates. |
| | • | | Commissions, including initial commissions and expense allowance paid for reinsurance assumed, and other policy acquisition expenses are expensed as incurred. |
| | • | | Initial commissions and expense allowance received for a block of reinsurance ceded net of taxes are reported as deferred gains in surplus and recognized as income in subsequent periods. |
| | • | | Federal income tax expense includes current income taxes defined as current year estimates of federal income taxes and tax contingencies for current and |
| | |
| 40 | | STANCORP FINANCIAL GROUP, INC. |
| | prior years and amounts incurred or received during the year relating to prior periods, to the extent not previously provided. |
| | • | | Deferred tax assets, net of deferred tax liabilities, are included in the regulatory financial statements but are limited to those deferred tax assets that will be realized within one year. |
Statutory net gains from insurance operations before federal income taxes and excluding capital gains and losses were $341.6 million, $309.3 million and $271.1 million for 2008, 2007 and 2006, respectively. The changes in net gains were primarily due to premium growth and comparatively favorable claims experience.
Generally, statutory net gains from insurance operations before federal income taxes, including capital gains and losses, are lower than GAAP income before income taxes, including capital gains and losses. This variance between Statutory and GAAP is primarily due to DAC and VOBA being expensed in the period incurred on a statutory basis and statutory using a lower discount rate than the GAAP rate. There was an increase of the variance between Statutory and GAAP results for 2008 compared to 2007. This increase of the variance was primarily due to an increase in the expensing of DAC and VOBA and a difference in the change in reserves due to the reserve discount rate being lower on a statutory basis. The reserve discount rate for long term disability claims on a statutory basis was 4.5% during 2008 and 2007. The GAAP reserve discount rate ranged from 5.00% to 5.75% in 2008 and ranged from 5.35% to 5.50% in 2007. Differences between Statutory and GAAP results for 2007 compared to 2006 were due to a rise in the statutory discount rate effective in 2007 for certain reserves established after January 1, 2007, that decreased statutory reserve requirements.
Statutory capital adjusted to exclude asset valuation reserves, for our insurance regulated subsidiaries totaled $1.23 billion and $1.15 billion at December 31, 2008 and 2007, respectively. The asset valuation reserve was $78.8 million and $102.2 million at December 31, 2008 and 2007, respectively.
Effective December 31, 2006, the NAIC adopted changes to the RBC calculation that required us to perform additional testing to determine the risk based capital requirement for annuities. The adopted change did not have a material impact on our RBC requirements.
ACCOUNTING PRONOUNCEMENTS
See Item 8, “Financial Statements and Supplementary Data—Notes to Consolidated Financial Statements—Note 1—Summary of Significant Accounting Policies—Accounting Pronouncements.”
CRITICAL ACCOUNTING POLICIES AND ESTIMATES
Our consolidated financial statements and certain disclosures made in this Form 10-K have been prepared in accordance with GAAP and require us to make estimates and assumptions that affect reported amounts of assets and liabilities and contingent assets and contingent liabilities at the dates of the financial statements and the reported amounts of revenues and expenses during the reporting periods. The estimates most susceptible to material changes due to significant judgment (identified as the “critical accounting policies”) are those used in determining investment valuations, DAC, VOBA and other intangibles, goodwill, the reserves for future policy benefits and claims, pension and postretirement benefit plans, and the provision for income taxes. The results of these estimates are critical because they affect our profitability and may affect key indicators used to measure the Company’s performance. These estimates have a material effect on our results of operations and financial condition.
Investment Valuations
For all investments, capital gains and losses are recognized using the specific identification method. Net investment income and capital gains and losses related to separate account assets and liabilities are included in the separate account assets and liabilities. For all investments, we record impairments when it is determined that the decline in fair value of an investment below its adjusted carrying value or amortized cost basis is other than temporary. The impairment loss is charged to net capital gains or losses, and the cost basis of the investment is permanently adjusted to reflect the impairment.
In our quarterly impairment analysis, we evaluate whether a decline in value of fixed maturity securities is other than temporary. Factors considered in this analysis include:
| | • | | The length of time and the extent to which the fair value has been below adjusted carrying value. |
| | • | | The financial condition and near-term prospects of the issuer. |
| | • | | The intent and ability of the Company to retain the investment for a period of time sufficient to allow for any anticipated recovery in market value. |
| | • | | The value of any security interest we may have collateralized in the investment. |
See Item 8, “Financial Statements and Supplementary Data—Notes to Consolidated Financial Statements—Note 5—Investment Securities.” For securities expected to be sold, an other-than-temporary impairment charge is
Part II
recorded if we do not expect the realizable market value of a security to recover to adjusted carrying value prior to the expected date of sale. Once an impairment charge has been recorded, we continue to review the other-than-temporarily impaired securities for further potential impairment on an on-going basis. If the market value of the investment later recovers, the Company is not permitted to write the asset back up to its historical cost (i.e. the write-down is permanent).
Our investment portfolio includes fixed maturity securities and commercial mortgage loans. At December 31, 2008, issues on our fixed maturity securities impairment watch list totaled approximately $329.5 million in market value and $439.0 million in book value after other-than-temporary impairments had been taken. The Company recorded other-than-temporary impairments of $104.9 million during 2008, primarily due to a decline in the market value of holdings of issuers the Company believed would face difficulties in the deteriorating economic environment. In 2008, the Company sold bond holdings of companies with potential liquidity concerns in order to solidify the condition of the Company’s bond portfolio. The Company will continue to evaluate its holdings but currently expects the fair values of its investments to recover as the securities approach their maturity dates. Should the credit quality of our fixed maturity securities continue to decline, there could be a material adverse effect on our business, financial position, results of operations or cash flows. We did not have any direct exposure to sub-prime or Alt-A mortgages in our fixed maturity securities portfolio at December 31, 2008. Investment securities include fixed maturity securities. Fixed maturity securities are classified as available-for-sale and are carried at fair value on the consolidated balance sheets. See Item 8, “Financial Statements and Supplementary Data—Notes to Consolidated Financial Statements—Note 4—Fair Value of Financial Instruments,” for a detailed explanation of the valuation methods the Company uses to calculate the fair value of the Company’s financial instruments. Investment securities also include derivative investments, which are carried at fair value. See Item 8, “Financial Statements and Supplementary Data—Notes to Consolidated Financial Statements—Note 7—Derivative Financial Instruments.” Valuation adjustments for fixed maturity securities that are not accounted for as other-than-temporary impairments are reported as net increases or decreases to other comprehensive income (loss), net of tax, on the consolidated statements of income
and comprehensive income. Valuation adjustments for derivatives are reported as a component of net investment income.
Commercial mortgage loans are stated at amortized cost less a valuation allowance for potentially uncollectible amounts. The commercial mortgage loan valuation allowance is based on our analysis of factors including changes in the size and composition of the loan portfolio, actual loan loss experience and individual loan analysis. We did not have any direct exposure to sub-prime or Alt-A mortgages in our commercial mortgage loan portfolio at December 31, 2008.
Real estate held for investment is stated at cost less accumulated depreciation. Depreciation generally is provided on the straight-line method with property lives varying from 30 to 40 years. Accumulated depreciation for real estate totaled $30.1 million and $29.1 million at December 31, 2008 and 2007, respectively. Real estate acquired in satisfaction of debt totaling $6.2 million at December 31, 2008 is recorded at the lower of cost or fair value, less estimated costs to sell.
Policy loans are stated at their aggregate unpaid principal balances and are secured by policy cash values.
In September 2006, the FASB issued Statement of Financial Accounting Standards (“SFAS”) No. 157, Fair Value Measurements, which is intended to increase consistency and comparability in fair value measurements by defining fair value, establishing a framework for measuring fair value and expanding disclosures about fair value measurements. SFAS No. 157 applies to other accounting pronouncements that require or permit fair value measurement. SFAS No. 157 became effective for financial statements issued for the fiscal years beginning after November 15, 2007, and interim periods within those fiscal years. StanCorp adopted the provisions of SFAS No. 157 beginning January 1, 2008. See Item 8, “Financial Statements and Supplementary Data—Notes to Consolidated Financial Statements—Note 4—Fair Value of Financial Instruments.”
DAC, VOBA and Other Intangible Assets
DAC, VOBA and other intangible assets are considered intangible assets. These intangible assets are generally originated through the issuance of new business or the purchase of existing business either by purchasing blocks of insurance policies from other insurers or by the outright purchase of other companies. The Company’s intangible assets are subject to impairment tests on an annual basis or
| | |
| 42 | | STANCORP FINANCIAL GROUP, INC. |
more frequently if circumstances indicate that carrying values may not be recoverable.
Acquisition costs that the Company has deferred as DAC are those costs that vary with and are primarily related to the acquisition and, in some instances, the renewal of insurance products. These costs are typically one-time expenses that represent the cost of originating new business and placing that business in force. Certain costs related to obtaining new business and acquiring business through reinsurance agreements have been deferred and will be amortized to accomplish matching against related future premiums or gross profits as appropriate. The Company normally defers certain acquisition-related commissions and incentive payments, certain costs of policy issuance and underwriting, and certain printing costs. Assumptions used in developing DAC and amortization amounts each period include the amount of business in force, expected future persistency, withdrawals, interest rates and profitability. These assumptions are modified to reflect actual experience when appropriate. Additional amortization of DAC is charged to current earnings to the extent it is determined that future premiums or gross profits are not adequate to cover the remaining amounts deferred. DAC totaled $249.2 million and $202.3 million at December 31, 2008 and 2007, respectively. Changes in actual persistency are reflected in the calculated DAC balance. Costs that do not vary with the production of new business are not deferred as DAC and are charged to expense as incurred. Annual commissions are considered expenses and are not deferred.
DAC for group and individual disability insurance products and group life insurance products is amortized over the life of related policies in proportion to future premiums in accordance with SFAS No. 60,Accounting and Reporting by Insurance Enterprises. Beginning with the adoption of SOP 05-1 on January 1, 2007, the Company began amortizing DAC for group disability and life insurance products over the initial premium rate guarantee period, which averages 2.5 years. DAC for individual disability insurance products is amortized in proportion to future premiums over the life of the contract, averaging 20 to 25 years with approximately 50% and 75% expected to be amortized by years 10 and 15, respectively.
The Company’s individual deferred annuities and group annuity products are classified as investment contracts. DAC related to these products is amortized over the life of related policies in proportion to expected gross profits in accordance with SFAS No. 97, Accounting and Reporting by
Insurance Enterprises for Certain Long-Duration Contracts and for RealizedGains and Losses from the Sale of Investments. For the Company’s individual deferred annuities, DAC is generally amortized over 30 years with approximately 50% and 90% expected to be amortized by years 5 and 15, respectively. DAC for group annuity products is amortized over 10 years with approximately 30% expected to be amortized by year five.
VOBA primarily represents the discounted future profits of business assumed through reinsurance agreements. We have established VOBA for a block of individual disability business assumed from the Minnesota Life and a block of group disability and group life business assumed from Teachers Insurance and Annuity Association of America (“TIAA”). VOBA is generally amortized in proportion to future premiums for group and individual disability insurance products and group life products. However, a portion of the VOBA related to the TIAA transaction associated with an in force block of group long term disability claims for which no ongoing premium is received is amortized in proportion to expected gross profits. If actual premiums or future profitability are inconsistent with our assumptions, the Company could be required to make adjustments to VOBA and related amortization. For the VOBA associated with the Minnesota Life block of business reinsured, the amortization period is up to 30 years and is amortized in proportion to future premiums. The amortization period of the intangible asset for the marketing agreement with Minnesota Life is up to 25 years. The VOBA associated with the TIAA transaction is comprised of two parts with differing amortization methods. The amortization period was up to 10 years for VOBA that was amortized in proportion to premiums and up to 20 years for VOBA that is amortized in proportion to expected gross profits. VOBA totaled $31.1 million and $34.4 million at December 31, 2008 and 2007, respectively. Upon adoption of SOP 05-1 in 2007, the premium portion of the VOBA related to TIAA was recorded as a $10.0 million reduction to retained earnings.
Part II
VOBA related to the TIAA group long term disability claims, for which no further premiums are due, is amortized in proportion to expected gross profits. The following table sets forth the amount of DAC and VOBA balances amortized in proportion to expected gross profits and the percentage of the total balance of DAC and VOBA amortized in proportion to expected gross profits at December 31:
| | | | | | | | | | | | |
| | | 2008 | | | 2007 | |
| (Dollars in millions) | | Amount | | Percent | | | Amount | | Percent | |
DAC | | $ | 79.9 | | 32.1 | % | | $ | 59.7 | | 29.5 | % |
VOBA | | | 7.7 | | 24.8 | | | | 9.4 | | 27.3 | |
Key assumptions, which will affect the determination of expected gross profits for determining DAC and VOBA balances are:
| | • | | Interest rates, which affect both investment income and interest credited. |
| | • | | Stock market performance. |
| | • | | Capital gains and losses. |
| | • | | Claim termination rates. |
Although a change in a single assumption may have an impact on the calculated amortization of DAC or VOBA, it is the relationship of that change to the changes in other key assumptions that determines the ultimate impact on DAC or VOBA amortization. Because actual results and trends related to these assumptions vary from those assumed, the Company revises these assumptions annually to reflect its current best estimate of expected gross profits. As a result of this process, known as “unlocking,” the cumulative balances of DAC and VOBA are adjusted with an offsetting benefit or charge to income to reflect changes in the period of the revision. An unlocking event that results in an after-tax benefit generally occurs as a result of actual experience or future expectations being favorable compared to previous estimates. An unlocking event that results in an after-tax charge generally occurs as a result of actual experience or future expectations being unfavorable compared to previous estimates. As a result of unlocking, the amortization schedule for future periods is also adjusted. Due to unlocking, DAC and VOBA balances decreased $0.4 million for 2008 and decreased $0.4 million for 2007. Based on past experience, future changes in DAC and VOBA balances due to changes in underlying assumptions are not expected to be material. However, significant, unanticipated changes in key assumptions, which affect the determination of expected gross profits, may result in a large unlocking event that could have a
material adverse effect on the Company’s financial position or results of operations.
The Company’s other intangible assets are subject to amortization and consist of certain customer lists and a marketing agreement. Customer lists were acquired primarily in connection with the purchase of Invesmart during the third quarter of 2006. Additional customer lists were acquired with the purchase of DPA, Inc. and with the acquisition of small investment advisory firms. Customer lists have a combined estimated weighted-average remaining life of approximately 9.3 years. A marketing agreement accompanied the Minnesota Life transaction and provides access to Minnesota Life agents, some of whom now market Standard’s individual disability insurance products. The amortization period for the Minnesota Life marketing agreement is up to 25 years. Other intangible assets totaled $54.2 million and $52.1 million at December 31, 2008 and 2007, respectively.
Goodwill
Goodwill of $33.5 million was acquired by the Company during the third quarter of 2006, primarily in connection with the purchase of Invesmart, and is related to the Asset Management segment. Goodwill totaled $36.0 million at both December 31, 2008 and 2007. In accordance with SFAS No. 142,Goodwill and other Intangible Assets, goodwill is not amortized and is tested at least annually for impairment. If indicators of impairment appear, or in the event of material changes in circumstances, the test will be more frequent.Per SFAS No. 142, we performed a step one test, as of December 31, 2008, in which the carrying value of tested assets was compared to the assets’ fair values. Fair value is measured using a combination of the income approach and the market approach. The income approach consists of utilizing the discounted cash flow method that incorporates our estimates of future revenues and costs of our business, discounted using a market participant weighted-average cost of capital. The estimates we use in the income approach are consistent with the plans and estimates that we use to manage our operations. The market approach utilizes multiples of profit measures in order to estimate the fair value of the assets. As a result of the consistency of the income approach with how we internally evaluate and manage our business, we weight the income approach more heavily than the market approach in determining the fair value of the assets. However, we do perform testing to ensure that both models are providing reasonably consistent results. Additionally, we perform sensitivity analysis on the key input factors in these models
| | |
| 44 | | STANCORP FINANCIAL GROUP, INC. |
to determine whether any input factor or combination of factors moving moderately in either direction would change the results of these tests. Through the performance of these tests, we concluded that goodwill was not impaired as of December 31, 2008.
Reserves
Reserves represent amounts to pay future benefits and claims. Developing the estimates for reserves (and therefore the resulting impact on earnings) requires varying degrees of subjectivity and judgment, depending upon the nature of the reserve. For most of our reserves, the calculation methodology is prescribed by various accounting and actuarial standards, although judgment is required in the determination of assumptions to use in the calculation. At December 31, 2008, these reserves represented approximately 87% of total reserves held or $4.62 billion. We also hold reserves that lack a prescribed methodology but instead are determined by a formula that we have developed based on our own experience. Because this type of reserve requires a higher level of subjective judgment, we closely monitor its adequacy. These reserves, which are primarily incurred but not reported reserves associated with our disability products, represented approximately 13% of total reserves held at December 31, 2008, or $661.4 million. Finally, a small amount of reserves is held based entirely upon subjective judgment. These reserves are generally set up as a result of unique circumstances that are not expected to continue far into the future and are released according to pre-established conditions and timelines. These reserves represented less than 1% of total reserves held at December 31, 2008, or $8.1 million.
Reserves include policy reserves for claims not yet incurred, policy reserve liabilities for our individual and group immediate annuity business and claim reserve liabilities for unpaid claims and claim adjustment expenses for claims that have been incurred or are estimated to have been incurred but not yet reported to us. These reserves totaled $5.12 billion, $5.02 billion and $4.78 billion at December 31, 2008, 2007 and 2006, respectively.
Policy Reserves
Policy reserves totaled $945.4 million, $908.3 million and $887.4 million at December 31, 2008, 2007 and 2006, respectively. Policy reserves include reserves established for individual life and individual disability businesses.
Policy reserves for our individual disability block of business are established at the time of policy issuance using
the net level premium method as prescribed by GAAP and represent the current value of projected future benefits including expenses less projected future premium. These reserves, related specifically to our individual disability block of business, totaled $177.2 million, $164.4 million and $153.8 million at December 31, 2008, 2007 and 2006, respectively.
We continue to maintain a policy reserve for as long as a policy is in force, even after a separate claim reserve is established.
Assumptions used to calculate individual disability policy reserves may vary by the age, gender and occupation class of the claimant, the year of policy issue and specific contract provisions and limitations.
Individual disability policy reserves are sensitive to assumptions and considerations regarding:
| | • | | Claim termination rates. |
| | • | | Discount rates used to value expected future claim payments and premiums. |
| | • | | The amount of monthly benefit paid to the insured less reinsurance recoveries and other offsets. |
| | • | | Expense rates including inflation. |
Policy reserves for our individual and group immediate annuity blocks of business totaled $162.1 million, $141.8 million and $136.8 million at December 31, 2008, 2007 and 2006, respectively. These reserves are established at the time of policy issue and represent the present value of future payments due under the annuity contracts. The contracts are single premium contracts, and, therefore, there is no projected future premium.
Assumptions used to calculate immediate annuity policy reserves may vary by the age and gender of the annuitant and year of policy issue.
Immediate annuity policy reserves are sensitive to assumptions and considerations regarding:
| | • | | Annuitant mortality rates. |
| | • | | Discount rates used to value expected future annuity payments. |
Policy reserves for our individual life block of business totaled $606.1 million, $602.1 million and $596.6 million at December 31, 2008, 2007 and 2006, respectively. Effective January 1, 2001, substantially all of our individual life policies and the associated reserves were ceded to Protective Life Insurance Company (“Protective Life”) under a reinsurance agreement.
Part II
Policy reserves are calculated using our best estimates of assumptions and considerations at the time the policy was issued, adjusted to allow for the effect of adverse deviations in actual experience. These assumptions are not subsequently modified unless policy reserves become inadequate; at which time, we may need to change assumptions to increase reserves.
Claim Reserves
Claim reserves are established when a claim is incurred or is estimated to have been incurred but not yet reported to us and, as prescribed by GAAP, equal our best estimate of the present value of the liability of future unpaid claims and claim adjustment expenses. Reserves for incurred but not reported claims (“IBNR”) are determined using company experience and consider actual historical incidence rates, claim-reporting patterns, and the average cost of claims. The IBNR reserves are calculated using a company derived formula based primarily upon premium, which is validated through a close examination of reserve run-out experience.
The claim reserves are related to group life and group and individual disability products offered by our Insurance Services segment. The following table sets forth total claim reserves segregated between reserves associated with life versus disability products:
| | | | | | | | | |
| | | |
| (In millions) | | 2008 | | 2007 | | 2006 |
Group life | | $ | 731.2 | | $ | 735.6 | | $ | 688.9 |
Group disability | | | 2,972.8 | | | 2,923.8 | | | 2,780.7 |
Individual disability | | | 636.9 | | | 590.6 | | | 569.8 |
| | | | | | | | | | |
Total claim reserves | | $ | 4,340.9 | | $ | 4,250.0 | | $ | 4,039.4 |
Unlike policy reserves, claim reserves are subject to revision as our current claim experience and expectations regarding future factors, which may influence claim experience, change. During each quarter, we monitor our emerging claim experience to ensure that the claim reserves remain appropriate and make adjustments to our assumptions based on actual experience and our expectations regarding future events as appropriate.
Assumptions used to calculate claim reserves may vary by the age, sex and occupation class of the claimant, the year the claim was incurred, time elapsed since disablement, and specific contract provisions and limitations.
Claim reserves for our disability products are sensitive to assumptions and considerations regarding:
| | • | | Claim incidence rates for IBNR claim reserves. |
| | • | | Claim termination rates. |
| | • | | Discount rates used to value expected future claim payments. |
| | • | | The amount of monthly benefit paid to the insured less reinsurance recoveries and other offsets. |
| | • | | Expense rates including inflation. |
| | • | | Historical delay in reporting of claims incurred. |
Certain of these factors could be materially affected by changes in social perceptions about work ethics, emerging medical perceptions and legal interpretations regarding physiological or psychological causes of disability, emerging or changing health issues and changes in industry regulation. If there are changes in one or more of these factors or if actual claims experience is materially inconsistent with our assumptions, we could be required to change our reserves.
Claim reserves for our group life and AD&D products are established for death claims reported but not yet paid, IBNR for death and waiver claims and waiver of premium benefits. The death claim reserve is based on the actual amount to be paid. The IBNR reserve is calculated using historical information, and the waiver of premium benefit is calculated using a tabular reserve method that takes into account company experience and published industry tables.
Trends in Key Assumptions
Key assumptions affecting our reserve calculations are (1) the discount rate, (2) claim termination rate and (3) the claim incidence rate for policy reserves and IBNR claim reserves. Reserve discount rates for newly incurred claims are reviewed quarterly and, if necessary, are adjusted to reflect our current and expected net investment yields. The discount rate used to calculate GAAP reserves for newly incurred long term disability claims increased 40 basis points to 5.75% in 2008 from 5.35%. The discount rate declined 15 basis points in 2007 and increased 75 basis points in 2006 as a result of changes in the interest rate environment. Based on our current size, a 25 basis point increase in the discount rate would result in a short-term decrease of approximately $2 million per quarter of benefits to policyholders, and a corresponding increase to pre-tax earnings. Offsetting adjustments to group insurance premium rates can take from one to three years given that most new contracts have rate guarantees in place.
Claim termination rates can vary widely from quarter to quarter. The claim termination assumptions used in determining our reserves represent our expectation for claim terminations over the life of our block of business and will vary from actual experience in any one quarter. In 2008, while we have experienced some variation in our
| | |
| 46 | | STANCORP FINANCIAL GROUP, INC. |
claim termination experience, we have not seen any prolonged or systemic change that would indicate a sustained underlying trend that would affect the claim termination rates used in the calculation of reserves.
In 2007, we adopted a new group life waiver table, the Society of Actuaries Table 2005, to be used in the calculation of reserves for group life waiver claims incurred in 2007 and later. Adoption of this table resulted in a reduction of $26.7 million and $15.5 million in reserves established for new 2008 and 2007 group life waiver claims, respectively, compared to the reserves that would have been established using the prior table.
As a result of continued favorable recovery patterns for our group long term disability insurance, partially offset by the recognition of the unique characteristics of a certain group, we released incurred but not reported reserves totaling $13.5 million in 2007. There were no similar reserve changes in 2008.
We adjusted the calculation of the incurred but not reported reserves related to pending group life waiver claims in 2007 as a result of continued redundancy in the reserve. This resulted in a decrease in reserves of $6.0 million. There were no similar reserve changes in 2008 or 2006.
We adjusted the termination assumptions associated with a small block of group long term disability reported reserves in 2007 due to prolonged unfavorable reserve run-out experience for the block. This resulted in an increase in reserves of $16.8 million. There were no similar reserve increases in 2008 or 2006.
In 2006, we adjusted the claim termination rate assumptions for a small block of individual disability claims in light of a recently released industry table. This resulted in an increase in reserves of $6.0 million. These assumptions were further refined in 2007 and 2008 and resulted in an additional increase in reserves of $7.4 million and $2.5 million, respectively. Our block of business is relatively small, and, as a result, we view a blend of the new industry table and our own experience as a more appropriate method for establishing reserve levels compared solely to our own experience. We will continue to monitor the credibility of our developing experience and, if necessary, will adjust reserves accordingly.
Claim incidence rates, which affect our policy reserves and IBNR claim reserves, can also vary widely from quarter to quarter. Overall, we have not seen any prolonged or systemic change that would indicate a sustained underlying trend that would affect the claim incidence rates used in the calculation of policy reserves or IBNR claim reserves.
We monitor the adequacy of our reserves relative to our key assumptions. In our estimation, scenarios based on reasonably possible variations in claim termination assumptions could produce a percentage change in reserves for our group insurance lines of business of approximately +/- 0.2% or $7.5 million. However given that claims experience can fluctuate widely from quarter to quarter, significant unanticipated changes in claim termination rates over time could produce a change in reserves for our group insurance lines outside of this range.
Pension and Postretirement Benefit Plans
The Company has two non-contributory defined benefit pension plans: the employee pension plan and the agent pension plan. The employee pension plan is for all eligible employees of StanCorp and its subsidiaries and was frozen effective January 2003 for new participants. The agent pension plan, which is frozen for new participants, is for former field employees and agents. Both plans are sponsored and administered by Standard. The defined benefit pension plans provide benefits based on years of service and final average pay.
Standard also sponsors and administers a postretirement benefit plan that includes medical, prescription drug benefits and group term life insurance. Eligible retirees are required to contribute specified amounts for medical and prescription drug benefits that are determined periodically and are based on retirees’ length of service and age at retirement. Effective January 1, 2006, participation in the postretirement benefit plan is limited to employees who had reached the age of 40 as of January 1, 2006, or whose combined age and length of service were equal to or greater than 45 years as of January 1, 2006.
In addition, eligible executive officers are covered by a non-qualified supplemental retirement plan.
Effective December 31, 2006, Standard adopted SFAS No. 158,Employers’ Accounting for Defined Benefit Pension and Other Postretirement Plans—an amendment of FASB Statements No. 87, 88, 106 and 132(R). SFAS No. 158 requires the Company to recognize the funded or underfunded status of our pension and postretirement benefit plans as an asset or liability on the balance sheet. For pension plans, this is measured as the difference between the plan assets at fair value and the projected benefit obligation as of the year-end balance sheet date. For our postretirement plan, this is measured as the difference between the plan assets at fair value and the accumulated benefit obligation as of the year-end balance sheet date. SFAS No. 158 also requires the Company to
Part II
recognize as a component of accumulated other comprehensive income or loss, net of tax, the actuarial gains or losses, prior service costs or credits, and transition assets that have not yet been recognized as components of net periodic benefit cost.
In accordance with the accounting principles related to the Company’s pension and other postretirement plans, the Company is required to make a significant number of assumptions in order to calculate the related liabilities and expenses each period. The major assumptions that affect net periodic benefit cost and the funded status of the plans include the weighted-average discount rate, expected return on plans assets, and rate of compensation increase.
The weighted-average discount rate is an interest assumption used to convert the benefit payment stream to present value. The discount rate is selected based on the yield of a portfolio of high quality corporate bonds with durations that are similar to the expected distributions from the employee benefit plan.
The expected return on plan assets assumption is the best long-term estimate of the average annual return that will be produced from the pension trust assets until current benefits are paid. Our expectations for the future investment returns of the asset categories are based on a combination of historical and projected market performance. The expected return for the total portfolio is calculated based on each plan’s strategic asset allocation.
The long-run rate of return for the employee pension plan portfolio is derived by calculating the average return for the portfolio monthly, from 1971 to the present, using the average mutual fund manager returns in each asset category, weighted by the target allocation to each category. Because the average equity market value returns over the last 30 years generally have been higher than the long run expected rate of return, the historical average return used to determine the expected return on plan assets was reduced by 20% to reflect the expected long run rate of return more effectively.
The rate of compensation increase is a long-term assumption that is based on an estimated inflation rate in addition to merit and promotion-related compensation increase components.
For the postretirement benefit plan, the assumed health care cost trend rates are also a major assumption that affects expenses and liabilities. Assumed health care cost trend rates have a significant effect on the amounts reported for the health care plans. A one-percentage-point change in assumed health care cost trend rates would have the following effects:
| | | | | | | |
| (In millions) | | 1% point
increase | | 1% point
decrease | |
Effect on total of service and interest cost | | $ | 0.3 | | $ | (0.3 | ) |
Effect on postretirement benefit obligation | | | 3.2 | | | (2.8 | ) |
Our discount rate assumption is reviewed annually, and we use a December 31 measurement date for each of our plans. For more information concerning our pension and postretirement plans, see Part II, Item 8, “Financial Statements and Supplementary Data—Notes to Consolidated Financial Statements—Note 11—Pension Benefits” and “—Note 12—Postretirement Benefits Other than Pensions.”
Income Taxes
We file a U.S. consolidated income tax return that includes all subsidiaries. Our U.S. income tax is calculated using regular corporate income tax rates on a tax base determined by laws and regulations administered by the IRS. We also file corporate income tax returns in various states. The provision for income taxes includes amounts currently payable and deferred amounts that result from temporary differences between financial reporting and tax bases of assets and liabilities. Deferred tax assets and liabilities are measured using enacted tax rates expected to apply when the temporary differences are expected to reverse.
GAAP requires management to use a more likely than not standard to evaluate whether, based on available evidence, each deferred tax asset will be realized. A valuation allowance is recorded to reduce a deferred tax asset to the amount expected to be realized.
FASB Interpretation No. 48,Accounting for Uncertainty in Income Taxes, requires management to determine whether tax return positions are more likely than not to be sustained upon audit by taxing authorities. Tax benefits of uncertain tax positions, as determined and measured by this interpretation, cannot be recognized in our financial statements.
It is the Company’s accounting policy to record income tax interest and penalties in the income tax provision.
| | |
| 48 | | STANCORP FINANCIAL GROUP, INC. |
Currently, years open for audit by the IRS are 2005 through 2008. See Item 8, “Financial Statements and Supplementary Data—Notes to Consolidated Financial Statements—Note 10—Income Taxes.”
FORWARD-LOOKING STATEMENTS
Some of the statements contained in this Item 7, Management’s Discussion and Analysis of Financial Condition and Results of Operations, including those relating to our strategy, growth prospects and other statements that are predictive in nature, that depend on or refer to future events or conditions or that include words such as “expects,” “anticipates,” “intends,” “plans,” “believes,” “estimates,” “seeks” and similar expressions, are forward-looking statements within the meaning of Section 21E of the Exchange Act, as amended. These statements are not historical facts but instead represent only management’s expectations, estimates and projections regarding future events. Similarly, these statements are not guarantees of future performance and involve uncertainties that are difficult to predict, which may include, but are not limited to, the factors discussed below. As a provider of financial products and services, our results of operations may vary significantly in response to economic trends, interest rate changes, investment performance and claims experience. Caution should be used when extrapolating historical results or conditions to future periods.
Our actual results and financial condition may differ, perhaps materially, from the anticipated results and financial condition in any such forward-looking statements. Given these uncertainties or circumstances, readers are cautioned not to place undue reliance on such statements. We assume no obligation to publicly update or revise any forward-looking statements, whether as a result of new information, future events or otherwise.
The following factors could cause results to differ materially from management expectations as suggested by such forward-looking statements:
| | • | | Growth of sales, premiums, and annuity deposits, cash flows, gross profits and profitability. |
| | • | | Availability of capital required to support business growth and the effective utilization of capital. |
| | • | | Changes in our liquidity needs and the liquidity of assets in our portfolio. |
| | • | | Integration and performance of business acquired through reinsurance or acquisition. |
| | • | | Financial strength and credit ratings. |
| | • | | Changes in the regulatory environment at the state or federal level or changes in U.S. GAAP accounting principles, practices or policies. |
| | • | | Findings in litigation or other legal proceedings. |
| | • | | Intent and ability to hold investments consistent with our investment strategy. |
| | • | | Receipt of dividends from, or contributions to, our subsidiaries. |
| | • | | Adequacy of the diversification of risk by product offerings and customer industry, geography and size. |
| | • | | Adequacy of asset/liability management. |
| | • | | Events of terrorism, natural disasters or other catastrophic events. |
| | • | | Changes in federal or state income taxes. |
| | • | | Growth in assets under administration including performance of equity investments in the separate account. |
| | • | | Benefit ratios, including changes in claims incidence, severity and recovery. |
| | • | | Adequacy of reserves established for future policy benefits. |
| | • | | The effect of changes in interest rates on reserves, policyholder funds, investment income and commercial mortgage loan prepayment fees. |
| | • | | The impact of rising benefit costs on employer budgets for employee benefits. |
| | • | | Levels of employment and wage growth. |
| | • | | Competition from other insurers and financial services companies, including the ability to competitively price our products. |
| | • | | Concentration of risk, especially inherent in group life products. |
| | • | | Ability of reinsurers to meet their obligations. |
| | • | | Availability, adequacy and pricing of reinsurance and catastrophe reinsurance coverage and potential charges incurred. |
| | • | | Losses from a disease pandemic. |
| | • | | Achievement of anticipated levels of operating expenses. |
| | • | | Adequacy of diversification of risk within our fixed maturity securities portfolio by industries, issuers and maturities. |
| | • | | Credit quality of the holdings in our investment portfolios. |
| | • | | The condition of the economy and expectations for interest rate changes. |
Part II
| | • | | The effect of changing levels of commercial mortgage loan prepayment fees on cash flows. |
| | • | | Experience in delinquency rates or loss experience in our commercial mortgage loan portfolio. |
| | • | | Concentration of commercial mortgage loan assets collateralized in California. |
| | • | | Environmental liability exposure resulting from commercial mortgage loan and real estate investments. |
| | • | | Ability to achieve financing through debt or equity. |
| | |
| 50 | | STANCORP FINANCIAL GROUP, INC. |
Item 7A. Quantitative and Qualitative Disclosures about Market Risk
See Item 7, “Management’s Discussion and Analysis of Financial Condition and Results of Operations—Liquidity and Capital Resources—Asset/Liability and Interest Rate Risk Management.”
Item 8. Financial Statements and Supplementary Data
Part II
Report of Independent Registered Public Accounting Firm
To the Board of Directors and Shareholders of
StanCorp Financial Group, Inc.
Portland, Oregon
We have audited the accompanying consolidated balance sheets of StanCorp Financial Group, Inc., and subsidiaries (the “Company”) as of December 31, 2008 and 2007, and the related consolidated statements of income and comprehensive income (loss), changes in shareholders’ equity, and cash flows for each of the three years in the period ended December 31, 2008. These financial statements are the responsibility of the Company’s management. Our responsibility is to express an opinion on these financial statements based on our audits.
We conducted our audits in accordance with the standards of the Public Company Accounting Oversight Board (United States). Those standards require that we plan and perform the audit to obtain reasonable assurance about whether the financial statements are free of material misstatement. An audit includes examining, on a test basis, evidence supporting the amounts and disclosures in the financial statements. An audit also includes assessing the accounting principles used and significant estimates made by management, as well as evaluating the overall financial statement presentation. We believe that our audits provide a reasonable basis for our opinion.
In our opinion, such consolidated financial statements present fairly, in all material respects, the financial position of StanCorp Financial Group, Inc., and subsidiaries as of December 31, 2008 and 2007, and the results of their operations and their cash flows for each of the three years in the period ended December 31, 2008, in conformity with accounting principles generally accepted in the United States of America.
As discussed in Note 1 to the consolidated financial statements, on January 1, 2007, the Company changed its method of accounting for deferred acquisition costs upon the adoption of Statement of Position 05-1,Accounting by Insurance Enterprises for Deferred Acquisition Costs in Connection with Modifications or Exchanges of Insurance Contracts. As also discussed in Notes 1 and 11 to the consolidated financial statements, on December 31, 2006, the Company changed its method of accounting for defined benefit and other postretirement plans upon the adoption of Statement of Financial Accounting Standards No. 158,Employers’ Accounting for Defined Benefit Pension and Other Postretirement Plans.
We have also audited, in accordance with the standards of the Public Company Accounting Oversight Board (United States), the Company’s internal control over financial reporting as of December 31, 2008, based on the criteria established in Internal Control—Integrated Framework issued by the Committee of Sponsoring Organizations of the Treadway Commission and our report dated February 27, 2009 expressed an unqualified opinion on the Company’s internal control over financial reporting.
|
|
/s/ DELOITTE & TOUCHE LLP
|
DELOITTE & TOUCHE LLP |
Portland, Oregon
February 27, 2009
| | |
| 52 | | STANCORP FINANCIAL GROUP, INC. |
Consolidated Statements of Income and Comprehensive Income (Loss)
| | | | | | | | | | | | |
| Years ended December 31 (In millions—except share data) | | 2008 | | | 2007 | | | 2006 | |
Revenues: | | | | | | | | | | | | |
Premiums | | $ | 2,140.2 | | | $ | 2,078.3 | | | $ | 1,935.0 | |
Administrative fees | | | 114.6 | | | | 115.2 | | | | 77.1 | |
Net investment income | | | 541.0 | | | | 516.3 | | | | 478.9 | |
Net capital gains (losses) | | | (128.8 | ) | | | (0.6 | ) | | | 1.9 | |
Total revenues | | | 2,667.0 | | | | 2,709.2 | | | | 2,492.9 | |
Benefits and expenses: | | | | | | | | | | | | |
Benefits to policyholders | | | 1,589.4 | | | | 1,591.8 | | | | 1,513.1 | |
Interest credited | | | 110.7 | | | | 108.8 | | | | 97.7 | |
Operating expenses | | | 469.2 | | | | 434.8 | | | | 370.3 | |
Commissions and bonuses | | | 227.6 | | | | 198.0 | | | | 183.6 | |
Premium taxes | | | 37.3 | | | | 36.4 | | | | 34.6 | |
Interest expense | | | 39.2 | | | | 30.7 | | | | 17.9 | |
Net increase in deferred acquisition costs, value of business acquired and intangibles | | | (47.5 | ) | | | (33.0 | ) | | | (34.0 | ) |
Total benefits and expenses | | | 2,425.9 | | | | 2,367.5 | | | | 2,183.2 | |
Income before income taxes | | | 241.1 | | | | 341.7 | | | | 309.7 | |
Income taxes | | | 78.2 | | | | 114.2 | | | | 105.9 | |
Net income | | | 162.9 | | | | 227.5 | | | | 203.8 | |
Other comprehensive income (loss), net of tax: | | | | | | | | | | | | |
Unrealized gains (losses) on securities available-for-sale: | | | | | | | | | | | | |
Unrealized capital gains (losses) on securities available-for-sale, net | | | (206.0 | ) | | | 25.0 | | | | (41.7 | ) |
Reclassification adjustment for net capital (gains) losses included in net income, net | | | 80.3 | | | | (2.0 | ) | | | (1.7 | ) |
Employee benefit plans: | | | | | | | | | | | | |
Prior service credit (cost) and net gains (losses) arising during the period, net | | | (45.9 | ) | | | 0.3 | | | | — | |
Reclassification adjustment for amortization to net periodic pension cost, net | | | 0.9 | | | | 1.6 | | | | — | |
Total other comprehensive income (loss), net of tax | | | (170.7 | ) | | | 24.9 | | | | (43.4 | ) |
Comprehensive income (loss) | | $ | (7.8 | ) | | $ | 252.4 | | | $ | 160.4 | |
| | | |
Net income per common share: | | | | | | | | | | | | |
Basic | | $ | 3.33 | | | $ | 4.39 | | | $ | 3.77 | |
Diluted | | | 3.30 | | | | 4.35 | | | | 3.73 | |
| | | |
Weighted-average common shares outstanding: | | | | | | | | | | | | |
Basic | | | 48,917,235 | | | | 51,824,050 | | | | 54,079,033 | |
Diluted | | | 49,292,240 | | | | 52,344,950 | | | | 54,688,114 | |
See Notes to Consolidated Financial Statements.
Part II
Consolidated Balance Sheets
| | | | | | | |
| December 31 (Dollars in millions) | | 2008 | | | 2007 |
ASSETS | | | | | | | |
Investments: | | | | | | | |
Fixed maturity securities—available-for-sale (adjusted carrying value of $5,322.1 and $4,933.7) | | $ | 5,200.3 | | | $ | 4,997.1 |
Short-term investments | | | 1.4 | | | | 4.5 |
Commercial mortgage loans, net | | | 4,083.6 | | | | 3,657.7 |
Real estate, net | | | 81.3 | | | | 71.8 |
Policy loans | | | 3.4 | | | | 3.9 |
Total investments | | | 9,370.0 | | | | 8,735.0 |
Cash and cash equivalents | | | 280.5 | | | | 205.8 |
Premiums and other receivables | | | 101.9 | | | | 106.8 |
Accrued investment income | | | 103.1 | | | | 93.1 |
Amounts recoverable from reinsurers | | | 944.0 | | | | 929.6 |
Deferred acquisition costs, value of business acquired and intangibles, net | | | 334.5 | | | | 288.8 |
Goodwill, net | | | 36.0 | | | | 36.0 |
Property and equipment, net | | | 136.1 | | | | 126.9 |
Deferred tax assets, net | | | 75.1 | | | | — |
Other assets | | | 98.1 | | | | 74.5 |
Separate account assets | | | 3,075.9 | | | | 4,386.4 |
Total assets | | $ | 14,555.2 | | | $ | 14,982.9 |
LIABILITIES AND SHAREHOLDERS’ EQUITY | | | | | | | |
Liabilities: | | | | | | | |
Future policy benefits and claims | | $ | 5,285.9 | | | $ | 5,158.7 |
Other policyholder funds | | | 3,944.1 | | | | 3,153.8 |
Deferred tax liabilities, net | | | — | | | | 15.6 |
Short-term debt | | | 3.7 | | | | 4.0 |
Long-term debt | | | 561.5 | | | | 562.6 |
Other liabilities | | | 303.8 | | | | 272.8 |
Separate account liabilities | | | 3,075.9 | | | | 4,386.4 |
Total liabilities | | | 13,174.9 | | | | 13,553.9 |
Commitments and contingencies (see Note 19) | | | | | | | |
| | |
Shareholders’ equity: | | | | | | | |
Preferred stock, 100,000,000 shares authorized; none issued | | | — | | | | — |
Common stock, no par, 300,000,000 shares authorized; 48,989,074 and 49,155,131 shares issued at December 31, 2008 and 2007, respectively | | | 262.9 | | | | 267.1 |
Accumulated other comprehensive income (loss) | | | (153.9 | ) | | | 16.8 |
Retained earnings | | | 1,271.3 | | | | 1,145.1 |
Total shareholders’ equity | | | 1,380.3 | | | | 1,429.0 |
Total liabilities and shareholders’ equity | | $ | 14,555.2 | | | $ | 14,982.9 |
See Notes to Consolidated Financial Statements.
| | |
| 54 | | STANCORP FINANCIAL GROUP, INC. |
Consolidated Statements of Changes in Shareholders’ Equity
| | | | | | | | | | | | | | | | | | | |
| | | Common stock
| | | Accumulated
other
comprehensive
income (loss) | | | Retained
earnings | | | Total
shareholders’
equity | |
| (In millions—except share data) | | Shares | | | Amount | | | | |
Balance, January 1, 2006 | | 54,712,936 | | | $ | 530.3 | | | $ | 59.8 | | | $ | 823.7 | | | $ | 1,413.8 | |
Net income | | — | | | | — | | | | — | | | | 203.8 | | | | 203.8 | |
Other comprehensive loss, net of tax | | — | | | | — | | | | (43.4 | ) | | | — | | | | (43.4 | ) |
Adjustment to initially apply SFAS No. 158, net of tax | | — | | | | — | | | | (24.5 | ) | | | — | | | | (24.5 | ) |
Common stock: | | | | | | | | | | | | | | | | | | | |
Repurchased | | (1,519,200 | ) | | | (70.1 | ) | | | — | | | | — | | | | (70.1 | ) |
Issued to directors | | 3,617 | | | | 0.2 | | | | — | | | | — | | | | 0.2 | |
Issued under employee stock plans, net | | 394,825 | | | | 19.5 | | | | — | | | | — | | | | 19.5 | |
Dividends declared on common stock | | — | | | | — | | | | — | | | | (34.8 | ) | | | (34.8 | ) |
Balance, December 31, 2006 | | 53,592,178 | | | | 479.9 | | | | (8.1 | ) | | | 992.7 | | | | 1,464.5 | |
Net income | | — | | | | — | | | | — | | | | 227.5 | | | | 227.5 | |
Cumulative adjustment to apply SOP 05-1, net of tax | | — | | | | — | | | | — | | | | (39.4 | ) | | | (39.4 | ) |
Other comprehensive income, net of tax | | — | | | | — | | | | 24.9 | | | | — | | | | 24.9 | |
Common stock: | | | | | | | | | | | | | | | | | | | |
Repurchased | | (4,847,200 | ) | | | (235.6 | ) | | | — | | | | — | | | | (235.6 | ) |
Issued to directors | | 1,292 | | | | 0.4 | | | | — | | | | — | | | | 0.4 | |
Issued under employee stock plans, net | | 408,861 | | | | 22.4 | | | | — | | | | — | | | | 22.4 | |
Dividends declared on common stock | | — | | | | — | | | | — | | | | (35.7 | ) | | | (35.7 | ) |
Balance, December 31, 2007 | | 49,155,131 | | | | 267.1 | | | | 16.8 | | | | 1,145.1 | | | | 1,429.0 | |
Net income | | — | | | | — | | | | — | | | | 162.9 | | | | 162.9 | |
Other comprehensive loss, net of tax | | — | | | | — | | | | (170.7 | ) | | | — | | | | (170.7 | ) |
Common stock: | | | | | | | | | | | | | | | | | | | |
Repurchased | | (526,300 | ) | | | (24.9 | ) | | | — | | | | — | | | | (24.9 | ) |
Issued to directors | | 9,820 | | | | 0.5 | | | | — | | | | — | | | | 0.5 | |
Issued under employee stock plans, net | | 350,423 | | | | 20.2 | | | | — | | | | — | | | | 20.2 | |
Dividends declared on common stock | | — | | | | — | | | | — | | | | (36.7 | ) | | | (36.7 | ) |
Balance, December 31, 2008 | | 48,989,074 | | | $ | 262.9 | | | $ | (153.9 | ) | | $ | 1,271.3 | | | $ | 1,380.3 | |
See Notes to Consolidated Financial Statements.
Part II
Consolidated Statements of Cash Flows
| | | | | | | | | | | | |
| Years ended December 31 (In millions) | | 2008 | | | 2007 | | | 2006 | |
Operating: | | | | | | | | | | | | |
Net income | | $ | 162.9 | | | $ | 227.5 | | | $ | 203.8 | |
Adjustments to reconcile net income to net cash provided by operating activities: | | | | | | | | | | | | |
Net realized (gains) and losses on sales of investments | | | 23.5 | | | | (3.2 | ) | | | (6.5 | ) |
Net loss on impairment of investments | | | 105.3 | | | | 3.8 | | | | 4.6 | |
Depreciation and amortization | | | 124.5 | | | | 97.8 | | | | 83.9 | |
Deferral of acquisition costs, value of business acquired, intangibles and goodwill, net | | | (122.5 | ) | | | (90.1 | ) | | | (77.9 | ) |
Deferred income taxes | | | 1.8 | | | | 0.7 | | | | 2.3 | |
Changes in other assets and liabilities: | | | | | | | | | | | | |
Receivables and accrued income | | | (15.3 | ) | | | (26.1 | ) | | | (28.6 | ) |
Future policy benefits and claims | | | 127.2 | | | | 231.1 | | | | 238.3 | |
Other, net | | | (45.6 | ) | | | 44.2 | | | | (29.8 | ) |
Net cash provided by operating activities | | | 361.8 | | | | 485.7 | | | | 390.1 | |
Investing: | | | | | | | | | | | | |
Proceeds of investments, sold, matured or repaid: | | | | | | | | | | | | |
Fixed maturity securities—available-for-sale | | | 615.0 | | | | 635.1 | | | | 517.2 | |
Commercial mortgage loans | | | 1,006.8 | | | | 1,055.8 | | | | 560.7 | |
Real estate | | | 0.5 | | | | 1.5 | | | | 7.6 | |
Cost of investments acquired or originated: | | | | | | | | | | | | |
Fixed maturity securities—available-for-sale | | | (1,160.1 | ) | | | (818.7 | ) | | | (773.7 | ) |
Commercial mortgage loans | | | (1,452.0 | ) | | | (1,400.2 | ) | | | (940.8 | ) |
Real estate | | | (3.2 | ) | | | (9.3 | ) | | | (18.2 | ) |
Acquisitions | | | — | | | | (6.1 | ) | | | (81.7 | ) |
Short-term investments, net | | | 1.3 | | | | (10.3 | ) | | | — | |
Other investments | | | (0.1 | ) | | | (0.2 | ) | | | (4.1 | ) |
Acquisition of property and equipment | | | (37.2 | ) | | | (44.6 | ) | | | (16.3 | ) |
Net cash used in investing activities | | | (1,029.0 | ) | | | (597.0 | ) | | | (749.3 | ) |
Financing: | | | | | | | | | | | | |
Policyholder fund deposits | | | 2,364.1 | | | | 1,705.8 | | | | 1,645.6 | |
Policyholder fund withdrawals | | | (1,573.8 | ) | | | (1,489.8 | ) | | | (1,357.1 | ) |
Short-term debt | | | (0.3 | ) | | | 1.6 | | | | 0.4 | |
Long-term debt | | | (1.1 | ) | | | 297.7 | | | | 0.6 | |
Third party interest in a limited liability company | | | — | | | | — | | | | 164.0 | |
Issuance of common stock | | | 14.6 | | | | 17.1 | | | | 13.4 | |
Repurchases of common stock | | | (24.9 | ) | | | (235.6 | ) | | | (70.1 | ) |
Dividends paid on common stock | | | (36.7 | ) | | | (35.7 | ) | | | (34.8 | ) |
Net cash provided by financing activities | | | 741.9 | | | | 261.1 | | | | 362.0 | |
Increase in cash and cash equivalents | | | 74.7 | | | | 149.8 | | | | 2.8 | |
Cash and cash equivalents, beginning of year | | | 205.8 | | | | 56.0 | | | | 53.2 | |
Cash and cash equivalents, end of year | | $ | 280.5 | | | $ | 205.8 | | | $ | 56.0 | |
Supplemental disclosure of cash flow information: | | | | | | | | | | | | |
Cash paid during the year for: | | | | | | | | | | | | |
Interest | | $ | 151.2 | | | $ | 132.6 | | | $ | 111.2 | |
Income taxes | | | 128.8 | | | | 97.3 | | | | 100.3 | |
Non-cash transactions: | | | | | | | | | | | | |
Real estate acquired through commercial mortgage loan foreclosure | | | 6.2 | | | | 0.5 | | | | 1.3 | |
Transfer of commercial mortgage loans in limited liability company dissolution | | | — | | | | — | | | | 307.1 | |
See Notes to Consolidated Financial Statements.
| | |
| 56 | | STANCORP FINANCIAL GROUP, INC. |
Notes to Consolidated Financial Statements
As used in this Form 10-K, the terms “StanCorp,” “Company,” “we,” “us” and “our” refer to StanCorp Financial Group, Inc. and its subsidiaries, unless the context otherwise requires.
1. SUMMARY OF SIGNIFICANT ACCOUNTING POLICIES
Organization, principles of consolidation, and basis of presentation
StanCorp is a holding company for our insurance and asset management subsidiaries and is headquartered in Portland, Oregon. We are the parent company of Standard Insurance Company, a leading provider of group insurance products and services serving the life and disability insurance needs of employer groups and the disability insurance needs of individuals. Our insurance subsidiaries also provide accidental death and dismemberment (“AD&D”) insurance and dental insurance. Through our insurance subsidiaries, we have the authority to underwrite insurance products in all 50 states. Our asset management businesses offer full-service 401(k) plans, 457 plans, defined benefit plans, money purchase pension plans, profit sharing plans, 403(b) plans and non-qualified deferred compensation products and services through an affiliated broker-dealer. Our asset management businesses also offer investment advisory and management services, financial planning services, commercial mortgage loan origination and servicing, individual fixed annuities, group annuity contracts and retirement plan trust products. StanCorp operates through two segments: Insurance Services and Asset Management, each of which is described below. See “Note 3—Segments.”
StanCorp was incorporated under the laws of Oregon in 1998 as a parent holding company and conducts business through its subsidiaries: Standard Insurance Company (“Standard”); The Standard Life Insurance Company of New York; Standard Retirement Services, Inc. (“Standard Retirement Services”); StanCorp Equities, Inc. (“StanCorp Equities”); StanCorp Mortgage Investors, LLC (“StanCorp Mortgage Investors”); StanCorp Investment Advisers, Inc. (“StanCorp Investment Advisers”); and StanCorp Real Estate, LLC (“StanCorp Real Estate”). The Company is headquartered in Portland, Oregon and, through its subsidiaries, has operations throughout the United States.
The Standard is a service mark of StanCorp and its subsidiaries and is used as a brand mark and marketing name by Standard and The Standard Life Insurance Company of New York.
Standard, the Company’s largest subsidiary, underwrites group and individual disability insurance and annuity products, group life and AD&D insurance, and group dental insurance, and provides retirement plan products. Founded in 1906, Standard is domiciled in Oregon, licensed in all states except New York, and licensed in the District of Columbia and the U.S. Territories of Guam and the Virgin Islands.
The Standard Life Insurance Company of New York was organized in 2000 and is licensed to provide group long term and short term disability, life, AD&D and dental insurance in New York.
Standard Retirement Services administers and services StanCorp’s retirement plans group annuity contracts and trust products. Retirement plan products are offered in all 50 states through Standard or Standard Retirement Services.
StanCorp Equities is a limited broker-dealer and member of the Financial Industry Regulatory Authority. StanCorp Equities serves as principal underwriter and distributor for group variable annuity contracts issued by Standard and as the broker of record for certain retirement plans using the trust platform. StanCorp Equities carries no customer accounts but provides supervision and oversight for the distribution of group variable annuity contracts and of the sales activities of all registered representatives employed by StanCorp Equities and its affiliates.
StanCorp Mortgage Investors originates, underwrites and services small, fixed-rate commercial mortgage loans for the investment portfolios of the Company’s insurance subsidiaries. StanCorp Mortgage Investors also generates additional fee income from the origination and servicing of commercial mortgage loans participated to institutional investors.
StanCorp Investment Advisers is a Securities and Exchange Commission (“SEC”) registered investment adviser providing performance analysis, fund selection support, model portfolios and other investment advisory, financial planning, and investment management services to its retirement plan clients, individual investors and subsidiaries of StanCorp.
StanCorp Real Estate is a property management company that owns and manages the Hillsboro, Oregon home office properties and other investment properties and manages the Portland, Oregon home office properties.
StanCorp and Standard hold interests in low-income housing partnerships. Individually, the interest in these partnerships do not represent a significant variable interest
Part II
pursuant to the definition of Financial Accounting Standards Board (“FASB”) Interpretation No. 46(R),Consolidation of Variable Interest Entities, (revised December 2003)—an interpretation of ARB No. 51,nor do they meet the requirements for consolidation. The total investment in these interests was $18.8 million and $17.8 million at December 31, 2008 and 2007, respectively.
Minority interest related to consolidated entities included in other liabilities was $2.5 million and $0.5 million at December 31, 2008 and 2007, respectively.
The consolidated financial statements include StanCorp and its subsidiaries. Intercompany balances and transactions have been eliminated. Goodwill stated for prior periods has been reclassified to conform to the current period’s presentation.
Use of estimates
Our consolidated financial statements have been prepared in accordance with accounting principles generally accepted in the United States of America (“GAAP”) and require us to make estimates and assumptions that affect reported amounts of assets and liabilities and disclosures of contingent assets and contingent liabilities at the dates of the financial statements and the reported amounts of revenues and expenses during the reporting periods. The estimates most susceptible to material changes due to significant judgment (the “critical accounting policies”) are those used in determining investment valuation and other-than-temporary impairments, deferred acquisition costs (“DAC”), value of business acquired (“VOBA”), other intangible assets, goodwill, the reserves for future policy benefits and claims, and the provision for income taxes. The results of these estimates are critical because they affect our profitability and may affect key indicators used to measure the Company’s performance. These estimates have a material effect on our results of operations and financial condition.
Investments
For all investments, capital gains and losses are recognized using the specific identification method. Net investment income and capital gains and losses related to separate account assets and liabilities are included in the separate account assets and liabilities. For all investments, we record impairments when it is determined that the decline in fair value of an investment below its adjusted carrying value or amortized cost basis is other than temporary. The impairment loss is charged to net capital
gains or losses, and the cost basis of the investment is permanently adjusted to reflect the impairment.
In our quarterly impairment analysis, we evaluate whether a decline in value of fixed maturity securities is other than temporary. Factors considered in this analysis include:
| | • | | The length of time and the extent to which the fair value has been below adjusted carrying value. |
| | • | | The financial condition and near-term prospects of the issuer. |
| | • | | The intent and ability of the Company to retain the investment for a period of time sufficient to allow for any anticipated recovery in market value. |
| | • | | The value of any security interest we may have collateralized in the investment. |
See “Note 5—Investment Securities.” For securities expected to be sold, an other-than-temporary impairment charge is recorded if we do not expect the realizable market value of a security to recover to adjusted carrying value prior to the expected date of sale. Once an impairment charge has been recorded, we continue to review the other-than-temporarily impaired securities for further potential impairment on an on-going basis. If the market value of the investment later recovers, the Company is not permitted to write the asset back up to its historical cost (i.e. the write-down is permanent).
Our investment portfolio includes fixed maturity securities and commercial mortgage loans. At December 31, 2008, issues on our fixed maturity securities impairment watch list totaled approximately $329.5 million in market value and $439.0 million in book value after other-than-temporary impairments had been taken. The Company recorded other-than-temporary impairments of $104.9 million during 2008, primarily due to a decline in the market value of holdings of issuers the Company believed would face difficulties in the deteriorating economic environment. In 2008, the Company sold bond holdings of companies with potential liquidity concerns in order to solidify the condition of the Company’s bond portfolio. The Company will continue to evaluate these holdings but currently expects the fair values of its investments to recover as the securities approach their maturity dates. Should the credit quality of our fixed maturity securities continue to decline, there could be a material adverse effect on our business, financial position, results of operations or cash flows. We did not have any direct exposure to sub-prime or Alt-A mortgages in our fixed maturity securities portfolio at December 31, 2008.
| | |
| 58 | | STANCORP FINANCIAL GROUP, INC. |
Investment securities include fixed maturity securities. Fixed maturity securities are classified as available-for-sale and are carried at fair value on the consolidated balance sheets. See “Note 4—Fair Value of Financial Instruments,” for a detailed explanation of the valuation methods the Company uses to calculate the fair value of the Company’s financial instruments. Investment securities also include derivative investments, which are carried at fair value. See “Note 7—Derivative Financial Instruments.” Valuation adjustments for fixed maturity securities that are not accounted for as other-than-temporary impairments are reported as net increases or decreases to other comprehensive income (loss), net of tax, on the consolidated statements of income and comprehensive income. Valuation adjustments for derivatives are reported as a component of net investment income.
Commercial mortgage loans are stated at amortized cost less a valuation allowance for potentially uncollectible amounts. The commercial mortgage loan valuation allowance is based on our analysis of factors including changes in the size and composition of the loan portfolio, actual loan loss experience and individual loan analysis. We did not have any direct exposure to sub-prime or Alt-A mortgages in our commercial mortgage loan portfolio at December 31, 2008.
Real estate held for investment is stated at cost less accumulated depreciation. Depreciation generally is provided on the straight-line method with property lives varying from 30 to 40 years. Accumulated depreciation for real estate totaled $30.1 million and $29.1 million at December 31, 2008 and 2007, respectively. Real estate acquired in satisfaction of debt totaling $6.2 million at December 31, 2008 is recorded at the lower of cost or fair value, less estimated costs to sell.
Policy loans are stated at their aggregate unpaid principal balances and are secured by policy cash values.
In September 2006, the FASB issued Statement of Financial Accounting Standards (“SFAS”) No. 157, Fair Value Measurements, which is intended to increase consistency and comparability in fair value measurements by defining fair value, establishing a framework for measuring fair value and expanding disclosures about fair value measurements. SFAS No. 157 applies to other accounting pronouncements that require or permit fair value measurement. SFAS No. 157 became effective for financial statements issued for the fiscal years beginning after November 15, 2007, and interim periods within those fiscal years. StanCorp adopted the provisions of SFAS
No. 157 beginning January 1, 2008. See “Note 4—Fair Value of Financial Instruments.”
Cash and Cash Equivalents
Cash and cash equivalents include cash and investments purchased with original maturities of three months or less at the time of acquisition. The carrying amount of cash equivalents approximates the fair value of those instruments.
DAC, VOBA and other intangible assets
DAC, VOBA and other intangible assets are considered intangible assets. These intangible assets are generally originated through the issuance of new business or the purchase of existing business either by purchasing blocks of insurance policies from other insurers or by the outright purchase of other companies. The Company’s intangible assets are subject to impairment tests on an annual basis or more frequently if circumstances indicate that carrying values may not be recoverable.
Acquisition costs that the Company has deferred as DAC are those costs that vary with and are primarily related to the acquisition and, in some instances, the renewal of insurance products. These costs are typically one-time expenses that represent the cost of originating new business and placing that business in force. Certain costs related to obtaining new business and acquiring business through reinsurance agreements have been deferred and will be amortized to accomplish matching against related future premiums or gross profits as appropriate. The Company normally defers certain acquisition-related commissions and incentive payments, certain costs of policy issuance and underwriting, and certain printing costs. Assumptions used in developing DAC and amortization amounts each period include the amount of business in force, expected future persistency, withdrawals, interest rates and profitability. These assumptions are modified to reflect actual experience when appropriate. Additional amortization of DAC is charged to current earnings to the extent it is determined that future premiums or gross profits are not adequate to cover the remaining amounts deferred. DAC totaled $249.2 million and $202.3 million at December 31, 2008 and 2007, respectively. Changes in actual persistency are reflected in the calculated DAC balance. Costs that do not vary with the production of new business are not deferred as DAC and are charged to expense as incurred. Annual commissions are considered expenses and are not deferred.
Part II
DAC for group and individual disability insurance products and group life insurance products is amortized over the life of related policies in proportion to future premiums in accordance with SFAS No. 60,Accounting and Reporting by Insurance Enterprises.Beginning with the adoption of Statement of Position (“SOP”) 05-1,Accounting by Insurance Enterprises for Deferred Acquisition Costs in Connection With Modifications or Exchanges of Insurance Contracts. On January 1, 2007, the Company began amortizing DAC for group disability and life insurance products over the initial premium rate guarantee period, which averages 2.5 years. DAC for individual disability insurance products is amortized in proportion to future premiums over the life of the contract, averaging 20 to 25 years with approximately 50% and 75% expected to be amortized by years 10 and 15, respectively.
The Company’s individual deferred annuities and group annuity products are classified as investment contracts. DAC related to these products is amortized over the life of related policies in proportion to expected gross profits in accordance with SFAS No. 97, Accounting and Reporting by Insurance Enterprises for Certain Long-Duration Contracts and for Realized Gains and Losses from the Sale of Investments. For the Company’s individual deferred annuities, DAC is generally amortized over 30 years with approximately 50% and 90% expected to be amortized by years 5 and 15, respectively. DAC for group annuity products is amortized over 10 years with approximately 30% expected to be amortized by year five.
VOBA primarily represents the discounted future profits of business assumed through reinsurance agreements. We have established VOBA for a block of individual disability business assumed from the Minnesota Life Insurance Company (“Minnesota Life”) and a block of group disability and group life business assumed from Teachers Insurance and Annuity Association of America (“TIAA”). VOBA is generally amortized in proportion to future premiums for group and individual disability insurance products and group life products. However, a portion of the VOBA related to the TIAA transaction associated with an in force block of group long term disability claims for which no ongoing premium is received is amortized in proportion to expected gross profits. If actual premiums or future profitability are inconsistent with our assumptions, the Company could be required to make adjustments to VOBA and related amortization. For the VOBA associated with the Minnesota Life block of business reinsured, the amortization period is up to 30 years and is amortized in
proportion to future premiums. The amortization period of the intangible asset for the marketing agreement with Minnesota Life is up to 25 years. The VOBA associated with the TIAA transaction is comprised of two parts with differing amortization methods. The amortization period was up to 10 years for VOBA that was amortized in proportion to premiums and up to 20 years for VOBA that is amortized in proportion to expected gross profits. VOBA totaled $31.1 million and $34.4 million at December 31, 2008 and 2007, respectively. Upon adoption of SOP 05-1 in 2007, the premium portion of the VOBA related to TIAA was recorded as a $10.0 million reduction to retained earnings.
VOBA related to the TIAA group long term disability claims, for which no further premiums are due, is amortized in proportion to expected gross profits. The following table sets forth the amount of DAC and VOBA balances amortized in proportion to expected gross profits and the percentage of the total balance of DAC and VOBA amortized in proportion to expected gross profits at December 31:
| | | | | | | | | | | | | | |
| | | 2008 | | | | | 2007 | |
| (Dollars in millions) | | Amount | | Percent | | | | | Amount | | Percent | |
DAC | | $ | 79.9 | | 32.1 | % | | | | $ | 59.7 | | 29.5 | % |
VOBA | | | 7.7 | | 24.8 | | | | | | 9.4 | | 27.3 | |
Key assumptions, which will affect the determination of expected gross profits for determining DAC and VOBA balances are:
| | • | | Interest rates, which affect both investment income and interest credited. |
| | • | | Stock market performance. |
| | • | | Capital gains and losses. |
| | • | | Claim termination rates. |
Although a change in a single assumption may have an impact on the calculated amortization of DAC or VOBA, it is the relationship of that change to the changes in other key assumptions that determines the ultimate impact on DAC or VOBA amortization. Because actual results and trends related to these assumptions vary from those assumed, the Company revises these assumptions annually to reflect its current best estimate of expected gross profits. As a result of this process, known as “unlocking,” the cumulative balances of DAC and VOBA are adjusted with an offsetting benefit or charge to income to reflect changes in the period of the revision. An unlocking event that results in an after-tax benefit generally occurs as a result of actual experience or future expectations being favorable
| | |
| 60 | | STANCORP FINANCIAL GROUP, INC. |
compared to previous estimates. An unlocking event that results in an after-tax charge generally occurs as a result of actual experience or future expectations being unfavorable compared to previous estimates. As a result of unlocking, the amortization schedule for future periods is also adjusted. Due to unlocking, DAC and VOBA balances decreased $0.4 million for 2008 and decreased $0.4 million for 2007. Based on past experience, future changes in DAC and VOBA balances due to changes in underlying assumptions are not expected to be material. However, significant, unanticipated changes in key assumptions, which affect the determination of expected gross profits, may result in a large unlocking event that could have a material adverse effect on the Company’s financial position or results of operations.
The Company’s other intangible assets are subject to amortization and consist of certain customer lists and a marketing agreement. Customer lists were acquired primarily in connection with the purchase of Invesmart, Inc. (“Invesmart”) during the third quarter of 2006. Additional customer lists were acquired with the purchase of DPA, Inc. and with the acquisition of small investment advisory firms. Customer lists have a combined estimated weighted-average remaining life of approximately 9.3 years. A marketing agreement accompanied the Minnesota Life transaction and provides access to Minnesota Life agents, some of whom now market Standard’s individual disability insurance products. The amortization period for the Minnesota Life marketing agreement is up to 25 years. Other intangible assets totaled $54.2 million and $52.1 million at December 31, 2008 and 2007, respectively.
The following table sets forth activity for DAC, VOBA and other intangible assets:
| | | | | | | | | | | | |
| (In millions) | | 2008 | | | 2007 | | | 2006 | |
Carrying value at beginning of period: | | | | | | | | | | | | |
DAC | | $ | 202.3 | | | $ | 208.5 | | | $ | 165.8 | |
VOBA | | | 34.4 | | | | 53.7 | | | | 59.6 | |
Other intangible assets | | | 52.1 | | | | 47.0 | | | | 19.9 | |
Total balance beginning of period | | | 288.8 | | | | 309.2 | | | | 245.3 | |
Deferred or acquired: | | | | | | | | | | | | |
DAC | | | 115.3 | | | | 86.2 | | | | 78.5 | |
Other intangible assets | | | 7.2 | | | | 9.0 | | | | 28.6 | |
Total deferred or acquired | | | 122.5 | | | | 95.2 | | | | 107.1 | |
Amortized during period: | | | | | | | | | | | | |
DAC | | | (68.4 | ) | | | (47.1 | ) | | | (35.8 | ) |
VOBA | | | (3.3 | ) | | | (3.9 | ) | | | (5.9 | ) |
Other intangible assets | | | (5.1 | ) | | | (3.9 | ) | | | (1.5 | ) |
Total amortized during period | | | (76.8 | ) | | | (54.9 | ) | | | (43.2 | ) |
Adjustment to apply SOP 05-1: | | | | | | | | | | | | |
DAC | | | — | | | | (45.3 | ) | | | — | |
VOBA | | | — | | | | (15.4 | ) | | | — | |
Total adjustment during period | | | — | | | | (60.7 | ) | | | — | |
Carrying value at end of period, net: | | | | | | | | | | | | |
DAC | | | 249.2 | | | | 202.3 | | | | 208.5 | |
VOBA | | | 31.1 | | | | 34.4 | | | | 53.7 | |
Other intangible assets | | | 54.2 | | | | 52.1 | | | | 47.0 | |
Total carrying value at end of period | | $ | 334.5 | | | $ | 288.8 | | | $ | 309.2 | |
The accumulated amortization of VOBA was $57.7 million and $54.4 million at December 31, 2008 and 2007, respectively. The accumulated amortization of other intangibles, excluding DAC, was $12.5 million and $7.4 million at December 31, 2008 and 2007, respectively.
The estimated net amortization of VOBA and other intangible assets, excluding DAC, for each of the next five years is as follows:
| | | |
| (In millions) | | Amount |
2009 | | $ | 6.0 |
2010 | | | 7.1 |
2011 | | | 7.9 |
2012 | | | 7.9 |
2013 | | | 8.3 |
Goodwill
Goodwill of $33.5 million was acquired by the Company during the third quarter of 2006, primarily in connection with the purchase of Invesmart, and is related to the Asset Management segment. Goodwill totaled $36.0 million at both December 31, 2008 and 2007. In accordance with SFAS No. 142,Goodwill and other Intangible Assets, goodwill is not amortized and is tested at least annually for impairment. If indicators of impairment appear, or in the
Part II
event of material changes in circumstances, the test will be more frequent.Per SFAS No. 142, we performed a step one test, as of December 31, 2008, in which the carrying value of tested assets was compared to the assets’ fair values. Fair value is measured using a combination of the income approach and the market approach. The income approach consists of utilizing the discounted cash flow method that incorporates our estimates of future revenues and costs of our business, discounted using a market participant weighted-average cost of capital. The estimates we use in the income approach are consistent with the plans and estimates that we use to manage our operations. The market approach utilizes multiples of profit measures in order to estimate the fair value of the assets. As a result of the consistency of the income approach with how we internally evaluate and manage our business, we weight the income approach more heavily than the market approach in determining the fair value of the assets. However, we do perform testing to ensure that both models are providing reasonably consistent results. Additionally, we perform sensitivity analysis on the key input factors in these models to determine whether any input factor or combination of factors moving moderately in either direction would change the results of these tests. Through the performance of these tests, we concluded that goodwill was not impaired as of December 31, 2008.
Property and equipment, net
The following table sets forth the major classifications of the Company’s property and equipment and accumulated depreciation at December 31:
| | | | | | |
| (In millions) | | 2008 | | 2007 |
Home office properties | | $ | 127.3 | | $ | 122.9 |
Office furniture and equipment | | | 71.9 | | | 69.0 |
Capitalized software | | | 114.3 | | | 87.1 |
Leasehold improvements | | | 10.7 | | | 10.0 |
Subtotal | | | 324.2 | | | 289.0 |
Less: accumulated depreciation | | | 188.1 | | | 162.1 |
Property and equipment, net | | $ | 136.1 | | $ | 126.9 |
Property and equipment are stated at cost less accumulated depreciation. The Company provides for depreciation of property and equipment using the half-year convention, and straight-line method over the estimated useful lives, which are generally 40 years for properties and from three to ten years for equipment. Leasehold improvements are amortized over the estimated useful life of the asset, with amortization not to exceed the life of the lease. Depreciation expense for 2008, 2007 and 2006 was $27.9 million, $22.2 million and $15.1 million, respectively.
The Company reviews property and equipment for impairment when circumstances or events indicate the carrying amount of the asset may not be recoverable and recognizes a charge to earnings if an asset is impaired.
Non-affiliated tenants leased approximately 36.5%, 38.5% and 40.0% of the corporate headquarters in Portland, Oregon at December 31, 2008, 2007 and 2006, respectively. Income from the leases is included in net investment income.
Separate account
Separate account assets and liabilities represent segregated funds held for the exclusive benefit of contract holders. The activities of the account primarily relate to contract holder-directed 401(k) contracts. Standard charges the separate account with asset management and plan administration fees associated with the contracts. Separate account assets and liabilities are carried at fair value.
Future policy benefits and claims
Benefits and expenses are matched with recognized premiums to result in recognition of profits over the life of the contracts. The match is accomplished by recording a provision for future policy benefits and unpaid claims and claim adjustment expenses. For most of our product lines, we establish and carry as a liability actuarially determined reserves that are calculated to meet our obligations for future policy benefits and claims. These reserves do not represent an exact calculation of our future benefit liabilities but are instead estimates based on assumptions and considerations concerning a number of factors, which include:
| | • | | The amount of premiums that we will receive in the future. |
| | • | | The rate of return on assets we purchase with premiums received. |
| | • | | Expected number and severity of claims. |
| | • | | Persistency, which is the measurement of the percentage of premiums remaining in force from year to year. |
In particular, our group and individual long term disability reserves are sensitive to assumptions and considerations regarding the following factors:
| | • | | Claim incidence rates for incurred but not reported claim reserves. |
| | • | | Claim termination rates. |
| | • | | Discount rates used to value expected future claim payments. |
| | |
| 62 | | STANCORP FINANCIAL GROUP, INC. |
| | • | | The amount of monthly benefit paid to the insured (less reinsurance recoveries and other offsets). |
| | • | | Expense rates including inflation. |
| | • | | Historical delay in reporting of claims incurred. |
Assumptions may vary by:
| | • | | Age, gender and, for individual policies, occupation class of the claimant. |
| | • | | Year of issue for policy reserves or incurred date for claim reserves. |
| | • | | Time elapsed since disablement. |
| | • | | Contract provisions and limitations. |
Other policyholder funds
Other policyholder funds are liabilities for investment-type contracts and are based on the policy account balances including accumulated interest. Other policyholder funds include amounts related to advanced premiums, premiums on deposit and experience rated liabilities totaling $419.6 million and $373.8 million at December 31, 2008 and 2007, respectively.
Recognition of premiums
Premiums from group life and group and individual disability contracts are recognized as revenue when due. Investment-type contract fee revenues consist of charges for policy administration and surrender charges assessed during the period. Charges related to services to be performed are deferred until earned. The amounts received in excess of premiums and fees are included in other policyholder funds in the consolidated balance sheets. Experience rated refunds (“ERRs”) are computed in accordance with the terms of the contracts with certain group policyholders and are accounted for as an adjustment to premiums.
Income Taxes
The provision for income taxes includes amounts currently payable and deferred amounts that result from temporary differences between financial reporting and tax bases of assets and liabilities as measured by current tax rates. Currently, years open for audit by the Internal Revenue Service (“IRS”) are 2005 through 2008. See “Note 10—Income Taxes.”
Other comprehensive income (loss)
Other comprehensive income (loss) included changes in unrealized capital gains and losses on investment securities available-for-sale, net of the related tax effects, and changes in unrealized prior service costs and credits and net gains and losses associated with our employee benefit plans, net of the related tax effects. The following table sets forth our other comprehensive income (loss) for the years ended December 31:
| | | | | | | | | | | | |
| (In millions) | | 2008 | | | 2007 | | | 2006 | |
Unrealized gains (losses) on securities available-for-sale: | | | | | | | | | | | | |
Unrealized capital gains (losses) on securities available-for-sale, net | | $ | (318.4 | ) | | $ | 38.4 | | | $ | (65.0 | ) |
Less: tax effects | | | (112.4 | ) | | | 13.4 | | | | (23.3 | ) |
Unrealized capital gains (losses) on securities available-for-sale, net of tax | | | (206.0 | ) | | | 25.0 | | | | (41.7 | ) |
Reclassification adjustment for net capital (gains) losses included in net income, net | | | 124.1 | | | | (3.0 | ) | | | (2.7 | ) |
Less: tax effects | | | 43.8 | | | | (1.0 | ) | | | (1.0 | ) |
Reclassification adjustment for realized net capital (gains) losses, net of tax | | | 80.3 | | | | (2.0 | ) | | | (1.7 | ) |
Total unrealized gains (losses) on securities available-for-sale | | | (125.7 | ) | | | 23.0 | | | | (43.4 | ) |
Employee benefit plans: | | | | | | | | | | | | |
Prior service credit (cost) and net gains (losses) arising during the period, net | | | (70.6 | ) | | | 0.5 | | | | — | |
Less: tax effects | | | (24.7 | ) | | | 0.2 | | | | — | |
Prior service credit (cost) and net gains (losses) arising during the period, net of tax | | | (45.9 | ) | | | 0.3 | | | | — | |
Reclassification adjustment for amortization to net periodic pension cost, net | | | 1.4 | | | | 2.4 | | | | — | |
Less: tax effects | | | 0.5 | | | | 0.8 | | | | — | |
Reclassification adjustment for amortization to net periodic pension cost, net of tax | | | 0.9 | | | | 1.6 | | | | — | |
Total unrealized changes in employee benefit plans | | | (45.0 | ) | | | 1.9 | | | | — | |
Total other comprehensive income (loss), net of tax | | $ | (170.7 | ) | | $ | 24.9 | | | $ | (43.4 | ) |
Part II
Accumulated Other Comprehensive Loss
The following table sets forth the adjustment to initially apply SFAS No. 158,Employers’ Accounting for Defined Benefit Pension and Other Postretirement Plans, an amendment of FASB Statements No. 87, 88, 106 and 132(R) in 2006:
| | | | |
| (In millions) | | Amount | |
Defined benefit retirement plans: | | | | |
Net loss | | $ | (43.5 | ) |
Prior service credit | | | 5.7 | |
Transition asset | | | 0.1 | |
Adjustment to initially apply SFAS No. 158 | | | (37.7 | ) |
Less: tax effects | | | (13.2 | ) |
Adjustment to initially apply SFAS No. 158, net of tax | | $ | (24.5 | ) |
The following table sets forth the incremental effect of applying SFAS No. 158 on individual line items in the Consolidated Balance Sheets and Consolidated Statement of Changes in Equity at December 31, 2006:
| | | | | | | | | | | |
| (In millions) | | Before
Application
of SFAS
No. 158 | | Adjustments | | | After
Application
of SFAS
No. 158 | |
Other liabilities | | $ | 152.1 | | $ | 37.7 | | | $ | 189.8 | |
Deferred tax liabilities | | | 36.1 | | | (13.2 | ) | | | 22.9 | |
Total liabilities | | | 12,149.6 | | | 24.5 | | | | 12,174.1 | |
Accumulated other comprehensive income (loss) | | | 16.4 | | | (24.5 | ) | | | (8.1 | ) |
Total shareholders’ equity | | | 1,489.0 | | | (24.5 | ) | | | 1,464.5 | |
Accounting Pronouncements
In December 2007, the FASB issued SFAS No. 141 (Revised 2007),Business Combinations. The revised standard will improve, simplify and converge internationally the accounting for business combinations. Under SFAS No. 141R, an acquiring entity in a business combination must recognize the assets acquired, the liabilities assumed, and any noncontrolling interest in the acquired entity at the acquisition date fair values, with limited exceptions. In addition, SFAS No. 141R requires the acquirer to disclose all information that investors and other users need to evaluate and understand the nature and financial effect of the business combination. SFAS No. 141R applies prospectively to business combinations for which the acquisition date is on or after the beginning of the first annual reporting period beginning on or after December 15, 2008. Earlier adoption is prohibited. Accordingly, the Company will record and disclose business combinations under the revised standard beginning January 1, 2009.
In December 2007, the FASB issued SFAS No. 160,Noncontrolling Interests in Consolidated Financial Statements—An Amendment of ARB No. 51. SFAS No. 160 establishes new accounting and reporting standards for the noncontrolling interest in a subsidiary and for the deconsolidation of a subsidiary. Specifically, SFAS No. 160 requires the recognition of a noncontrolling interest (formerly referred to as “minority interest”) as equity in the consolidated financial statements and separate from the parent’s equity. The amount of net income attributable to the noncontrolling interest will be identified and included in consolidated net income on the face of the income statement. SFAS No. 160 clarifies that changes in a parent’s ownership interest in a subsidiary that do not result in deconsolidation are equity transactions if the parent retains its controlling financial interest. In addition, this statement requires that a parent recognize a gain or loss in net income when a subsidiary is deconsolidated. This statement also includes expanded disclosure requirements regarding interests of the parent and its noncontrolling interest. SFAS No. 160 is effective for fiscal years beginning on or after December 15, 2008, and earlier adoption is prohibited. The Company has performed an analysis of the impact that the January 1, 2009, adoption of SFAS No. 160 will have on our financial statements, and we do not expect it to have a material effect.
In March 2008, the FASB issued SFAS No. 161,Disclosures about Derivative Instruments and Hedging Activities—an Amendment of FASB Statement 133. SFAS No. 161 expands the disclosure requirements for derivative instruments and hedging activities. The enhanced disclosures required by SFAS No. 161 include how and why an entity uses derivative instruments, how derivative instruments and related hedged items are accounted for under SFAS No. 133 and its related interpretations, and how derivative instruments and related hedged items affect an entity’s financial position, financial performance and cash flows. The guidance in SFAS No. 161 is effective for fiscal years and interim periods beginning after November 15, 2008. The Company will adopt the new standard as of January 1, 2009 and the enhanced disclosures will be reflected in the Company’s first quarter Form 10-Q.
In April 2008, the FASB finalized FASB Staff Position (FSP) FAS No. 142-3,Determination of the Useful Life of Intangible Assets. FSP FAS No. 142-3 amends the factors that should be considered in developing renewal or extension assumptions used to determine the useful life of a recognized intangible asset under SFAS No. 142,Goodwill
| | |
| 64 | | STANCORP FINANCIAL GROUP, INC. |
and Other Intangible Assets. The intent of this FSP is to improve the consistency between the useful life of a recognized asset under SFAS No. 142 and the period of expected cash flows used to measure the fair value of the asset under SFAS No. 141R,Business Combinations, and other U.S. generally accepted accounting principles. In addition, this FSP requires additional disclosures concerning recognized intangible assets. These additional disclosures would enable users of financial statements to assess the extent to which the expected future cash flows associated with the asset are affected by the entity’s intent and/or ability to renew or extend the arrangement. FSP FAS No. 142-3 is effective for fiscal years beginning after December 15, 2008, and interim periods within those years. Earlier adoption is prohibited; therefore, the Company will adopt FSP FAS No. 142-3 as of January 1, 2009. The Company does not expect the adoption to have a material effect on our financial statements.
In May 2008, the FASB issued SFAS No. 162,The Hierarchy of Generally Accepted Accounting Principles. SFAS No. 162 identifies the sources of accounting principles and provides a consistent framework, or hierarchy, for selecting the accounting principles to be used in preparing financial statements that are presented in conformity with U.S. generally accepted accounting principles for nongovernmental entities. The hierarchy of accounting principles within SFAS No. 162 is consistent with that previously defined in the AICPA Statement on Auditing Standards (SAS) No. 69,The Meaning of Present Fairly in Conformity With Generally Accepted Accounting Principles. SFAS No. 162 became effective November 15, 2008. The Company had previously utilized the guidance within SAS No. 69, and, therefore, we do not expect the adoption of SFAS No. 162 to have a material effect on our financial statements.
In December 2008, the FASB issued FSP FAS No. 132(R)-1,Employer’s Disclosures about Postretirement Benefit Plan Assets. This FSP amends FAS No. 132(R),Employers’ Disclosures about Pensions and Other Postretirement Benefits, to provide guidance on an employer’s disclosures about plan assets of a defined benefit pension or postretirement plan. The objectives of the disclosures about plan assets are to provide users of financial statements with an understanding of:
| | • | | How investment allocation decisions are made, including the factors that are pertinent to an understanding of investment policies and strategies. |
| | • | | The major categories of plan assets. |
| | • | | The inputs and valuation techniques used to measure fair value of plan assets. |
| | • | | The effect of fair value measurements using significant unobservable inputs (Level 3) on changes in plan assets for the period. |
| | • | | Significant concentrations of risk within plan assets. |
The disclosures about plan assets required by this FSP shall be provided for fiscal years ending after December 15, 2009. Upon initial adoption, the provisions of this FSP are not required for earlier periods that are presented for comparative purposes. Earlier adoption of FSP FAS No. 132(R)-1 is permitted. The Company is assessing the impact of FSP FAS No. 132(R)-1 and does not currently anticipate early adoption.
2. NET INCOME PER COMMON SHARE
Basic net income per common share was calculated by dividing net income by the weighted-average number of common shares outstanding. Net income per diluted common share, as calculated using the treasury stock method, reflects the potential dilutive effects of restricted stock grants and exercises of dilutive outstanding stock options. The computation of diluted weighted-average earnings per share does not include stock options with an option exercise price greater than the average market price because they are antidilutive and inclusion would increase earnings per share.
Net income per basic and diluted weighted-average common shares outstanding was calculated as follows for the years ended December 31:
| | | | | | | | | |
| | | 2008 | | 2007 | | 2006 |
Net income (In millions) | | $ | 162.9 | | $ | 227.5 | | $ | 203.8 |
Basic weighted-average common shares outstanding | | | 48,917,235 | | | 51,824,050 | | | 54,079,033 |
Stock options | | | 351,022 | | | 496,929 | | | 554,354 |
Restricted stock | | | 23,983 | | | 23,971 | | | 54,727 |
Diluted weighted-average common shares outstanding | | | 49,292,240 | | | 52,344,950 | | | 54,688,114 |
Net income per
common share: | | | | | | | | | |
Net income per basic common share | | $ | 3.33 | | $ | 4.39 | | $ | 3.77 |
Net income per diluted common share | | | 3.30 | | | 4.35 | | | 3.73 |
Antidilutive shares not included in net income per diluted common share calculation | | | 779,775 | | | 348,425 | | | 408,450 |
Part II
3. SEGMENTS
StanCorp operates through two reportable segments: Insurance Services and Asset Management, as well as an Other category, which includes net capital gains and losses, return on capital not allocated to the product segments, holding company expenses, interest on debt, unallocated expenses and adjustments made in consolidation. Resources are allocated and performance is evaluated at the segment level. The Insurance Services segment offers group and individual disability insurance, group life and AD&D insurance, and group dental insurance. The Asset Management segment offers full-service 401(K) plans, 457 plans, defined benefit plans, money purchase pension plans, profit sharing plans, 403(b) plans and non-qualified deferred compensation products and services through an affiliated broker-dealer. This segment also offers investment management and advisory services, financial planning services, commercial mortgage loan origination and servicing, individual fixed annuities, group annuity contracts and retirement plan trust products. In the third quarter of 2007, the Asset Management segment added $1.7 billion of assets under administration acquired from DPA, Inc., a retirement business based in Portland, Oregon.
Administrative fee revenues for the Asset Management segment included fees charged to manage the fixed maturity securities and commercial mortgage loan portfolios for the Company’s insurance subsidiaries. These administrative fees were $12.9 million, $11.9 million and $10.1 million for 2008, 2007 and 2006, respectively.
The following table sets forth premiums, administrative fees and net investment income by major product line or category within each of our segments for the years ended December 31:
| | | | | | | | | | | | |
| (In millions) | | 2008 | | | 2007 | | | 2006 | |
Premiums: | | | | | | | | | | | | |
Insurance Services: | | | | | | | | | | | | |
Group life and AD&D | | $ | 850.3 | | | $ | 807.2 | | | $ | 735.0 | |
Group long term disability | | | 862.9 | | | | 869.8 | | | | 809.9 | |
Group short term disability | | | 215.5 | | | | 219.5 | | | | 211.1 | |
Group dental | | | 75.8 | | | | 70.8 | | | | 72.9 | |
Experience rated refunds | | | (44.6 | ) | | | (37.2 | ) | | | (22.6 | ) |
Total Group insurance | | | 1,959.9 | | | | 1,930.1 | | | | 1,806.3 | |
Individual disability | | | 149.2 | | | | 133.5 | | | | 121.1 | |
Total Insurance Services premiums | | | 2,109.1 | | | | 2,063.6 | | | | 1,927.4 | |
Asset Management: | | | | | | | | | | | | |
Retirement plans | | | 1.6 | | | | 0.8 | | | | 1.3 | |
Individual annuities | | | 29.5 | | | | 13.9 | | | | 6.3 | |
Total Asset Management premiums | | | 31.1 | | | | 14.7 | | | | 7.6 | |
Total premiums | | $ | 2,140.2 | | | $ | 2,078.3 | | | $ | 1,935.0 | |
Administrative fees: | | | | | | | | | | | | |
Insurance Services: | | | | | | | | | | | | |
Group insurance | | $ | 8.9 | | | $ | 8.1 | | | $ | 8.4 | |
Individual insurance | | | 0.3 | | | | 0.3 | | | | 0.3 | |
Total Insurance Services administrative fees | | | 9.2 | | | | 8.4 | | | | 8.7 | |
Asset Management: | | | | | | | | | | | | |
Retirement plans | | | 95.2 | | | | 100.1 | | | | 63.7 | |
Other financial services businesses | | | 23.1 | | | | 18.6 | | | | 14.6 | |
Total Asset Management administrative fees | | | 118.3 | | | | 118.7 | | | | 78.3 | |
Other | | | (12.9 | ) | | | (11.9 | ) | | | (9.9 | ) |
Total administrative fees | | $ | 114.6 | | | $ | 115.2 | | | $ | 77.1 | |
Net investment income: | | | | | | | | | | | | |
Insurance Services: | | | | | | | | | | | | |
Group insurance | | $ | 288.7 | | | $ | 276.9 | | | $ | 265.8 | |
Individual insurance | | | 48.8 | | | | 48.9 | | | | 47.6 | |
Total Insurance Services net investment income | | | 337.5 | | | | 325.8 | | | | 313.4 | |
Asset Management: | | | | | | | | | | | | |
Retirement plans | | | 85.3 | | | | 83.4 | | | | 74.0 | |
Individual annuities | | | 79.9 | | | | 70.0 | | | | 68.5 | |
Other financial services businesses | | | 18.6 | | | | 16.8 | | | | 8.8 | |
Total Asset Management net investment income | | | 183.8 | | | | 170.2 | | | | 151.3 | |
Other | | | 19.7 | | | | 20.3 | | | | 14.2 | |
Total net investment income | | $ | 541.0 | | | $ | 516.3 | | | $ | 478.9 | |
| | |
| 66 | | STANCORP FINANCIAL GROUP, INC. |
The following tables set forth select segment information at or for the years ended December 31:
| | | | | | | | | | | | | | | | |
| (In millions) | | Insurance
Services | | | Asset
Manage- ment | | | Other | | | Total | |
2008: | | | | | | | | | | | | | | | | |
Revenues: | | | | | | | | | | | | | | | | |
Premiums | | $ | 2,109.1 | | | $ | 31.1 | | | $ | — | | | $ | 2,140.2 | |
Administrative fees | | | 9.2 | | | | 118.3 | | | | (12.9 | ) | | | 114.6 | |
Net investment income | | | 337.5 | | | | 183.8 | | | | 19.7 | | | | 541.0 | |
Net capital losses | | | — | | | | — | | | | (128.8 | ) | | | (128.8 | ) |
Total revenues | | | 2,455.8 | | | | 333.2 | | | | (122.0 | ) | | | 2,667.0 | |
Benefits and expenses: | | | | | | | | | | | | | | | | |
Benefits to policyholders | | | 1,549.7 | | | | 39.7 | | | | — | | | | 1,589.4 | |
Interest credited | | | 10.8 | | | | 99.9 | | | | — | | | | 110.7 | |
Operating expenses | | | 338.4 | | | | 131.4 | | | | (0.6 | ) | | | 469.2 | |
Commissions and bonuses | | | 175.8 | | | | 51.8 | | | | — | | | | 227.6 | |
Premium taxes | | | 37.3 | | | | — | | | | — | | | | 37.3 | |
Interest expense | | | — | | | | 0.4 | | | | 38.8 | | | | 39.2 | |
Net increase in deferred acquisition costs, value of business acquired and intangibles | | | (22.6 | ) | | | (24.9 | ) | | | — | | | | (47.5 | ) |
Total benefits and expenses | | | 2,089.4 | | | | 298.3 | | | | 38.2 | | | | 2,425.9 | |
Income (loss) before income taxes | | $ | 366.4 | | | $ | 34.9 | | | $ | (160.2 | ) | | $ | 241.1 | |
Total assets | | $ | 7,300.3 | | | $ | 6,904.9 | | | $ | 350.0 | | | $ | 14,555.2 | |
2007: | | | | | | | | | | | | | | | | |
Revenues: | | | | | | | | | | | | | | | | |
Premiums | | $ | 2,063.6 | | | $ | 14.7 | | | $ | — | | | $ | 2,078.3 | |
Administrative fees | | | 8.4 | | | | 118.7 | | | | (11.9 | ) | | | 115.2 | |
Net investment income | | | 325.8 | | | | 170.2 | | | | 20.3 | | | | 516.3 | |
Net capital losses | | | — | | | | — | | | | (0.6 | ) | | | (0.6 | ) |
Total revenues | | | 2,397.8 | | | | 303.6 | | | | 7.8 | | | | 2,709.2 | |
Benefits and expenses: | | | | | | | | | | | | | | | | |
Benefits to policyholders | | | 1,569.4 | | | | 22.4 | | | | — | | | | 1,591.8 | |
Interest credited | | | 16.1 | | | | 92.7 | | | | — | | | | 108.8 | |
Operating expenses | | | 313.2 | | | | 120.2 | | | | 1.4 | | | | 434.8 | |
Commissions and bonuses | | | 167.5 | | | | 30.5 | | | | — | | | | 198.0 | |
Premium taxes | | | 36.4 | | | | — | | | | — | | | | 36.4 | |
Interest expense | | | — | | | | 0.5 | | | | 30.2 | | | | 30.7 | |
Net increase in deferred acquisition costs, value of business acquired and intangibles | | | (27.4 | ) | | | (5.6 | ) | | | — | | | | (33.0 | ) |
Total benefits and expenses | | | 2,075.2 | | | | 260.7 | | | | 31.6 | | | | 2,367.5 | |
Income (loss) before income taxes | | $ | 322.6 | | | $ | 42.9 | | | $ | (23.8 | ) | | $ | 341.7 | |
Total assets | | $ | 7,232.2 | | | $ | 7,545.8 | | | $ | 204.9 | | | $ | 14,982.9 | |
| | | | | | | | | | | | | | | | |
| | | | |
| (In millions) | | Insurance
Services | | | Asset
Manage- ment | | | Other | | | Total | |
2006: | | | | | | | | | | | | | | | | |
Revenues: | | | | | | | | | | | | | | | | |
Premiums | | $ | 1,927.4 | | | $ | 7.6 | | | $ | — | | | $ | 1,935.0 | |
Administrative fees | | | 8.7 | | | | 78.3 | | | | (9.9 | ) | | | 77.1 | |
Net investment income | | | 313.4 | | | | 151.3 | | | | 14.2 | | | | 478.9 | |
Net capital gains | | | — | | | | — | | | | 1.9 | | | | 1.9 | |
Total revenues | | | 2,249.5 | | | | 237.2 | | | | 6.2 | | | | 2,492.9 | |
Benefits and expenses: | | | | | | | | | | | | | | | | |
Benefits to policyholders | | | 1,497.1 | | | | 16.0 | | | | — | | | | 1,513.1 | |
Interest credited | | | 13.3 | | | | 84.4 | | | | — | | | | 97.7 | |
Operating expenses | | | 291.8 | | | | 78.6 | | | | (0.1 | ) | | | 370.3 | |
Commissions and bonuses | | | 155.5 | | | | 28.1 | | | | — | | | | 183.6 | |
Premium taxes | | | 34.6 | | | | — | | | | — | | | | 34.6 | |
Interest expense | | | — | | | | 0.5 | | | | 17.4 | | | | 17.9 | |
Net increase in deferred acquisition costs, value of business acquired and intangibles | | | (25.2 | ) | | | (8.8 | ) | | | — | | | | (34.0 | ) |
Total benefits and expenses | | | 1,967.1 | | | | 198.8 | | | | 17.3 | | | | 2,183.2 | |
Income (loss) before income taxes | | $ | 282.4 | | | $ | 38.4 | | | $ | (11.1 | ) | | $ | 309.7 | |
Total assets | | $ | 6,882.2 | | | $ | 6,660.8 | | | $ | 95.6 | | | $ | 13,638.6 | |
The accounting policies of the segments are the same as those described in the summary of significant accounting policies.
4. FAIR VALUE OF FINANCIAL INSTRUMENTS
In September 2006, the FASB issued SFAS No. 157, which is intended to increase consistency and comparability in fair value measurements by defining fair value, establishing a framework for measuring fair value and expanding disclosures about fair value measurements. SFAS No. 157 applies to other accounting pronouncements that require or permit fair value measurements. SFAS No. 157 became effective for financial statements issued for fiscal years beginning after November 15, 2007, and interim periods within those fiscal years. StanCorp adopted the provisions of SFAS No. 157 beginning January 1, 2008.
SFAS No. 157 establishes a three-level hierarchy for disclosure of assets and liabilities recorded at fair value. The classification of assets and liabilities within the
Part II
hierarchy is based on whether the inputs to the valuation methodology used for measurement are observable or unobservable. Observable inputs reflect market-derived or market-based information obtained from independent sources while unobservable inputs reflect our estimates about market data.
The fair value hierarchy prioritizes the inputs to valuation techniques used to measure fair value into three broad levels: Level 1 inputs are based upon quoted prices in active markets for identical assets or liabilities that we can access at the measurement date. Level 2 inputs are based upon quoted prices for similar instruments in active markets, quoted prices for identical or similar instruments in markets that are not active, and model-based valuation techniques for which all significant assumptions are observable in the market. Level 3 inputs are generated from model-based techniques that use significant assumptions not observable in the market. These unobservable assumptions reflect the Company’s estimates of assumptions that market participants would use in pricing the asset or liability.
There are three types of valuation techniques described in SFAS No. 157: (1) the market approach, which uses prices or other relevant information generated by market transactions involving identical or comparable assets or liabilities; (2) the income approach, which uses the present value of cash flows or earnings; and (3) the cost approach, which uses replacement costs more readily adaptable for valuing physical assets.
The fair value of each financial instrument in the table below was measured using SFAS No. 157 input guidance and valuation techniques. The following table sets forth carrying amounts and estimated fair values for financial instruments at December 31:
| | | | | | | | | | | | |
| | | 2008 | | 2007 |
| (In millions) | | Fair
Value | | Carrying
Amount | | Fair
Value | | Carrying
Amount |
Investments: | | | | | | | | | | | | |
Investment securities | | $ | 5,197.8 | | $ | 5,197.8 | | $ | 4,991.1 | | $ | 4,991.1 |
S&P 500 index options | | | 2.5 | | | 2.5 | | | 6.0 | | | 6.0 |
Commercial mortgage loans, net | | | 3,989.2 | | | 4,083.6 | | | 3,640.0 | | | 3,657.7 |
Policy Loans | | | 3.4 | | | 3.4 | | | 3.9 | | | 3.9 |
Liabilities | | | | | | | | | | | | |
Total other policyholder funds, investment type contracts | | $ | 3,278.4 | | $ | 3,308.1 | | $ | 2,558.3 | | $ | 2,594.6 |
Index-based interest guarantees | | | 33.0 | | | 33.0 | | | 26.3 | | | 26.3 |
Long-term debt | | | 389.8 | | | 561.5 | | | 563.4 | | | 562.6 |
Financial Instruments Not Recorded at Fair Value
Under FASB Statement No. 159,The Fair Value Option for Financial Assets and Financial Liabilities, the Company did not elect to measure and record commercial mortgage loans, policy loans, other policyholders funds that are investment-type contracts, and long-term debt at fair value on the consolidated balance sheets.
For disclosure purposes, the fair values of commercial mortgage loans were estimated using an option-adjusted discounted cash flow valuation. The valuation includes both observable market inputs and estimated model parameters. Significant observable inputs to the valuation include:
| | • | | Indicative year-end pricing for a package of loans similar to those originated by the Company near year-end. |
| | • | | U.S. Government treasury yields. |
| | • | | Indicative yields from industrial bond issues. |
| | • | | The contractual terms of nearly every mortgage subject to valuation. |
Significant estimated parameters include:
| | • | | A liquidity premium that is estimated from historical loan sales and is applied over and above based yields. |
| | • | | Adjustments in spread based on an aggregate portfolio loan-to-value ratio, estimated from historical differential yields with respect to loan-to-value ratios. |
| | • | | Projected prepayment activity. |
For policy loans, the carrying values represent historical cost but approximate fair values. While potentially financial instruments, policy loans are an integral component of the insurance contract and have no maturity date.
The fair values of other policyholder funds that are investment-type contracts were calculated using the income approach in conjunction with the cost of capital method. The parameters used for discounting in the calculation were estimated using the perspective of the principal market for the contracts under consideration. The principal market consists of other insurance carriers with similar contracts on their books.
The fair value for long-term debt was predominantly based on quoted market prices and was materially affected by depressed values for conventional debt securities as of December 31, 2008. The fair value for the Company’s long-term debt was also materially affected by the infrequent trading of our Subordinated Debt.
| | |
| 68 | | STANCORP FINANCIAL GROUP, INC. |
Financial Instruments Measured and Recorded at Fair Value
Fixed maturity securities—available-for-sale, S&P 500 index options and index-based interest guarantees are recorded at fair value on a recurring basis. The Company currently has no assets or liabilities measured at fair value on a nonrecurring basis. In the Company’s consolidated statements of income and comprehensive income, unrealized gains and losses are reported in other comprehensive income for fixed maturity securities—available-for-sale, in net investment income for S&P 500 index options and in interest credited for index-based interest guarantees.
Fixed maturity securities—available-for-sale and S&P 500 index options are reported on the balance sheet as fixed maturity securities—available-for-sale. The fixed maturity securities are comprised of corporate bonds, as well as government, agency and municipal securities and are diversified across industries, issuers and maturities. They are placed into three groups depending on the valuation technique used to determine the fair value of the securities.
Fair values of fixed maturity securities for which there is active trading are determined based upon quoted market prices and are classified as Level 1 assets. The fair values for fixed maturity securities without an active market, of which there were $5.20 billion at December 31, 2008, were valued using Level 2 measurements. In order to assist management in determining the values of these assets, we utilize an independent pricing service. The pricing service incorporates a variety of market observable information in their valuation techniques, including:
| | • | | Reported trading prices. |
| | • | | Relative credit information. |
The pricing service also takes into account perceived market movements and sector news, as well as the bond’s terms and conditions, including any features specific to that issue which may influence risk, and thus marketability. Depending on the security, the priority of the use of observable market inputs may change as some observable market inputs may not be relevant or additional inputs may be necessary. The Company generally obtains one value from our primary external pricing service. On a
case-by-case basis, the Company may obtain further quotes or prices from additional parties as needed.
The pricing service provides quoted market prices when available. Quoted prices are not always available due to bond market inactivity. The pricing service obtains a broker quote when sufficient information, such as security structure or other market information, is not available to produce an evaluation. Valuations and quotes obtained from third party commercial pricing services are non-binding and do not represent quotes on which one may execute the disposition of the assets.
External valuations are validated by the Company at least quarterly through the evaluation of methodologies used by the pricing service, analytical reviews and performance analysis of the prices against statistics and trends, back testing of sales activity, discounted cash flow models, maintenance of a securities watch list, and independent evaluation on a case-by-case basis of inputs and assumptions similar to those used by the pricing service. Although we do identify differences from time to time as a result of these validation procedures, we did not make any significant adjustments as of December 31, 2008.
The Company recorded other-than-temporary impairments of our fixed maturity securities of $104.9 million during 2008, primarily due to a decline in the market value in the deteriorating economic environment. Impairments in the fourth quarter of 2008 were the result of other-than-temporary impairments in the fixed maturity securities of various economic sectors. In the third quarter of 2008, we recorded capital losses that were the result of other-than-temporary impairments of fixed maturity security holdings of certain financial institutions including Lehman Brothers, AIG, and Washington Mutual. Net capital losses also resulted from the sale of holdings in several regional banks in the third quarter of 2008 and the other-than-temporary impairments of debt security holdings of certain bond insurers in the second quarter of 2008.
S&P 500 index options were valued using the market approach and Level 3 measurement. The valuations for the Company’s S&P 500 index options are provided to us as non-binding courtesy indications of value by the banking counterparties that have written each option. The valuations are estimates of the mid-market values of the positions, based on proprietary valuation models that use information derived from estimated or actual bids and offers for similar positions. In addition, the Company produces its own valuations based on its derivations of
Part II
Black-Scholes pricing parameters. The Company’s valuations maximize the use of observable inputs, which include direct price quotes from the Chicago Board Options Exchange and values for on-the-run treasury securities and LIBOR rates as reported by Bloomberg. Where observable inputs are not available, we use unobservable inputs such as estimates of future gross dividends to be paid on the stocks underlying the S&P 500 index, estimates of bid-ask spreads, and estimates of implied volatilities on options. In order to assure that the Company’s valuations are consistent with SFAS No. 157, we perform additional validation procedures such as the daily observation of market activity and conditions and the tracking and analyzing of actual quotes provided to us by banking counterparties each time the Company purchases options from them. At December 31, 2008, the Company utilized valuations of the S&P 500 index options that were provided by the banking counterparties.
The valuation technique used to determine the fair value of index-based interest guarantees is the income approach. The liability is the present value of future cash flows attributable to the projected index growth in excess of cash flows driven by fixed interest rate guarantees for the indexed annuity product. Level 3 assumptions for policyholder behavior and future index interest rate declarations significantly impact the calculation.
The following table sets forth the estimated fair values of assets and liabilities measured and recorded at fair value on a recurring basis at December 31, 2008:
| | | | | | | | | | | | |
| (In millions) | | Total | | Level 1 | | Level 2 | | Level 3 |
Assets: | | | | | | | | | | | | |
Fixed maturity securities—available-for-sale | | $ | 5,197.8 | | $ | — | | $ | 5,197.8 | | $ | — |
S&P 500 index options | | | 2.5 | | | — | | | — | | | 2.5 |
Total fixed maturity securities—available-for-sale | | $ | 5,200.3 | | $ | — | | $ | 5,197.8 | | $ | 2.5 |
Liabilities: | | | | | | | | | | | | |
Index-based interest guarantees | | $ | 33.0 | | $ | — | | $ | — | | $ | 33.0 |
The following table sets forth the changes in Level 3 assets and liabilities measured at fair value on a recurring basis for the year ended December 31, 2008:
| | | | | | | | |
| (In millions) | | S&P 500 Index
Options | | | Index-Based
Interest
Guarantees | |
Balance, January 1, 2008 | | $ | 6.0 | | | $ | (26.3 | ) |
Total net gains (losses) included in: | | | | | | | | |
Net investment income | | | (11.1 | ) | | | — | |
Interest credited | | | — | | | | 9.2 | |
Purchases, sales, issuances and settlements, net | | | 7.6 | | | | (15.9 | ) |
Balance, December 31, 2008 | | | 2.5 | | | | (33.0 | ) |
Net unrealized gains (losses) included in income before income taxes for assets and liabilities held at fair value at December 31, 2008 | | $ | (11.1 | ) | | $ | 9.2 | |
Changes to the fair value of fixed maturity securities were recorded to other comprehensive income. Changes to the fair value of the S&P 500 index options were recorded to net investment income. Changes in the fair value of the index-based interest guarantees were recorded as interest credited.
Certain assets and liabilities are measured at fair value on a nonrecurring basis after initial recognition such as loans measured for impairment. The following table sets forth the fair value measurement for nonrecurring assets at December 31, 2008:
| | | | | | | | | | | | |
| (In millions) | | Total | | Level 1 | | Level 2 | | Level 3 |
Commercial mortgage loans measured for impairment | | $ | 1.7 | | $ | — | | $ | — | | $ | 1.7 |
Total nonrecurring assets measured at fair value | | $ | 1.7 | | $ | — | | $ | — | | $ | 1.7 |
For further discussion, see “—Note 6—Commercial Mortgage Loans, Net.”
| | |
| 70 | | STANCORP FINANCIAL GROUP, INC. |
5. INVESTMENT SECURITIES
The following table sets forth adjusted carrying value and estimated fair values of investment securities available-for-sale at December 31:
| | | | | | | | | | | | |
| | | 2008 |
| | | Adjusted
Carrying
Value | | Unrealized
| | Estimated
Fair Value |
| (In millions) | | | Gains | | Losses | |
Available-for-sale: | | | | | | | | | | | | |
U.S. government and agency bonds | | $ | 457.6 | | $ | 58.0 | | $ | 0.1 | | $ | 515.5 |
Bonds of states and political subdivisions of the U.S. | | | 177.3 | | | 9.9 | | | 2.4 | | | 184.8 |
Foreign government bonds | | | 13.0 | | | 1.2 | | | — | | | 14.2 |
Corporate bonds | | | 4,674.2 | | | 67.8 | | | 256.2 | | | 4,485.8 |
Total investment securities | | $ | 5,322.1 | | $ | 136.9 | | $ | 258.7 | | $ | 5,200.3 |
| |
| | | 2007 |
| | | Adjusted
Carrying
Value | | Unrealized
| | Estimated
Fair Value |
| (In millions) | | | Gains | | Losses | |
Available-for-sale: | | | | | | | | | | | | |
U.S. government and agency bonds | | $ | 417.4 | | $ | 24.9 | | $ | 0.1 | | $ | 442.2 |
Bonds of states and political subdivisions of the U.S. | | | 151.2 | | | 5.0 | | | 0.7 | | | 155.5 |
Foreign government bonds | | | 22.2 | | | 0.5 | | | — | | | 22.7 |
Corporate bonds | | | 4,342.9 | | | 85.4 | | | 51.6 | | | 4,376.7 |
Total investment securities | | $ | 4,933.7 | | $ | 115.8 | | $ | 52.4 | | $ | 4,997.1 |
The following table sets forth the contractual maturities of investment securities available-for-sale at December 31:
| | | | | | | | | | | | |
| | | 2008 | | 2007 |
| (In millions) | | Adjusted
Carrying
Value | | Estimated
Fair Value | | Amortized
Cost | | Estimated
Fair Value |
Available-for-sale: | | | | | | | | | | | | |
Due in 1 year or less | | $ | 503.2 | | $ | 502.4 | | $ | 412.3 | | $ | 412.8 |
Due in 1 to 5 years | | | 2,386.1 | | | 2,309.8 | | | 2,129.3 | | | 2,157.5 |
Due in 5 to 10 years | | | 1,571.5 | | | 1,515.0 | | | 1,419.6 | | | 1,423.2 |
Due after 10 years | | | 861.3 | | | 873.1 | | | 972.5 | | | 1,003.6 |
Total investment securities | | $ | 5,322.1 | | $ | 5,200.3 | | $ | 4,933.7 | | $ | 4,997.1 |
Actual maturities may differ from contractual maturities because borrowers may have the right to call or prepay obligations. Callable bonds represented 2.43%, or $126.2 million, of our investment securities at December 31, 2008.
The following table sets forth net investment income summarized by type of investment for the years ended December 31:
| | | | | | | | | | | | |
| (In millions) | | 2008 | | | 2007 | | | 2006 | |
Investment securities available-for-sale | | $ | 291.0 | | | $ | 274.7 | | | $ | 263.0 | |
Commercial mortgage loans | | | 261.6 | | | | 240.9 | | | | 217.0 | |
Real estate | | | 5.8 | | | | 7.5 | | | | 5.3 | |
Policy loans | | | 0.2 | | | | 0.2 | | | | 0.3 | |
Other | | | — | | | | 8.6 | | | | 8.1 | |
Gross investment income | | | 558.6 | | | | 531.9 | | | | 493.7 | |
Investment expenses | | | (17.6 | ) | | | (15.6 | ) | | | (14.8 | ) |
Net investment income | | $ | 541.0 | | | $ | 516.3 | | | $ | 478.9 | |
The following table sets forth capital gains (losses) for the years ended December 31:
| | | | | | | | | | | | |
| (In millions) | | 2008 | | | 2007 | | | 2006 | |
Gains: | | | | | | | | | | | | |
Investment securities available-for-sale | | $ | 3.9 | | | $ | 5.0 | | | $ | 4.6 | |
Commercial mortgage loans(1) | | | 3.3 | | | | 2.5 | | | | 1.4 | |
Real estate | | | 2.7 | | | | 0.1 | | | | 4.0 | |
Gross capital gains | | | 9.9 | | | | 7.6 | | | | 10.0 | |
Losses: | | | | | | | | | | | | |
Investment securities available-for-sale | | | (133.0 | ) | | | (4.6 | ) | | | (2.9 | ) |
Capitalized software | | | — | | | | — | | | | (0.5 | ) |
Commercial mortgage loans(1) | | | (5.2 | ) | | | (1.9 | ) | | | — | |
Real estate | | | (0.5 | ) | | | (1.7 | ) | | | (4.7 | ) |
Gross capital losses | | | (138.7 | ) | | | (8.2 | ) | | | (8.1 | ) |
Net capital gains (losses) | | $ | (128.8 | ) | | $ | (0.6 | ) | | $ | 1.9 | |
| | (1) | | Includes increases to the loan valuation allowance of $3.8 million and $0.6 million for 2008 and 2007, respectively, and a decrease to the loan loss allowance of $0.1 million in 2006. |
Securities deposited for the benefit of policyholders in various states, in accordance with state regulations, amounted to $7.0 million and $6.4 million at December 31, 2008 and 2007, respectively.
Part II
The following table sets forth our investments’ gross unrealized losses and fair value, aggregated by investment category and length of time that individual securities have been in a continuous unrealized loss position, at December 31, 2008. The Company expects the fair value of these investment securities to recover as the investment securities approach their maturity dates or sooner if market yields for such investment securities decline. The Company reviews the fixed maturity securities portfolio at least quarterly and, given the increase in issuer credit quality concerns and the movement in credit spreads and general interest rates, has recorded other-than-temporary impairments when appropriate. Based on management’s evaluation and intent, none of the unrealized losses summarized in this table are considered other-than-temporary. In comparing December 31, 2008, to December 31, 2007, the significant increase in the number and amount of securities with an unrealized loss position was primarily due to an overall economic decline in the securities markets that affected multiple economic sectors.
| | | | | | | | | | | | | | | |
| | | | | | | Aging |
| | | At December 31, 2008 | | Less than 12 months | | 12 or More Months |
| (Dollars in millions) | | Number | | Amount | | Number | | Amount | | Number | | Amount |
Unrealized losses: | | | | | | | | | | | | | | | |
Bonds: | | | | | | | | | | | | | | | |
U.S. government and agency | | 4 | | $ | 0.1 | | 4 | | $ | 0.1 | | — | | $ | — |
State and political subdivisions of the U.S. | | 71 | | | 2.4 | | 57 | | | 1.7 | | 14 | | | 0.7 |
Corporate | | 3,047 | | | 256.2 | | 2,572 | | | 185.3 | | 475 | | | 70.9 |
| | | 3,122 | | $ | 258.7 | | 2,633 | | $ | 187.1 | | 489 | | $ | 71.6 |
Fair market value of securities with unrealized losses: | | | | | | | | | | | | | | | |
Bonds: | | | | | | | | | | | | | | | |
U.S. government and agency | | 4 | | $ | 6.4 | | 4 | | $ | 6.4 | | — | | $ | — |
State and political subdivisions of the U.S. | | 71 | | | 42.0 | | 57 | | | 34.4 | | 14 | | | 7.6 |
Corporate | | 3,047 | | | 2,732.9 | | 2,572 | | | 2,332.9 | | 475 | | | 400.0 |
| | | 3,122 | | $ | 2,781.3 | | 2,633 | | $ | 2,373.7 | | 489 | | $ | 407.6 |
The following table sets forth our investments’ gross unrealized losses and fair value, aggregated by investment category and length of time that individual securities have been in a continuous unrealized loss position, at December 31, 2007:
| | | | | | | | | | | | | | | |
| | | | | | | Aging |
| | | At December 31, 2007 | | Less than 12 months | | 12 or More Months |
| (Dollars in millions) | | Number | | Amount | | Number | | Amount | | Number | | Amount |
Unrealized losses: | | | | | | | | | | | | | | | |
Bonds: | | | | | | | | | | | | | | | |
U.S. government and agency | | 9 | | $ | 0.1 | | 1 | | $ | — | | 8 | | $ | 0.1 |
State and political subdivisions of the U.S. | | 35 | | | 0.7 | | 13 | | | 0.1 | | 22 | | | 0.6 |
Corporate | | 1,799 | | | 51.6 | | 1,121 | | | 24.3 | | 678 | | | 27.3 |
| | | 1,843 | | $ | 52.4 | | 1,135 | | $ | 24.4 | | 708 | | $ | 28.0 |
Fair market value of securities with unrealized losses: | | | | | | | | | | | | | | | |
Bonds: | | | | | | | | | | | | | | | |
U.S. government and agency | | 9 | | $ | 13.6 | | 1 | | $ | 0.2 | | 8 | | $ | 13.4 |
State and political subdivisions of the U.S. | | 35 | | | 42.4 | | 13 | | | 18.5 | | 22 | | | 23.9 |
Corporate | | 1,799 | | | 1,624.1 | | 1,121 | | | 676.2 | | 678 | | | 947.9 |
| | | 1,843 | | $ | 1,680.1 | | 1,135 | | $ | 694.9 | | 708 | | $ | 985.2 |
| | |
| 72 | | STANCORP FINANCIAL GROUP, INC. |
6. COMMERCIAL MORTGAGE LOANS, NET
The Company underwrites mortgage loans on commercial property and in addition to real estate collateral, requires either partial or full recourse on most loans. The following table sets forth the geographic concentration of commercial mortgage loans at December 31:
| | | | | | | | | | | | |
| | | 2008 | | | 2007 | |
| (In millions) | | Amount | | Percent | | | Amount | | Percent | |
California | | $ | 1,130.6 | | 27.7 | % | | $ | 1,096.2 | | 30.0 | % |
Texas | | | 410.0 | | 10.0 | | | | 365.7 | | 10.0 | |
Florida | | | 244.3 | | 6.0 | | | | 190.5 | | 5.2 | |
Georgia | | | 224.8 | | 5.5 | | | | 183.3 | | 5.0 | |
Other | | | 2,073.9 | | 50.8 | | | | 1,822.0 | | 49.8 | |
Total commercial mortgage loans | | $ | 4,083.6 | | 100.0 | % | | $ | 3,657.7 | | 100.0 | % |
Although the Company underwrites commercial mortgage loans throughout the United States, commercial mortgage loans in California represent a concentration of credit risk at 27.7% and 30.0% of our commercial mortgage loan portfolio at December 31, 2008 and 2007, respectively. Through this concentration in California, we are exposed to potential losses from an economic downturn in California as well as to certain catastrophes, such as earthquakes and fires, which may affect certain areas of the state. We diversify our commercial mortgage loan portfolio within California by both location and type of property in an effort to reduce certain catastrophe and economic exposure. However, diversification may not always eliminate the risk of such losses. We require borrowers to maintain fire insurance coverage to provide reimbursement for any losses due to fire. Historically, the delinquency rate of our California-based commercial mortgage loans has been substantially below the industry average and consistent with our experience in other states. In addition, when new loans are underwritten, we do not require earthquake insurance for properties on which we make commercial mortgage loans but do consider the potential for earthquake loss based upon seismic surveys and structural information specific to each property.
The following table sets forth the amount of commercial mortgage loans on the consolidated balance sheet at December 31, 2008, segregated by origination year.
| | | | | | |
| (Dollars in millions) | | Amount | | Percent | |
Prior to 2001 | | $ | 129.6 | | 3 | % |
2001 | | | 95.5 | | 2 | |
2002 | | | 264.5 | | 7 | |
2003 | | | 449.8 | | 11 | |
2004 | | | 684.1 | | 17 | |
2005 | | | 528.1 | | 13 | |
2006 | | | 545.0 | | 13 | |
2007 | | | 677.0 | | 17 | |
2008 | | | 710.0 | | 17 | |
Total | | $ | 4,083.6 | | 100.0 | % |
The commercial mortgage loan valuation allowance is estimated based on evaluating known and inherent risks in the loan portfolio. The allowance is based on our analysis of factors including changes in the size and composition of the loan portfolio, actual loan loss experience and individual loan analysis. A loan is considered impaired when it is probable that the Company will be unable to collect all amounts due according to the contractual terms of the loan agreement. Loans that are deemed uncollectible are generally written off against the allowance, and recoveries, if any, are credited to the allowance.
Commercial mortgage loans foreclosed were $6.8 million and $0.5 million for 2008 and 2007, respectively. Assets transferred to real estate were $6.2 million and $0.5 million for 2008 and 2007, respectively, after charges against the reserve. At December 31, 2008 and 2007, we had commercial mortgage loans totaling $7.8 million and $1.9 million, respectively, that were more than sixty days delinquent and of these amounts, $3.9 million and $0.7 million, respectively, were in the process of foreclosure.
The following table sets forth commercial mortgage loan valuation and allowance provisions at December 31:
| | | | | | | | | | | | |
| (In millions) | | 2008 | | | 2007 | | | 2006 | |
Balance at beginning of the year | | $ | 3.0 | | | $ | 2.4 | | | $ | 2.5 | |
Provisions (recapture) | | | 5.1 | | | | 1.8 | | | | 0.4 | |
Charge offs | | | (1.3 | ) | | | (1.2 | ) | | | (0.5 | ) |
Balance at end of the year | | $ | 6.8 | | | $ | 3.0 | | | $ | 2.4 | |
The mortgage loan valuation allowance was $6.8 million in 2008 and $3.0 million in 2007. The increase in the mortgage loan valuation allowance in 2008 was primarily due to increased delinquencies, requests for forbearance and loans in the process of foreclosure in our mortgage loan portfolio.
Part II
The following table sets forth non-performing commercial mortgage loans identified in management’s specific review of probable loan losses and the related allowance at December 31, are as follows:
| | | | | | |
| (In millions) | | 2008 | | 2007 |
Non-performing commercial mortgages with allowance for losses | | $ | 2.4 | | $ | 0.7 |
Non-performing commercial mortgages with no allowance for losses | | | — | | | — |
Allowance for losses on non-performing commercial mortgages, end of year | | | 0.7 | | | 0.2 |
| | | | | | | |
Net carrying value of non-performing commercial mortgages | | $ | 1.7 | | $ | 0.5 |
There were no non-performing commercial mortgage loans with no allowance for losses for the years 2008, 2007 and 2006. Non-performing commercial mortgage loans with no allowance for losses are those for which we have determined that it remains probable that the Company will collect all amounts due. The average recorded investment in non-performing mortgages before allowance for losses was $3.2 million, $2.2 million and $2.1 million for 2008, 2007 and 2006, respectively. Net investment income recognized on these non-performing mortgages was $0.1 million, $0.1 million and less than $0.1 million for the 2008, 2007 and 2006, respectively. The Company continues to recognize interest income on delinquent loans until the loans are more than 90 days delinquent.
7. DERIVATIVE FINANCIAL INSTRUMENTS
The Company markets indexed annuities, which permit the holder to elect an interest rate return or an indexed return, where interest credited to the contracts is based on the performance of the S&P 500 index, subject to an upper limit or cap. Policyholders may elect to rebalance between interest crediting options at renewal dates annually. At each renewal date, the Company has the opportunity to re-price the indexed component by changing the cap, subject to minimum guarantees. SFAS No. 133,Accounting for Derivative Instruments and Hedging Activities, requires that the Company estimate the fair value of the index-based interest rate guarantees for the current period and for all future reset periods until contract maturity. Changes in the fair value of the index-based interest guarantees are recorded as interest credited and represent an estimate of the cost of the options to be purchased in the future to hedge the guarantees, discounted back to the date of the balance sheet using current market indicators for future interest rates, option costs and actuarial estimates for policyholder lapse behavior. The interest credited to
policyholders relating to the change in the fair value of the index-based interest guarantees decreased $9.2 million for 2008, compared to an increase of $1.6 million for 2007. The decrease for 2008 was primarily due to the decline, on average, of the S&P 500 Index during 2008 compared to 2007.
The Company purchases S&P 500 Index options in conjunction with its sales of indexed annuities. SFAS No. 133 requires companies to recognize all derivative investments as assets in the balance sheet at fair value. These investments are highly correlated to the portfolio allocation decisions of its policyholders, such that the Company is economically hedged with respect to index-based interest rate guarantees for the current reset period. However, the Company does not use hedge accounting. The fair value of the Company’s derivative instruments of $2.5 million and $6.0 million at December 31, 2008 and 2007, respectively, was included in fixed maturity securities in the consolidated balance sheets. The change in fair value associated with these investments was a decrease of $11.1 million for 2008, compared to a decrease of $1.0 million for 2007. The change in fair value was recorded as net investment income.
| | |
| 74 | | STANCORP FINANCIAL GROUP, INC. |
8. LIABILITY FOR UNPAID CLAIMS, CLAIMS ADJUSTMENT EXPENSES AND OTHER POLICYHOLDER FUNDS
The liability for unpaid claims, claims adjustment expenses and other policyholder funds includes liabilities for insurance offered on products such as group long term and short term disability, individual disability, group dental and group AD&D. The liability for unpaid claims and claim adjustment expenses is established when a claim is incurred or is estimated to have been incurred but not yet reported to us and, as prescribed by GAAP, equals our best estimate of the present value of the liability of future unpaid claims and claim adjustment expenses. This liability is included in future policy benefits and claims in the consolidated balance sheets. The following table sets forth the change in the liabilities for unpaid claims and claim adjustment expenses for the years ended December 31:
| | | | | | | | | | | | |
| (In millions) | | 2008 | | | 2007 | | | 2006 | |
Balance at beginning of the year,
gross of reinsurance | | $ | 3,514.4 | | | $ | 3,350.5 | | | $ | 3,185.1 | |
Less: reinsurance recoverable
and other | | | (103.1 | ) | | | (98.0 | ) | | | (91.2 | ) |
Net balance at beginning
of the year | | | 3,411.3 | | | | 3,252.5 | | | | 3,093.9 | |
Incurred related to: | | | | | | | | | | | | |
Current year | | | 1,028.1 | | | | 1,032.4 | | | | 995.9 | |
Prior year’s interest | | | 172.0 | | | | 191.1 | | | | 183.0 | |
Prior years | | | (142.8 | ) | | | (115.4 | ) | | | (115.9 | ) |
Total incurred | | | 1,057.3 | | | | 1,108.1 | | | | 1,063.0 | |
Paid related to: | | | | | | | | | | | | |
Current year | | | (307.4 | ) | | | (301.2 | ) | | | (288.9 | ) |
Prior year | | | (666.4 | ) | | | (648.1 | ) | | | (615.5 | ) |
Total paid | | | (973.8 | ) | | | (949.3 | ) | | | (904.4 | ) |
Net balance at end of the year
and other | | | 3,494.8 | | | | 3,411.3 | | | | 3,252.5 | |
Plus: reinsurance recoverable | | | 114.9 | | | | 103.1 | | | | 98.0 | |
Balance at end of the year,
gross of reinsurance | | $ | 3,609.7 | | | $ | 3,514.4 | | | $ | 3,350.5 | |
Classified as future policyholder benefits and claims, but excluded from the table above are amounts recorded for group and individual life reserves, group and individual annuity reserves, and individual disability active life reserves. Below is a table that reconciles amounts above to future policyholder benefits and claims as presented on the consolidated balance sheet:
| | | | | | | | | | | | |
| (In millions) | | 2008 | | | 2007 | | | 2006 | |
Future policyholder benefits | | $ | 5,285.9 | | | $ | 5,158.7 | | | $ | 4,927.6 | |
Less: Individual life reserves | | | (595.5 | ) | | | (600.8 | ) | | | (595.7 | ) |
Less: Group life reserves | | | (739.9 | ) | | | (735.6 | ) | | | (688.9 | ) |
Less: Group and Individual annuity reserves | | | (162.1 | ) | | | (141.8 | ) | | | (136.9 | ) |
Less: Individual disability active life reserves | | | (178.7 | ) | | | (166.1 | ) | | | (155.6 | ) |
| | | | | | | | | | | | | |
Liability for unpaid claims and claims adjustment expenses | | $ | 3,609.7 | | | $ | 3,514.4 | | | $ | 3,350.5 | |
The majority of the net liability balances are related to long term disability claims on which interest earned on assets backing the reserves is a key component of reserving and pricing. The year-to-year development of incurred claims related to prior years is therefore broken out into an interest portion and remaining incurred portion.
The changes in amounts incurred related to prior years for the years 2008, 2007, and 2006 are not the result of a significant change in an underlying assumption or method used to determine the estimate. Instead we expect these amounts to change over time as a result of the growth in the size of our in force insurance business and the actual claims experience with respect to that business during the time periods captured for claims with an incurral date in years prior to the year of valuation. Interest is also a key component in the year-to-year development of the reserves and therefore the positive changes in amounts incurred related to prior years for the years 2008, 2007 and 2006 should not be taken as an indicator of the adequacy or inadequacy of the reserves held. In each of the years captured there was a decrease in incurred amounts associated with prior years after the effect of interest is taken into account, indicating claim experience was favorable when compared to the assumptions used to establish the associated reserves.
Other policyholder funds at December 31, 2008, 2007 and 2006, included $1.42 billion, $1.40 billion and $1.29 billion, respectively, of employer-sponsored defined contribution and benefit plans funds, and $1.53 billion, $892.3 million and $988.3 million, respectively, of individual fixed annuity funds.
Part II
9. LONG-TERM DEBT
The following table sets forth the Company’s long-term debt at December 31:
| | | | | | |
| (In millions) | | 2008 | | 2007 |
Long-term debt: | | | | | | |
Senior notes | | $ | 250.0 | | $ | 250.0 |
Subordinated debt | | | 300.0 | | | 300.0 |
Other long-term borrowings | | | 11.5 | | | 12.6 |
Total long-term debt | | $ | 561.5 | | $ | 562.6 |
On September 25, 2002, we completed an initial public debt offering of $250 million of 6.875%, 10-year senior notes (“Senior Notes”), pursuant to the shelf registration statement. The principal amount of the Senior Notes is payable at maturity, and interest is payable semi-annually in April and October.
On May 29, 2007, the Company completed a public debt offering of $300 million of 6.90%, junior subordinated debentures (“Subordinated Debt”). The Subordinated Debt has a final maturity on June 1, 2067, is non-callable at par for the first 10 years and is subject to a replacement capital covenant. The covenant limits replacement of the Subordinated Debt for the first 40 years to be redeemable after year 10 and only with securities that carry equity-like characteristics that are the same as or more equity-like than the Subordinated Debt. The principal amount of the Subordinated Debt is payable at final maturity. Interest is payable semi-annually at 6.90% in June and December for the first 10 years and quarterly thereafter at a floating rate equal to three-month LIBOR plus 2.51%. StanCorp has the option to defer interest payments for up to five years. StanCorp is currently not deferring interest on the subordinated debt.
10. INCOME TAXES
The provision for income taxes was as follows for the years ended December 31:
| | | | | | | | | |
| (In millions) | | 2008 | | 2007 | | 2006 |
Current | | $ | 76.4 | | $ | 113.5 | | $ | 103.6 |
Deferred | | | 1.8 | | | 0.7 | | | 2.3 |
Total income taxes | | $ | 78.2 | | $ | 114.2 | | $ | 105.9 |
The difference between taxes calculated as if the federal corporate tax rate of 35% was applied to income before income taxes and the recorded tax expense is reconciled as follows:
| | | | | | | | | | | | |
| (In millions) | | 2008 | | | 2007 | | | 2006 | |
Tax at federal corporate rate of 35% | | $ | 84.4 | | | $ | 119.6 | | | $ | 108.4 | |
Increase (decrease) in rate resulting from: | | | | | | | | | | | | |
Tax exempt interest | | | (0.3 | ) | | | (0.4 | ) | | | (0.4 | ) |
Dividends received deduction | | | (3.0 | ) | | | (3.7 | ) | | | (2.6 | ) |
State income taxes, net of federal benefit | | | 1.1 | | | | 2.0 | | | | 3.0 | |
Federal tax credits | | | (2.9 | ) | | | (2.7 | ) | | | (3.0 | ) |
Valuation allowance | | | 1.0 | | | | — | | | | (0.9 | ) |
Other | | | (2.1 | ) | | | (0.6 | ) | | | 1.4 | |
Total income taxes | | $ | 78.2 | | | $ | 114.2 | | | $ | 105.9 | |
The tax effect of temporary differences that gave rise to significant portions of the net deferred tax asset (liability) was as follows at December 31:
| | | | | | | | | | | | |
| (In millions) | | 2008 | | | 2007 | | | 2006 | |
Policyholder liabilities | | $ | 10.1 | | | $ | 14.5 | | | $ | 17.1 | |
Net unrealized capital losses | | | 46.5 | | | | — | | | | — | |
Deferred gain on disposal of block of business | | | 1.0 | | | | 1.1 | | | | 1.3 | |
Retirement plans for employees | | | 3.0 | | | | 8.6 | | | | 3.5 | |
Loss carryforwards | | | 31.4 | | | | 25.4 | | | | 26.4 | |
Application of SFAS No. 158 | | | 36.3 | | | | 13.2 | | | | 13.2 | |
Investments | | | 28.1 | | | | 9.2 | | | | — | |
Other | | | 5.3 | | | | 2.8 | | | | 3.1 | |
Total deferred tax assets | | | 161.7 | | | | 74.8 | | | | 64.6 | |
Less: Valuation allowance | | | (2.5 | ) | | | — | | | | — | |
Net deferred tax assets | | | 159.2 | | | | 74.8 | | | | 64.6 | |
Investments | | | — | | | | — | | | | 0.5 | |
Net unrealized capital gains | | | — | | | | 22.2 | | | | 9.8 | |
Capitalized software | | | 17.2 | | | | 11.9 | | | | 6.9 | |
Deferred policy acquisition costs | | | 57.5 | | | | 45.6 | | | | 57.4 | |
Intangible | | | 7.1 | | | | 8.1 | | | | 9.4 | |
Other | | | 2.3 | | | | 2.6 | | | | 3.5 | |
Total deferred tax liabilities | | | 84.1 | | | | 90.4 | | | | 87.5 | |
Net deferred tax asset (liability) | | $ | 75.1 | | | $ | (15.6 | ) | | $ | (22.9 | ) |
The Company is carrying forward net operating losses of $31.9 million that originated in StanCorp and certain subsidiaries. The losses will be used in future years to offset taxable income from those entities to the degree allowed by the Internal Revenue Code. If unutilized, these losses would expire between the years 2023 to 2028. In addition, the Company is carrying forward a $55.4 million federal net operating loss from the acquisition of Invesmart. This carryforward is subject to limitations under IRS Section 382, which potentially reduces the annual amount that may be utilized. This carryforward will expire between 2019 and 2024. In addition, as a result of the Invesmart
| | |
| 76 | | STANCORP FINANCIAL GROUP, INC. |
acquisition, the Company has approximately $1.7 million (tax effected) of various state net operating loss carryforwards that expire at various dates through 2028.
Upon adoption of FASB Interpretation No. 48,Accounting for Uncertainty in Income Taxes, on January 1, 2007, and throughout 2007 and 2008, the Company did not have any material unrecognized tax benefits. It is the Company’s accounting policy to record income tax interest and penalties in the income tax provision. See “Note 1—Summary of Significant Accounting Policies—Income Taxes.”
11. PENSION BENEFITS
The Company has two non-contributory defined benefit pension plans: the employee pension plan and the agent pension plan. The employee pension plan is for all eligible employees of StanCorp and its subsidiaries and was frozen effective January 2003 for new participants. The agent pension plan, which is frozen for new participants, is for former field employees and agents. Both plans are sponsored and administered by Standard. The defined benefit pension plans provide benefits based on years of service and final average pay.
On September 10, 2008, the Compensation and Organization Committee of the board of directors of StanCorp approved an amendment to the employee pension plan that also had the effect of modifying the terms of the non-qualified supplemental retirement plan (“non-qualified plan”), which covers eligible executive officers. The amendment will become effective January 1, 2009. Under the employee pension plan and the non-qualified plan, a participant is entitled to a normal retirement benefit once the participant reaches age 65. Prior to the amendment, a participant could also receive a normal, unreduced retirement benefit once the participant reached age 60 and the sum of his or her age plus years of service was at least 90. The amendment eliminates the requirement that a participant reach age 60 in order to receive an unreduced early retirement benefit, thereby making a participant eligible for this unreduced benefit once the sum of his or her age plus years of service is at least 90.
Effective December 31, 2006, Standard adopted SFAS No. 158. SFAS No. 158 requires the Company to recognize the funded or underfunded status of our pension benefit plans as an asset or liability on the balance sheet. This is measured as the difference between the plan assets at fair value and the projected benefit obligation as of the
year-end balance sheet date. At December 31, 2008, a liability of $41.0 million was reflected on the balance sheet.
The following table provides a reconciliation of the changes in the pension plans’ projected benefit obligations, fair value of assets and the funded status at December 31:
| | | | | | | | | | | | |
| (In millions) | | 2008 | | | 2007 | | | 2006 | |
Change in benefit obligation: | | | | | | | | | | | | |
Projected benefit obligation at beginning of the year | | $ | (238.6 | ) | | $ | (225.8 | ) | | $ | (204.1 | ) |
Service cost | | | (8.9 | ) | | | (9.3 | ) | | | (8.0 | ) |
Interest cost | | | (14.4 | ) | | | (13.2 | ) | | | (12.4 | ) |
Plan amendments | | | (8.7 | ) | | | — | | | | — | |
Actuarial gain (loss) | | | (5.1 | ) | | | 4.9 | | | | (5.6 | ) |
Benefits paid | | | 5.4 | | | | 4.8 | | | | 4.3 | |
Projected benefit obligation at
end of the year | | | (270.3 | ) | | | (238.6 | ) | | | (225.8 | ) |
Change in plan assets: | | | | | | | | | | | | |
Fair value of plan assets at beginning
of the year | | | 240.0 | | | | 227.5 | | | | 191.4 | |
Actual return on plan assets | | | (35.3 | ) | | | 14.3 | | | | 15.5 | |
Employer contributions | | | 30.0 | | | | 3.0 | | | | 25.0 | |
Benefits paid and estimated expenses | | | (5.4 | ) | | | (4.8 | ) | | | (4.4 | ) |
Fair value of plan assets at end
of the year | | | 229.3 | | | | 240.0 | | | | 227.5 | |
Funded status at end of the year | | $ | (41.0 | ) | | $ | 1.4 | | | $ | 1.7 | |
The following table summarizes the projected and accumulated benefit obligations and the fair value of assets for our plans at December 31:
| | | | | | | | | |
| (In millions) | | 2008 | | 2007 | | 2006 |
Projected benefit obligation | | $ | 270.3 | | $ | 238.6 | | $ | 225.8 |
Accumulated benefit obligation | | | 222.3 | | | 201.0 | | | 191.8 |
Fair value of assets | | | 229.3 | | | 240.0 | | | 227.5 |
SFAS No. 158 also requires the Company to recognize as a component of accumulated other comprehensive income or loss, net of tax, the actuarial gains or losses, prior service costs or credits, and transition assets that have not yet been recognized as components of net periodic benefit cost. The following table sets forth the amounts recognized in accumulated other comprehensive loss at December 31:
| | | | | | | |
| (In millions) | | 2008 | | 2007 | |
Net loss | | $ | 62.3 | | $ | 25.7 | |
Prior service cost (credit) | | | 4.4 | | | (1.5 | ) |
Total recognized in accumulated other comprehensive loss | | $ | 66.7 | | $ | 24.2 | |
Part II
The estimated net loss and prior service cost for the defined benefit pension plans that will be amortized from accumulated other comprehensive loss into net periodic benefit cost in 2009 are $7.4 million and $0.6 million, respectively.
The following table sets forth the Company’s target and actual weighted-average asset allocations for defined benefit pension plans at December 31:
| | | | | | | | | |
| | | 2008 | | | 2008 | | | 2007 | |
| (In millions) | | Target
Allocation | | | Percentage of
Plan Assets | |
Asset category: | | | | | | | | | |
Equity securities | | 50.0 | % | | 50.9 | % | | 47.9 | % |
Debt securities | | 50.0 | | | 49.1 | | | 52.1 | |
Total | | 100.0 | % | | 100.0 | % | | 100.0 | % |
The investment goal of the employee pension plan is to produce long-run portfolio returns that are consistent with reasonable contribution rates and a well-funded plan. To manage the overall risk of the portfolio, the portfolio is rebalanced as necessary to keep the allocation within tolerance levels of the target allocation. The portfolio is diversified across a number of equity asset categories and stable value assets. The investment goal of the agent pension plan is to invest in stable value assets in order to maintain its funded status.
The following table sets forth the components of net periodic benefit cost, other changes in plan assets and benefit obligations recognized in other comprehensive loss, and obligation assumptions used in the measurement of the benefit obligations for the years ended December 31:
| | | | | | | | | | | | |
| (In millions) | | 2008 | | | 2007 | | | 2006 | |
Components of net periodic benefit cost (benefit): | | | | | | | | | | | | |
Service cost | | $ | 9.0 | | | $ | 9.4 | | | $ | 8.2 | |
Interest cost | | | 14.4 | | | | 13.2 | | | | 12.4 | |
Expected return on plan assets | | | (18.1 | ) | | | (17.2 | ) | | | (14.4 | ) |
Amortization of unrecognized transition asset | | | — | | | | (0.1 | ) | | | (0.2 | ) |
Amortization of prior service credit | | | (0.3 | ) | | | (0.2 | ) | | | (0.3 | ) |
Amortization of net actuarial loss | | | 2.1 | | | | 2.6 | | | | 2.5 | |
Net periodic benefit cost | | | 7.1 | | | | 7.7 | | | | 8.2 | |
Other changes in plan assets and benefit obligation recognized in other comprehensive (income) loss: | | | | | | | | | | | | |
Net (gain) loss | | | 58.5 | | | | (2.2 | ) | | | — | |
Prior service cost | | | 8.7 | | | | — | | | | — | |
Amortization of net actuarial loss | | | (2.1 | ) | | | (2.6 | ) | | | — | |
Amortization of prior service credit | | | 0.3 | | | | 0.3 | | | | — | |
Amortization of transition asset | | | — | | | | 0.1 | | | | — | |
Total recognized in other comprehensive (income) loss | | | 65.4 | | | | (4.4 | ) | | | — | |
Total recognized in net periodic benefit cost and other comprehensive (income) loss | | $ | 72.5 | | | $ | 3.3 | | | $ | 8.2 | |
Weighted-average assumptions: | | | | | | | | | | | | |
Assumptions used for net periodic benefit cost: | | | | | | | | | | | | |
Discount rate | | | 6.00 | % | | | 5.75 | % | | | 5.75 | % |
Expected return on plan assets | | | 7.63 | | | | 7.63 | | | | 7.61 | |
Rate of compensation increase (Home Office Plan) | | | 4.50 | | | | 4.50 | | | | 4.50 | |
Assumptions used to determine benefit obligations: | | | | | | | | | | | | |
Discount rate | | | 6.00 | % | | | 6.00 | % | | | 5.75 | % |
Rate of compensation increase (Home Office Plan) | | | 4.50 | | | | 4.50 | | | | 4.50 | |
The long-run rate of return for the employee pension plan portfolio is derived by calculating the average return for the portfolio monthly, from 1971 to the present, using the average mutual fund manager returns in each asset category, weighted by the target allocation to each category. Because the average equity market value returns over the last 30 years generally have been higher than the long run expected rate of return, the historical average return used to determine the expected return on plan assets was reduced by 20% to reflect the expected long run rate of return more effectively.
| | |
| 78 | | STANCORP FINANCIAL GROUP, INC. |
Equity securities in the employee pension plan portfolio totaled $112.5 million and $114.9 million at December 31, 2008 and 2007, respectively. The plan held no StanCorp securities as plan assets at December 31, 2008 and 2007.
The Company contributed $30.0 million and $3.0 million to the employee pension plan in 2008 and 2007, respectively. The Company is not obligated to make any contributions to its pension plans for 2009. In addition, no plan assets are expected to be returned to the Company in 2009.
The expected benefit payments for the Company’s pension plans are as follows for the years indicated:
| | | |
| (In millions) | | Amount |
2009 | | $ | 6.3 |
2010 | | | 7.1 |
2011 | | | 8.1 |
2012 | | | 9.2 |
2013 | | | 10.4 |
2014-2018 | | | 71.1 |
Deferred compensation plans
Eligible employees are covered by one of two qualified deferred compensation plans sponsored by Standard and Standard Retirement Services under which a portion of the employee contribution is matched. Employees not eligible for the employee pension plan are eligible for an additional non-elective employer contribution. Contributions to the plan for 2008, 2007 and 2006 were $10.2 million, $8.8 million and $6.6 million, respectively.
In addition, eligible executive officers are covered by a non-qualified supplemental retirement plan. The unfunded status was $23.2 million and $19.9 million at December 31, 2008 and 2007, respectively. Expenses were $2.5 million, $2.3 million and $1.8 million for 2008, 2007 and 2006, respectively. At December 31, 2008, net loss and prior service cost of $4.9 million, net of tax, were excluded from the net periodic benefit cost and reported as a component of accumulated other comprehensive income. In addition, $23.2 million was reflected in other liabilities. In March 2007, additional executive officers were eligible to participate in the plan, which increased the pension benefit obligation by $2.1 million and decreased accumulated other comprehensive income by $1.4 million, net of tax.
Eligible executive officers, directors, agents and group producers may participate in one of several non-qualified deferred compensation plans under which a portion of the deferred compensation for participating executive officers, agents and group producers is matched. The liability for the plans was $8.9 million at both December 31, 2008 and 2007.
12. POSTRETIREMENT BENEFITS OTHER THAN PENSIONS
Standard sponsors and administers a postretirement benefit plan that includes medical, prescription drug benefits and group term life insurance. Eligible retirees are required to contribute specified amounts for medical and prescription drug benefits that are determined periodically and are based on retirees’ length of service and age at retirement. Effective January 1, 2006, participation in the postretirement benefit plan is limited to employees who had reached the age of 40 as of January 1, 2006, or whose combined age and length of service were equal to or greater than 45 years as of January 1, 2006.
The funded or underfunded status of the postretirement benefit plan, reflected as an asset or liability, is measured as the difference between the fair value of plan assets and the accumulated benefit obligation. At December 31, 2008, a liability of $8.0 million was reflected on the balance sheet for this plan.
The Company uses a December 31 measurement date for the postretirement benefit plan. The following table provides a reconciliation of the changes in the postretirement benefit plan’s accumulated benefit obligation, fair value of assets and the funded status for the years ended December 31:
| | | | | | | | | | | | |
| (In millions) | | 2008 | | | 2007 | | | 2006 | |
Change in postretirement benefit obligation: | | | | | | | | | | | | |
Accumulated postretirement benefit obligation at beginning of the year | | $ | (22.0 | ) | | $ | (19.9 | ) | | $ | (22.5 | ) |
Service cost | | | (0.9 | ) | | | (1.3 | ) | | | (0.9 | ) |
Interest cost | | | (1.3 | ) | | | (1.2 | ) | | | (1.1 | ) |
Amendments | | | — | | | | — | | | | (0.5 | ) |
Actuarial gain (loss) | | | (1.0 | ) | | | — | | | | 4.8 | |
Benefits paid | | | 0.2 | | | | 0.4 | | | | 0.3 | |
Accumulated postretirement benefit obligation at end of the year | | | (25.0 | ) | | | (22.0 | ) | | | (19.9 | ) |
Change in postretirement benefit plan assets: | | | | | | | | | | | | |
Fair value of plan assets at beginning of the year | | | 16.9 | | | | 15.9 | | | | 15.3 | |
Actual return on plan assets | | | 0.1 | | | | 1.0 | | | | 0.6 | |
Employer contributions | | | 0.2 | | | | 0.5 | | | | 0.3 | |
Benefits paid and estimated expenses | | | (0.2 | ) | | | (0.5 | ) | | | (0.3 | ) |
Fair value of plan assets at end of the year | | | 17.0 | | | | 16.9 | | | | 15.9 | |
Funded status at end of the year | | $ | (8.0 | ) | | $ | (5.1 | ) | | $ | (4.0 | ) |
The gains and losses, and prior service costs or credits excluded from the projected benefit obligation are recognized as a component of accumulated other comprehensive (income) loss, net of tax. The following
Part II
table sets forth the amounts recognized in accumulated other comprehensive income at December 31:
| | | | | | | | |
| (In millions) | | 2008 | | | 2007 | |
Net gain | | $ | (1.3 | ) | | $ | (2.5 | ) |
Prior service credit | | | (1.6 | ) | | | (1.9 | ) |
Total recognized in accumulated other comprehensive income | | $ | (2.9 | ) | | $ | (4.4 | ) |
The estimated prior service credit for the postretirement benefit plan that will be amortized from accumulated other comprehensive income into net periodic benefit cost in 2009 is $0.4 million.
The projected discounted cash flow obligation for the postretirement benefit plan was $42.1 million and $32.5 million at December 31, 2008 and 2007, respectively.
For the postretirement benefit plan, the assumed health care cost trend rates were assumed to increase as follows for the years ended December 31:
| | | | | | |
| | | 2008 | | | 2007 | |
Health care cost trend rate assumed for next year: | | | | | | |
Medical | | 8.25 | % | | 7.75 | % |
Prescriptions | | 10.00 | | | 9.50 | |
HMO (blended) | | 6.00 | | | 7.75 | |
Rate to which the cost trend rate is assumed to decline (the ultimate trend rate)(1) | | 4.50 | | | 5.00 | |
| | (1) | | Year that the rate reaches the ultimate trend is 2028. |
Assumed health care cost trend rates have a significant effect on the amounts reported for the health care plans. A one-percentage-point change in assumed health care cost trend rates would have the following effects:
| | | | | | | |
| (In millions) | | 1% Point
Increase | | 1% Point
Decrease | |
Effect on total of service and interest cost | | $ | 0.3 | | $ | (0.3 | ) |
Effect on postretirement benefit obligation | | | 3.2 | | | (2.8 | ) |
The following table sets forth the Company’s target and actual weighted-average asset allocations for the postretirement medical plan for the years ended December 31:
| | | | | | | | | |
| | | 2008 | | | 2008 | | | 2007 | |
| | | Target
Allocation | | | Percentage of
Plan Assets | |
Asset category: | | | | | | | | | |
Debt securities | | 95.0 | % | | 97.4 | % | | 95.4 | % |
Other | | 5.0 | | | 2.6 | | | 4.6 | |
Total | | 100.0 | % | | 100.0 | % | | 100.0 | % |
Components of net periodic benefit cost, other changes in plan assets and benefit obligations recognized in other comprehensive loss, and obligation assumptions used in the measurement of the postretirement benefit obligations were as follows for the years ended December 31:
| | | | | | | | | | | | |
| (Dollars in millions) | | 2008 | | | 2007 | | | 2006 | |
Components of net periodic benefit cost (benefit): | | | | | | | | | | | | |
Service cost | | $ | 1.1 | | | $ | 1.1 | | | $ | 1.0 | |
Interest cost | | | 1.3 | | | | 1.2 | | | | 1.0 | |
Expected return on plan assets | | | (1.1 | ) | | | (0.9 | ) | | | (0.8 | ) |
Amortization of prior service credit | | | (0.4 | ) | | | (0.4 | ) | | | (0.4 | ) |
Amortization of net actuarial gain | | | (0.1 | ) | | | (0.1 | ) | | | (0.2 | ) |
Net periodic benefit cost | | | 0.8 | | | | 0.9 | | | | 0.6 | |
Other changes in plan assets and benefit obligation recognized in other comprehensive (income) loss: | | | | | | | | | | | | |
Net loss | | | 1.8 | | | | — | | | | — | |
Amortization of prior service credit | | | 0.4 | | | | 0.4 | | | | — | |
Amortization of net actuarial gain | | | 0.1 | | | | 0.1 | | | | — | |
Total recognized in other comprehensive loss | | | 2.3 | | | | 0.5 | | | | — | |
Total recognized in net periodic benefit cost and other comprehensive loss | | $ | 3.1 | | | $ | 1.4 | | | $ | 0.6 | |
Weighted-average assumptions: | | | | | | | | | | | | |
Assumptions used for net periodic benefit cost: | | | | | | | | | | | | |
Discount rate | | | 6.00 | % | | | 5.75 | % | | | 5.75 | % |
Expected return on plan assets | | | 5.00 | | | | 5.50 | | | | 5.50 | |
Rate of compensation increase graded by age | | | 4.50 | | | | 4.50 | | | | 4.50 | |
Assumptions used to determine benefit obligations: | | | | | | | | | | | | |
Discount rate | | | 6.00 | % | | | 6.00 | % | | | 5.75 | % |
Rate of compensation increase graded by age | | | 4.50 | | | | 4.50 | | | | 4.50 | |
The Company contributed approximately $0.2 million and $0.4 million to fund the postretirement benefit plan in 2008 and 2007, respectively. The Company expects to make contributions of $0.7 million to its postretirement benefit plan in 2009. No plan assets are expected to be returned to the Company in 2009.
The expected benefit payments for the Company’s postretirement benefit plan for the years indicated are as follows:
| | | |
| (In millions) | | Amount |
2009 | | $ | 0.7 |
2010 | | | 0.8 |
2011 | | | 0.8 |
2012 | | | 0.9 |
2013 | | | 1.0 |
2014-2018 | | | 6.1 |
| | |
| 80 | | STANCORP FINANCIAL GROUP, INC. |
13. SHARE-BASED COMPENSATION
The Company has three share-based compensation plans: the 1999 Omnibus Stock Incentive Plan, the 2002 Stock Incentive Plan and the 1999 Employee Share Purchase Plan (“ESPP”).
The 1999 Omnibus Stock Incentive Plan authorized the board of directors of StanCorp to grant eligible employees certain incentive or non-statutory stock options, bonuses and performance stock options, restricted and foreign stock awards, and stock appreciation and cash bonus rights related to StanCorp’s common stock. The maximum number of shares of common stock that may be issued under this plan is 3.4 million. Substantially all of these shares have been issued or optioned.
The 2002 Stock Incentive Plan authorized the board of directors to grant eligible employees and certain related parties incentive or non-statutory stock options and restricted stock. The maximum number of shares of common stock that may be issued under this plan is 4.8 million. At December 31, 2008, 2.6 million shares or options for shares have been issued under the 2002 plan.
The Company’s ESPP allows eligible employees to purchase StanCorp common stock at a discount. The ESPP is described later in this section.
Income before income taxes included compensation costs related to all share-based compensation arrangements of $8.7 million, $8.7 million and $8.7 million for 2008, 2007 and 2006, respectively. The related tax benefits were $3.0 million, $3.0 million and $3.0 million for the same periods, respectively.
The Company has provided three types of share-based compensation pursuant to the 1999 Omnibus Stock Incentive Plan and the 2002 Stock Incentive Plan: option grants to directors, officers and certain non-officer employees; restricted stock grants to officers; and stock retainer fees to directors.
Option grants
Options are granted to directors, officers and certain non-officer employees. Directors and executive officers receive annual grants in amounts determined by the organization and compensation committee of the board of directors. Officers may also receive options when hired or promoted to an officer position. In addition, the chief executive officer has authority to award a limited number of options at his discretion to non-executive officers and other employees. Options are granted with an exercise price equal to the market closing price of the stock on the date of grant. Directors’ options vest in one year with all
others vesting in four equal installments on the first four anniversaries of the grant date. Option awards to certain officers vest immediately upon a change of control of the Company as defined in the change of control agreement. Options generally expire 10 years from the grant date.
A summary of option activity and options outstanding and exercisable is presented below:
| | | | | | | | | | | |
| (In millions) | | Options | | | Weighted-
Average
Exercise
Price | | Weighted-
Average
Remaining
Contractual
Terms
(Years) | | Total
Intrinsic
Value |
Outstanding, January 1, 2006 | | 2,218,248 | | | $ | 28.14 | | 7.0 | | $ | 48,378,159 |
Granted | | 433,350 | | | | 49.96 | | | | | |
Exercised | | (244,327 | ) | | | 21.28 | | | | | |
Forfeited | | (54,754 | ) | | | 40.33 | | | | | |
Expired | | (1,855 | ) | | | 12.24 | | | | | |
Outstanding, December 31, 2006 | | 2,350,662 | | | | 32.61 | | 6.7 | | | 31,305,782 |
Granted | | 432,800 | | | | 45.72 | | | | | |
Exercised | | (326,321 | ) | | | 24.43 | | | | | |
Forfeited | | (106,975 | ) | | | 44.81 | | | | | |
Expired | | (7,038 | ) | | | 44.90 | | | | | |
Outstanding, December 31, 2007 | | 2,343,128 | | | | 35.58 | | 6.4 | | | 34,722,495 |
Granted | | 405,450 | | | | 49.46 | | | | | |
Exercised | | (209,510 | ) | | | 27.12 | | | | | |
Forfeited | | (12,715 | ) | | | 44.99 | | | | | |
Expired | | (10,787 | ) | | | 46.29 | | | | | |
Outstanding, December 31, 2008 | | 2,515,566 | | | | 38.42 | | 6.1 | | | 16,301,078 |
Exercisable, December 31, 2008 | | 1,643,782 | | | | 33.46 | | 5.0 | | | 16,163,208 |
The fair value of each option award under the share-based compensation plans was estimated using the Black-Scholes option pricing model as of the grant date using the assumptions noted in the following table. The Black-Scholes model uses the expected term as an input with the calculated option value varying directly with the length of time until exercise. The Company bases its estimate of expected term on an analysis of the historical exercise experience of similar options granted to similar employee or director groups. The expected term given below represents the weighted-average expected term of options granted. Expected stock price volatility is based on volatility of the Company’s stock over the prior period equal in duration to the expected term. The dividend rate is the rate expected to be paid over the expected term, generally
Part II
estimated to be equal to the rate for the year prior to the grant. The risk-free rate is the interest rate on a U.S. Treasury bond of a maturity closest to the expected term of the option.
| | | | | | | | | |
| | | 2008 | | | 2007 | | | 2006 | |
Dividend yield | | 1.47 | % | | 1.34 | % | | 1.48 | % |
Expected stock price volatility | | 24.0-38.6 | | | 22.7-26.8 | | | 23.0-28.9 | |
Risk-free interest rate | | 1.46-3.49 | | | 4.57-4.69 | | | 4.17-5.14 | |
Expected option lives | | 5.5 years | | | 4.9 years | | | 5.0 years | |
The weighted-average grant date fair value of options granted was $12.30, $11.95 and $13.14 during 2008, 2007 and 2006, respectively. The total intrinsic value of the options exercised was $5.0 million, $8.4 million and $6.8 million for the same periods, respectively. The amount received from the exercise of stock options was $5.7 million, $8.0 million and $5.2 million for 2008, 2007 and 2006, respectively. The related tax benefit derived from the tax deduction received by the Company for the difference between the stock price and the exercise price when the options were exercised was $1.8 million, $2.8 million and $2.4 million for 2008, 2007 and 2006, respectively.
The expense of stock options is amortized over the vesting period, which is also the period over which the grantee must provide services to the Company. At December 31, 2008, the total compensation cost related to unvested option awards that had not yet been recognized in the financial statements was $6.2 million. This cost will be recognized over the next four years.
Restricted stock grants
Restricted stock grants are a part of the Company’s long-term compensation for certain senior officers. The Company grants both performance-based and retention-based restricted stock. Under the current plans, the Company had 0.8 million shares available for issuance as restricted stock at December 31, 2008.
Performance-based restricted stock
Performance-based awards are made to designated senior officers each year and vest with respect to all or a portion of the awards based on the Company’s financial performance for a given year. In years prior to 2007, awards consisted of restricted stock (60%) and cash performance units (40%), which represent a right to receive cash equal to the value of one share of stock subject to the same employment and performance criteria. Both restricted stock and cash performance units are subject to forfeiture if continued employment and financial performance criteria are not met.
On December 8, 2006, the organization and compensation committee of the board of directors of StanCorp approved a revised form of long-term incentive award agreement to be used in connection with future grants of performance-based awards to executives (“Stock Performance Units”). Under the new agreement, Stock Performance Units granted represent the maximum number of shares to be issued and Units are generally granted two years before the performance period. Stock is issued at the end of the performance period based on satisfaction of employment and financial performance conditions, with a portion of the shares withheld to cover required tax withholding. The new agreement replaced the restricted stock and cash performance unit arrangement previously used.
The compensation cost of these awards was measured using an estimate of the number of shares of StanCorp stock that will vest at the end of the performance period, multiplied by the fair market value. For shares, the fair market value was measured at the grant date. For cash units, the value was measured as of the date of the financial statements.
A summary of the activity for Stock Performance Units outstanding is presented below:
| | | | | | |
| | | Stock Performance Units | | | Weighted- Average Grant Date Fair Value |
Unvested balance, January 1, 2007 | | — | | | $ | — |
Granted | | 83,655 | | | | |
Vested | | — | | | | |
Forfeited | | (8,680 | ) | | | |
Unvested balance, December 31, 2007 | | 74,975 | | | | 45.49 |
Granted | | 77,712 | | | | |
Vested | | (4,299 | ) | | | |
Forfeited | | (2,666 | ) | | | |
Unvested balance, December 31, 2008 | | 145,722 | | | | 47.95 |
| | |
| 82 | | STANCORP FINANCIAL GROUP, INC. |
A summary of the activity for performance-based restricted stock and cash performance units outstanding is presented below:
| | | | | | | | | |
| | | Restricted
Shares | | | Cash Units | | | Weighted-
Average
Grant Date
Fair Value |
Unvested balance, January 1, 2006 | | 120,894 | | | 79,178 | | | $ | 35.27 |
Granted | | 43,261 | | | 28,605 | | | | |
Vested | | (31,945 | ) | | (21,137 | ) | | | |
Forfeited | | (10,291 | ) | | (6,821 | ) | | | |
Unvested balance, December 31, 2006 | | 121,919 | | | 79,825 | | | | 41.37 |
Granted | | — | | | — | | | | |
Vested | | (27,086 | ) | | (17,923 | ) | | | |
Forfeited | | (25,928 | ) | | (17,207 | ) | | | |
Unvested balance, December 31, 2007 | | 68,905 | | | 44,695 | | | | 45.62 |
Granted | | — | | | — | | | | |
Vested | | (21,422 | ) | | (13,612 | ) | | | |
Forfeited | | (11,236 | ) | | (7,142 | ) | | | |
Unvested balance, December 31, 2008 | | 36,247 | | | 23,941 | | | | 50.15 |
During 2008 and 2007, there were 77,712 and 83,655 Stock Performance Units granted. The total value of performance-based shares vested and cash units paid was $2.1 million, $2.2 million and $2.8 million for 2008, 2007 and 2006, respectively.
The compensation cost that the Company will ultimately recognize as a result of these awards is dependent on the Company’s financial performance and (for cash units) the price of the Company’s stock on the vesting dates. Assuming that the maximum is achieved for each performance goal, and valuing cash units at the price of StanCorp stock on December 31, 2008, $4.8 million in additional compensation cost would be recognized through 2012. The target or expected payout is 70% of the total or approximately $3.9 million in additional compensation cost through 2012. This cost is expected to be recognized over a weighted-average period of 1.8 years.
Retention-based restricted stock
Awards of retention-based restricted stock to certain senior officers are made less frequently and at irregular intervals by the organization and compensation committee of the board of directors. Participants vest with respect to the stock after completion of a specified period of employment, generally three or four years. The compensation cost of these awards is measured using the fair market value of the stock at the grant date and is
amortized over the specified period of employment. There was no unrecognized compensation cost related to unvested retention-based shares at December 31, 2008. Unvested shares vested on January 1, 2009.
A summary of the retention-based restricted stock activity and its characteristics are presented below:
| | | | | | |
| | | Restricted
Shares | | | Weighted-
Average
Grant Date
Fair Value |
Unvested balance, January 1, 2006 | | 19,000 | | | $ | 27.59 |
Granted | | 8,000 | | | | 50.36 |
Vested | | (4,000 | ) | | | 26.54 |
Unvested balance, December 31, 2006 | | 23,000 | | | | 35.55 |
Granted | | — | | | | — |
Vested | | (15,000 | ) | | | 27.87 |
Unvested balance, December 31, 2007 | | 8,000 | | | | 49.95 |
Granted | | — | | | | — |
Vested | | — | | | | — |
Unvested balance, December 31, 2008 | | 8,000 | | | | 49.95 |
Stock retainer fees to directors
Prior to May 7, 2007, the Company used StanCorp common stock pursuant to the 1999 Omnibus Stock Incentive Plan and the 2002 Stock Incentive Plan to pay a portion of the retainer fees to members of the Company’s board of directors each quarter. Total retainer fees were fixed in dollars. Directors received one-third of the retainer fees in stock and received the remainder in cash. The number of shares issued varied according to the market value of the stock on the date of the issue. The shares were fully vested when issued.
On November 6, 2006, the board of directors of StanCorp approved a new director compensation schedule that became effective May 7, 2007. Under the new schedule, each director who is not an employee of StanCorp or Standard receives cash retainer fees that the Company pays quarterly. Additionally, each director will receive 1,000 shares of common stock annually beginning on the day preceding the annual shareholders meeting in 2008.
The number of director shares issued was 9,820, 1,292, and 3,617 during 2008, 2007 and 2006, respectively. The weighted-average fair value per share for the shares issued was $53.22, $46.36 and $49.83 for the same periods, respectively.
Employee share purchase plan
The Company’s ESPP allows eligible employees to purchase StanCorp common stock at a 15% discount off the lesser of the fair market value of the stock on either the
Part II
commencement date of each six-month offering period or the end-of-the-period purchase date. Under the terms of the plan, each eligible employee may elect to have up to 10% of the employee’s gross total cash compensation for the period withheld to purchase StanCorp common stock. No employee may purchase StanCorp common stock having a fair market value in excess of $25,000 in any calendar year. Of the 2.0 million shares authorized for this plan, 0.7 million remain available at December 31, 2008.
The compensation cost for the ESPP is measured as the sum of the value of the 15% discount and the value of the embedded six-month option. The value of the discount is equal to 15% of the fair market value of the purchase price of the stock. The value of the embedded option is calculated using the Black-Scholes option pricing model using the assumptions noted in the following table. Expected stock price volatility was based on the volatility of StanCorp common stock over the six months preceding the offering period. The risk-free rate was based on the U.S. Treasury yield curve in effect at the time of the grant.
| | | | | | | | | |
| | | 2008 | | | 2007 | | | 2006 | |
Dividend yield | | 1.32-1.45 | % | | 1.34 | % | | 1.48 | % |
Expected stock price volatility | | 33.5-34.4 | | | 17.0-27.7 | | | 24.9-32.7 | |
Risk-free interest rate | | 2.42-3.32 | | | 4.69-5.15 | | | 4.36-5.17 | |
Expected option lives | | 0.5 years | | | 0.5 years | | | 0.5 years | |
The weighted-average per-share fair value for the Company’s ESPP offerings was $12.18, $10.27 and $10.68 during 2008, 2007 and 2006, respectively. The Company’s compensation cost resulting from the ESPP was $1.8 million, $1.2 million and $1.2 million for 2008, 2007 and 2006, respectively. The related tax benefit was $0.6 million, $0.4 million and $0.4 million for the same periods, respectively.
14. REINSURANCE
The Company manages risk through sound product design and underwriting, effective claims management, disciplined pricing, distribution expertise, broad diversification of risk by customer geography, industry, size and occupation, maintenance of a strong financial position, maintenance of reinsurance and risk pool arrangements, and sufficient alignment of assets and liabilities to meet financial obligations.
In order to limit its losses from large exposures, the Company enters into reinsurance agreements with other insurance companies. The Company reviews its retention limits based on size and experience. The maximum retention limit per individual for group life and AD&D is $750,000. The Company’s maximum retention limit for
group disability insurance is $15,000 of monthly benefit per individual. During 2007, the Company increased its maximum retention limit from $5,000 to $5,500 of monthly benefit per individual for individual disability policies with effective dates on or after September 1, 2007. On certain Minnesota Life business, the Company has a maximum retention of $6,000 of monthly benefit per individual.
Standard participates in a reinsurance and third party administration arrangement with Northwestern Mutual Life Insurance Company (“Northwestern Mutual”) under which Northwestern Mutual group long term and short term disability products are sold using Northwestern Mutual’s agency distribution system. Generally, Standard assumes 60% of the risk and receives 60% of the premiums for the policies issued. If Standard were to become unable to meet its obligations, Northwestern Mutual would retain the reinsured liabilities. Therefore, in accordance with an agreement with Northwestern Mutual, Standard established a trust for the benefit of Northwestern Mutual with the market value of assets in the trust equal to Northwestern Mutual’s reinsurance receivable from Standard. The market value of assets required to be maintained in the trust at December 31, 2008, was $221.7 million. Premiums assumed by Standard for the Northwestern Mutual business accounted for 3% of the Company’s total premiums for each of the three years 2008, 2007 and 2006. In addition to assuming risk, Standard provides product design, pricing, underwriting, legal support, claims management and other administrative services under the arrangement.
During 2002, Standard formed a strategic marketing alliance with Ameritas Life Insurance Corp. (“Ameritas”) that offers Standard’s policyholders new and more flexible dental coverage options and access to Ameritas’ nationwide preferred provider organization panel of dentists. As part of this alliance, Standard and Ameritas entered into a reinsurance agreement. In 2008, the agreement provided for 21% of the net dental premiums written by Standard and the risk associated with this premium to be ceded to Ameritas.
In addition to product-specific reinsurance arrangements, the Company maintains reinsurance coverage for certain catastrophe losses related to group life and AD&D. This agreement excludes nuclear, biological and chemical acts of terrorism. Through a combination of this agreement and its participation in a catastrophe reinsurance pool discussed below, the Company has coverage of up to $429.0 million per event.
| | |
| 84 | | STANCORP FINANCIAL GROUP, INC. |
Subsequent to the terrorist events of September 11, 2001, the Company entered into a catastrophe reinsurance pool with other insurance companies. This pool spreads catastrophe losses on group life and AD&D over approximately 27 participating members. The annual fee paid by the Company in 2008 to participate in the pool was less than $30 thousand. As a member of the pool, the Company is exposed to maximum potential losses experienced by other participating members of up to $105.2 million for a single event for losses submitted by a single company and a maximum of $263.5 million for a single event for losses submitted by multiple companies. The Company’s percentage share of losses experienced by pool members will change over time as it is a function of our group life and AD&D in force relative to the total
group life and AD&D in force for all pool participants. The reinsurance pool does not exclude war or nuclear, biological and chemical acts of terrorism.
The Terrorism Risk Insurance Act of 2002 (“TRIA”), which has been extended through 2014, provides for federal government assistance to property and casualty insurers in the event of material losses due to terrorist acts on behalf of a foreign person or foreign interest. Due to the concentration of risk present in group life insurance and the fact that group life insurance is not covered under TRIA, an occurrence of a significant catastrophe or a change in the on-going nature and availability of reinsurance and catastrophe reinsurance could have a material adverse effect on the Company.
The following table sets forth reinsurance information at or for the years ended December 31:
| | | | | | | | | | | | | | | |
| (Dollars in millions) | | Gross
Amount | | Ceded to
Other
Companies | | Assumed
from
Other
Companies | | Net Amount | | Percentage
of Amount
Assumed
to Net | |
2008: | | | | | | | | | | | | | | | |
Life insurance in force | | $ | 310,472.0 | | $ | 5,535.8 | | $ | 97.5 | | $ | 305,033.7 | | — | % |
Premiums: | | | | | | | | | | | | | | | |
Life insurance and annuities | | $ | 924.9 | | $ | 58.8 | | $ | 0.1 | | $ | 866.2 | | — | % |
Accident and health insurance | | | 1,221.7 | | | 62.2 | | | 114.5 | | | 1,274.0 | | 9.0 | |
Total premiums | | $ | 2,146.6 | | $ | 121.0 | | $ | 114.6 | | $ | 2,140.2 | | 5.4 | % |
2007: | | | | | | | | | | | | | | | |
Life insurance in force | | $ | 313,653.9 | | $ | 5,698.9 | | $ | 102.3 | | $ | 308,057.3 | | — | % |
Premiums: | | | | | | | | | | | | | | | |
Life insurance and annuities | | $ | 866.3 | | $ | 61.2 | | $ | — | | $ | 805.1 | | — | % |
Accident and health insurance | | | 1,217.5 | | | 58.6 | | | 114.3 | | | 1,273.2 | | 9.0 | |
Total premiums | | $ | 2,083.8 | | $ | 119.8 | | $ | 114.3 | | $ | 2,078.3 | | 5.5 | % |
2006: | | | | | | | | | | | | | | | |
Life insurance in force | | $ | 271,276.9 | | $ | 4,907.2 | | $ | 112.2 | | $ | 266,481.9 | | — | % |
Premiums: | | | | | | | | | | | | | | | |
Life insurance and annuities | | $ | 792.5 | | $ | 62.6 | | $ | — | | $ | 729.9 | | — | % |
Accident and health insurance | | | 1,144.9 | | | 55.2 | | | 115.4 | | | 1,205.1 | | 9.6 | |
Total premiums | | $ | 1,937.4 | | $ | 117.8 | | $ | 115.4 | | $ | 1,935.0 | | 6.0 | % |
Recoveries recognized under reinsurance agreements were $64.0 million, $60.8 million and $56.4 million for 2008, 2007 and 2006, respectively. Amounts recoverable from reinsurers were $944.0 million and $929.6 million at December 31, 2008 and 2007, respectively. Of these
amounts, $799.6 million and $795.4 million were from the reinsurance transaction with Protective Life Insurance Company (“Protective Life”) effective January 1, 2001. See “Note 15—Reinsurance of Blocks of Business.”
Part II
15. REINSURANCE OF BLOCKS OF BUSINESS
Effective October 1, 2002, Standard entered into a reinsurance agreement with TIAA to assume TIAA’s group disability and group life insurance business. This business included approximately 1,800 group insurance contracts, representing 650,000 insured individuals. Standard paid a ceding commission of approximately $75 million and received approximately $705 million in assets and corresponding statutory liabilities. If Standard were to become unable to meet its obligations, TIAA would retain the reinsured liabilities. Therefore, in accordance with the agreement with TIAA, Standard established a trust for the benefit of TIAA with the market value of assets in the trust equal to TIAA’s reinsurance receivable from Standard. The market value of assets required to be maintained in the trust is determined quarterly. The market value of assets required to be maintained in the trust at December 31, 2008, was approximately $407.4 million. Approximately $60 million in VOBA was capitalized related to the reinsurance agreement.
Effective October 1, 2000, Standard assumed, through a reinsurance agreement, the individual disability insurance business of Minnesota Life. Standard paid a ceding commission of approximately $55 million and received approximately $500 million in assets and corresponding statutory liabilities. If Standard were to become unable to meet its obligations, Minnesota Life would retain the reinsured liabilities. Therefore, in accordance with the
agreement with Minnesota Life, Standard established a trust for the benefit of Minnesota Life with the market value of assets in the trust equal to Minnesota Life’s reinsurance receivable from Standard. The market value of assets required to be maintained in the trust is determined quarterly. The market value of assets required to be maintained in the trust at December 31, 2008, was $600.8 million. Accompanying the transaction was a national marketing agreement that provides access to Minnesota Life agents, some of whom now market Standard’s individual disability insurance products. The national marketing agreement, remains in effect through 2012.
Effective January 1, 2001, Standard ceded to Protective Life, through a reinsurance agreement, Standard’s individual life insurance product line. Standard received a ceding commission of approximately $90 million and transferred to Protective Life approximately $790 million in assets and corresponding statutory liabilities. If Protective Life were to become unable to meet its obligations, Standard would retain the reinsured liabilities. Therefore, the liabilities remain on Standard’s books, and an equal amount is recorded as a recoverable from the reinsurer. In accordance with the agreement, Protective Life established a trust for the benefit of Standard with assets in the trust required to be equal to Standard’s reinsurance receivable from Protective Life. The amount of assets required to be maintained in the trust is determined quarterly.
16. INSURANCE INFORMATION
The following table sets forth insurance information at or for the years ended December 31:
| | | | | | | | | | | | | | | | | | | | | | | | |
| (In Millions) | | Deferred
Acquisition
Costs(1) | | Future
Policy
Benefits
and
Claims | | Other
Policyholder
Funds | | Premium
Revenues | | Net
Investment
Income | | Benefits,
Claims
and
Interest
Credited | | Amortization
of Deferred
Acquisition
Costs(1) | | Other
Operating
Expenses(2) |
2008: | | | | | | | | | | | | | | | | | | | | | | | | |
Insurance Services | | $ | 217.4 | | $ | 5,123.7 | | $ | 570.1 | | $ | 2,109.1 | | $ | 337.5 | | $ | 1,560.5 | | $ | 52.6 | | $ | 528.9 |
Asset Management | | | 79.9 | | | 162.2 | | | 3,374.0 | | | 31.1 | | | 183.8 | | | 139.6 | | | 10.9 | | | 158.7 |
Total | | $ | 297.3 | | $ | 5,285.9 | | $ | 3,944.1 | | $ | 2,140.2 | | $ | 521.3 | | $ | 1,700.1 | | $ | 63.5 | | $ | 687.6 |
2007: | | | | | | | | | | | | | | | | | | | | | | | | |
Insurance Services | | $ | 194.9 | | $ | 5,016.9 | | $ | 532.9 | | $ | 2,063.6 | | $ | 325.8 | | $ | 1,585.5 | | $ | 43.2 | | $ | 489.7 |
Asset Management | | | 59.7 | | | 141.8 | | | 2,620.9 | | | 14.7 | | | 170.2 | | | 115.1 | | | 6.6 | | | 145.6 |
Total | | $ | 254.6 | | $ | 5,158.7 | | $ | 3,153.8 | | $ | 2,078.3 | | $ | 496.0 | | $ | 1,700.6 | | $ | 49.8 | | $ | 635.3 |
2006: | | | | | | | | | | | | | | | | | | | | | | | | |
Insurance Services | | $ | 228.1 | | $ | 4,790.7 | | $ | 477.9 | | $ | 1,927.4 | | $ | 313.4 | | $ | 1,510.4 | | $ | 37.2 | | $ | 456.7 |
Asset Management | | | 52.4 | | | 136.9 | | | 2,459.9 | | | 7.6 | | | 151.3 | | | 100.4 | | | 5.6 | | | 98.4 |
Total | | $ | 280.5 | | $ | 4,927.6 | | $ | 2,937.8 | | $ | 1,935.0 | | $ | 464.7 | | $ | 1,610.8 | | $ | 42.8 | | $ | 555.1 |
| | (1) | | DAC and amortization of DAC including VOBA and amortization of VOBA. |
| | (2) | | Other operating expenses include operating expenses, commissions and bonuses, interest expense, premium taxes, and the net increase in DAC. |
| | |
| 86 | | STANCORP FINANCIAL GROUP, INC. |
17. REGULATORY MATTERS
Standard and The Standard Life Insurance Company of New York prepare their statutory financial statements in accordance with accounting practices prescribed or permitted by their states of domicile. Prescribed statutory accounting practices include state laws, regulations, and general administrative rules, as well as the Statements of Statutory Accounting Practices set forth in publications of the National Association of Insurance Commissioners (“NAIC”).
Statutory accounting practices differ in some respects from GAAP. The principal statutory practices that differ from GAAP are: a) bonds and commercial mortgage loans are reported principally at adjusted carrying value; b) asset valuation and the interest maintenance reserve are provided as prescribed by the NAIC; c) certain assets designated as non-admitted, principally deferred tax assets, furniture, equipment, and unsecured receivables are not recognized as assets, resulting in a charge to statutory surplus; d) annuity considerations with life contingencies, or purchase rate guarantees, are recognized as revenue when received; e) reserves for life and disability policies and contracts are reported net of ceded reinsurance and calculated based on statutory requirements, including required discount rates; f) commissions, including initial commissions and expense allowance paid for reinsurance assumed, and other policy acquisition expenses are expensed as incurred; g) initial commissions and expense allowance received for a block of reinsurance ceded net of taxes are reported as deferred gains in surplus and recognized as income in subsequent periods; h) federal income tax expense includes current income taxes defined as current year estimates of federal income taxes and tax contingencies for current and all prior years and amounts incurred or received during the year relating to prior periods, to the extent not previously provided; and i) deferred tax assets, net of deferred tax liabilities, are included in the regulatory financial statements, but are limited to those deferred tax assets that will be realized within one year that are considered admitted assets. Standard and The Standard Life Insurance Company of New York are subject to statutory restrictions that limit the maximum amount of dividends and distributions that they could declare and pay to StanCorp without prior approval of the states in which the subsidiaries are domiciled.
During 2008 and 2007, Standard made distributions to StanCorp totaling $60.0 million and $155.0 million, respectively.
State insurance departments require insurance enterprises to adhere to minimum Risk-based Capital (“RBC”) requirements promulgated by the NAIC. At December 31, 2008 and 2007, the insurance subsidiaries’ capital levels were significantly in excess of that which would require corrective action by the insurance subsidiaries or regulatory agencies. The authorized control level RBC was $196.1 million and $191.3 million at December 31, 2008 and 2007, respectively.
The following table reconciles the statutory capital and surplus of the insurance subsidiaries as reported to state insurance regulatory authorities with the Company’s GAAP equity at December 31:
| | | | | | | | |
| (In millions) | | 2008 | | | 2007 | |
Statutory capital and surplus | | $ | 1,154.6 | | | $ | 1,047.8 | |
Adjustments to reconcile to GAAP equity: | | | | | | | | |
Future policy benefits and other policyholder funds | | | 265.0 | | | | 235.8 | |
Deferred acquisition costs, value of business acquired and intangibles | | | 297.3 | | | | 315.3 | |
SOP 05-1 adjustment | | | — | | | | (60.7 | ) |
Deferred tax liabilities | | | (202.7 | ) | | | (196.2 | ) |
Asset valuation reserve | | | 78.8 | | | | 102.2 | |
Interest maintenance reserve | | | — | | | | 7.7 | |
Valuation of investments | | | (76.0 | ) | | | 48.0 | |
Equity of StanCorp and its non-insurance subsidiaries | | | (294.3 | ) | | | (257.3 | ) |
Non-admitted assets | | | 285.4 | | | | 237.5 | |
Prepaid pension cost | | | (59.0 | ) | | | (35.4 | ) |
Accrued retirement and defined benefit plans | | | (48.0 | ) | | | (3.3 | ) |
Capital lease obligations | | | (7.8 | ) | | | (7.0 | ) |
Other, net | | | (13.0 | ) | | | (5.4 | ) |
GAAP equity | | $ | 1,380.3 | | | $ | 1,429.0 | |
Part II
The following table reconciles statutory gain from operations as reported to insurance regulatory authorities with GAAP net income for the years ended December 31:
| | | | | | | | | | | | |
| (In millions) | | 2008 | | | 2007 | | | 2006 | |
Statutory gain from operations | | $ | 136.0 | | | $ | 239.6 | | | $ | 170.9 | |
Adjustments to reconcile to GAAP net income: | | | | | | | | | | | | |
Future policy benefits and other policyholder funds | | | 29.3 | | | | 3.2 | | | | 14.3 | |
Deferred acquisition costs and value of business acquired, net of amortization | | | 51.8 | | | | 36.4 | | | | 36.7 | |
Deferred income taxes | | | 16.5 | | | | (0.7 | ) | | | (2.3 | ) |
Current income taxes | | | (20.4 | ) | | | (1.4 | ) | | | (5.3 | ) |
Earnings of StanCorp and its non-insurance subsidiaries | | | (21.1 | ) | | | 11.5 | | | | (3.1 | ) |
Gain from sale of assets to affiliate | | | — | | | | (44.2 | ) | | | — | |
Reinsurance ceding commission | | | (18.4 | ) | | | (12.0 | ) | | | (9.9 | ) |
Reserve increase due to change in valuation basis | | | — | | | | (2.6 | ) | | | (7.5 | ) |
Deferred capital gains (interest maintenance reserve) | | | (10.7 | ) | | | 1.6 | | | | 3.8 | |
Other, net | | | (0.1 | ) | | | (3.9 | ) | | | 6.2 | |
GAAP net income | | $ | 162.9 | | | $ | 227.5 | | | $ | 203.8 | |
18. PARENT HOLDING COMPANY CONDENSED FINANCIAL INFORMATION
Set forth below are the unconsolidated condensed financial statements of StanCorp. The significant accounting policies used in preparing StanCorp’s financial statements are substantially the same as those used in the preparation of the consolidated financial statements of the Company except that StanCorp’s subsidiaries are carried under the equity method.
The following table sets forth StanCorp’s condensed statements of income for the years ended December 31:
| | | | | | | | | | | | |
| (In millions) | | 2008 | | | 2007 | | | 2006 | |
Revenues: | | | | | | | | | | | | |
Net investment income (loss) | | $ | (2.0 | ) | | $ | 6.3 | | | $ | 3.3 | |
Total | | | (2.0 | ) | | | 6.3 | | | | 3.3 | |
Expenses: | | | | | | | | | | | | |
Interest expense | | | 38.7 | | | | 30.1 | | | | 17.6 | |
Operating expenses | | | 5.6 | | | | 6.0 | | | | 5.3 | |
Total | | | 44.3 | | | | 36.1 | | | | 22.9 | |
Loss before income taxes and equity in net income of subsidiaries | | | (46.3 | ) | | | (29.8 | ) | | | (19.6 | ) |
Income taxes | | | (9.3 | ) | | | (20.1 | ) | | | (5.0 | ) |
Equity in net income of subsidiaries | | | 199.9 | | | | 237.2 | | | | 218.4 | |
Net income | | $ | 162.9 | | | $ | 227.5 | | | $ | 203.8 | |
The following table sets forth StanCorp’s condensed balance sheets at December 31:
| | | | | | |
| (In millions) | | 2008 | | 2007 |
Assets: | | | | | | |
Cash and cash equivalents | | $ | 7.7 | | $ | 71.1 |
Investment in subsidiaries | | | 1,877.1 | | | 1,866.7 |
Receivable from subsidiaries | | | 17.3 | | | 10.9 |
Other assets | | | 37.5 | | | 40.6 |
Total | | $ | 1,939.6 | | $ | 1,989.3 |
Liabilities and Shareholders’ Equity: | | | | | | |
Payable to subsidiaries | | $ | 2.7 | | $ | — |
Long-term debt | | | 550.0 | | | 550.0 |
Other liabilities | | | 6.6 | | | 10.3 |
Total shareholders’ equity | | | 1,380.3 | | | 1,429.0 |
Total | | $ | 1,939.6 | | $ | 1,989.3 |
The following table sets forth StanCorp’s condensed statements of cash flows for the years ended December 31:
| | | | | | | | | | | | |
| (In millions) | | 2008 | | | 2007 | | | 2006 | |
Operating: | | | | | | | | | | | | |
Net income | | $ | 162.9 | | | $ | 227.5 | | | $ | 203.8 | |
Change in operating assets and liabilities | | | 22.0 | | | | 33.2 | | | | (0.9 | ) |
Net cash provided by operating activities | | | 184.9 | | | | 260.7 | | | | 202.9 | |
Investing: | | | | | | | | | | | | |
Investment in subsidiaries | | | (264.5 | ) | | | (379.6 | ) | | | (321.1 | ) |
Dividends received from subsidiaries | | | 62.0 | | | | 95.4 | | | | 147.0 | |
Investment securities and other | | | 5.3 | | | | 57.8 | | | | 34.7 | |
Net cash used in investing activities | | | (197.2 | ) | | | (226.4 | ) | | | (139.4 | ) |
Financing: | | | | | | | | | | | | |
Receivables from affiliates, net | | | (4.1 | ) | | | (9.0 | ) | | | 6.6 | |
Proceeds from issuance of Subordinated Debt | | | — | | | | 300.0 | | | | — | |
Issuance and repurchase of common stock, net | | | (10.3 | ) | | | (218.5 | ) | | | (50.4 | ) |
Dividends on common stock | | | (36.7 | ) | | | (35.7 | ) | | | (34.8 | ) |
Net cash provided by (used in) financing activities | | | (51.1 | ) | | | 36.8 | | | | (78.6 | ) |
Increase (decrease) in cash and cash equivalents | | | (63.4 | ) | | | 71.1 | | | | (15.1 | ) |
Cash and cash equivalents, beginning of the year | | | 71.1 | | | | — | | | | 15.1 | |
Cash and cash equivalents, end of the year | | $ | 7.7 | | | $ | 71.1 | | | $ | — | |
19. COMMITMENTS AND CONTINGENCIES
In the normal course of business, the Company is involved in various legal actions and other state and federal proceedings. A number of actions or proceedings were pending at December 31, 2008. In some instances, lawsuits include claims for punitive damages and similar types of relief in unspecified or substantial amounts, in addition to amounts for alleged contractual liability or other compensatory damages. In the opinion of management,
| | |
| 88 | | STANCORP FINANCIAL GROUP, INC. |
the ultimate liability, if any, arising from the actions or proceedings is not expected to have a material adverse effect on the Company’s business, financial position, results of operations or cash flows.
On June 15, 2006, the Company established a five-year, $200 million senior unsecured revolving credit facility (“Facility.”) On June 15, 2008, the Facility was amended to extend the expiration date by one year to June 15, 2013. The Facility will remain at $200 million through June 15, 2012, and will decrease to $165 million thereafter until final maturity on June 15, 2013. Borrowings under the Facility will continue to be used to provide for the working capital and general corporate purposes of the Company and its subsidiaries and the issuance of letters of credit.
Under the agreement, StanCorp is subject to customary covenants that take into consideration the impact of material transactions, changes to the business, compliance with legal requirements and financial performance. The two financial covenants are based on the Company’s total debt to total capitalization ratio and consolidated net worth. The Facility is subject to performance pricing based upon the Company’s total debt to total capitalization ratio and includes interest based on a Eurodollar margin, plus facility and utilization fees. At December 31, 2008, StanCorp was in compliance with all covenants under the Facility and had no outstanding balance on the Facility.
The Company leases certain buildings and equipment under non-cancelable operating leases that expire in various years through 2014, with renewal options for periods ranging from one to five years. Future minimum payments under the leases are 2009, $14.7 million; 2010, $13.2 million; 2011, $10.4 million; 2012, $8.2 million; and thereafter, $5.4 million. Total rent expense was $16.0 million, $15.8 million and $9.6 million for the years ended December 31, 2008, 2007 and 2006, respectively.
At December 31, 2008, minimum future rental receivables on non-cancelable leases of retail and office space with initial terms of one year or more are 2009, $15.0 million; 2010, $13.6 million; 2011, $10.6 million; 2012, $7.4 million; 2013 $5.3 million; and thereafter, $17.3 million.
The Company’s financing obligations generally include debts, lease payment obligations and commitments to fund commercial mortgage loans. The remaining obligations reflect the long-term portion of other liabilities and the Company’s obligations under our insurance and annuity product contracts.
The Company’s long-term debt obligations consisted primarily of the $250 million 6.875%, Senior Notes and the
$300 million 6.90% Subordinated Debt. See “Note 9—Long-Term Debt” for additional information.
In the normal course of business, the Company commits to fund commercial mortgage loans generally up to 90 days in advance. At December 31, 2008, the Company had outstanding commitments to fund commercial mortgage loans totaling $96.9 million, with fixed interest rates ranging from 6.50% to 7.25%. These commitments generally have fixed expiration dates. A small percentage of commitments expire due to the borrower’s failure to deliver the requirements of the commitment by the expiration date. In these cases, the Company will retain the commitment fee and good faith deposit. Alternatively, if we terminate a commitment due to the disapproval of a commitment requirement, the commitment fee and deposit may be refunded to the borrower, less an administrative fee.
The purchase obligations were 2009, $1.4 million; 2010, $0.6 million; 2011, $0.6 million; and 2012, $0.2 million. Purchase obligations were related to non-cancelable telecommunication obligations, software maintenance agreements and other contractual obligations.
From time to time, the board of directors has authorized share repurchase programs. Share repurchases are to be effected in the open market or in negotiated transactions in compliance with the safe harbor provisions of Rule 10b-18 under regulations of the Securities Exchange Act of 1934. Execution of the share repurchase program is based upon management’s assessment of market conditions for its common stock, other potential growth opportunities or other priorities for capital use. On May 7, 2007, the board of directors authorized a share repurchase program of up to 6.0 million shares of StanCorp common stock. The share repurchase program replaced our previous share repurchase program, which had 1.2 million shares remaining that were canceled upon authorization of the new program. On November 3, 2008, the board of directors extended the expiration date of the Company’s share repurchase program to December 31, 2009.
During 2008, the Company repurchased approximately 0.5 million shares of common stock at a total cost of $24.9 million for a volume weighted-average price of $47.31 per common share. At December 31, 2008, there were 0.9 million shares remaining under the current share repurchase program. In addition, during 2008, the Company acquired 5,245 shares of common stock from executive officers and directors to cover tax liabilities of these officers and directors resulting from the release of
Part II
performance-based shares and retention-based shares at a total cost of $0.3 million for a volume weighted-average price of $51.33 per common share, which reflects the market price on the transaction dates.
QUARTERLY FINANCIAL INFORMATION (Unaudited)
The following tables set forth select unaudited financial information by calendar quarter for the years indicated:
| | | | | | | | | | | | | | | | |
| | | 2008 | |
| (In millions—except share data) | | 4th
Qtr | | | 3rd
Qtr | | | 2nd
Qtr | | | 1st
Qtr | |
Premiums | | $ | 528.0 | | | $ | 528.7 | | | $ | 543.0 | | | $ | 540.5 | |
Administrative fees | | | 26.0 | | | | 29.8 | | | | 30.9 | | | | 27.9 | |
Net investment income | | | 138.8 | | | | 136.8 | | | | 136.6 | | | | 128.8 | |
Net capital losses | | | (54.0 | ) | | | (48.8 | ) | | | (21.6 | ) | | | (4.4 | ) |
Total Revenues | | | 638.8 | | | | 646.5 | | | | 688.9 | | | | 692.8 | |
Benefits to policyholders | | | 388.9 | | | | 379.6 | | | | 409.2 | | | | 411.7 | |
Net income | | | 24.0 | | | | 40.2 | | | | 48.4 | | | | 50.3 | |
Net income per common share: | | | | | | | | | | | | | | | | |
Basic | | $ | 0.49 | | | $ | 0.82 | | | $ | 0.99 | | | $ | 1.03 | |
Diluted | | | 0.49 | | | | 0.82 | | | | 0.98 | | | | 1.02 | |
| | | | | | | | | | | | | | |
| | | 2007 |
| (In millions—except share data) | | 4th
Qtr | | | 3rd
Qtr | | | 2nd
Qtr | | 1st
Qtr |
Premiums | | $ | 546.0 | | | $ | 522.2 | | | $ | 518.1 | | $ | 492.0 |
Administrative fees | | | 30.1 | | | | 30.2 | | | | 28.4 | | | 26.5 |
Net investment income | | | 131.0 | | | | 131.3 | | | | 130.7 | | | 123.3 |
Net capital gains (losses) | | | (1.8 | ) | | | (0.4 | ) | | | 0.7 | | | 0.9 |
Total Revenues | | | 705.3 | | | | 683.3 | | | | 677.9 | | | 642.7 |
Benefits to policyholders | | | 410.5 | | | | 389.4 | | | | 409.9 | | | 382.0 |
Net income | | | 60.5 | | | | 66.6 | | | | 52.1 | | | 48.3 |
Net income per common share: | | | | | | | | | | | | | | |
Basic | | $ | 1.22 | | | $ | 1.30 | | | $ | 0.98 | | $ | 0.90 |
Diluted | | | 1.21 | | | | 1.29 | | | | 0.97 | | | 0.90 |
| Item 9. | | Changes in and Disagreements with Accountants on Accounting and Financial Disclosure |
None.
| Item 9A. | | Controls and Procedures |
(a) Management’s annual report on internal control over financial reporting. Management of the Company has evaluated, under the supervision and with the participation of the Company’s chief executive officer and chief financial officer, the effectiveness of the design and operation of the Company’s “disclosure controls and procedures” (as defined in the Securities Exchange Act of 1934 (“Exchange Act”) Rules 13a-15(c) and 15d-15(c)) as of the end of the period covered by this report. Based on this evaluation, the chief executive officer and chief financial officer have concluded that our disclosure controls and procedures were effective at December 31, 2008, and designed to
provide reasonable assurance that material information relating to us and our consolidated subsidiaries is recorded, processed, summarized and reported within the time periods specified in the Securities and Exchange Commission’s rules and forms, and is accumulated and communicated to management, including the Company’s chief executive officer and chief financial officer, as appropriate, to allow timely decisions regarding required disclosure.
Management of StanCorp Financial Group, Inc. (the “Company”) is responsible for establishing and maintaining adequate internal control over financial reporting. The Company’s internal control system was designed to provide reasonable assurance regarding the reliability of financial reporting and preparation of financial statements for external purposes in accordance with accounting principles generally accepted in the United States of America. All internal control systems, no matter how well designed, have inherent limitations and may not prevent or detect misstatements. Therefore, even those systems determined to be effective can provide only reasonable assurance with respect to financial statement preparation and presentation. Company management assessed the effectiveness of the Company’s internal control over financial reporting as of December 31, 2008. In making this assessment, it used the criteria set forth by the Committee of Sponsoring Organizations of the Treadway Commission (COSO) inInternal Control—Integrated Framework. Our management concluded that based on its assessment, our internal control over financial reporting was effective as of December 31, 2008. The effectiveness of our internal control over financial reporting as of December 31, 2008 was audited by Deloitte & Touche LLP, an independent registered public accounting firm, as stated in their report, which appears under Item 8 –Financial Statements and Supplementary Data.
| | |
| 90 | | STANCORP FINANCIAL GROUP, INC. |
(b) Attestation report of the registered public accounting firm.
Report of Independent Registered Public Accounting Firm
To the Board of Directors and Shareholders of
StanCorp Financial Group, Inc.
Portland, Oregon
We have audited the internal control over financial reporting of StanCorp Financial Group, Inc., and subsidiaries (the “Company”) as of December 31, 2008, based on criteria established inInternal Control—Integrated Framework issued by the Committee of Sponsoring Organizations of the Treadway Commission. The Company’s management is responsible for maintaining effective internal control over financial reporting and for its assessment of the effectiveness of internal control over financial reporting, included in the accompanying Management’s Annual Report on Internal Control over Financial Reporting. Our responsibility is to express an opinion on the Company’s internal control over financial reporting based on our audit.
We conducted our audit in accordance with the standards of the Public Company Accounting Oversight Board (United States). Those standards require that we plan and perform the audit to obtain reasonable assurance about whether effective internal control over financial reporting was maintained in all material respects. Our audit included obtaining an understanding of internal control over financial reporting, assessing the risk that a material weakness exists, testing and evaluating the design and operating effectiveness of internal control based on the assessed risk, and performing such other procedures as we considered necessary in the circumstances. We believe that our audit provides a reasonable basis for our opinion.
A company’s internal control over financial reporting is a process designed by, or under the supervision of, the company’s principal executive and principal financial officers, or persons performing similar functions, and effected by the company’s board of directors, management, and other personnel to provide reasonable assurance regarding the reliability of financial reporting and the preparation of financial statements for external purposes in accordance with generally accepted accounting principles. A company’s internal control over financial reporting includes those policies and procedures that (1) pertain to the maintenance of records that, in reasonable detail, accurately and fairly reflect the transactions and dispositions of the assets of the company;
(2) provide reasonable assurance that transactions are recorded as necessary to permit preparation of financial statements in accordance with generally accepted accounting principles, and that receipts and expenditures of the company are being made only in accordance with authorizations of management and directors of the company; and (3) provide reasonable assurance regarding prevention or timely detection of unauthorized acquisition, use, or disposition of the company’s assets that could have a material effect on the financial statements.
Because of the inherent limitations of internal control over financial reporting, including the possibility of collusion or improper management override of controls, material misstatements due to error or fraud may not be prevented or detected on a timely basis. Also, projections of any evaluation of the effectiveness of the internal control over financial reporting to future periods are subject to the risk that the controls may become inadequate because of changes in conditions, or that the degree of compliance with the policies or procedures may deteriorate.
In our opinion, the Company maintained, in all material respects, effective internal control over financial reporting as of December 31, 2008, based on the criteria established inInternal Control—Integrated Framework issued by the Committee of Sponsoring Organizations of the Treadway Commission.
We have also audited, in accordance with the standards of the Public Company Accounting Oversight Board (United States), the consolidated balance sheet, and the related consolidated statements of income and comprehensive income, changes in shareholders’ equity, and cash flows as of and for the year ended December 31, 2008 of the Company and our report dated February 27, 2009 expressed an unqualified opinion on those financial statements, and includes an explanatory paragraph regarding the adoption, on January 1, 2007, of Statement of Position 05-1,Accounting by Insurance Enterprises for Deferred Acquisition Costs in Connection With Modifications or Exchanges of Insurance Contracts, and on December 31, 2006, of Statement of Financial Accounting Standards No. 158,Employers’ Accounting for Defined Benefit Pension and Other Postretirement Plans.
|
|
/S/ DELOITTE & TOUCHE LLP
|
DELOITTE & TOUCHE LLP |
|
Portland, Oregon |
February 27, 2009 |
Part II
(c) Changes in control over financial reporting. There were no changes in our internal control over financial reporting that occurred during the quarter ended December 31, 2008, that have materially affected, or are reasonably likely to affect materially, the Company’s internal control over financial reporting.
| Item 9B. | | Other Information |
None.
| | |
| 92 | | STANCORP FINANCIAL GROUP, INC. |
Part III
| Item 10. | | Directors, Executive Officers and Corporate Governance |
Information required by Item 10 relating to directors of StanCorp is set forth under the caption “Election of Directors” in the 2009 Proxy Statement and is incorporated herein by reference.
For information on the executive officers of the registrant, see Part I, Item 4A, “Executive Officers of the Registrant.”
Information relating to beneficial ownership reporting compliance by directors and executive officers of the Company pursuant to Section 16(a) of the Securities Exchange Act of 1934 (the “Exchange Act”) is set forth under the caption “Section 16(a) Beneficial Ownership Reporting Compliance” in the 2009 Proxy Statement, and is incorporated herein by reference.
We have codes of business ethics for all directors, senior executive officers, including the Chairman and Chief Executive Officer, the Senior Vice President and Chief Financial Officer and the Vice President and Controller of StanCorp (its principal executive officer, principal financial officer and principal accounting officer, respectively), and employees of the Company. The codes of business ethics are available on the Company’s web site located at www.stancorpfinancial.com. A copy of the codes of business ethics will be provided without charge to any person who requests them by writing to the address or telephoning the number indicated under “Available Information” on page 3. We will disclose on our web site any amendments to or waivers from our codes of business ethics applicable to directors or executive officers of StanCorp, including the Chairman and Chief Executive Officer, the Senior Vice President and Chief Financial Officer and the Vice President and Controller in accordance with all applicable laws and regulations.
AUDIT COMMITTEE
StanCorp has a separately designated standing Audit Committee established in accordance with Section 3(a)58(A) of the Exchange Act. Information regarding the members of the Audit Committee is reported under the caption “Corporate Governance—Committees of the Board” in the Company’s 2009 Proxy Statement, herein incorporated by reference.
AUDIT COMMITTEE FINANCIAL EXPERT
Information required by Item 10 regarding the audit committee financial expert is reported under the caption “Corporate Governance—Committees of the Board” in the
Company’s 2009 Proxy Statement and is incorporated herein by reference.
| Item 11. | | Executive Compensation |
Information required by Item 11 regarding executive compensation and related matters is reported under the captions “Director Compensation,” “Executive Compensation,” “Compensation Discussion and Analysis” and “Report of the Organization and Compensation Committee” in the Company’s 2009 Proxy Statement, herein incorporated by reference.
| Item 12. | | Security Ownership of Certain Beneficial Owners and Management and Related Stockholder Matters |
Information required by Item 12 regarding security ownership of certain beneficial owners and management is reported under the caption “Share Ownership of Directors and Officers” and “Security Ownership of Certain Beneficial Owners” in the Company’s 2009 Proxy Statement, herein incorporated by reference.
EQUITY COMPENSATION PLANS
The Company currently has in effect three equity compensation plans, all of which have been approved by shareholders. These are the 1999 Omnibus Stock Incentive Plan, the 1999 Employee Share Purchase Plan (“ESPP”) and the 2002 Stock Plan. The shares to be issued subject to outstanding options and the shares otherwise available for issue under these plans as of December 31, 2008, are presented below:
| | | | | | | |
| Plan category | | Number of
securities to be issued upon exercise of
outstanding
options, warrants
and rights | | Weighted-
average exercise price of
outstanding
options, warrants and rights | | Number of
securities for future issuance under equity
compensation
plans (excluding
securities reflected in
column (a) |
| | | (a) | | (b) | | (c) |
Equity compensation plans approved by security holders | | 2,661,288 | | $ | 38.42 | | 2,869,537 |
Equity compensation plans not approved by security holders | | — | | | — | | — |
Under the 1999 Omnibus Stock Incentive Plan, 30,437 shares remained available for issuance as options or restricted stock as of December 31, 2008. Under the 1999 ESPP, there were 670,699 shares available for issuance.
Part III
Under the 2002 Stock Plan, there were 2,168,401 shares available to be issued, all of which could be issued as options, and 805,061 of these shares, which could be issued as restricted stock. Shares issuable under performance share awards are not included in calculating the weighted-average price of outstanding options, warrants and rights.
| Item 13. | | Certain Relationships and Related Transactions, and Director Independence |
Information required by Item 13 regarding certain relationships and related transactions, and director independence is reported under the captions “Corporate Governance—Director Independence” and “Transactions with Related Parties” in the Company’s 2009 Proxy Statement, herein incorporated by reference.
| Item 14. | | Principal Accountant Fees and Services |
Information required by Item 14 regarding principal accounting fees and services is reported under the caption “Proposal to Ratify Appointment of Independent Registered Public Accounting Firm” in the Company’s 2009 Proxy Statement, herein incorporated by reference.
| | |
| 94 | | STANCORP FINANCIAL GROUP, INC. |
Part IV
| Item 15. | | Exhibits and Financial Statement Schedules |
| (a) | | Index of documents filed as part of the report: |
| | 1. | | The following Consolidated Financial Statements of StanCorp are included in Item 8, “Financial Statements and Supplementary Data.” |
Report of Independent Registered Public Accounting Firm
Consolidated Statements of Income and Comprehensive Income for the years ended December 31, 2008, 2007 and 2006
Consolidated Balance Sheets at December 31, 2008 and 2007
Consolidated Statements of Changes in Shareholders’ Equity for the years ended December 31, 2008, 2007 and 2006
Consolidated Statements of Cash Flows for the years ended December 31, 2008, 2007 and 2006
Notes to Consolidated Financial Statements
| | 2. | | The following Financial Statement Schedules of StanCorp are included in Item 8, “Financial Statements and Supplementary Data—Notes to Consolidated Financial Statements.” Schedules not referenced are inapplicable or not required. |
Condensed Financial Information of Registrant
Valuation and Qualifying Accounts
Summary of Investments—Other Than Investments in Affiliates
Supplementary Insurance Information
Reinsurance
| | |
| Number | | Name |
| |
| 3.1 | | Articles of Incorporation of StanCorp Financial Group, Inc. as amended |
| 3.2 | | Bylaws of StanCorp Financial Group, Inc. |
| 4.1 | | Form of Rights Agreement |
| 4.2 | | Form of Indenture Relating to Senior Debt Securities |
| 4.3 | | StanCorp Financial Group, Inc. and U.S. Bank National Association as Trustee, First Supplemental Indenture, Dated as of September 25, 2002 |
| 4.4 | | First Supplemental Indenture, dated May 29, 2007, between the Company and U.S. Bank National Association |
| 4.5 | | Replacement Capital Covenant dated May 29, 2007, for the benefit of holders of the Company’s 6.875% Senior Notes due 2012 |
| 10.1 | | StanCorp Financial Group, Inc. 1999 Omnibus Stock Incentive Plan, As Amended |
| 10.2 | | Amendment No. 3 to StanCorp Financial Group, Inc. 1999 Omnibus Stock Incentive Plan |
| 10.3 | | StanCorp Financial Group, Inc. 1999 Employee Share Purchase Plan |
| 10.4 | | Amendment No. 1 to StanCorp Financial Group, Inc. 1999 Employee Share Purchase Plan |
| 10.5 | | Standard Insurance Company Supplemental Retirement Plan for the Senior Officer Management Group 2008 Restatement |
| 10.6 | | StanCorp Financial Group, Inc. Deferred Compensation Plan for Senior Officers 2008 Restatement |
| 10.7 | | StanCorp Financial Group, Inc. Amended 2002 Stock Incentive Plan |
| 10.8 | | Form of StanCorp Financial Group, Inc. 2002 Stock Incentive Plan, As Amended Restricted Stock Agreement |
| 10.9 | | Form of StanCorp Financial Group, Inc. 2002 Stock Incentive Plan Non-Statutory Stock Option Agreement Senior Officers |
| 10.10 | | Form of StanCorp Financial Group, Inc. 2002 Stock Incentive Plan Non-Statutory Stock Option Agreement Directors |
| 10.11 | | StanCorp Financial Group, Inc. Short-Term Incentive Plan |
Part IV
| | |
| Number | | Name |
| 10.12 | | Acquisition Agreement by and between Minnesota Life Insurance Company and Standard Insurance Company Dated December 1, 2000 |
| 10.13 | | 100% Coinsurance Agreement Between Protective Life Insurance Company and Standard Insurance Company dated November 6, 2000 |
| 10.14 | | Purchase and Sale Agreement by and Between Teachers Insurance and Annuity Association of America and Standard Insurance Company dated May 29, 2002 |
| 10.15 | | StanCorp Financial Group, Inc. Deferred Compensation Plan for Directors 2008 Restatement |
| 10.16 | | Group Disability Income Reinsurance Agreement between The Northwestern Mutual Life Insurance Company (Milwaukee, Wisconsin) and Standard Insurance Company (Portland, Oregon) |
| 10.17 | | Amendment to Group Disability Income Reinsurance Agreement between Standard Insurance Company (Portland, Oregon) and The Northwestern Mutual Life Insurance Company (Milwaukee, Wisconsin) |
| 10.18 | | Form of Executive Officer and Director Indemnity Agreement |
| 10.19 | | Credit Agreement Dated as of June 15, 2006, Among StanCorp Financial Group, Inc., as Borrower, The Lenders Listed Herein, as Lenders, Wells Fargo Bank, National Association, as Administrative Agent, and U.S. Bank National Association, as Syndication Agent, $200,000,000 |
| 10.20 | | Form of Change of Control Agreement |
| 10.21 | | Form of StanCorp Financial Group, Inc. Long-Term Incentive Award Agreement (20 Performance Period) |
| 10.22 | | Credit Agreement Extension Dated as of May 9, 2007, Among StanCorp Financial Group, Inc., as Borrower, The Lenders Listed Herein, as lenders, Wells Fargo Bank, National Association, as Administrative Agent, and U.S. Bank National Association, as Syndication Agent, $200,000,000 |
| 10.23 | | Credit Agreement Extension Dated as of June 15, 2008, Among StanCorp Financial Group, Inc., as Borrower, The Lenders Listed Herein, as lenders, Wells Fargo Bank, National Association, as Administrative Agent, and U.S. Bank National Association, as Syndication Agent, $165,000,000 |
| 10.24 | | Consulting and Separation Agreement and Release of All Claims for Kim W. Ledbetter |
| 10.25 | | StanCorp Financial Group, Inc. Deferred Compensation Plan for Senior Officers—First Amendment |
| 12.1 | | Statement Regarding Computation of Ratio of Earnings to Fixed Charges |
| 14.1 | | Code of Business Conduct and Ethics for the Board of Directors |
| 14.2 | | Code of Ethics for Senior Officers |
| 14.3 | | Guide to Business Conduct |
| 21 | | Subsidiaries of the Registrant |
| 23 | | Independent Registered Public Accounting Firm Consent |
| 24 | | Power of Attorney of Directors of StanCorp Financial Group, Inc. |
| 31.1 | | Certification of Chief Executive Officer pursuant to Section 302 of the Sarbanes-Oxley Act of 2002 |
| 31.2 | | Certification of Chief Financial Officer pursuant to Section 302 of the Sarbanes-Oxley Act of 2002 |
| 32.1 | | Certification of Chief Executive Officer pursuant to Section 906 of the Sarbanes-Oxley Act of 2002 |
| 32.2 | | Certification of Chief Financial Officer pursuant to Section 906 of the Sarbanes-Oxley Act of 2002 |
| 99.1 | | StanCorp Financial Group, Inc. Corporate Governance Guidelines dated February 12, 2007 |
| | |
| 96 | | STANCORP FINANCIAL GROUP, INC. |
Signatures
Pursuant to the requirements of Section 13 or 15(d) of the Securities Exchange Act of 1934, the Registrant has duly caused this report to be signed on its behalf by the undersigned, thereunto duly authorized in Portland, Oregon on February 27, 2009.
| | |
STANCORP FINANCIAL GROUP, INC. |
| |
By: | | /s/ ERIC E. PARSONS
|
Name: Eric E. Parsons |
Title: Chairman and Chief Executive Officer |
Pursuant to the requirements of the Securities Exchange Act of 1934, this report has been signed below by the following persons on behalf of the Registrant and in the capacities and on the dates indicated.
| | | | |
| Signature | | Title | | Date |
| | |
/s/ ERIC E. PARSONS
Eric E. Parsons | | Chairman and Chief Executive Officer (Principal Executive Officer) Director | | February 27, 2009 |
| | |
/s/ FLOYD F. CHADEE
Floyd F. Chadee | | Senior Vice President and Chief Financial Officer (Principal Financial Officer) | | February 27, 2009 |
| | |
/s/ ROBERT M. ERICKSON
Robert M. Erickson | | Vice President and Controller (Principal Accounting Officer) | | February 27, 2009 |
| | |
*
Virginia L. Anderson | | Director | | February 22, 2009 |
| | |
*
Frederick W. Buckman | | Director | | February 20, 2009 |
| | |
*
John E. Chapoton | | Director | | February 20, 2009 |
| | |
*
Stanley R. Fallis | | Director | | February 20, 2009 |
| | |
*
Peter O. Kohler, MD | | Director | | February 21, 2009 |
| | |
*
Jerome J. Meyer | | Director | | February 20, 2009 |
| | |
*
Ralph R. Peterson | | Director | | February 20, 2009 |
| | |
*
Mary F. Sammons | | Director | | February 23, 2009 |
| | |
*
E. Kay Stepp | | Director | | February 21, 2009 |
| | |
*
Michael G. Thorne | | Director | | February 21, 2009 |
| | |
*
Ronald E. Timpe | | Director | | February 22, 2009 |
| | |
| |
*By: | | /s/ ERIC E. PARSONS
|
| | | Eric E. Parsons, as Attorney-in-fact |
Part IV
Exhibits Index
| | | | |
| Number | | Name | | Method of Filing |
| 3.1 | | Articles of Incorporation of StanCorp Financial Group, Inc. as amended | | Filed as Exhibit 4.1 on Registrant’s Form 8-K, dated May 7, 1999, and incorporated herein by this reference |
| 3.2 | | Bylaws of StanCorp Financial Group, Inc. | | Filed as Exhibit 3.2 on Registrant’s Form S-1A, dated March 12, 1999, and incorporated herein by this reference |
| 4.1 | | Form of Rights Agreement | | Filed as Exhibit 10.2 on the Registrant’s Form 10-Q, dated May 8, 2008, and incorporated herein by this reference |
| 4.2 | | Form of Indenture Relating to Senior Debt Securities | | Filed as Exhibit 4 (c) on the Registrant’s Form S-3, dated July 3, 2002, and incorporated herein by this reference |
| 4.3 | | StanCorp Financial Group, Inc. and U.S. Bank National Association as Trustee, First Supplemental Indenture, Dated as of September 25, 2002 | | Filed as Exhibit 4.1 on the Registrant’s Form 8-K, dated September 25, 2002, and incorporated herein by this reference |
| 4.4 | | First Supplemental Indenture, dated May 29, 2007, between the Company and U.S. Bank National Association | | Filed as Exhibit 4.1 on Registrant’s 8-K, dated May 30, 2007, and incorporated herein by this reference |
| 4.5 | | Replacement Capital Covenant dated May 29, 2007, for the benefit of holders of the Company’s 6.875% Senior Notes due 2012 | | Filed as Exhibit 4.2 on Registrant’s 8-K, dated May 30, 2007, and incorporated herein by this reference |
| 10.1 | | StanCorp Financial Group, Inc. 1999 Omnibus Stock Incentive Plan, As Amended | | Filed as Exhibit 10.2 on Registrant’s Form 10-Q, dated August 14, 2000, and incorporated herein by this reference |
| 10.2 | | Amendment No. 3 to StanCorp Financial Group, Inc. 1999 Omnibus Stock Incentive Plan | | Filed as Exhibit 10.3 on Registrant’s Form 10-K, dated March 10, 2005, and incorporated herein by this reference |
| 10.3 | | StanCorp Financial Group, Inc. 1999 Employee Share Purchase Plan | | Filed as Exhibit 10.3 on the Registrant’s Form 10-K, dated March 14, 2000, and incorporated herein by this reference |
| 10.4 | | Amendment No. 1 to StanCorp Financial Group, Inc. 1999 Employee Share Purchase Plan | | Filed as Exhibit 10.5 on Registrant’s Form 10-K, dated March 10, 2005, and incorporated herein by this reference |
| 10.5 | | Standard Insurance Company Supplemental Retirement Plan for the Senior Officer Management Group 2008 Restatement | | Filed as Exhibit 10.3 on the Registrant’s Form 10-Q, dated May 8, 2008, and incorporated herein by this reference |
| 10.6 | | StanCorp Financial Group, Inc. Deferred Compensation Plan for Senior Officers 2008 Restatement | | Filed as Exhibit 10.6 on Registrant’s Form 10-K, dated February 27, 2008, and incorporated herein by this reference |
| 10.7 | | StanCorp Financial Group, Inc. Amended 2002 Stock Incentive Plan | | Filed as Exhibit 10.1 on Registrant’s Form 10-Q, dated May 8, 2008, and incorporated herein by this reference |
| 10.8 | | Form of StanCorp Financial Group, Inc. 2002 Stock Incentive Plan, As Amended Restricted Stock Agreement | | Filed as Exhibit 10.3 on the Registrant’s Form 8-K, dated January 6, 2005, and incorporated herein by this reference |
| | |
| 98 | | STANCORP FINANCIAL GROUP, INC. |
| | | | |
| Number | | Name | | Method of Filing |
| 10.9 | | Form of StanCorp Financial Group, Inc. 2002 Stock Incentive Plan Non-Statutory Stock Option Agreement Senior Officers | | Filed herewith |
| 10.10 | | Form of StanCorp Financial Group, Inc. 2002 Stock Incentive Plan Non-Statutory Stock Option Agreement Directors | | Filed as Exhibit 10.4 on the Registrant’s Form 10-Q, dated May 8, 2008, and incorporated herein by this reference |
| 10.11 | | StanCorp Financial Group, Inc. Short-Term Incentive Plan | | Filed as Exhibit 10.2 on Registrant’s Form 10-Q, dated May 9, 2007, and incorporated herein by this reference |
| 10.12 | | Acquisition Agreement by and between Minnesota Life Insurance Company and Standard Insurance Company dated December 1, 2000 | | Filed as Exhibit 2 on Registrant’s Form 10-K, dated March 14, 2001, and incorporated herein by this reference |
| 10.13 | | 100% Coinsurance Agreement Between Protective Life Insurance Company and Standard Insurance Company dated November 6, 2000 | | Filed as Exhibit 2 on Registrant’s Form 10-Q, dated May 14, 2001, and incorporated herein by this reference |
| 10.14 | | Purchase and Sale Agreement by and Between Teachers Insurance and Annuity Association of America and Standard Insurance Company dated May 29, 2002 | | Filed as exhibit 10.17 on Registrant’s Form 10-K, dated March 14, 2003, and incorporated herein by this reference |
| 10.15 | | StanCorp Financial Group, Inc. Deferred Compensation Plan for Directors 2008 Restatement | | Filed as Exhibit 10.15 on Registrant’s Form 10-K, dated February 27, 2008, and incorporated herein by this reference |
| 10.16 | | Group Disability Income Reinsurance Agreement between The Northwestern Mutual Life Insurance Company (Milwaukee, Wisconsin) and Standard Insurance Company (Portland, Oregon) | | Filed as Exhibit 10.20 on Registrant’s Form 10-K, dated March 10, 2005, and incorporated herein by this reference |
| 10.17 | | Amendment to Group Disability Income Reinsurance Agreement between Standard Insurance Company (Portland, Oregon) and The Northwestern Mutual Life Insurance Company (Milwaukee, Wisconsin) | | Filed as Exhibit 10.22 on Registrant’s Form 10-Q, dated August 9, 2005, and incorporated herein by this reference |
| 10.18 | | Form of Executive Officer and Director Indemnity Agreement | | Filed as Exhibit 10.25 on Registrant’s Form 10-Q, dated August 9, 2005, and incorporated herein by this reference |
| 10.19 | | Credit Agreement Dated as of June 15, 2006, Among StanCorp Financial Group, Inc., as Borrower, The Lenders Listed Herein, as Lenders, Wells Fargo Bank, National Association, as Administrative Agent, and U.S. Bank National Association, as Syndication Agent, $200,000,000 | | Filed as Exhibit 10.1 on the Registrant’s Form 8-K, dated June 16, 2006, and incorporated herein by this reference |
| 10.20 | | Form of Change of Control Agreement | | Filed as Exhibit 10.1 on Registrant’s Form 8-K, dated December 14, 2006, and incorporated herein by this reference |
| 10.21 | | Form of StanCorp Financial Group, Inc. Long-Term Incentive Award Agreement (20 Performance Period) | | Filed herewith |
Part IV
| | | | |
| Number | | Name | | Method of Filing |
| 10.22 | | Credit Agreement Extension Dated as of May 9, 2007, Among StanCorp Financial Group, Inc., as Borrower, The Lenders Listed Herein, as lenders, Wells Fargo Bank, National Association, as Administrative Agent, and U.S. Bank National Association, as Syndication Agent, $200,000,000 | | Filed as Exhibit 10.1 on Registrant’s Form 8-K, dated May 9, 2007, and incorporated herein by this reference |
| 10.23 | | Credit Agreement Extension Dated as of June 15, 2008, Among StanCorp Financial Group, Inc., as Borrower, The Lenders Listed Herein, as lenders, Wells Fargo Bank, National Association, as Administrative Agent, and U.S. Bank National Association, as Syndication Agent, $165,000,000 | | Filed as Exhibit 10.1 on Registrant’s Form 8-K, dated June 15, 2008, and incorporated herein by this reference |
| 10.24 | | Consulting and Separation Agreement and Release of All Claims for Kim W. Ledbetter | | Filed as Exhibit 10.1 on Registrant’s Form 8-K, dated September 10, 2008, and incorporated herein by this reference |
| 10.25 | | StanCorp Financial Group, Inc. Deferred Compensation Plan for Senior Officers—First Amendment | | Filed as Exhibit 10.1 on Registrant’s Form 10-Q, dated November 4, 2008, and incorporated herein by this reference |
| 12.1 | | Statement Regarding Computation of Ratio of Earnings to Fixed Charges | | Filed herewith |
| 14.1 | | Code of Business Conduct and Ethics for the Board of Directors | | Filed as Exhibit 14.1 on Registrant’s Form 10-K, dated March 5, 2004, and incorporated herein by this reference |
| 14.2 | | Code of Ethics for Senior Officers | | Filed as Exhibit 14.2 on Registrant’s Form 10-K, dated March 5, 2004, and incorporated herein by this reference |
| 14.3 | | Guide to Business Conduct | | Filed as Exhibit 14.3 on Registrant’s Form 10-K, dated March 5, 2004, and incorporated herein by this reference |
| 21 | | Subsidiaries of the Registrant | | Filed herewith |
| 23 | | Independent Registered Public Accounting Firm Consent | | Filed herewith |
| 24 | | Power of Attorney of Directors of StanCorp Financial Group, Inc. | | Filed herewith |
| 31.1 | | Certification of Chief Executive Officer pursuant to Section 302 of the Sarbanes-Oxley Act of 2002 | | Filed herewith |
| 31.2 | | Certification of Chief Financial Officer pursuant to Section 302 of the Sarbanes-Oxley Act of 2002 | | Filed herewith |
| 32.1 | | Certification of Chief Executive Officer pursuant to Section 906 of the Sarbanes-Oxley Act of 2002 | | Filed herewith |
| 32.2 | | Certification of Chief Financial Officer pursuant to Section 906 of the Sarbanes-Oxley Act of 2002 | | Filed herewith |
| 99.1 | | StanCorp Financial Group, Inc. Corporate Governance Guidelines dated February 12, 2007 | | Filed as Exhibit 99.1 on Registrant’s Form 8-K, dated February 16, 2007, and incorporated herein by this reference |
| | |
| 100 | | STANCORP FINANCIAL GROUP, INC. |