UNITED STATES SECURITIES AND EXCHANGE COMMISSION
Washington, D.C. 20549
FORM 10-K
| x | | ANNUAL REPORT PURSUANT TO SECTION 13 OR 15(d) OF THE SECURITIES EXCHANGE ACT OF 1934 For the fiscal year ended December 31, 2011 |
or
| ¨ | | TRANSITION REPORT PURSUANT TO SECTION 13 OR 15(d) OF THE SECURITIES EXCHANGE ACT OF 1934 For the transition period from to |
Commission File Number: 1-14925
STANCORP FINANCIAL GROUP, INC.
(Exact name of registrant as specified in its charter)
| | |
| Oregon | | 93-1253576 |
| (State or other jurisdiction of incorporation or organization) | | (I.R.S. Employer Identification No.) |
1100 SW Sixth Avenue, Portland, Oregon, 97204
(Address of principal executive offices, including zip code)
Registrant’s telephone number, including area code: (971) 321-7000
Securities registered pursuant to Section 12(b) of the Act:
| | |
| TITLE OF EACH CLASS | | NAME OF EACH EXCHANGE ON WHICH REGISTERED |
Common Stock | | New York Stock Exchange |
Series A Preferred Share Purchase Rights | | New York Stock Exchange |
Securities registered pursuant to Section 12(g) of the Act: NONE
Indicate by check mark if the registrant is a well-known seasoned issuer, as defined in Rule 405 of the Securities Act. Yes x No ¨
Indicate by check mark if the registrant is not required to file reports pursuant to Section 13 or Section 15(d) of the Act. Yes ¨ No x
Indicate by check mark whether the registrant: (1) has filed all reports required to be filed by Section 13 or 15(d) of the Securities Exchange Act of 1934 during the preceding 12 months (or for such shorter period that the registrant was required to file such reports), and (2) has been subject to such filing requirements for the past 90 days. Yes x No ¨
Indicate by check mark whether the registrant has submitted electronically and posted on its corporate Web site, if any, every Interactive Data File required to be submitted and posted pursuant to Rule 405 of Regulation S-T (§232.405 of this chapter) during the preceding 12 months (or for such shorter period that the registrant was required to submit and post such files). Yes x No ¨
Indicate by check mark if disclosure of delinquent filers pursuant to Item 405 of Regulation S-K (§229.405 of this chapter) is not contained herein, and will not be contained, to the best of registrant’s knowledge, in definitive proxy or information statements incorporated by reference in Part III of this Form 10-K or any amendment to this Form 10-K. x
Indicate by check mark whether the registrant is a large accelerated filer, an accelerated filer, a non-accelerated filer or a smaller reporting company. See the definitions of “large accelerated filer,” “accelerated filer” and “smaller reporting company” in Rule 12b-2 of the Exchange Act.
Large accelerated filer x Accelerated filer ¨ Non-accelerated filer ¨ Smaller reporting company ¨
Indicate by check mark whether the registrant is a shell company (as defined in Rule 12b-2 of the Act). Yes ¨ No x
The aggregate market value of the voting and non-voting common equity held by non-affiliates of the registrant as of June 30, 2011, was $1,866,535,131 based upon the closing price of $42.19 on June 30, 2011. For this purpose, directors and executive officers of the registrant are assumed to be affiliates.
As of February 17, 2012, there were 44,357,908 shares of the registrant’s common stock, no par value, outstanding.
DOCUMENTS INCORPORATED BY REFERENCE
Portions of the registrant’s definitive Proxy Statement for its 2012 Annual Meeting of Shareholders are incorporated by reference in Part III.
INDEX
Part I
GENERAL
StanCorp Financial Group, Inc. was incorporated in 1998 in Oregon. As used in this report, the terms “StanCorp,” “Company,” “we,” “us” and “our” refer to StanCorp Financial Group, Inc. and its subsidiaries, unless the context indicates otherwise. Our investor website iswww.stancorpfinancial.com. We post on our investor website our annual reports on Form 10-K, our quarterly reports on Form 10-Q, our current reports on Form 8-K and amendments to those reports filed or furnished pursuant to Section 13 or 15(d) of the Securities Exchange Act of 1934 (“Exchange Act”), as amended, as soon as reasonably practicable after they are electronically filed with or furnished to the Securities and Exchange Commission (“SEC”). The filings on our investor website are available free of charge. We also make available on our investor website our Corporate Governance Guidelines, our Codes of Business Ethics (including any waivers granted to executive officers or directors), and the charters of the Audit, Organization & Compensation, and Nominating & Corporate Governance Committees of our Board of Directors. These documents are also available in print without charge to any person who requests them by writing or telephoning our Shareholder Services Department, StanCorp Financial Group, Inc., 1100 SW Sixth Avenue, Portland, OR 97204, (800) 378-8360.
We are headquartered in Portland, Oregon and are a holding company for our insurance and asset management subsidiaries as well as for subsidiaries included in our Other category. Our insurance businesses offer group and individual disability insurance, group life and accidental death and dismemberment (“AD&D”) insurance, group dental and group vision insurance, and absence management services. Through our insurance subsidiaries, we have the authority to underwrite insurance products in all 50 states as well as the District of Columbia and the U.S. territories of Guam and the Virgin Islands. Our asset management businesses offer full-service 401(k) plans, 403(b) plans, 457 plans, defined benefit plans, money purchase pension plans, profit sharing plans and non-qualified deferred compensation products and services. Our asset management businesses also offer investment advisory and management services, financial planning services, commercial mortgage loan origination and servicing, individual fixed-rate annuity products, group annuity contracts and retirement plan trust products, and manage certain real estate properties. The subsidiaries included in our Other category have owned and managed certain real estate properties held for sale, and operate our online financial life planning and management service.
MISSION AND STRATEGY
Our mission is to exceed customers’ needs for financial products and services in growing markets where the application of specialized expertise creates potential for superior shareholder returns. Our vision is to lead the financial services industry in integrity, expertise and customer service. We operate in select financial products and services markets and seek to compete on expertise, differentiation and customer service, while maintaining a strong financial position.
Our long-term strategy includes:
| | • | | Maintaining strong growth rates in traditional risk acceptance businesses (disability and group life insurance). |
| | • | | Seeking to expand growth opportunities by increasing penetration in markets where we have limited presence. |
| | • | | Further diversifying our earnings base, and taking advantage of market opportunities, demographic trends and capital synergies by increasing our asset management businesses. |
| | • | | Returning value to shareholders through strategic uses of capital. |
Our ability to accomplish this strategy is dependent on a number of factors, some of which involve risks or uncertainties. See “Competition” and “Key Factors Affecting Results of Operations” below and Item 1A, “Risk Factors,” of this Report.
STANCORP AND SUBSIDARIES
StanCorp, headquartered in Portland, Oregon, is a holding company and conducts business through wholly-owned operating subsidiaries throughout the United States. Through our subsidiaries, we have the authority to underwrite insurance products in all 50 states as well as the District of Columbia and the U.S. territories of Guam and the Virgin Islands.
Standard Insurance Company (“Standard”), our largest subsidiary, underwrites group and individual disability insurance and annuity products, group life and AD&D insurance, and provides group dental and group vision insurance, absence management services and retirement plan products. Founded in 1906, Standard is domiciled in Oregon, licensed in all states except New York, and licensed in the District of Columbia and the U.S. territories of Guam and the Virgin Islands.
Part I
The Standard Life Insurance Company of New York was organized in 2000 and is licensed to provide group long term and short term disability insurance, group life and AD&D insurance, group dental insurance and individual disability insurance in New York.
The Standardis a service mark of StanCorp and its subsidiaries and is used as a brand mark and marketing name by Standard and The Standard Life Insurance Company of New York.
Standard Retirement Services, Inc. (“Standard Retirement Services”) administers and services our retirement plans group annuity contracts and trust products. Retirement plan products are offered in all 50 states through Standard or Standard Retirement Services.
StanCorp Equities, Inc. (“StanCorp Equities”) is a limited broker-dealer and member of the Financial Industry Regulatory Authority. StanCorp Equities serves as principal underwriter and distributor for group variable annuity contracts issued by Standard and as the broker of record for certain retirement plans using the trust platform. StanCorp Equities holds no customer funds but provides supervision and oversight for the distribution of group variable annuity contracts and of the sales activities of all registered representatives employed by StanCorp Equities and its affiliates.
StanCorp Mortgage Investors, LLC (“StanCorp Mortgage Investors”) originates and services fixed-rate commercial mortgage loans for the investment portfolios of our insurance subsidiaries. StanCorp Mortgage Investors also generates additional fee income from the origination and servicing of commercial mortgage loans participated to institutional investors.
StanCorp Investment Advisers, Inc. (“StanCorp Investment Advisers”) is an SEC-registered investment adviser providing performance analysis, fund selection support, model portfolios and other investment advisory, financial planning and investment management services to its retirement plans clients, individual investors and subsidiaries of StanCorp.
StanCorp Real Estate, LLC is a property management company that owns and manages our Hillsboro, Oregon home office properties and other properties held for investment and held for sale and manages our Portland, Oregon home office properties.
Adaptu, LLC provides an online service to help users plan and manage their financial lives.
MARKET POSITION
Based on the United States insurance industry in force premium statistics, we have leading market positions with single digit market share in group long term and short term disability insurance, group life insurance and individual disability insurance. These statistics were based on the most recent annual Gen Re insurance industry reports available as of January 2012. The positions are as follows:
| | • | | 5th largest provider of group long term disability insurance. |
| | • | | 6th largest provider of group short term disability insurance. |
| | • | | 8th largest provider of group life insurance. |
| | • | | 7th largest provider of individual disability insurance. |
FINANCIAL STRENGTH AND CREDIT RATINGS
Financial strength ratings are gauges of our claims paying ability and are an important factor in establishing the competitive position of insurance companies. In addition, ratings are important for maintaining public confidence in our company and in our ability to market our products. Rating organizations regularly review the financial performance and condition of insurance companies, including ours. In addition, credit ratings on our 10-year senior notes (“Senior Notes”) and junior subordinated debentures (“Subordinated Debt”) are tied to our financial strength ratings. A ratings downgrade could increase surrender levels for our annuity products, adversely affect our ability to market our products and increase costs of future debt issuances.
Standard & Poor’s (“S&P”), Moody’s Investors Service, Inc. (“Moody’s”) and A.M. Best Company (“A.M. Best”) provide financial strength ratings on Standard.
| | |
| 2 | | STANCORP FINANCIAL GROUP, INC. |
Standard’s financial strength ratings as of January 2012 were:
| | | | |
| S&P | | Moody’s | | A.M. Best |
A+ (Strong) | | A1 (Good) | | A (Excellent)(1) |
5th of 20 ratings | | 5th of 21 ratings | | 3rd of 13 ratings |
| Outlook: Stable | | Outlook: Negative | | Outlook: Stable |
| | (1) | | Also includes Standard Life Insurance Company of New York |
Credit ratings assess credit quality and the likelihood of issuer default. S&P, Moody’s and A.M. Best provide ratings on StanCorp’s Senior Notes and Subordinated Debt. S&P and A.M. Best also provide issuer credit ratings for both Standard and StanCorp.
Our debt ratings and issuer credit ratings as of January 2012, which we believe are indications of our liquidity and ability to make payments, were:
| | | | | | |
| | | S&P | | Moody’s | | A.M. Best |
StanCorp debt ratings: | | | | | | |
Senior Notes | | BBB+ | | Baa1 | | bbb+ |
Subordinated Debt | | BBB- | | Baa2 | | bbb- |
| | | |
Issuer credit ratings: | | | | | | |
Standard | | A+ | | — | | a+(1) |
StanCorp | | BBB+ | | — | | bbb+ |
| | | |
| Outlook | | Stable | | Negative | | Negative(1) |
| | (1) | | Also includes Standard Life Insurance Company of New York |
During the second quarter of 2011, A.M. Best revised its outlook to negative from stable for the issuer credit rating of StanCorp, primarily related to elevated claims incidence in our group long term disability business.
Following the release of our results for the second quarter of 2011, both S&P and Moody’s took rating actions on StanCorp and our insurance subsidiaries. S&P lowered all of its ratings on StanCorp and Standard while maintaining a stable outlook. Moody’s lowered its outlook on the financial strength and issuer credit ratings from stable to negative. These changes in ratings and outlook are primarily due to a significant increase in claims incidence in our group long term disability business.
We believe our well-managed underwriting and claims operations, high-quality invested asset portfolios, enterprise risk management processes and strong capital position will continue to support our financial strength ratings and strong credit standing. See Part II, Item 7, “Management’s Discussion and Analysis of Financial Condition and Results of Operations—Liquidity and Capital Resources—Asset-Liability and Interest Rate Risk Management” and Part II, Item 7, “Management’s Discussion and Analysis of Financial Condition and Results of Operations—Capital Management.” In addition, we remain well within our financial covenants. See Part II, Item 7, “Management’s Discussion and Analysis of Financial Condition and Results of Operations—Liquidity and Capital Resources—Financing Cash Flows.”
SEGMENTS
We operate through two reportable segments: Insurance Services and Asset Management, as well as an Other category. Subsidiaries, or operating segments, have been aggregated to form our reportable segments. Resources are allocated and performance is evaluated at the segment level.
Of our total $2.87 billion in revenues for 2011, revenues of $2.50 billion were from our Insurance Services segment, revenues of $390.6 million were from our Asset Management segment and losses of $14.8 million were from our Other category. Revenues from the Other category included net capital losses of $6.9 million. See Part II, Item 7, “Management’s Discussion and Analysis of Financial Condition and Results of Operations—Consolidated Results of Operations—Revenues” and Item 8, “Financial Statements and Supplementary Data—Notes to Consolidated Financial Statements—Note 5—Segments” for segment information regarding revenues, expenses and total assets for the years 2011, 2010 and 2009.
Part I
Insurance Services Segment
The Insurance Services segment offers group and individual disability insurance, group life and AD&D insurance, group dental and group vision insurance, and absence management services to individuals and employer groups ranging in size from two lives to more than 173,000 lives. We have approximately 33,000 group insurance policies in force, covering approximately 6.8 million employees as of December 31, 2011.
Our group insurance products are sold by sales representatives through independent employee benefit brokers and consultants. The sales representatives, who are employees of the Company, are compensated through salary and incentive compensation programs and are located in 41 field offices in principal metropolitan areas of the United States. The field offices also provide sales support and customer service through field administrative staff. Our arrangements with brokers include compensation established at the time of sale (commissions or fees) and, in some situations, also include compensation related to the overall performance of a block of business (performance-related compensation). In most cases, the overall performance of a block of business is measured in terms of volume and persistency (customer retention).
Group long term disability insurance contributed 37.4% of 2011 premiums for the segment. Group long term disability insurance provides partial replacement of earnings to insured employees who become disabled for extended periods of time.
Our basic long term disability product covers disabilities that occur during the policy period at both work and elsewhere. In order to receive long term disability benefits, an employee must be continuously disabled beyond a specified waiting period, which generally ranges from 30 to 180 days. The benefits are usually reduced by other income that the disabled employee receives from sources such as social security disability, workers compensation and sick leave. The benefits may also be subject to certain maximum amounts and benefit periods. Historically, approximately 50% of all claims filed under our long term disability policies close within 24 months. However, claims caused by more severe disabling conditions may be paid over longer periods, including up to normal retirement age or longer.
Generally, group long term disability policies offer rate guarantees for periods from one to three years. While we can prospectively re-price and re-underwrite coverage at the end of these guarantee periods, we must pay benefits with respect to claims incurred during these periods without being able to increase guaranteed premium rates during the same periods.
Group short term disability insurance contributed 9.7% of 2011 premiums for the segment. Our basic short term disability products generally cover only disabilities occurring outside of work. Short term disability insurance generally requires a short waiting period, ranging from one to 30 days, before an insured employee may receive benefits, with maximum benefit periods generally not exceeding 180 days. Group short term disability benefits may also be reduced by other income, such as sick leave that a disabled insured employee may receive.
Individual disability insurance contributed 8.0% of 2011 premiums for the segment. The products include non-cancelable disability coverage that provides insurance at a guaranteed fixed premium rate for the life of the contract, and guaranteed renewable coverage where premium rates are guaranteed for limited periods and are subject to change thereafter. We also offer a product with features that provide coverage in the event of partial disability or loss of income while caring for a family member with a serious health condition as well as medical and legal specialty protection. This segment also sells business overhead expense coverage that reimburses covered operating expenses when the insured is disabled, and business equity buy-out coverage that provides payment for the purchase, by other owners or partners, of the insured’s ownership interest in a business in the event of total disability. Non-cancelable disability insurance policies represented 79.0% of individual disability sales for 2011.
Our individual disability insurance products are sold nationally by brokers through master general agents, primarily to physicians, lawyers, executives, other professionals and small business owners. The compensation paid to brokers and master general agents is based primarily on a percentage of premiums. Master general agents are eligible for a bonus based on sales volume of business they have written.
Group life and AD&D insurance contributed 41.1% of 2011 premiums for the segment. Group life insurance products provide coverage to insured employees for a specified period and have no cash value (amount of cash available to an insured employee on the surrender of, or withdrawal from, the life insurance policy). Coverage is offered to insured employees and their dependents. AD&D insurance is usually provided in conjunction with group life insurance, and is payable after the accidental death or dismemberment of the insured in an amount based on the face amount of the policy or dismemberment schedule.
| | |
| 4 | | STANCORP FINANCIAL GROUP, INC. |
Our other insurance premiums include group dental and group vision insurance and contributed 3.8% of 2011 premiums for the segment. Group dental products provide coverage to insured employees and their dependents for preventive, basic and major dental expenses, and also include an option to purchase orthodontia benefits. We offer three dental plans including a traditional plan, a reduced cost plan and a cost containment plan that are differentiated by levels of service and cost. Standard has a strategic marketing alliance with Ameritas Life Insurance Corp. (“Ameritas”), which offers Standard’s policyholders flexible dental coverage options and access to Ameritas’ nationwide preferred provider organization panel of dentists.
Our group vision products provide coverage to insured employees and their dependents for essential eye care services including exams, frames, a variety of lens options and contact lenses. We offer three vision plans that are differentiated by vision-care provider network coverage.
We also offer absence management services that allow employers to outsource administrative services and compliance support for short term disability, family medical leave, leave of absence, paid time off, and other employer-specific leave programs.
Asset Management Segment
The Asset Management segment offers full-service 401(k) plans, 403(b) plans, 457 plans, defined benefit plans, money purchase pension plans, profit sharing plans and non-qualified deferred compensation products and services through an affiliated broker-dealer. This segment also offers investment advisory and management services, financial planning services, commercial mortgage loan origination and servicing, individual fixed-rate annuity products, group annuity contracts and retirement plan trust products.
Retirement plans contributed 46.7% of 2011 revenues for the segment. Investment services for 401(k), defined benefit plans and governmental 457 plans are provided through a non-registered group annuity contract with third-party brand name mutual funds through a separate account and a stable value investment option managed by Standard. These plan services also are provided through an open architecture (NAV) platform offering mutual funds and a stable value investment option managed by Standard. Plans on the NAV platform can choose from any mutual fund that our trading partners are able to trade. We also provide a stable value investment option available on an investment-only basis to retirement plans for which Standard does not provide administrative services. Retirement plan assets under administration were $13.8 billion at December 31, 2011.
Mutual funds offered through the group annuity separate account as of December 31, 2011 are limited to those funds that have been evaluated through a due diligence process. Representative fund companies are: Davis Funds, Dodge & Cox, Federated Investors Funds, Harbor Funds, Oppenheimer Funds, T. Rowe Price and Vanguard Funds. Funds offered in our group annuity retirement plans are regularly evaluated for performance, expense ratios, risk statistics, style consistency, industry diversification and management through the investment advisory service we provide to our customers. Funds are added and removed as part of this evaluation process. StanCorp Investment Advisers provides fund performance analysis and selection support to 87% of our group annuity plan sponsors. All group annuity contracts are distributed through StanCorp Equities.
Services for 403(b) and non-qualified deferred compensation plans are available on the NAV platform. Previously they have been provided through a registered group variable annuity contract with a stable value investment option managed by Standard and separate account investment options. The registered product was phased out during 2011, and held no assets as of December 31, 2011.
Our target market for retirement plans is primarily small to mid-size businesses. Our retirement plans products and services are sold primarily through registered investment advisors, brokers, employee benefit consultants, investment advisors and other distributors served by our sales representatives throughout the United States. These distributors are usually compensated based on a percentage of the deposits or assets under administration. Compensation is disclosed to the customer by either Standard or Standard Retirement Services. Most of our retirement plan customers receive financial, record keeping and administrative services, although the option is available to receive only financial and record keeping services or financial services only.
The primary sources of revenue for the retirement plans business include plan administration fees, asset-based fees and investment income on general account assets under administration, a portion of which is credited to policyholders. In
Part I
addition, premiums and benefits to policyholders reflect the conversion of retirement plan assets into life-contingent annuities, which is an option that can be selected by plan participants at the time of retirement.
The Standard earned a total of four Best in Class awards inPlanSponsor Magazine’s 2011 Defined Contribution Survey. All of the Best in Class awards were in the $5 million to $50 million in plan assets category.
Individual annuities contributed 42.8% of 2011 revenues for the segment. The individual annuity products sold by this segment are primarily fixed-rate and indexed deferred annuities. This segment also sells immediate annuities. Our target market for annuities is any individual seeking conservative investments to meet their retirement or other financial goals. The fixed-rate annuity product portfolio includes deferred annuities with initial interest rate guarantees generally ranging from one to six years and a full array of single premium immediate annuity income payment options. We offer an indexed annuity product that uses over the counter call-spread options to hedge the index performance of the policies.
Fixed-rate annuities are distributed through national marketing organizations, brokers and financial institutions and compensation is primarily based on a percentage of premiums and deposits related to the business sold. Master General Agents are eligible for a bonus based on the volume of annuity business sold by financial institutions and brokers they coordinate.
Most of our annuity business deposits are not recorded as premiums, but rather are recorded as liabilities. Individual fixed-rate annuity deposits earn investment income, a portion of which is credited to policyholders. Annuity premiums consist of premiums on life-contingent annuities, which are a small portion of total sales.
Our other financial services business includes our investment advisory, real estate management and commercial mortgage loan origination businesses. These businesses contributed 10.5% of 2011 revenues for the segment.
Our investment advisory business, StanCorp Investment Advisers, is an SEC-registered investment adviser providing performance analysis, fund selection support, model portfolios and other investment advisory and investment management services. Our target market is our retirement plan clients and individual investors with a minimum of $250,000 in portfolio assets.
Our commercial mortgage loans subsidiary, StanCorp Mortgage Investors, underwrites, originates and services fixed-rate commercial mortgage loans, generally between $250,000 and $5 million per loan for the investment portfolios of our insurance subsidiaries. It also generates additional fee income from the origination and servicing of commercial mortgage loans participated to institutional investors. The target market for commercial mortgage loans is small retail, office, and industrial properties located throughout the continental United States.
Other
In addition to our two segments, we report our holding company and corporate activities in the Other category. This category includes return on capital not allocated to the product segments, holding company expenses, operations of certain unallocated subsidiaries, interest on debt, other unallocated expenses including costs incurred during our 2009 operating expense reduction initiatives, net capital gains and losses related to the impairment or the disposition of our invested assets and adjustments made in consolidation.
COMPETITION
Competition for the sale of our products comes primarily from other insurers and financial services companies such as banks, broker-dealers, mutual funds, and managed care providers for employer groups, individual consumers and distributors. Some competitors have greater financial resources, offer a broader array of products and have higher financial strength ratings. Pricing is competitive in the markets we serve. We do not seek to compete primarily on price. While we believe our products and service provide superior value to our customers, a significant price difference between our products and those of some of our competitors may result in periods of declining new sales, reduced persistency represented by customer retention, declining premium levels and increased sales force attrition. See “Key Factors Affecting Results of Operations—Pricing.”
KEY FACTORS AFFECTING RESULTS OF OPERATIONS
Our Insurance Services segment represented approximately 76%, 85% and 91% of total income before income taxes, excluding the Other category, for the years ended December 31, 2011, 2010 and 2009, respectively. In addition to competition, four primary factors can have a critical impact on the financial results of our Insurance Services segment operations: pricing; claims experience; wage, employment and benefit levels; and interest rates.
| | |
| 6 | | STANCORP FINANCIAL GROUP, INC. |
Our Asset Management segment represented approximately 24%, 15% and 9% of total income before income taxes, excluding the Other category, for the years ended December 31, 2011, 2010 and 2009, respectively. The financial results of the Asset Management segment are primarily impacted by employment and benefit levels, interest rates and equity market performance.
Pricing. One of the key components of our pricing decisions for many of our insurance products is the investment return available to us. In periods of decreasing or low interest rates, the returns available to us from our primary investments, fixed maturity securities—available-for-sale (“fixed maturity securities”) and commercial mortgage loans, decline. This may require us to increase the price of some of our products in order to maintain our targeted returns. If our competitors do not make similar adjustments to their product pricing or if they have a higher return on investments, our products may be more expensive than those offered by competitors. Alternatively, in periods when interest rates are increasing, we may be able to reduce premium rates, and therefore reduce pricing pressure to customers. Given the negative financial consequences of under-pricing, we believe that our practice of maintaining a disciplined approach to product pricing provides the best long-term pricing strategy, higher levels of persistency, and therefore, the best long-term financial success for our company.
Claims Experience. We have a large and well-diversified insurance business. However, claims experience can fluctuate widely, particularly from quarter to quarter. The predominant factors affecting claims experience are incidence, represented by the number of claims, and severity, represented by the length of time a disability claim is paid and the size of the claim. These factors can fluctuate widely within and between our insurance products.
Wage, Employment and Benefit Levels. In our insurance businesses, premium rates are based, in part, on total salaries covered. The rate of wage and employment growth can influence organic growth of premiums. In addition, economic conditions can impact demand for the group insurance products we offer, and can increase competition as insurers compete for market share as overall market growth declines.
In our asset accumulation businesses, the growth in wages and employment levels affects the level of new deposits for the retirement plans we administer, which affects the amount of administrative fee revenues we earn.
Interest Rates. Our financial results are sensitive to changing interest rates. Changes in interest rates affect product pricing for our insurance businesses because premiums collected today must be invested to provide a return sufficient to meet the future claims of policyholders. Therefore, we closely monitor changes in interest rates and make changes to our pricing, as appropriate. Interest rates also affect the discount rates we use to establish reserves.
For those products in our asset accumulation businesses where deposits are invested in securities managed by us, achieving adequate interest rates is important to meet customer obligations, including our annuity obligations.
Equity Market Performance. Changes in equity market performance affect the value of the assets under administration for our retirement plans business, which is a primary driver of administrative fee revenues we earn.
RISK MANAGEMENT
We manage our risk associated with our businesses through the following practices:
| | • | | Sound product design and underwriting. |
| | • | | Effective claims management. |
| | • | | Broad diversification of risk by customer geography, industry, size and occupation. |
| | • | | Maintenance of a strong financial position. |
| | • | | Maintenance of reinsurance and risk pool arrangements. |
| | • | | Sufficient alignment of assets and liabilities to meet financial obligations. |
Diversification of Products
We achieve earnings diversification by offering multiple insurance products such as group and individual disability insurance, group life and AD&D insurance, group dental and group vision insurance, and absence management services. In addition, we diversify our earnings base through our asset management businesses, which include products such as full-service retirement plans, money purchase pension plans, defined benefit plans, non-qualified deferred compensation products, investment advisory and management services, financial planning services, commercial mortgage loan origination
Part I
and servicing, individual fixed-rate annuity products, group annuity contracts and retirement plan trust products. These products have differing price, market and risk characteristics. Our strategy is to further diversify our earning s base and take advantage of market opportunities, demographic trends and capital synergies by increasing our asset accumulation and asset administration businesses.
Diversification by Customer Industry, Geography and Size
We seek to diversify risk by customer industry, geography and size measured by the number of insured employees in each of our business segments. Over half of our group long term disability and group life insurance premiums come from industries in which we have expertise and a competitive advantage. These industries include the public sector, education, health care and utilities.
The following tables set forth in force premium distribution by customer industry, geography and size for group long term disability and group life insurance products:
| | | | |
| Customer Industry | | December 31, 2011 | |
Public | | | 26 | % |
Education | | | 23 | |
Health Care | | | 10 | |
Professional | | | 9 | |
Manufacturing | | | 9 | |
Finance | | | 7 | |
Transportation | | | 2 | |
Services | | | 2 | |
Retail | | | 1 | |
Utilities | | | 1 | |
Other | | | 10 | |
| | | | | |
Total | | | 100 | % |
| | | | |
| Customer Geography | | December 31, 2011 | |
West | | | 35 | % |
Central | | | 31 | |
Southeast | | | 18 | |
Northeast | | | 16 | |
| | | | | |
Total | | | 100 | % |
| | | | |
| Customer Size (Employees) | | December 31, 2011 | |
2-99 | | | 12 | % |
100-2,499 | | | 37 | |
2,500-7,499 | | | 18 | |
7,500 and above | | | 33 | |
| | | | | |
Total | | | 100 | % |
Reinsurance
In order to limit our losses from large claim exposures, we enter into reinsurance agreements with other insurance companies. We review our retention limits based on size and experience. The maximum retention limit per individual for group life and AD&D is $750,000. Our maximum retention limit per individual for group disability insurance is $15,000 of monthly benefit. Our maximum retention limit per individual for individual disability insurance is $6,000 of monthly benefit.
Standard maintains a strategic marketing alliance with Ameritas that offers Standard’s policyholders more flexible dental coverage options and access to Ameritas’ nationwide preferred provider organization panel of dentists. As part of this
| | |
| 8 | | STANCORP FINANCIAL GROUP, INC. |
alliance, Standard and Ameritas entered into a reinsurance agreement. In 2011, the agreement provided for 24.2% of the net dental premiums written by Standard and the risk associated with this premium to be ceded to Ameritas.
Standard participates in a reinsurance and third-party administration arrangement with Northwestern Mutual Life Insurance Company (“Northwestern Mutual”) under which Northwestern Mutual group long term and short term disability products are sold using Northwestern Mutual’s agency distribution system. Generally, Standard assumes 60% of the risk, and receives 60% of the premiums for the policies issued. If Standard were to become unable to meet its obligations, Northwestern Mutual would retain the reinsured liabilities. Therefore, in accordance with an agreement with Northwestern Mutual, Standard established a trust for the benefit of Northwestern Mutual with the market value of assets in the trust equal to Northwestern Mutual’s reinsurance receivable from Standard. The market value of assets required to be maintained in the trust at December 31, 2011, was $230.6 million. Premiums assumed by Standard for the Northwestern Mutual business accounted for approximately 3% of our total premiums for each of the three years 2011, 2010 and 2009. In addition to assuming risk, Standard provides product design, pricing, underwriting, legal support, claims management and other administrative services under the arrangement.
In the fourth quarter of 2011, Standard entered into a Yearly Renewable Term (“YRT”) reinsurance agreement, with Canada Life Assurance Company to cede a share of the Company’s group life insurance risk in order to reduce its losses and provide relief in the event of a catastrophe.
We also maintain reinsurance coverage for certain catastrophe losses related to group life and AD&D, with partial coverage of nuclear, biological and chemical acts of terrorism. Through a combination of this agreement and our participation in a catastrophe reinsurance pool discussed below, we have coverage of up to $480.6 million per event.
We are part of a catastrophe reinsurance pool with other insurance companies. This pool spreads catastrophe losses from group life and AD&D over 23 participating members. The annual fee we paid in 2011 to participate in the pool was less than $30,000. As a member of the pool, we are exposed to maximum potential losses experienced by other participating members of up to $111.0 million for a single event for losses submitted by a single company and a maximum of $277.9 million for a single event for losses submitted by multiple companies. Our percentage share of losses experienced by pool members will change over time as it is a function of our group life and AD&D in force relative to the total group life and AD&D in force for all pool participants. The reinsurance pool does not exclude war or nuclear, biological and chemical acts of terrorism.
The Terrorism Risk Insurance Act of 2002 (“TRIA”), which has been extended through 2014, provides for federal government assistance to property and casualty insurers in the event of material losses due to terrorist acts on behalf of a foreign person or foreign interest. Due to the concentration of risk present in group life insurance and the fact that group life insurance is not covered under TRIA, an occurrence of a significant catastrophe or a change in the on-going nature and availability of reinsurance and catastrophe reinsurance could have a material effect on us.
Asset-Liability and Interest Rate Risk Management
See Part II, Item 7, “Management’s Discussion and Analysis of Financial Condition and Results of Operations—Liquidity and Capital Resources—Asset-Liability and Interest Rate Risk Management.”
INVESTMENTS
Investment management is an integral part of our business. Investments are maintained to ensure that asset types and maturities are appropriate for our policy reserves and other liabilities so that we can meet our obligations to policyholders under a wide variety of economic conditions. A substantial portion of our insurance subsidiaries’ policy liabilities result from long term disability reserves that have proven to be very stable over time, and annuity products on which interest rates can be adjusted periodically, subject to minimum interest rate guarantees. Policyholders or claimants may not withdraw funds from the large block of disability reserves. Instead, claim payments are issued monthly over periods that may extend for many years. Holding these stable long-term reserves makes it possible to allocate a significant portion of invested assets to long-term fixed-rate investments, including commercial mortgage loans and low-income housing tax credit investments. StanCorp Mortgage Investors’ unique expertise with respect to its market niche for small fixed-rate commercial mortgage loans allows us to enhance the yield on the overall investment portfolio beyond that available through fixed maturity securities with an equivalent risk profile. See Part II, Item 7, “Management’s Discussion and Analysis of Financial Condition
Part I
and Results of Operations—Liquidity and Capital Resources—Investing Cash Flows” and Item 8, “Financial Statements and Supplementary Data—Notes to Consolidated Financial Statements—Note 10—Investments.”
REGULATION
State and Federal Laws and Regulations
Standard sells its products in and is regulated by the District of Columbia, the U.S. territories of Guam and the Virgin Islands, and all states except New York. The Standard Life Insurance Company of New York sells its products in and is regulated by the state of New York. The insurance industry in the United States is subject to extensive regulation. Such regulation relates to, among other things, terms and provisions of insurance policies, market conduct practices, maintenance of capital and payment of distributions, and financial reporting on a statutory basis of accounting.
In 2011, we maintained registered group variable annuity products, which are part of a registered investment company under the Investment Company Act of 1940. This Act regulates the relationship between a registered investment company and its investment adviser.
As registered investment advisers, StanCorp Investment Advisers is subject to regulation under the Investment Advisers Act of 1940. This Act establishes, among other things, recordkeeping and reporting requirements, disclosure requirements, limitations on transactions between the adviser’s account and an advisory client’s account, limitations on transactions between the accounts of advisory clients and general anti-fraud provisions.
Violation of applicable laws and regulations can result in legal or administrative proceedings, which can result in fines, penalties, cease and desist orders or suspension or expulsion of our license to sell insurance in a particular state.
Capital Requirement—Risk-Based Capital
The National Association of Insurance Commissioners uses Risk-based Capital (“RBC”) to aid in the assessment of the statutory capital and surplus of life and health insurers. RBC employs a risk-based formula that applies prescribed factors to the various risk elements inherent in an insurer’s business to arrive at minimum capital requirements in proportion to the amount of risk assumed by the insurer. The RBC model determines an appropriate Company Action Level RBC based on our business and assets. Capital below the Company Action Level RBC would require us to prepare and submit an RBC plan to the commissioner of the state of domicile outlining the capital level we plan on maintaining. Capital below the Authorized Control Level RBC, which is 50% of the Company Action Level RBC, is the capital level at which the state of domicile is authorized to take whatever regulatory actions it considers necessary to protect the best interests of the policyholders and creditors of the insurer.
At December 31, 2011, the capital of our insurance subsidiaries was approximately 327% of the Company Action Level RBC required by regulators, which was 654% of the Authorized Control Level RBC required by our states of domicile. See Part II, Item 7, “Management’s Discussion and Analysis of Financial Condition and Results of Operations—Capital Management.”
EMPLOYEES
At December 31, 2011, StanCorp and its subsidiaries had 2,974 full-time equivalent employees, 80% of which were located in Portland, Oregon and the surrounding metropolitan area. At December 31, 2011, none of our employees were represented by unions.
FORWARD-LOOKING STATEMENTS
From time to time StanCorp or its representatives make written or oral statements, including some of the statements contained or incorporated by reference in this Annual Report on Form 10-K and in other reports, filings with the Securities and Exchange Commission (“SEC”), press releases, conferences or otherwise, that are other than purely historical information. These statements, including estimates, projections, statements related to business plans, strategies, objectives and expected operating results and the assumptions upon which those statements are based, are forward-looking statements within the meaning of the Private Securities Litigation Reform Act of 1995 and Section 21E of the Securities Exchange Act of 1934, as amended. Forward-looking statements also include, without limitation, any statement that includes words such as “expects,” “anticipates,” “intends,” “plans,” “believes,” “estimates,” “seeks,” “will be,” “will continue,”
| | |
| 10 | | STANCORP FINANCIAL GROUP, INC. |
“will likely result” and similar expressions that are predictive in nature or that depend on or refer to future events or conditions. Our forward-looking statements are not guarantees of future performance and involve uncertainties that are difficult to predict. They involve risks and uncertainties which may cause actual results to differ materially from the forward-looking statements. The risks and uncertainties are detailed in reports filed by StanCorp with the SEC, including Forms 8-K, 10-Q and 10-K, which may include, but are not limited to, the factors listed in Part II, Item 7, “Management’s Discussion and Analysis of Financial Condition and Results of Operations—Forward-Looking Statements” of this Form 10-K.
As a provider of financial products and services, our actual results of operations may vary significantly in response to economic trends, interest rates, investment performance, claims experience, operating expenses and pricing. Given these uncertainties or circumstances, investors are cautioned not to place undue reliance on such statements as a predictor of future results. We assume no obligation to publicly update or revise any forward-looking statements, whether as a result of new information, future events or otherwise.
RISK FACTORS
Risk factors that may affect our business are as follows:
| | • | | Our reserves for future policy benefits and claims related to our current and future business may prove to be inadequate—For certain of our product lines, we establish and carry, as a liability, actuarially determined reserves to meet our obligations for future policy benefits and claims. These reserves do not represent an exact calculation of our future benefit liabilities but instead are estimates based on assumptions, which can be materially affected by changes in the economy, changes in social perceptions about work ethics, emerging medical perceptions regarding physiological or psychological causes of disability, emerging or changing health issues and changes in industry regulation. Claims experience on our products can fluctuate widely from period to period. If actual events vary materially from our assumptions used when establishing the reserves to meet our obligations for future policy benefits and claims, we may be required to increase our reserves, which could have a material adverse effect on our business, financial position, results of operations or cash flows. |
| | • | | Differences between actual claims experience and underwriting and reserving assumptions may adversely affect our financial results—Our long term disability products provide coverage for claims incurred during the policy period. Generally, group policies offer rate guarantees for periods from one to three years. While we can prospectively re-price and re-underwrite coverages at the end of these guarantee periods, we must pay benefits with respect to claims incurred during these periods without being able to increase guaranteed premium rates during these periods. Historically, approximately 50% of all claims filed under our long term disability policies close within 24 months. However, claims caused by more severe disabling conditions may be paid over much longer periods, including, in some cases, up to normal retirement age or longer. Longer duration claims, in addition to a higher volume of claims than we expect, expose us to the possibility that we may pay benefits in excess of the amount that we anticipated when the policy was underwritten. The profitability of our long term disability products is thus subject to volatility resulting from the difference between our actual claims experience and our assumptions at the time of underwriting. |
| | • | | We are exposed to concentration risk on our group life insurance business—Due to the nature of group life insurance coverage, we are subject to geographical concentration risk from the occurrence of a catastrophe. |
| | • | | Catastrophe losses from a disease pandemic could have an adverse effect on us—Our life insurance operations are exposed to the risk of loss from an occurrence of catastrophic mortality caused by a disease pandemic, which could have a material adverse effect on our business, financial position, results of operations or cash flows. |
| | • | | Catastrophe losses from terrorism or other factors could have an adverse effect on us—An occurrence of a significant catastrophic event, including terrorism, natural or other disasters, or a change in the nature and availability of reinsurance and catastrophe reinsurance, could have a material adverse effect on our business, financial position, results of operations or cash flows. |
| | • | | We may be exposed to disintermediation risk during periods of increasing interest rates—In periods of increasing interest rates, withdrawals of annuity contracts may increase as policyholders seek investments with higher perceived returns. This process, referred to as disintermediation, may lead to net cash outflows. These outflows may require investment assets to be sold at a time when the prices of those assets are adversely affected by the increase in interest |
Part I
| | rates, which may result in realized investment losses. A significant portion of our investment portfolio consists of commercial mortgage loans, which are relatively illiquid, thus increasing our liquidity risk in the event of disintermediation during a period of rising interest rates. |
| | • | | Our profitability may be adversely affected by declining or low interest rates—During periods of declining or low interest rates, annuity products may be relatively more attractive investments, resulting in increases in the percentage of policies remaining in force from year to year during a period when our new investments carry lower returns. During these periods, actual returns on our investments could prove inadequate for us to meet contractually guaranteed minimum payments to holders of our annuity products. In addition, the profitability of our life and disability insurance products can be affected by declining or low interest rates. A factor in pricing our insurance products is prevailing interest rates. Longer duration claims and premium rate guarantees can expose us to interest rate risk when portfolio yields are less than those assumed when pricing these products. Mortgages and bonds in our investment portfolio are more likely to be prepaid or redeemed as borrowers seek to borrow at lower interest rates, and we may be required to reinvest those funds in lower interest-bearing investments. |
| | • | | Our investment portfolio is subject to risks of market value fluctuations, defaults, delinquencies and liquidity—Our general account investments primarily consist of fixed maturity securities—available-for-sale (“fixed maturity securities”), commercial mortgage loans and real estate. The fair values of our investments vary with changing economic and market conditions and interest rates. In addition, we are subject to default risk on our fixed maturity securities portfolio and its corresponding impact on credit spreads. Our commercial mortgage loan portfolio is subject to delinquency, default and borrower concentration risks. Related declines in market activity due to overall declining values of fixed maturity securities may result in our fixed maturity securities portfolio becoming less liquid. Also, our commercial mortgage loans are relatively illiquid and the demand for our real estate owned may remain low due to macroeconomic conditions. We may have difficulty selling our fixed maturity securities, commercial mortgage loans and real estate owned at attractive prices, in a timely manner, or both if we require significant amounts of cash on short notice. |
| | • | | Our business is subject to significant competition—Each of our business segments faces competition from other insurers and financial services companies, such as banks, broker-dealers, mutual funds, and managed care providers for employer groups, individual consumers and distributors. Since many of our competitors have greater financial resources, offer a broader array of products and, with respect to other insurers, may have higher financial strength ratings than we do, the possibility exists that any one of our business segments could be adversely affected by competition, which in turn could have a material adverse effect on our business, financial position, results of operations or cash flows. |
| | • | | A downgrade in our financial strength ratings may negatively affect our business—Financial strength ratings, which are an indicator of our claims paying ability, are an important factor in establishing the competitive position of insurance companies. Ratings are important to maintaining public confidence in our company and in our ability to market our products. Rating organizations regularly review the financial performance and condition of insurance companies, including our company. A ratings downgrade could increase our surrender levels for our annuity products, could adversely affect our ability to market our products, could increase costs of future debt issuances, and could thereby have a material adverse effect on our business, financial position, results of operations or cash flows. |
| | • | | Our profitability may be affected by changes in state and federal regulation—Our business is subject to comprehensive regulation and supervision throughout the United States (“U.S.”) including rules and regulations relating to income taxes and accounting principles generally accepted in the U.S. While we cannot predict the impact of potential or future state or federal legislation or regulation on our business, future laws and regulations, or the interpretation thereof, could have a material adverse effect on our business, financial position, results of operations or cash flows. |
| | • | | Our deferred tax asset includes net operating losses which depend on future taxable income to be realized and may be limited or impaired by future ownership changes—Our deferred tax assets include federal, state and local net operating losses. Certain of our subsidiaries as a group have generated losses in recent years. Net operating losses can be available to reduce income taxes that might otherwise be incurred on future taxable income. There can be no assurance that we will generate the future taxable income necessary to utilize our net operating losses. Furthermore, |
| | |
| 12 | | STANCORP FINANCIAL GROUP, INC. |
| | the availability of these losses to be utilized in the future can become limited if certain changes in company structure or income levels occur. In such a circumstance, we may be unable to utilize the losses even in the event the company generates future taxable income. See Part II, Item 8, “Financial Statements and Supplementary Data—Notes to Consolidated Financial Statements—Note 7—Income Taxes.” |
| | • | | Our business is subject to litigation risk—In the normal course of business, we are a plaintiff or defendant in actions arising out of our insurance business and investment operations. We are from time to time involved in various governmental and administrative proceedings. While the outcome of any pending or future litigation cannot be predicted, as of the date hereof, we do not believe that any pending litigation will have a material adverse effect on our results of operations or financial condition. However, no assurances can be given that such litigation would not materially and adversely affect our business, financial position, results of operations or cash flows. |
| | • | | Certain concentrations in our commercial mortgage loan investments may subject us to losses resulting from an economic downturn—While isolated to a small number of borrowers, the concentration of our commercial mortgage loan portfolio assets by individual borrower may expose us to potential losses resulting from an economic downturn. Although we diversify our commercial mortgage loan portfolio by location, type of property and individual borrower, such diversification may not eliminate the risk of such losses, which could have a material adverse effect on our business, financial position, results of operations or cash flows. |
| | • | | The concentration of our investments in California may subject us to losses resulting from the economic downturn—Our commercial mortgage loans are concentrated in the western region of the U.S., particularly in California. Currently, our California exposure is primarily in Los Angeles County, Orange County, San Diego County and the Bay Area Counties. We have a smaller concentration of commercial mortgage loans in the Inland Empire and the San Joaquin Valley where there has been greater economic decline. A continued decline in economic conditions in California could have a material adverse effect on our business, financial position, results of operations or cash flows. |
| | • | | The concentration of our investments in the western region of the U.S. may subject us to losses resulting from certain natural catastrophes in this area—Due to our commercial mortgage loan concentration in the western region of the U.S., particularly in California, we are exposed to potential losses resulting from certain natural catastrophes, such as earthquakes and fires, which may affect the region. Although we diversify our commercial mortgage loan portfolio within the western region by both location and type of property in an effort to reduce earthquake exposure, such diversification may not eliminate the risk of such losses, which could have a material adverse effect on our business, financial position, results of operations or cash flows. |
| | • | | We may be exposed to environmental liability from our commercial mortgage loan and real estate investments—As a commercial mortgage lender, we customarily conduct environmental assessments prior to making commercial mortgage loans secured by real estate and before taking title through foreclosure or deeds in lieu of foreclosure to real estate collateralizing delinquent commercial mortgage loans held by us. Compliance costs associated with environmental laws and regulations or any remediation of affected properties could have a material adverse effect on our results of operations or financial condition. |
| | • | | As a holding company, we depend on the ability of our subsidiaries to transfer funds to us in sufficient amounts to pay dividends to shareholders, make payments on debt securities and meet our other obligations—We are a holding company for our insurance and asset management subsidiaries as well as for the subsidiaries that comprise our Other category and do not have any significant operations of our own. Dividends and permitted payments from our subsidiaries are our principal source of cash to pay dividends to shareholders, make payments on debt securities and meet our other obligations. As a result, our ability to pay dividends to shareholders and interest payments on debt securities will primarily depend upon the receipt of dividends and other distributions from our subsidiaries. |
Many of our subsidiaries are non-insurance businesses and have no regulatory restrictions on dividends. Our insurance subsidiaries, however, are regulated by insurance laws and regulations that limit the maximum amount of dividends, distributions and other payments that they could declare and pay to us without prior approval of the states in which the subsidiaries are domiciled. Under Oregon law, Standard Insurance Company may pay dividends only from the earned surplus arising from its business. Oregon law gives the Director of the Oregon Department of Consumer and Business Services—Insurances Division (“Oregon Insurance Division”) broad discretion regarding the
Part I
approval of dividends in excess of certain statutory limitations. Oregon law requires us to receive the prior approval of the Oregon Insurance Division to pay such a dividend. See Part II, Item 7, “Management’s Discussion and Analysis of Financial Condition and Results of Operations—Capital Management—Dividends from Standard.”
| | • | | Our ability to refinance debt and raise capital in future years depends not only on contributions from our subsidiaries but also on market conditions and availability of credit in the market—Our 10-year senior notes (“Senior Notes”) of $250 million will mature in September 2012. Should market conditions and credit availability worsen, we could be required to consider alternative means of raising replacement capital for our Senior Notes. For a full discussion of debt instruments, see Part II, Item 8, “Financial Statements and Supplementary Data—Notes to Consolidated Financial Statements—Note 18—Long-Term Debt.” |
| | • | | Our portfolio of investments, including U.S. government and agency bonds and U.S. state and political subdivision bonds could be negatively impacted by U.S. credit and financial market conditions—A potential ratings downgrade of U.S. government securities could lead to future deterioration in the U.S. and global credit and financial markets. As a result, these events may materially adversely affect our business, financial condition and results of operations. |
| | • | | Our business continues to be affected by employment and wage levels—Factors influencing the growth of our group insurance and retirement plans businesses include the employment levels, benefit offerings, and salary and wage growth of our employer groups. Current economic conditions have caused our employer groups to experience lower levels of insured employees, to limit benefit offerings, to reduce work hours, or to reduce or slow the growth of wage levels. If economic conditions worsen, it could have a material adverse effect on premium levels for our group businesses and revenues for our retirement plans business. |
| | • | | Our profitability may be adversely affected by declining equity markets—U.S. and global equity markets heavily influence the value of our retirement plan assets under administration, which are a significant component from which our administrative fee revenues are derived. Sustained equity market declines could result in decreases in the value of the assets under administration in our retirement plans, which could reduce our ability to earn administrative fee revenues derived from the value of those assets. |
| | • | | Declining equity markets and low interest rates could affect the funding status of Company sponsored pension plans—Our estimates of liabilities and expenses for pension and other postretirement benefits incorporate significant assumptions including the rate used to discount the estimated future liability, the long-term rate of return on plan assets and the employee work force. Declines in the discount rate or the rate of return on plan assets resulting from the current economic downturn could increase our required cash contributions or pension-related expenses in future periods. As part of our annual requirement to evaluate our pension plans, in the fourth quarter of 2011 we made a contribution of $58 million to our pension plan based on the effects of our discount rate and the current interest rate environment. |
| | • | | Our ability to conduct business may be compromised if we are unable to maintain the availability of our systems and safeguard the security of our data in the event of a disaster or other unanticipated events—We use computer systems to store, retrieve, evaluate and utilize customer and company data and information. Our business is highly dependent on our ability to access these systems to perform necessary business functions. System failures, system outages, outsourcing risk or the failure or unwillingness of a service provider to perform could compromise our ability to perform these functions in a timely manner and could hurt our relationships with our business partners and customers. In the event of a disaster such as a natural catastrophe, fire, a blackout, a computer virus, a terrorist attack or war, these systems may be inaccessible to our employees, customers or business partners for an extended period of time. These systems could also be subject to physical and electronic break-ins and subject to similar disruptions from unauthorized tampering. This may impede or interrupt our business operations and could have a material adverse effect on our business, financial position, results of operations or cash flows. |
| | • | | The U.S. economic downturn and disruption in global financial markets could continue to adversely affect us in the near term—The U.S. economic downturn and disruption in the global financial market present risks and uncertainties. In the current economic downturn, we face the following risks: |
| | • | | Declines in revenues or profitability as a result of lost wages or lower levels of insured employees by our customers due to reductions in workforce. |
| | |
| 14 | | STANCORP FINANCIAL GROUP, INC. |
| | • | | Increases in pricing pressure and competition resulting in a loss of customers or new business as customers seek to reduce benefit costs and competitors seek to protect market share. |
| | • | | Increases in commercial mortgage loan foreclosures. |
| | • | | Increases in holdings of real estate owned properties due to a decline in demand for these properties and the decline in value of these properties during our holding period. |
| | • | | Continued pressure on budgets for public institutions could impact our customer groups in this sector, which represents a significant customer group for our employee benefits business. |
| | • | | If the U.S. economy and global financial markets do not continue to recover, it could have a lasting adverse effect on us—In addition to the risks we noted above that we are currently facing, if the U.S. economy and global financial markets do not continue to recover, we could be adversely affected in the following ways: |
| | • | | Increases in corporate tax rates to finance government-spending programs. |
| | • | | Reductions in the number of our potential lenders or to our committed credit availability due to combinations or failures of financial institutions. |
| | • | | Loss of employer groups due to business acquisitions, bankruptcy or failure. |
| | • | | Declines in the financial health of reinsurers. |
| | • | | Reduction in the value of our general account investment portfolio. |
| | • | | Declines in revenues and profitability as a result of lower levels of assets under administration. |
| Item 1B. | | Unresolved Staff Comments |
None.
Principal properties owned by Standard Insurance Company (“Standard”) and used by StanCorp Financial Group, Inc. or its subsidiaries consist of two office buildings in downtown Portland, Oregon: the Standard Insurance Center, with approximately 460,000 square feet; and the Standard Plaza, with approximately 220,000 square feet. Both of our business segments use the facilities described above. We also own two buildings in Hillsboro, Oregon, each with 72,000 square feet of office space. The Hillsboro offices are used by StanCorp Mortgage Investors, LLC and our group insurance claims operations. In addition, Standard leases approximately 160,000 square feet of office space located in downtown Portland, Oregon, for home office and claims operations. We lease 59 offices under commitments of varying terms to support our sales and regional processing offices throughout the United States. Management believes that the capacity and types of facilities are suitable and adequate for operations. See Part II, Item 8, “Financial Statements and Supplementary Data—Notes to Consolidated Financial Statements—Note 1—Summary of Significant Accounting Policies—Property and Equipment, Net.”
| Item 3. | | Legal Proceedings |
In the normal course of business, we are involved in various legal actions and other state and federal proceedings. A number of actions or proceedings were pending at December 31, 2011. In some instances, lawsuits include claims for punitive damages and similar types of relief in unspecified or substantial amounts, in addition to amounts for alleged contractual liability or other compensatory damages. In the opinion of management, the ultimate liability, if any, arising from the actions or proceedings is not expected to have a material effect on our business, financial position, results of operations or cash flows.
| Item 4. | | Mine Safety Disclosure |
Not applicable.
Part I
| Item 4A. | | Executive Officers of the Registrant |
The following table sets forth the executive officers of StanCorp Financial Group (“StanCorp”) and Standard Insurance Company (“Standard”):
| | | | | | |
| Name | | Age (as of
February 24,
2012) | | | Position |
Floyd F. Chadee | | | 54 | | | Senior Vice President and Chief Financial Officer of StanCorp and Standard |
Katherine Durham* | | | 45 | | | Vice President, Marketing and Communications of Standard |
James B. Harbolt* | | | 49 | | | Vice President, Insurance Services Group of Standard |
Scott A. Hibbs* | | | 50 | | | Vice President, Asset Management Group of Standard |
Daniel J. McMillan* | | | 45 | | | Vice President, Insurance Services Group of Standard |
J. Gregory Ness | | | 54 | | | Chairman, President and Chief Executive Officer of StanCorp and Standard |
David M. O’Brien* | | | 55 | | | Senior Vice President, Information Technology of Standard |
| Karen M. Weisz* | | | 44 | | | Vice President, Human Resources and Corporate Services of Standard |
| | * | | Denotes an officer of a subsidiary who is not an officer of StanCorp but who is considered an “executive officer” of StanCorp under the regulations of the Securities and Exchange Commission. |
Set forth below is biographical information for the executive officers of StanCorp:
Floyd F. Chadee, Ph.D., FSA, has been Senior Vice President and Chief Financial Officer of StanCorp and Standard since April 2008. Prior to this position, Mr. Chadee served as Senior Vice President and Chief Financial Officer at Assurant Employee Benefits, a part of Assurant, Inc., and had been with Assurant Employee Benefits since 1998.
Katherine Durham has been Vice President, Marketing and Communications of Standard since March 2010. Prior to joining Standard, Ms. Durham served as Vice President of Marketing for Hewlett-Packard’s Americas Imaging and Printing Group. During nine years at HP, she moved into roles of increasing responsibility in a variety of functions including business planning, market insight, communication and operations.
James B. Harbolthas been Vice President, Insurance Services Group of Standard since October 2008. Mr. Harbolt co-leads the Insurance Services segment and is responsible for employee benefit sales, actuarial, underwriting, legal, individual disability insurance and the Standard Life Insurance Company of New York. Mr. Harbolt has been with the Company since June 1994 when he joined as Assistant Counsel. From 1997 until 2000 Mr. Harbolt was Second Vice President and Associate Counsel and then Assistant Vice President and Associate Counsel in Individual Insurance. He was named Vice President of Individual Disability Insurance in 2000, and in 2005 he became Vice President and Associate Counsel of Employee Benefits Law.
Scott A. Hibbshas been Vice President, Asset Management Group of Standard since January 2009. From September 2007 to January 2009, Mr. Hibbs was a Vice President for the Insurance Services segment, which included responsibility for the individual disability insurance area and The Standard Life Insurance Company of New York. From July 2005 to September 2007 Mr. Hibbs was Vice President for the Asset Management segment, which included responsibility for StanCorp Investment Advisers, Inc. From July 2004 to July 2005, Mr. Hibbs was Vice President of Corporate Strategy and Business Development. Prior to July 2004, Mr. Hibbs was Assistant Vice President of Investor Relations and Financial Planning. Mr. Hibbs has been with the Company since 2000.
Daniel J. McMillanhas been Vice President, Insurance Services Group of Standard since October 2008. Mr. McMillan co-leads the Insurance Services segment and is responsible for all claims services, customer support, premium administration, producer services, shared services, and the enterprise contact center. Mr. McMillan has been with Standard since July 1989 and has held a number of positions in the Insurance Services segment. In 2002 Mr. McMillan was named Business Program Executive at Standard, and in 2007 he was named Vice President of Shared Services.
J. Gregory Ness, LLIF, was elected Chairman of the Board of Directors of StanCorp and Standard in December 2011. He has been President and Chief Executive Officer of StanCorp and Standard since July 2009. From September 2008 until July 2009, Mr. Ness served as President and Chief Operating Officer of StanCorp and Standard. Prior to his appointment to President and Chief Operating Officer, Mr. Ness served as Senior Vice President, Insurance Services segment of Standard since the Company’s segment realignment in January 2006. From April 2004 to January 2006, Mr. Ness was Senior Vice President, group insurance division of Standard. From 1999 to April 2004, Mr. Ness was Senior Vice President, Investments of Standard.
| | |
| 16 | | STANCORP FINANCIAL GROUP, INC. |
David M. O’Brien has been Senior Vice President of Information Technology of Standard since June 2006. From May 2004 to June 2006, Mr. O’Brien was Vice President of Information Technology. Prior to joining Standard in 2004, Mr. O’Brien served as Chief Information Officer for FEI Company.
Karen M. Weisz has been Vice President of Human Resources and Corporate Services for Standard since January 2009. From January 2008 to January 2009, Ms. Weisz was Vice President of Human Resources. Prior to joining Standard, Ms. Weisz served as Human Resources Director of new and emerging platform business groups at Intel Corporation and served Intel in various other human resource functions for more than 12 years.
Part II
| Item 5: | | Market for Registrant’s Common Equity, Related Stockholder Matters and Issuer Purchases of Equity Securities |
Our common stock is listed on the New York Stock Exchange Euronext (“NYSE”) under the symbol “SFG.” As of February 17, 2012, there were 33,675 shareholders of record of common stock.
The following tables set forth the high and low sales prices as reported by the NYSE at the close of the trading day and cash dividends paid per share of common stock:
| | | | | | | | | | | | | | | | |
| | | 2011 | |
| | | 4th Quarter | | | 3rd Quarter | | | 2nd Quarter | | | 1st Quarter | |
High | | $ | 37.12 | | | $ | 43.05 | | | $ | 47.31 | | | $ | 48.64 | |
Low | | | 26.09 | | | | 25.80 | | | | 40.26 | | | | 43.73 | |
| Dividend Paid | | | 0.89 | | | | — | | | | — | | | | — | |
| | | | | | | | | | | | | | | | |
| | | 2010 | |
| | | 4th Quarter | | | 3rd Quarter | | | 2nd Quarter | | | 1st Quarter | |
High | | $ | 46.06 | | | $ | 42.88 | | | $ | 50.19 | | | $ | 47.63 | |
Low | | | 38.34 | | | | 35.47 | | | | 40.54 | | | | 39.42 | |
| Dividend Paid | | | 0.86 | | | | — | | | | — | | | | — | |
The declaration and payment of dividends in the future is subject to the discretion of our Board of Directors. It is anticipated that annual dividends will be paid in December of each year depending on our financial condition, results of operations, cash requirements, future prospects, regulatory restrictions on the distributions from the insurance subsidiaries, the ability of the insurance subsidiaries to maintain adequate capital and other factors deemed relevant by our Board of Directors. See Item 7, “Management’s Discussion and Analysis of Financial Condition and Results of Operations—Capital Management.” See also Part I, Item 1A, “Risk Factors.”
| | |
| 18 | | STANCORP FINANCIAL GROUP, INC. |
The following graph provides a comparison of the cumulative total shareholder return on our common stock with the cumulative total return of the Standard & Poor’s (“S&P”) 500 Index, the S&P Life and Health Insurance Index and the S&P Insurance Group Index. The comparison assumes $100 was invested on December 31, 2006, in our common stock and in each of the foregoing indexes, and assumes the reinvestment of dividends. The graph covers the period of time beginning December 31, 2006, through December 31, 2011.
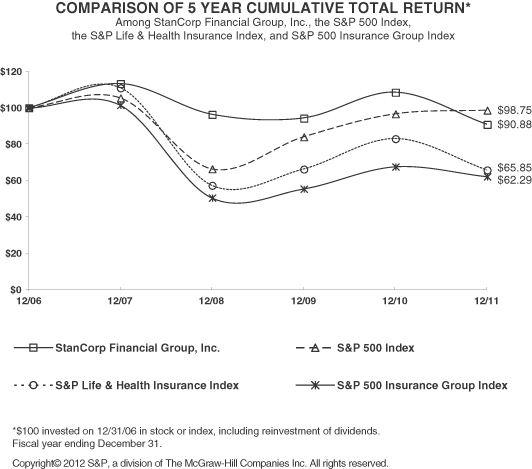
Part II
The following table sets forth share repurchase information:
| | | | | | | | | | | | | | | | |
| | | (a) Total Number of
Shares Purchased | | | (b) Average Price
Paid per Share | | | (c) Total Number
of Shares Purchased
as Part of Publicly
Announced Plans or
Programs | | | (d) Maximum Number
of Shares that May Yet
Be Purchased Under
the Plans or Programs | |
Period: | | | | | | | | | | | | | | | | |
October 1-31, 2011 | | | — | | | $ | — | | | | — | | | | 3,138,900 | |
November 1-30, 2011 | | | 10,100 | | | | 31.97 | | | | 10,100 | | | | 3,128,800 | |
December 1-31, 2011 | | | — | | | | — | | | | — | | | | 3,000,000 | |
| | |
|
|
| | | | | |
|
|
| | | | |
Total fourth quarter | | | 10,100 | | | $ | 31.97 | | | | 10,100 | | | | 3,000,000 | |
On February 8, 2010, our Board of Directors authorized 3.0 million shares of StanCorp common stock for its share repurchase program. The February 2010 authorization took effect upon the completion of the previous share repurchase authorization and expired on December 31, 2011. The total number of shares repurchased through the February 2010 authorization was 2.9 million shares. On May 16, 2011, our Board of Directors authorized an additional 3.0 million shares of StanCorp common stock. The May 2011 authorization took effect upon the expiration of the February 2010 authorization and expires on December 31, 2012. As of December 31, 2011, 128,800 shares under the February 2010 authorization expired. Share repurchases under the repurchase program are made in the open market or in negotiated transactions in compliance with the safe harbor provisions of Rule 10b-18 under regulations of the Securities Exchange Act of 1934 (“Exchange Act”). Execution of the share repurchase program is based upon management’s assessment of market conditions for its common stock, capital levels, our assessment of the overall economy and other potential growth opportunities or priorities for capital use. Repurchases are made at market prices on the transaction date. We will evaluate share repurchases opportunistically based on equity markets, capital levels and our assessment of the direction of the overall economy.
The following table sets forth share repurchase activity:
| | | | | | | | |
| | | Years ended
December 31, | |
| (Dollars in millions except per share data) | | 2011 | | | 2010 | |
Share repurchases: | | | | | | | | |
Shares repurchased | | | 2,180,100 | | | | 2,034,200 | |
Cost of share repurchases | | $ | 90.3 | | | $ | 81.8 | |
Volume weighted-average price per common share | | | 41.41 | | | | 40.19 | |
Shares remaining under repurchase authorizations | | | 3,000,000 | | | | 2,308,900 | |
| | |
Share acquired to cover tax liabilities: | | | | | | | | |
Shares acquired | | | — | | | | 8,613 | |
Cost of shares repurchased | | $ | — | | | $ | 0.4 | |
Volume weighted-average price per common share | | | — | | | | 43.01 | |
Information required by Item 5 with respect to securities authorized for issuance under equity compensation plans is contained in Part III, Item 12, “Security Ownership of Certain Beneficial Owners and Management and Related Stockholder Matters.”
| | |
| 20 | | STANCORP FINANCIAL GROUP, INC. |
| Item 6: | | Selected Financial Data |
The following table sets forth selected financial data at or for the years ended December 31 and should be read in conjunction with Item 7, “Management’s Discussion and Analysis of Financial Condition and Results of Operations” and Item 8, “Financial Statements and Supplementary Data”:
| | | | | | | | | | | | | | | | | | | | |
| (Dollars in millions—except per share data) | | 2011 | | | 2010 | | | 2009 | | | 2008 | | | 2007 | |
Income Statement Data: | | | | | | | | | | | | | | | | | | | | |
Revenues: | | | | | | | | | | | | | | | | | | | | |
Premiums | | $ | 2,153.3 | | | $ | 2,097.7 | | | $ | 2,101.9 | | | $ | 2,140.2 | | | $ | 2,078.3 | |
Administrative fees | | | 115.5 | | | | 116.5 | | | | 108.5 | | | | 114.6 | | | | 115.2 | |
Net investment income | | | 612.8 | | | | 602.5 | | | | 586.5 | | | | 541.0 | | | | 516.3 | |
Net capital losses | | | (6.9 | ) | | | (51.6 | ) | | | (26.9 | ) | | | (128.8 | ) | | | (0.6 | ) |
| | | | | | | | | | | | | | | | | | | | | |
Total revenues | | | 2,874.7 | | | | 2,765.1 | | | | 2,770.0 | | | | 2,667.0 | | | | 2,709.2 | |
| | | | | | | | | | | | | | | | | | | | | |
Benefits and expenses: | | | | | | | | | | | | | | | | | | | | |
Benefits to policyholders and interest credited | | | 1,932.2 | | | | 1,778.2 | | | | 1,721.3 | | | | 1,700.1 | | | | 1,700.6 | |
Operating expenses* | | | 708.5 | | | | 665.2 | | | | 693.8 | | | | 686.6 | | | | 636.2 | |
Interest expense | | | 38.9 | | | | 38.9 | | | | 39.2 | | | | 39.2 | | | | 30.7 | |
| | | | | | | | | | | | | | | | | | | | | |
Total benefits and expenses | | | 2,679.6 | | | | 2,482.3 | | | | 2,454.3 | | | | 2,425.9 | | | | 2,367.5 | |
| | | | | | | | | | | | | | | | | | | | | |
Income before income taxes | | | 195.1 | | | | 282.8 | | | | 315.7 | | | | 241.1 | | | | 341.7 | |
Income taxes | | | 55.8 | | | | 93.8 | | | | 106.8 | | | | 78.2 | | | | 114.2 | |
| | | | | | | | | | | | | | | | | | | | | |
Net income | | $ | 139.3 | | | $ | 189.0 | | | $ | 208.9 | | | $ | 162.9 | | | $ | 227.5 | |
Benefit Ratios, including interest credited
(% of total premiums): | | | | | | | | | | | | | | | | | | | | |
Group insurance | | | 83.1 | % | | | 77.2 | % | | | 74.7 | % | | | 73.6 | % | | | 77.4 | % |
Individual disability | | | 67.3 | | | | 66.8 | | | | 69.3 | | | | 78.7 | | | | 69.3 | |
Per Common Share: | | | | | | | | | | | | | | | | | | | | |
Basic net income | | $ | 3.10 | | | $ | 4.04 | | | $ | 4.27 | | | $ | 3.33 | | | $ | 4.39 | |
Diluted net income | | | 3.09 | | | | 4.02 | | | | 4.26 | | | | 3.30 | | | | 4.35 | |
Market value at year end | | | 36.75 | | | | 45.14 | | | | 40.02 | | | | 41.77 | | | | 50.38 | |
Dividends declared and paid | | | 0.89 | | | | 0.86 | | | | 0.80 | | | | 0.75 | | | | 0.72 | |
Basic weighted-average shares outstanding | | | 44,876,650 | | | | 46,774,277 | | | | 48,932,908 | | | | 48,917,235 | | | | 51,824,050 | |
Diluted weighted-average shares outstanding | | | 45,016,070 | | | | 47,006,228 | | | | 49,044,543 | | | | 49,292,240 | | | | 52,344,950 | |
Ending shares outstanding | | | 44,268,859 | | | | 46,159,387 | | | | 47,744,524 | | | | 48,989,074 | | | | 49,155,131 | |
Balance Sheet Data: | | | | | | | | | | | | | | | | | | | | |
General account assets | | $ | 13,840.3 | | | $ | 13,055.9 | | | $ | 12,395.0 | | | $ | 11,479.3 | | | $ | 10,596.5 | |
Separate account assets | | | 4,593.5 | | | | 4,787.4 | | | | 4,174.5 | | | | 3,075.9 | | | | 4,386.4 | |
| | | | | |
Total assets | | $ | 18,433.8 | | | $ | 17,843.3 | | | $ | 16,569.5 | | | $ | 14,555.2 | | | $ | 14,982.9 | |
| | | | | | | | | | | | | | | | | | | | | |
Long-term debt | | $ | 300.9 | | | $ | 551.9 | | | $ | 553.2 | | | $ | 561.5 | | | $ | 562.6 | |
Total liabilities | | | 16,423.3 | | | | 15,931.2 | | | | 14,834.1 | | | | 13,174.9 | | | | 13,553.9 | |
Total equity | | | 2,010.5 | | | | 1,912.1 | | | | 1,735.4 | | | | 1,380.3 | | | | 1,429.0 | |
Statutory Data: | | | | | | | | | | | | | | | | | | | | |
Net gain from operations before federal income taxes and realized capital gains (losses) | | $ | 185.1 | | | $ | 317.4 | | | $ | 375.0 | | | $ | 341.6 | | | $ | 309.3 | |
Net gain from operations after federal income taxes and before realized capital gains (losses) | | | 143.1 | | | | 202.4 | | | | 251.4 | | | | 235.0 | | | | 197.2 | |
Capital and surplus | | | 1,193.1 | | | | 1,226.8 | | | | 1,243.2 | | | | 1,154.6 | | | | 1,047.8 | |
Asset valuation reserve | | | 107.2 | | | | 95.6 | | | | 89.7 | | | | 78.8 | | | | 102.2 | |
| | * | | Includes operating expenses, commissions and bonuses, premium taxes, and the net increase in deferred acquisition costs, value of business acquired and other intangible assets. |
Part II
| Item 7. | | Management’s Discussion and Analysis of Financial Condition and Results of Operations |
The following management assessment of the financial condition and results of operations should be read in conjunction with the consolidated financial statements and related notes thereto contained in Item 8, “Financial Statements and Supplementary Data.” Our consolidated financial statements and certain disclosures made in this Form 10-K have been prepared in accordance with accounting principles generally accepted in the United States of America (“GAAP”) and require us to make estimates and assumptions that affect reported amounts of assets and liabilities and disclosures of contingent assets and contingent liabilities at the dates of the financial statements and the reported amounts of revenues and expenses during each reporting period. The estimates most susceptible to material changes due to significant judgment are identified as critical accounting policies. The results of these estimates are critical because they affect our profitability and may affect key indicators used to measure our performance. See “Critical Accounting Policies and Estimates.”
Financial measures that exclude after-tax costs related to our 2009 operating expense reduction initiatives and after-tax net capital gains and losses are non-GAAP measures. To provide investors with a broader understanding of earnings, we provide net income per diluted share excluding after-tax costs related to our 2009 operating expense reduction initiatives and after-tax net capital gains and losses, along with the GAAP measure of net income per diluted share, because costs related to operating expense reduction initiatives occur infrequently and capital gains and losses are not likely to occur in a stable pattern.
This management’s discussion and analysis of financial condition and results of operations contain forward looking statements. See Part I, Item 1A, “Risk Factors—Forward-Looking Statements.”
EXECUTIVE SUMMARY
Financial Results Overview
The following table sets forth selected consolidated financial results:
| | | | | | | | | | | | |
| | | Years ended
December 31,
| |
| (Dollars in millions except share data) | | 2011 | | | 2010 | | | 2009 | |
Net income | | $ | 139.3 | | | $ | 189.0 | | | $ | 208.9 | |
After-tax costs related to operating expense reduction initiatives | | | — | | | | — | | | | (12.0 | ) |
After-tax net capital losses | | | (4.5 | ) | | | (32.1 | ) | | | (17.3 | ) |
| | | | | | | | | | | | | |
Net income excluding after-tax costs related to operating expense reduction initiatives and after-tax net capital losses | | $ | 143.8 | | | $ | 221.1 | | | $ | 238.2 | |
| | | | | | | | | | | | | |
Diluted earnings per common share: | | | | | | | | | | | | |
Net income | | $ | 3.09 | | | $ | 4.02 | | | $ | 4.26 | |
After-tax costs related to operating expense reduction initiatives | | | — | | | | — | | | | (0.25 | ) |
After-tax net capital losses | | | (0.10 | ) | | | (0.68 | ) | | | (0.35 | ) |
| | | | | | | | | | | | | |
Net income excluding after-tax costs related to operating expense reduction initiatives and after-tax net capital losses | | $ | 3.19 | | | $ | 4.70 | | | $ | 4.86 | |
| | | | | | | | | | | | | |
| Diluted weighted-average common shares outstanding | | | 45,016,070 | | | | 47,006,228 | | | | 49,044,543 | |
The decrease in GAAP results for 2011 compared to 2010 was primarily due to a comparatively higher benefit ratio in our Insurance Services segment as a result of higher claims incidence in our group insurance business, partially offset by higher earnings in our Asset Management segment. Diluted earnings per common share for 2011 reflected the effect of a decrease in diluted weighted-average common shares outstanding, which was primarily due to share repurchases.
GAAP results for 2010 compared to 2009 reflected less favorable claims experience in the Insurance Services segment and net capital losses recognized on real estate acquired in satisfaction of debt through foreclosure or the acceptance of deeds in lieu of foreclosure on commercial mortgage loans (“real estate owned”) and additional provisions to our commercial mortgage loan loss allowance. These factors were partially offset by higher earnings in the Asset Management segment, the effect of a decrease in diluted weighted-average common shares outstanding and a reduction in operating expenses reflecting the completion of our 2009 operating expense reduction initiatives and careful expense management during 2010.
| | |
| 22 | | STANCORP FINANCIAL GROUP, INC. |
Outlook for 2012
We will continue to focus on our long-term objectives and address challenges that arise with financial discipline and from a position of financial strength. We manage for long-term profitability by focusing on business diversification, disciplined product pricing, sound underwriting, effective claims management and high-quality customer service.
We intend to remain focused on preserving the value of our business by continuing to provide excellent service to our customers and by enhancing our financial strength. We will continue to focus on optimizing shareholder value through sustainable profitability by investing in new product and service capabilities and through the strategic use of capital. We believe these actions position us well for growth as the economy recovers.
For 2012, we have established the following expectations:
| | • | | Net income per diluted share, excluding after-tax net capital gains and losses, to be in the range of $3.60 to $3.90. |
| | • | | Return on average equity, excluding after-tax net capital gains and losses from net income and accumulated other comprehensive income and losses from equity, to be in the range of 9% to 10%. |
Expectations and guidance for any specific year may vary due to short-term market trends, changes in the interest rate environment and other factors. More specifically, these expectations will be affected by the following items:
| | • | | Premium growth—Beginning in 2011, we implemented pricing actions for both new and renewal long term disability business. Given these pricing actions and the effect of the continued challenging economic environment on the employment and wage levels of our group insurance customers, we expect group insurance premium growth to be relatively flat. However, our strong customer retention in the group insurance business has created the potential for organic growth in premiums as wage growth and employment levels improve. |
| | • | | Interest rates—The interest rate environment can affect our new money investment interest rate and the discount rate used to establish long term disability reserves. If the current interest rate environment persists, we estimate the discount rate would be lowered 25 to 50 basis points during 2012. Based on our current size, a 25 basis point increase or decrease in the discount rate results in a comparable increase or decrease in quarterly pre-tax income of $1.6 million. |
| | • | | Benefit ratio—We expect that the 2012 annual benefit ratio for the group insurance business will be in the range of 80% to 82%. We expect the annual benefit ratio to return to a historical range of 74% to 78% when pricing actions on our long term disability business are completed and wage growth and employment levels return to historical levels. |
| | • | | Share repurchases—Given the continued uncertainty in the economy, we expect to be conservative in capital deployment for 2012 with share repurchases in the range of $40 million to $80 million. We will evaluate share repurchases opportunistically based on equity markets, capital levels and other opportunities for capital deployment; as well as an assessment of the direction of the overall economy. |
| | • | | Effective income tax rate—Our purchases of tax-advantaged investments will result in a lower effective income tax rate. We expect our effective income tax rate for 2012 will be approximately 26% to 27%. |
| | • | | Deferred acquisition costs—We will adopt Accounting Standards Update (“ASU”) 2010-26,Accounting for Costs Associated with Acquiring or Renewing Insurance Contracts, on a retrospective basis in the first quarter of 2012. We currently estimate that implementing the change will increase pre-tax expenses by approximately $3 to $4 million annually with a cumulative effect adjustment to retained earnings of approximately $20 to $25 million in the initial year of adoption. |
Part II
CONSOLIDATED RESULTS OF OPERATIONS
Revenues
Revenues consist of premiums, administrative fees, net investment income and net capital gains and losses. Historically, premium growth in our Insurance Services segment and administrative fee revenues growth in our Asset Management segment have been the primary drivers of consolidated revenue growth.
The following table sets forth consolidated revenues:
| | | | | | | | | | | | | | | | | | | | |
| | | Years ended
December 31,
| |
| (Dollars in millions) | | 2011 | | | Percent
Change | | | 2010 | | | Percent
Change | | | 2009 | |
Revenues: | | | | | | | | | | | | | | | | | | | | |
Premiums | | $ | 2,153.3 | | | | 2.7 | % | | $ | 2,097.7 | | | | (0.2 | )% | | $ | 2,101.9 | |
Administrative fees | | | 115.5 | | | | (0.9 | ) | | | 116.5 | | | | 7.4 | | | | 108.5 | |
Net investment income | | | 612.8 | | | | 1.7 | | | | 602.5 | | | | 2.7 | | | | 586.5 | |
Net capital losses | | | (6.9 | ) | | | 86.6 | | | | (51.6 | ) | | | (91.8 | ) | | | (26.9 | ) |
| | |
|
|
| | | | | |
|
|
| | | | | |
|
|
|
Total revenues | | $ | 2,874.7 | | | | 4.0 | | | $ | 2,765.1 | | | | (0.2 | ) | | $ | 2,770.0 | |
The increase in revenues for 2011 compared to 2010 was primarily due to an increase in premiums from our Insurance Services segment and a decrease in net capital losses. The slight decrease in revenues for 2010 compared to 2009 was primarily due to an increase in net capital losses, partially offset by an increase in administrative fee revenues and net investment income from our Asset Management segment. Net capital gains and losses are reflected in the Other category. See “Business Segments—Other—Net Capital Gains (Losses).”
Premiums
Insurance Services segment premiums are the primary driver of consolidated premiums and are affected by the following factors:
| | • | | Organic growth in our group insurance businesses, which is derived from existing policyholders’ employment and wage growth. |
| | • | | Experience rated refunds (“ERRs”). ERRs represent a cost sharing arrangement with certain group contract holders that provides refunds to the contract holders when claims experience is more favorable than contractual benchmarks, and provides for additional premiums to be paid when claims experience is below the contractual benchmarks. ERRs can fluctuate widely from quarter to quarter depending on the underlying experience of specific contracts. |
Premiums from our Asset Management segment are generated from sales of life-contingent annuities, which are a single-premium product. Due to the competitive nature of single-premium products, premiums in the Asset Management segment can fluctuate widely from quarter to quarter. See “Business Segments—Asset Management Segment.”
The following table sets forth premiums by segment:
| | | | | | | | | | | | | | | | | | | | |
| | | Years ended
December 31,
| |
| (Dollars in millions) | | 2011 | | | Percent
Change | | | 2010 | | | Percent
Change | | | 2009 | |
Premiums: | | | | | | | | | | | | | | | | | | | | |
Insurance Services | | $ | 2,145.3 | | | | 4.3 | % | | $ | 2,056.2 | | | | (0.5 | )% | | $ | 2,067.2 | |
Asset Management | | | 8.0 | | | | (80.7 | ) | | | 41.5 | | | | 19.6 | | | | 34.7 | |
Total premiums | | $ | 2,153.3 | | | | 2.7 | | | $ | 2,097.7 | | | | (0.2 | ) | | $ | 2,101.9 | |
| | |
| 24 | | STANCORP FINANCIAL GROUP, INC. |
The overall increase in premiums for 2011 compared to 2010 was primarily due to strong sales and customer retention levels, and comparatively lower ERRs for 2011 in our Insurance Services segment, partially offset by decreased premiums in our Asset Management segment related to a decrease in sales of life-contingent annuities. See “Business Segments—Insurance Services Segment” and “Business Segments—Asset Management Segment.”
The slight decrease in premiums for 2010 compared to 2009 was primarily driven by a few large case terminations in our group insurance businesses during 2009. These terminated customers contributed to premiums for a portion of 2009. In addition, premium growth was negatively affected by a lack of organic growth in our group insurance businesses, reflecting negative employment growth and lower wage growth as our customers continued to navigate a challenging economy. Also, individual disability premiums for the first quarter of 2009 included a single premium of approximately $18 million related to the termination of reinsurance agreements on certain individual disability insurance. These factors were mostly offset by strong sales and favorable persistency in 2010.
Administrative Fee Revenues
The primary driver for administrative fee revenues is the level of assets under administration in our Asset Management segment, which is driven by equity market performance and net customer deposits. Administrative fee revenues from our Insurance Services segment are primarily derived from insurance products for which we provide only administrative services.
The following table sets forth administrative fee revenues by segment:
| | | | | | | | | | | | | | | | | | | | |
| | | Years ended December 31, | |
| (Dollars in millions) | | 2011 | | | Percent
Change | | | 2010 | | | Percent
Change | | | 2009 | |
Administrative fee revenues: | | | | | | | | | | | | | | | | | | | | |
Insurance Services | | $ | 12.3 | | | | 28.1 | % | | $ | 9.6 | | | | 15.7 | % | | $ | 8.3 | |
Asset Management | | | 119.9 | | | | (1.3 | ) | | | 121.5 | | | | 6.5 | | | | 114.1 | |
Other | | | (16.7 | ) | | | (14.4 | ) | | | (14.6 | ) | | | (5.0 | ) | | | (13.9 | ) |
| | |
|
|
| | | | | |
|
|
| | | | | |
|
|
|
Total administrative fee revenues | | $ | 115.5 | | | | (0.9 | ) | | $ | 116.5 | | | | 7.4 | | | $ | 108.5 | |
The slight decrease in administrative fee revenues in our Asset Management segment for 2011 compared to 2010 was primarily due to decreased assets under administration in our retirement plan trust assets and private client wealth management assets.
The increase in administrative fee revenues in our Asset Management segment for 2010 compared to 2009 was primarily due to improvements in equity market performance leading to increased asset-based administrative fee revenues from our retirement plans business, though equity market values have shown continued volatility. This increase was partially offset by net retirement plan withdrawals primarily due to the termination of a few large plans that were not meeting our profitability objectives. See “Business Segments—Asset Management Segment.”
Part II
Net Investment Income
Net investment income is primarily affected by changes in levels of invested assets, interest rates, fluctuations in the fair value of our Standard & Poor’s (“S&P”) 500 Index call spread options (“S&P 500 Index options”) related to our indexed annuity product, commercial mortgage loan prepayment fees and call premiums on bonds.
The following table sets forth net investment income by segment and associated key indicators:
| | | | | | | | | | | | | | | | | | | | |
| | | Years ended December 31, | |
| (Dollars in millions) | | 2011 | | | Percent
Change | | | 2010 | | | Percent
Change | | | 2009 | |
Net investment income: | | | | | | | | | | | | | | | | | | | | |
Insurance Services | | $ | 341.3 | | | | 0.7 | % | | $ | 338.9 | | | | 1.1 | % | | $ | 335.1 | |
Asset Management | | | 262.7 | | | | 4.7 | | | | 251.0 | | | | 7.3 | | | | 234.0 | |
Other | | | 8.8 | | | | (30.2 | ) | | | 12.6 | | | | (27.6 | ) | | | 17.4 | |
| | |
|
|
| | | | | |
|
|
| | | | | |
|
|
|
Total net investment income | | $ | 612.8 | | | | 1.7 | | | $ | 602.5 | | | | 2.7 | | | $ | 586.5 | |
| | |
|
|
| | | | | |
|
|
| | | | | |
|
|
|
| | | | | |
Key indicators of net investment income: | | | | | | | | | | | | | | | | | | | | |
Contribution from the change in fair value of the S&P 500 Index options | | $ | (0.2 | ) | | | (102.4 | )% | | $ | 8.4 | | | | 78.7 | % | | $ | 4.7 | |
Average invested assets | | | 11,521.0 | | | | 6.1 | | | | 10,858.2 | | | | 8.9 | | | | 9,969.9 | |
Portfolio yields: | | | | | | | | | | | | | | | | | | | | |
Fixed maturity securities | | | 5.08 | % | | | | | | | 5.31 | % | | | | | | | 5.46 | % |
Commercial mortgage loans | | | 6.34 | | | | | | | | 6.45 | | | | | | | | 6.46 | |
The increase in net investment income for 2011 compared to 2010 was primarily due to an increase in average invested assets, which primarily resulted from individual annuity sales. Also contributing to the increase in net investment income for 2011 was $7.1 million of call premiums received on certain fixed maturity securities, compared to $4.4 million in 2010, and $7.5 million of prepayment fees received on commercial mortgage loans, compared to $3.4 million in 2010. Partially offsetting these increases was a decline in the change in fair value of our S&P 500 Index options and a decline in the portfolio yields for fixed maturity securities and commercial mortgage loans.
The increase in net investment income for 2010 compared to 2009 was primarily due to an increase in average invested assets, which primarily resulted from individual annuity sales. Also contributing to the increase was an increase in the contribution from the change in fair value of our S&P 500 index options. Partially offsetting these increases was a decline in the portfolio yield for fixed maturity securities.
Given the uncertainty surrounding credit spreads and the direction of interest rates, we may experience lower new money interest rates in the future if credit spreads remain tight and interest rates remain low. New money interest rates are also affected by the current volume and mix of commercial mortgage loan originations, the purchases of fixed maturity securities and other investments.
We seek investments containing call or prepayment protection to ensure our expected cash flow is not adversely affected by unexpected prepayments. Callable bonds without make-whole provisions represented 6.4% of our fixed maturity security portfolio for 2011. We also originate commercial mortgage loans containing a make-whole prepayment provision requiring the borrower to pay a prepayment fee. As interest rates decrease, potential prepayment fees increase. These larger prepayment fees deter borrowers from refinancing during a low interest rate environment. Approximately 95% of the commercial mortgage loans we originate contain this prepayment provision. Almost all of the remaining commercial mortgage loans contain fixed percentage prepayment fees that mitigate prepayments but may not fully protect our expected cash flows in the event of prepayment. Commercial mortgage loan prepayment fees were $7.5 million, $3.4 million and $2.8 million for 2011, 2010 and 2009 respectively.
| | |
| 26 | | STANCORP FINANCIAL GROUP, INC. |
Net Capital Gains (Losses)
Net capital gains and losses are reported in the Other category and are not likely to occur in a stable pattern. Net capital gains and losses primarily occur as a result of sales of our assets for more or less than carrying value, other-than-temporary impairments (“OTTI”) of assets in our bond portfolio, provisions to our commercial mortgage loan loss allowance and losses recognized due to the impairment of real estate and impairments of low-income housing tax credit investments.
The following table sets forth net capital gains and losses and associated key components:
| | | | | | | | | | | | | | | | | | | | |
| | | Years ended December 31, | |
| (In millions) | | 2011 | | | Dollar
Change | | | 2010 | | | Dollar
Change | | | 2009 | |
Net capital losses | | $ | (6.9) | | | $ | 44.7 | | | $ | (51.6) | | | $ | (24.7 | ) | | $ | (26.9 | ) |
| | | | | |
Key components of net capital gains (losses): | | | | | | | | | | | | | | | | | | | | |
Net capital gains (losses) on fixed maturity securities | | $ | 9.1 | | | $ | (6.3 | ) | | $ | 15.4 | | | $ | 20.8 | | | $ | (5.4) | |
Net capital gains (losses) on real estate investments | | | 34.7 | | | | 25.1 | | | | 9.6 | | | | 10.0 | | | | (0.4 | ) |
Net capital losses on real estate owned | | | (16.5 | ) | | | 6.4 | | | | (22.9 | ) | | | (22.9 | ) | | | — | |
Provision to our commercial mortgage loan loss allowance | | | (32.7 | ) | | | 15.4 | | | | (48.1 | ) | | | (27.0 | ) | | | (21.1 | ) |
Net capital losses for 2011 were primarily related to our commercial mortgage loan loss allowance provision and losses recognized on real estate acquired in satisfaction of debt through foreclosure or the acceptance of deeds in lieu of foreclosure on commercial mortgage loans (“real estate owned”). These losses were partially offset by net capital gains related to the sale of real estate investments and certain fixed maturity securities. See “Liquidity and Capital Resources—Investing Cash Flows—Commercial Mortgage Loans” and “Business Segments—Other—Net Capital Gains (Losses).”
The increase in net capital losses for 2010 compared to 2009 was primarily related to the foreclosure and restructuring of commercial mortgage loans with a single borrower during the second quarter of 2010 recorded as additional provisions to our commercial mortgage loan loss allowance. Capital losses were also recognized due to impairments on properties acquired from the above mentioned borrower resulting from the receipt of independent appraisals and on low-income housing tax credit investments. Due to the prescribed accounting treatment for low-income housing tax credit investments, we will record impairments if we are not able to realize any value either through reductions to our taxable income and related tax liabilities or through a sale to a third party. These losses were partially offset by net capital gains related to the sale of certain fixed maturity securities and from the sale of real estate investments. See “Liquidity and Capital Resources—Investing Cash Flows—Commercial Mortgage Loans” and “Business Segments—Other—Net Capital Gains (Losses).”
Benefits and Expenses
Benefits to Policyholders
Consolidated benefits to policyholders is primarily affected by the following factors:
| | • | | Reserves that are established in part based on premium levels. |
| | • | | Claims experience—the predominant factors affecting claims experience are claims incidence, measured by the number of claims, and claims severity, measured by the magnitude of the claim and the length of time a disability claim is paid. |
| | • | | Reserve assumptions—the assumptions used to establish the related reserves reflect expected incidence and severity, and the discount rate. The discount rate is affected by new money investment interest rates and the overall portfolio yield. See “Critical Accounting Policies and Estimates—Reserves for Future Policy Benefits and Claims.” |
| | • | | Current estimates for future benefits on life-contingent annuities. |
Part II
The following table sets forth benefits to policyholders by segment:
| | | | | | | | | | | | | | | | | | | | |
| | | Years ended
December 31, | |
| (Dollars in millions) | | 2011 | | | Percent
Change | | | 2010 | | | Percent
Change | | | 2009 | |
Benefits to policyholders: | | | | | | | | | | | | | | | | | | | | |
Insurance Services | | $ | 1,750.9 | | | | 11.8 | % | | $ | 1,566.4 | | | | 2.4 | % | | $ | 1,530.3 | |
Asset Management | | | 20.3 | | | | (62.0 | ) | | | 53.4 | | | | 17.6 | | | | 45.4 | |
| | |
|
|
| | | | | |
|
|
| | | | | |
|
|
|
Total benefits to policyholders | | $ | 1,771.2 | | | | 9.3 | | | $ | 1,619.8 | | | | 2.8 | | | $ | 1,575.7 | |
The increase in benefits to policyholders for 2011 compared to 2010 was primarily due to higher claims incidence in the group long term disability insurance business. See “Business Segments—Insurance Services Segment—Benefits and Expenses—Benefits to Policyholders (including interest credited).”
The increase in benefits to policyholders for 2010 compared to 2009 was primarily due to higher claims incidence and fewer claim closures in the group long term disability insurance business and a few large claims in the group life insurance business. Benefits to policyholders for 2009 included approximately $18 million of additional individual disability insurance reserves recorded during the first quarter of 2009 due to the termination of reinsurance on certain reinsured policies and claims. See “Business Segments—Insurance Services Segment—Benefits and Expenses—Benefits to Policyholders (including interest credited).”
Interest Credited
Interest credited represents interest paid to policyholders on retirement plan general account assets, individual fixed-rate annuity deposits and index-based interest guarantees embedded in indexed annuities (“index-based interest guarantees”) in the Asset Management segment and interest paid on life insurance proceeds on deposit in the Insurance Services segment.
Interest credited is primarily affected by the following factors:
| | • | | Growth in general account assets under management. |
| | • | | Growth in individual fixed-rate annuity liabilities. |
| | • | | Changes in new investment interest rates and overall portfolio yield, which influence our interest-crediting rate for our customers. |
| | • | | Changes in customer retention. |
| | • | | Changes in the fair value of the index-based interest guarantees. These changes may fluctuate from quarter to quarter due to changes in interest rates and equity market volatility. See “Business Segments—Asset Management Segment—Benefits and Expenses—Interest Credited” for information regarding the interest credited on our indexed annuity product. |
The following table sets forth interest credited and associated key components:
| | | | | | | | | | | | | | | | | | | | |
| | | Years ended
December 31, | |
| (Dollars in millions) | | 2011 | | | Change | | | 2010 | | | Change | | | 2009 | |
Interest credited | | $ | 161.0 | | | $ | 2.6 | | | $ | 158.4 | | | $ | 12.8 | | | $ | 145.6 | |
| | | | | |
Key components of interest credited: | | | | | | | | | | | | | | | | | | | | |
Contribution from the change in fair value of index-based interest guarantees | | $ | 1.3 | | | $ | (4.5 | ) | | $ | 5.8 | | | $ | 6.2 | | | $ | (0.4 | ) |
Average individual annuity assets under administration | | | 2,830.0 | | | | 11.5 | % | | | 2,537.6 | | | | 14.1 | % | | | 2,223.8 | |
The increases in interest credited for both 2011 and 2010 primarily reflected growth in our average individual annuity assets under administration and the change in fair value of the index-based interest guarantees.
| | |
| 28 | | STANCORP FINANCIAL GROUP, INC. |
Operating Expenses
The following table sets forth operating expenses and costs incurred during 2009 operating expense reduction initiatives:
| | | | | | | | | | | | | | | | | | | | |
| | | Years ended December 31, | |
| (Dollars in millions) | | 2011 | | | Percent
Change | | | 2010 | | | Percent
Change | | | 2009 | |
Operating expenses | | $ | 471.2 | | | | 5.6 | % | | $ | 446.2 | | | | (6.3 | )% | | $ | 476.2 | |
Pre-tax costs related to operating expense
reduction initiatives | | | — | | | | n/a | | | | — | | | | n/a | | | | 18.6 | |
The increase in operating expenses for 2011 compared to 2010 was primarily related to business growth as evidenced by premium growth, and approximately $11.0 million in project costs for information technology services. See “Business Segments.”
The decrease in operating expenses for 2010 compared to 2009 was primarily related to the completion of our 2009 operating expense reduction initiatives and careful expense management during 2010. Operating expenses for 2009 included $18.6 million of costs related to our 2009 operating expense reduction initiatives. These costs were recorded in our Other category. The cost savings resulting from these initiatives were primarily reflected in the Asset Management segment for 2010. See “Business Segments.”
Commissions and Bonuses
Commissions and bonuses primarily represent sales-based compensation, which can vary depending on the product, the structure of the commission program and other factors such as customer retention, sales, growth in assets under administration and the profitability of business in each of our segments.
The following table sets forth commissions and bonuses:
| | | | | | | | | | | | | | | | | | | | |
| | | Years ended December 31, | |
| (Dollars in millions) | | 2011 | | | Percent
Change | | | 2010 | | | Percent
Change | | | 2009 | |
| Commissions and bonuses | | $ | 218.7 | | | | 6.1 | % | | $ | 206.1 | | | | 2.0 | % | | $ | 202.0 | |
The increase in commissions and bonuses for 2011 compared to 2010 was primarily due to an increase in our Insurance Services segment sales and individual annuity business sales. The increase in commissions and bonuses for 2010 compared to 2009 was primarily due to an increase in our Insurance Services segment sales, partially offset by a change in our individual annuity product mix.
Net Change in Deferred Acquisition Costs (“DAC”), Value of Business Acquired (“VOBA”) and Other Intangible Assets
We normally defer certain acquisition-related commissions and incentive payments, certain costs of policy issuance and underwriting, and certain printing costs. These costs are then amortized into expenses over a period not to exceed the life of the related policies, which for group insurance contracts is the initial premium rate guarantee period and averages 2.5 years. VOBA primarily represents the discounted future profits of business assumed through reinsurance agreements. A portion of VOBA is amortized each year to achieve matching against expected gross profits. Our other intangible assets, consisting of customer lists and marketing agreements, are also subject to amortization. Customer lists were obtained through acquisitions of Asset Management businesses and have a combined estimated weighted-average remaining life of approximately 8.3 years. The intangible asset associated with the individual disability marketing agreement with the Minnesota Life Insurance Company (“Minnesota Life”) will be fully amortized by 2023. See “Critical Accounting Policies and Estimates—DAC, VOBA and Other Intangible Assets.”
Part II
The following table sets forth the operating impact resulting in a net increase in DAC, VOBA and other intangible assets:
| | | | | | | | | | | | | | | | | | | | |
| | | Years ended
December 31, | |
| (In millions) | | 2011 | | | Dollar
Change | | | 2010 | | | Dollar
Change | | | 2009 | |
| Deferral of acquisition costs | | $ | (98.8 | ) | | $ | (5.9 | ) | | $ | (92.9 | ) | | $ | 1.0 | | | $ | (93.9 | ) |
| Amortization of DAC, VOBA and other intangible assets | | | 80.7 | | | | 9.6 | | | | 71.1 | | | | (4.2 | ) | | | 75.3 | |
| | | | | | | | | | | | | | | | | | | | | |
Net increase in DAC, VOBA and other intangible assets | | $ | (18.1 | ) | | $ | 3.7 | | | $ | (21.8 | ) | | $ | (3.2 | ) | | $ | (18.6 | ) |
The net increase in DAC, VOBA and other intangible assets was lower for 2011 compared to 2010 primarily due an increase in the amortization of DAC which was driven by an increase in net investment income from call premiums. This increase was partially offset by losses due to the change in fair value of our indexed-based guarantees and an increase in deferrals in our Insurance services segment resulting from higher sales.
The net increase in DAC, VOBA and other intangible assets was higher for 2010 compared to 2009 due to an increase in deferrals in our group insurance businesses resulting from higher sales, a decrease in amortization driven by favorable persistency in our group and individual disability insurance businesses, changes in the interest rates environment and favorable lapse experience in the individual annuity segment.
Income Taxes
Income taxes may differ from the amount computed by applying the federal corporate tax rate of 35% to pre-tax income because of the net result of permanent differences between book and taxable income and because of the inclusion of state and local income taxes, net of the federal tax benefit.
The following table sets forth the combined federal and state effective income tax rates:
| | | | | | | | | | | | |
| | | Years ended December 31, | |
| | | 2011 | | | 2010 | | | 2009 | |
| Combined federal and state effective income tax rates | | | 28.6 | % | | | 33.2 | % | | | 33.8 | % |
During 2011 and the second half of 2010, we purchased tax-advantaged investments. As a result of these investments, our effective tax rate decreased 3.2% in 2011. The effective rate also decreased due to certain favorable permanent tax differences relative to lower income in 2011. We will continue to purchase investments that meet our yield and quality requirements.
At December 31, 2011, the years open for audit by the Internal Revenue Service (“IRS”) were 2009 through 2011. The years 2008 through 2011 were also open for audit by state authorities. See Item 8, “Financial Statements and Supplementary Data—Notes to the Consolidated Financial Statements—Note 7—Income Taxes” for more information on the change in the effective tax rate.
BUSINESS SEGMENTS
We operate through two reportable segments: Insurance Services and Asset Management, as well as an Other category. Resources are allocated and performance is evaluated at the segment level. The Insurance Services segment offers group and individual disability insurance, group life and accidental death and dismemberment (“AD&D”) insurance, group dental and group vision insurance, and absence management services. The Asset Management segment offers full-service 401(k) plans, 403(b) plans, 457 plans, defined benefit plans, money purchase pension plans, profit sharing plans and non-qualified deferred compensation products and services. This segment also offers investment advisory and management services, financial planning services, commercial mortgage loan origination and servicing, individual fixed-rate annuity products, group annuity contracts and retirement plan trust products. The Other category includes return on capital not allocated to the product segments, holding company expenses, operations of certain unallocated subsidiaries, interest on debt, unallocated expenses, net capital gains and losses and adjustments made in consolidation.
| | |
| 30 | | STANCORP FINANCIAL GROUP, INC. |
The following table sets forth segment revenues measured as a percentage of total revenues, excluding revenues from the Other category:
| | | | | | | | | | | | |
| | | Years ended
December 31, | |
| | | 2011 | | | 2010 | | | 2009 | |
Insurance Services | | | 86.5 | % | | | 85.3 | % | | | 86.3 | % |
| Asset Management | | | 13.5 | | | | 14.7 | | | | 13.7 | |
Insurance Services Segment
The Insurance Services segment is our largest segment and substantially influences our consolidated financial results.
The following table sets forth key indicators that we use to manage and assess the performance of the Insurance Services segment:
| | | | | | | | | | | | | | | | | | | | |
| | | Years ended December 31, | |
| (Dollars in millions) | | 2011 | | | Percent
Change | | | 2010 | | | Percent
Change | | | 2009 | |
Premiums | | $ | 2,145.3 | | | | 4.3 | % | | $ | 2,056.2 | | | | (0.5 | )% | | $ | 2,067.2 | |
Total revenues | | | 2,498.9 | | | | 3.9 | | | | 2,404.7 | | | | (0.2 | ) | | | 2,410.6 | |
Income before income taxes | | | 203.5 | | | | (35.1 | ) | | | 313.8 | | | | (11.9 | ) | | | 356.3 | |
Sales (annualized new premiums) reported at contract effective date | | | 358.6 | | | | 2.0 | | | | 351.7 | | | | 13.2 | | | | 310.8 | |
| | | | | |
Benefit ratios, including interest credited (%
of premiums): | | | | | | | | | | | | | | | | | | | | |
Insurance Services segment | | | 81.8 | % | | | | | | | 76.4 | % | | | | | | | 74.3 | % |
Group insurance | | | 83.1 | | | | | | | | 77.2 | | | | | | | | 74.7 | |
Individual disability | | | 67.3 | | | | | | | | 66.8 | | | | | | | | 69.3 | |
| Operating expense ratio (% of premiums) | | | 15.8 | % | | | | | | | 16.1 | % | | | | | | | 16.2 | % |
Income before income taxes decreased for 2011 compared to 2010 primarily due to less favorable claims experience in the group insurance business as a result of higher group long term disability claims incidence. Income before income taxes decreased for 2010 compared to 2009 primarily due to less favorable claims experience and lower premiums.
Revenues
Revenues for the Insurance Services segment are primarily driven by insurance premiums. The increase in revenues for 2011 compared to 2010 was primarily due to higher premiums in our group insurance business. The slight decrease in revenues for 2010 compared to 2009 was primarily due to lower premiums in our individual disability insurance business due to a single premium of approximately $18 million received in the first quarter of 2009 related to the termination of reinsurance on certain individual disability reinsured policies and claims.
Premiums
The primary factors that affect premiums for the Insurance Services segment are sales and customer retention for our insurance products and organic growth in our group insurance businesses derived from existing group policyholders’ employment and wage growth. Premium levels can also be influenced by ERRs. ERRs represent cost sharing arrangements with certain group contract holders that provide refunds to the contract holders when claims experience is better than contractual benchmarks, and provide for additional premiums to be paid when claims experience is below the contractual benchmarks. ERRs can fluctuate widely from quarter to quarter depending on the underlying experience of specific contracts.
Part II
The following table sets forth premiums and sales by line of business for the Insurance Services segment:
| | | | | | | | | | | | | | | | | | | | |
| | | Years ended December 31, | |
| (Dollars in millions) | | 2011 | | | Percent
Change | | | 2010 | | | Percent
Change | | | 2009 | |
Premiums: | | | | | | | | | | | | | | | | | | | | |
Group life and AD&D | | $ | 892.6 | | | | 6.8 | % | | $ | 835.7 | | | | 2.0 | % | | $ | 819.6 | |
Group long term disability | | | 803.3 | | | | 0.4 | | | | 799.9 | | | | (3.1 | ) | | | 825.6 | |
Group short term disability | | | 208.0 | | | | 2.1 | | | | 203.7 | | | | (1.0 | ) | | | 205.7 | |
Group other | | | 81.6 | | | | 0.1 | | | | 81.5 | | | | 2.5 | | | | 79.5 | |
Experience rated refunds | | | (12.5 | ) | | | 55.2 | | | | (27.9 | ) | | | 30.6 | | | | (40.2 | ) |
| | | | | | | | | | | | | | | | | | | | | |
Total group insurance | | | 1,973.0 | | | | 4.2 | | | | 1,892.9 | | | | 0.1 | | | | 1,890.2 | |
Individual disability | | | 172.3 | | | | 5.5 | | | | 163.3 | | | | (7.7 | ) | | | 177.0 | |
| | | | | | | | | | | | | | | | | | | | | |
Total premiums | | $ | 2,145.3 | | | | 4.3 | | | $ | 2,056.2 | | | | (0.5 | ) | | $ | 2,067.2 | |
| | | | | | | | | | | | | | | | | | | | | |
Key indicators of premiums: | | | | | | | | | | | | | | | | | | | | |
Total premiums excluding ERRs | | $ | 2,157.8 | | | | 3.5 | % | | $ | 2,084.1 | | | | (1.1 | )% | | $ | 2,107.4 | |
Group insurance sales (annualized new premiums) reported at contract effective date | | | 336.4 | | | | 1.8 | | | | 330.6 | | | | 14.9 | | | | 287.8 | |
Individual disability sales (annualized new premiums) | | | 22.2 | | | | 5.2 | | | | 21.1 | | | | (8.3 | ) | | | 23.0 | |
The increase in group insurance premiums for 2011 compared to 2010 was primarily due to strong group insurance sales and strong customer retention levels, in addition to comparatively lower ERRs. The decrease in individual disability premiums for 2010 was primarily related to a single premium of approximately $18 million received in the first quarter of 2009 related to the termination of reinsurance on certain individual disability reinsured policies and claims. The premiums received from these terminations of reinsurance were offset by approximately $18 million in additional reserves assumed.
Sales. Strong group insurance sales for 2011 reflected continued customer interest for our product and service capabilities while the group insurance market continues to be a price-competitive sales environment.
Customer Retention. Customer retention, also referred to as persistency, increased to 88.8% for 2011, compared to 88.7% for 2010. Persistency in our individual disability products remained above 90%.
Organic Growth. A portion of premium growth in our group insurance in force business is affected by employment and wage growth, changes in price per insured and the average age of employees. Unfavorable economic conditions have resulted in lower levels of employment, and have negatively affected both wage rate and employment growth since the second half of 2008. Premiums continued to be negatively affected by the economic environment which has resulted in lower wage growth and lower employment levels in our existing customer base.
Net Investment Income
The following table sets forth net investment income for the Insurance Services segment:
| | | | | | | | | | | | | | | | | | | | |
| | | Years ended December 31, | |
| (Dollars in millions) | | 2011 | | | Percent
Change | | | 2010 | | | Percent
Change | | | 2009 | |
| Net investment income | | $ | 341.3 | | | | 0.7 | % | | $ | 338.9 | | | | 1.1 | % | | $ | 335.1 | |
Net investment income is primarily affected by changes in levels of invested assets, interest rates and prepayment fees. See “Consolidated Results of Operations—Revenues—Net Investment Income.”
Benefits and Expenses
Benefits to Policyholders (including interest credited)
Benefits to policyholders is primarily affected by the following factors:
| | • | | Reserves that are established in part based on premium levels. |
| | |
| 32 | | STANCORP FINANCIAL GROUP, INC. |
| | • | | Claims experience – the predominant factors affecting claims experience are claims incidence, measured by the number of claims, and claims severity, measured by the magnitude of the claim and the length of time a disability claim is paid. |
| | • | | Reserve assumptions – the assumptions used to establish the related reserves reflect claims incidence and severity, and the discount rate. The discount rate is affected by the new money investment interest rates and the overall portfolio yield. See “Critical Accounting Policies and Estimates—Reserves for Future Policy Benefits and Claims.” |
The benefit ratio, calculated as benefits to policyholders and interest credited as a percentage of premiums, is utilized to provide a measurement of claims normalized for growth in our in force block.
The following table sets forth benefits to policyholders (including interest credited) and the benefit ratios for the Insurance Services segment:
| | | | | | | | | | | | | | | | | | | | |
| | | Years ended December 31, | |
| (Dollars in millions) | | 2011 | | | Percent
Change | | | 2010 | | | Percent
Change | | | 2009 | |
Benefits to policyholders, including interest credited | | $ | 1,755.5 | | | | 11.7 | % | | $ | 1,571.2 | | | | 2.4 | % | | $ | 1,535.0 | |
Benefit ratios, including interest credited (% of premiums): | | | | | | | | | | | | | | | | | | | | |
Insurance Services segment | | | 81.8 | % | | | | | | | 76.4 | % | | | | | | | 74.3 | % |
Group insurance | | | 83.1 | | | | | | | | 77.2 | | | | | | | | 74.7 | |
Individual disability | | | 67.3 | | | | | | | | 66.8 | | | | | | | | 69.3 | |
The increase in Insurance Services benefits to policyholders (including interest credited) for 2011 compared to 2010 was primarily due to higher claims incidence in our group long term disability insurance business. In addition, there was a reserve release for group long term disability claims of $14.6 million in 2010 and no similar release in 2011. These increases were partially offset by a decrease in additional amounts recorded to our individual disability reserves, which totaled $3.6 million for 2011, compared to $7.8 million for 2010.
The higher claims incidence in our group long term disability business has not been concentrated in any single industry, region or policy year.
The increase in Insurance Services benefits to policyholders (including interest credited) for 2010 compared to 2009 was primarily due to higher incidence and fewer claim closures in the group long term disability insurance business, a few large claims in the group life insurance business and a decrease in the group long term disability reserve release which amounted to $16.6 million for 2009 and $14.6 million for 2010. Offsetting these factors was a decrease in additional amounts recorded to our individual disability reserves which totaled $11.5 million for 2009, compared to $7.8 million for 2010, in addition to the inclusion of approximately $18 million of additional individual disability insurance reserves in 2009 benefits to policyholders recorded due to the termination of reinsurance on certain reinsured policies and claims.
The reserve releases related to our group long term disability insurance business for 2010 and 2009 were primarily due to favorable claims experience compared to reserving assumptions for certain reserve items. Claims experience is one of the factors we use in estimating our reserves. However, the favorable claims experience seen in 2010 and 2009 did not result in a significant change in our underlying assumptions or methods used to determine the estimated reserves, primarily due to the long-term nature of our group long term disability insurance business and the materiality of other factors, including the potential impact of the economic uncertainty during 2010 and 2009. We carefully monitor trends in reserve assumptions and when these trends become credible and are expected to persist, we incorporate these factors into our reserves to ensure the best estimates are established. For a complete discussion of our reserve methodology, see “Critical Accounting Policies and Estimates—Reserves for Future Policy Benefits and Claims.”
During 2011, we implemented targeted pricing increases on our group long term disability business that were, on average, in the high single digit range. These pricing increases apply to both new sales and renewal business. Our pricing reflects our long-term expectations of claims experience, demographic changes, return objectives and interest rates. We will continue to monitor our claims activity closely, but remain confident in our current underwriting methodologies. The increase in benefits to policyholders was partially offset by a higher average discount rate used for 2011 than 2010 to establish reserves on newly incurred long term disability claims.
Part II
The group insurance benefit ratio for 2011 was outside of our 2011 estimated annual range of 74% to 78%. The benefit ratio is expected to remain elevated while the economy remains weak and until pricing actions are fully implemented. Group insurance claims experience and the corresponding benefit ratio can fluctuate widely from quarter to quarter, and therefore should be analyzed over a longer period.
We generally expect the individual disability benefit ratio to trend down over the long term to reflect growth in the business outside of the large block of individual disability business assumed in 2000 from Minnesota Life. The anticipated general decrease in the expected benefit ratio does not necessarily indicate an increase in profitability; rather it reflects a change in the mix of revenues from the business.
In 2006, we adjusted the claim termination rate assumptions for the reserves on a small block of individual disability claims based on an industry table. These assumptions were further refined in 2011, 2010 and 2009 resulting in increases in reserves of $5.5 million, $12.5 million and $11.5 million, respectively. Our block of business is relatively small, and, as a result, we view a blend of the released industry table and our own experience as a more appropriate method for establishing reserve levels compared solely to our own experience. We will continue to monitor the credibility of our developing experience and, if necessary, will adjust reserves accordingly.
We refined our reserve calculation for certain other individual disability claims in 2011 and 2010 which resulted in a decrease in our individual disability reserves of $1.9 million and $4.7 million, respectively. There were no similar calculation refinements in 2009.
The following table sets forth the average discount rate used for newly incurred long term disability claim reserves and life waiver reserves:
| | | | | | | | | | | | |
| | | Years ended
December 31, | |
| | | 2011 | | | 2010 | | | 2009 | |
| Average discount rate | | | 5.13 | % | | | 5.00 | % | | | 5.00 | % |
The discount rate is based on the average rate we receive on newly invested assets during the previous 12 months, less a margin. We also consider our average investment yield and average discount rate on our entire block of claims when deciding whether to increase or decrease the discount rate. Based on our current size, every 25 basis point decrease in the discount rate would result in an increase of approximately $1.6 million per quarter of benefits to policyholders. We do not adjust group insurance premium rates based on short-term fluctuations in investment yields. Any offsetting adjustments of group insurance premium rates due to sustained changes in investment yields can take from one to three years given that most new contracts have rate guarantees in place.
If investment rates prove to be lower than provided for in the margin between the new money investment rate and the reserve discount rate, we could be required to increase reserves, which could cause expense for benefits to policyholders to increase. Given the uncertainty of the movement of future interest rates, this may result in significantly higher or lower discount rates. A sustained low interest rate environment and fewer commercial mortgage loan and tax-advantaged investments in future quarters could result in future reductions to the discount rate. The margin in our overall block of business for group insurance between the invested asset yield and the weighted-average reserve discount rate at December 31, 2011 and December 31, 2010 was 40 and 41 basis points, respectively. See “Liquidity and Capital Resources.”
Operating Expenses
The following table sets forth operating expenses for the Insurance Services segment:
| | | | | | | | | | | | | | | | | | | | |
| | | Years ended December 31, | |
| (Dollars in millions) | | 2011 | | | Percent
Change | | | 2010 | | | Percent
Change | | | 2009 | |
| Operating expenses | | $ | 338.7 | | | | 2.1 | % | | $ | 331.8 | | | | (0.6 | )% | | $ | 333.9 | |
| | |
| 34 | | STANCORP FINANCIAL GROUP, INC. |
The increase in Insurance Services operating expenses for 2011 compared to 2010 was primarily related to business growth as evidenced by premium growth. The decrease in Insurance Services operating expenses for 2010 compared to 2009 was primarily due to a decrease in lease obligations and compensation related expenses resulting from our 2009 operating expense reduction initiatives and careful expense management during 2010. This was partially offset by increased costs associated with several new customer service programs implemented in 2010.
Asset Management Segment
The following tables set forth key indicators that we use to manage and assess the performance of the Asset Management segment:
| | | | | | | | | | | | | | | | | | | | |
| | | Years ended
December 31, | |
| (In millions) | | 2011 | | | Percent
Change | | | 2010 | | | Percent
Change | | | 2009 | |
Revenues: | | | | | | | | | | | | | | | | | | | | |
Premiums | | $ | 8.0 | | | | (80.7 | )% | | $ | 41.5 | | | | 19.6 | % | | $ | 34.7 | |
Administrative fees | | | 119.9 | | | | (1.3 | ) | | | 121.5 | | | | 6.5 | | | | 114.1 | |
Net investment income | | | 262.7 | | | | 4.7 | | | | 251.0 | | | | 7.3 | | | | 234.0 | |
| | |
|
|
| | | | | |
|
|
| | | | | |
|
|
|
Total revenues | | $ | 390.6 | | | | (5.7 | ) | | $ | 414.0 | | | | 8.2 | | | $ | 382.8 | |
| | |
|
|
| | | | | |
|
|
| | | | | |
|
|
|
Income before income taxes | | $ | 62.6 | | | | 10.2 | % | | $ | 56.8 | | | | 52.3 | % | | $ | 37.3 | |
| | | | | |
Sales (Individual annuity deposits) | | | 410.3 | | | | 12.8 | | | | 363.8 | | | | (8.8 | ) | | | 398.8 | |
| | | | | |
Interest credited (% of net investment income): | | | | | | | | | | | | | | | | | | | | |
Retirement plans | | | 54.6 | % | | | | | | | 56.5 | % | | | | | | | 57.5 | % |
Individual annuities | | | 66.5 | | | | | | | | 69.0 | | | | | | | | 68.4 | |
| | | | | |
Retirement plans annualized operating expenses (% of average assets under administration) | | | 0.58 | % | | | | | | | 0.57 | % | | | | | | | 0.65 | % |
| | | | | | | | | | | | |
| | | At December 31, | |
| (Dollars in millions) | | 2011 | | | 2010 | | | Percent
Change | |
Assets under administration: | | | | | | | | | | | | |
Retirement plans general account | | $ | 1,730.2 | | | $ | 1,587.2 | | | | 9.0 | % |
Retirement plans separate account | | | 4,593.5 | | | | 4,787.4 | | | | (4.1 | ) |
| | |
|
|
| | | | |
Total retirement plans insurance products | | | 6,323.7 | | | | 6,374.6 | | | | (0.8 | ) |
Retirement plans trust products | | | 7,441.2 | | | | 8,907.1 | | | | (16.5 | ) |
Individual annuities | | | 2,975.7 | | | | 2,684.2 | | | | 10.9 | |
Commercial mortgage loans for other investors | | | 2,691.6 | | | | 2,697.3 | | | | (0.2 | ) |
Private client wealth management | | | 1,001.5 | | | | 1,224.5 | | | | (18.2 | ) |
| | |
|
|
| | | | |
Total assets under administration | | $ | 20,433.7 | | | $ | 21,887.7 | | | | (6.6 | ) |
Income before income taxes increased for 2011 compared to 2010 primarily due to higher bond call premiums and commercial mortgage loan prepayment fee revenues. Income before income taxes increased for 2010 compared to 2009 primarily due to an increase in net investment income, an increase in administrative fee revenues and reduced operating expenses resulting from the implementation of our 2009 operating expense reduction initiatives.
Revenues
Revenues for the Asset Management segment include retirement plan trust product administration fees, fees on investments held in separate account assets and private client wealth management assets under administration, and investment income on general account assets under administration. Premiums and benefits to policyholders reflect both the sale of life-contingent annuities by our individual annuity business and the conversion of retirement plan assets into
Part II
life-contingent annuities. Most of the sales for this segment are recorded as deposits and are therefore not reflected as premiums. Individual fixed-rate annuity deposits earn investment income, a portion of which is credited to policyholders.
The decrease in revenue for 2011 compared to 2010 was primarily due to a decrease in individual annuity premiums, which were driven by decreased sales of life-contingent annuities, which fluctuate widely in a price competitive market. The decrease in individual annuity premiums was partially offset by an increase in net investment income due to higher bond call premiums and commercial mortgage loan prepayment fees. The increase in revenues for 2010 compared to 2009 was primarily due to an increase in net investment income, primarily related to an increase in average individual annuity assets under administration, and administrative fee revenues, primarily due to the effect of improved equity market performance on our retirement plan assets under administration.
Premiums
Premiums for the Asset Management segment are generated from the sale of life-contingent annuities, which are primarily a single-premium product. Premiums and benefits to policyholders reflect both the sale of immediate annuities by our individual annuity business and the conversion of retirement plan assets into life-contingent annuities, which can be selected by plan participants at the time of retirement. Premiums for the segment can vary significantly from quarter to quarter due to low sales volume of life-contingent annuities and the varying size of single premiums. Increases or decreases in premiums for life-contingent annuities generally correlate with corresponding increases or decreases in benefits to policyholders.
The following table sets forth premiums by line of business for the Asset Management segment:
| | | | | | | | | | | | | | | | | | | | |
| | | Years ended
December 31, | |
| (In millions) | | 2011 | | | Dollar
Change | | | 2010 | | | Dollar
Change | | | 2009 | |
Premiums: | | | | | | | | | | | | | | | | | | | | |
Retirement plans | | $ | 2.0 | | | $ | 0.4 | | | $ | 1.6 | | | $ | 0.9 | | | $ | 0.7 | |
Individual annuities | | | 6.0 | | | | (33.9 | ) | | | 39.9 | | | | 5.9 | | | | 34.0 | |
| | | | | | | | | | | | | | | | | | | | | |
Total premiums | | $ | 8.0 | | | $ | (33.5 | ) | | $ | 41.5 | | | $ | 6.8 | | | $ | 34.7 | |
Administrative Fee Revenues
Administrative fee revenues for the Asset Management segment include asset-based and plan-based fees related to our retirement plans and private client wealth management businesses, and fees related to the origination and servicing of commercial mortgage loans. The primary driver for administrative fee revenues is the level of assets under administration for retirement plans, which is driven by equity market performance and net customer deposits. Assets under administration that produce administrative fee revenues include retirement plan separate account, retirement plan trust products, private client wealth management and commercial mortgage loans under administration for other investors.
The following tables set forth administrative fee revenues by line of business and associated key indicators for the Asset Management segment:
| | | | | | | | | | | | | | | | | | | | |
| | | Years ended
December 31, | |
| (Dollars in millions) | | 2011 | | | Percent
Change | | | 2010 | | | Percent
Change | | | 2009 | |
Administrative fee revenues: | | | | | | | | | | | | | | | | | | | | |
Retirement plans | | $ | 90.0 | | | | (2.7 | )% | | $ | 92.5 | | | | 4.5 | % | | $ | 88.5 | |
Other financial services business | | | 29.9 | | | | 3.1 | | | | 29.0 | | | | 13.3 | | | | 25.6 | |
| | | | | | | | | | | | | | | | | | | | | |
Total administrative fee revenues | | $ | 119.9 | | | | (1.3 | ) | | $ | 121.5 | | | | 6.5 | | | $ | 114.1 | |
| | |
| 36 | | STANCORP FINANCIAL GROUP, INC. |
| | | | | | | | | | | | |
| | | At December 31, |
| (Dollars in millions) | | 2011 | | | 2010 | | | Percent Change |
Key indicators of administrative fee revenues: | | | | | | | | | | |
Assets under administration: | | | | | | | | | | |
Retirement plan separate account | | $ | 4,593.5 | | | $ | 4,787.4 | | | (4.1)% |
Retirement plan trust products | | | 7,441.2 | | | | 8,907.1 | | | (16.5) |
Commercial mortgage loans for other investors | | | 2,691.6 | | | | 2,697.3 | | | (0.2) |
Private client wealth management | | | 1,001.5 | | | | 1,224.5 | | | (18.2) |
The decrease in administrative fee revenues for 2011 compared to 2010 was primarily due to a few large plan terminations in the Company’s retirement plan trust assets under administration in the first quarter and the fourth quarter of 2011, and a decline in assets under administration in our private client wealth management assets due to attrition associated with the loss of two advisers. The increase in administrative fee revenues for 2010 compared to 2009 was primarily due to the effect of improved equity market performance on our retirement plan assets under administration, higher commercial mortgage loans under administration and higher private client wealth management assets under administration. These increases occurred despite a decrease in retirement plan trust assets under administration. The decline in retirement plan trust assets under administration was primarily due to the termination of a few large trust retirement plans in the first six months of 2010 that did not meet our profitability objectives. The administrative fee revenues generated from these terminated plans were not significant.
Net Investment Income
The following table sets forth net investment income and associated key indicators for the Asset Management segment:
| | | | | | | | | | | | | | | | | | | | |
| | | Years ended
December 31, | |
| (Dollars in millions) | | 2011 | | | Change | | | 2010 | | | Change | | | 2009 | |
Net investment income: | | | | | | | | | | | | | | | | | | | | |
Retirement plans | | $ | 90.4 | | | | 3.4 | % | | $ | 87.4 | | | | 1.9 | % | | $ | 85.8 | |
Individual annuities | | | 161.0 | | | | 6.6 | | | | 151.0 | | | | 12.8 | | | | 133.9 | |
Other financial services business | | | 11.3 | | | | (10.3 | ) | | | 12.6 | | | | (11.9 | ) | | | 14.3 | |
| | | | | | | | | | | | | | | | | | | | | |
Total net investment income | | $ | 262.7 | | | | 4.7 | | | $ | 251.0 | | | | 7.3 | | | $ | 234.0 | |
| | | | | | | | | | | | | | | | | | | | | |
Key indicators of net investment income: | | | | | | | | | | | | | | | | | | | | |
| | | | | |
Average assets under administration: | | | | | | | | | | | | | | | | | | | | |
Retirement plan general account | | $ | 1,658.7 | | | | 6.1 | % | | $ | 1,563.7 | | | | 3.6 | % | | $ | 1,510.0 | |
Individual annuities | | | 2,830.0 | | | | 11.5 | | | | 2,537.6 | | | | 14.1 | | | | 2,223.8 | |
| | | | | |
Contribution from the change in fair value of the S&P 500 Index options | | $ | (0.2 | ) | | $ | (8.6 | ) | | $ | 8.4 | | | $ | 3.7 | | | $ | 4.7 | |
Commercial mortgage loan originations | | | 1,007.7 | | | | 13.5 | % | | | 887.5 | | | | 23.5 | % | | | 718.5 | |
| | | | | |
Portfolio yields: | | | | | | | | | | | | | | | | | | | | |
Fixed maturity securities | | | 5.08 | % | | | | | | | 5.31 | % | | | | | | | 5.46 | % |
Commercial mortgage loans | | | 6.34 | | | | | | | | 6.45 | | | | | | | | 6.46 | |
The increase in net investment income for 2011 compared to 2010 was primarily due to increases in our average individual annuity assets under administration and our average retirement plan general account assets under administration. Also contributing to the increase in net investment income for 2011 compared to 2010 were increases of $6.3 million of call premiums received on certain fixed maturity securities, and $4.1 million of prepayment fees received on commercial mortgage loans. These increases were partially offset by the change in fair value of our S&P 500 Index options and a decline in the portfolio yield of our fixed maturity securities and commercial mortgage loans. See Item 8, “Financial Statements and Supplementary Data—Notes to Consolidated Financial Statements—Note 11—Derivative Financial Instruments” for further derivatives disclosure.
Part II
The increase in net investment income for 2010 compared to 2009 was primarily due to an increase in average individual annuity assets under administration resulting from individual annuity sales, and an increase in average retirement plan general account assets under administration. These increases were enhanced by the change in fair value of our S&P 500 Index options. Partially offsetting these increases was a decline in the portfolio yield for our fixed maturity securities. See Item 8, “Financial Statements and Supplementary Data—Notes to Consolidated Financial Statements—Note 11—Derivative Financial Instruments” for further derivatives disclosure.
Benefits and Expenses
Benefits to Policyholders
Benefits to policyholders for the Asset Management segment primarily represent current and future benefits on life-contingent annuities. Changes in the level of benefits to policyholders will generally correlate to changes in premium levels because these annuities are primarily single-premium life-contingent annuity products with a significant portion of all premium payments established as reserves.
The following table sets forth benefits to policyholders for the Asset Management segment:
| | | | | | | | | | | | | | | | | | | | |
| | | Years ended
December 31, | |
| (Dollars in millions) | | 2011 | | | Percent
Change | | | 2010 | | | Percent
Change | | | 2009 | |
| Benefits to policyholders | | $ | 20.3 | | | | (62.0 | )% | | $ | 53.4 | | | | 17.6 | % | | $ | 45.4 | |
Interest Credited
Interest credited represents interest paid to policyholders on retirement plan general account assets, individual fixed-rate annuity deposits and index-based interest guarantees.
The following table sets forth interest credited and associated key indicators for the Asset Management segment:
| | | | | | | | | | | | | | | | | | | | |
| | | Years ended
December 31, | |
| (In millions) | | 2011 | | | Dollar
Change | | | 2010 | | | Dollar
Change | | | 2009 | |
Interest credited | | $ | 156.4 | | | $ | 2.8 | | | $ | 153.6 | | | $ | 12.7 | | | $ | 140.9 | |
Key indicators of interest credited: | | | | | | | | | | | | | | | | | | | | |
Contribution from the change in fair value of index-based interest guarantees | | $ | 1.3 | | | $ | (4.5 | ) | | $ | 5.8 | | | $ | 6.2 | | | $ | (0.4 | ) |
The increase in interest credited for 2011 compared to 2010 was primarily due to growth in our individual fixed-rate annuity assets under administration, which was partially offset by the change in fair value of the index-based interest guarantees. The increase in interest credited for 2010 compared to 2009 was primarily due to growth in our individual fixed-rate annuity assets under administration enhanced by the change in fair value of the index-based interest guarantees. See Item 8, “Financial Statements and Supplementary Data—Notes to Consolidated Financial Statements—Note 11—Derivative Financial Instruments” for further derivatives disclosure.
Operating Expenses
The following table sets forth operating expenses for the Asset Management segment:
| | | | | | | | | | | | | | | | | | | | |
| | | Years ended
December 31, | |
| (Dollars in millions) | | 2011 | | | Percent
Change | | | 2010 | | | Percent
Change | | | 2009 | |
| Operating expenses | | $ | 115.2 | | | | (3.2 | )% | | $ | 119.0 | | | | (6.2 | )% | | $ | 126.9 | |
| | |
| 38 | | STANCORP FINANCIAL GROUP, INC. |
The decrease in Asset Management operating expenses for 2011 compared to 2010 was primarily due to continued operating expense containment. The decrease in Asset Management operating expenses for 2010 compared to 2009 was due to decreases in lease obligations and compensation related expenses resulting from our 2009 operating expense reduction initiatives and careful expense management during 2010.
OTHER
In addition to our two segments, we report our holding company and corporate activities in the Other category. This category includes return on capital not allocated to the product segments, holding company expenses, operations of certain unallocated subsidiaries, interest on debt, unallocated expenses, net capital gains and losses and adjustments made in consolidation.
The following table sets forth results for the Other category:
| | | | | | | | | | | | |
| | | Years ended December 31, | |
| (Dollars in millions) | | 2011 | | | 2010 | | | 2009 | |
Loss before income taxes | | $ | (71.0 | ) | | $ | (87.8 | ) | | $ | (77.9 | ) |
| Pre-tax costs related to operating expense reduction initiatives | | | — | | | | — | | | | 18.6 | |
The decrease in losses before income taxes for 2011 compared to 2010 was primarily due to a decrease in net capital losses, partially offset by a decrease in net investment income and an increase in operating expenses related to project costs for information technology service changes and other business initiatives. These operating expenses included severance and outsourcing transition costs, which were reported in our Other category since these costs were not representative of our segment operations.
The increase in losses before income taxes for 2010 compared to 2009 was primarily due to higher net capital losses. The loss before income taxes for 2009 included costs related to our 2009 operating expense reduction initiatives, primarily related to severance costs and lease terminations. The benefits from these enhanced efficiencies began in the second half of 2009.
Net Capital Gains (Losses)
Net capital gains and losses generally are not likely to occur in a stable pattern and primarily occur as a result of OTTI of assets in our bond portfolio, provisions to our commercial mortgage loan loss allowance, losses recognized due to impairment of real estate, low-income housing tax credit investments and from sales of our assets for more or less than carrying value.
The following table sets forth net capital gains and losses and associated key components:
| | | | | | | | | | | | |
| | | Years ended
December 31, | |
| (In millions) | | 2011 | | | 2010 | | | 2009 | |
Net capital gains (losses): | | | | | | | | | | | | |
Fixed maturity securities | | $ | 9.1 | | | $ | 15.4 | | | $ | (5.4 | ) |
Commercial mortgage loans | | | (31.8 | ) | | | (46.9 | ) | | | (20.3 | ) |
Real estate investments | | | 34.7 | | | | 9.6 | | | | (0.4 | ) |
Real estate owned | | | (16.5 | ) | | | (22.9 | ) | | | — | |
Other | | | (2.4 | ) | | | (6.8 | ) | | | (0.8 | ) |
| | | | | | | | | | | | | |
Total net capital losses | | $ | (6.9 | ) | | $ | (51.6 | ) | | $ | (26.9 | ) |
| | | | | | | | | | | | | |
Key components of net capital losses: | | | | | | | | | | | | |
Provision in our commercial mortgage loan loss allowance | | $ | (32.7 | ) | | $ | (48.1 | ) | | $ | (21.1 | ) |
OTTI on fixed maturity securities | | | (1.8 | ) | | | (0.7 | ) | | | (5.9 | ) |
Impairments on real estate owned | | | (15.8 | ) | | | (25.7 | ) | | | (0.1 | ) |
Part II
The decrease in net capital losses for 2011 compared to 2010 was primarily due to higher net capital gains on the sale of real estate investments in 2011, and a comparatively smaller increase in the provision for our commercial mortgage loan loss allowance in 2011.
Net capital losses for 2010 were primarily related to the foreclosure and restructuring of commercial mortgage loans with a single borrower during the second quarter of 2010 recorded as additional provisions to our commercial mortgage loan loss allowance. Capital losses were also recognized due to impairments on properties acquired from the above mentioned borrower resulting from the receipt of independent appraisals and on low-income housing tax credit investments. These losses were partially offset by net capital gains related to the sale of certain fixed maturity securities and from the sale of real estate investments.
LIQUIDITY AND CAPITAL RESOURCES
Asset-Liability Matching and Interest Rate Risk Management
Asset-liability management is a part of our risk management structure. The risks we assume related to asset-liability mismatches vary with economic conditions. The primary sources of economic risk are interest rate related and include changes in interest rate term risk, credit risk and liquidity risk. It is generally management’s objective to align the characteristics of assets and liabilities so that our financial obligations can be met under a wide variety of economic conditions. From time to time, management may choose to liquidate certain investments and reinvest in different investments so that the likelihood of meeting our financial obligations is increased. See “—Investing Cash Flows.”
We manage interest rate risk, in part, through asset-liability analyses. In accordance with presently accepted actuarial standards, we have made adequate provisions for the anticipated cash flows required to meet contractual obligations and related expenses through the use of statutory reserves and related items at December 31, 2011.
Our interest rate risk analysis reflects the influence of call and prepayment rights present in our fixed maturity securities and commercial mortgage loans. The majority of these investments have contractual provisions that require the borrower to compensate us in part or in full for reinvestment losses if the security or loan is retired before maturity. Callable bonds without make-whole provisions represented 6.4% of our fixed maturity security portfolio at December 31, 2011. We also originate commercial mortgage loans containing a make-whole prepayment provision requiring the borrower to pay a prepayment fee. As interest rates decrease, potential prepayment fees increase. These larger prepayment fees deter borrowers from refinancing during a low interest rate environment. Approximately 95% of the commercial mortgage loans we originate contain this prepayment provision. Almost all of the remaining commercial mortgage loans contain fixed percentage prepayment fees that mitigate prepayments but may not fully protect our expected cash flows in the event of prepayment.
Our financial instruments are exposed to financial market volatility and potential disruptions in the market that may result in certain financial instruments becoming less valuable. Financial market volatility includes interest rate risk. We have analyzed the estimated loss in fair value of certain market sensitive financial assets held at December 31, 2011 and 2010, using a hypothetical 10% increase in interest rates and related qualitative information on how we manage interest rate risk. The interest rate sensitivity analysis was based upon our fixed maturity securities and commercial mortgage loans held at December 31, 2011 and 2010. Interest rate sensitivity of our financial assets was measured assuming a parallel shift in interest rates. All security yields were increased by 10% of the year-end 10-year U.S. Government Treasury bond yield, or 0.19% and 0.33% for the 2011 and 2010 analyses, respectively. The change in fair value of each security was estimated as the change in the option adjusted value of each security. Option adjusted values were computed using our payment models and provisions for the effects of possible future changes in interest rates. The analyses did not explicitly provide for the possibility of non-parallel shifts in the yield curve, which would involve discount rates for different maturities being increased by different amounts. The actual change in fair value of our financial assets can be significantly different from that estimated by the model. The hypothetical reduction in the fair value of our financial assets that resulted from the model was estimated to be $98 million and $150 million at December 31, 2011 and 2010, respectively.
Additionally, a cash management process is in place that anticipates short-term cash needs. Depending upon capital market conditions, anticipated cash needs may be covered by liquid asset holdings or a draw upon our line of credit. In almost all cases, borrowed funds can be retired from normal operating cash flows in conjunction with adjustments to long-term investing practice within half a year. For more information about our line of credit, see “—Financing Cash Flows,” and Part I, Item 1A, “Risk Factors.”
| | |
| 40 | | STANCORP FINANCIAL GROUP, INC. |
Operating Cash Flows
Net cash provided by operating activities is net income adjusted for non-cash items and accruals, and was $254.1 million, $355.1 million and $441.4 million for 2011, 2010 and 2009, respectively.
Investing Cash Flows
We maintain a diversified investment portfolio primarily consisting of fixed maturity securities and fixed-rate commercial mortgage loans. Investing cash inflows primarily consist of the proceeds of investments sold, matured or repaid. Investing cash outflows primarily consist of payments for investments acquired or originated.
The insurance laws of the states of domicile and other states in which the insurance subsidiaries conduct business regulate the investment portfolios of the insurance subsidiaries. Relevant laws and regulations generally limit investments to bonds and other fixed maturity securities, mortgage loans, common and preferred stock and real estate. Decisions to acquire and dispose of investments are made in accordance with guidelines adopted and modified from time to time by the Boards of Directors of our insurance subsidiaries. Each investment transaction requires the approval of one or more members of senior investment staff, with increasingly higher approval authorities required for transactions that are more significant. Transactions are reported quarterly to the Audit Committee of the Board of Directors for Standard Insurance Company (“Standard”) and to the Board of Directors for The Standard Life Insurance Company of New York.
Net cash used in investing activities was $595.4 million, $493.1 million and $907.6 million for 2011, 2010 and 2009, respectively. The increase in net cash used in investing activities for 2011 compared to 2010 was primarily due to higher commercial mortgage loan originations during 2011, in addition to higher net purchases of fixed maturity securities and other invested assets, resulting from higher policyholder fund net deposits. The decrease in net cash used in investing activities for 2010 compared to 2009 was primarily due to lower net purchases of fixed maturity securities, which resulted from lower policyholder fund net deposits, the termination of a few large retirement plans and higher repurchases of common stock.
Our target investment portfolio allocation is approximately 60% fixed maturity securities and 40% commercial mortgage loans with a maximum allocation of 45% to commercial mortgage loans. At December 31, 2011, our portfolio consisted of 56.9% fixed maturity securities, 41.2% commercial mortgage loans, 0.8% real estate, and 1.1% other invested assets.
Fixed Maturity Securities
We maintain prudent diversification across industries, issuers and maturities. We have avoided the types of structured products that do not meet an adequate level of transparency for good decision making. Our corporate bond industry diversification targets are based on the Bank of America Merrill Lynch U.S. Corporate Master Index, which is reasonably reflective of the mix of issuers broadly available in the market. Our fixed maturity securities below investment grade are primarily managed by a third party.
Our fixed maturity securities portfolio generates unrealized gains or losses primarily resulting from market interest rates that are lower or higher relative to our book yield at the reporting date. In addition, changes in the spread between the risk-free rate and market rates for any given issuer can fluctuate based on the demand for the instrument, the near-term prospects of the issuer and the overall economic climate.
The following table sets forth fixed maturity securities and associated key indicators:
| | | | | | | | | | | | |
| | | December 31, | | | Change | |
| (Dollars in millions) | | 2011 | | | 2010 | | |
Fixed maturity securities | | $ | 6,769.5 | | | $ | 6,419.1 | | | | 5.5 | % |
| | | |
Weighted-average credit quality of our fixed maturity securities portfolio (S&P) | | | A | | | | A | | | | | |
| | | |
Fixed maturity securities below investment grade: | | | | | | | | | | | | |
As a percent of total fixed maturity securities | | | 5.6 | % | | | 5.2 | % | | | 0.4 | % |
Managed by a third party | | $ | 311.3 | | | $ | 292.3 | | | | 6.5 | |
| | | |
Fixed maturity securities on our watch list: | | | | | | | | | | | | |
Fair value | | | 8.9 | | | | 0.7 | | | $ | 8.2 | |
Amortized cost after OTTI | | | 12.2 | | | | 1.0 | | | | 11.2 | |
| | | |
Gross unrealized capital gains in our fixed maturity securities portfolio | | | 580.5 | | | | 415.8 | | | | 39.6 | % |
| Gross unrealized capital losses in our fixed maturity securities portfolio | | | (20.9 | ) | | | (19.7 | ) | | | (6.1 | ) |
Part II
We recorded OTTI of $1.8 million and $0.7 million for 2011 and 2010, respectively. See “Critical Accounting Policies and Estimates—Investment Valuations—Fixed Maturity Securities.” We did not have any direct exposure to sub-prime or Alt-A mortgages in our fixed maturity securities portfolio at December 31, 2011.
Commercial Mortgage Loans
StanCorp Mortgage Investors, LLC originates and services fixed-rate commercial mortgage loans for the investment portfolios of our insurance subsidiaries and generates additional fee income from the origination and servicing of commercial mortgage loans participated to institutional investors. The level of commercial mortgage loan originations in any period is influenced by market conditions as we respond to changes in interest rates, available spreads and borrower demand.
The following table sets forth commercial mortgage loan originations:
| | | | | | | | | | | | | | | | | | | | |
| | | Years ended
December 31, | |
| (Dollars in millions) | | 2011 | | | Percent
Change | | | 2010 | | | Percent
Change | | | 2009 | |
| Commercial mortgage loan originations | | $ | 1,007.7 | | | | 13.5 | % | | $ | 887.5 | | | | 23.5 | % | | $ | 718.5 | |
The increases in commercial mortgage loan originations for 2011 compared to 2010, and 2010 compared to 2009 was primarily due to increased activity in the commercial real estate market.
The following table sets forth commercial mortgage loan servicing data:
| | | | | | | | | | | | |
| | | December 31, | | | Percent Change | |
| (Dollars in millions) | | 2011 | | | 2010 | | |
Commercial mortgage loans serviced: | | | | | | | | | | | | |
For subsidiaries of StanCorp | | $ | 4,901.0 | | | $ | 4,509.7 | | | | 8.7 | % |
For other institutional investors | | | 2,691.6 | | | | 2,697.3 | | | | (0.2 | ) |
| | | |
Capitalized commercial mortgage loan servicing rights associated with commercial mortgage loans serviced for other institutional investors | | | 7.2 | | | | 7.6 | | | | (5.3 | ) |
The estimated average loan to value ratio for the overall portfolio was less than 70% at December 31, 2011. The average loan balance of our commercial mortgage loan portfolio was approximately $0.8 million at December 31, 2011. We have the contractual ability to pursue personal recourse on approximately 73% of our loans and partial personal recourse on a majority of the remaining loans. The average capitalization rate for the portfolio at December 31, 2011 was approximately 9%. Capitalization rates are used internally to annually value our commercial mortgage loan portfolio.
At December 31, 2011, we did not have any direct exposure to sub-prime or Alt-A mortgages in our commercial mortgage loan portfolio. When we undertake mortgage risk, we do so directly through loans that we originate ourselves rather than in packaged products such as commercial mortgage-backed securities. Given that we service the vast majority of loans in our portfolios, we are prepared to deal with them promptly and proactively. Should the delinquency rate or loss performance of our commercial mortgage loan portfolio increase significantly, the increase could have a material adverse effect on our business, financial position, results of operations or cash flows.
| | |
| 42 | | STANCORP FINANCIAL GROUP, INC. |
The following table sets forth our commercial mortgage loan portfolio by property type, by geographic region within the U.S., and by U.S. state:
| | | | | | | | | | | | | | | | |
| | | December 31,
2011 | | | December 31,
2010 | |
| (Dollars in millions) | | Amount | | | Percent | | | Amount | | | Percent | |
Property type: | | | | | | | | | | | | | | | | |
Retail | | $ | 2,457.8 | | | | 50.1 | % | | $ | 2,186.4 | | | | 48.4 | % |
Office | | | 911.1 | | | | 18.6 | | | | 855.2 | | | | 18.9 | |
Industrial | | | 900.4 | | | | 18.4 | | | | 829.0 | | | | 18.4 | |
Hotel/motel | | | 241.9 | | | | 4.9 | | | | 301.8 | | | | 6.7 | |
Commercial | | | 187.1 | | | | 3.8 | | | | 179.5 | | | | 4.0 | |
Apartment and other | | | 204.0 | | | | 4.2 | | | | 161.7 | | | | 3.6 | |
| | | | | | | | | | | | | | | | | |
Total commercial mortgage loans | | $ | 4,902.3 | | | | 100.0 | % | | $ | 4,513.6 | | | | 100.0 | % |
| | | | | | | | | | | | | | | | | |
Geographic region: | | | | | | | | | | | | | | | | |
Pacific | | $ | 1,699.3 | | | | 34.7 | % | | $ | 1,558.5 | | | | 34.5 | % |
South Atlantic | | | 953.8 | | | | 19.5 | | | | 838.9 | | | | 18.6 | |
West South Central | | | 605.3 | | | | 12.3 | | | | 547.2 | | | | 12.1 | |
Mountain | | | 585.8 | | | | 11.9 | | | | 541.1 | | | | 12.0 | |
East North Central | | | 393.4 | | | | 8.0 | | | | 350.4 | | | | 7.8 | |
Middle Atlantic | | | 243.8 | | | | 5.0 | | | | 257.1 | | | | 5.7 | |
West North Central | | | 184.8 | | | | 3.8 | | | | 165.5 | | | | 3.7 | |
East South Central | | | 129.9 | | | | 2.6 | | | | 129.0 | | | | 2.8 | |
New England | | | 106.2 | | | | 2.2 | | | | 125.9 | | | | 2.8 | |
| | | | | | | | | | | | | | | | | |
Total commercial mortgage loans | | $ | 4,902.3 | | | | 100.0 | % | | $ | 4,513.6 | | | | 100.0 | % |
| | | | | | | | | | | | | | | | | |
U.S. state: | | | | | | | | | | | | | | | | |
California | | $ | 1,332.0 | | | | 27.2 | % | | $ | 1,236.1 | | | | 27.4 | % |
Texas | | | 550.8 | | | | 11.2 | | | | 495.8 | | | | 11.0 | |
Florida | | | 305.3 | | | | 6.2 | | | | 240.2 | | | | 5.3 | |
Georgia | | | 270.1 | | | | 5.5 | | | | 268.3 | | | | 5.9 | |
Other states | | | 2,444.1 | | | | 49.9 | | | | 2,273.2 | | | | 50.4 | |
| | | | | | | | | | | | | | | | | |
Total commercial mortgage loans | | $ | 4,902.3 | | | | 100.0 | % | | $ | 4,513.6 | | | | 100.0 | % |
Our largest concentration of commercial mortgage loan property type was retail properties and primarily consisted of convenience related properties in strip malls, convenience stores and restaurants. Our exposure to retail properties is diversified among various borrowers, properties and geographic regions. In addition, retail commercial lending represents an area of experience and expertise, where careful underwriting and consistent surveillance mitigate risks surrounding our commercial mortgage lending in this area.
At December 31, 2011, our ten largest borrowers represented less than 9% of our total commercial mortgage loan portfolio balance. Our largest borrower concentrations within our commercial mortgage loan portfolio consisted of two borrowers that individually ranged from 1% to 2% of our total commercial mortgage loan portfolio balance.
Through our concentration of commercial mortgage loans in California, we are exposed to potential losses from an economic downturn in California as well as to certain catastrophes, such as earthquakes and fires that may affect certain areas of the western region. We require borrowers to maintain fire insurance coverage. We diversify our commercial mortgage loan portfolio within California by both location and type of property in an effort to reduce certain catastrophe and economic exposure. However, diversification may not always eliminate the risk of such losses. Historically, the delinquency rate of our California-based commercial mortgage loans has been substantially below the industry average and is consistent with our experience in other states. We do not require earthquake insurance for the properties when we underwrite new loans. However, we consider the potential for earthquake loss based upon seismic surveys and structural information specific to each property. We do not expect a catastrophe or earthquake damage in the western region to have
Part II
a material adverse effect on our business, financial position, results of operations or cash flows. Currently, our California exposure is primarily in Los Angeles County, Orange County, San Diego County and the Bay Area Counties. We have a smaller concentration of commercial mortgage loans in the Inland Empire and the San Joaquin Valley where there has been greater economic decline. Due to the concentration of commercial mortgage loans in California, a continued economic decline in California could have a material effect on our business, financial position, results of operations or cash flows. See Part I, Item 1A, “Risk Factors.”
Under the laws of certain states, environmental contamination of a property may result in a lien on the property to secure recovery of the costs of cleanup. In some states, such a lien has priority over the lien of an existing mortgage against such property. As a commercial mortgage lender, we customarily conduct environmental assessments prior to making commercial mortgage loans secured by real estate and before taking title through foreclosure on real estate collateralizing delinquent commercial mortgage loans held by us. Based on our environmental assessments, we believe that any compliance costs associated with environmental laws and regulations or any remediation of affected properties would not have a material effect on our business, financial position, results of operations or cash flows. However, we cannot provide assurance that material compliance costs will not be incurred by us.
In the normal course of business, we commit to fund commercial mortgage loans generally up to 90 days in advance. At December 31, 2011, we had outstanding commitments to fund commercial mortgage loans totaling $105 million, with fixed interest rates ranging from 5.125% to 6.375%. These commitments generally have fixed expiration dates. A small percentage of commitments expire due to the borrower’s failure to deliver the requirements of the commitment by the expiration date. In these cases, we will retain the commitment fee and good faith deposit. Alternatively, if we terminate a commitment due to the disapproval of a commitment requirement, the commitment fee and good faith deposit may be refunded to the borrower, less an administrative fee.
The following table sets forth key commercial mortgage loan statistics:
| | | | | | | | | | | | |
| | | December 31, | | | Percent Change | |
| (Dollars in millions) | | 2011 | | | 2010 | | |
Commercial mortgage loans 60 day delinquencies: | | | | | | | | | | | | |
Book value | | $ | 17.1 | | | $ | 19.6 | | | | (12.8 | )% |
Delinquency rate | | | 0.34 | % | | | 0.43 | % | | | | |
In process of foreclosure | | $ | 5.1 | | | $ | 9.3 | | | | (45.2 | ) |
| Restructured commercial mortgage loans | | | 93.7 | | | | 76.6 | | | | 22.3 | |
The performance of our commercial mortgage loan portfolio may fluctuate in the future. However, based on our business approach of diligently underwriting high-quality loans, we believe our delinquency rate will remain contained. We have steadfastly avoided the types of structured products that do not meet an adequate level of transparency for good decision making.
The following table sets forth details of our commercial mortgage loans foreclosed or accepted as deeds in lieu of foreclosure:
| | | | | | | | | | | | | | | | | | | | |
| | | Years ended
December 31, | |
| (Dollars in millions) | | 2011 | | | Change | | | 2010 | | | Change | | | 2009 | |
Number of loans | | | 49 | | | | (48 | ) | | | 97 | | | | 72 | | | | 25 | |
Book value | | $ | 40.3 | | | $ | (78.3 | ) | | $ | 118.6 | | | $ | 85.4 | | | $ | 33.2 | |
| Real estate acquired | | | 22.8 | | | | (80.4 | ) | | | 103.2 | | | | 79.0 | | | | 24.2 | |
Real estate acquired through foreclosure or accepted as deeds in lieu of foreclosure is initially recorded at estimated net realizable value, which includes an estimate for disposal costs. These amounts may be adjusted in a subsequent period as additional market information regarding fair value is received. Real estate acquired during 2011 decreased compared to 2010 primarily due to a decrease in foreclosures and the acceptance of deeds in lieu of foreclosure. During 2010, we
| | |
| 44 | | STANCORP FINANCIAL GROUP, INC. |
recorded capital losses of $26.0 million, primarily due to impairments recognized on 62 properties we acquired through the acceptance of deed s in lieu of foreclosure related to a single borrower. See “Critical Accounting Policies and Estimates—Investment Valuations—Commercial Mortgage Loans” for our commercial mortgage loan loss allowance policy.
The following table sets forth changes in the commercial mortgage loan loss allowance:
| | | | | | | | | | | | | | | | | | | | |
| | | Years ended
December 31, | |
| (In millions) | | 2011 | | | Dollar
Change | | | 2010 | | | Dollar
Change | | | 2009 | |
Commercial mortgage loan loss allowance: | | | | | | | | | | | | | | | | | | | | |
Beginning balance | | $ | 36.1 | | | $ | 16.5 | | | $ | 19.6 | | | $ | 12.8 | | | $ | 6.8 | |
Provision | | | 32.7 | | | | (15.4 | ) | | | 48.1 | | | | 27.0 | | | | 21.1 | |
Charge-offs, net | | | (20.7 | ) | | | 10.9 | | | | (31.6 | ) | | | (23.3 | ) | | | (8.3 | ) |
| | | | | | | | | | | | | | | | | | | | | |
Ending balance | | $ | 48.1 | | | $ | 12.0 | | | $ | 36.1 | | | $ | 16.5 | | | $ | 19.6 | |
The smaller increase in the provision for the commercial mortgage loan loss allowance for 2011 compared to 2010 was primarily due to a prior year provision related to a single borrower, which is no longer in the commercial mortgage loan portfolio. The lower charge-offs for 2011 compared to 2010 were primarily related to the prior year acceptance of deeds in lieu of foreclosure associated with a single borrower in the second quarter of 2010, which did not recur in 2011. The increase in the provisions for the commercial mortgage loan loss allowance for 2010 compared to 2009 was primarily related to the foreclosure and restructuring of commercial mortgage loans with a single borrower during the second quarter of 2010.
The following table sets forth impaired commercial mortgage loans identified in management’s specific review of probable loan losses and the related allowance:
| | | | | | | | | | | | |
| | | December 31, | | | Dollar
Change | |
| (In millions) | | 2011 | | | 2010 | | |
Impaired commercial mortgage loans with specific allowances for losses | | $ | 75.8 | | | $ | 64.3 | | | $ | 11.5 | |
Impaired commercial mortgage loans without specific allowances for losses | | | 28.9 | | | | 18.0 | | | | 10.9 | |
Specific allowance for losses on impaired commercial mortgage loans, end of
the period | | | (26.6 | ) | | | (20.4 | ) | | | (6.2 | ) |
| | | | | | | | | | | | | |
Net carrying value of impaired commercial mortgage loans | | $ | 78.1 | | | $ | 61.9 | | | $ | 16.2 | |
An impaired commercial mortgage loan is a loan where we do not expect to receive contractual principal and interest in accordance with the terms of the loan agreement. A specific allowance for losses is recorded when a loan is considered to be impaired and it is probable that all amounts due will not be collected. We also hold specific allowances for losses on certain performing loans that we continue to monitor and evaluate. Impaired commercial mortgage loans without specific allowances for losses are those for which we have determined that it remains probable that we will collect all amounts due. The increase in the impaired commercial mortgage loans at December 31, 2011 compared to 2010 was primarily due to an increase in restructured commercial mortgage loans that were not performing to the contractual terms of the loan agreements.
The following table sets forth the average recorded investment in impaired commercial mortgage loans before specific allowance for losses:
| | | | | | | | | | | | | | | | | | | | |
| | | Years ended
December 31, | |
| (In millions) | | 2011 | | | Dollar
Change | | | 2010 | | | Dollar
Change | | | 2009 | |
| Average recorded investment | | $ | 92.3 | | | $ | 15.9 | | | $ | 76.4 | | | $ | 58.9 | | | $ | 17.5 | |
Part II
Interest income is recorded in net investment income. We continue to recognize interest income on delinquent commercial mortgage loans until the loans are more than 90 days delinquent. Interest income and accrued interest receivable are reversed when a loan is put on non-accrual status. For loans that are less than 90 days delinquent, we may reverse interest income and the accrued interest receivable if there is a question on the collectability of the interest. Interest income on loans in the 90-day delinquent category is recognized in the period the cash is collected. We resume the recognition of interest income when the loan becomes less than 90 days delinquent and we determine it is probable that the loan will remain performing.
The amount of interest income recognized on impaired commercial mortgage loans was $3.8 million, $2.8 million and $0.1 million for 2011, 2010 and 2009, respectively. The cash received by us in payment of interest on impaired commercial mortgage loans was $3.1 million, $3.3 million and $0.1 million for 2011, 2010 and 2009, respectively.
Financing Cash Flows
Financing cash flows primarily consist of policyholder fund deposits and withdrawals, borrowings and repayments on the line of credit, borrowings and repayments on long-term debt, repurchases of common stock and dividends paid on common stock. Net cash provided by financing activities was $327.7 million, $181.7 million and $294.0 million for 2011, 2010 and 2009, respectively. The increase in funds provided by financing cash flows for 2011 compared to 2010 was primarily due to an increase in the level of new individual annuity deposits, resulting in a larger increase of policyholder deposits net of withdrawals. The increase was partially offset by an increase in cash used to repurchase shares of common stock. See “Capital Management—Share Repurchases” for further discussion on share repurchases.
We maintain a $200 million senior unsecured revolving credit facility (“Facility”). The Facility will remain at $200 million through June 15, 2012, and will decrease to $165 million thereafter until final maturity on June 15, 2013. Borrowings under the Facility will continue to be used to provide for working capital, for issuance of letters of credit and for our general corporate purposes.
Under the agreement, we are subject to customary covenants that take into consideration the impact of material transactions, changes to the business, compliance with legal requirements and financial performance. The two financial covenants are based on our total debt to total capitalization ratio and consolidated net worth. Under the two financial covenants, we are required to maintain a total debt to capitalization ratio that does not exceed 35% and a consolidated net worth that is equal to at least $1.04 billion. The financial covenants exclude the unrealized gains and losses related to fixed maturity securities that are held in accumulated other comprehensive income (loss). At December 31, 2011, we had a total debt to total capitalization ratio of 24.6% and consolidated net worth of $1.70 billion as defined by the financial covenants. We believe we will continue to meet the financial covenants in the future. The Facility is subject to performance pricing based upon our total debt to total capitalization ratio and includes interest based on a Eurodollar margin, plus facility and utilization fees. At December 31, 2011, we were in compliance with all covenants under the Facility and had no outstanding balance on the Facility.
We have $250 million of 6.875%, 10-year senior notes (“Senior Notes”), which mature on September 25, 2012. The principal amount of the Senior Notes is payable at maturity and interest is payable semi-annually in April and October.
We have $300 million of 6.90%, junior subordinated debentures (“Subordinated Debt”). The Subordinated Debt has a final maturity on June 1, 2067, is non-callable at par for the first 10 years (prior to June 1, 2017), and is subject to a replacement capital covenant. The covenant limits replacement of the Subordinated Debt for the first 40 years to be redeemable after year 10 (on or after June 1, 2017) and only with securities that carry equity-like characteristics that are the same as or more equity-like than the Subordinated Debt. The principal amount of the Subordinated Debt is payable at final maturity. Interest is payable semi-annually at 6.90% in June and December for the first 10 years up to June 1, 2017, and quarterly thereafter at a floating rate equal to three-month London Interbank Offered Rate plus 2.51%. We have the option to defer interest payments for up to five years. We have not deferred interest on the Subordinated Debt.
CAPITAL MANAGEMENT
State insurance departments require insurance enterprises to maintain minimum levels of capital and surplus. The target for our insurance subsidiaries is generally to maintain capital at 300% of the Company Action Level of Risk-based Capital (“RBC”) required by regulators, which is 600% of the Authorized Control Level RBC required by our states of domicile.
| | |
| 46 | | STANCORP FINANCIAL GROUP, INC. |
The insurance subsidiaries held estimated capital of 327% of the Company Action Level RBC at December 31, 2011. At December 31, 2011, statutory capital, adjusted to exclude asset valuation reserves, for our regulated insurance subsidiaries totaled $1.30 billion.
The level of capital in excess of targeted RBC we generate varies inversely in relation to the level of our premium growth. As premium growth increases, capital is utilized to fund additional reserve requirements, meet increased regulatory capital requirements based on premium and cover certain acquisition costs associated with policy issuance, leaving less available capital beyond our target level. Higher levels of premium growth can result in increased utilization of capital beyond that which is generated by the business, and at very high levels of premium growth, we could generate the need for capital infusions. At lower levels of premium growth, additional capital produced by the business exceeds the capital utilized to meet these requirements, which can result in additional capital above our targeted RBC level. At our expected growth rate for 2012, we anticipate generating between $90 million and $120 million of capital in excess of our 300% RBC target. In assessing our capital position, we also consider cash and capital at the holding company and non-insurance subsidiaries.
Available capital consists of capital in excess of our insurance subsidiaries’ target RBC ratio of 300%, as well as cash and securities available to the holding company at our non-regulated subsidiaries. During 2011, our available capital decreased by approximately $15 million to $220 million. The capital decrease was primarily due to share repurchases, interest payments on our debt and our shareholder dividend payment, partially offset by capital generated by our insurance subsidiaries.
Dividends from Standard
Our ability to pay dividends to our shareholders, repurchase our shares and meet our obligations substantially depends upon the receipt of distributions from our subsidiary Standard. Standard’s ability to pay dividends to StanCorp is affected by factors deemed relevant by Standard’s Board of Directors. One factor considered by the Board is the ability to maintain adequate capital according to Oregon statute. Under Oregon law, Standard may pay dividends only from the earned surplus arising from its business. If the proposed dividend exceeds certain statutory limitations, Standard must receive the prior approval of the Director of the Oregon Department of Consumer and Business Services—Insurance Division (“Oregon Insurance Division”). The current statutory limitations are the greater of (a) 10% of Standard’s combined capital and surplus as of December 31 of the preceding year, or (b) the net gain from operations after dividends to policyholders and federal income taxes before realized capital gains or losses for the 12-month period ended on the preceding December 31. In each case, the limitation must be determined under statutory accounting practices. Oregon law gives the Oregon Insurance Division broad discretion to decline requests for dividends in excess of these limits. There are no regulatory restrictions on dividends from our non-insurance subsidiaries.
As of December 31, 2011, Standard’s net income after federal income taxes but before capital gains and losses was $144.0 million and capital and surplus was $1,193.1 million. Based upon Standard’s results for 2011, the amount of ordinary dividend available without additional approval from the Oregon Insurance Division was $144.0 million over a 12-month rolling period.
Dividends paid from Standard to StanCorp will be based on levels of available capital and needs at the holding company, which are driven by the financial results of Standard and the Company as a whole. Standard paid ordinary cash dividends to StanCorp of $87.8 million, $244.0 million and $170.0 million for 2011, 2010 and 2009, respectively.
Dividends to Shareholders
On November 14, 2011, our Board of Directors declared an annual cash dividend of $0.89 per share, calculated and payable on a per share basis. The dividend was paid on December 9, 2011 to shareholders of record on November 28, 2011. In 2010 and 2009, we paid an annual cash dividend of $0.86 and $0.80 per share, respectively. The Board of Directors has increased the annual dividend per share to shareholders each year for the past 12 consecutive years. The declaration and payment of dividends to shareholders in the future is subject to the discretion of our Board of Directors. It is anticipated that annual dividends to shareholders will be paid in December of each year depending on our financial condition, results of operations, cash requirements, future prospects, regulatory restrictions on distributions from the insurance subsidiaries, the ability of the insurance subsidiaries to maintain adequate capital and other factors deemed relevant by the Board of Directors. In addition, the declaration and payment of dividends to shareholders would be restricted if we elect to defer
Part II
interest payments on our Subordinated Debt issued May 7, 2007. If elected, the restriction would be in place during the interest deferral period, which cannot exceed five years. We have not deferred interest on the Subordinated Debt, and have paid dividends each year since our initial public offering in 1999.
Share Repurchases
On February 8, 2010, our Board of Directors authorized 3.0 million shares of StanCorp common stock for its share repurchase program. The February 2010 authorization took effect upon the completion of the previous share repurchase authorization and expired on December 31, 2011. The total number of shares repurchased through the February 2010 authorization was 2.9 million shares. On May 16, 2011, our Board of Directors authorized an additional 3.0 million shares of StanCorp common stock. As of December 31, 2011, 128,800 shares under the February 2010 authorization expired. The May 2011 authorization took effect upon the expiration of the February 2010 authorization and expires on December 31, 2012. No shares were repurchased under the May 2011 Plan at December 31, 2011. Share repurchases under the repurchase program are made in the open market or in negotiated transactions in compliance with the safe harbor provisions of Rule 10b-18 under regulations of the Securities Exchange Act of 1934 (“Exchange Act”). Repurchases are made at market prices on the transaction date. Execution of the share repurchase program is based upon management’s assessment of market conditions for its common stock, capital levels, our assessment of the overall economy and other potential growth opportunities or priorities for capital use.
The following table sets forth share repurchases activity:
| | | | | | | | |
| | | Years ended December 31, | |
| (Dollars in millions except per share data) | | 2011 | | | 2010 | |
Share repurchases: | | | | | | | | |
Shares repurchased | | | 2,180,100 | | | | 2,034,200 | |
Cost of share repurchases | | $ | 90.3 | | | $ | 81.8 | |
Volume weighted-average price per common share | | | 41.41 | | | | 40.19 | |
Shares remaining under repurchase authorizations | | | 3,000,000 | | | | 2,308,900 | |
| | |
Share acquired to cover tax liabilities: | | | | | | | | |
Shares acquired | | | — | | | | 8,613 | |
Cost of shares repurchased | | $ | — | | | $ | 0.4 | |
Volume weighted-average price per common share | | | — | | | | 43.01 | |
FINANCIAL STRENGTH AND CREDIT RATINGS
See Part I, Item 1, “Business—Financial Strength and Credit Ratings.”
CONTINGENCIES AND LITIGATION
See Item 8, “Financial Statements and Supplementary Data—Notes to Consolidated Financial Statements—Note 19—Commitments and Contingencies.”
OFF-BALANCE SHEET ARRANGEMENTS
See discussion of loan commitments, “Liquidity and Capital Resources—Investing Cash Flows—Commercial Mortgage Loans.”
CONTRACTUAL OBLIGATIONS
Our financing obligations generally include debts, lease payment obligations and commitments to fund commercial mortgage loans. The remaining obligations reflect the long-term portion of other liabilities and our obligations under our insurance and annuity product contracts.
| | |
| 48 | | STANCORP FINANCIAL GROUP, INC. |
The following table summarizes our contractual obligations by period in which payments are due:
| | | | | | | | | | | | | | | | | | | | |
| (In millions) | | Total | | | Less than 1
year | | | 1 to 3 Years | | | 3 to 5 Years | | | More than 5
Years | |
Contractual obligations: | | | | | | | | | | | | | | | | | | | | |
Short-term debt and capital lease obligations | | $ | 251.2 | | | $ | 251.2 | | | $ | — | | | $ | — | | | $ | — | |
Long-term debt and capital lease obligations | | | 300.9 | | | | — | | | | 0.7 | | | | 0.2 | | | | 300.0 | |
Interest on debt obligations | | | 131.1 | | | | 37.9 | | | | 41.4 | | | | 41.4 | | | | 10.4 | |
Operating lease obligations | | | 29.5 | | | | 10.4 | | | | 11.5 | | | | 4.7 | | | | 2.9 | |
Funding requirements for commercial mortgage loans | | | 105.0 | | | | 105.0 | | | | — | | | | — | | | | — | |
Purchase obligations | | | 7.7 | | | | 7.3 | | | | 0.4 | | | | — | | | | — | |
Insurance obligations(1) | | | 7,435.0 | | | | 1,216.4 | | | | 1,166.9 | | | | 906.2 | | | | 4,145.5 | |
Policyholder fund obligations(2) | | | 4,789.1 | | | | 4,152.2 | | | | 90.3 | | | | 78.6 | | | | 468.0 | |
Separate account liabilities(3) | | | 4,593.5 | | | | 4,593.5 | | | | — | | | | — | | | | — | |
Other short-term and long-term obligations | | | 378.7 | | | | 59.6 | | | | 51.3 | | | | 34.4 | | | | 233.4 | |
| | | | | | | | | | | | | | | | | | | | | |
Total contractual obligations | | $ | 18,021.7 | | | $ | 10,433.5 | | | $ | 1,362.5 | | | $ | 1,065.5 | | | $ | 5,160.2 | |
| | (1) | | The estimated payments expected to be due by period for insurance obligations reflect future estimated cash payments, for pending and future potential claims, to be made to policyholders and others for future policy benefits, policyholders’ account balances, policyholders’ dividends, and reinsurance payables. These future estimated net cash payments are based on mortality, morbidity, lapse and other assumptions comparable with our experience, consider future premium receipts on current policies in force, and assume market growth and interest crediting consistent with assumptions used in amortizing DAC and VOBA. These net cash payments are undiscounted with respect to interest and, as a result, the sum of the net cash payments shown for all years in the table of $7.44 billion exceeds the corresponding liability amount of $5.68 billion included in the Consolidated Financial Statements as of December 31, 2011. We have made significant assumptions to determine the future estimated net cash payments related to the underlying policies and contracts. Due to the significance of the assumptions used, actual net cash payments will differ, possibly materially, from these estimates. |
| | (2) | | While historical withdrawal patterns indicate withdrawal primarily occurs in periods in excess of one year, policyholder fund obligations in the amount of $3.72 billion have been included in the less than one year column of the table as they may be withdrawn upon request. These net cash payments are undiscounted with respect to interest but reflect an offsetting effect due to reinsurance receivables and, as a result, the sum of the net cash payments shown for all years in the table of $4.79 billion differs from the corresponding liability amount of $5.08 billion included in the Consolidated Financial Statements as of December 31, 2011. Due to the significance of the assumptions used, actual net cash payments will differ, possibly materially, from these estimates. |
| | (3) | | Separate account liabilities are legally insulated from general account obligations, and it is generally expected these liabilities will be fully funded by separate account assets and their related cash flows. While historical withdrawal patterns indicate withdrawal primarily occurs in periods in excess of one year, separate account liabilities in the amount of $4.59 billion have been included in the less than one year column of the table as they may be withdrawn upon request. |
Our debt obligations consisted primarily of the $250 million 6.875% Senior Notes and the $300 million 6.90% Subordinated Debt. See Item 8, “Financial Statements and Supplementary Data—Notes to Consolidated Financial Statements—Note 18—Long-Term Debt” for additional information.
In the normal course of business, we commit to fund commercial mortgage loans generally up to 90 days in advance. At December 31, 2011, we had outstanding commitments to fund commercial mortgage loans totaling $105.0 million, with fixed interest rates ranging from 5.125% to 6.375%. These commitments generally have fixed expiration dates. A small percentage of commitments expire due to the borrower’s failure to deliver the requirements of the commitment by the expiration date. In these cases, we will retain the commitment fee and good faith deposit. Alternatively, if we terminate a commitment due to the disapproval of a commitment requirement, the commitment fee and deposit may be refunded to the borrower, less an administrative fee.
The insurance obligations in the table are actuarial estimates of the cash required to meet our obligations for future policy benefits and claims. These estimates do not represent an exact calculation of our future benefit liabilities, but are instead based on assumptions, which involve a number of factors, including mortality, morbidity, recovery, the consumer price index, reinsurance arrangements and other sources of income for people on claim. Assumptions may vary by age and gender and, for individual policies occupation class of the claimant, time elapsed since disablement, and contract provisions and limitations. Certain of these factors could be materially affected by changes in social perceptions about work ethics, emerging medical perceptions and legal interpretations regarding physiological or psychological causes of disability, emerging or changing health issues and changes in industry regulation. Changes in one or more of these factors or incorrect assumptions could cause actual results to be materially different from the information presented in the table.
Policyholder fund obligations include payments based on currently scheduled withdrawals and annuity benefit payments stemming from liabilities shown on the balance sheet as policyholder funds.
Part II
Other long-term obligations reflected in our balance sheet at December 31, 2011, consisted of $159.5 million in expected benefit payments for supplemental, home office, and field office retirement plans, $124.4 million in expected benefit payments for the postretirement benefit plan, $68.4 million in capital commitments related to our low-income housing tax credit investments, a $14.5 million tax reimbursement liability related to the block of life insurance business sold to Protective Life Insurance Company (“Protective Life”) in 2001, and a $10.7 million liability for our deferred compensation plan.
INSOLVENCY ASSESSMENTS
Insolvency regulations exist in many of the jurisdictions in which our subsidiaries do business. Such regulations may require insurance companies operating within the jurisdiction to participate in guaranty associations. The associations levy assessments against their members for the purpose of paying benefits due to policyholders of impaired or insolvent insurance companies. Association assessments levied against us from January 1, 2009, through December 31, 2011, aggregated $1.7 million. At December 31, 2011, we maintained a reserve of $0.5 million for future assessments with respect to currently impaired, insolvent or failed insurers.
STATUTORY FINANCIAL ACCOUNTING
Standard and The Standard Life Insurance Company of New York prepare their statutory financial statements in accordance with accounting practices prescribed or permitted by their states of domicile. Prescribed statutory accounting practices include state laws, regulations, and general administrative rules, as well as the Statements of Statutory Accounting Practices set forth in publications of the National Association of Insurance Commissioners (“NAIC”).
Statutory accounting practices differ in some respects from GAAP. The principal statutory practices that differ from GAAP are:
| | • | | Bonds and commercial mortgage loans are reported principally at adjusted carrying value and amortized cost, respectively. |
| | • | | Asset valuation and the interest maintenance reserves are provided as prescribed by the NAIC. |
| | • | | Certain assets designated as non-admitted, principally deferred tax assets, furniture, equipment, and unsecured receivables, are not recognized as assets, resulting in a charge to statutory surplus. |
| | • | | Annuity considerations with life contingencies, or purchase rate guarantees, are recognized as revenue when received. |
| | • | | Reserves for life and disability policies and contracts are reported net of ceded reinsurance and calculated based on statutory requirements, including required discount rates. |
| | • | | Commissions, including initial commissions and expense allowance paid for reinsurance assumed, and other policy acquisition expenses are expensed as incurred. |
| | • | | Initial commissions and expense allowance received for a block of reinsurance ceded net of taxes are reported as deferred gains in surplus and recognized as income in subsequent periods. |
| | • | | Federal income tax expense includes current income taxes defined as current year estimates of federal income taxes and tax contingencies for current and prior years and amounts incurred or received during the year relating to prior periods, to the extent not previously provided. |
| | • | | Deferred tax assets, net of deferred tax liabilities, are included in the regulatory financial statements but are limited to those deferred tax assets that will be realized within three years. |
| | • | | Annuity reserves follow the commissioner’s annuity reserve valuation methodology rather than GAAP guidance for investment contracts. |
The following table sets forth the difference between the statutory net gains from insurance operations before federal income taxes and net capital gains and losses (“Statutory Results”) and GAAP income before income taxes excluding net capital gains and losses (“Adjusted GAAP Results”):
| | | | | | | | | | | | | | | | | | | | |
| | | Years ended December 31, | |
| (In millions) | | 2011 | | | Dollar Change | | | 2010 | | | Dollar
Change | | | 2009 | |
Statutory Results | | $ | 185.5 | | | $ | (131.9 | ) | | $ | 317.4 | | | $ | (57.6 | ) | | $ | 375.0 | |
Adjusted GAAP Results | | | 202.0 | | | | (132.4 | ) | | | 334.4 | | | | (8.2 | ) | | | 342.6 | |
| | |
|
|
| |
|
|
| |
|
|
| |
|
|
| |
|
|
|
Difference | | $ | (16.5 | ) | | $ | 0.5 | | | $ | (17.0 | ) | | $ | (49.4 | ) | | $ | 32.4 | |
| | |
| 50 | | STANCORP FINANCIAL GROUP, INC. |
The decrease in Statutory Results for 2011 compared to 2010 was primarily due to an increase in group long term disability reserves due to higher claims experience. The decrease in Statutory Results for 2010 compared to 2009 was primarily due to an increase in group long term disability reserves.
The narrowing of the spread between Statutory Results and Adjusted GAAP Results for 2011 was primarily due to a decrease in earnings from our insurance subsidiaries. The narrowing of the spread between Statutory Results and Adjusted GAAP Results for 2010 was due to an increase in the deferral of capital gains subject to the interest maintenance reserve on a statutory basis and an increase in reserves for the group disability business.
The following table sets forth statutory capital and the associated asset valuation reserve:
| | | | | | | | | | | | |
| | | December 31, | | | Percent
Change | |
| (In millions) | | 2011 | | | 2010 | | |
Statutory capital adjusted to exclude asset valuation reserves for our regulated insurance subsidiaries | | $ | 1,300.3 | | | $ | 1,322.4 | | | | (1.7) | % |
| Asset valuation reserve | | | 107.2 | | | | 95.6 | | | | 12.1 | |
ACCOUNTING PRONOUNCEMENTS
See Item 8, “Financial Statements and Supplementary Data—Notes to Consolidated Financial Statements—Note 1—Summary of Significant Accounting Policies—Accounting Pronouncements.”
CRITICAL ACCOUNTING POLICIES AND ESTIMATES
Our consolidated financial statements and certain disclosures made in this Form 10-K have been prepared in accordance with GAAP and require us to make estimates and assumptions that affect reported amounts of assets and liabilities and disclosures of contingent assets and contingent liabilities at the dates of the financial statements and the reported amounts of revenues and expenses during the reporting periods. The estimates most susceptible to material changes due to significant judgment (identified as the “critical accounting policies”) are those used in determining investment valuations, DAC, VOBA and other intangible assets, the reserves for future policy benefits and claims, pension and postretirement benefit plans and the provision for income taxes. The results of these estimates are critical because they affect our profitability and may affect key indicators used to measure our performance. These estimates have a material effect on our results of operations and financial condition.
Investment Valuations
Fixed Maturity Securities
Fixed maturity security capital gains and losses are recognized using the specific identification method. If a debt security’s fair value declines below its amortized cost, we must assess the security’s impairment to determine if the impairment is other than temporary.
In our quarterly fixed maturity security impairment analysis, we evaluate whether a decline in value of the fixed maturity security is other than temporary by considering the following factors:
| | • | | The nature of the fixed maturity security. |
| | • | | The duration until maturity. |
| | • | | The duration and extent the fair value has been below amortized cost. |
| | • | | The financial quality of the issuer. |
| | • | | Estimates regarding the issuer’s ability to make the scheduled payments associated with the fixed maturity security. |
| | • | | Our intent to sell or whether it is more likely than not we will be required to sell a fixed maturity security before recovery of the security’s cost basis through the evaluation of facts and circumstances including, but not limited to, decisions to rebalance our portfolio, current cash flow needs and sales of securities to capitalize on favorable pricing. |
If it is determined an OTTI exists, we separate the OTTI of debt securities into an OTTI related to credit loss and an OTTI related to noncredit loss. The OTTI related to credit loss represents the portion of losses equal to the difference between the present value of expected cash flows, discounted using the pre-impairment yields, and the amortized cost basis. All other changes in value represent the OTTI related to noncredit loss. The OTTI related to credit loss is recognized in earnings in the current period, while the OTTI related to noncredit loss is deemed recoverable and is recognized in other
Part II
comprehensive income. The cost basis of the fixed maturity security is permanently adjusted to reflect the credit related impairment. Once an impairment charge has been recorded, we continue to review the OTTI securities for further potential impairment.
We maintain an internally identified list of securities with characteristics that could indicate potential impairment (“watch list”). At December 31, 2011, our fixed maturity securities watch list totaled $8.9 million at fair value and $12.2 million at amortized cost. We recorded $1.8 million of OTTI related to credit loss due to impairments for 2011, compared to $0.7 million for 2010. We recorded no OTTI related to noncredit loss for 2011 and 2010. See Item 8, “Financial Statements and Supplementary Data—Notes to Consolidated Financial Statements—Note 1—Summary of Significant Accounting Policies—Investment Valuations—Fixed Maturity Securities—Available-for-Sale” for further disclosures.
We will continue to evaluate our holdings; however, we currently expect the fair values of our investments to recover either prior to their maturity dates or upon maturity. Should the credit quality of our fixed maturity securities significantly decline, there could be a material adverse effect on our business, financial position, results of operations or cash flows.
In conjunction with determining the extent of credit losses associated with debt securities, we utilize certain information in order to determine the present value of expected cash flows discounted using pre-impairment yields. Some of these input factors include, but are not limited to, original scheduled contractual cash flows, current market spread information, risk-free rates, fundamentals of the industry and sector in which the issuer operates, and general market information.
In 2009, we recorded a cumulative effect adjustment of $2.3 million, net of tax, for the portion of OTTI related to noncredit losses on our debt securities for the period prior to April 1, 2009. We met the following criteria in order to record the cumulative effect adjustment:
| | • | | The debt securities were held at the beginning of the interim period of adoption, |
| | • | | The debt securities had noncredit losses previously recognized as OTTI in earnings, |
| | • | | We did not intend to sell the debt securities, and |
| | • | | It was not more likely than not that we would be required to sell the debt securities before the recovery of their amortized cost bases. |
Fixed maturity securities are classified as available-for-sale and are carried at fair value on the consolidated balance sheet. See Item 8, “Financial Statements and Supplementary Data—Notes to Consolidated Financial Statements—Note 9—Fair Value” for a detailed explanation of the valuation methods we use to calculate the fair value of our financial instruments. Valuation adjustments for fixed maturity securities not accounted for as OTTI are reported as net increases or decreases to other comprehensive income (loss), net of tax, on the consolidated statements of income and comprehensive income.
Commercial Mortgage Loans
The carrying value of commercial mortgage loans represents the outstanding principal balance less a loan loss allowance for probable uncollectible amounts. The commercial mortgage loan loss allowance is estimated based on evaluating known and inherent risks in the loan portfolio and consists of a general loan loss allowance and a specific loan loss allowance. The general loan loss allowance is based on our analysis of factors including changes in the size and composition of the loan portfolio, debt coverage ratios, loan to value ratios, actual loan loss experience and individual loan analysis. An impaired commercial mortgage loan is a loan where we do not expect to receive contractual principal and interest in accordance with the terms of the loan agreement. A specific allowance for losses is recorded when a loan is considered to be impaired. We also hold specific allowances for losses on certain performing loans that we continue to monitor and evaluate. Impaired commercial mortgage loans without specific allowances for losses are those for which we have determined that it remains probable that we will collect all amounts due. In addition, for impaired commercial mortgage loans, we evaluate the loss to dispose of the underlying collateral, any significant out of pocket expenses the loan may incur, the loan-to-value ratio and other quantitative information we have concerning the loan. Portions of loans that are deemed uncollectible are generally written off against the allowance, and recoveries, if any, are credited to the allowance. See “Liquidity and Capital Resources—Investing Cash Flows—Commercial Mortgage Loans.”
Real Estate
Real estate is comprised of two components: real estate investments and real estate owned.
Real estate investment properties are stated at cost less accumulated depreciation. Generally, we depreciate this real estate using the straight-line depreciation method with property lives varying from 30 to 40 years. Accumulated
| | |
| 52 | | STANCORP FINANCIAL GROUP, INC. |
depreciation for real estate totaled $10.4 million and $29.4 million at December 31, 2011 and 2010, respectively. We record impairments when it is determined that the decline in fair value of an investment below its carrying value is other than temporary. The impairment loss is charged to net capital losses, and the cost basis of the investment is permanently adjusted to reflect the impairment.
Real estate owned is initially recorded at the lower of cost or estimated net realizable value, which includes an estimate for disposal costs. This amount may be adjusted in a subsequent period as additional market information regarding fair value is received. Our real estate owned is initially considered an investment held for sale and is expected to be sold within one year from acquisition. For any real estate expected to be sold, an impairment charge is recorded if we do not expect the investment to recover its carrying value prior to the expected date of sale. Once an impairment charge has been recorded, we continue to review the investment for further potential impairment.
Total real estate was $92.7 million at December 31, 2011, compared to $153.1 million at December 31, 2010. The $60.4 million decrease in total real estate during 2011 was primarily due to the sale and depreciation of real estate investments and the sale and impairment of real estate owned, partially offset by additional real estate owned properties acquired in satisfaction of debt through foreclosure or the acceptance of deeds in lieu of foreclosure.
DAC, VOBA and Other Intangible Assets
DAC, VOBA and other acquisition related intangible assets are generally originated through the issuance of new business or the purchase of existing business, either by purchasing blocks of insurance policies from other insurers or by the outright purchase of other companies. Our intangible assets are subject to impairment tests on an annual basis or more frequently if circumstances indicate that carrying values may not be recoverable.
The following table sets forth the balances of DAC, VOBA and other intangible assets:
| | | | | | | | | | | | |
| | | December 31, | | | Percent
Change | |
| (Dollars in millions) | | 2011 | | | 2010 | | |
DAC | | $ | 305.0 | | | $ | 277.0 | | | | 10.1 | % |
VOBA | | | 26.4 | | | | 28.4 | | | | (7.0 | ) |
Other intangible assets | | | 44.1 | | | | 51.7 | | | | (14.7 | ) |
| | |
|
|
| | | | |
| Total DAC, VOBA and other intangible assets | | $ | 375.5 | | | $ | 357.1 | | | | 5.2 | |
We defer certain acquisition costs that vary with and are primarily related to the origination of new business and placing that business in force. Certain costs related to obtaining new business and acquiring business through reinsurance agreements have been deferred and will be amortized to accomplish matching against related future premiums or gross profits as appropriate. We normally defer certain acquisition-related commissions and incentive payments, certain costs of policy issuance and underwriting, and certain printing costs. Assumptions used in developing DAC and amortization amounts each period include the amount of business in force, expected future persistency, withdrawals, interest rates and profitability. These assumptions are modified to reflect actual experience when appropriate. Additional amortization of DAC is charged to current earnings to the extent it is determined that future premiums or gross profits are not adequate to cover the remaining amounts deferred. Changes in actual persistency are reflected in the calculated DAC balance. Costs that do not vary with the production of new business are not deferred as DAC and are charged to expense as incurred. Generally, annual commissions are considered expenses and are not deferred.
DAC for group and individual disability insurance products and group life insurance products is amortized over the life of related policies in proportion to future premiums. We amortize DAC for group disability and life insurance products over the initial premium rate guarantee period, which averages 2.5 years. DAC for individual disability insurance products is amortized in proportion to future premiums over the life of the contract, averaging 20 to 25 years with approximately 50% and 75% expected to be amortized by years 10 and 15, respectively.
Our individual deferred annuities and group annuity products are classified as investment contracts. DAC related to these products is amortized over the life of related policies in proportion to expected gross profits. For our individual deferred annuities, DAC is generally amortized over 30 years with approximately 55% and 95% expected to be amortized by years 5 and 15, respectively. DAC for group annuity products is amortized over 10 years with approximately 80% expected to be amortized by year five.
Part II
VOBA primarily represents the discounted future profits of business assumed through reinsurance agreements. We have established VOBA for a block of individual disability business assumed from Minnesota Life and a block of group disability and group life business assumed from Teachers Insurance and Annuity Association of America (“TIAA”). VOBA is generally amortized in proportion to future premiums for group and individual disability insurance products and group life products. However, the VOBA related to the TIAA transaction associated with an in force block of group long term disability claims for which no ongoing premium is received is amortized in proportion to expected gross profits. If actual premiums or future profitability are inconsistent with our assumptions, we could be required to make adjustments to VOBA and related amortization. For the VOBA associated with the Minnesota Life block of business assumed, the amortization period is up to 30 years and is amortized in proportion to future premiums. The VOBA associated with the TIAA transaction is amortized in proportion to expected gross profits with an amortization period of up to 20 years. The accumulated amortization of VOBA was $62.4 million and $60.4 million at December 31, 2011 and 2010, respectively.
The following table sets forth the amount of DAC and VOBA balances amortized in proportion to expected gross profits and the percentage of the total balance of DAC and VOBA amortized in proportion to expected gross profits:
| | | | | | | | | | | | | | | | | | |
| | | December 31, 2011 | | | | | December 31, 2010 | |
| (Dollars in millions) | | Amount | | | Percent | | | | | Amount | | | Percent | |
DAC | | $ | 67.6 | | | | 22.2 | % | | | | $ | 63.6 | | | | 23.0 | % |
| VOBA | | | 7.1 | | | | 26.9 | | | | | | 7.5 | | | | 26.4 | |
Key assumptions, which will affect the determination of expected gross profits for determining DAC and VOBA balances, are:
| | • | | Interest rates, which affect both investment income and interest credited. |
| | • | | Stock market performance. |
| | • | | Capital gains and losses. |
| | • | | Claim termination rates. |
| | • | | Amount of business in force. |
These assumptions are modified to reflect actual experience when appropriate. Although a change in a single assumption may have an impact on the calculated amortization of DAC or VOBA for balances associated with investment contracts, it is the relationship of that change to the changes in other key assumptions that determines the ultimate impact on DAC or VOBA amortization. Because actual results and trends related to these assumptions vary from those assumed, we revise these assumptions annually to reflect our current best estimate of expected gross profits. As a result of this process, known as “unlocking,” the cumulative balances of DAC and VOBA are adjusted with an offsetting benefit or charge to income to reflect changes in the period of the revision. An unlocking event that results in an after-tax benefit generally occurs as a result of actual experience or future expectations being favorable compared to previous estimates. An unlocking event that results in an after-tax charge generally occurs as a result of actual experience or future expectations being unfavorable compared to previous estimates. As a result of unlocking, the amortization schedule for future periods is also adjusted.
The following table sets forth the impact of unlocking on DAC and VOBA balances:
| | | | | | | | | | | | | | | | | | | | |
| | | Years ended
December 31, | |
| (Dollars in millions) | | 2011 | | | Dollar
Change | | | 2010 | | | Dollar
Change | | | 2009 | |
| Decrease to DAC and VOBA | | $ | (0.9) | | | $ | (0.4) | | | $ | (0.5) | | | $ | 0.5 | | | $ | (1.0) | |
Significant, unanticipated changes in key assumptions, which affect the determination of expected gross profits, may result in a large unlocking event that could have a material adverse effect on our financial position or results of operations. However, future changes in DAC and VOBA balances due to changes in underlying assumptions are not expected to be material.
| | |
| 54 | | STANCORP FINANCIAL GROUP, INC. |
Our other intangible assets are subject to amortization and consist of certain customer lists from Asset Management business acquired and an individual disability marketing agreement. Customer lists have a combined estimated weighted-average remaining life of approximately 8.3 years. The marketing agreement accompanied the Minnesota Life transaction and provides access to Minnesota Life agents, some of whom now market Standard’s individual disability insurance products. The Minnesota Life marketing agreement will be fully amortized by the end of 2023. The accumulated amortization of other intangible assets was $30.6 million and $23.0 million at December 31, 2011 and 2010, respectively.
Reserves for Future Policy Benefits and Claims
Reserves include policy reserve liabilities and claim reserve liabilities and represent amounts to pay future benefits and claims. Claim reserve liabilities are for claims that have been incurred or are estimated to have been incurred but not yet reported to us. Policy reserve liabilities reflect our best estimate of assumptions at the time of policy issuance including adjustments for adverse deviations in actual experience.
The following table sets forth total reserve balances by reserve type:
| | | | | | | | |
| | | December 31, | |
| (In millions) | | 2011 | | | 2010 | |
Reserves: | | | | | | | | |
Policy reserves | | $ | 1,061.2 | | | $ | 1,035.5 | |
Claim reserves | | | 4,622.4 | | | | 4,466.8 | |
| | | | | | | | | |
Total reserves | | $ | 5,683.6 | | | $ | 5,502.3 | |
Developing the estimates for reserves, and thus the resulting impact on earnings, requires varying degrees of subjectivity and judgment, depending upon the nature of the reserve. For most of our reserves, the reserve calculation methodology is prescribed by various accounting and actuarial standards, although judgment is required in the determination of assumptions used in the calculation. We also hold reserves that lack a prescribed methodology but instead are determined by a formula that we have developed based on our own experience. Because this type of reserve requires a higher level of subjective judgment, we closely monitor its adequacy. These reserves are primarily incurred but not reported (“IBNR”) claim reserves associated with our disability products. Finally, a small amount of reserves is held based entirely upon subjective judgment. These reserves are generally set up as a result of unique circumstances that are not expected to continue far into the future and are released according to pre-established conditions and timelines.
The following table sets forth total reserve balances by calculation methodology:
| | | | | | | | | | | | | | | | |
| (In millions) | | December 31,
2011 | | | Percent of
Total | | | December 31,
2010 | | | Percent of
Total | |
Reserves: | | | | | | | | | | | | | | | | |
Reserves determined through prescribed methodology | | $ | 5,056.6 | | | | 89.0 | % | | $ | 4,872.6 | | | | 88.6 | % |
Reserves determined by internally-developed formulas | | | 620.7 | | | | 10.9 | | | | 619.3 | | | | 11.2 | |
Reserves based on subjective judgment | | | 6.3 | | | | 0.1 | | | | 10.4 | | | | 0.2 | |
| | | | | | | | | | | | | | | | | |
Total reserves | | $ | 5,683.6 | | | | 100.0 | % | | $ | 5,502.3 | | | | 100.0 | % |
Policy Reserves
Policy reserves include reserves established for individual disability insurance, individual and group immediate annuity businesses and individual life insurance. Policy reserves are calculated using our best estimates of assumptions and considerations at the time the policy was issued, adjusted for the effect of adverse deviations in actual experience. These assumptions are not subsequently modified unless policy reserves become inadequate, at which time we may need to change assumptions to increase reserves. We maintain a policy reserve for as long as a policy is in force, even after a separate claim reserve is established.
Part II
The following table sets forth policy reserves by block of business:
| | | | | | | | |
| | | December 31, | |
| (In millions) | | 2011 | | | 2010 | |
Policy reserves: | | | | | | | | |
Individual disability insurance | | $ | 219.8 | | | $ | 204.7 | |
Individual and group immediate annuity businesses | | | 244.2 | | | | 235.0 | |
Individual life insurance | | | 597.2 | | | | 595.8 | |
| | | | | | | | | |
Total policy reserves | | $ | 1,061.2 | | | $ | 1,035.5 | |
Individual Disability Insurance
Policy reserves for our individual disability block of business are established at the time of policy issuance using the net level premium method as prescribed by GAAP and represent the current value of projected future benefits including expenses less projected future premium. Assumptions used to calculate individual disability policy reserves may vary by the age, gender and occupation class of the insured, the year of policy issue and specific contract provisions and limitations.
Individual disability policy reserves are sensitive to assumptions and considerations regarding:
| | • | | Claim termination rates. |
| | • | | Discount rates used to value expected future claim payments and premiums. |
| | • | | The amount of monthly benefit paid to the insured less reinsurance recoveries and other offsets. |
| | • | | Expense rates including inflation. |
Individual and Group Immediate Annuity Businesses
Policy reserves for our individual and group immediate annuity blocks of business are established at the time of policy issue and represent the present value of future payments due under the annuity contracts. The contracts are single premium contracts, and, therefore, there is no projected future premium. Assumptions used to calculate immediate annuity policy reserves may vary by the age and gender of the annuitant and year of policy issue.
Immediate annuity policy reserves are sensitive to assumptions and considerations regarding:
| | • | | Annuitant mortality rates. |
| | • | | Discount rates used to value expected future annuity payments. |
Individual Life Insurance
Effective January 1, 2001, substantially all of our individual life policies and the associated reserves were ceded to Protective Life under a reinsurance agreement. If Protective Life were to become unable to meet its obligations, Standard would retain the reinsured liabilities. Therefore the associated reserves remain on Standard’s consolidated balance sheets and an equal amount is recorded as a recoverable from the reinsurer. We also retain a small number of individual policies arising out of individual conversions from our group life policies.
Claim Reserves
Claim reserves are established when a claim is incurred or is estimated to have been incurred but not yet reported to us and, as prescribed by GAAP, equal our best estimate of the present value of the liability of future unpaid claims and claim adjustment expenses. Reserves for IBNR claims are determined using our experience and consider actual historical incidence rates, claim-reporting patterns and the average cost of claims. The IBNR claim reserves are calculated using a company derived formula based primarily upon premiums, which is validated through a close examination of reserve run-out experience. The claim reserves are related to group and individual disability insurance and group life insurance products offered by our Insurance Services segment.
Claim reserves are subject to revision based on credible changes in claim experience and expectations of future factors that may influence claim experience. During each quarter, we monitor our emerging claim experience to ensure that the claim reserves remain appropriate. We make adjustments to our assumptions based on emerging trends that are credible
| | |
| 56 | | STANCORP FINANCIAL GROUP, INC. |
and are expected to persist, and expectations of future factors that may influence our claim experience. Assumptions used to calculate claim reserves may vary by the age, gender and occupation class of the claimant, the year the claim was incurred, time elapsed since disablement, and specific contract provisions and limitations.
The following table sets forth total claim reserves by block of business:
| | | | | | | | |
| | | December 31, | |
| (In millions) | | 2011 | | | 2010 | |
Claim reserves: | | | | | | | | |
Group disability insurance | | $ | 3,135.2 | | | $ | 3,022.2 | |
Individual disability insurance | | | 721.8 | | | | 694.1 | |
Group life insurance | | | 765.4 | | | | 750.5 | |
| | | | | | | | | |
Total claim reserves | | $ | 4,622.4 | | | $ | 4,466.8 | |
Group and Individual Disability Insurance
Claim reserves for our disability products are sensitive to assumptions and considerations regarding:
| | • | | Claim incidence rates for IBNR claim reserves. |
| | • | | Claim termination rates. |
| | • | | Discount rates used to value expected future claim payments. |
| | • | | The amount of monthly benefit paid to the insured less reinsurance recoveries and other offsets. |
| | • | | Expense rates including inflation. |
| | • | | Historical delay in reporting of claims incurred. |
Certain of these factors could be materially affected by changes in social perceptions about work ethics, emerging medical perceptions and legal interpretations regarding physiological or psychological causes of disability, emerging or changing health issues and changes in industry regulation. If there are changes in one or more of these factors or if actual claims experience is materially inconsistent with our assumptions, we could be required to change our reserves.
Group Life Insurance
Claim reserves for our group life products are established for death claims reported but not yet paid, IBNR for death and waiver claims and waiver of premium benefits. The death claim reserve is based on the actual amount to be paid. The IBNR claim reserves are calculated using historical information, and the waiver of premium benefit is calculated using a tabular reserve method that takes into account company experience and published industry tables.
Trends in Key Assumptions
Key assumptions affecting our reserve calculations are:
| | • | | The claim termination rate. |
| | • | | The claim incidence rate for policy reserves and IBNR claim reserves. |
The following table sets forth the average discount rate used for newly incurred long term disability claim reserves and life waiver reserves:
| | | | | | | | | | | | |
| | | Years ended December 31, | |
| | | 2011 | | | 2010 | | | 2009 | |
Average discount rate | | | 5.13 | % | | | 5.00 | % | | | 5.00 | % |
Reserve discount rates for newly incurred claims are reviewed quarterly and, if necessary, are adjusted to reflect our current and expected new investment yields. The discount rate is based on the average rate we received on newly invested assets during the previous 12 months, less a margin. We also consider our average investment yield and average discount rate on our entire block of claims when deciding whether to increase or decrease the discount rate. The decrease in the average discount rate from 2011 to 2010 was primarily the result of a continued low interest rate environment. A 25 basis point increase or decrease in the discount rate for newly incurred claims results in a comparable increase or decrease in
Part II
quarterly pre-tax income of approximately $1.6 million. We do not adjust group insurance premium rates based on short-term fluctuations in investment yields. Any offsetting adjustments of group insurance premium rates due to sustained changes in investment yields can take from one to three years given that most new contracts have rate guarantees in place.
Claim termination rates can vary widely from quarter to quarter. The claim termination assumptions used in determining our reserves represent our expectation for claim terminations over the life of our block of business and will vary from actual experience in any one quarter. While we have experienced some variation in our claim termination experience, we did not see any prolonged or systemic change in 2011 that would indicate a sustained underlying trend that would affect the claim termination rates used in the calculation of reserves.
As a result of studies of our long-term trends compared to reserving assumptions for our group long term disability insurance, we did not release any IBNR claim reserves in 2011, compared to a release of IBNR claim reserves totaling $11.7 million and claim reserves totaling $2.9 million in 2010. We released IBNR claim reserves totaling $16.6 million in 2009.
We refined the claim termination rate assumptions for the reserves on a small block of individual disability claims based on a blend of our experience and industry data in 2009, 2010 and 2011 which resulted in an increase in reserves of $11.5 million, $12.5 million and $5.5 million, respectively. Our block of business is relatively small, and, as a result, we view a blend of the industry data and our own experience as a more appropriate method for establishing termination assumptions compared solely to our own experience. We will continue to monitor the credibility of our developing experience and, if necessary, will adjust reserves accordingly.
We refined our reserve calculation for certain other individual disability claims in 2010 and 2011, which resulted in decreases in our individual disability reserves of $4.7 million and $1.9 million, respectively. There were no similar calculation refinements in 2009.
We monitor the adequacy of our reserves relative to our key assumptions. In our estimation, scenarios based on reasonably possible variations in claim termination assumptions could produce a percentage change in reserves for our group insurance lines of business of approximately +/- 0.2% or $8 million. However, given that claims experience can fluctuate widely from quarter to quarter, significant unanticipated changes in claim termination rates over time could produce a change in reserves for our group insurance lines outside of this range.
Pension and Postretirement Benefit Plans
We have two non-contributory defined benefit pension plans: the employee pension plan and the agent pension plan. The employee pension plan is for all eligible employees and the agent pension plan is for former field employees and agents. The defined benefit pension plans provide benefits based on years of service and final average pay. Participation in the defined benefit pension plans is generally limited to eligible employees whose date of employment began before 2003. These plans are sponsored by Standard and administered by Standard Retirement Services, Inc. and are closed for new participants.
We also have a postretirement benefit plan that includes medical, prescription drug benefits and group term life insurance. The group term life insurance benefit was curtailed as of December 31, 2011. Eligible retirees are required to contribute specified amounts for medical and prescription drug benefits that are determined periodically and are based on retirees’ length of service and age at retirement. Participation in the postretirement benefit plan is limited to employees who had reached the age of 40 or whose combined age and length of service was equal to or greater than 45 years as of January 1, 2006. This plan is sponsored and administered by Standard and is closed for new participants.
In addition, eligible executive officers are covered by a non-qualified supplemental retirement plan.
We are required to recognize the funded status of our pension and postretirement benefit plans as an asset or liability on the balance sheet. For pension plans, this is measured as the difference between the plan assets at fair value and the projected benefit obligation as of the year-end balance sheet date. For our postretirement plan, this is measured as the difference between the plan assets at fair value and the accumulated benefit obligation as of the year-end balance sheet date. Unrecognized actuarial gains or losses, prior service costs or credits, and transition assets are amortized, net of tax, out of accumulated other comprehensive income or loss as components of net periodic benefit cost.
In accordance with the accounting principles related to our pension and other postretirement plans, we are required to make a significant number of assumptions in order to calculate the related liabilities and expenses each period. The major assumptions that affect net periodic benefit cost and the funded status of the plans include the weighted-average discount rate, the expected return on plan assets, and the rate of compensation increase.
| | |
| 58 | | STANCORP FINANCIAL GROUP, INC. |
The weighted-average discount rate is an interest assumption used to convert the benefit payment stream to present value. The discount rate is selected based on the yield of a portfolio of high quality corporate bonds with durations that are similar to the expected distributions from the employee benefit plan.
The expected return on plan assets assumption is the best long-term estimate of the average annual return that will be produced from the pension trust assets until current benefits are paid. Our expectations for the future investment returns of the asset categories are based on a combination of historical and projected market performance. The expected return for the total portfolio is calculated based on each plan’s strategic asset allocation.
The long-term rate of return for the employee pension plan portfolio is derived by calculating the average return for the portfolio monthly, from 1971 to the present, using the average mutual fund manager returns in each asset category, weighted by the target allocation to each category.
The rate of compensation increase is a long-term assumption that is based on an estimated inflation rate in addition to merit and promotion-related compensation increase components.
For the postretirement benefit plan, the assumed health care cost trend rates are also major assumptions that affect expenses and liabilities. Assumed health care cost trend rates have a significant effect on the amounts reported for the health care plans. A one-percentage-point change in assumed health care cost trend rates would have the following effects:
| | | | | | | | |
| (In millions) | | 1% Point
Increase | | | 1% Point
Decrease | |
Effect on total of service and interest cost | | $ | 0.5 | | | $ | (0.4 | ) |
| Effect on postretirement benefit obligation | | | 7.1 | | | | (5.6 | ) |
Our discount rate assumption is reviewed annually, and we use a December 31 measurement date for each of our plans. For more information concerning our pension and postretirement plans, see Item 8, “Financial Statements and Supplementary Data—Notes to Consolidated Financial Statements—Note 4—Retirement Benefits.”
Income Taxes
We file a U.S. consolidated income tax return that includes all subsidiaries. Our U.S. income tax is calculated using regular corporate income tax rates on a tax base determined by laws and regulations administered by the IRS. We also file corporate income tax returns in various states. The provision for income taxes includes amounts currently payable and deferred amounts that result from temporary differences between financial reporting and tax bases of assets and liabilities. Deferred tax assets and liabilities are measured using enacted tax rates expected to apply when the temporary differences are expected to reverse.
GAAP requires management to use a more likely than not standard to evaluate whether, based on available evidence, each deferred tax asset will be realized. A valuation allowance is recorded to reduce a deferred tax asset to the amount expected to be realized. We have recorded a deferred tax asset for loss carryforwards. Realization is dependent on generating sufficient taxable income prior to expiration of the loss carryforwards. Although realization is not assured, management believes it is more likely than not that all of the deferred tax asset will be realized. The amount of the deferred tax asset considered realizable, however, could be reduced in the near term if estimates of future taxable income during the carryforward period are reduced.
Management is required to determine whether tax return positions are more likely than not to be sustained upon audit by taxing authorities. Tax benefits of uncertain tax positions, as determined and measured by this interpretation, cannot be recognized in our financial statements.
We record income tax interest and penalties in the income tax provision according to our accounting policy. See Item 8, “Financial Statements and Supplementary Data—Notes to Consolidated Financial Statements—Note 7—Income Taxes.”
FORWARD-LOOKING STATEMENTS
From time to time StanCorp or its representatives make written or oral statements, including some of the statements contained or incorporated by reference in this Annual Report on Form 10-K and in other reports, filings with the Securities and Exchange Commission, press releases, conferences or otherwise, that are other than purely historical information. These statements, including estimates, projections, statements related to business plans, strategies, objectives and expected operating results and the assumptions upon which those statements are based, are forward-looking statements within the
Part II
meaning of the Private Securities Litigation Reform Act of 1995 and Section 21E of the Exchange Act, as amended. Forward-looking statements also include, without limitation, any statement that includes words such as “expects,” “anticipates,” “intends,” “plans,” “believes,” “estimates,” “seeks,” “will be,” “will continue,” “will likely result” and similar expressions that are predictive in nature or that depend on or refer to future events or conditions. Our forward-looking statements are not guarantees of future performance and involve uncertainties that are difficult to predict. They involve risks and uncertainties which may cause actual results to differ materially from the forward-looking statements and include, but are not limited to, the following:
| | • | | Growth of sales, premiums, annuity deposits, cash flows, assets under administration including performance of equity investments in the separate account, gross profits and profitability. |
| | • | | Availability of capital required to support business growth and the effective utilization of capital, including the ability to achieve financing through debt or equity. |
| | • | | Changes in our liquidity needs and the liquidity of assets in its investment portfolio. |
| | • | | Our ability to refinance or retire maturing debt. |
| | • | | Integration and performance of business acquired through reinsurance or acquisition. |
| | • | | Changes in financial strength and credit ratings. |
| | • | | Changes in the regulatory environment at the state or federal level including changes in income tax rates and regulations or changes in U.S. GAAP accounting principles, practices or policies. |
| | • | | Findings in litigation or other legal proceedings. |
| | • | | Intent and ability to hold investments consistent with our investment strategy. |
| | • | | Receipt of dividends from, or contributions to, our subsidiaries. |
| | • | | Adequacy of the diversification of risk by product offerings and customer industry, geography and size, including concentration of risk, especially inherent in group life products. |
| | • | | Adequacy of asset-liability management. |
| | • | | Events of terrorism, natural disasters or other catastrophic events, including losses from a disease pandemic. |
| | • | | Benefit ratios, including changes in claims incidence, severity and recovery. |
| | • | | Adequacy of reserves established for future policy benefits. |
| | • | | The effect of changes in interest rates on reserves, policyholder funds, investment income and commercial mortgage loan prepayment fees. |
| | • | | Levels of employment and wage growth and the impact of rising benefit costs on employer budgets for employee benefits. |
| | • | | Competition from other insurers and financial services companies, including the ability to competitively price its products. |
| | • | | Ability of reinsurers to meet their obligations. |
| | • | | Availability, adequacy and pricing of reinsurance and catastrophe reinsurance coverage and potential charges incurred. |
| | • | | Achievement of anticipated levels of operating expenses. |
| | • | | Adequacy of diversification of risk within our fixed maturity securities portfolio by industries, issuers and maturities. |
| | • | | Adequacy of diversification of risk within our commercial mortgage loan portfolio by borrower type, property type and geographic region. |
| | • | | Credit quality of the holdings in our investment portfolios. |
| | • | | The condition of the economy and expectations for interest rate changes. |
| | • | | The effect of changing levels of commercial mortgage loan prepayment fees and participation levels on cash flows. |
| | • | | Experience in delinquency rates or loss experience in its commercial mortgage loan portfolio. |
| | • | | Adequacy of commercial mortgage loan loss allowance. |
| | • | | Concentration of commercial mortgage loan assets collateralized in certain states such as California. |
| | • | | Concentration of commercial mortgage loan assets by borrower. |
| | • | | Environmental liability exposure resulting from commercial mortgage loan and real estate investments. |
| Item 7A. | | Quantitative and Qualitative Disclosures About Market Risk |
See Item 7, “Management’s Discussion and Analysis of Financial Condition and Results of Operations—Liquidity and Capital Resources—Asset-Liability and Interest Rate Risk Management.”
| | |
| 60 | | STANCORP FINANCIAL GROUP, INC. |
| ITEM 8. | | FINANCIAL STATEMENTS AND SUPPLEMENTARY DATA |
Part II
REPORT OF INDEPENDENT REGISTERED PUBLIC ACCOUNTING FIRM
To the Board of Directors and Shareholders of
StanCorp Financial Group, Inc.
Portland, Oregon
We have audited the accompanying consolidated balance sheets of StanCorp Financial Group, Inc., and subsidiaries (the “Company”) as of December 31, 2011 and 2010, and the related consolidated statements of income and comprehensive income, changes in shareholders’ equity, and cash flows for each of the three years in the period ended December 31, 2011. These financial statements are the responsibility of the Company’s management. Our responsibility is to express an opinion on these financial statements based on our audits.
We conducted our audits in accordance with the standards of the Public Company Accounting Oversight Board (United States). Those standards require that we plan and perform the audit to obtain reasonable assurance about whether the financial statements are free of material misstatement. An audit includes examining, on a test basis, evidence supporting the amounts and disclosures in the financial statements. An audit also includes assessing the accounting principles used and significant estimates made by management, as well as evaluating the overall financial statement presentation. We believe that our audits provide a reasonable basis for our opinion.
In our opinion, such consolidated financial statements present fairly, in all material respects, the financial position of StanCorp Financial Group, Inc., and subsidiaries as of December 31, 2011 and 2010, and the results of their operations and their cash flows for each of the three years in the period ended December 31, 2011, in conformity with accounting principles generally accepted in the United States of America.
We have also audited, in accordance with the standards of the Public Company Accounting Oversight Board (United States), the Company’s internal control over financial reporting as of December 31, 2011, based on the criteria established inInternal Control—Integrated Framework issued by the Committee of Sponsoring Organizations of the Treadway Commission and our report dated February 24, 2012 expressed an unqualified opinion on the Company’s internal control over financial reporting.
|
/S/ DELOITTE & TOUCHE LLP
|
Portland, Oregon
February 24, 2012
| | |
| 62 | | STANCORP FINANCIAL GROUP, INC. |
CONSOLIDATED STATEMENTS OF INCOME AND COMPREHENSIVE INCOME
| | | | | | | | | | | | |
| | | Years ended December 31, | |
| (Dollars in millions—except per share data) | | 2011 | | | 2010 | | | 2009 | |
Revenues: | | | | | | | | | | | | |
Premiums | | $ | 2,153.3 | | | $ | 2,097.7 | | | $ | 2,101.9 | |
Administrative fees | | | 115.5 | | | | 116.5 | | | | 108.5 | |
Net investment income | | | 612.8 | | | | 602.5 | | | | 586.5 | |
Net capital losses: | | | | | | | | | | | | |
Total other-than-temporary impairment losses on fixed maturity securities—available-for-sale | | | (1.8 | ) | | | (0.7 | ) | | | (5.9 | ) |
All other net capital losses | | | (5.1 | ) | | | (50.9 | ) | | | (21.0 | ) |
| | | | | | | | | | | | | |
Total net capital losses | | | (6.9 | ) | | | (51.6 | ) | | | (26.9 | ) |
| | | | | | | | | | | | | |
Total revenues | | | 2,874.7 | | | | 2,765.1 | | | | 2,770.0 | |
| | | | | | | | | | | | | |
Benefits and expenses: | | | | | | | | | | | | |
Benefits to policyholders | | | 1,771.2 | | | | 1,619.8 | | | | 1,575.7 | |
Interest credited | | | 161.0 | | | | 158.4 | | | | 145.6 | |
Operating expenses | | | 471.2 | | | | 446.2 | | | | 476.2 | |
Commissions and bonuses | | | 218.7 | | | | 206.1 | | | | 202.0 | |
Premium taxes | | | 36.7 | | | | 34.7 | | | | 34.2 | |
Interest expense | | | 38.9 | | | | 38.9 | | | | 39.2 | |
Net increase in deferred acquisition costs, value of business acquired and other intangible assets | | | (18.1 | ) | | | (21.8 | ) | | | (18.6 | ) |
| | | | | | | | | | | | | |
Total benefits and expenses | | | 2,679.6 | | | | 2,482.3 | | | | 2,454.3 | |
| | | | | | | | | | | | | |
Income before income taxes | | | 195.1 | | | | 282.8 | | | | 315.7 | |
Income taxes | | | 55.8 | | | | 93.8 | | | | 106.8 | |
| | | | | | | | | | | | | |
Net income | | | 139.3 | | | | 189.0 | | | | 208.9 | |
| | | | | | | | | | | | | |
Other comprehensive income, net of tax: | | | | | | | | | | | | |
Unrealized gains on securities—available-for-sale: | | | | | | | | | | | | |
Net unrealized capital gains on securities—available-for-sale | | | 103.4 | | | | 100.5 | | | | 210.8 | |
Reclassification adjustment for net capital (gains) losses included in
net income | | | (5.9 | ) | | | (9.6 | ) | | | 3.5 | |
Employee benefit plans: | | | | | | | | | | | | |
Prior service (cost) credit and net (losses) gains arising during the
period, net | | | (26.6 | ) | | | (5.0 | ) | | | 8.4 | |
Reclassification adjustment for amortization to net periodic pension
cost, net | | | 3.3 | | | | 3.6 | | | | 4.9 | |
| | | | | | | | | | | | | |
Total other comprehensive income, net of tax | | | 74.2 | | | | 89.5 | | | | 227.6 | |
| | | | | | | | | | | | | |
Comprehensive income | | $ | 213.5 | | | $ | 278.5 | | | $ | 436.5 | |
Net income per common share: | | | | | | | | | | | | |
Basic | | $ | 3.10 | | | $ | 4.04 | | | $ | 4.27 | |
Diluted | | | 3.09 | | | | 4.02 | | | | 4.26 | |
Weighted-average common shares outstanding: | | | | | | | | | | | | |
Basic | | | 44,876,650 | | | | 46,774,277 | | | | 48,932,908 | |
Diluted | | | 45,016,070 | | | | 47,006,228 | | | | 49,044,543 | |
See Notes to Consolidated Financial Statements.
Part II
CONSOLIDATED BALANCE SHEETS
| | | | | | | | |
| | | December 31, | |
| (Dollars in millions) | | 2011 | | | 2010 | |
ASSETS | | | | | | | | |
Investments: | | | | | | | | |
Fixed maturity securities—available-for-sale (amortized cost of $6,209.9 and $6,023.0) | | $ | 6,769.5 | | | $ | 6,419.1 | |
Commercial mortgage loans, net | | | 4,902.3 | | | | 4,513.6 | |
Real estate, net | | | 92.7 | | | | 153.1 | |
Other invested assets | | | 130.9 | | | | 60.8 | |
| | | | | | | | | |
Total investments | | | 11,895.4 | | | | 11,146.6 | |
Cash and cash equivalents | | | 138.4 | | | | 152.0 | |
Premiums and other receivables | | | 118.8 | | | | 101.9 | |
Accrued investment income | | | 111.7 | | | | 110.8 | |
Amounts recoverable from reinsurers | | | 949.3 | | | | 938.3 | |
Deferred acquisition costs, value of business acquired and other intangible assets, net | | | 375.5 | | | | 357.1 | |
Goodwill | | | 36.0 | | | | 36.0 | |
Property and equipment, net | | | 101.3 | | | | 111.5 | |
Other assets | | | 113.9 | | | | 101.7 | |
Separate account assets | | | 4,593.5 | | | | 4,787.4 | |
| | | | | | | | | |
Total assets | | $ | 18,433.8 | | | $ | 17,843.3 | |
LIABILITIES AND SHAREHOLDERS’ EQUITY | | | | | | | | |
Liabilities: | | | | | | | | |
Future policy benefits and claims | | $ | 5,683.6 | | | $ | 5,502.3 | |
Other policyholder funds | | | 5,078.1 | | | | 4,627.8 | |
Deferred tax liabilities, net | | | 113.5 | | | | 58.3 | |
Short-term debt | | | 251.2 | | | | 2.2 | |
Long-term debt | | | 300.9 | | | | 551.9 | |
Other liabilities | | | 402.5 | | | | 401.3 | |
Separate account liabilities | | | 4,593.5 | | | | 4,787.4 | |
| | | | | | | | | |
Total liabilities | | | 16,423.3 | | | | 15,931.2 | |
| | | | | | | | | |
Commitments and contingencies (See Note 19) | | | | | | | | |
| | |
Shareholders’ equity: | | | | | | | | |
Preferred stock, 100,000,000 shares authorized; none issued | | | — | | | | — | |
Common stock, no par, 300,000,000 shares authorized; 44,268,859 and 46,159,387 shares issued at December 31, 2011 and December 31, 2010, respectively | | | 82.4 | | | | 158.2 | |
Accumulated other comprehensive income | | | 235.1 | | | | 160.9 | |
Retained earnings | | | 1,693.0 | | | | 1,593.0 | |
| | | | | | | | | |
Total shareholders’ equity | | | 2,010.5 | | | | 1,912.1 | |
| | | | | | | | | |
Total liabilities and shareholders’ equity | | $ | 18,433.8 | | | $ | 17,843.3 | |
See Notes to Consolidated Financial Statements.
| | |
| 64 | | STANCORP FINANCIAL GROUP, INC. |
CONSOLIDATED STATEMENTS OF CHANGES IN SHAREHOLDERS’ EQUITY
| | | | | | | | | | | | | | | | | | | | |
| | | Common Stock | | | Accumulated
Other
Comprehensive
Income (Loss) | | | Retained
Earnings | | | Total
Shareholders’
Equity | |
| (Dollars in millions) | | Shares | | | Amount | | | | |
Balance, January 1, 2009 | | | 48,989,074 | | | $ | 262.9 | | | $ | (153.9 | ) | | $ | 1,271.3 | | | $ | 1,380.3 | |
Net income | | | — | | | | — | | | | — | | | | 208.9 | | | | 208.9 | |
Cumulative adjustment for the noncredit portion of losses from other-than-temporary impairments, net of tax | | | — | | | | — | | | | (2.3 | ) | | | 2.3 | | | | — | |
Other comprehensive income, net of tax | | | — | | | | — | | | | 227.6 | | | | — | | | | 227.6 | |
Common stock: | | | | | | | | | | | | | | | | | | | | |
Repurchased | | | (1,551,700 | ) | | | (59.3 | ) | | | — | | | | — | | | | (59.3 | ) |
Issued under share-based compensation plans, net | | | 307,150 | | | | 16.8 | | | | — | | | | — | | | | 16.8 | |
Dividends declared on common stock | | | — | | | | — | | | | — | | | | (38.9 | ) | | | (38.9 | ) |
| | | | | | | | | | | | | | | | | | | | | |
| Balance, December 31, 2009 | | | 47,744,524 | | | | 220.4 | | | | 71.4 | | | | 1,443.6 | | | | 1,735.4 | |
Net income | | | — | | | | — | | | | — | | | | 189.0 | | | | 189.0 | |
Other comprehensive income, net of tax | | | — | | | | — | | | | 89.5 | | | | — | | | | 89.5 | |
Common stock: | | | | | | | | | | | | | | | | | | | | |
Repurchased | | | (2,034,200 | ) | | | (81.8 | ) | | | — | | | | — | | | | (81.8 | ) |
Issued under share-based compensation plans, net | | | 449,063 | | | | 19.6 | | | | — | | | | — | | | | 19.6 | |
Dividends declared on common stock | | | — | | | | — | | | | — | | | | (39.6 | ) | | | (39.6 | ) |
| | | | | | | | | | | | | | | | | | | | | |
Balance, December 31, 2010 | | | 46,159,387 | | | | 158.2 | | | | 160.9 | | | | 1,593.0 | | | | 1,912.1 | |
Net income | | | — | | | | — | | | | — | | | | 139.3 | | | | 139.3 | |
Other comprehensive income, net of tax | | | — | | | | — | | | | 74.2 | | | | — | | | | 74.2 | |
Common stock: | | | | | | | | | | | | | | | | | | | | |
Repurchased | | | (2,180,100 | ) | | | (90.3 | ) | | | — | | | | — | | | | (90.3 | ) |
Issued under share-based compensation plans, net | | | 289,572 | | | | 14.5 | | | | — | | | | — | | | | 14.5 | |
Dividends declared on common stock | | | — | | | | — | | | | — | | | | (39.3 | ) | | | (39.3 | ) |
| | | | | | | | | | | | | | | | | | | | | |
| Balance, December 31, 2011 | | | 44,268,859 | | | $ | 82.4 | | | $ | 235.1 | | | $ | 1,693.0 | | | $ | 2,010.5 | |
See Notes to Consolidated Financial Statements.
Part II
CONSOLIDATED STATEMENTS OF CASH FLOWS
| | | | | | | | | | | | |
| | | Years ended December 31, | |
| (In millions) | | 2011 | | | 2010 | | | 2009 | |
Operating: | | | | | | | | | | | | |
Net income | | $ | 139.3 | | | $ | 189.0 | | | $ | 208.9 | |
Adjustments to reconcile net income to net cash provided by operating activities: | | | | | | | | | | | | |
Net realized capital losses | | | 6.9 | | | | 51.6 | | | | 26.9 | |
Depreciation and amortization | | | 133.9 | | | | 129.7 | | | | 123.4 | |
Deferral of acquisition costs, value of business acquired and other intangible
assets, net | | | (98.8 | ) | | | (91.8 | ) | | | (93.9 | ) |
Deferred income taxes | | | 15.3 | | | | (21.9 | ) | | | (16.8 | ) |
Changes in other assets and liabilities: | | | | | | | | | | | | |
Receivables and accrued income | | | (28.3 | ) | | | 13.5 | | | | 13.9 | |
Future policy benefits and claims | | | 166.3 | | | | 127.8 | | | | 66.5 | |
Other, net | | | (80.5 | ) | | | (42.8 | ) | | | 112.5 | |
| | | | | | | | | | | | | |
Net cash provided by operating activities | | | 254.1 | | | | 355.1 | | | | 441.4 | |
Investing: | | | | | | | | | | | | |
Proceeds from sale, maturity, or repayment of fixed maturity securities— available-for-sale | | | 885.2 | | | | 762.4 | | | | 953.8 | |
Proceeds from sale or repayment of commercial mortgage loans | | | 573.8 | | | | 499.3 | | | | 542.0 | |
Proceeds from sale of real estate | | | 62.6 | | | | 31.5 | | | | 0.9 | |
Proceeds from sale or maturity of other investments | | | — | | | | — | | | | 0.2 | |
Acquisition of fixed maturity securities—available-for-sale | | | (1,076.8 | ) | | | (856.1 | ) | | | (1,570.8 | ) |
Acquisition or origination of commercial mortgage loans | | | (970.2 | ) | | | (902.2 | ) | | | (804.5 | ) |
Acquisition of real estate | | | (5.3 | ) | | | (2.3 | ) | | | (1.5 | ) |
Acquisition of other invested assets | | | (47.0 | ) | | | (6.9 | ) | | | — | |
Acquisition of businesses, net of cash acquired | | | — | | | | (2.8 | ) | | | (5.2 | ) |
Acquisition of property and equipment, net | | | (17.7 | ) | | | (16.0 | ) | | | (22.5 | ) |
| | | | | | | | | | | | | |
Net cash used in investing activities | | | (595.4 | ) | | | (493.1 | ) | | | (907.6 | ) |
| | | | | | | | | | | | | |
Financing: | | | | | | | | | | | | |
Policyholder fund deposits | | | 1,905.0 | | | | 1,640.0 | | | | 1,748.7 | |
Policyholder fund withdrawals | | | (1,454.7 | ) | | | (1,349.3 | ) | | | (1,355.7 | ) |
Short-term debt | | | (1.0 | ) | | | (0.7 | ) | | | (0.8 | ) |
Long-term debt | | | (1.0 | ) | | | (1.3 | ) | | | (8.3 | ) |
Issuance of common stock | | | 9.0 | | | | 14.4 | | | | 8.3 | |
Repurchases of common stock | | | (90.3 | ) | | | (81.8 | ) | | | (59.3 | ) |
Dividends paid on common stock | | | (39.3 | ) | | | (39.6 | ) | | | (38.9 | ) |
| | | | | | | | | | | | | |
Net cash provided by financing activities | | | 327.7 | | | | 181.7 | | | | 294.0 | |
| | | |
| | | | | | | | | | | | | |
(Decrease) increase in cash and cash equivalents | | | (13.6 | ) | | | 43.7 | | | | (172.2 | ) |
Cash and cash equivalents, beginning of year | | | 152.0 | | | | 108.3 | | | | 280.5 | |
| | | | | | | | | | | | | |
Cash and cash equivalents, end of year | | $ | 138.4 | | | $ | 152.0 | | | $ | 108.3 | |
| | | |
| | | | | | | | | | | | | |
Supplemental disclosure of cash flow information: | | | | | | | | | | | | |
Cash paid during the year for: | | | | | | | | | | | | |
Interest | | $ | 206.7 | | | $ | 200.5 | | | $ | 178.8 | |
Income taxes | | | 74.1 | | | | 115.9 | | | | 90.1 | |
Non-cash transactions: | | | | | | | | | | | | |
Real estate acquired through commercial mortgage loan foreclosure | | | 22.8 | | | | 103.2 | | | | 24.2 | |
Commercial mortgage loans originated on real estate sold | | | 52.2 | | | | — | | | | — | |
| | | | | | | | | | | | | |
See Notes to Consolidated Financial Statements.
| | |
| 66 | | STANCORP FINANCIAL GROUP, INC. |
NOTES TO CONSOLIDATED FINANCIAL STATEMENTS
As used in this Form 10-K, the terms “StanCorp,” “Company,” “we,” “us” and “our” refer to StanCorp Financial Group, Inc. and its subsidiaries, unless the context otherwise requires.
1. SUMMARY OF SIGNIFICANT ACCOUNTING POLICIES
Organization, principles of consolidation, and basis of presentation
StanCorp, headquartered in Portland, Oregon, is a holding company and conducts business through wholly-owned operating subsidiaries throughout the United States. Through its subsidiaries, StanCorp has the authority to underwrite insurance products in all 50 states. StanCorp operates through two segments: Insurance Services and Asset Management as well as an Other category. See “Note 5—Segments.”
StanCorp has the following wholly-owned operating subsidiaries: Standard Insurance Company (“Standard”), The Standard Life Insurance Company of New York, Standard Retirement Services, Inc. (“Standard Retirement Services”), StanCorp Equities, Inc. (“StanCorp Equities”), StanCorp Mortgage Investors, LLC (“StanCorp Mortgage Investors”), StanCorp Investment Advisers, Inc. (“StanCorp Investment Advisers”), StanCorp Real Estate, LLC (“StanCorp Real Estate”), Standard Management, Inc. (“Standard Management”) and Adaptu, LLC (“Adaptu”).
Standard, the Company’s largest subsidiary, underwrites group and individual disability insurance and annuity products, group life and accidental death and dismemberment (“AD&D”) insurance, and provides group dental and group vision insurance, absence management services and retirement plan products. Founded in 1906, Standard is domiciled in Oregon, licensed in all states except New York, and licensed in the District of Columbia and the U.S. territories of Guam and the Virgin Islands.
The Standard Life Insurance Company of New York was organized in 2000 and is licensed to provide group long term and short term disability insurance, group life and AD&D insurance, group dental insurance and individual disability insurance in New York.
The Standard is a service mark of StanCorp and its subsidiaries and is used as a brand mark and marketing name by Standard and The Standard Life Insurance Company of New York.
Standard Retirement Services administers and services StanCorp’s retirement plans group annuity contracts and trust products. Retirement plan products are offered in all 50 states through Standard or Standard Retirement Services.
StanCorp Equities is a limited broker-dealer and member of the Financial Industry Regulatory Authority. StanCorp Equities serves as principal underwriter and distributor for group variable annuity contracts issued by Standard and as the broker of record for certain retirement plans using the trust platform. StanCorp Equities carries no customer accounts but provides supervision and oversight for the distribution of group variable annuity contracts and of the sales activities of all registered representatives employed by StanCorp Equities and its affiliates.
StanCorp Mortgage Investors originates and services fixed-rate commercial mortgage loans for the investment portfolios of the Company’s insurance subsidiaries. StanCorp Mortgage Investors also generates additional fee income from the origination and servicing of commercial mortgage loans participated to institutional investors.
StanCorp Investment Advisers is a Securities and Exchange Commission (“SEC”) registered investment adviser providing performance analysis, fund selection support, model portfolios and other investment advisory, financial planning, and investment management services to its retirement plan clients, individual investors and subsidiaries of StanCorp.
StanCorp Real Estate is a property management company that owns and manages the Hillsboro, Oregon home office properties and other properties held for investment and held for sale. StanCorp Real Estate also manages the Portland, Oregon home office properties.
Standard Management has owned and managed certain real estate properties held for sale.
Adaptu provides an online service to help members plan and manage their financial lives.
Standard holds interests in low-income housing tax credit investments. These interests do not meet the requirements for consolidation under existing accounting standards, and thus the Company’s interests in the low-income housing tax credit investments are accounted for under the equity method of accounting. The total investment in these interests was $128.0 million and $57.5 million at December 31, 2011 and 2010 respectively.
Part II
The consolidated financial statements include StanCorp and its subsidiaries. Intercompany balances and transactions have been eliminated on a consolidated basis.
In 2008, the Company identified opportunities and developed strategies to centralize key functions, streamline its processes and improve efficiencies. In January 2009, the Company adopted a restructuring plan to implement these strategies. The Company incurred $18.6 million of costs during its 2009 operating expense reduction initiatives. In 2011, as part of an ongoing effort to reduce costs and improve capabilities, the Company initiated a project to outsource a significant portion of its information-technology infrastructure function, which resulted in approximately $11 million in project related costs.
Reclassifications
Certain investments previously classified as Real estate, net and Policy loans have been reclassified to Other invested assets for all periods presented. Low-income housing tax credit investments that were previously included in the Real estate, net balance were reclassified to Other invested assets. The amounts related to low-income housing tax credit investments that were reclassified were $128.0 million and $57.5 million for 2011 and 2010, respectively. The amounts related to Policy loans that were reclassified to Other invested assets were $2.9 million and $3.3 million for 2011 and 2010, respectively. The reclassifications discussed above had no impact on the Company’s financial condition, results of operations or cash flows for any periods presented.
Use of estimates
The Company’s consolidated financial statements have been prepared in accordance with accounting principles generally accepted in the United States of America (“GAAP”) which require management to make estimates and assumptions that affect reported amounts of assets and liabilities and disclosures of contingent assets and contingent liabilities at the dates of the financial statements and the reported amounts of revenues and expenses during the reporting periods. The estimates most susceptible to material changes due to significant judgment are those used in determining investment valuations, deferred acquisition costs (“DAC”), value of business acquired (“VOBA”) and other intangible assets, the reserves for future policy benefits and claims, pension and postretirement benefit plans and the provision for income taxes. The results of these estimates are critical because they affect the Company’s profitability and may affect key indicators used to measure the Company’s performance. These estimates have a material effect on our results of operations and financial condition.
Investment Valuations
Fixed Maturity Securities—Available-for-sale (“Fixed Maturity Securities”)
Fixed maturity security capital gains and losses are recognized using the specific identification method. If a debt security’s fair value declines below its amortized cost, we must assess the security’s impairment to determine if the impairment is other than temporary.
In the Company’s quarterly fixed maturity security impairment analysis, management evaluates whether a decline in value of the fixed maturity security is other than temporary by considering the following factors:
| | • | | The nature of the fixed maturity security. |
| | • | | The duration until maturity. |
| | • | | The duration and extent the fair value has been below amortized cost. |
| | • | | The financial quality of the issuer. |
| | • | | Estimates regarding the issuer’s ability to make the scheduled payments associated with the fixed maturity security. |
| | • | | The Company’s intent to sell or whether it is more likely than not we will be required to sell a fixed maturity security before recovery of the security’s cost basis through the evaluation of facts and circumstances including, but not limited to, decisions to rebalance our portfolio, current cash flow needs and sales of securities to capitalize on favorable pricing. |
If it is determined an other-than-temporary impairment (“OTTI”) exists, we separate the OTTI of debt securities into an OTTI related to credit loss and an OTTI related to noncredit loss. The OTTI related to credit loss represents the portion of losses equal to the difference between the present value of expected cash flows, discounted using the pre-impairment yields, and the amortized cost basis. All other changes in value represent the OTTI related to noncredit loss. The OTTI
| | |
| 68 | | STANCORP FINANCIAL GROUP, INC. |
related to credit loss is recognized in earnings in the current period, while the OTTI related to noncredit loss is deemed recoverable and is recognized in other comprehensive income. The cost basis of the fixed maturity security is permanently adjusted to reflect the credit related impairment. Once an impairment charge has been recorded, the Company continues to review the OTTI securities for further potential impairment.
The Company will continue to evaluate our holdings; however, the Company currently expects the fair values of our investments to recover either prior to their maturity dates or upon maturity. Should the credit quality of the Company’s fixed maturity securities significantly decline, there could be a material adverse effect on the Company’s business, financial position, results of operations or cash flows.
In conjunction with determining the extent of credit losses associated with debt securities, the Company utilizes certain information in order to determine the present value of expected cash flows discounted using pre-impairment yields. Some of these input factors include, but are not limited to, original scheduled contractual cash flows, current market spread information, risk-free rates, fundamentals of the industry and sector in which the issuer operates, and general market information.
Fixed maturity securities are classified as available-for-sale and are carried at fair value on the consolidated balance sheet. See “Note 9—Fair Value” for a detailed explanation of the valuation methods the Company uses to calculate the fair value of the Company’s financial instruments. Valuation adjustments for fixed maturity securities not accounted for as OTTI are reported as net increases or decreases to other comprehensive income (loss), net of tax, on the consolidated statements of income and comprehensive income.
Commercial Mortgage Loans
Commercial mortgage loans are stated at amortized cost less a loan loss allowance for probable uncollectible amounts. The commercial mortgage loans loss allowance is estimated based on evaluating known and inherent risks in the loan portfolio and consists of a general and a specific loan loss allowance.
Impairment Evaluation
The Company continuously monitors its commercial mortgage loan portfolio for potential nonperformance by evaluating the portfolio and individual loans. Key factors that are monitored are as follows:
| | • | | Refinancing and restructuring history. |
| | • | | Request for forbearance history. |
If the analysis above indicates a loan might be impaired, it is further analyzed for impairment through the consideration of the following additional factors:
If it is determined a loan is impaired, a specific allowance is usually recorded.
General Loan Loss Allowance
The general loan loss allowance is based on the Company’s analysis of factors including changes in the size and composition of the loan portfolio, debt coverage ratios, loan to value ratios, actual loan loss experience and individual loan analysis.
Specific Loan Loss Allowance
An impaired commercial mortgage loan is a loan where the Company does not expect to receive contractual principal and interest in accordance with the terms of the loan agreement. A specific allowance for losses is recorded when a loan is considered to be impaired and it is probable that all amounts due will not be collected. The Company also holds specific
Part II
loan loss allowances on certain performing commercial mortgage loans that it continues to monitor and evaluate. Impaired commercial mortgage loans without specific allowances for losses are those for which the Company has determined that it remains probable that all amounts due will be collected although the timing or nature is, or is likely to be outside the original contractual terms. In addition, for impaired commercial mortgage loans, the Company evaluates the loss to dispose of the underlying collateral, any significant out of pocket expenses the loan may incur and other quantitative information management has concerning the loan. Portions of loans that are deemed uncollectible are written off against the allowance, and recoveries, if any, are credited to the allowance. See “Note 10—Investments—Commercial Mortgage Loans.”
Interest Income
The Company records interest income in net investment income and continues to recognize interest income on delinquent commercial mortgage loans until the loans are more than 90 days delinquent. Interest income and accrued interest receivable are reversed when a loan is put on non-accrual status. For loans that are less than 90 days delinquent, management may reverse interest income and the accrued interest receivable if there is a question on the collectability of the interest. Interest income on loans more than 90 days delinquent is recognized in the period the cash is collected. The Company resumes the recognition of interest income when the loan becomes less than 90 days delinquent and management determines it is probable that the loan will continue to perform.
Real Estate
Real estate is comprised of two components: real estate investments and real estate owned.
Real estate investment properties are stated at cost less accumulated depreciation. Generally, the Company depreciates this real estate using the straight-line depreciation method with property lives varying from 30 to 40 years. Accumulated depreciation for real estate totaled $10.4 million and $29.4 million at December 31, 2011 and 2010, respectively. The Company records impairments when it is determined that the decline in fair value of an investment below its carrying value is other than temporary. The impairment loss is charged to net capital losses, and the cost basis of the investment is permanently adjusted to reflect the impairment.
Real estate owned is initially recorded at the lower of cost or estimated net realizable value, which includes an estimate for disposal costs. This amount may be adjusted in a subsequent period as independent appraisals are received. The Company’s real estate owned is initially considered an investment held for sale and is expected to be sold within one year from acquisition. For any real estate expected to be sold, an impairment charge is recorded if the Company does not expect the investment to recover its carrying value prior to the expected date of sale. Properties held for sale are continuously reviewed for potential impairment.
Total real estate was $92.7 million at December 31, 2011, compared to $153.1 million at December 31, 2010. The $60.4 million decrease in total real estate during 2011 was primarily due to the sale and depreciation of real estate investments and the sale and impairment of real estate owned, partially offset by additional real estate owned properties acquired in satisfaction of debt through foreclosure or the acceptance of deeds in lieu of foreclosure.
All Other Investments
Other Invested assets include low income housing tax credit investments, derivative financial instruments and policy loans. Valuation adjustments for these investments are recognized using the specific identification method.
Low income housing tax credit investments are carried at fair value and are accounted for under the equity method of accounting. Valuation adjustments are reported as capital losses.
Derivative financial instruments are carried at fair value, and valuation adjustments are reported as a component of net investment income. See “Note 11—Derivative Financial Instruments.”
Policy loans are stated at their aggregate unpaid principal balances and are secured by policy cash values.
Net investment income and capital gains and losses related to separate account assets and liabilities are included in the separate account assets and liabilities.
Cash and Cash Equivalents
Cash and cash equivalents include cash and investments purchased with original maturities of three months or less at the time of acquisition. The carrying amount of cash equivalents approximates the fair value of those instruments.
| | |
| 70 | | STANCORP FINANCIAL GROUP, INC. |
DAC, VOBA and Other Intangible Assets
DAC, VOBA and other acquisition related intangible assets are generally originated through the issuance of new business or the purchase of existing business, either by purchasing blocks of insurance policies from other insurers or by the outright purchase of other companies. The Company’s intangible assets are subject to impairment tests on an annual basis or more frequently if circumstances indicate that carrying values may not be recoverable.
The Company defers certain acquisition costs that vary with and are primarily related to the origination of new business and placing that business in force. Certain costs related to obtaining new business and acquiring business through reinsurance agreements have been deferred and will be amortized to accomplish matching against related future premiums or gross profits as appropriate. The Company normally defers certain acquisition-related commissions and incentive payments, certain costs of policy issuance and underwriting, and certain printing costs. Assumptions used in developing DAC and amortization amounts each period include the amount of business in force, expected future persistency, withdrawals, interest rates and profitability. These assumptions are modified to reflect actual experience when appropriate. Additional amortization of DAC is charged to current earnings to the extent it is determined that future premiums or gross profits are not adequate to cover the remaining amounts deferred. Changes in actual persistency are reflected in the calculated DAC balance. Costs that do not vary with the production of new business are not deferred as DAC and are charged to expense as incurred. Generally, annual commissions are considered expenses and are not deferred.
DAC for group and individual disability insurance products and group life insurance products is amortized over the life of related policies in proportion to future premiums. The Company amortizes DAC for group disability and life insurance products over the initial premium rate guarantee period, which averages 2.5 years. DAC for individual disability insurance products is amortized in proportion to future premiums over the life of the contract, averaging 20 to 25 years with approximately 50% and 75% expected to be amortized by years 10 and 15, respectively.
The Company’s individual deferred annuities and group annuity products are classified as investment contracts. DAC related to these products is amortized over the life of related policies in proportion to expected gross profits. For the Company’s individual deferred annuities, DAC is generally amortized over 30 years with approximately 55% and 95% expected to be amortized by years 5 and 15, respectively. DAC for group annuity products is amortized over 10 years with approximately 80% expected to be amortized by year five.
VOBA primarily represents the discounted future profits of business assumed through reinsurance agreements. The Company has established VOBA for a block of individual disability business assumed from Minnesota Life Insurance Company (“Minnesota Life”) and a block of group disability and group life business assumed from Teachers Insurance and Annuity Association of America (“TIAA”). VOBA is generally amortized in proportion to future premiums for group and individual disability insurance products and group life products. However, the VOBA related to the TIAA transaction associated with an in force block of group long term disability claims for which no ongoing premium is received is amortized in proportion to expected gross profits. If actual premiums or future profitability are inconsistent with the Company’s assumptions, the Company could be required to make adjustments to VOBA and related amortization. For the VOBA associated with the Minnesota Life block of business assumed, the amortization period is up to 30 years and is amortized in proportion to future premiums. The VOBA associated with the TIAA transaction is amortized in proportion to expected gross profits with an amortization period of up to 20 years.
Key assumptions, which will affect the determination of expected gross profits for determining DAC and VOBA balances, are:
| | • | | Interest rates, which affect both investment income and interest credited. |
| | • | | Stock market performance. |
| | • | | Capital gains and losses. |
| | • | | Claim termination rates. |
| | • | | Amount of business in force. |
These assumptions are modified to reflect actual experience when appropriate. Although a change in a single assumption may have an impact on the calculated amortization of DAC or VOBA for balances associated with investment contracts, it is the relationship of that change to the changes in other key assumptions that determines the ultimate impact
Part II
on DAC or VOBA amortization. Because actual results and trends related to these assumptions vary from those assumed, we revise these assumptions annually to reflect our current best estimate of expected gross profits. As a result of this process, known as “unlocking,” the cumulative balances of DAC and VOBA are adjusted with an offsetting benefit or charge to income to reflect changes in the period of the revision. An unlocking event that results in an after-tax benefit generally occurs as a result of actual experience or future expectations being favorable compared to previous estimates. An unlocking event that results in an after-tax charge generally occurs as a result of actual experience or future expectations being unfavorable compared to previous estimates. As a result of unlocking, the amortization schedule for future periods is also adjusted.
Significant, unanticipated changes in key assumptions, which affect the determination of expected gross profits, may result in a large unlocking event that could have a material adverse effect on our financial position or results of operations. However, future changes in DAC and VOBA balances due to changes in underlying assumptions are not expected to be material.
The Company’s other intangible assets are subject to amortization and consist of certain customer lists from Asset Management business acquired and an individual disability marketing agreement. Customer lists have a combined estimated weighted-average remaining life of approximately 8.3 years. The marketing agreement accompanied the Minnesota Life transaction and provides access to Minnesota Life agents, some of whom now market Standard’s individual disability insurance products. The Minnesota Life marketing agreement will be fully amortized by the end of 2023.
Property and Equipment, Net
The following table sets forth the major classifications of the Company’s property and equipment and accumulated depreciation:
| | | | | | | | |
| | | December 31, | |
| (In millions) | | 2011 | | | 2010 | |
Home office properties | | $ | 133.2 | | | $ | 130.8 | |
Office furniture and equipment | | | 54.2 | | | | 58.3 | |
Capitalized software | | | 154.4 | | | | 142.4 | |
Leasehold improvements | | | 12.6 | | | | 11.7 | |
| | | | | | | | | |
Property and equipment, gross | | | 354.4 | | | | 343.2 | |
Less: accumulated depreciation | | | 253.1 | | | | 231.7 | |
| | | | | | | | | |
Property and equipment, net | | $ | 101.3 | | | $ | 111.5 | |
Property and equipment are stated at cost less accumulated depreciation. The Company depreciates property and equipment using the straight-line method over the estimated useful lives with a half-year convention. The estimated useful lives are generally 40 years for properties, range from three to ten years for equipment and range from three to five years for capitalized software. Leasehold improvements are depreciated over the lesser of the estimated useful life of the asset or the life of the lease. Depreciation expense for 2011, 2010 and 2009 was $28.0 million, $31.7 million and $31.4 million, respectively. The Company reviews property and equipment for impairment when circumstances or events indicate the carrying amount of the asset may not be recoverable and recognizes a charge to earnings if an asset is impaired.
Non-affiliated tenants leased 35.3%, 34.3% and 35.7% of the corporate headquarters in Portland, Oregon at December 31, 2011, 2010 and 2009, respectively. Income from the leases is included in net investment income.
Separate Account
Separate account assets and liabilities represent segregated funds held for the exclusive benefit of contract holders. The activities of the account primarily relate to contract holder-directed 401(k) contracts. Standard charges the separate account with asset management and plan administration fees associated with the contracts. Separate account assets are carried at fair value and separate account liabilities are carried at the amount of the related assets.
| | |
| 72 | | STANCORP FINANCIAL GROUP, INC. |
Reserves for Future Policy Benefits and Claims
Benefits and expenses are matched with recognized premiums to result in recognition of profits over the life of the contracts. The match is accomplished by recording a provision for future policy benefits and unpaid claims and claim adjustment expenses. For most of the Company’s product lines, management establishes and carries as a liability actuarially determined reserves that are calculated to meet the Company’s obligations for future policy benefits and claims. These reserves do not represent an exact calculation of the Company’s future benefit liabilities but are instead estimates based on assumptions and considerations concerning a number of factors, which include:
| | • | | The amount of premiums that the Company will receive in the future. |
| | • | | The rate of return on assets the Company purchases with premiums received. |
| | • | | Expected number and severity of claims. |
| | • | | Persistency, which is the measurement of the percentage of premiums remaining in force from year to year. |
In particular, the Company’s group and individual long term disability reserves are sensitive to assumptions and considerations regarding the following factors:
| | • | | Claim incidence rates for incurred but not reported claim reserves. |
| | • | | Claim termination rates. |
| | • | | Discount rates used to value expected future claim payments. |
| | • | | The amount of monthly benefit paid to the insured, less reinsurance recoveries and other offsets. |
| | • | | Expense rates including inflation. |
| | • | | Historical delay in reporting of claims incurred. |
Assumptions may vary by:
| | • | | Age, gender and, for individual policies, occupation class of the claimant. |
| | • | | Year of issue for policy reserves or incurred date for claim reserves. |
| | • | | Time elapsed since disablement. |
| | • | | Contract provisions and limitations. |
Other Policyholder Funds
Other policyholder funds are liabilities for investment-type contracts and are based on the policy account balances including accumulated interest. Other policyholder funds include amounts related to advanced premiums, premiums on deposit and experience rated liabilities totaling $419.4 million and $418.5 million at December 31, 2011 and 2010, respectively.
Recognition of Premiums
Premiums from group life and group and individual disability contracts are recognized as revenue when due. Investment-type contract fee revenues consist of charges for policy administration and surrender charges assessed during the period. Charges related to services to be performed are deferred until earned. The amounts received in excess of premiums and fees are included in other policyholder funds in the consolidated balance sheets. Experience rated refunds are computed in accordance with the terms of the contracts with certain group policyholders and are accounted for as an adjustment to premiums.
Income Taxes
The Company files a U.S. consolidated income tax return that includes all subsidiaries. The Company’s U.S. income tax is calculated using regular corporate income tax rates on a tax base determined by laws and regulations administered by the Internal Revenue Service (“IRS”). The Company also files corporate income tax returns in various states. The provision for income taxes includes amounts currently payable and deferred amounts that result from temporary differences between financial reporting and tax bases of assets and liabilities. Deferred tax assets and liabilities are measured using enacted tax rates expected to apply when the temporary differences are expected to reverse.
Part II
GAAP requires management to use a more likely than not standard to evaluate whether, based on available evidence, each deferred tax asset will be realized. A valuation allowance is recorded to reduce a deferred tax asset to the amount expected to be realized.
Management is required to determine whether tax return positions are more likely than not to be sustained upon audit by taxing authorities. Tax benefits of uncertain tax positions, as determined and measured by this interpretation, cannot be recognized in the Company’s financial statements.
The Company records income tax interest and penalties in the income tax provision according to the Company’s accounting policy. See “Note 7—Income Taxes.”
Accumulated Other Comprehensive Income
The following table sets forth the components of accumulated other comprehensive income:
| | | | | | | | |
| | | December 31, | |
| (In millions) | | 2011 | | | 2010 | |
Net unrealized capital gains on fixed maturity securities | | $ | 315.2 | | | $ | 217.7 | |
Employee benefit plans | | | (80.1 | ) | | | (56.8 | ) |
| | | | | | | | | |
Total accumulated other comprehensive income | | $ | 235.1 | | | $ | 160.9 | |
Other Comprehensive Income
Other comprehensive income includes changes in unrealized capital gains and losses on fixed maturity securities, net of the related tax effects, and changes in unrealized prior service costs and credits and net gains and losses associated with the Company’s employee benefit plans, net of the related tax effects.
The following table sets forth other comprehensive income:
| | | | | | | | | | | | |
| | | Years ended December 31, | |
| (In millions) | | 2011 | | | 2010 | | | 2009 | |
Unrealized gains on fixed maturity securities: | | | | | | | | | | | | |
Net unrealized capital gains on fixed maturity securities | | $ | 159.3 | | | $ | 157.2 | | | $ | 326.7 | |
Less: tax effects | | | 55.9 | | | | 56.7 | | | | 115.9 | |
| | | | | | | | | | | | | |
Net unrealized capital gains on fixed maturity securities, net of tax | | | 103.4 | | | | 100.5 | | | | 210.8 | |
| | | | | | | | | | | | | |
Net reclassifications adjustment for net capital (gains) losses included in
net income | | | (9.1 | ) | | | (15.4 | ) | | | 5.5 | |
Less: tax effects | | | (3.2 | ) | | | (5.8 | ) | | | 2.0 | |
| | | | | | | | | | | | | |
Net reclassifications adjustment for realized net capital (gains) losses, net
of tax | | | (5.9 | ) | | | (9.6 | ) | | | 3.5 | |
| | | | | | | | | | | | | |
Total net unrealized gains on fixed maturity securities | | | 97.5 | | | | 90.9 | | | | 214.3 | |
| | | | | | | | | | | | | |
Employee benefit plans: | | | | | | | | | | | | |
Net prior service (cost) credit and net (losses) gains arising during the period | | | (40.9 | ) | | | (7.7 | ) | | | 12.9 | |
Less: tax effects | | | (14.3 | ) | | | (2.7 | ) | | | 4.5 | |
| | | | | | | | | | | | | |
Net prior service (cost) credit and net (losses) gains arising during the period, net of tax | | | (26.6 | ) | | | (5.0 | ) | | | 8.4 | |
| | | | | | | | | | | | | |
Net reclassification adjustment for amortization to net periodic pension cost | | | 5.0 | | | | 5.6 | | | | 7.6 | |
Less: tax effects | | | 1.7 | | | | 2.0 | | | | 2.7 | |
| | | | | | | | | | | | | |
Net reclassification adjustment for amortization to net periodic pension cost, net of tax | | | 3.3 | | | | 3.6 | | | | 4.9 | |
| | | | | | | | | | | | | |
Total unrealized changes in employee benefit plans | | | (23.3 | ) | | | (1.4 | ) | | | 13.3 | |
| | | | | | | | | | | | | |
Total other comprehensive income, net of tax | | $ | 74.2 | | | $ | 89.5 | | | $ | 227.6 | |
| | |
| 74 | | STANCORP FINANCIAL GROUP, INC. |
Accounting Pronouncements
Accounting Standards Update (“ASU”) No. 2010-26,Accounting for Costs Associated with Acquiring or Renewing Insurance Contracts
In October 2010, the Financial Accounting Standards Board (“FASB”) issued ASU No. 2010-26,Accounting for Costs Associated with Acquiring or Renewing Insurance Contracts. ASU No. 2010-26 amends the codification guidance for insurance entities to eliminate the diversity of accounting treatment related to deferred acquisition costs. ASU No. 2010-26 limits the capitalization of deferred acquisition costs to incremental direct costs of contract acquisition and certain costs directly related to acquisition activities such as underwriting, policy issuance and processing, medical and inspection, and sales force contract selling. To be an incremental direct cost of contract acquisition, the cost must meet the following two requirements:
| | 1) | | It results directly from and is essential to the acquisition of the contract. |
| | 2) | | It would not have been incurred by the insurance entity had that acquisition contract transaction not occurred. |
The ASU requires additional disclosures in the financial statements and footnotes concerning deferred acquisition costs such as the nature and type of acquisition costs capitalized, the method of amortizing capitalized acquisition costs, and the amount of acquisition costs amortized for the period. The directives of ASU No. 2010-26 are effective for fiscal years and interim periods beginning after December 15, 2011. Retrospective adoption of the rule is allowed, but not required. The Company estimates implementing this ASU will increase pre-tax expenses approximately $3 to $4 million annually with a cumulative effect adjustment of approximately $20 to $25 million in the initial year of adoption. The Company will adopt this guidance on a retrospective basis in the first quarter of 2012.
ASU No. 2011-04,Amendments to Achieve Common Fair Value Measurement and Disclosure Requirements in U.S. GAAP and IFRS
In May 2011, the FASB issued ASU No. 2011-04,Amendments to Achieve Common Fair Value Measurement and Disclosure Requirements in U.S. GAAP and IFRS. ASU No. 2011-04 is intended to converge GAAP and International Financial Reporting Standards (“IFRS”) requirements for measuring fair value and disclosing information about fair value measurements. This ASU is not expected to have a significant impact on GAAP. Key provisions of the ASU include:
| | 1) | | The grouping of financial instruments for the purpose of determining fair value being prohibited. |
| | 2) | | The use of a blockage factor to all fair value measurements also being prohibited. |
| | 3) | | The requirement that for recurring Level 3 fair value measurements entities must disclose quantitative information about unobservable inputs, a description of the valuation process used and qualitative details about the sensitivity of the measurements. |
| | 4) | | The requirement to disclose the fair value by level for each class of assets and liabilities not measured at fair value in the statement of financial position, but for which the fair value is required to be disclosed. |
ASU No. 2011-04 is effective for interim and annual periods beginning after December 15, 2011. The Company is currently assessing the impact that this pronouncement will have on its disclosures, but does not expect a material effect to its financial statements.
ASU No. 2011-05,Presentation of Comprehensive Income
In June 2011, the FASB issued ASU No. 2011-05,Presentation of Comprehensive Income. ASU No. 2011-05 outlines two acceptable methods of presenting comprehensive income in the financial statements. Entities are required to present other comprehensive income in a single continuous statement with net income or present the components of net income and other comprehensive income in two separate, consecutive statements.
ASU No. 2011-05 is effective for interim and annual periods beginning after December 15, 2011. The Company will continue to present other comprehensive income in a single financial statement with net income and does not expect this ASU to have a material effect on its presentation of financial statements.
ASU No. 2011-08,Testing Goodwill for Impairment
In September 2011, the FASB issued ASU No. 2011-08,Testing Goodwill for Impairment. ASU No. 2011-08 is intended to reduce the cost and complexity of performing the first step of the two-step goodwill impairment test required under Topic 350,Intangibles-Goodwill and Other. Under the revised guidance, entities testing goodwill for impairment have the option of performing a qualitative assessment before calculating the fair value of the reporting unit (i.e., step one of the goodwill impairment test).
Part II
If entities determine, on the basis of qualitative factors, that the fair value of the reporting unit is more likely than not less than the carrying amount, the two-step impairment test would be required. If it is not more likely than not that the fair value of the reporting unit is less than the carrying amount, further testing of goodwill for impairment would not be performed. Because the qualitative assessment is optional, entities may bypass it for any reporting unit in any period and begin their impairment analysis with the quantitative calculation in step one.
ASU No. 2011-08 is effective for interim and annual periods beginning after December 15, 2011. As this ASU provides optional qualitative analysis, the Company does not expect this ASU to have a material effect on its goodwill testing or disclosure in the financial statements.
ASU 2011-11,Disclosures about Offsetting Assets and Liabilities
In December 2011, the FASB issued ASU No. 2011-11,Disclosures about Offsetting Assets and Liabilities. The main objective of ASU No. 2011-11 is to enhance disclosures for financial instruments and derivative instruments which have right of setoff conditions. Under the guidance provided in this ASU, entities would be required to disclose the amounts offset in determining the net amounts presented in their statements of financial position. The amount of both the recognized asset and the recognized liability subject to setoff under the same arrangement will become a required disclosure.
ASU No. 2011-11 is effective for interim and annual periods beginning on or after January 1, 2013. The Company does not currently have exposure to hedges, derivatives or master netting arrangements that would be subjected to these additional disclosures. Therefore, the Company does not expect this ASU to have a material effect on its asset and liability disclosures in its statements of financial position.
2. NET INCOME PER COMMON SHARE
Net income per basic common share was calculated by dividing net income by the weighted-average number of common shares outstanding. Net income per diluted common share, as calculated using the treasury stock method, reflects the potential dilutive effects of stock award grants and exercises of dilutive outstanding stock options. The computation of diluted weighted-average earnings per share does not include stock options with an option exercise price greater than the average market price because they are antidilutive and inclusion would increase earnings per share.
The following table sets forth the calculation of net income per basic and diluted weighted-average common shares outstanding:
| | | | | | | | | | | | |
| | | Years ended December 31, | |
| (Dollars in millions—except per share data) | | 2011 | | | 2010 | | | 2009 | |
Net income (in millions) | | $ | 139.3 | | | $ | 189.0 | | | $ | 208.9 | |
Basic weighted-average common shares outstanding | | | 44,876,650 | | | | 46,774,277 | | | | 48,932,908 | |
Stock options | | | 131,926 | | | | 228,193 | | | | 105,263 | |
Stock awards | | | 7,494 | | | | 3,758 | | | | 6,372 | |
| | | | | | | | | | | | | |
Diluted weighted-average common shares outstanding | | | 45,016,070 | | | | 47,006,228 | | | | 49,044,543 | |
| | | | | | | | | | | | | |
Net income per common share: | | | | | | | | | | | | |
Net income per basic common share | | $ | 3.10 | | | $ | 4.04 | | | $ | 4.27 | |
Net income per diluted common share | | | 3.09 | | | | 4.02 | | | | 4.26 | |
Antidilutive shares not included in net income per diluted common share calculation | | | 1,974,242 | | | | 1,150,075 | | | | 1,967,483 | |
3. SHARE-BASED COMPENSATION
The Company has two active share-based compensation plans: the 2002 Stock Incentive Plan (“2002 Plan”) and the 1999 Employee Share Purchase Plan (“ESPP”). The 2002 Plan authorizes the Board of Directors to grant incentive or non-statutory stock options and stock awards to eligible employees and certain related parties. Of the 4.8 million shares of common stock authorized for the 2002 Plan, 1.3 million shares or options for shares remain available for grant at December 31, 2011. The Company’s ESPP allows eligible employees to purchase StanCorp common stock at a discount. Of the 2.0 million shares authorized for the ESPP, 0.2 million shares remain available for issuance at December 31, 2011.
| | |
| 76 | | STANCORP FINANCIAL GROUP, INC. |
The following table sets forth the total compensation cost and related income tax benefit under the Company’s share-based compensation plans:
| | | | | | | | | | | | |
| | | Years ended December 31, | |
| (In millions) | | 2011 | | | 2010 | | | 2009 | |
Compensation cost | | $ | 5.9 | | | $ | 5.3 | | | $ | 9.6 | |
| Related income tax benefit | | | 2.1 | | | | 1.9 | | | | 3.4 | |
The Company has provided three types of share-based compensation pursuant to the 2002 Plan: option grants, stock award grants and director stock award grants.
Option Grants
Options are granted to directors, officers and certain non-officer employees. Directors typically receive annual grants in amounts determined by the Nominating & Corporate Governance Committee of the Board of Directors and executive officers typically receive annual grants in amounts determined by the Organization & Compensation Committee of the Board of Directors. Each director who is not an employee of the Company receives annual stock options with a fair value equal to $50,000 on the date of the annual shareholders meeting. Non-executive officers typically receive annual grants as determined by management. Officers may also receive options when hired or promoted to an officer position. In addition, the Chief Executive Officer has authority to award a limited number of options at his discretion to non-executive officers and other employees. Options are granted with an exercise price equal to the closing market price of StanCorp common stock on the grant date. Directors’ options vest after one year with other options generally vesting in four equal installments on the first four anniversaries of the vesting reference date. Option awards to certain officers vest if the officer’s employment is terminated by the Company without cause or the officer terminates for good reason within 24 months after a change of control of the Company as defined in the Company’s change of control agreement. Options generally expire 10 years from the grant date.
Part II
The following table sets forth a summary of option activity and options outstanding and exercisable:
| | | | | | | | | | | | | | | | |
| | | Options | | | Weighted-
Average
Exercise Price | | | Weighted-
Average
Remaining
Contractual
Terms (Years) | | | Total Intrinsic
Value | |
Outstanding, January 1, 2009 | | | 2,515,566 | | | $ | 38.42 | | | | 6.1 | | | $ | 16,301,078 | |
Granted | | | 523,501 | | | | 37.08 | | | | | | | | | |
Exercised | | | (101,903 | ) | | | 18.17 | | | | | | | | | |
Forfeited | | | (110,146 | ) | | | 43.08 | | | | | | | | | |
Expired | | | (33,542 | ) | | | 20.42 | | | | | | | | | |
| | |
|
|
| | | | | | | | | | | | |
| Outstanding, December 31, 2009 | | | 2,793,476 | | | | 38.94 | | | | 6.0 | | | | 13,272,319 | |
Granted | | | 283,752 | | | | 42.12 | | | | | | | | | |
Exercised | | | (279,270 | ) | | | 29.17 | | | | | | | | | |
Forfeited | | | (114,465 | ) | | | 46.17 | | | | | | | | | |
Expired | | | (3,000 | ) | | | 19.24 | | | | | | | | | |
| | |
|
|
| | | | | | | | | | | | |
Outstanding, December 31, 2010 | | | 2,680,493 | | | | 40.01 | | | | 5.6 | | | | 17,226,460 | |
Granted | | | 272,785 | | | | 44.18 | | | | | | | | | |
Exercised | | | (120,880 | ) | | | 29.10 | | | | | | | | | |
Forfeited | | | (42,837 | ) | | | 42.78 | | | | | | | | | |
Expired | | | (5,200 | ) | | | 42.73 | | | | | | | | | |
| | |
|
|
| | | | | | | | | | | | |
Outstanding, December 31, 2011 | | | 2,784,361 | | | $ | 40.84 | | | | 5.1 | | | $ | 5,947,355 | |
Options outstanding and exercisable: | | | | | | | | | | | | | | | | |
Vested or expected to be vested, December 31, 2011 | | | 2,758,689 | | | $ | 40.83 | | | | 5.1 | | | $ | 5,923,768 | |
Fully vested and exercisable, December 31, 2011 | | | 2,270,916 | | | | 40.60 | | | | 4.4 | | | | 5,475,610 | |
The fair value of each option award was estimated using the Black-Scholes option pricing model as of the grant date using the assumptions noted in the following table. The Black-Scholes option pricing model uses the expected term as an input with the calculated option value varying directly with the length of time until exercise. The Company bases its estimate of the expected term on an analysis of the historical exercise experience of similar options granted to similar employee or director groups. The expected term given below represents the weighted-average expected term of options granted. Expected stock price volatility is based on the volatility of StanCorp common stock price over the prior period equal in duration to the expected term. The dividend rate is the rate expected to be paid over the expected term, generally estimated to be equal to the rate for the year prior to the grant. The risk-free rate is the interest rate on a U.S. Treasury bond of a maturity closest to the expected term of the option granted.
The following table sets forth the weighted-average assumptions used to determine the fair value of option grants:
| | | | | | | | | | | | |
| | | Years ended December 31, | |
| | | 2011 | | | 2010 | | | 2009 | |
Dividend yield | | | 1.97 | % | | | 1.91 | % | | | 2.10 | % |
Expected stock price volatility | | | 46.24 | | | | 45.61 | | | | 39.51 | |
Risk-free interest rate | | | 2.35 | | | | 2.75 | | | | 1.83 | |
Expected option lives | | | 5.7 years | | | | 5.7 years | | | | 5.4 years | |
The weighted-average grant date fair value of options granted was $16.87, $16.16 and $11.52 for 2011, 2010, and 2009, respectively. The total intrinsic value of the options exercised was $1.8 million, $4.5 million and $1.4 million for the same periods, respectively. The amount that the Company received from the exercise of stock options was $3.5 million, $8.1 million and $1.9 million for 2011, 2010 and 2009, respectively. The related tax benefit derived from the tax deduction
| | |
| 78 | | STANCORP FINANCIAL GROUP, INC. |
received by the Company for the difference between the market price of StanCorp common stock and the exercise price when the options were exercised was $0.6 million, $1.6 million and $0.5 million for 2011, 2010 and 2009, respectively.
The compensation cost of stock options is recognized over the vesting period, which is also the period over which the grantee must provide services to the Company. At December 31, 2011, the total compensation cost related to unvested option awards that had not yet been recognized in the financial statements was $6.1 million. This compensation cost will be recognized over a weighted-average period of 2.2 years. During 2009, certain executive officers of the Company retired, upon which the vesting of some of their options was accelerated in accordance with their option agreements. The accelerated vesting resulted in recognition of $1.8 million of additional compensation cost for 2009.
Stock award grants
The Company grants annual performance-based stock awards to designated senior officers as long-term incentive compensation. Under the 2002 Plan, the Company had 0.7 million shares available for issuance as stock award grants at December 31, 2011.
In years prior to 2008, the performance-based stock awards consisted of restricted shares (60%) and cash performance units (40%), which represent a right to receive cash equal to the value of one share of StanCorp common stock. The restricted shares and cash performance units were subject to forfeiture if continued employment and financial performance criteria were not met.
The compensation cost of these awards was measured using an estimate of the number of restricted shares and cash performance units that will vest at the end of the performance period, multiplied by the fair value of the awards. For restricted shares, the fair value was measured as the closing market price of StanCorp common stock on the grant date. For cash performance units, the fair value was measured as the closing market price of StanCorp common stock on the date of the financial statements.
The following table sets forth a summary of the activity of performance-based restricted shares and cash performance units outstanding:
| | | | | | | | | | | | |
| | | Restricted Shares | | | Cash Units | | | Weighted-
Average
Grant Date
Fair Value | |
Unvested balance, January 1, 2009 | | | 36,247 | | | $ | 23,941 | | | $ | 50.15 | |
Granted | | | — | | | | — | | | | | |
Vested | | | (15,959 | ) | | | (10,550 | ) | | | | |
Forfeited | | | (20,288 | ) | | | (13,391 | ) | | | | |
| | | | | | | | | | | | | |
| Unvested balance, December 31, 2009 | | | — | | | $ | — | | | $ | — | |
As of December 31, 2009, there were no unvested restricted shares or cash units. The total value of restricted shares vested and cash performance units paid was $0.8 million for 2009. There were no restricted shares that vested or cash units paid for 2011 or 2010.
In 2006, the Organization & Compensation Committee of the Board of Directors approved a revised form of long-term incentive award agreement to be used in connection with future grants of performance-based stock awards (“Performance Shares”) to designated senior officers. Under the new agreement, Performance Share grants represent the maximum number of shares issuable to the designated senior officers and are generally granted two years before the beginning of the performance period. The actual number of shares issued at the end of the performance period is based on satisfaction of employment and Company financial performance conditions, with a portion of the shares withheld to cover required tax withholding. The new agreement replaced the restricted shares and cash performance unit arrangement previously used.
Part II
The following table sets forth a summary of the activity of Performance Shares outstanding:
| | | | | | | | |
| | | Performance
Shares | | | Weighted-
Average Grant
Date Fair
Value | |
Unvested balance, January 1, 2009 | | | 145,722 | | | $ | 47.95 | |
Granted | | | 109,884 | | | | | |
Vested | | | (21,082 | ) | | | | |
Forfeited | | | (120,435 | ) | | | | |
| Unvested balance, December 31, 2009 | | | 114,089 | | | | 38.97 | |
Granted | | | 64,790 | | | | | |
Vested | | | (8,027 | ) | | | | |
Forfeited | | | (43,194 | ) | | | | |
| Unvested balance, December 31, 2010 | | | 127,658 | | | | 34.99 | |
Granted | | | 116,978 | | | | | |
Vested | | | (6,504 | ) | | | | |
Forfeited | | | (47,164 | ) | | | | |
| Unvested balance, December 31, 2011 | | | 190,968 | | | | 44.05 | |
The Company issued 4,906, 10,276, and 3,221 shares of StanCorp common stock for 2011, 2010 and 2009, respectively, to redeem Performance Shares that vested following the 2010, 2009 and 2008 performance periods, net of Performance Shares withheld to cover the required taxes.
The fair value of the Performance Shares is determined based on the closing market price of StanCorp common stock on the grant date.
The compensation cost that the Company will ultimately recognize as a result of these stock awards is dependent on the Company’s financial performance. Assuming that the maximum performance is achieved for each performance goal, $8.4 million in additional compensation cost would be recognized through 2013. The target or expected payout is 70% of the maximum Performance Shares for the 2012 performance period and 50% of the maximum Performance Shares for the 2013 performance period. A target payout for these periods would result in approximately $4.8 million of additional compensation cost through 2013. This cost is expected to be recognized over a weighted-average period of 1.6 years.
Director Stock Grants
Each director who is not an employee of the Company receives annual compensation of StanCorp common stock with a fair value equal to $50,000 based on the closing market price of StanCorp common stock on the day of the annual shareholders meeting, in addition to annual stock option grants.
The Company issued 10,399, 14,823, and 10,339 shares of StanCorp common stock for 2011, 2010 and 2009, respectively, related to the annual Director stock grant. The weighted-average fair value per share for the shares issued was $43.00, $44.81, and $28.19 for the same periods, respectively.
Employee share purchase plan
The Company’s ESPP allows eligible employees to purchase StanCorp common stock at a 15% discount of the lesser of the closing market price of StanCorp common stock on either the commencement date or the final date of each six-month offering period. Under the terms of the plan, each eligible employee may elect to have up to 10% of the employee’s gross total cash compensation for the period withheld to purchase StanCorp common stock. No employee may purchase StanCorp common stock having a fair market value in excess of $25,000 in any calendar year.
The compensation cost for the ESPP is measured as the sum of the value of the 15% discount and the value of the embedded six-month option. The value of the discount is equal to 15% of the fair market value of the purchase price of the
| | |
| 80 | | STANCORP FINANCIAL GROUP, INC. |
common stock. The value of the embedded option is calculated using the Black-Scholes option pricing model and the assumptions noted in the following table. Expected stock price volatility was based on the volatility of the price of StanCorp common stock during the six months preceding the offering period. The risk-free rate was based on the six-month U.S. Treasury yield curve in effect at the time of the grant.
The following table sets forth the assumptions used to determine the fair value of the ESPP embedded option:
| | | | | | | | | | | | |
| | | Years ended December 31, | |
| | | 2011 | | | 2010 | | | 2009 | |
Dividend yield | | | 1.85–2.11 | % | | | 1.81–1.93 | % | | | 1.81–2.70 | % |
Expected stock price volatility | | | 22.03–25.63 | | | | 28.68–33.93 | | | | 86.97–98.08 | |
Risk-free interest rate | | | 0.10–0.18 | | | | 0.15–0.17 | | | | 0.28–0.31 | |
Expected option lives | | | 0.5 years | | | | 0.5 years | | | | 0.5 years | |
The following table sets forth the fair value per share, compensation cost and related income tax benefit under the Company’s ESPP:
| | | | | | | | | | | | |
| | | Years ended December 31, | |
| (In millions except per share data) | | 2011 | | | 2010 | | | 2009 | |
Weighted-average fair value per share for the Company’s ESPP offerings | | $ | 9.46 | | | $ | 9.92 | | | $ | 12.82 | |
Compensation cost | | | 1.2 | | | | 1.3 | | | | 2.9 | |
Related income tax benefit | | | 0.4 | | | | 0.5 | | | | 1.0 | |
4. RETIREMENT BENEFITS
Pension Benefits
The Company has two non-contributory defined benefit pension plans: the employee pension plan and the agent pension plan. The employee pension plan is for all eligible employees of the Company, and the agent pension plan is for former field employees and agents. The defined benefit pension plans provide benefits based on years of service and final average pay. Both plans are sponsored by Standard and administered by Standard Retirement Services and are closed to new participants. Participation in the defined benefit pension plans is generally limited to eligible employees whose date of employment began before 2003.
Under the employee pension plan, a participant is entitled to a normal retirement benefit once the participant reaches age 65. A participant can also receive a normal, unreduced retirement benefit once the sum of his or her age plus years of service is at least 90.
The Company recognizes the funded status of the pension plans as an asset or liability on the balance sheet. The funded status is measured as the difference between the fair value of the plan assets and the projected benefit obligation as of the year-end balance sheet date.
Part II
The following table sets forth a reconciliation of the changes in the pension plans’ projected benefit obligations, fair value of plan assets and the funded status:
| | | | | | | | | | | | |
| | | Years ended December 31, | |
| (In millions) | | 2011 | | | 2010 | | | 2009 | |
Change in benefit obligation: | | | | | | | | | | | | |
Projected benefit obligation at beginning of the year | | $ | (323.7) | | | $ | (295.1) | | | $ | (270.3) | |
Service cost | | | (9.2) | | | | (8.9) | | | | (8.9) | |
Interest cost | | | (17.5) | | | | (16.6) | | | | (15.7) | |
Actuarial loss | | | (29.0) | | | | (9.9) | | | | (6.4) | |
Benefits Paid | | | 7.8 | | | | 6.8 | | | | 6.2 | |
Projected benefit obligation at end of the year | | | (371.6) | | | | (323.7) | | | | (295.1) | |
Change in fair value of plan assets: | | | | | | | | | | | | |
Fair value of plan assets at beginning of the year | | | 292.6 | | | | 264.6 | | | | 229.3 | |
Actual return on plan assets | | | 7.0 | | | | 28.9 | | | | 41.5 | |
Employer contributions | | | 58.0 | | | | 6.0 | | | | — | |
Benefits paid and estimated expenses | | | (7.9) | | | | (6.9) | | | | (6.2) | |
Fair value of plan assets at end of the year | | | 349.7 | | | | 292.6 | | | | 264.6 | |
Funded status at end of the year | | $ | (21.9) | | | $ | (31.1) | | | $ | (30.5) | |
The following table sets forth the projected and accumulated benefit obligations and the fair value of the plan assets for the pension plans:
| | | | | | | | | | | | |
| | | Years ended December 31, | |
| (In millions) | | 2011 | | | 2010 | | | 2009 | |
Projected benefit obligation | | $ | 371.6 | | | $ | 323.7 | | | $ | 295.1 | |
Accumulated benefit obligation | | | 337.5 | | | | 280.9 | | | | 252.2 | |
| Fair value of plan assets | | | 349.7 | | | | 292.6 | | | | 264.6 | |
The Company recognizes as a component of accumulated other comprehensive income, net of tax, the actuarial gains or losses, prior service costs or credits, and transition assets that have not yet been recognized as components of net periodic benefit cost.
The following table sets forth the amounts recognized in accumulated other comprehensive income:
| | | | | | | | | | | | |
| | | Years ended December 31, | |
| (In millions) | | 2011 | | | 2010 | | | 2009 | |
Net Loss | | $ | 70.1 | | | $ | 44.1 | | | $ | 46.2 | |
Prior service cost | | | 3.1 | | | | 3.5 | | | | 4.0 | |
| Total recognized in accumulated other comprehensive income | | $ | 73.2 | | | $ | 47.6 | | | $ | 50.2 | |
The estimated net loss and prior service cost for the pension plans that will be amortized from accumulated other comprehensive income into net periodic benefit cost in 2012 are $8.5 million and $0.6 million, respectively.
| | |
| 82 | | STANCORP FINANCIAL GROUP, INC. |
The following table sets forth the components of net periodic benefit cost, other changes in plan assets and benefit obligations recognized in other comprehensive (income) loss, and assumptions used in the measurement of the net periodic benefit cost and the benefit obligations:
| | | | | | | | | | | | |
| | | Years ended December 31, | |
| (Dollars in millions) | | 2011 | | | 2010 | | | 2009 | |
Components of net periodic benefit cost: | | | | | | | | | | | | |
Service cost | | $ | 9.3 | | | $ | 9.0 | | | $ | 9.0 | |
Interest cost | | | 17.5 | | | | 16.6 | | | | 15.7 | |
Expected return on plan assets | | | (22.1) | | | | (20.0) | | | | (17.3) | |
Amortization of prior service cost | | | 0.6 | | | | 0.6 | | | | 0.6 | |
Amortization of net actuarial loss | | | 4.0 | | | | 4.3 | | | | 6.9 | |
| | | | | | | | | | | | | |
Net periodic benefit cost | | | 9.3 | | | | 10.5 | | | | 14.9 | |
| | | | | | | | | | | | | |
Other changes in plan assets and benefit obligation recognized in other comprehensive income: | | | | | | | | | | | | |
Net loss (gain) | | | 44.1 | | | | 1.0 | | | | (17.9) | |
Amortization of prior service cost | | | (0.6) | | | | (0.6) | | | | (0.6) | |
Amortization of net actuarial loss | | | (4.0) | | | | (4.3) | | | | (6.9) | |
| | | | | | | | | | | | | |
Total recognized in other comprehensive income | | | 39.5 | | | | (3.9) | | | | (25.4) | |
| | | | | | | | | | | | | |
Total recognized in net periodic benefit cost and other comprehensive income | | $ | 48.8 | | | $ | 6.6 | | | $ | (10.5) | |
Weighted-average assumptions: | | | | | | | | | | | | |
Assumptions used for net periodic benefit cost: | | | | | | | | | | | | |
Discount rate | | | 5.50 | % | | | 5.75 | % | | | 6.00 | % |
Expected return on plan assets | | | 7.68 | | | | 7.66 | | | | 7.65 | |
Rate of compensation increase | | | 4.50 | | | | 4.50 | | | | 4.50 | |
Assumptions used to determine benefit obligations: | | | | | | | | | | | | |
Discount rate | | | 4.50 | % | | | 5.50 | % | | | 5.75 | % |
Rate of compensation increase | | | 3.25 | | | | 4.50 | | | | 4.50 | |
The long-run rate of return for the employee pension plan portfolio is derived by calculating the average return for the portfolio monthly, from 1971 to the present, using the average mutual fund manager returns in each asset category, weighted by the target allocation to each category.
The Company made contributions of $58.0 million and $6.0 million to the employee pension in 2011 and 2010, respectively. The Company did not make a contribution in 2009. The Company is not obligated to make any contributions to its pension plans for 2012. In addition, no plan assets are expected to be returned to the Company in 2012.
The following table sets forth the expected benefit payments for the Company’s pension plans:
| | | | |
| (In millions) | | Amount | |
2012 | | $ | 9.3 | |
2013 | | | 10.4 | |
2014 | | | 11.3 | |
2015 | | | 12.5 | |
2016 | | | 13.7 | |
| 2017-2021 | | | 87.7 | |
The investment goal of the employee pension plan is to produce long-run portfolio returns that are consistent with reasonable contribution rates and a well-funded plan. To manage the overall risk of the portfolio, the portfolio is reviewed quarterly and rebalanced as necessary to keep the allocation of debt and equity securities within target allocation tolerance levels. The equity securities include pooled separate account funds comprised of large cap growth, large cap blend, large
Part II
cap value, mid cap blend and foreign mutual funds and are diversified across investment strategies. The employee pension plan held no StanCorp equity securities as plan assets at December 31, 2011 and 2010. The plan invests in a stable asset fund comprised of debt securities represented by a Deposit Administration Contract with Standard. Standard maintains the contributions in an unallocated fund, whose assets are invested with other assets in the general account of Standard. The account is credited with earnings on the underlying investments and charged for plan withdrawals and administrative expenses charged by Standard Retirement Services. The stable asset fund contract may subject the plan to concentrations of risk as its contract value is dependent on the ability of Standard to honor its contractual commitments. There are no reserves against the contract value for credit risk of Standard or otherwise.
The investment goal of the agent pension plan is to invest in stable value assets in order to maintain its funded status.
The following table sets forth the Company’s target and actual weighted-average asset allocations for the pension plans:
| | | | | | | | | | | | |
| | | December 31, | |
| | | 2011 | | | 2011 | | | 2010 | |
| (In millions) | | Target | | | Actual | | | Actual | |
Asset Category: | | | | | | | | | | | | |
Equity securities | | | 50.0 | % | | | 45.8 | % | | | 49.9 | % |
Debt securities | | | 50.0 | | | | 54.2 | | | | 50.1 | |
| | | | | | | | | | | | | |
Total | | | 100.0 | % | | | 100.0 | % | | | 100.0 | % |
Pension plan assets are recorded at fair value and are disclosed below using a three-level hierarchy. See “Note 9—Fair Value” for additional fair value information. The fair values of pooled separate accounts are valued daily based upon quoted market prices in an active market and are classified as Level 1 assets. Pooled separate accounts are recorded at fair value on a recurring basis. The fair value of the stable asset fund is included in the financial statements at the Deposit Administration Contract value. The contract value approximates fair value, as the contract crediting rate resets annually, and the contracts are fully benefit-responsive and are classified as a Level 2 asset. Contract value represents contributions made under the contracts, plus earnings, less withdrawals and administrative expenses.
The following tables set forth the estimated fair values of assets and liabilities measured and recorded at fair value on a recurring basis:
| | | | | | | | | | | | | | | | |
| | | December 31, 2011 | |
| (In millions) | | Total | | | Level 1 | | | Level 2 | | | Level 3 | |
Assets: | | | | | | | | | | | | | | | | |
Equity securities: | | | | | | | | | | | | | | | | |
Pooled separate account funds: | | | | | | | | | | | | | | | | |
Large cap growth | | $ | 33.0 | | | $ | 33.0 | | | $ | — | | | $ | — | |
Large cap blend | | | 49.4 | | | | 49.4 | | | | — | | | | — | |
Large cap value | | | 16.4 | | | | 16.4 | | | | — | | | | — | |
Mid cap blend | | | 46.4 | | | | 46.4 | | | | — | | | | — | |
Foreign | | | 14.8 | | | | 14.8 | | | | — | | | | — | |
| | | | | | | | | | | | | | | | | |
Total pooled separate account funds | | | 160.0 | | | | 160.0 | | | | — | | | | — | |
| | | | | | | | | | | | | | | | | |
Debt securities: | | | | | | | | | | | | | | | | |
Stable asset fund | | | 189.7 | | | | — | | | | 189.7 | | | | — | |
| | | | | | | | | | | | | | | | | |
Total | | $ | 349.7 | | | $ | 160.0 | | | $ | 189.7 | | | $ | — | |
| | |
| 84 | | STANCORP FINANCIAL GROUP, INC. |
| | | | | | | | | | | | | | | | |
| | | December 31, 2010 | |
| (In millions) | | Total | | | Level 1 | | | Level 2 | | | Level 3 | |
Assets: | | | | | | | | | | | | | | | | |
Equity securities: | | | | | | | | | | | | | | | | |
Pooled separate account funds: | | | | | | | | | | | | | | | | |
Large cap growth | | $ | 29.2 | | | $ | 29.2 | | | $ | — | | | $ | — | |
Large cap blend | | | 42.7 | | | | 42.7 | | | | — | | | | — | |
Large cap value | | | 13.6 | | | | 13.6 | | | | — | | | | — | |
Mid cap blend | | | 46.5 | | | | 46.5 | | | | — | | | | — | |
Foreign | | | 13.9 | | | | 13.9 | | | | — | | | | — | |
| | | | | | | | | | | | | | | | | |
Total pooled separate account funds | | | 145.9 | | | | 145.9 | | | | — | | | | — | |
| | | | | | | | | | | | | | | | | |
Debt securities: | | | | | | | | | | | | | | | | |
Stable asset fund | | | 146.7 | | | | — | | | | 146.7 | | | | — | |
| | | | | | | | | | | | | | | | | |
Total | | $ | 292.6 | | | $ | 145.9 | | | $ | 146.7 | | | $ | — | |
There were no transfers into or out of Level 3 for 2011. The following table sets forth the reconciliation for all assets and liabilities measured at fair value on a recurring basis using significant unobservable Level 3 inputs for December 31, 2010:
| | | | | | | | | | | | | | | | | | | | | | | | | | | | |
| | | Year ended December 31, 2010 | |
| | | | | | Total Realized/Unrealized
Gains (Losses) | | | | | | | | | | | | | |
| (In millions) | | Beginning
Asset
(Liability)
Balance as of
December 31,
2009 | | | Included in
Net Income | | | Included in
Other
Comprehensive
Income (Loss) | | | Purchases,
Sales,
Issuances
and
Settlements | | | Transfer
into
Level 3 | | | Transfer out
of Level 3 | | | Ending Asset
(Liability)
Balance as of
December 31,
2010 | |
Assets: | | | | | | | | | | | | | | | | | | | | | | | | | | | | |
Debt securities | | | | | | | | | | | | | | | | | | | | | | | | | | | | |
Stable asset fund | | $ | 129.6 | | | $ | — | | | $ | — | | | $ | — | | | $ | — | | | $ | | (129.6) | | $ | — | |
As a result of inputs used during the current period to estimate the fair value of stable asset fund, Plan management has categorized the stable asset fund as having Level 2 inputs at December 31, 2010. The valuation methods may produce fair value calculations that may not be indicative of net realizable values or reflective of future fair values. See “Note 9—Fair Value” for further disclosure on valuation methods. Furthermore, although the Plan believes its valuation methods are appropriate and consistent with other market participants, the use of different methodologies or assumptions to determine the fair value of certain financial instruments could result in a different fair value measurement at the reporting date.
Deferred Compensation Plans
Eligible employees are covered by a qualified deferred compensation plan sponsored by Standard under which a portion of the employee contribution is matched. Employees not eligible for the employee pension plan are eligible for an additional non-elective employer contribution. Contributions to the plan for 2011, 2010 and 2009 were $10.3 million, $10.0 million and $10.5 million, respectively.
Eligible executive officers, directors, agents and group producers may participate in one of several non-qualified deferred compensation plans under which a portion of the deferred compensation for participating executive officers, agents and group producers is matched. The liability for the plans was $10.7 million and $10.5 million at December 31, 2011 and 2010, respectively.
Postretirement Benefits Other Than Pensions
Standard sponsors and administers a postretirement benefit plan that includes medical, prescription drug benefits and group term life insurance. The group term life insurance benefit was curtailed as of December 31, 2011. Eligible retirees
Part II
are required to contribute specified amounts for medical and prescription drug benefits that are determined periodically and are based on retirees’ length of service and age at retirement. Participation in the postretirement benefit plan is limited to employees who had reached the age of 40, or whose combined age and length of service was equal to or greater than 45 years as of January 1, 2006. This plan is closed to new participants.
The Company recognizes the funded status of the postretirement benefit plan as an asset or liability on the balance sheet. The funded status is measured as the difference between the fair value of the plan assets and the accumulated benefit obligation.
The following table sets forth a reconciliation of the changes in the postretirement benefit plan’s accumulated benefit obligation, fair value of plan assets and the funded status:
| | | | | | | | | | | | |
| | | Years ended December 31, | |
| (In millions) | | 2011 | | | 2010 | | | 2009 | |
Change in postretirement benefit obligation: | | | | | | | | | | | | |
Accumulated postretirement benefit obligation at beginning of the year | | $ | (40.5 | ) | | $ | (33.9 | ) | | $ | (25.0 | ) |
Service cost | | | (1.5 | ) | | | (1.6 | ) | | | (1.3 | ) |
Interest cost | | | (2.1 | ) | | | (2.1 | ) | | | (1.8 | ) |
Plan amendments | | | 8.0 | | | | — | | | | — | |
Actuarial loss | | | (5.4 | ) | | | (3.5 | ) | | | (6.3 | ) |
Benefits Paid | | | 0.5 | | | | 0.6 | | | | 0.5 | |
Accumulated postretirement benefit obligation at end of the year | | | (41.0 | ) | | | (40.5 | ) | | | (33.9 | ) |
Change in fair value of postretirement plan assets: | | | | | | | | | | | | |
Fair value of plan assets at beginning of the year | | | 18.2 | | | | 18.1 | | | | 17.0 | |
Actual return on plan assets | | | 2.7 | | | | 0.2 | | | | 1.4 | |
Employer contributions | | | 0.3 | | | | 0.5 | | | | 0.2 | |
Benefits paid and estimated expenses | | | (0.5 | ) | | | (0.6 | ) | | | (0.5 | ) |
Fair value of plan assets at end of the year | | | 20.7 | | | | 18.2 | | | | 18.1 | |
Funded status at end of the year | | $ | (20.3 | ) | | $ | (22.3 | ) | | $ | (15.8 | ) |
The gains and losses, and prior service costs or credits excluded from the projected benefit obligation are recognized as a component of accumulated other comprehensive income, net of tax.
The following table sets forth the amounts recognized in accumulated other comprehensive income:
| | | | | | | | | | | | |
| | | December 31, | |
| (In millions) | | 2011 | | | 2010 | | | 2009 | |
Net loss | | $ | 2.2 | | | $ | 4.5 | | | $ | 5.0 | |
Prior service credit | | | (1.0 | ) | | | (0.7 | ) | | | (0.9 | ) |
| | | | | | | | | | | | | |
Total recognized in accumulated other comprehensive income | | $ | 1.2 | | | $ | 3.8 | | | $ | 4.1 | |
The estimated prior service cost for the postretirement benefit plan that will be amortized from accumulated other comprehensive income into net periodic benefit cost in 2012 is $0.4 million. The projected discounted cash flow obligation for the postretirement benefit plan was $48.5 million and $50.1 million at December 31, 2011 and 2010, respectively.
| | |
| 86 | | STANCORP FINANCIAL GROUP, INC. |
The following table sets forth the assumed health care cost trend rates for next year:
| | | | | | | | |
| | | Years ended
December 31, | |
| | | 2011 | | | 2010 | |
Medical | | | 7.50 | % | | | 7.80 | % |
Prescriptions | | | 8.10 | | | | 8.70 | |
HMO (Blended) | | | 6.80 | | | | 8.60 | |
Rate to which the cost trend is assumed to decline (the ultimate trend rate)* | | | 4.50 | | | | 4.50 | |
| | * | | Year that the rate reaches the ultimate trend is 2027. |
Assumed health care cost trend rates have a significant effect on the amounts reported for the health care plans. A one-percentage-point change in assumed health care cost trend rates would have the following effects:
| | | | | | | | |
| (In millions) | | 1% Point
Increase | | | 1% Point
Decrease | |
Effect on total of service and interest cost | | $ | 0.5 | | | $ | (0.4 | ) |
Effect on postretirement benefit obligation | | | 7.1 | | | | (5.6 | ) |
The following table sets forth the components of net periodic benefit cost, other changes in plan assets and benefit obligations recognized in other comprehensive income, and assumptions used in the measurement of the postretirement net periodic benefit cost and the postretirement benefit obligations:
| | | | | | | | | | | | |
| | | Years ended December 31, | |
| (Dollars in millions) | | 2011 | | | 2010 | | | 2009 | |
Components of net periodic benefit cost: | | | | | | | | | | | | |
Service cost | | $ | 1.5 | | | $ | 1.6 | | | $ | 1.3 | |
Interest cost | | | 2.1 | | | | 2.1 | | | | 1.8 | |
Expected return on plan assets | | | (0.8 | ) | | | (0.9 | ) | | | (1.2) | |
Amortization of prior service cost | | | (0.3 | ) | | | (0.3 | ) | | | (0.3) | |
Amortization of net actuarial loss | | | 0.1 | | | | 0.2 | | | | — | |
Curtailment loss | | | 0.7 | | | | — | | | | — | |
Net periodic benefit cost | | | 3.3 | | | | 2.7 | | | | 1.6 | |
Other changes in plan assets and benefit obligation recognized in other comprehensive income: | | | | | | | | | | | | |
Net loss | | | 6.1 | | | | 3.9 | | | | 4.4 | |
Amortization of prior service cost | | | 0.2 | | | | 0.3 | | | | 0.3 | |
Amortization of net actuarial loss | | | (0.1 | ) | | | (0.2 | ) | | | — | |
Total recognized in other comprehensive income | | | 6.2 | | | | 4.0 | | | | 4.7 | |
Total recognized in net periodic benefit cost and other comprehensive income | | $ | 9.5 | | | $ | 6.7 | | | $ | 6.3 | |
| | | |
Weighted-average assumptions: | | | | | | | | | | | | |
Assumptions used for net periodic benefit cost: | | | | | | | | | | | | |
Discount rate | | | 5.50 | % | | | 5.75 | % | | | 6.00 | % |
Expected return on plan assets | | | 4.50 | | | | 4.75 | | | | 5.00 | |
Rate of compensation increase graded by age | | | 5.00 | | | | 5.00 | | | | 4.50 | |
Assumptions used to determine benefit obligations: | | | | | | | | | | | | |
Discount rate | | | 4.50 | % | | | 5.50 | % | | | 5.75 | % |
Rate of compensation increase graded by age | | | n/a | * | | | 5.00 | | | | 5.00 | |
| | * | | Assumption for rate of compensation increase was not applicable in determining benefit obligations for 2011 due to curtailment of group term life insurance benefit as of December 31, 2011. |
Part II
The Company contributed $0.3 million and $0.5 million to fund the postretirement benefit plan in 2011 and 2010, respectively. The Company expects to make contributions of $0.5 million to its postretirement benefit plan in 2012. No plan assets are expected to be returned to the Company in 2012.
The following table sets forth the expected benefit payments for the Company’s postretirement benefit plan:
| | | | |
| (In millions) | | Amount | |
2012 | | $ | 1.1 | |
2013 | | | 1.2 | |
2014 | | | 1.3 | |
2015 | | | 1.4 | |
2016 | | | 1.5 | |
2017-2021 | | | 9.6 | |
The investment goal of the postretirement plan is to produce a steady return on plan assets to maintain its funded status. To achieve this goal, the Company’s postretirement benefit plan assets are comprised primarily of municipal bonds and cash and cash equivalents.
The following table sets forth the Company’s target and actual weighted-average asset allocations for the postretirement medical plan:
| | | | | | | | | | | | |
| | | Years ended December 31, | |
| | | 2011 | | | 2011 | | | 2010 | |
| (In millions) | | Target | | | Actual | | | Actual | |
Asset category: | | | | | | | | | | | | |
Debt securities | | | 95.0 | % | | | 98.1 | % | | | 94.0 | % |
Cash and cash equivalents | | | 5.0 | | | | 1.9 | | | | 6.0 | |
| | | | | | | | | | | | | |
Total | | | 100.0 | % | | | 100.0 | % | | | 100.0 | % |
Postretirement benefit plan assets are recorded at fair value and are disclosed below using a three-level hierarchy. See “Note 9—Fair Value” for additional fair value information. As there was not an active market for the Company’s municipal bond holdings at December 31, 2011, the municipal bonds were valued using Level 2 measurements.
The following tables set forth the estimated fair values of assets and liabilities measured and recorded at fair value on a recurring basis:
| | | | | | | | | | | | | | | | |
| | | December 31, 2011 | |
| (In millions) | | Total | | | Level 1 | | | Level 2 | | | Level 3 | |
Assets: | | | | | | | | | | | | | | | | |
Debt securities: | | | | | | | | | | | | | | | | |
Municipal bonds | | $ | 20.3 | | | $ | — | | | $ | 20.3 | | | $ | — | |
Cash and cash equivalents | | | 0.4 | | | | 0.4 | | | | — | | | | — | |
| | | | | | | | | | | | | | | | | |
Total | | $ | 20.7 | | | $ | 0.4 | | | $ | 20.3 | | | $ | — | |
| | | | | | | | | | | | | | | | |
| | | December 31, 2010 | |
| (In millions) | | Total | | | Level 1 | | | Level 2 | | | Level 3 | |
Assets: | | | | | | | | | | | | | | | | |
Debt securities: | | | | | | | | | | | | | | | | |
Municipal bonds | | $ | 17.1 | | | $ | — | | | $ | 17.1 | | | $ | — | |
Cash and cash equivalents | | | 1.1 | | | | 1.1 | | | | — | | | | — | |
Total | | $ | 18.2 | | | $ | 1.1 | | | $ | 17.1 | | | $ | — | |
| | |
| 88 | | STANCORP FINANCIAL GROUP, INC. |
Non-Qualified Supplemental Retirement Plan
Eligible executive officers are covered by a non-qualified supplemental retirement plan (“non-qualified plan”). Under the non-qualified plan, a participant is entitled to a normal retirement benefit once the participant reaches age 65. A participant can also receive a normal, unreduced retirement benefit once the sum of his or her age plus years of service is at least 90. The Company recognizes the unfunded status of the non-qualified plan in other liabilities on the balance sheet. The unfunded status was $28.5 million and $26.7 million at December 31, 2011 and 2010, respectively. Expenses were $2.5 million $2.8 million and $2.1 million for 2011, 2010 and 2009, respectively. At December 31, 2011 the net loss and prior service cost, net of tax, excluded from the net periodic benefit cost and reported as a component of accumulated other comprehensive income were $5.7 million.
5. SEGMENTS
StanCorp operates through two reportable segments: Insurance Services and Asset Management, as well as an Other category. Subsidiaries, or operating segments, have been aggregated to form the Company’s reportable segments. Resources are allocated and performance is evaluated at the segment level. The Insurance Services segment offers group and individual disability insurance, group life and AD&D insurance, group dental and group vision insurance, and absence management services. The Asset Management segment offers full-service 401(k) plans, 403(b) plans, 457 plans, defined benefit plans, money purchase pension plans, profit sharing plans and non-qualified deferred compensation products and services. This segment also offers investment advisory and management services, financial planning services, commercial mortgage loan origination and servicing, individual fixed-rate annuity products, group annuity contracts and retirement plan trust products. The Other category includes return on capital not allocated to the product segments, holding company expenses, operations of certain unallocated subsidiaries, interest on debt, unallocated expenses, net capital gains and losses related to the impairment or the disposition of the Company’s invested assets and adjustments made in consolidation. The accounting policies of the segments are the same as those described in the summary of significant accounting policies. See “Note 1—Summary of Significant Accounting Policies.”
Intersegment revenues are comprised of administrative fee revenues charged by the Asset Management segment to manage the fixed maturity securities—available-for-sale (“fixed maturity securities”) and commercial mortgage loan portfolios for the Company’s insurance subsidiaries.
The following table sets forth intersegment revenues:
| | | | | | | | | | | | |
| | | Years ended December 31, | |
| (In millions) | | 2011 | | | 2010 | | | 2009 | |
Intersegment administrative fee revenues | | $ | 16.7 | | | $ | 14.8 | | | $ | 13.9 | |
Part II
The following table sets forth premiums, administrative fee revenues and net investment income by major product line or category within each of the Company’s segments:
| | | | | | | | | | | | |
| | | Years ended December 31, | |
| (In millions) | | 2011 | | | 2010 | | | 2009 | |
Premiums: | | | | | | | | | | | | |
Insurance Services: | | | | | | | | | | | | |
Group life and AD&D | | $ | 892.6 | | | $ | 835.7 | | | $ | 819.6 | |
Group long term disability | | | 803.3 | | | | 799.9 | | | | 825.6 | |
Group short term disability | | | 208.0 | | | | 203.7 | | | | 205.7 | |
Group other | | | 81.6 | | | | 81.5 | | | | 79.5 | |
Experience rated refunds | | | (12.5 | ) | | | (27.9 | ) | | | (40.2 | ) |
| | | | | | | | | | | | | |
Total group insurance | | | 1,973.0 | | | | 1,892.9 | | | | 1,890.2 | |
Individual disability insurance | | | 172.3 | | | | 163.3 | | | | 177.0 | |
| | | | | | | | | | | | | |
Total Insurance Services premiums | | | 2,145.3 | | | | 2,056.2 | | | | 2,067.2 | |
| | | | | | | | | | | | | |
Asset Management: | | | | | | | | | | | | |
Retirement plans | | | 2.0 | | | | 1.6 | | | | 0.7 | |
Individual annuities | | | 6.0 | | | | 39.9 | | | | 34.0 | |
| | | | | | | | | | | | | |
Total Asset Management premiums | | | 8.0 | | | | 41.5 | | | | 34.7 | |
| | | | | | | | | | | | | |
Total premiums | | $ | 2,153.3 | | | $ | 2,097.7 | | | $ | 2,101.9 | |
| | | | | | | | | | | | | |
Administrative fees: | | | | | | | | | | | | |
Insurance Services: | | | | | | | | | | | | |
Group insurance | | $ | 12.0 | | | $ | 9.3 | | | $ | 8.0 | |
Individual disability insurance | | | 0.3 | | | | 0.3 | | | | 0.3 | |
| | | | | | | | | | | | | |
Total Insurance Services administrative fees | | | 12.3 | | | | 9.6 | | | | 8.3 | |
| | | | | | | | | | | | | |
Asset Management: | | | | | | | | | | | | |
Retirement plans | | | 90.0 | | | | 92.5 | | | | 88.5 | |
Other financial services businesses | | | 29.9 | | | | 29.0 | | | | 25.6 | |
| | | | | | | | | | | | | |
Total Asset Management administrative fees | | | 119.9 | | | | 121.5 | | | | 114.1 | |
| | | | | | | | | | | | | |
Other | | | (16.7 | ) | | | (14.6 | ) | | | (13.9 | ) |
| | | | | | | | | | | | | |
Total administrative fees | | $ | 115.5 | | | $ | 116.5 | | | $ | 108.5 | |
| | | | | | | | | | | | | |
Net investment income: | | | | | | | | | | | | |
Insurance Services: | | | | | | | | | | | | |
Group insurance | | $ | 288.6 | | | $ | 286.3 | | | $ | 285.6 | |
Individual disability insurance | | | 52.7 | | | | 52.6 | | | | 49.5 | |
| | | | | | | | | | | | | |
Total Insurance Services net investment income | | | 341.3 | | | | 338.9 | | | | 335.1 | |
| | | | | | | | | | | | | |
Asset Management: | | | | | | | | | | | | |
Retirement plans | | | 90.4 | | | | 87.4 | | | | 85.8 | |
Individual annuities | | | 161.0 | | | | 151.0 | | | | 133.9 | |
Other financial services businesses | | | 11.3 | | | | 12.6 | | | | 14.3 | |
| | | | | | | | | | | | | |
Total Asset Management net investment income | | | 262.7 | | | | 251.0 | | | | 234.0 | |
| | | | | | | | | | | | | |
Other | | | 8.8 | | | | 12.6 | | | | 17.4 | |
| | | | | | | | | | | | | |
Total net investment income | | $ | 612.8 | | | $ | 602.5 | | | $ | 586.5 | |
| | |
| 90 | | STANCORP FINANCIAL GROUP, INC. |
The following tables set forth select segment information:
| | | | | | | | | | | | | | | | |
| (In millions) | | Insurance
Services | | | Asset
Management | | | Other | | | Total | |
Year ended December 31, 2011 | | | | | | | | | | | | | | | | |
Revenues: | | | | | | | | | | | | | | | | |
Premiums | | $ | 2,145.3 | | | $ | 8.0 | | | $ | — | | | $ | 2,153.3 | |
Administrative fees | | | 12.3 | | | | 119.9 | | | | (16.7 | ) | | | 115.5 | |
Net investment income | | | 341.3 | | | | 262.7 | | | | 8.8 | | | | 612.8 | |
Net capital losses | | | — | | | | — | | | | (6.9 | ) | | | (6.9 | ) |
| | | | | | | | | | | | | | | | | |
Total revenues | | | 2,498.9 | | | | 390.6 | | | | (14.8 | ) | | | 2,874.7 | |
| | | | | | | | | | | | | | | | | |
Benefits and expenses: | | | | | | | | | | | | | | | | |
Benefits to policyholders | | | 1,750.9 | | | | 20.3 | | | | — | | | | 1,771.2 | |
Interest credited | | | 4.6 | | | | 156.4 | | | | — | | | | 161.0 | |
Operating expenses | | | 338.7 | | | | 115.2 | | | | 17.3 | | | | 471.2 | |
Commissions and bonuses | | | 185.1 | | | | 33.6 | | | | — | | | | 218.7 | |
Premium taxes | | | 36.6 | | | | 0.1 | | | | — | | | | 36.7 | |
Interest expense | | | — | | | | — | | | | 38.9 | | | | 38.9 | |
Net (increase) decrease in deferred acquisition costs, value of business acquired and other intangible assets | | | (20.5 | ) | | | 2.4 | | | | — | | | | (18.1 | ) |
| | | | | | | | | | | | | | | | | |
Total benefits and expenses | | | 2,295.4 | | | | 328.0 | | | | 56.2 | | | | 2,679.6 | |
| | | | | | | | | | | | | | | | | |
Income (loss) before income taxes | | $ | 203.5 | | | $ | 62.6 | | | $ | (71.0 | ) | | $ | 195.1 | |
| | | | | | | | | | | | | | | | | |
Total assets | | $ | 8,228.5 | | | $ | 9,929.8 | | | $ | 275.5 | | | $ | 18,433.8 | |
| | | | | | | | | | | | | | | | |
| (In millions) | | Insurance
Services | | | Asset
Management | | | Other | | | Total | |
Year ended December 31, 2010 | | | | | | | | | | | | | | | | |
Revenues: | | | | | | | | | | | | | | | | |
Premiums | | $ | 2,056.2 | | | $ | 41.5 | | | $ | — | | | $ | 2,097.7 | |
Administrative fees | | | 9.6 | | | | 121.5 | | | | (14.6 | ) | | | 116.5 | |
Net investment income | | | 338.9 | | | | 251.0 | | | | 12.6 | | | | 602.5 | |
Net capital losses | | | — | | | | — | | | | (51.6 | ) | | | (51.6 | ) |
| | | | | | | | | | | | | | | | | |
Total revenues | | | 2,404.7 | | | | 414.0 | | | | (53.6 | ) | | | 2,765.1 | |
| | | | | | | | | | | | | | | | | |
Benefits and expenses: | | | | | | | | | | | | | | | | |
Benefits to policyholders | | | 1,566.4 | | | | 53.4 | | | | — | | | | 1,619.8 | |
Interest credited | | | 4.8 | | | | 153.6 | | | | — | | | | 158.4 | |
Operating expenses | | | 331.8 | | | | 119.0 | | | | (4.6 | ) | | | 446.2 | |
Commissions and bonuses | | | 175.7 | | | | 30.4 | | | | — | | | | 206.1 | |
Premium taxes | | | 34.5 | | | | 0.2 | | | | — | | | | 34.7 | |
Interest expense | | | — | | | | 0.1 | | | | 38.8 | | | | 38.9 | |
Net (increase) decrease in deferred acquisition costs, value of business acquired and other intangible assets | | | (22.3 | ) | | | 0.5 | | | | — | | | | (21.8 | ) |
| | | | | | | | | | | | | | | | | |
Total benefits and expenses | | | 2,090.9 | | | | 357.2 | | | | 34.2 | | | | 2,482.3 | |
| | | | | | | | | | | | | | | | | |
Income (loss) before income taxes | | $ | 313.8 | | | $ | 56.8 | | | $ | (87.8 | ) | | $ | 282.8 | |
| | | | | | | | | | | | | | | | | |
Total assets | | $ | 7,736.8 | | | $ | 9,813.7 | | | $ | 292.8 | | | $ | 17,843.3 | |
Part II
| | | | | | | | | | | | | | | | |
| (In millions) | | Insurance
Services | | | Asset
Management | | | Other | | | Total | |
Year ended December 31, 2009 | | | | | | | | | | | | | | | | |
Revenues: | | | | | | | | | | | | | | | | |
Premiums | | $ | 2,067.2 | | | $ | 34.7 | | | $ | — | | | $ | 2,101.9 | |
Administrative fees | | | 8.3 | | | | 114.1 | | | | (13.9 | ) | | | 108.5 | |
Net investment income | | | 335.1 | | | | 234.0 | | | | 17.4 | | | | 586.5 | |
Net capital losses | | | — | | | | — | | | | (26.9 | ) | | | (26.9 | ) |
| | | | | | | | | | | | | | | | | |
Total revenues | | | 2,410.6 | | | | 382.8 | | | | (23.4 | ) | | | 2,770.0 | |
| | | | | | | | | | | | | | | | | |
Benefits and expenses: | | | | | | | | | | | | | | | | |
Benefits to policyholders | | | 1,530.3 | | | | 45.4 | | | | — | | | | 1,575.7 | |
Interest credited | | | 4.7 | | | | 140.9 | | | | — | | | | 145.6 | |
Operating expenses | | | 333.9 | | | | 126.9 | | | | 15.4 | | | | 476.2 | |
Commissions and bonuses | | | 169.8 | | | | 32.2 | | | | — | | | | 202.0 | |
Premium taxes | | | 34.2 | | | | — | | | | — | | | | 34.2 | |
Interest expense | | | — | | | | 0.1 | | | | 39.1 | | | | 39.2 | |
Net increase in deferred acquisition costs, value of business acquired and other intangible assets | | | (18.6 | ) | | | — | | | | — | | | | (18.6 | ) |
| | | | | | | | | | | | | | | | | |
Total benefits and expenses | | | 2,054.3 | | | | 345.5 | | | | 54.5 | | | | 2,454.3 | |
| | | | | | | | | | | | | | | | | |
Income (loss) before income taxes | | $ | 356.3 | | | $ | 37.3 | | | $ | (77.9 | ) | | $ | 315.7 | |
| | | | | | | | | | | | | | | | | |
Total assets | | $ | 7,587.6 | | | $ | 8,721.7 | | | $ | 260.2 | | | $ | 16,569.5 | |
6. PARENT HOLDING COMPANY CONDENSED FINANCIAL INFORMATION
Set forth below are the unconsolidated condensed financial statements of StanCorp. The significant accounting policies used in preparing StanCorp’s financial statements are substantially the same as those used in the preparation of the consolidated financial statements of the Company except that StanCorp’s subsidiaries are carried under the equity method.
The following table sets forth StanCorp’s condensed statements of income:
| | | | | | | | | | | | |
| | | Years ended December 31, | |
| (In millions) | | 2011 | | | 2010 | | | 2009 | |
Revenues: | | | | | | | | | | | | |
Administrative fees | | $ | — | | | $ | 0.1 | | | $ | — | |
Net investment income | | | — | | | | 0.2 | | | | 0.1 | |
Net capital losses | | | (0.3 | ) | | | (0.7 | ) | | | — | |
| | | | | | | | | | | | | |
Total revenues | | | (0.3 | ) | | | (0.4 | ) | | | 0.1 | |
| | | | | | | | | | | | | |
Expenses: | | | | | | | | | | | | |
Interest expense | | | 38.8 | | | | 38.8 | | | | 38.8 | |
Operating expenses | | | 11.2 | | | | 5.1 | | | | 5.1 | |
| | | | | | | | | | | | | |
Total expenses | | | 50.0 | | | | 43.9 | | | | 43.9 | |
| | | | | | | | | | | | | |
Loss before income taxes and equity in net income of subsidiaries | | | (50.3 | ) | | | (44.3 | ) | | | (43.8 | ) |
Income tax benefit | | | (10.8 | ) | | | (23.7 | ) | | | (11.5 | ) |
Equity in net income of subsidiaries | | | 178.8 | | | | 209.6 | | | | 241.2 | |
| | | | | | | | | | | | | |
Net income | | $ | 139.3 | | | $ | 189.0 | | | $ | 208.9 | |
| | |
| 92 | | STANCORP FINANCIAL GROUP, INC. |
The following table sets forth StanCorp’s condensed balance sheets:
| | | | | | | | |
| | | December 31, | |
| (In millions) | | 2011 | | | 2010 | |
ASSETS | | | | | | | | |
Cash and cash equivalents | | $ | 34.5 | | | $ | 44.1 | |
Investment in subsidiaries | | | 2,462.9 | | | | 2,357.2 | |
Receivable from subsidiaries | | | 4.3 | | | | 16.8 | |
Other assets | | | 65.3 | | | | 51.0 | |
| | | | | | | | | |
Total assets | | $ | 2,567.0 | | | $ | 2,469.1 | |
LIABILITIES AND SHAREHOLDERS’ EQUITY | | | | | | | | |
Liabilities: | | | | | | | | |
Payable to subsidiaries | | $ | — | | | $ | 0.4 | |
Short-term debt | | | 250.0 | | | | — | |
Long-term debt | | | 300.0 | | | | 550.0 | |
Other liabilities | | | 6.5 | | | | 6.6 | |
| | | | | | | | | |
Total liabilities | | | 556.5 | | | | 557.0 | |
| | | | | | | | | |
Shareholders’ equity: | | | | | | | | |
Total shareholders’ equity | | | 2,010.5 | | | | 1,912.1 | |
| | | | | | | | | |
Total liabilities and shareholders’ equity | | $ | 2,567.0 | | | $ | 2,469.1 | |
The following table sets forth StanCorp’s condensed statements of cash flows:
| | | | | | | | | | | | |
| | | Years ended December 31, | |
| (In millions) | | 2011 | | | 2010 | | | 2009 | |
Operating: | | | | | | | | | | | | |
Net income | | $ | 139.3 | | | $ | 189.0 | | | $ | 208.9 | |
Adjustments to reconcile net income to net cash provided by operating activities: | | | | | | | | | | | | |
Equity in net income of subsidiaries | | | (178.8 | ) | | | (209.6 | ) | | | (241.2 | ) |
Dividends received from subsidiaries | | | 94.3 | | | | 244.0 | | | | 170.0 | |
Changes in operating assets and liabilities | | | (24.5 | ) | | | (16.6 | ) | | | 2.1 | |
| | | | | | | | | | | | | |
Net cash provided by operating activities | | | 30.3 | | | | 206.8 | | | | 139.8 | |
Investing: | | | | | | | | | | | | |
Capital contributions to subsidiaries | | | (9.0 | ) | | | (90.0 | ) | | | (35.9 | ) |
Return of capital from subsidiaries | | | 76.1 | | | | 12.7 | | | | 1.8 | |
Receivables from subsidiaries, net | | | 13.3 | | | | 13.9 | | | | (15.7 | ) |
Investment securities and other | | | 0.3 | | | | 0.6 | | | | (0.7 | ) |
| | | | | | | | | | | | | |
Net cash provided by (used in) investing activities | | | 80.7 | | | | (62.8 | ) | | | (50.5 | ) |
Financing: | | | | | | | | | | | | |
Issuance and repurchase of common stock, net | | | (81.3 | ) | | | (67.4 | ) | | | (51.0 | ) |
Dividends paid on common stock | | | (39.3 | ) | | | (39.6 | ) | | | (38.9 | ) |
| | | | | | | | | | | | | |
Net cash used in financing activities | | | (120.6 | ) | | | (107.0 | ) | | | (89.9 | ) |
(Decrease) increase in cash and cash equivalents | | | (9.6 | ) | | | 37.0 | | | | (0.6 | ) |
Cash and cash equivalents, beginning of period | | | 44.1 | | | | 7.1 | | | | 7.7 | |
| | | | | | | | | | | | | |
Cash and cash equivalents, end of period | | $ | 34.5 | | | $ | 44.1 | | | $ | 7.1 | |
Part II
7. INCOME TAXES
The following table sets forth the provision for income taxes:
| | | | | | | | | | | | |
| | | Years ended December 31, | |
| (In millions) | | 2011 | | | 2010 | | | 2009 | |
Current | | $ | 40.5 | | | $ | 115.7 | | | $ | 123.6 | |
Deferred | | | 15.3 | | | | (21.9 | ) | | | (16.8 | ) |
| | | | | | | | | | | | | |
Total income tax provision | | $ | 55.8 | | | $ | 93.8 | | | $ | 106.8 | |
The following table sets forth the reconciliation between taxes calculated as if the federal corporate tax rate of 35% was applied to income before income taxes and the recorded income tax provision:
| | | | | | | | | | | | |
| | | Years ended December 31, | |
| (In millions) | | 2011 | | | 2010 | | | 2009 | |
Tax at federal corporate rate of 35% | | $ | 68.3 | | | $ | 99.0 | | | $ | 110.5 | |
(Decrease) increase in rate resulting from: | | | | | | | | | | | | |
Tax exempt interest | | | (0.1 | ) | | | (0.2 | ) | | | (0.3 | ) |
Dividends received deduction | | | (3.1 | ) | | | (3.1 | ) | | | (3.2 | ) |
State income taxes, net of federal benefit | | | (0.1 | ) | | | (0.1 | ) | | | 1.0 | |
Federal tax credits | | | (8.6 | ) | | | (3.3 | ) | | | (3.1 | ) |
Other | | | (0.6 | ) | | | 1.5 | | | | 1.9 | |
| | | | | | | | | | | | | |
Total income tax provision | | $ | 55.8 | | | $ | 93.8 | | | $ | 106.8 | |
The following table sets forth the tax effect of temporary differences that gave rise to significant portions of the net deferred tax liability:
| | | | | | | | | | | | |
| | | Years ended December 31, | |
| (In millions) | | 2011 | | | 2010 | | | 2009 | |
Policyholder liabilities | | $ | 9.3 | | | $ | 11.9 | | | $ | 9.3 | |
Compensation and benefit plans | | | 42.4 | | | | 43.8 | | | | 40.4 | |
Loss carryforwards | | | 56.2 | | | | 50.9 | | | | 54.4 | |
Investments | | | 41.4 | | | | 43.3 | | | | 24.6 | |
Other | | | 1.9 | | | | 3.7 | | | | 4.5 | |
| | | | | | | | | | | | | |
Total deferred tax assets | | | 151.2 | | | | 153.6 | | | | 133.2 | |
Less: valuation allowances | | | (4.2 | ) | | | (0.8 | ) | | | (1.9 | ) |
| | | | | | | | | | | | | |
Net deferred tax assets | | | 147.0 | | | | 152.8 | | | | 131.3 | |
| | | | | | | | | | | | | |
Net unrealized capital gains | | | 173.9 | | | | 121.1 | | | | 71.4 | |
Capitalized software | | | 10.2 | | | | 14.8 | | | | 18.0 | |
Deferred policy acquisition costs | | | 72.1 | | | | 66.1 | | | | 62.3 | |
Intangible assets | | | 3.2 | | | | 5.2 | | | | 5.4 | |
Other | | | 1.1 | | | | 3.9 | | | | 4.2 | |
| | | | | | | | | | | | | |
Total deferred tax liabilities | | | 260.5 | | | | 211.1 | | | | 161.3 | |
| | | | | | | | | | | | | |
Net deferred tax liability | | $ | (113.5 | ) | | $ | (58.3 | ) | | $ | (30.0 | ) |
The Company is carrying forward net operating losses of $77.5 million that originated in StanCorp and certain subsidiaries. The losses will be used in future years to offset taxable income from those entities to the degree allowed by the Internal Revenue Code. If unutilized, these losses would expire between the years 2023 to 2031. In addition, the Company is carrying forward a $58.6 million federal net operating loss from a business acquisition. This carryforward is subject to limitations under IRS Section 382, which potentially reduces the annual amount that may be utilized. This carryforward will expire between 2019 and 2024.
| | |
| 94 | | STANCORP FINANCIAL GROUP, INC. |
Realization of the Company’s net operating loss carryforwards is dependent upon generating sufficient taxable income before expiration of the losses. Although realization is not assured, management believes it is more likely than not that all of the deferred tax asset relating to the federal loss carryforwards will be realized. The amount of the deferred tax asset considered realizable could be reduced in the future if estimates of expected taxable income during the carryforward period are reduced.
The Company is carrying forward a deferred tax asset of $8.3 million related to losses attributable to various states and municipalities. In some instances, state and local loss carryforwards are subject to a shorter expiration period than the 20-year federal period. Further, some losses originated in a subsidiary which has reduced its operations in the state where the loss was incurred. We believe that the benefit from certain state and local NOL carryforwards will not be realized. As such, we have provided a valuation allowance of $4.2 million on the deferred tax assets relating to these assets. If our assumptions change, we may be able to realize these NOLs. The state and local loss carryforwards expire at various dates through 2031.
As of December 31, 2011, the Company is subject to examination by the IRS for the years 2009 through 2011.
The Company did not have any material unrecognized tax benefits in 2011 and 2010. It is the Company’s accounting policy to record income tax interest and penalties in the income tax provision. See “Note 1—Summary of Significant Accounting Policies—Income Taxes.”
8. GOODWILL
Goodwill is related to the Asset Management segment and totaled $36.0 million at both December 31, 2011 and 2010. Goodwill is not amortized and is tested at least annually for impairment. If indicators of impairment appear throughout the year, or in the event of material changes in circumstances, the test will be more frequent. The Company performs a step-one test and compares the carrying value of the tested assets with the fair value of the assets. Fair value is measured using a combination of the income approach and the market approach. The income approach consists of utilizing the discounted cash flow method that incorporates the Company’s estimates of future revenues and costs, discounted using a market participant weighted-average cost of capital. The estimates the Company uses in the income approach are consistent with the plans and estimates that the Company uses to manage its operations. The market approach utilizes multiples of profit measures in order to estimate the fair value of the assets. As the income approach more closely aligns with how the Company internally evaluates and manages its business, the Company weights the income approach more heavily than the market approach in determining the fair value of the assets. However, the Company performs testing to ensure that both models are providing reasonably consistent results. Additionally, the Company performs sensitivity analysis on the key input factors in these models to determine whether any input factor or combination of factors moving moderately in either direction would change the results of these tests. Through the performance of these tests, the Company concluded that goodwill was not impaired as of December 31, 2011.
9. FAIR VALUE
Assets and liabilities recorded at fair value are disclosed using a three-level hierarchy. The classification of assets and liabilities within the hierarchy is based on whether the inputs to the valuation methodology used for measurement are observable or unobservable. Observable inputs reflect market-derived or market-based information obtained from independent sources while unobservable inputs reflect the Company’s estimates about market data.
The fair value hierarchy prioritizes the inputs to valuation techniques used to measure fair value into three broad levels: Level 1 inputs are based upon quoted prices in active markets for identical assets or liabilities that the Company can access at the measurement date. Level 2 inputs are based upon quoted prices for similar instruments in active markets, quoted prices for identical or similar instruments in markets that are not active, and model-based valuation techniques for which all significant assumptions are observable in the market. Level 3 inputs are generated from model-based techniques that use significant assumptions not observable in the market. These unobservable assumptions reflect the Company’s estimates of assumptions that market participants would use in pricing the asset or liability.
Part II
There are three types of valuation techniques used to measure assets and liabilities recorded at fair value:
| | • | | The market approach, which uses prices or other relevant information generated by market transactions involving identical or comparable assets or liabilities. |
| | • | | The income approach, which uses the present value of cash flows or earnings. |
| | • | | The cost approach, which uses replacement costs more readily adaptable for valuing physical assets. |
The Company uses both the market and income approach in its fair value measurements. These measurements are discussed in more detail below.
The following table sets forth the estimated fair value and the carrying value of each financial instrument:
| | | | | | | | | | | | | | | | |
| | | December 31, 2011
| | | December 31, 2010
| |
| (In millions) | | Fair Value | | | Carrying
Value | | | Fair Value | | | Carrying
Value | |
Assets: | | | | | | | | | | | | | | | | |
Fixed maturity securities: | | | | | | | | | | | | | | | | |
U.S. government and agency bonds | | $ | 452.1 | | | $ | 452.1 | | | $ | 415.9 | | | $ | 415.9 | |
U.S. state and political subdivision bonds | | | 178.8 | | | | 178.8 | | | | 209.1 | | | | 209.1 | |
Foreign government bonds | | | 72.1 | | | | 72.1 | | | | 69.6 | | | | 69.6 | |
Corporate bonds | | | 6,059.3 | | | | 6,059.3 | | | | 5,711.2 | | | | 5,711.2 | |
S&P 500 Index options | | | 7.2 | | | | 7.2 | | | | 13.3 | | | | 13.3 | |
Total fixed maturity securities | | $ | 6,769.5 | | | $ | 6,769.5 | | | $ | 6,419.1 | | | $ | 6,419.1 | |
Commercial mortgage loans, net | | $ | 5,450.9 | | | $ | 4,902.3 | | | $ | 4,739.7 | | | $ | 4,513.6 | |
Policy loans | | | 2.9 | | | | 2.9 | | | | 3.3 | | | | 3.3 | |
Separate account assets | | | 4,593.5 | | | | 4,593.5 | | | | 4,787.4 | | | | 4,787.4 | |
Liabilities: | | | | | | | | | | | | | | | | |
Total other policyholder funds, investment type contracts | | $ | 4,804.8 | | | $ | 4,449.2 | | | $ | 4,186.2 | | | $ | 4,010.1 | |
Index-based interest guarantees | | | 49.5 | | | | 49.5 | | | | 48.5 | | | | 48.5 | |
Short-term debt | | | 263.7 | | | | 251.2 | | | | 2.8 | | | | 2.2 | |
Long-term debt | | | 272.0 | | | | 300.9 | | | | 558.2 | | | | 551.9 | |
Financial Instruments Not Recorded at Fair Value
The Company did not elect to measure and record commercial mortgage loans, policy loans, other policyholders funds that are investment-type contracts, or long-term debt at fair value on the consolidated balance sheets.
For disclosure purposes, the fair values of commercial mortgage loans were estimated using an option-adjusted discounted cash flow valuation. The valuation includes both observable market inputs and estimated model parameters.
Significant observable inputs to the valuation include:
| | • | | Indicative quarter-end pricing for a package of loans similar to those originated by the Company near quarter-end. |
| | • | | U.S. Government treasury yields. |
| | • | | Indicative yields from industrial bond issues. |
| | • | | The contractual terms of nearly every mortgage subject to valuation. |
Significant estimated parameters include:
| | • | | A liquidity premium that is estimated from historical loan sales and is applied over and above base yields. |
| | • | | Adjustments in interest rate spread based on an aggregate portfolio loan-to-value ratio, estimated from historical differential yields with respect to loan-to-value ratios. |
| | • | | Projected prepayment activity. |
For policy loans, the carrying value represents historical cost but approximates fair value. While potentially financial instruments, policy loans are an integral component of the insurance contract and have no maturity date.
The fair value of other policyholder funds that are investment-type contracts was calculated using the income approach in conjunction with the cost of capital method. The parameters used for discounting in the calculation were estimated using the perspective of the principal market for the contracts under consideration. The principal market consists of other insurance carriers with similar contracts on their books.
| | |
| 96 | | STANCORP FINANCIAL GROUP, INC. |
The fair value for long-term debt was predominantly based on quoted market prices as of December 31, 2011 and 2010 and trades occurring close to December 31, 2011 and 2010.
Financial Instruments Measured and Recorded at Fair Value
Fixed maturity securities, Standard & Poor’s (“S&P”) 500 Index call options (“S&P 500 Index options”) and index-based interest guarantees embedded in indexed annuities (“index-based interest guarantees”) are recorded at fair value on a recurring basis. In the Company’s consolidated statements of income and comprehensive income (loss), unrealized gains and losses are reported in other comprehensive income for fixed maturity securities, in net investment income for S&P 500 Index options and in interest credited for index-based interest guarantees.
Separate account assets represent segregated funds held for the exclusive benefit of contract holders. The activities of the account primarily relate to participant-directed 401(k) contracts. Separate account assets are recorded at fair value on a recurring basis, with changes in fair value recorded in separate account liabilities. Separate account assets consist of mutual funds. The mutual funds’ fair value is determined through Level 1 and Level 2 inputs. The majority of the separate account assets are valued using quoted prices in an active market with the remainder of the assets valued using quoted prices from an independent pricing service. The Company reviews the values obtained from the pricing service for reasonableness through analytical procedures and performance reviews.
Fixed maturity securities are comprised of the following classes:
| | • | | U.S. government and agency bonds. |
| | • | | U.S. state and political subdivision bonds. |
| | • | | Foreign government bonds. |
The fixed maturity securities are diversified across industries, issuers and maturities. The Company calculates fair values for all classes of fixed maturity securities using valuation techniques described below. They are placed into three levels depending on the valuation technique used to determine the fair value of the securities.
The Company uses an independent pricing service to assist management in determining the fair value of these assets. The pricing service incorporates a variety of information observable in the market in its valuation techniques, including:
| | • | | Reported trading prices. |
| | • | | Relative credit information. |
The pricing service also takes into account perceived market movements and sector news, as well as a bond’s terms and conditions, including any features specific to that issue that may influence risk, and thus marketability. Depending on the security, the priority of the use of observable market inputs may change as some observable market inputs may not be relevant or additional inputs may be necessary. The Company generally obtains one value from its primary external pricing service. On a case-by-case basis, the Company may obtain further quotes or prices from additional parties as needed.
The pricing service provides quoted market prices when available. Quoted prices are not always available due to bond market inactivity. The pricing service obtains a broker quote when sufficient information, such as security structure or other market information, is not available to produce a valuation. Valuations and quotes obtained from third party commercial pricing services are non-binding and do not represent quotes on which one may execute the disposition of the assets.
The Company performs control procedures over the external valuations at least quarterly through a combination of procedures that include an evaluation of methodologies used by the pricing service, analytical reviews and performance analysis of the prices against statistics and trends, back testing of sales activity and maintenance of a securities watch list. As necessary, the Company compares prices received from the pricing service to prices independently estimated by the
Part II
Company utilizing discounted cash flow models or through performing independent valuations of inputs and assumptions similar to those used by the pricing service in order to ensure prices represent a reasonable estimate of fair value. Although the Company does identify differences from time to time as a result of these validation procedures, the Company did not make any significant adjustments as of December 31, 2011 or 2010.
S&P 500 Index options and certain fixed maturity securities were valued using Level 3 inputs. The Level 3 fixed maturity securities were valued using matrix pricing, independent broker quotes and other standard market valuation methodologies. The fair value was determined using inputs that were not observable or could not be derived principally from, or corroborated by, observable market data. These inputs included assumptions regarding liquidity, estimated future cash flows and discount rates. Unobservable inputs to these valuations are based on management’s judgment or estimation obtained from the best sources available. The Company’s valuations maximize the use of observable inputs, which include an analysis of securities in similar sectors with comparable maturity dates and bond ratings. Broker quotes are validated by management for reasonableness in conjunction with information obtained from matrix pricing and other sources.
The Company calculates the fair value for its S&P 500 Index options using the Black-Scholes option pricing model and parameters derived from market sources. The Company’s valuations maximize the use of observable inputs, which include direct price quotes from the Chicago Board Options Exchange (“CBOE”) and values for on-the-run treasury securities and London Interbank Offered Rate (“LIBOR”) rates as reported by Bloomberg. Unobservable inputs are estimated from the best sources available to the Company and include estimates of future gross dividends to be paid on the stocks underlying the S&P 500 Index, estimates of bid-ask spreads, and estimates of implied volatilities on options. Valuation parameters are calibrated to replicate the actual end-of-day market quotes for options trading on the CBOE. The Company performs additional validation procedures such as the daily observation of market activity and conditions and the tracking and analyzing of actual quotes provided by banking counterparties each time the Company purchases options from them. Additionally, in order to help validate the values derived through the procedures noted above, the Company obtains indicators of value from representative investment banks.
The Company uses the income approach valuation technique to determine the fair value of index-based interest guarantees. The liability is the present value of future cash flows attributable to the projected index growth in excess of cash flows driven by fixed interest rate guarantees for the indexed annuity product. Level 3 assumptions for policyholder behavior and future index interest rate declarations significantly influence the calculation. Index-based interest guarantees are included in the other policyholder funds line on the Company’s consolidated balance sheet.
The following tables set forth the estimated fair values of assets and liabilities measured and recorded at fair value on a recurring basis:
| | | | | | | | | | | | | | | | |
| | | December 31, 2011 | |
| (In millions) | | Total | | | Level 1 | | | Level 2 | | | Level 3 | |
Assets: | | | | | | | | | | | | | | | | |
Fixed maturity securities: | | | | | | | | | | | | | | | | |
U.S. government and agency bonds | | $ | 452.1 | | | $ | — | | | $ | 451.6 | | | $ | 0.5 | |
U.S. state and political subdivision bonds | | | 178.8 | | | | — | | | | 177.4 | | | | 1.4 | |
Foreign government bonds | | | 72.1 | | | | — | | | | 72.1 | | | | — | |
Corporate bonds | | | 6,059.3 | | | | — | | | | 5,995.3 | | | | 64.0 | |
S&P 500 Index options | | | 7.2 | | | | — | | | | — | | | | 7.2 | |
| | | | | | | | | | | | | | | | | |
Total fixed maturity securities | | $ | 6,769.5 | | | $ | — | | | $ | 6,696.4 | | | $ | 73.1 | |
| | | | | | | | | | | | | | | | | |
Separate account assets | | $ | 4,593.5 | | | $ | 4,444.4 | | | $ | 149.1 | | | $ | — | |
Liabilities: | | | | | | | | | | | | | | | | |
Index-based interest guarantees | | $ | 49.5 | | | $ | — | | | $ | — | | | $ | 49.5 | |
| | |
| 98 | | STANCORP FINANCIAL GROUP, INC. |
| | | | | | | | | | | | | | | | |
| | | December 31, 2010 | |
| (In millions) | | Total | | | Level 1 | | | Level 2 | | | Level 3 | |
Assets: | | | | | | | | | | | | | | | | |
Fixed maturity securities: | | | | | | | | | | | | | | | | |
U.S. government and agency bonds | | $ | 415.9 | | | $ | — | | | $ | 415.0 | | | $ | 0.9 | |
U.S. state and political subdivision bonds | | | 209.1 | | | | — | | | | 207.4 | | | | 1.7 | |
Foreign government bonds | | | 69.6 | | | | — | | | | 69.6 | | | | — | |
Corporate bonds | | | 5,711.2 | | | | — | | | | 5,652.2 | | | | 59.0 | |
S&P 500 Index options | | | 13.3 | | | | — | | | | — | | | | 13.3 | |
| | | | | | | | | | | | | | | | | |
Total fixed maturity securities | | $ | 6,419.1 | | | $ | — | | | $ | 6,344.2 | | | $ | 74.9 | |
| | | | | | | | | | | | | | | | | |
Separate account assets | | $ | 4,787.4 | | | $ | 4,586.4 | | | $ | 201.0 | | | $ | — | |
Liabilities: | | | | | | | | | | | | | | | | |
Index-based interest guarantees | | $ | 48.5 | | | $ | — | | | $ | — | | | $ | 48.5 | |
The following tables set forth the reconciliation for all assets and liabilities measured at fair value on a recurring basis using significant unobservable Level 3 inputs:
| | | | | | | | | | | | | | | | | | | | | | | | | | |
| | | Year ended December 31, 2011 | |
| | | Assets | | | | | Liabilities | |
| (In millions) | | U.S.
Government
and Agency
Bonds | | | U.S. State
and Political
Subdivision
Bonds | | | Corporate
Bonds | | | S&P 500
Index
Options | | | Total
Assets | | | | | Index-
Based
Interest
Guarantees | |
Beginning balance | | $ | 0.9 | | | $ | 1.7 | | | $ | 59.0 | | | $ | 13.3 | | | $ | 74.9 | | | | | $ | (48.5 | ) |
Total realized/unrealized gains (losses): | | | | | | | | | | | | | | | | | | | | | | | | | | |
Included in net income | | | — | | | | — | | | | — | | | | (0.2 | ) | | | (0.2 | ) | | | | | (1.3 | ) |
Included in other comprehensive income (loss) | | | (0.2 | ) | | | 0.1 | | | | (1.9 | ) | | | — | | | | (2.0 | ) | | | | | — | |
Purchases, issuances, sales and settlements: | | | | | | | | | | | | | | | | | | | | | | | | | | |
Purchases | | | — | | | | — | | | | — | | | | 9.6 | | | | 9.6 | | | | | | — | |
Issuances | | | — | | | | — | | | | — | | | | — | | | | — | | | | | | (1.8 | ) |
Sales | | | (0.2 | ) | | | — | | | | (2.1 | ) | | | — | | | | (2.3 | ) | | | | | — | |
Settlements | | | — | | | | — | | | | — | | | | (15.5 | ) | | | (15.5 | ) | | | | | 2.1 | |
Transfers into level 3 | | | — | | | | — | | | | 9.0 | | | | — | | | | 9.0 | | | | | | — | |
Transfers out of level 3 | | | — | | | | (0.4 | ) | | | — | | | | — | | | | (0.4 | ) | | | | | — | |
| | | | | | | | | | | | | | | | | | | | | | | | | | | |
Ending balance | | $ | 0.5 | | | $ | 1.4 | | | $ | 64.0 | | | $ | 7.2 | | | $ | 73.1 | | | | | $ | (49.5 | ) |
| | | | | | | | | | | | | | | | | | | | | | | | | | |
| | | Year ended December 31, 2010 | |
| | | Assets | | | | | Liabilities | |
| (In millions) | | U.S.
Government
and Agency
Bonds | | | U.S. State
and Political
Subdivision
Bonds | | | Corporate
Bonds | | | S&P 500
Index
Options | | | Total
Assets | | | | | Index- Based
Interest
Guarantees | |
Beginning balance | | $ | 7.5 | | | $ | 1.7 | | | $ | 68.4 | | | $ | 8.6 | | | $ | 86.2 | | | | | $ | (40.4 | ) |
Total realized/unrealized gains (losses): | | | | | | | | | | | | | | | | | | | | | | | | | | |
Included in net income | | | — | | | | — | | | | (0.8 | ) | | | 8.4 | | | | 7.6 | | | | | | (5.8 | ) |
Included in other comprehensive income (loss) | | | — | | | | — | | | | 4.5 | | | | — | | | | 4.5 | | | | | | — | |
Purchases, issuances, sales and settlements: | | | | | | | | | | | | | | | | | | | | | | | | | | |
Purchases | | | — | | | | — | | | | — | | | | 9.1 | | | | 9.1 | | | | | | — | |
Issuances | | | — | | | | — | | | | — | | | | — | | | | — | | | | | | (3.0 | ) |
Sales | | | — | | | | — | | | | (6.1 | ) | | | — | | | | (6.1 | ) | | | | | — | |
Settlements | | | — | | | | — | | | | (5.2 | ) | | | (12.8 | ) | | | (18.0 | ) | | | | | 0.7 | |
Transfers into level 3 | | | — | | | | — | | | | — | | | | — | | | | — | | | | | | — | |
Transfers out of level 3 | | | (6.6 | ) | | | — | | | | (1.8 | ) | | | — | | | | (8.4 | ) | | | | | — | |
| | | | | | | | | | | | | | | | | | | | | | | | | | | |
Ending balance | | $ | 0.9 | | | $ | 1.7 | | | $ | 59.0 | | | $ | 13.3 | | | $ | 74.9 | | | | | $ | (48.5 | ) |
For all periods disclosed above, fixed maturity securities transferred into Level 3 from Level 2 are the result of the Company being unable to obtain pricing for these investments from an independent pricing service. Fixed maturity
Part II
securities transferred out of Level 3 into Level 2 are the result of the Company being able to obtain pricing for these investments from an independent pricing service. There were no significant transfers between Level 1 and Level 2 for 2011 and 2010.
The following table sets forth the changes in unrealized gains (losses) included in net income relating to positions that the Company continued to hold:
| | | | | | | | |
| | | Years ended December 31, | |
| (In millions) | | 2011 | | | 2010 | |
Assets: | | | | | | | | |
S&P 500 Index options | | $ | (2.5 | ) | | $ | 8.4 | |
| | |
Liabilities: | | | | | | | | |
Index-based interest guarantees | | $ | (4.6 | ) | | $ | (5.8 | ) |
Changes to the fair value of fixed maturity securities, excluding S&P 500 Index options, were recorded in other comprehensive income. Changes to the fair value of the S&P 500 Index options were recorded to net investment income. Changes to the fair value of the index-based interest guarantees were recorded as interest credited. The interest credited amount for 2011 and 2010 included negative interest on policyholder funds of $1.9 million and $5.0 million due to changes in the Level 3 actuarial assumptions.
Certain assets and liabilities are measured at fair value on a nonrecurring basis such as impaired commercial mortgage loans with specific allowances for losses and real estate acquired in satisfaction of debt through foreclosure or the acceptance of deeds in lieu of foreclosure on commercial mortgage loans (“real estate owned”). The impaired commercial mortgage loans and real estate owned are valued using Level 3 measurements. These Level 3 inputs are reviewed for reasonableness by management and evaluated on a quarterly basis. The commercial mortgage loan measurements include valuation of the market value of the asset using general underwriting procedures and appraisals. Real estate owned is initially recorded at estimated net realizable value, which includes an estimate for disposal costs. These amounts may be adjusted in a subsequent period as independent appraisals are received.
The following table sets forth the assets measured at fair value on a nonrecurring basis during 2011 that the Company continued to hold:
| | | | | | | | | | | | | | | | |
| | | December 31, 2011 | |
| (In millions) | | Total | | | Level 1 | | | Level 2 | | | Level 3 | |
Commercial mortgage loans | | $ | 49.2 | | | $ | — | | | $ | — | | | $ | 49.2 | |
Real estate owned | | | 50.1 | | | | — | | | | — | | | | 50.1 | |
Total assets measured at fair value on a nonrecurring basis | | $ | 99.3 | | | $ | — | | | $ | — | | | $ | 99.3 | |
Commercial mortgage loans measured on a nonrecurring basis with a carrying amount of $75.8 million were written down to their fair value of $49.2 million, less selling costs, at December 31, 2011. The specific commercial mortgage loan loss allowance related to these commercial mortgage loans was $26.6 million at December 31, 2011. The real estate owned measured on a nonrecurring basis during 2011 and still held at December 31, 2011 had capital losses totaling $3.5 million for the year. See “Note 10—Investments—Commercial Mortgage Loans” for further disclosures regarding the commercial mortgage loan loss allowance.
The following table sets forth the assets measured at fair value on a nonrecurring basis during 2010 that the Company continued to hold:
| | | | | | | | | | | | | | | | |
| | | December 31, 2010 | |
| (In millions) | | Total | | | Level 1 | | | Level 2 | | | Level 3 | |
Commercial mortgage loans | | $ | 43.9 | | | $ | — | | | $ | — | | | $ | 43.9 | |
Real estate owned | | | 108.5 | | | | — | | | | — | | | | 108.5 | |
Total assets measured at fair value on a nonrecurring basis | | $ | 152.4 | | | $ | — | | | $ | — | | | $ | 152.4 | |
| | |
| 100 | | STANCORP FINANCIAL GROUP, INC. |
Commercial mortgage loans measured on a nonrecurring basis with a carrying amount of $64.3 million were written down to their fair value of $43.9 million, less selling costs, at December 31, 2010. The specific commercial mortgage loan loss allowance related to these commercial mortgage loans was $20.4 million at December 31, 2010. The real estate owned measured on a nonrecurring basis during 2010 and still held at December 31, 2010 had capital losses totaling $22.9 million for the year. See “Note 10—Investments—Commercial Mortgage Loans” for further disclosures regarding the commercial mortgage loan loss allowance.
10. INVESTMENTS
Fixed Maturity Securities
The following tables set forth amortized costs, gross unrealized gains and losses and fair values of the Company’s fixed maturity securities:
| | | | | | | | | | | | | | | | |
| | | December 31, 2011 | |
| (In millions) | | Amortized
Cost | | | Unrealized
Gains | | | Unrealized
Losses | | | Fair Value | |
U.S. government and agency bonds | | $ | 387.8 | | | $ | 64.3 | | | $ | — | | | $ | 452.1 | |
U.S. state and political subdivision bonds | | | 164.8 | | | | 14.0 | | | | — | | | | 178.8 | |
Foreign government bonds | | | 61.7 | | | | 10.4 | | | | — | | | | 72.1 | |
Corporate bonds | | | 5,588.4 | | | | 491.8 | | | | 20.9 | | | | 6,059.3 | |
S&P 500 Index options | | | 7.2 | | | | — | | | | — | | | | 7.2 | |
Total fixed maturity securities | | $ | 6,209.9 | | | $ | 580.5 | | | $ | 20.9 | | | $ | 6,769.5 | |
| | | | | | | | | | | | | | | | |
| | | December 31, 2010 | |
| (In millions) | | Amortized
Cost | | | Unrealized
Gains | | | Unrealized
Losses | | | Fair Value | |
U.S. government and agency bonds | | $ | 374.4 | | | $ | 41.5 | | | $ | — | | | $ | 415.9 | |
U.S. state and political subdivision bonds | | | 203.3 | | | | 8.0 | | | | 2.2 | | | | 209.1 | |
Foreign government bonds | | | 63.2 | | | | 6.5 | | | | 0.1 | | | | 69.6 | |
Corporate bonds | | | 5,368.8 | | | | 359.8 | | | | 17.4 | | | | 5,711.2 | |
S&P 500 Index options | | | 13.3 | | | | — | | | | — | | | | 13.3 | |
Total fixed maturity securities | | $ | 6,023.0 | | | $ | 415.8 | | | $ | 19.7 | | | $ | 6,419.1 | |
The following table sets forth the amortized costs and fair values of the Company’s fixed maturity securities by contractual maturity:
| | | | | | | | | | | | | | | | | | |
| | | December 31, 2011 | | | | | December 31, 2010 | |
| (In millions) | | Amortized
Cost | | | Fair Value | | | | | Amortized
Cost | | | Fair Value | |
Due in one year or less | | $ | 632.7 | | | $ | 645.0 | | | | | $ | 591.0 | | | $ | 600.9 | |
Due after one year through five years | | | 2,534.6 | | | | 2,693.6 | | | | | | 2,563.9 | | | | 2,735.0 | |
Due after five years through ten years | | | 2,173.9 | | | | 2,392.5 | | | | | | 1,926.3 | | | | 2,078.5 | |
Due after ten years | | | 868.7 | | | | 1,038.4 | | | | | | 941.8 | | | | 1,004.7 | |
| | | | | |
Total fixed maturity securities | | $ | 6,209.9 | | | $ | 6,769.5 | | | | | $ | 6,023.0 | | | $ | 6,419.1 | |
Actual maturities may differ from contractual maturities because borrowers may have the right to call or prepay obligations. Callable bonds without make-whole provisions represented 6.4%, or $430.3 million, of the Company’s fixed maturity securities portfolio at December 31, 2011. At December 31, 2011, the Company did not have any direct exposure to sub-prime or Alt-A mortgages in its fixed maturity securities portfolio. At December 31, 2011, the Company’s foreign government bonds category did not have any direct exposure to Euro zone government issued debt.
Part II
Commercial Mortgage Loans
The Company underwrites mortgage loans on commercial property throughout the United States. In addition to real estate collateral, the Company requires either partial or full recourse on most loans. At December 31, 2011, the Company did not have any direct exposure to sub-prime or Alt-A mortgages in its commercial mortgage loan portfolio.
The following table sets forth the commercial mortgage loan portfolio by property type, by geographic region within the U.S. and by U.S. state:
| | | | | | | | | | | | | | | | | | |
| | | December 31, 2011 | | | | | December 31,
2010 | |
| (Dollars in millions) | | Amount | | | Percent | | | | | Amount | | | Percent | |
Property type: | | | | | | | | | | | | | | | | | | |
Retail | | $ | 2,457.8 | | | | 50.1 | % | | | | $ | 2,186.4 | | | | 48.4 | % |
Office | | | 911.1 | | | | 18.6 | | | | | | 855.2 | | | | 18.9 | |
Industrial | | | 900.4 | | | | 18.4 | | | | | | 829.0 | | | | 18.4 | |
Hotel/motel | | | 241.9 | | | | 4.9 | | | | | | 301.8 | | | | 6.7 | |
Commercial | | | 187.1 | | | | 3.8 | | | | | | 179.5 | | | | 4.0 | |
Apartment and other | | | 204.0 | | | | 4.2 | | | | | | 161.7 | | | | 3.6 | |
| | | | | | | | | | | | | | | | | | | |
Total commercial mortgage loans | | $ | 4,902.3 | | | | 100.0 | % | | | | $ | 4,513.6 | | | | 100.0 | % |
| | | | | | | | | | | | | | | | | | | |
Geographic region: | | | | | | | | | | | | | | | | | | |
Pacific | | $ | 1,699.3 | | | | 34.7 | % | | | | $ | 1,558.5 | | | | 34.5 | % |
South Atlantic | | | 953.8 | | | | 19.5 | | | | | | 838.9 | | | | 18.6 | |
West South Central | | | 605.3 | | | | 12.3 | | | | | | 547.2 | | | | 12.1 | |
Mountain | | | 585.8 | | | | 11.9 | | | | | | 541.1 | | | | 12.0 | |
East North Central | | | 393.4 | | | | 8.0 | | | | | | 350.4 | | | | 7.8 | |
Middle Atlantic | | | 243.8 | | | | 5.0 | | | | | | 257.1 | | | | 5.7 | |
West North Central | | | 184.8 | | | | 3.8 | | | | | | 165.5 | | | | 3.7 | |
East South Central | | | 129.9 | | | | 2.6 | | | | | | 129.0 | | | | 2.8 | |
New England | | | 106.2 | | | | 2.2 | | | | | | 125.9 | | | | 2.8 | |
| | | | | | | | | | | | | | | | | | | |
Total commercial mortgage loans | | $ | 4,902.3 | | | | 100.0 | % | | | | $ | 4,513.6 | | | | 100.0 | % |
| | | | | | | | | | | | | | | | | | | |
U.S. state: | | | | | | | | | | | | | | | | | | |
California | | $ | 1,332.0 | | | | 27.2 | % | | | | $ | 1,236.1 | | | | 27.4 | % |
Texas | | | 550.8 | | | | 11.2 | | | | | | 495.8 | | | | 11.0 | |
Florida | | | 305.3 | | | | 6.2 | | | | | | 240.2 | | | | 5.3 | |
Georgia | | | 270.1 | | | | 5.5 | | | | | | 268.3 | | | | 5.9 | |
Other states | | | 2,444.1 | | | | 49.9 | | | | | | 2,273.2 | | | | 50.4 | |
| | | | | | | | | | | | | | | | | | | |
Total commercial mortgage loans | | $ | 4,902.3 | | | | 100.0 | % | | | | $ | 4,513.6 | | | | 100.0 | % |
Through its concentration of commercial mortgage loans in California, the Company is exposed to potential losses from an economic downturn in California as well as certain catastrophes, such as earthquakes and fires that may affect certain areas of the western region. Borrowers are required to maintain fire insurance coverage to provide reimbursement for any losses due to fire. Management diversifies the commercial mortgage loan portfolio within California by both location and type of property in an effort to reduce certain catastrophe and economic exposure. However, diversification may not always eliminate the risk of such losses. Historically, the delinquency rate of the California-based commercial mortgage loans has been substantially below the industry average and consistent with the Company’s experience in other states. The Company does not require earthquake insurance for the properties when it underwrites new loans. However, management does consider the potential for earthquake loss based upon seismic surveys and structural information specific to each property. The Company does not expect a catastrophe or earthquake damage in the western region to have a material adverse effect on its business, financial position, results of operations or cash flows. Currently, the Company’s California exposure is primarily in Los Angeles County, Orange County, San Diego County and the Bay Area Counties. There is a smaller concentration of commercial mortgage loans in the Inland Empire and the San Joaquin Valley where there has been greater economic decline. Due to the concentration of commercial mortgage loans in California, a continued economic decline in California could have a material effect on the Company’s business, financial position, results of operations or cash flows.
| | |
| 102 | | STANCORP FINANCIAL GROUP, INC. |
The carrying value of commercial mortgage loans represents the outstanding principal balance less a loan loss allowance for probable uncollectible amounts. The commercial mortgage loan loss allowance is estimated based on evaluating known and inherent risks in the loan portfolio and consists of a general and a specific loan loss allowance.
Impairment Evaluation
The Company continuously monitors its commercial mortgage loan portfolio for potential nonperformance by evaluating the portfolio and individual loans. See “Note 1—Summary of Significant Accounting Policies—Investment Valuations—Commercial Mortgage Loans” for the Company’s commercial mortgage loan impairment evaluation.
General Loan Loss Allowance
The general loan loss allowance is based on the Company’s analysis of factors including changes in the size and composition of the loan portfolio, debt coverage ratios, loan to value ratios, actual loan loss experience and individual loan analysis.
Specific Loan Loss Allowance
An impaired commercial mortgage loan is a loan where the Company does not expect to receive contractual principal and interested in accordance with the terms of the loan agreement. A specific allowance for losses is recorded when a loan is considered to be impaired and it is probable that all amounts due will not be collected. The Company also holds specific loan loss allowances on certain performing commercial mortgage loans that it continues to monitor and evaluate. Impaired commercial mortgage loans without specific allowances for losses are those for which the Company has determined that it remains probable that all amounts due will be collected although the timing or nature is, or is likely to be outside the original contractual terms. In addition, for impaired commercial mortgage loans, the Company evaluates the loss to dispose of the underlying collateral, any significant out of pocket expenses the loan may incur and other quantitative information management has concerning the loan. Portions of loans that are deemed uncollectible are written off against the allowance, and recoveries, if any, are credited to the allowance.
The following table sets forth changes in the commercial mortgage loan loss allowance:
| | | | | | | | |
| | | Years ended
December 31, | |
| (In millions) | | 2011 | | | 2010 | |
Commercial mortgage loan loss allowance: | | | | | | | | |
Beginning balance | | $ | 36.1 | | | $ | 19.6 | |
Provision | | | 32.7 | | | | 48.1 | |
Charge-offs, net | | | (20.7 | ) | | | (31.6 | ) |
| | | | | | | | | |
Ending balance | | $ | 48.1 | | | $ | 36.1 | |
| | | | | | | | | |
Specific loan loss allowance | | $ | 26.6 | | | $ | 20.4 | |
General loan loss allowance | | | 21.5 | | | | 15.7 | |
| | | | | | | | | |
Total commercial mortgage loan loss allowance | | $ | 48.1 | | | $ | 36.1 | |
The smaller increase in the provision for the commercial mortgage loan loss allowance in 2011 compared to 2010 was primarily due to a prior year provision related to a single borrower, which is no longer in the commercial mortgage loan portfolio. The lower charge-offs for the 2011 compared to 2010 was primarily related to the prior year acceptance of deeds in lieu of foreclosure associated with a single borrower in the second quarter of 2010, which did not recur in 2011.
The following table sets forth the recorded investment in commercial mortgage loans:
| | | | | | | | |
| | | December 31, | |
| (In millions) | | 2011 | | | 2010 | |
Commercial mortgage loans collectively evaluated for impairment | | $ | 4,845.7 | | | $ | 4,467.4 | |
Commercial mortgage loans individually evaluated for impairment | | | 104.7 | | | | 82.3 | |
Commercial mortgage loan loss allowance | | | (48.1 | ) | | | (36.1 | ) |
| | | | | | | | | |
Total commercial mortgage loans | | $ | 4,902.3 | | | $ | 4,513.6 | |
Part II
The Company assesses the credit quality of its commercial mortgage loan portfolio quarterly by reviewing the performance of its portfolio which includes evaluating its performing and nonperforming commercial mortgage loans. Nonperforming commercial mortgage loans include all commercial mortgage loans that are 60 days or more past due and commercial mortgage loans that are not 60 days past due but are not substantially performing to other original contractual terms. Nonperforming commercial mortgage loans do not include restructured commercial mortgage loans that are current with their payments and thus are considered performing. However, these restructured commercial mortgage loans may continue to be classified as impaired commercial mortgage loans for monitoring and review purposes.
The following tables set forth performing and nonperforming commercial mortgage loans by property type:
| | | | | | | | | | | | | | | | | | | | | | | | | | | | |
| | | December 31,
2011 | |
| (In millions) | | Retail | | | Office | | | Industrial | | | Hotel/
Motel | | | Commercial | | | Apartment
and Other | | | Total | |
Performing commercial mortgage loans | | $ | 2,442.3 | | | $ | 898.4 | | | $ | 895.2 | | | $ | 241.9 | | | $ | 182.0 | | | $ | 201.3 | | | $ | 4,861.1 | |
Nonperforming commercial mortgage loans | | | 15.5 | | | | 12.7 | | | | 5.2 | | | | — | | | | 5.1 | | | | 2.7 | | | | 41.2 | |
| | | | | | | | | | | | | | | | | | | | | | | | | | | | | |
Total commercial mortgage loans | | $ | 2,457.8 | | | $ | 911.1 | | | $ | 900.4 | | | $ | 241.9 | | | $ | 187.1 | | | $ | 204.0 | | | $ | 4,902.3 | |
| | | | | | | | | | | | | | | | | | | | | | | | | | | | |
| | | December 31,
2010 | |
| (In millions) | | Retail | | | Office | | | Industrial | | | Hotel/
Motel | | | Commercial | | | Apartment
and Other | | | Total | |
Performing commercial mortgage loans | | $ | 2,175.3 | | | $ | 847.8 | | | $ | 817.7 | | | $ | 301.8 | | | $ | 174.8 | | | $ | 161.2 | | | $ | 4,478.6 | |
Nonperforming commercial mortgage loans | | | 11.1 | | | | 7.4 | | | | 11.3 | | | | — | | | | 4.7 | | | | 0.5 | | | | 35.0 | |
| | | | | | | | | | | | | | | | | | | | | | | | | | | | | |
Total commercial mortgage loans | | $ | 2,186.4 | | | $ | 855.2 | | | $ | 829.0 | | | $ | 301.8 | | | $ | 179.5 | | | $ | 161.7 | | | $ | 4,513.6 | |
The following tables set forth impaired commercial mortgage loans identified in management’s specific review of probable loan losses and the related allowance:
| | | | | | | | | | | | | | | | |
| | | December 31,
2011 | |
| (In millions) | | Recorded
Investment | | | Unpaid
Principal
Balance | | | Related
Allowance | | | Amount on
Nonaccrual
Status | |
Impaired commercial mortgage loans: | | | | | | | | | | | | | | | | |
Without specific loan loss allowances: | | | | | | | | | | | | | | | | |
Retail | | $ | 8.6 | | | $ | 8.6 | | | $ | — | | | $ | 2.1 | |
Office | | | 5.8 | | | | 5.8 | | | | — | | | | 4.3 | |
Industrial | | | 5.8 | | | | 5.8 | | | | — | | | | 0.9 | |
Hotel/motel | | | 5.9 | | | | 5.9 | | | | — | | | | — | |
Apartment and other | | | 2.8 | | | | 2.8 | | | | — | | | | 1.1 | |
| | | | | | | | | | | | | | | | | |
Total impaired commercial mortgage loans without specific loan loss allowances | | | 28.9 | | | | 28.9 | | | | — | | | | 8.4 | |
| | | | | | | | | | | | | | | | | |
With specific loan loss allowances: | | | | | | | | | | | | | | | | |
Retail | | | 31.7 | | | | 31.7 | | | | 10.7 | | | | 10.2 | |
Office | | | 18.3 | | | | 18.3 | | | | 5.2 | | | | 10.1 | |
Industrial | | | 11.5 | | | | 11.5 | | | | 5.0 | | | | 7.5 | |
Commercial | | | 11.1 | | | | 11.1 | | | | 5.3 | | | | 11.1 | |
Apartment and other | | | 3.2 | | | | 3.2 | | | | 0.4 | | | | 1.9 | |
| | | | | | | | | | | | | | | | | |
Total impaired commercial mortgage loans with specific loan
loss allowances | | | 75.8 | | | | 75.8 | | | | 26.6 | | | | 40.8 | |
| | | | | | | | | | | | | | | | | |
Total impaired commercial mortgage loans | | $ | 104.7 | | | $ | 104.7 | | | $ | 26.6 | | | $ | 49.2 | |
| | |
| 104 | | STANCORP FINANCIAL GROUP, INC. |
| | | | | | | | | | | | | | | | |
| | | December 31,
2010 | |
| (In millions) | | Recorded
Investment | | | Unpaid
Principal
Balance | | | Related
Allowance | | | Amount on
Nonaccrual
Status | |
Impaired commercial mortgage loans: | | | | | | | | | | | | | | | | |
Without specific loan loss allowances: | | | | | | | | | | | | | | | | |
Retail | | $ | 6.8 | | | $ | 6.8 | | | $ | — | | | $ | 0.4 | |
Office | | | 2.3 | | | | 2.3 | | | | — | | | | 1.1 | |
Industrial | | | 3.0 | | | | 3.0 | | | | — | | | | 3.0 | |
Hotel/motel | | | 5.9 | | | | 5.9 | | | | — | | | | 5.9 | |
| | | | | | | | | | | | | | | | | |
Total impaired commercial mortgage loans without specific loan
loss allowances | | | 18.0 | | | | 18.0 | | | | — | | | | 10.4 | |
| | | | | | | | | | | | | | | | | |
With specific loan loss allowances: | | | | | | | | | | | | | | | | |
Retail | | | 34.4 | | | | 34.4 | | | | 10.4 | | | | 21.5 | |
Office | | | 11.2 | | | | 11.2 | | | | 2.5 | | | | 6.9 | |
Industrial | | | 10.8 | | | | 10.8 | | | | 4.6 | | | | 10.8 | |
Commercial | | | 7.4 | | | | 7.4 | | | | 2.8 | | | | 6.5 | |
Apartment and other | | | 0.5 | | | | 0.5 | | | | 0.1 | | | | 0.2 | |
| | | | | | | | | | | | | | | | | |
Total impaired commercial mortgage loans with specific loan
loss allowances | | | 64.3 | | | | 64.3 | | | | 20.4 | | | | 45.9 | |
| | | | | | | | | | | | | | | | | |
Total impaired commercial mortgage loans | | $ | 82.3 | | | $ | 82.3 | | | $ | 20.4 | | | $ | 56.3 | |
The increase in the impaired commercial mortgage loans at December 31, 2011 compared to December 31, 2010 was primarily due to an increase in restructured commercial mortgage loans. As of December 31, 2011 and December 31, 2010 the Company did not have any commercial mortgage loans greater than 90 days delinquent that were accruing interest. See “Note 1—Summary of Significant Accounting Policies—Investment Valuations—Commercial Mortgage Loans” for the policies regarding interest income for delinquent commercial mortgage loans.
As a result of adopting the amendments in ASU No. 2011-02,A Creditor’s Determination of Whether a Restructuring Is a Troubled Debt Restructuring, the Company reassessed all restructurings that occurred on or after January 1, 2011 for identification as troubled debt restructurings. The Company did not identify any troubled debt restructurings that were not already considered impaired and there were no troubled debt restructurings that subsequently defaulted during the period.
The following table sets forth information related to the troubled debt restructurings of financing receivables:
| | | | | | | | | | | | |
| | | Year ended December 31, 2011 | |
| (In millions) | | Number of
Loans | | | Pre-
Restructuring
Recorded
Investment | | | Post-
Restructuring
Recorded
Investment | |
Troubled debt restructurings: | | | | | | | | | | | | |
Retail | | | 6 | | | $ | 4.5 | | | $ | 4.0 | |
Office | | | 3 | | | | 2.4 | | | | 2.4 | |
Industrial | | | 4 | | | | 2.9 | | | | 3.0 | |
Apartment and other | | | 7 | | | | 2.4 | | | | 2.4 | |
| | | | | | | | | | | | | |
Total troubled debt restructurings | | | 20 | | | $ | 12.2 | | | $ | 11.8 | |
A restructuring is considered to be a troubled debt restructuring when the debtor is experiencing financial difficulties and the restructured terms constitute a concession. The Company evaluates all restructured commercial mortgage loans for indications of troubled debt restructurings and the potential losses related to these restructurings. If a loan is considered a troubled debt restructuring, the Company impairs the loan and records a specific allowance for estimated losses. In some cases, the recorded investment in the loan may increase post-restructuring.
Part II
The following table sets forth the average recorded investment in impaired commercial mortgage loans before specific allowances for losses:
| | | | | | | | | | | | |
| | | Years ended December 31, | |
| (In millions) | | 2011 | | | 2010 | | | 2009 | |
| Average recorded investment | | $ | 92.3 | | | $ | 76.4 | | | $ | 17.5 | |
The amount of interest income recognized on impaired commercial mortgage loans was $3.8 million, $2.8 million, and $0.1 million for 2011, 2010 and 2009 respectively. The cash received by the Company in payment of interest on impaired commercial mortgage loans was $3.1 million, $3.3 million and $0.1 million for 2011, 2010 and 2009, respectively. See “Note 1—Summary of Significant Accounting Policies—Investment Valuations—Commercial Mortgage Loans” for policies regarding interest income for delinquent commercial mortgage loans.
The following tables set forth the aging of commercial mortgage loans by property type:
| | | | | | | | | | | | | | | | | | | | | | | | | | | | |
| | | December 31, 2011 | |
| (In millions) | | 30 Days Past
Due | | | 60 Days Past
Due | | | Greater
Than 90
Days Past
Due | | | Total Past
Due | | | Allowance
Related
to Past Due | | | Current | | | Total
Commercial
Mortgage
Loans | |
Commercial mortgage loans: | | | | | | | | | | | | | | | | | | | | | | | | | | | | |
Retail | | $ | 3.1 | | | $ | 7.1 | | | $ | 3.0 | | | $ | 13.2 | | | $ | (1.3 | ) | | $ | 2,445.9 | | | $ | 2,457.8 | |
Office | | | 0.8 | | | | 1.5 | | | | 1.6 | | | | 3.9 | | | | (0.4 | ) | | | 907.6 | | | | 911.1 | |
Industrial | | | 1.4 | | | | 0.4 | | | | 2.3 | | | | 4.1 | | | | (0.7 | ) | | | 897.0 | | | | 900.4 | |
Hotel/motel | | | — | | | | — | | | | — | | | | — | | | | — | | | | 241.9 | | | | 241.9 | |
Commercial | | | — | | | | — | | | | 1.2 | | | | 1.2 | | | | (0.8 | ) | | | 186.7 | | | | 187.1 | |
Apartment and other | | | 0.2 | | | | — | | | | — | | | | 0.2 | | | | — | | | | 203.8 | | | | 204.0 | |
| | | | | | | | | | | | | | | | | | | | | | | | | | | | | |
Total commercial mortgage loans | | $ | 5.5 | | | $ | 9.0 | | | $ | 8.1 | | | $ | 22.6 | | | $ | (3.2 | ) | | $ | 4,882.9 | | | $ | 4,902.3 | |
| | | | | | | | | | | | | | | | | | | | | | | | | | | | |
| | | December 31,
2010 | |
| (In millions) | | 30 Days Past
Due | | | 60 Days Past
Due | | | Greater
Than 90
Days Past
Due | | | Total Past
Due | | | Allowance
Related
to Past Due | | | Current | | | Total
Commercial
Mortgage
Loans | |
Commercial mortgage loans: | | | | | | | | | | | | | | | | | | | | | | | | | | | | |
Retail | | $ | 7.2 | | | $ | — | | | $ | 5.5 | | | $ | 12.7 | | | $ | (1.9 | ) | | $ | 2,175.6 | | | $ | 2,186.4 | |
Office | | | 5.0 | | | | 1.5 | | | | 3.2 | | | | 9.7 | | | | (1.0 | ) | | | 846.5 | | | | 855.2 | |
Industrial | | | 4.8 | | | | 2.1 | | | | 5.5 | | | | 12.4 | | | | (0.9 | ) | | | 817.5 | | | | 829.0 | |
Hotel/motel | | | — | | | | — | | | | — | | | | — | | | | — | | | | 301.8 | | | | 301.8 | |
Commercial | | | — | | | | — | | | | 1.2 | | | | 1.2 | | | | (0.6 | ) | | | 178.9 | | | | 179.5 | |
Apartment and other | | | 0.9 | | | | 0.4 | | | | 0.2 | | | | 1.5 | | | | (0.1 | ) | | | 160.3 | | | | 161.7 | |
| | | | | | | | | | | | | | | | | | | | | | | | | | | | | |
Total commercial mortgage loans | | $ | 17.9 | | | $ | 4.0 | | | $ | 15.6 | | | $ | 37.5 | | | $ | (4.5 | ) | | $ | 4,480.6 | | | $ | 4,513.6 | |
The Company closely monitors all past due commercial mortgage loans; additional attention is given to those loans at least 60 days past due. Commercial mortgage loans that were at least 60 days past due totaled $17.1 million and $19.6 million at December 31, 2011 and 2010, respectively. The Company’s current level of past due commercial mortgage loans is higher than its historical levels due to the current macroeconomic challenges. Overall, loans that were at least 60 days past due were 0.34% of the commercial mortgage loan portfolio at December 31, 2011, compared to 0.43% at December 31, 2010.
| | |
| 106 | | STANCORP FINANCIAL GROUP, INC. |
Gross Unrealized Losses
The following tables set forth the gross unrealized losses and fair value of investments, aggregated by investment category and length of time that individual securities have been in a continuous unrealized loss position:
| | | | | | | | | | | | | | | | | | | | | | | | | | | | |
| | | December 31,
2011 | |
| | | Total | | | | | Less than 12 months | | | | | 12 or more months | |
| (Dollars in millions) | | Number | | | Amount | | | | | Number | | | Amount | | | | | Number | | | Amount | |
Unrealized losses: | | | | | | | | | | | | | | | | | | | | | | | | | | | | |
Corporate bonds | | | 360 | | | $ | 20.9 | | | | | | 334 | | | $ | 17.4 | | | | | | 26 | | | $ | 3.5 | |
| | | | | | | | | | | | | | | | | | | | | | | | | | | | | |
Total | | | 360 | | | $ | 20.9 | | | | | | 334 | | | $ | 17.4 | | | | | | 26 | | | $ | 3.5 | |
| | | | | | | | | | | | | | | | | | | | | | | | | | | | | |
Fair market value of securities with unrealized losses: | | | | | | | | | | | | | | | | | | | | | | | | | | | | |
Corporate bonds | | | 360 | | | $ | 425.3 | | | | | | 334 | | | $ | 398.0 | | | | | | 26 | | | $ | 27.3 | |
| | | | | | | | | | | | | | | | | | | | | | | | | | | | | |
Total | | | 360 | | | $ | 425.3 | | | | | | 334 | | | $ | 398.0 | | | | | | 26 | | | $ | 27.3 | |
| | | | | | | | | | | | | | | | | | | | | | | | | | | | |
| | | December 31,
2010 | |
| | | Total | | | | | Less than 12 months | | | | | 12 or more months | |
| (Dollars in millions) | | Number | | | Amount | | | | | Number | | | Amount | | | | | Number | | | Amount | |
Unrealized losses: | | | | | | | | | | | | | | | | | | | | | | | | | | | | |
U.S. state and political subdivision bonds | | | 37 | | | $ | 2.2 | | | | | | 33 | | | $ | 2.0 | | | | | | 4 | | | $ | 0.2 | |
Foreign government bonds | | | 2 | | | | 0.1 | | | | | | 2 | | | | 0.1 | | | | | | — | | | | — | |
Corporate bonds | | | 433 | | | | 17.4 | | | | | | 347 | | | | 14.9 | | | | | | 86 | | | | 2.5 | |
| | | | | | | | | | | | | | | | | | | | | | | | | | | | | |
Total | | | 472 | | | $ | 19.7 | | | | | | 382 | | | $ | 17.0 | | | | | | 90 | | | $ | 2.7 | |
| | | | | | | | | | | | | | | | | | | | | | | | | | | | | |
Fair market value of securities with unrealized losses: | | | | | | | | | | | | | | | | | | | | | | | | | | | | |
U.S. state and political subdivision bonds | | | 37 | | | $ | 51.7 | | | | | | 33 | | | $ | 46.7 | | | | | | 4 | | | $ | 5.0 | |
Foreign government bonds | | | 2 | | | | 1.9 | | | | | | 2 | | | | 1.9 | | | | | | — | | | | — | |
Corporate bonds | | | 433 | | | | 487.5 | | | | | | 347 | | | | 448.9 | | | | | | 86 | | | | 38.6 | |
| | | | | | | | | | | | | | | | | | | | | | | | | | | | | |
Total | | | 472 | | | $ | 541.1 | | | | | | 382 | | | $ | 497.5 | | | | | | 90 | | | $ | 43.6 | |
The unrealized losses on the investment securities set forth above were primarily due to increases in market interest rates subsequent to their purchase by the Company. Additionally, unrealized losses have been affected by overall economic factors. The Company expects the fair value of these investment securities to recover as the investment securities approach their maturity dates or sooner if market yields for such investment securities decline. The Company does not believe that any of the investment securities are impaired due to reasons of credit quality or to any company or industry specific event. Based on management’s evaluation of the securities and the Company’s intent to hold the securities, and as it is unlikely that the Company will be required to sell the securities, none of the unrealized losses summarized in this table are considered other-than-temporary. See “Note 1—Summary of Significant Accounting Policies—Investment Valuations—Fixed Maturity Securities” for a discussion regarding fixed maturity securities’ OTTI and cumulative effect adjustment.
Part II
Net Investment Income
The following table sets forth net investment income summarized by investment type:
| | | | | | | | | | | | |
| | | Years ended December 31, | |
| (In millions) | | 2011 | | | 2010 | | | 2009 | |
Fixed maturity securities: | | | | | | | | | | | | |
Bonds | | $ | 323.6 | | | $ | 322.8 | | | $ | 314.1 | |
S&P 500 Index options | | | (0.2 | ) | | | 8.4 | | | | 4.7 | |
| | | | | | | | | | | | | |
Total fixed maturity securities | | | 323.4 | | | | 331.2 | | | | 318.8 | |
Commercial mortgage loans | | | 310.2 | | | | 285.0 | | | | 274.3 | |
Real estate | | | (0.4 | ) | | | 2.5 | | | | 5.8 | |
Other | | | 1.4 | | | | 4.3 | | | | 6.4 | |
| | | | | | | | | | | | | |
Gross investment income | | | 634.6 | | | | 623.0 | | | | 605.3 | |
Investment expenses | | | (21.8 | ) | | | (20.5 | ) | | | (18.8 | ) |
| | | | | | | | | | | | | |
Net investment income | | $ | 612.8 | | | $ | 602.5 | | | $ | 586.5 | |
Realized Gross Capital Gains and Losses
The following table sets forth gross capital gains and losses by investment type:
| | | | | | | | | | | | |
| | | Years ended
December 31, | |
| (In millions) | | 2011 | | | 2010 | | | 2009 | |
Gains: | | | | | | | | | | | | |
Fixed maturity securities | | $ | 11.5 | | | $ | 18.0 | | | $ | 29.6 | |
Commercial mortgage loans | | | 0.9 | | | | 1.2 | | | | 1.1 | |
Real estate investments | | | 35.2 | | | | 9.6 | | | | — | |
Real estate owned | | | 1.1 | | | | 0.5 | | | | — | |
| | | | | | | | | | | | | |
Gross capital gains | | | 48.7 | | | | 29.3 | | | | 30.7 | |
| | | | | | | | | | | | | |
Losses: | | | | | | | | | | | | |
Fixed maturity securities | | | (2.4 | ) | | | (2.6 | ) | | | (35.0 | ) |
Provision for commercial mortgage loan losses | | | (32.7 | ) | | | (48.1 | ) | | | (21.4 | ) |
Real estate investments | | | (0.5 | ) | | | — | | | | (0.4 | ) |
Real estate owned | | | (17.6 | ) | | | (23.4 | ) | | | — | |
Other | | | (2.4 | ) | | | (6.8 | ) | | | (0.8 | ) |
| | | | | | | | | | | | | |
Gross capital losses | | | (55.6 | ) | | | (80.9 | ) | | | (57.6 | ) |
| | | | | | | | | | | | | |
Net capital losses | | $ | (6.9 | ) | | $ | (51.6 | ) | | $ | (26.9 | ) |
Securities Deposited as Collateral
Securities deposited for the benefit of policyholders in various states, in accordance with state regulations, amounted to $6.7 million and $6.6 million at December 31, 2011 and 2010, respectively.
11. DERIVATIVE FINANCIAL INSTRUMENTS
The Company sells indexed annuities, which permit the holder to elect a fixed interest rate return or an indexed return, where interest credited to the contracts is based on the performance of the S&P 500 Index, subject to an upper limit or cap and minimum guarantees. Policyholders may elect to rebalance between interest crediting options at renewal dates annually. At each renewal date, the Company has the opportunity to re-price the indexed component by changing the cap, subject to minimum guarantees. The Company estimates the fair value of the index-based interest guarantees for the current period and for all future reset periods until contract maturity. Changes in the fair value of the index-based interest guarantees are recorded as interest credited. The liability represents an estimate of the cost of the options to be purchased in the future to manage the risk related to the index-based interest guarantees. The liability for indexed based interest guarantees is the present value of future cash flows attributable to the projected index growth that are in excess of cash
| | |
| 108 | | STANCORP FINANCIAL GROUP, INC. |
flows attributable to fixed interest rates guarantees. The excess cash flows are discounted back to the date of the balance sheet using current market indicators for future interest rates and option costs. Cash flows depend on actuarial estimates for policyholder lapse behavior and management’s discretion in setting renewal index-based interest guarantees.
The Company purchases S&P 500 Index options for its interest crediting strategy used in its indexed annuity product. The S&P 500 Index options are purchased from investment banks and are selected in a manner that supports the amount of interest that is expected to be credited in the current year to annuity policyholder accounts that are dependent on the performance of the S&P 500 Index. The purchase of S&P 500 Index options is a pivotal part of the Company’s risk management strategy for indexed annuity products. The S&P 500 Index options are exclusively used for risk management. While valuations of the S&P 500 Index options are sensitive to a number of variables, valuations for S&P 500 Index options purchased are most sensitive to changes in the S&P 500 Index value and the implied volatilities of this index. The Company generally purchases fewer than five S&P 500 Index option contract per month, which all have an expiry date of one year from the date of purchase.
The notional amount of the Company’s S&P 500 Index options at December 31, 2011 and 2010 was $303.1 million and $303.8 million, respectively. Option premiums paid for the Company’s S&P 500 Index option contracts were $9.6 million and $9.1 million for 2011 and 2010, respectively. The Company received $15.5 million and $12.8 million for options exercised in 2011 and 2010, respectively.
The Company recognizes all derivative investments as assets or liabilities in the balance sheet at fair value. The Company does not designate its derivatives as hedging instruments and thus does not use hedge accounting. As such, any change in the fair value of the derivative assets and derivative liabilities is recognized as income or loss in the period of change. See “Note 9—Fair Value” for additional information regarding the fair value of the Company’s derivative assets and liabilities.
The following table sets forth the fair value of the Company’s derivative assets and liabilities:
| | | | | | | | |
| Derivatives Not Designated as Hedging Instruments | | December 31, | |
| (In millions) | | 2011 | | | 2010 | |
Assets: | | | | | | | | |
Fixed maturity securities: | | | | | | | | |
S&P 500 Index options | | $ | 7.2 | | | $ | 13.3 | |
Liabilities: | | | | | | | | |
Other policyholder funds: | | | | | | | | |
Index-based interest guarantees | | $ | 49.5 | | | $ | 48.5 | |
The following table sets forth the amount of gain or loss recognized in earnings from the change in fair value of the Company’s derivative assets and liabilities:
| | | | | | | | | | | | |
| Derivatives Not Designated as Hedging Instruments | | Years ended December 31, | |
| (In millions) | | 2011 | | | 2010 | | | 2009 | |
Net investment income: | | | | | | | | | | | | |
S&P 500 Index options | | $ | (0.2 | ) | | $ | 8.4 | | | $ | 4.7 | |
Interest credited: | | | | | | | | | | | | |
Index-based interest guarantees | | | (1.3 | ) | | | (5.8 | ) | | | 0.4 | |
| | | | | | | | | | | | | |
Net (loss) gain | | $ | (1.5 | ) | | $ | 2.6 | | | $ | 5.1 | |
Fluctuations in the fair value of the S&P 500 Index options related to the volatility of the S&P 500 Index decreased net investment income for 2011 and increased net investment income for 2010 and 2009. Fluctuations in the fair value of the index-based interest guarantees related to the volatility of the S&P 500 Index and the Company’s annual update of the key assumptions used to value the index-based interest guarantees, a process known as “unlocking,” increased interest credited for 2011 and 2010 and decreased interest credited for 2009. The combined changes in the fair value of the S&P Index options and the index-based interest guarantees resulted in a net loss for 2011 and net gains for 2010 and 2009.
Part II
The Company does not bear derivative-related risk that would require it to post collateral with another institution, and its index option contracts do not contain counterparty credit-risk-related contingent features. The Company is exposed to the credit worthiness of the institutions from which it purchases its S&P 500 Index options and these institutions’ continued abilities to perform according to the terms of the contracts. The current values for the credit exposure have been affected by fluctuations in the S&P 500 Index. The Company’s maximum credit exposure would require an increase of approximately 13.2% in the value of the S&P 500 Index. The maximum credit risk is calculated using the cap strike price within the Company’s index option contracts less the floor price, multiplied by the notional amount of the contracts.
The following table sets forth the fair value of the Company’s derivative assets and its maximum credit risk exposure related to its derivatives:
| | | | | | | | |
| | | December 31, 2011 | |
| (In millions) | | Assets at Fair
Value | | | Maximum
Credit Risk | |
Counterparty: | | | | | | | | |
Merrill Lynch International | | $ | 2.5 | | | $ | 8.0 | |
The Bank of New York Mellon | | | 4.1 | | | | 10.3 | |
Goldman Sachs | | | 0.6 | | | | 1.4 | |
| | | | | | | | | |
Total | | $ | 7.2 | | | $ | 19.7 | |
12. DAC, VOBA AND OTHER INTANGIBLE ASSETS
DAC, VOBA and other acquisition related intangible assets are generally originated through the issuance of new business or the purchase of existing business, either by purchasing blocks of insurance policies from other insurers or by the outright purchase of other companies. The Company’s other intangible assets consist of certain customer lists from Asset Management business acquired and an individual disability marketing agreement. See “Note 1—Summary of Significant Accounting Policies—DAC, VOBA and Other Intangible Assets” for additional information.
In October 2010, the FASB issued ASU No. 2010-26,Accounting for Costs Associated with Acquiring or Renewing Insurance Contracts. ASU No. 2010-26 amends the codification guidance for insurance entities to eliminate the diversity of accounting treatment related to deferred acquisition costs. The Company estimates implementing this ASU will increase pretax expenses approximately $3 to $4 million annually with a cumulative effect adjustment of approximately $20 to $25 million in the initial year of adoption. The Company will adopt this guidance on a retrospective basis in the first quarter of 2012. See “Note 1—Summary of Significant Accounting Policies—Accounting Pronouncements.”
| | |
| 110 | | STANCORP FINANCIAL GROUP, INC. |
The following table sets forth activity for DAC, VOBA and other intangible assets:
| | | | | | | | | | | | |
| | | Years ended December 31, | |
| (In millions) | | 2011 | | | 2010 | | | 2009 | |
Carrying value at beginning of period: | | | | | | | | | | | | |
DAC | | $ | 277.0 | | | $ | 252.6 | | | $ | 249.2 | |
VOBA | | | 28.4 | | | | 30.4 | | | | 31.1 | |
Other intangible assets | | | 51.7 | | | | 55.8 | | | | 54.2 | |
| | | | | | | | | | | | | |
Total balance at beginning of period | | | 357.1 | | | | 338.8 | | | | 334.5 | |
| | | | | | | | | | | | | |
Deferred or acquired: | | | | | | | | | | | | |
DAC | | | 98.8 | | | | 92.9 | | | | 93.9 | |
Other intangible assets | | | — | | | | 1.7 | | | | 6.3 | |
| | | | | | | | | | | | | |
Total deferred or acquired | | | 98.8 | | | | 94.6 | | | | 100.2 | |
| | | | | | | | | | | | | |
Amortized during period: | | | | | | | | | | | | |
DAC | | | (70.8 | ) | | | (68.5 | ) | | | (90.5 | ) |
VOBA | | | (2.0 | ) | | | (2.0 | ) | | | (0.7 | ) |
Other intangible assets | | | (7.6 | ) | | | (5.8 | ) | | | (4.7 | ) |
| | | | | | | | | | | | | |
Total amortized during period | | | (80.4 | ) | | | (76.3 | ) | | | (95.9 | ) |
| | | | | | | | | | | | | |
Carrying value at end of period, net: | | | | | | | | | | | | |
DAC | | | 305.0 | | | | 277.0 | | | | 252.6 | |
VOBA | | | 26.4 | | | | 28.4 | | | | 30.4 | |
Other intangible assets | | | 44.1 | | | | 51.7 | | | | 55.8 | |
| | | | | | | | | | | | | |
Total carrying value at end of period | | $ | 375.5 | | | $ | 357.1 | | | $ | 338.8 | |
The following table sets forth the amount of DAC and VOBA balances amortized in proportion to expected gross profits and the percentage of the total balance of DAC and VOBA amortized in proportion to expected gross profits:
| | | | | | | | | | | | | | | | |
| | | December 31, 2011 | | | December 31, 2010 | |
| (Dollars in millions) | | Amount | | | Percent | | | Amount | | | Percent | |
DAC | | $ | 67.6 | | | | 22.2 | % | | $ | 63.6 | | | | 23.0 | % |
| VOBA | | | 7.1 | | | | 26.9 | | | | 7.5 | | | | 26.4 | |
The value of DAC and VOBA is dependent on key assumptions. See “Note 1—Summary of Significant Accounting Policies—DAC, VOBA and Other Intangible Assets” for a discussion of the key assumptions used to determine the values of DAC and VOBA. Because actual results and trends related to these assumptions vary from those assumed, the Company revises these assumptions annually to reflect its current best estimate of expected gross profits. As a result of this process, known as “unlocking,” the cumulative balances of DAC and VOBA are adjusted with an offsetting benefit or charge to income to reflect changes in the period of the revision. An unlocking event that results in an after-tax benefit generally occurs as a result of actual experience or future expectations being favorable compared to previous estimates. An unlocking event that results in an after-tax charge generally occurs as a result of actual experience or future expectations being unfavorable compared to previous estimates. As a result of unlocking, the amortization schedule for future periods is also adjusted.
The following table sets forth the impact of unlocking on DAC and VOBA balances:
| | | | | | | | |
| | | Years ended
December 31, | |
| (In millions) | | 2011 | | | 2010 | |
| Decrease to DAC and VOBA | | $ | (0.9 | ) | | $ | (0.5 | ) |
Part II
Significant, unanticipated changes in key assumptions, which affect the determination of expected gross profits, may result in a large unlocking event that could have a material effect on the Company’s financial position or results of operations. However, future changes in DAC and VOBA balances due to changes in underlying assumptions are not expected to be material.
The accumulated amortization of VOBA was $62.4 million and $60.4 million at December 31, 2011 and 2010, respectively. The accumulated amortization of other intangible assets was $30.6 million and $23.0 million at December 31, 2011 and 2010, respectively. See “Note 1—Summary of Significant Accounting Policies—DAC, VOBA and Other Intangible Assets” for a discussion on the amortization policies for VOBA and other intangible assets.
The following table sets forth the estimated net amortization of VOBA and other intangible assets for each of the next five years:
| | | | |
| (In millions) | | Amount | |
2012 | | $ | 9.2 | |
2013 | | | 8.3 | |
2014 | | | 8.2 | |
2015 | | | 8.3 | |
| 2016 | | | 6.2 | |
13. LIABILITY FOR UNPAID CLAIMS, CLAIM ADJUSTMENT EXPENSES AND OTHER POLICYHOLDER FUNDS
The liability for unpaid claims, claim adjustment expenses and other policyholder funds includes liabilities for insurance offered on products such as group long term and short term disability, individual disability, group dental and group vision, and group AD&D. The liability for unpaid claims and claim adjustment expenses is established when a claim is incurred or is estimated to have been incurred but not yet reported to the Company and, as prescribed by GAAP, equals the Company’s best estimate of the present value of the liability of future unpaid claims and claim adjustment expenses. This liability is included in future policy benefits and claims in the consolidated balance sheets.
The following table sets forth the change in the liability for unpaid claims and claim adjustment expenses:
| | | | | | | | | | | | |
| | | Years ended December 31, | |
| (In millions) | | 2011 | | | 2010 | | | 2009 | |
Net balance at beginning of the year: | | | | | | | | | | | | |
Balance at beginning of the year, gross of reinsurance | | $ | 3,716.3 | | | $ | 3,651.3 | | | $ | 3,609.7 | |
Less: reinsurance recoverable | | | (110.5 | ) | | | (106.9 | ) | | | (114.9 | ) |
| | | | | | | | | | | | | |
Net balance at beginning of the year | | | 3,605.8 | | | | 3,544.4 | | | | 3,494.8 | |
| | | | | | | | | | | | | |
Incurred related to: | | | | | | | | | | | | |
Current year | | | 1,077.1 | | | | 1,010.3 | | | | 1,020.5 | |
Prior year’s interest | | | 175.9 | | | | 176.1 | | | | 174.8 | |
Prior years | | | (46.5 | ) | | | (116.3 | ) | | | (151.2 | ) |
| | | | | | | | | | | | | |
Total incurred | | | 1,206.5 | | | | 1,070.1 | | | | 1,044.1 | |
| | | | | | | | | | | | | |
Paid related to: | | | | | | | | | | | | |
Current year | | | (347.1 | ) | | | (323.3 | ) | | | (315.6 | ) |
Prior year | | | (725.5 | ) | | | (685.4 | ) | | | (678.9 | ) |
| | | | | | | | | | | | | |
Total paid | | | (1,072.6 | ) | | | (1,008.7 | ) | | | (994.5 | ) |
| | | | | | | | | | | | | |
Net balance at end of the year | | | 3,739.7 | | | | 3,605.8 | | | | 3,544.4 | |
Plus: reinsurance recoverable | | | 117.3 | | | | 110.5 | | | | 106.9 | |
| | | | | | | | | | | | | |
Balance at end of the year, gross of reinsurance | | $ | 3,857.0 | | | $ | 3,716.3 | | | $ | 3,651.3 | |
Classified as future policy benefits and claims, but excluded from the table above are amounts recorded for group and individual life reserves, group and individual annuity reserves, and individual disability active life reserves.
| | |
| 112 | | STANCORP FINANCIAL GROUP, INC. |
The following table sets forth the reconciliation of amounts above to future policy benefits and claims as presented on the consolidated balance sheets:
| | | | | | | | | | | | |
| | | Years ended December 31, | |
| (In millions) | | 2011 | | | 2010 | | | 2009 | |
Future policy benefits and claims | | $ | 5,683.6 | | | $ | 5,502.3 | | | $ | 5,368.7 | |
Less: Group life reserves | | | (765.4 | ) | | | (750.5 | ) | | | (735.7 | ) |
Less: Individual life reserves | | | (597.2 | ) | | | (595.8 | ) | | | (589.3 | ) |
Less: Group and individual annuity reserves | | | (244.2 | ) | | | (235.0 | ) | | | (201.5 | ) |
Less: Individual disability active life reserves | | | (219.8 | ) | | | (204.7 | ) | | | (190.9 | ) |
| | | | | | | | | | | | | |
Liability for unpaid claims and claim adjustment expenses | | $ | 3,857.0 | | | $ | 3,716.3 | | | $ | 3,651.3 | |
The majority of the net liability balances are related to long term disability claims on which interest earned on assets backing the reserves is a key component of reserving and pricing. The year-to-year development of incurred claims related to prior years is therefore broken out into an interest portion and remaining incurred portion.
The changes in amounts incurred related to prior years are not the result of a significant change in an underlying assumption or method used to determine the estimate. Instead the Company expects these amounts to change over time as a result of the growth in the size of the Company’s in force insurance business and the actual claims experience with respect to that business during the time periods captured for claims with an incurred date in years prior to the year of valuation. Interest is also a key component in the year-to-year development of the reserves and therefore the positive changes in amounts incurred related to prior years should not be taken as an indicator of the adequacy or inadequacy of the reserves held. In each of the years captured, there was a decrease in incurred amounts associated with prior years after the effect of interest is taken into account, indicating that in spite of the increase in long term disability claims incidence in 2011, claim experience was favorable when compared to the assumptions used to establish the associated reserves. However, significant changes to assumptions regarding unpaid claims and claims adjustment expenses for prior periods in the group long term disability reserves were not made in 2011, 2010 and 2009 primarily due to the long-term nature of this product and the materiality of other factors including the potential impact of the economic uncertainty in 2011, 2010 and 2009. The Company carefully monitors trends in reserve assumptions and when these trends become credible and are expected to persist, the Company incorporates these factors into its reserves to ensure best estimates are established.
The following table sets forth the composition of other policyholder funds:
| | | | | | | | |
| | | Years ended December 31, | |
| (In millions) | | 2011 | | | 2010 | |
Employer-sponsored defined contribution and benefit plans funds | | $ | 1,619.7 | | | $ | 1,526.4 | |
Individual fixed-rate annuity funds | | | 2,248.4 | | | | 1,978.2 | |
Indexed annuity funds | | | 386.9 | | | | 395.1 | |
Other | | | 823.1 | | | | 728.1 | |
| | | | | | | | | |
Total other policyholder funds | | $ | 5,078.1 | | | $ | 4,627.8 | |
The primary components of other policyholder funds are employer-sponsored defined contribution and benefit plan funds, individual fixed-rate annuity funds and indexed annuity funds. The remaining balance is comprised primarily of premiums on deposits, advanced premiums and experience related liabilities.
14. REINSURANCE
The Company manages insurance risk through the following practices:
| | • | | Sound product design and underwriting. |
| | • | | Effective claims management. |
| | • | | Distribution expertise. |
| | • | | Broad diversification of risk by customer geography, industry, size and occupation. |
| | • | | Maintenance of a strong financial position. |
| | • | | Maintenance of reinsurance and risk pool arrangements. |
| | • | | Sufficient alignment of assets and liabilities to meet financial obligations. |
Part II
In order to limit its losses from large claim exposures, the Company enters into reinsurance agreements with other insurance companies. The Company reviews its retention limits based on size and experience. The maximum retention limit per individual for group life and AD&D is $750,000. The Company’s maximum retention limit per individual for group disability insurance is $15,000 of monthly benefit. The Company’s maximum retention limit per individual for individual disability insurance is $6,000 of monthly benefit.
Standard maintains a strategic marketing alliance with Ameritas Life Insurance Corp. (“Ameritas”) that offers Standard’s policyholders more flexible dental coverage options and access to Ameritas’ nationwide preferred provider organization panel of dentists. As part of this alliance, Standard and Ameritas entered into a reinsurance agreement. In 2011, the agreement provided for 24.2% of the net dental premiums written by Standard and the risk associated with this premium to be ceded to Ameritas.
Standard participates in a reinsurance and third-party administration arrangement with Northwestern Mutual Life Insurance Company (“Northwestern Mutual”) under which Northwestern Mutual group long term and short term disability products are sold using Northwestern Mutual’s agency distribution system. Generally, Standard assumes 60% of the risk and receives 60% of the premiums for the policies issued. If Standard were to become unable to meet its obligations, Northwestern Mutual would retain the reinsured liabilities. Therefore, in accordance with an agreement with Northwestern Mutual, Standard established a trust for the benefit of Northwestern Mutual with the market value of assets in the trust equal to Northwestern Mutual’s reinsurance receivable from Standard. The market value of assets required to be maintained in the trust at December 31, 2011, was $230.6 million. Premiums assumed by Standard for the Northwestern Mutual business accounted for approximately 3.0% of the Company’s total premiums for each of the three years 2011, 2010 and 2009. In addition to assuming risk, Standard provides product design, pricing, underwriting, legal support, claims management and other administrative services under the arrangement.
In the fourth quarter of 2011, Standard entered into a Yearly Renewable Term (“YRT”) reinsurance agreement, with Canada Life Assurance Company to cede a share of the Company’s group life insurance risk in order to reduce its losses and provide relief in the event of a catastrophe.
The Company also maintains reinsurance coverage for certain catastrophe losses related to group life and AD&D with partial coverage of nuclear, biological and chemical acts of terrorism. Through a combination of this agreement and its participation in a catastrophe reinsurance pool discussed below, the Company has coverage of up to $480.6 million per event.
The Company is part of a catastrophe reinsurance pool with other insurance companies. This pool spreads catastrophe losses from group life and AD&D over 23 participating members. The annual fee paid by the Company in 2011 to participate in the pool was less than $30,000. As a member of the pool, the Company is exposed to maximum potential losses experienced by other participating members of up to $111.0 million for a single event for losses submitted by a single company and a maximum of $277.9 million for a single event for losses submitted by multiple companies. The Company’s percentage share of losses experienced by pool members will change over time as it is a function of the Company’s group life and AD&D in force relative to the total group life and AD&D in force for all pool participants. The reinsurance pool does not exclude war or nuclear, biological and chemical acts of terrorism.
The Terrorism Risk Insurance Act of 2002 (“TRIA”), which has been extended through 2014, provides for federal government assistance to property and casualty insurers in the event of material losses due to terrorist acts on behalf of a foreign person or foreign interest. Due to the concentration of risk present in group life insurance and the fact that group life insurance is not covered under TRIA, an occurrence of a significant catastrophe or a change in the on-going nature and availability of reinsurance and catastrophe reinsurance could have a material adverse effect on the Company.
| | |
| 114 | | STANCORP FINANCIAL GROUP, INC. |
The following table sets forth reinsurance information:
| | | | | | | | | | | | | | | | | | | | |
| (Dollars in millions) | | Gross Amount | | | Ceded to
Other
Companies | | | Assumed From
Other
Companies | | | Net Amount | | | Percentage of
Amount
Assumed to Net | |
2011: | | | | | | | | | | | | | | | | | | | | |
Life insurance in force | | $ | 350,623.1 | | | $ | 55,126.0 | | | $ | 71.7 | | | $ | 295,568.8 | | | | — | % |
Premiums: | | | | | | | | | | | | | | | | | | | | |
Life insurance and annuities | | $ | 942.3 | | | $ | 52.2 | | | $ | — | | | $ | 890.1 | | | | — | |
Accident and health insurance | | | 1,241.8 | | | | 76.1 | | | | 97.5 | | | | 1,263.2 | | | | 7.7 | |
| | | | | | | | | | | | | | | | | | | | | |
Total premiums | | $ | 2,184.1 | | | $ | 128.3 | | | $ | 97.5 | | | $ | 2,153.3 | | | | 4.5 | |
| | | | | | | | | | | | | | | | | | | | | |
2010: | | | | | | | | | | | | | | | | | | | | |
Life insurance in force | | $ | 333,211.1 | | | $ | 6,301.3 | | | $ | 84.8 | | | $ | 326,994.6 | | | | — | % |
Premiums: | | | | | | | | | | | | | | | | | | | | |
Life insurance and annuities | | $ | 920.9 | | | $ | 54.1 | | | $ | 0.1 | | | $ | 866.9 | | | | — | |
Accident and health insurance | | | 1,198.4 | | | | 72.9 | | | | 105.3 | | | | 1,230.8 | | | | 8.6 | |
| | | | | | | | | | | | | | | | | | | | | |
Total premiums | | $ | 2,119.3 | | | $ | 127.0 | | | $ | 105.4 | | | $ | 2,097.7 | | | | 5.0 | |
| | | | | | | | | | | | | | | | | | | | | |
2009: | | | | | | | | | | | | | | | | | | | | |
Life insurance in force | | $ | 305,500.1 | | | $ | 6,012.6 | | | $ | 91.1 | | | $ | 299,578.6 | | | | — | % |
Premiums: | | | | | | | | | | | | | | | | | | | | |
Life insurance and annuities | | $ | 900.5 | | | $ | 56.3 | | | $ | 0.1 | | | $ | 844.3 | | | | — | |
Accident and health insurance | | | 1,196.4 | | | | 47.9 | | | | 109.1 | | | | 1,257.6 | | | | 8.7 | |
| | |
|
|
| |
|
|
| |
|
|
| |
|
|
| | | | |
Total premiums | | $ | 2,096.9 | | | $ | 104.2 | | | $ | 109.2 | | | $ | 2,101.9 | | | | 5.2 | |
Recoveries recognized under reinsurance agreements were $75.9 million, $71.9 million and $75.2 million for 2011, 2010 and 2009, respectively. Amounts recoverable from reinsurers were $949.3 million and $938.3 million at December 31, 2011 and 2010, respectively. Of these amounts, $788.1 million and $786.6 million for 2011 and 2010, respectively, were from the reinsurance transaction with Protective Life Insurance Company (“Protective Life”) effective January 1, 2001. See “Note 15—Reinsurance of Blocks of Business.”
15. REINSURANCE OF BLOCKS OF BUSINESS
Effective October 1, 2002, Standard entered into a reinsurance agreement with TIAA to assume TIAA’s group disability and group life insurance business. This business included approximately 1,800 group insurance contracts, representing 650,000 insured individuals. Standard paid a ceding commission of approximately $75 million and received approximately $705 million in assets and corresponding statutory liabilities. If Standard were to become unable to meet its obligations, TIAA would retain the reinsured liabilities. Therefore, in accordance with the agreement with TIAA, Standard established a trust for the benefit of TIAA with the market value of assets in the trust equal to TIAA’s reinsurance receivable from Standard. The market value of assets required to be maintained in the trust is determined quarterly. The market value of assets required to be maintained in the trust at December 31, 2011, was $282.8 million. Approximately $60.0 million in VOBA was recorded related to the reinsurance agreement.
Effective October 1, 2000, Standard assumed, through a reinsurance agreement, the individual disability insurance business of Minnesota Life. Standard paid a ceding commission of approximately $55 million and received approximately $500 million in assets and corresponding statutory liabilities. If Standard were to become unable to meet its obligations, Minnesota Life would retain the reinsured liabilities. Therefore, in accordance with the agreement with Minnesota Life, Standard established a trust for the benefit of Minnesota Life with the market value of assets in the trust equal to Minnesota Life’s reinsurance receivable from Standard. The market value of assets required to be maintained in the trust is determined quarterly. The market value of assets required to be maintained in the trust at December 31, 2011, was $579.6 million. Accompanying the transaction was a national marketing agreement that provides access to Minnesota Life agents, some of whom now market Standard’s individual disability insurance products. The national marketing agreement remains in effect through 2012.
Part II
Effective January 1, 2001, Standard ceded to Protective Life, through a reinsurance agreement, Standard’s individual life insurance product line. Standard received a ceding commission of approximately $90 million and transferred to Protective Life approximately $790 million in assets and corresponding statutory liabilities. If Protective Life were to become unable to meet its obligations, Standard would retain the reinsured liabilities. Therefore, the liabilities remain on Standard’s consolidated balance sheets, and an equal amount is recorded as a recoverable from the reinsurer. In accordance with the agreement, Protective Life established a trust for the benefit of Standard with assets in the trust required to be equal to Standard’s reinsurance receivable from Protective Life. The amount of assets required to be maintained in the trust is determined quarterly.
In the fourth quarter of 2011, Standard entered into a YRT reinsurance agreement, with Canada Life Assurance Company to cede a share of the Company’s group life insurance risk in order to reduce its losses and provide relief in the event of a catastrophe.
16. INSURANCE INFORMATION
The following table sets forth insurance information:
| | | | | | | | | | | | | | | | | | | | | | | | | | | | | | | | |
| (In millions) | | DAC(1) | | | Future Policy
Benefits
and Claims | | | Other
Policyholder
Funds | | | Premium
Revenues | | | Net
Investment
Income | | | Benefits,
Claims and
Interest
Credited | | | Amortization
of DAC | | | Other
Operating
Expenses(2) | |
2011: | | | | | | | | | | | | | | | | | | | | | | | | | | | | | | | | |
Insurance Services | | $ | 237.4 | | | $ | 5,439.4 | | | $ | 579.3 | | | $ | 2,145.3 | | | $ | 341.3 | | | $ | 1,755.5 | | | $ | 55.4 | | | $ | 539.9 | |
Asset Management | | | 67.6 | | | | 244.2 | | | | 4,498.8 | | | | 8.0 | | | | 262.7 | | | | 176.7 | | | | 17.1 | | | | 151.3 | |
| | | | | | | | | | | | | | | | | | | | | | | | | | | | | | | | | |
Total | | $ | 305.0 | | | $ | 5,683.6 | | | $ | 5,078.1 | | | $ | 2,153.3 | | | $ | 604.0 | | | $ | 1,932.2 | | | $ | 72.5 | | | $ | 691.2 | |
2010: | | | | | | | | | | | | | | | | | | | | | | | | | | | | | | | | |
Insurance Services | | $ | 213.5 | | | $ | 5,267.3 | | | $ | 569.2 | | | $ | 2,056.2 | | | $ | 338.9 | | | $ | 1,571.2 | | | $ | 51.2 | | | $ | 519.7 | |
Asset Management | | | 63.5 | | | | 235.0 | | | | 4,058.6 | | | | 41.5 | | | | 251.0 | | | | 207.0 | | | | 12.4 | | | | 150.2 | |
| | | | | | | | | | | | | | | | | | | | | | | | | | | | | | | | | |
Total | | $ | 277.0 | | | $ | 5,502.3 | | | $ | 4,627.8 | | | $ | 2,097.7 | | | $ | 589.9 | | | $ | 1,778.2 | | | $ | 63.6 | | | $ | 669.9 | |
2009: | | | | | | | | | | | | | | | | | | | | | | | | | | | | | | | | |
Insurance Services | | $ | 188.6 | | | $ | 5,167.2 | | | $ | 591.3 | | | $ | 2,067.2 | | | $ | 335.1 | | | $ | 1,535.0 | | | $ | 53.8 | | | $ | 519.3 | |
Asset Management | | | 64.0 | | | | 201.5 | | | | 3,745.8 | | | | 34.7 | | | | 234.0 | | | | 186.3 | | | | 16.1 | | | | 159.2 | |
| | | | | | | | | | | | | | | | | | | | | | | | | | | | | | | | | |
Total | | $ | 252.6 | | | $ | 5,368.7 | | | $ | 4,337.1 | | | $ | 2,101.9 | | | $ | 569.1 | | | $ | 1,721.3 | | | $ | 69.9 | | | $ | 678.5 | |
| | (1) | | See “Note 1—Summary of Significant Accounting Policies—DAC, VOBA and Other Intangible Assets” And “Note 12—DAC, VOBA and Other Intangible Assets.” |
| | (2) | | Other operating expenses include operating expenses, commissions and bonuses, premium taxes, interest expense and the net increase in DAC, VOBA and other intangible assets. |
17. REGULATORY MATTERS
Standard and The Standard Life Insurance Company of New York prepare their statutory financial statements in accordance with accounting practices prescribed or permitted by their states of domicile. Prescribed statutory accounting practices include state laws, regulations, and general administrative rules, as well as the Statements of Statutory Accounting Practices (“SSAP”) set forth in publications of the National Association of Insurance Commissioners (“NAIC”).
Statutory accounting practices differ in some respects from GAAP. The principal statutory practices that differ from GAAP are:
| | • | | Bonds and commercial mortgage loans are reported principally at adjusted carrying value and amortized cost, respectively. |
| | • | | Asset valuation and the interest maintenance reserves are provided as prescribed by the NAIC. |
| | • | | Certain assets designated as non-admitted, principally deferred tax assets, furniture, equipment, and unsecured receivables are not recognized as assets, resulting in a charge to statutory surplus. |
| | • | | Annuity considerations with life contingencies, or purchase rate guarantees, are recognized as revenue when received. |
| | • | | Reserves for life and disability policies and contracts are reported net of ceded reinsurance and calculated based on statutory requirements, including required discount rates. |
| | |
| 116 | | STANCORP FINANCIAL GROUP, INC. |
| | • | | Commissions, including initial commissions and expense allowance paid for reinsurance assumed, and other policy acquisition expenses are expensed as incurred. |
| | • | | Initial commissions and expense allowance received for a block of reinsurance ceded net of taxes are reported as deferred gains in surplus and recognized as income in subsequent periods. |
| | • | | Federal income tax expense includes current income taxes defined as current year estimates of federal income taxes and tax contingencies for current and all prior years and amounts incurred or received during the year relating to prior periods, to the extent not previously provided. |
| | • | | Deferred tax assets, net of deferred tax liabilities, which will be realized within three years, are considered admitted assets and are included in the regulatory financial statements. |
Standard and The Standard Life Insurance Company of New York are subject to statutory restrictions that limit the maximum amount of dividends and distributions that they could declare and pay to StanCorp without prior approval of the states in which the subsidiaries are domiciled. During 2011 and 2010, Standard made distributions to StanCorp totaling $87.8 million and $244.0 million, respectively.
State insurance departments require insurance enterprises to adhere to minimum Risk-based Capital (“RBC”) requirements promulgated by the NAIC. At December 31, 2011 and 2010, the insurance subsidiaries’ capital levels were significantly in excess of that which would require corrective action by the insurance subsidiaries or regulatory agencies. The Authorized Control Level RBC was $198.8 million and $200.0 million at December 31, 2011 and 2010, respectively.
The following table reconciles the statutory capital and surplus of the insurance subsidiaries based on statutory filings with applicable insurance regulatory authorities to the Company’s GAAP equity:
| | | | | | | | |
| | | December 31, | |
| (In millions) | | 2011 | | | 2010 | |
Statutory capital and surplus | | $ | 1,193.1 | | | $ | 1,226.8 | |
| | |
Adjustments to reconcile to GAAP equity: | | | | | | | | |
Future policy benefits and other policyholder funds | | | 285.4 | | | | 251.6 | |
DAC, VOBA and other intangible assets | | | 346.4 | | | | 321.9 | |
Deferred tax liabilities | | | (233.4 | ) | | | (211.4 | ) |
Asset valuation reserve | | | 107.2 | | | | 95.6 | |
Valuation of investments | | | 368.7 | | | | 264.7 | |
Interest maintenance reserve | | | 19.8 | | | | 12.6 | |
Equity of StanCorp and its non-insurance subsidiaries | | | (206.9 | ) | | | (150.9 | ) |
Non-admitted assets | | | 266.6 | | | | 216.6 | |
Prepaid pension cost | | | (89.6 | ) | | | (40.8 | ) |
Accrued retirement and defined benefit plans | | | (35.1 | ) | | | (46.9 | ) |
Capital lease obligations | | | (2.1 | ) | | | (3.2 | ) |
Special surplus in accordance with SSAP No. 10R | | | 8.6 | | | | (11.4 | ) |
Other, net | | | (18.2 | ) | | | (13.1 | ) |
| | | | | | | | | |
| GAAP equity | | $ | 2,010.5 | | | $ | 1,912.1 | |
Part II
The following table reconciles statutory gain from operations based on statutory filings with applicable insurance regulatory authorities to the Company’s GAAP net income:
| | | | | | | | | | | | |
| | | Years ended December 31, | |
| (In millions) | | 2011 | | | 2010 | | | 2009 | |
Statutory gain from operations | | $ | 125.8 | | | $ | 195.5 | | | $ | 224.5 | |
Adjustments to reconcile to GAAP net income: | | | | | | | | | | | | |
Future policy benefits and other policyholder funds | | | 48.0 | | | | 11.6 | | | | (2.1 | ) |
DAC and VOBA, net of amortization | | | 22.8 | | | | 26.6 | | | | 23.2 | |
Deferred income taxes | | | (43.1 | ) | | | 4.6 | | | | 13.2 | |
Current income taxes | | | 24.7 | | | | 1.3 | | | | (4.6 | ) |
Earnings of StanCorp and its non-insurance subsidiaries | | | (18.9 | ) | | | (45.3 | ) | | | (27.5 | ) |
Reinsurance ceding commission | | | (15.2 | ) | | | (16.1 | ) | | | (13.9 | ) |
Reserve increase due to change in valuation basis | | | — | | | | — | | | | (8.1 | ) |
Deferred capital gains (interest maintenance reserve) | | | 7.2 | | | | 11.6 | | | | 4.1 | |
Other, net | | | (12.0 | ) | | | (0.8 | ) | | | 0.1 | |
| | | | | | | | | | | | | |
| GAAP net income | | $ | 139.3 | | | $ | 189.0 | | | $ | 208.9 | |
18. LONG-TERM DEBT
The Company has $250 million of 6.875%, 10-year senior notes (“Senior Notes”), which mature on September 25, 2012. The principal amount of the Senior Notes is payable at maturity and interest is payable semi-annually in April and October. Given the maturity date of the Senior Notes, they have been classified as short-term debt as of December 31, 2011.
The Company has $300 million of 6.90%, junior subordinated debentures (“Subordinated Debt”), which matures on June 1, 2067, is non-callable at par for the first 10 years (prior to June 1, 2017) and is subject to a replacement capital covenant. The covenant limits replacement of the Subordinated Debt for the first 40 years to be redeemable after year 10 (on or after June 1, 2017) and only with securities that carry equity-like characteristics that are the same as or more equity-like than the Subordinated Debt. The principal amount of the Subordinated Debt is payable at final maturity. Interest is payable semi-annually in June and December for the first 10 years up to June 1, 2017, and quarterly thereafter at a floating rate equal to three-month LIBOR plus 2.51%. StanCorp has the option to defer interest payments for up to five years. The declaration and payment of dividends to shareholders would be restricted if the Company elected to defer interest payments on its Subordinated Debt. If elected, the restriction would be in place during the interest deferral period. StanCorp is currently not deferring interest on the Subordinated Debt.
The following table sets forth the Company’s long-term debt:
| | | | | | | | |
| | | December 31, | |
| (In millions) | | 2011 | | | 2010 | |
Long-term debt: | | | | | | | | |
Senior notes | | $ | — | | | $ | 250.0 | |
Subordinated debt | | | 300.0 | | | | 300.0 | |
Other long-term borrowings | | | 0.9 | | | | 1.9 | |
| | | | | | | | | |
Total long-term debt | | $ | 300.9 | | | $ | 551.9 | |
19. COMMITMENTS AND CONTINGENCIES
Litigation Contingencies
In the normal course of business, the Company is involved in various legal actions and other state and federal proceedings. A number of actions or proceedings were pending at December 31, 2011. In some instances, lawsuits include claims for punitive damages and similar types of relief in unspecified or substantial amounts, in addition to amounts for alleged contractual liability or other compensatory damages. In the opinion of management, the ultimate liability, if any, arising from the actions or proceedings is not expected to have a material effect on the Company’s business, financial position, results of operations or cash flows.
| | |
| 118 | | STANCORP FINANCIAL GROUP, INC. |
Senior Unsecured Revolving Credit Facility (“Facility”) Contingencies
The Company maintains a $200 million Facility, which will remain at $200 million through June 15, 2012 and will then decrease to $165 million until final maturity on June 15, 2013. Borrowings under the Facility will continue to be used to provide for working capital and general corporate purposes of the Company and its subsidiaries and the issuance of letters of credit.
Under the agreement, StanCorp is subject to two financial covenants that are based on the Company’s ratio of total debt to total capitalization and consolidated net worth. The Facility is subject to performance pricing based upon the Company’s ratio of total debt to total capitalization and includes interest based on a Eurodollar margin, plus facility and utilization fees. At December 31, 2011, StanCorp was in compliance with all financial covenants under the Facility and had no outstanding balance on the Facility.
Operating Lease Commitments
The Company leases certain buildings and equipment under non-cancelable operating leases that expire in various years through 2020. Most of these leases have renewal options for periods ranging from one to twelve years.
The following table sets forth future minimum payments under the leases:
| | | | |
| (In millions) | | | |
2012 | | $ | 10.4 | |
2013 | | | 7.9 | |
2014 | | | 3.6 | |
2015 | | | 2.5 | |
2016 | | | 2.2 | |
| Thereafter | | | 2.9 | |
Total rent expense was $16.4 million, $14.5 million and $23.5 million for the years ended December 31, 2011, 2010 and 2009, respectively.
The following table sets forth the minimum future rental receivables on non-cancelable leases of retail and office space with initial terms of one year or more:
| | | | |
| (In millions) | | | |
2012 | | $ | 8.3 | |
2013 | | | 7.3 | |
2014 | | | 5.7 | |
2015 | | | 5.3 | |
2016 | | | 3.4 | |
| Thereafter | | | 5.2 | |
Other Financing Obligations
The Company’s financing obligations include long-term debt and capital lease payment obligations as well as commitments to fund commercial mortgage loans.
The Company’s debt obligations consisted primarily of the $250 million 6.875% Senior Notes and the $300 million 6.90% Subordinated Debt. See “Note 18—Long-Term Debt” for additional information.
In the normal course of business, the Company commits to fund commercial mortgage loans generally up to 90 days in advance. At December 31, 2011, the Company had outstanding commitments to fund commercial mortgage loans totaling $105.0 million, with fixed interest rates ranging from 5.125% to 6.375%. These commitments generally have fixed expiration dates. A small percentage of commitments expire due to the borrower’s failure to deliver the requirements of the commitment by the expiration date. In these cases, the Company will retain the commitment fee and good faith deposit. Alternatively, if the Company terminates a commitment due to the disapproval of a commitment requirement, the commitment fee and good faith deposit may be refunded to the borrower, less an administrative fee.
Part II
20. SEVERANCE, LEASE TERMINATIONS AND TRANSITION COSTS
During 2011, the Company identified opportunities to improve information technology service efficiencies and incurred $9.7 million in severance and other transitional costs related to restructuring. In addition, the Company also incurred $1.3 million in severance and lease termination costs associated with the restructuring of a non-core service function. Costs associated with these project initiatives were completed in 2011. Of the $11.0 million expensed, $9.7 million resulted in cash expenditures during 2011. These costs were included in the Other category. See “Note 5—Segments.”
The following table sets forth the expenses incurred for 2011 by major category:
| | | | | | | | | | | | | | | | |
| (In millions) | | Beginning Accrued
Liability | | | Charged to
Expense, Net | | | Expenditures | | | Ending Accrued
Liability | |
Severance | | $ | — | | | $ | 4.1 | | | $ | 3.1 | | | $ | 1.0 | |
Lease terminations | | | 0.7 | | | | 1.7 | | | | 1.4 | | | | 1.0 | |
Transition and other restructuring costs | | | — | | | | 5.2 | | | | 5.2 | | | | — | |
| | | | | | | | | | | | | | | | | |
| | | $ | 0.7 | | | $ | 11.0 | | | $ | 9.7 | | | $ | 2.0 | |
SUPPLEMENTARY DATA
Quarterly Financial Information (Unaudited)
The following tables set forth select unaudited financial information by calendar quarter:
| | | | | | | | | | | | | | | | |
| | | 2011 | |
| (In millions—except per share data) | | 4th Quarter | | | 3rd Quarter | | | 2nd Quarter | | | 1st Quarter | |
Premiums | | $ | 542.7 | | | $ | 539.8 | | | $ | 537.0 | | | $ | 533.8 | |
Administrative fees | | | 28.1 | | | | 28.5 | | | | 29.5 | | | | 29.4 | |
Net investment income | | | 155.9 | | | | 147.3 | | | | 152.6 | | | | 157.0 | |
Net capital gains (losses) | | | 1.0 | | | | 7.7 | | | | (13.1 | ) | | | (2.5 | ) |
| | | | | | | | | | | | | | | | | |
Total revenues | | | 727.7 | | | | 723.3 | | | | 706.0 | | | | 717.7 | |
Benefits to policyholders | | | 446.5 | | | | 432.2 | | | | 452.4 | | | | 440.1 | |
| Net income | | | 39.3 | | | | 47.5 | | | | 18.8 | | | | 33.7 | |
Net income per common share: | | | | | | | | | | | | | | | | |
Basic | | $ | 0.89 | | | $ | 1.07 | | | $ | 0.42 | | | $ | 0.73 | |
Diluted | | | 0.89 | | | | 1.07 | | | | 0.42 | | | | 0.73 | |
| | | | | | | | | | | | | | | | |
| | | 2010 | |
| (In millions—except per share data) | | 4th Quarter | | | 3rd Quarter | | | 2nd Quarter | | | 1st Quarter | |
Premiums | | $ | 524.5 | | | $ | 532.8 | | | $ | 532.9 | | | $ | 507.5 | |
Administrative fees | | | 29.8 | | | | 29.1 | | | | 29.3 | | | | 28.3 | |
Net investment income | | | 158.0 | | | | 152.7 | | | | 141.9 | | | | 149.9 | |
Net capital losses | | | (2.1 | ) | | | (29.6 | ) | | | (12.9 | ) | | | (7.0 | ) |
| | | | | | | | | | | | | | | | | |
Total revenues | | | 710.2 | | | | 685.0 | | | | 691.2 | | | | 678.7 | |
Benefits to policyholders | | | 412.1 | | | | 400.9 | | | | 424.4 | | | | 382.4 | |
| Net income | | | 52.0 | | | | 46.2 | | | | 41.1 | | | | 49.7 | |
Net income per common share: | | | | | | | | | | | | | | | | |
Basic | | $ | 1.13 | | | $ | 0.99 | | | $ | 0.87 | | | $ | 1.05 | |
Diluted | | | 1.12 | | | | 0.99 | | | | 0.87 | | | | 1.04 | |
| Item 9. | | Changes in and Disagreements With Accountant on Accounting and Financial Disclosure |
None.
| | |
| 120 | | STANCORP FINANCIAL GROUP, INC. |
| Item 9A. | | CONTROLS AND PROCEDURES |
Management of StanCorp Financial Group, Inc. (the “Company”) has evaluated, under the supervision and with the participation of the Company’s Chief Executive Officer and Chief Financial Officer, the effectiveness of the design and operation of the Company’s “disclosure controls and procedures” (as defined in the Securities Exchange Act of 1934 (the “Exchange Act”) Rules 13a-15(c) and 15d-15(c)) as of the end of the period covered by this report. Based on this evaluation, the Chief Executive Officer and Chief Financial Officer have concluded that the Company’s disclosure controls and procedures were effective at December 31, 2011, and designed to provide reasonable assurance that material information relating to the Company and its consolidated subsidiaries is recorded, processed, summarized and reported within the time periods specified in the Securities and Exchange Commission’s rules and forms, and is accumulated and communicated to management, including the Company’s Chief Executive Officer and Chief Financial Officer, as appropriate, to allow timely decisions regarding required disclosure.
Changes in internal control over financial reporting
There have not been any changes in the Company’s internal control over financial reporting (as such term is defined in Rules 13a-15(f) and 15d-15(f) under the Exchange Act) during the fiscal quarter to which this report relates that have materially affected, or are reasonably likely to materially affect, the Company’s internal control over financial reporting.
In 2011, as part of an ongoing effort to reduce costs and improve capabilities, the Company initiated a project to outsource certain information technology functions. The Company transitioned work to the outside service provider in the fourth quarter of 2011. The outsourcing of certain information technology functions was not in response to any identified deficiency or weakness in our internal control over financial reporting. The outsourcing initiative is part of an ongoing effort to reduce long-term costs and improve overall capabilities, but in the short-term may increase our control risk as we complete the transition.
Management’s annual report on internal control over financial reporting
Management of the Company is responsible for establishing and maintaining adequate internal control over financial reporting. The Company’s internal control system was designed to provide reasonable assurance regarding the reliability of financial reporting and preparation of financial statements for external purposes in accordance with accounting principles generally accepted in the United States of America. All internal control systems, no matter how well designed, have inherent limitations and may not prevent or detect misstatements. Therefore, even those systems determined to be effective can provide only reasonable assurance with respect to financial statement preparation and presentation. Company management assessed the effectiveness of the Company’s internal control over financial reporting as of December 31, 2011. In making this assessment, it used the criteria set forth by the Committee of Sponsoring Organizations of the Treadway Commission inInternal Control—Integrated Framework. Company management concluded that based on its assessment, the Company’s internal control over financial reporting was effective as of December 31, 2011. The effectiveness of the Company’s internal control over financial reporting as of December 31, 2011 was audited by Deloitte & Touche LLP, an independent registered public accounting firm, as stated in their report, which is included below.
Attestation report of the registered public accounting firm
Part II
To the Board of Directors and Stockholders of
StanCorp Financial Group, Inc.
Portland, Oregon
We have audited the internal control over financial reporting of StanCorp Financial Group, Inc., and subsidiaries (the “Company”) as of December 31, 2011, based on criteria established inInternal Control—Integrated Frameworkissued by the Committee of Sponsoring Organizations of the Treadway Commission. The Company’s management is responsible for maintaining effective internal control over financial reporting and for its assessment of the effectiveness of internal control over financial reporting, included in the accompanying Management’s Annual Report on Internal Control over Financial Reporting. Our responsibility is to express an opinion on the Company’s internal control over financial reporting based on our audit.
We conducted our audit in accordance with the standards of the Public Company Accounting Oversight Board (United States). Those standards require that we plan and perform the audit to obtain reasonable assurance about whether effective internal control over financial reporting was maintained in all material respects. Our audit included obtaining an understanding of internal control over financial reporting, assessing the risk that a material weakness exists, testing and evaluating the design and operating effectiveness of internal control based on the assessed risk, and performing such other procedures as we considered necessary in the circumstances. We believe that our audit provides a reasonable basis for our opinion.
A company’s internal control over financial reporting is a process designed by, or under the supervision of, the company’s principal executive and principal financial officers, or persons performing similar functions, and effected by the company’s board of directors, management, and other personnel to provide reasonable assurance regarding the reliability of financial reporting and the preparation of financial statements for external purposes in accordance with generally accepted accounting principles.
A company’s internal control over financial reporting includes those policies and procedures that (1) pertain to the maintenance of records that, in reasonable detail, accurately and fairly reflect the transactions and dispositions of the assets of the company; (2) provide reasonable assurance that transactions are recorded as necessary to permit preparation of financial statements in accordance with generally accepted accounting principles, and that receipts and expenditures of the company are being made only in accordance with authorizations of management and directors of the company; and (3) provide reasonable assurance regarding prevention or timely detection of unauthorized acquisition, use, or disposition of the company’s assets that could have a material effect on the financial statements.
Because of the inherent limitations of internal control over financial reporting, including the possibility of collusion or improper management override of controls, material misstatements due to error or fraud may not be prevented or detected on a timely basis. Also, projections of any evaluation of the effectiveness of the internal control over financial reporting to future periods are subject to the risk that the controls may become inadequate because of changes in conditions, or that the degree of compliance with the policies or procedures may deteriorate.
In our opinion, the Company maintained, in all material respects, effective internal control over financial reporting as of December 31, 2011, based on the criteria established inInternal Control—Integrated Frameworkissued by the Committee of Sponsoring Organizations of the Treadway Commission.
We have also audited, in accordance with the standards of the Public Company Accounting Oversight Board (United States), the consolidated balance sheet, and the related consolidated statements of income and comprehensive income, changes in shareholders’ equity, and cash flows as of and for the year ended December 31, 2011 of the Company and our report dated February 24, 2012 expressed an unqualified opinion on those financial statements.
|
/s/ DELOITTE & TOUCHE LLP
|
Portland, Oregon
February 24, 2012
| | |
| 122 | | STANCORP FINANCIAL GROUP, INC. |
| Item 9B. | | Other Information |
On November 15, 2011, the Board of Directors approved a proposal to amend the 1999 Employee Share Purchase Plan, changing the timing of the offering periods. No other changes have been made to the existing 1999 Employee Share Purchase Plan. A copy of the agreement is attached hereto and filed herewith as Exhibit 10.3.
On February 14, 2012, the Board of Directors approved a revised form of the Corporate Governance Guidelines, as amended. A copy of the form is attached hereto and filed herewith as Exhibit 99.1.
Part II
| Item 10. | | Directors, Executive Officers and Corporate Governance |
Information required by Item 10 relating to directors of StanCorp Financial Group, Inc. (the “Company”) is set forth under the caption “Election of Directors” in the 2012 Proxy Statement and is incorporated herein by reference.
For information on the executive officers of the registrant, see Part I, Item 4A, “Executive Officers of the Registrant.”
Information relating to beneficial ownership reporting compliance by directors and executive officers of the Company pursuant to Section 16(a) of the Securities Exchange Act of 1934 (the “Exchange Act”) is set forth under the caption “Section 16(a) Beneficial Ownership Reporting Compliance” in the 2012 Proxy Statement, and is incorporated herein by reference.
The Company has codes of business ethics for all directors, senior executive officers, including the President and Chief Executive Officer, the Senior Vice President and Chief Financial Officer and the Vice President and Controller of StanCorp (its principal executive officer, principal financial officer and principal accounting officer, respectively), and employees of the Company. The codes of business ethics are available on the Company’s investor website located atwww.stancorpfinancial.com. A copy of the codes of business ethics will be provided without charge to any person who requests them by writing or telephoning the Company’s Shareholder Services Department, StanCorp Financial Group, Inc., 1100 SW Sixth Avenue, Portland, OR 97204, (800) 378-8360. The Company will disclose on its investor website any amendments to or waivers from its codes of business ethics applicable to directors or executive officers of StanCorp, including the Chairman, President and Chief Executive Officer, the Senior Vice President and Chief Financial Officer and the Vice President and Controller in accordance with all applicable laws and regulations.
AUDIT COMMITTEE
StanCorp has a separately designated standing Audit Committee established in accordance with Section 3(a)58(A) of the Exchange Act. Information regarding the members of the Audit Committee is reported under the caption “Corporate Governance—Committees of the Board” in the Company’s 2012 Proxy Statement, herein incorporated by reference.
AUDIT COMMITTEE FINANCIAL EXPERT
Information required by Item 10 regarding the Audit Committee Financial Expert is reported under the caption “Corporate Governance—Committees of the Board” in the Company’s 2012 Proxy Statement and is incorporated herein by reference.
| Item 11. | | Executive Compensation |
Information required by Item 11 regarding executive compensation and related matters is reported under the captions “Director Compensation,” “Executive Compensation,” “Compensation Discussion and Analysis” and “Report of the Organization & Compensation Committee” in the Company’s 2012 Proxy Statement, herein incorporated by reference.
| Item 12. | | Security Ownership of Certain Beneficial Owners and Management and Related Stockholder Matters |
Information required by Item 12 regarding security ownership of certain beneficial owners and management is reported under the caption “Security Ownership of Certain Beneficial Owners” and “Share Ownership of Directors and Officers” in the Company’s 2012 Proxy Statement, herein incorporated by reference.
| | |
| 124 | | STANCORP FINANCIAL GROUP, INC. |
Part III
EQUITY COMPENSATION PLANS
The Company has two active equity compensation plans, both of which have been approved by shareholders. These are the 2002 Stock Incentive Plan (“2002 Plan”) and the 1999 Employee Share Purchase Plan (“ESPP”).
The following table sets forth the shares to be issued subject to outstanding options and the shares otherwise available for issue under these plans as of December 31, 2011:
| | | | | | | | | | | | |
| Plan category | | (a) Number of
securities to
be issued
upon exercise
of outstanding
options,
warrants and
rights | | | (b) Weighted-
average
exercise price
of outstanding
options,
warrants and
rights | | | (c) Number of
securities for
future
issuance
under equity
compensation
plans
(excluding
securities
reflected in
column (a)) | |
Equity compensation plans approved by security holders | | | 2,981,833 | | | $ | 40.84 | | | | 1,424,843 | |
| Equity compensation plans not approved by security holders | | | — | | | | — | | | | — | |
As of December 31, 2011, there were 158,608 shares available for issuance under the ESPP and there were 1,266,235 shares available to be issued as options or stock awards under the 2002 Plan. Of the shares available for issuance under the 2002 Plan, only 740,194 shares could be issued as stock awards. Shares issuable under performance share awards are not included in calculating the weighted-average price of outstanding options, warrants and rights.
| Item 13. | | Certain Relationships and Related Transactions, and Director Independence |
Information required by Item 13 regarding certain relationships and related transactions, and director independence is reported under the captions “Corporate Governance—Director Independence” and “Transactions with Related Parties” in the Company’s 2012 Proxy Statement, herein incorporated by reference.
| Item 14. | | Principle Accountant Fees and Services |
Information required by Item 14 regarding principal accounting fees and services is reported under the caption “Proposal to Ratify Appointment of Independent Registered Public Accounting Firm” in the Company’s 2012 Proxy Statement, herein incorporated by reference.
Part III
| Item 15. | | Exhibits and Financial Statement Schedules |
| (a) | | Index of documents filed as part of the report: |
| | 1. | | The following Consolidated Financial Statements of StanCorp are included in Item 8, “Financial Statements and Supplementary Data.” |
Report of Independent Registered Public Accounting Firm
Consolidated Statements of Income and Comprehensive Income for the years ended December 31, 2011, 2010 and 2009
Consolidated Balance Sheets at December 31, 2011 and 2010
Consolidated Statements of Changes in Shareholders’ Equity for the years ended December 31, 2011, 2010 and 2009
Consolidated Statements of Cash Flows for the years ended December 31, 2011, 2010 and 2009
Notes to Consolidated Financial Statements
| | 2. | | The following Financial Statement Schedules of StanCorp are included in Item 8, “Financial Statements and Supplementary Data—Notes to Consolidated Financial Statements.” Schedules not referenced are inapplicable or not required. |
Condensed Financial Information of Registrant
Valuation and Qualifying Accounts
Summary of Investments—Other Than Investments in Affiliates
Supplementary Insurance Information
Reinsurance
| | | | |
| Number | | | Name |
| | 3.1 | | | Articles of Incorporation of StanCorp Financial Group, Inc., As Amended |
| | 3.2 | | | Bylaws of StanCorp Financial Group, Inc. |
| | 4.1 | | | Amended and Restated Rights Agreement |
| | 4.2 | | | Form of Indenture Relating to Senior Debt Securities |
| | 4.3 | | | StanCorp Financial Group, Inc. and U.S. Bank National Association as Trustee, First Supplemental Indenture, Dated as of September 25, 2002 |
| | 4.4 | | | First Supplemental Indenture, dated May 29, 2007, between the Company and U.S. Bank National Association |
| | 4.5 | | | Replacement Capital Covenant dated May 29, 2007, for the benefit of holders of the Company’s 6.875% Senior Notes due 2012 |
| | 10.1 | | | StanCorp Financial Group, Inc. 1999 Omnibus Stock Incentive Plan, As Amended |
| | 10.2 | | | Amendment No. 3 to StanCorp Financial Group, Inc. 1999 Omnibus Stock Incentive Plan |
| | 10.3 | | | StanCorp Financial Group, Inc. 1999 Employee Share Purchase Plan, As Amended |
| | 10.4 | | | Standard Insurance Company Supplemental Retirement Plan for the Senior Officer Management Group 2008 Restatement |
| | 10.5 | | | StanCorp Financial Group, Inc. Deferred Compensation Plan for Senior Officers 2008 Restatement |
| | 10.6 | | | StanCorp Financial Group, Inc. Amended 2002 Stock Incentive Plan |
| | 10.7 | | | Form of StanCorp Financial Group, Inc. 2002 Stock Incentive Plan, As Amended Restricted Stock Agreement |
| | 10.8 | | | Form of StanCorp Financial Group, Inc. 2002 Stock Incentive Plan Non-Statutory Stock Option Agreement for Senior Officers |
| | 10.9 | | | Form of StanCorp Financial Group, Inc. 2002 Stock Incentive Plan Non-Statutory Stock Option Agreement for Directors |
| | 10.10 | | | StanCorp Financial Group, Inc. Short-Term Incentive Plan |
| | 10.11 | | | StanCorp Financial Group, Inc. Deferred Compensation Plan for Directors—2008 Restatement |
| | |
| 126 | | STANCORP FINANCIAL GROUP, INC. |
| | | | |
| Number | | | Name |
| | 10.12 | | | Form of Executive Officer and Director Indemnity Agreement |
| | 10.13 | | | Credit Agreement Dated as of June 15, 2006, Among StanCorp Financial Group, Inc., as Borrower, The Lenders Listed Herein, as Lenders, Wells Fargo Bank, National Association, as Administrative Agent, and U.S. Bank National Association, as Syndication Agent, $200,000,000 |
| | 10.14 | | | Form of Change of Control Agreement, as amended |
| | 10.15 | | | Form of StanCorp Financial Group, Inc. Long-Term Incentive Award Agreement ( Performance Period) |
| | 10.16 | | | Credit Agreement Extension Dated as of May 9, 2007, Among StanCorp Financial Group, Inc., as Borrower, The Lenders Listed Herein, as lenders, Wells Fargo Bank, National Association, as Administrative Agent, and U.S. Bank National Association, as Syndication Agent, $200,000,000 |
| | 10.17 | | | Credit Agreement Extension Dated as of June 15, 2008, Among StanCorp Financial Group, Inc., as Borrower, The Lenders Listed Herein, as lenders, Wells Fargo Bank, National Association, as Administrative Agent, and U.S. Bank National Association, as Syndication Agent, $165,000,000 |
| | 10.18 | | | StanCorp Financial Group, Inc. Deferred Compensation Plan for Senior Officers—First Amendment |
| | 12.1 | | | Statement Regarding Computation of Ratio of Earnings to Fixed Charges |
| | 14.1 | | | Code of Business Conduct and Ethics for the Board of Directors |
| | 14.2 | | | Code of Ethics for Senior Officers |
| | 14.3 | | | Guide to Business Conduct |
| | 21 | | | Subsidiaries of the Registrant |
| | 23 | | | Consent of Independent Registered Public Accounting Firm |
| | 24 | | | Power of Attorney of Directors of StanCorp Financial Group, Inc. |
| | 31.1 | | | Certification of Chief Executive Officer pursuant to Section 302 of the Sarbanes-Oxley Act of 2002 |
| | 31.2 | | | Certification of Chief Financial Officer pursuant to Section 302 of the Sarbanes-Oxley Act of 2002 |
| | 32.1 | | | Certification of Chief Executive Officer pursuant to Section 906 of the Sarbanes-Oxley Act of 2002 |
| | 32.2 | | | Certification of Chief Financial Officer pursuant to Section 906 of the Sarbanes-Oxley Act of 2002 |
| | 99.1 | | | Amended StanCorp Financial Group, Inc. Corporate Governance Guidelines dated February 14, 2012 |
| | 101.INS | | | XBRL Instance Document |
| | 101.SCH | | | XBRL Taxonomy Extension Schema Document |
| | 101.CAL | | | XBRL Taxonomy Extension Calculation Linkbase Document |
| | 101.DEF | | | XBRL Taxonomy Extension Definition Linkbase Document |
| | 101.LAB | | | XBRL Taxonomy Extension Label Linkbase Document |
| | 101.PRE | | | XBRL Taxonomy Extension Presentation Linkbase Document |
SIGNATURES
Pursuant to the requirements of Section 13 or 15(d) of the Securities Exchange Act of 1934, the Registrant has duly caused this report to be signed on its behalf by the undersigned, thereunto duly authorized in Portland, Oregon on February 24, 2012.
| | |
STANCORP FINANCIAL GROUP, INC. |
| |
By: | | /s/ J. GREG NESS
|
| | | J. Greg Ness |
| | | Chairman, President and Chief Executive Officer |
Pursuant to the requirements of the Securities Exchange Act of 1934, this report has been signed below by the following persons on behalf of the Registrant and in the capacities and on the dates indicated.
| | | | |
| Signature | | Title | | Date |
| | |
/s/ J. GREG NESS
J. Greg Ness | | Chairman, President and Chief Executive Officer (Principle Executive Officer), Director | | February 24, 2012 |
| | |
/s/ FLOYD F. CHADEE
Floyd F. Chadee | | Senior Vice President and Chief Financial Officer (Principal Financial Officer) | | February 24, 2012 |
| | |
/s/ ROBERT M. ERICKSON
Robert M. Erickson | | Vice President and Controller (Principal Accounting Officer) | | February 24, 2012 |
| | |
*
Eric E. Parsons | | Director | | February 13, 2012 |
| | |
*
Virginia L. Anderson | | Director | | February 13, 2012 |
| | |
*
Frederick W. Buckman | | Director | | February 13, 2012 |
| | |
*
Stanley R. Fallis | | Director | | February 13, 2012 |
| | |
*
Duane C. McDougall | | Director | | February 13, 2012 |
| | |
*
George J. Puentes | | Director | | February 13, 2012 |
| | |
*
Mary F. Sammons | | Director | | February 13, 2012 |
| | |
*
E. Kay Stepp | | Director | | February 13, 2012 |
| | |
*
Michael G. Thorne | | Director | | February 13, 2012 |
| | |
*
Ronald E. Timpe | | Director | | February 13, 2012 |
| | |
| |
*By: | | /s/ FLOYD F. CHADEE
|
| | | Floyd F. Chadee, as Attorney-in-fact |
| | |
| 128 | | STANCORP FINANCIAL GROUP, INC. |
EXHIBITS INDEX
| | | | | | |
| Number | | | Name | | Method of Filing |
| | 3.1 | | | Articles of Incorporation of StanCorp Financial Group, Inc., As Amended | | Filed as Exhibit 3.1 on Registrant’s Form 10-Q, dated August 3, 2010, and incorporated herein by this reference |
| | 3.2 | | | Bylaws of StanCorp Financial Group, Inc. | | Filed as Exhibit 3.2 on Registrant’s Form S-1A, dated March 12, 1999, and incorporated herein by this reference |
| | 4.1 | | | Amended and Restated Rights Agreement | | Filed as Exhibit 4.1 on Registrant’s 10-Q, dated August 3, 2011, and exhibits to this Agreement filed as Exhibit 4.1 on Registrants 10-Q, dated November 2, 2011, and incorporated herein by this reference. |
| | 4.2 | | | Form of Indenture Relating to Senior Debt Securities | | Filed as Exhibit 4 (c) on the Registrant’s Form S-3, dated July 3, 2002, and incorporated herein by this reference |
| | 4.3 | | | StanCorp Financial Group, Inc. and U.S. Bank National Association as Trustee, First Supplemental Indenture, Dated as of September 25, 2002 | | Filed as Exhibit 4.1 on the Registrant’s Form 8-K, dated September 25, 2002, and incorporated herein by this reference |
| | 4.4 | | | First Supplemental Indenture, dated May 29, 2007, between the Company and U.S. Bank National Association | | Filed as Exhibit 4.1 on Registrant’s 8-K, dated May 30, 2007, and incorporated herein by this reference |
| | 4.5 | | | Replacement Capital Covenant dated May 29, 2007, for the benefit of holders of the Company’s 6.875% Senior Notes due 2012 | | Filed as Exhibit 4.2 on Registrant’s 8-K, dated May 30, 2007, and incorporated herein by this reference |
| | 10.1 | | | StanCorp Financial Group, Inc. 1999 Omnibus Stock Incentive Plan, As Amended | | Filed as Exhibit 10.2 on Registrant’s Form 10-Q, dated August 14, 2000, and incorporated herein by this reference |
| | 10.2 | | | Amendment No. 3 to StanCorp Financial Group, Inc. 1999 Omnibus Stock Incentive Plan | | Filed as Exhibit 10.3 on Registrant’s Form 10-K, dated March 10, 2005, and incorporated herein by this reference |
| | 10.3 | | | StanCorp Financial Group, Inc. 1999 Employee Share Purchase Plan, As Amended | | Filed herewith |
| | 10.4 | | | Amendment No. 1 to StanCorp Financial Group, Inc. 1999 Employee Share Purchase Plan | | Filed as Exhibit 10.5 on Registrant’s Form 10-K, dated March 10, 2005, and incorporated herein by this reference |
| | 10.5 | | | Standard Insurance Company Supplemental Retirement Plan for the Senior Officer Management Group 2008 Restatement | | Filed as Exhibit 10.3 on the Registrant’s Form 10-Q, dated May 8, 2008, and incorporated herein by this reference |
| | 10.6 | | | StanCorp Financial Group, Inc. Deferred Compensation Plan for Senior Officers 2008 Restatement | | Filed as Exhibit 10.6 on Registrant’s Form 10-K, dated February 27, 2008, and incorporated herein by this reference |
| | 10.7 | | | StanCorp Financial Group, Inc. Amended 2002 Stock Incentive Plan | | Filed as Exhibit 10.1 on Registrant’s Form 10-Q, dated May 8, 2008, and incorporated herein by this reference |
| | 10.8 | | | Form of StanCorp Financial Group, Inc. 2002 Stock Incentive Plan Non-Statutory Stock Option Agreement for Senior Officers | | Filed as Exhibit 10.9 on the Registrant’s Form 10-K dated February 25, 2009, and incorporated herein by this reference |
| | | | | | |
| Number | | | Name | | Method of Filing |
| | 10.9 | | | Form of StanCorp Financial Group, Inc. 2002 Stock Incentive Plan Non-Statutory Stock Option Agreement for Directors | | Filed as Exhibit 10.4 on the Registrant’s Form 10-Q, dated May 8, 2008, and incorporated herein by this reference |
| | 10.10 | | | StanCorp Financial Group, Inc. Short-Term Incentive Plan | | Filed as Exhibit 10.11 on the Registrant’s Form 10-K dated February 25, 2010, and incorporated herein by this reference |
| | 10.11 | | | StanCorp Financial Group, Inc. Deferred Compensation Plan for Directors—2008 Restatement | | Filed as Exhibit 10.15 on Registrant’s Form 10-K, dated February 27, 2008, and incorporated herein by this reference |
| | 10.12 | | | Form of Executive Officer and Director Indemnity Agreement | | Filed as Exhibit 10.25 on Registrant’s Form 10-Q, dated August 9, 2005, and incorporated herein by this reference |
| | 10.13 | | | Credit Agreement Dated as of June 15, 2006, Among StanCorp Financial Group, Inc., as Borrower, The Lenders Listed Herein, as Lenders, Wells Fargo Bank, National Association, as Administrative Agent, and U.S. Bank National Association, as Syndication Agent, $200,000,000 | | Filed as Exhibit 10.1 on the Registrant’s Form 8-K, dated June 16, 2006, and incorporated herein by this reference |
| | 10.14 | | | Form of Change of Control Agreement, As Amended | | Filed as Exhibit 10.1 on Registrant’s Form 8-K, dated December 15, 2010, and incorporated herein by this reference |
| | 10.15 | | | Form of StanCorp Financial Group, Inc. Long-Term Incentive Award Agreement ( Performance Period) | | Filed as Exhibit 10.21 on Registrant’s Form 10-K dated February 25, 2011, and incorporated herein by this reference |
| | 10.16 | | | Credit Agreement Extension Dated as of May 9, 2007, Among StanCorp Financial Group, Inc., as Borrower, The Lenders Listed Herein, as lenders, Wells Fargo Bank, National Association, as Administrative Agent, and U.S. Bank National Association, as Syndication Agent, $200,000,000 | | Filed as Exhibit 10.1 on Registrant’s Form 8-K, dated May 9, 2007, and incorporated herein by this reference |
| | 10.17 | | | Credit Agreement Extension Dated as of June 15, 2008, Among StanCorp Financial Group, Inc., as Borrower, The Lenders Listed Herein, as lenders, Wells Fargo Bank, National Association, as Administrative Agent, and U.S. Bank National Association, as Syndication Agent, $165,000,000 | | Filed as Exhibit 10.1 on Registrant’s Form 8-K, dated June 15, 2008, and incorporated herein by this reference |
| | 10.18 | | | StanCorp Financial Group, Inc. Deferred Compensation Plan for Senior Officers—First Amendment | | Filed as Exhibit 10.1 on Registrant’s Form 10-Q, dated November 4, 2008, and incorporated herein by this reference |
| | 12.1 | | | Statement Regarding Computation of Ratio of Earnings to Fixed Charges | | Filed herewith |
| | 14.1 | | | Code of Business Conduct and Ethics for the Board of Directors | | Filed as Exhibit 14.1 on Registrant’s Form 10-K, dated March 5, 2004, and incorporated herein by this reference |
| | 14.2 | | | Code of Ethics for Senior Officers | | Filed as Exhibit 14.2 on Registrant’s Form 10-K, dated March 5, 2004, and incorporated herein by this reference |
| | |
| 130 | | STANCORP FINANCIAL GROUP, INC. |
| | | | | | |
| Number | | | Name | | Method of Filing |
| | 14.3 | | | Guide to Business Conduct | | Filed as Exhibit 14.3 on Registrant’s Form 10-K, dated February 25, 2010, and incorporated herein by this reference |
| | 21 | | | Subsidiaries of the Registrant | | Filed herewith |
| | 23 | | | Consent of Independent Registered Public Accounting Firm | | Filed herewith |
| | 24 | | | Power of Attorney of Directors of StanCorp Financial Group, Inc. | | Filed herewith |
| | 31.1 | | | Certification of Chief Executive Officer pursuant to Section 302 of the Sarbanes-Oxley Act of 2002 | | Filed herewith |
| | 31.2 | | | Certification of Chief Financial Officer pursuant to Section 302 of the Sarbanes-Oxley Act of 2002 | | Filed herewith |
| | 32.1 | | | Certification of Chief Executive Officer pursuant to Section 906 of the Sarbanes-Oxley Act of 2002 | | Filed herewith |
| | 32.2 | | | Certification of Chief Financial Officer pursuant to Section 906 of the Sarbanes-Oxley Act of 2002 | | Filed herewith |
| | 99.1 | | | Amended StanCorp Financial Group, Inc. Corporate Governance Guidelines dated February 14, 2012 | | Filed herewith |
| | 101.INS | | | XBRL Instance Document | | * |
| | 101.SCH | | | XBRL Taxonomy Extension Schema Document | | * |
| | 101.CAL | | | XBRL Taxonomy Extension Calculation Linkbase Document | | * |
| | 101.DEF | | | XBRL Taxonomy Extension Definition Linkbase Document | | * |
| | 101.LAB | | | XBRL Taxonomy Extension Label Linkbase Document | | * |
| | |
| | 101.PRE | | | XBRL Taxonomy Extension Presentation Linkbase Document | | * |
| | * | | Pursuant to Rule 406T of Regulation S-T, these interactive data files are deemed not filed or part of a registration statement or prospectus for purposes of Sections 11 or 12 of the Securities Act of 1933, as amended, or Section 18 of the Securities and Exchange Act of 1934, as amended and otherwise are not subject to liability under those sections. |