UNITED STATES
SECURITIES AND EXCHANGE COMMISSION
Washington, D.C. 20549
FORM N-CSRS
CERTIFIED SHAREHOLDER REPORT OF REGISTERED
MANAGEMENT INVESTMENT COMPANIES
Investment Company Act file number: 811-09253
Wells Fargo Funds Trust
(Exact name of registrant as specified in charter)
525 Market St., San Francisco, CA 94105
(Address of principal executive offices) (Zip code)
C. David Messman
Wells Fargo Funds Management, LLC
525 Market St., San Francisco, CA 94105
(Name and address of agent for service)
Registrant’s telephone number, including area code: 800-643-9691
Date of fiscal year end: February 28, 2003
Date of reporting period: August 31, 2003
ITEM 1. REPORT TO SHAREHOLDERS
WELLS FARGO
FUNDS
Wells Fargo Outlook Funds®
Semi-Annual Report
Wells Fargo Outlook Today Fund®
Wells Fargo Outlook 2010 FundSM
Wells Fargo Outlook 2020 FundSM
Wells Fargo Outlook 2030 FundSM
Wells Fargo Outlook 2040 FundSM
August 31, 2003
TABLEOFCONTENTS
NOT FDIC INSURED–NO BANK GUARANTEE–MAY LOSE VALUE
��
This page is intentionally left blank —
| | | OUTLOOKFUNDSSHAREHOLDERLETTER |
|
DEARVALUEDSHAREHOLDER,
We are pleased to provide you with this Wells Fargo Outlook Funds® semi-annual report for the six-month period ended August 31, 2003. On the following pages, you will find a discussion of the Wells Fargo Outlook Funds, including performance highlights, strategic outlook, and facts and figures about each Fund’s portfolio.
THE ECONOMY: A WEAK RECOVERY
With the economy mired in weakness at the beginning of the reporting period, the Federal Reserve Board (the Fed) cut short-term interest rates from 1.25% to 1%, the lowest level in half a century. Still, unemployment remained relatively high and a record fiscal year 2003 federal budget deficit suggested that tax revenues were not growing nearly fast enough to cover spending demands of the war and other programs. On the plus side, consumer spending remained a positive factor for the economy. In the final months of the period, business confidence improved, followed by a gradual increase in new orders. Although firms remained cautious about increased hiring, the number of layoff announcements had fallen to a two-year low.
STOCKS: STRONGEST RALLY IN FOUR YEARS
The S&P 500 Index returned 20.87% for the six-month reporting period, with small- and mid-cap domestic stocks outperforming large cap stocks. Similar to how uncertainty leading up to the war in Iraq caused stocks to stumble in early 2003, the war’s launch and relatively brief engagement caused stocks to rally as investors became more confident about the future. In the early stages of the rally, stronger sentiment drove the market higher—particularly hopes that the economy was not as fragile as investors feared. By period end, the market was driven by news about the improving health of the economy.
BONDS: BEGINNING TO WANE
Generally speaking, bonds have done well over the past three years, providing a strong counterpoint to declining stocks during that time. However, long- and intermediate-term U.S. government bonds underperformed equities during the reporting period. Returns for mortgage-backed bonds were restrained by record financing early in the period, as investors in such bonds saw their capital returned earlier than expected. Later in the period, bond yields—and hence mortgage rates—began increasing, the cost of borrowing rose sharply and the rate of mortgage refinancing declined.
LOOKING AHEAD: POSITIVE OUTLOOK FOR STOCKS COULD SIGNAL A CHALLENGING TIME FOR BONDS
An improving economy could be a positive sign for stocks, and investors are hopeful of the possibility of low interest rates, contained inflation and increased corporate profits. Such an environment is typically more challenging for bonds, however, because interest rates typically rise when the economy strengthens. Worsening federal budget deficits are also a major concern, since massive U.S. government borrowing would exert upward pressure on interest rates and inflation. Although some of the U.S. dollar’s weakness has unwound lately, the dollar’s fall over the past twelve months should continue to boost corporate earnings overseas. The improvement in sentiment towards the U.S. dollar makes the currency a little more attractive, although it continues to be weighed down by its relative overvaluation and the unattractive level of U.S. interest rates.
During this period of mixed economic data, it is important to ensure that your investment portfolio is properly allocated. The Wells Fargo Outlook Funds are globally diversified allocation funds designed to maximize assets while gradually reducing the potential for investment risk over specific periods of time. Each Wells Fargo Outlook Fund’s portfolio may be allocated across asset classes covering a variety of equity, fixed-income and cash investments and may include international exposure.
We would like to thank you for your investment in Wells Fargo Funds. Please know that through each market cycle, we are committed to helping you meet your financial needs. If you have any questions about your investment, please contact your investment professional or call us at 1-800-222-8222. You may also visit our Web site at www.wellsfargofunds.com.
Sincerely,

Karla M. Rabusch
President
Wells Fargo Funds
1
| WELLSFARGOOUTLOOKFUNDS | | PERFORMANCEHIGHLIGHTS |
|
WELLSFARGOOUTLOOKFUNDS
INVESTMENT OBJECTIVE
Each of the Wells Fargo Outlook Funds (each, a Fund, and collectively, the Funds) seeks to provide investors with an asset allocation strategy designed to maximize assets for retirement or for other purposes consistent with the quantitatively measured risk that investors, on average, may be willing to accept given their investment time horizons.
ADVISER
Wells Fargo Funds Management, LLC
SUB-ADVISER
Barclays Global Fund Advisors
FUND MANAGERS
Team Managed
INCEPTION DATE
03/01/94
PERFORMANCE HIGHLIGHTS
During most of the six-month reporting period that ended August 31, 2003, economic recovery remained sluggish, although near the end of the period the recovery began to gain momentum. During the period, the S&P 500 Index returned 20.87%, with small- and mid-cap stocks being the best performers.
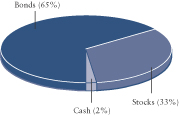
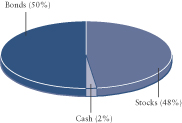
Performance of all of the Wells Fargo Outlook Funds during the reporting period was driven by the positive performance of the stock market. The Wells Fargo Outlook Today Fund Class A shares returned 7.47%,1 excluding sales charges, over the six-month reporting period, underperforming the other Wells Fargo Outlook Funds due to its greater exposure to bonds. The Wells Fargo Outlook Today Fund, a Fund suited to investors with short-term investment horizons, completed the six-month period with an allocation of 33% stocks, 65% bonds and 2% cash.
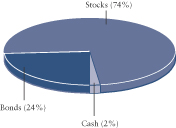
The Wells Fargo Outlook 2010 Fund Class A shares returned 10.69%,1 excluding sales charges, over the six-month reporting period.
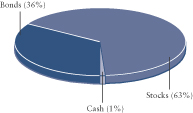
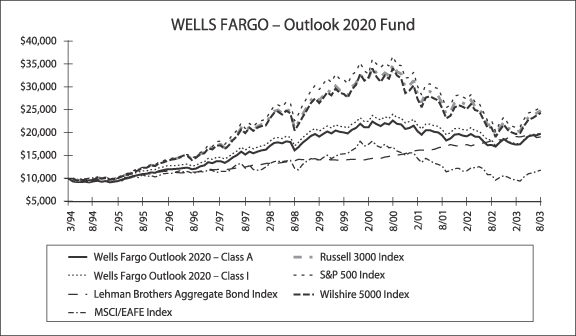
The Wells Fargo Outlook 2020 Fund, with a higher percentage of equities than the Wells Fargo Outlook 2010 and Outlook Today Funds, also performed better than those Wells Fargo Outlook Funds with higher exposure to bonds. The Fund’s Class A shares returned 13.46%,1 excluding sales charges, over the six-month reporting period.
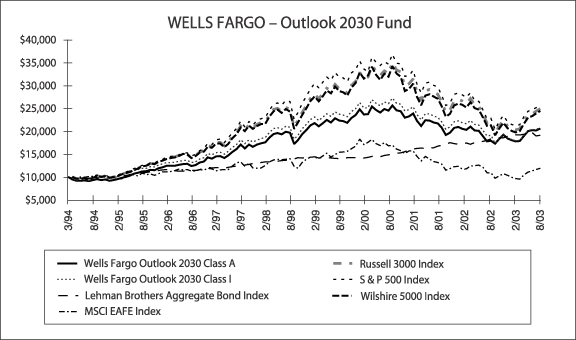
The Wells Fargo Outlook 2030 Fund Class A shares returned 15.78%,1 excluding sales charges, over the six-month reporting period.
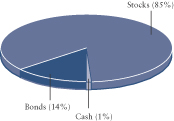
The Wells Fargo Outlook 2040 Fund Class A shares returned 18.33%,1 excluding sales charges, over the six-month reporting period. As equity prices rose, the Wells Fargo Outlook Funds with longer time horizons and consequently higher equity allocations, such as the Wells Fargo Outlook 2040 Fund with 85% of its portfolio invested in stocks as of August 31, 2003, outperformed the Wells Fargo Outlook Funds with shorter time horizons and lower equity allocations. By 2040, the Wells Fargo Outlook 2040 Fund should resemble the Wells Fargo Outlook Today Fund in its present composition, with adjustments reflecting market conditions at that time.
The majority of the domestic equity holdings for each of the Funds was invested in stocks of the S&P 500 Index. All of the sectors of the S&P 500 Index reported positive returns for the reporting period, with the Information Technology, Financial, and Consumer Discretionary sectors reporting the best performance.
A number of factors help to explain the performance of the equity market during the reporting period. Corporate earnings continued to improve, perhaps signaling that an increase in capital spending and new hiring may be on the horizon. Although consumer confidence was tenuous during the reporting period, apparently due to the joblessness of the current recovery, consumer spending remained strong and provided the safety net the economy needed to avoid slipping.
As various signs of economic improvement began to appear, bonds began to lose some of their recent gains, driving yields up from their previously low levels. The Funds’ worst performing holdings were long-term U.S. government bonds, followed by intermediate-term U.S. government bonds and cash.
STRATEGIC OUTLOOK
We believe that, although the economy is showing signs of improvement, the flow of good news will remain at a trickle rather than a flood. The lackluster labor market continues to dampen the economic recovery. An improvement in the labor market could translate into increased consumer spending, although at a slower pace than previous recoveries, due to the potential for rising interest rates. If firms cannot count on a sharp rise in consumer spending to use up their excess capacity, then they may be unlikely to raise their capital spending as much as they did during previous upturns.
2
PERFORMANCEHIGHLIGHTS | | WELLSFARGOOUTLOOKFUNDS |
|
AVERAGE ANNUAL TOTAL RETURNS1 (%) (AS OF AUGUST 31, 2003)
| | | With Load2
| | Without load
|
| Fund Name | | 6-months* | | 1-Year | | | 5-Year | | Life of
Fund
(3/1/94) | | 6-months* | | | 1-Year | | 5-Year | | | Life of
Fund
(3/1/94) |
| | | | | | | | |
Wells Fargo Outlook Today Fund – A | | 1.25 | | (0.40 | ) | | 2.95 | | 5.06 | | 7.47 | | | 5.65 | | 4.18 | | | 5.72 |
| | | | | | | | |
Wells Fargo Outlook Today Fund – B | | 2.19 | | 0.11 | | | 3.29 | | 5.20 | | 7.19 | | | 5.11 | | 3.64 | | | 5.20 |
| | | | | | | | |
Wells Fargo Outlook Today Fund – C | | 5.06 | | 2.95 | | | 3.41 | | 5.08 | | 7.10 | | | 5.03 | | 3.62 | | | 5.19 |
| | | | | | | | |
Wells Fargo Outlook Today Fund – I | | 7.62 | | 6.05 | | | 4.36 | | 5.81 | | 7.62 | | | 6.05 | | 4.36 | | | 5.81 |
| | | | | | | | |
Wells Fargo Outlook 2010 Fund – A | | 4.28 | | 0.75 | | | 2.68 | | 6.45 | | 10.69 | | | 6.93 | | 3.90 | | | 7.12 |
| | | | | | | | |
Wells Fargo Outlook 2010 Fund – B | | 5.32 | | 1.35 | | | 3.00 | | 6.55 | | 10.32 | | | 6.35 | | 3.35 | | | 6.55 |
| | | | | | | | |
Wells Fargo Outlook 2010 Fund – C | | 8.29 | | 4.32 | | | 3.14 | | 6.44 | | 10.34 | | | 6.38 | | 3.35 | | | 6.55 |
| | | | | | | | |
Wells Fargo Outlook 2010 Fund – I | | 10.86 | | 7.28 | | | 4.04 | | 7.19 | | 10.86 | | | 7.28 | | 4.04 | | | 7.19 |
| | | | | | | | |
Wells Fargo Outlook 2020 Fund – A | | 6.96 | | 1.34 | | | 1.65 | | 6.79 | | 13.46 | | | 7.51 | | 2.87 | | | 7.46 |
| | | | | | | | |
Wells Fargo Outlook 2020 Fund – B | | 8.09 | | 1.94 | | | 1.98 | | 6.90 | | 13.09 | | | 6.94 | | 2.35 | | | 6.90 |
| | | | | | | | |
Wells Fargo Outlook 2020 Fund – C | | 11.05 | | 4.84 | | | 2.12 | | 6.78 | | 13.12 | | | 6.89 | | 2.33 | | | 6.89 |
| | | | | | | | |
Wells Fargo Outlook 2020 Fund – I | | 13.58 | | 7.80 | | | 3.08 | | 7.58 | | 13.58 | | | 7.80 | | 3.08 | | | 7.58 |
| | | | | | | | |
Wells Fargo Outlook 2030 Fund – A | | 9.11 | | 2.34 | | | 1.22 | | 7.22 | | 15.78 | | | 8.55 | | 2.43 | | | 7.89 |
| | | | | | | | |
Wells Fargo Outlook 2030 Fund – B | | 10.35 | | 2.99 | | | 1.54 | | 7.32 | | 15.35 | | | 7.99 | | 1.91 | | | 7.32 |
| | | | | | | | |
Wells Fargo Outlook 2030 Fund – C | | 13.27 | | 5.87 | | | 1.68 | | 7.19 | | 15.37 | | | 7.97 | | 1.88 | | | 7.30 |
| | | | | | | | |
Wells Fargo Outlook 2030 Fund – I | | 15.90 | | 8.87 | | | 2.61 | | 7.99 | | 15.90 | | | 8.87 | | 2.61 | | | 7.99 |
| | | | | | | | |
Wells Fargo Outlook 2040 Fund – A | | 11.53 | | 3.71 | | | 0.62 | | 7.48 | | 18.33 | | | 10.07 | | 1.83 | | | 8.15 |
| | | | | | | | |
Wells Fargo Outlook 2040 Fund – B | | 12.93 | | 4.46 | | | 0.91 | | 7.56 | | 17.93 | | | 9.46 | | 1.30 | | | 7.56 |
| | | | | | | | |
Wells Fargo Outlook 2040 Fund – C | | 15.81 | | 7.42 | | | 1.09 | | 7.44 | | 17.94 | | | 9.48 | | 1.29 | | | 7.56 |
| | | | | | | | |
Wells Fargo Outlook 2040 Fund – I | | 18.58 | | 10.37 | | | 2.05 | | 8.28 | | 18.58 | | | 10.37 | | 2.05 | | | 8.28 |
| | | | | | | |
iMoneyNet All Taxable Money Fund Average3 | | | | | | | | | 0.33 | | | 0.84 | | 3.47 | | | 4.10 |
| | | | | | | |
Lehman Brothers Aggregate Bond Index4 | | | | | | | | | (0.36 | ) | | 4.36 | | 6.56 | | | 7.04 |
| | | | | | |
Morgan Stanley Capital International/ Europe, Australasia and Far East Index5 | | | | | | 22.65 | | | 9.11 | | (0.68 | ) | | 1.81 |
| | | | | | | | |
Russell 3000 Index6 | | | | | | | | | | | 22.82 | | | 13.93 | | 3.51 | | | 10.07 |
| | | | | | | | |
S&P 500 Index7 | | | | | | | | | | | 20.87 | | | 12.06 | | 2.48 | | | 10.39 |
| | | | | | | | |
Wilshire 5000 Index8 | | | | | | | | | | | 23.56 | | | 14.87 | | 3.53 | | | 9.84 |
| * | | Returns for periods of less than one year are not annualized. |
3
WELLSFARGOOUTLOOKFUNDS | | PERFORMANCEHIGHLIGHTS |
|
Wells Fargo Outlook Today Fund
Wells Fargo Outlook 2020 Fund
Wells Fargo Outlook 2040 Fund
Wells Fargo Outlook 2010 Fund
Wells Fargo Outlook 2030 Fund
PORTFOLIO ALLOCATION9 (AS OF AUGUST 31, 2003)
FUND CHARACTERISTICS (AS OF AUGUST 31, 2003)
| | | Wells Fargo
Outlook
Today
Fund | | Wells Fargo
Outlook
2010 Fund | | Wells Fargo
Outlook
2020 Fund | | Wells Fargo
Outlook
2030 Fund | | Wells Fargo
Outlook
2040 Fund |
Weighted Average Coupon of Bond Portfolio | | 4.22% | | 4.62% | | 4.77% | | 6.05% | | 7.31% |
Weighted Average Maturity of Bond Portfolio | | 3.71 years | | 3.72 years | | 6.87 years | | 13.68 years | | 17.71 years |
Estimated Duration of Bond Portfolio | | 3.25 years | | 3.25 years | | 4.69 years | | 8.09 years | | 10.08 years |
Number of Holdings | | 756 | | 813 | | 955 | | 949 | | 895 |
PORTFOLIO ALLOCATION BY ASSET CLASS (AS OF AUGUST 31, 2003)
| Asset Class | | Wells Fargo
Outlook
Today
Fund | | Wells Fargo
Outlook
2010 Fund | | Wells Fargo
Outlook
2020 Fund | | Wells Fargo
Outlook
2030 Fund | | Wells Fargo Outlook
2040 Fund |
| | | | | |
DOMESTIC STOCKS | | | | | | | | | | |
Large Cap Growth | | 9% | | 15% | | 19% | | 23% | | 28% |
Large Cap Value | | 11% | | 16% | | 21% | | 23% | | 27% |
Mid Cap Growth | | 1% | | 2% | | 2% | | 3% | | 4% |
Mid Cap Value | | 0% | | 0% | | 3% | | 4% | | 5% |
Small Cap Growth | | 1% | | 2% | | 2% | | 2% | | 1% |
Small Cap Value | | 2% | | 2% | | 1% | | 1% | | 0% |
| | | | | |
INTERNATIONAL STOCKS | | | | | | | | | | |
Europe/Australasia/Far East (except Japan) | | 7% | | 9% | | 12% | | 15% | | 16% |
Japan | | 2% | | 2% | | 3% | | 3% | | 4% |
| | | | | |
BONDS | | | | | | | | | | |
Intermediate-Term Government | | 65% | | 50% | | 31% | | 11% | | 0% |
Long-Term Government | | 0% | | 0% | | 5% | | 13% | | 14% |
| | | | | |
CASH EQUIVALENTS | | | | | | | | | | |
U.S. Treasury Bills | | 2% | | 2% | | 1% | | 2% | | 1% |
TOTAL | | 100% | | 100% | | 100% | | 100% | | 100% |
4
PERFORMANCEHIGHLIGHTS | | WELLSFARGOOUTLOOKFUNDS |
|
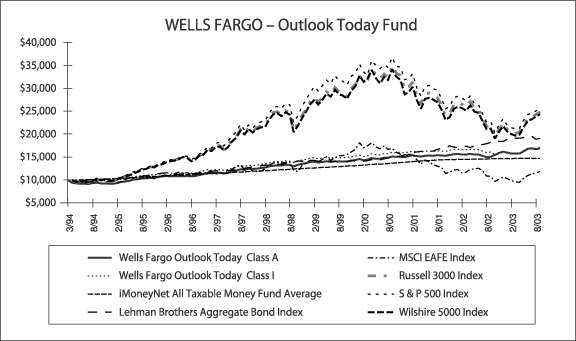
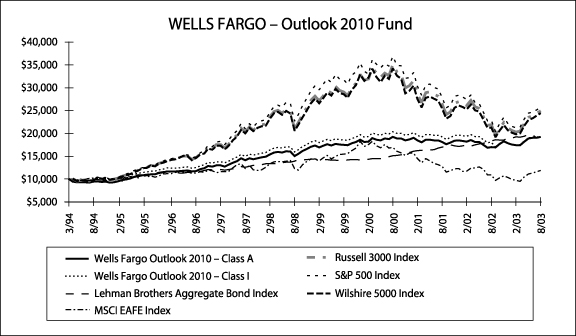
GROWTH OF $10,000 INVESTMENT CHARTS10
5
| WELLSFARGOOUTLOOKFUNDS | | PERFORMANCEHIGHLIGHTS |
|
6
PERFORMANCEHIGHLIGHTS | | WELLSFARGOOUTLOOKFUNDS |
|

1 Figures quoted represent past performance, which is no guarantee of future results and do not reflect the deduction of taxes that a shareholder may pay on fund distributions or the redemption of fund shares. Investment return and principal value of an investment will fluctuate so that an investor’s shares, when redeemed, may be worth more or less than their original cost. The Funds’ Adviser has committed through June 30, 2004 to waive fees and/or reimburse expenses to the extent necessary to maintain a certain net operating expense ratio for the Funds. Actual reductions of operating expenses can increase total return to shareholders. Without these reductions, the Funds’ returns would have been lower.
Performance shown for Class A, Class B and Class C shares of each of the Wells Fargo Outlook Funds (formerly LifePath Funds) for periods prior to November 8, 1999, reflects performance of the Class A, Class B and Class C shares of the corresponding Stagecoach LifePath Funds, their predecessor funds. Performance shown for the Class B shares of the Outlook Today Fund (formerly LifePath Opportunity Fund) for periods prior to August 1, 1998 reflects the performance of the Class A shares of the Outlook Today Fund adjusted to reflect the Class B shares contingent-deferred sales charge (CDSC) and expenses. Performance shown for the Class B shares of all other Outlook Funds for periods prior to March 1, 1997 reflects the performance of the Class A shares of the corresponding Outlook Funds adjusted to reflect the Class B share CDSCs and expenses. Performance shown for the Class C shares of the Outlook 2040 Fund (formerly LifePath 2040 Fund) for periods prior to July 1, 1998 reflects the performance of the Class B shares of the Outlook 2040 Fund adjusted to reflect the Class C shares CDSCs and expenses. Performance shown for the Class C shares of all other Outlook Funds for periods prior to December 1, 1998 reflects the performance of the Class B shares of the corresponding Outlook Funds adjusted to reflect the Class C share CDSCs and expenses. Performance shown for Institutional Class shares of each of the Wells Fargo Outlook Funds for periods prior to November 8, 1999, reflects performance of the Class A shares of the corresponding Stagecoach LifePath Funds, their predecessor funds, adjusted to reflect the sales charges and expenses of the Institutional Class shares. Effective at the close of business November 5, 1999, the Stagecoach Funds were reorganized into the Wells Fargo Funds.
2 For Class A shares, the maximum front-end sales charge is 5.75%. The maximum contingent deferred sales charge (“CDSC”) for Class B shares is 5.00%. For Class C shares, the maximum front-end sales charge is 1.00% and the maximum CDSC is 1.00%. Performance including sales charge assumes the maximum sales charge for the period shown. Institutional Class shares are sold without sales charges.
3 The iMoneyNet All Taxable Money Fund Average includes all taxable retail and institutional money funds. It is made up of funds in the Treasury Retail, Treasury Institutional, Treasury & Repo Retail, Treasury & Repo Institutional, Government & Agency Retail, Government & Agency Institutional, First Tier Retail, First Tier Institutional, Second Tier Retail, and Second Tier Institutional categories.
4 The Lehman Brothers Aggregate Bond Index is composed of the Lehman Brothers Government/Credit Index and the Lehman Brothers Mortgage-Backed Securities Index and includes Treasury issues, agency issues, corporate bond issues and mortgage-backed securities. The Fund is a professionally managed mutual fund. You cannot invest directly in an index.
5 The Morgan Stanley Capital International/Europe, Australasia and Far East (“MSCI EAFE”) Stock Index is an unmanaged group of securities widely regarded by investors to be representations of the stock markets of Europe, Australasia and the Far East. You cannot invest directly in an Index.
6 The Fund has selected the Russell 3000 Index to replace the Wilshire 5000 Index going forward because the Russell 3000 Index is more representative of the breadth of the Fund’s holdings. The Russell 3000 Index measures the performance of the 3,000 largest U.S. companies based on total market capitalization, which represents approximately 98% of the investable U.S. equity market. You cannot invest in an index.
7 “Standard & Poor’s”, “S&P”, “S&P 500”, “Standard & Poor’s 500” and “500” are trademarks of McGraw-Hill, Inc. and have been licensed. The Funds are not sponsored, endorsed, sold or promoted by Standard & Poor’s and Standard & Poor’s makes no representation regarding the advisability of investing in the Funds. The S&P 500 Index is an unmanaged index of 500 widely held common stocks representing, among others, industrial, financial, utility, and transportation companies listed or traded on national exchanges or over-the-counter markets. You cannot invest directly in an index.
7
| WELLSFARGOOUTLOOKFUNDS | | PERFORMANCEHIGHLIGHTS |
|
8 “Wilshire 5000” is a trademark and “Wilshire” is a service mark of Wilshire Associates Incorporated. The Funds are not sponsored, endorsed, sold or promoted by Wilshire Associates Incorporated or any of its subsidiaries or affiliates, and it makes no representation regarding the advisability of investing in the Funds. The Wilshire 5000 Index is comprised of over 6,500 U.S. equity securities with readily available price data. The Index includes all New York Stock Exchange and American Stock Exchange issues, and active over-the-counter equity issues. You cannot invest directly in an index.
9 Portfolio holdings are subject to change.
10 The charts compare the performance of the Wells Fargo Outlook Funds Class A and Institutional Class shares for the life of the Fund with the S&P 500 Index, Lehman Brothers Aggregate Bond Index, MSCI EAFE, the iMoneyNet All Taxable Money Fund Average, the Russell 3000 Index and the Wilshire 5000 Index. The charts assume a hypothetical $10,000 investment in Class A and Institutional Class shares and reflects all operating expenses and, for Class A shares, assumes the maximum initial sales charge of 5.75%. The indexes presented do not incur expenses and are not available directly for investment. Had these indexes incurred operating expenses, their performance would have been lower.
8
PORTFOLIOOFINVESTMENTS —AUGUST 31, 2003 (UNAUDITED) | | WELLSFARGOOUTLOOKTODAYFUND |
|
| Shares | | Security Name | | Value |
| Common Stock – 33.80% | | | |
|
| AGRICULTURAL PRODUCTION CROPS — 0.01% |
385 | | Alico Incorporated | | $ | 10,896 |
| | | | |
|
|
|
| AMUSEMENT & RECREATION SERVICES — 0.07% |
| 314 | | Harrah's Entertainment Incorporated | | | 13,005 |
| 584 | | International Game Technology | | | 15,091 |
| 1,170 | | Penn National Gaming Incorporated† | | | 25,916 |
| | |
| | | | | | 54,012 |
| | | | |
|
|
|
| APPAREL & ACCESSORY STORES — 0.18% |
| 750 | | Christopher & Banks Corporation† | | | 22,274 |
| 1,944 | | Gap Incorporated | | | 40,610 |
| 556 | | Kohl’s Corporation† | | | 35,167 |
| 1,312 | | Limited Brands | | | 22,252 |
| 766 | | Nordstrom Incorporated | | | 19,970 |
| | |
| | | | | | 140,273 |
| | | | |
|
|
|
APPAREL & OTHER FINISHED PRODUCTS MADE
FROM FABRICS & SIMILAR MATERIALS — 0.10% |
| 3,402 | | Benetton Group SpA ADR | | | 69,333 |
| 271 | | Liz Claiborne Incorporated | | | 9,341 |
| | |
| | | | | | 78,674 |
| | | | |
|
|
|
AUTOMOTIVE DEALERS & GASOLINE SERVICE
STATIONS — 0.07% |
| 86 | | AutoZone Incorporated† | | | 7,894 |
| 289 | | CarMax Incorporated | | | 11,141 |
| 1,142 | | MarineMax Incorporated† | | | 16,582 |
| 721 | | United Auto Group Incorporated† | | | 18,458 |
| | |
| | | | | | 54,075 |
| | | | |
|
|
|
AUTOMOTIVE REPAIR, SERVICES, &
PARKING — 0.03% |
| 682 | | Ryder System Incorporated | | | 20,480 |
| | | | |
|
|
|
| BANKS — 0.11% |
| 4,413 | | Sanpaolo IMI SpA ADR | | | 85,171 |
| | | | |
|
|
|
BUILDING CONSTRUCTION-GENERAL
CONTRACTORS & OPERATIVE BUILDERS — 0.01% |
| 15 | | Centex Corporation | | | 1,130 |
| 16 | | KB Home | | | 916 |
| 1 | | MDC Holdings Incorporated | | | 26 |
| | |
| | | | | | 2,072 |
| | | | |
|
|
|
BUILDING MATERIALS, HARDWARE, GARDEN
SUPPLY & MOBILE HOME DEALERS — 0.27% |
| 1,198 | | Central Garden & Pet Company† | | | 33,340 |
| 3,539 | | Home Depot Incorporated | | | 113,815 |
| 1,078 | | Lowe's Companies Incorporated | | | 59,139 |
| 261 | | Sherwin-Williams Company | | | 7,851 |
| | |
| | | | | | 214,145 |
| | | | |
|
|
|
| BUSINESS SERVICES — 2.17% |
| 690 | | Adobe Systems Incorporated | | | 26,793 |
| 193 | | Advo Incorporated† | | | 8,521 |
| 2,872 | | Akamai Technologies Incorporated† | | | 11,948 |
| Shares | | Security Name | | Value |
| 227 | | Arbitron Incorporated† | | $ | 8,394 |
| 951 | | Automatic Data Processing Incorporated | | | 37,954 |
| 188 | | Avocent Corporation† | | | 5,490 |
| 1,508 | | BEA Systems Incorporated† | | | 20,433 |
| 1,121 | | BMC Software Incorporated† | | | 16,456 |
| 2,366 | | Cendant Corporation† | | | 42,541 |
| 571 | | Citrix Systems Incorporated† | | | 11,757 |
| 451 | | Cognizant Technology Solutions Corporation† | | | 15,708 |
| 1,409 | | Computer Associates International Incorporated | | | 36,113 |
| 552 | | Computer Sciences Corporation† | | | 23,499 |
| 1,339 | | Compuware Corporation† | | | 7,967 |
| 1,400 | | Concord EFS Incorporated† | | | 19,390 |
| 707 | | Datastream Systems Incorporated† | | | 6,681 |
| 98 | | Deluxe Corporation | | | 4,185 |
| 593 | | Digimarc Corporation† | | | 9,785 |
| 1,332 | | eBay Incorporated† | | | 73,966 |
| 1,614 | | Electro Rent Corporation | | | 19,336 |
| 296 | | Electronic Arts Incorporated† | | | 26,566 |
| 971 | | Electronic Data Systems Corporation | | | 21,197 |
| 2,605 | | Enterasys Networks Incorporated† | | | 15,031 |
| 836 | | Equifax Incorporated | | | 19,178 |
| 982 | | eUniverse Incorporated†(a) | | | 1,748 |
| 809 | | F5 Networks Incorporated† | | | 15,864 |
| 209 | | Factset Research Systems Incorporated | | | 10,147 |
| 1,242 | | FalconStor Software Incorporated† | | | 7,353 |
| 1,323 | | First Data Corporation | | | 50,803 |
| 60 | | Hudson Highland Group Incorporated† | | | 1,253 |
| 110 | | Hyperion Solutions Corporation† | | | 3,628 |
| 1,115 | | IMS Health Incorporated | | | 21,709 |
| 1,042 | | Interpublic Group of Companies Incorporated | | | 15,786 |
| 356 | | Intuit Incorporated† | | | 16,134 |
| 16,604 | | Microsoft Corporation | | | 440,335 |
| 708 | | Mindspeed Technologies Incorporated† | | | 2,492 |
| 800 | | Monster Worldwide Incorporated† | | | 21,856 |
| 468 | | NCR Corporation† | | | 13,577 |
| 723 | | Novell Incorporated† | | | 3,637 |
| 317 | | Omnicom Group Incorporated | | | 24,758 |
| 8,705 | | Oracle Corporation† | | | 111,250 |
| 1,000 | | PeopleSoft Incorporated† | | | 18,100 |
| 757 | | Radisys Corporation† | | | 13,437 |
| 3,567 | | Rentokil Initial plc ADR | | | 59,242 |
| 982 | | Reuters Group plc ADR | | | 23,195 |
| 1,846 | | SAP AG ADR | | | 55,269 |
| 1,300 | | Secure Computing Corporation† | | | 14,157 |
| 1,378 | | Siebel Systems Incorporated† | | | 13,890 |
| 7,434 | | Sun Microsystems Incorporated† | | | 28,695 |
9
| WELLSFARGOOUTLOOKTODAYFUND | | PORTFOLIOOFINVESTMENTS —AUGUST 31, 2003 (UNAUDITED) |
|
| Shares | | Security Name | | Value |
| Common Stock (Continued) | | | |
| 653 | | Sungard Data Systems Incorporated† | | $ | 18,415 |
| 172 | | Symantec Corporation† | | | 9,878 |
| 168 | | Synopsys Incorporated† | | | 11,459 |
| 1,100 | | Transaction Systems Architects Incorporated Class A† | | | 15,664 |
| 1,668 | | Unisys Corporation† | | | 21,651 |
| 721 | | Vastera Incorporated† | | | 3,915 |
| 905 | | Veritas Software Corporation† | | | 31,204 |
| 930 | | Verity Incorporated† | | | 11,086 |
| 700 | | Websense Incorporated† | | | 16,660 |
| 1,264 | | WPP Group plc ADR | | | 58,005 |
| 1,284 | | Yahoo! Incorporated† | | | 42,886 |
| | |
| | | | | | 1,718,027 |
| | | | |
|
|
|
| CHEMICALS & ALLIED PRODUCTS — 3.46% |
| 2,404 | | Abbott Laboratories | | | 96,881 |
| 439 | | Air Products & Chemicals Incorporated | | | 20,773 |
| 2,644 | | Akzo Nobel NV ADR | | | 86,274 |
| 144 | | Alberto-Culver Company Class B | | | 8,220 |
| 2,061 | | Amgen Incorporated† | | | 135,820 |
| 2,440 | | AstraZeneca plc ADR | | | 96,746 |
| 1,146 | | Aventis SA ADR | | | 56,154 |
| 99 | | Avery Dennison Corporation | | | 5,420 |
| 353 | | Avon Products Incorporated | | | 22,627 |
| 144 | | Barr Laboratories Incorporated† | | | 9,744 |
| 519 | | Biogen Incorporated† | | | 20,480 |
| 2,906 | | Bristol-Myers Squibb Company | | | 73,725 |
| 1,412 | | Centerpulse ADR | | | 38,858 |
| 489 | | Chiron Corporation† | | | 24,851 |
| 421 | | Clorox Company | | | 18,040 |
| 812 | | Colgate-Palmolive Company | | | 44,887 |
| 1,400 | | Corixa Corporation† | | | 11,130 |
| 1,572 | | Dow Chemical Company | | | 54,281 |
| 1,395 | | E I Du Pont de Nemours & Company | | | 62,412 |
| 113 | | Eastman Chemical Company | | | 4,047 |
| 305 | | Ecolab Incorporated | | | 7,866 |
| 1,771 | | Eli Lilly & Company | | | 117,825 |
| 807 | | Forest Laboratories Incorporated† | | | 37,929 |
| 256 | | Genentech Incorporated† | | | 20,326 |
| 555 | | Genzyme Corporation† | | | 26,168 |
| 812 | | Georgia Gulf Corporation | | | 18,148 |
| 97 | | Gilead Sciences Incorporated† | | | 6,470 |
| 1,725 | | Gillette Company | | | 55,994 |
| 3,238 | | GlaxoSmithKline plc ADR | | | 125,732 |
| 743 | | Great Lakes Chemical Corporation | | | 15,744 |
| 432 | | IDEC Pharmaceuticals Corporation† | | | 15,012 |
| 464 | | International Flavors & Fragrances Incorporated | | | 14,616 |
| 900 | | King Pharmaceuticals Incorporated† | | | 12,645 |
| 134 | | Martek Biosciences Corporation† | | | 6,913 |
| 546 | | MedImmune Incorporated† | | | 19,039 |
| 3,343 | | Merck & Company Incorporated | | | 168,220 |
| 842 | | MGI Pharma Incorporated† | | | 32,493 |
| Shares | | Security Name | | Value |
| 164 | | Neurocrine Biosciences Incorporated† | | $ | 8,776 |
| 3,583 | | Novartis AG ADR | | | 132,464 |
| 1,104 | | Novo Nordisk A/S ADR | | | 39,468 |
| 1,307 | | OraSure Technologies Incorporated† | | | 11,763 |
| 139 | | OSI Pharmaceuticals Incorporated† | | | 5,296 |
| 850 | | Penwest Pharmaceuticals† | | | 18,598 |
| 12,251 | | Pfizer Incorporated | | | 366,550 |
| 245 | | PPG Industries Incorporated | | | 13,453 |
| 197 | | Praxair Incorporated | | | 12,573 |
| 1,614 | | Procter & Gamble Company | | | 140,886 |
| 1,550 | | Roche Holding AG ADR | | | 118,695 |
| 510 | | Rohm & Haas Company | | | 18,528 |
| 2,508 | | Schering-Plough Corporation | | | 38,097 |
| 300 | | Sepracor Incorporated† | | | 8,076 |
| 7,000 | | Shiseido Company Limited ADR | | | 73,252 |
| 111 | | Sigma-Aldrich Corporation | | | 6,077 |
| 2,292 | | Unifi Incorporated† | | | 15,792 |
| 515 | | Watson Pharmaceuticals Incorporated† | | | 21,167 |
| 2,005 | | WR Grace & Company† | | | 6,755 |
| 2,053 | | Wyeth | | | 87,971 |
| | |
| | | | | | 2,736,747 |
| | | | |
|
|
|
| COMMERCIAL SERVICES — 0.03% |
| 4,900 | | Stewart Enterprises Incorporated† | | | 20,188 |
| | | | |
|
|
|
| COMMUNICATIONS — 1.96% |
| 778 | | Alltel Corporation | | | 35,632 |
| 1,937 | | AT&T Corporation | | | 43,195 |
| 6,650 | | AT&T Wireless Services Incorporated† | | | 57,323 |
| 1,061 | | Avaya Incorporated† | | | 11,087 |
| 871 | | Beasley Broadcast Group Incorporated Class A† | | | 12,778 |
| 3,874 | | BellSouth Corporation | | | 97,625 |
| 1,139 | | British Sky Broadcasting Group plc ADR† | | | 48,385 |
| 2,005 | | BT Group plc ADR† | | | 58,847 |
| 593 | | CenturyTel Incorporated | | | 20,613 |
| 568 | | Certegy Incorporated† | | | 17,182 |
| 1,302 | | Clear Channel Communications Incorporated† | | | 58,746 |
| 7,624 | | Comcast Corporation† | | | 226,814 |
| 3,827 | | Deutsche Telekom AG ADR | | | 54,879 |
| 168 | | Echostar Communications Corporation† | | | 6,199 |
| 1,569 | | France Telecom SA ADR | | | 38,911 |
| 1 | | ITC Deltacom Incorporated† | | | 4 |
| 170 | | Liberty Corporation | | | 7,293 |
| 1,837 | | Nextel Communications Incorporated† | | | 35,417 |
| 1,658 | | Nippon Telegraph & Telephone Corporation ADR | | | 36,791 |
| 1,502 | | NTT DoCoMo Incorporated ADR† | | | 38,857 |
| 2,349 | | Qwest Communications International† | | | 10,453 |
10
PORTFOLIOOFINVESTMENTS —AUGUST 31, 2003 (UNAUDITED) | | WELLSFARGOOUTLOOKTODAYFUND |
|
| Shares | | Security Name | | Value |
| Common Stock (Continued) | | | |
| 6,107 | | SBC Communications Incorporated | | $ | 137,346 |
| 2,309 | | Sprint Corporation (FON Group) | | | 34,104 |
| 3,205 | | Sprint Corporation (PCS Group)† | | | 16,634 |
| 699 | | Telecom Corporation of New Zealand Limited ADR | | | 16,217 |
| 2,598 | | Telefonica SA ADR† | | | 92,229 |
| 514 | | Tivo Incorporated† | | | 5,587 |
| 203 | | Univision Communications Incorporated† | | | 7,610 |
| 4,322 | | Verizon Communications Incorporated | | | 152,654 |
| 9,383 | | Vodafone Group plc ADR | | | 171,709 |
| | |
| | | | | | 1,551,121 |
| | | | |
|
|
|
CONSTRUCTION SPECIAL TRADE
CONTRACTORS — 0.02% |
| 111 | | EMCOR Group Incorporated† | | | 4,892 |
| 193 | | Whirlpool Corporation | | | 13,429 |
| | |
| | | | | | 18,321 |
| | | | |
|
|
|
| DEPOSITORY INSTITUTIONS — 4.11% |
| 5,236 | | ABN AMRO Holding NV ADR | | | 92,363 |
| 2,122 | | Allied Irish Banks plc ADR | | | 59,586 |
| 1,098 | | AmSouth Bancorporation | | | 23,651 |
| 5,215 | | Banco Bilbao Vizcaya Argentaria
SA ADR | | | 56,061 |
| 1,279 | | Banco Comercial Portugues SA ADR | | | 11,319 |
| 5,739 | | Banco Santander Central Hispano SA ADR | | | 49,241 |
| 2,379 | | Bank of America Corporation | | | 188,536 |
| 1,592 | | Bank of New York Company Incorporated | | | 46,837 |
| 2,220 | | Bank One Corporation | | | 87,623 |
| 1,482 | | Bankunited Financial Corporation Class A† | | | 32,219 |
| 3,203 | | Barclays plc ADR | | | 94,745 |
| 1,026 | | BB&T Corporation | | | 37,470 |
| 3,818 | | BNP Paribas SA ADR | | | 95,111 |
| 395 | | Cascade Bancorp | | | 7,118 |
| 1,212 | | Central Coast Bancorp† | | | 20,859 |
| 590 | | Charter One Financial Incorporated | | | 18,290 |
| 416 | | Chittenden Corporation | | | 11,997 |
| 9,319 | | Citigroup Incorporated | | | 403,979 |
| 145 | | City Bank Lynnwood WA | | | 4,710 |
| 272 | | Coastal Financial Corporation | | | 4,189 |
| 293 | | Comerica Incorporated | | | 14,457 |
| 119 | | Corus Bankshares Incorporated | | | 6,164 |
| 1,319 | | Deutsche Bank AG | | | 76,819 |
| 1,062 | | Fifth Third Bancorp | | | 62,233 |
| 196 | | First Bancorp | | | 6,019 |
| 949 | | First of Long Island Corporation | | | 40,760 |
| 153 | | First Tennessee National Corporation | | | 6,327 |
| 1,156 | | Firstfed America Bancorp Incorporated | | | 23,004 |
| 2,213 | | FleetBoston Financial Corporation | | | 65,483 |
| Shares | | Security Name | | Value |
| 125 | | Golden West Financial Corporation | | $ | 10,784 |
| 2,791 | | HBOS plc ADR | | | 93,238 |
| 2,841 | | HSBC Holdings plc ADR | | | 182,733 |
| 1,334 | | Huntington Bancshares Incorporated | | | 26,680 |
| 634 | | Itla Capital Corporation† | | | 28,530 |
| 4,018 | | JP Morgan Chase & Company | | | 137,496 |
| 1,000 | | KeyCorp | | | 27,180 |
| 727 | | Marshall & Ilsley Corporation | | | 22,537 |
| 131 | | MB Financial Incorporated | | | 5,633 |
| 921 | | Mellon Financial Corporation | | | 28,873 |
| 592 | | National Australia Bank | | | 59,851 |
| 1,093 | | National City Corporation | | | 34,626 |
| 412 | | New York Community Bancorp Incorporated | | | 12,673 |
| 558 | | Northern Trust Corporation | | | 23,570 |
| 330 | | PNC Financial Services Group | | | 15,708 |
| 501 | | Regions Financial Corporation | | | 17,665 |
| 785 | | SouthTrust Corporation | | | 22,757 |
| 784 | | State Street Corporation | | | 34,457 |
| 6,014 | | Sumitomo Mitsui Financial Group Incorporated | | | 20,978 |
| 1,040 | | Sun Bancorp Incorporated† | | | 22,506 |
| 402 | | SunTrust Banks Incorporated | | | 24,574 |
| 1,148 | | Synovus Financial Corporation | | | 28,069 |
| 1,009 | | Troy Financial Corporation | | | 35,557 |
| 555 | | Union Planters Corporation | | | 17,705 |
| 3,939 | | US Bancorp | | | 94,142 |
| 1,037 | | USB Holding Company Incorporated | | | 19,091 |
| 2,439 | | Wachovia Corporation | | | 102,804 |
| 1,662 | | Washington Mutual Incorporated | | | 64,785 |
| 2,915 | | Wells Fargo & Company‡ | | | 146,158 |
| 2,472 | | Westpac Banking Corporation ADR | | | 126,418 |
| 771 | | Wintrust Financial Corporation | | | 27,263 |
| 1,088 | | WSFS Financial Corporation | | | 47,546 |
| 999 | | Yardville National Bancorp | | | 21,978 |
| 233 | | Zions Bancorporation | | | 12,974 |
| | |
| | | | | | 3,244,709 |
| | | | |
|
|
|
| EATING & DRINKING PLACES — 0.17% |
| 1,079 | | Darden Restaurants Incorporated | | | 23,521 |
| 2,416 | | McDonald's Corporation | | | 54,167 |
| 121 | | PF Chang's China Bistro Incorporated† | | | 5,627 |
| 229 | | Rare Hospitality International Incorporated† | | | 8,720 |
| 747 | | Wendy's International Incorporated | | | 23,568 |
| 546 | | Yum! Brands Incorporated† | | | 16,189 |
| | |
| | | | | | 131,792 |
| | | | |
|
|
|
| EDUCATIONAL SERVICES — 0.06% |
| 405 | | Apollo Group Incorporated
Class A† | | | 25,948 |
| 152 | | Corinthian Colleges Incorporated† | | | 8,748 |
| 141 | | ITT Educational Services Incorporated† | | | 6,112 |
| 104 | | Strayer Education Incorporated | | | 9,932 |
| | |
| | | | | | 50,740 |
| | | | |
|
|
11
| WELLSFARGOOUTLOOKTODAYFUND | | PORTFOLIOOFINVESTMENTS —AUGUST 31, 2003 (UNAUDITED) |
|
| Shares | | Security Name | | Value |
| Common Stock (Continued) | | | |
|
| ELECTRIC, GAS, & SANITARY SERVICES — 1.34% |
| 2,178 | | AES Corporation† | | $ | 14,113 |
| 1,156 | | Allied Waste Industries Incorporated† | | | 12,785 |
| 421 | | Ameren Corporation | | | 17,893 |
| 424 | | American Electric Power Company Incorporated | | | 12,003 |
| 685 | | American States Water Company | | | 17,139 |
| 232 | | Black Hills Corporation | | | 7,519 |
| 2,000 | | Calpine Corporation† | | | 11,280 |
| 815 | | CenterPoint Energy Incorporated | | | 6,919 |
| 212 | | CH Energy Group Incorporated | | | 9,381 |
| 523 | | Cinergy Corporation | | | 17,897 |
| 764 | | CMS Energy Corporation† | | | 5,096 |
| 464 | | Consolidated Edison Incorporated | | | 18,342 |
| 607 | | Constellation Energy Group Incorporated | | | 22,089 |
| 516 | | Dominion Resources Incorporated | | | 31,259 |
| 434 | | DTE Energy Company | | | 15,151 |
| 2,159 | | Duke Energy Corporation | | | 36,876 |
| 1,802 | | E.ON AG ADR | | | 93,596 |
| 1,252 | | Edison International† | | | 23,613 |
| 1,456 | | El Paso Corporation | | | 10,687 |
| 6,728 | | Endesa SA ADR | | | 105,293 |
| 361 | | Entergy Corporation | | | 18,934 |
| 473 | | Exelon Corporation | | | 27,860 |
| 680 | | FirstEnergy Corporation | | | 19,897 |
| 399 | | FPL Group Incorporated | | | 24,682 |
| 182 | | Kinder Morgan Incorporated | | | 9,692 |
| 3,094 | | National Grid Transco plc ADR | | | 95,450 |
| 572 | | Nicor Incorporated | | | 19,442 |
| 807 | | NiSource Incorporated | | | 15,607 |
| 850 | | Peoples Energy Corporation | | | 34,128 |
| 1,222 | | PG&E Corporation† | | | 27,092 |
| 483 | | Progress Energy Incorporated | | | 19,557 |
| 402 | | Public Service Enterprise Group Incorporated | | | 17,021 |
| 3,890 | | Scottish Power plc ADR | | | 91,804 |
| 252 | | Sempra Energy | | | 7,497 |
| 728 | | South Jersey Industries Incorporated | | | 27,919 |
| 1,340 | | Southern Company | | | 38,029 |
| 40 | | Texas Genco Holdings Incorporated | | | 980 |
| 600 | | TXU Corporation | | | 13,200 |
| 174 | | UIL Holdings Corporation | | | 6,273 |
| 889 | | Waste Management Incorporated | | | 23,656 |
| 1,282 | | Williams Companies Incorporated | | | 11,705 |
| 1,257 | | Xcel Energy Incorporated | | | 18,414 |
| | |
| | | | | | 1,057,770 |
| | | | |
|
|
|
ELECTRONIC & OTHER ELECTRICAL EQUIPMENT & COMPONENTS, EXCEPT
COMPUTER EQUIPMENT — 2.99% |
| 2,023 | | Acuity Brands Incorporated | | | 36,232 |
| 1,652 | | Advanced Micro Devices Incorporated† | | | 18,651 |
| 773 | | Altera Corporation† | | | 17,346 |
| Shares | | Security Name | | Value |
| 218 | | Ametek Incorporated | | $ | 9,147 |
| 612 | | Analog Devices Incorporated† | | | 25,092 |
| 907 | | Andrew Corporation† | | | 11,229 |
| 1,214 | | Applied Micro Circuits Corporation† | | | 7,053 |
| 830 | | Broadcom Corporation† | | | 22,808 |
| 1,459 | | Canon Incorporated ADR | | | 70,703 |
| 721 | | Catapult Communications Corporation† | | | 9,597 |
| 2,484 | | Chartered Semiconductor Manufacturing Limited ADR† | | | 16,320 |
| 1,400 | | CIENA Corporation† | | | 9,100 |
| 1,293 | | Comverse Technology Incorporated† | | | 21,322 |
| 2,126 | | Conexant Systems Incorporated† | | | 11,650 |
| 238 | | Cree Incorporated† | | | 3,765 |
| 757 | | Cubic Corporation | | | 19,962 |
| 584 | | Emerson Electric Company | | | 32,564 |
| 1,340 | | Fujitsu Limited ADR | | | 32,042 |
| 15,122 | | General Electric Company | | | 447,158 |
| 9,848 | | Intel Corporation | | | 281,850 |
| 311 | | Interdigital Communications Corporation† | | | 5,520 |
| 2,546 | | International Business Machines Corporation | | | 208,797 |
| 757 | | Jabil Circuit Incorporated† | | | 21,310 |
| 3,942 | | JDS Uniphase Corporation† | | | 13,560 |
| 2,933 | | Koninklijke Philips Electronics NV NY Shares | | | 71,565 |
| 720 | | Linear Technology Corporation | | | 29,678 |
| 1,809 | | LSI Logic Corporation† | | | 20,876 |
| 692 | | Maxim Integrated Products | | | 31,078 |
| 606 | | Maytag Corporation | | | 16,423 |
| 1,345 | | Medis Technologies Limited† | | | 15,373 |
| 1,764 | | Micron Technology Incorporated† | | | 25,331 |
| 8,000 | | Minebea Company Limited ADR | | | 79,671 |
| 800 | | Molex Incorporated | | | 23,536 |
| 4,837 | | Motorola Incorporated | | | 51,901 |
| 1,204 | | Mykrolis Corporation† | | | 15,170 |
| 700 | | National Semiconductor Corporation† | | | 20,398 |
| 1,047 | | Network Appliance Incorporated† | | | 23,463 |
| 4,262 | | Nokia Oyj ADR | | | 69,428 |
| 385 | | Novellus Systems Incorporated† | | | 15,385 |
| 540 | | NVIDIA Corporation† | | | 9,806 |
| 303 | | Omron Corporation ADR | | | 61,415 |
| 2,678 | | Pioneer Corporation ADR | | | 59,693 |
| 1,200 | | PMC-Sierra Incorporated† | | | 17,112 |
| 250 | | QLogic Corporation† | | | 12,255 |
| 1,218 | | Qualcomm Incorporated | | | 50,279 |
| 318 | | Rambus Incorporated† | | | 5,298 |
| 835 | | Remec Incorporated† | | | 7,565 |
| 1,900 | | Sanmina-SCI Corporation† | | | 17,062 |
| 900 | | Seachange International Incorporated† | | | 9,207 |
| 315 | | Skyworks Solutions Incorporated† | | | 3,572 |
| 2,629 | | Solectron Corporation† | | | 15,590 |
| 1,001 | | Sony Corporation ADR | | | 32,983 |
| 1,658 | | STMicroelectronics NV ADR | | | 41,351 |
12
PORTFOLIOOFINVESTMENTS —AUGUST 31, 2003 (UNAUDITED) | | WELLSFARGOOUTLOOKTODAYFUND |
|
| Shares | | Security Name | | Value |
| Common Stock (Continued) | | | |
| 1,791 | | Tellabs Incorporated† | | $ | 11,695 |
| 3,578 | | Texas Instruments Incorporated | | | 85,335 |
| 894 | | Thomas & Betts Corporation† | | | 15,270 |
| 457 | | Tollgrade Communications Incorporated† | | | 8,048 |
| 700 | | Vitesse Semiconductor Corporation† | | | 4,781 |
| 855 | | Xilinx Incorporated† | | | 26,369 |
| | |
| | | | | | 2,356,740 |
| | | | |
|
|
|
ENGINEERING, ACCOUNTING, RESEARCH
MANAGEMENT & RELATED SERVICES — 0.27% |
| 921 | | Antigenics Incorporated† | | | 13,023 |
| 693 | | Atrix Laboratories Incorporated† | | | 20,929 |
| 450 | | Charles River Associates Incorporated† | | | 15,138 |
| 150 | | Corporate Executive Board Company† | | | 6,623 |
| 2,107 | | First Consulting Group Incorporated† | | | 9,903 |
| 437 | | Fluor Corporation | | | 16,099 |
| 1,000 | | Gene Logic Incorporated† | | | 5,130 |
| 1,100 | | Millennium Pharmaceutical† | | | 15,290 |
| 578 | | Monsanto Company | | | 14,860 |
| 337 | | Moody's Corporation | | | 17,477 |
| 983 | | Paychex Incorporated | | | 35,388 |
| 771 | | Per-Se Technologies Incorporated† | | | 12,390 |
| 215 | | Quest Diagnostic Incorporated† | | | 12,900 |
| 1,472 | | Quintiles Transnational† | | | 20,960 |
| | |
| | | | | | 216,110 |
| | | | |
|
|
|
FABRICATED METAL PRODUCTS, EXCEPT
MACHINERY & TRANSPORTATION EQUIPMENT — 0.21% |
| 133 | | Ball Corporation | | | 7,023 |
| 606 | | Crane Company | | | 15,508 |
| 211 | | Fortune Brands Incorporated | | | 11,900 |
| 988 | | Griffon Corporation† | | | 18,624 |
| 1,342 | | Gulf Island Fabrication Incorporated† | | | 21,083 |
| 408 | | Illinois Tool Works Incorporated | | | 29,494 |
| 976 | | Masco Corporation | | | 24,195 |
| 159 | | Simpson Manufacturing Company Incorporated† | | | 7,568 |
| 596 | | Snap-On Incorporated | | | 17,582 |
| 578 | | Watts Industries Incorporated Class A | | | 10,612 |
| | |
| | | | | | 163,589 |
| | | | |
|
|
|
| FINANCIAL SERVICES — 0.03% |
| 1,547 | | Janus Capital Group Incorporated | | | 26,717 |
| | | | |
|
|
|
| FOOD & KINDRED PRODUCTS — 1.22% |
| 52 | | Adolph Coors Company | | | 2,868 |
| 129 | | American Italian Pasta Company
Class A† | | | 5,382 |
| 672 | | Anheuser-Busch Companies Incorporated | | | 34,635 |
| 2,080 | | Archer-Daniels-Midland Company | | | 28,850 |
| 3,929 | | Cadbury Schweppes plc ADR | | | 96,575 |
| Shares | | Security Name | | Value |
| 880 | | Campbell Soup Company | | $ | 21,296 |
| 3,373 | | Coca-Cola Company | | | 146,793 |
| 1,029 | | Coca-Cola Enterprises Incorporated | | | 19,026 |
| 1,116 | | ConAgra Foods Incorporated | | | 24,552 |
| 208 | | Del Monte Foods Company† | | | 1,868 |
| 2,028 | | Diageo plc ADR | | | 88,705 |
| 548 | | General Mills Incorporated | | | 25,405 |
| 981 | | Hercules Incorporated† | | | 10,987 |
| 103 | | Hershey Foods Corporation | | | 7,200 |
| 498 | | Heinz (HJ) Company | | | 16,115 |
| 764 | | Kellogg Company | | | 25,617 |
| 10,035 | | Kirin Brewery Company Limited | | | 70,446 |
| 3,116 | | Nestle SA ADR | | | 169,645 |
| 518 | | Pepsi Bottling Group Incorporated | | | 12,494 |
| 2,383 | | PepsiCo Incorporated | | | 106,139 |
| 1,400 | | Sara Lee Corporation | | | 26,572 |
| 1,464 | | Topps Company Incorporated | | | 13,088 |
| 258 | | WM Wrigley Jr Company | | | 13,686 |
| | |
| | | | | | 967,944 |
| | | | |
|
|
|
| FOOD STORES — 0.31% |
| 1,107 | | Albertson's Incorporated | | | 23,269 |
| 2,790 | | Coles Myer Limited ADR | | | 105,881 |
| 1,586 | | Great Atlantic & Pacific Tea Company Incorporated† | | | 15,178 |
| 5,252 | | Koninklijke Ahold NV ADR | | | 48,844 |
| 1,014 | | Kroger Company† | | | 19,479 |
| 169 | | Panera Bread Company† | | | 7,461 |
| 717 | | Starbucks Corporation† | | | 20,391 |
| 843 | | Winn-Dixie Stores Incorporated | | | 8,472 |
| | |
| | | | | | 248,975 |
| | | | |
|
|
|
| FORESTRY — 0.04% |
| 505 | | Weyerhaeuser Company | | | 30,048 |
| | | | |
|
|
|
| FURNITURE & FIXTURES — 0.05% |
| 1,232 | | Leggett & Platt Incorporated | | | 28,533 |
| 589 | | Newell Rubbermaid Incorporated | | | 13,989 |
| | |
| | | | | | 42,522 |
| | | | |
|
|
|
| GENERAL MERCHANDISE STORES — 0.85% |
| 658 | | Big Lots Incorporated† | | | 12,041 |
| 633 | | Dillard’s Incorporated Class A | | | 9,577 |
| 962 | | Dollar General Corporation | | | 22,059 |
| 525 | | Federated Department Stores Incorporated | | | 22,943 |
| 721 | | Fred's Incorporated | | | 25,776 |
| 600 | | JC Penney Company Incorporated | | | 12,732 |
| 600 | | May Department Stores Company | | | 16,548 |
| 2,193 | | Mitsukoshi Limited ADR† | | | 60,144 |
| 586 | | Sears Roebuck & Company | | | 25,796 |
| 950 | | ShopKo Stores Incorporated† | | | 13,082 |
| 1,470 | | Target Corporation | | | 59,682 |
| 861 | | TJX Companies Incorporated | | | 18,649 |
| 6,354 | | Wal-Mart Stores Incorporated | | | 375,965 |
| | |
| | | | | | 674,994 |
| | | | |
|
|
13
| WELLSFARGOOUTLOOKTODAYFUND | | PORTFOLIOOFINVESTMENTS —AUGUST 31, 2003 (UNAUDITED) |
|
| Shares | | Security Name | | Value |
| Common Stock (Continued) | | | |
|
| HEALTH SERVICES — 0.15% |
| 680 | | Apria Healthcare Group Incorporated† | | $ | 17,612 |
| 914 | | HCA Incorporated | | | 34,723 |
| 915 | | Manor Care Incorporated | | | 25,254 |
| 461 | | Matria Healthcare Incorporated† | | | 7,132 |
| 648 | | Sierra Health Services Incorporated† | | | 12,642 |
| 1,340 | | Tenet Healthcare Corporation† | | | 21,507 |
| | |
| | | | | | 118,870 |
| | | | |
|
|
|
HOME FURNITURE, FURNISHINGS, & EQUIPMENT
STORES — 0.18% |
| 558 | | Bed Bath & Beyond Incorporated† | | | 24,011 |
| 525 | | Best Buy Company Incorporated† | | | 27,305 |
| 621 | | Brookstone Incorporated† | | | 17,543 |
| 921 | | Circuit City Stores Incorporated | | | 9,606 |
| 493 | | Cost Plus Incorporated† | | | 19,838 |
| 1,012 | | Movie Gallery Incorporated† | | | 21,667 |
| 549 | | RadioShack Corporation | | | 16,690 |
| 257 | | Ultimate Electronics Incorporated† | | | 3,297 |
| | |
| | | | | | 139,957 |
| | | | |
|
|
|
HOTELS, ROOMING HOUSES, CAMPS, & OTHER
LODGE PLACES — 0.06% |
| 1,685 | | Hilton Hotels Corporation | | | 25,747 |
| 470 | | Marriott International Incorporated | | | 19,190 |
| | |
| | | | | | 44,937 |
| | | | |
|
|
|
INDUSTRIAL & COMMERCIAL MACHINERY &
COMPUTER EQUIPMENT — 1.85% |
| 492 | | 3M Company | | | 70,095 |
| 925 | | Apple Computer Incorporated† | | | 20,933 |
| 3,307 | | Applied Materials Incorporated† | | | 71,431 |
| 1,209 | | Baker Hughes Incorporated | | | 40,453 |
| 172 | | Black & Decker Corporation | | | 7,358 |
| 284 | | Briggs & Stratton Corporation | | | 16,699 |
| 1,500 | | Brocade Communications Systems Incorporated† | | | 8,460 |
| 674 | | Caterpillar Incorporated | | | 48,413 |
| 10,918 | | Cisco Systems Incorporated† | | | 209,080 |
| 1,442 | | Computer Network Technology Corporation† | | | 11,392 |
| 378 | | Deere & Company | | | 21,361 |
| 3,977 | | Dell Incorporated† | | | 129,770 |
| 719 | | Dover Corporation | | | 27,336 |
| 170 | | Eaton Corporation | | | 15,919 |
| 4,817 | | EMC Corporation† | | | 61,417 |
| 785 | | Gardner Denver Incorporated† | | | 18,479 |
| 1,320 | | Gateway Incorporated† | | | 7,616 |
| 707 | | General Binding Corporation | | | 8,597 |
| 638 | | Global Imaging Systems Incorporated† | | | 16,403 |
| 6,098 | | Hewlett-Packard Company | | | 121,472 |
| 640 | | Hitachi Limited ADR | | | 34,970 |
| Shares | | Security Name | | Value |
| 407 | | Ingersoll-Rand Company Class A | | $ | 24,225 |
| 623 | | Juniper Networks Incorporated† | | | 10,728 |
| 620 | | Kadant Incorporated† | | | 11,718 |
| 303 | | Lexmark International Incorporated† | | | 20,313 |
| 450 | | Lufkin Industries Incorporated | | | 11,565 |
| 11,986 | | Makita Corporation | | | 105,477 |
| 6,604 | | NEC Corporation | | | 49,860 |
| 665 | | Pall Corporation | | | 16,625 |
| 38 | | Palm Incorporated† | | | 694 |
| 34 | | Pitney Bowes Incorporated | | | 1,326 |
| 154 | | Sandisk Corporation† | | | 9,311 |
| 1,760 | | Siemens AG | | | 109,613 |
| 360 | | Stanley Works | | | 10,897 |
| 595 | | United Technologies Corporation | | | 47,749 |
| 1,794 | | Vivendi Universal SA ADR† | | | 30,319 |
| 1,278 | | Watsco Incorporated | | | 23,643 |
| 379 | | Western Digital Corporation† | | | 4,353 |
| | |
| | | | | | 1,456,070 |
| | | | |
|
|
|
INSURANCE AGENTS, BROKERS & SERVICE — 0.12% |
| 622 | | AON Corporation | | | 13,808 |
| 130 | | Hilb, Rogal & Hamilton Company | | | 3,900 |
| 1,310 | | Humana Incorporated† | | | 23,043 |
795 | | Marsh & Mclennan Companies Incorporated | | | 39,750 |
403 | | Medco Health Solutions Incorporated† | | | 10,765 |
| | |
| | | | | | 91,266 |
| | | | |
|
|
|
| INSURANCE CARRIERS — 1.44% |
| 622 | | ACE Limited | | | 20,028 |
| 1,783 | | Aegon NV ADR | | | 22,216 |
| 347 | | Aetna Incorporated | | | 19,779 |
| 1,179 | | AFLAC Incorporated | | | 37,740 |
| 1,188 | | Allstate Corporation | | | 42,471 |
| 252 | | AMBAC Financial Group Incorporated | | | 16,360 |
| 4,789 | | American International Group Incorporated | | | 285,281 |
| 216 | | Anthem Incorporated† | | | 15,811 |
| 3,440 | | AXA ADR | | | 61,163 |
| 204 | | Chubb Corporation | | | 13,860 |
| 171 | | CIGNA Corporation | | | 8,153 |
| 411 | | Cincinnati Financial Corporation | | | 16,584 |
| 726 | | Cobalt Corporation | | | 14,368 |
| 490 | | Hartford Financial Services Group Incorporated | | | 26,078 |
| 3,630 | | ING Group NV ADR | | | 71,620 |
| 655 | | John Hancock Financial Services Incorporated | | | 19,997 |
| 69 | | Kansas City Life Insurance Company | | | 3,036 |
| 406 | | Landamerica Financial Group Incorporated | | | 18,635 |
| 333 | | Lincoln National Corporation | | | 11,795 |
| 113 | | Loews Corporation | | | 4,651 |
14
PORTFOLIOOFINVESTMENTS —AUGUST 31, 2003 (UNAUDITED) | | WELLSFARGOOUTLOOKTODAYFUND |
|
| Shares | | Security Name | | Value |
| Common Stock (Continued) |
| 26 | | Markel Corporation† | | $ | 6,988 |
| 281 | | MBIA Incorporated | | | 15,865 |
| 1,284 | | MetLife Incorporated | | | 36,491 |
| 213 | | MGIC Investment Corporation | | | 12,007 |
| 1,146 | | Millea Holdings Incorporated ADR | | | 58,606 |
| 777 | | Principal Financial Group | | | 24,444 |
| 787 | | ProAssurance Corporation† | | | 20,257 |
| 436 | | Progressive Corporation | | | 30,843 |
| 1,123 | | Prudential Financial Incorporated | | | 40,888 |
| 225 | | Safeco Corporation | | | 8,114 |
| 413 | | St Paul Companies Incorporated | | | 14,356 |
| 180 | | Torchmark Corporation | | | 7,265 |
| 1,809 | | Travelers Property Casualty Corporation Class B† | | | 28,021 |
| 926 | | UnitedHealth Group Incorporated | | | 45,772 |
| 900 | | UnumProvident Corporation | | | 12,690 |
| 264 | | WellPoint Health Networks Incorporated† | | | 20,592 |
| 290 | | XL Capital Limited Class A | | | 21,968 |
| | |
| | | | | | 1,134,793 |
| | | | |
|
|
|
LUMBER & WOOD PRODUCTS, EXCEPT
FURNITURE — 0.02% |
| 2,135 | | Champion Enterprises Incorporated† | | | 15,479 |
| | | | |
|
|
|
MEASURING, ANALYZING, & CONTROLLING
INSTRUMENTS: PHOTOGRAPHIC, MEDICAL &
OPTICAL GOODS — 1.01% |
| 766 | | Advanced Medical Optics Incorporated† | | | 12,708 |
| 1,269 | | Agilent Technologies Incorporated† | | | 30,862 |
| 642 | | Aksys Limited† | | | 6,407 |
| 231 | | Allergan Incorporated | | | 18,355 |
| 556 | | Analogic Corporation | | | 28,640 |
| 1,285 | | Anaren Incorporated† | | | 15,407 |
| 768 | | Applera Corporation-Applied Biosystems Group | | | 16,712 |
| 356 | | Bausch & Lomb Incorporated | | | 15,009 |
| 1,092 | | Baxter International Incorporated | | | 30,685 |
| 330 | | Becton Dickinson & Company | | | 12,058 |
| 517 | | Biomet Incorporated | | | 15,370 |
| 670 | | Boston Scientific Corporation† | | | 40,267 |
| 121 | | CR Bard Incorporated | | | 8,107 |
| 585 | | Conmed Corporation† | | | 12,443 |
| 850 | | Cyberonics Incorporated† | | | 23,401 |
| 383 | | Danaher Corporation | | | 29,587 |
| 700 | | Eastman Kodak Company | | | 19,523 |
| 351 | | ESCO Technologies Incorporated† | | | 16,515 |
| 626 | | Flir Systems Incorporated† | | | 16,439 |
| 594 | | Guidant Corporation | | | 29,819 |
| 685 | | Integra LifeSciences Holdings Corporation† | | | 18,502 |
| 454 | | KLA-Tencor Corporation† | | | 26,949 |
| 1,969 | | Medtronic Incorporated | | | 97,623 |
| 407 | | Millipore Corporation | | | 18,478 |
| 685 | | Ocular Sciences Incorporated† | | | 15,488 |
| 493 | | PolyMedica Corporation | | | 22,195 |
| Shares | | Security Name | | Value |
| 660 | | Raytheon Company | | $ | 21,160 |
| 155 | | Resmed Incorporated† | | | 6,712 |
| 390 | | Ricoh Company Limited | | | 35,880 |
| 245 | | St Jude Medical Incorporated† | | | 12,757 |
| 307 | | Stryker Corporation | | | 23,271 |
| 648 | | Teradyne Incorporated† | | | 11,551 |
| 928 | | Thermo Electron Corporation† | | | 21,149 |
| 112 | | Trimble Navigation Limited† | | | 2,996 |
| 647 | | Viasys Healthcare Incorporated† | | | 14,299 |
| 835 | | X-Rite Incorporated | | | 9,519 |
| 2,219 | | Xerox Corporation† | | | 23,921 |
| 328 | | Zimmer Holdings Incorporated† | | | 16,971 |
| | |
| | | | | | 797,735 |
| | | | |
|
|
|
| MEMBERSHIP ORGANIZATIONS — 0.02% |
| 312 | | Cooper Industries Limited Class A | | | 15,878 |
| | | | |
|
|
|
| METAL MINING — 0.20% |
| 968 | | Newmont Mining Corporation | | | 38,004 |
| 416 | | Phelps Dodge Corporation† | | | 19,964 |
| 1,162 | | Rio Tinto plc ADR | | | 102,883 |
| | |
| | | | | | 160,851 |
| | | | |
|
|
|
MINING & QUARRYING OF NONMETALLIC
MINERALS, EXCEPT FUELS — 0.02% |
| 453 | | Vulcan Materials Company | | | 18,759 |
| | | | |
|
|
|
MISCELLANEOUS MANUFACTURING INDUSTRIES — 0.16% |
| 1,264 | | Hasbro Incorporated | | | 23,384 |
| 1,008 | | Mattel Incorporated | | | 19,475 |
| 3,981 | | Tyco International Limited | | | 81,929 |
| | |
| | | | | | 124,788 |
| | | | |
|
|
|
| MISCELLANEOUS RETAIL — 0.30% |
| 642 | | 1-800-Flowers.Com Incorporated Class A† | | | 6,087 |
| 873 | | Costco Wholesale Corporation† | | | 28,015 |
| 637 | | CVS Corporation | | | 20,766 |
| 578 | | GSI Commerce Incorporated† | | | 6,936 |
| 771 | | Hancock Fabrics Incorporated/Delaware | | | 13,122 |
| 731 | | J Jill Group Incorporated† | | | 10,899 |
| 781 | | Longs Drug Stores Corporation | | | 17,885 |
| 1,235 | | Office Depot Incorporated† | | | 22,526 |
| 1,257 | | PC Connection Incorporated† | | | 13,199 |
| 498 | | Sports Authority Incorporated† | | | 16,125 |
| 916 | | Staples Incorporated† | | | 22,561 |
| 1,667 | | Walgreen Company | | | 54,294 |
| 385 | | Whitehall Jewellers Incorporated† | | | 4,062 |
| | |
| | | | | | 236,477 |
| | | | |
|
|
|
| MISCELLANEOUS SERVICES — 0.07% |
| 3,852 | | Adecco SA ADR | | | 48,921 |
| 152 | | D&B Corporation† | | | 6,399 |
| | |
| | | | | | 55,320 |
| | | | |
|
|
|
| MOTION PICTURES — 0.31% |
| 9,313 | | AOL Time Warner Incorporated† | | | 152,361 |
| 4,368 | | Walt Disney Company | | | 89,544 |
| | |
| | | | | | 241,905 |
| | | | |
|
|
15
| WELLSFARGOOUTLOOKTODAYFUND | | PORTFOLIOOFINVESTMENTS —AUGUST 31, 2003 (UNAUDITED) |
|
| Shares | | Security Name | | Value |
| Common Stock (Continued) |
|
MOTOR FREIGHT TRANSPORTATION &
WAREHOUSING — 0.16% |
| 128 | | Landstar System Incorporated† | | $ | 7,899 |
| 1,837 | | United Parcel Service Incorporated | | | 115,290 |
| 153 | | USF Corporation | | | 4,873 |
| | |
| | | | | | 128,062 |
| | | | |
|
|
|
| NON-DEPOSITORY CREDIT INSTITUTIONS — 0.61% |
| 1,997 | | American Express Company | | | 89,965 |
| 597 | | Capital One Financial Corporation | | | 31,880 |
| 2,000 | | Charter Municipal Mortgage Acceptance Company | | | 36,300 |
| 133 | | Countrywide Financial Corporation | | | 9,024 |
| 1,376 | | Fannie Mae | | | 89,151 |
| 1,184 | | Freddie Mac | | | 62,930 |
| 2,471 | | MBNA Corporation | | | 57,673 |
| 1,477 | | ORIX Corporation ADR | | | 49,480 |
| 253 | | Providian Financial Corporation | | | 2,593 |
| 630 | | SLM Corporation | | | 25,313 |
| 493 | | WFS Financial Incorporated† | | | 19,237 |
| 899 | | World Acceptance Corporation† | | | 12,532 |
| | |
| | | | | | 486,078 |
| | | | |
|
|
|
| OIL & GAS EXTRACTION — 0.89% |
| 569 | | Anadarko Petroleum Corporation | | | 24,752 |
| 207 | | Apache Corporation | | | 14,279 |
| 4,349 | | BHP Billiton Limited ADR | | | 62,060 |
| 359 | | Burlington Resources Incorporated | | | 17,383 |
| 523 | | Devon Energy Corporation | | | 27,065 |
| 1,104 | | ENI SpA-ADR | | | 84,335 |
| 113 | | Evergreen Resources Incorporated† | | | 6,313 |
| 1,720 | | Halliburton Company | | | 41,590 |
| 434 | | Kerr-McGee Corporation | | | 19,074 |
| 3,070 | | Magnum Hunter Resources Incorporated† | | | 24,560 |
| 210 | | Nabors Industries Limited† | | | 8,432 |
| 185 | | Noble Corporation† | | | 6,693 |
| 885 | | Plains Exploration & Production company† | | | 10,806 |
| 885 | | Plains Resources Incorporated† | | | 12,045 |
| 4,896 | | Repsol YPF SA ADR | | | 82,889 |
| 902 | | Rowan Companies Incorporated† | | | 22,586 |
| 1,067 | | Schlumberger Limited | | | 52,827 |
| 950 | | Southwestern Energy Company† | | | 17,252 |
| 143 | | Stone Energy Corporation† | | | 5,534 |
| 1,848 | | Total Fina Elf SA ADR | | | 142,314 |
| 1,104 | | Transocean Incorporated† | | | 23,316 |
| | |
| | | | | | 706,105 |
| | | | |
|
|
|
| PAPER & ALLIED PRODUCTS — 0.35% |
| 235 | | Bemis Company Incorporated | | | 10,639 |
| 338 | | Boise Cascade Corporation | | | 9,211 |
| 849 | | Chesapeake Corporation | | | 20,206 |
| 1,968 | | Glatfelter | | | 25,446 |
| 955 | | International Paper Company | | | 38,725 |
| 620 | | Kimberly-Clark Corporation | | | 31,688 |
| 497 | | MeadWestvaco Corporation | | | 12,599 |
| Shares | | Security Name | | Value |
| 632 | | Pactiv Corporation† | | $ | 12,691 |
| 215 | | Potlatch Corporation | | | 6,340 |
| 2,956 | | Stora Enso Oyj ADR | | | 38,103 |
| 231 | | Temple-Inland Incorporated | | | 11,499 |
| 3,084 | | UPM-Kymmene Oyj ADR | | | 56,067 |
| | |
| | | | | | 273,214 |
| | | | |
|
|
|
| PERSONAL SERVICES — 0.07% |
| 751 | | Cintas Corporation | | | 29,988 |
| 283 | | H&R Block Incorporated | | | 12,480 |
| 270 | | Regis Corporation | | | 9,339 |
| | |
| | | | | | 51,807 |
| | | | |
|
|
|
PETROLEUM REFINING & RELATED INDUSTRIES — 1.25% |
| 307 | | Amerada Hess Corporation | | | 14,474 |
| 17 | | Ashland Incorporated | | | 562 |
| 3,754 | | BP plc ADR | | | 156,617 |
| 1,791 | | ChevronTexaco Corporation | | | 130,510 |
| 1,303 | | ConocoPhillips | | | 72,760 |
| 11,865 | | Exxon Mobil Corporation | | | 447,311 |
| 669 | | Marathon Oil Corporation | | | 18,658 |
| 2,478 | | Royal Dutch Petroleum Company NY Shares | | | 111,188 |
| 371 | | Sunoco Incorporated | | | 15,074 |
| 667 | | Unocal Corporation† | | | 20,424 |
| | |
| | | | | | 987,578 |
| | | | |
|
|
|
| PRIMARY METAL INDUSTRIES — 0.22% |
| 1,840 | | Alcoa Incorporated | | | 52,551 |
| 707 | | Engelhard Corporation | | | 19,845 |
| 4,320 | | Kubota Corporation ADR | | | 72,144 |
| 581 | | United States Steel Corporation | | | 10,696 |
| 1,417 | | Worthington Industries | | | 21,397 |
| | |
| | | | | | 176,633 |
| | | | |
|
|
|
PRINTING, PUBLISHING, & ALLIED INDUSTRIES — 0.66% |
| 721 | | American Greetings Corporation† | | | 13,337 |
| 771 | | Bowne & Company Incorporated | | | 11,203 |
| 711 | | Consolidated Graphics Incorporated† | | | 17,583 |
| 377 | | Dow Jones & Company Incorporated | | | 16,011 |
| 395 | | Gannett Company Incorporated | | | 30,976 |
| 107 | | Knight-Ridder Incorporated | | | 7,261 |
| 367 | | McGraw-Hill Companies Incorporated | | | 22,387 |
| 526 | | Meredith Corporation | | | 24,943 |
| 448 | | New York Times Company | | | 19,887 |
| 1,126 | | News Corporation Limited ADR | | | 38,678 |
| 6,527 | | Pearson plc ADR | | | 64,944 |
| 2,929 | | Reed Elsevier NV ADR | | | 65,317 |
| 654 | | RR Donnelley & Sons Company | | | 16,442 |
| 499 | | Tribune Company | | | 23,079 |
| 3,393 | | Viacom Incorporated Class B | | | 152,685 |
| | |
| | | | | | 524,733 |
| | | | |
|
|
16
PORTFOLIOOFINVESTMENTS —AUGUST 31, 2003 (UNAUDITED) | | WELLSFARGOOUTLOOKTODAYFUND |
|
| Shares | | Security Name | | Value |
| Common Stock (Continued) |
|
| RAILROAD TRANSPORTATION — 0.08% |
| 522 | | Burlington Northern Santa Fe Corporation | | $ | 14,798 |
| 453 | | CSX Corporation | | | 14,623 |
| 896 | | Norfolk Southern Corporation | | | 17,060 |
| 316 | | Union Pacific Corporation | | | 19,257 |
| | |
| | | | | | 65,738 |
| | | | |
|
|
|
RUBBER & MISCELLANEOUS PLASTICS PRODUCTS — 0.14% |
| 1,213 | | Cooper Tire & Rubber Company | | | 21,833 |
| 451 | | Nike Incorporated Class B | | | 25,698 |
| 1,327 | | Schulman A Incorporated | | | 21,259 |
| 305 | | Sealed Air Corporation† | | | 14,841 |
| 811 | | Tupperware Corporation | | | 13,244 |
| 557 | | West Pharmaceutical Services Incorporated | | | 16,153 |
| | |
| | | | | | 113,028 |
| | | | |
|
|
|
SECURITY & COMMODITY BROKERS, DEALERS,
EXCHANGES & SERVICES — 0.66% |
| 181 | | Bear Stearns Companies Incorporated | | | 12,666 |
| 3,650 | | Charles Schwab Corporation | | | 39,639 |
| 2,347 | | Credit Suisse Group ADR | | | 73,860 |
| 651 | | Franklin Resources Incorporated | | | 28,117 |
| 814 | | Goldman Sachs Group Incorporated | | | 72,031 |
| 361 | | Lehman Brothers Holdings Incorporated | | | 23,729 |
| 1,681 | | Merrill Lynch & Company Incorporated | | | 90,404 |
| 1,979 | | Morgan Stanley | | | 96,555 |
| 3,672 | | Nomura Holdings Incorporated ADR | | | 53,795 |
| 658 | | T Rowe Price Group Incorporated | | | 27,965 |
| | |
| | | | | | 518,761 |
| | | | |
|
|
|
STONE, CLAY, GLASS, & CONCRETE PRODUCTS — 0.33% |
| 2,680 | | Corning Incorporated† | | | 22,110 |
| 2,582 | | Hanson plc ADR | | | 84,044 |
| 4,589 | | Holcim Limited ADR† | | | 90,926 |
| 3,922 | | Lafarge SA ADR | | | 66,517 |
| | |
| | | | | | 263,597 |
| | | | |
|
|
|
| TEXTILE MILL PRODUCTS — 0.05% |
| 1,764 | | Interface Incorporated | | | 10,073 |
| 474 | | Oxford Industries Incorporated | | | 28,250 |
| | |
| | | | | | 38,323 |
| | | | |
|
|
|
| TOBACCO PRODUCTS — 0.18% |
| 2,734 | | Altria Group Incorporated | | | 112,695 |
| 125 | | Universal Corporation | | | 5,238 |
| 732 | | UST Incorporated | | | 24,449 |
| | |
| | | | | | 142,382 |
| | | | |
|
|
|
| TRANSPORTATION BY AIR — 0.28% |
| 9,391 | | BAA plc ADR | | | 67,736 |
| 800 | | Delta Air Lines Incorporated | | | 10,296 |
| Shares | | Security Name | | Value |
| 647 | | FedEx Corporation | | $ | 43,414 |
| 5,026 | | Japan Airlines System ADR | | | 59,228 |
| 2,334 | | Southwest Airlines Company | | | 39,888 |
| | |
| | | | | | 220,562 |
| | | | |
|
|
|
| TRANSPORTATION EQUIPMENT — 0.96% |
| 3,458 | | BAE Systems plc ADR | | | 37,358 |
| 1,587 | | Boeing Company | | | 59,338 |
| 809 | | Brunswick Corporation | | | 21,827 |
| 1,989 | | DaimlerChrysler AG | | | 76,039 |
| 2,600 | | Delphi Corporation | | | 23,556 |
| 4,409 | | Fiat SpA ADR | | | 29,937 |
| 4,200 | | Ford Motor Company | | | 48,552 |
| 389 | | General Dynamics Corporation | | | 33,497 |
| 777 | | General Motors Corporation | | | 31,935 |
| 781 | | Goodrich Corporation | | | 20,329 |
| 458 | | Harley-Davidson Incorporated | | | 22,818 |
| 2,198 | | Honda Motor Company Limited ADR | | | 44,751 |
| 1,976 | | Honeywell International Incorporated | | | 57,284 |
| 145 | | ITT Industries Incorporated | | | 9,437 |
| 248 | | Johnson Controls Incorporated | | | 24,552 |
| 785 | | Lockheed Martin Corporation | | | 40,216 |
| 320 | | Northrop Grumman Corporation | | | 30,554 |
| 284 | | PACCAR Incorporated | | | 24,197 |
| 419 | | Sequa Corporation† | | | 18,394 |
| 496 | | Sports Resorts International Incorporated† | | | 2,455 |
| 149 | | Superior Industries International Incorporated | | | 6,447 |
| 317 | | Textron Incorporated | | | 14,265 |
| 185 | | Thor Industries Incorporated | | | 10,025 |
| 1,237 | | Toyota Motor Corporation ADR | | | 68,517 |
| | |
| | | | | | 756,280 |
| | | | |
|
|
|
| TRANSPORTATION SERVICES — 0.02% |
| 139 | | Expeditors International of Washington Incorporated | | | 5,242 |
| 454 | | Sabre Holdings Corporation | | | 10,269 |
| | |
| | | | | | 15,511 |
| | | | |
|
|
|
| WATER TRANSPORTATION — 0.06% |
| 1,243 | | Carnival Corporation | | | 42,995 |
| 255 | | Kirby Corporation† | | | 7,446 |
| | |
| | | | | | 50,441 |
| | | | |
|
|
|
| WHOLESALE TRADE–DURABLE GOODS — 0.57% |
| 524 | | 1-800 Contacts Incorporated† | | | 10,858 |
| 534 | | Imagistics International Incorporated† | | | 15,272 |
| 4,363 | | Johnson & Johnson | | | 216,318 |
| 518 | | Kyocera Corporation ADR | | | 32,805 |
| 3,448 | | Mitsubishi Corporation ADR | | | 58,274 |
| 397 | | Mitsui & Company Limited ADR | | | 50,621 |
| 2,402 | | Nissan Motor Company Limited ADR | | | 52,123 |
| 237 | | Grainger WW Incorporated | | | 11,810 |
| | |
| | | | | | 448,081 |
| | | | |
|
|
17
| WELLSFARGOOUTLOOKTODAYFUND | | PORTFOLIOOFINVESTMENTS —AUGUST 31, 2003 (UNAUDITED) |
|
| Shares | | Security Name | | Value |
| Common Stock (Continued) |
|
WHOLESALE TRADE NON-DURABLE GOODS — 0.21% |
| 321 | | Advanced Marketing Services Incorporated | | $ | 3,290 |
| 275 | | AmerisourceBergen Corporation | | | 16,008 |
| 53 | | Brown-Forman Corporation Class B | | | 4,189 |
| 774 | | Cardinal Health Incorporated | | | 44,064 |
| 672 | | McKesson Corporation | | | 22,001 |
| 977 | | Safeway Incorporated† | | | 23,849 |
| 655 | | Supervalu Incorporated | | | 15,786 |
| 1,255 | | Sysco Corporation | | | 39,482 |
| | |
| | | | | | 168,669 |
| | | | |
|
|
TOTAL COMMON STOCK
(Cost $27,468,955) | | | 26,705,520 |
| | | | |
|
|
|
| Real Estate Investment Trust — 0.32% |
| 547 | | Alexandria Real Estate Equities Incorporated | | | 25,572 |
| 2,513 | | Boykin Lodging Company | | | 19,601 |
| 126 | | Capital Automotive REIT | | | 3,600 |
| 308 | | Chelsea Property Group Incorporated | | | 14,153 |
| 1,585 | | Entertainment Properties Trust | | | 49,531 |
| 615 | | Equity Office Properties Trust | | | 17,109 |
| 936 | | Equity Residential | | | 27,219 |
| 293 | | Home Properties of New York Incorporated | | | 10,973 |
| 3,634 | | Mid Atlantic Realty Trust | | | 76,387 |
| 156 | | Simon Property Group Incorporated | | | 6,663 |
TOTAL REAL ESTATE INVESTMENT
TRUST (Cost $200,165) | | | 250,808 |
| | | | |
|
|
| Principal | | Interest Rate | | Maturity
Date | | |
| US Treasury Obligations — 63.80% | | |
| |
| US TREASURY BONDS — 1.89% | | |
| $ | 580,000 | | 3.25% | | 8/15/07 | | 585,030 |
| | 500,000 | | 11.63% | | 11/15/04 | | 560,391 |
| | 300,000 | | 10.75% | | 8/15/05 | | 350,613 |
| | | |
| | | | | | | | 1,496,034 |
| | | | | | |
|
| Principal | | Interest Rate | | Maturity
Date | | Value |
| |
| US TREASURY NOTES — 61.91% | | | |
| $ | 1,970,000 | | 5.75% | | 11/15/05 | | $ | 2,125,675 |
| | 3,000,000 | | 5.00% | | 2/15/11 | | | 3,168,399 |
| | 2,675,000 | | 5.00% | | 8/15/11 | | | 2,816,272 |
| | 390,000 | | 4.88% | | 2/15/12 | | | 405,768 |
| | 1,840,000 | | 4.00% | | 11/15/12 | | | 1,784,081 |
| | 10,315,000 | | 1.63% | | 1/31/05 | | | 10,325,078 |
| | 4,710,000 | | 2.00% | | 5/15/06 | | | 4,673,389 |
| | 800,000 | | 7.25% | | 8/15/04 | | | 845,125 |
| | 600,000 | | 7.88% | | 11/15/04 | | | 645,867 |
| | 3,850,000 | | 6.50% | | 5/15/05 | | | 4,156,194 |
| | 2,120,000 | | 5.63% | | 2/15/06 | | | 2,293,988 |
| | 1,890,000 | | 6.50% | | 10/15/06 | | | 2,110,007 |
| | 450,000 | | 6.25% | | 2/15/07 | | | 501,680 |
| | 2,750,000 | | 6.13% | | 8/15/07 | | | 3,067,647 |
| | 2,990,000 | | 5.63% | | 5/15/08 | | | 3,285,146 |
| | 2,930,000 | | 4.75% | | 11/15/08 | | | 3,100,306 |
| | 600,000 | | 5.50% | | 5/15/09 | | | 657,914 |
| | 600,000 | | 6.00% | | 8/15/04 | | | 626,765 |
| | 800,000 | | 5.88% | | 11/15/04 | | | 842,218 |
| | 1,390,000 | | 6.75% | | 5/15/05 | | | 1,506,193 |
| | | |
| | | | | | | | | 48,937,712 |
| | | | | | |
|
TOTAL US TREASURY OBLIGATIONS (Cost $49,665,637) | | | 50,433,746 |
| | | | | | |
|
| |
| Short Term Investments — 1.51% | | | |
| |
| US TREASURY BILLS — 1.51% | | | |
| | 48,000 | | 0.84%^ | | 9/18/03 | | | 47,982 |
| | 18,000 | | 0.84%^ | | 9/18/03 | | | 17,993 |
| | 105,000 | | 0.88%^ | | 10/16/03 | | | 104,876 |
| | 70,000 | | 0.88%^ | | 10/16/03 | | | 69,918 |
| | 18,000 | | 0.88%^ | | 10/16/03 | | | 17,979 |
| | 488,000 | | 0.88%^ | | 10/16/03 | | | 487,445 |
| | 16,000 | | 0.88%^ | | 10/16/03 | | | 15,982 |
| | 200,000 | | 0.88%^ | | 10/16/03 | | | 199,778 |
| | 41,000 | | 0.88%^ | | 10/16/03 | | | 40,955 |
| | 99,000 | | 0.88%^ | | 10/16/03 | | | 98,891 |
| | 94,000 | | 0.88%^ | | 10/16/03 | | | 93,894 |
TOTAL SHORT-TERM INVESTMENTS
(Cost $1,195,737) | | | 1,195,693 |
| | | | | | |
|
| | | | | |
| | |
| TOTAL INVESTMENTS IN SECURITIES | | | | | |
| | |
| (Cost $78,530,494) | | 99.43% | | $ | 78,585,767 |
| | |
Other Assets and Liabilities, | | | | | |
Net | | 0.57 | | | 454,472 |
| | |
| |
|
|
| TOTAL NET ASSETS | | 100.00% | | $ | 79,040,239 |
| | |
| |
|
|
| (a) | Security Fair Valued in accordance with the procedures approved by the Board of Trustees. |
| † | Non-income earning securities. |
| ‡ | Security of an affiliate of the fund with a cost of $134,033 |
The accompanying notes are an integral part of these financial statements.
18
PORTFOLIOOFINVESTMENTS —AUGUST 31, 2003 (UNAUDITED) | | WELLSFARGOOUTLOOK 2010FUND |
|
| Shares | | Security Name | | Value |
| Common Stock — 48.12% | | | |
|
| AMUSEMENT & RECREATION SERVICES — 0.10% |
| 2,484 | | Alliance Gaming Corporation† | | $ | 55,965 |
| 1,354 | | Churchill Downs Incorporated | | | 48,825 |
| 190 | | Harrah's Entertainment Incorporated | | | 7,870 |
| 1,448 | | International Game Technology | | | 37,416 |
| 548 | | Westwood One Incorporated† | | | 17,591 |
| | |
| | | | | | 167,667 |
| | | | |
|
|
|
APPAREL & OTHER FINISHED PRODUCTS MADE
FROM FABRICS & SIMILAR MATERIALS — 0.23% |
| 7,136 | | Benetton Group SpA ADR | | | 145,432 |
| 582 | | Jones Apparel Group Incorporated | | | 17,978 |
| 1,740 | | Liz Claiborne Incorporated | | | 59,978 |
| 1,274 | | VF Corporation | | | 51,087 |
| 3,335 | | Wacoal Corporation ADR | | | 131,499 |
| | |
| | | | | | 405,974 |
| | | | |
|
|
|
| APPAREL & ACCESSORY STORES — 0.32% |
| 537 | | Abercrombie & Fitch Company Class A† | | | 16,346 |
| 2,047 | | Cato Corporation | | | 48,616 |
| 6,284 | | Charming Shoppes Incorporated† | | | 37,704 |
| 1,895 | | Deb Shops Incorporated | | | 34,603 |
| 6,346 | | Gap Incorporated | | | 132,568 |
| 2,062 | | Kohl's Corporation† | | | 130,422 |
| 4,961 | | Limited Brands | | | 84,139 |
| 2,647 | | Nordstrom Incorporated | | | 69,007 |
| | |
| | | | | | 553,405 |
| | | | |
|
|
|
AUTOMOTIVE DEALERS & GASOLINE SERVICE
STATIONS — 0.06% |
| 753 | | AutoZone Incorporated† | | | 69,125 |
| 1,063 | | Carmax Incorporated | | | 40,979 |
| | |
| | | | | | 110,104 |
| | | | |
|
|
|
BUILDING CONSTRUCTION–GENERAL
CONTRACTORS & OPERATIVE BUILDERS — 0.17% |
| 175 | | Beazer Homes USA Incorporated† | | | 14,546 |
| 12 | | Cavco Industries Incorporated† | | | 229 |
| 249 | | Centex Corporation | | | 18,780 |
| 0 | | MDC Holdings Incorporated | | | 10 |
| 21 | | NVR Incorporated† | | | 9,104 |
| 176 | | Pulte Corporation | | | 11,715 |
| 18,151 | | Sekisui House Limited ADR | | | 159,451 |
| 248 | | Standard-Pacific Corporation | | | 8,814 |
| 4,517 | | Vivendi Universal SA ADR† | | | 76,336 |
| | |
| | | | | | 298,985 |
| | | | |
|
|
|
BUILDING MATERIALS, HARDWARE, GARDEN
SUPPLY, & MOBILE HOME DEALERS — 0.40% |
| 12,532 | | Home Depot Incorporated | | | 403,028 |
| 4,432 | | Lowe's Companies Incorporated | | | 243,140 |
| 1,947 | | Sherwin-Williams Company | | | 58,566 |
| | |
| | | | | | 704,734 |
| | | | |
|
|
| Shares | | Security Name | | Value |
|
| BUSINESS SERVICES — 3.09% |
| 2,947 | | Acacia Research-Acacia Technologies† | | $ | 6,130 |
| 7,679 | | Adecco SA ADR | | | 97,523 |
| 1,685 | | Adobe Systems Incorporated | | | 65,429 |
| 318 | | Advo Incorporated† | | | 14,040 |
| 5,148 | | Aether Systems Incorporated† | | | 27,851 |
| 436 | | Affiliated Computer Services Incorporated† | | | 21,630 |
| 3,443 | | Akamai Technologies Incorporated† | | | 14,323 |
| 220 | | Arbitron Incorporated† | | | 8,136 |
| 807 | | Ariba Incorporated† | | | 2,050 |
| 3,631 | | Automatic Data Processing Incorporated | | | 144,913 |
| 283 | | Avocent Corporation† | | | 8,264 |
| 3,881 | | BEA Systems Incorporated† | | | 52,588 |
| 2,992 | | BMC Software Incorporated† | | | 43,923 |
| 1,892 | | CCC Information Services Group† | | | 29,099 |
| 7,252 | | Cendant Corporation† | | | 130,391 |
| 245 | | ChoicePoint Incorporated† | | | 9,616 |
| 1,865 | | Citrix Systems Incorporated† | | | 38,400 |
| 4,396 | | Computer Associates International | | | 112,669 |
| 1,460 | | Computer Sciences Corporation† | | | 62,152 |
| 5,550 | | Compuware Corporation† | | | 33,023 |
| 3,475 | | Concord EFS Incorporated† | | | 48,129 |
| 2,668 | | Convergys Corporation† | | | 48,024 |
| 3,679 | | Datastream Systems Incorporated† | | | 34,767 |
| 1,803 | | Digital Insight Corporation† | | | 43,182 |
| 450 | | DST Systems Incorporated† | | | 17,820 |
| 3,922 | | Ebay Incorporated† | | | 217,789 |
| 2,801 | | Electro Rent Corporation | | | 33,556 |
| 714 | | Electronic Arts† | | | 64,082 |
| 3,130 | | Electronic Data Systems | | | 68,328 |
| 1,268 | | Enterasys Networks Incorporated† | | | 7,316 |
| 2,225 | | Equifax Incorporated | | | 51,042 |
| 1,973 | | eUniverse Incorporated†(a) | | | 3,512 |
| 249 | | Factset Research Systems Incorporated | | | 12,089 |
| 159 | | Fair Isaac Corporation | | | 9,317 |
| 4,551 | | First Data Corporation | | | 174,758 |
| 1,814 | | Fiserv Incorporated† | | | 70,474 |
| 3,258 | | IMS Health Incorporated | | | 63,433 |
| 2,628 | | Insurance Auto Auctions† | | | 32,640 |
| 1,598 | | Interpool Incorporated | | | 29,004 |
| 3,894 | | Interpublic Group of Companies Incorporated | | | 58,994 |
| 2,436 | | Intrado Incorporated† | | | 44,213 |
| 1,434 | | Intuit Incorporated† | | | 64,989 |
| 3,010 | | Keynote Systems Incorporated† | | | 29,709 |
| 8,449 | | Kidde plc ADR | | | 129,633 |
| 1,020 | | Mercury Interactive Corporation† | | | 44,768 |
| 57,857 | | Microsoft Corporation | | | 1,534,368 |
| 988 | | NCR Corporation† | | | 28,662 |
19
| WELLSFARGOOUTLOOK 2010FUND | | PORTFOLIOOFINVESTMENTS —AUGUST 31, 2003 (UNAUDITED) |
|
| Shares | | Security Name | | Value |
| Common Stock (Continued) | | | |
| 3,177 | | Novell Incorporated† | | $ | 15,980 |
| 1,723 | | Nuance Communications Incorporated† | | | 9,253 |
| 1,106 | | Omnicom Group Incorporated | | | 86,379 |
| 29,614 | | Oracle Corporation† | | | 378,467 |
| 3,028 | | PeopleSoft Incorporated† | | | 54,807 |
| 3,877 | | Red Hat Incorporated† | | | 28,225 |
| 4,530 | | Rentokil Initial plc ADR | | | 75,236 |
| 2,352 | | Reuters Group plc ADR | | | 55,554 |
| 4,899 | | Sap AG ADR | | | 146,671 |
| 5,088 | | Siebel Systems Incorporated† | | | 51,287 |
| 619 | | Softbrands Incorporated† | | | 495 |
| 23,236 | | Sun Microsystems Incorporated† | | | 89,691 |
| 1,410 | | Sungard Data Systems Incorporated† | | | 39,762 |
| 574 | | Symantec Corporation† | | | 32,965 |
| 275 | | Synopsys Incorporated† | | | 18,758 |
| 4,881 | | Unisys Corporation† | | | 63,355 |
| 1,519 | | Verisign Incorporated† | | | 22,739 |
| 2,919 | | Veritas Software Corporation† | | | 100,647 |
| 2,089 | | WPP Group plc ADR | | | 95,864 |
| 4,019 | | Yahoo! Incorporated† | | | 134,235 |
| | |
| | | | | | 5,387,118 |
| | | | |
|
|
|
| CHEMICALS & ALLIED PRODUCTS — 5.11% |
| 8,468 | | Abbott Laboratories | | | 341,260 |
| 2,848 | | Abgenix Incorporated† | | | 37,024 |
| 1,645 | | Acacia Research-Combimatrix† | | | 6,169 |
| 1,513 | | Air Products & Chemicals Incorporated | | | 71,595 |
| 3,490 | | Akzo Nobel NV ADR | | | 113,879 |
| 397 | | Alberto Culver Company Class B | | | 22,661 |
| 7,174 | | Amgen Incorporated† | | | 472,767 |
| 2,238 | | Aphton Corporation† | | | 15,576 |
| 7,171 | | AstraZeneca plc ADR | | | 284,330 |
| 2,354 | | Aventis SA ADR | | | 115,346 |
| 868 | | Avery Dennison Corporation | | | 47,523 |
| 1,620 | | Avon Products Incorporated | | | 103,842 |
| 3,558 | | BASF AG ADR | | | 164,913 |
| 4,747 | | Bayer AG ADR | | | 102,678 |
| 1,240 | | Biogen Incorporated† | | | 48,930 |
| 10,057 | | Bristol-Myers Squibb Company | | | 255,146 |
| 3,572 | | Centerpulse ADR | | | 98,301 |
| 1,867 | | Chiron Corporation† | | | 94,881 |
| 1,636 | | Clorox Company | | | 70,103 |
| 2,966 | | Colgate Palmolive Company | | | 163,960 |
| 3,344 | | Columbia Laboratories Incorporated† | | | 45,779 |
| 4,509 | | Dow Chemical Company | | | 155,696 |
| 4,403 | | E I Du Pont de Nemours | | | 196,990 |
| 626 | | Eastman Chemical Company | | | 22,417 |
| 2,260 | | Ecolab Incorporated | | | 58,285 |
| 6,144 | | Eli Lilly & Company | | | 408,760 |
| 2,706 | | Forest Laboratories Incorporated† | | | 127,182 |
| 1,293 | | Genentech Incorporated† | | | 102,664 |
| 1,064 | | Genzyme Corporation† | | | 50,168 |
| 1,922 | | Geron Corporation† | | | 15,318 |
| Shares | | Security Name | | Value |
| 1,013 | | Gilead Sciences Incorporated† | | $ | 67,567 |
| 5,655 | | Gillette Company | | | 183,561 |
| 10,287 | | Glaxosmithkline plc ADR | | | 399,444 |
| 650 | | IDEC Pharmaceutical Corporation† | | | 22,588 |
| 2,017 | | International Flavors & Fragrances Incorporated | | | 63,536 |
| 2,543 | | King Pharmaceuticals Incorporated† | | | 35,729 |
| 437 | | Martek Bioscience† | | | 22,545 |
| 3,434 | | Medarex Incorporated† | | | 20,638 |
| 2,029 | | Medimmune Incorporated† | | | 70,751 |
| 11,963 | | Merck & Company Incorporated | | | 601,978 |
| 1,273 | | MGI Pharma Incorporated† | | | 49,125 |
| 970 | | Mylan Laboratories Incorporated | | | 35,308 |
| 11,778 | | Novartis AG ADR | | | 435,433 |
| 2,377 | | Novo Nordisk A/S ADR | | | 84,978 |
| 1,571 | | Penwest Pharmaceuticals† | | | 34,373 |
| 42,221 | | Pfizer Incorporated | | | 1,263,253 |
| 432 | | PPG Industries Incorporated | | | 23,721 |
| 891 | | Praxair Incorporated | | | 56,864 |
| 6,175 | | Procter & Gamble Company | | | 539,016 |
| 3,914 | | Roche Holding AG ADR | | | 299,725 |
| 1,955 | | Rohm and Haas Company | | | 71,025 |
| 8,189 | | Schering-Plough Corporation | | | 124,391 |
| 1,683 | | Sepracor Incorporated† | | | 45,306 |
| 13,000 | | Shiseido Company Limited ADR | | | 136,039 |
| 942 | | Sigma-Aldrich Corporation | | | 51,575 |
| 1,283 | | Watson Pharmaceuticals Incorporated† | | | 52,731 |
| 6,968 | | Wyeth | | | 298,579 |
| | |
| | | | | | 8,903,922 |
| | | | |
|
|
|
| COAL MINING — 0.03% |
| 988 | | Penn Virginia Corporation | | | 44,470 |
| | | | |
|
|
|
| COMMUNICATIONS — 2.91% |
| 1,763 | | Alltel Corporation | | | 80,745 |
| 4,826 | | AT&T Corporation | | | 107,620 |
| 18,888 | | AT&T Wireless Services Incorporated† | | | 162,815 |
| 3,742 | | Avaya Incorporated† | | | 39,104 |
| 10,179 | | Bellsouth Corporation | | | 256,511 |
| 1,194 | | Boston Communications Group Incorporated† | | | 16,059 |
| 2,431 | | British Sky Broadcasting Group plc ADR† | | | 103,269 |
| 4,431 | | BT Group plc ADR† | | | 130,050 |
| 1,299 | | CenturyTel Incorporated | | | 45,153 |
| 1,461 | | Certegy Incorporated† | | | 44,195 |
| 4,071 | | Clear Channel Communications Incorporated† | | | 183,684 |
| 24,363 | | Comcast Corporation† | | | 724,799 |
| 11,683 | | Deutsche Telekom AG ADR | | | 167,534 |
| 3,119 | | Extreme Networks Incorporated† | | | 21,490 |
| 4,154 | | France Telecom SA ADR | | | 103,019 |
| 2,312 | | Interactivecorp† | | | 85,567 |
| 1,833 | | Lagardere SCA ADR | | | 83,275 |
20
PORTFOLIOOFINVESTMENTS —AUGUST 31, 2003 (UNAUDITED) | | WELLSFARGOOUTLOOK 2010FUND |
|
| Shares | | Security Name | | Value |
| Common Stock (Continued) |
| 420 | | Liberty Corporation | | $ | 18,018 |
| 1,949 | | Lodgenet Entertainment Corporation† | | | 25,337 |
| 6,802 | | Nextel Communications Incorporated† | | | 131,143 |
| 4,359 | | Nippon Telegraph and Telephone Corporation ADR | | | 96,726 |
| 6,000 | | NTT Docomo Incorporated ADR† | | | 155,220 |
| 9,172 | | Qwest Communications International Incorporated† | | | 40,815 |
| 2,611 | | Reed Elsevier plc | | | 82,116 |
| 11,012 | | Royal KPN NV ADR | | | 75,983 |
| 18,599 | | SBC Communications Incorporated | | | 418,292 |
| 3,860 | | Spanish Broadcasting Systems Incorporated† | | | 29,915 |
| 6,724 | | Sprint Corporation (FON Group) | | | 99,313 |
| 7,211 | | Sprint Corporation (PCS Group)† | | | 37,425 |
| 5,401 | | TDC A/S ADR | | | 80,745 |
| 7,741 | | Telefonica SA ADR† | | | 274,806 |
| 1,945 | | Univision Communications Incorporated† | | | 72,918 |
| 15,616 | | Verizon Communications Incorporated | | | 551,557 |
| 27,631 | | Vodafone Group plc ADR | | | 505,647 |
| 700 | | Western Wireless Corporation
Class A† | | | 12,936 |
| | |
| | | | | | 5,063,801 |
| | | | |
|
|
|
CONSTRUCTION SPECIAL TRADE
CONTRACTORS — 0.03% |
| 287 | | Emco Group Incorporated† | | | 12,648 |
| 688 | | Whirlpool Corporation | | | 47,871 |
| | |
| | | | | | 60,519 |
| | | | |
|
|
|
| DEPOSITORY INSTITUTIONS — 5.67% |
| 11,060 | | ABN Amro Holding NV ADR | | | 195,098 |
| 5,732 | | Allied Irish Banks plc ADR | | | 160,955 |
| 2,950 | | AmSouth Bancorporation | | | 63,543 |
| 10,419 | | Banco Bilbao Vizcaya Argentaria SA ADR | | | 112,004 |
| 7,146 | | Banco Comercial Portugues SA ADR | | | 63,242 |
| 18,125 | | Banco Santander Central Hispano SA ADR | | | 155,513 |
| 8,223 | | Bank of America Corporation | | | 651,673 |
| 4,523 | | Bank of New York Company Incorporated | | | 133,067 |
| 6,026 | | Bank One Corporation | | | 237,846 |
| 1,235 | | Bankunited Financial Corporation Class A† | | | 26,849 |
| 1,840 | | Banner Corporation | | | 38,824 |
| 7,812 | | Barclays plc ADR | | | 231,079 |
| 3,008 | | Bayerische Hypo-Und Vereinsbank AG ADR† | | | 46,994 |
| Shares | | Security Name | | Value |
| 2,853 | | BB&T Corporation | | $ | 104,192 |
| 8,205 | | BNP Paribas SA ADR | | | 204,397 |
| 2,243 | | Cascade Bancorp | | | 40,419 |
| 3,532 | | CFS Bancorp Incorporated | | | 48,883 |
| 1,530 | | Charter One Financial Incorporated | | | 47,430 |
| 758 | | Chittenden Corporation | | | 21,861 |
| 30,182 | | Citigroup Incorporated | | | 1,308,390 |
| 1,629 | | City Bank Lynnwood WA | | | 52,910 |
| 767 | | Comerica Incorporated | | | 37,844 |
| 2,104 | | Community Trust Bancorp | | | 61,879 |
| 2,760 | | Deutsche Bank AG | | | 160,742 |
| 2,640 | | Dime Community Bancshares | | | 62,832 |
| 2,919 | | Fifth Third Bancorp | | | 171,053 |
| 1,137 | | First Republic Bank | | | 35,622 |
| 1,793 | | First Sentinel Bancorp Incorporated | | | 29,943 |
| 316 | | First Tennessee National Corporation | | | 13,067 |
| 856 | | FirstFed Financial Corporation† | | | 33,983 |
| 2,117 | | Flagstar Bancorp Incorporated | | | 41,345 |
| 6,038 | | FleetBoston Financial Corporation | | | 178,664 |
| 4,550 | | Gold Banc Corporation Incorporated | | | 49,823 |
| 652 | | Golden West Financial Corporation | | | 56,248 |
| 6,800 | | HBOS plc ADR | | | 227,165 |
| 7,018 | | HSBC Holdings plc ADR | | | 451,398 |
| 3,519 | | Huntington Bancshares Incorporated | | | 70,380 |
| 11,840 | | JP Morgan Chase & Company | | | 405,165 |
| 2,016 | | KeyCorp | | | 54,795 |
| 5,389 | | Lloyds TSB Group PLC ADR | | | 142,431 |
| 635 | | Marshall & Ilsley Corporation | | | 19,685 |
| 2,681 | | Mellon Financial Corporation | | | 84,049 |
| 2,158 | | National Australia Bank Limited ADR | | | 218,174 |
| 27,516 | | National Bank of Greece SA ADR | | | 118,869 |
| 3,068 | | National City Corporation | | | 97,194 |
| 4,379 | | NBT Bancorp Incorporated | | | 92,090 |
| 1,621 | | Northern Trust Corporation | | | 68,471 |
| 3,208 | | Northwest Bancorp Incorporated | | | 53,028 |
| 2,147 | | OceanFirst Financial Corporation | | | 54,985 |
| 1,039 | | PNC Financial Services Group Incorporated | | | 49,456 |
| 1,405 | | Regions Financial Corporation | | | 49,540 |
| 5,980 | | Republic Bancorp Incorporated | | | 82,165 |
| 2,686 | | Republic Bancorp Incorporated KY | | | 46,978 |
| 2,151 | | Republic Bancshares Incorporated | | | 58,357 |
| 174 | | River Forest Bancorp | | | 9,013 |
| 3,333 | | Royal Bancshares of Pennsylvania Incorporated | | | 82,625 |
| 9,766 | | Sanpaolo-IMI SpA ADR | | | 188,484 |
21
| WELLSFARGOOUTLOOK 2010FUND | | PORTFOLIOOFINVESTMENTS —AUGUST 31, 2003 (UNAUDITED) |
|
| Shares | | Security Name | | Value |
| Common Stock (Continued) |
| 2,196 | | Seacoast Financial Services Corporation | | $ | 45,347 |
| 10,537 | | Societe Generale | | | 139,748 |
| 2,860 | | SouthTrust Corporation | | | 82,911 |
| 2,166 | | State Street Corporation | | | 95,196 |
| 2,046 | | Sterling Financial Corporation | | | 53,196 |
| 1,270 | | SunTrust Banks Incorporated | | | 77,635 |
| 2,733 | | Synovus Financial Corporation | | | 66,822 |
| 669 | | Umpqua Holdings Corporation | | | 12,477 |
| 1,552 | | Union Planters Corporation | | | 49,509 |
| 4,450 | | United Community Financial Corporation | | | 42,275 |
| 11,943 | | US Bancorp | | | 285,438 |
| 1,834 | | USB Holding Company Incorporated | | | 33,764 |
| 7,171 | | Wachovia Corporation | | | 302,258 |
| 4,178 | | Washington Mutual Incorporated | | | 162,858 |
| 9,119 | | Wells Fargo & Company‡ | | | 457,227 |
| 3,014 | | West Coast Bancorp – OR | | | 56,543 |
| 5,628 | | Westpac Banking Corporation ADR | | | 287,815 |
| 387 | | Zions Bancorporation | | | 21,556 |
| | |
| | | | | | 9,875,286 |
| | | | |
|
|
|
| EATING & DRINKING PLACES — 0.21% |
| 2,448 | | Darden Restaurants Incorporated | | | 53,366 |
| 7,442 | | McDonald's Corporation | | | 166,850 |
| 1,945 | | Wendy's International Incorporated | | | 61,365 |
| 2,625 | | Yum! Brands Incorporated† | | | 77,831 |
| | |
| | | | | | 359,412 |
| | | | |
|
|
|
| EDUCATIONAL SERVICES — 0.03% |
| 846 | | Apollo Group Incorporated Class A† | | | 54,203 |
| | | | |
|
|
|
| ELECTRIC, GAS, & SANITARY SERVICES — 1.96% |
| 4,906 | | AES Corporation† | | | 31,791 |
| 2,617 | | Allied Waste Industries Incorporated† | | | 28,944 |
| 1,452 | | Ameren Corporation | | | 61,710 |
| 1,262 | | American Electric Power Company Incorporated | | | 35,727 |
| 5,100 | | BG Group plc ADR | | | 111,231 |
| 768 | | Black Hills Corporation | | | 24,891 |
| 4,255 | | Calpine Corporation† | | | 23,998 |
| 3,870 | | CenterPoint Energy Incorporated | | | 32,856 |
| 621 | | CH Energy Group Incorporated | | | 27,479 |
| 1,990 | | Cinergy Corporation | | | 68,098 |
| 2,487 | | CMS Energy Corporation† | | | 16,588 |
| 2,065 | | Constellation Energy | | | 75,145 |
| 1,836 | | Dominion Resources Incorporated | | | 111,225 |
| 1,330 | | DTE Energy Company | | | 46,430 |
| 6,007 | | Duke Energy Corporation | | | 102,600 |
| 3,036 | | E.ON AG ADR | | | 157,690 |
| 4,485 | | El Paso Corporation | | | 32,920 |
| Shares | | Security Name | | Value |
| 9,204 | | Endesa SA ADR | | $ | 144,043 |
| 4,955 | | Enel SpA ADR | | | 151,871 |
| 1,896 | | Entergy Corporation | | | 99,445 |
| 2,394 | | Exelon Corporation | | | 141,007 |
| 2,930 | | FirstEnergy Corporation | | | 85,732 |
| 1,422 | | FPL Group Incorporated | | | 87,965 |
| 110,319 | | Hong Kong & China Gas Company Limited ADR | | | 148,522 |
| 36,000 | | Hong Kong Electric Holdings Limited ADR | | | 142,164 |
| 3,579 | | International Power plc ADR† | | | 85,860 |
| 467 | | KN Energy Incorporated | | | 24,868 |
| 3,342 | | Middlesex Water Company | | | 88,563 |
| 3,624 | | National Grid Transco plc ADR | | | 111,800 |
| 250 | | Nicor Incorporated | | | 8,498 |
| 3,603 | | NiSource Incorporated | | | 69,682 |
| 2,583 | | Pico Holdings Incorporated† | | | 33,502 |
| 1,398 | | Pinnacle West Cap Corporation | | | 47,951 |
| 2,150 | | PPl Corporation | | | 85,291 |
| 1,332 | | Progress Energy Incorporated | | | 53,933 |
| 507 | | Public Service Enterprise | | | 21,466 |
| 4,389 | | Scottish Power plc ADR | | | 103,580 |
| 2,926 | | Sempra Energy | | | 87,049 |
| 4,342 | | Southern Company | | | 123,226 |
| 5,936 | | Suez SA ADR | | | 94,798 |
| 193 | | Texas Genco Holdings Incorporated | | | 4,729 |
| 450 | | TXU Corporation | | | 9,900 |
| 674 | | UIL Holdings Corporation | | | 24,298 |
| 9,566 | | United Utilities plc ADR | | | 165,970 |
| 3,068 | | Waste Management Incorporated | | | 81,639 |
| 4,459 | | Williams Companies Incorporated | | | 40,711 |
| 3,660 | | Xcel Energy Incorporated | | | 53,618 |
| | |
| | | | | | 3,411,004 |
| | | | �� |
|
|
|
ELECTRONIC & OTHER ELECTRICAL
EQUIPMENT & COMPONENTS, EXCEPT
COMPUTER EQUIPMENT — 4.42% |
| 4,558 | | Advanced Micro Devices Incorporated† | | | 51,460 |
| 10,185 | | Alcatel SA ADR | | | 110,915 |
| 3,078 | | Altera Corporation† | | | 69,070 |
| 3,542 | | American Power Conversion Corporation | | | 63,473 |
| 249 | | Ametek Incorporated | | | 10,448 |
| 2,309 | | Analog Devices Incorporated† | | | 94,669 |
| 4,013 | | Applied Micro Circuits Corporation† | | | 23,316 |
| 4,324 | | ASML Holding NV NY Shares† | | | 68,752 |
| 2,379 | | Broadcom Corporation† | | | 65,375 |
| 4,295 | | C-COR.net Corporation† | | | 23,365 |
| 3,441 | | Canon Incorporated ADR | | | 166,751 |
| 4,281 | | Chartered Semiconductor Manufacturing Limited ADR† | | | 28,126 |
| 3,224 | | CIENA Corporation† | | | 20,956 |
22
PORTFOLIOOFINVESTMENTS —AUGUST 31, 2003 (UNAUDITED) | | WELLSFARGOOUTLOOK 2010FUND |
|
| Shares | | Security Name | | Value |
| Common Stock (Continued) |
| 3,041 | | Comverse Technology Incorporated† | | $ | 50,146 |
| 2,642 | | Conexant Systems Incorporated† | | | 14,478 |
| 629 | | Cooper Industries Limited Class A | | | 32,010 |
| 1,024 | | Cree Resh Incorporated† | | | 16,200 |
| 2,162 | | EchoStar Communications Corporation† | | | 79,778 |
| 2,116 | | Electrolux AB ADR Class B | | | 94,564 |
| 1,851 | | Emerson Electric Company | | | 103,212 |
| 4,764 | | Ericsson ADR† | | | 73,747 |
| 2,186 | | Fujitsu Limited ADR | | | 52,271 |
| 53,083 | | General Electric Company | | | 1,569,661 |
| 2,260 | | Globespan Virata Incorporated† | | | 17,199 |
| 964 | | Hutchinson Technology† | | | 30,491 |
| 3,925 | | Infineon Technologies AG ADR | | | 57,698 |
| 34,659 | | Intel Corporation | | | 991,941 |
| 1,210 | | Inter-Tel Incorporated | | | 30,492 |
| 401 | | Interdigital Communications Corporation† | | | 7,118 |
| 9,052 | | International Business Machines Corporation | | | 742,355 |
| 2,038 | | Jabil Circuit Incorporated† | | | 57,370 |
| 10,973 | | JDS Uniphase Corporation† | | | 37,747 |
| 5,079 | | Koninklijke Philips Electronics NV NY Shares | | | 123,928 |
| 180 | | L-3 Communications Holdings Incorporated† | | | 9,196 |
| 1,999 | | Linear Technology Corporation | | | 82,399 |
| 5,389 | | LSI Logic Corporation† | | | 62,189 |
| 7,241 | | Matsushita Electric Industrial Company ADR | | | 92,757 |
| 2,147 | | Maxim Integrated Products | | | 96,422 |
| 1,420 | | Maytag Corporation | | | 38,482 |
| 2,473 | | McDATA Corporation† | | | 25,101 |
| 942 | | Microchip Technology Incorporated | | | 26,385 |
| 4,922 | | Micron Technology Incorporated† | | | 70,680 |
| 880 | | Mindspeed Technologies† | | | 3,098 |
| 12,000 | | Minebea Company Limited ADR | | | 119,507 |
| 1,748 | | Molex Incorporated | | | 51,426 |
| 14,198 | | Motorola Incorporated | | | 152,345 |
| 3,709 | | Mykrolis Corporation† | | | 46,733 |
| 1,237 | | National Presto Industries Incorporated | | | 45,212 |
| 1,559 | | National Semiconductor† | | | 45,429 |
| 2,974 | | Network Appliance Incorporated† | | | 66,647 |
| 12,239 | | Nokia Oyj ADR | | | 199,373 |
| 1,257 | | Novellus Systems Incorporated† | | | 50,230 |
| 1,572 | | NVIDIA Corporation† | | | 28,548 |
| 631 | | Omron Corporation ADR | | | 127,898 |
| 5,294 | | Pioneer Corporation ADR | | | 118,003 |
| 951 | | QLogic Corporation† | | | 46,618 |
| 4,490 | | Qualcomm Incorporated | | | 185,347 |
| 524 | | Rambus Incorporated† | | | 8,730 |
| 2,849 | | RF Micro Devices Incorporated† | | | 25,128 |
| Shares | | Security Name | | Value |
| 2,196 | | Rockwell Collins Incorporated | | $ | 59,402 |
| 4,863 | | Sanmina-SCI Corporation† | | | 43,670 |
| 1,883 | | Scientific-Atlanta Incorporated | | | 64,022 |
| 1,262 | | Skyworks Solutions Incorporated† | | | 14,311 |
| 6,795 | | Solectron Corporation† | | | 40,294 |
| 2,654 | | Sony Corporation ADR | | | 87,449 |
| 3,933 | | STMicroelectronics NV ADR | | | 98,089 |
| 1,653 | | TDK Corporation ADR | | | 107,114 |
| 4,802 | | Tellabs Incorporated† | | | 31,357 |
| 10,451 | | Texas Instruments Incorporated | | | 249,256 |
| 325 | | Varian Semiconductor Equipment Associates Incorporated† | | | 13,185 |
| 2,270 | | Vitesse Semiconductor Corporation† | | | 15,504 |
| 2,383 | | Xilinx Incorporated† | | | 73,492 |
| | |
| | | | | | 7,700,110 |
| | | | |
|
|
|
ENGINEERING, ACCOUNTING, RESEARCH
MANAGEMENT & RELATED SERVICES — 0.28% |
| 2,961 | | Applera Corporation-Celera Genomics Group† | | | 30,143 |
| 1,604 | | CDI Corporation | | | 40,822 |
| 184 | | Cephalon Incorporated† | | | 8,160 |
| 183 | | Corporate Executive Board Company† | | | 8,079 |
| 1,463 | | Dun & Bradstreet Corporation† | | | 61,592 |
| 4,772 | | First Consulting Group Incorporated† | | | 22,428 |
| 1,092 | | Fluor Corporation | | | 40,229 |
| 2,017 | | Monsanto Company | | | 51,857 |
| 1,216 | | Moody’s Corporation | | | 63,062 |
| 2,638 | | Paychex Incorporated | | | 94,968 |
| 2,276 | | Per-Se Technologies Incorporated† | | | 36,577 |
| 524 | | Quest Diagnostic Incorporated† | | | 31,440 |
| | |
| | | | | | 489,357 |
| | | | |
|
|
|
FABRICATED METAL PRODUCTS, EXCEPT
MACHINERY & TRANSPORTATION EQUIPMENT — 0.18% |
| 155 | | Ball Corporation | | | 8,184 |
| 1,280 | | Fortune Brands Incorporated | | | 72,192 |
| 1,814 | | Illinois Tool Works Incorporated | | | 131,134 |
| 3,573 | | Masco Corporation | | | 88,575 |
| 258 | | Simpson Manufacturing Company Incorporated† | | | 12,281 |
| 256 | | Snap-On Tools Corporation | | | 7,552 |
| | |
| | | | | | 319,918 |
| | | | |
|
|
|
| FINANCIAL SERVICES — 0.04% |
| 3,967 | | Janus Capital Group Incorporated | | | 68,510 |
| | | | |
|
|
|
| FOOD & KINDRED PRODUCTS — 1.69% |
| 170 | | American Italian Pasta Company Class A† | | | 7,092 |
| 3,249 | | Anheuser-Busch Companies Incorporated | | | 167,455 |
23
| WELLSFARGOOUTLOOK 2010FUND | | PORTFOLIOOFINVESTMENTS —AUGUST 31, 2003 (UNAUDITED) |
|
| Shares | | Security Name | | Value |
| Common Stock (Continued) |
| 5,531 | | Archer-Daniels-Midland Company | | $ | 76,715 |
| 7,106 | | Cadbury Schweppes plc ADR | | | 174,665 |
| 2,159 | | Campbell Soup Company | | | 52,248 |
| 12,304 | | Coca Cola Company | | | 535,470 |
| 3,458 | | Coca Cola Enterprises Incorporated | | | 63,938 |
| 17,900 | | Compass Group plc ADR | | | 99,168 |
| 3,125 | | ConAgra Foods Incorporated | | | 68,750 |
| 4,105 | | Diageo plc ADR | | | 179,553 |
| 2,112 | | General Mills Incorporated | | | 97,912 |
| 2,915 | | Hercules Incorporated† | | | 32,648 |
| 635 | | Hershey Foods Corporation | | | 44,387 |
| 375 | | HJ Heinz Company | | | 12,135 |
| 1,095 | | J & J Snack Foods Corporation† | | | 38,445 |
| 2,155 | | Kellogg Company | | | 72,257 |
| 25,312 | | Kirin Brewery Company Limited ADR | | | 177,690 |
| 2,523 | | National Beverage Corporation† | | | 38,223 |
| 7,403 | | Nestle SA ADR | | | 403,044 |
| 743 | | PBG | | | 17,921 |
| 8,326 | | Pepsico Incorporated | | | 370,840 |
| 1,893 | | Sanderson Farms Incorporated | | | 56,695 |
| 5,012 | | Sara Lee Corporation | | | 95,128 |
| 1,158 | | WM Wrigley Jr Company | | | 61,432 |
| | |
| | | | | | 2,943,811 |
| | | | |
|
|
|
| FOOD STORES — 0.43% |
| 2,510 | | Albertson’s Incorporated | | | 52,760 |
| 4,635 | | Coles Myer Limited ADR | | | 175,898 |
| 2,650 | | Ito-Yokado Company Limited ADR(a) | | | 75,695 |
| 8,369 | | Koninklijke Ahold NV ADR | | | 77,832 |
| 5,735 | | Kroger Company† | | | 110,169 |
| 3,071 | | Starbucks Corporation† | | | 87,339 |
| 13,579 | | Tesco plc ADR | | | 139,182 |
| 126 | | Whole Foods Market Incorporated† | | | 6,846 |
| 1,958 | | Winn-Dixie Stores Incorporated | | | 19,678 |
| | |
| | | | | | 745,399 |
| | | | |
|
|
|
| FORESTRY — 0.07% |
| 1,749 | | Plum Creek Timber Company Incorporated | | | 45,736 |
| 1,328 | | Weyerhaeuser Company | | | 79,016 |
| | |
| | | | | | 124,752 |
| | | | |
|
|
|
| FURNITURE & FIXTURES — 0.06% |
| 2,522 | | Leggett & Platt Incorporated | | | 58,410 |
| 2,207 | | Newell Rubbermaid Incorporated | | | 52,416 |
| | |
| | | | | | 110,826 |
| | | | |
|
|
|
| GENERAL MERCHANDISE STORES — 1.21% |
| 3,240 | | Dollar General Corporation | | | 74,291 |
| 231 | | Family Dollar Stores Incorporated | | | 9,268 |
| Shares | | Security Name | | Value |
| 1,380 | | Federated Department Stores Incorporated | | $ | 60,306 |
| 2,130 | | Fred’s Incorporated | | | 76,148 |
| 2,550 | | JC Penney Company Incorporated | | | 54,111 |
| 2,265 | | May Department Stores Company | | | 62,469 |
| 2,277 | | Mitsukoshi Limited ADR† | | | 62,448 |
| 2,125 | | Sears Roebuck & Company | | | 93,543 |
| 5,028 | | Target Corporation | | | 204,137 |
| 3,867 | | TJX Companies Incorporated | | | 83,759 |
| 22,494 | | Wal-Mart Stores Incorporated | | | 1,330,970 |
| | |
| | | | | | 2,111,450 |
| | | | |
|
|
|
| HEALTH SERVICES — 0.23% |
| 1,305 | | Caremark RX Incorporated† | | | 32,793 |
| 328 | | Express Scripts Incorporated† | | | 21,258 |
| 4,113 | | HCA Incorporated | | | 156,253 |
| 1,619 | | Human Genome Sciences Incorporated† | | | 23,055 |
| 542 | | Laboratory Corporation Of America Holdings† | | | 16,396 |
| 568 | | Lincare Holdings Incorporated† | | | 19,670 |
| 4,588 | | Tenet Healthcare Corporation† | | | 73,637 |
| 1,702 | | Triad Hospitals Incorporated† | | | 55,145 |
| | |
| | | | | | 398,207 |
| | | | |
|
|
|
HOLDINGS AND OTHER INVESTMENT OFFICES — 0.11% |
| 12,000 | | Mitsubishi Tokyo Finance | | | 70,440 |
| 16,164 | | Sun Hung Kai Properties | | | 116,576 |
| | |
| | | | | | 187,016 |
| | | | |
|
|
|
HOME FURNITURE, FURNISHINGS, &
EQUIPMENT STORES — 0.22% |
2,275 | | Bed Bath & Beyond Incorporated† | | | 97,894 |
2,167 | | Best Buy Company Incorporated† | | | 112,706 |
3,387 | | Circuit City Stores Incorporated | | | 35,326 |
1,317 | | Guitar Center Incorporated† | | | 44,172 |
1,596 | | RadioShack Corporation | | | 48,518 |
3,561 | | Tweeter Home Entertainment Group Incorporated† | | | 31,123 |
290 | | Williams-Sonoma Incorporated† | | | 8,877 |
| | |
| | | | | | 378,616 |
| | | | |
|
|
|
HOTELS, ROOMING HOUSES, CAMPS, & OTHER
LODGE PLACES — 0.18% |
8,053 | | Accor SA ADR | | | 156,890 |
5,260 | | Hilton Hotels Corporation | | | 80,373 |
1,934 | | Marriott International Incorporated | | | 78,965 |
| | |
| | | | | | 316,228 |
| | | | |
|
|
24
PORTFOLIOOFINVESTMENTS —AUGUST 31, 2003 (UNAUDITED) | | WELLSFARGOOUTLOOK 2010FUND |
|
| Shares | | Security Name | | Value |
| Common Stock (Continued) |
|
INDUSTRIAL & COMMERCIAL MACHINERY &
COMPUTER EQUIPMENT — 2.52% |
| 1,842 | | 3M Company | | $ | 262,429 |
| 753 | | American Standard Companies Incorporated† | | | 60,383 |
| 2,844 | | Apple Computer Incorporated† | | | 64,360 |
| 10,035 | | Applied Materials Incorporated† | | | 216,756 |
| 3,258 | | Baker Hughes Incorporated | | | 109,013 |
| 933 | | Black & Decker Corporation | | | 39,914 |
| 397 | | Briggs & Stratton Corporation | | | 23,344 |
| 2,062 | | Caterpillar Incorporated | | | 148,113 |
| 389 | | CDW Corporation† | | | 20,076 |
| 37,818 | | Cisco Systems Incorporated† | | | 724,215 |
| 1,561 | | Deere & Company | | | 88,212 |
| 13,588 | | Dell Incorporated† | | | 443,376 |
| 1,613 | | Dover Corporation | | | 61,326 |
| 637 | | Eaton Corporation | | | 59,649 |
| 14,333 | | EMC Corporation† | | | 182,746 |
| 1,285 | | Emulex Corporation† | | | 31,110 |
| 4,484 | | Gateway Incorporated† | | | 25,873 |
| 1,140 | | Global Imaging Systems Incorporated† | | | 29,309 |
| 18,173 | | Hewlett-Packard Company | | | 362,006 |
| 336 | | Idex Corporation | | | 13,030 |
| 1,018 | | Ingersoll-Rand Company Class A | | | 60,591 |
| 3,419 | | Juniper Networks Incorporated† | | | 58,875 |
| 2,068 | | Kadant Incorporated† | | | 39,085 |
| 530 | | Kennametal Incorporated | | | 20,840 |
| 5,823 | | Komatsu Limited ADR | | | 132,949 |
| 804 | | Lexmark International Incorporated† | | | 53,900 |
| 26,566 | | Makita Corporation ADR | | | 233,781 |
| 12,147 | | NEC Corporation ADR | | | 91,710 |
| 2,309 | | Pall Corporation | | | 57,725 |
| 1,309 | | Palm Incorporated† | | | 23,889 |
| 1,329 | | Parker Hannifin Corporation | | | 65,812 |
| 735 | | Pitney Bowes Incorporated | | | 28,665 |
| 2,658 | | Rainbow Technologies Incorporated† | | | 21,131 |
| 310 | | Sandisk Corporation† | | | 18,743 |
| 3,638 | | Siemens AG ADR | | | 226,575 |
| 1,217 | | Stanley Works | | | 36,839 |
| 2,595 | | Symbol Technologies Incorporated | | | 35,136 |
| 2,605 | | United Technologies Corporation | | | 209,051 |
| 139 | | Varian Associates Systems Incorporated† | | | 7,763 |
| 804 | | Western Digital Corporation† | | | 9,238 |
| | |
| | | | | | 4,397,538 |
| | | | |
|
|
|
| INSURANCE AGENTS, BROKERS & SERVICE — 0.13% |
| 2,182 | | AON Corporation | | | 48,441 |
| 2,866 | | Marsh & McLennan Companies Incorporated | | | 143,300 |
| 1,443 | | Medco Health Solutions Incorporated† | | | 38,521 |
| | |
| | | | | | 230,262 |
| | | | |
|
|
| Shares | | Security Name | | Value |
|
| INSURANCE CARRIERS — 2.17% |
| 1,451 | | Ace Limited | | $ | 46,722 |
| 6,141 | | Aegon NV ADR | | | 76,517 |
| 1,076 | | Aetna Incorporated | | | 61,332 |
| 3,576 | | AFLAC Incorporated | | | 114,468 |
| 6,550 | | Allianz AG ADR | | | 58,492 |
| 3,865 | | Allstate Corporation | | | 138,174 |
| 331 | | AMBAC Financial Group Incorporated | | | 21,489 |
| 15,307 | | American International Group Incorporated | | | 911,838 |
| 703 | | Anthem Incorporated† | | | 51,460 |
| 8,561 | | AXA ADR | | | 152,215 |
| 843 | | Chubb Corporation | | | 57,273 |
| 770 | | Cigna Corporation | | | 36,714 |
| 1,315 | | Cincinnati Financial Corporation | | | 53,060 |
| 2,106 | | Cobalt Corporation | | | 41,678 |
| 1,454 | | Hartford Financial Services Group Incorporated | | | 77,382 |
| 6,965 | | ING Group NV ADR | | | 137,419 |
| 840 | | Jefferson-Pilot Corporation | | | 37,187 |
| 814 | | John Hancock Financial Services Incorporated | | | 24,851 |
| 1,013 | | Lincoln National Corporation | | | 35,880 |
| 1,575 | | Loews Corporation | | | 64,827 |
| 1,056 | | MBIA Incorporated | | | 59,622 |
| 4,617 | | MetLife Incorporated | | | 131,215 |
| 824 | | MGIC Investment Corporation | | | 46,449 |
| 3,414 | | Millea Holdings Incorporated ADR | | | 174,592 |
| 1,137 | | Oxford Health Plans Incorporated† | | | 41,216 |
| 1,143 | | Principal Financial Group | | | 35,959 |
| 2,382 | | ProAssurance Corporation† | | | 61,313 |
| 1,448 | | Progressive Corporation | | | 102,432 |
| 3,432 | | Prudential Financial Incorporated | | | 124,959 |
| 1,044 | | Safeco Corporation | | | 37,647 |
| 1,955 | | Swiss Reinsurance ADR | | | 120,047 |
| 1,700 | | St Paul Companies Incorporated | | | 59,092 |
| 1,345 | | Torchmark Corporation | | | 54,284 |
| 7,342 | | Travelers Property Casualty Corporation Class B† | | | 113,728 |
| 4,245 | | UnitedHealth Group Incorporated | | | 209,830 |
| 2,729 | | UnumProvident Corporation | | | 38,479 |
| 1,436 | | WellPoint Health Networks Incorporated† | | | 112,008 |
| 810 | | XL Capital Limited Class A | | | 61,355 |
| | |
| | | | | | 3,783,205 |
| | | | |
|
|
|
| JUSTICE, PUBLIC ORDER, & SAFETY — 0.03% |
| 2,415 | | Wackenhut Corrections Corporation† | | | 43,591 |
| | | | |
|
|
|
| LEATHER & LEATHER PRODUCTS — 0.01% |
| 406 | | Coach Incorporated† | | | 23,564 |
| | | | |
|
|
25
| WELLSFARGOOUTLOOK 2010FUND | | PORTFOLIOOFINVESTMENTS —AUGUST 31, 2003 (UNAUDITED) |
|
| Shares | | Security Name | | Value |
| Common Stock (Continued) |
|
LUMBER & WOOD PRODUCTS, EXCEPT
FURNITURE — 0.05% |
| 3,673 | | Champion Enterprises Incorporated† | | $ | 26,629 |
| 2,388 | | Georgia-Pacific Corporation | | | 55,330 |
| | |
| | | | | | 81,959 |
| | | | |
|
|
|
MEASURING, ANALYZING, & CONTROLLING
INSTRUMENTS: PHOTOGRAPHIC, MEDICAL &
OPTICAL GOODS — 1.59% |
| 2,976 | | Advanced Medical Optics Incorporated† | | | 49,372 |
| 5,201 | | Advantest Corporation ADR | | | 90,289 |
| 3,300 | | Agilent Technologies Incorporated† | | | 80,256 |
| 1,051 | | Allergan Incorporated | | | 83,512 |
| 2,896 | | Applera Corporation—Applied Biosystems Group | | | 63,017 |
| 1,348 | | Bausch & Lomb Incorporated | | | 56,832 |
| 3,273 | | Baxter International Incorporated | | | 91,971 |
| 1,851 | | Becton Dickinson & Company | | | 67,636 |
| 2,363 | | Biomet Incorporated | | | 70,252 |
| 2,591 | | Boston Scientific Corporation† | | | 155,719 |
| 118 | | C R Bard Incorporated | | | 7,906 |
| 2,759 | | Credence Systems Corporation† | | | 31,701 |
| 962 | | Danaher Corporation | | | 74,315 |
| 1,908 | | Eastman Kodak Company | | | 53,214 |
| 2,997 | | Energy Conversion Devices Incorporated† | | | 35,964 |
| 4,362 | | Fuji Photo Film Company Limited ADR | | | 131,253 |
| 2,214 | | Guidant Corporation | | | 111,143 |
| 1,864 | | Ii-Vi Incorporated† | | | 46,097 |
| 1,746 | | Integra LifeSciences Holdings Corporation† | | | 47,159 |
| 1,961 | | Keithley Instruments Incorporated | | | 31,298 |
| 1,371 | | KLA-Tencor Corporation† | | | 81,383 |
| 6,596 | | Medtronic Incorporated | | | 327,030 |
| 1,349 | | Millipore Corporation | | | 61,245 |
| 2,490 | | Perkinelmer Incorporated | | | 41,185 |
| 822 | | Photon Dynamics Incorporated† | | | 26,641 |
| 3,379 | | Pinnacle Systems Incorporated† | | | 30,648 |
| 2,455 | | Raytheon Company | | | 78,707 |
| 923 | | Ricoh Company Limited ADR | | | 84,916 |
| 1,932 | | Rockwell Automation Incorporated | | | 52,589 |
| 1,456 | | St Jude Medical Incorporated† | | | 75,814 |
| 1,450 | | Stryker Corporation | | | 109,910 |
| 1,762 | | Tektronix Incorporated† | | | 41,654 |
| 1,822 | | Teradyne Incorporated† | | | 32,486 |
| 2,482 | | Thermo Electron Corporation† | | | 56,565 |
| 1,322 | | Trimble Navigation Limited† | | | 35,364 |
| 2,201 | | Viasys Healthcare Incorporated† | | | 48,642 |
| 1,781 | | Waters Corporation† | | | 54,321 |
| 6,199 | | Xerox Corporation† | | | 66,825 |
| 1,660 | | Zimmer Holdings Incorporated† | | | 85,885 |
| | |
| | | | | | 2,770,716 |
| | | | |
|
|
| Shares | | Security Name | | Value |
|
| METAL MINING — 0.21% |
| 755 | | Freeport-McMoRan Copper & Gold Incorporated Class B | | $ | 22,650 |
| 2,796 | | Newmont Mining Corporation | | | 109,770 |
| 938 | | Phelps Dodge Corporation† | | | 45,015 |
| 2,066 | | Rio Tinto plc ADR | | | 182,924 |
| | |
| | | | | | 360,359 |
| | | | |
|
|
|
MINING & QUARRYING OF NONMETALLIC
MINERALS, EXCEPT FUELS — 0.09% |
| 4,230 | | Pechiney SA ADR | | | 106,934 |
| 1,202 | | Vulcan Materials Company | | | 49,775 |
| | |
| | | | | | 156,709 |
| | | | |
|
|
|
MISCELLANEOUS MANUFACTURING INDUSTRIES — 0.26% |
| 3,219 | | Hasbro Incorporated | | | 59,552 |
| 2,960 | | Mattel Incorporated | | | 57,187 |
| 1,537 | | Steinway Musical Instruments† | | | 25,668 |
| 1,525 | | Tiffany & Company | | | 59,353 |
| 12,590 | | Tyco International Limited | | | 259,102 |
| | |
| | | | | | 460,862 |
| | | | |
|
|
|
| MISCELLANEOUS RETAIL — 0.41% |
| 1,923 | | Amazon.Com Incorporated† | | | 89,305 |
| 3,078 | | Costco Wholesale Corporation† | | | 98,773 |
| 2,845 | | CVS Corporation | | | 92,747 |
| 665 | | Dollar Tree Stores Incorporated† | | | 26,088 |
| 240 | | Michael's Stores Incorporated | | | 10,908 |
| 3,749 | | Office Depot Incorporated† | | | 68,382 |
| 4,053 | | Staples Incorporated† | | | 99,825 |
| 3,091 | | Toys R Us Incorporated† | | | 42,099 |
| 5,605 | | Walgreen Company | | | 182,555 |
| | |
| | | | | | 710,682 |
| | | | |
|
|
|
| MOTION PICTURES — 0.41% |
| 27,936 | | AOL Time Warner Incorporated† | | | 457,033 |
| 12,796 | | Walt Disney Company | | | 262,318 |
| | |
| | | | | | 719,351 |
| | | | |
|
|
|
MOTOR FREIGHT TRANSPORTATION &
WAREHOUSING — 0.25% |
| 217 | | Hunt (JB) Transport Services Incorporated† | | | 10,785 |
| 306 | | Landstar System Incorporated† | | | 18,883 |
| 6,258 | | United Parcel Service Incorporated | | | 392,752 |
| 395 | | USF Corporation | | | 12,581 |
| | |
| | | | | | 435,001 |
| | | | |
|
|
|
NON-DEPOSITORY CREDIT INSTITUTIONS — 0.90% |
| 6,951 | | American Express Company | | | 313,142 |
| 1,818 | | Capital One Financial Corporation | | | 97,081 |
| 4,477 | | Charter Municipal Mortgage Acceptance Company | | | 81,258 |
| 1,152 | | Countrywide Financial Corporation | | | 78,163 |
| 5,005 | | Fannie Mae | | | 324,274 |
| 4,149 | | Freddie Mac | | | 220,519 |
26
PORTFOLIOOFINVESTMENTS —AUGUST 31, 2003 (UNAUDITED) | | WELLSFARGOOUTLOOK 2010FUND |
|
| Shares | | Security Name | | Value |
| Common Stock (Continued) |
| 8,408 | | MBNA Corporation | | $ | 196,243 |
| 3,436 | | ORIX Corporation ADR | | | 115,106 |
| 3,348 | | Providian Financial Corporation | | | 34,317 |
| 2,610 | | SLM Corporation | | | 104,870 |
| | |
| | | | | | 1,564,973 |
| | | | |
|
|
|
| OIL & GAS EXTRACTION — 1.20% |
| 1,912 | | Anadarko Petroleum Corporation | | | 83,173 |
| 1,178 | | Apache Corporation | | | 81,258 |
| 13,023 | | BHP Billiton Limited ADR | | | 185,838 |
| 1,678 | | Burlington Resources Incorporated | | | 81,249 |
| 1,705 | | Devon Energy Corporation | | | 88,234 |
| 2,671 | | ENI SpA ADR | | | 204,038 |
| 4,552 | | Halliburton Company | | | 110,067 |
| 924 | | Kerr-McGee Corporation | | | 40,610 |
| 563 | | Nabors Industries Limited† | | | 22,604 |
| 2,168 | | Noble Corporation† | | | 78,438 |
| 2,565 | | Occidental Petroleum Corporation | | | 88,056 |
| 2,318 | | Pride International Incorporated† | | | 39,615 |
| 7,644 | | Repsol YPF SA ADR | | | 129,413 |
| 2,230 | | Rowan Companies Incorporated† | | | 55,839 |
| 2,984 | | Schlumberger Limited | | | 147,738 |
| 504 | | Seacor Holdings Incorporated† | | | 19,817 |
| 4,203 | | Shell Transport & Trading Company plc ADR | | | 161,563 |
| 2,683 | | Southwestern Energy Company† | | | 48,723 |
| 4,688 | | Total Sa ADR | | | 361,023 |
| 2,672 | | Transocean Incorporated† | | | 56,433 |
| | |
| | | | | | 2,083,729 |
| | | | |
|
|
|
| PAPER & ALLIED PRODUCTS — 0.34% |
| 164 | | Bemis Company Incorporated | | | 7,423 |
| 1,963 | | Boise Cascade Corporation | | | 53,492 |
| 2,458 | | International Paper Company | | | 99,672 |
| 2,742 | | Kimberly-Clark Corporation | | | 140,144 |
| 2,005 | | MeadWestvaco Corporation | | | 50,827 |
| 314 | | Potlatch Corporation | | | 9,260 |
| 7,021 | | Stora Enso Oyj ADR | | | 90,501 |
| 708 | | Temple-Inland Incorporated | | | 35,244 |
| 5,962 | | Upm-Kymmene Oyj ADR | | | 108,389 |
| | |
| | | | | | 594,952 |
| | | | |
|
|
|
| PERSONAL SERVICES — 0.16% |
| 1,853 | | Cintas Corporation | | | 73,990 |
| 1,895 | | G & K Services Incorporated Class A | | | 62,630 |
| 1,268 | | H & R Block Incorporated | | | 55,919 |
| 265 | | Regis Corporation | | | 9,166 |
| 3,073 | | Unifirst Corporation | | | 79,130 |
| | |
| | | | | | 280,835 |
| | | | |
|
|
| Shares | | Security Name | | Value |
|
PETROLEUM REFINING & RELATED
INDUSTRIES — 1.74% |
| 795 | | Amerada Hess Corporation | | $ | 37,485 |
| 10,737 | | BP plc ADR | | | 447,948 |
| 5,851 | | ChevronTexaco Corporation | | | 426,362 |
| 4,193 | | ConocoPhillips | | | 234,137 |
| 39,036 | | Exxon Mobil Corporation | | | 1,471,657 |
| 1,971 | | Headwaters Incorporated† | | | 27,476 |
| 2,643 | | Marathon Oil Corporation | | | 73,713 |
| 5,584 | | Royal Dutch Petroleum Company | | | 250,554 |
| 2,268 | | Unocal Corporation† | | | 69,446 |
| | |
| | | | | | 3,038,778 |
| | | | |
|
|
|
| PRIMARY METAL INDUSTRIES — 0.34% |
| 5,999 | | Alcoa Incorporated | | | 171,332 |
| 4,712 | | Allegheny Technologies Incorporated | | | 35,104 |
| 2,321 | | Engelhard Corporation | | | 65,150 |
| 2,649 | | General Cable Corporation† | | | 23,920 |
| 3,023 | | Johnson Matthew plc ADR | | | 93,864 |
| 7,904 | | Kubota Corporation ADR | | | 131,997 |
| 709 | | Mueller Industries Incorporated† | | | 20,476 |
| 1,057 | | Nucor Corporation | | | 54,340 |
| | |
| | | | | | 596,183 |
| | | | |
|
|
|
PRINTING, PUBLISHING, & ALLIED INDUSTRIES — 0.83% |
| 1,199 | | Dow Jones & Company Incorporated | | | 50,921 |
| 1,806 | | Gannett Company Incorporated | | | 141,627 |
| 922 | | Knight-Ridder Incorporated | | | 62,567 |
| 1,400 | | McGraw-Hill Companies Incorporated | | | 85,400 |
| 1,313 | | New York Times Company | | | 58,284 |
| 3,301 | | News Corporation Limited ADR | | | 113,389 |
| 8,711 | | Pearson plc ADR | | | 86,674 |
| 4,979 | | Reed Elsevier NV ADR | | | 111,032 |
| 2,311 | | RR Donnelley & Sons Company | | | 58,099 |
| 2,152 | | Toppan Printing Company Limited ADR | | | 87,054 |
| 2,476 | | Tribune Company | | | 114,515 |
| 10,403 | | Viacom Incorporated Class B | | | 468,135 |
| | |
| | | | | | 1,437,697 |
| | | | |
|
|
|
| RAILROAD TRANSPORTATION — 0.15% |
| 1,768 | | Burlington Northern Santa Fe Corporation | | | 50,123 |
| 1,460 | | CSX Corporation | | | 47,129 |
| 3,695 | | Kansas City Southern† | | | 44,894 |
| 2,641 | | Norfolk Southern Corporation | | | 50,285 |
| 993 | | Union Pacific Corporation | | | 60,513 |
| | |
| | | | | | 252,944 |
| | | | |
|
|
|
RUBBER & MISCELLANEOUS PLASTICS
PRODUCTS — 0.11% |
| 5,297 | | Goodyear Tire & Rubber Company | | | 37,715 |
27
| WELLSFARGOOUTLOOK 2010FUND | | PORTFOLIOOFINVESTMENTS —AUGUST 31, 2003 (UNAUDITED) |
|
| Shares | | Security Name | | Value |
| |
| Common Stock (Continued) | | | |
| 1,888 | | Nike Incorporated Class B | | $ | 107,578 |
| 948 | | Sealed Air Corporation† | | | 46,130 |
| | |
| | | | | | 191,423 |
| | | | |
|
|
|
SECURITY & COMMODITY BROKERS, DEALERS,
EXCHANGES & SERVICES — 1.02% |
| 4,974 | | Amvescap plc ADR | | | 79,784 |
| 916 | | Bear Stearns Companies Incorporated | | | 64,102 |
| 10,852 | | Charles Schwab Corporation | | | 117,853 |
| 5,275 | | Credit Suisse Group | | | 166,004 |
| 252 | | Eaton Vance Corporation | | | 8,583 |
| 2,134 | | Franklin Resources Incorporated | | | 92,167 |
| 2,722 | | Friedman Billings Ramsey Group Incorporated | | | 45,158 |
| 2,869 | | Goldman Sachs Group Incorporated | | | 253,878 |
| 1,747 | | Lehman Brothers Holdings Incorporated | | | 114,830 |
| 5,081 | | Merrill Lynch & Company Incorporated | | | 273,256 |
| 6,586 | | Morgan Stanley | | | 321,331 |
| 244 | | Neuberger Berman Incorporated | | | 10,116 |
| 9,706 | | Nomura Holdings Incorporated ADR | | | 142,193 |
| 2,068 | | T Rowe Price Group Incorporated | | | 87,890 |
| | |
| | | | | | 1,777,145 |
| | | | |
|
|
|
| SOCIAL SERVICES — 0.03% |
| 9,723 | | ABB Limited ADR† | | | 55,616 |
| | | | |
|
|
|
STONE, CLAY, GLASS, & CONCRETE
PRODUCTS — 0.24% |
| 7,254 | | Corning Incorporated† | | | 59,845 |
| 3,982 | | Hanson plc ADR | | | 129,614 |
| 7,419 | | Holcim Limited ADR† | | | 146,999 |
| 5,223 | | Lafarge SA ADR | | | 88,582 |
| | |
| | | | | | 425,040 |
| | | | |
|
|
|
| TOBACCO PRODUCTS — 0.43% |
| 10,942 | | Altria Group Incorporated | | | 451,029 |
| 4,932 | | British American Tobacco plc ADR | | | 101,156 |
| 1,930 | | Swedish Match AB ADR | | | 131,240 |
| 356 | | Universal Corporation | | | 14,916 |
| 1,561 | | UST Incorporated | | | 52,137 |
| | |
| | | | | | 750,478 |
| | | | |
|
|
|
| TRANSPORTATION BY AIR — 0.24% |
10,458 | | BAA plc ADR | | | 75,431 |
2,299 | | FedEx Corporation | | | 154,263 |
7,165 | | Japan Airlines System Corporation ADR | | | 84,435 |
5,730 | | Southwest Airlines Company | | | 97,926 |
| | |
| | | | | | 412,055 |
| | | | |
|
|
| Shares | | Security Name | | Value |
|
| TRANSPORTATION EQUIPMENT — 1.26% |
| 6,701 | | BAE Systems plc ADR | | $ | 72,393 |
| 5,335 | | Boeing Company | | | 199,476 |
| 3,585 | | DaimlerChrysler AG | | | 137,055 |
| 2,347 | | Dana Corporation | | | 36,191 |
| 5,340 | | Delphi Corporation | | | 48,380 |
| 9,216 | | Fiat SpA ADR | | | 62,577 |
| 11,689 | | Ford Motor Company | | | 135,125 |
| 1,264 | | General Dynamics Corporation | | | 108,843 |
| 2,860 | | General Motors Corporation | | | 117,546 |
| 1,718 | | Genuine Parts Company | | | 55,010 |
| 2,065 | | Goodrich Corporation | | | 53,752 |
| 273 | | Group 1 Automotive Incorporated† | | | 10,278 |
| 2,027 | | Harley-Davidson Incorporated | | | 100,985 |
| 7,522 | | Honda Motor Company Limited ADR | | | 153,148 |
| 5,361 | | Honeywell International Incorporated | | | 155,415 |
| 796 | | ITT Industries Incorporated | | | 51,804 |
| 594 | | Johnson Controls Incorporated | | | 58,806 |
| 2,673 | | Lockheed Martin Corporation | | | 136,938 |
| 1,021 | | Navistar International Corporation | | | 45,669 |
| 1,033 | | Northrop Grumman Corporation | | | 98,631 |
| 1,018 | | PACCAR Incorporated | | | 86,734 |
| 3,416 | | Sports Resorts International Incorporated† | | | 16,909 |
| 383 | | Textron Incorporated | | | 17,235 |
| 4,125 | | Toyota Motor Corporation ADR | | | 228,484 |
| | |
| | | | | | 2,187,384 |
| | | | |
|
|
|
| TRANSPORTATION SERVICES — 0.05% |
| 266 | | C H Robinson Worldwide Incorporated | | | 10,100 |
| 389 | | Expeditors International of Washington Incorporated | | | 14,669 |
| 1,807 | | Pegasus Solutions Incorporated† | | | 26,111 |
| 1,924 | | Sabre Holdings Corporation | | | 43,521 |
| | |
| | | | | | 94,401 |
| | | | |
|
|
|
| WATER TRANSPORTATION — 0.10% |
| 3,978 | | Carnival Corporation | | | 137,599 |
| 861 | | Kirby Corporation† | | | 25,141 |
| 399 | | Overseas Shipholding Group Incorporated | | | 10,338 |
| | |
| | | | | | 173,078 |
| | | | |
|
|
|
| WHOLESALE TRADE-DURABLE GOODS — 0.88% |
| 539 | | Hughes Supply Incorporated | | | 19,135 |
| 1,887 | | Imagistics International Incorporated† | | | 53,968 |
| 15,660 | | Johnson & Johnson | | | 776,423 |
| 1,253 | | Kyocera Corporation ADR | | | 79,352 |
| 9,010 | | Mitsubishi Corporation ADR | | | 152,277 |
| 1,114 | | Mitsui & Company Limited ADR | | | 142,046 |
| 7,413 | | Nissan Motor Company Limited ADR | | | 160,862 |
28
PORTFOLIOOFINVESTMENTS —AUGUST 31, 2003 (UNAUDITED) | | WELLSFARGOOUTLOOK 2010FUND |
|
| Shares | | Security Name | | Value |
| Common Stock (Continued) |
| 17,011 | | Sumitomo Mitsui Financial | | $ | 59,338 |
| 4,897 | | Visteon Corporation | | | 33,055 |
| 1,105 | | WW Grainger Incorporated | | | 55,062 |
| | |
| | | | | | 1,531,518 |
| | | | |
|
|
|
| WHOLESALE TRADE-NONDURABLE GOODS — 0.52% |
| 383 | | AmeriSource Bergen Corporation | | | 22,293 |
| 567 | | Brown-Forman Corporation
Class B | | | 44,816 |
| 2,729 | | Cardinal Health Incorporated | | | 155,362 |
| 1,905 | | Maui Land & Pineapple Company Incorporated | | | 47,816 |
| 2,302 | | McKesson Corporation | | | 75,367 |
| 1,707 | | Nash Finch Company | | | 27,312 |
| 3,043 | | Safeway Incorporated† | | | 74,280 |
| 1,976 | | Supervalu Incorporated | | | 47,622 |
| 3,809 | | Sysco Corporation | | | 119,831 |
| 2,797 | | Unilever NV NY Shares | | | 156,576 |
| 4,093 | | Unilever plc ADR | | | 133,515 |
| | |
| | | | | | 904,790 |
| | | | |
|
|
TOTAL COMMON STOCK
(Cost $86,198,143) | | | 83,821,622 |
| | | | |
|
|
|
| Real Estate Investment Trust — 0.38% |
| 3,254 | | Alexandria Real Estate Equities Incorporated | | | 152,126 |
| 1,967 | | Capstead Mortgage Corporation | | | 24,430 |
| 5,666 | | Crown American Realty Trust | | | 63,912 |
| 7,177 | | Koger Equity Incorporated | | | 128,253 |
| 3,101 | | Mid-America Apartment Communities Incorporated | | | 91,138 |
| 3,119 | | Parkway Properties Incorporated | | | 139,887 |
| 7,213 | | Winston Hotels Incorporated | | | 66,937 |
TOTAL REAL ESTATE INVESTMENT
TRUST
(Cost $603,653) | | | 666,683 |
| | | | |
|
|
| Principal | | Interest Rate | | Maturity Date | | |
| US Treasury Obligations — 49.51% | | |
| |
| US TREASURY BONDS — 1.35% | | |
| $ | 500,000 | | 12.75% | | 11/15/10 | | 612,988 |
| | 300,000 | | 13.75% | | 8/15/04 | | 335,063 |
| | 1,200,000 | | 10.75% | | 8/15/05 | | 1,402,453 |
| | | |
| | | | | | | | 2,350,504 |
| | | | | | |
|
| |
| US TREASURY NOTES — 48.16% | | |
| | 4,375,000 | | 3.00% | | 11/15/07 | | 4,352,954 |
| | 2,780,000 | | 4.00% | | 11/15/12 | | 2,695,513 |
| | 7,730,000 | | 1.63% | | 1/31/05 | | 7,737,552 |
| | 3,050,000 | | 1.50% | | 2/28/05 | | 3,045,355 |
| | 1,390,000 | | 1.63% | | 4/30/05 | | 1,387,773 |
| | 1,600,000 | | 2.00% | | 5/15/06 | | 1,587,563 |
| | 1,810,000 | | 1.13% | | 6/30/05 | | 1,787,446 |
| | 800,000 | | 7.25% | | 8/15/04 | | 845,125 |
| | 3,950,000 | | 7.88% | | 11/15/04 | | 4,251,958 |
| | 9,100,000 | | 6.50% | | 5/15/05 | | 9,823,732 |
| | 2,600,000 | | 5.63% | | 2/15/06 | | 2,813,382 |
| | 2,270,000 | | 6.88% | | 5/15/06 | | 2,537,613 |
| Principal | | Interest Rate | | Maturity Date | | Value |
| $ | 2,160,000 | | 6.50% | | 10/15/06 | | $ | 2,411,437 |
| | 100,000 | | 6.63% | | 5/15/07 | | | 113,066 |
| | 4,210,000 | | 6.13% | | 8/15/07 | | | 4,696,289 |
| | 5,100,000 | | 5.63% | | 5/15/08 | | | 5,603,426 |
| | 2,435,000 | | 4.75% | | 11/15/08 | | | 2,576,534 |
| | 2,850,000 | | 6.00% | | 8/15/04 | | | 2,977,136 |
| | 1,060,000 | | 6.00% | | 8/15/09 | | | 1,187,365 |
| | 1,000,000 | | 6.50% | | 2/15/10 | | | 1,149,336 |
| | 1,200,000 | | 5.75% | | 8/15/10 | | | 1,326,937 |
| | 3,100,000 | | 5.75% | | 11/15/05 | | | 3,344,971 |
| | 1,750,000 | | 5.00% | | 2/15/11 | | | 1,848,233 |
| | 6,920,000 | | 4.63% | | 5/15/06 | | | 7,333,581 |
| | 5,610,000 | | 5.00% | | 8/15/11 | | | 5,906,275 |
| | 520,000 | | 4.88% | | 2/15/12 | | | 541,024 |
| | | |
| | | | | | | | | 83,881,576 |
| | | | | | |
|
| TOTAL US TREASURY OBLIGATIONS | | | |
| (Cost $85,421,772) | | | | | 86,232,080 |
| | | | | | | |
|
|
| Short Term Investments — 1.46% | | | |
| |
| US TREASURY BILLS — 1.46% | | | |
| | 86,000 | | 0.92%^ | | 10/16/03 | | | 85,899 |
| | 140,000 | | 0.93%^ | | 10/16/03 | | | 139,835 |
| | 146,000 | | 0.89%^ | | 10/16/03 | | | 145,828 |
| | 26,000 | | 0.91%^ | | 10/16/03 | | | 25,969 |
| | 135,000 | | 0.91%^ | | 10/16/03 | | | 134,841 |
| | 70,000 | | 0.89%^ | | 10/16/03 | | | 69,918 |
| | 22,000 | | 0.90%^ | | 10/16/03 | | | 21,974 |
| | 724,000 | | 0.89%^ | | 10/16/03 | | | 723,177 |
| | 718,000 | | 0.90%^ | | 10/16/03 | | | 717,210 |
| | 157,000 | | 0.90%^ | | 10/16/03 | | | 156,828 |
| | 244,000 | | 0.90%^ | | 10/16/03 | | | 243,732 |
| | 75,000 | | 0.88%^ | | 10/16/03 | | | 74,912 |
| |
TOTAL SHORT TERM INVESTMENTS
(Cost $2,540,211) | | | 2,540,123 |
| | | | | | | |
|
|
TOTAL INVESTMENTS IN
SECURITIES | | | |
| (Cost $174,763,779) | | 99.47% | | $ | 173,260,508 |
| | |
Other Assets and Liabilities,
Net | | 0.53 | | | 919,032 |
| | | | | |
| |
|
|
| TOTAL NET ASSETS | | 100.00% | | $ | 174,179,540 |
| �� | | | | |
| |
|
|
| (a) | Security Fair Valued in accordance with the procedures approved by the Board of Trustees. |
| † | Non-income earning securities. |
| ‡ | Security of an affiliate of the fund with a cost of $428,662 |
The accompanying notes are an integral part of these financial statements.
29
| WELLSFARGOOUTLOOK 2020FUND | | PORTFOLIOOFINVESTMENTS —AUGUST 31, 2003 (UNAUDITED) |
|
| Shares | | Security Name | | Value |
| Common Stock — 62.57% | | | |
|
| AMUSEMENT & RECREATION SERVICES — 0.11% |
| 2,050 | | Harrah's Entertainment Incorporated | | $ | 84,911 |
| 5,956 | | International Game Technology | | | 153,903 |
| 7,942 | | Park Place Entertainment Corporation† | | | 69,731 |
| | |
| | | | | | 308,545 |
| | | | |
|
|
|
| APPAREL & ACCESSORY STORES — 0.32% |
| 1,111 | | Abercrombie & Fitch Company Class A† | | | 33,819 |
| 12,692 | | Gap Incorporated | | | 265,136 |
| 3,921 | | Kohl's Corporation† | | | 248,003 |
| 8,779 | | Limited Brands | | | 148,892 |
| 3,720 | | Nordstrom Incorporated | | | 96,980 |
| 1,851 | | Payless ShoeSource Incorporated† | | | 27,284 |
| 1,640 | | Ross Stores Incorporated | | | 82,623 |
| | |
| | | | | | 902,737 |
| | | | |
|
|
|
APPAREL & OTHER FINISHED PRODUCTS MADE
FROM FABRICS & SIMILAR MATERIALS — 0.38% |
| 17,972 | | Benetton Group SpA ADR | | | 366,269 |
| 2,213 | | Jones Apparel Group Incorporated | | | 68,360 |
| 2,743 | | Liz Claiborne Incorporated | | | 94,551 |
| 2,483 | | VF Corporation | | | 99,568 |
| 10,735 | | Wacoal Corporation ADR | | | 423,281 |
| | |
| | | | | | 1,052,029 |
| | | | |
|
|
|
AUTOMOTIVE DEALERS & GASOLINE
SERVICE STATIONS — 0.11% |
| 4,938 | | AutoNation Incorporated† | | | 92,785 |
| 1,336 | | AutoZone Incorporated† | | | 122,644 |
| 2,121 | | CarMax Incorporated | | | 81,765 |
| | |
| | | | | | 297,194 |
| | | | |
|
|
|
BUILDING CONSTRUCTION-GENERAL
CONTRACTORS & OPERATIVE BUILDERS — 0.27% |
| 26 | | Cavco Industries Incorporated† | | | 496 |
| 837 | | Centex Corporation | | | 63,127 |
| 485 | | MDC Holdings Incorporated | | | 24,784 |
| 88 | | NVR Incorporated† | | | 38,148 |
| 731 | | Pulte Homes Incorporated | | | 48,655 |
| 45,902 | | Sekisui House Limited ADR | | | 403,234 |
| 9,704 | | Vivendi Universal SA ADR† | | | 163,998 |
| | |
| | | | | | 742,442 |
| | | | |
|
|
|
BUILDING MATERIALS, HARDWARE, GARDEN
SUPPY, & MOBILE HOME DEALERS — 0.55% |
| 1,720 | | Fastenal Company | | | 69,540 |
| 26,830 | | Home Depot Incorporated | | | 862,852 |
| 9,365 | | Lowe’s Companies Incorporated | | | 513,764 |
| 2,776 | | Sherwin-Williams Company | | | 83,502 |
| | |
| | | | | | 1,529,658 |
| | | | |
|
|
|
| BUSINESS SERVICES — 4.28% |
| 3,938 | | 3Com Corporation† | | | 22,447 |
| 3,046 | | Adobe Systems Incorporated | | | 118,276 |
| Shares | | Security Name | | Value |
| 15,344 | | Adecco SA ADR | | $ | 194,869 |
| 1,400 | | Advent Software Incorporated† | | | 23,660 |
| 1,156 | | Affiliated Computer Services Incorporated† | | | 57,349 |
| 5,824 | | Akamai Technologies Incorporated† | | | 24,228 |
| 56,865 | | AOL Time Warner Incorporated† | | | 930,312 |
| 1,824 | | Arbitron Incorporated† | | | 67,452 |
| 1,884 | | Ariba Incorporated† | | | 4,785 |
| 3,358 | | AutoDesk Incorporated | | | 60,108 |
| 6,191 | | Automatic Data Processing Incorporated | | | 247,083 |
| 6,121 | | BEA Systems Incorporated† | | | 82,940 |
| 4,370 | | BMC Software Incorporated† | | | 64,152 |
| 5,060 | | Cadence Design Systems Incorporated† | | | 71,953 |
| 13,674 | | Cendant Corporation† | | | 245,859 |
| 4,024 | | Ceridian Corporation† | | | 78,227 |
| 1,611 | | Checkfree Corporation† | | | 37,021 |
| 1,658 | | ChoicePoint Incorporated† | | | 65,077 |
| 3,361 | | Citrix Systems Incorporated† | | | 69,203 |
| 8,215 | | Computer Associates International Incorporated | | | 210,550 |
| 2,302 | | Computer Sciences Corporation† | | | 97,996 |
| 9,026 | | Compuware Corporation† | | | 53,705 |
| 6,602 | | Concord EFS Incorporated† | | | 91,438 |
| 3,324 | | Convergys Corporation† | | | 59,832 |
| 1,648 | | Deluxe Corporation | | | 70,370 |
| 3,720 | | DoubleClick Incorporated† | | | 41,924 |
| 1,564 | | DST Systems Incorporated† | | | 61,934 |
| 7,714 | | eBay Incorporated† | | | 428,358 |
| 2,211 | | Echelon Corporation† | | | 32,878 |
| 2,470 | | eFunds Corporation† | | | 31,542 |
| 1,870 | | Electronic Arts Incorporated† | | | 167,833 |
| 6,307 | | Electronic Data Systems Corporation | | | 137,682 |
| 5,755 | | Enterasys Networks Incorporated† | | | 33,206 |
| 2,863 | | Equifax Incorporated | | | 65,677 |
| 3,637 | | eUniverse Incorporated† (a) | | | 6,474 |
| 660 | | Fair Isaac Corporation | | | 38,676 |
| 8,924 | | First Data Corporation | | | 342,682 |
| 3,125 | | Fiserv Incorporated† | | | 121,406 |
| 229 | | Hudson Highland Group Incorporated† | | | 4,782 |
| 4,981 | | IMS Health Incorporated | | | 96,980 |
| | | Infospace Incorporated | | | 5 |
| 1,709 | | Internet Security Systems Incorporated† | | | 21,345 |
| 5,725 | | Interpublic Group of Companies Incorporated | | | 86,734 |
| 2,611 | | Intuit Incorporated† | | | 118,331 |
| 1,637 | | Macromedia Incorporated† | | | 39,026 |
| 2,030 | | Manpower Incorporated | | | 78,987 |
| 1,537 | | Mercury Interactive Corporation† | | | 67,459 |
| 1,816 | | Micromuse Incorporated† | | | 14,855 |
| 123,804 | | Microsoft Corporation | | | 3,283,282 |
30
PORTFOLIOOFINVESTMENTS —AUGUST 31, 2003 (UNAUDITED) | | WELLSFARGOOUTLOOK 2020FUND |
|
| Shares | | Security Name | | Value |
| Common Stock (Continued) |
| 2,482 | | Monster Worldwide Incorporated† | | $ | 67,808 |
| 5,736 | | MPS Group Incorporated† | | | 54,779 |
| 1,532 | | NCR Corporation† | | | 44,443 |
| 3,185 | | Network Associates Incorporated† | | | 44,335 |
| 5,062 | | Novell Incorporated† | | | 25,462 |
| 1,892 | | Omnicom Group Incorporated | | | 147,765 |
| 63,105 | | Oracle Corporation† | | | 806,482 |
| 4,022 | | Parametric Technology† | | | 13,393 |
| 4,171 | | PeopleSoft Incorporated† | | | 75,495 |
| 1,323 | | RealNetworks Incorporated† | | | 8,361 |
| 12,842 | | Rentokil Initial plc ADR | | | 213,285 |
| 4,909 | | Reuters Group plc ADR | | | 115,951 |
| 4,197 | | Robert Half International Incorporated† | | | 93,341 |
| 1,462 | | RSA Security Incorporated† | | | 17,661 |
| 10,609 | | SAP AG ADR | | | 317,630 |
| 8,075 | | Siebel Systems Incorporated† | | | 81,396 |
| 46,673 | | Sun Microsystems Incorporated† | | | 180,158 |
| 4,272 | | Sungard Data Systems Incorporated† | | | 120,470 |
| 3,044 | | Sybase Incorporated† | | | 51,474 |
| 2,040 | | Symantec Corporation† | | | 117,157 |
| 1,196 | | Synopsys Incorporated† | | | 81,579 |
| 4,116 | | TIBCO Software Incorporated† | | | 22,021 |
| 5,708 | | Unisys Corporation† | | | 74,090 |
| 3,614 | | VeriSign Incorporated† | | | 54,102 |
| 5,274 | | Veritas Software Corporation† | | | 181,848 |
| 2,865 | | Viad Corporation | | | 68,416 |
| 1,899 | | webMethods Incorporated† | | | 17,129 |
| 4,198 | | WPP Group plc ADR | | | 192,646 |
| 7,549 | | Yahoo! Incorporated† | | | 252,137 |
| | |
| | | | | | 11,911,764 |
| | | | |
|
|
|
| CHEMICALS & ALLIED PRODUCTS — 6.77% |
| 18,170 | | Abbott Laboratories | | | 732,251 |
| 2,768 | | Abgenix Incorporated† | | | 35,984 |
| 2,288 | | Air Products & Chemicals Incorporated | | | 108,268 |
| 7,306 | | Akzo Nobel NV ADR | | | 238,395 |
| 1,128 | | Alberto-Culver Company Class B | | | 64,386 |
| 15,005 | | Amgen Incorporated† | | | 988,830 |
| 15,600 | | AstraZeneca plc ADR | | | 618,540 |
| 6,353 | | Aventis SA ADR | | | 311,297 |
| 968 | | Avery Dennison Corporation | | | 52,998 |
| 2,930 | | Avon Products Incorporated | | | 187,813 |
| 6,497 | | BASF AG ADR | | | 301,136 |
| 9,373 | | Bayer AG ADR | | | 202,738 |
| 2,103 | | Biogen Incorporated† | | | 82,984 |
| 22,363 | | Bristol-Myers Squibb Company | | | 567,349 |
| 1,382 | | Cabot Corporation | | | 37,577 |
| 8,555 | | Centerpulse Limited | | | 235,434 |
| 2,933 | | Chiron Corporation† | | | 149,055 |
| 2,768 | | Clorox Company | | | 118,609 |
| 6,080 | | Colgate Palmolive Company | | | 336,102 |
| 4,034 | | Crompton Corporation | | | 23,841 |
| 10,570 | | Dow Chemical Company | | | 364,982 |
| Shares | | Security Name | | Value |
| 10,725 | | E I Du Pont de Nemours & Company | | $ | 479,837 |
| 1,079 | | Eastman Chemical Company | | | 38,639 |
| 4,027 | | Ecolab Incorporated | | | 103,856 |
| 13,138 | | Eli Lilly & Company | | | 874,071 |
| 1,424 | | Estee Lauder Companies Incorporated | | | 49,114 |
| 810 | | FMC Corporation† | | | 20,161 |
| 4,868 | | Forest Laboratories Incorporated† | | | 228,796 |
| 2,517 | | Genentech Incorporated† | | | 199,850 |
| 2,944 | | Genzyme Corporation† | | | 138,810 |
| 2,703 | | Gilead Sciences Incorporated† | | | 180,290 |
| 11,500 | | Gillette Company | | | 373,290 |
| 23,508 | | GlaxoSmithKline plc ADR | | | 912,816 |
| 2,089 | | Great Lakes Chemical Corporation | | | 44,266 |
| 2,177 | | ICN Pharmaceuticals Incorporated | | | 38,098 |
| 1,829 | | IDEC Pharmaceuticals Corporation† | | | 63,558 |
| 3,098 | | IMC Global Incorporated | | | 24,257 |
| 1,338 | | ImClone Systems Incorporated† | | | 56,236 |
| 2,272 | | International Flavors & Fragrances Incorporated | | | 71,568 |
| 2,897 | | IVAX Corporation† | | | 57,361 |
| 4,161 | | King Pharmaceuticals Incorporated† | | | 58,462 |
| 1,501 | | Lubrizol Corporation | | | 51,034 |
| 3,016 | | Medarex Incorporated† | | | 18,126 |
| 324 | | Medicis Pharmaceutical Corporation | | | 19,790 |
| 3,570 | | MedImmune Incorporated† | | | 124,486 |
| 25,912 | | Merck & Company Incorporated | | | 1,303,892 |
| 4,070 | | Millennium Chemicals Incorporated | | | 44,037 |
| 3,223 | | Mylan Laboratories Incorporated | | | 117,317 |
| 24,158 | | Novartis AG ADR | | | 893,121 |
| 5,623 | | Novo Nordisk A/S ADR | | | 201,022 |
| 91,150 | | Pfizer Incorporated | | | 2,727,208 |
| 1,892 | | PPG Industries Incorporated | | | 103,890 |
| 1,765 | | Praxair Incorporated | | | 112,642 |
| 13,957 | | Procter & Gamble Company | | | 1,218,307 |
| 2,918 | | Protein Design Labs Incorporated† | | | 35,891 |
| 7,176 | | Roche Holding AG ADR | | | 549,521 |
| 2,920 | | Rohm & Haas Company | | | 106,084 |
| 17,205 | | Schering-Plough Corporation | | | 261,344 |
| 2,014 | | Sepracor Incorporated† | | | 54,217 |
| 21,000 | | Shiseido Company Limited ADR | | | 219,755 |
| 1,169 | | Sigma Aldrich Corporation | | | 64,003 |
| 1,509 | | Valspar Corporation | | | 70,123 |
| 2,413 | | Vertex Pharmaceuticals Incorporated† | | | 30,404 |
| 1,905 | | Watson Pharmaceuticals Incorporated† | | | 78,296 |
| 15,378 | | Wyeth | | | 658,944 |
| | |
| | | | | | 18,835,359 |
| | | | |
|
|
31
| WELLSFARGOOUTLOOK 2020FUND | | PORTFOLIOOFINVESTMENTS —AUGUST 31, 2003 (UNAUDITED) |
|
| Shares | | Security Name | | Value |
| Common Stock (Continued) |
|
| COAL MINING — 0.02% |
2,329 | | Arch Coal Incorporated | | $ | 53,451 |
| | | | |
|
|
|
| COMMUNICATIONS — 3.73% |
| 3,185 | | Alltel Corporation | | | 145,873 |
| 3,992 | | American Tower Corporation Class A† | | | 45,429 |
| 10,161 | | AT&T Corporation | | | 226,590 |
| 36,385 | | AT&T Wireless Services Incorporated† | | | 313,639 |
| 6,267 | | Avaya Incorporated† | | | 65,490 |
| 21,369 | | BellSouth Corporation | | | 538,499 |
| 5,246 | | British Sky Broadcasting Group plc ADR† | | | 222,850 |
| 9,382 | | BT Group plc ADR† | | | 275,362 |
| 1,792 | | Cablevision Systems Corporation† | | | 36,109 |
| 2,399 | | CenturyTel Incorporated | | | 83,389 |
| 1,769 | | Certegy Incorporated† | | | 53,512 |
| 4,357 | | Cincinnati Bell Incorporated† | | | 24,617 |
| 7,678 | | Clear Channel Communications Incorporated† | | | 346,431 |
| 47,909 | | Comcast Corporation† | | | 1,425,293 |
| 2,861 | | COX Communications Incorporated Class A† | | | 93,612 |
| 3,929 | | Crown Castle International Corporation† | | | 42,237 |
| 20,869 | | Deutsche Telekom AG ADR | | | 299,261 |
| 3,365 | | Extreme Networks Incorporated† | | | 23,185 |
| 9,153 | | France Telecom SA ADR | | | 226,994 |
| 2,191 | | Hispanic Broadcasting Corporation† | | | 68,797 |
| 3,626 | | Interactive Corporation† | | | 134,198 |
| 5,673 | | Lagardere SCA ADR | | | 257,731 |
| 6,362 | | Level 3 Communications Incorporated† | | | 31,937 |
| 13,289 | | Nextel Communications Incorporated Class A† | | | 256,212 |
| 11,100 | | Nippon Telegraph & Telephone Corporation ADR | | | 246,309 |
| 12,000 | | NTT DoCoMo Incorporated ADR† | | | 310,440 |
| 23,822 | | Qwest Communications International Incorporated† | | | 106,008 |
| 6,605 | | Reed Elsevier plc | | | 207,727 |
| 39,952 | | SBC Communications Incorporated | | | 898,520 |
| 12,248 | | Sprint Corporation (FON Group) | | | 180,903 |
| 14,867 | | Sprint Corporation (PCS Group)† | | | 77,160 |
| 9,577 | | TDC A/S ADR | | | 143,177 |
| 17,054 | | Telefonica SA ADR† | | | 605,417 |
| 773 | | Telephone & Data Systems Incorporated | | | 44,386 |
| 3,441 | | Univision Communications Incorporated Class A† | | | 129,003 |
| Shares | | Security Name | | Value |
| 33,081 | | Verizon Communications Incorporated | | $ | 1,168,421 |
| 56,076 | | Vodafone Group plc ADR | | | 1,026,191 |
| | |
| | | | | | 10,380,909 |
| | | | |
|
|
|
| DEPOSITORY INSTITUTIONS — 7.65% |
| 3,943 | | ABC Bancorp | | | 66,085 |
| 19,207 | | ABN AMRO Holding NV ADR | | | 338,811 |
| 12,410 | | Allied Irish Banks plc ADR | | | 348,473 |
| 5,184 | | AmSouth Bancorporation | | | 111,663 |
| 1,942 | | Associated Banc-Corporation | | | 74,126 |
| 32,925 | | Banco Bilbao Vizcaya Argentaria SA ADR | | | 353,944 |
| 15,674 | | Banco Commercial Portuguese SA ADR | | | 138,715 |
| 50,247 | | Banco Santander Central Hispano SA ADR | | | 431,119 |
| 17,030 | | Bank of America Corporation | | | 1,349,628 |
| 8,373 | | Bank of New York Company Incorporated | | | 246,334 |
| 12,340 | | Bank One Corporation | | | 487,060 |
| 16,547 | | Barclays plc ADR | | | 489,460 |
| 5,222 | | Bayerische Hypo-Und Vereinsbank AG ADR† | | | 81,584 |
| 5,601 | | BB&T Corporation | | | 204,549 |
| 16,839 | | BNP Paribas SA ADR | | | 419,481 |
| 3,092 | | BostonFed Bancorp Incorporated | | | 95,914 |
| 1,422 | | Bryn Mawr Bank Corporation | | | 59,297 |
| 1,981 | | Capitol Bancorp Limited | | | 54,478 |
| 5,741 | | Cascade Bancorp | | | 103,453 |
| 1,417 | | CB Bancshares Incorporated | | | 86,596 |
| 2,217 | | Charter One Financial Incorporated | | | 68,727 |
| 2,894 | | Chittenden Corporation | | | 83,463 |
| 61,878 | | Citigroup Incorporated | | | 2,682,411 |
| 1,927 | | City Bank Lynnwood Washington | | | 62,589 |
| 744 | | City National Corporation | | | 38,465 |
| 2,084 | | CoBiz Incorporated | | | 33,281 |
| 2,631 | | Columbia Bancorp | | | 74,747 |
| 1,336 | | Comerica Incorporated | | | 65,918 |
| 1,456 | | Commerce Bancshares Incorporated | | | 63,161 |
| 1,800 | | Commercial Federal Corporation | | | 44,640 |
| 2,303 | | Compass Bancshares Incorporated | | | 79,177 |
| 2,268 | | Connecticut Bancshares | | | 115,781 |
| 5,637 | | Deutsche Bank AG | | | 328,299 |
| 5,915 | | Fifth Third Bancorp | | | 346,619 |
| 3,105 | | First Oak Brook Bancshares Incorporated | | | 79,581 |
| 2,923 | | First Place Financial Corporation | | | 49,399 |
| 1,605 | | First South Bancorp Incorporated | | | 60,300 |
| 2,173 | | First Tennessee National Corporation | | | 89,854 |
| 2,502 | | FirstMerit Corporation | | | 63,376 |
| 11,672 | | Fleet Boston Financial Corporation | | | 345,374 |
32
PORTFOLIOOFINVESTMENTS —AUGUST 31, 2003 (UNAUDITED) | | WELLSFARGOOUTLOOK 2020FUND |
|
| Shares | | Security Name | | Value |
| Common Stock (Continued) |
| 3,650 | | Fulton Financial Corporation | | $ | 73,730 |
| 1,006 | | German American Bancorp | | | 18,531 |
| 1,554 | | Golden West Financial Corporation | | | 134,064 |
| 1,300 | | GreenPoint Financial Corporation | | | 44,044 |
| 13,100 | | HBOS plc ADR | | | 437,626 |
| 3,532 | | Hibernia Corporation Class A | | | 73,289 |
| 15,244 | | Horizon Financial Corporation | | | 262,197 |
| 15,278 | | HSBC Holdings plc ADR | | | 982,681 |
| 3,944 | | Huntington Bancshares Incorporated | | | 78,880 |
| 527 | | IBERIABANK Corporation | | | 25,296 |
| 16,471 | | ING Groep NV | | | 324,973 |
| 2,815 | | Interchange Financial Services Corporation | | | 61,649 |
| 1,772 | | Itla Capital Corporation† | | | 79,740 |
| 24,431 | | JP Morgan Chase & Company | | | 836,029 |
| 4,203 | | KeyCorp | | | 114,238 |
| 12,434 | | Lloyds TSB Group plc ADR | | | 328,631 |
| 631 | | M&T Bank Corporation | | | 53,155 |
| 3,274 | | Marshall & Ilsley Corporation | | | 101,494 |
| 2,024 | | MASSBANK Corporation | | | 74,645 |
| 4,125 | | Mellon Financial Corporation | | | 129,319 |
| 1,406 | | Mercantile Bankshares | | | 57,435 |
| 2,219 | | Merchants Bancshares Incorporated | | | 59,913 |
| 5,372 | | National Australia Bank Limited ADR | | | 543,109 |
| 57,941 | | National Bank of Greece | | | 250,305 |
| 6,310 | | National City Corporation | | | 199,901 |
| 3,240 | | National Commerce Financial Corporation | | | 81,000 |
| 1,827 | | New York Community Bancorp, Incorporated | | | 56,199 |
| 1,696 | | North Fork Bancorporation Incorporated | | | 57,274 |
| 2,063 | | Northern Trust Corporation | | | 87,141 |
| 200 | | Park National Corporation | | | 22,500 |
| 2,245 | | Peoples Bancorp Incorporated | | | 62,318 |
| 1,050 | | PNC Financial Services Group | | | 49,980 |
| 3,610 | | Prosperity Bancshares Incorporated | | | 75,810 |
| 2,269 | | Regions Financial Corporation | | | 80,005 |
| 22,365 | | Sanpaolo IMI SpA ADR | | | 431,645 |
| 19,699 | | Societe Generale ADR | | | 261,260 |
| 4,751 | | SouthTrust Corporation | | | 137,731 |
| 2,514 | | State Bancorp Incorporated | | | 52,015 |
| 2,753 | | State Street Corporation | | | 120,994 |
| 38,000 | | Sumitomo Mitsui Financial | | | 132,552 |
| 1,968 | | Summit Bancshares Incorporated | | | 53,785 |
| 1,569 | | Sun Bancorp Incorporated | | | 31,019 |
| 2,229 | | SunTrust Banks Incorporated | | | 136,259 |
| 4,360 | | Synovus Financial Corporation | | | 106,602 |
| 324 | | TCF Financial Corporation | | | 14,901 |
| 2,894 | | Trustmark Corporation | | | 76,054 |
| 2,159 | | Union Planters Corporation | | | 68,872 |
| 24,285 | | US Bancorp | | | 580,412 |
| Shares | | Security Name | | Value |
| 3,305 | | Valley National Bancorp | | $ | 92,904 |
| 14,446 | | Wachovia Corporation | | | 608,899 |
| 10,113 | | Washington Mutual Incorporated | | | 394,205 |
| 927 | | Webster Financial Corporation | | | 36,107 |
| 18,785 | | Wells Fargo & Company‡ | | | 941,880 |
| 10,989 | | Westpac Banking Corporation ADR | | | 561,977 |
| 1,740 | | Wilmington Trust Corporation | | | 55,576 |
| 2,971 | | Yardville National Bancorp | | | 65,362 |
| 1,285 | | Zions Bancorporation | | | 71,571 |
| | |
| | | | | | 21,265,615 |
| | | | |
|
|
|
| EATING & DRINKING PLACES — 0.28% |
2,141 | | Brinker International Incorporated† | | | 73,222 |
3,748 | | Darden Restaurants Incorporated | | | 81,706 |
15,290 | | McDonald's Corporation | | | 342,802 |
2,081 | | Outback Steakhouse Incorporated | | | 80,431 |
2,029 | | Wendy's International Incorporated | | | 64,015 |
4,175 | | Yum! Brands Incorporated† | | | 123,789 |
| | |
| | | | | | 765,965 |
| | | | |
|
|
|
| EDUCATIONAL SERVICES — 0.10% |
| 2,943 | | Apollo Group Incorporated Class A† | | | 188,558 |
| 1,734 | | Career Education Corporation† | | | 78,255 |
| | |
| | | | | | 266,813 |
| | | | |
|
|
|
| ELECTRIC, GAS, & SANITARY SERVICES — 2.58% |
| 8,372 | | AES Corporation† | | | 54,251 |
| 2,700 | | Allegheny Energy Incorporated† | | | 25,029 |
| 3,745 | | Allied Waste Industries Incorporated† | | | 41,420 |
| 2,510 | | Ameren Corporation | | | 106,675 |
| 3,166 | | American Electric Power Company Incorporated | | | 89,629 |
| 9,400 | | BG Group plc ADR | | | 205,014 |
| 1,387 | | Black Hills Corporation | | | 44,953 |
| 6,512 | | Calpine Corporation† | | | 36,728 |
| 6,206 | | CenterPoint Energy Incorporated | | | 52,689 |
| 713 | | CH Energy Group Incorporated | | | 31,550 |
| 3,286 | | Cinergy Corporation | | | 112,447 |
| 6,239 | | Citizens Communications Company† | | | 71,125 |
| 58,626 | | CLP Holdings Limited ADR | | | 258,576 |
| 2,875 | | CMS Energy Corporation† | | | 19,176 |
| 2,634 | | Connecticut Water Service Incorporated | | | 76,913 |
| 2,470 | | Consolidated Edison Incorporated | | | 97,639 |
| 3,016 | | Constellation Energy Group Incorporated | | | 109,752 |
| 3,177 | | Dominion Resources Incorporated | | | 192,463 |
| 2,038 | | DTE Energy Company | | | 71,147 |
33
| WELLSFARGOOUTLOOK 2020FUND | | PORTFOLIOOFINVESTMENTS —AUGUST 31, 2003 (UNAUDITED) |
|
| Shares | | Security Name | | Value |
| Common Stock (Continued) |
| 10,994 | | Duke Energy Corporation | | $ | 187,778 |
| 5,625 | | E.ON AG ADR | | | 292,163 |
| 5,548 | | Edison International† | | | 104,635 |
| 8,610 | | El Paso Corporation | | | 63,197 |
| 15,796 | | Endesa SA ADR | | | 247,207 |
| 1,872 | | EnergySouth Incorporated | | | 61,763 |
| 3,336 | | Entergy Corporation | | | 174,973 |
| 4,330 | | Exelon Corporation | | | 255,037 |
| 4,782 | | FirstEnergy Corporation | | | 139,921 |
| 2,090 | | FPL Group Incorporated | | | 129,287 |
| 197,329 | | Hong Kong & China Gas Company Limited ADR | | | 265,664 |
| 64,000 | | Hong Kong Electric Holdings Limited ADR | | | 252,736 |
| 5,666 | | International Power plc ADR† | | | 135,927 |
| 2,452 | | KeySpan Corporation | | | 82,755 |
| 2,256 | | Kinder Morgan Incorporated | | | 120,132 |
| 3,297 | | Middlesex Water Company | | | 87,371 |
| 6,517 | | National Grid Transco plc ADR | | | 201,049 |
| 4,558 | | NiSource Incorporated | | | 88,152 |
| 2,300 | | NSTAR | | | 102,580 |
| 5,825 | | PG&E Corporation† | | | 129,140 |
| 1,697 | | Pinnacle West Capital Corporation | | | 58,207 |
| 3,197 | | PPL Corporation | | | 126,825 |
| 2,275 | | Progress Energy Incorporated | | | 92,115 |
| 2,331 | | Public Service Enterprise Group Incorporated | | | 98,695 |
| 4,894 | | Reliant Resources Incorporated† | | | 22,610 |
| 5,109 | | RWE AG ADR | | | 137,705 |
| 12,950 | | Scottish Power plc ADR | | | 305,620 |
| 3,118 | | Sempra Energy | | | 92,761 |
| 8,953 | | Southern Company | | | 254,086 |
| 13,079 | | Suez SA ADR | | | 208,872 |
| 310 | | Texas Genco Holdings Incorporated | | | 7,595 |
| 2,834 | | TXU Corporation | | | 62,348 |
| 976 | | UIL Holdings Corporation | | | 35,185 |
| 22,217 | | United Utilities plc ADR | | | 385,465 |
| 2,725 | | Unitil Corporation | | | 68,670 |
| 6,763 | | Waste Management Incorporated | | | 179,963 |
| 8,951 | | Williams Companies Incorporated | | | 81,723 |
| 819 | | WPS Resources Corporation | | | 31,792 |
| 6,796 | | Xcel Energy Incorporated | | | 99,561 |
| | |
| | | | | | 7,168,441 |
| | | | |
|
|
|
ELECTRONIC & OTHER ELECTRICAL
EQUIPMENT & COMPONENTS, EXCEPT
COMPUTER EQUIPMENT — 5.68% |
| 2,432 | | Advanced Fibre Communications Incorporated† | | | 56,593 |
| 7,004 | | Advanced Micro Devices Incorporated† | | | 79,075 |
| 24,874 | | Alcatel SA ADR | | | 270,878 |
| Shares | | Security Name | | Value |
| 5,199 | | Altera Corporation† | | $ | 116,666 |
| 4,575 | | American Power Conversion Corporation | | | 81,984 |
| 4,373 | | Analog Devices Incorporated† | | | 179,293 |
| 2,475 | | Andrew Corporation† | | | 30,641 |
| 6,682 | | Applied Micro Circuits Corporation† | | | 38,822 |
| 8,445 | | ASML Holding NV NY Shares† | | | 134,276 |
| 3,885 | | Broadcom Corporation† | | | 106,760 |
| 5,494 | | Canon Incorporated ADR | | | 266,239 |
| 8,461 | | Chartered Semiconductor Manufacturing Limited ADR† | | | 55,589 |
| 5,588 | | CIENA Corporation† | | | 36,322 |
| 3,352 | | Comverse Technology Incorporated† | | | 55,274 |
| 8,363 | | Conexant Systems Incorporated† | | | 45,829 |
| 1,200 | | Cooper Industries Limited Class A | | | 61,068 |
| 2,016 | | Cree Incorporated† | | | 31,893 |
| 3,169 | | Cypress Semiconductor Corporation† | | | 58,848 |
| 3,821 | | EchoStar Communications Corporation Class A† | | | 140,995 |
| 463 | | Emco Group, Incorporated† | | | 20,404 |
| 4,144 | | Emerson Electric Company | | | 231,069 |
| 21,617 | | Ericsson ADR† | | | 334,631 |
| 4,455 | | Gemstar-TV Guide International Incorporated† | | | 21,473 |
| 113,917 | | General Electric Company | | | 3,368,526 |
| 1,309 | | Harris Corporation | | | 43,459 |
| 7,684 | | Infineon Technologies AG ADR | | | 112,955 |
| 2,712 | | Integrated Device Technology Incorporated† | | | 37,832 |
| 74,610 | | Intel Corporation | | | 2,135,338 |
| 1,209 | | Interdigital Communications Corporation† | | | 21,460 |
| 19,704 | | International Business Machines Corporation | | | 1,615,925 |
| 1,275 | | International Rectifier Corporation† | | | 53,027 |
| 3,600 | | Jabil Circuit Incorporated† | | | 101,340 |
| 21,032 | | JDS Uniphase Corporation† | | | 72,350 |
| 13,640 | | Koninklijke Philips Electronics NV NY Shares | | | 332,816 |
| 891 | | L-3 Communications Holdings Incorporated† | | | 45,521 |
| 2,406 | | Lattice Semiconductor Corporation | | | 21,173 |
| 3,790 | | Linear Technology Corporation | | | 156,224 |
| 6,034 | | LSI Logic Corporation† | | | 69,632 |
| 19,845 | | Matsushita Electric Industrial Company Limited ADR | | | 254,214 |
| 3,733 | | Maxim Integrated Products Incorporated | | | 167,649 |
| 1,807 | | Maytag Corporation | | | 48,970 |
| 2,937 | | McDATA Corporation Class A† | | | 29,811 |
34
PORTFOLIOOFINVESTMENTS —AUGUST 31, 2003 (UNAUDITED) | | WELLSFARGOOUTLOOK 2020FUND |
|
| Shares | | Security Name | | Value |
| Common Stock (Continued) |
| 7,868 | | Micron Technology Incorporated† | | $ | 112,984 |
| 2,787 | | Mindspeed Technologies, Incorporated† | | | 9,810 |
| 20,000 | | Minebea Company Limited ADR | | | 199,178 |
| 3,432 | | Molex Incorporated | | | 100,969 |
| 29,354 | | Motorola Incorporated | | | 314,968 |
| 3,553 | | Mykrolis Corporation† | | | 44,768 |
| 2,447 | | National Semiconductor Corporation† | | | 71,306 |
| 5,556 | | Network Appliance Incorporated† | | | 124,510 |
| 1,899 | | Nidec Corporation ADR | | | 150,971 |
| 27,017 | | Nokia Oyi ADR | | | 440,107 |
| 2,081 | | Novellus Systems Incorporated† | | | 83,157 |
| 2,450 | | NVIDIA Corporation† | | | 44,492 |
| 1,036 | | Omron Corporation ADR | | | 209,988 |
| 10,763 | | Pioneer Corporation ADR | | | 239,907 |
| 1,911 | | Plexus Corporation† | | | 31,532 |
| 4,000 | | PMC-Sierra Incorporated† | | | 57,040 |
| 2,519 | | Polycom Incorporated† | | | 43,226 |
| 3,570 | | Power-One Incorporated† | | | 42,162 |
| 2,956 | | Powerwave Technologies Incorporated† | | | 24,978 |
| 1,456 | | QLogic Corporation† | | | 71,373 |
| 9,433 | | Qualcomm Incorporated | | | 389,394 |
| 2,643 | | Rambus Incorporated† | | | 44,032 |
| 3,529 | | RF Micro Devices Incorporated† | | | 31,126 |
| 3,666 | | Rockwell Collins Incorporated | | | 99,165 |
| 9,166 | | Sanmina-SCI Corporation† | | | 82,311 |
| 2,811 | | Scientific-Atlanta Incorporated | | | 95,574 |
| 2,152 | | Skyworks Solutions Incorporated† | | | 24,404 |
| 12,025 | | Solectron Corporation† | | | 71,308 |
| 5,885 | | Sony Corporation ADR | | | 193,911 |
| 8,285 | | STMicroelectronics NV ADR | | | 206,628 |
| 2,613 | | TDK Corporation ADR | | | 169,322 |
| 5,940 | | Tellabs Incorporated† | | | 38,788 |
| 20,587 | | Texas Instruments Incorporated | | | 491,000 |
| 2,220 | | Triquint Semiconductor Incorporated† | | | 12,343 |
| 1,092 | | Varian Semiconductor Equipment Associates Incorporated† | | | 44,302 |
| 2,858 | | Vishay Intertechnology Incorporated† | | | 47,071 |
| 3,686 | | Vitesse Semiconductor Corporation† | | | 25,175 |
| 520 | | Whirlpool Corporation | | | 36,182 |
| 4,424 | | Xilinx Incorporated† | | | 136,438 |
| | |
| | | | | | 15,798,744 |
| | | | |
|
|
|
ENGINEERING, ACCOUNTING, RESEARCH
MANAGEMENT & RELATED SERVICES — 0.39% |
| 2,565 | | Applera Corporation-Celera Genomics Group† | | | 26,112 |
| 2,290 | | Celgene Corporation† | | | 88,142 |
| 618 | | Cephalon Incorporated† | | | 27,408 |
| Shares | | Security Name | | Value |
| 2,911 | | CuraGen Corporation† | | $ | 13,361 |
| 2,019 | | Dun & Bradstreet Corporation† | | | 85,000 |
| 1,635 | | Fluor Corporation | | | 60,233 |
| 2,268 | | Gene Logic Incorporated† | | | 11,635 |
| 3,419 | | Incyte Genomics Corporation† | | | 13,539 |
| 1,789 | | Landauer Incorporated | | | 65,674 |
| 5,002 | | Millennium Pharmaceutical Incorporated† | | | 69,528 |
| 3,400 | | Monsanto Company | | | 87,414 |
| 2,382 | | Moody's Corporation | | | 123,531 |
| 5,005 | | Paychex Incorporated | | | 180,180 |
| 1,466 | | Quest Diagnostics Incorporated† | | | 87,960 |
| 4,218 | | Quintiles Transnational Corporation† | | | 60,064 |
| 7,486 | | ServiceMaster Company | | | 74,936 |
| 1,169 | | UnitedGlobalCom Incorporated Class A† | | | 7,809 |
| | |
| | | | | | 1,082,526 |
| | | | |
|
|
|
FABRICATED METAL PRODUCTS, EXCEPT
MACHINERY & TRANSPORTATION
EQUIPMENT — 0.24% |
| 449 | | Alliant Techsystems Incorporated† | | | 22,873 |
| 1,060 | | Ball Corporation | | | 55,968 |
| 2,465 | | Crane Company | | | 63,079 |
| 2,036 | | Fortune Brands Incorporated | | | 114,830 |
| 3,448 | | Illinois Tool Works Incorporated | | | 249,256 |
| 6,674 | | Masco Corporation | | | 165,448 |
| | |
| | | | | | 671,454 |
| | | | |
|
|
|
| FOOD & KINDRED PRODUCTS — 2.31% |
| 269 | | American Italian Pasta Company Class A† | | | 11,223 |
| 7,837 | | Anheuser-Busch Companies Incorporated | | | 403,919 |
| 11,356 | | Archer-Daniels-Midland Company | | | 157,508 |
| 10,442 | | Cadbury Schweppes plc ADR | | | 256,664 |
| 5,077 | | Campbell Soup Company | | | 122,863 |
| 27,027 | | Coca Cola Company | | | 1,176,215 |
| 7,040 | | Coca Cola Enterprises Incorporated | | | 130,170 |
| 35,100 | | Compass Group plc ADR | | | 194,458 |
| 6,797 | | ConAgra Foods Incorporated | | | 149,534 |
| 2,059 | | Del Monte Foods Company† | | | 18,490 |
| 9,553 | | Diageo plc ADR | | | 417,848 |
| 2,962 | | Flowers Foods Incorporated | | | 62,706 |
| 4,231 | | General Mills Incorporated | | | 196,149 |
| 3,300 | | Hercules Incorporated† | | | 36,960 |
| 1,394 | | Hershey Foods Corporation | | | 97,441 |
| 3,599 | | Heinz (H J) Company | | | 116,464 |
| 2,576 | | Hormel Foods Corporation | | | 55,642 |
| 1,869 | | JM Smucker Company | | | 75,657 |
| 5,236 | | Kellogg Company | | | 175,563 |
| 39,055 | | Kirin Brewery Company Limited ADR | | | 274,166 |
| 1,905 | | Kraft Foods Incorporated | | | 56,579 |
| 3,606 | | McCormick & Company Incorporated | | | 96,280 |
35
| WELLSFARGOOUTLOOK 2020FUND | | PORTFOLIOOFINVESTMENTS —AUGUST 31, 2003 (UNAUDITED) |
|
| Shares | | Security Name | | Value |
| Common Stock (Continued) |
| 14,334 | | Nestle SA ADR | | $ | 780,390 |
| 3,881 | | Pepsi Bottling Group Incorporated | | | 93,610 |
| 3,040 | | PepsiAmericas Incorporated | | | 42,317 |
| 18,792 | | PepsiCo Incorporated | | | 836,996 |
| 10,175 | | Sara Lee Corporation | | | 193,122 |
| 4,204 | | Tyson Foods Incorporated Class A | | | 47,085 |
| 2,719 | | WM Wrigley Jr Company | | | 144,240 |
| | |
| | | | | | 6,420,259 |
| | | | |
|
|
|
| FOOD STORES — 0.45% |
| 3,796 | | Albertson's Incorporated | | | 79,793 |
| 8,816 | | Coles Myer Limited ADR | | | 334,567 |
| 5,181 | | Ito-Yokado Company Limited ADR(a) | | | 147,990 |
| 26,591 | | Koninklijke Ahold NV ADR | | | 247,296 |
| 9,659 | | Kroger Company† | | | 185,549 |
| 5,854 | | Starbucks Corporation† | | | 166,488 |
| 873 | | Whole Foods Market Incorporated† | | | 47,430 |
| 3,069 | | Winn-Dixie Stores Incorporated | | | 30,843 |
| | |
| | | | | | 1,239,956 |
| | | | |
|
|
|
| FORESTRY — 0.08% |
| 3,585 | | Plum Creek Timber Company | | | 93,748 |
| 2,378 | | Weyerhaeuser Company | | | 141,491 |
| | |
| | | | | | 235,239 |
| | | | |
|
|
|
| FURNITURE & FIXTURES — 0.17% |
| 1,821 | | Ethan Allen Interiors Incorporated | | | 70,491 |
| 2,916 | | Herman Miller Incorporated | | | 68,176 |
| 700 | | Hillenbrand Industries Incorporated | | | 37,905 |
| 3,005 | | HON Industries Incorporated | | | 110,344 |
| 4,614 | | Leggett & Platt Incorporated | | | 106,860 |
| 3,437 | | Newell Rubbermaid Incorporated | | | 81,629 |
| | |
| | | | | | 475,405 |
| | | | |
|
|
|
| GENERAL MERCHANDISE STORES — 1.74% |
| 1,558 | | BJ's Wholesale Club Incorporated† | | | 34,026 |
| 5,634 | | Dollar General Corporation | | | 129,188 |
| 2,779 | | Family Dollar Stores Incorporated | | | 111,493 |
| 2,218 | | Federated Department Stores Incorporated | | | 96,927 |
| 3,636 | | JC Penney Company Incorporated | | | 77,156 |
| 4,063 | | May Department Stores Company | | | 112,058 |
| 9,861 | | Mitsukoshi Limited ADR† | | | 270,442 |
| 4,266 | | Saks Incorporated† | | | 53,709 |
| 3,324 | | Sears Roebuck & Company | | | 146,322 |
| 10,412 | | Target Corporation | | | 422,727 |
| 26,285 | | Tesco plc ADR | | | 269,416 |
| Shares | | Security Name | | Value |
| 7,302 | | TJX Companies Incorporated | | $ | 158,161 |
| 49,857 | | Wal-Mart Stores Incorporated | | | 2,950,039 |
| | |
| | | | | | 4,831,664 |
| | | | |
|
|
|
| HEALTH SERVICES — 0.36% |
| 4,023 | | Caremark Rx Incorporated† | | | 101,098 |
| 1,598 | | Corvel Corporation† | | | 60,500 |
| 1,616 | | Enzon Pharmaceuticals Incorporated† | | | 18,374 |
| 1,072 | | Express Scripts Incorporated† | | | 69,476 |
| 2,932 | | First Health Group Corporation† | | | 76,876 |
| 5,757 | | HCA Incorporated | | | 218,708 |
| 5,074 | | Health Management Association Incorporated Class A | | | 113,049 |
| 2,670 | | Human Genome Sciences Incorporated† | | | 38,021 |
| 1,713 | | Immunomedics Incorporated† | | | 15,109 |
| 1,250 | | Laboratory Corporation of America Holdings† | | | 37,813 |
| 500 | | Lincare Holdings Incorporated† | | | 17,315 |
| 2,865 | | Manor Care Incorporated | | | 79,074 |
| 719 | | Renal Care Group Incorporated† | | | 26,107 |
| 5,236 | | Tenet Healthcare Corporation† | | | 84,038 |
| 1,032 | | Universal Health Services Incorporated Class B† | | | 51,373 |
| | |
| | | | | | 1,006,931 |
| | | | |
|
|
|
HOLDING & OTHER INVESTMENT
OFFICES — 0.06% |
| 29,000 | | Mitsubishi Tokyo Finance | | | 170,230 |
| | | | |
|
|
|
HOME FURNITURE, FURNISHINGS, & EQUIPMENT
STORES — 0.21% |
| 4,175 | | Bed Bath & Beyond Incorporated† | | | 179,650 |
| 4,232 | | Best Buy Company Incorporated† | | | 220,106 |
| 4,660 | | Circuit City Stores Incorporated | | | 48,604 |
| 2,853 | | Pier 1 Imports Incorporated | | | 58,686 |
| 2,976 | | RadioShack Corporation | | | 90,471 |
| | |
| | | | | | 597,517 |
| | | | |
|
|
|
HOTELS, ROOMING HOUSES, CAMPS, &
OTHER LODGE PLACES — 0.24% |
15,407 | | Accor SA ADR | | | 300,162 |
7,116 | | Hilton Hotels Corporation | | | 108,732 |
1,439 | | Mandalay Resort Group | | | 54,682 |
2,724 | | Marriott International Incorporated | | | 111,222 |
2,352 | | Starwood Hotels & Resorts Worldwide Incorporated | | | 79,568 |
| | |
| | | | | | 654,366 |
| | | | |
|
|
|
INDUSTRIAL & COMMERCIAL MACHINERY &
COMPUTER EQUIPMENT — 3.35% |
| 3,991 | | 3M Company | | | 568,598 |
| 2,392 | | AGCO Corporation† | | | 52,815 |
| 1,199 | | American Standard Companies Incorporated† | | | 96,148 |
| 5,636 | | Apple Computer Incorporated† | | | 127,543 |
36
PORTFOLIOOFINVESTMENTS —AUGUST 31, 2003 (UNAUDITED) | | WELLSFARGOOUTLOOK 2020FUND |
|
| Shares | | Security Name | | Value |
| Common Stock (Continued) |
| 20,372 | | Applied Materials Incorporated† | | $ | 440,035 |
| 2,916 | | Baker Hughes Incorporated | | | 97,569 |
| 1,343 | | Black & Decker Corporation | | | 57,454 |
| 5,072 | | Brocade Communications Systems Incorporated† | | | 28,606 |
| 3,848 | | Caterpillar Incorporated | | | 276,402 |
| 1,311 | | CDW Corporation† | | | 67,661 |
| 82,012 | | Cisco Systems Incorporated† | | | 1,570,530 |
| 1,133 | | Cooper Cameron Corporation† | | | 55,018 |
| 2,893 | | Deere & Company | | | 163,483 |
| 29,842 | | Dell Incorporated† | | | 973,744 |
| 1,159 | | Diebold Incorporated | | | 56,675 |
| 3,045 | | Dover Corporation | | | 115,771 |
| 763 | | Eaton Corporation | | | 71,447 |
| 28,806 | | EMC Corporation† | | | 367,277 |
| 1,989 | | Emulex Corporation† | | | 48,154 |
| 2,605 | | FMC Technologies Incorporated† | | | 61,660 |
| 5,966 | | Gateway Incorporated† | | | 34,424 |
| 4,393 | | Grant Prideco Incorporated† | | | 50,959 |
| 37,575 | | Hewlett-Packard Company | | | 748,494 |
| 1,695 | | Hitachi Limited ADR | | | 92,615 |
| 1,989 | | Ingersoll-Rand Company
Class A | | | 118,385 |
| 5,979 | | Juniper Networks Incorporated† | | | 102,958 |
| 1,957 | | Kadant Incorporated† | | | 36,987 |
| 14,474 | | Komatsu Limited ADR | | | 330,466 |
| 2,826 | | Lam Research Corporation† | | | 72,685 |
| 1,460 | | Lexmark International Incorporated† | | | 97,878 |
| 45,087 | | Makita Corporation ADR | | | 396,766 |
| 23,526 | | NEC Corporation ADR | | | 177,621 |
| 2,639 | | Pall Corporation | | | 65,975 |
| 1,812 | | Palm Incorporated† | | | 33,069 |
| 1,552 | | Parker-Hannifin Corporation | | | 76,855 |
| 2,602 | | Pitney Bowes Incorporated | | | 101,478 |
| 3,606 | | Quantum Corporation—DLT† | | | 10,890 |
| 1,135 | | Sandisk Corporation† | | | 68,622 |
| 9,134 | | Siemens AG ADR | | | 568,866 |
| 1,699 | | Smith International Incorporation† | | | 66,414 |
| 3,387 | | Sonus Networks Incorporated† | | | 24,048 |
| 1,037 | | SPX Corporation† | | | 51,176 |
| 1,808 | | Stanley Works | | | 54,728 |
| 2,371 | | Storage Technology Corporation† | | | 60,721 |
| 5,375 | | Symbol Technologies Incorporated | | | 72,778 |
| 5,488 | | United Technologies Corporation | | | 440,412 |
| 884 | | Varian Medical Systems Incorporated† | | | 49,371 |
| 385 | | Zebra Technologies Corporation Class A† | | | 20,644 |
| | |
| | | | | | 9,322,875 |
| | | | |
|
|
|
INSURANCE AGENTS, BROKERS &
SERVICE — 0.19% |
| 3,738 | | AON Corporation | | | 82,984 |
| 4,492 | | Humana Incorporated† | | | 79,014 |
| Shares | | Security Name | | Value |
| 5,768 | | Marsh & McLennan Companies Incorporated | | $ | 288,400 |
| 3,125 | | Medco Health Solutions Incorporated† | | | 83,437 |
| | |
| | | | | | 533,835 |
| | | | |
|
|
|
| INSURANCE CARRIERS — 2.67% |
| 3,512 | | ACE Limited | | | 113,086 |
| 10,824 | | Aegon NV ADR | | | 134,867 |
| 1,876 | | Aetna Incorporated | | | 106,932 |
| 6,336 | | AFLAC Incorporated | | | 202,815 |
| 14,291 | | Allianz AG ADR | | | 127,619 |
| 1,067 | | Allmerica Financial Corporation† | | | 25,256 |
| 7,831 | | Allstate Corporation | | | 279,958 |
| 1,030 | | AMBAC Financial Group Incorporated | | | 66,868 |
| 31,595 | | American International Group Incorporated | | | 1,882,114 |
| 711 | | American National Insurance Company | | | 61,139 |
| 1,772 | | Anthem Incorporated† | | | 129,710 |
| 16,339 | | AXA ADR | | | 290,507 |
| 1,941 | | Chubb Corporation | | | 131,872 |
| 1,554 | | CIGNA Corporation | | | 74,095 |
| 3,001 | | Cincinnati Financial Corporation | | | 121,090 |
| 1,036 | | CNA Financial Corporation† | | | 22,533 |
| 3,096 | | Hartford Financial Services Group | | | 164,769 |
| 2,190 | | Health Net Incorporated† | | | 69,708 |
| 1,163 | | Jefferson-Pilot Corporation | | | 51,486 |
| 2,932 | | John Hancock Financial Services Incorporated | | | 89,514 |
| 1,166 | | Lincoln National Corporation | | | 41,300 |
| 2,142 | | Loews Corporation | | | 88,165 |
| 1,434 | | MBIA Incorporated | | | 80,964 |
| 8,342 | | MetLife Incorporated | | | 237,080 |
| 1,045 | | MGIC Investment Corporation | | | 58,907 |
| 396 | | Mid Atlantic Medical Services Incorporated† | | | 19,428 |
| 4,954 | | Millea Holdings Incorporated ADR | | | 253,348 |
| 2,231 | | Old Republic International Corporation | | | 74,939 |
| 1,531 | | Oxford Health Plans Incorporated† | | | 55,499 |
| 1,352 | | PMI Group Incorporated | | | 47,834 |
| 4,256 | | Principal Financial Group Incorporated | | | 133,894 |
| 2,616 | | Progressive Corporation | | | 185,056 |
| 2,010 | | Protective Life Corporation | | | 58,471 |
| 6,265 | | Prudential Financial Incorporated | | | 228,109 |
| 1,354 | | Radian Group Incorporated | | | 64,437 |
| 2,356 | | Safeco Corporation | | | 84,957 |
| 772 | | Stancorp Financial Group Incorporated | | | 43,761 |
| 2,323 | | Stewart Information Services Corporation | | | 67,971 |
| 3,260 | | Swiss Reinsurance ADR | | | 200,180 |
37
| WELLSFARGOOUTLOOK 2020FUND | | PORTFOLIOOFINVESTMENTS —AUGUST 31, 2003 (UNAUDITED) |
|
| Shares | | Security Name | | Value |
| Common Stock (Continued) |
| 2,388 | | St Paul Companies Incorporated | | $ | 83,007 |
| 1,683 | | Torchmark Corporation | | | 67,926 |
| 14,020 | | Travelers Property Casualty Corporation Class B† | | | 217,170 |
| 7,259 | | UnitedHealth Group Incorporated | | | 358,812 |
| 2,414 | | Unitrin Incorporated | | | 71,503 |
| 3,781 | | UnumProvident Corporation | | | 53,312 |
| 1,869 | | WellPoint Health Networks Incorporated† | | | 145,782 |
| 1,702 | | XL Capital Limited Class A | | | 128,927 |
| 10,943 | | Zurich Financial Services AG ADR | | | 140,642 |
| | |
| | | | | | 7,437,319 |
| | | | |
|
|
|
| LEATHER & LEATHER PRODUCTS — 0.02% |
| 996 | | Coach Incorporated† | | | 57,808 |
| | | | |
|
|
|
LUMBER & WOOD PRODUCTS, EXCEPT
FURNITURE — 0.04% |
4,348 | | Georgia-Pacific Corporation | | | 100,743 |
| | | | |
|
|
|
MEASURING, ANALYZING, & CONTROLLING
INSTRUMENTS: PHOTOGRAPHIC, MEDICAL &
OPTICAL GOODS — 1.81% |
| 2,047 | | Advanced Medical Optics Incorporated† | | | 33,960 |
| 8,205 | | Advantest Corporation ADR | | | 142,439 |
| 6,394 | | Agilent Technologies Incorporated† | | | 155,502 |
| 1,739 | | Allergan Incorporated | | | 138,181 |
| 4,101 | | Applera Corporation-Applied Biosystems Group | | | 89,238 |
| 1,198 | | Bausch & Lomb Incorporated | | | 50,508 |
| 6,734 | | Baxter International Incorporated | | | 189,225 |
| 1,187 | | Beckman Coulter Incorporated | | | 52,643 |
| 3,371 | | Becton Dickinson & Company | | | 123,176 |
| 4,104 | | Biomet Incorporated | | | 122,012 |
| 5,153 | | Boston Scientific Corporation† | | | 309,695 |
| 1,052 | | CR Bard Incorporated | | | 70,484 |
| 1,690 | | Danaher Corporation | | | 130,553 |
| 2,062 | | Dentsply International Incorporated | | | 90,213 |
| 4,292 | | Eastman Kodak Company | | | 119,704 |
| 7,160 | | Fuji Photo Film Company Limited ADR | | | 215,444 |
| 11,383 | | General Motors Corporation
Class H | | | 170,062 |
| 3,464 | | Guidant Corporation | | | 173,893 |
| 2,116 | | KLA-Tencor Corporation† | | | 125,606 |
| 14,273 | | Medtronic Incorporated | | | 707,655 |
| 2,946 | | Microchip Technology Incorporated | | | 82,517 |
| 1,265 | | Millipore Corporation | | | 57,431 |
| 2,058 | | Newport Corporation† | | | 36,776 |
| 11,543 | | Olympus Optical Company Limited ADR | | | 265,129 |
| Shares | | Security Name | | Value |
| 2,809 | | PerkinElmer Incorporated | | $ | 46,461 |
| 4,817 | | Raytheon Company | | | 154,433 |
| 621 | | Resmed, Incorporated† | | | 26,889 |
| 2,067 | | Ricoh Company Limited ADR | | | 190,164 |
| 3,659 | | Rockwell Automation Incorporated | | | 99,598 |
| 2,243 | | St Jude Medical Incorporated† | | | 116,793 |
| 2,519 | | Stryker Corporation | | | 190,940 |
| 2,629 | | Tektronix Incorporated† | | | 62,150 |
| 3,028 | | Teradyne Incorporated† | | | 53,989 |
| 3,521 | | Thermo Electron Corporation† | | | 80,244 |
| 1,833 | | Viasys Healthcare Incorporated† | | | 40,509 |
| 2,376 | | Waters Corporation† | | | 72,468 |
| 11,296 | | Xerox Corporation† | | | 121,772 |
| 2,637 | | Zimmer Holdings Incorporated† | | | 136,438 |
| | |
| | | | | | 5,044,894 |
| | | | |
|
|
|
| METAL MINING — 0.23% |
| 6,064 | | Newmont Mining Corporation | | | 238,072 |
| 1,704 | | Phelps Dodge Corporation† | | | 81,775 |
| 3,755 | | Rio Tinto plc ADR | | | 332,468 |
| | |
| | | | | | 652,315 |
| | | | |
|
|
|
MINING & QUARRYING OF NONMETALLIC
MINERALS, EXCEPT FUELS — 0.10% |
| 7,763 | | Pechiney SA ADR | | | 196,248 |
| 2,170 | | Vulcan Materials Company | | | 89,860 |
| | |
| | | | | | 286,108 |
| | | | |
|
|
|
MISCELLANEOUS MANUFACTURING
INDUSTRIES — 0.30% |
| 2,591 | | Callaway Golf Company | | | 38,943 |
| 4,367 | | Hasbro Incorporated | | | 80,790 |
| 6,189 | | Mattel Incorporated | | | 119,571 |
| 2,447 | | Tiffany & Company | | | 95,237 |
| 24,750 | | Tyco International Limited | | | 509,355 |
| | |
| | | | | | 843,896 |
| | | | |
|
|
|
| MISCELLANEOUS RETAIL — 0.52% |
| 3,211 | | Amazon.Com Incorporated† | | | 149,117 |
| 3,882 | | Cash America International Incorporated | | | 67,353 |
| 5,723 | | Costco Wholesale Corporation† | | | 183,651 |
| 5,372 | | CVS Corporation | | | 175,127 |
| 2,256 | | Dollar Tree Stores Incorporated† | | | 88,503 |
| 5,882 | | Office Depot Incorporated† | | | 107,288 |
| 6,530 | | Rite Aid Corporation† | | | 32,977 |
| 7,593 | | Staples Incorporated† | | | 187,016 |
| 4,238 | | Toys R Us Incorporated† | | | 57,722 |
| 12,195 | | Walgreen Company | | | 397,191 |
| | |
| | | | | | 1,445,945 |
| | | | |
|
|
|
| MOTION PICTURES — 0.32% |
| 30,633 | | Liberty Media Corporation Class A† | | | 370,659 |
| 25,462 | | Walt Disney Company | | | 521,971 |
| | |
| | | | | | 892,630 |
| | | | |
|
|
38
PORTFOLIOOFINVESTMENTS —AUGUST 31, 2003 (UNAUDITED) | | WELLSFARGOOUTLOOK 2020FUND |
|
| Shares | | Security Name | | Value |
| Common Stock (Continued) |
|
MOTOR FREIGHT TRANSPORTATION &
WAREHOUSING — 0.32% |
| 1,733 | | CNF Incorporated | | $ | 51,470 |
| 13,478 | | United Parcel Service Incorporated Class B | | | 845,879 |
| | |
| | | | | | 897,349 |
| | | | |
|
|
|
NON-DEPOSITORY CREDIT
INSTITUTIONS — 1.16% |
| 14,946 | | American Express Company | | | 673,316 |
| 2,974 | | Capital One Financial Corporation | | | 158,812 |
| 1,843 | | Countrywide Financial Corporation | | | 125,048 |
| 1,152 | | Doral Financial Corporation | | | 47,290 |
| 10,983 | | Fannie Mae | | | 711,589 |
| 8,197 | | Freddie Mac | | | 435,671 |
| 16,605 | | MBNA Corporation | | | 387,561 |
| 4,996 | | Metris Companies Incorporated† | | | 16,287 |
| 5,798 | | ORIX Corporation ADR | | | 194,233 |
| 5,093 | | Providian Financial Corporation | | | 52,203 |
| 5,530 | | SLM Corporation | | | 222,195 |
| 6,256 | | Sovereign Bancorp Incorporated | | | 123,118 |
| 215 | | The Student Loan Corporation | | | 26,436 |
| 3,727 | | World Acceptance Corporation† | | | 51,954 |
| | |
| | | | | | 3,225,713 |
| | | | |
|
|
|
| OIL & GAS EXTRACTION — 1.66% |
| 3,366 | | Anadarko Petroleum Corporation | | | 146,421 |
| 2,283 | | Apache Corporation | | | 157,481 |
| 24,039 | | BHP Billiton Limited ADR | | | 343,037 |
| 2,241 | | BJ Services Company† | | | 83,746 |
| 3,177 | | Burlington Resources Incorporated | | | 153,830 |
| 3,471 | | Devon Energy Corporation | | | 179,624 |
| 546 | | Diamond Offshore Drilling | | | 11,029 |
| 6,829 | | ENI SpA ADR | | | 521,667 |
| 2,487 | | ENSCO International Incorporated | | | 69,512 |
| 2,134 | | EOG Resources Incorporated | | | 90,482 |
| 6,529 | | Halliburton Company | | | 157,871 |
| 2,500 | | Houston Exploration Company† | | | 85,725 |
| 1,637 | | Kerr-McGee Corporation | | | 71,946 |
| 1,646 | | Nabors Industries Limited† | | | 66,087 |
| 2,138 | | Newfield Exploration Company† | | | 84,002 |
| 1,332 | | Noble Corporation† | | | 48,192 |
| 2,067 | | Noble Energy Incorporated | | | 81,833 |
| 4,583 | | Occidental Petroleum Corporation | | | 157,334 |
| 3,105 | | Pioneer Natural Resources Company† | | | 78,743 |
| 3,000 | | Pride International Incorporated† | | | 51,270 |
| Shares | | Security Name | | Value |
| 18,412 | | Repsol YPF SA ADR | | $ | 311,715 |
| 2,420 | | Rowan Companies Incorporated† | | | 60,597 |
| 5,618 | | Schlumberger Limited | | | 278,148 |
| 9,792 | | Shell Transport & Trading Company plc ADR | | | 376,404 |
| 875 | | Tidewater Incorporated | | | 25,130 |
| 10,434 | | Total Fina Elf SA ADR | | | 803,522 |
| 3,452 | | Transocean Incorporated† | | | 72,906 |
| 2,134 | | Varco International Incorporated† | | | 36,812 |
| | |
| | | | | | 4,605,066 |
| | | | |
|
|
|
| PAPER & ALLIED PRODUCTS — 0.42% |
| 1,900 | | Boise Cascade Corporation | | | 51,775 |
| 1,143 | | Bowater Incorporated | | | 49,503 |
| 5,034 | | International Paper Company | | | 204,129 |
| 5,403 | | Kimberly-Clark Corporation | | | 276,147 |
| 3,504 | | MeadWestvaco Corporation | | | 88,826 |
| 17,113 | | Stora Enso Oyj ADR | | | 220,587 |
| 838 | | Temple-Inland Incorporated | | | 41,716 |
| 12,620 | | UPM-Kymmene Oyj ADR | | | 229,432 |
| | |
| | | | | | 1,162,115 |
| | | | |
|
|
|
| PERSONAL SERVICES — 0.07% |
| 3,086 | | Cintas Corporation | | | 123,224 |
| 1,744 | | H&R Block Incorporated | | | 76,910 |
| | |
| | | | | | 200,134 |
| | | | |
|
|
|
PETROLEUM REFINING & RELATED
INDUSTRIES — 2.37% |
| 1,196 | | Amerada Hess Corporation | | | 56,391 |
| 1,422 | | Ashland Incorporated | | | 47,011 |
| 24,252 | | BP plc ADR | | | 1,011,793 |
| 12,477 | | ChevronTexaco Corporation | | | 909,199 |
| 7,617 | | ConocoPhillips | | | 425,333 |
| 79,172 | | Exxon Mobil Corporation | | | 2,984,788 |
| 4,762 | | Marathon Oil Corporation | | | 132,812 |
| 1,376 | | Murphy Oil Corporation | | | 79,436 |
| 13,967 | | Royal Dutch Petroleum Company NY Shares | | | 626,699 |
| 1,608 | | Sunoco Incorporated | | | 65,333 |
| 3,660 | | Unocal Corporation† | | | 112,069 |
| 1,456 | | Valero Energy Corporation | | | 57,366 |
| 2,568 | | WD-40 Company | | | 74,857 |
| | |
| | | | | | 6,583,087 |
| | | | |
|
|
|
| PRIMARY METAL INDUSTRIES — 0.47% |
| 4,800 | | AK Steel Holding Corporation† | | | 12,674 |
| 11,336 | | Alcoa Incorporated | | | 323,756 |
| 3,372 | | Allegheny Technologies Incorporated | | | 25,121 |
| 3,120 | | Engelhard Corporation | | | 87,578 |
| 11,475 | | Johnson Matthey plc ADR | | | 356,296 |
| 18,305 | | Kubota Corporation ADR | | | 305,694 |
| 1,406 | | Nucor Corporation | | | 72,282 |
| 1,683 | | Precision Castparts Corporation | | | 59,578 |
| 3,266 | | United States Steel Corporation | | | 60,127 |
| | |
| | | | | | 1,303,106 |
| | | | |
|
|
39
| WELLSFARGOOUTLOOK 2020FUND | | PORTFOLIOOFINVESTMENTS —AUGUST 31, 2003 (UNAUDITED) |
|
| Shares | | Security Name | | Value |
| Common Stock (Continued) |
|
PRINTING, PUBLISHING, & ALLIED
INDUSTRIES — 1.07% |
| 3,639 | | Belo Corporation Class A | | $ | 84,861 |
| 1,822 | | Dow Jones & Co Incorporated | | | 77,380 |
| 3,345 | | Gannett Company Incorporated | | | 262,315 |
| 1,284 | | Knight-Ridder Incorporated | | | 87,132 |
| 2,342 | | McGraw-Hill Companies Incorporated | | | 142,862 |
| 2,117 | | New York Times Company | | | 93,974 |
| 6,794 | | News Corporation Limited ADR | | | 233,374 |
| 17,996 | | Pearson plc ADR | | | 179,060 |
| 2,981 | | Readers Digest Association Incorporated | | | 36,279 |
| 7,491 | | Reed Elsevier NV ADR | | | 167,049 |
| 2,189 | | Reynolds & Reynolds Company | | | 63,590 |
| 2,910 | | RR Donnelley & Sons Company | | | 73,157 |
| 4,117 | | Toppan Printing Company Limited ADR | | | 166,543 |
| 4,469 | | Tribune Company | | | 206,691 |
| 1,353 | | Valassis Communications Incorporated† | | | 39,752 |
| 21,460 | | Viacom Incorporated Class B | | | 965,700 |
| 151 | | Washington Post Company Class B | | | 105,101 |
| | |
| | | | | | 2,984,820 |
| | | | |
|
|
|
| RAILROAD TRANSPORTATION — 0.18% |
| 4,028 | | Burlington Northern Santa Fe Corporation | | | 114,194 |
| 2,110 | | CSX Corporation | | | 68,111 |
| 3,906 | | Kansas City Southern† | | | 47,458 |
| 5,492 | | Norfolk Southern Corporation | | | 104,568 |
| 2,542 | | Union Pacific Corporation | | | 154,909 |
| | |
| | | | | | 489,240 |
| | | | |
|
|
|
| REAL ESTATE — 0.05% |
| 3,896 | | Catellus Development Corporation† | | | 91,361 |
| 1,433 | | LNR Property Corporation | | | 57,320 |
| | |
| | | | | | 148,681 |
| | | | |
|
|
|
RUBBER & MISCELLANEOUS PLASTICS
PRODUCTS — 0.18% |
| 5,785 | | Bridgestone Corporation ADR | | | 161,134 |
| 4,639 | | Goodyear Tire & Rubber Company | | | 33,030 |
| 3,473 | | Nike Incorporated Class B | | | 197,892 |
| 1,126 | | Sealed Air Corporation† | | | 54,791 |
| 2,441 | | Tupperware Corporation | | | 39,862 |
| | |
| | | | | | 486,709 |
| | | | |
|
|
|
SECURITY & COMMODITY BROKERS, DEALERS,
EXCHANGES & SERVICES — 1.31% |
| 9,322 | | Amvescap plc ADR | | | 149,523 |
| 1,082 | | Bear Stearns Companies Incorporated | | | 75,718 |
| 821 | | Blackrock Incorporated | | | 37,331 |
| 19,578 | | Charles Schwab Corporation | | | 212,617 |
| 10,395 | | Credit Suisse Group ADR | | | 327,131 |
| Shares | | Security Name | | Value |
| 4,851 | | E*TRADE Group Incorporated† | | $ | 44,775 |
| 1,329 | | Edwards AG Incorporated | | | 47,844 |
| 1,429 | | Federated Investors Incorporated Class B | | | 41,955 |
| 2,904 | | Franklin Resources Incorporated | | | 125,424 |
| 1,397 | | Gabelli Asset Management Incorporated Class A† | | | 52,667 |
| 5,457 | | Goldman Sachs Group Incorporated | | | 482,890 |
| 4,965 | | Janus Capital Group Incorporated | | | 85,746 |
| 3,028 | | Knight Trading Group Incorporated† | | | 28,070 |
| 1,174 | | Legg Mason Incorporated | | | 84,328 |
| 2,953 | | Lehman Brothers Holdings Incorporated | | | 194,101 |
| 11,087 | | Merrill Lynch & Company Incorporated | | | 596,259 |
| 13,276 | | Morgan Stanley | | | 647,736 |
| 20,101 | | Nomura Holdings Incorporated ADR | | | 294,480 |
| 2,511 | | T Rowe Price Group Incorporated | | | 106,718 |
| | |
| | | | | | 3,635,313 |
| | | | |
|
|
|
STONE, CLAY, GLASS, & CONCRETE
PRODUCTS — 0.35% |
| 807 | | Cabot Microelectronics Corporation† | | | 52,608 |
| 16,636 | | Corning Incorporated† | | | 137,247 |
| 7,914 | | Hanson plc ADR | | | 257,601 |
| 17,302 | | Holcim Limited ADR† | | | 342,818 |
| 10,002 | | Lafarge SA ADR | | | 169,634 |
| | |
| | | | | | 959,908 |
| | | | |
|
|
|
| TEXTILE MILL PRODUCTS — 0.02% |
| 745 | | Mohawk Industries Incorporated† | | | 54,355 |
| | | | |
|
|
|
| TOBACCO PRODUCTS — 0.58% |
| 23,201 | | Altria Group Incorporated | | | 956,345 |
| 12,480 | | British American Tobacco plc ADR | | | 255,965 |
| 1,067 | | RJ Reynolds Tobacco Holdings Incorporated | | | 36,438 |
| 3,775 | | Swedish Match AB ADR | | | 256,700 |
| 647 | | Universal Corporation | | | 27,109 |
| 2,765 | | UST Incorporated | | | 92,351 |
| | |
| | | | | | 1,624,908 |
| | | | |
|
|
|
| TRANSPORTATION BY AIR — 0.32% |
| 3,588 | | AMR Corporation† | | | 39,468 |
| 23,498 | | BAA plc ADR | | | 169,488 |
| 2,844 | | Delta Air Lines Incorporated | | | 36,602 |
| 4,382 | | FedEx Corporation | | | 294,032 |
| 13,681 | | Japan Airlines System ADR | | | 161,222 |
| 2,337 | | Northwest Airlines Corporation† | | | 20,963 |
| 9,582 | | Southwest Airlines Company | | | 163,756 |
| | |
| | | | | | 885,531 |
| | | | |
|
|
40
PORTFOLIOOFINVESTMENTS —AUGUST 31, 2003 (UNAUDITED) | | WELLSFARGOOUTLOOK 2020FUND |
|
| Shares | | Security Name | | Value |
| Common Stock (Continued) |
|
| TRANSPORTATION EQUIPMENT — 1.58% |
| 12,920 | | BAE Systems plc ADR | | $ | 139,580 |
| 9,907 | | Boeing Company | | | 370,423 |
| 10,120 | | DaimlerChrysler AG | | | 386,888 |
| 3,742 | | Dana Corporation | | | 57,702 |
| 9,033 | | Delphi Corporation | | | 81,839 |
| 20,861 | | Fiat SpA ADR | | | 141,646 |
| 23,515 | | Ford Motor Company | | | 271,833 |
| 2,194 | | General Dynamics Corporation | | | 188,925 |
| 6,392 | | General Motors Corporation | | | 262,711 |
| 3,209 | | Genuine Parts Company | | | 102,752 |
| 2,688 | | Goodrich Corporation | | | 69,969 |
| 4,275 | | Harley-Davidson Incorporated | | | 212,981 |
| 13,628 | | Honda Motor Company Limited ADR | | | 277,466 |
| 10,309 | | Honeywell International Incorporated | | | 298,858 |
| 1,375 | | ITT Industries Incorporated | | | 89,485 |
| 1,089 | | Johnson Controls Incorporated | | | 107,811 |
| 1,131 | | Lear Corporation† | | | 62,827 |
| 5,298 | | Lockheed Martin Corporation | | | 271,417 |
| 1,645 | | Navistar International Corporation | | | 73,581 |
| 1,940 | | Northrop Grumman Corporation | | | 185,231 |
| 1,934 | | Paccar Incorporated | | | 164,776 |
| 3,323 | | Standard Motor Products Incorporated | | | 32,466 |
| 1,974 | | Textron Incorporated | | | 88,830 |
| 8,111 | | Toyota Motor Corporation ADR | | | 449,268 |
| | |
| | | | | | 4,389,265 |
| | | | |
|
|
|
| TRANSPORTATION SERVICES — 0.05% |
| 1,330 | | Expeditors International of Washington Incorporated | | | 50,154 |
| 1,492 | | GATX Corporation | | | 31,601 |
| 2,216 | | Sabre Holdings Corporation | | | 50,126 |
| | |
| | | | | | 131,881 |
| | | | |
|
|
|
| WATER TRANSPORTATION — 0.11% |
| 7,851 | | Carnival Corporation | | | 271,566 |
| 1,428 | | Kirby Corporation† | | | 41,698 |
| | |
| | | | | | 313,264 |
| | | | |
|
|
|
| WHOLESALE TRADE–DURABLE GOODS — 1.08% |
| 2,741 | | Apogent Technologies Incorporated† | | | 59,863 |
| 2,067 | | Arrow Electronics Incorporated† | | | 42,663 |
| 2,700 | | Cytyc Corporation† | | | 35,316 |
| 1,736 | | Imagistics International Incorporated† | | | 49,650 |
| 33,960 | | Johnson & Johnson | | | 1,683,735 |
| 1,881 | | Kyocera Corporation ADR | | | 119,124 |
| 15,833 | | Mitsubishi Corporation ADR | | | 267,592 |
| 2,017 | | Mitsui & Company Limited ADR | | | 257,188 |
| 11,739 | | Nissan Motor Company Limited ADR | | | 254,736 |
| 1,963 | | Omnicare Incorporated | | | 66,546 |
| Shares | | Security Name | | Value |
| 1,272 | | Sycamore Networks Incorporated† | | $ | 5,368 |
| 1,043 | | Tech Data Corporation† | | | 34,784 |
| 6,926 | | Visteon Corporation | | | 46,751 |
| 1,338 | | WW Grainger Incorporated | | | 66,673 |
| | |
| | | | | | 2,989,989 |
| | | | |
|
|
|
WHOLESALE TRADE NON-DURABLE
GOODS — 0.60% |
| 1,567 | | AmeriSourceBergen Corporation | | | 91,215 |
| 583 | | Brown-Forman Corporation Class B | | | 46,080 |
| 5,219 | | Cardinal Health Incorporated | | | 297,118 |
| 765 | | Dean Foods Company† | | | 22,223 |
| 3,818 | | McKesson Corporation | | | 125,001 |
| 4,894 | | Safeway Incorporated† | | | 119,463 |
| 4,548 | | Smurfit-Stone Container Corporation† | | | 71,767 |
| 2,897 | | Supervalu Incorporated | | | 69,818 |
| 7,880 | | Sysco Corporation | | | 247,905 |
| 5,332 | | Unilever NV NY Shares | | | 298,485 |
| 8,745 | | Unilever plc ADR | | | 285,263 |
| | |
| | | | | | 1,674,338 |
| | | | |
|
|
TOTAL COMMON STOCK (Cost $184,202,266) | | | 174,028,353 |
| | | | |
|
|
|
| Real Estate Investment Trust — 0.67% |
| 1,862 | | Alexandria Real Estate Equities Incorporated | | | 87,049 |
| 8,464 | | Annaly Mortgage Management Incorporated | | | 161,155 |
| 3,601 | | Apartment Investment & Management Company | | | 138,819 |
| 6,193 | | Archstone-Smith Trust | | | 161,947 |
| 3,355 | | Avalonbay Communities Incorporated | | | 155,672 |
| 397 | | Capital Automotive | | | 11,340 |
| 7,352 | | Duke Realty Corporation | | | 203,430 |
| 5,051 | | Equity Office Properties Trust | | | 140,519 |
| 5,473 | | Equity Residential | | | 159,155 |
| 7,619 | | Host Marriott Corporation† | | | 76,342 |
| 3,900 | | iStar Financial Incorporated | | | 142,974 |
| 2,598 | | Parkway Properties Incorporated | | | 116,520 |
| 3,977 | | Simon Property Group Incorporated | | | 169,858 |
| 3,091 | | Vornado Realty Trust | | | 145,741 |
TOTAL REAL ESTATE INVESTMENT
TRUST (Cost $1,939,162) | | | 1,870,521 |
| | | | |
|
|
| Principal | | Interest Rate | | Maturity Date | | |
| US Treasury Obligations — 35.11% | | |
| |
| US TREASURY BONDS — 4.52% | | |
| $ | 600,000 | | 7.25% | | 5/15/16 | | 733,452 |
| | 2,820,000 | | 8.00% | | 11/15/21 | | 3,727,358 |
| | 7,935,000 | | 5.38% | | 2/15/31 | | 8,105,476 |
| | | |
| | | | | | | | 12,566,286 |
| | | | | | |
|
41
| WELLSFARGOOUTLOOK 2020FUND | | PORTFOLIOOFINVESTMENTS —AUGUST 31, 2003 (UNAUDITED) |
|
| Principal | | Interest Rate | | Maturity Date | | Value |
| |
| US TREASURY NOTES — 30.59% | | | |
| $ | 1,400,000 | | 8.13% | | 8/15/19 | | $ | 1,851,664 |
| | 6,410,000 | | 6.50% | | 5/15/05 | | | 6,919,794 |
| | 2,520,000 | | 5.63% | | 2/15/06 | | | 2,726,816 |
| | 1,690,000 | | 7.00% | | 7/15/06 | | | 1,901,845 |
| | 4,500,000 | | 6.13% | | 8/15/07 | | | 5,019,786 |
| | 3,200,000 | | 4.75% | | 11/15/08 | | | 3,386,000 |
| | 3,500,000 | | 6.00% | | 8/15/04 | | | 3,656,132 |
| | 3,030,000 | | 6.00% | | 8/15/09 | | | 3,394,073 |
| | 3,000,000 | | 5.88% | | 11/15/04 | | | 3,158,319 |
| | 7,000,000 | | 6.75% | | 5/15/05 | | | 7,585,158 |
| | 2,190,000 | | 5.75% | | 8/15/10 | | | 2,421,660 |
| | 2,900,000 | | 5.75% | | 11/15/05 | | | 3,129,167 |
| | 1,305,000 | | 4.63% | | 5/15/06 | | | 1,382,995 |
| | 4,130,000 | | 5.00% | | 8/15/11 | | | 4,348,114 |
| | 3,945,000 | | 3.50% | | 11/15/06 | | | 4,049,479 |
| | 2,160,000 | | 4.38% | | 5/15/07 | | | 2,271,713 |
| | 6,980,000 | | 1.88% | | 9/30/04 | | | 7,022,808 |
| | 4,650,000 | | 3.00% | | 11/15/07 | | | 4,626,569 |
| | 6,520,000 | | 4.00% | | 11/15/12 | | | 6,321,850 |
| | 1,740,000 | | 3.00% | | 2/15/08 | | | 1,721,580 |
| | 5,925,000 | | 1.63% | | 4/30/05 | | | 5,915,508 |
| | 2,275,000 | | 2.00% | | 5/15/06 | | | 2,257,316 |
| | | |
| | | | | | | | | 85,068,346 |
| | | | | | |
|
TOTAL US TREASURY OBLIGATIONS (Cost $98,362,991) | | | 97,634,632 |
| | | | | | |
|
| Principal | | Interest Rate | | Maturity Date | | Value |
| Short Term Investments — 1.30% | | | |
| |
| US TREASURY BILLS — 1.30% | | | |
| $ | 192,000 | | 0.84%^ | | 9/18/03 | | $ | 191,928 |
| | 160,000 | | 0.84%^ | | 9/18/03 | | | 159,940 |
| | 280,000 | | 0.88%^ | | 10/16/03 | | | 279,670 |
| | 88,000 | | 0.88%^ | | 10/16/03 | | | 87,896 |
| | 177,000 | | 0.88%^ | | 10/16/03 | | | 176,792 |
| | 232,000 | | 0.88%^ | | 10/16/03 | | | 231,727 |
| | 299,000 | | 0.88%^ | | 10/16/03 | | | 298,648 |
| | 32,000 | | 0.88%^ | | 10/16/03 | | | 31,962 |
| | 23,000 | | 0.88%^ | | 10/16/03 | | | 22,974 |
| | 106,000 | | 0.88%^ | | 10/16/03 | | | 105,875 |
| | 197,000 | | 0.88%^ | | 10/16/03 | | | 196,768 |
| | 840,000 | | 0.88%^ | | 10/16/03 | | | 839,044 |
| | 595,000 | | 0.88%^ | | 10/16/03 | | | 594,346 |
| | 125,000 | | 0.88%^ | | 10/16/03 | | | 124,863 |
| | 46,000 | | 0.88%^ | | 10/16/03 | | | 45,949 |
| | 20,000 | | 0.88%^ | | 10/16/03 | | | 19,978 |
| | 199,000 | | 0.88%^ | | 10/16/03 | | | 198,776 |
TOTAL SHORT TERM INVESTMENT (Cost $3,607,289) | | | 3,607,136 |
| | | | | | |
|
TOTAL INVESTMENT IN
SECURITIES (Cost $288,111,708) | | 99.65% | | $ | 277,140,642 |
| | |
Other Assets and Liabilities,
Net | | 0.35 | | | 977,701 |
| | | | | |
| |
|
|
| TOTAL NET ASSETS | | 100.00% | | $ | 278,118,343 |
| | | | | |
| |
|
|
| (a) | Security Fair Valued in accordance with the procedures approved by the Board of Trustees. |
| † | Non-income earning securities. |
| ‡ | Security of an affiliate of the fund with a cost of $871,528. |
The accompanying notes are an integral part of these financial statements.
42
PORTFOLIOOFINVESTMENTS —AUGUST 31, 2003 (UNAUDITED) | | WELLSFARGOOUTLOOK 2030FUND |
|
| Shares | | Security Name | | Value |
| Common Stock — 73.50% | | | |
|
| AMUSEMENT & RECREATION SERVICES — 0.10% |
| 985 | | Harrah’s Entertainment Incorporated | | $ | 40,799 |
| 3,508 | | International Game Technology | | | 90,646 |
| 3,000 | | Park Place Entertainment† | | | 26,340 |
| | |
| | | | | | 157,785 |
| | | | |
|
|
|
| APPAREL & ACCESSORY STORES — 0.37% |
| 1,405 | | Abercrombie & Fitch Company† | | | 42,767 |
| 8,036 | | Gap Incorporated | | | 167,872 |
| 2,722 | | Kohl’s Corporation† | | | 172,167 |
| 5,254 | | Limited Brands | | | 89,108 |
| 2,045 | | Nordstrom Incorporated | | | 53,313 |
| 825 | | Payless ShoeSource Incorporated† | | | 12,161 |
| 1,024 | | Ross Stores Incorporated | | | 51,589 |
| | |
| | | | | | 588,977 |
| | | | |
|
|
|
APPAREL & OTHER FINISHED PRODUCTS MADE
FROM FABRICS & SIMILAR MATERIALS — 0.37% |
| 10,456 | | Benetton Group SpA ADR | | | 213,094 |
| 1,718 | | Jones Apparel Group Incorporated | | | 53,069 |
| 1,356 | | Liz Claiborne Incorporated | | | 46,741 |
| 1,079 | | VF Corporation | | | 43,268 |
| 5,968 | | Wacoal Corporation ADR | | | 235,318 |
| | |
| | | | | | 591,490 |
| | | | |
|
|
|
AUTOMOTIVE DEALERS & GASOLINE SERVICE
STATIONS — 0.10% |
| 3,355 | | AutoNation Incorporated† | | | 63,040 |
| 765 | | AutoZone Incorporated† | | | 70,227 |
| 907 | | CarMax Incorporated | | | 34,965 |
| | |
| | | | | | 168,232 |
| | | | |
|
|
|
BUILDING CONSTRUCTION — GENERAL
CONTRACTORS & OPERATIVE BUILDERS — 0.29% |
| 21 | | Cavco Industries Incorporated† | | | 399 |
| 428 | | Centex Corporation | | | 32,280 |
| 1,800 | | DR Horton Incorporated | | | 56,016 |
| 667 | | KB Home | | | 38,166 |
| 700 | | Lennar Corporation Class A | | | 47,075 |
| 70 | | Lennar Corporation Class B | | | 4,533 |
| 628 | | Pulte Homes Incorporated | | | 41,800 |
| 15,258 | | Sekisui House Limited ADR | | | 134,037 |
| 6,801 | | Vivendi Universal SA ADR† | | | 114,937 |
| | |
| | | | | | 469,243 |
| | | | |
|
|
|
BUILDING MATERIALS, HARDWARE, GARDEN
SUPPLY, & MOBILE HOME DEALERS — 0.63% |
| 1,010 | | Fastenal Company | | | 40,834 |
| 17,974 | | Home Depot Incorporated | | | 578,044 |
| 6,158 | | Lowe’s Companies Incorporated | | | 337,828 |
| 1,841 | | Sherwin-Williams Company | | | 55,377 |
| | |
| | | | | | 1,012,083 |
| | | | |
|
|
|
| BUSINESS SERVICES — 5.16% |
| 4,330 | | 3Com Corporation† | | | 24,681 |
| 10,176 | | Adecco SA ADR | | | 129,235 |
| Shares | | Security Name | | Value |
| 2,001 | | Adobe Systems Incorporated | | $ | 77,699 |
| 1,040 | | Affiliated Computer Services Incorporated† | | | 51,594 |
| 39,092 | | AOL Time Warner Incorporated† | | | 639,545 |
| 1,012 | | Arbitron Incorporated† | | | 37,424 |
| 1,616 | | Ariba Incorporated† | | | 4,105 |
| 847 | | Ascential Software Corporation† | | | 14,823 |
| 2,042 | | Autodesk Incorporated | | | 36,552 |
| 4,699 | | Automatic Data Processing Incorporated | | | 187,537 |
| 4,256 | | BEA Systems Incorporated† | | | 57,669 |
| 2,639 | | BMC Software Incorporated† | | | 38,741 |
| 3,312 | | Brocade Communications Systems Incorporated† | | | 18,680 |
| 3,007 | | Cadence Design Systems Incorporated† | | | 42,760 |
| 9,554 | | Cendant Corporation† | | | 171,781 |
| 2,507 | | Ceridian Corporation† | | | 48,736 |
| 1,185 | | ChoicePoint Incorporated† | | | 46,511 |
| 2,102 | | Citrix Systems Incorporated† | | | 43,280 |
| 1,071 | | Cognex Corporation | | | 32,837 |
| 5,171 | | Computer Associates International Incorporated | | | 132,533 |
| 1,614 | | Computer Sciences Corporation† | | | 68,708 |
| 5,073 | | Compuware Corporation† | | | 30,184 |
| 5,002 | | Concord EFS Incorporated† | | | 69,278 |
| 2,193 | | Convergys Corporation† | | | 39,474 |
| 3,477 | | CSK Corporation ADR | | | 110,569 |
| 960 | | Deluxe Corporation | | | 40,992 |
| 2,866 | | DoubleClick Incorporated† | | | 32,300 |
| 945 | | DST Systems Incorporated† | | | 37,422 |
| 5,268 | | eBay Incorporated† | | | 292,532 |
| 1,608 | | Echelon Corporation† | | | 23,911 |
| 2,172 | | eFunds Corporation† | | | 27,736 |
| 1,151 | | Electronic Arts Incorporated† | | | 103,302 |
| 4,298 | | Electronic Data Systems Corporation | | | 93,825 |
| 1,316 | | Electronics for Imaging Incorporated† | | | 28,189 |
| 466 | | Enterasys Networks Incorporated† | | | 2,689 |
| 1,687 | | Equifax Incorporated | | | 38,700 |
| 778 | | Fair Isaac Corporation | | | 45,591 |
| 5,808 | | First Data Corporation | | | 223,027 |
| 1,930 | | Fiserv Incorporated† | | | 74,981 |
| 1,616 | | FreeMarkets Incorporated† | | | 14,382 |
| 135 | | Hudson Highland Group Incorporated† | | | 2,819 |
| 2,729 | | IMS Health Incorporated | | | 53,134 |
| 1 | | InfoSpace Incorporated† | | | 11 |
| 1,020 | | Internet Security Systems Incorporated† | | | 12,740 |
| 3,965 | | Interpublic Group of Companies Incorporated | | | 60,070 |
| 1,543 | | Intuit Incorporated† | | | 69,929 |
| 1,637 | | Keane Incorporated† | | | 24,113 |
| 3,474 | | Legato Systems Incorporated† | | | 39,326 |
| 1,546 | | Macromedia Incorporated† | | | 36,857 |
43
| WELLSFARGOOUTLOOK 2030FUND | | PORTFOLIOOFINVESTMENTS —AUGUST 31, 2003 (UNAUDITED) |
|
| Shares | | Security Name | | Value |
| Common Stock (Continued) | | | |
| 1,176 | | Manpower Incorporated | | $ | 45,758 |
| 1,789 | | Mentor Graphics Corporation† | | | 36,227 |
| 942 | | Mercury Interactive Corporation† | | | 41,344 |
| 3,881 | | Micromuse Incorporated† | | | 31,747 |
| 83,611 | | Microsoft Corporation | | | 2,217,364 |
| 1,800 | | Monster Worldwide Incorporated† | | | 49,176 |
| 3,916 | | MPS Group Incorporated† | | | 37,398 |
| 1,239 | | NCR Corporation† | | | 35,943 |
| 831 | | NDCHealth Corporation | | | 17,601 |
| 1,919 | | Network Associates Incorporated† | | | 26,712 |
| 3,698 | | Novell Incorporated† | | | 18,601 |
| 1,563 | | Omnicom Group Incorporated | | | 122,070 |
| 42,842 | | Oracle Corporation† | | | 547,521 |
| 3,696 | | Parametric Technology† | | | 12,308 |
| 2,958 | | PeopleSoft Incorporated† | | | 53,540 |
| 981 | | RealNetworks Incorporated† | | | 6,200 |
| 7,629 | | Rentokil Initial plc ADR | | | 126,705 |
| 3,338 | | Reuters Group plc ADR | | | 78,844 |
| 2,698 | | Robert Half International Incorporated† | | | 60,004 |
| 744 | | RSA Security Incorporated† | | | 8,988 |
| 6,867 | | SAP AG ADR | | | 205,598 |
| 5,187 | | Siebel Systems Incorporated† | | | 52,285 |
| 29,373 | | Sun Microsystems Incorporated† | | | 113,380 |
| 2,878 | | Sungard Data Systems Incorporated† | | | 81,160 |
| 1,949 | | Sybase Incorporated† | | | 32,958 |
| 1,291 | | Symantec Corporation† | | | 74,142 |
| 659 | | Synopsys Incorporated† | | | 44,950 |
| 831 | | Total System Services Incorporated | | | 20,974 |
| 3,746 | | Unisys Corporation† | | | 48,623 |
| 2,235 | | VeriSign Incorporated† | | | 33,458 |
| 3,539 | | Veritas Software Corporation† | | | 122,025 |
| 1,945 | | Viad Corporation | | | 46,447 |
| 2,766 | | WPP Group plc ADR | | | 126,932 |
| 5,156 | | Yahoo! Incorporated† | | | 172,204 |
| | |
| | | | | | 8,282,701 |
| | | | |
|
|
|
| CHEMICALS & ALLIED PRODUCTS — 8.02% |
| 12,294 | | Abbott Laboratories | | | 495,446 |
| 3,154 | | Abgenix Incorporated† | | | 41,002 |
| 1,636 | | Air Products & Chemicals Incorporated | | | 77,416 |
| 5,615 | | Akzo Nobel NV ADR | | | 183,217 |
| 870 | | Alberto-Culver Company Class B | | | 49,660 |
| 10,390 | | Amgen Incorporated† | | | 684,701 |
| 10,468 | | AstraZeneca plc ADR | | | 415,056 |
| 4,581 | | Aventis SA ADR | | | 224,469 |
| 567 | | Avery Dennison Corporation | | | 31,043 |
| 1,970 | | Avon Products Incorporated | | | 126,277 |
| 699 | | Barr Laboratories Incorporated† | | | 47,301 |
| 1,392 | | Biogen Incorporated† | | | 54,928 |
| 15,191 | | Bristol-Myers Squibb Company | | | 385,396 |
| 905 | | Cabot Corporation | | | 24,607 |
| Shares | | Security Name | | Value |
| 3,935 | | Centerpulse Limited | | $ | 108,291 |
| 1,812 | | Chiron Corporation† | | | 92,086 |
| 5,944 | | Ciba Specialty Chemicals AD ADR | | | 203,641 |
| 1,943 | | Clorox Company | | | 83,258 |
| 4,187 | | Colgate-Palmolive Company | | | 231,457 |
| 2,517 | | Crompton Corporation | | | 14,875 |
| 1,947 | | Dial Corporation | | | 39,466 |
| 7,252 | | Dow Chemical Company | | | 250,412 |
| 7,243 | | E I Du Pont De Nemours & Company | | | 324,052 |
| 458 | | Eastman Chemical Company | | | 16,401 |
| 2,628 | | Ecolab Incorporated | | | 67,776 |
| 3,891 | | Eisai Company Limited ADR | | | 81,368 |
| 8,834 | | Eli Lilly & Company | | | 587,726 |
| 1,122 | | Estee Lauder Companies Incorporated | | | 38,698 |
| 2,988 | | Forest Laboratories Incorporated† | | | 140,436 |
| 1,785 | | Genentech Incorporated† | | | 141,729 |
| 2,158 | | Genzyme Corporation–General Division† | | | 101,750 |
| 1,765 | | Gilead Sciences Incorporated† | | | 117,726 |
| 7,887 | | Gillette Company | | | 256,012 |
| 16,512 | | GlaxoSmithKline plc ADR | | | 641,161 |
| 1,977 | | ICN Pharmaceuticals Incorporated | | | 34,598 |
| 1,300 | | IDEC Pharmaceuticals Corporation† | | | 45,175 |
| 1,267 | | Idexx Laboratories Incorporated† | | | 52,720 |
| 1,439 | | IMC Global Incorporated | | | 11,267 |
| 1,257 | | International Flavors & Fragrances Incorporated | | | 39,596 |
| 2,340 | | IVAX Corporation† | | | 46,332 |
| 3,054 | | King Pharmaceuticals Incorporated† | | | 42,909 |
| 1,035 | | Lubrizol Corporation | | | 35,190 |
| 2,286 | | Lyondell Chemical Company | | | 32,690 |
| 2,445 | | Medimmune Incorporated† | | | 85,257 |
| 17,496 | | Merck & Company Incorporated | | | 880,399 |
| 2,821 | | Millennium Chemicals Incorporated | | | 30,523 |
| 2,077 | | Mylan Laboratories Incorporated | | | 75,603 |
| 13,818 | | Novartis AG ADR | | | 510,851 |
| 3,910 | | Novo Nordisk A/S ADR | | | 139,783 |
| 1,515 | | Olin Corporation | | | 27,588 |
| 62,038 | | Pfizer Incorporated | | | 1,856,177 |
| 949 | | PPG Industries Incorporated | | | 52,110 |
| 1,205 | | Praxair Incorporated | | | 76,903 |
| 9,493 | | Procter & Gamble Company | | | 828,644 |
| 3,933 | | Roche Holding AG ADR | | | 301,180 |
| 2,359 | | Rohm & Haas Company | | | 85,702 |
| 11,936 | | Schering-Plough Corporation | | | 181,308 |
| 1,642 | | Sepracor Incorporated† | | | 44,203 |
| 13,976 | | Shiseido Company Limited ADR | | | 146,252 |
| 848 | | Sigma-Aldrich Corporation | | | 46,428 |
| 16,820 | | Syngenta AG ADR | | | 186,702 |
| 2,761 | | Tanox Incorporated† | | | 61,267 |
44
PORTFOLIOOFINVESTMENTS —AUGUST 31, 2003 (UNAUDITED) | | WELLSFARGOOUTLOOK 2030FUND |
|
| Shares | | Security Name | | Value |
| Common Stock (Continued) | | | |
| 1,055 | | Valspar Corporation | | $ | 49,026 |
| 1,384 | | Watson Pharmaceuticals Incorporated† | | | 56,882 |
| 10,358 | | Wyeth | | | 443,840 |
| | |
| | | | | | 12,885,945 |
| | | | |
|
|
|
| COAL MINING — 0.05% |
| 1,483 | | Massey Energy Company | | | 18,760 |
| 1,400 | | Penn Virginia Corporation | | | 63,014 |
| | |
| | | | | | 81,774 |
| | | | |
|
|
|
| COMMUNICATIONS — 4.41% |
| 533 | | ADTRAN Incorporated | | | 29,207 |
| 2,150 | | Alltel Corporation | | | 98,470 |
| 4,530 | | American Tower Corporation Class A† | | | 51,551 |
| 876 | | Anixter International Incorporated† | | | 19,911 |
| 7,088 | | AT&T Corporation | | | 158,062 |
| 24,911 | | AT&T Wireless Services Incorporated† | | | 214,733 |
| 2,621 | | Avaya Incorporated† | | | 27,389 |
| 14,736 | | BellSouth Corporation | | | 371,347 |
| 3,193 | | British Sky Broadcasting Group plc ADR† | | | 135,639 |
| 6,141 | | BT Group plc ADR† | | | 180,238 |
| 1,773 | | Cablevision Systems New York Group Class A† | | | 35,726 |
| 1,508 | | CenturyTel Incorporated | | | 52,418 |
| 1,143 | | Certegy Incorporated† | | | 34,576 |
| 5,535 | | Cincinnati Bell Incorporated† | | | 31,273 |
| 5,206 | | Clear Channel Communications Incorporated† | | | 234,895 |
| 31,945 | | Comcast Corporation Class A† | | | 950,364 |
| 1,907 | | COX Communications Incorporated† | | | 62,397 |
| 16,929 | | Deutsche Telekom AG ADR | | | 242,762 |
| 5,179 | | France Telecom SA ADR | | | 128,439 |
| 1,247 | | Global Payments Incorporated | | | 47,074 |
| 1,383 | | Hearst-Argyle Television Incorporated† | | | 33,552 |
| 1,368 | | Hispanic Broadcasting Corporation† | | | 42,955 |
| 2,459 | | Interactive Corporation† | | | 91,008 |
| 2,942 | | Lagardere SCA ADR | | | 133,658 |
| 4,577 | | Level 3 Communications Incorporated† | | | 22,977 |
| 8,413 | | Nextel Communications Incorporated† | | | 162,203 |
| 7,251 | | Nippon Telegraph & Telephone Corporation ADR | | | 160,900 |
| 9,800 | | NTT DoCoMo Incorporated ADR† | | | 253,526 |
| 15,401 | | Qwest Communications International Incorporated† | | | 68,534 |
| 4,077 | | Reed Elsevier plc | | | 128,222 |
| 27,466 | | SBC Communications Incorporated | | | 617,710 |
| Shares | | Security Name | | Value |
| 9,145 | | Sprint Corporation (FON Group) | | $ | 135,072 |
| 9,210 | | Sprint Corporation (PCS Group)† | | | 47,800 |
| 6,986 | | TDC A/S ADR | | | 104,441 |
| 10,919 | | Telefonica SA ADR† | | | 387,625 |
| 585 | | Telephone & Data Systems Incorporated | | | 33,591 |
| 2,110 | | Univision Communications Incorporated† | | | 79,104 |
| 22,887 | | Verizon Communications Incorporated | | | 808,369 |
| 36,621 | | Vodafone Group plc ADR | | | 670,164 |
| | |
| | | | | | 7,087,882 |
| | | | |
|
|
|
| DEPOSITORY INSTITUTIONS — 9.07% |
| 15,123 | | ABN AMRO Holding NV ADR | | | 266,762 |
| 7,533 | | Allied Irish Banks Plc ADR | | | 211,527 |
| 4,118 | | AmSouth Bancorporation | | | 88,702 |
| 1,802 | | Associated Banc-Corp | | | 68,782 |
| 22,690 | | Banco Bilbao Vizcaya Argentaria SA ADR | | | 243,918 |
| 12,328 | | Banco Comercial Portugues SA ADR | | | 109,103 |
| 39,483 | | Banco Santander Central Hispano SA ADR | | | 338,764 |
| 11,036 | | Bank of America Corporation | | | 874,603 |
| 1,504 | | Bank of Hawaii Corporation | | | 50,986 |
| 5,818 | | Bank of New York Company Incorporated | | | 171,166 |
| 9,006 | | Bank One Corporation | | | 355,467 |
| 953 | | Banknorth Group Incorporated | | | 26,779 |
| 11,319 | | Barclays plc ADR | | | 334,816 |
| 4,799 | | Bayerische Hypo-Und Vereinsbank Ag ADR† | | | 74,975 |
| 3,906 | | BB&T Corporation | | | 142,647 |
| 2,400 | | Berkshire Hills Bancorp Incorporated | | | 77,760 |
| 10,234 | | BNP Paribas Sa ADR | | | 254,942 |
| 2,100 | | BostonFed Bancorp Incorporated | | | 65,142 |
| 1,494 | | Charter One Financial Incorporated | | | 46,314 |
| 2,132 | | Chittenden Corporation | | | 61,487 |
| 42,828 | | Citigroup Incorporated | | | 1,856,594 |
| 504 | | City National Corporation | | | 26,057 |
| 1,299 | | Comerica Incorporated | | | 64,093 |
| 1,181 | | Commerce Bancshares Incorporated | | | 51,232 |
| 1,800 | | Community Bank System Incorporated | | | 78,840 |
| 1,907 | | Compass Bancshares Incorporated | | | 65,563 |
| 4,274 | | Deutsche Bank AG | | | 248,918 |
| 246 | | Downey Financial Corporation | | | 10,398 |
| 4,598 | | Fifth Third Bancorp | | | 269,443 |
| 1,258 | | First Tennessee National Corporation | | | 52,018 |
| 1,700 | | FirstFed Financial Corporation† | | | 67,490 |
| 8,659 | | FleetBoston Fianancial Corporation | | | 256,220 |
45
| WELLSFARGOOUTLOOK 2030FUND | | PORTFOLIOOFINVESTMENTS —AUGUST 31, 2003 (UNAUDITED) |
|
| Shares | | Security Name | | Value |
| Common Stock (Continued) | | | |
| 754 | | Golden West Financial Corporation | | $ | 65,048 |
| 1,081 | | GreenPoint Financial Corporation | | | 36,624 |
| 1,800 | | Hawthorne Financial Corporation† | | | 70,380 |
| 7,700 | | HBOS Plc ADR | | | 257,231 |
| 2,382 | | Hibernia Corporation Class A | | | 49,427 |
| 10,846 | | HSBC Holdings plc ADR | | | 697,615 |
| 3,443 | | Huntington Bancshares Incorporated | | | 68,860 |
| 2,000 | | IBERIABANK Corporation | | | 96,000 |
| 11,983 | | ING Groep NV | | | 236,425 |
| 16,375 | | JP Morgan Chase & Company | | | 560,353 |
| 3,237 | | Keycorp | | | 87,982 |
| 7,269 | | Lloyds Tsb Group Plc ADR | | | 192,120 |
| 553 | | M&T Bank Corporation | | | 46,585 |
| 2,578 | | Marshall & Ilsley Corporation | | | 79,918 |
| 1,400 | | MASSBANK Corporation | | | 51,632 |
| 3,103 | | Mellon Financial Corporation | | | 97,279 |
| 1,127 | | Mercantile Bankshares | | | 46,038 |
| 3,316 | | National Australia Bank | | | 335,248 |
| 48,910 | | National Bank Of Greece | | | 211,291 |
| 4,709 | | National City Corporation | | | 149,181 |
| 3,225 | | National Commerce Financial Corporation | | | 80,625 |
| 994 | | New York Community Bancorp | | | 30,575 |
| 1,816 | | North Fork Bancorporation Incorporated | | | 61,326 |
| 1,840 | | Northern Trust Corporation | | | 77,722 |
| 184 | | Park National Corporation | | | 20,700 |
| 1,408 | | Pennrock Financial Services | | | 42,240 |
| 1,346 | | PNC Financial Services Group | | | 64,070 |
| 1,500 | | Popular Incorporated | | | 56,520 |
| 1,600 | | Provident Financial Group | | | 42,736 |
| 1,512 | | Regions Financial Corporation | | | 53,313 |
| 15,662 | | San Paolo-Imi SpA | | | 302,277 |
| 3,512 | | Sky Financial Group Incorporated | | | 82,251 |
| 15,731 | | Societe Generale | | | 208,634 |
| 3,522 | | Southtrust Corporation | | | 102,103 |
| 2,862 | | State Street Corporation | | | 125,785 |
| 26,481 | | Sumitomo Mitsui Financial | | | 92,371 |
| 1,512 | | SunTrust Banks Incorporated | | | 92,429 |
| 2,621 | | Synovus Financial Corporation | | | 64,083 |
| 373 | | TCF Financial Corporation | | | 17,154 |
| 1,952 | | Trustmark Corporation | | | 51,299 |
| 1,360 | | Union Planters Corporation | | | 43,384 |
| 17,332 | | US Bancorp | | | 414,235 |
| 2,962 | | Valley National Bancorp | | | 83,262 |
| 10,645 | | Wachovia Corporation | | | 448,687 |
| 4,314 | | Washington Federal Incorporated | | | 109,403 |
| 6,669 | | Washington Mutual Incorporated | | | 259,958 |
| 421 | | Webster Financial Corporation | | | 16,398 |
| 13,400 | | Wells Fargo & Company‡ | | | 671,876 |
| 8,026 | | Westpac Banking Corporation ADR | | | 410,450 |
| Shares | | Security Name | | Value |
| 1,204 | | Wilmington Trust Corporation | | $ | 38,456 |
| 872 | | Zions Bancorporation | | | 48,570 |
| | |
| | | | | | 14,559,637 |
| | | | |
|
|
|
| EATING & DRINKING PLACES — 0.32% |
| 1,549 | | Brinker International Incorporated† | | | 52,975 |
| 2,592 | | Darden Restaurants Incorporated | | | 56,506 |
| 10,442 | | McDonald’s Corporation | | | 234,110 |
| 1,388 | | Outback Steakhouse Incorporated | | | 53,646 |
| 1,414 | | Wendy’s International Incorporated | | | 44,612 |
| 2,637 | | Yum! Brands Incorporated† | | | 78,187 |
| | |
| | | | | | 520,036 |
| | | | |
|
|
|
| EDUCATIONAL SERVICES — 0.07% |
| 1,827 | | Apollo Group Incorporated Class A† | | | 117,056 |
| | | | |
|
|
|
| ELECTRIC, GAS, & SANITARY SERVICES — 2.81% |
| 4,881 | | AES Corporation† | | | 31,630 |
| 1,596 | | Ameren Corporation | | | 67,830 |
| 3,661 | | American Electric Power Company Incorporated | | | 103,643 |
| 6,451 | | BG Group plc ADR | | | 140,696 |
| 3,754 | | Calpine Corporation† | | | 21,173 |
| 4,177 | | CenterPoint Energy Incorporated | | | 35,463 |
| 2,220 | | Cinergy Corporation | | | 75,968 |
| 49,665 | | CLP Holdings Limited ADR | | | 219,052 |
| 1,925 | | Consolidated Edison Incorporation | | | 76,095 |
| 2,365 | | Constellation Energy Group Incorporated | | | 86,062 |
| 3,004 | | Dominion Resources Incorporation | | | 181,982 |
| 7,740 | | Duke Energy Corporation | | | 132,199 |
| 4,511 | | E. ON AG ADR | | | 234,301 |
| 4,060 | | Edison International† | | | 76,572 |
| 3,600 | | El Paso Corporation | | | 26,424 |
| 2,374 | | Entergy Corporation | | | 124,516 |
| 3,603 | | Exelon Corporation | | | 212,217 |
| 3,510 | | FirstEnergy Corporation | | | 102,703 |
| 1,563 | | FPL Group Incorporated | | | 96,687 |
| 159,943 | | Hong Kong & China Gas Company Limited ADR | | | 215,331 |
| 47,000 | | Hong Kong Electric Holdings Limited ADR | | | 185,603 |
| 4,732 | | International Power plc ADR† | | | 113,521 |
| 1,381 | | Kinder Morgan Incorporated | | | 73,538 |
| 488 | | National Fuel Gas Company | | | 11,297 |
| 5,879 | | National Grid Transco plc ADR | | | 181,367 |
| 2,966 | | NiSource Incorporated | | | 57,362 |
| 627 | | NSTAR | | | 27,964 |
| 363 | | Peoples Energy Corporation | | | 14,574 |
| 4,333 | | PG&E Corporation† | | | 96,063 |
| 1,071 | | Pinnacle West Capital Corporation | | | 36,735 |
46
PORTFOLIOOFINVESTMENTS —AUGUST 31, 2003 (UNAUDITED) | | WELLSFARGOOUTLOOK 2030FUND |
|
| Shares | | Security Name | | Value |
| Common Stock (Continued) | | | |
| 2,058 | | PPL Corporation | | $ | 81,641 |
| 1,864 | | Progress Energy Incorporated | | | 75,473 |
| 1,929 | | Public Service Enterprise Group Incorporated | | | 81,674 |
| 3,293 | | Reliant Resources Incorporated† | | | 15,214 |
| 4,667 | | RWE AG ADR | | | 125,792 |
| 611 | | SCANA Corporation | | | 20,774 |
| 6,592 | | Scottish Power plc ADR | | | 155,571 |
| 2,656 | | Sempra Energy | | | 79,016 |
| 2,200 | | South Jersey Industries Incorporated | | | 84,370 |
| 6,263 | | Southern Company | | | 177,744 |
| 208 | | Texas Genco Holdings Incorporated | | | 5,096 |
| 1,954 | | TXU Corporation | | | 42,988 |
| 376 | | UGI Corporation | | | 11,487 |
| 13,283 | | United Utilities plc ADR | | | 230,460 |
| 4,883 | | Waste Management Incorporated | | | 129,937 |
| 5,054 | | Williams Companies Incorporated | | | 46,143 |
| 773 | | WPS Resources Corporation | | | 30,008 |
| 3,746 | | Xcel Energy Incorporated | | | 54,879 |
| | |
| | | | | | 4,506,835 |
| | | | |
|
|
|
ELECTRONIC & OTHER ELECTRICAL
EQUIPMENT & COMPONENTS, EXCEPT
COMPUTER EQUIPMENT — 6.77% |
| 2,514 | | Adaptec Incorporated† | | | 18,378 |
| 1,543 | | Advanced Fibre Communications Incorporated† | | | 35,906 |
| 4,305 | | Advanced Micro Devices Incorporated† | | | 48,603 |
| 15,206 | | Alcatel SA ADR | | | 165,593 |
| 3,317 | | Altera Corporation† | | | 74,433 |
| 2,751 | | American Power Conversion Corporation | | | 49,298 |
| 2,838 | | Analog Devices Incorporated† | | | 116,358 |
| 1,752 | | Andrew Corporation† | | | 21,690 |
| 5,512 | | Applied Micro Circuits Corporation† | | | 32,025 |
| 4,877 | | ASML Holding NV NY Shares† | | | 77,544 |
| 1,292 | | AVX Corporation | | | 18,062 |
| 2,655 | | Broadcom Corporation† | | | 72,959 |
| 4,774 | | Canon Incorporated ADR | | | 231,348 |
| 4,079 | | Chartered Semiconductor Manufacturing Limited ADR† | | | 26,799 |
| 2,390 | | CIENA Corporation† | | | 15,535 |
| 2,219 | | Comverse Technology Incorporated† | | | 36,591 |
| 10,678 | | Conexant Systems Incorporated† | | | 58,515 |
| 543 | | Cooper Industries Limited Class A | | | 27,633 |
| 1,381 | | Cree Incorporated† | | | 21,847 |
| 1,880 | | Cypress Semiconductor Corporation† | | | 34,912 |
| 2,514 | | EchoStar Communications Corporation† | | | 92,767 |
| 2,747 | | Emerson Electric Company | | | 153,173 |
| Shares | | Security Name | | Value |
| 12,276 | | Ericsson ADR† | | $ | 190,032 |
| 2,816 | | Gemstar-TV Guide International Incorporated† | | | 13,573 |
| 77,856 | | General Electric Company | | | 2,302,202 |
| 771 | | Harris Corporation | | | 25,597 |
| 693 | | Imation Corporation | | | 24,913 |
| 4,748 | | Infineon Technologies AG ADR | | | 69,796 |
| 1,832 | | Integrated Device Technology Incorporated† | | | 25,556 |
| 50,571 | | Intel Corporation | | | 1,447,342 |
| 13,185 | | International Business Machines Corporation | | | 1,081,302 |
| 1,034 | | International Rectifier Corporation† | | | 43,004 |
| 1,320 | | Intersil Corporation Class A† | | | 38,452 |
| 2,520 | | Jabil Circuit Incorporated† | | | 70,938 |
| 1,406 | | Jacuzzi Brands Incorporated† | | | 8,000 |
| 15,584 | | JDS Uniphase Corporation† | | | 53,609 |
| 8,649 | | Koninklijke Philips Electronics NV NY Shares | | | 211,036 |
| 820 | | L-3 Communications Holdings Incorporated† | | | 41,894 |
| 1,270 | | Lattice Semiconductor Corporation | | | 11,176 |
| 2,319 | | Linear Technology Corporation | | | 95,589 |
| 4,264 | | LSI Logic Corporation† | | | 49,207 |
| 13,289 | | Matsushita Electric Industrial Company Limited ADR | | | 170,232 |
| 2,357 | | Maxim Integrated Products Incorporated | | | 105,853 |
| 1,175 | | Maytag Corporation | | | 31,843 |
| 1,566 | | McDATA Corporation† | | | 15,895 |
| 5,598 | | Micron Technology Incorporated† | | | 80,387 |
| 4,353 | | Mindspeed Technologies-W/I† | | | 15,323 |
| 12,304 | | Minebea Company Limited ADR | | | 122,534 |
| 2,045 | | Molex Incorporated | | | 60,164 |
| 20,757 | | Motorola Incorporated | | | 222,723 |
| 3,281 | | Mykrolis Corporation† | | | 41,341 |
| 1,777 | | National Semiconductor Corporation† | | | 51,782 |
| 3,609 | | Network Appliance Incorporated† | | | 80,878 |
| 1,450 | | Nidec Corporation ADR | | | 115,275 |
| 24,667 | | Nokia Oyj ADR | | | 401,825 |
| 1,351 | | Novellus Systems Incorporated† | | | 53,986 |
| 1,744 | | NVIDIA Corporation† | | | 31,671 |
| 721 | | Omron Corporation ADR | | | 146,140 |
| 6,561 | | Pioneer Corporation ADR | | | 146,245 |
| 943 | | QLogic Corporation† | | | 46,226 |
| 6,286 | | Qualcomm Incorporated | | | 259,486 |
| 1,589 | | Rambus Incorporated† | | | 26,473 |
| 2,312 | | RF Micro Devices Incorporated† | | | 20,392 |
| 2,758 | | Rockwell Collins Incorporated | | | 74,604 |
| 5,288 | | Sanmina-SCI Corporation† | | | 47,486 |
| 6,052 | | Sanyo Electric Company Limited ADR | | | 122,008 |
| 1,924 | | Scientific-Atlanta Incorporated | | | 65,416 |
47
| WELLSFARGOOUTLOOK 2030FUND | | PORTFOLIOOFINVESTMENTS —AUGUST 31, 2003 (UNAUDITED) |
|
| Shares | | Security Name | | Value |
| Common Stock (Continued) | | | |
| 647 | | Silicon Laboratories Incorporated† | | $ | 28,733 |
| 1,707 | | Skyworks Solutions Incorporated† | | | 19,357 |
| 8,321 | | Solectron Corporation† | | | 49,344 |
| 5,084 | | Sony Corporation ADR | | | 167,518 |
| 4,912 | | STMicroelectronics NV ADR | | | 122,505 |
| 1,810 | | TDK Corporation ADR | | | 117,288 |
| 3,823 | | Tellabs Incorporated† | | | 24,964 |
| 14,403 | | Texas Instruments Incorporated | | | 343,512 |
| 1,518 | | Thomas & Betts Corporation† | | | 25,927 |
| 568 | | Varian Semiconductor Equipment Associates Incorporated† | | | 23,044 |
| 1,843 | | Vishay Intertechnology Incorporated† | | | 30,354 |
| 1,637 | | Vitesse Semiconductor Corporation† | | | 11,181 |
| 451 | | Whirlpool Corporation | | | 31,381 |
| 2,712 | | Xilinx Incorporated† | | | 83,638 |
| | |
| | | | | | 10,868,121 |
| | | | |
|
|
|
ENGINEERING, ACCOUNTING, RESEARCH
MANAGEMENT & RELATED SERVICES — 0.37% |
| 2,624 | | Applera Corporation — Celera Genomics Group† | | | 26,711 |
| 628 | | Cephalon Incorporated† | | | 27,852 |
| 3,554 | | CuraGen Corporation† | | | 16,313 |
| 1,093 | | Dun & Bradstreet Corporation† | | | 46,015 |
| 875 | | Fluor Corporation | | | 32,235 |
| 4,262 | | Millennium Pharmaceutical Incorporated† | | | 59,242 |
| 1,794 | | Monsanto Company | | | 46,124 |
| 1,153 | | Moody’s Corporation | | | 59,795 |
| 3,130 | | Paychex Incorporated | | | 112,680 |
| 1,138 | | Quest Diagnostics Incorporated† | | | 68,280 |
| 2,596 | | Quintiles Transnational Corporation† | | | 36,967 |
| 5,101 | | ServiceMaster Company | | | 51,061 |
| 2,197 | | UnitedGlobalCom Incorporated† | | | 14,676 |
| | |
| | | | | | 597,951 |
| | | | |
|
|
|
FABRICATED METAL PRODUCTS, EXCEPT
MACHINERY & TRANSPORTATION
EQUIPMENT — 0.27% |
| 800 | | Ball Corporation | | | 42,240 |
| 1,410 | | Crane Company | | | 36,082 |
| 1,271 | | Fortune Brands Incorporated | | | 71,684 |
| 2,395 | | Illinois Tool Works Incorporated | | | 173,135 |
| 4,417 | | Masco Corporation | | | 109,497 |
| | |
| | | | | | 432,638 |
| | | | |
|
|
|
| FOOD & KINDRED PRODUCTS — 2.9% |
| 142 | | Adolph Coors Company | | | 7,831 |
| 5,702 | | Anheuser-Busch Companies Incorporated | | | 293,881 |
| 6,331 | | Archer-Daniels-Midland Company | | | 87,811 |
| 8,917 | | Cadbury Schweppes plc ADR | | | 219,180 |
| 3,353 | | Campbell Soup Company | | | 81,143 |
| Shares | | Security Name | | Value |
| 18,438 | | Coca-Cola Company | | $ | 802,422 |
| 5,079 | | Coca-Cola Enterprises Incorporated | | | 93,911 |
| 42,549 | | Compass Group plc ADR | | | 235,726 |
| 4,417 | | ConAgra Foods Incorporated | | | 97,174 |
| 1,221 | | Del Monte Foods Company† | | | 10,965 |
| 6,850 | | Diageo plc ADR | | | 299,619 |
| 2,388 | | Flowers Foods Incorporated | | | 50,554 |
| 3,226 | | General Mills Incorporated | | | 149,557 |
| 10,119 | | Groupe Danone ADR | | | 278,576 |
| 1,852 | | Heinz (HJ) Company | | | 59,931 |
| 807 | | Hershey Foods Corporation | | | 56,409 |
| 1,794 | | Hormel Foods Corporation | | | 38,750 |
| 817 | | J M Smucker Company | | | 33,072 |
| 3,162 | | Kellogg Company | | | 106,022 |
| 21,659 | | Kirin Brewery Company Limited ADR | | | 152,046 |
| 1,541 | | Kraft Foods Incorporated | | | 45,768 |
| 1,886 | | McCormick & Co Incorporated | | | 50,356 |
| 8,469 | | Nestle SA ADR | | | 461,080 |
| 2,600 | | Pepsi Bottling Group Incorporated | | | 62,712 |
| 1,887 | | PepsiAmericas Incorporated | | | 26,267 |
| 12,719 | | PepsiCo Incorporated | | | 566,504 |
| 6,796 | | Sara Lee Corporation | | | 128,988 |
| 1,886 | | Smithfield Foods Incorporated† | | | 38,192 |
| 3,100 | | Tyson Foods Incorporated Class A | | | 34,720 |
| 1,518 | | WM Wrigley Jr Company | | | 80,530 |
| | |
| | | | | | 4,649,697 |
| | | | |
|
|
|
| FOOD STORES — 0.65% |
| 3,385 | | Albertson’s Incorporated | | | 71,153 |
| 6,064 | | Coles Myer Limited ADR | | | 230,129 |
| 3,564 | | Ito-Yokado Company Limited ADR(a) | | | 101,802 |
| 17,252 | | Koninklijke Ahold NV ADR | | | 160,444 |
| 6,485 | | Kroger Company† | | | 124,577 |
| 3,799 | | Starbucks Corporation† | | | 108,044 |
| 19,589 | | Tesco plc ADR | | | 200,783 |
| 586 | | Whole Foods Market Incorporated† | | | 31,837 |
| 1,287 | | Winn-Dixie Stores Incorporated | | | 12,934 |
| | |
| | | | | | 1,041,703 |
| | | | |
|
|
|
| FORESTRY — 0.08% |
| 1,775 | | Plum Creek Timber Company | | | 46,416 |
| 1,483 | | Weyerhaeuser Company | | | 88,239 |
| | |
| | | | | | 134,655 |
| | | | |
|
|
|
| FURNITURE & FIXTURES — 0.18% |
| 1,068 | | Ethan Allen Interiors Incorporated | | | 41,342 |
| 1,712 | | Herman Miller Incorporated | | | 40,027 |
| 547 | | Hillenbrand Industries Incorporated | | | 29,620 |
| 1,671 | | HON Industries Incorporated | | | 61,359 |
| 2,674 | | Leggett & Platt Incorporated | | | 61,930 |
| 2,355 | | Newell Rubbermaid Incorporated | | | 55,931 |
| | |
| | | | | | 290,209 |
| | | | |
|
|
48
PORTFOLIOOFINVESTMENTS —AUGUST 31, 2003 (UNAUDITED) | | WELLSFARGOOUTLOOK 2030FUND |
|
| Shares | | Security Name | | Value |
| Common Stock (Continued) | | | |
|
| GENERAL MERCHANDISE STORES — 1.88% |
| 2,036 | | Big Lots Incorporated† | | $ | 37,259 |
| 840 | | BJ’s Wholesale Club Incorporated† | | | 18,346 |
| 3,645 | | Dollar General Corporation | | | 83,580 |
| 1,687 | | Family Dollar Stores Incorporated | | | 67,682 |
| 1,183 | | Federated Department Stores Incorporated | | | 51,697 |
| 2,483 | | JC Penney Company Incorporated | | | 52,689 |
| 2,458 | | May Department Stores Company | | | 67,792 |
| 4,772 | | Mitsukoshi Limited ADR† | | | 130,874 |
| 2,329 | | Saks Incorporated† | | | 29,322 |
| 2,349 | | Sears Roebuck & Company | | | 103,403 |
| 7,197 | | Target Corporation | | | 292,198 |
| 4,438 | | TJX Companies Incorporated | | | 96,127 |
| 33,668 | | Wal-Mart Stores Incorporated | | | 1,992,136 |
| | |
| | | | | | 3,023,105 |
| | | | |
|
|
|
| HEALTH SERVICES — 0.35% |
| 2,590 | | Caremark Rx Incorporated† | | | 65,086 |
| 892 | | Express Scripts Incorporated† | | | 57,811 |
| 1,886 | | First Health Group Corporation† | | | 49,451 |
| 3,824 | | HCA Incorporated | | | 145,274 |
| 3,094 | | Health Management Association Incorporated | | | 68,934 |
| 1,800 | | Laboratory Corporation Of America Holdings† | | | 54,450 |
| 399 | | LifePoint Hospitals Incorporated† | | | 11,495 |
| 2,863 | | Tenet Healthcare Corporation† | | | 45,951 |
| 904 | | Triad Hospitals Incorporated† | | | 29,290 |
| 809 | | Universal Health Services Incorporated Class B† | | | 40,272 |
| | |
| | | | | | 568,014 |
| | | | |
|
|
|
HOLDING & OTHER INVESTMENT
OFFICES — 0.06% |
| 16,926 | | Mitsubishi Tokyo Financial Group ADR | | | 99,356 |
| | | | |
|
|
|
HOME FURNITURE, FURNISHINGS, &
EQUIPMENT STORES — 0.23% |
| 2,592 | | Bed Bath & Beyond Incorporated† | | | 111,533 |
| 2,720 | | Best Buy Company Incorporated† | | | 141,467 |
| 2,892 | | Circuit City Stores Incorporated | | | 30,164 |
| 1,798 | | Pier 1 Imports Incorporated | | | 36,985 |
| 1,822 | | RadioShack Corporation | | | 55,389 |
| | |
| | | | | | 375,538 |
| | | | |
|
|
|
HOTELS, ROOMING HOUSES, CAMPS, &
OTHER LODGE PLACES — 0.29% |
| 11,085 | | Accor SA ADR | | | 215,960 |
| 3,860 | | Hilton Hotels Corporation | | | 58,981 |
| 930 | | Mandalay Resort Group | | | 35,340 |
| 1,670 | | Marriott International Incorporated | | | 68,186 |
| Shares | | Security Name | | Value |
| 1,023 | | MGM MIRAGE | | $ | 37,094 |
| 1,594 | | Starwood Hotels & Resorts Worldwide Incorporated | | | 53,925 |
| | |
| | | | | | 469,486 |
| | | | |
|
|
|
INDUSTRIAL & COMMERCIAL MACHINERY &
COMPUTER EQUIPMENT — 3.77% |
| 2,791 | | 3M Company | | | 397,632 |
| 390 | | American Standard Companies Incorporated† | | | 31,274 |
| 3,864 | | Apple Computer Incorporated† | | | 87,442 |
| 13,872 | | Applied Materials Incorporated† | | | 299,635 |
| 2,999 | | Axcelis Technologies Incorporated† | | | 26,091 |
| 2,174 | | Baker Hughes Incorporated | | | 72,742 |
| 907 | | Black & Decker Corporation | | | 38,801 |
| 2,759 | | Caterpillar Incorporated | | | 198,179 |
| 744 | | CDW Corporation Centers Incorporated† | | | 38,398 |
| 2,138 | | Cirrus Logic Incorporated† | | | 12,016 |
| 55,854 | | Cisco Systems Incorporated† | | | 1,069,604 |
| 574 | | Cooper Cameron Corporation† | | | 27,873 |
| 2,002 | | Deere & Company | | | 113,133 |
| 20,098 | | Dell Computer Corporation† | | | 655,798 |
| 712 | | Diebold Incorporated | | | 34,817 |
| 2,036 | | Dover Corporated | | | 77,409 |
| 554 | | Eaton Corporated | | | 51,877 |
| 20,030 | | EMC Corporation† | | | 255,383 |
| 1,600 | | Emulex Corporation† | | | 38,736 |
| 3,391 | | Gateway Incorporated† | | | 19,566 |
| 2,866 | | Grant Prideco Incorporated† | | | 33,246 |
| 25,516 | | Hewlett-Packard Company | | | 508,279 |
| 915 | | Hitachi Limited ADR | | | 49,996 |
| 1,327 | | Ingersoll-Rand Company Class A | | | 78,983 |
| 3,789 | | Juniper Networks Incorporated† | | | 65,247 |
| 8,810 | | Komatsu Limited ADR | | | 201,147 |
| 1,761 | | Lam Research Corporation† | | | 45,293 |
| 1,055 | | Lexmark International Incorporated† | | | 70,727 |
| 23,527 | | Makita Corporation ADR | | | 207,038 |
| 3,730 | | Maxtor Corporation† | | | 42,634 |
| 15,433 | | NEC Corporation ADR | | | 116,519 |
| 1,741 | | Pall Corporation | | | 43,525 |
| 281 | | Palm Incorporated† | | | 5,128 |
| 1,102 | | Parker-Hannifin Corporation | | | 54,571 |
| 1,359 | | Pitney Bowes Incorporated | | | 53,001 |
| 1,891 | | Quantum Corporation† | | | 5,711 |
| 6,033 | | Siemens AG ADR | | | 375,735 |
| 1,450 | | Smith International Incorporation† | | | 56,681 |
| 798 | | SPX Corporation† | | | 39,381 |
| 954 | | Stanley Works | | | 28,878 |
| 1,448 | | Storage Technology Corporation† | | | 37,083 |
| 3,603 | | Symbol Technologies Incorporated | | | 48,785 |
| 3,769 | | United Technologies Corporation | | | 302,462 |
| 637 | | Varian Medical Systems Incorporated† | | | 35,576 |
| | |
| | | | | | 6,052,032 |
| | | | |
|
|
49
| WELLSFARGOOUTLOOK 2030FUND | | PORTFOLIOOFINVESTMENTS —AUGUST 31, 2003 (UNAUDITED) |
|
| Shares | | Security Name | | Value |
| Common Stock (Continued) |
|
INSURANCE AGENTS, BROKERS &
SERVICE — 0.21% |
| 2,716 | | AON Corporation | | $ | 60,296 |
| 4,303 | | Marsh & Mclennan Companies Incorporated | | | 215,150 |
| 2,110 | | Medco Health Solutions Incorporated† | | | 56,337 |
| | |
| | | | | | 331,783 |
| | | | |
|
|
|
| INSURANCE CARRIERS — 3.22% |
| 1,087 | | 21st Century Insurance Group | | | 15,151 |
| 2,583 | | ACE Limited | | | 83,173 |
| 608 | | AdvancePCS† | | | 24,429 |
| 10,579 | | Aegon NV ADR | | | 131,814 |
| 1,074 | | Aetna Incorporated | | | 61,218 |
| 4,347 | | AFLAC Incorporated | | | 139,147 |
| 204 | | Alleghany Corporation† | | | 40,802 |
| 17,824 | | Allianz AG ADR | | | 159,168 |
| 185 | | Allmerica Financial Corporation† | | | 4,379 |
| 5,216 | | Allstate Corporation | | | 186,472 |
| 863 | | AMBAC Financial Group Incorporated | | | 56,026 |
| 808 | | American Financial Group Incorporated | | | 17,679 |
| 21,735 | | American International Group Incorporated | | | 1,294,754 |
| 231 | | American National Insurance Company | | | 19,864 |
| 369 | | AmerUs Group Company | | | 11,893 |
| 1,183 | | Anthem Incorporated† | | | 86,596 |
| 13,458 | | AXA ADR | | | 239,283 |
| 1,379 | | Chubb Corporation | | | 93,689 |
| 920 | | CIGNA Corporation | | | 43,866 |
| 1,723 | | Cincinnati Financial Corporation | | | 69,523 |
| 2,125 | | Hartford Financial Services Group Incorporated | | | 113,093 |
| 743 | | Health Net Incorporated† | | | 23,650 |
| 741 | | Jefferson-Pilot Corporation | | | 32,804 |
| 1,995 | | John Hancock Financial Services Incorporated | | | 60,907 |
| 1,404 | | Lincoln National Corporation | | | 49,730 |
| 699 | | Loews Corporation | | | 28,771 |
| 175 | | Markel Corporation† | | | 47,031 |
| 1,105 | | MBIA Incorporated | | | 62,388 |
| 782 | | Mercury General Corporation | | | 34,158 |
| 6,090 | | MetLife Incorporated | | | 173,078 |
| 586 | | MGIC Investment Corporation | | | 33,033 |
| 2,912 | | Millea Holdings Incorporated ADR | | | 148,920 |
| 1,339 | | Old Republic International Corporation | | | 44,977 |
| 971 | | Oxford Health Plans Incorporated† | | | 35,199 |
| 624 | | Pacificare Health Systems Incorporated† | | | 31,075 |
| 1,012 | | PMI Group Incorporated | | | 35,805 |
| 2,932 | | Principal Financial Group Incorporated | | | 92,241 |
| Shares | | Security Name | | Value |
| 1,819 | | Progressive Corporation | | $ | 128,676 |
| 1,273 | | Protective Life Corporation | | | 37,032 |
| 4,440 | | Prudential Financial Incorporated | | | 161,660 |
| 1,080 | | Radian Group Incorporated | | | 51,397 |
| 1,400 | | RLI Corporation | | | 46,144 |
| 1,509 | | Safeco Corporation | | | 54,415 |
| 1,869 | | St Paul Companies Incorporated | | | 64,966 |
| 844 | | Torchmark Corporation | | | 34,064 |
| 205 | | Transatlantic Holdings Incorporated | | | 14,491 |
| 6,121 | | Travelers Property Casualty Corporation Class B† | | | 94,814 |
| 287 | | Triad Guaranty Incorporated† | | | 13,337 |
| 4,936 | | UnitedHealth Group Incorporated | | | 243,986 |
| 1,024 | | Unitrin Incorporated | | | 30,331 |
| 2,809 | | UnumProvident Corporation | | | 39,607 |
| 1,384 | | WellPoint Health Networks Incorporated† | | | 107,952 |
| 1,158 | | Xl Capital Limited Class A | | | 87,719 |
| 10,069 | | Zurich Financial Services AG ADR | | | 129,409 |
| | |
| | | | | | 5,165,786 |
| | | | |
|
|
|
| LEATHER & LEATHER PRODUCTS — 0.04% |
| 1,103 | | Coach Incorporated† | | | 64,018 |
| | | | |
|
|
|
LUMBER & WOOD PRODUCTS, EXCEPT
FURNITURE — 0.04% |
| 2,430 | | Georgia-Pacific Corporation | | | 56,303 |
| | | | |
|
|
|
MEASURING, ANALYZING, & CONTROLLING
INSTRUMENTS: PHOTOGRAPHIC, MEDICAL &
OPTICAL GOODS — 2.13% |
| 2,823 | | Advanced Medical Optics Incorporated† | | | 46,833 |
| 5,076 | | Advantest Corporation ADR | | | 88,119 |
| 4,605 | | Agilent Technologies Incorporated† | | | 111,994 |
| 1,060 | | Allergan Incorporated | | | 84,228 |
| 2,984 | | Applera Corporation-Applied Biosystems Group | | | 64,932 |
| 1,009 | | Bausch & Lomb Incorporated | | | 42,539 |
| 4,638 | | Baxter International Incorporated | | | 130,328 |
| 862 | | Beckman Coulter Incorporated | | | 38,230 |
| 2,053 | | Becton Dickinson & Company | | | 75,017 |
| 2,718 | | Biomet Incorporated | | | 80,806 |
| 3,394 | | Boston Scientific Corporation† | | | 203,979 |
| 546 | | C R Bard Incorporated | | | 36,582 |
| 1,265 | | Danaher Corporation | | | 97,721 |
| 1,336 | | Dentsply International Incorporated | | | 58,450 |
| 2,815 | | Eastman Kodak Company | | | 78,510 |
| 6,392 | | Fuji Photo Film Company Limited ADR | | | 192,335 |
| 8,122 | | General Motors Corporation Class H† | | | 121,343 |
| 2,436 | | Guidant Corporation | | | 122,287 |
| 1,293 | | KLA–Tencor Corporation† | | | 76,752 |
50
PORTFOLIOOFINVESTMENTS —AUGUST 31, 2003 (UNAUDITED) | | WELLSFARGOOUTLOOK 2030FUND |
|
| Shares | | Security Name | | Value |
| Common Stock (Continued) | | | |
| 9,795 | | Medtronic Incorporated | | $ | 485,636 |
| 1,872 | | Microchip Technology Incorporated | | | 52,435 |
| 864 | | Millipore Corporation | | | 39,226 |
| 7,432 | | Olympus Optical Company Limited ADR | | | 170,704 |
| 1,048 | | Perkinelmer Incorporation | | | 17,334 |
| 2,634 | | Raytheon Company | | | 84,446 |
| 1,250 | | Ricoh Company Limited ADR | | | 115,000 |
| 2,258 | | Rockwell Automation Incorporated | | | 61,463 |
| 1,405 | | St Jude Medical Incorporated† | | | 73,158 |
| 1,462 | | Steris Corporation† | | | 34,240 |
| 1,603 | | Stryker Corporation | | | 121,507 |
| 1,690 | | Sybron Dental Specialties Incorporated† | | | 40,459 |
| 1,552 | | Tektronix Incorporated† | | | 36,689 |
| 2,207 | | Teradyne Incorporated† | | | 39,351 |
| 2,277 | | Thermo Electron Corporation† | | | 51,893 |
| 951 | | Varian Incorporated† | | | 32,334 |
| 1,443 | | Waters Corporation† | | | 44,012 |
| 7,929 | | Xerox Corporation† | | | 85,475 |
| 1,664 | | Zimmer Holdings Incorporated† | | | 86,095 |
| | |
| | | | | | 3,422,442 |
| | | | |
|
|
|
| MEMBERSHIP ORGANIZATIONS — 0.04% |
| 1,462 | | Career Education Corporation† | | | 65,980 |
| | | | |
|
|
|
| METAL MINING — 0.28% |
| 3,959 | | Newmont Mining Corporation | | | 155,430 |
| 750 | | Phelps Dodge Corporation† | | | 35,993 |
| 2,902 | | Rio Tinto Plc ADR | | | 256,943 |
| | |
| | | | | | 448,366 |
| | | | |
|
|
|
MINING & QUARRYING OF NONMETALLIC
MINERALS, EXCEPT FUELS — 0.11% |
| 5,401 | | Pechiney SA ADR | | | 136,537 |
| 1,050 | | Vulcan Materials Company | | | 43,481 |
| | |
| | | | | | 180,018 |
| | | | |
|
|
|
MISCELLANEOUS MANUFACTURING
INDUSTRIES — 0.36% |
| 1,854 | | Callaway Golf Company | | | 27,866 |
| 2,842 | | Hasbro Incorporated | | | 52,577 |
| 4,114 | | Mattel Incorporated | | | 79,482 |
| 1,476 | | Tiffany & Company | | | 57,446 |
| 17,396 | | Tyco International Limited | | | 358,010 |
| | |
| | | | | | 575,381 |
| | | | |
|
|
|
| MISCELLANEOUS RETAIL — 0.61% |
| 2,197 | | Amazon.Com Incorporated† | | | 102,030 |
| 843 | | Barnes & Noble Incorporated† | | | 22,087 |
| 1,410 | | Borders Group Incorporated† | | | 27,269 |
| 3,747 | | Costco Wholesale Corporation† | | | 120,241 |
| 3,345 | | CVS Corporation | | | 109,047 |
| 1,569 | | Dollar Tree Stores Incorporated† | | | 61,552 |
| 832 | | Michaels Stores Incorporated | | | 37,814 |
| 3,977 | | Office Depot Incorporated† | | | 72,540 |
| 5,406 | | Rite Aid Corporation† | | | 27,300 |
| Shares | | Security Name | | Value |
| 4,714 | | Staples Incorporated† | | $ | 116,106 |
2,437 | | Toys R Us Incorporated† | | | 33,192 |
7,835 | | Walgreen Company | | | 255,186 |
| | |
| | | | | | 984,364 |
| | | | |
|
|
|
| MOTION PICTURES — 0.42% |
| 24,600 | | Liberty Media Corporation† | | | 297,660 |
| 1,377 | | Macrovision Corporation† | | | 25,640 |
| 16,974 | | Walt Disney Company | | | 347,967 |
| | |
| | | | | | 671,267 |
| | | | |
|
|
|
MOTOR FREIGHT TRANSPORTATION &
WAREHOUSING — 0.37% |
| 1,173 | | CNF Incorporated | | | 34,838 |
| 8,827 | | United Parcel Service Incorporated | | | 553,983 |
| | |
| | | | | | 588,821 |
| | | | |
|
|
|
| NON-DEPOSITORY CREDIT INSTITUTIONS — 1.29% |
| 10,650 | | American Express Company | | | 479,782 |
| 2,177 | | Capital One Financial Corporation | | | 116,252 |
| 1,226 | | Countrywide Financial | | | 83,184 |
| 7,573 | | Fannie Mae | | | 490,655 |
| 5,602 | | Freddie Mac | | | 297,746 |
| 11,444 | | MBNA Corporation | | | 267,103 |
| 4,120 | | Orix Corporation ADR | | | 138,020 |
| 3,072 | | Providian Financial Corporation | | | 31,488 |
| 3,666 | | SLM Corporation | | | 147,300 |
| 151 | | Student Loan Corporation | | | 18,567 |
| | |
| | | | | | 2,070,097 |
| | | | |
|
|
|
| OIL & GAS EXTRACTION — 1.91% |
| 1,967 | | Anadarko Petroleum Corporation | | | 85,564 |
| 1,262 | | Apache Corporation | | | 87,053 |
| 15,404 | | BHP Billiton Limited ADR | | | 219,815 |
| 1,519 | | BJ Services Company† | | | 56,765 |
| 1,489 | | Burlington Resources Incorporated | | | 72,097 |
| 2,200 | | Cimarex Energy Company† | | | 47,850 |
| 24 | | Cross Timbers Royalty Trust† | | | 529 |
| 2,270 | | Devon Energy Corporation | | | 117,473 |
| 720 | | Diamond Offshore Drilling | | | 14,544 |
| 4,739 | | ENI SpA ADR | | | 362,012 |
| 1,939 | | ENSCO International Incorporated | | | 54,195 |
| 1,279 | | EOG Resources Incorporated | | | 54,230 |
| 806 | | Equitable Resources Incorporated | | | 31,813 |
| 4,074 | | Halliburton Company | | | 98,509 |
| 765 | | Kerr-McGee Corporation | | | 33,622 |
| 1,478 | | Nabors Industries Limited† | | | 59,342 |
| 1,199 | | Noble Corporation† | | | 43,380 |
| 1,073 | | Noble Energy Incorporated | | | 42,480 |
| 744 | | Occidental Petroleum Corporation | | | 25,542 |
| 1,500 | | Patterson-UTI Energy Incorporated† | | | 44,760 |
| 1,800 | | Pioneer Natural Resources† | | | 45,648 |
| 769 | | Pogo Producing Company | | | 35,343 |
51
| WELLSFARGOOUTLOOK 2030FUND | | PORTFOLIOOFINVESTMENTS —AUGUST 31, 2003 (UNAUDITED) |
|
| Shares | | Security Name | | Value |
| Common Stock (Continued) |
| 13,747 | | Repsol YPF SA | | $ | 232,737 |
| 1,899 | | Rowan Companies Incorporated† | | | 47,551 |
| 3,768 | | Schlumberger Limited | | | 186,554 |
| 6,793 | | Shell Transport & Trading Company plc ADR | | | 261,123 |
| 6,928 | | Total Fina Elf SA ADR | | | 533,525 |
| 2,553 | | Transocean Incorporated† | | | 53,919 |
| 2,913 | | Varco International Incorporated† | | | 50,249 |
| 3,200 | | XTO Energy Incorporated | | | 67,168 |
| | |
| | | | | | 3,065,392 |
| | | | |
|
|
|
| PAPER & ALLIED PRODUCTS — 0.48% |
| 572 | | Bemis Company Incorporated | | | 25,894 |
| 915 | | Boise Cascade Corporation | | | 24,934 |
| 246 | | Bowater Incorporated | | | 10,654 |
| 3,311 | | International Paper Company | | | 134,261 |
| 3,676 | | Kimberly-Clark Corporation | | | 187,880 |
| 1,955 | | MeadWestvaco Corp | | | 49,559 |
| 2,021 | | Pactiv Corporation† | | | 40,582 |
| 1,522 | | Sonoco Products Company | | | 34,656 |
| 9,240 | | Stora Enso Oyj ADR | | | 119,104 |
| 542 | | Temple-Inland Incorporated | | | 26,981 |
| 6,444 | | UPM-Kymmene Oyj ADR | | | 117,152 |
| | |
| | | | | | 771,657 |
| | | | |
|
|
|
| PERSONAL SERVICES — 0.09% |
| 2,149 | | Cintas Corporation | | | 85,809 |
| 1,356 | | H & R Block Incorporated | | | 59,800 |
| | |
| | | | | | 145,609 |
| | | | |
|
|
|
PETROLEUM REFINING & RELATED
INDUSTRIES — 2.78% |
| 928 | | Amerada Hess Corporation | | | 43,758 |
| 16,884 | | BP plc ADR | | | 704,400 |
| 8,767 | | ChevronTexaco Corporation | | | 638,851 |
| 5,142 | | ConocoPhillips | | | 287,129 |
| 54,499 | | Exxon Mobil Corporation | | | 2,054,612 |
| 3,233 | | Marathon Oil Corporation | | | 90,168 |
| 1,088 | | Murphy Oil Corporation | | | 62,810 |
| 9,328 | | Royal Dutch Petroleum Company | | | 418,547 |
| 1,234 | | Sunoco Incorporated | | | 50,137 |
| 1,929 | | Unocal Corporation† | | | 59,066 |
| 1,344 | | Valero Energy Corporation | | | 52,954 |
| | |
| | | | | | 4,462,432 |
| | | | |
|
|
|
| PRIMARY METAL INDUSTRIES — 0.49% |
| 7,205 | | Alcoa Incorporated | | | 205,774 |
| 1,900 | | Allegheny Technologies Incorporated | | | 14,155 |
| 1,550 | | CommScope Incorporated† | | | 15,934 |
| 1,753 | | Engelhard Corporation | | | 49,207 |
| 950 | | Hubbell Incorporated Class B | | | 37,962 |
| 5,333 | | Johnson Matthey plc ADR | | | 165,589 |
| 9,348 | | Kubota Corporation ADR | | | 156,112 |
| 644 | | Nucor Corporation | | | 33,108 |
| 1,100 | | Precision Castparts Corporation | | | 38,940 |
| 2,576 | | Schnitzer Steel Industry Incorporated | | | 63,885 |
| | |
| | | | | | 780,666 |
| | | | |
|
|
| Shares | | Security Name | | Value |
|
PRINTING, PUBLISHING, & ALLIED
INDUSTRIES — 1.31% |
| 1,731 | | American Greetings Corporation Class A† | | $ | 32,024 |
| 2,174 | | Belo Corporation Class A | | | 50,698 |
| 1,013 | | Dow Jones & Company Incorporated | | | 43,022 |
| 2,027 | | Gannett Company Incorporated | | | 158,957 |
| 2,053 | | Harte-Hanks Incorporated | | | 39,007 |
| 3,850 | | Hollinger International Incorporated | | | 48,279 |
| 495 | | Knight-Ridder Incorporated | | | 33,591 |
| 1,390 | | McGraw-Hill Companies Incorporated | | | 84,790 |
| 1,238 | | Meredith Corporated | | | 58,706 |
| 1,226 | | New York Times Company | | | 54,422 |
| 4,826 | | News Corporation Limited ADR | | | 165,773 |
| 11,608 | | Pearson plc ADR | | | 115,500 |
| 1,424 | | Reader's Digest Association Incorporated | | | 17,330 |
| 6,478 | | Reed Elsevier NV ADR | | | 144,459 |
| 1,093 | | Reynolds & Reynolds Company | | | 31,752 |
| 1,416 | | RR Donnelley & Sons Company | | | 35,598 |
| 233 | | Scripps Company (E W) | | | 20,175 |
| 3,318 | | Toppan Printing Company Limited ADR | | | 134,221 |
| 2,663 | | Tribune Company | | | 123,164 |
| 966 | | Valassis Communications Incorporated† | | | 28,381 |
| 14,745 | | Viacom Incorporated Class B | | | 663,525 |
| 40 | | Washington Post Company
Class B | | | 27,841 |
| | |
| | | | | | 2,111,215 |
| | | | |
|
|
|
| RAILROAD TRANSPORTATION — 0.19% |
| 2,616 | | Burlington Northern Santa Fe Corporation | | | 74,163 |
| 1,068 | | CSX Corporation | | | 34,475 |
| 2,413 | | Kansas City Southern† | | | 29,318 |
| 4,045 | | Norfolk Southern Corporation | | | 77,017 |
| 1,371 | | Union Pacific Corporation | | | 83,549 |
| | |
| | | | | | 298,522 |
| | | | |
|
|
|
| REAL ESTATE — 0.04% |
| 979 | | Catellus Development Corporation† | | | 22,958 |
| 305 | | Forest City Enterprises Incorporated Class A | | | 12,993 |
| 800 | | LNR Property Corporation | | | 32,000 |
| | |
| | | | | | 67,951 |
| | | | |
|
|
|
RUBBER & MISCELLANEOUS PLASTICS
PRODUCTS — 0.19% |
| 4,673 | | Bridgestone Corporation | | | 130,162 |
| 1,383 | | Goodyear Tire & Rubber Company | | | 9,847 |
| 2,039 | | Nike Incorporated Class B | | | 116,182 |
| 1,023 | | Sealed Air Corporation† | | | 49,779 |
| | |
| | | | | | 305,970 |
| | | | |
|
|
52
PORTFOLIOOFINVESTMENTS —AUGUST 31, 2003 (UNAUDITED) | | WELLSFARGOOUTLOOK 2030FUND |
|
| Shares | | Security Name | | Value |
| Common Stock (Continued) |
|
SECURITY & COMMODITY BROKERS, DEALERS,
EXCHANGES & SERVICES — 1.58% |
| 1,155 | | AG Edwards Incorporated | | $ | 41,580 |
| 5,752 | | Amvescap plc ADR | | | 92,263 |
| 809 | | Bear Stearns Companies Incorporated | | | 56,614 |
| 13,207 | | Charles Schwab Corporation | | | 143,428 |
| 8,490 | | Credit Suisse Group ADR | | | 267,180 |
| 2,570 | | Franklin Resources Incorporated | | | 110,998 |
| 1,300 | | Gabelli Asset Management Incorporated Class A† | | | 49,010 |
| 3,886 | | Goldman Sachs Group Incorporated | | | 343,872 |
| 3,128 | | Janus Capital Group Incorporated | | | 54,021 |
| 922 | | Legg Mason Incorporated | | | 66,227 |
| 2,030 | | Lehman Brothers Holdings Incorporated | | | 133,432 |
| 7,817 | | Merrill Lynch & Co Incorporated | | | 420,398 |
| 9,251 | | Morgan Stanley | | | 451,356 |
| 1,109 | | Neuberger Berman Incorporated | | | 45,979 |
| 13,200 | | Nomura Holdings Incorporated ADR | | | 193,380 |
| 1,738 | | T Rowe Price Group Incorporated | | | 73,865 |
| | |
| | | | | | 2,543,603 |
| | | | |
|
|
|
STONE, CLAY, GLASS, & CONCRETE
PRODUCTS — 0.43% |
| 655 | | Cabot Microelectronics Corporation† | | | 42,699 |
| 358 | | Centex Construction Products Incorporated | | | 16,058 |
| 8,738 | | Corning Incorporated† | | | 72,089 |
| 5,539 | | Hanson plc ADR | | | 180,294 |
| 10,132 | | Holcim Limited ADR† | | | 200,753 |
| 9,438 | | Lafarge SA ADR | | | 160,068 |
| 2,200 | | Owens-Illinois Incorporated† | | | 25,190 |
| | |
| | | | | | 697,151 |
| | | | |
|
|
|
| TEXTILE MILL PRODUCTS — 0.03% |
| 651 | | Mohawk Industries Incorporated† | | | 47,497 |
| | | | |
|
|
|
| TOBACCO PRODUCTS — 0.68% |
| 15,845 | | Altria Group Incorporated | | | 653,131 |
| 7,261 | | British American Tobacco plc ADR | | | 148,923 |
| 504 | | RJ Reynolds Tobacco Holdings Incorporated | | | 17,212 |
| 2,965 | | Swedish Match AB ADR | | | 201,620 |
| 536 | | Universal Corporation | | | 22,458 |
| 1,567 | | UST Incorporated | | | 52,338 |
| | |
| | | | | | 1,095,682 |
| | | | |
|
|
|
| TRANSPORTATION BY AIR — 0.38% |
| 1,738 | | AMR Corporation† | | | 19,117 |
| 19,419 | | BAA plc ADR | | | 140,065 |
| 1,164 | | Continental Airlines Incorporated† | | | 17,763 |
| 1,209 | | Delta Air Lines Incorporated | | | 15,560 |
| 2,646 | | FedEx Corporation | | | 177,547 |
| 8,953 | | Japan Airlines System ADR | | | 105,506 |
| Shares | | Security Name | | Value |
| 1,185 | | Northwest Airlines Corporation† | | $ | 10,629 |
| 7,565 | | Southwest Airlines Company | | | 129,286 |
| | |
| | | | | | 615,473 |
| | | | |
|
|
|
| TRANSPORTATION EQUIPMENT — 1.95% |
| 2,200 | | Autoliv Incorporated | | | 66,464 |
| 9,714 | | BAE Systems plc ADR | | | 104,944 |
| 7,101 | | Boeing Company | | | 265,506 |
| 1,680 | | Brunswick Corporation | | | 45,326 |
| 7,288 | | DaimlerChrysler AG | | | 278,620 |
| 1,814 | | Dana Corporation | | | 27,972 |
| 5,662 | | Delphi Corporation | | | 51,298 |
| 18,382 | | Fiat SpA ADR | | | 124,814 |
| 16,605 | | Ford Motor Company | | | 191,954 |
| 1,648 | | General Dynamics Corporation | | | 141,909 |
| 4,327 | | General Motors Corporation | | | 177,840 |
| 1,410 | | Genuine Parts Company | | | 45,148 |
| 1,502 | | Goodrich Corporation | | | 39,097 |
| 2,732 | | Harley-Davidson Incorporated | | | 136,108 |
| 1,242 | | Harsco Corporation | | | 48,426 |
| 9,895 | | Honda Motor Company Limited ADR | | | 201,462 |
| 7,751 | | Honeywell International Incorporated | | | 224,701 |
| 816 | | ITT Industries Incorporated | | | 53,105 |
| 621 | | Johnson Controls Incorporated | | | 61,479 |
| 778 | | Lear Corporation† | | | 43,218 |
| 3,234 | | Lockheed Martin Corporation | | | 165,678 |
| 1,128 | | Navistar International Corporation | | | 50,455 |
| 1,003 | | Northrop Grumman Corporation | | | 95,766 |
| 1,168 | | PACCAR Incorporation | | | 99,514 |
| 1,247 | | Textron Incorporated | | | 56,115 |
| 6,126 | | Toyota Motor Corporation ADR | | | 339,319 |
| | |
| | | | | | 3,136,238 |
| | | | |
|
|
|
| TRANSPORTATION SERVICES — 0.04% |
| 1,188 | | GATX Corporation | | | 25,162 |
| 1,619 | | Sabre Holdings Corporation | | | 36,622 |
| | |
| | | | | | 61,784 |
| | | | |
|
|
|
| WATER TRANSPORTATION — 0.16% |
| 2,145 | | Alexander & Baldwin Incorporated | | | 62,806 |
| 5,112 | | Carnival Corporation | | | 176,824 |
| 1,700 | | GulfMark Offshore Incorporated† | | | 23,800 |
| | |
| | | | | | 263,430 |
| | | | |
|
|
|
| WHOLESALE TRADE-DURABLE GOODS — 1.28% |
| 1,794 | | Apogent Technologies Incorporated† | | | 39,180 |
| 1,216 | | Arrow Electronics Incorporated† | | | 25,098 |
| 1,419 | | Avnet Incorporated† | | | 25,613 |
| 23,250 | | Johnson & Johnson | | | 1,152,735 |
| 1,832 | | Kyocera Corporation ADR | | | 116,021 |
| 10,228 | | Mitsubishi Corporation ADR | | | 172,862 |
| 1,301 | | Mitsui & Company Limited ADR | | | 165,891 |
| 9,606 | | Nissan Motor Company Limited ADR | | | 208,450 |
| 1,525 | | Omnicare Incorporated | | | 51,698 |
53
| WELLSFARGOOUTLOOK 2030FUND | | PORTFOLIOOFINVESTMENTS —AUGUST 31, 2003 (UNAUDITED) |
|
| Shares | | Security Name | | Value |
| Common Stock (Continued) |
| 734 | | Tech Data Corporation† | | $ | 24,479 |
| 3,998 | | Visteon Corporation | | | 26,987 |
| 830 | | WW Grainger Incorporated | | | 41,359 |
| | |
| | | | | | 2,050,373 |
| | | | |
|
|
|
WHOLESALE TRADE NON-DURABLE
GOODS — 0.78% |
| 973 | | AmerisourceBergen Corporation | | | 56,639 |
| 591 | | Brown-Forman Corporation Class B | | | 46,713 |
| 3,738 | | Cardinal Health Incorporated | | | 212,804 |
| 1,866 | | Dean Foods Company† | | | 54,207 |
| 2,473 | | McKesson Corporation | | | 80,966 |
| 3,359 | | Safeway Incorporated† | | | 81,993 |
| 2,280 | | Smurfit-Stone Container Corporation† | | | 35,978 |
| 1,833 | | Supervalu Incorporated | | | 44,175 |
| 4,988 | | Sysco Corporation | | | 156,922 |
| 4,612 | | Unilever NV NY Shares | | | 258,180 |
| 6,914 | | Unilever plc ADR | | | 225,533 |
| | |
| | | | | | 1,254,110 |
| | | | |
|
|
TOTAL COMMON STOCK
(Cost $127,880,432) | | | 118,031,562 |
| | | | |
|
|
|
| Real Estate Investment Trust — 0.87% |
| 1,155 | | Alexandria Real Estate Equities Incorporated | | | 53,999 |
| 1,359 | | Apartment Investment & Management Company Class A | | | 52,389 |
| 2,397 | | Archstone-Smith Trust | | | 62,682 |
| 2,923 | | Arden Realty Incorporated | | | 79,359 |
| 968 | | AvalonBay Communities Incorporated | | | 44,915 |
| 762 | | Boston Properties Incorporated | | | 32,728 |
| 2,265 | | CarrAmerica Realty Corporation | | | 63,760 |
| 988 | | CBL & Associates Properties | | | 48,382 |
| 620 | | CenterPoint Properties | | | 39,308 |
| 2,197 | | Crescent Real Estate Incorporated | | | 31,878 |
| 3,124 | | Duke Realty Corporation | | | 86,441 |
| 1,664 | | Equity Office Properties Trust | | | 46,292 |
| 1,463 | | Equity Residential | | | 42,544 |
| 214 | | General Growth Properties Incorporated | | | 14,841 |
| 2,972 | | Highwoods Properties Incorporated | | | 68,207 |
| 3,572 | | Host Marriott Corporation† | | | 35,791 |
| 962 | | iStar Financial Incorporated | | | 35,267 |
| 1,474 | | Kimco Realty Corporation | | | 61,436 |
| 1,410 | | Mack-Cali Realty Corporation | | | 51,888 |
| 1,274 | | Pan Pacific Retail Properties | | | 53,635 |
| 2,800 | | Parkway Properties Incorporated | | | 125,580 |
| 645 | | Public Storage Incorporated | | | 23,794 |
| 1,148 | | Simon Property Group Incorporated | | | 49,031 |
| 3,700 | | Tanger Factory Outlet Centers Incorporated | | | 124,875 |
| 822 | | Rouse Company | | | 32,773 |
| 717 | | Vornado Realty Trust | | | 33,806 |
TOTAL REAL ESTATE INVESTMENT
TRUST (Cost $1,145,521) | | | 1,395,601 |
| | | | |
|
|
| Principal | | Interest
Rate | | Maturity
Date | | Value |
| US Treasury Obligations — 23.77% | | | |
| |
| US TREASURY BONDS — 12.53% | | | |
| $ | 660,000 | | 7.25% | | 5/15/16 | | $ | 806,797 |
| | 3,035,000 | | 8.00% | | 11/15/21 | | | 4,011,536 |
| | 3,255,000 | | 6.25% | | 8/15/23 | | | 3,613,177 |
| | 5,500,000 | | 6.63% | | 2/15/27 | | | 6,417,384 |
| | 3,120,000 | | 6.25% | | 5/15/30 | | | 3,521,457 |
| | 1,710,000 | | 5.38% | | 2/15/31 | | | 1,746,738 |
| | | |
| | | | | | | | | 20,117,089 |
| | | | | | |
|
| |
| US TREASURY NOTES — 11.24% | | | |
| | 2,680,000 | | 6.50% | | 5/15/05 | | | 2,893,145 |
| | 2,680,000 | | 7.00% | | 7/15/06 | | | 3,015,943 |
| | 2,500,000 | | 6.00% | | 8/15/09 | | | 2,800,390 |
| | 1,410,000 | | 5.75% | | 8/15/10 | | | 1,559,151 |
| | 750,000 | | 5.00% | | 8/15/11 | | | 789,609 |
| | 970,000 | | 3.00% | | 11/15/07 | | | 965,112 |
| | 3,140,000 | | 4.00% | | 11/15/12 | | | 3,044,572 |
| | 960,000 | | 3.00% | | 2/15/08 | | | 949,837 |
| | 185,000 | | 1.50% | | 2/28/05 | | | 184,718 |
| | 1,845,000 | | 1.63% | | 4/30/05 | | | 1,842,044 |
| | | |
| | | | | | | | | 18,044,521 |
| | | | | | |
|
TOTAL US TREASURY OBLIGATIONS
(Cost $39,724,605) | | | 38,161,610 |
| | | | | | |
|
| Short Term Investments — 1.61% | | | |
| US TREASURY BILLS — 1.61% | | | |
| | 45,000 | | 0.90%^ | | 10/16/03 | | | 44,946 |
| | 618,000 | | 0.89%^ | | 10/16/03 | | | 617,298 |
| | 495,000 | | 0.90%^ | | 10/16/03 | | | 494,456 |
| | 76,000 | | 0.90%^ | | 10/16/03 | | | 75,916 |
| | 204,000 | | 0.92%^ | | 10/16/03 | | | 203,771 |
| | 16,000 | | 0.92%^ | | 10/16/03 | | | 15,982 |
| | 41,000 | | 0.91%^ | | 10/16/03 | | | 40,954 |
| | 293,000 | | 0.90%^ | | 10/16/03 | | | 292,679 |
| | 90,000 | | 0.88%^ | | 10/16/03 | | | 89,894 |
| | 38,000 | | 0.91%^ | | 10/16/03 | | | 37,958 |
| | 201,000 | | 0.91%^ | | 10/16/03 | | | 200,763 |
| | 303,000 | | 0.90%^ | | 10/16/03 | | | 302,667 |
| | 92,000 | | 0.91%^ | | 10/16/03 | | | 91,892 |
| | 76,000 | | 0.89%^ | | 10/16/03 | | | 75,911 |
TOTAL SHORT TERM INVESTMENTS
(Cost $2,585,156) | | | 2,585,087 |
| | | | | | | |
|
|
TOTAL INVESTMENT IN
SECURITIES (Cost $171,335,714) | | 99.75% | | $ | 160,173,860 |
| | |
Other Assets and Liabilities,
Net | | 0.25 | | | 401,625 |
| | | | | |
| |
|
|
| TOTAL NET ASSETS | | 100.00% | | $ | 160,575,485 |
| | | | | |
| |
|
|
| (a) | Security Fair Valued in accordance with the procedures approved by the Board of Trustees. |
| † | Non-income earning securities. |
| ‡ | Security of an affiliate of the fund with a cost of $584,079 |
The accompanying notes are an integral part of these financial statements.
54
PORTFOLIOOFINVESTMENTS —AUGUST 31, 2003 (UNAUDITED) | | WELLSFARGOOUTLOOK 2040FUND |
|
| Shares | | Security Name | | Value |
| Common Stock — 84.05% |
|
| AGRICULTURAL PRODUCTION CROPS — 0.05% |
| 5,239 | | Tate & Lyle plc ADR | | $ | 117,175 |
| | | | |
|
|
|
| AMUSEMENT & RECREATION SERVICES — 0.26% |
| 1,841 | | Harrah’s Entertainment Incorporated | | | 76,254 |
| 5,552 | | International Game Technology | | | 143,464 |
| 9,496 | | Park Place Entertainment Corporation† | | | 83,375 |
| 21,180 | | Rank Group plc ADR | | | 192,336 |
| 1,874 | | Westwood One Incorporated† | | | 60,155 |
| | |
| | | | | | 555,584 |
| | | | |
|
|
|
| APPAREL & ACCESSORY STORES — 0.43% |
| 2,276 | | Abercrombie & Fitch Company Class A† | | | 69,281 |
| 12,666 | | Gap Incorporated | | | 264,593 |
| 4,159 | | Kohl’s Corporation† | | | 263,057 |
| 8,280 | | Limited Brands | | | 140,429 |
| 3,018 | | Nordstrom Incorporated | | | 78,679 |
| 2,220 | | Ross Stores Incorporated | | | 111,844 |
| | |
| | | | | | 927,883 |
| | | | |
|
|
|
APPAREL & OTHER FINISHED PRODUCTS MADE
FROM FABRICS & SIMILAR MATERIALS — 0.41% |
| 12,425 | | Benetton Group SpA ADR | | | 253,222 |
| 2,452 | | Jones Apparel Group Incorporated | | | 75,742 |
| 2,986 | | Liz Claiborne Incorporated | | | 102,927 |
| 2,139 | | VF Corporation | | | 85,774 |
| 9,537 | | Wacoal Corporation ADR | | | 376,044 |
| | |
| | | | | | 893,709 |
| | | | |
|
|
|
AUTOMOTIVE DEALERS & GASOLINE SERVICE
STATIONS — 0.14% |
| 200 | | Advance Auto Parts Incorporated† | | | 14,930 |
| 5,530 | | AutoNation Incorporated† | | | 103,908 |
| 1,391 | | AutoZone Incorporated† | | | 127,694 |
| 1,625 | | CarMax Incorporated | | | 62,644 |
| | |
| | | | | | 309,176 |
| | | | |
|
|
|
BUILDING CONSTRUCTION-GENERAL
CONTRACTORS & OPERATIVE BUILDERS — 0.47% |
| 18 | | Cavco Industries Incorporated† | | | 344 |
| 372 | | Centex Corporation | | | 28,056 |
| 3,522 | | DR Horton Incorporated | | | 109,605 |
| 1,272 | | Lennar Corporation Class A | | | 85,542 |
| 127 | | Lennar Corporation Class B | | | 8,223 |
| 222 | | NVR Incorporated† | | | 96,237 |
| 172 | | Pulte Homes, Incorporated. | | | 11,448 |
| 46,674 | | Sekisui House Limited ADR | | | 410,017 |
| 12,129 | | Vivendi Universal SA ADR† | | | 204,980 |
| 1,547 | | William Lyon Homes Incorporated† | | | 57,780 |
| | |
| | | | | | 1,012,232 |
| | | | |
|
|
| Shares | | Security Name | | Value |
|
BUILDING MATERIALS, HARDWARE, GARDEN
SUPPY, & MOBILE HOME DEALERS — 0.76% |
| 1,797 | | Fastenal Company | | $ | 72,653 |
| 28,841 | | Home Depot Incorporated | | | 927,527 |
| 9,976 | | Lowe's Companies Incorporated | | | 547,283 |
| 3,140 | | Sherwin-Williams Company | | | 94,451 |
| | |
| | | | | | 1,641,914 |
| | | | |
|
|
|
| BUSINESS SERVICES — 6.14% |
| 14,331 | | 3Com Corporation† | | | 81,687 |
| 14,635 | | Adecco SA ADR | | | 185,864 |
| 3,117 | | Adobe Systems Incorporated | | | 121,033 |
| 1,155 | | Affiliated Computer Services Incorporated† | | | 57,300 |
| 4,791 | | Akamai Technologies Incorporated† | | | 19,931 |
| 57,955 | | AOL Time Warner Incorporated† | | | 948,144 |
| 1,746 | | Ascential Software Corporation† | | | 30,555 |
| 3,888 | | Autodesk Incorporated | | | 69,595 |
| 7,383 | | Automatic Data Processing Incorporated | | | 294,656 |
| 658 | | Avocent Corporation† | | | 19,214 |
| 6,995 | | BEA Systems Incorporated† | | | 94,782 |
| 3,917 | | BMC Software Incorporated† | | | 57,502 |
| 4,248 | | Business Objects SA ADR† | | | 114,823 |
| 5,094 | | Cadence Design Systems Incorporated† | | | 72,437 |
| 14,382 | | Cendant Corporation† | | | 258,588 |
| 4,638 | | Ceridian Corporation† | | | 90,163 |
| 1,967 | | Checkfree Corporation† | | | 45,202 |
| 1,951 | | ChoicePoint Incorporated† | | | 76,577 |
| 3,050 | | Citrix Systems Incorporated† | | | 62,800 |
| 1,630 | | Cognex Corporation | | | 49,976 |
| 7,403 | | Computer Associates International Incorporated | | | 189,739 |
| 2,411 | | Computer Sciences Corporation† | | | 102,636 |
| 8,567 | | Compuware Corporation† | | | 50,974 |
| 7,925 | | Concord EFS Incorporated† | | | 109,761 |
| 3,268 | | Convergys Corporation† | | | 58,824 |
| 2,363 | | CSG Systems International Incorporated† | | | 36,674 |
| 3,024 | | CSK Corporation ADR | | | 96,163 |
| 1,801 | | Deluxe Corporation | | | 76,903 |
| 1,788 | | DST Systems Incorporated† | | | 70,805 |
| 8,282 | | eBay Incorporated† | | | 459,899 |
| 2,507 | | Echelon Corporation† | | | 37,279 |
| 1,901 | | Electronic Arts Incorporated† | | | 170,615 |
| 6,208 | | Electronic Data Systems Corporation | | | 135,521 |
| 2,697 | | Equifax Incorporated | | | 61,869 |
| 3,604 | | eUniverse Incorporated† (a) | | | 6,415 |
| 287 | | Factset Research Systems Incorporated | | | 13,934 |
| 420 | | Fair Isaac Corporation | | | 24,612 |
| 9,261 | | First Data Corporation | | | 355,622 |
| 2,736 | | Fiserv Incorporated† | | | 106,294 |
| 297 | | Gtech Holdings Corporation | | | 12,587 |
| 233 | | Hudson Highland Group Incorporated† | | | 4,865 |
55
| WELLSFARGOOUTLOOK 2040FUND | | PORTFOLIOOFINVESTMENTS —AUGUST 31, 2003 (UNAUDITED) |
|
| Shares | | Security Name | | Value |
| Common Stock (Continued) |
| 4,906 | | IMS Health Incorporated | | $ | 95,520 |
| 5,884 | | Interpublic Group of Companies Incorporated | | | 89,143 |
| 2,728 | | Intuit Incorporated† | | | 123,633 |
| 2,031 | | Iron Mountain Incorporated† | | | 75,147 |
| 15,580 | | Kidde plc ADR | | | 239,044 |
| 1,920 | | Lamar Advertising Company† | | | 64,147 |
| 822 | | Manhattan Associates Incorporated† | | | 24,356 |
| 2,233 | | Manpower Incorporated | | | 86,886 |
| 1,537 | | Mercury Interactive Corporation† | | | 67,459 |
| 3,381 | | Micromuse Incorporated† | | | 27,657 |
| 132,573 | | Microsoft Corporation | | | 3,515,836 |
| 2,152 | | Monster Worldwide Incorporated† | | | 58,793 |
| 1,676 | | NCR Corporation† | | | 48,621 |
| 4,248 | | Netegrity Incorporated† | | | 41,078 |
| 3,800 | | Network Associates Incorporated† | | | 52,896 |
| 7,289 | | Novell Incorporated† | | | 36,664 |
| 2,147 | | Omnicom Group Incorporated | | | 167,681 |
| 66,000 | | Oracle Corporation† | | | 843,480 |
| 6,592 | | Parametric Technology† | | | 21,951 |
| 4,876 | | PeopleSoft Incorporated† | | | 88,256 |
| 6,314 | | Publicis Groupe ADR | | | 186,263 |
| 2,087 | | RealNetworks Incorporated† | | | 13,190 |
| 187 | | Rent-A-Center, Incorporated† | | | 15,029 |
| 8,243 | | Rentokil Initial plc ADR | | | 136,903 |
| 4,475 | | Reuters Group plc ADR | | | 105,700 |
| 4,386 | | Robert Half International Incorporated† | | | 97,545 |
| 11,438 | | SAP AG ADR | | | 342,454 |
| 2,069 | | Serena Software Incorporated† | | | 40,139 |
| 7,776 | | Siebel Systems Incorporated† | | | 78,382 |
| 48,577 | | Sun Microsystems Incorporated† | | | 187,507 |
| 4,407 | | Sungard Data Systems Incorporated† | | | 124,277 |
| 2,433 | | Sybase Incorporated† | | | 41,142 |
| 2,166 | | Symantec Corporation† | | | 124,393 |
| 1,184 | | Synopsys Incorporated† | | | 80,761 |
| 1,416 | | TIBCO Software Incorporated† | | | 7,576 |
| 1,672 | | Total System Services Incorporated | | | 42,201 |
| 6,173 | | Unisys Corporation† | | | 80,126 |
| 4,835 | | VeriSign Incorporated† | | | 72,380 |
| 5,401 | | Veritas Software Corporation† | | | 186,226 |
| 3,143 | | Viad Corporation | | | 75,055 |
| 7,630 | | WebMD Corporation† | | | 78,582 |
| 3,958 | | WPP Group plc ADR | | | 181,633 |
| 8,031 | | Yahoo! Incorporated† | | | 268,235 |
| | |
| | | | | | 13,266,767 |
| | | | |
|
|
|
| CHEMICALS & ALLIED PRODUCTS — 9.01% |
| 19,378 | | Abbott Laboratories | | | 780,933 |
| 2,840 | | Air Products & Chemicals Incorporated | | | 134,389 |
| Shares | | Security Name | | Value |
| 1,804 | | Alberto-Culver Company Class B | | $ | 102,972 |
| 15,631 | | Amgen Incorporated† | | | 1,030,083 |
| 14,756 | | AstraZeneca plc ADR | | | 585,075 |
| 7,374 | | Aventis SA ADR | | | 361,326 |
| 1,147 | | Avery Dennison Corporation | | | 62,798 |
| 3,213 | | Avon Products Incorporated | | | 205,953 |
| 2,187 | | Biogen Incorporated† | | | 86,299 |
| 23,577 | | Bristol-Myers Squibb Company | | | 598,148 |
| 1,854 | | Cabot Corporation | | | 50,410 |
| 3,998 | | Centerpulse ADR | | | 110,025 |
| 2,761 | | Chiron Corporation† | | | 140,314 |
| 3,048 | | Clorox Company | | | 130,607 |
| 6,489 | | Colgate-Palmolive Company | | | 358,712 |
| 11,556 | | Dow Chemical Company | | | 399,029 |
| 11,423 | | E I Du Pont De Nemours & Company | | | 511,065 |
| 1,189 | | Eastman Chemical Company | | | 42,578 |
| 4,257 | | Ecolab Incorporated | | | 109,788 |
| 6,341 | | Eisai Company Limited ADR | | | 132,602 |
| 13,911 | | Eli Lilly & Company | | | 925,499 |
| 2,691 | | Estee Lauder Companies Incorporated | | | 92,813 |
| 5,051 | | Forest Laboratories Incorporated† | | | 237,397 |
| 3,418 | | Genentech Incorporated† | | | 271,389 |
| 3,052 | | Genzyme Corporation–General Division † | | | 143,902 |
| 3,075 | | Gilead Sciences Incorporated† | | | 205,103 |
| 12,164 | | Gillette Company | | | 394,843 |
| 23,747 | | GlaxoSmithKline plc ADR | | | 922,096 |
| 1,727 | | Great Lakes Chemical Corporation | | | 36,595 |
| 2,804 | | ICN Pharmaceuticals Incorporated | | | 49,070 |
| 2,061 | | IDEC Pharmaceuticals Corporation† | | | 71,620 |
| 4,049 | | IMC Global Incorporated | | | 31,704 |
| 2,494 | | International Flavors & Fragrances Incorporated | | | 78,561 |
| 1,600 | | Invitrogen Corporation† | | | 92,272 |
| 3,871 | | IVAS Corporation† | | | 76,646 |
| 9,541 | | Kazoo Nobel NV ADR | | | 311,323 |
| 4,740 | | King Pharmaceuticals Incorporated† | | | 66,597 |
| 3,821 | | Lyondell Chemical Company | | | 54,640 |
| 270 | | Medicis Pharmaceutical Corporation Class A | | | 16,492 |
| 3,773 | | MedImmune Incorporated† | | | 131,565 |
| 27,632 | | Merck & Company Incorporated | | | 1,390,442 |
| 3,826 | | Mylan Laboratories Incorporated | | | 139,266 |
| 22,965 | | Novartis AG ADR | | | 849,016 |
| 4,984 | | Novo Nordisk AS ADR | | | 178,178 |
| 1,271 | | NPS Pharmaceuticals Incorporated† | | | 34,902 |
| 1,326 | | OSI Pharmaceuticals Incorporated† | | | 50,521 |
| 97,968 | | Pfizer Incorporated | | | 2,931,203 |
| 2,167 | | PPG Industries Incorporated | | | 118,990 |
| 1,960 | | Praxair Incorporated | | | 125,087 |
56
PORTFOLIOOFINVESTMENTS —AUGUST 31, 2003 (UNAUDITED) | | WELLSFARGOOUTLOOK 2040FUND |
|
| Shares | | Security Name | | Value |
| Common Stock (Continued) |
| 15,118 | | Procter & Gamble Company | | $ | 1,319,650 |
| 6,857 | | Roche Holding AG ADR | | | 525,093 |
| 3,404 | | Rohm and Haas Company | | | 123,667 |
| 18,731 | | Schering-Plough Corporation | | | 284,524 |
| 1,970 | | Sepracor Incorporated† | | | 53,032 |
| 27,000 | | Shiseido Company Limited | | | 282,542 |
| 1,627 | | Sigma-Aldrich Corporation | | | 89,078 |
| 232 | | Valspar Corporation | | | 10,781 |
| 2,743 | | Vertex Pharmaceuticals Incorporated† | | | 34,562 |
| 2,201 | | Watson Pharmaceuticals Incorporated† | | | 90,461 |
| 16,349 | | Wyeth | | | 700,554 |
| | |
| | | | | | 19,474,782 |
| | | | |
|
|
|
| COMMUNICATIONS — 4.80% |
| 3,252 | | Alltel Corporation | | | 148,942 |
| 5,562 | | American Tower Corporation Class A† | | | 63,296 |
| 10,593 | | AT&T Corporation | | | 236,224 |
| 36,769 | | AT&T Wireless Services Incorporated† | | | 316,949 |
| 6,507 | | Avaya Incorporated† | | | 67,998 |
| 22,012 | | BellSouth Corporation | | | 554,702 |
| 4,312 | | British Sky Broadcasting Group plc ADR† | | | 183,174 |
| 8,885 | | BT Group plc ADR† | | | 260,775 |
| 1,850 | | Cablevision Systems Corporation† | | | 37,278 |
| 2,354 | | CenturyTel Incorporated | | | 81,825 |
| 2,093 | | Certegy Incorporated† | | | 63,313 |
| 7,928 | | Clear Channel Communications Incorporated† | | | 357,711 |
| 50,697 | | Comcast Corporation† | | | 1,508,236 |
| 2,621 | | COX Communications Incorporated† | | | 85,759 |
| 4,599 | | Crown Castle International Corporation† | | | 49,439 |
| 22,450 | | Deutsche Telekom AG ADR | | | 321,933 |
| 743 | | Entercom Communications Corporation† | | | 37,395 |
| 3,652 | | Extreme Networks Incorporated† | | | 25,162 |
| 3,607 | | Foundry Networks Incorporated† | | | 70,156 |
| 2,430 | | Fox Entertainment Group Incorporated Class A† | | | 76,739 |
| 5,525 | | France Telecom SA ADR | | | 137,020 |
| 2,208 | | Hispanic Broadcasting Corporation† | | | 69,331 |
| 4,130 | | Interactive Corporation† | | | 152,851 |
| 3,934 | | Lagardere SCA ADR | | | 178,726 |
| 8,169 | | Level 3 Communications Incorporated† | | | 41,008 |
| 13,230 | | Nextel Communications Incorporated† | | | 255,074 |
| 7,799 | | Nippon Telegraph And Telephone Corporation ADR | | | 173,060 |
| Shares | | Security Name | | Value |
| 7,817 | | NTT Docomo Incorporated ADR† | | $ | 202,226 |
| 932 | | PanAmSat Corporation† | | | 14,735 |
| 20,815 | | Qwest Communications International Incorporated† | | | 92,627 |
| 3,134 | | Radio One Incorporated Class D† | | | 51,554 |
| 4,534 | | Reed Elsevier plc ADR | | | 142,594 |
| 41,166 | | SBC Communications Incorporated | | | 925,823 |
| 12,984 | | Sprint Corporation (FON Group) | | | 191,774 |
| 15,779 | | Sprint Corporation (PCS Group)† | | | 81,893 |
| 10,504 | | TDC A/S ADR | | | 157,035 |
| 15,689 | | Telefonica SA ADR† | | | 556,960 |
| 802 | | Telephone & Data Systems Incorporated | | | 46,051 |
| 3,443 | | Univision Communications Incorporated Class A† | | | 129,078 |
| 33,609 | | Verizon Communications Incorporated | | | 1,187,070 |
| 53,887 | | Vodafone Group plc ADR | | | 986,132 |
| 2,676 | | Western Wireless Corporation† | | | 49,453 |
| | |
| | | | | | 10,369,081 |
| | | | |
|
|
|
| DEPOSITORY INSTITUTIONS — 10.31% |
| 20,017 | | ABN Amro Holding NV ADR | | | 353,100 |
| 10,675 | | Allied Irish Banks plc ADR | | | 299,754 |
| 7,636 | | AmSouth Bancorporation | | | 164,479 |
| 3,166 | | Associated Banc-Corp | | | 120,846 |
| 1,902 | | Astoria Financial Corporation | | | 61,130 |
| 39,191 | | Banco Bilbao Vizcaya Argentaria SA ADR | | | 421,303 |
| 15,428 | | Banco Comercial Portugues SA ADR | | | 136,538 |
| 64,823 | | Banco Santander Central Hispano SA ADR | | | 556,181 |
| 18,190 | | Bank of America Corporation | | | 1,441,558 |
| 120,000 | | Bank of East Asia Limited ADR | | | 283,104 |
| 9,728 | | Bank of New York Company Incorporated | | | 286,198 |
| 13,683 | | Bank One Corporation | | | 540,068 |
| 4,923 | | Banknorth Group Incorporated | | | 138,336 |
| 15,985 | | Barclays plc ADR | | | 472,836 |
| 8,318 | | Bayerische Hypo-Und Vereinsbank AG ADR† | | | 129,953 |
| 7,569 | | BB&T Corporation | | | 276,420 |
| 16,440 | | BNP Paribas SA ADR | | | 409,542 |
| 4,156 | | Camden National Corporation | | | 117,407 |
| 3,077 | | Capitol Federal Financial | | | 87,202 |
| 3,974 | | Cascade Bancorp | | | 71,611 |
| 2,827 | | Charter One Financial Incorporated | | | 87,637 |
| 3,772 | | Chittenden Corporation | | | 108,784 |
| 63,961 | | Citigroup Incorporated | | | 2,772,709 |
| 1,309 | | Comerica Incorporated | | | 64,586 |
| 443 | | Commerce Bancorp Incorporated | | | 17,942 |
57
| WELLSFARGOOUTLOOK 2040FUND | | PORTFOLIOOFINVESTMENTS —AUGUST 31, 2003 (UNAUDITED) |
|
| Shares | | Security Name | | Value |
| Common Stock (Continued) |
| 2,441 | | Commerce Bancshares Incorporated | | $ | 105,891 |
| 3,707 | | Compass Bancshares Incorporated | | | 127,447 |
| 6,003 | | Deutsche Bank Ag | | | 349,615 |
| 7,189 | | Fifth Third Bancorp | | | 421,275 |
| 5,702 | | First National Corporation | | | 155,950 |
| 2,215 | | First Tennessee National Corporation | | | 91,590 |
| 3,144 | | Flagstar Bancorp Incorporated | | | 61,402 |
| 13,523 | | FleetBoston Financial Corporation | | | 400,146 |
| 1,710 | | Golden West Financial Corporation | | | 147,522 |
| 1,270 | | GreenPoint Financial Corporation | | | 43,028 |
| 11,800 | | HBOS plc ADR | | | 394,198 |
| 18,326 | | HSBC Holdings plc ADR | | | 1,178,728 |
| 6,763 | | Huntington Bancshares Incorporated | | | 135,260 |
| 2,101 | | InDyMac Bancorp Incorporated | | | 48,449 |
| 18,464 | | ING Groep NV ADR | | | 364,295 |
| 5,348 | | Interchange Financial Services Corporation | | | 117,121 |
| 25,665 | | JP Morgan Chase & Company | | | 878,256 |
| 10,842 | | Lloyds TSB Group plc ADR | | | 286,554 |
| 1,628 | | M&T Bank Corporation | | | 137,143 |
| 4,729 | | Marshall & Ilsley Corporation | | | 146,599 |
| 4,403 | | Mellon Financial Corporation | | | 138,034 |
| 2,710 | | Mercantile Bankshares Corporation | | | 110,704 |
| 4,293 | | National Australia Bank ADR | | | 434,022 |
| 8,177 | | National City Corporation | | | 259,047 |
| 2,925 | | National Commerce Financial | | | 73,125 |
| 2,339 | | North Fork Bancorporation Incorporated | | | 78,988 |
| 2,547 | | Northern Trust Corporation | | | 107,585 |
| 2,524 | | PNC Financial Services Group | | | 120,142 |
| 4,092 | | Popular Incorporated | | | 154,187 |
| 3,268 | | Regions Financial Corporation | | | 115,230 |
| 22,789 | | San Paolo-IMI SPA | | | 439,828 |
| 4,730 | | Seacoast Banking Corporation | | | 82,964 |
| 21,036 | | Societe Generale ADR | | | 278,992 |
| 6,328 | | SouthTrust Corporation | | | 183,449 |
| 8,100 | | Sovereign Bancorp Incorporated | | | 159,408 |
| 3,872 | | State Street Corporation | | | 170,174 |
| 32,598 | | Sumitomo Mitsui Financial | | | 113,708 |
| 3,433 | | SunTrust Banks Incorporated | | | 209,859 |
| 2,200 | | SY Bancorp Incorporated | | | 88,000 |
| 4,338 | | Synovus Financial Corporation | | | 106,064 |
| 59 | | TCF Financial Corporation | | | 2,713 |
| 5,705 | | UCBH Holdings Incorporated | | | 182,503 |
| 2,942 | | Union Planters Corporation | | | 93,850 |
| 1,339 | | UnionBanCal Corporation | | | 62,866 |
| 25,351 | | US Bancorp | | | 605,889 |
| 16,857 | | Wachovia Corporation | | | 710,523 |
| 10,831 | | Washington Mutual Incorporated | | | 422,192 |
| Shares | | Security Name | | Value |
| 20,023 | | Wells Fargo & Company ‡ | | $ | 1,003,953 |
| 11,434 | | Westpac Banking Corporation ADR | | | 584,735 |
| 2,581 | | Wilmington Trust Corporation | | | 82,437 |
| 1,513 | | Zions Bancorporation | | | 84,275 |
| | |
| | | | | | 22,269,139 |
| | | | |
|
|
|
| EATING & DRINKING PLACES — 0.37% |
| 453 | | Brinker International Incorporated† | | | 15,493 |
| 343 | | CEC Entertainment Incorporated† | | | 13,452 |
| 3,745 | | Darden Restaurants Incorporated | | | 81,641 |
| 16,640 | | McDonald’s Corporation | | | 373,069 |
| 2,635 | | Outback Steakhouse Incorporated | | | 101,843 |
| 2,487 | | Wendy’s International Incorporated | | | 78,465 |
| 4,302 | | Yum! Brands Incorporated† | | | 127,554 |
| | |
| | | | | | 791,517 |
| | | | |
|
|
|
| EDUCATIONAL SERVICES — 0.11% |
| 3,140 | | Apollo Group Incorporated Class A† | | | 201,180 |
| 716 | | Career Education Corporation† | | | 32,313 |
| | |
| | | | | | 233,493 |
| | | | |
|
|
|
| ELECTRIC, GAS, & SANITARY SERVICES — 2.98% |
| 8,509 | | AES Corporation† | | | 55,138 |
| 4,686 | | Allied Waste Industries Incorporated† | | | 51,827 |
| 3,415 | | Ameren Corporation | | | 145,138 |
| 5,316 | | American Electric Power Company Incorporated | | | 150,496 |
| 11,700 | | BG Group plc ADR | | | 255,177 |
| 4,534 | | Calpine Corporation† | | | 25,572 |
| 6,192 | | CenterPoint Energy Incorporated | | | 52,570 |
| 4,047 | | Cinergy Corporation | | | 138,488 |
| 6,843 | | Citizens Communications Company† | | | 78,010 |
| 3,903 | | Consolidated Edison Incorporated | | | 154,286 |
| 3,642 | | Constellation Energy Group Incorporated | | | 132,532 |
| 4,152 | | Dominion Resources Incorporated | | | 251,528 |
| 2,955 | | DTE Energy Company | | | 103,159 |
| 12,047 | | Duke Energy Corporation | | | 205,763 |
| 6,865 | | E.ON AG ADR | | | 356,568 |
| 6,093 | | Edison International† | | | 114,914 |
| 2,784 | | El Paso Corporation | | | 20,435 |
| 20,596 | | Endesa SA ADR | | | 322,327 |
| 3,496 | | Entergy Corporation | | | 183,365 |
| 4,684 | | Exelon Corporation | | | 275,888 |
| 5,495 | | FirstEnergy Corporation | | | 160,784 |
| 2,863 | | FPL Group Incorporated | | | 177,105 |
| 336 | | Hawaiian Electric Industries Incorporated | | | 14,441 |
58
PORTFOLIOOFINVESTMENTS —AUGUST 31, 2003 (UNAUDITED) | | WELLSFARGOOUTLOOK 2040FUND |
|
| Shares | | Security Name | | Value |
| Common Stock (Continued) |
| 110,000 | | Hong Kong Electric Holdings Limited ADR | | $ | 434,390 |
| 5,430 | | International Power plc ADR† | | | 130,266 |
| 2,189 | | Kinder Morgan Incorporated | | | 116,564 |
| 7,520 | | National Grid Transco plc ADR | | | 231,992 |
| 1,623 | | Nicor Incorporated | | | 55,166 |
| 4,663 | | NiSource Incorporated | | | 90,182 |
| 500 | | Nstar | | | 22,300 |
| 6,646 | | PG&E Corporation† | | | 147,342 |
| 1,674 | | Pinnacle West Capital Corporation | | | 57,418 |
| 3,463 | | PPL Corporation | | | 137,377 |
| 2,927 | | Progress Energy Incorporated | | | 118,514 |
| 3,078 | | Public Service Enterprise Group Incorporated | | | 130,323 |
| 4,883 | | Reliant Resources Incorporated† | | | 22,559 |
| 3,371 | | Republic Services Incorporated† | | | 82,994 |
| 6,949 | | RWE AG ADR | | | 187,299 |
| 9,845 | | Scottish Power plc ADR | | | 232,342 |
| 4,308 | | Sempra Energy | | | 128,163 |
| 9,496 | | Southern Company | | | 269,496 |
| 309 | | Texas Genco Holdings Incorporated | | | 7,571 |
| 4,592 | | TXU Corporation | | | 101,024 |
| 6,812 | | Waste Management Incorporated | | | 181,267 |
| 4,790 | | Williams Companies Incorporated | | | 43,733 |
| 6,520 | | Xcel Energy Incorporated | | | 95,519 |
| | |
| | | | | | 6,449,312 |
| | | | |
|
|
|
ELECTRONIC & OTHER ELECTRICAL
EQUIPMENT & COMPONENTS, EXCEPT
COMPUTER EQUIPMENT — 7.83% |
| 2,892 | | Advanced Fibre Communications Incorporated† | | | 67,297 |
| 7,326 | | Advanced Micro Devices Incorporated† | | | 82,711 |
| 17,193 | | Alcatel SA ADR | | | 187,232 |
| 5,407 | | Altera Corporation† | | | 121,333 |
| 4,723 | | American Power Conversion Corporation | | | 84,636 |
| 2,897 | | Amkor Technology Incorporated† | | | 50,929 |
| 4,429 | | Analog Devices Incorporated† | | | 181,589 |
| 2,224 | | Andrew Corporation† | | | 27,533 |
| 6,538 | | Applied Micro Circuits Corporation† | | | 37,986 |
| 7,046 | | ASML Holding NV NY Shares† | | | 112,031 |
| 1,562 | | AVX Corporation | | | 21,837 |
| 4,035 | | Broadcom Corporation† | | | 110,882 |
| 6,884 | | Canon Incorporated ADR | | | 333,599 |
| 6,102 | | Chartered Semiconductor† | | | 40,090 |
| 8,531 | | CIENA Corporation† | | | 55,452 |
| 3,509 | | Comverse Technology Incorporated† | | | 57,863 |
| Shares | | Security Name | | Value |
| 8,883 | | Conexant Systems Incorporated† | | $ | 48,679 |
| 1,007 | | Cooper Industries Limited Class A | | | 51,246 |
| 1,938 | | Cree Incorporated† | | | 30,659 |
| 3,462 | | Cypress Semiconductor Corporation† | | | 64,289 |
| 3,951 | | EchoStar Communications Corporation Class A† | | | 145,792 |
| 4,668 | | Emerson Electric Company | | | 260,288 |
| 347 | | Energizer Holdings, Incorporated† | | | 12,763 |
| 25,959 | | Ericsson ADR† | | | 401,845 |
| 6,567 | | Gemstar-TV Guide International Incorporated† | | | 31,653 |
| 123,258 | | General Electric Company | | | 3,644,739 |
| 168 | | Harman International Industries Incorporated | | | 16,741 |
| 1,149 | | Harris Corporation | | | 38,147 |
| 7,387 | | Infineon Technologies AG ADR | | | 108,589 |
| 3,599 | | Integrated Device Technology Incorporated† | | | 50,206 |
| 80,069 | | Intel Corporation | | | 2,291,575 |
| 1,736 | | Interdigital Communications Corporation† | | | 30,814 |
| 20,923 | | International Business Machines Corporation | | | 1,715,895 |
| 1,472 | | International Rectifier Corporation† | | | 61,220 |
| 3,543 | | Jabil Circuit Incorporated† | | | 99,735 |
| 13,328 | | Koninklijke Philips Electronics NV NY Shares | | | 325,203 |
| 1,343 | | L-3 Communications Holdings Incorporated† | | | 68,614 |
| 2,886 | | Lattice Semiconductor Corporation | | | 25,397 |
| 3,634 | | Linear Technology Corporation | | | 149,793 |
| 5,240 | | LSI Logic Corporation† | | | 60,470 |
| 25,880 | | Matsushita Electric Industrial Company Limited ADR | | | 331,523 |
| 4,022 | | Maxim Integrated Products Incorporated | | | 180,628 |
| 1,330 | | Maytag Corporation | | | 36,043 |
| 3,339 | | McDATA Corporation† | | | 33,891 |
| 7,585 | | Micron Technology Incorporated† | | | 108,921 |
| 2,961 | | Mindspeed Technologies, Incorporated† | | | 10,423 |
| 29,200 | | Minebea Company Limited ADR | | | 290,800 |
| 3,530 | | Molex Incorporated | | | 103,853 |
| 29,302 | | Motorola Incorporated | | | 314,410 |
| 2,656 | | National Semiconductor Corporation† | | | 77,396 |
| 5,632 | | Network Appliance Incorporated† | | | 126,213 |
| 52,555 | | Nokia Oyi ADR | | | 856,121 |
| 2,329 | | Novellus Systems Incorporated† | | | 93,067 |
59
| WELLSFARGOOUTLOOK 2040FUND | | PORTFOLIOOFINVESTMENTS —AUGUST 31, 2003 (UNAUDITED) |
|
| Shares | | Security Name | | Value |
| Common Stock (Continued) |
| 2,599 | | NVIDIA Corporation† | | $ | 47,198 |
| 873 | | Omron Corporation | | | 176,949 |
| 3,152 | | Polycom Incorporated† | | | 54,088 |
| 4,898 | | Power-One Incorporated† | | | 57,845 |
| 3,693 | | Powerwave Technologies Incorporated† | | | 31,206 |
| 1,448 | | QLogic Corporation† | | | 70,981 |
| 10,025 | | Qualcomm Incorporated | | | 413,832 |
| 3,075 | | Rambus Incorporated† | | | 51,230 |
| 4,278 | | RF Micro Devices Incorporated† | | | 37,732 |
| 3,595 | | Rockwell Collins Incorporated | | | 97,245 |
| 10,394 | | Sanmina-SCI Corporation† | | | 93,338 |
| 7,534 | | Sanyo Electric Company Limited ADR | | | 151,885 |
| 2,462 | | Scientific-Atlanta Incorporated | | | 83,708 |
| 1,272 | | Silicon Laboratories Incorporated† | | | 56,490 |
| 1,899 | | Skyworks Solutions Incorporated† | | | 21,535 |
| 13,480 | | Solectron Corporation ADR† | | | 79,936 |
| 6,754 | | Sony Corporation ADR | | | 222,544 |
| 8,118 | | STMicroelectronics NV ADR | | | 202,463 |
| 2,297 | | TDK Corporation ADR | | | 148,846 |
| 7,706 | | Tellabs Incorporated† | | | 50,320 |
| 21,747 | | Texas Instruments Incorporated | | | 518,664 |
| 1,906 | | Thomas & Betts Corporation† | | | 32,554 |
| 3,387 | | Triquint Semiconductor Incorporated† | | | 18,832 |
| 752 | | Varian Semiconductor Equipment Associates Incorporated† | | | 30,509 |
| 4,102 | | Vishay Intertechnology Incorporated† | | | 67,560 |
| 5,991 | | Vitesse Semiconductor Corporation† | | | 40,919 |
| 623 | | Whirlpool Corporation | | | 43,348 |
| 4,452 | | Xilinx Incorporated† | | | 137,300 |
| | |
| | | | | | 16,909,698 |
| | | | |
|
|
|
ENGINEERING, ACCOUNTING, RESEARCH
MANAGEMENT & RELATED SERVICES — 0.60% |
| 3,048 | | Applera Corporation-Celera Genomics Group† | | | 31,028 |
| 5,067 | | BearingPoint Incorporated† | | | 41,549 |
| 2,159 | | Celgene Corporation† | | | 83,100 |
| 1,143 | | Cephalon Incorporated† | | | 50,692 |
| 8,239 | | CuraGen Corporation† | | | 37,817 |
| 2,304 | | Dun & Bradstreet Corporation† | | | 96,998 |
| 1,414 | | Fluor Corporation | | | 52,092 |
| 166,176 | | Invensys plc ADR | | | 169,533 |
| 6,887 | | Millennium Pharmaceutical Incorporated† | | | 95,729 |
| 3,625 | | Monsanto Company | | | 93,199 |
| 2,153 | | Moody's Corporation | | | 111,655 |
| 5,044 | | Paychex Incorporated | | | 181,584 |
| Shares | | Security Name | | Value |
| 1,604 | | Quest Diagnostics Incorporated† | | $ | 96,240 |
| 3,743 | | Quintiles Transnational Corporation† | | | 53,300 |
| 10,460 | | ServiceMaster Company | | | 104,705 |
| | |
| | | | | | 1,299,221 |
| | | | |
|
|
|
FABRICATED METAL PRODUCTS, EXCEPT
MACHINERY & TRANSPORTATION
EQUIPMENT — 0.32% |
| 465 | | Ball Corporation | | | 24,552 |
| 1,759 | | Crane Company | | | 45,013 |
| 1,853 | | Fortune Brands Incorporated | | | 104,509 |
| 3,770 | | Illinois Tool Works Incorporated | | | 272,533 |
| 7,403 | | Masco Corporation | | | 183,520 |
| 1,791 | | Snap-On Incorporated | | | 52,835 |
| | |
| | | | | | 682,962 |
| | | | |
|
|
|
| FOOD & KINDRED PRODUCTS — 3.19% |
| 469 | | Adolph Coors Company | | | 25,865 |
| 227 | | American Italian Pasta Company Class A† | | | 9,470 |
| 9,329 | | Anheuser-Busch Companies Incorporated | | | 480,817 |
| 10,952 | | Archer-Daniels-Midland Company | | | 151,904 |
| 10,282 | | Cadbury Schweppes plc ADR | | | 252,732 |
| 5,880 | | Campbell Soup Company | | | 142,296 |
| 29,315 | | Coca-Cola Company | | | 1,275,789 |
| 7,252 | | Coca-Cola Enterprises Incorporated | | | 134,089 |
| 7,314 | | ConAgra Foods Incorporated | | | 160,908 |
| 2,015 | | Del Monte Foods Company† | | | 18,095 |
| 8,818 | | Diageo plc ADR | | | 385,699 |
| 4,775 | | General Mills Incorporated | | | 221,369 |
| 9,038 | | Groupe Danone ADR | | | 248,816 |
| 1,705 | | Hershey Foods Corporation | | | 119,180 |
| 4,198 | | Heinz (H J) Company | | | 135,847 |
| 3,655 | | Hormel Foods Corporation | | | 78,948 |
| 1,563 | | J M Smucker Company | | | 63,270 |
| 5,394 | | Kellogg Company | | | 180,861 |
| 41,943 | | Kirin Brewery Company Limited ADR | | | 294,440 |
| 4,687 | | Kraft Foods Incorporated | | | 139,204 |
| 3,483 | | McCormick & Company Incorporated | | | 92,996 |
| 14,360 | | Nestle SA ADR | | | 781,806 |
| 4,306 | | Pepsi Bottling Group Incorporated | | | 103,861 |
| 4,217 | | PepsiAmericas Incorporated | | | 58,701 |
| 20,312 | | PepsiCo Incorporated | | | 904,696 |
| 10,800 | | Sara Lee Corporation | | | 204,984 |
| 6,616 | | Tyson Foods Incorporated
Class A | | | 74,099 |
| 2,746 | | WM Wrigley Jr Company | | | 145,676 |
| | |
| | | | | | 6,886,418 |
| | | | |
|
|
|
| FOOD STORES — 0.67% |
| 5,096 | | Albertson's Incorporated | | | 107,118 |
| 9,287 | | Coles Myer Limited ADR | | | 352,442 |
60
PORTFOLIOOFINVESTMENTS —AUGUST 31, 2003 (UNAUDITED) | | WELLSFARGOOUTLOOK 2040FUND |
|
| Shares | | Security Name | | Value |
| Common Stock (Continued) |
| 6,092 | | Ito-Yokado Company Limited ADR(a) | | $ | 174,012 |
| 12,798 | | Koninklijke Ahold NV ADR | | | 119,021 |
| 10,235 | | Kroger Company† | | | 196,614 |
| 6,077 | | Starbucks Corporation† | | | 172,830 |
| 25,880 | | Tesco plc ADR | | | 265,265 |
| 353 | | Whole Foods Market Incorporated† | | | 19,178 |
| 3,083 | | Winn-Dixie Stores Incorporated | | | 30,985 |
| | |
| | | | | | 1,437,465 |
| | | | |
|
|
|
| FORESTRY — 0.10% |
| 3,081 | | Plum Creek Timber Company | | | 80,568 |
| 2,322 | | Weyerhaeuser Company | | | 138,159 |
| | |
| | | | | | 218,727 |
| | | | |
|
|
|
| FURNITURE & FIXTURES — 0.17% |
| 3,107 | | Herman Miller Incorporated | | | 72,641 |
| 1,404 | | Hillenbrand Industries Incorporated | | | 76,027 |
| 5,036 | | Leggett & Platt Incorporated | | | 116,634 |
| 4,344 | | Newell Rubbermaid Incorporated | | | 103,170 |
| | |
| | | | | | 368,472 |
| | | | |
|
|
|
| GENERAL MERCHANDISE STORES — 2.21% |
| 3,634 | | Big Lots Incorporated† | | | 66,502 |
| 53 | | Dillard's Incorporated | | | 802 |
| 5,741 | | Dollar General Corporation | | | 131,641 |
| 2,820 | | Family Dollar Stores Incorporated | | | 113,138 |
| 2,667 | | Federated Department Stores Incorporated | | | 116,548 |
| 3,929 | | Foot Locker Incorporated | | | 65,104 |
| 3,851 | | JC Penney Company Incorporated | | | 81,718 |
| 4,290 | | May Department Stores Company | | | 118,318 |
| 5,601 | | Mitsukoshi Limited ADR† | | | 153,610 |
| 3,685 | | Sears Roebuck & Company | | | 162,214 |
| 11,237 | | Target Corporation | | | 456,222 |
| 7,865 | | TJX Companies Incorporated | | | 170,356 |
| 53,171 | | Wal-Mart Stores Incorporated | | | 3,146,128 |
| | |
| | | | | | 4,782,301 |
| | | | |
|
|
|
| HEALTH SERVICES — 0.52% |
| 4,885 | | Caremark Rx Incorporated† | | | 122,760 |
| 1,914 | | Enzon Pharmaceuticals Incorporated† | | | 21,762 |
| 1,700 | | Express Scripts Incorporated† | | | 110,177 |
| 3,458 | | First Health Group Corporation† | | | 90,669 |
| 6,894 | | HCA Incorporated | | | 261,903 |
| 5,162 | | Health Management Association Incorporated | | | 115,009 |
| 3,414 | | Human Genome Sciences Incorporated† | | | 48,615 |
| 4,749 | | Immunomedics Incorporated† | | | 41,886 |
| 1,307 | | Laboratory Corporation of America Holdings† | | | 39,537 |
| Shares | | Security Name | | Value |
| 357 | | Lincare Holdings Incorporated† | | $ | 12,363 |
| 309 | | Renal Care Group, Incorporated† | | | 11,220 |
| 6,488 | | Tenet Healthcare Corporation† | | | 104,132 |
| 2,189 | | Triad Hospitals Incorporated† | | | 70,924 |
| 1,534 | | Universal Health Services† | | | 76,363 |
| | |
| | | | | | 1,127,320 |
| | | | |
|
|
|
HOLDING & OTHER INVESTMENT
OFFICES — 0.05 % |
| 20,147 | | Mitsubishi Tokyo Financial Group ADR | | | 118,263 |
| | | | |
|
|
|
HOME FURNITURE, FURNISHINGS, & EQUIPMENT
STORES — 0.25% |
| 4,274 | | Bed Bath & Beyond Incorporated† | | | 183,910 |
| 4,233 | | Best Buy Company Incorporated† | | | 220,158 |
| 3,004 | | Circuit City Stores Incorporated | | | 31,332 |
| 3,072 | | RadioShack Corporation | | | 93,389 |
| 584 | | Williams-Sonoma Incorporated† | | | 17,876 |
| | |
| | | | | | 546,665 |
| | | | |
|
|
|
HOTELS, ROOMING HOUSES, CAMPS, & OTHER
LODGE PLACES — 0.17% |
| 7,683 | | Hilton Hotels Corporation | | | 117,396 |
| 3,149 | | Marriott International Incorporated | | | 128,574 |
| 1,502 | | MGM MIRAGE | | | 54,463 |
| 2,036 | | Starwood Hotels & Resorts Worldwide Incorporated | | | 68,877 |
| | |
| | | | | | 369,310 |
| | | | |
|
|
|
INDUSTRIAL & COMMERCIAL MACHINERY &
COMPUTER EQUIPMENT — 4.51% |
| 4,597 | | 3M Company | | | 654,935 |
| 864 | | American Standard Companies Incorporated† | | | 69,284 |
| 5,301 | | Apple Computer Incorporated† | | | 119,962 |
| 21,226 | | Applied Materials Incorporated† | | | 458,482 |
| 4,882 | | Baker Hughes Incorporated | | | 163,352 |
| 1,524 | | Black & Decker Corporation | | | 65,197 |
| 6,171 | | Brocade Communications Systems Incorporated† | | | 34,804 |
| 4,232 | | Caterpillar Incorporated | | | 303,985 |
| 1,362 | | CDW Corporation† | | | 70,293 |
| 87,549 | | Cisco Systems Incorporated† | | | 1,676,563 |
| 1,082 | | Cooper Cameron Corporation† | | | 52,542 |
| 3,254 | | Deere & Company | | | 183,884 |
| 31,630 | | Dell Computer Incorporated† | | | 1,032,087 |
| 1,635 | | Diebold Incorporated | | | 79,952 |
| 3,094 | | Dover Corporation | | | 117,634 |
| 1,030 | | Eaton Corporation | | | 96,449 |
| 28,775 | | EMC Corporation† | | | 366,881 |
| 1,979 | | Emulex Corporation† | | | 47,912 |
| 7,604 | | Gateway Incorporated† | | | 43,875 |
| 5,780 | | Grant Prideco Incorporated† | | | 67,048 |
| 37,985 | | Hewlett-Packard Company | | | 756,661 |
| 3,869 | | Hitachi Limited ADR | | | 211,402 |
| 2,256 | | Ingersoll-Rand Company Class A | | | 134,277 |
| 6,571 | | Juniper Networks Incorporated† | | | 113,153 |
61
| WELLSFARGOOUTLOOK 2040FUND | | PORTFOLIOOFINVESTMENTS —AUGUST 31, 2003 (UNAUDITED) |
|
| Shares | | Security Name | | Value |
| Common Stock (Continued) |
| 11,556 | | Komatsu Limited ADR | | $ | 263,843 |
| 2,459 | | Lam Research Corporation† | | | 63,245 |
| 1,599 | | Lexmark International Incorporated† | | | 107,197 |
| 37,861 | | Makita Corporation ADR | | | 333,177 |
| 21,824 | | NEC Corporation ADR | | | 164,771 |
| 2,615 | | Pall Corporation | | | 65,375 |
| 28 | | Palm Incorporated† | | | 511 |
| 1,716 | | Parker-Hannifin Corporation | | | 84,976 |
| 1,574 | | Pentair Incorporated | | | 67,367 |
| 2,457 | | Pitney Bowes Incorporated | | | 95,823 |
| 1,141 | | Sandisk Corporation† | | | 68,985 |
| 9,219 | | Siemens AG ADR | | | 574,159 |
| 2,620 | | Smith International Incorporation† | | | 102,416 |
| 4,969 | | Sonus Networks Incorporated† | | | 35,280 |
| 1,390 | | SPX Corporation† | | | 68,597 |
| 1,235 | | Stanley Works | | | 37,383 |
| 2,411 | | Storage Technology Corporation† | | | 61,746 |
| 4,304 | | Symbol Technologies Incorporated | | | 58,276 |
| 5,820 | | United Technologies Corporation | | | 467,055 |
| 1,511 | | Varian Medical Systems Incorporated† | | | 84,387 |
| 225 | | Zebra Technologies Corporation Class A† | | | 12,065 |
| | |
| | | | | | 9,737,248 |
| | | | |
|
|
|
INSURANCE AGENTS, BROKERS &
SERVICE — 0.25% |
| 4,745 | | AON Corporation | | | 105,339 |
| 372 | | Hilb, Rogal & Hamilton Company | | | 11,160 |
| 6,631 | | Marsh & McLennan Companies Incorporated | | | 331,550 |
| 3,356 | | Medco Health Solutions Incorporated† | | | 89,616 |
| | |
| | | | | | 537,665 |
| | | | |
|
|
|
| INSURANCE CARRIERS — 3.88% |
| 3,142 | | ACE Limited | | | 101,172 |
| 387 | | Advancepcs† | | | 15,550 |
| 13,156 | | Aegon NV ADR | | | 163,924 |
| 2,157 | | Aetna Incorporated | | | 122,949 |
| 7,011 | | AFLAC Incorporated | | | 224,422 |
| 408 | | Alleghany Corporation† | | | 81,604 |
| 17,718 | | Allianz AG ADR | | | 158,222 |
| 8,621 | | Allstate Corporation | | | 308,201 |
| 1,326 | | AMBAC Financial Group Incorporated | | | 86,084 |
| 32,608 | | American International Group Incorporated | | | 1,942,459 |
| 1,016 | | American National Insurance Company | | | 87,366 |
| 2,251 | | Anthem Incorporated† | | | 164,773 |
| 18,576 | | AXA ADR | | | 330,281 |
| 2,544 | | Berkley (WR) Corporation | | | 84,156 |
| Shares | | Security Name | | Value |
| 1,609 | | Chubb Corporation | | $ | 109,315 |
| 1,370 | | CIGNA Corporation | | | 65,322 |
| 2,938 | | Cincinnati Financial Corporation | | | 118,548 |
| 3,750 | | Fidelity National Financial Incorporated | | | 108,375 |
| 3,404 | | Hartford Financial Services Group | | | 181,161 |
| 3,055 | | Health Net Incorporated† | | | 97,241 |
| 1,406 | | Jefferson-Pilot Corporation | | | 62,244 |
| 4,305 | | John Hancock Financial Services Incorporated | | | 131,432 |
| 2,302 | | Lincoln National Corporation | | | 81,537 |
| 2,419 | | Loews Corporation | | | 99,566 |
| 249 | | Markel Corporation† | | | 66,919 |
| 1,487 | | MBIA Incorporated | | | 83,956 |
| 1,200 | | Mercury General Corporation | | | 52,416 |
| 9,653 | | MetLife Incorporated | | | 274,338 |
| 1,066 | | MGIC Investment Corporation | | | 60,090 |
| 230 | | Mid Atlantic Medical Services Incorporated.† | | | 11,284 |
| 7,075 | | Millea Holdings Incorporated ADR | | | 361,816 |
| 2,709 | | Old Republic International Corporation | | | 90,995 |
| 1,911 | | Oxford Health Plans Incorporated† | | | 69,274 |
| 1,533 | | PMI Group Incorporated | | | 54,238 |
| 1,510 | | Principal Financial Group, Incorporated | | | 47,505 |
| 2,528 | | Progressive Corporation | | | 178,831 |
| 7,285 | | Prudential Financial Incorporated | | | 265,247 |
| 1,847 | | Radian Group Incorporated | | | 87,899 |
| 1,986 | | Safeco Corporation | | | 71,615 |
| 433 | | Stancorp Financial Group Incorporated | | | 24,547 |
| 4,193 | | Swiss Reinsurance ADR | | | 257,471 |
| 2,553 | | The St Paul Companies Incorporated | | | 88,742 |
| 2,195 | | Torchmark Corporation | | | 88,590 |
| 500 | | Transatlantic Holding Incorporated | | | 35,345 |
| 14,395 | | Travelers Property Casualty Corporation Class B† | | | 222,979 |
| 7,827 | | UnitedHealth Group Incorporated | | | 386,889 |
| 1,966 | | Unitrin Incorporated | | | 58,233 |
| 674 | | UnumProvident Corporation | | | 9,503 |
| 2,314 | | WellPoint Health Networks Incorporated† | | | 180,492 |
| 1,634 | | XL Capital Limited Class A | | | 123,776 |
| 62 | | Zenith National Insurance Corporation | | | 1,795 |
| 15,181 | | Zurich Financial Services AG ADR | | | 195,104 |
| | |
| | | | | | 8,375,793 |
| | | | |
|
|
|
| LEATHER & LEATHER PRODUCTS — 0.02% |
| 752 | | Coach Incorporated† | | | 43,646 |
| | | | |
|
|
62
PORTFOLIOOFINVESTMENTS —AUGUST 31, 2003 (UNAUDITED) | | WELLSFARGOOUTLOOK 2040FUND |
|
| Shares | | Security Name | | Value |
| Common Stock (Continued) |
|
LUMBER & WOOD PRODUCTS, EXCEPT
FURNITURE — 0.02% |
| 1,535 | | Georgia-Pacific Corporation | | $ | 35,566 |
| | | | |
|
|
|
MEASURING, ANALYZING, & CONTROLLING
INSTRUMENTS: PHOTOGRAPHIC, MEDICAL &
OPTICAL GOODS — 2.45% |
| 3,289 | | Advanced Medical Optics Incorporated† | | | 54,565 |
| 4,802 | | Advantest Corporation ADR | | | 83,363 |
| 6,267 | | Agilent Technologies Incorporated† | | | 152,413 |
| 1,924 | | Allergan Incorporated | | | 152,881 |
| 3,949 | | Applera Corporation-Applied Biosystems Group | | | 85,930 |
| 1,559 | | Bausch & Lomb Incorporated | | | 65,727 |
| 7,886 | | Baxter International Incorporated | | | 221,597 |
| 1,545 | | Beckman Coulter Incorporated | | | 68,521 |
| 3,610 | | Becton Dickinson & Company | | | 131,909 |
| 4,071 | | Biomet Incorporated | | | 121,031 |
| 5,323 | | Boston Scientific Corporation† | | | 319,912 |
| 1,202 | | CR Bard Incorporated | | | 80,534 |
| 2,030 | | Danaher Corporation | | | 156,818 |
| 4,332 | | Eastman Kodak Company | | | 120,819 |
| 9,280 | | Fuji Photo Film Company Limited ADR | | | 279,235 |
| 16,658 | | General Motors Corporation Class H–Hughes Electronics Corporation† | | | 248,871 |
| 3,919 | | Guidant Corporation | | | 196,734 |
| 2,234 | | KLA-Tencor Corporation† | | | 132,610 |
| 15,299 | | Medtronic Incorporated | | | 758,524 |
| 3,543 | | Microchip Technology Incorporated | | | 99,239 |
| 1,134 | | Millipore Corporation | | | 51,484 |
| 9,718 | | Olympus Optical Company Limited | | | 223,211 |
| 1,933 | | PerkinElmer Incorporated | | | 31,972 |
| 5,485 | | Raytheon Company | | | 175,849 |
| 536 | | Resmed Incorporated† | | | 23,209 |
| 2,261 | | Ricoh Company Limited–ADR | | | 208,012 |
| 3,712 | | Rockwell Automation Incorporated | | | 101,041 |
| 2,372 | | St Jude Medical Incorporated† | | | 123,510 |
| 2,543 | | Stryker Corporation | | | 192,759 |
| 1,991 | | Sybron Dental Specialties Incorporated† | | | 47,665 |
| 2,268 | | Tektronix Incorporated† | | | 53,616 |
| 2,915 | | Teradyne Incorporated† | | | 51,974 |
| 3,863 | | Thermo Electron Corporation† | | | 88,038 |
| 1,350 | | Varian Incorporated† | | | 45,900 |
| 2,107 | | Waters Corporation† | | | 64,264 |
| 11,981 | | Xerox Corporation† | | | 129,155 |
| 2,857 | | Zimmer Holdings Incorporated† | | | 147,820 |
| | |
| | | | | | 5,290,712 |
| | | | |
|
|
| Shares | | Security Name | | Value |
|
| METAL MINING — 0.34% |
| 3,426 | | Freeport-McMoran Copper & Gold Incorporated Class B | | $ | 102,780 |
| 5,432 | | Newmont Mining Corporation | | | 213,260 |
| 1,386 | | Phelps Dodge Corporation† | | | 66,514 |
| 4,092 | | Rio Tinto plc ADR | | | 362,306 |
| | |
| | | | | | 744,860 |
| | | | |
|
|
|
MINING & QUARRYING OF NONMETALLIC
MINERALS, EXCEPT FUELS — 0.15% |
| 9,807 | | Pechiney SA ADR | | | 247,921 |
| 1,754 | | Vulcan Materials Company | | | 72,633 |
| | |
| | | | | | 320,554 |
| | | | |
|
|
|
MISCELLANEOUS MANUFACTURING
INDUSTRIES — 0.39% |
| 4,323 | | Hasbro Incorporated | | | 79,976 |
| 6,277 | | Mattel Incorporated | | | 121,272 |
| 2,573 | | Tiffany & Company | | | 100,141 |
| 25,793 | | Tyco International Limited | | | 530,819 |
| | |
| | | | | | 832,208 |
| | | | |
|
|
| |
| MISCELLANEOUS RETAIL — 0.70% | | | |
| 3,824 | | Amazon.Com Incorporated† | | | 177,587 |
| 6,378 | | Costco Wholesale Corporation† | | | 204,670 |
| 5,492 | | CVS Corporation | | | 179,039 |
| 2,852 | | Dollar Tree Stores Incorporated† | | | 111,884 |
| 371 | | Michaels Stories, Incorporated | | | 16,862 |
| 5,975 | | Office Depot Incorporated† | | | 108,984 |
| 11,227 | | Rite Aid Corporation† | | | 56,696 |
| 7,727 | | Staples Incorporated† | | | 190,316 |
| 2,757 | | Toys R Us Incorporated† | | | 37,550 |
| 12,973 | | Walgreen Company | | | 422,531 |
| 286 | | Zale Corporation† | | | 14,572 |
| | |
| | | | | | 1,520,691 |
| | | | |
|
|
|
| MOTION PICTURES — 0.51% |
| 47,825 | | Liberty Media Corporation† | | | 578,683 |
| 25,229 | | Walt Disney Company | | | 517,194 |
| | |
| | | | | | 1,095,877 |
| | | | |
|
|
|
MOTOR FREIGHT TRANSPORTATION &
WAREHOUSING — 0.43% |
| 1,566 | | CNF Incorporated | | | 46,510 |
| 14,070 | | United Parcel Service Incorporated | | | 883,033 |
| | |
| | | | | | 929,543 |
| | | | |
|
|
|
NON-DEPOSITORY CREDIT
INSTITUTIONS — 1.54% |
| 16,282 | | American Express Company | | | 733,504 |
| 931 | | AmeriCredit Corporation† | | | 9,990 |
| 3,319 | | Capital One Financial Corporation | | | 177,235 |
| 2,001 | | Countrywide Financial Corporation | | | 135,768 |
| 12,258 | | FNMA | | | 794,196 |
| 9,007 | | FHLMC | | | 478,722 |
| 16,900 | | MBNA Corporation | | | 394,446 |
| 6,972 | | ORIX Corporation ADR | | | 233,562 |
63
| WELLSFARGOOUTLOOK 2040FUND | | PORTFOLIOOFINVESTMENTS —AUGUST 31, 2003 (UNAUDITED) |
|
| Shares | | Security Name | | Value |
| Common Stock (Continued) |
| 5,295 | | Providian Financial Corporation | | $ | 54,274 |
| 5,766 | | SLM Corporation | | | 231,678 |
| 665 | | Student Loan Corporation | | | 81,767 |
| | |
| | | | | | 3,325,142 |
| | | | |
|
|
|
| OIL & GAS EXTRACTION — 2.07% |
| 3,969 | | Anadarko Petroleum Corporation | | | 172,652 |
| 2,392 | | Apache Corporation | | | 165,000 |
| 3,200 | | Berry Petroleum Company Class A | | | 60,000 |
| 2,721 | | BJ Services Company† | | | 101,684 |
| 2,782 | | Burlington Resources Incorporated | | | 134,704 |
| 36 | | Cross Timbers Royalty Trust† | | | 810 |
| 2,787 | | Devon Energy Corporation | | | 144,227 |
| 413 | | Diamond Offshore Drilling | | | 8,343 |
| 7,239 | | ENI SpA ADR | | | 552,987 |
| 3,562 | | ENSCO International Incorporated | | | 99,558 |
| 1,923 | | EOG Resources Incorporated | | | 81,535 |
| 3,000 | | Equitable Resources Incorporated | | | 118,410 |
| 6,774 | | Halliburton Company | | | 163,795 |
| 979 | | Kerr-McGee Corporation | | | 43,027 |
| 684 | | Nabors Industries Limited† | | | 27,463 |
| 1,082 | | Newfield Exploration Company† | | | 42,512 |
| 1,116 | | Noble Corporation† | | | 40,377 |
| 6,374 | | Occidental Petroleum Corporation | | | 218,819 |
| 2,175 | | Patina Oil & Gas Corporation | | | 80,584 |
| 1,431 | | Pioneer Natural Resources† | | | 36,290 |
| 19,291 | | Repsol YPF SA ADR | | | 326,597 |
| 2,165 | | Rowan Companies Incorporated† | | | 54,212 |
| 6,776 | | Schlumberger Limited | | | 335,480 |
| 10,766 | | Shell Transport & Trading Company plc ADR | | | 413,845 |
| 1,050 | | Tidewater Incorporated | | | 30,156 |
| 10,655 | | Total Fina Elf SA ADR | | | 820,542 |
| 76 | | Transocean Incorporated† | | | 1,605 |
| 5,309 | | Varco International Incorporated† | | | 91,580 |
| 4,899 | | XTO Energy Incorporated | | | 102,829 |
| | |
| | | | | | 4,469,623 |
| | | | |
|
|
|
| PAPER & ALLIED PRODUCTS — 0.61% |
| 1,071 | | Bemis Company Incorporated | | | 48,484 |
| 1,557 | | Boise Cascade Corporation | | | 42,428 |
| 465 | | Bowater Incorporated | | | 20,139 |
| 6,621 | | Bunzl plc ADR | | | 242,991 |
| 5,722 | | International Paper Company | | | 232,027 |
| 5,875 | | Kimberly-Clark Corporation | | | 300,271 |
| 3,437 | | MeadWestvaco Corporation | | | 87,128 |
| 3,967 | | Pactiv Corporation† | | | 79,657 |
| 4,491 | | Rexam plc ADR | | | 149,326 |
| 3,387 | | Sonoco Products Company | | | 77,122 |
| 735 | | Temple-Inland Incorporated | | | 36,589 |
| | |
| | | | | | 1,316,162 |
| | | | |
|
|
| Shares | | Security Name | | Value |
|
| PERSONAL SERVICES — 0.11% |
| 3,312 | | Cintas Corporation | | $ | 132,248 |
| 2,277 | | H & R Block Incorporated | | | 100,416 |
| | |
| | | | | | 232,664 |
| | | | |
|
|
|
PETROLEUM REFINING & RELATED
INDUSTRIES — 3.22% |
| 820 | | Ashland Incorporated | | | 27,109 |
| 27,256 | | BP plc ADR | | | 1,137,120 |
| 13,356 | | ChevronTexaco Corporation | | | 973,252 |
| 8,819 | | ConocoPhillips | | | 492,453 |
| 82,662 | | Exxon Mobil Corporation | | | 3,116,357 |
| 5,271 | | Marathon Oil Corporation | | | 147,008 |
| 2,031 | | Murphy Oil Corporation | | | 117,250 |
| 15,130 | | Royal Dutch Petroleum Company | | | 678,883 |
| 1,904 | | Sunoco Incorporated | | | 77,360 |
| 3,457 | | Unocal Corporation† | | | 105,853 |
| 2,322 | | Valero Energy Corporation | | | 91,487 |
| | |
| | | | | | 6,964,132 |
| | | | |
|
|
|
| PRIMARY METAL INDUSTRIES — 0.46% |
| 11,547 | | Alcoa Incorporated | | | 329,782 |
| 183 | | Allegheny Technologies Incorporated | | | 1,363 |
| 3,243 | | Engelhard Corporation | | | 91,031 |
| 6,981 | | Johnson Matthey plc ADR | | | 216,759 |
| 13,837 | | Kubota Corporation ADR | | | 231,078 |
| 1,242 | | Nucor Corporation | | | 63,851 |
| 1,650 | | Precision Castparts Corporation | | | 58,410 |
| | |
| | | | | | 992,274 |
| | | | |
|
|
|
PRINTING, PUBLISHING, & ALLIED
INDUSTRIES — 1.34% |
| 4,054 | | Belo Corporation Class A | | | 94,539 |
| 1,095 | | Dow Jones & Company Incorporated | | | 46,505 |
| 8,593 | | Elsevier | | | 191,624 |
| 3,301 | | Gannett Company Incorporated | | | 258,864 |
| 959 | | Knight-Ridder Incorporated | | | 65,078 |
| 1,411 | | McClatchy Company | | | 84,265 |
| 2,095 | | McGraw-Hill Companies Incorporated | | | 127,795 |
| 230 | | Media General Incorporated | | | 13,940 |
| 1,681 | | Meredith Corporation | | | 79,713 |
| 2,041 | | New York Times Company | | | 90,600 |
| 6,310 | | News Corporation Limited ADR | | | 216,749 |
| 2,980 | | Readers Digest Assocation | | | 36,267 |
| 3,050 | | RR Donnelley & Sons Company | | | 76,677 |
| 340 | | Scripps Company (E W) | | | 29,441 |
| 4,816 | | Toppan Printing Company Limited ADR | | | 194,819 |
| 4,372 | | Tribune Company | | | 202,205 |
| 1,481 | | Valassis Communications Incorporated† | | | 43,512 |
| 21,668 | | Viacom Incorporated Class B | | | 975,060 |
| 88 | | Washington Post Company Class B | | | 61,250 |
| | |
| | | | | | 2,888,903 |
| | | | |
|
|
64
PORTFOLIOOFINVESTMENTS —AUGUST 31, 2003 (UNAUDITED) | | WELLSFARGOOUTLOOK 2040FUND |
|
| Shares | | Security Name | | Value |
| Common Stock (Continued) | | | |
|
| RAILROAD TRANSPORTATION — 0.24% |
| 4,934 | | Burlington Northern Santa Fe Corporation | | $ | 139,878 |
| 2,706 | | CSX Corporation | | | 87,350 |
| 5,749 | | Norfolk Southern Corporation | | | 109,461 |
| 3,087 | | Union Pacific Corporation | | | 188,122 |
| | |
| | | | | | 524,811 |
| | | | |
|
|
|
| REAL ESTATE — 0.17% |
| 4,027 | | Catellus Development Corporation† | | | 94,433 |
| 74,722 | | City Developments Limited | | | 217,404 |
| 1,837 | | The St Joe Company | | | 62,476 |
| | |
| | | | | | 374,313 |
| | | | |
|
|
|
RUBBER & MISCELLANEOUS PLASTICS
PRODUCTS — 0.22% |
| 5,371 | | Bridgestone Corporation | | | 149,604 |
| 3,676 | | Nike Incorporated Class B | | | 209,458 |
| 1,379 | | Sealed Air Corporation† | | | 67,102 |
| 3,036 | | Tupperware Corporation | | | 49,578 |
| | |
| | | | | | 475,742 |
| | | | |
|
|
|
SECURITY & COMMODITY BROKERS, DEALERS,
EXCHANGES & SERVICES — 1.77% |
| 1,353 | | Bear Stearns Companies Incorporated | | | 94,683 |
| 343 | | Blackrock Incorporated | | | 15,596 |
| 20,385 | | Charles Schwab Corporation | | | 221,381 |
| 11,987 | | Credit Suisse Group | | | 377,231 |
| 7,582 | | E*Trade Group Incorporated† | | | 69,982 |
| 1,893 | | Edwards Ag Incorporated | | | 68,148 |
| 3,433 | | Franklin Resources Incorporated | | | 148,271 |
| 718 | | Gabelli Asset Management Incorporated Class A† | | | 27,069 |
| 6,107 | | Goldman Sachs Group Incorporated | | | 540,408 |
| 3,761 | | Janus Capital Group Incorporated | | | 64,953 |
| 516 | | Jefferies Group Incorporated | | | 15,325 |
| 1,607 | | Legg Mason Incorporated | | | 115,431 |
| 3,274 | | Lehman Brothers Holdings Incorporated | | | 215,200 |
| 11,775 | | Merrill Lynch & Company Incorporated | | | 633,260 |
| 13,830 | | Morgan Stanley | | | 674,766 |
| 1,515 | | Neuberger Berman Incorporated | | | 62,812 |
| 19,876 | | Nomura Holdings Incorporated ADR | | | 291,183 |
| 3,100 | | Nuveen Investments Class A | | | 80,817 |
| 2,551 | | T Rowe Price Group Incorporated | | | 108,417 |
| | |
| | | | | | 3,824,933 |
| | | | |
|
|
|
STONE, CLAY, GLASS, & CONCRETE PRODUCTS — 0.42% |
| 17,110 | | Corning Incorporated† | | | 141,158 |
| 7,056 | | Hanson plc ADR | | | 229,673 |
| Shares | | Security Name | | Value |
| 17,900 | | Holcim Limited ADR† | | $ | 354,667 |
| 10,826 | | Lafarge SA ADR | | | 183,608 |
| | |
| | | | | | 909,106 |
| | | | |
|
|
|
| TEXTILE MILL PRODUCTS — 0.01% |
| 272 | | Mohawk Industries, Incorporated† | | | 19,845 |
| | | | |
|
|
|
| TOBACCO PRODUCTS — 0.72% |
| 24,656 | | Altria Group Incorporated | | | 1,016,320 |
| 9,042 | | British American Tobacco plc ADR | | | 185,451 |
| 6,495 | | Imperial Tobacco Group | | | 207,191 |
| 1,159 | | RJ Reynolds Tobacco Holdings | | | 39,580 |
| 3,028 | | UST Incorporated | | | 101,135 |
| | |
| | | | | | 1,549,677 |
| | | | |
|
|
|
| TRANSPORTATION BY AIR — 0.32% |
| 4,440 | | FedEx Corporation | | | 297,924 |
| 15,795 | | Japan Airlines System ADR | | | 186,135 |
| 12,257 | | Southwest Airlines Company | | | 209,472 |
| | |
| | | | | | 693,531 |
| | | | |
|
|
|
| TRANSPORTATION EQUIPMENT — 2.21% |
| 15,460 | | BAE Systems plc ADR | | | 167,021 |
| 10,784 | | Boeing Company | | | 403,214 |
| 2,736 | | Brunswick Corporation | | | 73,817 |
| 11,095 | | DaimlerChrysler AG | | | 424,162 |
| 11,421 | | Delphi Corporation | | | 103,474 |
| 18,722 | | Fiat Spa ADR | | | 127,122 |
| 23,778 | | Ford Motor Company | | | 274,874 |
| 2,441 | | General Dynamics Corporation | | | 210,195 |
| 6,885 | | General Motors Corporation | | | 282,974 |
| 3,211 | | Genuine Parts Company | | | 102,816 |
| 1,406 | | Goodrich Corporation | | | 36,598 |
| 3,946 | | Harley-Davidson Incorporated | | | 196,590 |
| 15,438 | | Honda Motor Company Limited ADR | | | 314,318 |
| 10,820 | | Honeywell International Incorporated | | | 313,672 |
| 1,670 | | ITT Industries Incorporated | | | 108,684 |
| 1,381 | | Johnson Controls Incorporated | | | 136,719 |
| 1,696 | | Lear Corporation† | | | 94,213 |
| 5,611 | | Lockheed Martin Corporation | | | 287,452 |
| 1,573 | | Navistar International Corporation | | | 70,360 |
| 2,517 | | Northrop Grumman Corporation | | | 240,323 |
| 1,985 | | Paccar Incorporated | | | 169,122 |
| 352 | | Polaris Industries, Incorporated | | | 27,196 |
| 1,892 | | Textron Incorporated | | | 85,140 |
| 9,431 | | Toyota Motor Corporation ADR | | | 522,380 |
| | |
| | | | | | 4,772,436 |
| | | | |
|
|
|
| TRANSPORTATION SERVICES — 0.08% |
| 3,123 | | Expeditors International of Washington Incorporated | | | 117,768 |
| 2,037 | | Sabre Holdings Corporation | | | 46,077 |
| | |
| | | | | | 163,845 |
| | | | |
|
|
65
| WELLSFARGOOUTLOOK 2040FUND | | PORTFOLIOOFINVESTMENTS —AUGUST 31, 2003 (UNAUDITED) |
|
| Shares | | Security Name | | Value |
| Common Stock (Continued) |
|
| WATER TRANSPORTATION — 0.26% |
| 7,987 | | Carnival Corporation | | $ | 276,270 |
| 7,473 | | Carnival plc ADR | | | 244,143 |
| 2,800 | | Gulfmark Offshore Incorporated† | | | 39,200 |
| | |
| | | | | | 559,613 |
| | | | |
|
|
|
| WHOLESALE TRADE-DURABLE GOODS — 1.52% |
| 3,573 | | Apogent Technologies Incorporated† | | | 78,034 |
| 2,808 | | Arrow Electronics Incorporated† | | | 57,957 |
| 3,214 | | Avnet Incorporated† | | | 58,013 |
| 309 | | Borgwarner Incorporated | | | 22,007 |
| 3,398 | | Cytyc Corporation† | | | 44,446 |
| 36,172 | | Johnson & Johnson | | | 1,793,408 |
| 1,991 | | Kyocera Corporation ADR | | | 126,090 |
| 17,350 | | Mitsubishi Corporation ADR | | | 293,231 |
| 2,348 | | Mitsui & Company Limited | | | 299,393 |
| 12,703 | | Nissan Motor Company Limited ADR | | | 275,655 |
| 2,851 | | Omnicare Incorporated | | | 96,649 |
| 5,047 | | Sycamore Networks Incorporated† | | | 21,298 |
| 1,262 | | Tech Data Corporation† | | | 42,088 |
| 1,615 | | WW Grainger Incorporated | | | 80,475 |
| | |
| | | | | | 3,288,744 |
| | | | |
|
|
|
WHOLESALE TRADE NON-DURABLE
GOODS — 1.62% |
| 1,729 | | AmerisourceBergen Corporation | | | 100,645 |
| 580 | | Brown-Forman Corporation Class B | | | 45,843 |
| 5,688 | | Cardinal Health Incorporated | | | 323,818 |
| 1,224 | | Dean Foods Company† | | | 35,557 |
| 3,980 | | McKesson Corporation | | | 130,305 |
| 5,408 | | Safeway Incorporated† | | | 132,009 |
| 5,250 | | Smurfit-Stone Container Corporation† | | | 82,845 |
| 2,848 | | Supervalu Incorporated | | | 68,637 |
| 8,268 | | Sysco Corporation | | | 260,111 |
| 5,374 | | Unilever NV | | | 300,837 |
| 8,188 | | Unilever plc ADR | | | 267,093 |
| | |
| | | | | | 1,747,700 |
| | | | |
|
|
TOTAL COMMON STOCK (Cost $194,257,876) | | | 181,616,145 |
| | | | |
|
|
|
| Real Estate Investment Trust — 0.95% |
| 5,299 | | Archstone-Smith Trust | | | 138,569 |
| 1,784 | | Boston Properties Incorporated | | | 76,623 |
| 3,342 | | CBL & Associates Properties | | | 163,658 |
| 6,018 | | Crescent Real Estate Incorporated | | | 87,321 |
| 4,863 | | Duke Realty Corporation | | | 134,559 |
| 5,353 | | Equity Office Properties Trust | | | 148,920 |
| 3,164 | | Equity Residential | | | 92,009 |
| 8,879 | | Host Marriott Corporation† | | | 88,968 |
| 2,723 | | iStar Financial Incorporated | | | 99,825 |
| 3,443 | | Kimco Realty Corporation | | | 143,504 |
| 5,200 | | Pennsylvania Real Estate | | | 161,200 |
| Shares | | Security Name | | Value |
| 2,248 | | Public Storage Incorporated | | $ | 82,929 |
4,400 | | Saul Centers Incorporated | | | 119,460 |
3,044 | | Simon Property Group Incorporated | | | 130,009 |
5,500 | | Tanger Factory Outlet Centers Incorporated | | | 185,625 |
2,864 | | The Rouse Company | | | 114,188 |
1,796 | | Vornado Realty Trust | | | 84,680 |
TOTAL REAL ESTATE INVESTMENT
TRUST (Cost $2,020,883) | | | 2,052,047 |
| | | | |
|
|
| Principal | | Interest Rate | | Maturity Date | | |
| US Treasury Obligations — 14.19% | | |
| US TREASURY BONDS — 14.19% | | |
| $ | 1,230,000 | | 5.38 | | 2/15/31 | | 1,256,425 |
| | 4,590,000 | | 7.50 | | 11/15/16 | | 5,722,977 |
| | 1,180,000 | | 8.88 | | 2/15/19 | | 1,654,904 |
| | 2,270,000 | | 8.13 | | 8/15/19 | | 3,002,341 |
| | 9,875,000 | | 8.00 | | 11/15/21 | | 13,052,360 |
| | 3,130,000 | | 7.25 | | 8/15/22 | | 3,857,237 |
| | 1,070,000 | | 6.13 | | 11/15/27 | | 1,177,752 |
| | 825,000 | | 6.25 | | 5/15/30 | | 931,155 |
TOTAL US TREASURY OBLIGATIONS (Cost $32,049,298) | | 30,655,151 |
| | | | | | |
|
| Short Term Investments — 0.83% | | |
| |
| US TREASURY BILLS — 0.83% | | |
| | 18,000 | | 0.90^ | | 10/16/03 | | 17,980 |
| | 205,000 | | 0.91^ | | 10/16/03 | | 204,772 |
| | 306,000 | | 0.92^ | | 10/16/03 | | 306,000 |
| | 1,273,000 | | 0.91^ | | 10/16/03 | | 1,271,590 |
TOTAL SHORT TERM INVESTMENTS (Cost $1,800,336) | | 1,800,342 |
| | | | | | |
|
TOTAL INVESTMENT IN
SECURITIES (Cost $230,128,393) | | 100.02% | | $ | 216,123,685 | |
| | |
Other Assets and Liabilities,
Net | | (0.02) | | | (51,216 | ) |
| | | | |
| |
|
|
|
| TOTAL NET ASSETS | | 100.00% | | $ | 216,072,469 | |
| | | | |
| |
|
|
|
| (a) | Security Fair Valued in accordance with the procedures approved by the Board of Trustees. |
| † | Non-income earning securities. |
| ‡ | Security of an affiliate of the fund with a cost of $995,608 |
The accompanying notes are an integral part of these financial statements.
66
This page is intentionally left blank —
67
| WELLSFARGOOUTLOOKFUNDS | | STATEMENTSOFASSETSANDLIABILITIES —AUGUST 31, 2003 (UNAUDITED) |
|
| | | Outlook
Today | | | Outlook
2010 | | | Outlook
2020 | | | Outlook
2030 | | | Outlook
2040 | |
|
| | | | | |
ASSETS | | | | | | | | | | | | | | | | | | | | |
| | | | | |
INVESTMENTS: | | | | | | | | | | | | | | | | | | | | |
In securities, at market value (see cost below) | | $ | 78,585,767 | | | $ | 173,260,508 | | | $ | 277,140,642 | | | $ | 160,173,860 | | | $ | 216,123,685 | |
Cash | | | 50,813 | | | | 50,293 | | | | 50,866 | | | | 50,141 | | | | 50,038 | |
Collateral for securities loaned | | | 37,827,849 | | | | 82,037,915 | | | | 127,919,437 | | | | 58,989,993 | | | | 61,393,901 | |
Receivable for dividends and interest and other receivables | | | 486,505 | | | | 1,027,176 | | | | 1,265,536 | | | | 574,396 | | | | 755,473 | |
Receivable for investments sold | | | 0 | | | | 0 | | | | 57,600 | | | | 77,288 | | | | 0 | |
Receivable for Fund shares issued | | | 201,027 | | | | 313,921 | | | | 184,875 | | | | 100,207 | | | | 57,108 | |
Prepaid expenses and other assets | | | 99 | | | | 0 | | | | 0 | | | | 0 | | | | 0 | |
| | |
|
|
| |
|
|
| |
|
|
| |
|
|
| |
|
|
|
TOTALASSETS | | | 117,152,060 | | | | 256,689,813 | | | | 406,618,956 | | | | 219,965,885 | | | | 278,380,205 | |
| | |
|
|
| |
|
|
| |
|
|
| |
|
|
| |
|
|
|
| | | | | |
LIABILITIES | | | | | | | | | | | | | | | | | | | | |
Payable for securities loaned | | | 37,827,849 | | | | 82,037,915 | | | | 127,919,437 | | | | 58,989,993 | | | | 61,393,901 | |
Payable for Fund shares redeemed | | | 14,725 | | | | 45,679 | | | | 96,954 | | | | 44,592 | | | | 85,610 | |
Payable for investment advisor and affiliates | | | 18,947 | | | | 65,556 | | | | 109,976 | | | | 51,823 | | | | 108,345 | |
Payable to other related parties (1) | | | 36,554 | | | | 53,887 | | | | 62,314 | | | | 42,399 | | | | 71,817 | |
Accrued expenses and other liabilities | | | 213,746 | | | | 307,236 | | | | 311,932 | | | | 261,593 | | | | 648,063 | |
| | |
|
|
| |
|
|
| |
|
|
| |
|
|
| |
|
|
|
TOTALLIABILITIES | | | 38,111,821 | | | | 82,510,273 | | | | 128,500,613 | | | | 59,390,400 | | | | 62,307,736 | |
| | |
|
|
| |
|
|
| |
|
|
| |
|
|
| |
|
|
|
TOTALNETASSETS | | $ | 79,040,239 | | | $ | 174,179,540 | | | $ | 278,118,343 | | | $ | 160,575,485 | | | $ | 216,072,469 | |
| | |
|
|
| |
|
|
| |
|
|
| |
|
|
| |
|
|
|
| | | | | |
NETASSETSCONSISTOF: | | | | | | | | | | | | | | | | | | | | |
|
Paid-in capital | | $ | 80,009,413 | | | $ | 181,973,911 | | | $ | 299,674,137 | | | $ | 171,794,832 | | | $ | 250,299,221 | |
Undistributed net investment income (loss) | | | 157,080 | | | | 297,612 | | | | 477,123 | | | | 263,650 | | | | 261,115 | |
Undistributed net realized gain (loss) on investments and foreign currency transactions and futures | | | (1,181,527 | ) | | | (6,588,712 | ) | | | (11,061,851 | ) | | | (321,143 | ) | | | (20,483,159 | ) |
Net unrealized appreciation (depreciation) of investments | | | 55,273 | | | | (1,503,271 | ) | | | (10,971,066 | ) | | | (11,161,854 | ) | | | (14,004,708 | ) |
| | |
|
|
| |
|
|
| |
|
|
| |
|
|
| |
|
|
|
TOTALNETASSETS | | $ | 79,040,239 | | | $ | 174,179,540 | | | $ | 278,118,343 | | | $ | 160,575,485 | | | $ | 216,072,469 | |
| | |
|
|
| |
|
|
| |
|
|
| |
|
|
| |
|
|
|
| | | | |
COMPUTATIONOFNETASSETVALUEANDOFFERINGPRICEPERSHARE | | | | | | | | | | | | | | | | |
|
Net assets – Class A | | $ | 35,944,672 | | | $ | 76,849,680 | | | $ | 126,989,243 | | | $ | 91,920,541 | | | $ | 132,584,858 | |
Shares outstanding – Class A | | | 3,767,022 | | | | 6,832,106 | | | | 10,871,106 | | | | 7,623,454 | | | | 10,585,430 | |
Net asset value per share – Class A | | $ | 9.54 | | | $ | 11.25 | | | $ | 11.68 | | | $ | 12.06 | | | $ | 12.53 | |
Maximum offering price per share – Class A (2) | | $ | 10.12 | | | $ | 11.94 | | | $ | 12.39 | | | $ | 12.80 | | | $ | 13.29 | |
Net Assets – Class B | | $ | 21,541,126 | | | $ | 34,621,886 | | | $ | 32,172,123 | | | $ | 21,143,754 | | | $ | 44,597,326 | |
Shares outstanding – Class B | | | 2,218,619 | | | | 3,077,272 | | | | 2,778,480 | | | | 1,783,426 | | | | 3,692,039 | |
Net asset value and offering price per share – Class B | | $ | 9.71 | | | $ | 11.25 | | | $ | 11.58 | | | $ | 11.86 | | | $ | 12.08 | |
Net Assets – Class C | | $ | 10,873,495 | | | $ | 6,946,974 | | | $ | 6,795,064 | | | $ | 4,068,785 | | | $ | 4,065,138 | |
Shares outstanding – Class C | | | 1,121,904 | | | | 612,279 | | | | 583,052 | | | | 342,763 | | | | 336,538 | |
Net asset value per share – Class C | | $ | 9.69 | | | $ | 11.35 | | | $ | 11.65 | | | $ | 11.87 | | | $ | 12.08 | |
Maximum offering price per share – Class C (3) | | $ | 9.79 | | | $ | 11.46 | | | $ | 11.77 | | | $ | 11.99 | | | $ | 12.20 | |
Net Assets – Institutional Class | | $ | 10,680,946 | | | $ | 55,761,000 | | | $ | 112,161,913 | | | $ | 43,442,405 | | | $ | 34,825,147 | |
Shares outstanding – Institutional Class | | | 1,102,251 | | | | 4,919,168 | | | | 9,502,809 | | | | 3,573,595 | | | | 2,747,080 | |
Net asset value and offering price per share – Institutional Class | | $ | 9.69 | | | $ | 11.34 | | | $ | 11.80 | | | $ | 12.16 | | | $ | 12.68 | |
| | |
|
|
| |
|
|
| |
|
|
| |
|
|
| |
|
|
|
INVESTMENTATCOST (NOTE 2) | | $ | 78,530,494 | | | $ | 174,763,779 | | | $ | 288,111,708 | | | $ | 171,335,714 | | | $ | 230,128,393 | |
| | |
|
|
| |
|
|
| |
|
|
| |
|
|
| |
|
|
|
SECURITIESONLOAN,ATMARKETVALUE | | $ | 36,938,439 | | | $ | 79,950,795 | | | $ | 124,824,321 | | | $ | 57,610,507 | | | $ | 59,754,267 | |
| (1) | | Other related parties include the Funds’ trustees and distributor. |
| (2) | | Maximum offering price is computed as 100/94.25 of net asset value. On investments of $50,000 or more, the offering price is reduced. |
| (3) | | Maximum offering price is computed as 100/99.00 of net asset value. |
The accompanying notes are an integral part of these financial statements.
68
STATEMENTS OF OPERATIONS — FOR THE PERIOD ENDED AUGUST 31, 2003 (UNAUDITED) | | WELLSFARGOOUTLOOKFUNDS |
|
| | | Outlook
Today | | | Outlook 2010 | | | Outlook 2020 | | | Outlook 2030 | | | Outlook 2040 | |
|
| | | | | |
INVESTMENTINCOME | | | | | | | | | | | | | | | | | | | | |
Dividends (1) | | $ | 317,536 | | | $ | 961,890 | | | $ | 1,904,837 | | | $ | 1,296,392 | | | $ | 1,974,735 | |
Interest | | | 803,118 | | | | 1,335,093 | | | | 1,381,747 | | | | 635,588 | | | | 568,212 | |
Securities lending income | | | 34,433 | | | | 74,053 | | | | 99,588 | | | | 46,638 | | | | 52,000 | |
| | |
|
|
| |
|
|
| |
|
|
| |
|
|
| |
|
|
|
TOTALINVESTMENTINCOME | | | 1,155,087 | | | | 2,371,036 | | | | 3,386,172 | | | | 1,978,618 | | | | 2,594,947 | |
| | |
|
|
| |
|
|
| |
|
|
| |
|
|
| |
|
|
|
| | | | | |
EXPENSES | | | | | | | | | | | | | | | | | | | | |
Advisory fees | | | 264,985 | | | | 580,442 | | | | 902,003 | | | | 528,312 | | | | 728,854 | |
Administration fees | | | 18,928 | | | | 41,461 | | | | 64,427 | | | | 37,736 | | | | 52,061 | |
Administration fees – Class Level | | | | | | | | | | | | | | | | | | | | |
Class A | | | 49,610 | | | | 103,825 | | | | 165,318 | | | | 120,588 | | | | 173,802 | |
Class B | | | 29,019 | | | | 48,537 | | | | 45,190 | | | | 29,476 | | | | 64,025 | |
Class C | | | 13,369 | | | | 8,881 | | | | 8,463 | | | | 4,763 | | | | 5,676 | |
Institutional Class | | | 9,998 | | | | 50,666 | | | | 101,307 | | | | 40,355 | | | | 34,313 | |
Custody fees | | | 7,571 | | | | 16,585 | | | | 25,772 | | | | 15,095 | | | | 20,824 | |
Shareholder servicing fees | | | 82,141 | | | | 143,968 | | | | 195,509 | | | | 138,239 | | | | 217,413 | |
Portfolio accounting fees | | | 12,293 | | | | 14,863 | | | | 17,480 | | | | 14,439 | | | | 16,072 | |
Distribution fees | | | | | | | | | | | | | | | | | | | | |
Class B | | | 77,729 | | | | 130,010 | | | | 121,045 | | | | 78,952 | | | | 171,496 | |
Class C | | | 35,811 | | | | 23,789 | | | | 22,670 | | | | 12,760 | | | | 15,204 | |
Legal and audit fees | | | 17,210 | | | | 16,838 | | | | 17,211 | | | | 17,211 | | | | 17,210 | |
Registration fees | | | 14,336 | | | | 21,923 | | | | 29,789 | | | | 21,973 | | | | 26,611 | |
Directors’ fees | | | 2,111 | | | | 2,111 | | | | 2,111 | | | | 2,111 | | | | 2,111 | |
Shareholder reports | | | 10,325 | | | | 25,599 | | | | 42,922 | | | | 29,018 | | | | 51,230 | |
Other | | | 2,884 | | | | 6,699 | | | | 11,477 | | | | 8,014 | | | | 17,602 | |
| | |
|
|
| |
|
|
| |
|
|
| |
|
|
| |
|
|
|
TOTALEXPENSES | | | 648,320 | | | | 1,236,197 | | | | 1,772,694 | | | | 1,099,042 | | | | 1,614,504 | |
| | |
|
|
| |
|
|
| |
|
|
| |
|
|
| |
|
|
|
| | | | | |
LESS: | | | | | | | | | | | | | | | | | | | | |
Waived fees and reimbursed expenses (Note 6) | | | (81,905 | ) | | | (113,557 | ) | | | (136,433 | ) | | | (106,419 | ) | | | (166,573 | ) |
NETEXPENSES | | | 566,415 | | | | 1,122,640 | | | | 1,636,261 | | | | 992,623 | | | | 1,447,931 | |
| | |
|
|
| |
|
|
| |
|
|
| |
|
|
| |
|
|
|
NETINVESTMENTINCOME (LOSS) | | | 588,672 | | | | 1,248,396 | | | | 1,749,911 | | | | 985,995 | | | | 1,147,016 | |
| | |
|
|
| |
|
|
| |
|
|
| |
|
|
| |
|
|
|
| | | | |
REALIZEDANDUNREALIZEDGAIN (LOSS)ONINVESTMENTS | | | | | | | | | | | | | | | | |
|
| | | | | |
NETREALIZEDGAIN (LOSS)FROM: | | | | | | | | | | | | | | | | | | | | |
Securities | | | (736,284 | ) | | | (2,751,713 | ) | | | (3,599,840 | ) | | | (351,115 | ) | | | (7,966,822 | ) |
| | |
|
|
| |
|
|
| |
|
|
| |
|
|
| |
|
|
|
NETREALIZEDGAIN (LOSS)FROMINVESTMENTS | | | (736,284 | ) | | | (2,751,713 | ) | | | (3,599,840 | ) | | | (351,115 | ) | | | (7,966,822 | ) |
| | |
|
|
| |
|
|
| |
|
|
| |
|
|
| |
|
|
|
| | | | | |
NETCHANGEINUNREALIZEDAPPRECIATION (DEPRECIATION)OF: | | | | | | | | | | | | | | | | | | | | |
Securities | | | 5,369,732 | | | | 17,671,608 | | | | 33,053,137 | | | | 20,630,635 | | | | 40,837,043 | |
| | |
|
|
| |
|
|
| |
|
|
| |
|
|
| |
|
|
|
NETCHANGEINUNREALIZEDAPPRECIATION (DEPRECIATION)OFINVESTMENTS | | | 5,369,732 | | | | 17,671,608 | | | | 33,053,137 | | | | 20,630,635 | | | | 40,837,043 | |
| | |
|
|
| |
|
|
| |
|
|
| |
|
|
| |
|
|
|
NETREALIZEDANDUNREALIZEDGAIN (LOSS)ONINVESTMENTS | | | 4,633,448 | | | | 14,919,895 | | | | 29,453,297 | | | | 20,279,520 | | | | 32,870,221 | |
| | |
|
|
| |
|
|
| |
|
|
| |
|
|
| |
|
|
|
NETINCREASE (DECREASE)INNETASSETSRESULTINGFROMOPERATIONS | | $ | 5,222,120 | | | $ | 16,168,291 | | | $ | 31,203,208 | | | $ | 21,265,515 | | | $ | 34,017,237 | |
| | |
|
|
| |
|
|
| |
|
|
| |
|
|
| |
|
|
|
(1)NETOFFOREIGNWITHHOLDINGTAXES | | $ | 15,083 | | | $ | 68,129 | | | $ | 79,559 | | | $ | 48,189 | | | $ | 80,838 | |
The accompanying notes are an integral part of these financial statements.
69
| WELLSFARGOOUTLOOKFUNDS | | STATEMENTSOFCHANGESINNETASSETS |
|
| | | OUTLOOKTODAY
| | | OUTLOOK 2010
| |
| | | (Unaudited) For the Six
Months Ended August 31, 2003 | | | For the Year Ended February 28, 2003 | | | (Unaudited) For the Six
Months Ended August 31, 2003 | | | For the Year Ended February 28, 2003 | |
|
INCREASE (DECREASE)INNETASSETS | | | | | | | | | | | | | | | | |
Beginning net assets | | $ | 69,281,351 | | | $ | 74,950,443 | | | $ | 150,087,200 | | | $ | 173,510,852 | |
| | | | |
OPERATIONS: | | | | | | | | | | | | | | | | |
Net investment income (loss) | | | 588,672 | | | | 1,409,695 | | | | 1,248,396 | | | | 2,650,245 | |
Net realized gain (loss) on sale of investments | | | (736,284 | ) | | | 660,829 | | | | (2,751,713 | ) | | | (2,816,073 | ) |
Net change in unrealized appreciation (depreciation) of investments | | | 5,369,732 | | | | (5,577,318 | ) | | | 17,671,608 | | | | (17,218,675 | ) |
| | |
|
|
| |
|
|
| |
|
|
| |
|
|
|
NETINCREASE (DECREASE)INNETASSETSRESULTINGFROMOPERATIONS | | | 5,222,120 | | | | (3,506,794 | ) | | | 16,168,291 | | | | (17,384,503 | ) |
| | |
|
|
| |
|
|
| |
|
|
| |
|
|
|
| | | | |
Distributions to shareholders: | | | | | | | | | | | | | | | | |
Net investment income | | | | | | | | | | | | | | | | |
Class A | | | (324,978 | ) | | | (859,765 | ) | | | (624,834 | ) | | | (1,489,514 | ) |
Class B | | | (137,633 | ) | | | (312,644 | ) | | | (207,596 | ) | | | (497,328 | ) |
Class C | | | (62,856 | ) | | | (129,644 | ) | | | (38,110 | ) | | | (73,300 | ) |
Institutional Class | | | (103,435 | ) | | | (230,965 | ) | | | (479,898 | ) | | | (869,780 | ) |
Net realized gain on sales of investments | | | | | | | | | | | | | | | | |
Class A | | | 0 | | | | (608,063 | ) | | | 0 | | | | (415,153 | ) |
Class B | | | 0 | | | | (337,642 | ) | | | 0 | | | | (196,112 | ) |
Class C | | | 0 | | | | (134,479 | ) | | | 0 | | | | (31,759 | ) |
Institutional Class | | | 0 | | | | (143,553 | ) | | | 0 | | | | (227,943 | ) |
| | | | |
Capital shares transactions: | | | | | | | | | | | | | | | | |
Proceeds from shares sold – Class A | | | 4,307,333 | | | | 6,688,606 | | | | 9,840,645 | | | | 12,208,481 | |
Reinvestment of dividends – Class A | | | 312,993 | | | | 1,405,214 | | | | 608,691 | | | | 1,871,653 | |
Cost of shares redeemed – Class A | | | (4,154,419 | ) | | | (13,127,935 | ) | | | (9,196,250 | ) | | | (24,661,516 | ) |
| | |
|
|
| |
|
|
| |
|
|
| |
|
|
|
NETINCREASE (DECREASE)INNETASSETSRESULTINGFROMCAPITALSHARETRANSACTIONS –CLASSA | | | 465,907 | | | | (5,034,115 | ) | | | 1,253,086 | | | | (10,581,382 | ) |
| | |
|
|
| |
|
|
| |
|
|
| |
|
|
|
Proceeds from shares sold – Class B | | | 3,162,602 | | | | 8,486,378 | | | | 2,461,682 | | | | 5,313,881 | |
Reinvestment of dividends – Class B | | | 126,630 | | | | 608,273 | | | | 195,211 | | | | 655,410 | |
Cost of shares redeemed – Class B | | | (2,422,301 | ) | | | (4,751,063 | ) | | | (3,995,082 | ) | | | (9,400,328 | ) |
| | |
|
|
| |
|
|
| |
|
|
| |
|
|
|
NETINCREASE (DECREASE)INNETASSETSRESULTINGFROMCAPITALSHARETRANSACTIONS –CLASSB | | | 866,931 | | | | 4,343,588 | | | | (1,338,189 | ) | | | (3,431,037 | ) |
| | |
|
|
| |
|
|
| |
|
|
| |
|
|
|
Proceeds from shares sold – Class C | | | 3,543,787 | | | | 3,861,891 | | | | 1,409,100 | | | | 2,713,004 | |
Reinvestment of dividends – Class C | | | 55,328 | | | | 216,881 | | | | 32,902 | | | | 91,765 | |
Cost of shares redeemed – Class C | | | (1,115,261 | ) | | | (3,275,723 | ) | | | (675,188 | ) | | | (2,319,605 | ) |
| | |
|
|
| |
|
|
| |
|
|
| |
|
|
|
NETINCREASE (DECREASE)INNETASSETSRESULTINGFROMCAPITALSHARETRANSACTIONS –CLASSC | | | 2,483,854 | | | | 803,049 | | | | 766,814 | | | | 485,164 | |
| | |
|
|
| |
|
|
| |
|
|
| |
|
|
|
Proceeds from shares sold – Institutional Class | | | 2,321,327 | | | | 4,464,786 | | | | 13,971,673 | | | | 19,228,765 | |
Reinvestment of dividends – Institutional Class | | | 103,435 | | | | 374,517 | | | | 478,732 | | | | 1,095,738 | |
Cost of shares redeemed – Institutional Class | | | (1,075,784 | ) | | | (4,357,368 | ) | | | (5,857,629 | ) | | | (9,035,508 | ) |
| | |
|
|
| |
|
|
| |
|
|
| |
|
|
|
NETINCREASE(DECREASE)INNETASSETSRESULTINGFROMCAPITALSHARETRANSACTIONS –INSTITUTIONALCLASS | | | 1,348,978 | | | | 481,935 | | | | 8,592,776 | | | | 11,288,995 | |
| | |
|
|
| |
|
|
| |
|
|
| |
|
|
|
NETINCREASE (DECREASE)INNETASSETS | | | 9,758,888 | | | | (5,669,092 | ) | | | 24,092,340 | | | | (23,423,652 | ) |
| | |
|
|
| |
|
|
| |
|
|
| |
|
|
|
| | | | |
NETASSETS: | | | | | | | | | | | | | | | | |
|
ENDINGNETASSETS | | $ | 79,040,239 | | | $ | 69,281,351 | | | $ | 174,179,540 | | | $ | 150,087,200 | |
| | |
|
|
| |
|
|
| |
|
|
| |
|
|
|
| | | | |
Shares Issued and Redeemed: | | | | | | | | | | | | | | | | |
Shares sold – Class A | | | 461,910 | | | | 718,015 | | | | 909,798 | | | | 1,122,349 | |
Shares issued in reinvestment of dividends – Class A | | | 33,678 | | | | 151,722 | | | | 56,417 | | | | 173,022 | |
Shares redeemed – Class A | | | (443,260 | ) | | | (1,397,644 | ) | | | (860,625 | ) | | | (2,281,386 | ) |
| | |
|
|
| |
|
|
| |
|
|
| |
|
|
|
NETINCREASE (DECREASE)INSHARESOUTSTANDING –CLASS A | | | 52,328 | | | | (527,907 | ) | | | 105,590 | | | | (986,015 | ) |
| | |
|
|
| |
|
|
| |
|
|
| |
|
|
|
Shares sold – Class B | | | 332,368 | | | | 891,237 | | | | 227,885 | | | | 483,449 | |
Shares issued in reinvestment of dividends – Class B | | | 13,371 | | | | 64,790 | | | | 18,039 | | | | 60,537 | |
Shares redeemed – Class B | | | (256,274 | ) | | | (501,428 | ) | | | (367,764 | ) | | | (875,857 | ) |
| | |
|
|
| |
|
|
| |
|
|
| |
|
|
|
NETINCREASE (DECREASE)INSHARESOUTSTANDING –CLASS B | | | 89,465 | | | | 454,599 | | | | (121,840 | ) | | | (331,871 | ) |
| | |
|
|
| |
|
|
| |
|
|
| |
|
|
|
Shares sold – Class C | | | 374,837 | | | | 409,689 | | | | 128,010 | | | | 247,127 | |
Shares issued in reinvestment of dividends – Class C | | | 5,839 | | | | 23,095 | | | | 3,007 | | | | 8,416 | |
Shares redeemed – Class C | | | (117,392 | ) | | | (346,270 | ) | | | (62,759 | ) | | | (215,148 | ) |
| | |
|
|
| |
|
|
| |
|
|
| |
|
|
|
NETINCREASE (DECREASE)INSHARESOUTSTANDING –CLASS C | | | 263,284 | | | | 86,514 | | | | 68,258 | | | | 40,395 | |
| | |
|
|
| |
|
|
| |
|
|
| |
|
|
|
Shares sold – Institutional Class | | | 245,836 | | | | 472,064 | | | | 1,285,463 | | | | 1,753,928 | |
Shares issued in reinvestment of dividends – Institutional Class | | | 10,956 | | | | 39,864 | | | | 43,930 | | | | 101,128 | |
Shares redeemed – Institutional Class | | | (114,083 | ) | | | (462,937 | ) | | | (537,875 | ) | | | (837,741 | ) |
| | |
|
|
| |
|
|
| |
|
|
| |
|
|
|
NETINCREASE (DECREASE)INSHARESOUTSTANDING—INSTITUTIONALCLASS | | | 142,709 | | | | 48,991 | | | | 791,518 | | | | 1,017,315 | |
| | |
|
|
| |
|
|
| |
|
|
| |
|
|
|
ENDINGBALANCEOFUNDISTRIBUTEDNETINVESTMENTINCOME | | $ | 157,080 | | | $ | 197,310 | | | $ | 297,612 | | | $ | 399,654 | |
| | |
|
|
| |
|
|
| |
|
|
| |
|
|
|
The accompanying notes are an integral part of these financial statements.
70
STATEMENTSOFCHANGESINNETASSETS | | WELLSFARGOOUTLOOKFUNDS |
|
OUTLOOK 2020
| | | OUTLOOK 2030
| | | OUTLOOK 2040
| |
(Unaudited) For the Six
Months Ended August 31, 2003 | | | For the Year Ended February 28, 2003 | | | (Unaudited) For the Six
Months Ended August 31, 2003 | | | For the Year Ended February 28, 2003 | | | (Unaudited) For the Six
Months Ended August 31, 2003 | | | For the Year Ended February 28, 2003 | |
|
| | | | | | | | | | | | | | | | | | | | | | | |
| $ | 231,535,861 | | | $ | 282,207,262 | | | $ | 134,266,749 | | | $ | 162,957,715 | | | $ | 189,121,289 | | | $ | 276,527,541 | |
| | | | | |
| | | | | | | | | | | | | | | | | | | | | | | |
| | 1,749,911 | | | | 3,044,620 | | | | 985,995 | | | | 1,242,447 | | | | 1,147,016 | | | | 1,301,994 | |
| | (3,599,840 | ) | | | (7,066,070 | ) | | | (351,115 | ) | | | 4,360,208 | | | | (7,966,822 | ) | | | (11,734,874 | ) |
| | | | | |
| | 33,053,137 | | | | (37,265,991 | ) | | | 20,630,635 | | | | (33,904,046 | ) | | | 40,837,043 | | | | (43,342,406 | ) |
|
|
| |
|
|
| |
|
|
| |
|
|
| |
|
|
| |
|
|
|
| | | | | |
| | 31,203,208 | | | | (41,287,441 | ) | | | 21,265,515 | | | | (28,301,391 | ) | | | 34,017,237 | | | | (53,775,286 | ) |
|
|
| |
|
|
| |
|
|
| |
|
|
| |
|
|
| |
|
|
|
| | | | | |
| | | | | | | | | | | | | | | | | | | | | | | |
| | | | | | | | | | | | | | | | | | | | | | | |
| | (745,696 | ) | | | (1,504,771 | ) | | | (516,501 | ) | | | (839,357 | ) | | | (703,192 | ) | | | (928,018 | ) |
| | (127,238 | ) | | | (249,459 | ) | | | (78,922 | ) | | | (101,914 | ) | | | (164,906 | ) | | | (128,086 | ) |
| | (23,799 | ) | | | (39,013 | ) | | | (13,234 | ) | | | (11,503 | ) | | | (14,866 | ) | | | (10,401 | ) |
| | (753,508 | ) | | | (1,433,375 | ) | | | (298,752 | ) | | | (415,526 | ) | | | (246,429 | ) | | | (318,252 | ) |
| | | | | | | | | | | | | | | | | | | | | | | |
| | 0 | | | | 0 | | | | 0 | | | | (3,178,411 | ) | | | 0 | | | | (931,523 | ) |
| | 0 | | | | 0 | | | | 0 | | | | (860,602 | ) | | | 0 | | | | (377,802 | ) |
| | 0 | | | | 0 | | | | 0 | | | | (109,004 | ) | | | 0 | | | | (32,777 | ) |
| | 0 | | | | 0 | | | | 0 | | | | (1,243,501 | ) | | | 0 | | | | (224,797 | ) |
| | | | | |
| | | | | | | | | | | | | | | | | | | | | | | |
| | 16,495,745 | | | | 18,584,376 | | | | 10,936,735 | | | | 16,044,412 | | | | 9,870,965 | | | | 8,099,258 | |
| | 733,731 | | | | 1,479,925 | | | | 505,100 | | | | 3,942,122 | | | | 691,602 | | | | 1,830,320 | |
| | (8,954,285 | ) | | | (31,134,712 | ) | | | (7,077,933 | ) | | | (24,127,695 | ) | | | (9,104,538 | ) | | | (34,123,589 | ) |
|
|
| |
|
|
| |
|
|
| |
|
|
| |
|
|
| |
|
|
|
| | | | | |
| | 8,275,191 | | | | (11,070,411 | ) | | | 4,363,902 | | | | (4,141,161 | ) | | | 1,458,029 | | | | (24,194,011 | ) |
|
|
| |
|
|
| |
|
|
| |
|
|
| |
|
|
| |
|
|
|
| | 2,311,037 | | | | 3,269,971 | | | | 1,583,393 | | | | 1,855,318 | | | | 898,518 | | | | 2,165,007 | |
| | 123,152 | | | | 243,278 | | | | 76,586 | | | | 945,870 | | | | 161,238 | | | | 496,898 | |
| | (5,105,012 | ) | | | (9,213,313 | ) | | | (3,716,618 | ) | | | (4,620,414 | ) | | | (7,735,982 | ) | | | (12,315,454 | ) |
|
|
| |
|
|
| |
|
|
| |
|
|
| |
|
|
| |
|
|
|
| | | | | |
| | (2,670,823 | ) | | | (5,700,064 | ) | | | (2,056,639 | ) | | | (1,819,226 | ) | | | (6,676,226 | ) | | | (9,653,549 | ) |
|
|
| |
|
|
| |
|
|
| |
|
|
| |
|
|
| |
|
|
|
| | 1,284,793 | | | | 1,953,378 | | | | 1,224,713 | | | | 1,533,660 | | | | 352,364 | | | | 1,134,903 | |
| | 23,176 | | | | 36,735 | | | | 12,850 | | | | 117,216 | | | | 14,118 | | | | 40,761 | |
| | (530,170 | ) | | | (2,359,923 | ) | | | (413,719 | ) | | | (1,543,918 | ) | | | (702,674 | ) | | | (1,698,555 | ) |
|
|
| |
|
|
| |
|
|
| |
|
|
| |
|
|
| |
|
|
|
| | | | | |
| | 777,799 | | | | (369,810 | ) | | | 823,844 | | | | 106,958 | | | | (336,192 | ) | | | (522,891 | ) |
|
|
| |
|
|
| |
|
|
| |
|
|
| |
|
|
| |
|
|
|
| | 22,366,300 | | | | 24,270,120 | | | | 8,345,353 | | | | 14,736,524 | | | | 7,467,531 | | | | 11,665,291 | |
| | 750,345 | | | | 1,426,395 | | | | 297,479 | | | | 1,651,150 | | | | 246,006 | | | | 542,010 | |
| | (12,469,297 | ) | | | (14,713,572 | ) | | | (5,823,309 | ) | | | (4,164,002 | ) | | | (8,095,812 | ) | | | (8,516,160 | ) |
|
|
| |
|
|
| |
|
|
| |
|
|
| |
|
|
| |
|
|
|
| | | | | |
| | 10,647,348 | | | | 10,982,943 | | | | 2,819,523 | | | | 12,223,672 | | | | (382,275 | ) | | | 3,691,141 | |
|
|
| |
|
|
| |
|
|
| |
|
|
| |
|
|
| |
|
|
|
| | 46,582,482 | | | | (50,671,401 | ) | | | 26,308,736 | | | | (28,690,966 | ) | | | 26,951,180 | | | | (87,406,252 | ) |
|
|
| |
|
|
| |
|
|
| |
|
|
| |
|
|
| |
|
|
|
| | | | | |
| | | | | | | | | | | | | | | | | | | | | | | |
|
| $ | 278,118,343 | | | $ | 231,535,861 | | | $ | 160,575,485 | | | $ | 134,266,749 | | | $ | 216,072,469 | | | $ | 189,121,289 | |
|
|
| |
|
|
| |
|
|
| |
|
|
| |
|
|
| |
|
|
|
| | | | | |
| | | | | | | | | | | | | | | | | | | | | | | |
| | 1,458,388 | | | | 1,656,509 | | | | 953,664 | | | | 1,378,313 | | | | 834,942 | | | | 655,770 | |
| | 65,839 | | | | 133,253 | | | | 44,121 | | | | 355,125 | | | | 59,147 | | | | 161,647 | |
| | (805,969 | ) | | | (2,806,124 | ) | | | (618,479 | ) | | | (2,051,468 | ) | | | (785,127 | ) | | | (2,876,277 | ) |
|
|
| |
|
|
| |
|
|
| |
|
|
| |
|
|
| |
|
|
|
| | | | | |
| | 718,258 | | | | (1,016,362 | ) | | | 379,306 | | | | (318,030 | ) | | | 108,962 | | | | (2,058,860 | ) |
|
|
| |
|
|
| |
|
|
| |
|
|
| |
|
|
| |
|
|
|
| | 209,292 | | | | 286,811 | | | | 139,510 | | | | 155,845 | | | | 78,879 | | | | 178,378 | |
| | 11,106 | | | | 22,061 | | | | 6,765 | | | | 87,222 | | | | 14,210 | | | | 45,490 | |
| | (463,155 | ) | | | (840,904 | ) | | | (332,502 | ) | | | (399,796 | ) | | | (680,779 | ) | | | (1,086,883 | ) |
|
|
| |
|
|
| |
|
|
| |
|
|
| |
|
|
| |
|
|
|
| | | | | |
| | (242,757 | ) | | | (532,032 | ) | | | (186,227 | ) | | | (156,729 | ) | | | (587,690 | ) | | | (863,015 | ) |
|
|
| |
|
|
| |
|
|
| |
|
|
| |
|
|
| |
|
|
|
| | 113,366 | | | | 172,405 | | | | 108,864 | | | | 130,944 | | | | 31,235 | | | | 97,954 | |
| | 2,074 | | | | 3,309 | | | | 1,132 | | | | 10,791 | | | | 1,243 | | | | 3,741 | |
| | (47,620 | ) | | | (212,480 | ) | | | (37,418 | ) | | | (131,231 | ) | | | (62,439 | ) | | | (150,345 | ) |
|
|
| |
|
|
| |
|
|
| |
|
|
| |
|
|
| |
|
|
|
| | | | | |
| | 67,820 | | | | (36,766 | ) | | | 72,578 | | | | 10,504 | | | | (29,961 | ) | | | (48,650 | ) |
|
|
| |
|
|
| |
|
|
| |
|
|
| |
|
|
| |
|
|
|
| | 1,955,239 | | | | 2,136,718 | | | | 717,700 | | | | 1,246,693 | | | | 627,100 | | | | 957,239 | |
| | | | | |
| | 66,786 | | | | 127,432 | | | | 25,807 | | | | 147,373 | | | | 20,780 | | | | 47,338 | |
| | (1,111,374 | ) | | | (1,312,191 | ) | | | (500,706 | ) | | | (349,134 | ) | | | (669,290 | ) | | | (713,391 | ) |
|
|
| |
|
|
| |
|
|
| |
|
|
| |
|
|
| |
|
|
|
| | | | | |
| | 910,651 | | | | 951,959 | | | | 242,801 | | | | 1,044,932 | | | | (21,410 | ) | | | 291,186 | |
|
|
| |
|
|
| |
|
|
| |
|
|
| |
|
|
| |
|
|
|
| | | | | |
| $ | 477,123 | | | $ | 377,453 | | | $ | 263,650 | | | $ | 185,064 | | | $ | 261,115 | | | $ | 243,492 | |
|
|
| |
|
|
| |
|
|
| |
|
|
| |
|
|
| |
|
|
|
71
| WELLSFARGOOUTLOOKFUNDS | | FINANCIALHIGHLIGHTS |
|
| | | | | | |
| | | Beginning Net Asset Value Per Share | | Net
Investment
Income
(Loss) | | Net Realized
and Unrealized
Gain (Loss) on
Investments | | | Dividends
From Net
Investment
Income | | | Distributions
From Net
Realized
Gains | | | Return
of Capital |
|
| | | | | | |
OUTLOOKTODAY | | | | | | | | | | | | | | | | |
| | | | | | |
ASHARES | | | | | | | | | | | | | | | | |
March 1, 2003 to August 31, 2003 (Unaudited) | | $ | 8.96 | | 0.09 | | 0.58 | | | (0.09 | ) | | 0.00 | | | N/A |
March 1, 2002 to February 28, 2003 | | $ | 9.79 | | 0.21 | | (0.66 | ) | | (0.22 | ) | | (0.16 | ) | | N/A |
March 1, 2001 to February 28, 2002 | | $ | 9.94 | | 0.29 | | (0.09 | ) | | (0.29 | ) | | (0.06 | ) | | N/A |
March 1, 2000 to February 28, 2001 | | $ | 10.30 | | 0.38 | | 0.21 | | | (0.39 | ) | | (0.56 | ) | | N/A |
March 1, 1999 to February 29, 2000 | | $ | 10.52 | | 0.38 | | 0.09 | | | (0.36 | ) | | (0.33 | ) | | N/A |
March 1, 1998 to February 28, 1999 | | $ | 10.83 | | 0.36 | | 0.32 | | | (0.37 | ) | | (0.62 | ) | | N/A |
| | | | | | |
BSHARES | | | | | | | | | | | | | | | | |
March 1, 2003 to August 31, 2003 (Unaudited) | | $ | 9.12 | | 0.05 | | 0.60 | | | (0.06 | ) | | 0.00 | | | N/A |
March 1, 2002 to February 28, 2003 | | $ | 9.96 | | 0.15 | | (0.66 | ) | | (0.17 | ) | | (0.16 | ) | | N/A |
March 1, 2001 to February 28, 2002 | | $ | 10.11 | | 0.23 | | (0.08 | ) | | (0.24 | ) | | (0.06 | ) | | N/A |
March 1, 2000 to February 28, 2001 | | $ | 10.44 | | 0.31 | | 0.24 | | | (0.32 | ) | | (0.56 | ) | | N/A |
March 1, 1999 to February 29, 2000 | | $ | 10.61 | | 0.27 | | 0.14 | | | (0.25 | ) | | (0.33 | ) | | N/A |
August 1, 1998(3) to February 28, 1999 | | $ | 10.91 | | 0.07 | | 0.29 | | | (0.04 | ) | | (0.62 | ) | | N/A |
| | | | | | |
CSHARES | | | | | | | | | | | | | | | | |
March 1, 2003 to August 31, 2003 (Unaudited) | | $ | 9.11 | | 0.06 | | 0.59 | | | (0.07 | ) | | 0.00 | | | N/A |
March 1, 2002 to February 28, 2003 | | $ | 9.94 | | 0.16 | | (0.66 | ) | | (0.17 | ) | | (0.16 | ) | | N/A |
March 1, 2001 to February 28, 2002 | | $ | 10.09 | | 0.23 | | (0.08 | ) | | (0.24 | ) | | (0.06 | ) | | N/A |
March 1, 2000 to February 28, 2001 | | $ | 10.44 | | 0.34 | | 0.21 | | | (0.34 | ) | | (0.56 | ) | | N/A |
March 1, 1999 to February 29, 2000 | | $ | 10.62 | | 0.29 | | 0.12 | | | (0.26 | ) | | (0.33 | ) | | N/A |
December 1, 1998(3) to February 28, 1999 | | $ | 11.24 | | 0.04 | | (0.04 | ) | | (0.01 | ) | | (0.61 | ) | | N/A |
| | | | | | |
INSTITUTIONALSHARES | | | | | | | | | | | | | | | | |
March 1, 2003 to August 31, 2003 (Unaudited) | | $ | 9.10 | | 0.10 | | 0.59 | | | (0.10 | ) | | 0.00 | | | N/A |
March 1, 2002 to February 28, 2003 | | $ | 9.94 | | 0.23 | | (0.66 | ) | | (0.25 | ) | | (0.16 | ) | | N/A |
March 1, 2001 to February 28, 2002 | | $ | 10.08 | | 0.30 | | (0.07 | ) | | (0.31 | ) | | (0.06 | ) | | N/A |
March 1, 2000 to February 28, 2001 | | $ | 10.36 | | 0.36 | | 0.25 | | | (0.33 | ) | | (0.56 | ) | | N/A |
November 8, 1999(3) to February 29, 2000 | | $ | 10.66 | | 0.08 | | 0.00 | | | (0.05 | ) | | (0.33 | ) | | N/A |
| | | | | | |
OUTLOOK 2010 | | | | | | | | | | | | | | | | |
|
| | | | | | |
ASHARES | | | | | | | | | | | | | | | | |
March 1, 2003 to August 31, 2003 (Unaudited) | | $ | 10.25 | | 0.08 | | 1.01 | | | (0.09 | ) | | 0.00 | | | N/A |
March 1, 2002 to February 28, 2003 | | $ | 11.65 | | 0.19 | | (1.33 | ) | | (0.20 | ) | | (0.06 | ) | | N/A |
March 1, 2001 to February 28, 2002 | | $ | 12.22 | | 0.28 | | (0.45 | ) | | (0.27 | ) | | (0.13 | ) | | N/A |
March 1, 2000 to February 28, 2001 | | $ | 12.88 | | 0.35 | | (0.15 | ) | | (0.35 | ) | | (0.51 | ) | | N/A |
March 1, 1999 to February 29, 2000 | | $ | 13.27 | | 0.34 | | 0.66 | | | (0.34 | ) | | (1.05 | ) | | N/A |
March 1, 1998 to February 28, 1999 | | $ | 13.16 | | 0.32 | | 0.94 | | | (0.33 | ) | | (0.82 | ) | | N/A |
| | | | | | |
BSHARES | | | | | | | | | | | | | | | | |
March 1, 2003 to August 31, 2003 (Unaudited) | | $ | 10.26 | | 0.05 | | 1.01 | | | (0.07 | ) | | 0.00 | | | N/A |
March 1, 2002 to February 28, 2003 | | $ | 11.66 | | 0.13 | | (1.33 | ) | | (0.14 | ) | | (0.06 | ) | | N/A |
March 1, 2001 to February 28, 2002 | | $ | 12.23 | | 0.20 | | (0.43 | ) | | (0.21 | ) | | (0.13 | ) | | N/A |
March 1, 2000 to February 28, 2001 | | $ | 12.88 | | 0.28 | | (0.14 | ) | | (0.28 | ) | | (0.51 | ) | | N/A |
March 1, 1999 to February 29, 2000 | | $ | 13.25 | | 0.25 | | 0.68 | | | (0.25 | ) | | (1.05 | ) | | N/A |
March 1, 1998 to February 28, 1999 | | $ | 13.10 | | 0.22 | | 0.97 | | | (0.22 | ) | | (0.82 | ) | | N/A |
| | | | | | |
CSHARES | | | | | | | | | | | | | | | | |
March 1, 2003 to August 31, 2003 (Unaudited) | | $ | 10.35 | | 0.05 | | 1.02 | | | (0.07 | ) | | 0.00 | | | N/A |
March 1, 2002 to February 28, 2003 | | $ | 11.75 | | 0.13 | | (1.33 | ) | | (0.14 | ) | | (0.06 | ) | | N/A |
March 1, 2001 to February 28, 2002 | | $ | 12.32 | | 0.20 | | (0.43 | ) | | (0.21 | ) | | (0.13 | ) | | N/A |
March 1, 2000 to February 28, 2001 | | $ | 12.97 | | 0.29 | | (0.16 | ) | | (0.27 | ) | | (0.51 | ) | | N/A |
March 1, 1999 to February 29, 2000 | | $ | 13.29 | | 0.21 | | 0.72 | | | (0.20 | ) | | (1.05 | ) | | N/A |
December 1, 1998(3) to February 28, 1999 | | $ | 13.98 | | 0.04 | | 0.09 | | | 0.00 | (4) | | (0.82 | ) | | N/A |
| | | | | | |
INSTITUTIONALSHARES | | | | | | | | | | | | | | | | |
March 1, 2003 to August 31, 2003 (Unaudited) | | $ | 10.33 | | 0.11 | | 1.01 | | | (0.11 | ) | | 0.00 | | | N/A |
March 1, 2002 to February 28, 2003 | | $ | 11.75 | | 0.21 | | (1.33 | ) | | (0.24 | ) | | (0.06 | ) | | N/A |
March 1, 2001 to February 28, 2002 | | $ | 12.32 | | 0.29 | | (0.43 | ) | | (0.30 | ) | | (0.13 | ) | | N/A |
March 1, 2000 to February 28, 2001 | | $ | 12.95 | | 0.33 | | (0.12 | ) | | (0.33 | ) | | (0.51 | ) | | N/A |
November 8, 1999 (3) to February 29, 2000 | | $ | 13.83 | | 0.07 | | 0.13 | | | (0.03 | ) | | (1.05 | ) | | N/A |
| (1) | | These ratios include income earned and expenses charged to each fund. Annualized for periods of less than one year. |
| (2) | | Total return calculations do not include any sales charges, and would have been lower had certain expenses not been waived or reimbursed during the periods shown. Returns for periods less than one year are not annualized. |
| (3) | | Commencement of operations. |
| (4) | | Distribution was less than $0.01 per share |
| (5) | | Calculated based upon average shares outstanding. |
The accompanying notes are an integral part of these financial statements.
72
FINANCIALHIGHLIGHTS | | WELLSFARGOOUTLOOKFUNDS |
|
Ending
Net Asset
Value Per
Share | | Ratio to Average Net Assets (Annualized)(1)
| | | Total
Return(2) | | | Portfolio
Turnover
Rate | | | Net Assets at
End of Period
(000’s Omitted) |
| | Net Investment
Income (Loss) | | | Net
Expenses | | | Gross
Expenses | | | | |
| | | | | | | | | | | | | | | | | | | | |
|
| | | | | | |
| | | | | | | | | | | | | | | | | | | | |
| | | | | | |
| | | | | | | | | | | | | | | | | | | | |
| $ | 9.54 | | 1.76 | % | | 1.30 | % | | 1.46 | % | | 7.47 | % | | 13 | % | | $ | 35,945 |
| $ | 8.96 | | 2.12 | % | | 1.30 | % | | 1.60 | % | | (4.63 | )% | | 53 | % | | $ | 33,299 |
| $ | 9.79 | | 2.85 | % | | 1.30 | % | | 1.63 | % | | 2.06 | % | | 51 | % | | $ | 41,543 |
| $ | 9.94 | | 3.66 | % | | 1.30 | % | | 1.51 | % | | 5.79 | % | | 58 | % | | $ | 46,316 |
| $ | 10.30 | | 3.29 | % | | 1.30 | % | | 1.45 | % | | 4.47 | % | | 55 | % | | $ | 44,801 |
| $ | 10.52 | | 3.27 | % | | 1.25 | % | | 1.31 | % | | 6.40 | % | | 66 | % | | $ | 56,986 |
| | | | | | |
| | | | | | | | | | | | | | | | | | | | |
| $ | 9.71 | | 1.17 | % | | 1.89 | % | | 2.21 | % | | 7.19 | % | | 13 | % | | $ | 21,541 |
| $ | 9.12 | | 1.60 | % | | 1.80 | % | | 2.28 | % | | (5.15 | )% | | 53 | % | | $ | 19,428 |
| $ | 9.96 | | 2.31 | % | | 1.80 | % | | 2.26 | % | | 1.54 | % | | 51 | % | | $ | 16,678 |
| $ | 10.11 | | 3.15 | % | | 1.80 | % | | 2.00 | % | | 5.30 | % | | 58 | % | | $ | 11,425 |
| $ | 10.44 | | 2.76 | % | | 1.80 | % | | 2.17 | % | | 3.87 | % | | 55 | % | | $ | 6,457 |
| $ | 10.61 | | 2.24 | % | | 1.70 | % | | 3.01 | % | | 3.35 | % | | 66 | % | | $ | 3,161 |
| | | | | | |
| | | | | | | | | | | | | | | | | | | | |
| $ | 9.69 | | 1.15 | % | | 1.90 | % | | 2.22 | % | | 7.10 | % | | 13 | % | | $ | 10,873 |
| $ | 9.11 | | 1.61 | % | | 1.80 | % | | 2.23 | % | | (5.06 | )% | | 53 | % | | $ | 7,822 |
| $ | 9.94 | | 2.32 | % | | 1.80 | % | | 2.26 | % | | 1.52 | % | | 51 | % | | $ | 7,678 |
| $ | 10.09 | | 3.19 | % | | 1.80 | % | | 1.97 | % | | 5.36 | % | | 58 | % | | $ | 5,972 |
| $ | 10.44 | | 2.77 | % | | 1.80 | % | | 2.13 | % | | 3.91 | % | | 55 | % | | $ | 7,243 |
| $ | 10.62 | | 2.27 | % | | 1.76 | % | | 2.66 | % | | 0.02 | % | | 66 | % | | $ | 4,758 |
| | | | | | |
| | | | | | | | | | | | | | | | | | | | |
| $ | 9.69 | | 2.05 | % | | 1.00 | % | | 1.13 | % | | 7.62 | % | | 13 | % | | $ | 10,681 |
| $ | 9.10 | | 2.42 | % | | 1.00 | % | | 1.17 | % | | (4.32 | )% | | 53 | % | | $ | 8,732 |
| $ | 9.94 | | 3.06 | % | | 1.03 | % | | 1.29 | % | | 2.40 | % | | 51 | % | | $ | 9,052 |
| $ | 10.08 | | 3.88 | % | | 1.04 | % | | 1.16 | % | | 5.94 | % | | 58 | % | | $ | 3,954 |
| $ | 10.36 | | 3.56 | % | | 1.00 | % | | 1.05 | % | | 0.53 | % | | 55 | % | | $ | 134 |
| | | | | | |
| | | | | | | | | | | | | | | | | | | | |
|
| | | | | | |
| | | | | | | | | | | | | | | | | | | | |
| $ | 11.25 | | 1.57 | % | | 1.30 | % | | 1.41 | % | | 10.69 | % | | 16 | % | | $ | 76,850 |
| $ | 10.25 | | 1.69 | % | | 1.30 | % | | 1.44 | % | | (9.86 | )% | | 65 | % | | $ | 68,977 |
| $ | 11.65 | | 2.25 | % | | 1.30 | % | | 1.53 | % | | (1.43 | )% | | 39 | % | | $ | 89,878 |
| $ | 12.22 | | 2.74 | % | | 1.30 | % | | 1.43 | % | | 1.41 | % | | 54 | % | | $ | 107,161 |
| $ | 12.88 | | 2.45 | % | | 1.30 | % | | 1.39 | % | | 7.50 | % | | 49 | % | | $ | 89,056 |
| $ | 13.27 | | 2.42 | % | | 1.25 | % | | 1.28 | % | | 9.91 | % | | 38 | % | | $ | 89,543 |
| | | | | | |
| | | | | | | | | | | | | | | | | | | | |
| $ | 11.25 | | 0.98 | % | | 1.89 | % | | 2.16 | % | | 10.32 | % | | 16 | % | | $ | 34,622 |
| $ | 10.26 | | 1.19 | % | | 1.80 | % | | 2.13 | % | | (10.34 | )% | | 65 | % | | $ | 32,831 |
| $ | 11.66 | | 1.73 | % | | 1.80 | % | | 2.12 | % | | (1.92 | )% | | 39 | % | | $ | 41,166 |
| $ | 12.23 | | 2.23 | % | | 1.80 | % | | 1.95 | % | | 0.93 | % | | 54 | % | | $ | 36,727 |
| $ | 12.88 | | 1.93 | % | | 1.80 | % | | 1.94 | % | | 6.96 | % | | 49 | % | | $ | 29,937 |
| $ | 13.25 | | 1.90 | % | | 1.76 | % | | 1.84 | % | | 9.30 | % | | 38 | % | | $ | 18,158 |
| | | | | | |
| | | | | | | | | | | | | | | | | | | | |
| $ | 11.35 | | 0.96 | % | | 1.90 | % | | 2.16 | % | | 10.34 | % | | 16 | % | | $ | 6,947 |
| $ | 10.35 | | 1.18 | % | | 1.80 | % | | 2.21 | % | | (10.29 | )% | | 65 | % | | $ | 5,631 |
| $ | 11.75 | | 1.74 | % | | 1.80 | % | | 2.12 | % | | (1.90 | )% | | 39 | % | | $ | 5,919 |
| $ | 12.32 | | 2.24 | % | | 1.80 | % | | 1.96 | % | | 0.89 | % | | 54 | % | | $ | 5,850 |
| $ | 12.97 | | 1.88 | % | | 1.80 | % | | 2.52 | % | | 6.91 | % | | 49 | % | | $ | 5,364 |
| $ | 13.29 | | 2.04 | % | | 1.76 | % | | 7.72 | % | | 1.11 | % | | 38 | % | | $ | 675 |
| | | | | | |
| | | | | | | | | | | | | | | | | | | | |
| $ | 11.34 | | 1.86 | % | | 1.00 | % | | 1.08 | % | | 10.86 | % | | 16 | % | | $ | 55,761 |
| $ | 10.33 | | 1.98 | % | | 1.00 | % | | 1.05 | % | | (9.60 | )% | | 65 | % | | $ | 42,649 |
| $ | 11.75 | | 2.48 | % | | 1.03 | % | | 1.21 | % | | (1.14 | )% | | 39 | % | | $ | 36,548 |
| $ | 12.32 | | 3.03 | % | | 1.04 | % | | 1.08 | % | | 1.52 | % | | 54 | % | | $ | 22,299 |
| $ | 12.95 | | 2.72 | % | | 1.00 | % | | 1.01 | % | | 1.08 | % | | 49 | % | | $ | 1,661 |
73
| WELLSFARGOOUTLOOKFUNDS | | FINANCIALHIGHLIGHTS |
|
| | | Beginning Net Asset Value Per Share | | Net
Investment
Income
(Loss) | | Net Realized
and Unrealized
Gain (Loss) on
Investments | | | Dividends
From Net
Investment
Income | | | Distributions
From Net
Realized
Gains | | | Return
of Capital | |
| | | | | | | | | | | | | | | | | | |
|
| | | | | | |
OUTLOOK 2020 | | | | | | | | | | | | | | | | | |
| | | | | | |
ASHARES | | | | | | | | | | | | | | | | | |
March 1, 2003 to August 31, 2003 (Unaudited) | | $ | 10.36 | | 0.07 | | 1.32 | | | (0.07 | ) | | 0.00 | | | N/A | |
March 1, 2002 to February 28, 2003 | | $ | 12.29 | | 0.14 | | (1.93 | ) | | (0.14 | ) | | 0.00 | | | N/A | |
March 1, 2001 to February 28, 2002 | | $ | 13.28 | | 0.13 | | (0.87 | ) | | (0.14 | ) | | (0.11 | ) | | N/A | |
March 1, 2000 to February 28, 2001 | | $ | 14.78 | | 0.24 | | (0.75 | ) | | (0.23 | ) | | (0.74 | ) | | (0.02 | ) |
March 1, 1999 to February 29, 2000 | | $ | 14.91 | | 0.24 | | 1.33 | | | (0.24 | ) | | (1.46 | ) | | N/A | |
March 1, 1998 to February 28, 1999 | | $ | 14.70 | | 0.24 | | 1.47 | | | (0.25 | ) | | (1.25 | ) | | N/A | |
| | | | | | |
BSHARES | | | | | | | | | | | | | | | | | |
March 1, 2003 to August 31, 2003 (Unaudited) | | $ | 10.28 | | 0.04 | | 1.30 | | | (0.04 | ) | | 0.00 | | | N/A | |
March 1, 2002 to February 28, 2003 | | $ | 12.18 | | 0.07 | | (1.90 | ) | | (0.07 | ) | | 0.00 | | | N/A | |
March 1, 2001 to February 28, 2002 | | $ | 13.17 | | 0.07 | | (0.87 | ) | | (0.08 | ) | | (0.11 | ) | | N/A | |
March 1, 2000 to February 28, 2001 | | $ | 14.66 | | 0.16 | | (0.74 | ) | | (0.16 | ) | | (0.74 | ) | | (0.01 | ) |
March 1, 1999 to February 29, 2000 | | $ | 14.79 | | 0.15 | | 1.33 | | | (0.15 | ) | | (1.46 | ) | | N/A | |
March 1, 1998 to February 28, 1999 | | $ | 14.55 | | 0.15 | | 1.48 | | | (0.15 | ) | | (1.24 | ) | | N/A | |
| | | | | | |
CSHARES | | | | | | | | | | | | | | | | | |
March 1, 2003 to August 31, 2003 (Unaudited) | | $ | 10.34 | | 0.05 | | 1.31 | | | (0.05 | ) | | 0.00 | | | N/A | |
March 1, 2002 to February 28, 2003 | | $ | 12.26 | | 0.07 | | (1.92 | ) | | (0.07 | ) | | 0.00 | | | N/A | |
March 1, 2001 to February 28, 2002 | | $ | 13.25 | | 0.07 | | (0.87 | ) | | (0.08 | ) | | (0.11 | ) | | N/A | |
March 1, 2000 to February 28, 2001 | | $ | 14.74 | | 0.16 | | (0.74 | ) | | (0.16 | ) | | (0.74 | ) | | (0.01 | ) |
March 1, 1999 to February 29, 2000 | | $ | 14.82 | | 0.11 | | 1.37 | | | (0.10 | ) | | (1.46 | ) | | N/A | |
December 1, 1998(3) to February 28, 1999 | | $ | 15.82 | | 0.01 | | 0.22 | | | 0.00 | (4) | | (1.23 | ) | | N/A | |
| | | | | | |
INSTITUTIONALSHARES | | | | | | | | | | | | | | | | | |
March 1, 2003 to August 31, 2003 (Unaudited) | | $ | 10.47 | | 0.10 | | 1.32 | | | (0.09 | ) | | 0.00 | | | N/A | |
March 1, 2002 to February 28, 2003 | | $ | 12.42 | | 0.17 | | (1.94 | ) | | (0.18 | ) | | 0.00 | | | N/A | |
March 1, 2001 to February 28, 2002 | | $ | 13.42 | | 0.16 | | (0.87 | ) | | (0.18 | ) | | (0.11 | ) | | N/A | |
March 1, 2000 to February 28, 2001 | | $ | 14.89 | | 0.24 | | (0.72 | ) | | (0.23 | ) | | (0.74 | ) | | (0.02 | ) |
November 8, 1999(3) to February 29, 2000 | | $ | 16.01 | | 0.06 | | 0.30 | | | (0.02 | ) | | (1.46 | ) | | N/A | |
| | | | | | |
OUTLOOK 2030 | | | | | | | | | | | | | | | | | |
|
| | | | | | |
ASHARES | | | | | | | | | | | | | | | | | |
March 1, 2003 to August 31, 2003 (Unaudited) | | $ | 10.48 | | 0.08 | | 1.57 | | | (0.07 | ) | | 0.00 | | | N/A | |
March 1, 2002 to February 28, 2003 | | $ | 13.34 | | 0.11 | | (2.40 | ) | | (0.12 | ) | | (0.45 | ) | | N/A | |
March 1, 2001 to February 28, 2002 | | $ | 15.13 | | 0.12 | | (1.43 | ) | | (0.12 | ) | | (0.36 | ) | | N/A | |
March 1, 2000 to February 28, 2001 | | $ | 16.96 | | 0.17 | | (1.17 | ) | | (0.16 | ) | | (0.67 | ) | | N/A | |
March 1, 1999 to February 29, 2000 | | $ | 17.15 | | 0.17 | | 2.03 | | | (0.17 | ) | | (2.22 | ) | | N/A | |
March 1, 1998 to February 28, 1999 | | $ | 16.51 | | 0.18 | | 1.93 | | | (0.19 | ) | | (1.28 | ) | | N/A | |
| | | | | | |
BSHARES | | | | | | | | | | | | | | | | | |
March 1, 2003 to August 31, 2003 (Unaudited) | | $ | 10.32 | | 0.04 | | 1.54 | | | (0.04 | ) | | 0.00 | | | N/A | |
March 1, 2002 to February 28, 2003 | | $ | 13.13 | | 0.04 | | (2.35 | ) | | (0.05 | ) | | (0.45 | ) | | N/A | |
March 1, 2001 to February 28, 2002 | | $ | 14.88 | | 0.05 | | (1.39 | ) | | (0.05 | ) | | (0.36 | ) | | N/A | |
March 1, 2000 to February 28, 2001 | | $ | 16.72 | | 0.07 | | (1.16 | ) | | (0.08 | ) | | (0.67 | ) | | N/A | |
March 1, 1999 to February 29, 2000 | | $ | 16.93 | | 0.08 | | 2.01 | | | (0.08 | ) | | (2.22 | ) | | N/A | |
March 1, 1998 to February 28, 1999 | | $ | 16.28 | | 0.09 | | 1.92 | | | (0.10 | ) | | (1.26 | ) | | N/A | |
| | | | | | |
CSHARES | | | | | | | | | | | | | | | | | |
March 1, 2003 to August 31, 2003 (Unaudited) | | $ | 10.33 | | 0.05 | | 1.54 | | | (0.05 | ) | | 0.00 | | | N/A | |
March 1, 2002 to February 28, 2003 | | $ | 13.14 | | 0.05 | | (2.36 | ) | | (0.05 | ) | | (0.45 | ) | | N/A | |
March 1, 2001 to February 28, 2002 | | $ | 14.90 | | 0.04 | | (1.39 | ) | | (0.05 | ) | | (0.36 | ) | | N/A | |
March 1, 2000 to February 28, 2001 | | $ | 16.74 | | 0.08 | | (1.17 | ) | | (0.08 | ) | | (0.67 | ) | | N/A | |
March 1, 1999 to February 29, 2000 | | $ | 16.94 | | 0.06 | | 2.01 | | | (0.05 | ) | | (2.22 | ) | | N/A | |
December 1, 1998(3) to February 28, 1999 | | $ | 17.89 | | 0.00 | | 0.31 | | | 0.00 | (4) | | (1.26 | ) | | N/A | |
| | | | | | |
INSTITUTIONALSHARES | | | | | | | | | | | | | | | | | |
March 1, 2003 to August 31, 2003 (Unaudited) | | $ | 10.57 | | 0.10 | | 1.58 | | | (0.09 | ) | | 0.00 | | | N/A | |
March 1, 2002 to February 28, 2003 | | $ | 13.45 | | 0.14 | | (2.41 | ) | | (0.16 | ) | | (0.45 | ) | | N/A | |
March 1, 2001 to February 28, 2002 | | $ | 15.24 | | 0.15 | | (1.42 | ) | | (0.16 | ) | | (0.36 | ) | | N/A | |
March 1, 2001 to February 28, 2001 | | $ | 17.07 | | 0.17 | | (1.16 | ) | | (0.17 | ) | | (0.67 | ) | | N/A | |
November 8, 1999(3) to February 29, 2000 | | $ | 18.73 | | 0.03 | | 0.54 | | | (0.01 | ) | | (2.22 | ) | | N/A | |
| (1) | | These ratios include income earned and expenses charged to each fund. Annualized for periods of less than one year. |
| (2) | | Total return calculations do not include any sales charges, and would have been lower had certain expenses not been waived or reimbursed during the periods shown. Returns for periods less than one year are not annualized. |
| (3) | | Commencement of operations. |
| (4) | | Distribution was less than $0.01 per share |
| (5) | | Calculated based upon average shares outstanding. |
The accompanying notes are an integral part of these financial statements.
74
FINANCIALHIGHLIGHTS | | WELLSFARGOOUTLOOKFUNDS |
|
Ending
Net Asset
Value Per
Share | | Ratio to Average Net Assets (Annualized)(1)
| | | Total
Return(2) | | | Portfolio
Turnover
Rate | | | Net Assets at
End of Period
(000’s Omitted) |
| | Net Investment
Income (Loss) | | | Net
Expenses | | | Gross
Expenses | | | | |
| | | | | | | | | | | | | | | | | | | | |
|
| | | | | | |
| | | | | | | | | | | | | | | | | | | | |
| | | | | | |
| | | | | | | | | | | | | | | | | | | | |
| $ | 11.68 | | 1.33 | % | | 1.30 | % | | 1.40 | % | | 13.46 | % | | 15 | % | | $ | 126,989 |
| $ | 10.36 | | 1.16 | % | | 1.30 | % | | 1.42 | % | | (14.65 | )% | | 62 | % | | $ | 105,206 |
| $ | 12.29 | | 1.35 | % | | 1.30 | % | | 1.50 | % | | (5.57 | )% | | 29 | % | | $ | 137,265 |
| $ | 13.28 | | 1.63 | % | | 1.30 | % | | 1.39 | % | | (3.79 | )% | | 39 | % | | $ | 154,871 |
| $ | 14.78 | | 1.52 | % | | 1.30 | % | | 1.33 | % | | 10.45 | % | | 43 | % | | $ | 176,460 |
| $ | 14.91 | | 1.61 | % | | 1.25 | % | | 1.26 | % | | 12.02 | % | | 36 | % | | $ | 165,584 |
| | | | | | |
| | | | | | | | | | | | | | | | | | | | |
| $ | 11.58 | | 0.75 | % | | 1.89 | % | | 2.15 | % | | 13.09 | % | | 15 | % | | $ | 32,172 |
| $ | 10.28 | | 0.66 | % | | 1.80 | % | | 2.13 | % | | (15.04 | )% | | 62 | % | | $ | 31,052 |
| $ | 12.18 | | 0.85 | % | | 1.80 | % | | 2.08 | % | | (6.09 | )% | | 29 | % | | $ | 43,280 |
| $ | 13.17 | | 1.12 | % | | 1.80 | % | | 1.94 | % | | (4.25 | )% | | 39 | % | | $ | 47,591 |
| $ | 14.66 | | 1.02 | % | | 1.80 | % | | 1.95 | % | | 9.90 | % | | 43 | % | | $ | 47,472 |
| $ | 14.79 | | 1.04 | % | | 1.76 | % | | 1.84 | % | | 11.56 | % | | 36 | % | | $ | 28,467 |
| | | | | | |
| | | | | | | | | | | | | | | | | | | | |
| $ | 11.65 | | 0.74 | % | | 1.90 | % | | 2.15 | % | | 13.12 | % | | 15 | % | | $ | 6,795 |
| $ | 10.34 | | 0.66 | % | | 1.80 | % | | 2.20 | % | | (15.12 | )% | | 62 | % | | $ | 5,330 |
| $ | 12.26 | | 0.83 | % | | 1.80 | % | | 2.08 | % | | (6.06 | )% | | 29 | % | | $ | 6,767 |
| $ | 13.25 | | 1.15 | % | | 1.80 | % | | 1.96 | % | | (4.26 | )% | | 39 | % | | $ | 6,308 |
| $ | 14.74 | | 0.92 | % | | 1.80 | % | | 3.28 | % | | 9.87 | % | | 43 | % | | $ | 3,009 |
| $ | 14.82 | | 0.76 | % | | 1.71 | % | | 52.02 | % | | 1.70 | % | | 36 | % | | $ | 192 |
| | | | | | |
| | | | | | | | | | | | | | | | | | | | |
| $ | 11.80 | | 1.63 | % | | 1.00 | % | | 1.07 | % | | 13.58 | % | | 15 | % | | $ | 112,162 |
| $ | 10.47 | | 1.46 | % | | 1.00 | % | | 1.01 | % | | (14.35 | )% | | 62 | % | | $ | 89,948 |
| $ | 12.42 | | 1.60 | % | | 1.03 | % | | 1.18 | % | | (5.30 | )% | | 29 | % | | $ | 94,895 |
| $ | 13.42 | | 1.93 | % | | 1.04 | % | | 1.04 | % | | (3.58 | )% | | 39 | % | | $ | 64,541 |
| $ | 14.89 | | 1.69 | % | | 1.00 | % | | 1.01 | % | | 1.74 | % | | 43 | % | | $ | 3,879 |
| | | | | | |
| | | | | | | | | | | | | | | | | | | | |
|
| | | | | | |
| | | | | | | | | | | | | | | | | | | | |
| $ | 12.06 | | 1.33 | % | | 1.30 | % | | 1.43 | % | | 15.78 | % | | 21 | % | | $ | 91,921 |
| $ | 10.48 | | 0.88 | % | | 1.30 | % | | 1.52 | % | | (17.40 | )% | | 68 | % | | $ | 75,953 |
| $ | 13.34 | | 0.81 | % | | 1.30 | % | | 1.57 | % | | (8.68 | )% | | 27 | % | | $ | 100,884 |
| $ | 15.13 | | 0.97 | % | | 1.30 | % | | 1.41 | % | | (6.29 | )% | | 27 | % | | $ | 133,569 |
| $ | 16.96 | | 0.96 | % | | 1.30 | % | | 1.37 | % | | 12.63 | % | | 26 | % | | $ | 140,867 |
| $ | 17.15 | | 1.07 | % | | 1.23 | % | | 1.26 | % | | 13.25 | % | | 19 | % | | $ | 134,008 |
| | | | | | |
| | | | | | | | | | | | | | | | | | | | |
| $ | 11.86 | | 0.74 | % | | 1.89 | % | | 2.18 | % | | 15.35 | % | | 21 | % | | $ | 21,144 |
| $ | 10.32 | | 0.38 | % | | 1.80 | % | | 2.21 | % | | (17.76 | )% | | 68 | % | | $ | 20,319 |
| $ | 13.13 | | 0.30 | % | | 1.80 | % | | 2.17 | % | | (9.10 | )% | | 27 | % | | $ | 27,913 |
| $ | 14.88 | | 0.47 | % | | 1.80 | % | | 2.00 | % | | (6.79 | )% | | 27 | % | | $ | 34,570 |
| $ | 16.72 | | 0.44 | % | | 1.80 | % | | 1.98 | % | | 12.13 | % | | 26 | % | | $ | 36,406 |
| $ | 16.93 | | 0.52 | % | | 1.75 | % | | 1.84 | % | | 12.64 | % | | 19 | % | | $ | 25,206 |
| | | | | | |
| | | | | | | | | | | | | | | | | | | | |
| $ | 11.87 | | 0.73 | % | | 1.90 | % | | 2.18 | % | | 15.37 | % | | 21 | % | | $ | 4,069 |
| $ | 10.33 | | 0.39 | % | | 1.80 | % | | 2.44 | % | | (17.78 | )% | | 68 | % | | $ | 2,791 |
| $ | 13.14 | | 0.29 | % | | 1.80 | % | | 2.17 | % | | (9.12 | )% | | 27 | % | | $ | 3,412 |
| $ | 14.90 | | 0.49 | % | | 1.80 | % | | 2.16 | % | | (6.79 | )% | | 27 | % | | $ | 3,467 |
| $ | 16.74 | | 0.36 | % | | 1.80 | % | | 5.37 | % | | 12.05 | % | | 26 | % | | $ | 1,293 |
| $ | 16.94 | | 0.16 | % | | 1.73 | % | | 72.87 | % | | 1.98 | % | | 19 | % | | $ | 92 |
| | | | | | |
| | | | | | | | | | | | | | | | | | | | |
| $ | 12.16 | | 1.62 | % | | 1.00 | % | | 1.10 | % | | 15.90 | % | | 21 | % | | $ | 43,442 |
| $ | 10.57 | | 1.17 | % | | 1.00 | % | | 1.07 | % | | (17.10 | )% | | 68 | % | | $ | 35,203 |
| $ | 13.45 | | 1.05 | % | | 1.03 | % | | 1.24 | % | | (8.47 | )% | | 27 | % | | $ | 30,749 |
| $ | 15.24 | | 1.27 | % | | 1.05 | % | | 1.05 | % | | (6.08 | )% | | 27 | % | | $ | 19,156 |
| $ | 17.07 | | 1.06 | % | | 1.00 | % | | 1.02 | % | | 2.39 | % | | 26 | % | | $ | 1,203 |
75
| WELLSFARGOOUTLOOKFUNDS | | FINANCIALHIGHLIGHTS |
|
| | | | | | |
| | | Beginning Net Asset Value Per Share | | Net
Investment
Income
(Loss) | | | Net Realized
and Unrealized
Gain (Loss) on
Investments | | | Dividends
From Net
Investment
Income | | | Distributions
From Net
Realized
Gains | | | Return
of Capital |
|
| | | | | | |
OUTLOOK 2040 | | | | | | | | | | | | | | | | | |
| | | | | | |
ASHARES | | | | | | | | | | | | | | | | | |
March 1, 2003 to August 31, 2003 (Unaudited) | | $ | 10.65 | | 0.07 | | | 1.88 | | | (0.07 | ) | | 0.00 | | | N/A |
March 1, 2002 to February 28, 2003 | | $ | 13.55 | | 0.08 | (5) | | (2.81 | ) | | (0.08 | ) | | (0.09 | ) | | N/A |
March 1, 2001 to February 28, 2002 | | $ | 15.50 | | 0.03 | | | (1.80 | ) | | 0.00 | | | (0.18 | ) | | N/A |
March 1, 2000 to February 28, 2001 | | $ | 18.78 | | 0.02 | | | (1.98 | ) | | (0.03 | ) | | (1.29 | ) | | N/A |
March 1, 1999 to February 29, 2000 | | $ | 17.87 | | 0.05 | | | 2.78 | | | (0.05 | ) | | (1.87 | ) | | N/A |
March 1, 1998 to February 28, 1999 | | $ | 17.07 | | 0.08 | | | 2.39 | | | (0.08 | ) | | (1.59 | ) | | N/A |
| | | | | | |
BSHARES | | | | | | | | | | | | | | | | | |
March 1, 2003 to August 31, 2003 (Unaudited) | | $ | 10.28 | | (0.01 | ) | | 1.85 | | | (0.04 | ) | | 0.00 | | | N/A |
March 1, 2002 to February 28, 2003 | | $ | 13.08 | | 0.02 | (5) | | (2.70 | ) | | (0.03 | ) | | (0.09 | ) | | N/A |
March 1, 2001 to February 28, 2002 | | $ | 15.05 | | (0.05 | ) | | (1.74 | ) | | 0.00 | | | (0.18 | ) | | N/A |
March 1, 2000 to February 28, 2001 | | $ | 18.34 | | (0.05 | ) | | (1.95 | ) | | 0.00 | (4) | | (1.29 | ) | | N/A |
March 1, 1999 to February 29, 2000 | | $ | 17.52 | | (0.04 | ) | | 2.73 | | | 0.00 | | | (1.87 | ) | | N/A |
March 1, 1998 to February 28, 1999 | | $ | 16.76 | | (0.01 | ) | | 2.33 | | | (0.01 | ) | | (1.55 | ) | | N/A |
| | | | | | |
CSHARES | | | | | | | | | | | | | | | | | |
March 1, 2003 to August 31, 2003 (Unaudited) | | $ | 10.28 | | 0.02 | | | 1.82 | | | (0.04 | ) | | 0.00 | | | N/A |
March 1, 2002 to February 28, 2003 | | $ | 13.09 | | 0.02 | (5) | | (2.71 | ) | | (0.03 | ) | | (0.09 | ) | | N/A |
March 1, 2001 to February 28, 2002 | | $ | 15.06 | | (0.04 | ) | | (1.75 | ) | | 0.00 | | | (0.18 | ) | | N/A |
March 1, 2000 to February 28, 2001 | | $ | 18.34 | | (0.05 | ) | | (1.94 | ) | | 0.00 | (4) | | (1.29 | ) | | N/A |
March 1, 1999 to February 29, 2000 | | $ | 17.53 | | (0.04 | ) | | 2.72 | | | 0.00 | | | (1.87 | ) | | N/A |
July 1, 1998(3) to February 28, 1999 | | $ | 18.01 | | (0.01 | ) | | 1.08 | | | 0.00 | | | (1.55 | ) | | N/A |
| | | | | | |
INSTITUTIONALSHARES | | | | | | | | | | | | | | | | | |
March 1, 2003 to August 31, 2003 (Unaudited) | | $ | 10.77 | | 0.08 | | | 1.91 | | | (0.08 | ) | | 0.00 | | | N/A |
March 1, 2002 to February 28, 2003 | | $ | 13.71 | | 0.12 | (5) | | (2.85 | ) | | (0.12 | ) | | (0.09 | ) | | N/A |
March 1, 2001 to February 28, 2002 | | $ | 15.64 | | 0.07 | | | (1.82 | ) | | 0.00 | | | (0.18 | ) | | N/A |
March 1, 2000 to February 28, 2001 | | $ | 18.90 | | 0.07 | | | (1.99 | ) | | (0.05 | ) | | (1.29 | ) | | N/A |
November 8, 1999(3) to February 29, 2000 | | $ | 19.97 | | 0.00 | | | 0.80 | | | 0.00 | | | (1.87 | ) | | N/A |
| (1) | | These ratios include income earned and expenses charged to each fund. Annualized for periods of less than one year. |
| (2) | | Total return calculations do not include any sales charges, and would have been lower had certain expenses not been waived or reimbursed during the periods shown. Returns for periods less than one year are not annualized. |
| (3) | | Commencement of operations. |
| (4) | | Distribution was less than $0.01 per share |
| (5) | | Calculated based upon average shares outstanding. |
The accompanying notes are an integral part of these financial statements.
76
FINANCIALHIGHLIGHTS | | WELLSFARGOOUTLOOKFUNDS |
|
Ending
Net Asset
Value Per
Share | | Ratio to Average Net Assets (Annualized)(1)
| | | Total
Return(2) | | | Portfolio
Turnover
Rate | | | Net Assets at
End of Period
(000’s Omitted) |
| | Net Investment
Income (Loss) | | | Net
Expenses | | | Gross
Expenses | | | | |
| | | | | | | | | | | | | | | | | | | | |
|
| | | | | | |
| | | | | | | | | | | | | | | | | | | | |
| | | | | | |
| | | | | | | | | | | | | | | | | | | | |
| $ | 12.53 | | 1.20 | % | | 1.30 | % | | 1.43 | % | | 18.33 | % | | 12 | % | | $ | 132,585 |
| $ | 10.65 | | 0.65 | % | | 1.30 | % | | 1.49 | % | | (20.24 | )% | | 54 | % | | $ | 111,546 |
| $ | 13.55 | | 0.24 | % | | 1.30 | % | | 1.55 | % | | (11.45 | )% | | 14 | % | | $ | 169,829 |
| $ | 15.50 | | 0.15 | % | | 1.30 | % | | 1.41 | % | | (11.09 | )% | | 20 | % | | $ | 218,085 |
| $ | 18.78 | | 0.24 | % | | 1.30 | % | | 1.36 | % | | 15.65 | % | | 29 | % | | $ | 306,002 |
| $ | 17.87 | | 0.42 | % | | 1.25 | % | | 1.26 | % | | 14.98 | % | | 19 | % | | $ | 261,808 |
| | | | | | |
| | | | | | | | | | | | | | | | | | | | |
| $ | 12.08 | | 0.62 | % | | 1.89 | % | | 2.18 | % | | 17.93 | % | | 12 | % | | $ | 44,597 |
| $ | 10.28 | | 0.15 | % | | 1.80 | % | | 2.23 | % | | (20.60 | )% | | 54 | % | | $ | 43,980 |
| $ | 13.08 | | (0.27 | )% | | 1.80 | % | | 2.14 | % | | (11.93 | )% | | 14 | % | | $ | 67,290 |
| $ | 15.05 | | (0.35 | )% | | 1.80 | % | | 2.05 | % | | (11.53 | )% | | 20 | % | | $ | 84,993 |
| $ | 18.34 | | (0.28 | )% | | 1.80 | % | | 1.95 | % | | 15.07 | % | | 29 | % | | $ | 93,757 |
| $ | 17.52 | | (0.12 | )% | | 1.75 | % | | 1.78 | % | | 14.37 | % | | 19 | % | | $ | 63,395 |
| | | | | | |
| | | | | | | | | | | | | | | | | | | | |
| $ | 12.08 | | 0.61 | % | | 1.89 | % | | 2.18 | % | | 17.94 | % | | 12 | % | | $ | 4,065 |
| $ | 10.28 | | 0.15 | % | | 1.80 | % | | 2.31 | % | | (20.66 | )% | | 54 | % | | $ | 3,767 |
| $ | 13.09 | | (0.27 | )% | | 1.80 | % | | 2.14 | % | | (11.92 | )% | | 14 | % | | $ | 5,432 |
| $ | 15.06 | | (0.35 | )% | | 1.80 | % | | 1.96 | % | | (11.52 | )% | | 20 | % | | $ | 6,349 |
| $ | 18.34 | | (0.30 | )% | | 1.80 | % | | 2.55 | % | | 15.07 | % | | 29 | % | | $ | 6,095 |
| $ | 17.53 | | (0.39 | )% | | 1.71 | % | | 4.71 | % | | 6.40 | % | | 19 | % | | $ | 3,096 |
| | | | | | |
| | | | | | | | | | | | | | | | | | | | |
| $ | 12.68 | | 1.49 | % | | 1.00 | % | | 1.10 | % | | 18.58 | % | | 12 | % | | $ | 34,825 |
| $ | 10.77 | | 0.96 | % | | 1.00 | % | | 1.03 | % | | (20.02 | )% | | 54 | % | | $ | 29,829 |
| $ | 13.71 | | 0.54 | % | | 1.02 | % | | 1.22 | % | | (11.22 | )% | | 14 | % | | $ | 33,976 |
| $ | 15.64 | | 0.46 | % | | 1.04 | % | | 1.07 | % | | (10.80 | )% | | 20 | % | | $ | 31,613 |
| $ | 18.90 | | 0.24 | % | | 1.00 | % | | 1.01 | % | | 3.27 | % | | 29 | % | | $ | 1,069 |
77
| WELLSFARGOOUTLOOKFUNDS | | NOTESTOFINANCIALSTATEMENTS (UNAUDITED) |
|
1. ORGANIZATION
Wells Fargo Funds Trust (the “Trust”) is registered under the Investment Company Act of 1940, as amended (the “1940 Act”), as an open-end management investment company. The Trust was organized as a Delaware statutory trust on March 10, 1999, and is currently comprised of 68 separate series. These financial statements represent the Outlook Today, Outlook 2010, Outlook 2020, Outlook 2030, and Outlook 2040 Funds (each a “Fund”, collectively the “Funds”).
Each Fund is authorized to issue four classes of shares: Class A, Class B, Class C and Institutional Class. The four classes of shares differ principally in their respective distribution, shareholder servicing and administration fees and sales charges. Shareholders of each class bear certain expenses that pertain to that particular class. All shareholders bear the common expenses of the Fund and earn income from the portfolio, pro rata based on the average daily net assets of each class, without distinction between share classes. Dividends are determined separately for each class based on income and expenses allocable to each class. Realized gains and losses are allocated to each class pro rata based upon net assets of each class on the date realized. No class has preferential dividend rights. Differences in per share dividend rates generally result from the relative weightings of pro rata income and from differences in separate class expenses, including distribution, shareholding servicing and administration fees.
2. SIGNIFICANT ACCOUNTING POLICIES
The following significant accounting policies, which are consistently followed by the Trust in preparation of its financial statements, are in conformity with accounting principles generally accepted in the United States of America (“GAAP”) for investment companies.
The preparation of financial statements in conformity with GAAP requires management to make estimates and assumptions that affect the reported amounts of assets and liabilities, disclosure of contingent assets and liabilities at the date of the financial statements and the reported amounts of revenues and expenses during the reporting period. Actual results could differ from those estimates.
SECURITYVALUATION
Investments in securities are valued each business day as of the close of regular trading on the New York Stock Exchange which is usually 4:00 p.m. (Eastern Time). Securities which are traded on a national or foreign securities exchange are valued at the last reported sales price. Securities listed on The Nasdaq Stock Market, Inc. are valued at the Nasdaq Official Closing Price (“NOCP”), and if no NOCP is available, then at the last reported sales price. In the absence of any sale of such securities, the valuations are based on the latest quoted bid prices. In the absence of any sale or bid price of such securities, the securities are fair valued in accordance with procedures approved by the Trust’s Board of Trustees.
Certain fixed income securities with maturities exceeding 60 days are valued by using a pricing service approved by the Trust’s Board of Trustees. The service uses market prices as quoted by an independent pricing service or by dealers in these securities when, in the service’s judgment, these prices are readily available and are representative of the securities’ market values. For some securities, such prices are not readily available. These securities will generally be fair valued based on methods which may include consideration of yields or prices of securities of comparable quality, coupon rate, maturity and type of issue; indications as to values from dealers in securities, trading characteristics and general market conditions. Securities denominated in foreign currencies are translated into U.S. dollars using the closing rates of exchange in effect on the day of valuation. Securities for which quotations are not readily available are valued at fair value as determined by policies set by the Trust’s Board of Trustees.
Debt securities maturing in 60 days or less generally are valued at amortized cost. The amortized cost method involves valuing a security at its cost, plus accretion of discount or minus amortization of premium over the period until maturity, which approximates market value.
SECURITYTRANSACTIONSANDINCOMERECOGNITION
Securities transactions are recorded on a trade date basis. Realized gains or losses are reported on the basis of identified cost of securities delivered. Interest income is accrued daily and bond discounts are accreted and premiums are amortized.
Non-cash dividends and interest, if any, are included in investment income at the fair market value of the securities received. Debt obligations may be placed on non-accrual status and related investment income may be reduced by ceasing current accruals and writing off interest receivables when the collection of all or a portion of income has become doubtful based on consistently applied procedures. A debt obligation is removed from non-accrual status when the issuer resumes interest payments or when collectibility of interest is reasonably assured.
78
NOTESTOFINANCIALSTATEMENTS (UNAUDITED) | | WELLSFARGOOUTLOOKFUNDS |
|
Dividend income is recognized on the ex-dividend date except for certain dividends from foreign securities which are recorded as soon as a Fund is informed of the ex-dividend date. Dividend income from foreign securities is recorded net of foreign taxes withheld where recovery of such taxes is not assured.
DIVIDENDSANDDISTRIBUTIONSTOSHAREHOLDERS
Each Fund declares and pays dividends to shareholders from net investment income quarterly. Distributions to shareholders from any net realized capital gains are declared and distributed at least annually. Due to the timing of distributions and the differences in accounting for income and realized gains (losses) for financial statement and federal income tax purposes, the fiscal year in which amounts are distributed may differ from the year in which income and realized gains (losses) were recorded by the Funds.
Distributions are based on amounts calculated in accordance with the applicable federal income tax regulations, which may differ from GAAP. The timing and character of distributions made during the period from net investment income or net realized gains also may differ from their ultimate characterization for federal income tax purposes. To the extent that these differences are permanent in nature, such amounts are reclassified within the capital accounts based on their federal tax-basis treatment; temporary differences do not require reclassification.
FEDERALINCOMETAXES
Each Fund is treated as a separate entity for federal income tax purposes. It is the policy of each Fund to continue to qualify as a regulated investment company by complying with the provisions applicable to regulated investment companies, as defined under subchapter M of the Internal Revenue Code of 1986, as amended and to distribute annually substantially all of its income and any gains (taking into account capital loss carryforwards) sufficient to relieve it from all, or substantially all, federal income and excise taxes. Accordingly, no provision for federal income taxes was required at August 31, 2003.
The following Funds had estimated net capital loss carryforwards at February 28, 2003, which are available to offset future net realized capital gains.
| Fund | | Year Expires | | Capital Loss Carryforwards |
Outlook 2020 | | 2010 | | 408,192 |
| | | 2011 | | 1,722,187 |
Outlook 2040 | | 2010 | | 797,881 |
| | | 2011 | | 4,325,640 |
For tax purposes, the following Funds have a current year deferred post-October capital loss. These losses will be realized for tax purposes on the first day of the succeeding year.
| Fund | | Deferred Post-October Capital Loss |
Outlook 2010 | | 2,771,437 |
Outlook 2020 | | 4,024,498 |
Outlook 2030 | | 1,074,813 |
Outlook 2040 | | 6,607,670 |
FUTURESCONTRACTS
Each Fund may purchase futures contracts to gain exposure to market changes as this may be more efficient or cost effective than actually buying the securities. A futures contract is an agreement between two parties to buy and sell a security at a set price on a future date and is exchange traded. Upon entering into a futures contract, the Funds are required to pledge to the broker an amount of cash, U.S. Government securities or other high-quality debt securities equal to the minimum “initial margin” requirements of the exchange. Pursuant to the contract, the Fund agrees to receive from or pay to the broker an amount of cash equal to the daily fluctuation in the value of the contract. Such receipts or payments are known as “variation margin” and are recorded by the Fund as unrealized gains or losses. When the contract is closed, the Fund records a gain or loss equal to the difference between the value of the contract at the time it was opened and the value at the time it was closed. Pursuant to regulations and/or published positions of the Securities and Exchange Commission, the Funds are required to segregate cash, U.S. Government securities or high quality, liquid debt instruments in connection with long futures transactions. Risks of entering into futures contracts include the possibility that there may be an illiquid market and that a change in the value of the contracts may not correlate with changes in the value of the underlying securities.
There were no open futures contracts in any of the Funds at August 31, 2003.
79
| WELLSFARGOOUTLOOKFUNDS | | NOTESTOFINANCIALSTATEMENTS (UNAUDITED) |
|
REPURCHASEAGREEMENTS
Each Fund may enter into repurchase agreements and may participate in pooled repurchase agreement transactions with other funds advised by Wells Fargo Funds Management, LLC. The repurchase agreements must be fully collateralized based on values that are marked to market daily. The collateral may be held by an agent bank under a tri-party agreement. It is the Funds’ custodian’s responsibility to value collateral daily and to take action to obtain additional collateral as necessary to maintain market value equal to or greater than the resale price. The repurchase agreements held by the Funds are collateralized by instruments such as U.S. Treasury, federal agency, or high-grade corporate obligations. There could be potential loss to a Fund in the event that such Fund is delayed or prevented from exercising its rights to dispose of the collateral, including the risk of a possible decline in the value of the underlying obligations during the period in which a Fund seeks to assert its rights.
There were no open repurchase agreements in any of the Funds at August 31, 2003.
SECURITYLOANS
The Funds may loan securities in return for securities and cash collateral, which is invested in various short-term fixed income securities. The Funds may receive compensation for lending securities in the form of fees or by retaining a portion of interest on the investment securities or cash received as collateral. A Fund also continues to receive interest or dividends on the securities loaned. Security loans are secured at all times by collateral. The collateral is equal to at least 102% of the market value of the securities loaned plus accrued interest when the transaction is entered into. If the collateral falls to 100%, it will be brought back to 102%. Gain or loss in the market price of the securities loaned that may occur during the term of the loan is reflected in the value of the Fund. The risks to the Fund from securities lending are that the borrower may not provide additional collateral when required or return the securities when due or when called for by the Fund. The value of the securities on loan and the value of the related collateral for the six-month period ended August 31, 2003 are shown on the Statement of Assets and Liabilities.
As of August 31, 2003, the cash collateral of each Fund was invested as follows:
| Fund | | Repurchase
Agreements | | Short-Term
Securities | | Mid-Term
Securities | | Money
Market
Fund | | Total |
Outlook Today | | 20% | | 52% | | 27% | | 1% | | 100% |
Outlook 2010 | | 18% | | 49% | | 32% | | 1% | | 100% |
Outlook 2020 | | 22% | | 60% | | 16% | | 2% | | 100% |
Outlook 2030 | | 20% | | 51% | | 28% | | 1% | | 100% |
Outlook 2040 | | 18% | | 50% | | 31% | | 1% | | 100% |
3. AGREEMENTS AND OTHER TRANSACTIONS WITH AFFILIATES
Wells Fargo Funds Management, LLC (“Funds Management”), an indirect and wholly-owned subsidiary of Wells Fargo & Company, serves as adviser to the Funds and is responsible for implementing the investment policies and guidelines for the Funds, and for supervising the sub-adviser. Funds Management is entitled to receive an annual fee of 0.70% of the Funds’ average daily net assets for its services as adviser.
Barclays Global Fund Advisors (“BGFA”), a wholly-owned subsidiary of Barclays Global Investors, N.A. (“BGI”), and an indirect subsidiary of Barclays Bank, PLC, is the sub-adviser for each of the Funds. In this capacity, BGFA invests the Funds’ assets according to an asset allocation model. BGFA is entitled to receive from Funds Management, as compensation for its sub-advisory services, a monthly fee at the annual rate of 0.25% of each Fund’s average daily net assets up to $100 million, 0.20% for the next $100 million, and 0.15% of each Fund’s average daily net assets in excess of $200 million.
Through February 28, 2003, the Trust had entered into an Administration Agreement with Funds Management on behalf of the Funds. Under the Administration Agreement, Funds Management acted as administrator of the Funds and was entitled to receive, on a monthly basis, fees at an annual rate of 0.15% of the average daily net assets of the Funds.
The Trust has also entered into an agreement with Boston Financial Data Services (“BFDS”) as the transfer agent for the Trust. Under the agreement, BFDS was entitled to receive from the Funds a per-account fee plus transaction fees, certain out-of-pocket costs and a complex based fee.
Effective March 1, 2003, the Trust has entered into a new Administration Agreement with the Funds. Under this Agreement, for providing administrative services, which now include paying the Funds’ fees and expenses for services provided by the Funds’ transfer agent and various sub-transfer agents and omnibus account servicers and record-keepers out of the fees it receives as administrator, Funds Management is
80
NOTESTOFINANCIALSTATEMENTS (UNAUDITED) | | WELLSFARGOOUTLOOKFUNDS |
|
entitled to receive an annual fee of 0.33% of the average daily net assets of a Fund’s Class A, Class B or Class C shares and 0.25% of the average daily net assets of a Fund’s Institutional Class shares.
Effective the first quarter of 2003, PFPC Inc. (“PFPC”) serves as fund accountant for all of the Funds. PFPC is entitled to receive an annual asset based fee, an annual fixed fee of $20,000 from each Fund and is entitled to be reimbursed for all out-of-pocket expenses reasonably incurred in providing these services. Prior to PFPC, Forum Accounting Services, LLC served as fund accountant and was entitled to receive a fixed monthly per fund fee, a basis point fee of 0.0025% of the average daily net assets of each Fund, and was reimbursed for all out-of-pocket expenses reasonably incurred in providing these services.
The Trust has entered into a contract on behalf of each Fund with Wells Fargo Bank Minnesota, N.A. (“Wells Fargo Bank MN”), whereby Wells Fargo Bank MN is responsible for providing custody services for the Funds. Pursuant to the contract, Wells Fargo Bank MN is entitled to receive certain transaction charges plus a monthly fee for custody services at the annual rate of 0.02% of the average daily net assets of each Fund.
On behalf of the Funds, the Trust may enter into servicing agreements with certain financial institutions, securities dealers, and other industry professionals (collectively, “Shareholder Servicing Agents”) for the provision of certain services to Fund shareholders. For the services provided pursuant to a Shareholder Servicing Agreement, Class A, Class B and Class C shares may pay each Shareholder Servicing Agent an annual fee of up to 0.25% of the average daily net asset value of each Fund’s shares beneficially owned by customers of the Shareholder Servicing Agent. No fee is currently charged for the Institutional Class shares.
The shareholder servicing fees paid on behalf of the Funds for the six-month period ended August 31, 2003 were as follows:
| Fund | | Class A | | Class B | | Class C |
Outlook Today | | $ | 44,294 | | $ | 25,910 | | $ | 11,937 |
Outlook 2010 | | | 92,701 | | | 43,337 | | | 7,930 |
Outlook 2020 | | | 147,605 | | | 40,348 | | | 7,556 |
Outlook 2030 | | | 107,668 | | | 26,318 | | | 4,253 |
Outlook 2040 | | | 155,180 | | | 57,165 | | | 5,068 |
The Trust has entered into an agreement with Stephens Inc. (“Stephens”) for distribution services and has adopted a Plan of Distribution pursuant to Rule 12b-1 under the 1940 Act, whereby Stephens may be compensated for services incurred on behalf of the Class B and Class C shares. For providing these services, Stephens is entitled to receive annual fees of 0.75% of the average daily net assets of Class B and Class C shares. There are no 12b-1 fees charged for the Class A or Institutional Class shares of the Funds.
4. CAPITAL SHARE TRANSACTIONS
As of August 31, 2003, the Trust has authorized an unlimited number of shares of beneficial interest without par value. Transactions in capital shares for each Fund are disclosed in detail in the Statement of Changes in Net Assets.
5. INVESTMENT PORTFOLIO TRANSACTIONS
Purchases and sales of investments, exclusive of short-term securities (securities with maturities of one year or less at purchase date) for each Fund for the six-month period ended August 31, 2003, were as follows:
| Fund | | Purchases | | Sales |
| | U.S. Government | | Other | | U.S. Government | | Other |
Outlook Today | | $ | 12,942,883 | | $ | 1,295,253 | | $ | 3,761,531 | | $ | 5,508,690 |
Outlook 2010 | | | 27,949,857 | | | 6,265,194 | | | 9,461,532 | | | 15,834,058 |
Outlook 2020 | | | 41,712,920 | | | 12,439,521 | | | 15,934,406 | | | 20,503,656 |
Outlook 2030 | | | 28,233,291 | | | 6,772,414 | | | 17,003,131 | | | 13,726,940 |
Outlook 2040 | | | 18,189,552 | | | 5,998,530 | | | 7,449,969 | | | 22,323,206 |
81
| WELLSFARGOOUTLOOKFUNDS | | NOTESTOFINANCIALSTATEMENTS (UNAUDITED) |
|
6. WAIVED FEES AND REIMBURSED EXPENSES
All amounts shown as waived fees or reimbursed expenses on the Statements of Operations, for the six-month period ended August 31, 2003, were waived by Funds Management, first from advisory fees, and then any remaining amount consecutively from administration, custody and shareholder servicing fees collected.
7. BANK BORROWINGS
All of the funds in the Trust and Wells Fargo Variable Trust (excluding the money market funds) share in a revolving Credit Agreement with The Bank of New York, whereby the funds are permitted to use bank borrowings for temporary or emergency purposes, such as to fund shareholder redemption requests. The agreement permits borrowings of up to $225 million, collectively. Interest is charged to each fund based on its borrowing at a rate equal to the Federal Funds Rate plus 0.40%. In addition, the funds pay a quarterly commitment fee equal to 0.1% per annum of the credit line. No borrowings under the agreement occurred during the six-month period ended August 31, 2003.
82
BOARDOFTRUSTEES | | WELLSFARGOOUTLOOKFUNDS |
|
BOARDOFTRUSTEES
The following table provides basic information about the Board of Trustees (“Trustees”) of the Trust and supplements, and should be read in conjunction with, the Prospectus and the Statement of Additional Information* of each Fund. Each of the Trustees listed below acts in identical capacities for each of the 92 funds comprising the Trust, Wells Fargo Variable Trust and Wells Fargo Master Trust (collectively the “Fund Complex”). All of the non-interested Trustees are also members of the Audit and Nominating Committees of each Trust in the Fund Complex. The address of each Trustee and Officer is 525 Market Street, 20th Floor, San Francisco, CA 94105. Each Trustee and Officer serves an indefinite term, however, each Trustee serves such term until reaching the mandatory retirement age established by the Trustees.
INTERESTEDTRUSTEES**
| Name and Age | | Position held and
length of service *** | | Principal occupations during
past five years | | Other Directorships |
Robert C. Brown 72 | | Trustee since 1992 | | Retired. Director, Federal Farm Credit Banks Funding Corporation and Farm Credit System Financial Assistance Corporation until February 1999. | | None |
|
J. Tucker Morse 59 | | Trustee since 1987 | | Private Investor/Real Estate Developer; Chairman of White Point Capital, LLC. | | None |
|
|
| NON-INTERESTEDTRUSTEES |
| Name and Age | | Position held and length of service *** | | Principal occupations during
past five years | | Other Directorships |
Thomas S. Goho 61 | | Trustee since 1987 | | Wake Forest University, Calloway School of Business and Accountancy, Benson-Pruitt Professorship since 1999, Associate Professor of Finance 1994-1999. | | None |
|
Peter G. Gordon 60 | | Trustee since 1998 (Lead Trustee since 2001) | | Chairman, CEO, and Co-Founder of Crystal Geyser Water Company and President of Crystal Geyser Roxane Water Company. | | None |
|
Richard M. Leach 70 | | Trustee since 1987 | | Retired. Prior thereto, President of Richard M. Leach Associates (a financial consulting firm). | | None |
|
Timothy J. Penny 51 | | Trustee since 1996 | | Senior Counselor to the public relations firm of Himle-Horner and Senior Fellow at the Humphrey Institute, Minneapolis, Minnesota (a public policy organization). | | None |
|
Donald C. Willeke 63 | | Trustee since 1996 | | Principal in the law firm of Willeke & Daniels. | | None |
|
83
WELLSFARGOOUTLOOKFUNDS | | BOARDOFTRUSTEES |
|
OFFICERS
| Name and Age | | Position held and
length of service | | Principal occupations during
past five years | | Other Directorships |
Karla M. Rabusch 44 | | President, since 2003 | | Executive Vice President of Wells Fargo Bank, N.A. President of Wells Fargo Funds Management, LLC. Senior Vice President and Chief Administrative Officer of Wells Fargo Funds Management, LLC from March 2001 to March 2003. Vice President of Wells Fargo Bank, N.A. from December 1997 to May 2000. | | None |
|
Stacie D. DeAngelo 34 | | Treasurer, since 2003 | | Vice President of Wells Fargo Bank, N.A. Vice President of Operations for Wells Fargo Funds Management, LLC. Prior thereto, Operations Manager at Scudder Weisel Capital, LLC (2000 to 2001), Director of Shareholder Services at BISYS Fund Services (1999 to 2000) and Assistant Vice President of Operations with Nicholas-Applegate Capital Management (1993 to 1999). | | None |
|
C. David Messman 43 | | Secretary, since 2000 | | Vice President and Counsel of Wells Fargo Bank, N.A. since January 1996. Vice President and Secretary of Wells Fargo Funds Management, LLC since March 2001. | | None |
|
| * | | The Statement of Additional Information includes additional information about the Fund’s Trustees and is available, without charge, upon request, by calling 1-800-222-8222. |
| ** | | Currently, two of the seven Trustees are considered “interested persons” of the Trusts as defined in the Investment Company Act of 1940. One of the interested Trustees, Robert C. Brown, owns securities of Wells Fargo & Company, and one of the interested Trustees, J. Tucker Morse, is affiliated with a government securities dealer that is registered under the Securities Exchange Act of 1934, which is not itself affiliated with Wells Fargo Funds Management, LLC. |
| *** | | Length of service dates reflects a Trustee’s commencement of service with the Trust’s predecessor entities. |
84
LISTOFABBREVIATIONS | | WELLSFARGOOUTLOOKFUNDS |
|
The following is a list of common abbreviations for terms and entities which may have appeared in this report.
ABAG | | — Association of Bay Area Governments |
ADR | | — American Depository Receipts |
AMBAC | | — American Municipal Bond Assurance Corporation |
AMT | | — Alternative Minimum Tax |
ARM | | — Adjustable Rate Mortgages |
BART | | — Bay Area Rapid Transit |
CDA | | — Community Development Authority |
CDSC | | — Contingent Deferred Sales Charge |
CGIC | | — Capital Guaranty Insurance Company |
CGY | | — Capital Guaranty Corporation |
CMT | | — Constant Maturity Treasury |
COFI | | — Cost of Funds Index |
Connie Lee | | — Connie Lee Insurance Company |
COP | | — Certificate of Participation |
CP | | — Commercial Paper |
CTF | | — Common Trust Fund |
DOT | | — Department of Transportation |
DW&P | | — Department of Water & Power |
DWR | | — Department of Water Resources |
EDFA | | — Education Finance Authority |
FGIC | | — Financial Guaranty Insurance Corporation |
FHA | | — Federal Housing Authority |
FHLB | | — Federal Home Loan Bank |
FHLMC | | — Federal Home Loan Mortgage Corporation |
FNMA | | — Federal National Mortgage Association |
FRN | | — Floating Rate Notes |
FSA | | — Financial Security Assurance, Inc |
GNMA | | — Government National Mortgage Association |
GO | | — General Obligation |
HEFA | | — Higher Education Facilities Authority |
HFA | | — Housing Finance Authority |
HFFA | | — Health Facilities Financing Authority |
IDA | | — Industrial Development Authority |
IDR | | — Industrial Development Revenue |
LIBOR | | — London Interbank Offered Rate |
LLC | | — Limited Liability Corporation |
LOC | | — Letter of Credit |
LP | | — Limited Partnership |
MBIA | | — Municipal Bond Insurance Association |
MFHR | | — Multi-Family Housing Revenue |
MUD | | — Municipal Utility District |
MTN | | — Medium Term Note |
PCFA | | — Pollution Control Finance Authority |
PCR | | — Pollution Control Revenue |
PFA | | — Public Finance Authority |
PLC | | — Private Placement |
PSFG | | — Public School Fund Guaranty |
RAW | | — Revenue Anticipation Warrants |
RDA | | — Redevelopment Authority |
RDFA | | — Redevelopment Finance Authority |
R&D | | — Research & Development |
SFMR | | — Single Family Mortgage Revenue |
TBA | | — To Be Announced |
TRAN | | — Tax Revenue Anticipation Notes |
USD | | — Unified School District |
V/R | | — Variable Rate |
WEBS | | — World Equity Benchmark Shares |
85
More information about Wells Fargo Funds® is available free upon request. To obtain literature, please write or call: Wells Fargo Funds PO Box 8266 Boston, MA 02266-8266 Wells Fargo Funds Investor Services: 1-800-222-8222 or visit our Web site at www.wellsfargofunds.com. | | This report and the financial statements contained herein are submitted for the general information of the shareholders of the Wells Fargo Funds. If this report is used for promotional purposes, distribution of the report must be accompanied or preceded by a current prospectus. For a prospectus containing more complete information, including charges and expenses, call 1-800-222-8222. Read the prospectus carefully before you invest or send money. Wells Fargo Funds Management, LLC, a wholly-owned subsidiary of Wells Fargo & Company, provides investment advisory and administrative services for the Wells Fargo Funds. Other affiliates of Wells Fargo & Company provide sub-advisory and other services for the Funds. The Funds are distributed by Stephens Inc., Member NYSE/SIPC. Wells Fargo & Company and its affiliates are not affiliated with Stephens Inc. |
| | | NOT FDIC INSURED - NO BANK GUARANTEE - MAY LOSE VALUE | | SAR 003 (8/03) |
ITEM 2. CODE OF ETHICS
Not applicable.
ITEM 3. AUDIT COMMITTEE FINANCIAL EXPERT
Not applicable.
ITEM 4. PRINCIPAL ACCOUNTANT FEES AND SERVICES
Not applicable.
ITEMS 5-6. [RESERVED]
ITEM 7. DISCLOSURE OF PROXY VOTING POLICIES AND PROCEDURES FOR
CLOSED-END MANAGEMENT INVESTMENT COMPANIES
Not applicable.
ITEM 8. [RESERVED]
ITEM 9. CONTROLS AND PROCEDURES
(a)(i) The President and Treasurer have concluded that the Wells Fargo Funds Trust (the “Trust”) disclosure controls and procedures (as defined in Rule 30a-3(c) under the Investment Company Act of 1940) provide reasonable assurances that material information relating to the Trust is made known to them by the appropriate persons based on their evaluation of these controls and procedures as of a date within 90 days of the filing of this report.
(a)(ii) There were no significant changes in the Trust’s internal controls or in other factors that could significantly affect these controls subsequent to the date of the evaluation referenced in (a)(i) above.
ITEM 10. EXHIBITS
(a)(1) Not applicable.
(a)(2) Certification pursuant to Rule 30a-2(a) under the Investment Company Act of 1940 (17 CFR 270.30a-2(a)) attached hereto as Exhibit 99.CERT.
(b) Certification pursuant to Rule 30a-2(b) under the Investment Company Act of 1940 (17 CFR 270.30a-2(b)) attached hereto as Exhibit 99.906CERT.
SIGNATURES
Pursuant to the requirements of the Securities Exchange Act of 1934 and the Investment Company Act of 1940, the registrant has duly caused this report to be signed on its behalf by the undersigned, thereunto duly authorized.
| WELLS FARGO FUNDS TRUST |
| |
By: | | /s/ KARLA M. RABUSCH
|
| | | Karla M. Rabusch President |
Date: October 2, 2003
SIGNATURES
Pursuant to the requirements of the Securities Exchange Act of 1934 and the Investment Company Act of 1940, the registrant has duly caused this report to be signed on its behalf by the undersigned, thereunto duly authorized.
| WELLS FARGO FUNDS TRUST |
| |
By: | | /s/ STACIE D. DEANGELO
|
| | | Stacie D. DeAngelo Treasurer |
Date: October 2, 2003